User login
Characterizing Counterfeit Dermatologic Devices Sold on Popular E-commerce Websites
To the Editor:
Approved medical devices on the market are substantial capital investments for practitioners. E-commerce websites, such as Alibaba.com (https://www.alibaba.com/) and DHgate.com (https://www.dhgate.com/), sell sham medical devices at a fraction of the cost of authentic products, with sellers often echoing the same treatment claims as legitimate devices that have been cleared by the US Food and Drug Administration (FDA).
In dermatology, devices claiming to perform cryolipolysis, laser skin resurfacing, radiofrequency skin tightening, and more exist on e-commerce websites. These counterfeit medical devices might differ from legitimate devices in ways that affect patient safety and treatment efficacy.1,2 The degree of difference between counterfeit and legitimate devices remains unknown, and potential harm from so-called knockoff devices needs to be critically examined by providers.
In this exploratory study, we characterize counterfeit listings of devices commonly used in dermatology. Using the trademark name of devices as the key terms, we searched Alibaba.com and DHgate.com for listings of counterfeit products. We recorded the total number of listings; the listing name, catalog number, and unit price; and claims of FDA certification. Characteristics of counterfeit listings were summarized using standard descriptive statistics in Microsoft Excel. Continuous variables were summarized with means and ranges.
Six medical devices that had been cleared by the FDA between 2002 and 2012 for use in dermatology were explored, including systems for picosecond and fractionated lasers, monopolar and bipolar radiofrequency skin tightening, cryolipolysis, and nonablative radiofrequency skin resurfacing. Our search of these 6 representative dermatologic devices revealed 47,055 counterfeit product listings on Alibaba.com and DHgate.com. Upon searching these popular e-commerce websites using the device name as the search term, the number of listings varied considerably between the 2 e-commerce websites for the same device and from device to device on the same e-commerce website. On Alibaba.com, the greatest number of listings resulted for picosecond laser (23,622 listings), fractionated laser (15,269), and radiofrequency skin tightening devices (3555); cryolipolysis and nonablative radiofrequency resurfacing devices had notably fewer listings (35 and 38, respectively). On DHGate.com, a similar trend was noted with the most numerous listings for picosecond and fractionated laser systems (2429 and 1345, respectively).
Among the first 10 listings of products on Alibaba.com and DHgate.com for these 6 devices, 10.7% (11 of 103) had advertised claims of FDA clearance on the listing page. Of 103 counterfeit products, China was the country of origin for 100; South Korea for 2; and Thailand for 1. Unit pricing was heterogeneous between the 2 e-commerce websites for the counterfeit listings; pricing for duplicate fractionated laser systems was particularly dissimilar, with an average price on Alibab.com of US $8105.80 and an average price on DHgate.com of US $3409.14. Even on the same e-commerce website, the range of unit pricing differed greatly for dermatologic devices. For example, among the first 10 listings on Alibaba.com for a fractionated laser system, the price ranged from US $2300 to US $32,000.
Counterfeit medical devices are on the rise in dermatology.1,3 Although devices such as radiofrequency and laser systems had thousands of knockoff listings on 2 e-commerce websites, other devices, such as cryolipolysis and body contouring systems, had fewer listings, suggesting heterogeneity in the prevalence of different counterfeit dermatologic devices on the market.
The varied pricing of the top 10 listings for each product and spurious claims of FDA clearance for some listings highlight the lack of regulatory authority over consistent product information on e-commerce websites. Furthermore, differences between characteristics of counterfeit device listings can impede efforts to trace suppliers and increase the opacity of counterfeit purchasing.
Three criteria have been proposed for a device to be considered counterfeit3:
• The device has no proven safety or efficacy among consumers. For example, the substantial threat of copycat devices in dermatology has been demonstrated by reports of burns caused by fake cryolipolysis devices.2
• The device violates patent rights or copy trademarks. Due to the regional nature of intellectual property rights, country-specific filings of patents and trademarks are required if protections are sought internationally. In this study, counterfeit devices originated in China, South Korea, and Thailand, where patent and trademark protections for the original devices do not extend.
• The device is falsely claimed to have been cleared by the FDA or other clinical regulatory authorities. Legitimate medical devices are subject to rounds of safety and compatibility testing using standards set by regulatory bodies, such as the FDA’s Center for Devices and Radiological Health, the International Organization of Standardization, and the International Electrotechnical Commission. Compliance with these safety standards is lost, however, among unregulated internet sales of medical devices. Our search revealed that 10.7% of the top 10 counterfeit device listings for each product explicitly mentioned FDA clearance in the product description. Among the thousands of listings on e-commerce sites, even a fraction that make spurious FDA-clearance claims can mislead consumers.
The issue of counterfeit medical devices has not gone unrecognized globally. In 2013, the World Health Organization created the Global Surveillance and Monitoring System to unify international efforts for reporting substandard, unlicensed, or falsified medical products.4 Although universal monitoring systems can improve detection of counterfeit products, we highlight the alarming continuing ease of purchasing counterfeit dermatologic devices through e-commerce websites. Due to the widespread nature of counterfeiting across all domains of medicine, the onus of curbing counterfeit dermatologic devices might be on dermatology providers to recognize and report such occurrences.
This exploration of counterfeit dermatologic devices revealed a lack of consistency throughout product listings on 2 popular e-commerce websites, Alibaba.com and DHgate.com. Given the alarming availability of these devices on the internet, practitioners should approach the purchase of any device with concern about counterfeiting. Future avenues of study might explore the prevalence of counterfeit devices used in dermatology practices and offer insight on regulation and consumer safety efforts.
- Wang JV, Zachary CB, Saedi N. Counterfeit esthetic devices and patient safety in dermatology. J Cosmet Dermatol. 2018;17:396-397. doi:10.1111/jocd.12526
- Biesman BS, Patel N. Physician alert: beware of counterfeit medical devices. Lasers Surg Med. 2014;46:528‐530. doi:10.1002/lsm.22275
- Stevens WG, Spring MA, Macias LH. Counterfeit medical devices: the money you save up front will cost you big in the end. Aesthet Surg J. 2014;34:786‐788. doi:10.1177/1090820X14529960
- Pisani E. WHO Global Surveillance and Monitoring System for Substandard and Falsified Medical Products. World Health Organization; 2017. Accessed November 21, 2021. https://www.who.int/medicines/regulation/ssffc/publications/GSMSreport_EN.pdf?ua=1
To the Editor:
Approved medical devices on the market are substantial capital investments for practitioners. E-commerce websites, such as Alibaba.com (https://www.alibaba.com/) and DHgate.com (https://www.dhgate.com/), sell sham medical devices at a fraction of the cost of authentic products, with sellers often echoing the same treatment claims as legitimate devices that have been cleared by the US Food and Drug Administration (FDA).
In dermatology, devices claiming to perform cryolipolysis, laser skin resurfacing, radiofrequency skin tightening, and more exist on e-commerce websites. These counterfeit medical devices might differ from legitimate devices in ways that affect patient safety and treatment efficacy.1,2 The degree of difference between counterfeit and legitimate devices remains unknown, and potential harm from so-called knockoff devices needs to be critically examined by providers.
In this exploratory study, we characterize counterfeit listings of devices commonly used in dermatology. Using the trademark name of devices as the key terms, we searched Alibaba.com and DHgate.com for listings of counterfeit products. We recorded the total number of listings; the listing name, catalog number, and unit price; and claims of FDA certification. Characteristics of counterfeit listings were summarized using standard descriptive statistics in Microsoft Excel. Continuous variables were summarized with means and ranges.
Six medical devices that had been cleared by the FDA between 2002 and 2012 for use in dermatology were explored, including systems for picosecond and fractionated lasers, monopolar and bipolar radiofrequency skin tightening, cryolipolysis, and nonablative radiofrequency skin resurfacing. Our search of these 6 representative dermatologic devices revealed 47,055 counterfeit product listings on Alibaba.com and DHgate.com. Upon searching these popular e-commerce websites using the device name as the search term, the number of listings varied considerably between the 2 e-commerce websites for the same device and from device to device on the same e-commerce website. On Alibaba.com, the greatest number of listings resulted for picosecond laser (23,622 listings), fractionated laser (15,269), and radiofrequency skin tightening devices (3555); cryolipolysis and nonablative radiofrequency resurfacing devices had notably fewer listings (35 and 38, respectively). On DHGate.com, a similar trend was noted with the most numerous listings for picosecond and fractionated laser systems (2429 and 1345, respectively).
Among the first 10 listings of products on Alibaba.com and DHgate.com for these 6 devices, 10.7% (11 of 103) had advertised claims of FDA clearance on the listing page. Of 103 counterfeit products, China was the country of origin for 100; South Korea for 2; and Thailand for 1. Unit pricing was heterogeneous between the 2 e-commerce websites for the counterfeit listings; pricing for duplicate fractionated laser systems was particularly dissimilar, with an average price on Alibab.com of US $8105.80 and an average price on DHgate.com of US $3409.14. Even on the same e-commerce website, the range of unit pricing differed greatly for dermatologic devices. For example, among the first 10 listings on Alibaba.com for a fractionated laser system, the price ranged from US $2300 to US $32,000.
Counterfeit medical devices are on the rise in dermatology.1,3 Although devices such as radiofrequency and laser systems had thousands of knockoff listings on 2 e-commerce websites, other devices, such as cryolipolysis and body contouring systems, had fewer listings, suggesting heterogeneity in the prevalence of different counterfeit dermatologic devices on the market.
The varied pricing of the top 10 listings for each product and spurious claims of FDA clearance for some listings highlight the lack of regulatory authority over consistent product information on e-commerce websites. Furthermore, differences between characteristics of counterfeit device listings can impede efforts to trace suppliers and increase the opacity of counterfeit purchasing.
Three criteria have been proposed for a device to be considered counterfeit3:
• The device has no proven safety or efficacy among consumers. For example, the substantial threat of copycat devices in dermatology has been demonstrated by reports of burns caused by fake cryolipolysis devices.2
• The device violates patent rights or copy trademarks. Due to the regional nature of intellectual property rights, country-specific filings of patents and trademarks are required if protections are sought internationally. In this study, counterfeit devices originated in China, South Korea, and Thailand, where patent and trademark protections for the original devices do not extend.
• The device is falsely claimed to have been cleared by the FDA or other clinical regulatory authorities. Legitimate medical devices are subject to rounds of safety and compatibility testing using standards set by regulatory bodies, such as the FDA’s Center for Devices and Radiological Health, the International Organization of Standardization, and the International Electrotechnical Commission. Compliance with these safety standards is lost, however, among unregulated internet sales of medical devices. Our search revealed that 10.7% of the top 10 counterfeit device listings for each product explicitly mentioned FDA clearance in the product description. Among the thousands of listings on e-commerce sites, even a fraction that make spurious FDA-clearance claims can mislead consumers.
The issue of counterfeit medical devices has not gone unrecognized globally. In 2013, the World Health Organization created the Global Surveillance and Monitoring System to unify international efforts for reporting substandard, unlicensed, or falsified medical products.4 Although universal monitoring systems can improve detection of counterfeit products, we highlight the alarming continuing ease of purchasing counterfeit dermatologic devices through e-commerce websites. Due to the widespread nature of counterfeiting across all domains of medicine, the onus of curbing counterfeit dermatologic devices might be on dermatology providers to recognize and report such occurrences.
This exploration of counterfeit dermatologic devices revealed a lack of consistency throughout product listings on 2 popular e-commerce websites, Alibaba.com and DHgate.com. Given the alarming availability of these devices on the internet, practitioners should approach the purchase of any device with concern about counterfeiting. Future avenues of study might explore the prevalence of counterfeit devices used in dermatology practices and offer insight on regulation and consumer safety efforts.
- Wang JV, Zachary CB, Saedi N. Counterfeit esthetic devices and patient safety in dermatology. J Cosmet Dermatol. 2018;17:396-397. doi:10.1111/jocd.12526
- Biesman BS, Patel N. Physician alert: beware of counterfeit medical devices. Lasers Surg Med. 2014;46:528‐530. doi:10.1002/lsm.22275
- Stevens WG, Spring MA, Macias LH. Counterfeit medical devices: the money you save up front will cost you big in the end. Aesthet Surg J. 2014;34:786‐788. doi:10.1177/1090820X14529960
- Pisani E. WHO Global Surveillance and Monitoring System for Substandard and Falsified Medical Products. World Health Organization; 2017. Accessed November 21, 2021. https://www.who.int/medicines/regulation/ssffc/publications/GSMSreport_EN.pdf?ua=1
Practice Points
- Among thousands of counterfeit dermatologic listings, there is great heterogeneity in the number of listings per different subtypes of dermatologic devices, device descriptions, and unit pricing, along with false claims of US Food and Drug Administration clearance.
- Given the prevalence of counterfeit medical devices readily available for purchase online, dermatology practitioners should be wary of the authenticity of any medical device purchased for clinical use.
Gender Disparities in Income Among Board-Certified Dermatologists
Although the number of female graduates from US medical schools has steadily increased,1 several studies since the 1970s indicate that a disparity exists in salary, academic rank, and promotion among female and male physicians across multiple specialties.2-8 Proposed explanations include women working fewer hours, having lower productivity rates, undernegotiating compensation, and underbilling for the same services. However, when controlling for variables such as time, experience, specialty, rank, and research activities, this gap unequivocally persists. There are limited data on this topic in dermatology, a field in which women comprise more than half of the working population.6,7 Most analyses of gender disparities in dermatology are based on data primarily from academic dermatologists, which may not be representative of the larger population of dermatologists.8,9 The purpose of this study is to determine if an income disparity exists between male and female physicians in dermatology, including those in private practice and those who are specialty trained.
Methods
Population—We performed a cross-sectional self-reported survey to examine compensation of male and female board-certified dermatologists (MDs/DOs). Several populations of dermatologists were surveyed in August and September 2018. Approximately 20% of the members of the American Academy of Dermatology were randomly selected and sent a link to the survey. Additionally, a survey link was emailed to members of the Association of Professors of Dermatology, American College of Mohs Surgery, and American Society for Dermatologic Surgery. A link to the survey also was published on “The Board Certified Dermatologists” Facebook group.
Statistical Analysis—Descriptive statistics were used to summarize the distribution of variables overall and within gender (male or female). Not all respondents completed every section, and duplicates and incomplete responses were removed. Variables were compared between genders using t tests (continuous), the Pearson χ2 test (nominal), or the Cochran-Mantel-Haenszel test (ordinal). For categorical variables with small cell counts, an exact χ2 test for small samples was used. For continuous variables, t test P values were calculated using either pooled or Satterthwaithe approximation.
To analyze the effect of different variables on total income using multivariate and univariate linear regression, the income variable was transformed into a continuous variable by using midpoints of the categories. Univariate linear regression was used to assess the effect and significance of each variable on total annual income. Variables that were found to have a P value of less than .05 (α=.05) were deemed as significant predictors of total annual income. These variables were added to a multivariate linear regression model to determine their effect on income when adjusting for other significant (and approaching significance) factors. In addition, variables that were found to have a P value of less than .2 (α=.05) were added to the multivariate linear regression model to assess significance of these specific variables when adjusting for other factors. In this way, we tested and accounted for a multitude of variables as potential sources of confounding.
Results
Demographics—Our survey was emailed to 3079 members of the American Academy of Dermatology, and 277 responses were received. Approximately 144 additional responses were obtained collectively from links sent to the directories of the Association of Professors of Dermatology, American College of Mohs Surgery, and American Society for Dermatologic Surgery and from social media. Of these respondents, 53.65% (213/397) were female and 46.35% (184/397) were male. When stratifying by race/ethnicity, 77.33% identified as White; 13.85% identified as Asian; 6.3% identified as Black or African American, Hispanic/Latino, and Native American; and 2.52% chose not to respond. Although most male and female respondents were White, a significantly higher proportion of female respondents identified as Asian or Black/African American/Hispanic/Latino/Native American (P=.0006). We found that race/ethnicity did not significantly impact income (P=.2736). All US Census regions were represented in this study, and geographic distribution as well as population density of practice location (ie, rural, suburban, urban setting) did not differ significantly between males and females (P=.5982 and P=.1007, respectively) and did not significantly impact income (P=.3225 and P=.10663, respectively).

Income—Total annual income was defined as the aggregate sum of all types of financial compensation received in 1 calendar year (eg, salary, bonuses, benefits) and was elicited as an ordinal variable in income brackets of US $100,000. Overall, χ2 analysis showed a statistically significant difference in annual total income between male and female dermatologists (P<.0001), with a higher proportion of males in the highest pay bracket (Figure). Gender remained a statistically significant predictor of income on both univariate and multivariate linear regression analyses (P=.0002 and P<.0001, respectively), indicating that gender has a significant impact on compensation, even after controlling for other variables (eTable). Of note, males in this sample were on average older and in practice longer than females (approximately 6 years, P<.0001). However, when univariate linear regression was performed, both age (P=.8281) and number of years since residency or fellowship completion (P=.8743) were not significant predictors of income.
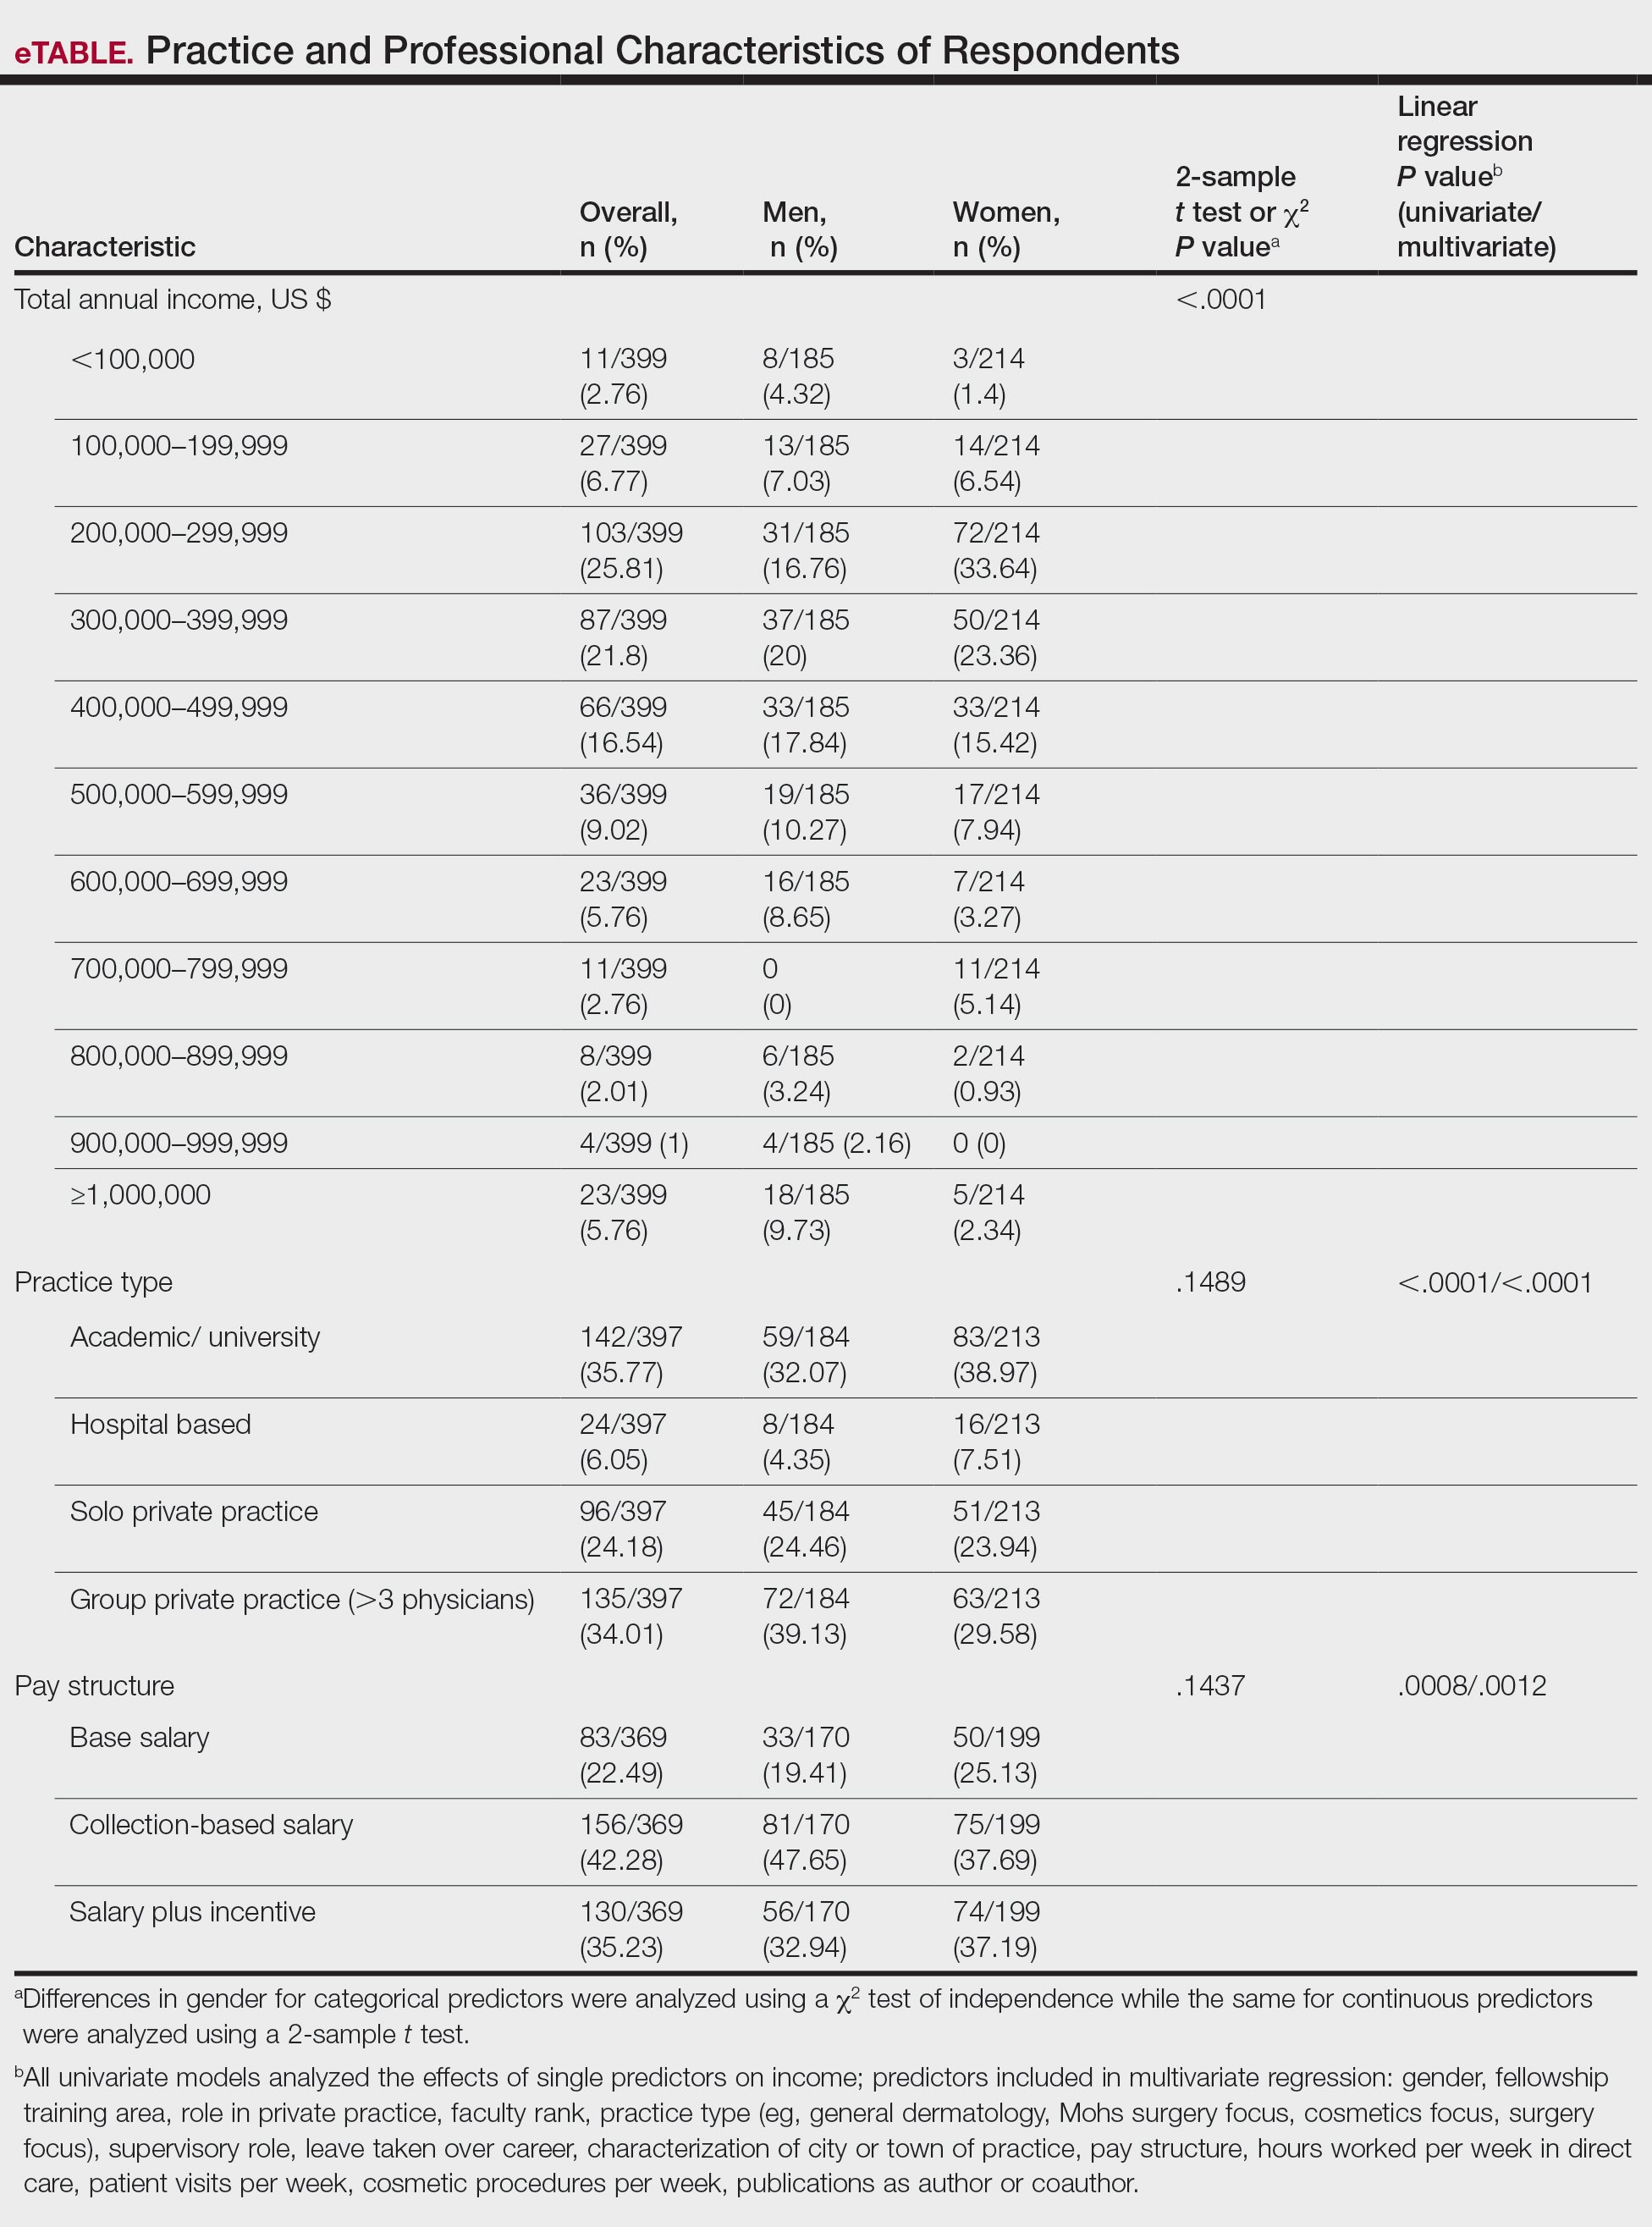
Practice Type—There were no statistically significant differences between men and women in practice type (P=.1489), including academic/university, hospital based, and solo and group private practice; pay structure (P=.1437), including base salary, collection-based salary, or salary plus incentive; holding a supervisory role (P=.0846); or having ownership of a practice (P=.3565)(eTable). Most respondents were in solo or group private practice (58.2%) and had a component of productivity-based compensation (77.5%). In addition, 62% of private practice dermatologists (133/212) had an ownership interest in their practice. As expected, univariate and multivariate regression analyses showed that practice type, pay structure, supervisory roles, and employee vs ownership roles were significant predictors of income (P<.05)(eTable).
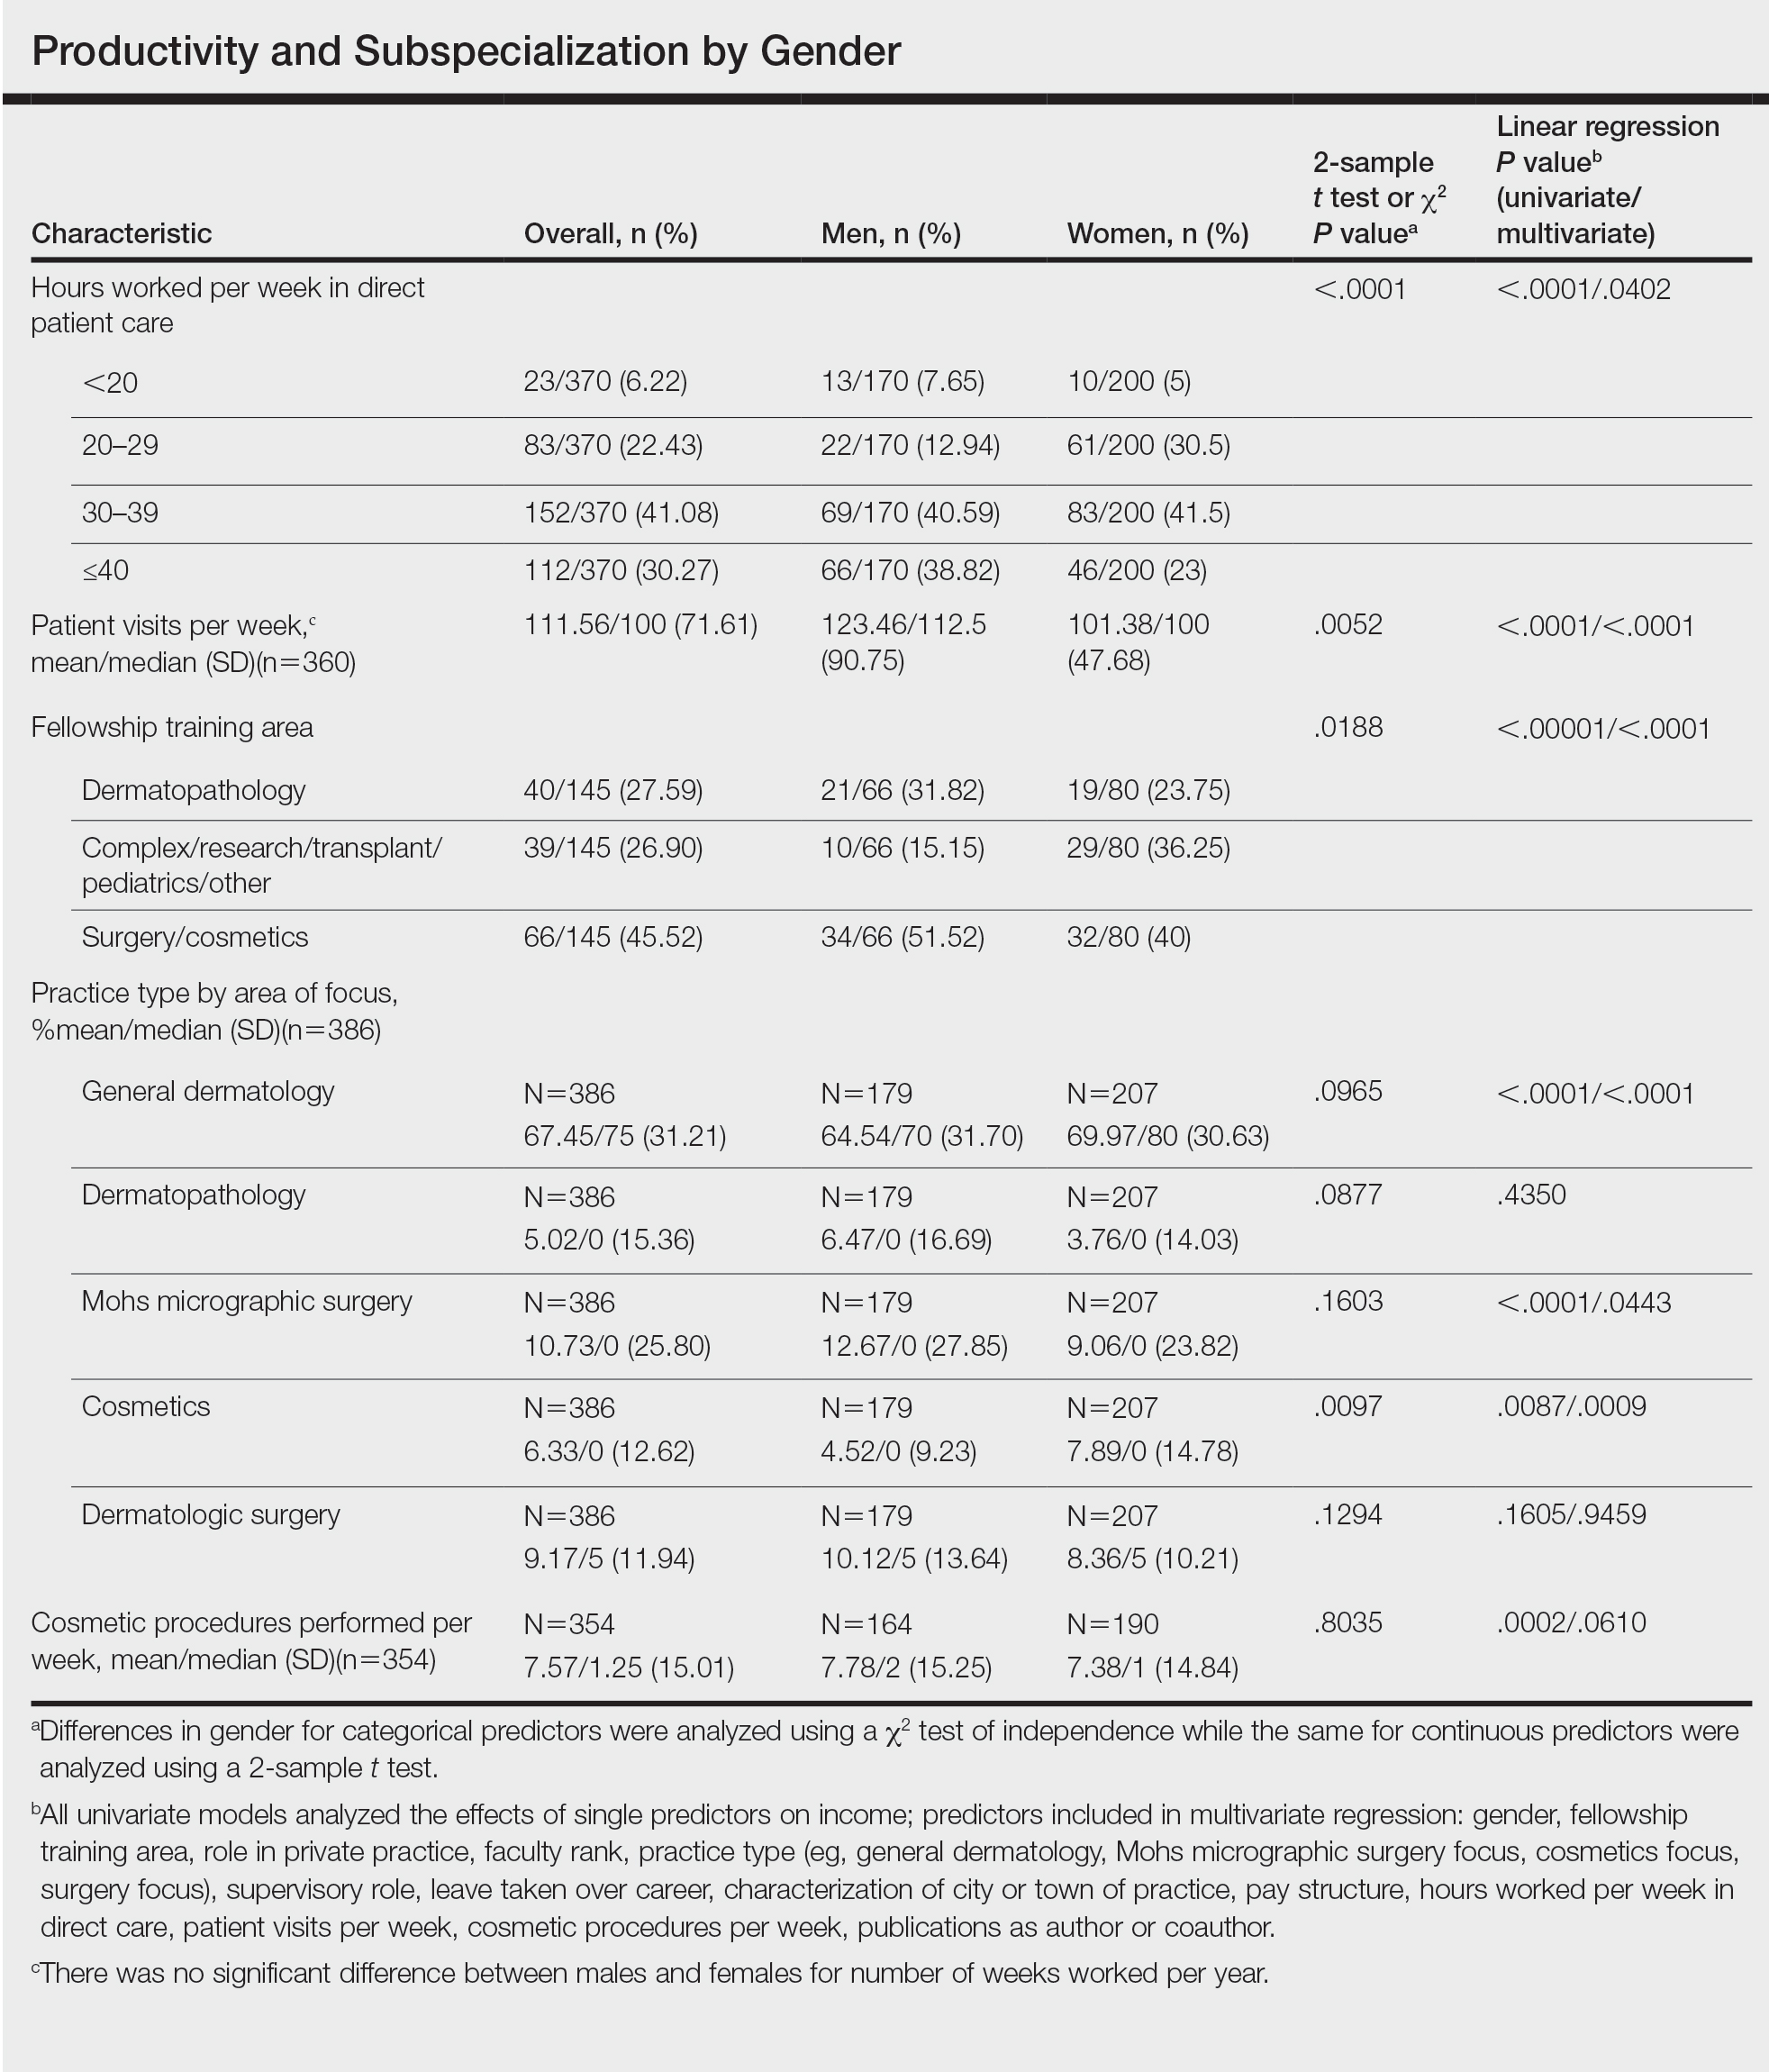
Work Productivity—Statistically significant differences were found between men and women in hours worked per week in direct patient care (P<.0001) and in patient visits per week (P=.0052), with a higher percentage of men working more than 40 hours per week and men seeing an average of approximately 22 more patients per week than women. In the subgroup of all dermatologists working more than 40 hours per week, a statistically significant difference in income persisted between males and females (P=.0001). Hours worked per week and patient visits per week were statistically significant predictors of income on both univariate and multivariate regression analyses (P<.05)(Table).
Education and Fellowship Training—No significant difference existed between males and females in type of undergraduate school attended, namely public or private institutions (P=.1090), but a significant difference existed within type of medical school education, with a higher percentage of females attending private medical schools (53.03%) compared to males (38.24%)(P=.0045). However, type of undergraduate or medical school attended had no impact on income (P=.9103). A higher percentage of males (27.32%) completed additional advanced degrees, such as a master of business administration or a master of public health, compared to females (16.9%)(P=.0122). However, the completion of additional advanced degrees had no significant impact on income (P=.2379). No statistical significance existed between males and females in number of residencies completed (P=.3236), and residencies completed had no significant impact on income (P=.4584).
Of 397 respondents, approximately one-third of respondents completed fellowship training (36.5%). Fellowships included dermatopathology, surgery/cosmetics, and other (encompassing complex medical, research, transplant, and pediatric dermatology). Although similar percentages of men and women completed fellowship training, men and women differed significantly by type of fellowship completed (P=.0188). There were similar rates of dermatopathology and surgical fellowship completion between genders but almost 3 times the number of females who completed other fellowships. Type of fellowship training was a statistically significant predictor of income on both univariate and multivariate regression analyses (P<.00001 and P<.0001, respectively).
Work Activity—Respondents were asked to estimate the amount of time devoted to general dermatology, dermatopathology, Mohs micrographic surgery, cosmetics, and dermatologic surgery in their practices (Table). Women devoted a significantly higher average percentage of time to cosmetics (7.89%) compared to men (4.52%)(P=.0097). The number of cosmetic procedures performed per week was not statistically significantly different between men and women (P=.8035) but was a significant factor for income on univariate regression analysis (P=.0002). Time spent performing dermatologic surgery, general dermatology, or Mohs micrographic surgery did not significantly differ between men and women but was found to significantly influence income.
Academic Dermatology—Among the respondents working in academic settings, χ2 analysis identified a significant difference in the faculty rank between males and females, with a tendency for lower academic rank in females (P=.0508). Assistant professorship was comprised of 35% of men vs 51% of women, whereas full professorship consisted of 26% of men but only 13% of women. Academic rank was found to be a significant predictor of income, with higher rank associated with higher income (P<.0001 on univariate regression analysis). However, when adjusting for other factors, academic rank was no longer a significant predictor of income (P=.0840 on multivariate regression analysis). No significant difference existed between men and women in funding received from the National Institutes of Health, conduction of clinical trials, or authorship of scientific publications, and these factors were not found to have a significant impact on income.
Work Leave—Male and female dermatologists showed a statistically significant difference in maternity or Family and Medical Leave Act (FMLA) leave taken over their careers, with 56.03% of females reporting leave taken compared to 6.78% of males (P<.0001). Women reported a significantly higher average number of weeks of maternity or FMLA leave taken over their careers (12.92 weeks) compared to men (2.42 weeks) (P<.0001). However, upon univariate regression analysis, whether or not maternity or FMLA leave was taken over their careers (P=.2005), the number of times that maternity or FMLA leave was taken (P=.4350), and weeks of maternity or FMLA leave taken (P=.4057) were all not significant predictors of income.
Comment
This study sought to investigate the relationship between income and gender in dermatology, and our results demonstrated that statistically significant differences in total annual income exist between male and female dermatologists, with male dermatologists earning a significantly higher income, approximately an additional $80,000. Our results are consistent with other studies of US physician income, which have found a gender gap ranging from $13,399 to $82,000 that persists even when controlling for factors such as specialty choice, practice setting, rank and role in practice, work hours, vacation/leave taken, and others.2-7,10-15
There was a significant difference in rank of male and female academic dermatologists, with fewer females at higher academic ranks. These results are consistent with numerous studies in academic dermatology that show underrepresentation of women at higher academic ranks and leadership positions.8,9,16-18 Poor negotiation may contribute to differences in both rank and income.19,20 There are conflicting data on research productivity of academic dermatologists and length of career, first and senior authorship, and quality and academic impact, all of which add complexity to this topic.8,9,12,16-18,20-23Male and female dermatologists reported significant differences in productivity, with male dermatologists working more hours and seeing more patients per week than female dermatologists. These results are consistent with other studies of dermatologists4,24 and other physicians.12 Regardless, gender was still found to have a significant impact on income even when controlling for differences in productivity and FMLA leave taken. These results are consistent with numerous studies of US physicians that found a gender gap in income even when controlling for hours worked.12,23 Although fellowship training as a whole was found to significantly impact income, our results do not characterize whether the impact on income was positive or negative for each type of fellowship. Fellowship training in specialties such as internal medicine or general surgery likewise has variable effects on income.24,25
A comprehensive survey design and significant data elicited from dermatologists working in private practice for the first time served as the main strengths of this study. Limitations included self-reported design, categorical ranges, and limited sample size in subgroups. Future directions include deeper analysis of subgroups, including fellowship-trained dermatologists, dermatologists working more than 40 hours per week, and female dermatologists by race/ethnicity.
Conclusion
We have demonstrated that self-reported discrepancies in salary between male and female dermatologists exist, with male dermatologists earning a significantly higher annual salary than their female counterparts. This study identified and stratified several career factors that comprise the broad field and practice of dermatology. Even when controlling for these variations, we have demonstrated that gender alone remains a significant predictor of income, indicating that an unexplained income gap between the 2 genders exists in dermatology.
- Association of American Medical Colleges. Table B-2.2: Total Graduates by U.S. Medical School and Sex, 2015-2016 through 2019-2020. December 3, 2020. Accessed October 12, 2021. https://www.aamc.org/download/321532/data/factstableb2-2.pdf
- Willett LL, Halvorsen AJ, McDonald FS, et al. Gender differences in salary of internal medicine residency directors: a national survey. Am J Med. 2015;128:659-665.
- Weeks WB, Wallace AE, Mackenzie TA. Gender differences in anesthesiologists’ annual incomes. Anesthesiology. 2007;106:806-811.
- Weeks WB, Wallace AE. Gender differences in ophthalmologists’ annual incomes. Ophthalmology. 2007;114:1696-1701.
- Singh A, Burke CA, Larive B, et al. Do gender disparities persist in gastroenterology after 10 years of practice? Am J Gastroenterol. 2008;103:1589-1595.
- Desai T, Ali S, Fang X, et al. Equal work for unequal pay: the gender reimbursement gap for healthcare providers in the United States. Postgrad Med J. 2016;92:571-575.
- Jena AB, Olenski AR, Blumenthal DM. Sex differences in physician salary in US public medical schools. JAMA Intern Med. 2016;176:1294-1304.
- John AM, Gupta AB, John ES, et al. A gender-based comparison of promotion and research productivity in academic dermatology. Dermatol Online J. 2016;22:13030/qt1hx610pf.
- Sadeghpour M, Bernstein I, Ko C, et al. Role of sex in academic dermatology: results from a national survey. Arch Dermatol. 2012;148:809-814.
- Gilbert SB, Allshouse A, Skaznik-Wikiel ME. Gender inequality in salaries among reproductive endocrinology and infertility subspecialists in the United States. Fertil Steril. 2019;111:1194-1200.
- Jagsi R, Griffith KA, Stewart A, et al. Gender differences in the salaries of physician researchers. JAMA. 2012;307:2410-2417. doi:10.1001/jama.2012.6183
- Apaydin EA, Chen PGC, Friedberg MW, et al. Differences in physician income by gender in a multiregion survey. J Gen Intern Med. 2018;33:1574-1581.
- Read S, Butkus R, Weissman A, et al. Compensation disparities by gender in internal medicine. Ann Intern Med. 2018;169:658-661.
- Guss ZD, Chen Q, Hu C, et al. Differences in physician compensation between men and women at United States public academic radiation oncology departments. Int J Radiat Oncol Biol Phys. 2019;103:314-319.
- Lo Sasso AT, Richards MR, Chou CF, et al. The $16,819 pay gap for newly trained physicians: the unexplained trend of men earning more than women. Health Aff (Millwood). 2011;30:193-201.
- Shah A, Jalal S, Khosa F. Influences for gender disparity in dermatology in North America. Int J Dermatol. 2018;57:171-176.
- Shi CR, Olbricht S, Vleugels RA, et al. Sex and leadership in academic dermatology: a nationwide survey. J Am Acad Dermatol. 2017;77:782-784.
- Shih AF, Sun W, Yick C, et al. Trends in scholarly productivity of dermatology faculty by academic status and gender. J Am Acad Dermatol. 2019;80:1774-1776.
- Sarfaty S, Kolb D, Barnett R, et al. Negotiation in academic medicine: a necessary career skill. J Womens Health (Larchmt). 2007;16:235-244.
- Jacobson CC, Nguyen JC, Kimball AB. Gender and parenting significantly affect work hours of recent dermatology program graduates. Arch Dermatol. 2004;140:191-196.
- Feramisco JD, Leitenberger JJ, Redfern SI, et al. A gender gap in the dermatology literature? Cross-sectional analysis of manuscript authorship trends in dermatology journals during 3 decades. J Am Acad Dermatol. 2009;60:63-69.
- Bendels MHK, Dietz MC, Brüggmann D, et al. Gender disparities in high-quality dermatology research: a descriptive bibliometric study on scientific authorships. BMJ Open. 2018;8:e020089.
- Seabury SA, Chandra A, Jena AB. Trends in the earnings of male and female health care professionals in the United States, 1987 to 2010. JAMA Intern Med. 2013;173:1748-1750.
- Baimas-George M, Fleischer B, Slakey D, et al. Is it all about the money? Not all surgical subspecialization leads to higher lifetime revenue when compared to general surgery. J Surg Educ. 2017;74:E62-E66.
- Leigh JP, Tancredi D, Jerant A, et al. Lifetime earnings for physicians across specialties. Med Care. 2012;50:1093-1101.
Although the number of female graduates from US medical schools has steadily increased,1 several studies since the 1970s indicate that a disparity exists in salary, academic rank, and promotion among female and male physicians across multiple specialties.2-8 Proposed explanations include women working fewer hours, having lower productivity rates, undernegotiating compensation, and underbilling for the same services. However, when controlling for variables such as time, experience, specialty, rank, and research activities, this gap unequivocally persists. There are limited data on this topic in dermatology, a field in which women comprise more than half of the working population.6,7 Most analyses of gender disparities in dermatology are based on data primarily from academic dermatologists, which may not be representative of the larger population of dermatologists.8,9 The purpose of this study is to determine if an income disparity exists between male and female physicians in dermatology, including those in private practice and those who are specialty trained.
Methods
Population—We performed a cross-sectional self-reported survey to examine compensation of male and female board-certified dermatologists (MDs/DOs). Several populations of dermatologists were surveyed in August and September 2018. Approximately 20% of the members of the American Academy of Dermatology were randomly selected and sent a link to the survey. Additionally, a survey link was emailed to members of the Association of Professors of Dermatology, American College of Mohs Surgery, and American Society for Dermatologic Surgery. A link to the survey also was published on “The Board Certified Dermatologists” Facebook group.
Statistical Analysis—Descriptive statistics were used to summarize the distribution of variables overall and within gender (male or female). Not all respondents completed every section, and duplicates and incomplete responses were removed. Variables were compared between genders using t tests (continuous), the Pearson χ2 test (nominal), or the Cochran-Mantel-Haenszel test (ordinal). For categorical variables with small cell counts, an exact χ2 test for small samples was used. For continuous variables, t test P values were calculated using either pooled or Satterthwaithe approximation.
To analyze the effect of different variables on total income using multivariate and univariate linear regression, the income variable was transformed into a continuous variable by using midpoints of the categories. Univariate linear regression was used to assess the effect and significance of each variable on total annual income. Variables that were found to have a P value of less than .05 (α=.05) were deemed as significant predictors of total annual income. These variables were added to a multivariate linear regression model to determine their effect on income when adjusting for other significant (and approaching significance) factors. In addition, variables that were found to have a P value of less than .2 (α=.05) were added to the multivariate linear regression model to assess significance of these specific variables when adjusting for other factors. In this way, we tested and accounted for a multitude of variables as potential sources of confounding.
Results
Demographics—Our survey was emailed to 3079 members of the American Academy of Dermatology, and 277 responses were received. Approximately 144 additional responses were obtained collectively from links sent to the directories of the Association of Professors of Dermatology, American College of Mohs Surgery, and American Society for Dermatologic Surgery and from social media. Of these respondents, 53.65% (213/397) were female and 46.35% (184/397) were male. When stratifying by race/ethnicity, 77.33% identified as White; 13.85% identified as Asian; 6.3% identified as Black or African American, Hispanic/Latino, and Native American; and 2.52% chose not to respond. Although most male and female respondents were White, a significantly higher proportion of female respondents identified as Asian or Black/African American/Hispanic/Latino/Native American (P=.0006). We found that race/ethnicity did not significantly impact income (P=.2736). All US Census regions were represented in this study, and geographic distribution as well as population density of practice location (ie, rural, suburban, urban setting) did not differ significantly between males and females (P=.5982 and P=.1007, respectively) and did not significantly impact income (P=.3225 and P=.10663, respectively).
Income—Total annual income was defined as the aggregate sum of all types of financial compensation received in 1 calendar year (eg, salary, bonuses, benefits) and was elicited as an ordinal variable in income brackets of US $100,000. Overall, χ2 analysis showed a statistically significant difference in annual total income between male and female dermatologists (P<.0001), with a higher proportion of males in the highest pay bracket (Figure). Gender remained a statistically significant predictor of income on both univariate and multivariate linear regression analyses (P=.0002 and P<.0001, respectively), indicating that gender has a significant impact on compensation, even after controlling for other variables (eTable). Of note, males in this sample were on average older and in practice longer than females (approximately 6 years, P<.0001). However, when univariate linear regression was performed, both age (P=.8281) and number of years since residency or fellowship completion (P=.8743) were not significant predictors of income.
Practice Type—There were no statistically significant differences between men and women in practice type (P=.1489), including academic/university, hospital based, and solo and group private practice; pay structure (P=.1437), including base salary, collection-based salary, or salary plus incentive; holding a supervisory role (P=.0846); or having ownership of a practice (P=.3565)(eTable). Most respondents were in solo or group private practice (58.2%) and had a component of productivity-based compensation (77.5%). In addition, 62% of private practice dermatologists (133/212) had an ownership interest in their practice. As expected, univariate and multivariate regression analyses showed that practice type, pay structure, supervisory roles, and employee vs ownership roles were significant predictors of income (P<.05)(eTable).
Work Productivity—Statistically significant differences were found between men and women in hours worked per week in direct patient care (P<.0001) and in patient visits per week (P=.0052), with a higher percentage of men working more than 40 hours per week and men seeing an average of approximately 22 more patients per week than women. In the subgroup of all dermatologists working more than 40 hours per week, a statistically significant difference in income persisted between males and females (P=.0001). Hours worked per week and patient visits per week were statistically significant predictors of income on both univariate and multivariate regression analyses (P<.05)(Table).
Education and Fellowship Training—No significant difference existed between males and females in type of undergraduate school attended, namely public or private institutions (P=.1090), but a significant difference existed within type of medical school education, with a higher percentage of females attending private medical schools (53.03%) compared to males (38.24%)(P=.0045). However, type of undergraduate or medical school attended had no impact on income (P=.9103). A higher percentage of males (27.32%) completed additional advanced degrees, such as a master of business administration or a master of public health, compared to females (16.9%)(P=.0122). However, the completion of additional advanced degrees had no significant impact on income (P=.2379). No statistical significance existed between males and females in number of residencies completed (P=.3236), and residencies completed had no significant impact on income (P=.4584).
Of 397 respondents, approximately one-third of respondents completed fellowship training (36.5%). Fellowships included dermatopathology, surgery/cosmetics, and other (encompassing complex medical, research, transplant, and pediatric dermatology). Although similar percentages of men and women completed fellowship training, men and women differed significantly by type of fellowship completed (P=.0188). There were similar rates of dermatopathology and surgical fellowship completion between genders but almost 3 times the number of females who completed other fellowships. Type of fellowship training was a statistically significant predictor of income on both univariate and multivariate regression analyses (P<.00001 and P<.0001, respectively).
Work Activity—Respondents were asked to estimate the amount of time devoted to general dermatology, dermatopathology, Mohs micrographic surgery, cosmetics, and dermatologic surgery in their practices (Table). Women devoted a significantly higher average percentage of time to cosmetics (7.89%) compared to men (4.52%)(P=.0097). The number of cosmetic procedures performed per week was not statistically significantly different between men and women (P=.8035) but was a significant factor for income on univariate regression analysis (P=.0002). Time spent performing dermatologic surgery, general dermatology, or Mohs micrographic surgery did not significantly differ between men and women but was found to significantly influence income.
Academic Dermatology—Among the respondents working in academic settings, χ2 analysis identified a significant difference in the faculty rank between males and females, with a tendency for lower academic rank in females (P=.0508). Assistant professorship was comprised of 35% of men vs 51% of women, whereas full professorship consisted of 26% of men but only 13% of women. Academic rank was found to be a significant predictor of income, with higher rank associated with higher income (P<.0001 on univariate regression analysis). However, when adjusting for other factors, academic rank was no longer a significant predictor of income (P=.0840 on multivariate regression analysis). No significant difference existed between men and women in funding received from the National Institutes of Health, conduction of clinical trials, or authorship of scientific publications, and these factors were not found to have a significant impact on income.
Work Leave—Male and female dermatologists showed a statistically significant difference in maternity or Family and Medical Leave Act (FMLA) leave taken over their careers, with 56.03% of females reporting leave taken compared to 6.78% of males (P<.0001). Women reported a significantly higher average number of weeks of maternity or FMLA leave taken over their careers (12.92 weeks) compared to men (2.42 weeks) (P<.0001). However, upon univariate regression analysis, whether or not maternity or FMLA leave was taken over their careers (P=.2005), the number of times that maternity or FMLA leave was taken (P=.4350), and weeks of maternity or FMLA leave taken (P=.4057) were all not significant predictors of income.
Comment
This study sought to investigate the relationship between income and gender in dermatology, and our results demonstrated that statistically significant differences in total annual income exist between male and female dermatologists, with male dermatologists earning a significantly higher income, approximately an additional $80,000. Our results are consistent with other studies of US physician income, which have found a gender gap ranging from $13,399 to $82,000 that persists even when controlling for factors such as specialty choice, practice setting, rank and role in practice, work hours, vacation/leave taken, and others.2-7,10-15
There was a significant difference in rank of male and female academic dermatologists, with fewer females at higher academic ranks. These results are consistent with numerous studies in academic dermatology that show underrepresentation of women at higher academic ranks and leadership positions.8,9,16-18 Poor negotiation may contribute to differences in both rank and income.19,20 There are conflicting data on research productivity of academic dermatologists and length of career, first and senior authorship, and quality and academic impact, all of which add complexity to this topic.8,9,12,16-18,20-23Male and female dermatologists reported significant differences in productivity, with male dermatologists working more hours and seeing more patients per week than female dermatologists. These results are consistent with other studies of dermatologists4,24 and other physicians.12 Regardless, gender was still found to have a significant impact on income even when controlling for differences in productivity and FMLA leave taken. These results are consistent with numerous studies of US physicians that found a gender gap in income even when controlling for hours worked.12,23 Although fellowship training as a whole was found to significantly impact income, our results do not characterize whether the impact on income was positive or negative for each type of fellowship. Fellowship training in specialties such as internal medicine or general surgery likewise has variable effects on income.24,25
A comprehensive survey design and significant data elicited from dermatologists working in private practice for the first time served as the main strengths of this study. Limitations included self-reported design, categorical ranges, and limited sample size in subgroups. Future directions include deeper analysis of subgroups, including fellowship-trained dermatologists, dermatologists working more than 40 hours per week, and female dermatologists by race/ethnicity.
Conclusion
We have demonstrated that self-reported discrepancies in salary between male and female dermatologists exist, with male dermatologists earning a significantly higher annual salary than their female counterparts. This study identified and stratified several career factors that comprise the broad field and practice of dermatology. Even when controlling for these variations, we have demonstrated that gender alone remains a significant predictor of income, indicating that an unexplained income gap between the 2 genders exists in dermatology.
- Association of American Medical Colleges. Table B-2.2: Total Graduates by U.S. Medical School and Sex, 2015-2016 through 2019-2020. December 3, 2020. Accessed October 12, 2021. https://www.aamc.org/download/321532/data/factstableb2-2.pdf
- Willett LL, Halvorsen AJ, McDonald FS, et al. Gender differences in salary of internal medicine residency directors: a national survey. Am J Med. 2015;128:659-665.
- Weeks WB, Wallace AE, Mackenzie TA. Gender differences in anesthesiologists’ annual incomes. Anesthesiology. 2007;106:806-811.
- Weeks WB, Wallace AE. Gender differences in ophthalmologists’ annual incomes. Ophthalmology. 2007;114:1696-1701.
- Singh A, Burke CA, Larive B, et al. Do gender disparities persist in gastroenterology after 10 years of practice? Am J Gastroenterol. 2008;103:1589-1595.
- Desai T, Ali S, Fang X, et al. Equal work for unequal pay: the gender reimbursement gap for healthcare providers in the United States. Postgrad Med J. 2016;92:571-575.
- Jena AB, Olenski AR, Blumenthal DM. Sex differences in physician salary in US public medical schools. JAMA Intern Med. 2016;176:1294-1304.
- John AM, Gupta AB, John ES, et al. A gender-based comparison of promotion and research productivity in academic dermatology. Dermatol Online J. 2016;22:13030/qt1hx610pf.
- Sadeghpour M, Bernstein I, Ko C, et al. Role of sex in academic dermatology: results from a national survey. Arch Dermatol. 2012;148:809-814.
- Gilbert SB, Allshouse A, Skaznik-Wikiel ME. Gender inequality in salaries among reproductive endocrinology and infertility subspecialists in the United States. Fertil Steril. 2019;111:1194-1200.
- Jagsi R, Griffith KA, Stewart A, et al. Gender differences in the salaries of physician researchers. JAMA. 2012;307:2410-2417. doi:10.1001/jama.2012.6183
- Apaydin EA, Chen PGC, Friedberg MW, et al. Differences in physician income by gender in a multiregion survey. J Gen Intern Med. 2018;33:1574-1581.
- Read S, Butkus R, Weissman A, et al. Compensation disparities by gender in internal medicine. Ann Intern Med. 2018;169:658-661.
- Guss ZD, Chen Q, Hu C, et al. Differences in physician compensation between men and women at United States public academic radiation oncology departments. Int J Radiat Oncol Biol Phys. 2019;103:314-319.
- Lo Sasso AT, Richards MR, Chou CF, et al. The $16,819 pay gap for newly trained physicians: the unexplained trend of men earning more than women. Health Aff (Millwood). 2011;30:193-201.
- Shah A, Jalal S, Khosa F. Influences for gender disparity in dermatology in North America. Int J Dermatol. 2018;57:171-176.
- Shi CR, Olbricht S, Vleugels RA, et al. Sex and leadership in academic dermatology: a nationwide survey. J Am Acad Dermatol. 2017;77:782-784.
- Shih AF, Sun W, Yick C, et al. Trends in scholarly productivity of dermatology faculty by academic status and gender. J Am Acad Dermatol. 2019;80:1774-1776.
- Sarfaty S, Kolb D, Barnett R, et al. Negotiation in academic medicine: a necessary career skill. J Womens Health (Larchmt). 2007;16:235-244.
- Jacobson CC, Nguyen JC, Kimball AB. Gender and parenting significantly affect work hours of recent dermatology program graduates. Arch Dermatol. 2004;140:191-196.
- Feramisco JD, Leitenberger JJ, Redfern SI, et al. A gender gap in the dermatology literature? Cross-sectional analysis of manuscript authorship trends in dermatology journals during 3 decades. J Am Acad Dermatol. 2009;60:63-69.
- Bendels MHK, Dietz MC, Brüggmann D, et al. Gender disparities in high-quality dermatology research: a descriptive bibliometric study on scientific authorships. BMJ Open. 2018;8:e020089.
- Seabury SA, Chandra A, Jena AB. Trends in the earnings of male and female health care professionals in the United States, 1987 to 2010. JAMA Intern Med. 2013;173:1748-1750.
- Baimas-George M, Fleischer B, Slakey D, et al. Is it all about the money? Not all surgical subspecialization leads to higher lifetime revenue when compared to general surgery. J Surg Educ. 2017;74:E62-E66.
- Leigh JP, Tancredi D, Jerant A, et al. Lifetime earnings for physicians across specialties. Med Care. 2012;50:1093-1101.
Practice Points
- In this survey-based cross-sectional study, a statistically significant income disparity between male and female dermatologists was found.
- Although several differences were identified between male and female dermatologists that contribute to income, gender remained a statistically significant predictor of income, and this disparity could not be explained by other factors.
Proper Use and Compliance of Facial Masks During the COVID-19 Pandemic: An Observational Study of Hospitals in New York City
Although the universal use of masks by both health care professionals and the general public now appears routine, widely differing recommendations were distributed by different health organizations early in the pandemic. In April 2020, the World Health Organization (WHO) stated that there was no evidence that healthy individuals wearing a medical mask in the community prevented COVID-19 infection.1 However, these recommendations must be placed in the context of a national shortage of personal protective equipment early in the pandemic. The WHO guidance released on June 5, 2020, recommended continuous use of masks for health care workers in the clinical setting.2 Additional recommendations included mask replacement when wet, soiled, or damaged, and when the wearer touched the mask. The WHO also recommended mask usage by those with underlying medical comorbidities and those living in high population–density areas and in settings where physical distancing was not possible.2
The Centers for Disease Control and Prevention (CDC) officially recommended the use of face coverings for the general public to prevent COVID-19 transmission on April 3, 2020.3 The CDC highlighted that masks should not be worn by children younger than 2 years; individuals with respiratory compromise; and patients who are unconscious, incapacitated, or unable to remove a mask without assistance.4 Medical masks and respirators were only recommended for health care workers. Importantly, masks with valves/vents were not recommended, as respiratory droplets can be emitted, defeating the purpose of source control.4 New York State mandated mask usage in public places starting on April 15, 2020.
These recommendations were based on the hypothesis that COVID-19 transmission occurs primarily via droplets and contact. In reality, SARS-CoV-2 transmission more likely occurs in a continuum from larger droplets to miniscule aerosols expelled from an infected person when talking, coughing, or sneezing.5,6 It should be noted that there was a formal suggestion of the potential for airborne transmission of SARS-CoV-2 by the CDC in a statement on September 18, 2020, that was subsequently retracted 3 days later.7,8 The CDC, reversing their prior recommendations, updated their guidance on October 5, 2020, endorsing prior reports that SARS-CoV-2 can be spread through aerosol transmission.8
Mask usage helps prevent viral spread by all individuals, especially those who are presymptomatic and asymptomatic. Presymptomatic individuals account for approximately 40% to 60% of transmissions, and asymptomatic individuals account for approximately 4% to 30% of infections by some models, which suggest these individuals are the drivers of the pandemic, more so than symptomatic individuals.9-15 Additionally, masking also may in effect reduce the amount of SARS-CoV-2 to which individuals are being exposed in the community.14 Universal masking is a relatively low-cost, low-risk intervention that may provide moderate benefit to the individual but substantial benefit to communities at large.10-13 Universal masking in other countries also has clearly demonstrated major benefits during the pandemic. Implementation of universal masking in Taiwan resulted in only approximately 440 COVID-19 cases and less than 10 deaths, despite a population of 23 million.16 South Korea, having experience with Middle East respiratory syndrome, also was able to quickly institute a mask policy for its citizens, resulting in approximately 94% compliance.17 Moreover, several mathematical models have shown that even imperfect use of masks on a population level can prevent disease transmission and should be instituted.18
Given the importance and potential benefits of mask usage, we investigated compliance and proper utilization of facial masks in New York City (NYC), once the epicenter of the pandemic in the United States. New York City and the rest of New York State experienced more than 1.13 million and 1.46 million cases of COVID-19, respectively, as of early November 2021.19 Nationwide, NYC had the greatest absolute death count of more than 34,634 and the greatest rate of death per 100,000 individuals of 412. In contrast, New York State, excluding NYC, had an absolute death count of more than 21,646 and a death rate per 100,000 individuals of 195 as of early November 2021.19 Now entering 20 months since the first case of COVID-19 in NYC, it continues to be vital for facial mask protocols to be emphasized as part of a comprehensive infection prevention protocol, especially in light of continued vaccine resistance, to help stall continued spread of SARS-CoV-2.20
We seek to show that despite months of policies for universal masking in NYC, there is still considerable mask noncompliance by the general public in health care settings where the use of masks is particularly imperative. We conducted an observational study investigating proper use of face masks of adults entering the main entrance of 4 hospitals located in NYC.
Methods
We observed mask usage in adults entering 4 hospitals in September 2020 (postsurge in NYC and prior to the availability of COVID-19 vaccinations). Hospitals were chosen to represent several types of health care delivery systems available in the United States and included a city, state, federal, and private hospital. Data collection was completed during peak traffic hours (8:00
Mask usage was observed and classified into several categories: correctly fitting mask over the nose and mouth, no face mask, mask usage with nose exposed, mask usage with mouth exposed, mask usage with both nose and mouth exposed (ie, mask on the chin/neck area), loosely fitting mask, vented/valved mask, or other form of face covering (eg, bandana, scarf).
Results
We observed a consistent rate of mask compliance between 72% and 85%, with an average of 78% of the 600 individuals observed wearing correctly fitting masks across the 4 hospitals included in this study (Table). The employee entrance included in this study had the highest compliance rate of 85%. An overall low rate of complete mask noncompliance was observed, with only 9 individuals (1.5%) in the entire study not wearing any mask. The federal hospital had the highest rate of mask noncompliance. We also observed a low rate of nose and mouth exposure, with 1.8% of individuals wearing a mask with the nose and mouth exposed (ie, mask tucked under the chin). No individuals were observed with the mouth exposed but with the nose covered by a mask. Additionally, only 3 individuals (0.5%) wore a mask with a vent/valve. The most common way that masks were worn incorrectly was with the nose exposed, accounting for 9.5% of individuals observed. Overall, only 9 individuals (1.5%) wore a nontraditional face covering, with a bandana being the most commonly observed makeshift mask.
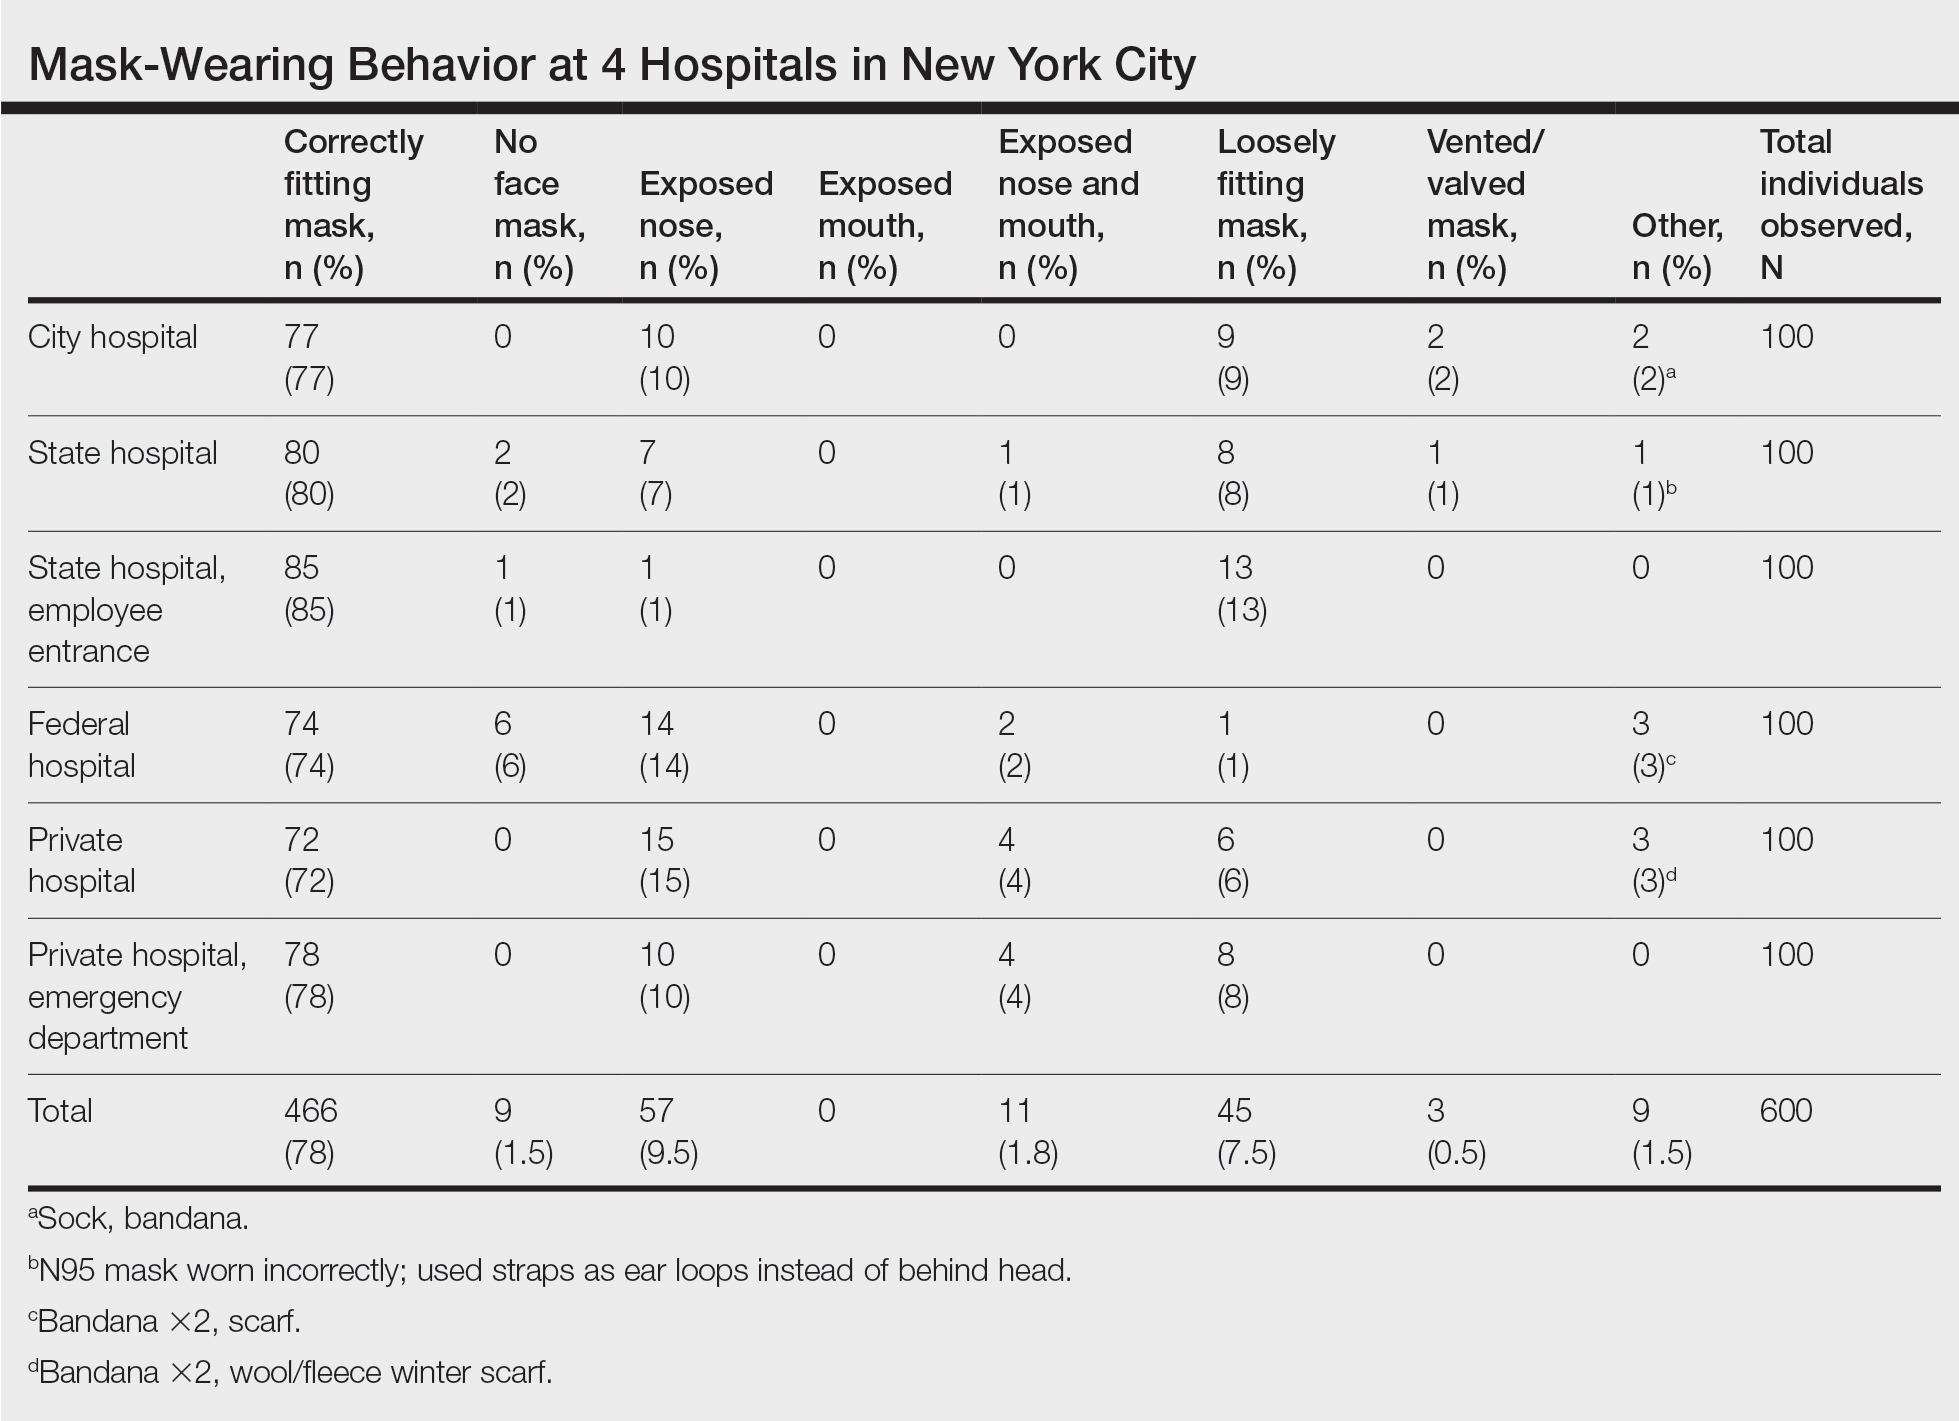
Signage regarding the requirement to wear masks and to social distance was universally instituted at all hospital entry points (both inside and outside the hospital) in this study. However, there were no illustrations demonstrating correct and incorrect forms of mask usage. All signage merely displayed a graphic of a facial mask noting the requirement to wear a mask prior to entering the building. Hospital staff also had face masks available for patients who failed to bring a mask or who wore an inappropriate mask (ie, vented/valved masks).
Comment
Mask Effectiveness—Masks reduce the spread of SARS-CoV-2 by preventing both droplets and potentially virus-bearing aerosols.6,21,22 It has been demonstrated that well-fitted cotton homemade masks and medical masks provide the most effective method of reducing droplet dispersion. Loosely fitted masks as well as bandana-style facial coverings minimally reduce small aerosolized droplets, and an uncovered mouth and nose can disperse particles at a distance much greater than 6 feet.22
Mask Compliance—We report an overall high compliance rate with mask wearing among individuals visiting a hospital; however, compliance was still imperfect. Overall, 78% of observed individuals wore a correctly fitting mask when entering a hospital, even with hospital staff positioned at entry points to ensure proper mask usage. With all the resources available at health care centers, we anticipated a much higher compliance rate for correctly fitting masks at hospital entrances. We hypothesize that given only 78% of individuals showed proper mask compliance in a setting with enforcement by health care personnel, the mask compliance rate in the larger community is likely much lower. It is imperative to enforce continued mask compliance in medical centers and other public areas given notable vaccine noncompliance in certain parts of the country.
Tools to Prevent Disease Transmission—Mask usage by the general public in NYC helped in its response to the COVID-19 pandemic. Yang et al23 demonstrated through mathematical modeling that mask usage in NYC was associated with a 6.6% reduction in transmission overall and a 20% decrease in transmission for individuals 65 years and older during the first month of the universal mask policy going into effect. The authors extrapolated these data during the NYC reopening and found that universal masking reduced transmission by approximately 9% to 11%, accounting for the increase in hours spent outside home quarantine. The authors also hypothesized that if universal masking was as effective in its reduction of transmission for everyone in NYC as it was for older adults, the potential reduction in transmission of SARS-CoV-2 could be as high as 28% to 32%.23
Temperature checks at entrance barricades were standard protocol during the observation period. Although the main purpose of this study was to investigate compliance with and proper use of facial masks in a health care setting, it should be mentioned that, although temperature checks were being done on almost every person entering a hospital, the uniformity and practicality of this intervention has not been backed by substantial evidence. Although many nontouch thermometers are intended to capture a forehead temperature for the most accurate reading, the authors will share that in their observation, medical personnel screening individuals at hospital entrances were observed checking temperatures at any easily accessible body part, such as the forearm, hand, or neck. Furthermore, it has been reported that only approximately 40% of individuals with COVID-19 present with a fever.24 Many hospitals, including the 4 that were included in this investigation, have formal protocols for patients presenting with a fever, especially those presenting to an ambulatory center. Patients are usually instructed to call ahead if they have a fever, and a decision regarding next steps will be discussed with a health care provider. In addition, 1 meta-analysis on the symptoms of COVID-19 suggested that approximately 12% of infected patients are asymptomatic, likely a conservative estimate.25 Although we do not suggest that hospitals stop temperature checks, consistent temperature checks in anatomic locations intended for the specific thermometer used must be employed. Alternatively, a thermographic camera system that could detect heat signatures may be a way to screen faster, only necessitating that those above a threshold be assessed further.
The results of this study suggest that much greater effort is being placed on these temperature checks than on other equally important components of the entrance health assessment. This initial encounter at hospital entrances should serve as an opportunity for education on proper choice and use of masks with clear instructions that masks should not be removed unless directed by a health care provider and in a designated area, such as an examination room. The COVID-19 pandemic in the United States is likely the first time an individual is wearing these types of masks. Reiterating when and how often a mask should be changed (eg, when wet or soiled), how a soiled mask is not an effective mask, how a used mask should be discarded, ways to prevent self-contamination (ie, proper donning and doffing), and the importance of other infection-prevention behaviors—hand hygiene; social distancing; avoidance of touching the eyes, nose, and mouth with unwashed hands; and regular disinfecting of surfaces—should be practiced.11,26-29 Extended use and reuse of masks also can result in transmission of infection.30
Throughout the pandemic, our personal experience is that some patients often overtly refuse to wear a mask, citing underlying respiratory issues. The implications of patients not wearing a mask in a medical office and endangering other patients and staff are beyond the scope of this analysis. We will, however, comment briefly on the evidence behind this common concern. Matuschek et al31 found substantial adverse changes in respiratory rate, oxygen saturation, and CO2 levels in patients with severe chronic obstructive pulmonary disease who were wearing N95 respirators during a 6-minute walk test. Another study by Chan et al32 showed that nonmedical masks in healthy older adults in the community setting had no impact on oxygen saturation. Ultimately, the most effective mask a patient can wear is a mask that will be worn consistently.32
Populations With Limited Access to Masks—The COVID-19 pandemic disproportionately impacted disadvantaged populations, both in socioeconomic status and minority status. A disproportionate number of COVID-19 hospitalizations and deaths occurred in lower-income and minority populations.10 In fact, Lamb et al33 reported that NYC neighborhoods with a larger proportion of uninsured individuals with limited access to health care and overall lower socioeconomic status had a higher rate of SARS-CoV-2 positivity. A retrospective study in Louisiana showed that Black individuals accounted for 77% of hospitalizations and 71% of deaths due to COVID-19 in a population where only 31% of individuals identified as Black.10 Chu et al6 even asserted that policies should be put into place to address equity issues for populations with limited access to masks. We agree that policies should be put into action to ensure that individuals lacking the means to obtain appropriate masks or unable to obtain an adequate supply of masks be provided this new necessity. It has been calculated that the impact of masks in reducing virus transmission would be greatest if mask availability to disadvantaged populations is ensured.18 We support a plan for masks to be covered by government-sponsored health plans.
Study Limitations—Several limitations exist in our study that should be discussed. Although the data collectors observed a large number of individuals, each hospital entrance was only observed for 1 half-day morning session. There may be variations in the number of people wearing a mask at different times of day and different days of the week with fluctuations in hospital traffic. Although data were collected at a variety of hospitals representing the diverse health care delivery models available in the United States, the NYC hospitals included in this study may have different resources available for infection-prevention strategies than hospitals across the country, given NYC’s unique population density and demographics.
Study Strengths—The generalizability of the study should be recognized. Data were collected by all major health care delivery models available in the United States—private, state, city, and federal hospital systems. This study can be easily replicated in other health care delivery systems to further investigate potential gaps in mask usage and infection prevention. Repeating this study in areas where a large portion of the population does not believe in the virus also will likely show lower levels of mask use.
Conclusion
As the country grapples with vaccine hesitancy and with the new variants of SARS-CoV-2, continued universal masking is still imperative. The effectiveness of universal masking has been demonstrated, and with the combination of vaccinations, we can be assured that the world will continue to emerge from the pandemic.
- World Health Organization. Advice on the use of masks in the context of COVID-19. Interim guidance (6 April 2020). Accessed November 8, 2021. https://apps.who.int/iris/bitstream/handle/10665/331693/WHO-2019-nCov-IPC_Masks-2020.3-eng.pdf?sequence=1ceisAllowed=y
- World Health Organization. Advice on the use of masks in the context of COVID-19. Interim guidance (5 June 2020). Accessed November 8, 2021. https://apps.who.int/iris/bitstream/handle/10665/332293/WHO- 2019-nCov-IPC_Masks-2020.4-eng.pdf?sequence=1&isAllowed=y
- Fisher KA, Barile JP, Guerin RJ, et al. Factors associated with cloth face covering use among adults during the COVID-19 pandemic—United States, April and May 2020. MMWR Morb Mortal Wkly Rep. 2020;69:933-937.
- Centers for Disease Control and Prevention. Coronavirus disease 2019 (COVID-19). Considerations for wearing masks (19 April 2021). Accessed November 10, 2021. https://www.cdc.gov/coronavirus/2019-ncov/prevent-getting-sick/cloth-face-cover-guidance.html
- Conly J, Seto WH, Pittet D, et al. Use of medical face masks versus particulate respirators as a component of personal protective equipment for health care workers in the context of the COVID-19 pandemic. Antimicrob Resist Infect Control. 2020;9:126.
- Chu DK, Akl EA, Duda S, et al; COVID-19 Systematic Urgent Review Group Effort (SURGE) study authors. Physical distancing, face masks, and eye protection to prevent person-to-person transmission of SARS-CoV-2 and COVID-19: a systematic review and meta-analysis. Lancet. 2020;395:1973-1987.
- Huang, P. Coronavirus FAQs: Why can’t the CDC make up its mind about airborne transmission? NPR. September 25, 2020. Accessed November 8, 2021. https://www.npr.org/sections/goatsandsoda/2020/09/25/916624967/coronavirus-faqs-why-cant-the-cdc-make-up-its-mind-about-airborne-transmission
- Centers for Disease Control and Prevention. Coronavirus disease 2019 (COVID-19). How COVID-19 spreads (14 July 2021). Accessed November 10, 2021. https://www.cdc.gov/coronavirus/2019-ncov/prevent-getting-sick/how-covid-spreads.html
- Wiersinga WJ, Rhodes A, Cheng AC, et al. Pathophysiology, transmission, diagnosis, and treatment of coronavirus disease 2019 (COVID-19): a review. JAMA. 2020;324:782-793.
- Klompas M, Morris CA, Shenoy ES. Universal masking in the covid-19 era. N Engl J Med. 2020;383:E9.
- Middleton JD, Lopes H. Face masks in the covid-19 crisis: caveats, limits, and priorities. BMJ. 2020;369:m2030.
- Cheng KK, Lam TH, Leung CC. Wearing face masks in the community during the COVID-19 pandemic: altruism and solidarity [published online April 16, 2020]. Lancet. doi:10.1016/S0140-6736(20)30918-1
- Javid B, Weekes MP, Matheson NJ. Covid-19: should the public wear face masks? BMJ. 2020;369:m1442.
- Gandhi M, Beyrer C, Goosby E. Masks do more than protect others during COVID-19: reducing the inoculum of SARS-CoV-2 to protect the wearer. J Gen Intern Med. 2020;35:3063-3066.
- Ngonghala CN, Iboi EA, Gumel AB. Could masks curtail the post-lockdown resurgence of COVID-19 in the US? Math Biosci. 2020;329:108452. doi:10.1016/j.mbs.2020.108452
- Yi-Fong Su V, Yen YF, Yang KY, et al. Masks and medical care: two keys to Taiwan’s success in preventing COVID-19 spread. Travel Med Infect Dis. 2020;38:101780.
- Lim S, Yoon HI, Song KH, et al. Face masks and containment of COVID-19: experience from South Korea. J Hosp Infect. 2020;106:206-207.
- Fisman DN, Greer AL, Tuite AR. Bidirectional impact of imperfect mask use on reproduction number of COVID-19: a next generation matrix approach. Infect Dis Model. 2020;5:405-408.
- Centers for Disease Control and Prevention. COVID data tracker. United States COVID-19 cases, deaths, and laboratory testing (NAATs) by state, territory, and jurisdiction. Accessed July 6, 2021. https://covid.cdc.gov/covid-data-tracker/#cases_totalcases
- Francescani C. Timeline: the first 100 days of New York Gov. Andrew Cuomo’s COVID-19 response. ABC News. June 17, 2020. Accessed November 8, 2021. https://abcnews.go.com/US/News/timeline-100-days-york-gov-andrew-cuomos-covid/story?id=71292880
- Zhang R, Li Y, Zhang AL, et al. Identifying airborne transmission as the dominant route for the spread of COVID-19. Proc Natl Acad Sci U S A. 2020;117:14857-14863.
- Verma S, Dhanak M, Frankenfield J. Visualizing the effectiveness of face masks in obstructing respiratory jets. Phys Fluids (1994). 2020;32:061708.
- Yang W, Shaff J, Shaman J. COVID-19 transmission dynamics and effectiveness of public health interventions in New York City during the 2020 spring pandemic wave. medRxiv. Preprint posted online September 9, 2020. doi:10.1101/2020.09.08.20190710
- Zavascki AP, Falci DR. Clinical characteristics of covid-19 in China. N Engl J Med. 2020;382:1859.
- Zhu J, Ji P, Pang J, et al. Clinical characteristics of 3062 COVID-19 patients: a meta-analysis. J Med Virol. 2020;92:1902-1914. doi:10.1002/jmv.25884
- Sommerstein R, Fux CA, Vuichard-Gysin D, et al. Risk of SARS-CoV-2 transmission by aerosols, the rational use of masks, and protection of healthcare workers from COVID-19. Antimicrob Resist Infect Control. 2020;9:100.
- Stone TE, Kunaviktikul W, Omura M, et al. Facemasks and the covid 19 pandemic: what advice should health professionals be giving the general public about the wearing of facemasks? Nurs Health Sci. 2020;22:339-342.
- Tam VC, Tam SY, Poon WK, et al. A reality check on the use of face masks during the COVID-19 outbreak in Hong Kong. EClinicalMedicine. 2020;22:100356.
- Chen YJ, Qin G, Chen J, et al. Comparison of face-touching behaviors before and during the coronavirus disease 2019 pandemic. JAMA Netw Open. 2020;3:e2016924.
- O’Dowd K, Nair KM, Forouzandeh P, et al. Face masks and respirators in the fight against the COVID-19 pandemic: a review of current materials, advances and future perspectives. Materials (Basel). 2020;13:3363.
- Matuschek C, Moll F, Fangerau H, et al. Face masks: benefits and risks during the COVID-19 crisis. Eur J Med Res. 2020;25:32.
- Chan NC, Li K, Hirsh J. Peripheral oxygen saturation in older persons wearing nonmedical face masks in community settings. JAMA. 2020;324:2323-2324. doi:10.1001/jama.2020.21905
- , , . Differential COVID‐19 case positivity in New York City neighborhoods: socioeconomic factors and mobility. Influenza Other Respir Viruses. 2021;15:209-217. doi:10.1111/irv.12816
Although the universal use of masks by both health care professionals and the general public now appears routine, widely differing recommendations were distributed by different health organizations early in the pandemic. In April 2020, the World Health Organization (WHO) stated that there was no evidence that healthy individuals wearing a medical mask in the community prevented COVID-19 infection.1 However, these recommendations must be placed in the context of a national shortage of personal protective equipment early in the pandemic. The WHO guidance released on June 5, 2020, recommended continuous use of masks for health care workers in the clinical setting.2 Additional recommendations included mask replacement when wet, soiled, or damaged, and when the wearer touched the mask. The WHO also recommended mask usage by those with underlying medical comorbidities and those living in high population–density areas and in settings where physical distancing was not possible.2
The Centers for Disease Control and Prevention (CDC) officially recommended the use of face coverings for the general public to prevent COVID-19 transmission on April 3, 2020.3 The CDC highlighted that masks should not be worn by children younger than 2 years; individuals with respiratory compromise; and patients who are unconscious, incapacitated, or unable to remove a mask without assistance.4 Medical masks and respirators were only recommended for health care workers. Importantly, masks with valves/vents were not recommended, as respiratory droplets can be emitted, defeating the purpose of source control.4 New York State mandated mask usage in public places starting on April 15, 2020.
These recommendations were based on the hypothesis that COVID-19 transmission occurs primarily via droplets and contact. In reality, SARS-CoV-2 transmission more likely occurs in a continuum from larger droplets to miniscule aerosols expelled from an infected person when talking, coughing, or sneezing.5,6 It should be noted that there was a formal suggestion of the potential for airborne transmission of SARS-CoV-2 by the CDC in a statement on September 18, 2020, that was subsequently retracted 3 days later.7,8 The CDC, reversing their prior recommendations, updated their guidance on October 5, 2020, endorsing prior reports that SARS-CoV-2 can be spread through aerosol transmission.8
Mask usage helps prevent viral spread by all individuals, especially those who are presymptomatic and asymptomatic. Presymptomatic individuals account for approximately 40% to 60% of transmissions, and asymptomatic individuals account for approximately 4% to 30% of infections by some models, which suggest these individuals are the drivers of the pandemic, more so than symptomatic individuals.9-15 Additionally, masking also may in effect reduce the amount of SARS-CoV-2 to which individuals are being exposed in the community.14 Universal masking is a relatively low-cost, low-risk intervention that may provide moderate benefit to the individual but substantial benefit to communities at large.10-13 Universal masking in other countries also has clearly demonstrated major benefits during the pandemic. Implementation of universal masking in Taiwan resulted in only approximately 440 COVID-19 cases and less than 10 deaths, despite a population of 23 million.16 South Korea, having experience with Middle East respiratory syndrome, also was able to quickly institute a mask policy for its citizens, resulting in approximately 94% compliance.17 Moreover, several mathematical models have shown that even imperfect use of masks on a population level can prevent disease transmission and should be instituted.18
Given the importance and potential benefits of mask usage, we investigated compliance and proper utilization of facial masks in New York City (NYC), once the epicenter of the pandemic in the United States. New York City and the rest of New York State experienced more than 1.13 million and 1.46 million cases of COVID-19, respectively, as of early November 2021.19 Nationwide, NYC had the greatest absolute death count of more than 34,634 and the greatest rate of death per 100,000 individuals of 412. In contrast, New York State, excluding NYC, had an absolute death count of more than 21,646 and a death rate per 100,000 individuals of 195 as of early November 2021.19 Now entering 20 months since the first case of COVID-19 in NYC, it continues to be vital for facial mask protocols to be emphasized as part of a comprehensive infection prevention protocol, especially in light of continued vaccine resistance, to help stall continued spread of SARS-CoV-2.20
We seek to show that despite months of policies for universal masking in NYC, there is still considerable mask noncompliance by the general public in health care settings where the use of masks is particularly imperative. We conducted an observational study investigating proper use of face masks of adults entering the main entrance of 4 hospitals located in NYC.
Methods
We observed mask usage in adults entering 4 hospitals in September 2020 (postsurge in NYC and prior to the availability of COVID-19 vaccinations). Hospitals were chosen to represent several types of health care delivery systems available in the United States and included a city, state, federal, and private hospital. Data collection was completed during peak traffic hours (8:00
Mask usage was observed and classified into several categories: correctly fitting mask over the nose and mouth, no face mask, mask usage with nose exposed, mask usage with mouth exposed, mask usage with both nose and mouth exposed (ie, mask on the chin/neck area), loosely fitting mask, vented/valved mask, or other form of face covering (eg, bandana, scarf).
Results
We observed a consistent rate of mask compliance between 72% and 85%, with an average of 78% of the 600 individuals observed wearing correctly fitting masks across the 4 hospitals included in this study (Table). The employee entrance included in this study had the highest compliance rate of 85%. An overall low rate of complete mask noncompliance was observed, with only 9 individuals (1.5%) in the entire study not wearing any mask. The federal hospital had the highest rate of mask noncompliance. We also observed a low rate of nose and mouth exposure, with 1.8% of individuals wearing a mask with the nose and mouth exposed (ie, mask tucked under the chin). No individuals were observed with the mouth exposed but with the nose covered by a mask. Additionally, only 3 individuals (0.5%) wore a mask with a vent/valve. The most common way that masks were worn incorrectly was with the nose exposed, accounting for 9.5% of individuals observed. Overall, only 9 individuals (1.5%) wore a nontraditional face covering, with a bandana being the most commonly observed makeshift mask.
Signage regarding the requirement to wear masks and to social distance was universally instituted at all hospital entry points (both inside and outside the hospital) in this study. However, there were no illustrations demonstrating correct and incorrect forms of mask usage. All signage merely displayed a graphic of a facial mask noting the requirement to wear a mask prior to entering the building. Hospital staff also had face masks available for patients who failed to bring a mask or who wore an inappropriate mask (ie, vented/valved masks).
Comment
Mask Effectiveness—Masks reduce the spread of SARS-CoV-2 by preventing both droplets and potentially virus-bearing aerosols.6,21,22 It has been demonstrated that well-fitted cotton homemade masks and medical masks provide the most effective method of reducing droplet dispersion. Loosely fitted masks as well as bandana-style facial coverings minimally reduce small aerosolized droplets, and an uncovered mouth and nose can disperse particles at a distance much greater than 6 feet.22
Mask Compliance—We report an overall high compliance rate with mask wearing among individuals visiting a hospital; however, compliance was still imperfect. Overall, 78% of observed individuals wore a correctly fitting mask when entering a hospital, even with hospital staff positioned at entry points to ensure proper mask usage. With all the resources available at health care centers, we anticipated a much higher compliance rate for correctly fitting masks at hospital entrances. We hypothesize that given only 78% of individuals showed proper mask compliance in a setting with enforcement by health care personnel, the mask compliance rate in the larger community is likely much lower. It is imperative to enforce continued mask compliance in medical centers and other public areas given notable vaccine noncompliance in certain parts of the country.
Tools to Prevent Disease Transmission—Mask usage by the general public in NYC helped in its response to the COVID-19 pandemic. Yang et al23 demonstrated through mathematical modeling that mask usage in NYC was associated with a 6.6% reduction in transmission overall and a 20% decrease in transmission for individuals 65 years and older during the first month of the universal mask policy going into effect. The authors extrapolated these data during the NYC reopening and found that universal masking reduced transmission by approximately 9% to 11%, accounting for the increase in hours spent outside home quarantine. The authors also hypothesized that if universal masking was as effective in its reduction of transmission for everyone in NYC as it was for older adults, the potential reduction in transmission of SARS-CoV-2 could be as high as 28% to 32%.23
Temperature checks at entrance barricades were standard protocol during the observation period. Although the main purpose of this study was to investigate compliance with and proper use of facial masks in a health care setting, it should be mentioned that, although temperature checks were being done on almost every person entering a hospital, the uniformity and practicality of this intervention has not been backed by substantial evidence. Although many nontouch thermometers are intended to capture a forehead temperature for the most accurate reading, the authors will share that in their observation, medical personnel screening individuals at hospital entrances were observed checking temperatures at any easily accessible body part, such as the forearm, hand, or neck. Furthermore, it has been reported that only approximately 40% of individuals with COVID-19 present with a fever.24 Many hospitals, including the 4 that were included in this investigation, have formal protocols for patients presenting with a fever, especially those presenting to an ambulatory center. Patients are usually instructed to call ahead if they have a fever, and a decision regarding next steps will be discussed with a health care provider. In addition, 1 meta-analysis on the symptoms of COVID-19 suggested that approximately 12% of infected patients are asymptomatic, likely a conservative estimate.25 Although we do not suggest that hospitals stop temperature checks, consistent temperature checks in anatomic locations intended for the specific thermometer used must be employed. Alternatively, a thermographic camera system that could detect heat signatures may be a way to screen faster, only necessitating that those above a threshold be assessed further.
The results of this study suggest that much greater effort is being placed on these temperature checks than on other equally important components of the entrance health assessment. This initial encounter at hospital entrances should serve as an opportunity for education on proper choice and use of masks with clear instructions that masks should not be removed unless directed by a health care provider and in a designated area, such as an examination room. The COVID-19 pandemic in the United States is likely the first time an individual is wearing these types of masks. Reiterating when and how often a mask should be changed (eg, when wet or soiled), how a soiled mask is not an effective mask, how a used mask should be discarded, ways to prevent self-contamination (ie, proper donning and doffing), and the importance of other infection-prevention behaviors—hand hygiene; social distancing; avoidance of touching the eyes, nose, and mouth with unwashed hands; and regular disinfecting of surfaces—should be practiced.11,26-29 Extended use and reuse of masks also can result in transmission of infection.30
Throughout the pandemic, our personal experience is that some patients often overtly refuse to wear a mask, citing underlying respiratory issues. The implications of patients not wearing a mask in a medical office and endangering other patients and staff are beyond the scope of this analysis. We will, however, comment briefly on the evidence behind this common concern. Matuschek et al31 found substantial adverse changes in respiratory rate, oxygen saturation, and CO2 levels in patients with severe chronic obstructive pulmonary disease who were wearing N95 respirators during a 6-minute walk test. Another study by Chan et al32 showed that nonmedical masks in healthy older adults in the community setting had no impact on oxygen saturation. Ultimately, the most effective mask a patient can wear is a mask that will be worn consistently.32
Populations With Limited Access to Masks—The COVID-19 pandemic disproportionately impacted disadvantaged populations, both in socioeconomic status and minority status. A disproportionate number of COVID-19 hospitalizations and deaths occurred in lower-income and minority populations.10 In fact, Lamb et al33 reported that NYC neighborhoods with a larger proportion of uninsured individuals with limited access to health care and overall lower socioeconomic status had a higher rate of SARS-CoV-2 positivity. A retrospective study in Louisiana showed that Black individuals accounted for 77% of hospitalizations and 71% of deaths due to COVID-19 in a population where only 31% of individuals identified as Black.10 Chu et al6 even asserted that policies should be put into place to address equity issues for populations with limited access to masks. We agree that policies should be put into action to ensure that individuals lacking the means to obtain appropriate masks or unable to obtain an adequate supply of masks be provided this new necessity. It has been calculated that the impact of masks in reducing virus transmission would be greatest if mask availability to disadvantaged populations is ensured.18 We support a plan for masks to be covered by government-sponsored health plans.
Study Limitations—Several limitations exist in our study that should be discussed. Although the data collectors observed a large number of individuals, each hospital entrance was only observed for 1 half-day morning session. There may be variations in the number of people wearing a mask at different times of day and different days of the week with fluctuations in hospital traffic. Although data were collected at a variety of hospitals representing the diverse health care delivery models available in the United States, the NYC hospitals included in this study may have different resources available for infection-prevention strategies than hospitals across the country, given NYC’s unique population density and demographics.
Study Strengths—The generalizability of the study should be recognized. Data were collected by all major health care delivery models available in the United States—private, state, city, and federal hospital systems. This study can be easily replicated in other health care delivery systems to further investigate potential gaps in mask usage and infection prevention. Repeating this study in areas where a large portion of the population does not believe in the virus also will likely show lower levels of mask use.
Conclusion
As the country grapples with vaccine hesitancy and with the new variants of SARS-CoV-2, continued universal masking is still imperative. The effectiveness of universal masking has been demonstrated, and with the combination of vaccinations, we can be assured that the world will continue to emerge from the pandemic.
- World Health Organization. Advice on the use of masks in the context of COVID-19. Interim guidance (6 April 2020). Accessed November 8, 2021. https://apps.who.int/iris/bitstream/handle/10665/331693/WHO-2019-nCov-IPC_Masks-2020.3-eng.pdf?sequence=1ceisAllowed=y
- World Health Organization. Advice on the use of masks in the context of COVID-19. Interim guidance (5 June 2020). Accessed November 8, 2021. https://apps.who.int/iris/bitstream/handle/10665/332293/WHO- 2019-nCov-IPC_Masks-2020.4-eng.pdf?sequence=1&isAllowed=y
- Fisher KA, Barile JP, Guerin RJ, et al. Factors associated with cloth face covering use among adults during the COVID-19 pandemic—United States, April and May 2020. MMWR Morb Mortal Wkly Rep. 2020;69:933-937.
- Centers for Disease Control and Prevention. Coronavirus disease 2019 (COVID-19). Considerations for wearing masks (19 April 2021). Accessed November 10, 2021. https://www.cdc.gov/coronavirus/2019-ncov/prevent-getting-sick/cloth-face-cover-guidance.html
- Conly J, Seto WH, Pittet D, et al. Use of medical face masks versus particulate respirators as a component of personal protective equipment for health care workers in the context of the COVID-19 pandemic. Antimicrob Resist Infect Control. 2020;9:126.
- Chu DK, Akl EA, Duda S, et al; COVID-19 Systematic Urgent Review Group Effort (SURGE) study authors. Physical distancing, face masks, and eye protection to prevent person-to-person transmission of SARS-CoV-2 and COVID-19: a systematic review and meta-analysis. Lancet. 2020;395:1973-1987.
- Huang, P. Coronavirus FAQs: Why can’t the CDC make up its mind about airborne transmission? NPR. September 25, 2020. Accessed November 8, 2021. https://www.npr.org/sections/goatsandsoda/2020/09/25/916624967/coronavirus-faqs-why-cant-the-cdc-make-up-its-mind-about-airborne-transmission
- Centers for Disease Control and Prevention. Coronavirus disease 2019 (COVID-19). How COVID-19 spreads (14 July 2021). Accessed November 10, 2021. https://www.cdc.gov/coronavirus/2019-ncov/prevent-getting-sick/how-covid-spreads.html
- Wiersinga WJ, Rhodes A, Cheng AC, et al. Pathophysiology, transmission, diagnosis, and treatment of coronavirus disease 2019 (COVID-19): a review. JAMA. 2020;324:782-793.
- Klompas M, Morris CA, Shenoy ES. Universal masking in the covid-19 era. N Engl J Med. 2020;383:E9.
- Middleton JD, Lopes H. Face masks in the covid-19 crisis: caveats, limits, and priorities. BMJ. 2020;369:m2030.
- Cheng KK, Lam TH, Leung CC. Wearing face masks in the community during the COVID-19 pandemic: altruism and solidarity [published online April 16, 2020]. Lancet. doi:10.1016/S0140-6736(20)30918-1
- Javid B, Weekes MP, Matheson NJ. Covid-19: should the public wear face masks? BMJ. 2020;369:m1442.
- Gandhi M, Beyrer C, Goosby E. Masks do more than protect others during COVID-19: reducing the inoculum of SARS-CoV-2 to protect the wearer. J Gen Intern Med. 2020;35:3063-3066.
- Ngonghala CN, Iboi EA, Gumel AB. Could masks curtail the post-lockdown resurgence of COVID-19 in the US? Math Biosci. 2020;329:108452. doi:10.1016/j.mbs.2020.108452
- Yi-Fong Su V, Yen YF, Yang KY, et al. Masks and medical care: two keys to Taiwan’s success in preventing COVID-19 spread. Travel Med Infect Dis. 2020;38:101780.
- Lim S, Yoon HI, Song KH, et al. Face masks and containment of COVID-19: experience from South Korea. J Hosp Infect. 2020;106:206-207.
- Fisman DN, Greer AL, Tuite AR. Bidirectional impact of imperfect mask use on reproduction number of COVID-19: a next generation matrix approach. Infect Dis Model. 2020;5:405-408.
- Centers for Disease Control and Prevention. COVID data tracker. United States COVID-19 cases, deaths, and laboratory testing (NAATs) by state, territory, and jurisdiction. Accessed July 6, 2021. https://covid.cdc.gov/covid-data-tracker/#cases_totalcases
- Francescani C. Timeline: the first 100 days of New York Gov. Andrew Cuomo’s COVID-19 response. ABC News. June 17, 2020. Accessed November 8, 2021. https://abcnews.go.com/US/News/timeline-100-days-york-gov-andrew-cuomos-covid/story?id=71292880
- Zhang R, Li Y, Zhang AL, et al. Identifying airborne transmission as the dominant route for the spread of COVID-19. Proc Natl Acad Sci U S A. 2020;117:14857-14863.
- Verma S, Dhanak M, Frankenfield J. Visualizing the effectiveness of face masks in obstructing respiratory jets. Phys Fluids (1994). 2020;32:061708.
- Yang W, Shaff J, Shaman J. COVID-19 transmission dynamics and effectiveness of public health interventions in New York City during the 2020 spring pandemic wave. medRxiv. Preprint posted online September 9, 2020. doi:10.1101/2020.09.08.20190710
- Zavascki AP, Falci DR. Clinical characteristics of covid-19 in China. N Engl J Med. 2020;382:1859.
- Zhu J, Ji P, Pang J, et al. Clinical characteristics of 3062 COVID-19 patients: a meta-analysis. J Med Virol. 2020;92:1902-1914. doi:10.1002/jmv.25884
- Sommerstein R, Fux CA, Vuichard-Gysin D, et al. Risk of SARS-CoV-2 transmission by aerosols, the rational use of masks, and protection of healthcare workers from COVID-19. Antimicrob Resist Infect Control. 2020;9:100.
- Stone TE, Kunaviktikul W, Omura M, et al. Facemasks and the covid 19 pandemic: what advice should health professionals be giving the general public about the wearing of facemasks? Nurs Health Sci. 2020;22:339-342.
- Tam VC, Tam SY, Poon WK, et al. A reality check on the use of face masks during the COVID-19 outbreak in Hong Kong. EClinicalMedicine. 2020;22:100356.
- Chen YJ, Qin G, Chen J, et al. Comparison of face-touching behaviors before and during the coronavirus disease 2019 pandemic. JAMA Netw Open. 2020;3:e2016924.
- O’Dowd K, Nair KM, Forouzandeh P, et al. Face masks and respirators in the fight against the COVID-19 pandemic: a review of current materials, advances and future perspectives. Materials (Basel). 2020;13:3363.
- Matuschek C, Moll F, Fangerau H, et al. Face masks: benefits and risks during the COVID-19 crisis. Eur J Med Res. 2020;25:32.
- Chan NC, Li K, Hirsh J. Peripheral oxygen saturation in older persons wearing nonmedical face masks in community settings. JAMA. 2020;324:2323-2324. doi:10.1001/jama.2020.21905
- , , . Differential COVID‐19 case positivity in New York City neighborhoods: socioeconomic factors and mobility. Influenza Other Respir Viruses. 2021;15:209-217. doi:10.1111/irv.12816
Practice Points
- Enormous financial and human resources have been utilized by health care systems to prevent the spread of COVID-19 in health care settings, including universal temperature checks, clinical symptom triage, and masking policies. Despite these mitigation practices, mask noncompliance continues to be a major problem in hospitals.
- Mask compliance among 600 individuals entering 4 New York City hospitals was observed to be 78%, despite months of policies for universal masking and the city’s high mortality rates during the first COVID-19 wave.
- Masks have been shown to reduce the spread of COVID-19, and proper mask compliance is an important issue that must be addressed by health care administrations and governmental agencies.

Assessment of Same-Day Naloxone Availability in New Mexico Pharmacies
From the Department of Medicine, University of California San Diego (Dr. Haponyuk), Department of Emergency Medicine, University of Tennessee (Dr. Dejong), the Department of Family Medicine, University of New Mexico (Dr. Gutfrucht), and the Department of Internal Medicine, University of New Mexico (Dr. Barrett)
Objective: Naloxone availability can reduce the risk of death from opioid overdoses, although prescriber, legislative, and payment barriers to accessing this life-saving medication exist. A previously underreported barrier involves same-day availability, the lack of which may force patients to travel to multiple pharmacies and having delays in access or risking not filling their prescription. This study sought to determine same-day availability of naloxone in pharmacies in the state of New Mexico.
Methods: Same-day availability of naloxone was assessed via an audit survey.
Results: Of the 183 pharamacies screened, only 84.7% had same-day availability, including only 72% in Albuquerque, the state’s most populous city/municipality.
Conclusion: These results highlight the extent of a previously underexplored challenge to patient care and barrier to patient safety, and future directions for more patient-centered care.
Keywords: naloxone; barriers to care; opioid overdose prevention.
The US is enduring an ongoing epidemic of deaths due to opioid use, which have increased in frequency since the onset of the COVID-19 pandemic.1 One strategy to reduce the risk of mortality from opioid use is to ensure the widespread availability of naloxone. Individual states have implemented harm reduction strategies to increase access to naloxone, including improving availability via a statewide standing order that it may be dispensed without a prescription.2,3 Such naloxone access laws are being widely adopted and are believed to reduce overdose deaths.4
There are many barriers to patients receiving naloxone despite their clinicians providing a prescription for it, including stigmatization, financial cost, and local availability.5-9 However, the stigma associated with naloxone extends to both patients and pharmacists. Pharmacists in West Virginia, for example, showed widespread concerns about having naloxone available for patients to purchase over the counter, for fear that increasing naloxone access may increase overdoses.6 A study in Tennessee also found pharmacists hesitant to recommend naloxone.7 Another study of rural pharmacies in Georgia found that just over half carried naloxone despite a state law that naloxone be available without a prescription.8 Challenges are not limited to rural areas, however; a study in Philadelphia found that more than one-third of pharmacies required a prescription to dispense naloxone, contrary to state law.9 Thus, in a rapidly changing regulatory environment, there are many evolving barriers to patients receiving naloxone.
New Mexico has an opioid overdose rate higher than the national average, coming in 15th out of 50 states when last ranked in 2018, with overdose rates that vary across demographic variables.10 Consequently, New Mexico state law added language requiring clinicians prescribing opioids for 5 days or longer to co-prescribe naloxone along with written information on how to administer the opioid antagonist.11 New Mexico is also a geographically large state with a relatively low overall population characterized by striking health disparities, particularly as related to access to care.
The purpose of this study is to describe the same-day availability of naloxone throughout the state of New Mexico after a change in state law requiring co-prescription was enacted, to help identify challenges to patients receiving it. Comprehensive examination of barriers to patients accessing this life-saving medication can advise strategies to both improve patient-centered care and potentially reduce deaths.
Methods
To better understand barriers to patients obtaining naloxone, in July and August of 2019 we performed an audit (“secret shopper”) study of all pharmacies in the state, posing as patients wishing to obtain naloxone. A publicly available list of every pharmacy in New Mexico was used to identify 89 pharmacies in Albuquerque (the most populous city in New Mexico) and 106 pharmacies throughout the rest of the state.12
Every pharmacy was called via a publicly available phone number during business hours (confirmed via an internet search), at least 2 hours prior to closing. One of 3 researchers telephoned pharmacies posing as a patient and inquired whether naloxone would be available for pick up the same day. If the pharmacy confirmed it was available that day, the call concluded. If naloxone was unavailable for same day pick up, researchers asked when it would be next available. Each pharmacy was called once, and neither insurance information nor cost was offered or requested. All questions were asked in English by native English speakers.
All responses were recorded in a secure spreadsheet. Once all responses were received and reviewed, they were characterized in discrete response categories: same day, within 1 to 2 days, within 3 to 4 days, within a week, or unsure/unknown. Naloxone availability was also tracked by city/municipality, and this was compared to the state’s population distribution.
No personally identifiable information was obtained. This study was Institutional Review Board exempt.

Results
Responses were recorded from 183 pharmacies. Seventeen locations were eliminated from our analysis because their phone system was inoperable or the pharmacy was permanently closed. Of the pharmacies reached, 84.7% (155/183) reported they have naloxone available for pick up on the same day (Figure 1). Of the 15.3% (28) pharmacies that did not have same-day availability, 60.7% (17 pharmacies) reported availability in 1 to 2 days, 3.6% had availability in 3 to 4 days, 3.6% had availability in 1 week, and 32.1% were unsure of next availability (Figure 2). More than one-third of the state’s patients reside in municipalities where naloxone is immediately available in at least 72% of pharmacies (Table).13

Discussion
Increased access to naloxone at the state and community level is associated with reduced risk for death from overdose, and, consequently, widespread availability is recommended.14-17 Statewide real-time pharmacy availability of naloxone—as patients would experience availability—has not been previously reported. These findings suggest unpredictable same-day availability that may affect experience and care outcomes. That other studies have found similar challenges in naloxone availability in other municipalities and regions suggests this barrier to access is widespread,6-9 and likely affects patients throughout the country.

Many patients have misgivings about naloxone, and it places an undue burden on them to travel to multiple pharmacies or take repeated trips to fill prescriptions. Additionally, patients without reliable transportation may be unable to return at a later date. Although we found most pharmacies in New Mexico without immediate availability of naloxone reported they could have it within several days, such a delay may reduce the likelihood that patients will fill their prescription at all. It is also concerning that many pharmacies are unsure of when naloxone will be available, particularly when some of these may be the only pharmacy easily accessible to patients or the one where they regularly fill their prescriptions.
Barriers to naloxone availability requires further study due to possible negative consequences for patient safety and risks for exacerbating health disparities among vulnerable populations. Further research may focus on examining the effects on patients when naloxone dispensing is delayed or impossible, why there is variability in naloxone availability between different pharmacies and municipalities, the reasons for uncertainty when naloxone will be available, and effective solutions. Expanded naloxone distribution in community locations and in clinics offers one potential patient-centered solution that should be explored, but it is likely that more widespread and systemic solutions will require policy and regulatory changes at the state and national levels.
Limitations of this study include that the findings may be relevant for solely 1 state, such as in the case of state-specific barriers to keeping naloxone in stock that we are unaware of. However, it is unclear why that would be the case, and it is more likely that similar barriers are pervasive. Additionally, repeat phone calls, which we did not follow up with, may have yielded more pharmacies with naloxone availability. However, due to the stigma associated with obtaining naloxone, it may be that patients will not make multiple calls either—highlighting how important real-time availability is.
Conclusion
Urgent solutions are needed to address the epidemic of deaths from opioid overdoses. Naloxone availability is an important tool for reducing these deaths, resulting in numerous state laws attempting to increase access. Despite this, there are persistent barriers to patients receiving naloxone, including a lack of same-day availability at pharmacies. Our results suggest that this underexplored barrier is widespread. Improving both availability and accessibility of naloxone may include legislative policy solutions as well as patient-oriented solutions, such as distribution in clinics and hospitals when opioid prescriptions are first written. Further research should be conducted to determine patient-centered, effective solutions that can improve outcomes.
Corresponding author: Eileen Barrett, MD, MPH, Department of Internal Medicine, University of New Mexico; ebarrett@salud.unm.edu.
Financial disclosures: None.
1. Mason M, Welch SB, Arunkumar P, et al. Notes from the field: opioid overdose deaths before, during, and after an 11-week COVID-19 stay-at-home order—Cook County, Illinois, January 1, 2018–October 6, 2020. MMWR Morb Mortal Wkly Rep. 2021;70(10):362-363. doi:10.15585/mmwr.mm7010a3
2. Kaiser Family Foundation. Opioid overdose death rates and all drug overdose death rates per 100,000 population (age-adjusted). Accessed October 6, 2021. https://www.kff.org/other/state-indicator/opioid-overdose-death
3. Sohn M, Talbert JC, Huang Z, et al. Association of naloxone coprescription laws with naloxone prescription dispensing in the United States. JAMA Netw Open. 2019;2(6):e196215. doi:10.1001/jamanetworkopen.2019.6215
4. Smart R, Pardo B, Davis CS. Systematic review of the emerging literature on the effectiveness of naloxone access laws in the United States. Addiction. 2021;116(1):6-17. doi:10.1111/add.15163
5. Mueller SR, Koester S, Glanz JM, et al. Attitudes toward naloxone prescribing in clinical settings: a qualitative study of patients prescribed high dose opioids for chronic non-cancer pain. J Gen Intern Med. 2017;32(3):277-283. doi:10.1007/s11606-016-3895-8
6. Thornton JD, Lyvers E, Scott VGG, Dwibedi N. Pharmacists’ readiness to provide naloxone in community pharmacies in West Virginia. J Am Pharm Assoc (2003). 2017;57(2S):S12-S18.e4. doi:10.1016/j.japh.2016.12.070
7. Spivey C, Wilder A, Chisholm-Burns MA, et al. Evaluation of naloxone access, pricing, and barriers to dispensing in Tennessee retail community pharmacies. J Am Pharm Assoc (2003). 2020;60(5):694-701.e1. doi:10.1016/j.japh.2020.01.030
8. Nguyen JL, Gilbert LR, Beasley L, et al. Availability of naloxone at rural Georgia pharmacies, 2019. JAMA Netw Open. 2020;3(2):e1921227. doi:10.1001/jamanetworkopen.2019.21227
9. Guadamuz JS, Alexander GC, Chaudhri T, et al. Availability and cost of naloxone nasal spray at pharmacies in Philadelphia, Pennsylvania. JAMA Netw Open. 2019;2(6):e195388. doi:10.1001/jamanetworkopen.2019.5388
10. Edge K. Changes in drug overdose mortality in New Mexico. New Mexico Epidemiology. July 2020 (3). https://www.nmhealth.org/data/view/report/2402/
11. Senate Bill 221. 54th Legislature, State of New Mexico, First Session, 2019 (introduced by William P. Soules). Accessed October 6, 2021. https://nmlegis.gov/Sessions/19%20Regular/bills/senate/SB0221.pdf
12. GoodRx. Find pharmacies in New Mexico. Accessed October 6, 2021. https://www.goodrx.com/pharmacy-near-me/all/nm
13. U.S. Census Bureau. QuickFacts: New Mexico. Accessed October 6, 2021. https://www.census.gov/quickfacts/NM
14. Linas BP, Savinkina A, Madushani RWMA, et al. Projected estimates of opioid mortality after community-level interventions. JAMA Netw Open. 2021;4(2):e2037259. doi:10.1001/jamanetworkopen.2020.37259
15. You HS, Ha J, Kang CY, et al. Regional variation in states’ naloxone accessibility laws in association with opioid overdose death rates—observational study (STROBE compliant). Medicine (Baltimore). 2020;99(22):e20033. doi:10.1097/MD.0000000000020033
16. Pew Charitable Trusts. Expanded access to naloxone can curb opioid overdose deaths. October 20, 2020. Accessed October 6, 2021. https://www.
17. Centers for Disease Control and Prevention. Still not enough naloxone where it’s most needed. August 6, 2019. Accessed October 6, 2021. https://www.cdc.gov/media/releases/2019/p0806-naloxone.html
From the Department of Medicine, University of California San Diego (Dr. Haponyuk), Department of Emergency Medicine, University of Tennessee (Dr. Dejong), the Department of Family Medicine, University of New Mexico (Dr. Gutfrucht), and the Department of Internal Medicine, University of New Mexico (Dr. Barrett)
Objective: Naloxone availability can reduce the risk of death from opioid overdoses, although prescriber, legislative, and payment barriers to accessing this life-saving medication exist. A previously underreported barrier involves same-day availability, the lack of which may force patients to travel to multiple pharmacies and having delays in access or risking not filling their prescription. This study sought to determine same-day availability of naloxone in pharmacies in the state of New Mexico.
Methods: Same-day availability of naloxone was assessed via an audit survey.
Results: Of the 183 pharamacies screened, only 84.7% had same-day availability, including only 72% in Albuquerque, the state’s most populous city/municipality.
Conclusion: These results highlight the extent of a previously underexplored challenge to patient care and barrier to patient safety, and future directions for more patient-centered care.
Keywords: naloxone; barriers to care; opioid overdose prevention.
The US is enduring an ongoing epidemic of deaths due to opioid use, which have increased in frequency since the onset of the COVID-19 pandemic.1 One strategy to reduce the risk of mortality from opioid use is to ensure the widespread availability of naloxone. Individual states have implemented harm reduction strategies to increase access to naloxone, including improving availability via a statewide standing order that it may be dispensed without a prescription.2,3 Such naloxone access laws are being widely adopted and are believed to reduce overdose deaths.4
There are many barriers to patients receiving naloxone despite their clinicians providing a prescription for it, including stigmatization, financial cost, and local availability.5-9 However, the stigma associated with naloxone extends to both patients and pharmacists. Pharmacists in West Virginia, for example, showed widespread concerns about having naloxone available for patients to purchase over the counter, for fear that increasing naloxone access may increase overdoses.6 A study in Tennessee also found pharmacists hesitant to recommend naloxone.7 Another study of rural pharmacies in Georgia found that just over half carried naloxone despite a state law that naloxone be available without a prescription.8 Challenges are not limited to rural areas, however; a study in Philadelphia found that more than one-third of pharmacies required a prescription to dispense naloxone, contrary to state law.9 Thus, in a rapidly changing regulatory environment, there are many evolving barriers to patients receiving naloxone.
New Mexico has an opioid overdose rate higher than the national average, coming in 15th out of 50 states when last ranked in 2018, with overdose rates that vary across demographic variables.10 Consequently, New Mexico state law added language requiring clinicians prescribing opioids for 5 days or longer to co-prescribe naloxone along with written information on how to administer the opioid antagonist.11 New Mexico is also a geographically large state with a relatively low overall population characterized by striking health disparities, particularly as related to access to care.
The purpose of this study is to describe the same-day availability of naloxone throughout the state of New Mexico after a change in state law requiring co-prescription was enacted, to help identify challenges to patients receiving it. Comprehensive examination of barriers to patients accessing this life-saving medication can advise strategies to both improve patient-centered care and potentially reduce deaths.
Methods
To better understand barriers to patients obtaining naloxone, in July and August of 2019 we performed an audit (“secret shopper”) study of all pharmacies in the state, posing as patients wishing to obtain naloxone. A publicly available list of every pharmacy in New Mexico was used to identify 89 pharmacies in Albuquerque (the most populous city in New Mexico) and 106 pharmacies throughout the rest of the state.12
Every pharmacy was called via a publicly available phone number during business hours (confirmed via an internet search), at least 2 hours prior to closing. One of 3 researchers telephoned pharmacies posing as a patient and inquired whether naloxone would be available for pick up the same day. If the pharmacy confirmed it was available that day, the call concluded. If naloxone was unavailable for same day pick up, researchers asked when it would be next available. Each pharmacy was called once, and neither insurance information nor cost was offered or requested. All questions were asked in English by native English speakers.
All responses were recorded in a secure spreadsheet. Once all responses were received and reviewed, they were characterized in discrete response categories: same day, within 1 to 2 days, within 3 to 4 days, within a week, or unsure/unknown. Naloxone availability was also tracked by city/municipality, and this was compared to the state’s population distribution.
No personally identifiable information was obtained. This study was Institutional Review Board exempt.
Results
Responses were recorded from 183 pharmacies. Seventeen locations were eliminated from our analysis because their phone system was inoperable or the pharmacy was permanently closed. Of the pharmacies reached, 84.7% (155/183) reported they have naloxone available for pick up on the same day (Figure 1). Of the 15.3% (28) pharmacies that did not have same-day availability, 60.7% (17 pharmacies) reported availability in 1 to 2 days, 3.6% had availability in 3 to 4 days, 3.6% had availability in 1 week, and 32.1% were unsure of next availability (Figure 2). More than one-third of the state’s patients reside in municipalities where naloxone is immediately available in at least 72% of pharmacies (Table).13
Discussion
Increased access to naloxone at the state and community level is associated with reduced risk for death from overdose, and, consequently, widespread availability is recommended.14-17 Statewide real-time pharmacy availability of naloxone—as patients would experience availability—has not been previously reported. These findings suggest unpredictable same-day availability that may affect experience and care outcomes. That other studies have found similar challenges in naloxone availability in other municipalities and regions suggests this barrier to access is widespread,6-9 and likely affects patients throughout the country.
Many patients have misgivings about naloxone, and it places an undue burden on them to travel to multiple pharmacies or take repeated trips to fill prescriptions. Additionally, patients without reliable transportation may be unable to return at a later date. Although we found most pharmacies in New Mexico without immediate availability of naloxone reported they could have it within several days, such a delay may reduce the likelihood that patients will fill their prescription at all. It is also concerning that many pharmacies are unsure of when naloxone will be available, particularly when some of these may be the only pharmacy easily accessible to patients or the one where they regularly fill their prescriptions.
Barriers to naloxone availability requires further study due to possible negative consequences for patient safety and risks for exacerbating health disparities among vulnerable populations. Further research may focus on examining the effects on patients when naloxone dispensing is delayed or impossible, why there is variability in naloxone availability between different pharmacies and municipalities, the reasons for uncertainty when naloxone will be available, and effective solutions. Expanded naloxone distribution in community locations and in clinics offers one potential patient-centered solution that should be explored, but it is likely that more widespread and systemic solutions will require policy and regulatory changes at the state and national levels.
Limitations of this study include that the findings may be relevant for solely 1 state, such as in the case of state-specific barriers to keeping naloxone in stock that we are unaware of. However, it is unclear why that would be the case, and it is more likely that similar barriers are pervasive. Additionally, repeat phone calls, which we did not follow up with, may have yielded more pharmacies with naloxone availability. However, due to the stigma associated with obtaining naloxone, it may be that patients will not make multiple calls either—highlighting how important real-time availability is.
Conclusion
Urgent solutions are needed to address the epidemic of deaths from opioid overdoses. Naloxone availability is an important tool for reducing these deaths, resulting in numerous state laws attempting to increase access. Despite this, there are persistent barriers to patients receiving naloxone, including a lack of same-day availability at pharmacies. Our results suggest that this underexplored barrier is widespread. Improving both availability and accessibility of naloxone may include legislative policy solutions as well as patient-oriented solutions, such as distribution in clinics and hospitals when opioid prescriptions are first written. Further research should be conducted to determine patient-centered, effective solutions that can improve outcomes.
Corresponding author: Eileen Barrett, MD, MPH, Department of Internal Medicine, University of New Mexico; ebarrett@salud.unm.edu.
Financial disclosures: None.
1. Mason M, Welch SB, Arunkumar P, et al. Notes from the field: opioid overdose deaths before, during, and after an 11-week COVID-19 stay-at-home order—Cook County, Illinois, January 1, 2018–October 6, 2020. MMWR Morb Mortal Wkly Rep. 2021;70(10):362-363. doi:10.15585/mmwr.mm7010a3
2. Kaiser Family Foundation. Opioid overdose death rates and all drug overdose death rates per 100,000 population (age-adjusted). Accessed October 6, 2021. https://www.kff.org/other/state-indicator/opioid-overdose-death
3. Sohn M, Talbert JC, Huang Z, et al. Association of naloxone coprescription laws with naloxone prescription dispensing in the United States. JAMA Netw Open. 2019;2(6):e196215. doi:10.1001/jamanetworkopen.2019.6215
4. Smart R, Pardo B, Davis CS. Systematic review of the emerging literature on the effectiveness of naloxone access laws in the United States. Addiction. 2021;116(1):6-17. doi:10.1111/add.15163
5. Mueller SR, Koester S, Glanz JM, et al. Attitudes toward naloxone prescribing in clinical settings: a qualitative study of patients prescribed high dose opioids for chronic non-cancer pain. J Gen Intern Med. 2017;32(3):277-283. doi:10.1007/s11606-016-3895-8
6. Thornton JD, Lyvers E, Scott VGG, Dwibedi N. Pharmacists’ readiness to provide naloxone in community pharmacies in West Virginia. J Am Pharm Assoc (2003). 2017;57(2S):S12-S18.e4. doi:10.1016/j.japh.2016.12.070
7. Spivey C, Wilder A, Chisholm-Burns MA, et al. Evaluation of naloxone access, pricing, and barriers to dispensing in Tennessee retail community pharmacies. J Am Pharm Assoc (2003). 2020;60(5):694-701.e1. doi:10.1016/j.japh.2020.01.030
8. Nguyen JL, Gilbert LR, Beasley L, et al. Availability of naloxone at rural Georgia pharmacies, 2019. JAMA Netw Open. 2020;3(2):e1921227. doi:10.1001/jamanetworkopen.2019.21227
9. Guadamuz JS, Alexander GC, Chaudhri T, et al. Availability and cost of naloxone nasal spray at pharmacies in Philadelphia, Pennsylvania. JAMA Netw Open. 2019;2(6):e195388. doi:10.1001/jamanetworkopen.2019.5388
10. Edge K. Changes in drug overdose mortality in New Mexico. New Mexico Epidemiology. July 2020 (3). https://www.nmhealth.org/data/view/report/2402/
11. Senate Bill 221. 54th Legislature, State of New Mexico, First Session, 2019 (introduced by William P. Soules). Accessed October 6, 2021. https://nmlegis.gov/Sessions/19%20Regular/bills/senate/SB0221.pdf
12. GoodRx. Find pharmacies in New Mexico. Accessed October 6, 2021. https://www.goodrx.com/pharmacy-near-me/all/nm
13. U.S. Census Bureau. QuickFacts: New Mexico. Accessed October 6, 2021. https://www.census.gov/quickfacts/NM
14. Linas BP, Savinkina A, Madushani RWMA, et al. Projected estimates of opioid mortality after community-level interventions. JAMA Netw Open. 2021;4(2):e2037259. doi:10.1001/jamanetworkopen.2020.37259
15. You HS, Ha J, Kang CY, et al. Regional variation in states’ naloxone accessibility laws in association with opioid overdose death rates—observational study (STROBE compliant). Medicine (Baltimore). 2020;99(22):e20033. doi:10.1097/MD.0000000000020033
16. Pew Charitable Trusts. Expanded access to naloxone can curb opioid overdose deaths. October 20, 2020. Accessed October 6, 2021. https://www.
17. Centers for Disease Control and Prevention. Still not enough naloxone where it’s most needed. August 6, 2019. Accessed October 6, 2021. https://www.cdc.gov/media/releases/2019/p0806-naloxone.html
Association Between Physiotherapy Outcome Measures and the Functional Independence Measure: A Retrospective Analysis
From Illawarra Shoalhaven Local Health District, New South Wales, Australia (Maren Jones, Dr. Hewitt, Philippa King, Rhiannon Thorn, Edward Davidson, and Tiana-Lee Elphick), and Illawarra Health and Medical Research Institute, University of Wollongong, Wollongong, New South Wales, Australia (Dr. Hewitt)
Objective: To assess the association between change scores in the Functional Independence Measure (FIM) with evaluative measures used in physiotherapy to objectively show that use of the FIM in isolation is limited.
Design: Retrospective observational study.
Setting: Five rehabilitation inpatient wards from 1 public local health district in NSW Australia.
Participants: Patient data over a 5-year time frame (2015 to 2019) were reviewed (N = 2378). The patient data from the 3 most prevalent impairment groups (Australasian Rehabilitation Outcome Centre classification) were identified for inclusion in this study: Reconditioning (n = 742, mean age 76.88 years); Orthopedic Fracture (n = 585, mean age 77.46 years); and Orthopedic Replacement (n = 377, mean age 73.84 years).
Measurements: The difference between the admission and discharge scores were calculated for each measure. Kruskal-Wallis and χ2 tests were used to analyze the data.
Results: Pearson correlation (r) coefficients between FIM Motor change to the de Morton’s Mobility Index (DEMMI) change was r = 0.396, FIM Motor change to the Timed Up and Go (TUG) change was r = -0.217, and the FIM Motor change to the Ten Meter Walk Test (10MWT) change was .194.
Conclusion: The FIM Motor change scores showed a weak positive association to the DEMMI change and no association to the TUG and 10MWT change, demonstrating that the outcome measures do not measure the same attributes. To review rehabilitation effectiveness from a management perspective, it is recommended that all measures are reviewed to assess the burden of care, functional mobility, and dynamic balance.
Keywords: physiotherapy; rehabilitation; clinical outcome measures.
Patients receive interdisciplinary inpatient rehabilitation treatment after they have sustained a lower limb fracture, a lower limb joint replacement, or have generalized deconditioning (muscle wasting and disuse atrophy) following hospitalization for surgery or illness. The degree of a patient’s impairment or loss of functional capacity, as well as their ability to manage at home safely, is assessed using standardized outcome measures during their recovery and rehabilitation.1,2
Physiotherapists routinely use validated outcome measures to assess patient progress and to measure goal attainment through assessment of functional independence, dynamic balance performance, and ambulatory ability. These objective assessments provide clinicians with information about the effectiveness of the rehabilitation program, as well as the patient’s ability to manage in their home environment, to determine the need for assistive devices, level of caregiver support, future level of autonomy, and strategies for falls prevention.3-7
There is a view among service providers that rehabilitation decisions can be based on a singular measure of function known as the Functional Independence Measure (FIM). This is an understandable position because not only is the FIM an internationally recognized, valid, and reliable tool, but, as a singular measure, it also means measurement consistency across rehabilitation sites is more likely. However, rehabilitation is complex, and it is risky to base decisions on a single measure, which might not capture the results of rehabilitation treatment ingredients on individual patient targets.8,9
The patient’s progress is objectively assessed using functional outcome measures such as the FIM. Other measures used typically in our service include the de Morton’s Mobility Index (DEMMI), Timed Up and Go (TUG), and the Ten Meter Walk Test (10MWT), which measure patient mobility, balance during directional changes, and walking ability, respectively. Additional measures include patient progression to a less supportive level of assistance (ie, number of persons required to assist or level of supervision) or the selection of a walking aid (eg, forearm support frame, crutches). This progression—or lack thereof—assists in decision-making regarding the individual’s future once they are discharged from rehabilitation. Such considerations would include the need to modify the home environment, selection of assistive devices, community access (walking indoors, outdoors, and shopping), personal care needs, and age-appropriate care facility recommendations (ie, level of care). The use of outcome measures also indicates the need for further referrals to other care providers upon discharge from the rehabilitation facility.
There is widespread support in the literature for the use of the FIM, DEMMI, TUG, and 10MWT in rehabilitation population groups. For example, DEMMI has been validated in hip fracture patients during rehabilitation,10 as well as among older people hospitalized for medical illness.11-13 It has also been shown to be a predictor of discharge destination for patients living with frailty in geriatric rehabilitation settings,14 and to have moderate predictive validity for functional independence after 4 weeks of rehabilitation.15 Similarly, TUG has been validated for use among hospitalized and community-dwelling individuals,16-18 and for patients after joint arthroplasty19,20 or hip fracture.21 It has also been shown to be an indicator of fall risk,22-24 as well as a predictor of fracture incidence.25 Furthermore, TUG has been identified as an indicator of a patient’s ability to walk in the community without the need for a walking device.26 It has also been shown to be an early identifier of patients in need of rehabilitation.27 Normative values for TUG have been reported, and the association with gait time established.28
Gait speed has been shown to predict adverse outcomes in community-dwelling older people.29 In fact, the 10MWT has been established as a powerful tool to benchmark rehabilitation recovery after a medical event.30 Results of the test relate to overall quality of walking, health status, morbidity, and the rate of mortality.31-33 Meaningful improvement, minimum detectable change (0.19-0.34 m/s), and responsiveness in common physical performance in older adults has been reported.26,34,36
Structural and functional impairment has been used to define rehabilitation classes by the Australasian Rehabilitation Outcome Centre (AROC) in the Australian National Sub-Acute and Non-Acute Patient Classification (AN-SNAP) Version 4.37-43 Variables used for grouping are age, care type, function, and impairment for rehabilitation. FIM was developed in order to assess patients’ outcomes after inpatient multidisciplinary care, and is an internationally accepted measure of functioning.44 It is a holistic outcome measure, which can be used to determine the patient’s level of disability and burden of care, and is widely used in both public and private inpatient rehabilitation settings. Each patient classification is reported separately within the case mix structure.45 Inpatient rehabilitation centers are evaluated and compared by the AROC,46 with an emphasis on length of stay and the FIM change. The most successful centers demonstrate shorter length of stay and greater FIM improvement. Although the FIM is a valuable measure, it does not provide a complete picture of the individual patient’s rehabilitation gain: ie, the specific attributes of patients’ mobility, walking ability, or balance during directional changes.
A large-scale analysis of the association between the holistic disability measure of the FIM and the more mobility- and ambulation-focused physiotherapy outcomes has not been documented.
The well-documented DEMMI accumulates points for the patient’s mobility in a similar fashion to the FIM, but with more mobility detail. These 2 outcome measures allow for the full range of patients, from the very dependent up to and including the independently ambulant patients. The DEMMI may show a positive relationship to the FIM, yet the association is unknown. The association of the TUG to the 10MWT has been established28; however, their relationship to the FIM is unknown.
Current practice in the participating public health inpatient rehabilitation wards is to use the DEMMI, TUG, 10MWT, and FIM to ensure physiotherapy and allow the wider multidisciplinary team to more effectively evaluate patient mobility outcomes. The 3 most frequent patient groups identified within the current patient population are expected to present clinical differences and will be analyzed for comparison. If an association is found between the outcome measures in question, clinical efficiency could be improved.
The aim of the current study is to assess the association between change scores in the FIM with evaluative measures of outcomes typically used in physiotherapy to objectively show that use of the FIM in isolation is limited in our population of patients.
Methods
Study design and setting
This retrospective descriptive observational study complied with the STROBE-RECORD guidance and checklist (available at mdedge.com/jcomjournal) and analyzed the routinely collected data from rehabilitation patients who were admitted to 5 different rehabilitation wards in 4 different public hospitals from 1 regional local health district (20-24 beds per ward) from 2015 to 2019. As this study conducted secondary analyses using existing de-identified data from a public health facility and did not involve interaction with any human subjects, ethical approval was not required.46 Approval to conduct this study was granted by the health district’s institutional review committee, as per the National Statement on Ethical Conduct in Human Research 2015.
Participants
Patient data over a 5-year time frame were reviewed (N = 2378). The patient data from the 3 most prevalent impairment groups were identified for inclusion in this study: reconditioning, orthopedic fracture, and orthopedic replacement. (See Table 1 for the specific AN-SNAP impairment groups used in this study.)

Patient data from the less-frequent impairment groups were excluded (n = 673, 28.19%), including stroke (n = 343), brain dysfunction (n = 45), amputation of limb (n = 45), spinal cord dysfunction (n = 36), neurological dysfunction (n = 34), cardiac (n = 24), and others (n = 25) who may have benefitted from other outcome measures due to their medical condition. Ten patient data sets were excluded for missing discharge outcome measure data, from when the patient became ill and returned to acute services or was discharged at short notice. To be included in the study, both the admission and discharge scores from the FIM and the admission and discharge scores from at least 1 of the physiotherapy outcome measures were required for each patient (n = 1704, 71.39%): Reconditioning (n = 742), Orthopedic Fracture (n = 585), and Orthopedic Replacement (n = 377). Information regarding the type of walking aid and the amount of assistance required for safe ambulation was also recorded. These items were included in the study’s descriptive analysis. Only 1.7% of these descriptors were missing.
Outcome measures
DEMMI tasks of bed mobility, sitting balance, transfers, walking, and balance were scored with an assigned value according to the patient’s performance. This was then tallied and the results scaled, to provide an overall score out of 100 available points. The total score from admission and discharge was then compared. Improvement (change) was identified by the increase in scores.
The TUG assesses a patient’s dynamic balance performance.47 The number of seconds it took the patient to complete the procedure was recorded at admission and discharge. Improvement (change) was identified by the reduction in time taken at discharge from the admission score.
The 10MWT measures the unidirectional walking speed of a person over 10 meters and is recorded in seconds and reported in meters per second. Improvement (change) was identified by the reduction in the time taken to increase walking speed.
Concurrent to the physiotherapy measures were the FIM scores, recorded by the accredited nursing staff from each rehabilitation ward. Improvement is demonstrated by the accumulation of points on the ordinal scale of the FIM Total, including mobility, dressing, bladder and bowel care, cognition, and social interaction, and is represented as a score between 18 and 126. The FIM Motor category is reported as a score between 13 and 91.
The 2 data sets were matched by unique identifier and admission dates, then de-identified for analysis.
Statistical analysis
Patient demographic information was analyzed using descriptive statistics (mean, SD, frequencies, percentages) for each impairment group (orthopedic fracture, orthopedic replacement, reconditioning). Differences in continuous demographic variables for each impairment group were assessed using Kruskal-Wallis tests and χ2 tests for categorical variables. Functional outcome scores were compared at admission, discharge, and change between the impairment groups. Association of the functional outcome change scores was determined with the Pearson correlation coefficient (r) between the FIM and the DEMMI, TUG, and 10MWT. Graphs were plotted for each of these (Figure available online at mdedge.com/jcomjournal). A strong, moderate, and weak association was described as > 0.6, > 0.4, and > 0.2, respectively.46 Statistical significance was set at P < .05. Analyses were conducted using Stata (StataCorp LLC, USA).
Results
The patient descriptive data (site from which data were collected, admission length of stay, age at admission, discharge destination, walk aid improvement, and walk assistance improvement) from the 3 impairment groups are reported in Table 2. The functional outcomes for DEMMI, TUG, 10MWT, FIM Motor, FIM Total at admission, discharge, and the change scores are presented in Table 3.

Orthopedic fracture patients had the greatest improvement in their functional outcomes, with a DEMMI improvement of 18 points, TUG score change of 23.49 seconds (s), 10MWT change of 0.30 meters/second (m/s), FIM Motor change of 20.62, and a FIM Total change of 21.9 points. The outcome measures exceeded the minimum detectable change as reported in the literature for DEMMI (8.8 points48), TUG (2.08 s26), walking speed 0.19 m/s26, and FIM Motor (14.6 points49).

Association of functional outcomes (change scores)
There was a significant weak positive correlation between DEMMI change score and both the FIM Motor (r = 0.396) and FIM Total change scores (r = 0.373). When viewing the specific items within the FIM Motor labelled FIM Walk change, FIM MobilityBedChair change, and FIM stairs change, r values were 0.100, 0.379, and 0.126, respectively. In addition, there was a weak negative correlation between TUG change scores and both FIM Motor (r = -0.217) and FIM Total change scores (r = -0.207). There was a very weak positive correlation between 10MWT (m/s) change scores and both FIM Motor (r = 0.194) and FIM Total change scores (r = 0.187) (Table 4, Figure). There was a moderate correlation between 10MWT change (s) and TUG change (s) (r = 0.72, P < .001).

Discussion
The purpose of this study was to ascertain the association between the DEMMI, TUG, 10MWT, and FIM measures using retrospective data collected from 5 public hospital inpatient rehabilitation wards. The results of this retrospective analysis demonstrate that a variety of objective outcome measures are required for the multidisciplinary team to accurately measure a patient’s functional improvement during their inpatient rehabilitation stay. No single outcome measure in this study fully reported all mobility attributes, and we note the risk of basing decisions on a single measure evaluating rehabilitation outcomes. Although the internationally used FIM has a strong place in rehabilitation reporting and benchmarking, it does not predict change nor provide a proxy for the patient’s whole-body motor control as they extend their mobility, dynamic balance, and ambulatory ability. Multiple objective outcome measures should therefore be required to evaluate the patient’s progress and functional performance toward discharge planning.
The FIM is a measure of disability or care needs, incorporating cognitive, social, and physical components of disability. It is a valid, holistic measure of an individual’s functional ability at a given time. Rehabilitation sites internationally utilize this assessment tool to evaluate a patient’s progress and the efficacy of intervention. The strength of this measure is its widespread use and the inclusion of the personal activities of daily living to provide an overall evaluation encompassing all aspects of a person’s ability to function independently. However, as our study results suggest, patient improvement measured by the FIM Motor components were not correlated to other widely used physiotherapy measures of ambulation and balance, such as the 10MWT or TUG. This is perhaps largely because the FIM Motor components only consider the level of assistance (eg, physical assistance, assistive device, independence) and do not consider assessment of balance and gait ability as assessed in the 10MWT and TUG. The 10MWT and TUG provide assessment of velocity and dynamic balance during walking, which have been shown to predict an individual’s risk of falling.22,23 This is a pertinent issue in the rehabilitation and geriatric population.29 Furthermore, the use of the FIM as a benchmarking tool to compare facility efficiency may not provide a complete assessment of all outcomes achieved on the inpatient rehabilitation ward, such as reduced falls risk or improved ambulatory ability and balance.
Of the objective measures evaluated in our paper, the DEMMI assessment has the most similar components to those of the FIM Motor. It includes evaluating independence with bed mobility, standing up, and ambulation. In addition, the DEMMI includes assessment of both static and dynamic balance. As a result of these commonalities, there was only a weak positive correlation between the change in DEMMI and the change in FIM Motor and FIM Total. However, this correlation is not statistically significant. Therefore, the FIM is not recommended as a replacement of the DEMMI, nor can one be used to predict the other.
It has previously been confirmed that there is a significant positive correlation between the 10MWT and the TUG.27 This retrospective analysis has also supported these findings. This is possibly due to the similarity in the assessments, as they both incorporate ambulation ability and dynamic movement.
Each of the 4 outcome measures assess different yet vital aspects of an individual’s functional mobility and ambulation ability during their subacute rehabilitation journey. The diversity of patient age, functional impairment, and mobility level needs a range of outcomes to provide baselines, targets, and goal attainment for discharge home.
Consistent with the AROC AN-SNAP reporting of Length of Stay and FIM change separated into the weighted impairment groups, the data analysis of this study demonstrated significant differences between the Reconditioning, Orthopedic Fracture, and Orthopedic Replacement patient data. Tables 2 and 3 describe the differences between the groups. The fracture population in this study improved the most across each outcome measure. In contrast, the reconditioning population showed the least improvement. This may be expected due to the pathophysiological differences between the groups. Furthermore, for the elderly who sustain fractures because of a fall, rehabilitation will be required to address not only the presenting injury but also the premorbid falls risk factors which may include polypharmacy or impaired balance.
Any conclusions drawn from the findings of this study need to take into consideration that it has focused on patients from 1 local health district and therefore may not be generalizable to a wider national or international context. As this study was a retrospective study, controlling for data collection quality, measurement bias due to nonblinding and missing data is a limitation. However, clinicians regularly completed these outcome assessments and recorded this information as part of their standard care practices within this health district. There may have been slight differences in definitions of practice between the 5 rehabilitation sites. To ensure reliability, each individual site’s protocols for the FIM, DEMMI, TUG, and 10MWT were reviewed and confirmed to be consistent.
It is important, too, to consider the ceiling effect for the FIM scores. For patients requiring a walking aid well after discharge, the highest level of independence from the walking aid will not be achieved. It is acknowledged that the floor effect of the 10MWT and TUG may also influence the outcomes of this study. In addition, data were not collected on preadmission functional measures to enable further evaluation of the population groups. The proportion of variance in change from admission to discharge for TUG and 10MWT to FIM was less than 5%, so the correlation interpretation from this type of scaling is limited. Further research into outcome measures for inpatient rehabilitation in respect to variables such as patient age, length of stay, discharge destination, and efficacy of intervention is warranted.
Conclusion
The FIM Motor change scores showed a weak positive association to the DEMMI change, and no association to the TUG and 10MWT change, demonstrating that the outcome measures do not measure the same attributes. Thorough reporting of clinical outcomes is much more meaningful to assess and guide the physiotherapy component of rehabilitation. To review rehabilitation effectiveness from a management perspective, it is recommended that all measures are reviewed to assess the burden of care, mobility, functional capacity, and dynamic balance.
Acknowledgements: The authors thank Anne Smith, MSHLM, BAppSc, Head of the Physiotherapy Department, and the physiotherapists and allied health assistants who have contributed to the collection of this valuable data over several years. They also thank Lina Baytieh, MS, BS, from Research Central, Illawarra Shoalhaven Local Health District, for her assistance with the analysis.
Corresponding author: Maren Jones, MPH, BS, Physiotherapy Department, Port Kembla Hospital, Illawarra Shoalhaven Local Health District, Warrawong, New South Wales, 2505 Australia; maren.jones@health.nsw.gov.au.
Financial disclosures: None.
1. Centers for Disease Control and Prevention. Disability and health overview. Impairments, activity limitations and participation restrictions. September 16, 2020. https://www.cdc.gov/ncbddd/disabilityandhealth/disability.html
2. The Royal Australasian College of Physicians. Australasian Faculty of Rehabilitation Medicine. Standards for the Provision of Inpatient Adult Rehabilitation Medicine Services in Public and Private Hospitals. February 2019:7-9. https://www.racp.edu.au/docs/default-source/advocacy-library/afrm-standards-for-the-provision-of-inpatient-adult-rehabilitation-medicine-services-in-public-and-private-hospitals.pdf?sfvrsn=4690171a_4
3. NSW Agency for Clinical Innovation. NSW rehabilitation model of care. June 1, 2015. https://aci.health.nsw.gov.au/resources/rehabilitation/rehabilitation-model-of-care/rehabilitation-moc
4. The State of Queensland (Queensland Health). Clinical task instructions. June 22, 2021. https://www.health.qld.gov.au/ahwac/html/clintaskinstructions
5. Panel on Prevention of Falls in Older Persons, American Geriatrics Society and British Geriatrics Society. Summary of the updated American Geriatrics Society/British Geriatrics Society clinical practice guideline for prevention of falls in older persons. J Am Geriatr Soc. 2011;59(1):148-157. doi:10.1111/j.1532-5415.2010.03234.x
6. Suwannarat P, Kaewsanmung S, Thaweewannakij T, Amatachaya S. The use of functional performance tests by primary health-care providers to determine walking ability with and without a walking device in community-dwelling elderly. Physiother Theory Pract. 2021;37(1):64-72. doi:10.1080/09593985.2019.1606372
7. Lee K-J, Um S-H, Kim Y-H. Postoperative rehabilitation after hip fracture: a literature review. Hip Pelvis. 2020;32(3):125-131. doi:10.5371/hp.2020.32.3.125
8. Wade DT, Smeets RJEM, Verbunt JA. Research in rehabilitation medicine: methodological challenges. J Clin Epidemiol. 2010;63(7):699-704. doi:10.1016/j.clinepi.2009.07.010
9. Wade DT. Outcome measures for clinical rehabilitation trials: impairment, function, quality of life, or value? Am J Phys Med Rehabil. 2003;82(suppl 10):S26-S31. doi:10.1097/01.PHM.0000086996.89383.A1
10. de Morton NA, Harding KE, Taylor NF, Harrison G. Validity of the de Morton NA Mobility Index (DEMMI) for measuring the mobility of patients with hip fracture during rehabilitation. Disabil Rehabil. 2013;35(4):325-333. doi:10.3109/09638288.2012.705220
11. Trøstrup J, Andersen H, Kam CAM, et al. Assessment of mobility in older people hospitalized for medical illness using the de Morton Mobility Index and cumulated ambulation score—validity and minimal clinical important difference. J Geriatr Phys Ther. 2019;42(3):153-160. doi:10.1519/JPT.0000000000000170
12. Gazzoti A, Meyer U, Freystaetter G, et al. Physical performance among patients aged 70+ in acute care: a preliminary comparison between the Short Physical Performance Battery and the De Morton Mobility Index with regard to sensitivity to change and prediction of discharge destination. Aging Clin Exp Res. 2020;32(4):579-586. doi:10.1007/s40520-019-1249-9
13. Tavares LS, Moreno NA, de Aquino BG, et al. Reliability, validity, interpretability and responsiveness of the DEMMI mobility index for Brazilian older hospitalized patients. PLoS One. 2020;15(3):e0230047. doi:10.1371/journal.pone.0230047
14. Braun T, Schulz R-J, Reinke J. Reliability and validity of the German translation of the de Morton Mobility Index performed by physiotherapists in patients admitted to a sub-acute inpatient geriatric rehabilitation hospital. BMC Geriatr. 2015;15:38. doi:10.1186/s12877-015-0035-y
15. Søndergaard K, Petersen LE, Pedersen MK, et al. The responsiveness and predictive validity of the de Morton Mobility Index in geriatric rehabilitation. Disabil Rehabil. 2020 Jun 12. [Epub ahead of print] doi:10.1080/09638288.2020.1771438
16. de Morton NA, Brusco NK, Wood L, et al. The de Morton Mobility Index (DEMMI) provides a valid method for measuring and monitoring the mobility of patients making the transition from hospital to the community: an observational study. J Physiother. 2011;57(2):109-116. doi:10.1016/S1836-9553(11)70021-2
17. Caronni A, Sterpi I, Antoniotti P, et al. Criterion validity of the instrumented Timed Up and Go test: a partial least square regression study. Gait Posture. 2018;61(3):287-293. doi:10.1016/j.gaitpost.2018.01.015
18. Kristensen MT, Bloch ML, Jonsson LR, Jakobsen TL. Interrater reliability of the standardized Timed Up and Go Test when used in hospitalized and community-dwelling individuals. Physiother Res Int. 2019;24(2):e1769. doi:10.1002/pri.1769
19. Yuksel E, Kalkan S, Cekmece S, et al. Assessing minimal detectable changes and test-retest reliability of the timed up and go test and 2-minute walk test in patients with total knee arthroplasty. J Arthroplasty. 2017;32(2):426-430. doi:10.1016/j.arth.2016.07.031
20. Yuksel E, Unver B, Kalkan S, Karatosun V. Reliability and minimal detectable change of the 2-minute walk test and Timed Up and Go test in patients with total hip arthroplasty. Hip Int. 2021;31(1):43-49. doi:10.1177/1120700019888614
21. Faleide AGH, Bogen BE, Magnussen LH. Intra-session test-retest reliability of the Timed “Up & Go” Test when performed by patients with hip fractures. Eur J Physiother. 2015;17(2):89-97. doi:10.3109/21679169.2015.1043579
22. Barry E, Galvin R, Keogh C, et al. Is the timed up and go test a useful predictor of risk of falls in community dwelling older adults: a systematic review and meta- analysis. BMC Geriatr. 2014;14:14. doi:10.1186/1471-2318-14-14
23. Kojima G, Masud T, Kendrick D, et al. Does the timed up and go test predict future falls among British community-dwelling older people? Prospective cohort study nested within a randomised controlled trial. BMC Geriatr. 2015;15:38. doi:10.1186/s12877-015-0039-7
24. Shumway-Cook A, Brauer S, Woollacott M. Predicting the probability for falls in community-dwelling older adults using the timed up & go test. Phys Ther. 2000;80(9):896-903.
25. Jeong SM, Shin DW, Han K, et al. Timed Up-and-Go test is a useful predictor of fracture incidence. Bone. 2019;127:474-481. doi:10.1016/j.bone.2019.07.018
26. Donaghue OA, Savva GM, Börsch-Supan A, Kenny RA. Reliability, measurement error and minimum detectable change in reliability measurement error and minimum detectable change in mobility measures: a cohort study of community dwelling adults aged 50 years and over in Ireland. BMJ Open. 2019;9(11):e030475. doi:10/1136.bmjopen-2019-030475
27. Freter SH, Fruchter N. Relationship between timed ‘up and go’ and gait time in an elderly orthopaedic rehabilitation population. Clin Rehabil. 2000;14(1):96-101. doi:10.1191/026921500675545616
28. Kear BM, Guck TP, McGaha AL. Timed up and go (TUG) test: normative reference values for ages 20 to 59 years and relationships with physical and mental health risk factors. J Prim Care Community Health. 2017;8(1):9-13. doi:10.1177/2150131916659282
29. Abellan van Kan G, Rolland Y, Andrieu S, et al. Gait speed at usual pace as a predictor of adverse outcomes in community-dwelling older people: an International Academy on Nutrition and Aging (IANA) Task Force. J Nutr Health Aging. 2009;13(10)881-889. doi:10.1007/s12603-009-0246-z
30. Unver B, Baris RH, Yusel E, et al. Reliability of 4-meter and 10-meter walk tests after lower extremity surgery. Disabil Rehabil. 2017;39(25):2572-2576. doi:10.1080/09638288.2016.1236153
31. Fritz S, Lusardi M. White paper: “walking speed: the sixth vital sign.” J Geriatr Phys Ther. 2009;32(2):46-49.
32. Studenski S, Perera S, Patel K, et al. Gait speed and survival in older adults. JAMA. 2011;305(1):50-58. doi:10.1001/jama.2010.1923
33. Bohannon R. Comfortable and maximum walking speed of adults aged 20-79 years: reference values and determinants. Age Ageing. 1997;26(1):15-19. doi:10.1093/ageing/26.1.15
34. Perera S, Mody SH, Woodman RC, Studenski SA. Meaningful change and responsiveness in common physical performance in older adults. J Am Geriatr Soc. 2006;54(5):743-749. doi:10.1111/j.1532-5415.2006.00701.x
35. Hollman J, Beckman B, Brandt R, et al. Minimum detectable change in gait velocity during acute rehabilitation following hip fracture. J Geriatr Phys Ther. 2008;31(2):53-56. doi:10.1519/00139143-200831020-00003
36. Bohannon RW, Andrews AW. Normal walking speed: a descriptive meta-analysis. Physiotherapy. 2011;97(3):182-189. doi:10.1016/j.physio.2010.12.004
37. Granger CV, Hamilton BB, Keith RA, et al. Advances in functional assessment for medical rehabilitation. Top Geriatr Rehabil. 1986;1:59-74.
38. Keith RA, Granger CV, Hamilton BB, Sherwin FS. The Functional Independence Measure: a new tool for rehabilitation. In: Eisenberg MG, Grzesiak RC, eds. Advances in Clinical Rehabilitation. Springer-Verlag; 1987:6-18.
39. Linacre JM, Heinemann AW, Wright BD, et al. The structure and stability of the Functional Independence Measure. Arch Phys Med Rehabil. 1994;75(2):127-132.
40. Coster WJ, Haley SM, Jette AM. Measuring patient-reported outcomes after discharge from inpatient rehabilitation settings. J Rehabil Med. 2006;38(4):237-242. doi:10.1080/16501970600609774
41. Street L. Frequently asked questions about FIM. Journal of the Australasian Rehabilitation Nurses Association. 2014;17(1):21-22. https://ro.uow.edu.au/ahsri/296/
42. Green JP, Gordon R, Blanchard MB, et al. Development of the Australian National Subacute and Non-acute Patient (AN-SNAP) Classification. Version 4 Final Report. Australian Health Services Research Institute, University of Wollongong, 2015. https://ro.uow.edu.au/ahsri/760
43. Australasian Rehabilitation Outcomes Centre. University of Wollongong, Australia. https://www.uow.edu.au/ahsri/aroc/
44. Green J, Gordon R, Kobel C, et al; Centre for Health Service Development. The Australian National Subacute and Non-acute Patient Classification. AN-SNAP V4 User Manual. May 2015. https://documents.uow.edu.au/content/groups/public/@web/@chsd/@aroc/documents/doc/uow194637.pdf
45. Alexander TL, Simmonds FD, Capelle JT, Green LJ. Anywhere Hospital AROC Impairment Specific Report on Reconditioning (Inpatient–Pathway 3), July 2018–June 2019. Australasian Rehabilitation Outcomes Centre, Australian Health Services Research Institute, University of Wollongong; 2019. ro.uow.edu.au/ahsri/1110
46. Evans JD. Straightforward Statistics for the Behavioural Sciences. Brooks/Cole Publishing; 1996.
47. Lee SP, Dufek J, Hickman R, Schuerman S. Influence of procedural factors on the reliability and performance of the timed up-and-go test in older adults. Int J Gerontol. 2016;10(1):37-42. doi:10.1016/j.ijge.2015
48. New PW, Scroggie GD, Williams CM. The validity, reliability, responsiveness and minimal clinically important difference of the de Morton Mobility Index in rehabilitation. Disabil Rehabil. 2017;39(10):1039-1043. doi:10.10801/09638288.2016.1179800
49. Nakaguchi T, Ishimoto Y, Akazawa N. Functional Independence Measure for patients with locomotor disorders in convalescent rehabilitation wards. Clinically significant minimum difference in exercise score gain. Physiotherapy Science. 2018;33(2):235-240.
From Illawarra Shoalhaven Local Health District, New South Wales, Australia (Maren Jones, Dr. Hewitt, Philippa King, Rhiannon Thorn, Edward Davidson, and Tiana-Lee Elphick), and Illawarra Health and Medical Research Institute, University of Wollongong, Wollongong, New South Wales, Australia (Dr. Hewitt)
Objective: To assess the association between change scores in the Functional Independence Measure (FIM) with evaluative measures used in physiotherapy to objectively show that use of the FIM in isolation is limited.
Design: Retrospective observational study.
Setting: Five rehabilitation inpatient wards from 1 public local health district in NSW Australia.
Participants: Patient data over a 5-year time frame (2015 to 2019) were reviewed (N = 2378). The patient data from the 3 most prevalent impairment groups (Australasian Rehabilitation Outcome Centre classification) were identified for inclusion in this study: Reconditioning (n = 742, mean age 76.88 years); Orthopedic Fracture (n = 585, mean age 77.46 years); and Orthopedic Replacement (n = 377, mean age 73.84 years).
Measurements: The difference between the admission and discharge scores were calculated for each measure. Kruskal-Wallis and χ2 tests were used to analyze the data.
Results: Pearson correlation (r) coefficients between FIM Motor change to the de Morton’s Mobility Index (DEMMI) change was r = 0.396, FIM Motor change to the Timed Up and Go (TUG) change was r = -0.217, and the FIM Motor change to the Ten Meter Walk Test (10MWT) change was .194.
Conclusion: The FIM Motor change scores showed a weak positive association to the DEMMI change and no association to the TUG and 10MWT change, demonstrating that the outcome measures do not measure the same attributes. To review rehabilitation effectiveness from a management perspective, it is recommended that all measures are reviewed to assess the burden of care, functional mobility, and dynamic balance.
Keywords: physiotherapy; rehabilitation; clinical outcome measures.
Patients receive interdisciplinary inpatient rehabilitation treatment after they have sustained a lower limb fracture, a lower limb joint replacement, or have generalized deconditioning (muscle wasting and disuse atrophy) following hospitalization for surgery or illness. The degree of a patient’s impairment or loss of functional capacity, as well as their ability to manage at home safely, is assessed using standardized outcome measures during their recovery and rehabilitation.1,2
Physiotherapists routinely use validated outcome measures to assess patient progress and to measure goal attainment through assessment of functional independence, dynamic balance performance, and ambulatory ability. These objective assessments provide clinicians with information about the effectiveness of the rehabilitation program, as well as the patient’s ability to manage in their home environment, to determine the need for assistive devices, level of caregiver support, future level of autonomy, and strategies for falls prevention.3-7
There is a view among service providers that rehabilitation decisions can be based on a singular measure of function known as the Functional Independence Measure (FIM). This is an understandable position because not only is the FIM an internationally recognized, valid, and reliable tool, but, as a singular measure, it also means measurement consistency across rehabilitation sites is more likely. However, rehabilitation is complex, and it is risky to base decisions on a single measure, which might not capture the results of rehabilitation treatment ingredients on individual patient targets.8,9
The patient’s progress is objectively assessed using functional outcome measures such as the FIM. Other measures used typically in our service include the de Morton’s Mobility Index (DEMMI), Timed Up and Go (TUG), and the Ten Meter Walk Test (10MWT), which measure patient mobility, balance during directional changes, and walking ability, respectively. Additional measures include patient progression to a less supportive level of assistance (ie, number of persons required to assist or level of supervision) or the selection of a walking aid (eg, forearm support frame, crutches). This progression—or lack thereof—assists in decision-making regarding the individual’s future once they are discharged from rehabilitation. Such considerations would include the need to modify the home environment, selection of assistive devices, community access (walking indoors, outdoors, and shopping), personal care needs, and age-appropriate care facility recommendations (ie, level of care). The use of outcome measures also indicates the need for further referrals to other care providers upon discharge from the rehabilitation facility.
There is widespread support in the literature for the use of the FIM, DEMMI, TUG, and 10MWT in rehabilitation population groups. For example, DEMMI has been validated in hip fracture patients during rehabilitation,10 as well as among older people hospitalized for medical illness.11-13 It has also been shown to be a predictor of discharge destination for patients living with frailty in geriatric rehabilitation settings,14 and to have moderate predictive validity for functional independence after 4 weeks of rehabilitation.15 Similarly, TUG has been validated for use among hospitalized and community-dwelling individuals,16-18 and for patients after joint arthroplasty19,20 or hip fracture.21 It has also been shown to be an indicator of fall risk,22-24 as well as a predictor of fracture incidence.25 Furthermore, TUG has been identified as an indicator of a patient’s ability to walk in the community without the need for a walking device.26 It has also been shown to be an early identifier of patients in need of rehabilitation.27 Normative values for TUG have been reported, and the association with gait time established.28
Gait speed has been shown to predict adverse outcomes in community-dwelling older people.29 In fact, the 10MWT has been established as a powerful tool to benchmark rehabilitation recovery after a medical event.30 Results of the test relate to overall quality of walking, health status, morbidity, and the rate of mortality.31-33 Meaningful improvement, minimum detectable change (0.19-0.34 m/s), and responsiveness in common physical performance in older adults has been reported.26,34,36
Structural and functional impairment has been used to define rehabilitation classes by the Australasian Rehabilitation Outcome Centre (AROC) in the Australian National Sub-Acute and Non-Acute Patient Classification (AN-SNAP) Version 4.37-43 Variables used for grouping are age, care type, function, and impairment for rehabilitation. FIM was developed in order to assess patients’ outcomes after inpatient multidisciplinary care, and is an internationally accepted measure of functioning.44 It is a holistic outcome measure, which can be used to determine the patient’s level of disability and burden of care, and is widely used in both public and private inpatient rehabilitation settings. Each patient classification is reported separately within the case mix structure.45 Inpatient rehabilitation centers are evaluated and compared by the AROC,46 with an emphasis on length of stay and the FIM change. The most successful centers demonstrate shorter length of stay and greater FIM improvement. Although the FIM is a valuable measure, it does not provide a complete picture of the individual patient’s rehabilitation gain: ie, the specific attributes of patients’ mobility, walking ability, or balance during directional changes.
A large-scale analysis of the association between the holistic disability measure of the FIM and the more mobility- and ambulation-focused physiotherapy outcomes has not been documented.
The well-documented DEMMI accumulates points for the patient’s mobility in a similar fashion to the FIM, but with more mobility detail. These 2 outcome measures allow for the full range of patients, from the very dependent up to and including the independently ambulant patients. The DEMMI may show a positive relationship to the FIM, yet the association is unknown. The association of the TUG to the 10MWT has been established28; however, their relationship to the FIM is unknown.
Current practice in the participating public health inpatient rehabilitation wards is to use the DEMMI, TUG, 10MWT, and FIM to ensure physiotherapy and allow the wider multidisciplinary team to more effectively evaluate patient mobility outcomes. The 3 most frequent patient groups identified within the current patient population are expected to present clinical differences and will be analyzed for comparison. If an association is found between the outcome measures in question, clinical efficiency could be improved.
The aim of the current study is to assess the association between change scores in the FIM with evaluative measures of outcomes typically used in physiotherapy to objectively show that use of the FIM in isolation is limited in our population of patients.
Methods
Study design and setting
This retrospective descriptive observational study complied with the STROBE-RECORD guidance and checklist (available at mdedge.com/jcomjournal) and analyzed the routinely collected data from rehabilitation patients who were admitted to 5 different rehabilitation wards in 4 different public hospitals from 1 regional local health district (20-24 beds per ward) from 2015 to 2019. As this study conducted secondary analyses using existing de-identified data from a public health facility and did not involve interaction with any human subjects, ethical approval was not required.46 Approval to conduct this study was granted by the health district’s institutional review committee, as per the National Statement on Ethical Conduct in Human Research 2015.
Participants
Patient data over a 5-year time frame were reviewed (N = 2378). The patient data from the 3 most prevalent impairment groups were identified for inclusion in this study: reconditioning, orthopedic fracture, and orthopedic replacement. (See Table 1 for the specific AN-SNAP impairment groups used in this study.)
Patient data from the less-frequent impairment groups were excluded (n = 673, 28.19%), including stroke (n = 343), brain dysfunction (n = 45), amputation of limb (n = 45), spinal cord dysfunction (n = 36), neurological dysfunction (n = 34), cardiac (n = 24), and others (n = 25) who may have benefitted from other outcome measures due to their medical condition. Ten patient data sets were excluded for missing discharge outcome measure data, from when the patient became ill and returned to acute services or was discharged at short notice. To be included in the study, both the admission and discharge scores from the FIM and the admission and discharge scores from at least 1 of the physiotherapy outcome measures were required for each patient (n = 1704, 71.39%): Reconditioning (n = 742), Orthopedic Fracture (n = 585), and Orthopedic Replacement (n = 377). Information regarding the type of walking aid and the amount of assistance required for safe ambulation was also recorded. These items were included in the study’s descriptive analysis. Only 1.7% of these descriptors were missing.
Outcome measures
DEMMI tasks of bed mobility, sitting balance, transfers, walking, and balance were scored with an assigned value according to the patient’s performance. This was then tallied and the results scaled, to provide an overall score out of 100 available points. The total score from admission and discharge was then compared. Improvement (change) was identified by the increase in scores.
The TUG assesses a patient’s dynamic balance performance.47 The number of seconds it took the patient to complete the procedure was recorded at admission and discharge. Improvement (change) was identified by the reduction in time taken at discharge from the admission score.
The 10MWT measures the unidirectional walking speed of a person over 10 meters and is recorded in seconds and reported in meters per second. Improvement (change) was identified by the reduction in the time taken to increase walking speed.
Concurrent to the physiotherapy measures were the FIM scores, recorded by the accredited nursing staff from each rehabilitation ward. Improvement is demonstrated by the accumulation of points on the ordinal scale of the FIM Total, including mobility, dressing, bladder and bowel care, cognition, and social interaction, and is represented as a score between 18 and 126. The FIM Motor category is reported as a score between 13 and 91.
The 2 data sets were matched by unique identifier and admission dates, then de-identified for analysis.
Statistical analysis
Patient demographic information was analyzed using descriptive statistics (mean, SD, frequencies, percentages) for each impairment group (orthopedic fracture, orthopedic replacement, reconditioning). Differences in continuous demographic variables for each impairment group were assessed using Kruskal-Wallis tests and χ2 tests for categorical variables. Functional outcome scores were compared at admission, discharge, and change between the impairment groups. Association of the functional outcome change scores was determined with the Pearson correlation coefficient (r) between the FIM and the DEMMI, TUG, and 10MWT. Graphs were plotted for each of these (Figure available online at mdedge.com/jcomjournal). A strong, moderate, and weak association was described as > 0.6, > 0.4, and > 0.2, respectively.46 Statistical significance was set at P < .05. Analyses were conducted using Stata (StataCorp LLC, USA).
Results
The patient descriptive data (site from which data were collected, admission length of stay, age at admission, discharge destination, walk aid improvement, and walk assistance improvement) from the 3 impairment groups are reported in Table 2. The functional outcomes for DEMMI, TUG, 10MWT, FIM Motor, FIM Total at admission, discharge, and the change scores are presented in Table 3.
Orthopedic fracture patients had the greatest improvement in their functional outcomes, with a DEMMI improvement of 18 points, TUG score change of 23.49 seconds (s), 10MWT change of 0.30 meters/second (m/s), FIM Motor change of 20.62, and a FIM Total change of 21.9 points. The outcome measures exceeded the minimum detectable change as reported in the literature for DEMMI (8.8 points48), TUG (2.08 s26), walking speed 0.19 m/s26, and FIM Motor (14.6 points49).
Association of functional outcomes (change scores)
There was a significant weak positive correlation between DEMMI change score and both the FIM Motor (r = 0.396) and FIM Total change scores (r = 0.373). When viewing the specific items within the FIM Motor labelled FIM Walk change, FIM MobilityBedChair change, and FIM stairs change, r values were 0.100, 0.379, and 0.126, respectively. In addition, there was a weak negative correlation between TUG change scores and both FIM Motor (r = -0.217) and FIM Total change scores (r = -0.207). There was a very weak positive correlation between 10MWT (m/s) change scores and both FIM Motor (r = 0.194) and FIM Total change scores (r = 0.187) (Table 4, Figure). There was a moderate correlation between 10MWT change (s) and TUG change (s) (r = 0.72, P < .001).
Discussion
The purpose of this study was to ascertain the association between the DEMMI, TUG, 10MWT, and FIM measures using retrospective data collected from 5 public hospital inpatient rehabilitation wards. The results of this retrospective analysis demonstrate that a variety of objective outcome measures are required for the multidisciplinary team to accurately measure a patient’s functional improvement during their inpatient rehabilitation stay. No single outcome measure in this study fully reported all mobility attributes, and we note the risk of basing decisions on a single measure evaluating rehabilitation outcomes. Although the internationally used FIM has a strong place in rehabilitation reporting and benchmarking, it does not predict change nor provide a proxy for the patient’s whole-body motor control as they extend their mobility, dynamic balance, and ambulatory ability. Multiple objective outcome measures should therefore be required to evaluate the patient’s progress and functional performance toward discharge planning.
The FIM is a measure of disability or care needs, incorporating cognitive, social, and physical components of disability. It is a valid, holistic measure of an individual’s functional ability at a given time. Rehabilitation sites internationally utilize this assessment tool to evaluate a patient’s progress and the efficacy of intervention. The strength of this measure is its widespread use and the inclusion of the personal activities of daily living to provide an overall evaluation encompassing all aspects of a person’s ability to function independently. However, as our study results suggest, patient improvement measured by the FIM Motor components were not correlated to other widely used physiotherapy measures of ambulation and balance, such as the 10MWT or TUG. This is perhaps largely because the FIM Motor components only consider the level of assistance (eg, physical assistance, assistive device, independence) and do not consider assessment of balance and gait ability as assessed in the 10MWT and TUG. The 10MWT and TUG provide assessment of velocity and dynamic balance during walking, which have been shown to predict an individual’s risk of falling.22,23 This is a pertinent issue in the rehabilitation and geriatric population.29 Furthermore, the use of the FIM as a benchmarking tool to compare facility efficiency may not provide a complete assessment of all outcomes achieved on the inpatient rehabilitation ward, such as reduced falls risk or improved ambulatory ability and balance.
Of the objective measures evaluated in our paper, the DEMMI assessment has the most similar components to those of the FIM Motor. It includes evaluating independence with bed mobility, standing up, and ambulation. In addition, the DEMMI includes assessment of both static and dynamic balance. As a result of these commonalities, there was only a weak positive correlation between the change in DEMMI and the change in FIM Motor and FIM Total. However, this correlation is not statistically significant. Therefore, the FIM is not recommended as a replacement of the DEMMI, nor can one be used to predict the other.
It has previously been confirmed that there is a significant positive correlation between the 10MWT and the TUG.27 This retrospective analysis has also supported these findings. This is possibly due to the similarity in the assessments, as they both incorporate ambulation ability and dynamic movement.
Each of the 4 outcome measures assess different yet vital aspects of an individual’s functional mobility and ambulation ability during their subacute rehabilitation journey. The diversity of patient age, functional impairment, and mobility level needs a range of outcomes to provide baselines, targets, and goal attainment for discharge home.
Consistent with the AROC AN-SNAP reporting of Length of Stay and FIM change separated into the weighted impairment groups, the data analysis of this study demonstrated significant differences between the Reconditioning, Orthopedic Fracture, and Orthopedic Replacement patient data. Tables 2 and 3 describe the differences between the groups. The fracture population in this study improved the most across each outcome measure. In contrast, the reconditioning population showed the least improvement. This may be expected due to the pathophysiological differences between the groups. Furthermore, for the elderly who sustain fractures because of a fall, rehabilitation will be required to address not only the presenting injury but also the premorbid falls risk factors which may include polypharmacy or impaired balance.
Any conclusions drawn from the findings of this study need to take into consideration that it has focused on patients from 1 local health district and therefore may not be generalizable to a wider national or international context. As this study was a retrospective study, controlling for data collection quality, measurement bias due to nonblinding and missing data is a limitation. However, clinicians regularly completed these outcome assessments and recorded this information as part of their standard care practices within this health district. There may have been slight differences in definitions of practice between the 5 rehabilitation sites. To ensure reliability, each individual site’s protocols for the FIM, DEMMI, TUG, and 10MWT were reviewed and confirmed to be consistent.
It is important, too, to consider the ceiling effect for the FIM scores. For patients requiring a walking aid well after discharge, the highest level of independence from the walking aid will not be achieved. It is acknowledged that the floor effect of the 10MWT and TUG may also influence the outcomes of this study. In addition, data were not collected on preadmission functional measures to enable further evaluation of the population groups. The proportion of variance in change from admission to discharge for TUG and 10MWT to FIM was less than 5%, so the correlation interpretation from this type of scaling is limited. Further research into outcome measures for inpatient rehabilitation in respect to variables such as patient age, length of stay, discharge destination, and efficacy of intervention is warranted.
Conclusion
The FIM Motor change scores showed a weak positive association to the DEMMI change, and no association to the TUG and 10MWT change, demonstrating that the outcome measures do not measure the same attributes. Thorough reporting of clinical outcomes is much more meaningful to assess and guide the physiotherapy component of rehabilitation. To review rehabilitation effectiveness from a management perspective, it is recommended that all measures are reviewed to assess the burden of care, mobility, functional capacity, and dynamic balance.
Acknowledgements: The authors thank Anne Smith, MSHLM, BAppSc, Head of the Physiotherapy Department, and the physiotherapists and allied health assistants who have contributed to the collection of this valuable data over several years. They also thank Lina Baytieh, MS, BS, from Research Central, Illawarra Shoalhaven Local Health District, for her assistance with the analysis.
Corresponding author: Maren Jones, MPH, BS, Physiotherapy Department, Port Kembla Hospital, Illawarra Shoalhaven Local Health District, Warrawong, New South Wales, 2505 Australia; maren.jones@health.nsw.gov.au.
Financial disclosures: None.
1. Centers for Disease Control and Prevention. Disability and health overview. Impairments, activity limitations and participation restrictions. September 16, 2020. https://www.cdc.gov/ncbddd/disabilityandhealth/disability.html
2. The Royal Australasian College of Physicians. Australasian Faculty of Rehabilitation Medicine. Standards for the Provision of Inpatient Adult Rehabilitation Medicine Services in Public and Private Hospitals. February 2019:7-9. https://www.racp.edu.au/docs/default-source/advocacy-library/afrm-standards-for-the-provision-of-inpatient-adult-rehabilitation-medicine-services-in-public-and-private-hospitals.pdf?sfvrsn=4690171a_4
3. NSW Agency for Clinical Innovation. NSW rehabilitation model of care. June 1, 2015. https://aci.health.nsw.gov.au/resources/rehabilitation/rehabilitation-model-of-care/rehabilitation-moc
4. The State of Queensland (Queensland Health). Clinical task instructions. June 22, 2021. https://www.health.qld.gov.au/ahwac/html/clintaskinstructions
5. Panel on Prevention of Falls in Older Persons, American Geriatrics Society and British Geriatrics Society. Summary of the updated American Geriatrics Society/British Geriatrics Society clinical practice guideline for prevention of falls in older persons. J Am Geriatr Soc. 2011;59(1):148-157. doi:10.1111/j.1532-5415.2010.03234.x
6. Suwannarat P, Kaewsanmung S, Thaweewannakij T, Amatachaya S. The use of functional performance tests by primary health-care providers to determine walking ability with and without a walking device in community-dwelling elderly. Physiother Theory Pract. 2021;37(1):64-72. doi:10.1080/09593985.2019.1606372
7. Lee K-J, Um S-H, Kim Y-H. Postoperative rehabilitation after hip fracture: a literature review. Hip Pelvis. 2020;32(3):125-131. doi:10.5371/hp.2020.32.3.125
8. Wade DT, Smeets RJEM, Verbunt JA. Research in rehabilitation medicine: methodological challenges. J Clin Epidemiol. 2010;63(7):699-704. doi:10.1016/j.clinepi.2009.07.010
9. Wade DT. Outcome measures for clinical rehabilitation trials: impairment, function, quality of life, or value? Am J Phys Med Rehabil. 2003;82(suppl 10):S26-S31. doi:10.1097/01.PHM.0000086996.89383.A1
10. de Morton NA, Harding KE, Taylor NF, Harrison G. Validity of the de Morton NA Mobility Index (DEMMI) for measuring the mobility of patients with hip fracture during rehabilitation. Disabil Rehabil. 2013;35(4):325-333. doi:10.3109/09638288.2012.705220
11. Trøstrup J, Andersen H, Kam CAM, et al. Assessment of mobility in older people hospitalized for medical illness using the de Morton Mobility Index and cumulated ambulation score—validity and minimal clinical important difference. J Geriatr Phys Ther. 2019;42(3):153-160. doi:10.1519/JPT.0000000000000170
12. Gazzoti A, Meyer U, Freystaetter G, et al. Physical performance among patients aged 70+ in acute care: a preliminary comparison between the Short Physical Performance Battery and the De Morton Mobility Index with regard to sensitivity to change and prediction of discharge destination. Aging Clin Exp Res. 2020;32(4):579-586. doi:10.1007/s40520-019-1249-9
13. Tavares LS, Moreno NA, de Aquino BG, et al. Reliability, validity, interpretability and responsiveness of the DEMMI mobility index for Brazilian older hospitalized patients. PLoS One. 2020;15(3):e0230047. doi:10.1371/journal.pone.0230047
14. Braun T, Schulz R-J, Reinke J. Reliability and validity of the German translation of the de Morton Mobility Index performed by physiotherapists in patients admitted to a sub-acute inpatient geriatric rehabilitation hospital. BMC Geriatr. 2015;15:38. doi:10.1186/s12877-015-0035-y
15. Søndergaard K, Petersen LE, Pedersen MK, et al. The responsiveness and predictive validity of the de Morton Mobility Index in geriatric rehabilitation. Disabil Rehabil. 2020 Jun 12. [Epub ahead of print] doi:10.1080/09638288.2020.1771438
16. de Morton NA, Brusco NK, Wood L, et al. The de Morton Mobility Index (DEMMI) provides a valid method for measuring and monitoring the mobility of patients making the transition from hospital to the community: an observational study. J Physiother. 2011;57(2):109-116. doi:10.1016/S1836-9553(11)70021-2
17. Caronni A, Sterpi I, Antoniotti P, et al. Criterion validity of the instrumented Timed Up and Go test: a partial least square regression study. Gait Posture. 2018;61(3):287-293. doi:10.1016/j.gaitpost.2018.01.015
18. Kristensen MT, Bloch ML, Jonsson LR, Jakobsen TL. Interrater reliability of the standardized Timed Up and Go Test when used in hospitalized and community-dwelling individuals. Physiother Res Int. 2019;24(2):e1769. doi:10.1002/pri.1769
19. Yuksel E, Kalkan S, Cekmece S, et al. Assessing minimal detectable changes and test-retest reliability of the timed up and go test and 2-minute walk test in patients with total knee arthroplasty. J Arthroplasty. 2017;32(2):426-430. doi:10.1016/j.arth.2016.07.031
20. Yuksel E, Unver B, Kalkan S, Karatosun V. Reliability and minimal detectable change of the 2-minute walk test and Timed Up and Go test in patients with total hip arthroplasty. Hip Int. 2021;31(1):43-49. doi:10.1177/1120700019888614
21. Faleide AGH, Bogen BE, Magnussen LH. Intra-session test-retest reliability of the Timed “Up & Go” Test when performed by patients with hip fractures. Eur J Physiother. 2015;17(2):89-97. doi:10.3109/21679169.2015.1043579
22. Barry E, Galvin R, Keogh C, et al. Is the timed up and go test a useful predictor of risk of falls in community dwelling older adults: a systematic review and meta- analysis. BMC Geriatr. 2014;14:14. doi:10.1186/1471-2318-14-14
23. Kojima G, Masud T, Kendrick D, et al. Does the timed up and go test predict future falls among British community-dwelling older people? Prospective cohort study nested within a randomised controlled trial. BMC Geriatr. 2015;15:38. doi:10.1186/s12877-015-0039-7
24. Shumway-Cook A, Brauer S, Woollacott M. Predicting the probability for falls in community-dwelling older adults using the timed up & go test. Phys Ther. 2000;80(9):896-903.
25. Jeong SM, Shin DW, Han K, et al. Timed Up-and-Go test is a useful predictor of fracture incidence. Bone. 2019;127:474-481. doi:10.1016/j.bone.2019.07.018
26. Donaghue OA, Savva GM, Börsch-Supan A, Kenny RA. Reliability, measurement error and minimum detectable change in reliability measurement error and minimum detectable change in mobility measures: a cohort study of community dwelling adults aged 50 years and over in Ireland. BMJ Open. 2019;9(11):e030475. doi:10/1136.bmjopen-2019-030475
27. Freter SH, Fruchter N. Relationship between timed ‘up and go’ and gait time in an elderly orthopaedic rehabilitation population. Clin Rehabil. 2000;14(1):96-101. doi:10.1191/026921500675545616
28. Kear BM, Guck TP, McGaha AL. Timed up and go (TUG) test: normative reference values for ages 20 to 59 years and relationships with physical and mental health risk factors. J Prim Care Community Health. 2017;8(1):9-13. doi:10.1177/2150131916659282
29. Abellan van Kan G, Rolland Y, Andrieu S, et al. Gait speed at usual pace as a predictor of adverse outcomes in community-dwelling older people: an International Academy on Nutrition and Aging (IANA) Task Force. J Nutr Health Aging. 2009;13(10)881-889. doi:10.1007/s12603-009-0246-z
30. Unver B, Baris RH, Yusel E, et al. Reliability of 4-meter and 10-meter walk tests after lower extremity surgery. Disabil Rehabil. 2017;39(25):2572-2576. doi:10.1080/09638288.2016.1236153
31. Fritz S, Lusardi M. White paper: “walking speed: the sixth vital sign.” J Geriatr Phys Ther. 2009;32(2):46-49.
32. Studenski S, Perera S, Patel K, et al. Gait speed and survival in older adults. JAMA. 2011;305(1):50-58. doi:10.1001/jama.2010.1923
33. Bohannon R. Comfortable and maximum walking speed of adults aged 20-79 years: reference values and determinants. Age Ageing. 1997;26(1):15-19. doi:10.1093/ageing/26.1.15
34. Perera S, Mody SH, Woodman RC, Studenski SA. Meaningful change and responsiveness in common physical performance in older adults. J Am Geriatr Soc. 2006;54(5):743-749. doi:10.1111/j.1532-5415.2006.00701.x
35. Hollman J, Beckman B, Brandt R, et al. Minimum detectable change in gait velocity during acute rehabilitation following hip fracture. J Geriatr Phys Ther. 2008;31(2):53-56. doi:10.1519/00139143-200831020-00003
36. Bohannon RW, Andrews AW. Normal walking speed: a descriptive meta-analysis. Physiotherapy. 2011;97(3):182-189. doi:10.1016/j.physio.2010.12.004
37. Granger CV, Hamilton BB, Keith RA, et al. Advances in functional assessment for medical rehabilitation. Top Geriatr Rehabil. 1986;1:59-74.
38. Keith RA, Granger CV, Hamilton BB, Sherwin FS. The Functional Independence Measure: a new tool for rehabilitation. In: Eisenberg MG, Grzesiak RC, eds. Advances in Clinical Rehabilitation. Springer-Verlag; 1987:6-18.
39. Linacre JM, Heinemann AW, Wright BD, et al. The structure and stability of the Functional Independence Measure. Arch Phys Med Rehabil. 1994;75(2):127-132.
40. Coster WJ, Haley SM, Jette AM. Measuring patient-reported outcomes after discharge from inpatient rehabilitation settings. J Rehabil Med. 2006;38(4):237-242. doi:10.1080/16501970600609774
41. Street L. Frequently asked questions about FIM. Journal of the Australasian Rehabilitation Nurses Association. 2014;17(1):21-22. https://ro.uow.edu.au/ahsri/296/
42. Green JP, Gordon R, Blanchard MB, et al. Development of the Australian National Subacute and Non-acute Patient (AN-SNAP) Classification. Version 4 Final Report. Australian Health Services Research Institute, University of Wollongong, 2015. https://ro.uow.edu.au/ahsri/760
43. Australasian Rehabilitation Outcomes Centre. University of Wollongong, Australia. https://www.uow.edu.au/ahsri/aroc/
44. Green J, Gordon R, Kobel C, et al; Centre for Health Service Development. The Australian National Subacute and Non-acute Patient Classification. AN-SNAP V4 User Manual. May 2015. https://documents.uow.edu.au/content/groups/public/@web/@chsd/@aroc/documents/doc/uow194637.pdf
45. Alexander TL, Simmonds FD, Capelle JT, Green LJ. Anywhere Hospital AROC Impairment Specific Report on Reconditioning (Inpatient–Pathway 3), July 2018–June 2019. Australasian Rehabilitation Outcomes Centre, Australian Health Services Research Institute, University of Wollongong; 2019. ro.uow.edu.au/ahsri/1110
46. Evans JD. Straightforward Statistics for the Behavioural Sciences. Brooks/Cole Publishing; 1996.
47. Lee SP, Dufek J, Hickman R, Schuerman S. Influence of procedural factors on the reliability and performance of the timed up-and-go test in older adults. Int J Gerontol. 2016;10(1):37-42. doi:10.1016/j.ijge.2015
48. New PW, Scroggie GD, Williams CM. The validity, reliability, responsiveness and minimal clinically important difference of the de Morton Mobility Index in rehabilitation. Disabil Rehabil. 2017;39(10):1039-1043. doi:10.10801/09638288.2016.1179800
49. Nakaguchi T, Ishimoto Y, Akazawa N. Functional Independence Measure for patients with locomotor disorders in convalescent rehabilitation wards. Clinically significant minimum difference in exercise score gain. Physiotherapy Science. 2018;33(2):235-240.
Responsibilities and Interests of Pediatricians Practicing Hospital Medicine in the United States
As one of the youngest fields of pediatric practice in the United States, pediatric hospital medicine (PHM) has grown rapidly over the past 2 decades. Approximately 10% of recent graduates from pediatric residency programs in the United States have entered PHM, with two-thirds reporting an intention to remain as hospitalists long term.1,2
In October 2016, the American Board of Medical Specialties (ABMS) approved a petition for PHM to become the newest pediatric subspecialty.3 The application for subspeciality status, led by the Joint Council of Pediatric Hospital Medicine, articulated that subspecialty certification would more clearly define subspecialty hospitalists’ scope of practice, create a “new and larger cadre” of quality improvement (QI) experts, and strengthen opportunities for professional development related to child health safety within healthcare systems.4 Approximately 1500 pediatric hospitalists sat for the first PHM board-certification exam in November 2019, illustrating broad interest and commitment to this subspecialty.5
Characterizing the current responsibilities, practice settings, and professional interests of pediatric hospitalists is critical to understanding the continued development of the field. However, the most recent national survey of pediatric hospitalists’ roles and responsibilities was conducted more than a decade ago, and shared definitions of what constitutes PHM across institutions are lacking.6 Furthermore, studies suggest wide variability in PHM workload.7-9 We therefore aimed to describe the characteristics, responsibilities, and practice settings of pediatricians who reported practicing PHM in the United States and determine how exclusive PHM practice, compared with PHM practice in combination with primary or subspecialty care, was associated with professional responsibilities and interests. We hypothesized that those reporting exclusive PHM practice would be more likely to report interest in QI leadership and intention to take the PHM certifying exam than those practicing PHM in combination with primary or subspecialty care.
METHODS
Participants and Survey
Pediatricians enrolling in the American Board of Pediatrics (ABP) Maintenance of Certification (MOC) program in 2017 and 2018 were asked to complete a voluntary survey about their professional roles and scope of practice (Appendix Methods). The survey, offered to all MOC enrollees, included a hospital medicine module administered to those reporting PHM practice, given the ABP’s interest in characterizing PHM roles, responsibilities, practice settings, and interests in QI. Respondents were excluded if they were practicing outside of the United States, if they were unemployed or in a volunteer position, or if they were in fellowship training.
To ascertain areas of clinical practice, respondents were provided with a list of clinical practice areas and asked, “In which of the following areas are you practicing?” Those selecting “hospital medicine” were classified as self-identified hospitalists (hereafter, “hospitalists”). Given variation across institutions in physician roles and responsibilities, we stratified hospitalists into three groups: (1) exclusive PHM practice, representing those who reported PHM as their only area of practice; (2) PHM in combination with general pediatrics, representing those who reported practicing PHM and general pediatrics; and (3) PHM in combination with other subspecialties, representing those who reported practicing PHM in addition to one or more subspecialties. Respondents who reported practicing hospital medicine, general pediatrics, and another subspecialty were classified in the subspecialty group. The ABP’s institutional review board of record deemed the survey exempt from human subjects review.
Hospitalist Characteristics and Clinical Roles
To characterize respondents, we examined their age, gender, medical school location (American medical school or international medical school), and survey year (2017 or 2018). We also examined the following practice characteristics: US Census region, part-time versus full-time employment, academic appointment (yes or no), proportion of time spent providing direct and/or consultative patient care and fulfilling nonclinical responsibilities (research, administration, medical education, and QI), hospital setting (children’s hospital, community hospital, or mix of these hospital types), and work schedule type (shift schedule, on-service work in blocks, or a combination of shift and block schedules).
To examine variation in clinical roles, we determined the proportion of total direct and/or consultative clinical care that was spent in each of the following areas: (1) inpatient pediatric care, defined as inpatient general or subspecialty care in patients up to 21 years of age; (2) neonatal care, defined as labor and delivery, inpatient normal newborn care, and/or neonatal intensive care; (3) outpatient practice, defined as outpatient general or subspecialty care in patients up to 21 years of age; (4) emergency department care; and (5) other, which included pediatric intensive care as well inpatient adult care. Recognizing that scope of practice may differ at community hospitals and children’s hospitals, we stratified this analysis by practice setting (children’s hospital, community hospital).
Dependent Variables
We examined four dependent variables, two that were hypothesis driven and two that were exploratory. To test our hypothesis that respondents practicing PHM exclusively would be more likely to report interest in QI leadership or consultation (given the emphasis on QI in the ABMS application for subspecialty status), we examined the frequency with which respondents endorsed being “somewhat interested” or “very interested” in “serving as a leader or consultant for QI activities.” To test our hypothesis that respondents practicing PHM exclusively would be more likely to report plans to take the PHM certifying exam, we noted the frequency with which respondents reported “yes” to the question, “Do you plan to take a certifying exam in hospitalist medicine when it becomes available?” As an exploratory outcome, we examined satisfaction with allocation of professional time, available on the 2017 survey only; satisfaction was defined as an affirmative response to the question, “Is the allocation of your total professional time approximately what you wanted in your current position?” Finally, intention to maintain more than one ABP certification, also reported only in 2017 and examined as an exploratory outcome, was defined as a reported intention to maintain more than one ABP certification, including general pediatrics, PHM, or any other subspecialty.
Statistical Analysis
We used chi-square tests and analysis of variance as appropriate to examine differences in sociodemographic and professional characteristics among respondents who reported exclusive PHM practice, PHM in combination with general pediatrics, and PHM in combination with another subspecialty. To examine differences across the three PHM groups in their allocation of time to various clinical responsibilities (eg, inpatient care, newborn care), we used Kruskal-Wallis equality-of-population rank tests, stratifying by hospital type. We used multivariable logistic regression to identify associations between exclusive PHM practice and our four dependent variables, adjusting for the sociodemographic and professional characteristics described above. All analyses were conducted using Stata 15 (StataCorp LLC), using two-sided tests, and defining P < .05 as statistically significant.
RESULTS
Study Sample
Of the 19,763 pediatricians enrolling in MOC in 2017 and 2018, 13,839 responded the survey, representing a response rate of 70.0%. There were no significant differences between survey respondents and nonrespondents with respect to gender; differences between respondents and nonrespondents in age, medical school location, and initial year of ABP certification year were small (mean age, 48.1 years and 47.1 years, respectively [P < .01]; 77.0% of respondents were graduates of US medical schools compared with 73.7% of nonrespondents [P < .01]; mean certification year for respondents was 2003 compared with 2004 for nonrespondents [P < .01]). After applying the described exclusion criteria, 1662 of 12,665 respondents self-identified as hospitalists, reflecting 13.1% of the sample and the focus of this analysis (Appendix Figure).
Participant Characteristics and Areas of Practice
Of 1662 self-identified hospitalists, 881 (53.0%) also reported practicing general pediatrics, and 653 (39.3%) also reported practicing at least one subspecialty in addition to PHM. The most frequently reported additional subspecialty practice areas included: (1) neonatology (n = 155, 9.3%); (2) adolescent medicine (n = 138, 8.3%); (3) pediatric critical care (n = 89, 5.4%); (4) pediatric emergency medicine (n = 80, 4.8%); and (5) medicine-pediatrics (n = 30, 4.7%, asked only on the 2018 survey). When stratified into mutually exclusive groups, 491 respondents (29.5%) identified as practicing PHM exclusively, 518 (31.2%) identified as practicing PHM in combination with general pediatrics, and 653 (39.3%) identified as practicing PHM in combination with one or more other subspecialties.
Table 1 summarizes the characteristics of respondents in these three groups. Respondents reporting exclusive PHM practice were, on average, younger, more likely to be female, and more likely to be graduates of US medical schools than those reporting PHM in combination with general or subspecialty pediatrics. In total, approximately two-thirds of the sample (n = 1068, 64.3%) reported holding an academic appointment, including 72.9% (n = 358) of those reporting exclusive PHM practice compared with 56.9% (n = 295) of those also reporting general pediatrics and 63.6% (n = 415) of those also reporting subspecialty care (P < .001). Respondents who reported practicing PHM exclusively most frequently worked at children’s hospitals (64.6%, n = 317), compared with 40.0% (n = 207) and 42.1% (n = 275) of those practicing PHM in combination with general and subspecialty pediatrics, respectively (P < .001).
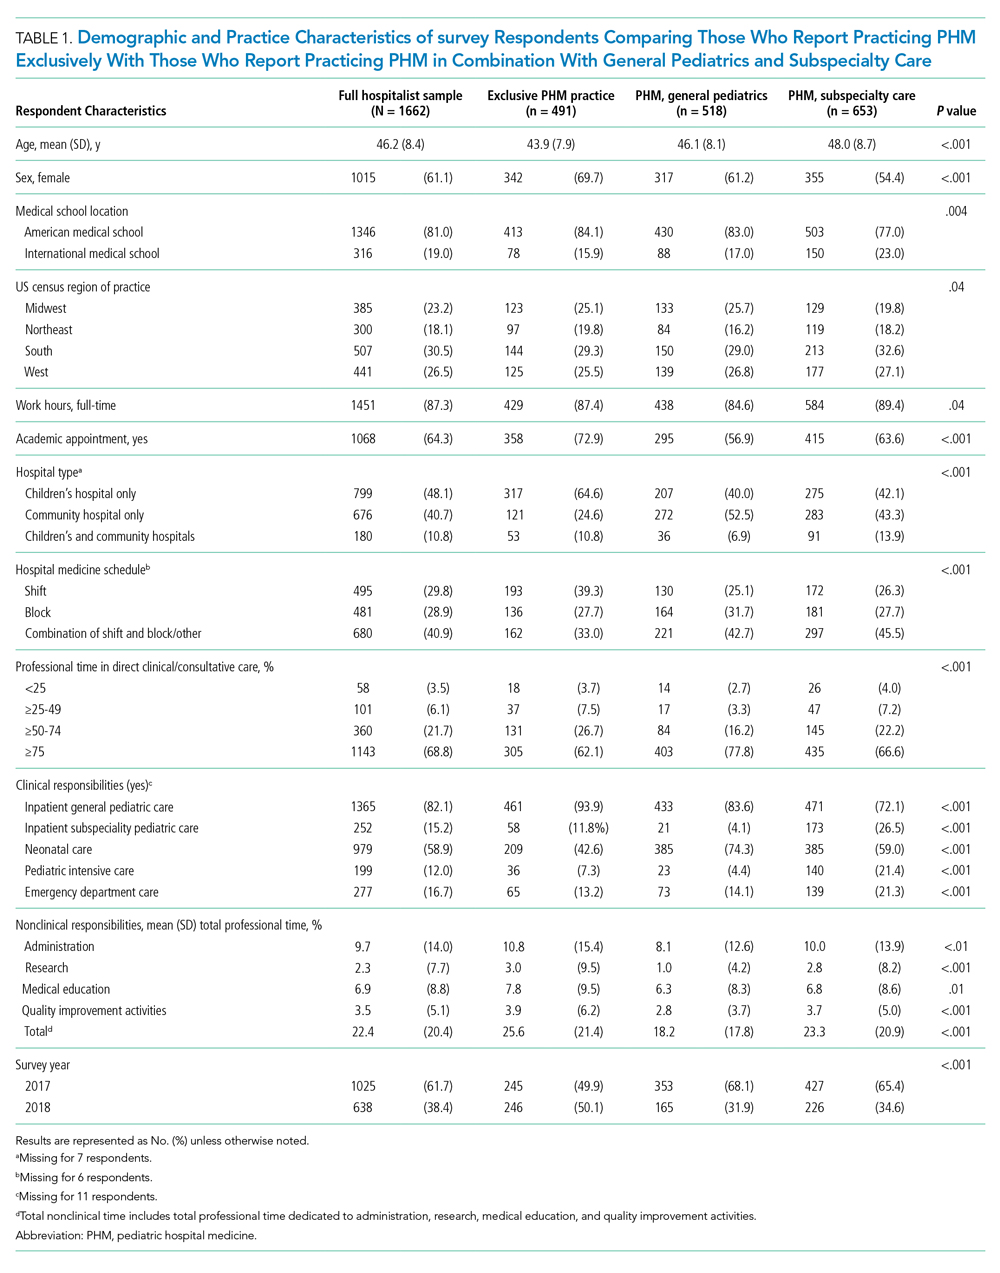
Clinical and Nonclinical Roles and Responsibilities
The majority of respondents reported that they spent >75% of their professional time in direct clinical or consultative care, including 62.1% (n = 305) of those reporting PHM exclusively and 77.8% (n = 403) and 66.6% (n = 435) of those reporting PHM with general and subspecialty pediatrics, respectively (P < .001). Overall, <10% reported spending less than 50% of their time proving direct patient care, including 11.2% (n = 55) of those reporting exclusive PHM practice, 11.2% (n = 73) reporting PHM in combination with a subspecialty, and 6% (n = 31) in combination with general pediatrics. The mean proportion of time spent in nonclinical roles was 22.4% (SD, 20.4%), and the mean proportions of time spent in any one area (administration, research, education, or QI) were all <10%.
The proportion of time allocated to inpatient pediatric care, neonatal care, emergency care, and outpatient pediatric care varied substantially across PHM practice groups and settings. Among respondents who practiced at children’s hospitals, the median percentage of clinical time dedicated to inpatient pediatric care was 66.5% (interquartile range [IQR], 15%-100%), with neonatal care being the second most common clinical practice area (Figure, part A; Appendix Table). At community hospitals, the percentage of clinical time dedicated to inpatient pediatric care was lower, with a median of 10% (IQR, 3%-40%) (Figure, part B). Among those reporting exclusive PHM practice, the median proportion of clinical time spent delivering inpatient pediatric care was 100% (IQR, 80%-100%) at children’s hospitals and 40% (IQR, 20%-85%) at community hospitals. At community hospitals, neonatal care accounted for a similar proportion of clinical time as inpatient pediatric care for these respondents (median, 40% [IQR, 0%-70%]). With the exception of emergency room care, we observed significant differences in how clinical time was allocated by respondents reporting exclusive PHM practice compared with those reporting PHM in combination with general or specialty care (all P values < .001, Appendix Table).

Professional Development Interests
Approximately two-thirds of respondents reported interest in QI leadership or consultation (Table 2), with those reporting exclusive PHM practice significantly more likely to report this (70.3% [n = 345] compared with 57.7% [n = 297] of those practicing PHM with general pediatrics and 66.3% [n = 431] of those practicing PHM with another subspecialty, P < .001). Similarly, 69% (n = 339) of respondents who reported exclusive PHM practice described an intention to take the PHM certifying examination, compared with 20.4% (n = 105) of those practicing PHM and general pediatrics and 17.7% (n = 115) of those practicing PHM and subspeciality pediatrics (P < .001). A total of 82.5% (n = 846) of respondents reported that they were satisfied with the allocation of their professional time; there were no significant differences between those reporting exclusive PHM practice and those reporting PHM in combination with general or subspecialty pediatrics. Of hospitalists reporting exclusive PHM practice, 67.8% (n = 166) reported an intention to maintain more than one ABP certification, compared with 22.1% (n = 78) of those practicing PHM and general pediatrics and 53.9% (n = 230) of those practicing PHM and subspecialty pediatrics (P < .001).
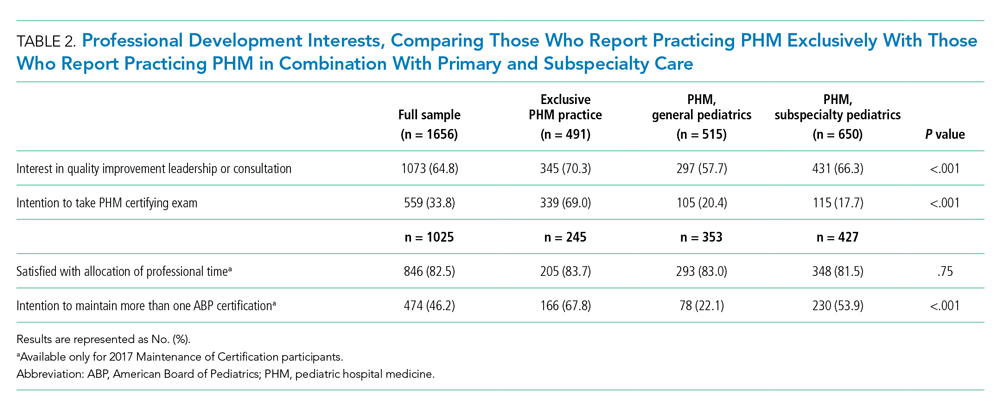
In multivariate regression analyses, hospitalists reporting exclusive PHM practice had significantly greater odds of reported interest in QI leadership or consultation (adjusted odds ratio [OR], 1.39; 95% CI, 1.09-1.79), intention to take the PHM certifying exam (adjusted OR, 7.10; 95% CI, 5.45-9.25), and intention to maintain more than one ABP certification (adjusted OR, 2.64; 95% CI, 1.89-3.68) than those practicing PHM in combination with general or subspecialty pediatrics (Table 3). There was no significant difference across the three groups in the satisfaction with the allocation of professional time.
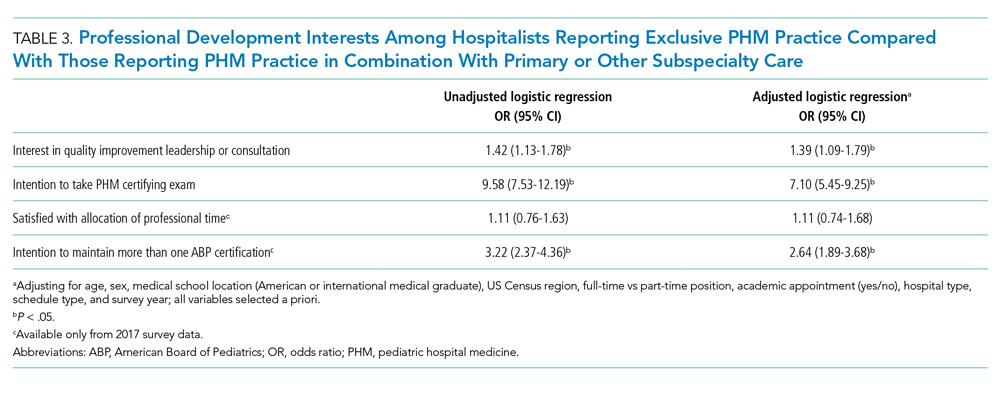
DISCUSSION
In this national survey of pediatricians seeking MOC from the ABP, 13.1% reported that they practiced hospital medicine, with approximately one-third of these individuals reporting that they practiced PHM exclusively. The distribution of clinical and nonclinical responsibilities differed across those reporting exclusive PHM practice relative to those practicing PHM in combination with general or subspecialty pediatrics. Relative to hospitalists who reported practicing PHM in addition to general or subspecialty care, those reporting exclusive PHM practice were significantly more likely to report an interest in QI leadership or consultation, intention to sit for the PHM board-certification exam, and intention to maintain more than one ABP certification.
These findings offer insight into the evolution of PHM and have important implications for workforce planning. The last nationally representative analysis of the PHM workforce was conducted in 2006, at which time 73% of hospitalists reported working at children’s hospitals.6 In the current analysis, less than 50% of hospitalists reported practicing PHM at children’s hospitals only; 10% reported working at both children’s hospitals and community hospitals and 40% at community hospitals alone. This diffusion of PHM from children’s hospitals into community hospitals represents an important development in the field and aligns with the epidemiology of pediatric hospitalization.10 Pediatric hospitalists who practice at community hospitals experience unique challenges, including a relative paucity of pediatric-specific clinical resources, limited mentorship opportunities and resources for scholarly work, and limited access to data from which to prioritize QI interventions.11,12 Our findings also illustrate that the scope of practice for hospitalists differs at community hospitals relative to children’s hospitals. Although the PHM fellowship curriculum requires training at a community hospital, the requirement is limited to one 4-week block, which may not provide sufficient preparation for the unique clinical responsibilities in this setting.13,14
Relative to past analyses of PHM workforce roles and responsibilities, a substantially greater proportion of respondents in the current study reported clinical responsibility for neonatal care, including more than 40% of those self-reporting practicing PHM exclusively and almost three-quarters of those self-reporting PHM in conjunction with general pediatrics.6,15 Given that more than half of the six million US pediatric hospitalizations that occur each year represent birth hospitalizations,16 pediatric hospitalists’ responsibilities for newborn care are consistent with these patterns of hospital-based care. Expanding hospitalists’ responsibilities to provide newborn care has also been shown to improve the financial performance of PHM programs with relatively low pediatric volumes, which may further explain this finding, particularly at community hospitals.17,18 Interestingly, although emergency department care has also been demonstrated as a model to improve the financial stability of PHM programs, relatively few hospitalists reported this as an area of clinical responsibility.19,20 This finding contrasts with past analyses and may reflect how the scope of PHM clinical responsibilities has changed since these prior studies were conducted.6,15
Because PHM had not been recognized as a subspecialty prior to 2016, a national count of pediatric hospitalists is lacking. In this study, approximately one in eight pediatricians reported that they practiced PHM, but less than 4% of the survey sample reported practicing PHM exclusively. Based on these results, we estimate that of the 76,214 to 89,608 ABP-certified pediatricians currently practicing in the United States, between 9984 and 11,738 would self-identify as practicing PHM, with between 2945 and 3462 reporting exclusive PHM practice.
Hospitalists who reported practicing PHM exclusively were significantly more likely to report an interest in QI leadership or consultation and plans to take the PHM certifying exam. These findings are consistent with PHM’s focus on QI, as articulated in the application to the ABMS for subspecialty status as well as the PHM Core Competencies and fellowship curriculum.4,13,21,22 Despite past research questioning the sustainability of some community- and university-based PHM programs and wide variability in workload,7-9 more than 80% of hospitalists reported satisfaction with the allocation of their professional time, with no significant differences between respondents practicing PHM exclusively or in combination with general or subspecialty care.
This analysis should be interpreted in light of its strengths and limitations. Strengths of this work include its national focus, large sample size, and comprehensive characterization of respondents’ professional roles and characteristics. Study limitations include the fact that respondents were classified as hospitalists based on self-report; we were unable to ascertain if they were classified as hospitalists at their place of employment or if they met the ABP’s eligibility criteria to sit for the PHM subspecialty certifying exam.19 Additionally, respondents self-reported their allocations of clinical and nonclinical time, and we are unable to correlate this with actual work hours. Respondents’ reported interest in QI leadership or consultation may not be correlated with QI effort in practice; the mean time reportedly dedicated to QI activities was quite low. Additionally, two of our outcomes were available only for respondents who enrolled in MOC in 2017, and the proportion practicing medicine-pediatrics was available only in 2018. Although this analysis represents approximately 40% of all pediatricians enrolling in MOC (2 years of the 5-year MOC cycle), it may not be representative of pediatricians who are not certified by the ABP. Finally, our outcomes related to board certification examined interest and intentions; future study will be needed to determine how many pediatricians take the PHM exam and maintain certification.
In conclusion, the field of PHM has evolved considerably since its inception, with pediatric hospitalists reporting diverse clinical and nonclinical responsibilities. Hospitalists practicing PHM exclusively were more likely to report an interest in QI leadership and intent to sit for the PHM certifying exam than those practicing PHM in combination with general pediatrics or another specialty. Continuing to monitor the evolution of PHM roles and responsibilities over time and across settings will be important to support the professional development needs of the PHM workforce.
1. House S, Frintner MP, Leyenaar JK. Factors influencing career longevity in pediatric hospital medicine. Hosp Pediatr. 2019;9(12):983-988. https://doi.org/10.1542/hpeds.2019-0151
2. Leyenaar JK, Frintner MP. Graduating pediatric residents entering the hospital medicine workforce, 2006-2015. Acad Pediatr. 2018;18(2):200-207. https://doi.org/10.1016/j.acap.2017.05.001
3. The American Board of Pediatrics. ABMS approves pediatric hospital medicine certification. November 8, 2016. Accessed October 12, 2021. https://www.abp.org/news/abms-approves-pediatric-hospital-medicine-certification
4. American Board of Medical Specialities. Application for a new subspecialty certificate: pediatric hospital medicine.
5. American Board of Pediatrics. 2019 Annual Report. Accessed October 12, 2021. https://www.abp.org/sites/abp/files/pdf/annual-report-2019.pdf
6. Freed GL, Dunham KM, Research Advisory Committee of the American Board of Pediatrics. Pediatric hospitalists: training, current practice, and career goals. J Hosp Med. 2009;4(3):179-186. https://doi.org/10.1002/jhm.458
7. Alvarez F, McDaniel CE, Birnie K, et al. Community pediatric hospitalist workload: results from a national survey. J Hosp Med. 2019;14(11):682-685. https://doi.org/10.12788/jhm.3263
8. Fromme HB, Chen CO, Fine BR, Gosdin C, Shaughnessy EE. Pediatric hospitalist workload and sustainability in university-based programs: results from a national interview-based survey. J Hosp Med. 2018;13(10):702-705. https://doi.org/10.12788/jhm.2977
9. Gosdin C, Simmons J, Yau C, Sucharew H, Carlson D, Paciorkowski N. Survey of academic pediatric hospitalist programs in the US: organizational, administrative, and financial factors. J Hosp Med. 2013;8(6):285-291. https://doi.org/10.1002/jhm.2020
10. Leyenaar JK, Ralston SL, Shieh MS, Pekow PS, Mangione-Smith R, Lindenauer PK. Epidemiology of pediatric hospitalizations at general hospitals and freestanding children’s hospitals in the United States. J Hosp Med. 2016;11(11):743-749. https://doi.org/10.1002/jhm.2624
11. Leary JC, Walsh KE, Morin RA, Schainker EG, Leyenaar JK. Quality and safety of pediatric inpatient care in community hospitals: a scoping review. J Hosp Med. 2019;14:694-703. https://doi.org/10.12788/jhm.3268
12. Leyenaar JK, Capra LA, O’Brien ER, Leslie LK, Mackie TI. Determinants of career satisfaction among pediatric hospitalists: a qualitative exploration. Acad Pediatr. 2014;14(4):361-368. https://doi.org/10.1016/j.acap.2014.03.015
13. Jerardi KE, Fisher E, Rassbach C, et al. Development of a curricular framework for pediatric hospital medicine fellowships. Pediatrics. 2017;140(1):e20170698. https://doi.org/10.1542/peds.2017-0698
14. ACGME Program Requirements for Graduate Medical Education in Pediatric Hospital Medicine. July 1, 2021. Accessed October 4, 2021.https://www.acgme.org/globalassets/PFAssets/ProgramRequirements/334_PediatricHospitalMedicine_2020.pdf?ver=2020-06-29-163350-910&ver=2020-06-29-163350-910
15. Freed GL, Brzoznowski K, Neighbors K, Lakhani I, American Board of Pediatrics, Research Advisory Committee. Characteristics of the pediatric hospitalist workforce: its roles and work environment. Pediatrics. 2007;120(1):33-39. https://doi.org/10.1542/peds.2007-0304
16. Moore B, Freeman W, Jiang H. Costs of Pediatric Hospital Stays, 2016. Healthcare Cost and Utilization Project Statistical Brief #250. Accessed October 25, 2021. https://www.ncbi.nlm.nih.gov/books/NBK547762/
17. Carlson DW, Fentzke KM, Dawson JG. Pediatric hospitalists: fill varied roles in the care of newborns. Pediatr Ann. 2003;32(12):802-810. https://doi.org/10.3928/0090-4481-20031201-09
18. Tieder JS, Migita DS, Cowan CA, Melzer SM. Newborn care by pediatric hospitalists in a community hospital: effect on physician productivity and financial performance. Arch Pediatr Adolesc Med. 2008;162(1):74-78. https://doi.org/10.1001/archpediatrics.2007.15
19. Krugman SD, Suggs A, Photowala HY, Beck A. Redefining the community pediatric hospitalist: the combined pediatric ED/inpatient unit. Pediatr Emerg Care. 2007;23(1):33-37. https://doi.org/10.1097/01.pec.0000248685.94647.01
20. Dudas RA, Monroe D, McColligan Borger M. Community pediatric hospitalists providing care in the emergency department: an analysis of physician productivity and financial performance. Pediatr Emerg Care. 2011;27(11):1099-1103. https://doi.org/10.1097/PEC.0b013e31823606f5
21. Stucky ER, Ottolini MC, Maniscalco J. Pediatric hospital medicine core competencies: development and methodology. J Hosp Med. 2010;5(6):339-343. https://doi.org/10.1002/jhm.843
22. Maniscalco J, Gage S, Teferi S, Fisher ES. The Pediatric Hospital Medicine Core Competencies: 2020 revision. J Hosp Med. 2020;15(7):389-394. https://doi.org/10.12788/jhm.3391
As one of the youngest fields of pediatric practice in the United States, pediatric hospital medicine (PHM) has grown rapidly over the past 2 decades. Approximately 10% of recent graduates from pediatric residency programs in the United States have entered PHM, with two-thirds reporting an intention to remain as hospitalists long term.1,2
In October 2016, the American Board of Medical Specialties (ABMS) approved a petition for PHM to become the newest pediatric subspecialty.3 The application for subspeciality status, led by the Joint Council of Pediatric Hospital Medicine, articulated that subspecialty certification would more clearly define subspecialty hospitalists’ scope of practice, create a “new and larger cadre” of quality improvement (QI) experts, and strengthen opportunities for professional development related to child health safety within healthcare systems.4 Approximately 1500 pediatric hospitalists sat for the first PHM board-certification exam in November 2019, illustrating broad interest and commitment to this subspecialty.5
Characterizing the current responsibilities, practice settings, and professional interests of pediatric hospitalists is critical to understanding the continued development of the field. However, the most recent national survey of pediatric hospitalists’ roles and responsibilities was conducted more than a decade ago, and shared definitions of what constitutes PHM across institutions are lacking.6 Furthermore, studies suggest wide variability in PHM workload.7-9 We therefore aimed to describe the characteristics, responsibilities, and practice settings of pediatricians who reported practicing PHM in the United States and determine how exclusive PHM practice, compared with PHM practice in combination with primary or subspecialty care, was associated with professional responsibilities and interests. We hypothesized that those reporting exclusive PHM practice would be more likely to report interest in QI leadership and intention to take the PHM certifying exam than those practicing PHM in combination with primary or subspecialty care.
METHODS
Participants and Survey
Pediatricians enrolling in the American Board of Pediatrics (ABP) Maintenance of Certification (MOC) program in 2017 and 2018 were asked to complete a voluntary survey about their professional roles and scope of practice (Appendix Methods). The survey, offered to all MOC enrollees, included a hospital medicine module administered to those reporting PHM practice, given the ABP’s interest in characterizing PHM roles, responsibilities, practice settings, and interests in QI. Respondents were excluded if they were practicing outside of the United States, if they were unemployed or in a volunteer position, or if they were in fellowship training.
To ascertain areas of clinical practice, respondents were provided with a list of clinical practice areas and asked, “In which of the following areas are you practicing?” Those selecting “hospital medicine” were classified as self-identified hospitalists (hereafter, “hospitalists”). Given variation across institutions in physician roles and responsibilities, we stratified hospitalists into three groups: (1) exclusive PHM practice, representing those who reported PHM as their only area of practice; (2) PHM in combination with general pediatrics, representing those who reported practicing PHM and general pediatrics; and (3) PHM in combination with other subspecialties, representing those who reported practicing PHM in addition to one or more subspecialties. Respondents who reported practicing hospital medicine, general pediatrics, and another subspecialty were classified in the subspecialty group. The ABP’s institutional review board of record deemed the survey exempt from human subjects review.
Hospitalist Characteristics and Clinical Roles
To characterize respondents, we examined their age, gender, medical school location (American medical school or international medical school), and survey year (2017 or 2018). We also examined the following practice characteristics: US Census region, part-time versus full-time employment, academic appointment (yes or no), proportion of time spent providing direct and/or consultative patient care and fulfilling nonclinical responsibilities (research, administration, medical education, and QI), hospital setting (children’s hospital, community hospital, or mix of these hospital types), and work schedule type (shift schedule, on-service work in blocks, or a combination of shift and block schedules).
To examine variation in clinical roles, we determined the proportion of total direct and/or consultative clinical care that was spent in each of the following areas: (1) inpatient pediatric care, defined as inpatient general or subspecialty care in patients up to 21 years of age; (2) neonatal care, defined as labor and delivery, inpatient normal newborn care, and/or neonatal intensive care; (3) outpatient practice, defined as outpatient general or subspecialty care in patients up to 21 years of age; (4) emergency department care; and (5) other, which included pediatric intensive care as well inpatient adult care. Recognizing that scope of practice may differ at community hospitals and children’s hospitals, we stratified this analysis by practice setting (children’s hospital, community hospital).
Dependent Variables
We examined four dependent variables, two that were hypothesis driven and two that were exploratory. To test our hypothesis that respondents practicing PHM exclusively would be more likely to report interest in QI leadership or consultation (given the emphasis on QI in the ABMS application for subspecialty status), we examined the frequency with which respondents endorsed being “somewhat interested” or “very interested” in “serving as a leader or consultant for QI activities.” To test our hypothesis that respondents practicing PHM exclusively would be more likely to report plans to take the PHM certifying exam, we noted the frequency with which respondents reported “yes” to the question, “Do you plan to take a certifying exam in hospitalist medicine when it becomes available?” As an exploratory outcome, we examined satisfaction with allocation of professional time, available on the 2017 survey only; satisfaction was defined as an affirmative response to the question, “Is the allocation of your total professional time approximately what you wanted in your current position?” Finally, intention to maintain more than one ABP certification, also reported only in 2017 and examined as an exploratory outcome, was defined as a reported intention to maintain more than one ABP certification, including general pediatrics, PHM, or any other subspecialty.
Statistical Analysis
We used chi-square tests and analysis of variance as appropriate to examine differences in sociodemographic and professional characteristics among respondents who reported exclusive PHM practice, PHM in combination with general pediatrics, and PHM in combination with another subspecialty. To examine differences across the three PHM groups in their allocation of time to various clinical responsibilities (eg, inpatient care, newborn care), we used Kruskal-Wallis equality-of-population rank tests, stratifying by hospital type. We used multivariable logistic regression to identify associations between exclusive PHM practice and our four dependent variables, adjusting for the sociodemographic and professional characteristics described above. All analyses were conducted using Stata 15 (StataCorp LLC), using two-sided tests, and defining P < .05 as statistically significant.
RESULTS
Study Sample
Of the 19,763 pediatricians enrolling in MOC in 2017 and 2018, 13,839 responded the survey, representing a response rate of 70.0%. There were no significant differences between survey respondents and nonrespondents with respect to gender; differences between respondents and nonrespondents in age, medical school location, and initial year of ABP certification year were small (mean age, 48.1 years and 47.1 years, respectively [P < .01]; 77.0% of respondents were graduates of US medical schools compared with 73.7% of nonrespondents [P < .01]; mean certification year for respondents was 2003 compared with 2004 for nonrespondents [P < .01]). After applying the described exclusion criteria, 1662 of 12,665 respondents self-identified as hospitalists, reflecting 13.1% of the sample and the focus of this analysis (Appendix Figure).
Participant Characteristics and Areas of Practice
Of 1662 self-identified hospitalists, 881 (53.0%) also reported practicing general pediatrics, and 653 (39.3%) also reported practicing at least one subspecialty in addition to PHM. The most frequently reported additional subspecialty practice areas included: (1) neonatology (n = 155, 9.3%); (2) adolescent medicine (n = 138, 8.3%); (3) pediatric critical care (n = 89, 5.4%); (4) pediatric emergency medicine (n = 80, 4.8%); and (5) medicine-pediatrics (n = 30, 4.7%, asked only on the 2018 survey). When stratified into mutually exclusive groups, 491 respondents (29.5%) identified as practicing PHM exclusively, 518 (31.2%) identified as practicing PHM in combination with general pediatrics, and 653 (39.3%) identified as practicing PHM in combination with one or more other subspecialties.
Table 1 summarizes the characteristics of respondents in these three groups. Respondents reporting exclusive PHM practice were, on average, younger, more likely to be female, and more likely to be graduates of US medical schools than those reporting PHM in combination with general or subspecialty pediatrics. In total, approximately two-thirds of the sample (n = 1068, 64.3%) reported holding an academic appointment, including 72.9% (n = 358) of those reporting exclusive PHM practice compared with 56.9% (n = 295) of those also reporting general pediatrics and 63.6% (n = 415) of those also reporting subspecialty care (P < .001). Respondents who reported practicing PHM exclusively most frequently worked at children’s hospitals (64.6%, n = 317), compared with 40.0% (n = 207) and 42.1% (n = 275) of those practicing PHM in combination with general and subspecialty pediatrics, respectively (P < .001).
Clinical and Nonclinical Roles and Responsibilities
The majority of respondents reported that they spent >75% of their professional time in direct clinical or consultative care, including 62.1% (n = 305) of those reporting PHM exclusively and 77.8% (n = 403) and 66.6% (n = 435) of those reporting PHM with general and subspecialty pediatrics, respectively (P < .001). Overall, <10% reported spending less than 50% of their time proving direct patient care, including 11.2% (n = 55) of those reporting exclusive PHM practice, 11.2% (n = 73) reporting PHM in combination with a subspecialty, and 6% (n = 31) in combination with general pediatrics. The mean proportion of time spent in nonclinical roles was 22.4% (SD, 20.4%), and the mean proportions of time spent in any one area (administration, research, education, or QI) were all <10%.
The proportion of time allocated to inpatient pediatric care, neonatal care, emergency care, and outpatient pediatric care varied substantially across PHM practice groups and settings. Among respondents who practiced at children’s hospitals, the median percentage of clinical time dedicated to inpatient pediatric care was 66.5% (interquartile range [IQR], 15%-100%), with neonatal care being the second most common clinical practice area (Figure, part A; Appendix Table). At community hospitals, the percentage of clinical time dedicated to inpatient pediatric care was lower, with a median of 10% (IQR, 3%-40%) (Figure, part B). Among those reporting exclusive PHM practice, the median proportion of clinical time spent delivering inpatient pediatric care was 100% (IQR, 80%-100%) at children’s hospitals and 40% (IQR, 20%-85%) at community hospitals. At community hospitals, neonatal care accounted for a similar proportion of clinical time as inpatient pediatric care for these respondents (median, 40% [IQR, 0%-70%]). With the exception of emergency room care, we observed significant differences in how clinical time was allocated by respondents reporting exclusive PHM practice compared with those reporting PHM in combination with general or specialty care (all P values < .001, Appendix Table).
Professional Development Interests
Approximately two-thirds of respondents reported interest in QI leadership or consultation (Table 2), with those reporting exclusive PHM practice significantly more likely to report this (70.3% [n = 345] compared with 57.7% [n = 297] of those practicing PHM with general pediatrics and 66.3% [n = 431] of those practicing PHM with another subspecialty, P < .001). Similarly, 69% (n = 339) of respondents who reported exclusive PHM practice described an intention to take the PHM certifying examination, compared with 20.4% (n = 105) of those practicing PHM and general pediatrics and 17.7% (n = 115) of those practicing PHM and subspeciality pediatrics (P < .001). A total of 82.5% (n = 846) of respondents reported that they were satisfied with the allocation of their professional time; there were no significant differences between those reporting exclusive PHM practice and those reporting PHM in combination with general or subspecialty pediatrics. Of hospitalists reporting exclusive PHM practice, 67.8% (n = 166) reported an intention to maintain more than one ABP certification, compared with 22.1% (n = 78) of those practicing PHM and general pediatrics and 53.9% (n = 230) of those practicing PHM and subspecialty pediatrics (P < .001).
In multivariate regression analyses, hospitalists reporting exclusive PHM practice had significantly greater odds of reported interest in QI leadership or consultation (adjusted odds ratio [OR], 1.39; 95% CI, 1.09-1.79), intention to take the PHM certifying exam (adjusted OR, 7.10; 95% CI, 5.45-9.25), and intention to maintain more than one ABP certification (adjusted OR, 2.64; 95% CI, 1.89-3.68) than those practicing PHM in combination with general or subspecialty pediatrics (Table 3). There was no significant difference across the three groups in the satisfaction with the allocation of professional time.
DISCUSSION
In this national survey of pediatricians seeking MOC from the ABP, 13.1% reported that they practiced hospital medicine, with approximately one-third of these individuals reporting that they practiced PHM exclusively. The distribution of clinical and nonclinical responsibilities differed across those reporting exclusive PHM practice relative to those practicing PHM in combination with general or subspecialty pediatrics. Relative to hospitalists who reported practicing PHM in addition to general or subspecialty care, those reporting exclusive PHM practice were significantly more likely to report an interest in QI leadership or consultation, intention to sit for the PHM board-certification exam, and intention to maintain more than one ABP certification.
These findings offer insight into the evolution of PHM and have important implications for workforce planning. The last nationally representative analysis of the PHM workforce was conducted in 2006, at which time 73% of hospitalists reported working at children’s hospitals.6 In the current analysis, less than 50% of hospitalists reported practicing PHM at children’s hospitals only; 10% reported working at both children’s hospitals and community hospitals and 40% at community hospitals alone. This diffusion of PHM from children’s hospitals into community hospitals represents an important development in the field and aligns with the epidemiology of pediatric hospitalization.10 Pediatric hospitalists who practice at community hospitals experience unique challenges, including a relative paucity of pediatric-specific clinical resources, limited mentorship opportunities and resources for scholarly work, and limited access to data from which to prioritize QI interventions.11,12 Our findings also illustrate that the scope of practice for hospitalists differs at community hospitals relative to children’s hospitals. Although the PHM fellowship curriculum requires training at a community hospital, the requirement is limited to one 4-week block, which may not provide sufficient preparation for the unique clinical responsibilities in this setting.13,14
Relative to past analyses of PHM workforce roles and responsibilities, a substantially greater proportion of respondents in the current study reported clinical responsibility for neonatal care, including more than 40% of those self-reporting practicing PHM exclusively and almost three-quarters of those self-reporting PHM in conjunction with general pediatrics.6,15 Given that more than half of the six million US pediatric hospitalizations that occur each year represent birth hospitalizations,16 pediatric hospitalists’ responsibilities for newborn care are consistent with these patterns of hospital-based care. Expanding hospitalists’ responsibilities to provide newborn care has also been shown to improve the financial performance of PHM programs with relatively low pediatric volumes, which may further explain this finding, particularly at community hospitals.17,18 Interestingly, although emergency department care has also been demonstrated as a model to improve the financial stability of PHM programs, relatively few hospitalists reported this as an area of clinical responsibility.19,20 This finding contrasts with past analyses and may reflect how the scope of PHM clinical responsibilities has changed since these prior studies were conducted.6,15
Because PHM had not been recognized as a subspecialty prior to 2016, a national count of pediatric hospitalists is lacking. In this study, approximately one in eight pediatricians reported that they practiced PHM, but less than 4% of the survey sample reported practicing PHM exclusively. Based on these results, we estimate that of the 76,214 to 89,608 ABP-certified pediatricians currently practicing in the United States, between 9984 and 11,738 would self-identify as practicing PHM, with between 2945 and 3462 reporting exclusive PHM practice.
Hospitalists who reported practicing PHM exclusively were significantly more likely to report an interest in QI leadership or consultation and plans to take the PHM certifying exam. These findings are consistent with PHM’s focus on QI, as articulated in the application to the ABMS for subspecialty status as well as the PHM Core Competencies and fellowship curriculum.4,13,21,22 Despite past research questioning the sustainability of some community- and university-based PHM programs and wide variability in workload,7-9 more than 80% of hospitalists reported satisfaction with the allocation of their professional time, with no significant differences between respondents practicing PHM exclusively or in combination with general or subspecialty care.
This analysis should be interpreted in light of its strengths and limitations. Strengths of this work include its national focus, large sample size, and comprehensive characterization of respondents’ professional roles and characteristics. Study limitations include the fact that respondents were classified as hospitalists based on self-report; we were unable to ascertain if they were classified as hospitalists at their place of employment or if they met the ABP’s eligibility criteria to sit for the PHM subspecialty certifying exam.19 Additionally, respondents self-reported their allocations of clinical and nonclinical time, and we are unable to correlate this with actual work hours. Respondents’ reported interest in QI leadership or consultation may not be correlated with QI effort in practice; the mean time reportedly dedicated to QI activities was quite low. Additionally, two of our outcomes were available only for respondents who enrolled in MOC in 2017, and the proportion practicing medicine-pediatrics was available only in 2018. Although this analysis represents approximately 40% of all pediatricians enrolling in MOC (2 years of the 5-year MOC cycle), it may not be representative of pediatricians who are not certified by the ABP. Finally, our outcomes related to board certification examined interest and intentions; future study will be needed to determine how many pediatricians take the PHM exam and maintain certification.
In conclusion, the field of PHM has evolved considerably since its inception, with pediatric hospitalists reporting diverse clinical and nonclinical responsibilities. Hospitalists practicing PHM exclusively were more likely to report an interest in QI leadership and intent to sit for the PHM certifying exam than those practicing PHM in combination with general pediatrics or another specialty. Continuing to monitor the evolution of PHM roles and responsibilities over time and across settings will be important to support the professional development needs of the PHM workforce.
1. House S, Frintner MP, Leyenaar JK. Factors influencing career longevity in pediatric hospital medicine. Hosp Pediatr. 2019;9(12):983-988. https://doi.org/10.1542/hpeds.2019-0151
2. Leyenaar JK, Frintner MP. Graduating pediatric residents entering the hospital medicine workforce, 2006-2015. Acad Pediatr. 2018;18(2):200-207. https://doi.org/10.1016/j.acap.2017.05.001
3. The American Board of Pediatrics. ABMS approves pediatric hospital medicine certification. November 8, 2016. Accessed October 12, 2021. https://www.abp.org/news/abms-approves-pediatric-hospital-medicine-certification
4. American Board of Medical Specialities. Application for a new subspecialty certificate: pediatric hospital medicine.
5. American Board of Pediatrics. 2019 Annual Report. Accessed October 12, 2021. https://www.abp.org/sites/abp/files/pdf/annual-report-2019.pdf
6. Freed GL, Dunham KM, Research Advisory Committee of the American Board of Pediatrics. Pediatric hospitalists: training, current practice, and career goals. J Hosp Med. 2009;4(3):179-186. https://doi.org/10.1002/jhm.458
7. Alvarez F, McDaniel CE, Birnie K, et al. Community pediatric hospitalist workload: results from a national survey. J Hosp Med. 2019;14(11):682-685. https://doi.org/10.12788/jhm.3263
8. Fromme HB, Chen CO, Fine BR, Gosdin C, Shaughnessy EE. Pediatric hospitalist workload and sustainability in university-based programs: results from a national interview-based survey. J Hosp Med. 2018;13(10):702-705. https://doi.org/10.12788/jhm.2977
9. Gosdin C, Simmons J, Yau C, Sucharew H, Carlson D, Paciorkowski N. Survey of academic pediatric hospitalist programs in the US: organizational, administrative, and financial factors. J Hosp Med. 2013;8(6):285-291. https://doi.org/10.1002/jhm.2020
10. Leyenaar JK, Ralston SL, Shieh MS, Pekow PS, Mangione-Smith R, Lindenauer PK. Epidemiology of pediatric hospitalizations at general hospitals and freestanding children’s hospitals in the United States. J Hosp Med. 2016;11(11):743-749. https://doi.org/10.1002/jhm.2624
11. Leary JC, Walsh KE, Morin RA, Schainker EG, Leyenaar JK. Quality and safety of pediatric inpatient care in community hospitals: a scoping review. J Hosp Med. 2019;14:694-703. https://doi.org/10.12788/jhm.3268
12. Leyenaar JK, Capra LA, O’Brien ER, Leslie LK, Mackie TI. Determinants of career satisfaction among pediatric hospitalists: a qualitative exploration. Acad Pediatr. 2014;14(4):361-368. https://doi.org/10.1016/j.acap.2014.03.015
13. Jerardi KE, Fisher E, Rassbach C, et al. Development of a curricular framework for pediatric hospital medicine fellowships. Pediatrics. 2017;140(1):e20170698. https://doi.org/10.1542/peds.2017-0698
14. ACGME Program Requirements for Graduate Medical Education in Pediatric Hospital Medicine. July 1, 2021. Accessed October 4, 2021.https://www.acgme.org/globalassets/PFAssets/ProgramRequirements/334_PediatricHospitalMedicine_2020.pdf?ver=2020-06-29-163350-910&ver=2020-06-29-163350-910
15. Freed GL, Brzoznowski K, Neighbors K, Lakhani I, American Board of Pediatrics, Research Advisory Committee. Characteristics of the pediatric hospitalist workforce: its roles and work environment. Pediatrics. 2007;120(1):33-39. https://doi.org/10.1542/peds.2007-0304
16. Moore B, Freeman W, Jiang H. Costs of Pediatric Hospital Stays, 2016. Healthcare Cost and Utilization Project Statistical Brief #250. Accessed October 25, 2021. https://www.ncbi.nlm.nih.gov/books/NBK547762/
17. Carlson DW, Fentzke KM, Dawson JG. Pediatric hospitalists: fill varied roles in the care of newborns. Pediatr Ann. 2003;32(12):802-810. https://doi.org/10.3928/0090-4481-20031201-09
18. Tieder JS, Migita DS, Cowan CA, Melzer SM. Newborn care by pediatric hospitalists in a community hospital: effect on physician productivity and financial performance. Arch Pediatr Adolesc Med. 2008;162(1):74-78. https://doi.org/10.1001/archpediatrics.2007.15
19. Krugman SD, Suggs A, Photowala HY, Beck A. Redefining the community pediatric hospitalist: the combined pediatric ED/inpatient unit. Pediatr Emerg Care. 2007;23(1):33-37. https://doi.org/10.1097/01.pec.0000248685.94647.01
20. Dudas RA, Monroe D, McColligan Borger M. Community pediatric hospitalists providing care in the emergency department: an analysis of physician productivity and financial performance. Pediatr Emerg Care. 2011;27(11):1099-1103. https://doi.org/10.1097/PEC.0b013e31823606f5
21. Stucky ER, Ottolini MC, Maniscalco J. Pediatric hospital medicine core competencies: development and methodology. J Hosp Med. 2010;5(6):339-343. https://doi.org/10.1002/jhm.843
22. Maniscalco J, Gage S, Teferi S, Fisher ES. The Pediatric Hospital Medicine Core Competencies: 2020 revision. J Hosp Med. 2020;15(7):389-394. https://doi.org/10.12788/jhm.3391
© 2021 Society of Hospital Medicine
The Effect of Hospital Safety Net Status on the Association Between Bundled Payment Participation and Changes in Medical Episode Outcomes
Bundled payments represent one of the most prominent value-based payment arrangements nationwide. Under this payment approach, hospitals assume responsibility for quality and costs across discrete episodes of care. Hospitals that maintain quality while achieving cost reductions are eligible for financial incentives, whereas those that do not are subject to financial penalties.
To date, the largest completed bundled payment program nationwide is Medicare’s Bundled Payments for Care Improvement (BPCI) initiative. Among four different participation models in BPCI, hospital enrollment was greatest in Model 2, in which episodes spanned from hospitalization through 90 days of post–acute care. The overall results from BPCI Model 2 have been positive: hospitals participating in both common surgical episodes, such as joint replacement surgery, and medical episodes, such as acute myocardial infarction (AMI) and congestive heart failure (CHF), have demonstrated long-term financial savings with stable quality performance.1,2
Safety net hospitals that disproportionately serve low-income patients may fare differently than other hospitals under bundled payment models. At baseline, these hospitals typically have fewer financial resources, which may limit their ability to implement measures to standardize care during hospitalization (eg, clinical pathways) or after discharge (eg, postdischarge programs and other strategies to reduce readmissions).3 Efforts to redesign care may be further complicated by greater clinical complexity and social and structural determinants of health among patients seeking care at safety net hospitals. Given the well-known interactions between social determinants and health conditions, these factors are highly relevant for patients hospitalized at safety net hospitals for acute medical events or exacerbations of chronic conditions.
Existing evidence has shown that safety net hospitals have not performed as well as other hospitals in other value-based reforms.4-8 In the context of bundled payments for joint replacement surgery, safety net hospitals have been less likely to achieve financial savings but more likely to receive penalties.9-11 Moreover, the savings achieved by safety net hospitals have been smaller than those achieved by non–safety net hospitals.12
Despite these concerning findings, there are few data about how safety net hospitals have fared under bundled payments for common medical conditions. To address this critical knowledge gap, we evaluated the effect of hospital safety net status on the association between BPCI Model 2 participation and changes in outcomes for medical condition episodes.
METHODS
This study was approved by the University of Pennsylvania Institutional Review Board with a waiver of informed consent.
Data
We used 100% Medicare claims data from 2011 to 2016 for patients receiving care at hospitals participating in BPCI Model 2 for one of four common medical condition episodes: AMI, pneumonia, CHF, and chronic obstructive pulmonary disease (COPD). A 20% random national sample was used for patients hospitalized at nonparticipant hospitals. Publicly available data from the Centers for Medicare & Medicaid Services (CMS) were used to identify hospital enrollment in BPCI Model 2, while data from the 2017 CMS Impact File were used to quantify each hospital’s disproportionate patient percentage (DPP), which reflects the proportion of Medicaid and low-income Medicare beneficiaries served and determines a hospital’s eligibility to earn disproportionate share hospital payments.
Data from the 2011 American Hospital Association Annual Survey were used to capture hospital characteristics, such as number of beds, teaching status, and profit status, while data from the Medicare provider of service, beneficiary summary, and accountable care organization files were used to capture additional hospital characteristics and market characteristics, such as population size and Medicare Advantage penetration. The Medicare Provider Enrollment, Chain, and Ownership System file was used to identify and remove BPCI episodes from physician group practices. State-level data about area deprivation index—a census tract–based measure that incorporates factors such as income, education, employment, and housing quality to describe socioeconomic disadvantage among neighborhoods—were used to define socioeconomically disadvantaged areas as those in the top 20% of area deprivation index statewide.13 Markets were defined using hospital referral regions.14
Study Periods and Hospital Groups
Our analysis spanned the period between January 1, 2011, and December 31, 2016. We separated this period into a baseline period (January 2011–September 2013) prior to the start of BPCI and a subsequent BPCI period (October 2013–December 2016).
We defined any hospitals participating in BPCI Model 2 across this period for any of the four included medical condition episodes as BPCI hospitals. Because hospitals were able to enter or exit BPCI over time, and enrollment data were provided by CMS as quarterly participation files, we were able to identify dates of entry into or exit from BPCI over time by hospital-condition pairs. Hospitals were considered BPCI hospitals until the end of the study period, regardless of subsequent exit.
We defined non-BPCI hospitals as those that never participated in the program and had 10 or more admissions in the BPCI period for the included medical condition episodes. We used this approach to minimize potential bias arising from BPCI entry and exit over time.
Across both BPCI and non-BPCI hospital groups, we followed prior methods and defined safety net hospitals based on a hospital’s DPP.15 Specifically, safety net hospitals were those in the top quartile of DPP among all hospitals nationwide, and hospitals in the other three quartiles were defined as non–safety net hospitals.9,12
Study Sample and Episode Construction
Our study sample included Medicare fee-for-service beneficiaries admitted to BPCI and non-BPCI hospitals for any of the four medical conditions of interest. We adhered to BPCI program rules, which defined each episode type based on a set of Medicare Severity Diagnosis Related Group (MS-DRG) codes (eg, myocardial infarction episodes were defined as MS-DRGs 280-282). From this sample, we excluded beneficiaries with end-stage renal disease or insurance coverage through Medicare Advantage, as well as beneficiaries who died during the index hospital admission, had any non–Inpatient Prospective Payment System claims, or lacked continuous primary Medicare fee-for-service coverage either during the episode or in the 12 months preceding it.
We constructed 90-day medical condition episodes that began with hospital admission and spanned 90 days after hospital discharge. To avoid bias arising from CMS rules related to precedence (rules for handling how overlapping episodes are assigned to hospitals), we followed prior methods and constructed naturally occurring episodes by assigning overlapping ones to the earlier hospital admission.2,16 From this set of episodes, we identified those for AMI, CHF, COPD, and pneumonia.
Exposure and Covariate Variables
Our study exposure was the interaction between hospital safety net status and hospital BPCI participation, which captured whether the association between BPCI participation and outcomes varied by safety net status (eg, whether differential changes in an outcome related to BPCI participation were different for safety net and non–safety net hospitals in the program). BPCI participation was defined using a time-varying indicator of BPCI participation to distinguish between episodes occurring under the program (ie, after a hospital began participating) or before participation in it. Covariates were chosen based on prior studies and included patient variables such as age, sex, Elixhauser comorbidities, frailty, and Medicare/Medicaid dual-eligibility status.17-23 Additionally, our analysis included market variables such as population size and Medicare Advantage penetration.
Outcome Variables
The prespecified primary study outcome was standardized 90-day postdischarge spending. This outcome was chosen owing to the lack of variation in standardized index hospitalization spending given the MS-DRG system and prior work suggesting that bundled payment participants instead targeted changes to postdischarge utilization and spending.2 Secondary outcomes included 90-day unplanned readmission rates, 90-day postdischarge mortality rates, discharge to institutional post–acute care providers (defined as either skilled nursing facilities [SNFs] or inpatient rehabilitation facilities), discharge home with home health agency services, and—among patients discharged to SNFs—SNF length of stay (LOS), measured in number of days.
Statistical Analysis
We described the characteristics of patients and hospitals in our samples. In adjusted analyses, we used a series of difference-in-differences (DID) generalized linear models to conduct a heterogeneity analysis evaluating whether the relationship between hospital BPCI participation and medical condition episode outcomes varied based on hospital safety net status.
In these models, the DID estimator was a time-varying indicator of hospital BPCI participation (equal to 1 for episodes occurring during the BPCI period at BPCI hospitals after they initiated participation; 0 otherwise) together with hospital and quarter-time fixed effects. To examine differences in the association between BPCI and episode outcomes by hospital safety net status—that is, whether there was heterogeneity in the outcome changes between safety net and non–safety net hospitals participating in BPCI—our models also included an interaction term between hospital safety net status and the time-varying BPCI participation term (Appendix Methods). In this approach, BPCI safety net and BPCI non–safety net hospitals were compared with non-BPCI hospitals as the comparison group. The comparisons were chosen to yield the most policy-salient findings, since Medicare evaluated hospitals in BPCI, whether safety net or not, by comparing their performance to nonparticipating hospitals, whether safety net or not.
All models controlled for patient and time-varying market characteristics and included hospital fixed effects (to account for time-invariant hospital market characteristics) and MS-DRG fixed effects. All outcomes were evaluated using models with identity links and normal distributions (ie, ordinary least squares). These variables and models were applied to data from the baseline period to examine consistency with the parallel trends assumption. Overall, Wald tests did not indicate divergent baseline period trends in outcomes between BPCI and non-BPCI hospitals (Appendix Figure 1) or BPCI safety net versus BPCI non–safety net hospitals (Appendix Figure 2).
We conducted sensitivity analyses to evaluate the robustness of our results. First, instead of comparing differential changes at BPCI safety net vs BPCI non–safety net hospitals (ie, evaluating safety net status among BPCI hospitals), we evaluated changes at BPCI safety net vs non-BPCI safety net hospitals compared with changes at BPCI non–safety net vs non-BPCI non–safety net hospitals (ie, marginal differences in the changes associated with BPCI participation among safety net vs non–safety net hospitals). Because safety net hospitals in BPCI were compared with nonparticipating safety net hospitals, and non–safety net hospitals in BPCI were compared with nonparticipating non–safety net hospitals, this set of analyses helped address potential concerns about unobservable differences between safety net and non–safety net organizations and their potential impact on our findings.
Second, we used an alternative, BPCI-specific definition for safety net hospitals: instead of defining safety net status based on all hospitals nationwide, we defined it only among BPCI hospitals (safety net hospitals defined as those in the top quartile of DPP among all BPCI hospitals) and non-BPCI hospitals (safety net hospitals defined as those in the top quartile of DPP among all non-BPCI hospitals). Third, we repeated our main analyses using models with standard errors clustered at the hospital level and without hospital fixed effects. Fourth, we repeated analysis using models with alternative nonlinear link functions and outcome distributions and without hospital fixed effects.
Statistical tests were two-tailed and considered significant at α = .05 for the primary outcome. Statistical analyses were conducted using SAS 9.4 (SAS Institute, Inc.).
RESULTS
Our sample consisted of 3066 hospitals nationwide that collectively provided medical condition episode care to a total of 1,611,848 Medicare fee-for-service beneficiaries. This sample included 238 BPCI hospitals and 2769 non-BPCI hospitals (Table 1, Appendix Table 1).
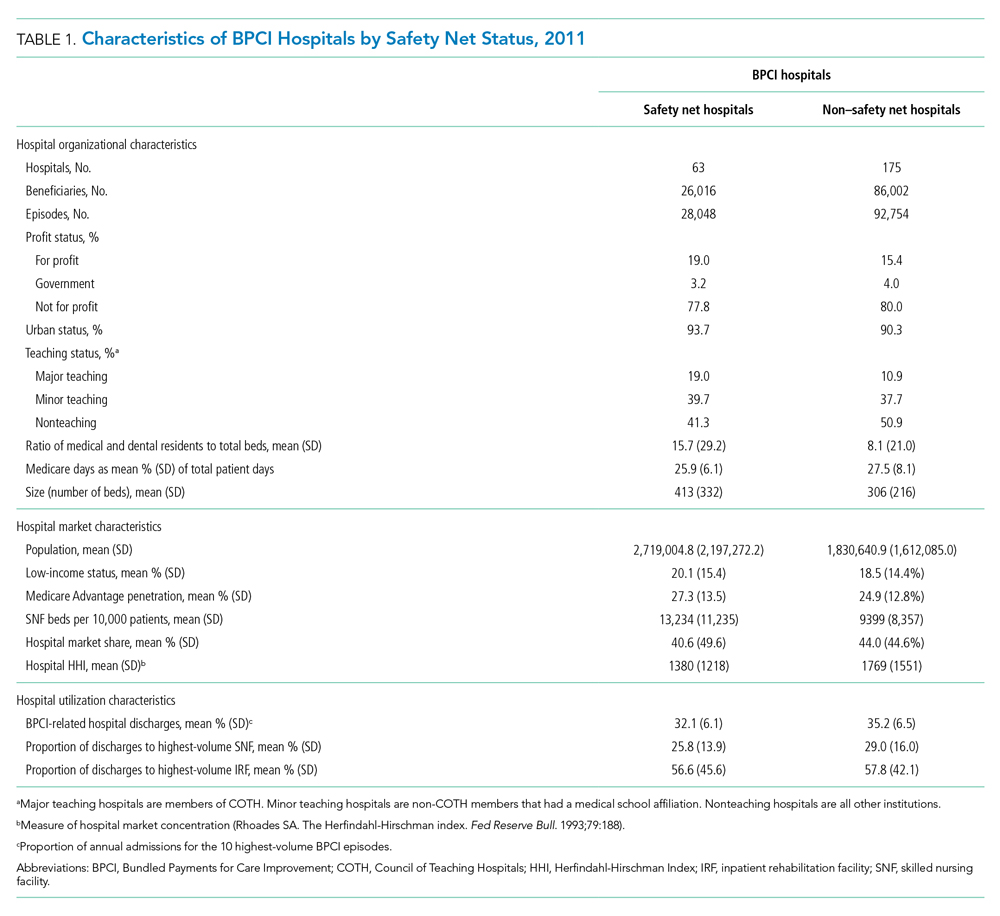
Among BPCI hospitals, 63 were safety net and 175 were non–safety net hospitals. Compared with non–safety net hospitals, safety net hospitals tended to be larger and were more likely to be urban teaching hospitals. Safety net hospitals also tended to be located in areas with larger populations, more low-income individuals, and greater Medicare Advantage penetration.
In both the baseline and BPCI periods, there were differences in several characteristics for patients admitted to safety net vs non–safety net hospitals (Table 2; Appendix Table 2). Among BPCI hospitals, in both periods, patients admitted at safety net hospitals were younger and more likely to be Black, be Medicare/Medicaid dual eligible, and report having a disability than patients admitted to non–safety net hospitals. Patients admitted to safety net hospitals were also more likely to reside in socioeconomically disadvantaged areas.
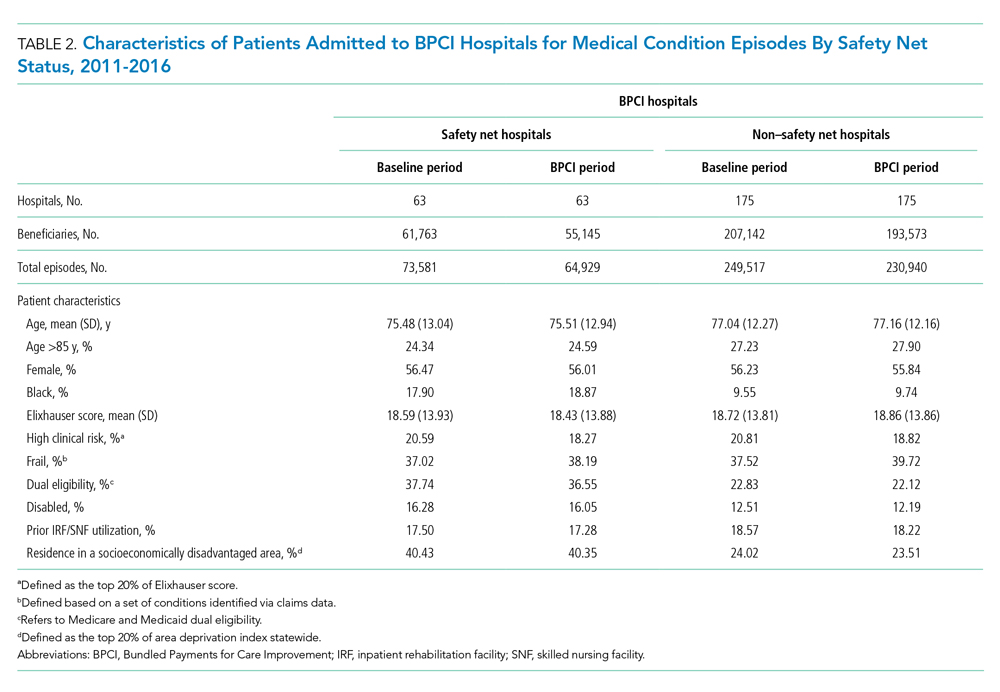
Safety Net Status Among BPCI Hospitals
In the baseline period (Appendix Table 3), postdischarge spending was slightly greater among patients admitted to BPCI safety net hospitals ($18,817) than those admitted to BPCI non–safety net hospitals ($18,335). There were also small differences in secondary outcomes between the BPCI safety net and non−safety net groups.
In adjusted analyses evaluating heterogeneity in the effect of BPCI participation between safety net and non–safety net hospitals (Figure 1), differential changes in postdischarge spending between baseline and BPCI participation periods did not differ between safety net and non–safety net hospitals participating in BPCI (aDID, $40; 95% CI, –$254 to $335; P = .79). 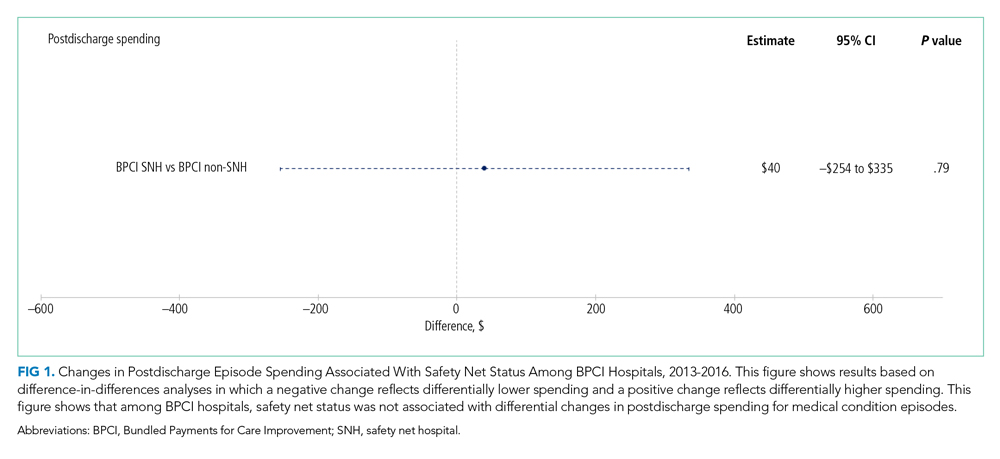

Sensitivity Analysis
Analyses of BPCI participation among safety net vs non–safety net hospitals nationwide yielded results that were similar to those from our main analyses (Appendix Figures 4, 5, and 6). Compared with BPCI participation among non–safety net hospitals, participation among safety net hospitals was associated with a differential increase from baseline to BPCI periods in discharge to institutional post–acute care providers (aDID, 1.07 percentage points; 95% CI, 0.47-1.67 percentage points; P < .001), but no differential changes between baseline and BPCI periods in postdischarge spending (aDID, –$199;95% CI, –$461 to $63; P = .14), SNF LOS (aDID, –0.22 days; 95% CI, –0.54 to 0.09 days; P = .16), or other secondary outcomes.
Replicating our main analyses using an alternative, BPCI-specific definition of safety net hospitals yielded similar results overall (Appendix Table 4; Appendix Figures 7, 8, and 9). There were no differential changes between baseline and BPCI periods in postdischarge spending between BPCI safety net and BPCI non–safety net hospitals (aDID, $111; 95% CI, –$189 to $411; P = .47). Results for secondary outcomes were also qualitatively similar to results from main analyses, with the exception that among BPCI hospitals, safety net hospitals had a differentially higher SNF LOS than non–safety net hospitals between baseline and BPCI periods (aDID, 0.38 days; 95% CI, 0.02-0.74 days; P = .04).
Compared with results from our main analysis, findings were qualitatively similar overall in analyses using models with hospital-clustered standard errors and without hospital fixed effects (Appendix Figures 10, 11, and 12) as well as models with alternative link functions and outcome distributions and without hospital fixed effects (Appendix Figures 13, 14, and 15).
Discussion
This analysis builds on prior work by evaluating how hospital safety net status affected the known association between bundled payment participation and decreased spending and stable quality for medical condition episodes. Although safety net status did not appear to affect those relationships, it did affect the relationship between participation and post–acute care utilization. These results have three main implications.
First, our results suggest that policymakers should continue engaging safety net hospitals in medical condition bundled payments while monitoring for unintended consequences. Our findings with regard to spending provide some reassurance that safety net hospitals can potentially achieve savings while maintaining quality under bundled payments, similar to other types of hospitals. However, the differences in patient populations and post–acute care utilization patterns suggest that policymakers should continue to carefully monitor for disparities based on hospital safety net status and consider implementing measures that have been used in other payment reforms to support safety net organizations. Such measures could involve providing customized technical assistance or evaluating performance using “peer groups” that compare performance among safety net hospitals alone rather than among all hospitals.24,25
Second, our findings underscore potential challenges that safety net hospitals may face when attempting to redesign care. For instance, among hospitals accepting bundled payments for medical conditions, successful strategies in BPCI have often included maintaining the proportion of patients discharged to institutional post–acute care providers while reducing SNF LOS.2 However, in our study, discharge to institutional post–acute care providers actually increased among safety net hospitals relative to other hospitals while SNF LOS did not decrease. Additionally, while other hospitals in bundled payments have exhibited differentially greater discharge home with home health services, we found that safety net hospitals did not. These represent areas for future work, particularly because little is known about how safety net hospitals coordinate post–acute care (eg, the extent to which safety net hospitals integrate with post–acute care providers or coordinate home-based care for vulnerable patient populations).
Third, study results offer insight into potential challenges to practice changes. Compared with other hospitals, safety net hospitals in our analysis provided medical condition episode care to more Black, Medicare/Medicaid dual-eligible, and disabled patients, as well as individuals living in socioeconomically disadvantaged areas. Collectively, these groups may face more challenging socioeconomic circumstances or existing disparities. The combination of these factors and limited financial resources at safety net hospitals could complicate their ability to manage transitions of care after hospitalization by shifting discharge away from high-intensity institutional post–acute care facilities.
Our analysis has limitations. First, given the observational study design, findings are subject to residual confounding and selection bias. For instance, findings related to post–acute care utilization could have been influenced by unobservable changes in market supply and other factors. However, we mitigated these risks using a quasi-experimental methodology that also directly accounted for multiple patient, hospital, and market characteristics and also used fixed effects to account for unobserved heterogeneity. Second, in studying BPCI Model 2, we evaluated one model within one bundled payment program. However, BPCI Model 2 encompassed a wide range of medical conditions, and both this scope and program design have served as the direct basis for subsequent bundled payment models, such as the ongoing BPCI Advanced and other forthcoming programs.26 Third, while our analysis evaluated multiple aspects of patient complexity, individuals may be “high risk” owing to several clinical and social determinants. Future work should evaluate different features of patient risk and how they affect outcomes under payment models such as bundled payments.
CONCLUSION
Safety net status appeared to affect the relationship between bundled payment participation and post–acute care utilization, but not episode spending. These findings suggest that policymakers could support safety net hospitals within bundled payment programs and consider safety net status when evaluating them.
1. Navathe AS, Emanuel EJ, Venkataramani AS, et al. Spending and quality after three years of Medicare’s voluntary bundled payment for joint replacement surgery. Health Aff (Millwood). 2020;39(1):58-66. https://doi.org/10.1377/hlthaff.2019.00466
2. Rolnick JA, Liao JM, Emanuel EJ, et al. Spending and quality after three years of Medicare’s bundled payments for medical conditions: quasi-experimental difference-in-differences study. BMJ. 2020;369:m1780. https://doi.org/10.1136/bmj.m1780
3. Figueroa JF, Joynt KE, Zhou X, Orav EJ, Jha AK. Safety-net hospitals face more barriers yet use fewer strategies to reduce readmissions. Med Care. 2017;55(3):229-235. https://doi.org/10.1097/MLR.0000000000000687
4. Werner RM, Goldman LE, Dudley RA. Comparison of change in quality of care between safety-net and non–safety-net hospitals. JAMA. 2008;299(18):2180-2187. https://doi/org/10.1001/jama.299.18.2180
5. Ross JS, Bernheim SM, Lin Z, et al. Based on key measures, care quality for Medicare enrollees at safety-net and non–safety-net hospitals was almost equal. Health Aff (Millwood). 2012;31(8):1739-1748. https://doi.org/10.1377/hlthaff.2011.1028
6. Gilman M, Adams EK, Hockenberry JM, Milstein AS, Wilson IB, Becker ER. Safety-net hospitals more likely than other hospitals to fare poorly under Medicare’s value-based purchasing. Health Aff (Millwood). 2015;34(3):398-405. https://doi.org/10.1377/hlthaff.2014.1059
7. Joynt KE, Jha AK. Characteristics of hospitals receiving penalties under the Hospital Readmissions Reduction Program. JAMA. 2013;309(4):342-343. https://doi.org/10.1001/jama.2012.94856
8. Rajaram R, Chung JW, Kinnier CV, et al. Hospital characteristics associated with penalties in the Centers for Medicare & Medicaid Services Hospital-Acquired Condition Reduction Program. JAMA. 2015;314(4):375-383. https://doi.org/10.1001/jama.2015.8609
9. Navathe AS, Liao JM, Shah Y, et al. Characteristics of hospitals earning savings in the first year of mandatory bundled payment for hip and knee surgery. JAMA. 2018;319(9):930-932. https://doi.org/10.1001/jama.2018.0678
10. Thirukumaran CP, Glance LG, Cai X, Balkissoon R, Mesfin A, Li Y. Performance of safety-net hospitals in year 1 of the Comprehensive Care for Joint Replacement Model. Health Aff (Millwood). 2019;38(2):190-196. https://doi.org/10.1377/hlthaff.2018.05264
11. Thirukumaran CP, Glance LG, Cai X, Kim Y, Li Y. Penalties and rewards for safety net vs non–safety net hospitals in the first 2 years of the Comprehensive Care for Joint Replacement Model. JAMA. 2019;321(20):2027-2030. https://doi.org/10.1001/jama.2019.5118
12. Kim H, Grunditz JI, Meath THA, Quiñones AR, Ibrahim SA, McConnell KJ. Level of reconciliation payments by safety-net hospital status under the first year of the Comprehensive Care for Joint Replacement Program. JAMA Surg. 2019;154(2):178-179. https://doi.org/10.1001/jamasurg.2018.3098
13. Department of Medicine, University of Wisconsin School of Medicine and Public Health. Neighborhood Atlas. Accessed March 1, 2021. https://www.neighborhoodatlas.medicine.wisc.edu/
14. Dartmouth Atlas Project. The Dartmouth Atlas of Health Care. Accessed March 1, 2021. https://www.dartmouthatlas.org/
15. Chatterjee P, Joynt KE, Orav EJ, Jha AK. Patient experience in safety-net hospitals: implications for improving care and value-based purchasing. Arch Intern Med. 2012;172(16):1204-1210. https://doi.org/10.1001/archinternmed.2012.3158
16. Rolnick JA, Liao JM, Navathe AS. Programme design matters—lessons from bundled payments in the US. June 17, 2020. Accessed March 1, 2021. https://blogs.bmj.com/bmj/2020/06/17/programme-design-matters-lessons-from-bundled-payments-in-the-us
17. Dummit LA, Kahvecioglu D, Marrufo G, et al. Association between hospital participation in a Medicare bundled payment initiative and payments and quality outcomes for lower extremity joint replacement episodes. JAMA. 2016;316(12):1267-1278. https://doi.org/10.1001/jama.2016.12717
18. Navathe AS, Liao JM, Dykstra SE, et al. Association of hospital participation in a Medicare bundled payment program with volume and case mix of lower extremity joint replacement episodes. JAMA. 2018;320(9):901-910. https://doi.org/10.1001/jama.2018.12345
19. Joynt Maddox KE, Orav EJ, Zheng J, Epstein AM. Evaluation of Medicare’s bundled payments initiative for medical conditions. N Engl J Med. 2018;379(3):260-269. https://doi.org/10.1056/NEJMsa1801569
20. Navathe AS, Emanuel EJ, Venkataramani AS, et al. Spending and quality after three years of Medicare’s voluntary bundled payment for joint replacement surgery. Health Aff (Millwood). 2020;39(1):58-66. https://doi.org/10.1377/hlthaff.2019.00466
21. Liao JM, Emanuel EJ, Venkataramani AS, et al. Association of bundled payments for joint replacement surgery and patient outcomes with simultaneous hospital participation in accountable care organizations. JAMA Netw Open. 2019;2(9):e1912270. https://doi.org/10.1001/jamanetworkopen.2019.12270
22. Kim DH, Schneeweiss S. Measuring frailty using claims data for pharmacoepidemiologic studies of mortality in older adults: evidence and recommendations. Pharmacoepidemiol Drug Saf. 2014;23(9):891-901. https://doi.org/10.1002/pds.3674
23. Joynt KE, Figueroa JF, Beaulieu N, Wild RC, Orav EJ, Jha AK. Segmenting high-cost Medicare patients into potentially actionable cohorts. Healthc (Amst). 2017;5(1-2):62-67. https://doi.org/10.1016/j.hjdsi.2016.11.002
24. Quality Payment Program. Small, underserved, and rural practices. Accessed March 1, 2021. https://qpp.cms.gov/about/small-underserved-rural-practices
25. McCarthy CP, Vaduganathan M, Patel KV, et al. Association of the new peer group–stratified method with the reclassification of penalty status in the Hospital Readmission Reduction Program. JAMA Netw Open. 2019;2(4):e192987. https://doi.org/10.1001/jamanetworkopen.2019.2987
26. Centers for Medicare & Medicaid Services. BPCI Advanced. Updated September 16, 2021. Accessed October 18, 2021. https://innovation.cms.gov/innovation-models/bpci-advanced
Bundled payments represent one of the most prominent value-based payment arrangements nationwide. Under this payment approach, hospitals assume responsibility for quality and costs across discrete episodes of care. Hospitals that maintain quality while achieving cost reductions are eligible for financial incentives, whereas those that do not are subject to financial penalties.
To date, the largest completed bundled payment program nationwide is Medicare’s Bundled Payments for Care Improvement (BPCI) initiative. Among four different participation models in BPCI, hospital enrollment was greatest in Model 2, in which episodes spanned from hospitalization through 90 days of post–acute care. The overall results from BPCI Model 2 have been positive: hospitals participating in both common surgical episodes, such as joint replacement surgery, and medical episodes, such as acute myocardial infarction (AMI) and congestive heart failure (CHF), have demonstrated long-term financial savings with stable quality performance.1,2
Safety net hospitals that disproportionately serve low-income patients may fare differently than other hospitals under bundled payment models. At baseline, these hospitals typically have fewer financial resources, which may limit their ability to implement measures to standardize care during hospitalization (eg, clinical pathways) or after discharge (eg, postdischarge programs and other strategies to reduce readmissions).3 Efforts to redesign care may be further complicated by greater clinical complexity and social and structural determinants of health among patients seeking care at safety net hospitals. Given the well-known interactions between social determinants and health conditions, these factors are highly relevant for patients hospitalized at safety net hospitals for acute medical events or exacerbations of chronic conditions.
Existing evidence has shown that safety net hospitals have not performed as well as other hospitals in other value-based reforms.4-8 In the context of bundled payments for joint replacement surgery, safety net hospitals have been less likely to achieve financial savings but more likely to receive penalties.9-11 Moreover, the savings achieved by safety net hospitals have been smaller than those achieved by non–safety net hospitals.12
Despite these concerning findings, there are few data about how safety net hospitals have fared under bundled payments for common medical conditions. To address this critical knowledge gap, we evaluated the effect of hospital safety net status on the association between BPCI Model 2 participation and changes in outcomes for medical condition episodes.
METHODS
This study was approved by the University of Pennsylvania Institutional Review Board with a waiver of informed consent.
Data
We used 100% Medicare claims data from 2011 to 2016 for patients receiving care at hospitals participating in BPCI Model 2 for one of four common medical condition episodes: AMI, pneumonia, CHF, and chronic obstructive pulmonary disease (COPD). A 20% random national sample was used for patients hospitalized at nonparticipant hospitals. Publicly available data from the Centers for Medicare & Medicaid Services (CMS) were used to identify hospital enrollment in BPCI Model 2, while data from the 2017 CMS Impact File were used to quantify each hospital’s disproportionate patient percentage (DPP), which reflects the proportion of Medicaid and low-income Medicare beneficiaries served and determines a hospital’s eligibility to earn disproportionate share hospital payments.
Data from the 2011 American Hospital Association Annual Survey were used to capture hospital characteristics, such as number of beds, teaching status, and profit status, while data from the Medicare provider of service, beneficiary summary, and accountable care organization files were used to capture additional hospital characteristics and market characteristics, such as population size and Medicare Advantage penetration. The Medicare Provider Enrollment, Chain, and Ownership System file was used to identify and remove BPCI episodes from physician group practices. State-level data about area deprivation index—a census tract–based measure that incorporates factors such as income, education, employment, and housing quality to describe socioeconomic disadvantage among neighborhoods—were used to define socioeconomically disadvantaged areas as those in the top 20% of area deprivation index statewide.13 Markets were defined using hospital referral regions.14
Study Periods and Hospital Groups
Our analysis spanned the period between January 1, 2011, and December 31, 2016. We separated this period into a baseline period (January 2011–September 2013) prior to the start of BPCI and a subsequent BPCI period (October 2013–December 2016).
We defined any hospitals participating in BPCI Model 2 across this period for any of the four included medical condition episodes as BPCI hospitals. Because hospitals were able to enter or exit BPCI over time, and enrollment data were provided by CMS as quarterly participation files, we were able to identify dates of entry into or exit from BPCI over time by hospital-condition pairs. Hospitals were considered BPCI hospitals until the end of the study period, regardless of subsequent exit.
We defined non-BPCI hospitals as those that never participated in the program and had 10 or more admissions in the BPCI period for the included medical condition episodes. We used this approach to minimize potential bias arising from BPCI entry and exit over time.
Across both BPCI and non-BPCI hospital groups, we followed prior methods and defined safety net hospitals based on a hospital’s DPP.15 Specifically, safety net hospitals were those in the top quartile of DPP among all hospitals nationwide, and hospitals in the other three quartiles were defined as non–safety net hospitals.9,12
Study Sample and Episode Construction
Our study sample included Medicare fee-for-service beneficiaries admitted to BPCI and non-BPCI hospitals for any of the four medical conditions of interest. We adhered to BPCI program rules, which defined each episode type based on a set of Medicare Severity Diagnosis Related Group (MS-DRG) codes (eg, myocardial infarction episodes were defined as MS-DRGs 280-282). From this sample, we excluded beneficiaries with end-stage renal disease or insurance coverage through Medicare Advantage, as well as beneficiaries who died during the index hospital admission, had any non–Inpatient Prospective Payment System claims, or lacked continuous primary Medicare fee-for-service coverage either during the episode or in the 12 months preceding it.
We constructed 90-day medical condition episodes that began with hospital admission and spanned 90 days after hospital discharge. To avoid bias arising from CMS rules related to precedence (rules for handling how overlapping episodes are assigned to hospitals), we followed prior methods and constructed naturally occurring episodes by assigning overlapping ones to the earlier hospital admission.2,16 From this set of episodes, we identified those for AMI, CHF, COPD, and pneumonia.
Exposure and Covariate Variables
Our study exposure was the interaction between hospital safety net status and hospital BPCI participation, which captured whether the association between BPCI participation and outcomes varied by safety net status (eg, whether differential changes in an outcome related to BPCI participation were different for safety net and non–safety net hospitals in the program). BPCI participation was defined using a time-varying indicator of BPCI participation to distinguish between episodes occurring under the program (ie, after a hospital began participating) or before participation in it. Covariates were chosen based on prior studies and included patient variables such as age, sex, Elixhauser comorbidities, frailty, and Medicare/Medicaid dual-eligibility status.17-23 Additionally, our analysis included market variables such as population size and Medicare Advantage penetration.
Outcome Variables
The prespecified primary study outcome was standardized 90-day postdischarge spending. This outcome was chosen owing to the lack of variation in standardized index hospitalization spending given the MS-DRG system and prior work suggesting that bundled payment participants instead targeted changes to postdischarge utilization and spending.2 Secondary outcomes included 90-day unplanned readmission rates, 90-day postdischarge mortality rates, discharge to institutional post–acute care providers (defined as either skilled nursing facilities [SNFs] or inpatient rehabilitation facilities), discharge home with home health agency services, and—among patients discharged to SNFs—SNF length of stay (LOS), measured in number of days.
Statistical Analysis
We described the characteristics of patients and hospitals in our samples. In adjusted analyses, we used a series of difference-in-differences (DID) generalized linear models to conduct a heterogeneity analysis evaluating whether the relationship between hospital BPCI participation and medical condition episode outcomes varied based on hospital safety net status.
In these models, the DID estimator was a time-varying indicator of hospital BPCI participation (equal to 1 for episodes occurring during the BPCI period at BPCI hospitals after they initiated participation; 0 otherwise) together with hospital and quarter-time fixed effects. To examine differences in the association between BPCI and episode outcomes by hospital safety net status—that is, whether there was heterogeneity in the outcome changes between safety net and non–safety net hospitals participating in BPCI—our models also included an interaction term between hospital safety net status and the time-varying BPCI participation term (Appendix Methods). In this approach, BPCI safety net and BPCI non–safety net hospitals were compared with non-BPCI hospitals as the comparison group. The comparisons were chosen to yield the most policy-salient findings, since Medicare evaluated hospitals in BPCI, whether safety net or not, by comparing their performance to nonparticipating hospitals, whether safety net or not.
All models controlled for patient and time-varying market characteristics and included hospital fixed effects (to account for time-invariant hospital market characteristics) and MS-DRG fixed effects. All outcomes were evaluated using models with identity links and normal distributions (ie, ordinary least squares). These variables and models were applied to data from the baseline period to examine consistency with the parallel trends assumption. Overall, Wald tests did not indicate divergent baseline period trends in outcomes between BPCI and non-BPCI hospitals (Appendix Figure 1) or BPCI safety net versus BPCI non–safety net hospitals (Appendix Figure 2).
We conducted sensitivity analyses to evaluate the robustness of our results. First, instead of comparing differential changes at BPCI safety net vs BPCI non–safety net hospitals (ie, evaluating safety net status among BPCI hospitals), we evaluated changes at BPCI safety net vs non-BPCI safety net hospitals compared with changes at BPCI non–safety net vs non-BPCI non–safety net hospitals (ie, marginal differences in the changes associated with BPCI participation among safety net vs non–safety net hospitals). Because safety net hospitals in BPCI were compared with nonparticipating safety net hospitals, and non–safety net hospitals in BPCI were compared with nonparticipating non–safety net hospitals, this set of analyses helped address potential concerns about unobservable differences between safety net and non–safety net organizations and their potential impact on our findings.
Second, we used an alternative, BPCI-specific definition for safety net hospitals: instead of defining safety net status based on all hospitals nationwide, we defined it only among BPCI hospitals (safety net hospitals defined as those in the top quartile of DPP among all BPCI hospitals) and non-BPCI hospitals (safety net hospitals defined as those in the top quartile of DPP among all non-BPCI hospitals). Third, we repeated our main analyses using models with standard errors clustered at the hospital level and without hospital fixed effects. Fourth, we repeated analysis using models with alternative nonlinear link functions and outcome distributions and without hospital fixed effects.
Statistical tests were two-tailed and considered significant at α = .05 for the primary outcome. Statistical analyses were conducted using SAS 9.4 (SAS Institute, Inc.).
RESULTS
Our sample consisted of 3066 hospitals nationwide that collectively provided medical condition episode care to a total of 1,611,848 Medicare fee-for-service beneficiaries. This sample included 238 BPCI hospitals and 2769 non-BPCI hospitals (Table 1, Appendix Table 1).
Among BPCI hospitals, 63 were safety net and 175 were non–safety net hospitals. Compared with non–safety net hospitals, safety net hospitals tended to be larger and were more likely to be urban teaching hospitals. Safety net hospitals also tended to be located in areas with larger populations, more low-income individuals, and greater Medicare Advantage penetration.
In both the baseline and BPCI periods, there were differences in several characteristics for patients admitted to safety net vs non–safety net hospitals (Table 2; Appendix Table 2). Among BPCI hospitals, in both periods, patients admitted at safety net hospitals were younger and more likely to be Black, be Medicare/Medicaid dual eligible, and report having a disability than patients admitted to non–safety net hospitals. Patients admitted to safety net hospitals were also more likely to reside in socioeconomically disadvantaged areas.
Safety Net Status Among BPCI Hospitals
In the baseline period (Appendix Table 3), postdischarge spending was slightly greater among patients admitted to BPCI safety net hospitals ($18,817) than those admitted to BPCI non–safety net hospitals ($18,335). There were also small differences in secondary outcomes between the BPCI safety net and non−safety net groups.
In adjusted analyses evaluating heterogeneity in the effect of BPCI participation between safety net and non–safety net hospitals (Figure 1), differential changes in postdischarge spending between baseline and BPCI participation periods did not differ between safety net and non–safety net hospitals participating in BPCI (aDID, $40; 95% CI, –$254 to $335; P = .79).
Sensitivity Analysis
Analyses of BPCI participation among safety net vs non–safety net hospitals nationwide yielded results that were similar to those from our main analyses (Appendix Figures 4, 5, and 6). Compared with BPCI participation among non–safety net hospitals, participation among safety net hospitals was associated with a differential increase from baseline to BPCI periods in discharge to institutional post–acute care providers (aDID, 1.07 percentage points; 95% CI, 0.47-1.67 percentage points; P < .001), but no differential changes between baseline and BPCI periods in postdischarge spending (aDID, –$199;95% CI, –$461 to $63; P = .14), SNF LOS (aDID, –0.22 days; 95% CI, –0.54 to 0.09 days; P = .16), or other secondary outcomes.
Replicating our main analyses using an alternative, BPCI-specific definition of safety net hospitals yielded similar results overall (Appendix Table 4; Appendix Figures 7, 8, and 9). There were no differential changes between baseline and BPCI periods in postdischarge spending between BPCI safety net and BPCI non–safety net hospitals (aDID, $111; 95% CI, –$189 to $411; P = .47). Results for secondary outcomes were also qualitatively similar to results from main analyses, with the exception that among BPCI hospitals, safety net hospitals had a differentially higher SNF LOS than non–safety net hospitals between baseline and BPCI periods (aDID, 0.38 days; 95% CI, 0.02-0.74 days; P = .04).
Compared with results from our main analysis, findings were qualitatively similar overall in analyses using models with hospital-clustered standard errors and without hospital fixed effects (Appendix Figures 10, 11, and 12) as well as models with alternative link functions and outcome distributions and without hospital fixed effects (Appendix Figures 13, 14, and 15).
Discussion
This analysis builds on prior work by evaluating how hospital safety net status affected the known association between bundled payment participation and decreased spending and stable quality for medical condition episodes. Although safety net status did not appear to affect those relationships, it did affect the relationship between participation and post–acute care utilization. These results have three main implications.
First, our results suggest that policymakers should continue engaging safety net hospitals in medical condition bundled payments while monitoring for unintended consequences. Our findings with regard to spending provide some reassurance that safety net hospitals can potentially achieve savings while maintaining quality under bundled payments, similar to other types of hospitals. However, the differences in patient populations and post–acute care utilization patterns suggest that policymakers should continue to carefully monitor for disparities based on hospital safety net status and consider implementing measures that have been used in other payment reforms to support safety net organizations. Such measures could involve providing customized technical assistance or evaluating performance using “peer groups” that compare performance among safety net hospitals alone rather than among all hospitals.24,25
Second, our findings underscore potential challenges that safety net hospitals may face when attempting to redesign care. For instance, among hospitals accepting bundled payments for medical conditions, successful strategies in BPCI have often included maintaining the proportion of patients discharged to institutional post–acute care providers while reducing SNF LOS.2 However, in our study, discharge to institutional post–acute care providers actually increased among safety net hospitals relative to other hospitals while SNF LOS did not decrease. Additionally, while other hospitals in bundled payments have exhibited differentially greater discharge home with home health services, we found that safety net hospitals did not. These represent areas for future work, particularly because little is known about how safety net hospitals coordinate post–acute care (eg, the extent to which safety net hospitals integrate with post–acute care providers or coordinate home-based care for vulnerable patient populations).
Third, study results offer insight into potential challenges to practice changes. Compared with other hospitals, safety net hospitals in our analysis provided medical condition episode care to more Black, Medicare/Medicaid dual-eligible, and disabled patients, as well as individuals living in socioeconomically disadvantaged areas. Collectively, these groups may face more challenging socioeconomic circumstances or existing disparities. The combination of these factors and limited financial resources at safety net hospitals could complicate their ability to manage transitions of care after hospitalization by shifting discharge away from high-intensity institutional post–acute care facilities.
Our analysis has limitations. First, given the observational study design, findings are subject to residual confounding and selection bias. For instance, findings related to post–acute care utilization could have been influenced by unobservable changes in market supply and other factors. However, we mitigated these risks using a quasi-experimental methodology that also directly accounted for multiple patient, hospital, and market characteristics and also used fixed effects to account for unobserved heterogeneity. Second, in studying BPCI Model 2, we evaluated one model within one bundled payment program. However, BPCI Model 2 encompassed a wide range of medical conditions, and both this scope and program design have served as the direct basis for subsequent bundled payment models, such as the ongoing BPCI Advanced and other forthcoming programs.26 Third, while our analysis evaluated multiple aspects of patient complexity, individuals may be “high risk” owing to several clinical and social determinants. Future work should evaluate different features of patient risk and how they affect outcomes under payment models such as bundled payments.
CONCLUSION
Safety net status appeared to affect the relationship between bundled payment participation and post–acute care utilization, but not episode spending. These findings suggest that policymakers could support safety net hospitals within bundled payment programs and consider safety net status when evaluating them.
1. Navathe AS, Emanuel EJ, Venkataramani AS, et al. Spending and quality after three years of Medicare’s voluntary bundled payment for joint replacement surgery. Health Aff (Millwood). 2020;39(1):58-66. https://doi.org/10.1377/hlthaff.2019.00466
2. Rolnick JA, Liao JM, Emanuel EJ, et al. Spending and quality after three years of Medicare’s bundled payments for medical conditions: quasi-experimental difference-in-differences study. BMJ. 2020;369:m1780. https://doi.org/10.1136/bmj.m1780
3. Figueroa JF, Joynt KE, Zhou X, Orav EJ, Jha AK. Safety-net hospitals face more barriers yet use fewer strategies to reduce readmissions. Med Care. 2017;55(3):229-235. https://doi.org/10.1097/MLR.0000000000000687
4. Werner RM, Goldman LE, Dudley RA. Comparison of change in quality of care between safety-net and non–safety-net hospitals. JAMA. 2008;299(18):2180-2187. https://doi/org/10.1001/jama.299.18.2180
5. Ross JS, Bernheim SM, Lin Z, et al. Based on key measures, care quality for Medicare enrollees at safety-net and non–safety-net hospitals was almost equal. Health Aff (Millwood). 2012;31(8):1739-1748. https://doi.org/10.1377/hlthaff.2011.1028
6. Gilman M, Adams EK, Hockenberry JM, Milstein AS, Wilson IB, Becker ER. Safety-net hospitals more likely than other hospitals to fare poorly under Medicare’s value-based purchasing. Health Aff (Millwood). 2015;34(3):398-405. https://doi.org/10.1377/hlthaff.2014.1059
7. Joynt KE, Jha AK. Characteristics of hospitals receiving penalties under the Hospital Readmissions Reduction Program. JAMA. 2013;309(4):342-343. https://doi.org/10.1001/jama.2012.94856
8. Rajaram R, Chung JW, Kinnier CV, et al. Hospital characteristics associated with penalties in the Centers for Medicare & Medicaid Services Hospital-Acquired Condition Reduction Program. JAMA. 2015;314(4):375-383. https://doi.org/10.1001/jama.2015.8609
9. Navathe AS, Liao JM, Shah Y, et al. Characteristics of hospitals earning savings in the first year of mandatory bundled payment for hip and knee surgery. JAMA. 2018;319(9):930-932. https://doi.org/10.1001/jama.2018.0678
10. Thirukumaran CP, Glance LG, Cai X, Balkissoon R, Mesfin A, Li Y. Performance of safety-net hospitals in year 1 of the Comprehensive Care for Joint Replacement Model. Health Aff (Millwood). 2019;38(2):190-196. https://doi.org/10.1377/hlthaff.2018.05264
11. Thirukumaran CP, Glance LG, Cai X, Kim Y, Li Y. Penalties and rewards for safety net vs non–safety net hospitals in the first 2 years of the Comprehensive Care for Joint Replacement Model. JAMA. 2019;321(20):2027-2030. https://doi.org/10.1001/jama.2019.5118
12. Kim H, Grunditz JI, Meath THA, Quiñones AR, Ibrahim SA, McConnell KJ. Level of reconciliation payments by safety-net hospital status under the first year of the Comprehensive Care for Joint Replacement Program. JAMA Surg. 2019;154(2):178-179. https://doi.org/10.1001/jamasurg.2018.3098
13. Department of Medicine, University of Wisconsin School of Medicine and Public Health. Neighborhood Atlas. Accessed March 1, 2021. https://www.neighborhoodatlas.medicine.wisc.edu/
14. Dartmouth Atlas Project. The Dartmouth Atlas of Health Care. Accessed March 1, 2021. https://www.dartmouthatlas.org/
15. Chatterjee P, Joynt KE, Orav EJ, Jha AK. Patient experience in safety-net hospitals: implications for improving care and value-based purchasing. Arch Intern Med. 2012;172(16):1204-1210. https://doi.org/10.1001/archinternmed.2012.3158
16. Rolnick JA, Liao JM, Navathe AS. Programme design matters—lessons from bundled payments in the US. June 17, 2020. Accessed March 1, 2021. https://blogs.bmj.com/bmj/2020/06/17/programme-design-matters-lessons-from-bundled-payments-in-the-us
17. Dummit LA, Kahvecioglu D, Marrufo G, et al. Association between hospital participation in a Medicare bundled payment initiative and payments and quality outcomes for lower extremity joint replacement episodes. JAMA. 2016;316(12):1267-1278. https://doi.org/10.1001/jama.2016.12717
18. Navathe AS, Liao JM, Dykstra SE, et al. Association of hospital participation in a Medicare bundled payment program with volume and case mix of lower extremity joint replacement episodes. JAMA. 2018;320(9):901-910. https://doi.org/10.1001/jama.2018.12345
19. Joynt Maddox KE, Orav EJ, Zheng J, Epstein AM. Evaluation of Medicare’s bundled payments initiative for medical conditions. N Engl J Med. 2018;379(3):260-269. https://doi.org/10.1056/NEJMsa1801569
20. Navathe AS, Emanuel EJ, Venkataramani AS, et al. Spending and quality after three years of Medicare’s voluntary bundled payment for joint replacement surgery. Health Aff (Millwood). 2020;39(1):58-66. https://doi.org/10.1377/hlthaff.2019.00466
21. Liao JM, Emanuel EJ, Venkataramani AS, et al. Association of bundled payments for joint replacement surgery and patient outcomes with simultaneous hospital participation in accountable care organizations. JAMA Netw Open. 2019;2(9):e1912270. https://doi.org/10.1001/jamanetworkopen.2019.12270
22. Kim DH, Schneeweiss S. Measuring frailty using claims data for pharmacoepidemiologic studies of mortality in older adults: evidence and recommendations. Pharmacoepidemiol Drug Saf. 2014;23(9):891-901. https://doi.org/10.1002/pds.3674
23. Joynt KE, Figueroa JF, Beaulieu N, Wild RC, Orav EJ, Jha AK. Segmenting high-cost Medicare patients into potentially actionable cohorts. Healthc (Amst). 2017;5(1-2):62-67. https://doi.org/10.1016/j.hjdsi.2016.11.002
24. Quality Payment Program. Small, underserved, and rural practices. Accessed March 1, 2021. https://qpp.cms.gov/about/small-underserved-rural-practices
25. McCarthy CP, Vaduganathan M, Patel KV, et al. Association of the new peer group–stratified method with the reclassification of penalty status in the Hospital Readmission Reduction Program. JAMA Netw Open. 2019;2(4):e192987. https://doi.org/10.1001/jamanetworkopen.2019.2987
26. Centers for Medicare & Medicaid Services. BPCI Advanced. Updated September 16, 2021. Accessed October 18, 2021. https://innovation.cms.gov/innovation-models/bpci-advanced
© 2021 Society of Hospital Medicine
Evaluation of the Effectiveness and Safety of Alirocumab Use in Statin-Intolerant Veterans
In 2016, 17.6 million deaths occurred globally due to cardiovascular disease (CVD) with coronary artery disease (CAD) and ischemic stroke as top contributors.1 Elevated low-density lipoprotein cholesterol (LDL-C) has been linked to greater risk of atherosclerotic cardiovascular disease (ASCVD); therefore, LDL-C reduction is imperative to decrease risk of cardiovascular (CV) morbidity and mortality.2 Since 1987, statin therapy has been the mainstay of treatment for hypercholesterolemia, and current practice guidelines recommend statins as first-line therapy given demonstrated reductions in LDL-C and CV mortality reduction in robust clinical trials.2-4 Although generally safe and well tolerated, muscle-related adverse events (AEs) limit optimal use of statins in up to 20% of individuals who have an indication for statin therapy.5 As a consequence, these patients receive suboptimal statin doses or no statin therapy and are at a higher risk for ASCVD.5
Proprotein convertase subtilisin/kexin type 9 (PCSK9) inhibitors have been shown to significantly lower LDL-C when used as monotherapy or in combination with statins and/or other lipid-lowering therapies.5 These agents are currently approved by the US Food and Drug Administration as an adjunct to diet with or without other lipid-lowering therapies for the management of primary hypercholesterolemia (including heterozygous familial hypercholesterolemia), homozygous familial hypercholesterolemia (evolocumab only), and for use in patients with established CVD unable to achieve their lipid-lowering goals with maximally tolerated statin doses and ezetimibe.4 With the ability to reduce LDL-C by up to 65%, PCSK9 inhibitors offer an alternative option for LDL-C and potentially CV risk reduction in statin-intolerant patients.5
Alirocumab, the formulary preferred PCSK9 inhibitor at the Michael E. DeBakey Veterans Affairs Medical Center (MEDVAMC) in Houston, Texas, has been increasingly used in high-risk statin-intolerant veterans. The primary objective of this case series was to assess LDL-C reduction associated with alirocumab use in statin-intolerant veterans at the MEDVAMC. The secondary objective was to assess the incidence of CV events. This study was approved by the MEDVAMC Quality Assurance and Regulatory Affairs committee.
Methods
In this single-center case series, a retrospective chart review was conducted to identify statin-intolerant veterans who were initiated on treatment with alirocumab for LDL-C and/or CV risk reduction between June 2017 and May 2019. Adult veterans with a diagnosis of primary hypercholesterolemia (including heterozygous familial hypercholesterolemia) and/or CAD with documented statin intolerance were included in the study. Statin intolerance was defined in accordance with the National Lipid Association (NLA) definition as aninability to tolerate ≥ 2 statins with a trial of at least 1 statin at its lowest daily dose.5 Veterans who previously received treatment with evolocumab, those prescribed concurrent statin therapies, and those missing follow-up lipid panels at 24 weeks were excluded from the study. To assess LDL-C reduction, LDL-C at baseline was compared with LDL-C at 4 and 24 weeks. Incident CV events before and after alirocumab initiation were documented. The US Department of Veteran Affairs (VA) Computerized Patient Record System was used to collect patient data.
Data Collection, Measures, and Analysis
Electronic health records of all eligible patients who received alirocumab were reviewed, and basic demographics (patient age, sex, and race/ethnicity) as well as medical characteristics at baseline were collected. To confirm statin intolerance, each veteran’s history of statin use and use of additional lipid-lowering agents was documented. CV history was measured with an index of categorical measures for hypertension, confirmed CAD, hyperlipidemia, heart failure, arrhythmias, peripheral artery disease, stroke, diabetes mellitus, and hypothyroidism. Additionally, concomitant medications, such as aspirin, P2Y12 inhibitors, β-blockers, angiotensin-converting enzyme inhibitors, and angiotensin II receptor blockers that patients were taking also were collected. Each veteran’s lipid panel at baseline, and at 4 and 24 weeks posttreatment initiation, also was extracted. Continuous variables were summarized with means (SD), and categorical variables were summarized with frequencies and proportions. The paired Wilcoxon signed rank test was used to compare LDL-C at 4 and 24 weeks after alirocumab initiation with patients’ baseline LDL-C.
Results
Between June 2017 and May 2019, 122 veterans were initiated on alirocumab. Of these veterans, 98 were excluded: 35 concurrently received statin therapy, 33 missed follow-up lipid panels, 21 had previously received evolocumab, 6 failed to meet the NLA definition for statin intolerance, 2 did not fill active alirocumab prescriptions, and 1 had an incalculable LDL-C with a baseline triglyceride level of 3079 mg/dL. This resulted in 24 veterans included in the analysis.
Most participants were male (87.5%) and White veterans (79.2%) with a mean (SD) age of 66.0 (8.4) years and mean (SD) baseline LDL-C of 161.9 (74.3) mg/dL. At baseline, 21 veterans had a history of primary hyperlipidemia, 19 had a history of CAD, and 2 had a history of heterozygous familial hypercholesterolemia. Of the 24 patients included, the most trialed statins before alirocumab initiation were atorvastatin (95.8%), simvastatin (79.2%), rosuvastatin (79.2%), and pravastatin (62.5%) (Table).
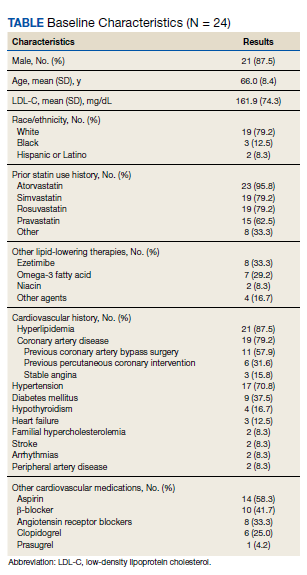
LDL-C Reduction
Veterans were initially treated with alirocumab 75 mg administered subcutaneously every 2 weeks; however, 11 veterans required a dose increase to 150 mg every 2 weeks. At treatment week 4, the median LDL-C reduction was 78.5 mg/dL (IQR, 28.0-107.3; P < .01), and at treatment week 24, the median LDL-C reduction was 55.6 mg/dL (IQR, 18.6-85.3; P < .01). This equated to median LDL-C reductions from baseline of 48.5% at week 4 and 34.3% at week 24. A total of 3 veterans experienced LDL-C increases following initiation of alirocumab. At week 4, 9 veterans were noted to have an LDL-C reduction > 50%, 7 veterans had an LDL-C reduction between 30% and 50%, and 5 veterans had an LDL-C reduction of < 30%. At week 24, 6 had an LDL-C reduction > 50%, 9 veterans had an LDL-C reduction between 30% and 50%, and 6 had a LDL-C reduction < 30%.
Cardiovascular Events
Before alirocumab initiation, 22 CV events and interventions were reported in 16 veterans: 12 percutaneous coronary interventions, 5 coronary artery bypass surgeries (CABG), 4 myocardial infarctions, and 1 transient ischemic attack. One month following alirocumab initiation, 1 veteran underwent a CABG after a non-ST-elevation myocardial infarction (NSTEMI).
Safety and Tolerability
Alirocumab was discontinued in 5 veterans due to 4 cases of intolerance (reported memory loss, lethargy, myalgias, and body aches with dyspnea) and 1 case of persistent LDL-C of < 40 mg/dL. Alirocumab was discontinued after 1 year in 2 patients (persistent LDL-C < 40 mg/dL and reported memory loss) and after 6 months in the veteran who reported lethargy. Alirocumab was discontinued after 4 months in the veteran with myalgias and within 2 months in the veteran with body aches and dyspnea. No other AEs were reported.
Discussion
The Efficacy and Safety of Alirocumab vs Ezetimibe in Statin-Intolerant Veterans With a Statin Rechallenge Arm trial is the first clinical trial to examine the efficacy and safety of alirocumab use in statin-intolerant patients. In the trial, 314 patients were randomized to receive alirocumab, ezetimibe, or an atorvastatin rechallenge.6 At 24 weeks, alirocumab reduced mean (SE) LDL-C by 45.0% (2.2%) vs 14.6% (2.2%) with ezetimibe (mean difference 30.4% [3.1%], P < .01).6 Fewer skeletal-muscle-related events also were noted with alirocumab vs atorvastatin (hazard ratio, 0.61; 95% CI, 0.38-0.99; P = .04).6
In this case series, an LDL-C reduction of > 50% was observed in 9 veterans (42.9%) following 4 weeks of treatment; however, LDL-C reduction of > 50% compared with baseline was sustained in only 6 veterans (28.6%) at week 24. Additionally, LDL-C increases from baseline were observed in 3 veterans; the reasoning for the observed increase was unclear, but this may have been due to nonadherence and dietary factors.4 Although a majority of patients saw a significant and clinically meaningful reduction in LDL-C, the group of patients with an increase in the same may have benefitted from targeted intervention to improve medication and dietary adherence. PCSK9 inhibitor resistance also may have contributed to an increase in LDL-C during treatment.7
Of the 24 patients included, 4 reported AEs resulted in therapy discontinuation. Memory impairment, a rare AE of alirocumab, was reported 1 year following alirocumab initiation. Additionally, lethargy was reported after 6 months of treatment. Myalgia also was reported in a veteran 4 months following treatment, and 1 veteran experienced body aches and dyspnea < 2 months following treatment. The most common AEs associated with alirocumab, as noted in previous safety and efficacy clinical trials, included: nasopharyngitis, injection site reaction, influenza, urinary tract infection, and myalgias.8 Many of these more common AEs may be subclinical and underreported. This small case series, however, detected 4 events severe enough to lead to therapy discontinuation. Although this sample is not representative of all statin-intolerant patients who receive treatment with alirocumab, our findings suggest the need for patient education on potential AEs before therapy initiation and clinician monitoring at follow-up visits.
The ODYSSEY OUTCOMES trial established a CV benefit associated with alirocumab; however, patients included had a recent acute coronary syndrome event and were receiving a high-intensity statin.9 This case series is unique in that before alirocumab initiation, 22 CV events/interventions were reported in the sample of 24 patients. After therapy initiation, 1 patient underwent a CABG after an NSTEMI in the month following initiation. This suggests that cardiac complications are possible after PCSK-9 initiation; however, little information can be gained from 1 patient. Nevertheless, early therapy failure should be investigated in the context of real-world use in statin-intolerant patients. This is a complex task, however, given the difficulties of achieving a balanced study design. Statin intolerance is a clear source of selection bias into treatment with alirocumab as patients in this population have already initiated and failed statin therapy. The prevalence of prior CV events and the time-dependent association between prior and future CV events stand as another complex confounder. Although there is a clear and pressing need to understand the risks and benefits of PCSK9 therapy in statin-intolerant patients, future research in this area will need to cautiously address these important sources of bias.
Overall, the results of this case series support LDL-C reduction associated with alirocumab in the absence of statin therapy. Despite favorable results, use of alirocumab may be limited by cost and its subcutaneous route of administration. Bempedoic acid, an oral, once-daily lipid-lowering agent poses an alternative to PCSK9 inhibitors, but further data regarding CV outcomes with this agent is needed.10,11 Robust randomized controlled trials also are needed to evaluate CV outcomes for alirocumab use in statin-intolerant veterans.
Limitations
Only 24 veterans were included in the study, reflecting 20% of the charts reviewed (80% exclusion rate), and in this small sample, only 1 CV event was observed. Both of these serve as threats to external validity. As the study information was extracted from chart review, the results may be limited by coding or historical bias. Medical information from outside institutions may be missing from medical records. Additionally, results may be skewed by possible documentation errors. Furthermore, the period between previous CV events and alirocumab initiation is unclear as event dates were often not recorded if treatment was received at an outside institution.
Due to the short follow-up period, the case series is limited in its assessment of CV outcomes and safety outcomes. Larger studies over an extended period are needed to assess CV outcomes and safety of alirocumab use in statin-intolerant patients. Also, medication adherence was not assessed. Given the impact of medication adherence on LDL-C reduction, it is unclear what role medication adherence played in the LDL-C reduction observed in this study.4
Conclusions
Alirocumab use in 24 statin-intolerant veterans resulted in a significant reduction in LDL-C at 4 and 24 weeks after initiation. In addition, 1 CV event/intervention was observed following alirocumab initiation, although this should be interpreted with caution due to the retrospective nature of this case series, small sample size, and short follow-up period. Large, long-term studies would better evaluate the CV benefit associated with alirocumab therapy in a veteran population.
1. Benjamin EJ, Munter P, Alonso A, et al; American Heart Association Council on Epidemiology and Prevention Statistics Committee and Stroke Statistics Subcommittee. Heart disease and stroke statistics—2019 update: a report from the American Heart Association. Circulation. 2019;139(10):e56-e528. doi:10.1161/CIR.0000000000000659
2. Stone NJ, Robinson JG, Lichtenstein AH, et al; American College of Cardiology/American Heart Association Task Force on Practice Guidelines. 2013 ACC/AHA guideline on the treatment of blood cholesterol to reduce atherosclerotic cardiovascular risk in adults: a report of the American College of Cardiology/American Heart Association Task Force on Practice Guidelines. Circulation. 2014 Jun 24;129(25)(suppl 2):S1-S45. doi:10.1016/j.jacc.2013.11.002
3. Hajar R. Statins: past and present. Heart Views. 2011;12(3): 121-127. doi:10.4103/1995-705X.95070
4. Grundy SM, Stone NJ, Bailey AL, et al. 2018 AHA/ACC/AACVPR/AAPA/ABC/ACPM/ADA/AGS/APhA/ASPC/NLA/PCNA guideline on the management of blood cholesterol: a report of the American College of Cardiology/American Heart Association Task Force on Clinical Practice Guidelines. J Am Coll Cardiol 2019;73(4):3168-3209. doi:10.1016/j.jacc.2018.11.002
5. Toth PH, Patti AM, Giglio RV, et al. Management of statin intolerance in 2018: still more questions than answers. Am J Cardiovasc Drugs. 2018;18(3):157-173. doi:10.1007/s40256-017-0259-7
6. Moriarty PM, Thompson PD, Cannon CP, et al; ODYSSEY ALTERNATIVE Investigators. Efficacy and safety of alirocumab vs ezetimibe in statin-intolerant patients, with a statin rechallenge arm: The ODYSSEY ALTERNATIVE randomized trial. J Clin Lipidol. 2015;9(6):758-769. doi:10.1016/j.jacl.2015.08.006
7. Shapiro MD, Miles J, Tavori H, Fazio S. Diagnosing resistance to a proprotein convertase subtilisin/kexin type 9 inhibitor. Ann Intern Med. 2018;168(5):376-379. doi:10.7326/M17-2485
8. Raedler LA. Praluent (alirocumab): first PCSK9 inhibitor approved by the FDA for hypercholesterolemia. Am Health Drug Benefits. 2016;9:123-126.
9. Schwartz GC, Steg PC, Szarek M, et al; ODYSSEY OUTCOMES Committees and Investigators. Alirocumab and cardiovascular outcomes after acute coronary syndrome. N Engl J Med. 2018;379(22):2097-2107. doi:10.1056/NEJMoa1801174
10. Nexletol. Package insert. Esperion Therapeutics Inc; 2020.
11. Laufs U, Banach M, Mancini GBJ, et al. Efficacy and safety of bempedoic acid in patients with hypercholesterolemia and statin intolerance. J Am Heart Assoc. 2019;8(7):e011662. doi:10.1161/JAHA.118.011662
In 2016, 17.6 million deaths occurred globally due to cardiovascular disease (CVD) with coronary artery disease (CAD) and ischemic stroke as top contributors.1 Elevated low-density lipoprotein cholesterol (LDL-C) has been linked to greater risk of atherosclerotic cardiovascular disease (ASCVD); therefore, LDL-C reduction is imperative to decrease risk of cardiovascular (CV) morbidity and mortality.2 Since 1987, statin therapy has been the mainstay of treatment for hypercholesterolemia, and current practice guidelines recommend statins as first-line therapy given demonstrated reductions in LDL-C and CV mortality reduction in robust clinical trials.2-4 Although generally safe and well tolerated, muscle-related adverse events (AEs) limit optimal use of statins in up to 20% of individuals who have an indication for statin therapy.5 As a consequence, these patients receive suboptimal statin doses or no statin therapy and are at a higher risk for ASCVD.5
Proprotein convertase subtilisin/kexin type 9 (PCSK9) inhibitors have been shown to significantly lower LDL-C when used as monotherapy or in combination with statins and/or other lipid-lowering therapies.5 These agents are currently approved by the US Food and Drug Administration as an adjunct to diet with or without other lipid-lowering therapies for the management of primary hypercholesterolemia (including heterozygous familial hypercholesterolemia), homozygous familial hypercholesterolemia (evolocumab only), and for use in patients with established CVD unable to achieve their lipid-lowering goals with maximally tolerated statin doses and ezetimibe.4 With the ability to reduce LDL-C by up to 65%, PCSK9 inhibitors offer an alternative option for LDL-C and potentially CV risk reduction in statin-intolerant patients.5
Alirocumab, the formulary preferred PCSK9 inhibitor at the Michael E. DeBakey Veterans Affairs Medical Center (MEDVAMC) in Houston, Texas, has been increasingly used in high-risk statin-intolerant veterans. The primary objective of this case series was to assess LDL-C reduction associated with alirocumab use in statin-intolerant veterans at the MEDVAMC. The secondary objective was to assess the incidence of CV events. This study was approved by the MEDVAMC Quality Assurance and Regulatory Affairs committee.
Methods
In this single-center case series, a retrospective chart review was conducted to identify statin-intolerant veterans who were initiated on treatment with alirocumab for LDL-C and/or CV risk reduction between June 2017 and May 2019. Adult veterans with a diagnosis of primary hypercholesterolemia (including heterozygous familial hypercholesterolemia) and/or CAD with documented statin intolerance were included in the study. Statin intolerance was defined in accordance with the National Lipid Association (NLA) definition as aninability to tolerate ≥ 2 statins with a trial of at least 1 statin at its lowest daily dose.5 Veterans who previously received treatment with evolocumab, those prescribed concurrent statin therapies, and those missing follow-up lipid panels at 24 weeks were excluded from the study. To assess LDL-C reduction, LDL-C at baseline was compared with LDL-C at 4 and 24 weeks. Incident CV events before and after alirocumab initiation were documented. The US Department of Veteran Affairs (VA) Computerized Patient Record System was used to collect patient data.
Data Collection, Measures, and Analysis
Electronic health records of all eligible patients who received alirocumab were reviewed, and basic demographics (patient age, sex, and race/ethnicity) as well as medical characteristics at baseline were collected. To confirm statin intolerance, each veteran’s history of statin use and use of additional lipid-lowering agents was documented. CV history was measured with an index of categorical measures for hypertension, confirmed CAD, hyperlipidemia, heart failure, arrhythmias, peripheral artery disease, stroke, diabetes mellitus, and hypothyroidism. Additionally, concomitant medications, such as aspirin, P2Y12 inhibitors, β-blockers, angiotensin-converting enzyme inhibitors, and angiotensin II receptor blockers that patients were taking also were collected. Each veteran’s lipid panel at baseline, and at 4 and 24 weeks posttreatment initiation, also was extracted. Continuous variables were summarized with means (SD), and categorical variables were summarized with frequencies and proportions. The paired Wilcoxon signed rank test was used to compare LDL-C at 4 and 24 weeks after alirocumab initiation with patients’ baseline LDL-C.
Results
Between June 2017 and May 2019, 122 veterans were initiated on alirocumab. Of these veterans, 98 were excluded: 35 concurrently received statin therapy, 33 missed follow-up lipid panels, 21 had previously received evolocumab, 6 failed to meet the NLA definition for statin intolerance, 2 did not fill active alirocumab prescriptions, and 1 had an incalculable LDL-C with a baseline triglyceride level of 3079 mg/dL. This resulted in 24 veterans included in the analysis.
Most participants were male (87.5%) and White veterans (79.2%) with a mean (SD) age of 66.0 (8.4) years and mean (SD) baseline LDL-C of 161.9 (74.3) mg/dL. At baseline, 21 veterans had a history of primary hyperlipidemia, 19 had a history of CAD, and 2 had a history of heterozygous familial hypercholesterolemia. Of the 24 patients included, the most trialed statins before alirocumab initiation were atorvastatin (95.8%), simvastatin (79.2%), rosuvastatin (79.2%), and pravastatin (62.5%) (Table).
LDL-C Reduction
Veterans were initially treated with alirocumab 75 mg administered subcutaneously every 2 weeks; however, 11 veterans required a dose increase to 150 mg every 2 weeks. At treatment week 4, the median LDL-C reduction was 78.5 mg/dL (IQR, 28.0-107.3; P < .01), and at treatment week 24, the median LDL-C reduction was 55.6 mg/dL (IQR, 18.6-85.3; P < .01). This equated to median LDL-C reductions from baseline of 48.5% at week 4 and 34.3% at week 24. A total of 3 veterans experienced LDL-C increases following initiation of alirocumab. At week 4, 9 veterans were noted to have an LDL-C reduction > 50%, 7 veterans had an LDL-C reduction between 30% and 50%, and 5 veterans had an LDL-C reduction of < 30%. At week 24, 6 had an LDL-C reduction > 50%, 9 veterans had an LDL-C reduction between 30% and 50%, and 6 had a LDL-C reduction < 30%.
Cardiovascular Events
Before alirocumab initiation, 22 CV events and interventions were reported in 16 veterans: 12 percutaneous coronary interventions, 5 coronary artery bypass surgeries (CABG), 4 myocardial infarctions, and 1 transient ischemic attack. One month following alirocumab initiation, 1 veteran underwent a CABG after a non-ST-elevation myocardial infarction (NSTEMI).
Safety and Tolerability
Alirocumab was discontinued in 5 veterans due to 4 cases of intolerance (reported memory loss, lethargy, myalgias, and body aches with dyspnea) and 1 case of persistent LDL-C of < 40 mg/dL. Alirocumab was discontinued after 1 year in 2 patients (persistent LDL-C < 40 mg/dL and reported memory loss) and after 6 months in the veteran who reported lethargy. Alirocumab was discontinued after 4 months in the veteran with myalgias and within 2 months in the veteran with body aches and dyspnea. No other AEs were reported.
Discussion
The Efficacy and Safety of Alirocumab vs Ezetimibe in Statin-Intolerant Veterans With a Statin Rechallenge Arm trial is the first clinical trial to examine the efficacy and safety of alirocumab use in statin-intolerant patients. In the trial, 314 patients were randomized to receive alirocumab, ezetimibe, or an atorvastatin rechallenge.6 At 24 weeks, alirocumab reduced mean (SE) LDL-C by 45.0% (2.2%) vs 14.6% (2.2%) with ezetimibe (mean difference 30.4% [3.1%], P < .01).6 Fewer skeletal-muscle-related events also were noted with alirocumab vs atorvastatin (hazard ratio, 0.61; 95% CI, 0.38-0.99; P = .04).6
In this case series, an LDL-C reduction of > 50% was observed in 9 veterans (42.9%) following 4 weeks of treatment; however, LDL-C reduction of > 50% compared with baseline was sustained in only 6 veterans (28.6%) at week 24. Additionally, LDL-C increases from baseline were observed in 3 veterans; the reasoning for the observed increase was unclear, but this may have been due to nonadherence and dietary factors.4 Although a majority of patients saw a significant and clinically meaningful reduction in LDL-C, the group of patients with an increase in the same may have benefitted from targeted intervention to improve medication and dietary adherence. PCSK9 inhibitor resistance also may have contributed to an increase in LDL-C during treatment.7
Of the 24 patients included, 4 reported AEs resulted in therapy discontinuation. Memory impairment, a rare AE of alirocumab, was reported 1 year following alirocumab initiation. Additionally, lethargy was reported after 6 months of treatment. Myalgia also was reported in a veteran 4 months following treatment, and 1 veteran experienced body aches and dyspnea < 2 months following treatment. The most common AEs associated with alirocumab, as noted in previous safety and efficacy clinical trials, included: nasopharyngitis, injection site reaction, influenza, urinary tract infection, and myalgias.8 Many of these more common AEs may be subclinical and underreported. This small case series, however, detected 4 events severe enough to lead to therapy discontinuation. Although this sample is not representative of all statin-intolerant patients who receive treatment with alirocumab, our findings suggest the need for patient education on potential AEs before therapy initiation and clinician monitoring at follow-up visits.
The ODYSSEY OUTCOMES trial established a CV benefit associated with alirocumab; however, patients included had a recent acute coronary syndrome event and were receiving a high-intensity statin.9 This case series is unique in that before alirocumab initiation, 22 CV events/interventions were reported in the sample of 24 patients. After therapy initiation, 1 patient underwent a CABG after an NSTEMI in the month following initiation. This suggests that cardiac complications are possible after PCSK-9 initiation; however, little information can be gained from 1 patient. Nevertheless, early therapy failure should be investigated in the context of real-world use in statin-intolerant patients. This is a complex task, however, given the difficulties of achieving a balanced study design. Statin intolerance is a clear source of selection bias into treatment with alirocumab as patients in this population have already initiated and failed statin therapy. The prevalence of prior CV events and the time-dependent association between prior and future CV events stand as another complex confounder. Although there is a clear and pressing need to understand the risks and benefits of PCSK9 therapy in statin-intolerant patients, future research in this area will need to cautiously address these important sources of bias.
Overall, the results of this case series support LDL-C reduction associated with alirocumab in the absence of statin therapy. Despite favorable results, use of alirocumab may be limited by cost and its subcutaneous route of administration. Bempedoic acid, an oral, once-daily lipid-lowering agent poses an alternative to PCSK9 inhibitors, but further data regarding CV outcomes with this agent is needed.10,11 Robust randomized controlled trials also are needed to evaluate CV outcomes for alirocumab use in statin-intolerant veterans.
Limitations
Only 24 veterans were included in the study, reflecting 20% of the charts reviewed (80% exclusion rate), and in this small sample, only 1 CV event was observed. Both of these serve as threats to external validity. As the study information was extracted from chart review, the results may be limited by coding or historical bias. Medical information from outside institutions may be missing from medical records. Additionally, results may be skewed by possible documentation errors. Furthermore, the period between previous CV events and alirocumab initiation is unclear as event dates were often not recorded if treatment was received at an outside institution.
Due to the short follow-up period, the case series is limited in its assessment of CV outcomes and safety outcomes. Larger studies over an extended period are needed to assess CV outcomes and safety of alirocumab use in statin-intolerant patients. Also, medication adherence was not assessed. Given the impact of medication adherence on LDL-C reduction, it is unclear what role medication adherence played in the LDL-C reduction observed in this study.4
Conclusions
Alirocumab use in 24 statin-intolerant veterans resulted in a significant reduction in LDL-C at 4 and 24 weeks after initiation. In addition, 1 CV event/intervention was observed following alirocumab initiation, although this should be interpreted with caution due to the retrospective nature of this case series, small sample size, and short follow-up period. Large, long-term studies would better evaluate the CV benefit associated with alirocumab therapy in a veteran population.
1. Benjamin EJ, Munter P, Alonso A, et al; American Heart Association Council on Epidemiology and Prevention Statistics Committee and Stroke Statistics Subcommittee. Heart disease and stroke statistics—2019 update: a report from the American Heart Association. Circulation. 2019;139(10):e56-e528. doi:10.1161/CIR.0000000000000659
2. Stone NJ, Robinson JG, Lichtenstein AH, et al; American College of Cardiology/American Heart Association Task Force on Practice Guidelines. 2013 ACC/AHA guideline on the treatment of blood cholesterol to reduce atherosclerotic cardiovascular risk in adults: a report of the American College of Cardiology/American Heart Association Task Force on Practice Guidelines. Circulation. 2014 Jun 24;129(25)(suppl 2):S1-S45. doi:10.1016/j.jacc.2013.11.002
3. Hajar R. Statins: past and present. Heart Views. 2011;12(3): 121-127. doi:10.4103/1995-705X.95070
4. Grundy SM, Stone NJ, Bailey AL, et al. 2018 AHA/ACC/AACVPR/AAPA/ABC/ACPM/ADA/AGS/APhA/ASPC/NLA/PCNA guideline on the management of blood cholesterol: a report of the American College of Cardiology/American Heart Association Task Force on Clinical Practice Guidelines. J Am Coll Cardiol 2019;73(4):3168-3209. doi:10.1016/j.jacc.2018.11.002
5. Toth PH, Patti AM, Giglio RV, et al. Management of statin intolerance in 2018: still more questions than answers. Am J Cardiovasc Drugs. 2018;18(3):157-173. doi:10.1007/s40256-017-0259-7
6. Moriarty PM, Thompson PD, Cannon CP, et al; ODYSSEY ALTERNATIVE Investigators. Efficacy and safety of alirocumab vs ezetimibe in statin-intolerant patients, with a statin rechallenge arm: The ODYSSEY ALTERNATIVE randomized trial. J Clin Lipidol. 2015;9(6):758-769. doi:10.1016/j.jacl.2015.08.006
7. Shapiro MD, Miles J, Tavori H, Fazio S. Diagnosing resistance to a proprotein convertase subtilisin/kexin type 9 inhibitor. Ann Intern Med. 2018;168(5):376-379. doi:10.7326/M17-2485
8. Raedler LA. Praluent (alirocumab): first PCSK9 inhibitor approved by the FDA for hypercholesterolemia. Am Health Drug Benefits. 2016;9:123-126.
9. Schwartz GC, Steg PC, Szarek M, et al; ODYSSEY OUTCOMES Committees and Investigators. Alirocumab and cardiovascular outcomes after acute coronary syndrome. N Engl J Med. 2018;379(22):2097-2107. doi:10.1056/NEJMoa1801174
10. Nexletol. Package insert. Esperion Therapeutics Inc; 2020.
11. Laufs U, Banach M, Mancini GBJ, et al. Efficacy and safety of bempedoic acid in patients with hypercholesterolemia and statin intolerance. J Am Heart Assoc. 2019;8(7):e011662. doi:10.1161/JAHA.118.011662
Continuous Blood Glucose Monitoring Outcomes in Veterans With Type 2 Diabetes
Nearly 25% of patients served in the US Department of Veterans Affairs (VA) have been diagnosed with type 2 diabetes mellitus (T2DM), although the prevalence among adults in the United States is 9%.1 Patients with DM typically monitor their blood glucose using intermittent fingerstick self-testing. Continuous glucose monitoring (CGM) might offer a more comprehensive picture of glucose control to improve disease management. Within the VA, criteria for CGM use varies among facilities, but generally veterans prescribed at least 3 daily insulin injections and 4 daily blood glucose checks qualify.2
CGM therapy has been extensively researched for type 1 DM (T1DM); however, outcomes of CGM use among older adults with T2DM have not been fully evaluated. In a 2018 review of randomized clinical trials evaluating CGM use, 17 trials examined only patients with T1DM (2009 participants), 4 included only patients with T2DM patients (547 patients), 3 evaluated patients with T1DM or T2DM (655 patients), and 3 included women with gestational diabetes (585 patients).3 Of 27 studies that included change in hemoglobin A1c (HbA1c) as an endpoint, 15 found a statistically significant reduction in HbA1c for the CGM group. Four trials evaluated CGM use in adults with T2DM and 3 found no difference in HbA1c overall. However, 1 study found a difference in HbA1c only in individuals aged < 65 years, and another study found a greater improvement in the CGM group (approximately 0.5%).4,5 These mixed results indicate a need for further subgroup analysis in specific populations to determine the optimal use of CGM in adults with T2DM. Although this study was not designed to measure changes in hypoglycemic episodes or the relative efficacy of different CGM products, it establishes a baseline from which to conduct additional research.
Our primary objective was to determine change in HbA1c in each patient from the year before CGM initiation to the year after. Secondary objectives included changes in blood pressure (BP), weight, and diabetes-related hospital and clinic visits during the same time frame. We also completed subanalysis comparing primary outcomes in engaged or adherent patients compared with the entire study group. This study was completed as a quality improvement project with approval from the Lexington Veterans Affairs Health Care System in Kentucky information security office and was exempted from institutional review board review.
Methods
This project was a retrospective evaluation using the VA database of patient records. Rather than using a control group, our study used a pre–post model to determine the impact of CGM for each patient. For the primary outcome, average HbA1c values were calculated for the year before and year after CGM initiation. Hemoglobin and hematocrit values were included if reported within 3 months of the HbA1c values to ensure validity of HbA1c results. Average HbA1c was 13.37 g/dL (range, 10.5-17.3), and average hematocrit was 43.3% (range, 36-52). Change in average HbA1c was recorded for each patient. Based on research by Taylor and colleagues, a change in HbA1c of 0.8% was considered clinically significant for this project.6
Mean BP and weight were calculated for the years before and after CGM initiation. Only values for routine clinic visits were included; values taken during an acute health incident, inpatient stay, infusion clinic appointments, or home readings were excluded. Changes were recorded for each patient. Patient encounter notes were used to determine the number of DM-related hospital, emergency department, and clinic visits, such as nephrology, podiatry, vascular medicine, or infectious disease clinic or inpatient encounters during the study period. Routine endocrinology or primary care visits were not included, and patient care notes were consulted to ensure that the encounters were related to a DM complication. The change in number of visits was calculated for each patient.
Adherence was defined as patients receiving active medication management, documented treatment regimen adherence, and > 4 annual endocrinology clinic visits. Active medication management was defined as having > 1 dosage or medication change for oral or noninsulin antihyperglycemics, initiation, or adjustment of insulin dosages according to the patient records. Treatment adherence was determined based on medication reconciliation notes and refill request history. Only endocrinology clinic visits at VA outpatient clinics were included.
Study Population
A sample of 166 patients was needed to detect an HbA1c change of 0.8 per power analysis. The normal approximation method using the z statistic was used, with 2-tailed α = 0.05, β = 0.05, E = 0.8, and S = 1.2. We randomly selected 175 patients among all individuals with an active prescription for CGM in 2018 and 2019, who had a diagnosis of T2DM, and were managed by VA endocrinology clinics (including endocrine clinics, diabetes clinics, and patient aligned care team clinics) at 87 VA medical centers. Patients with types of DM other than T2DM were excluded, as well as those with a diagnosed hemoglobinopathy or HbA1c < 10 g/dL. The adherent subgroup included 40 patients of the 175 sample population (Table 1).
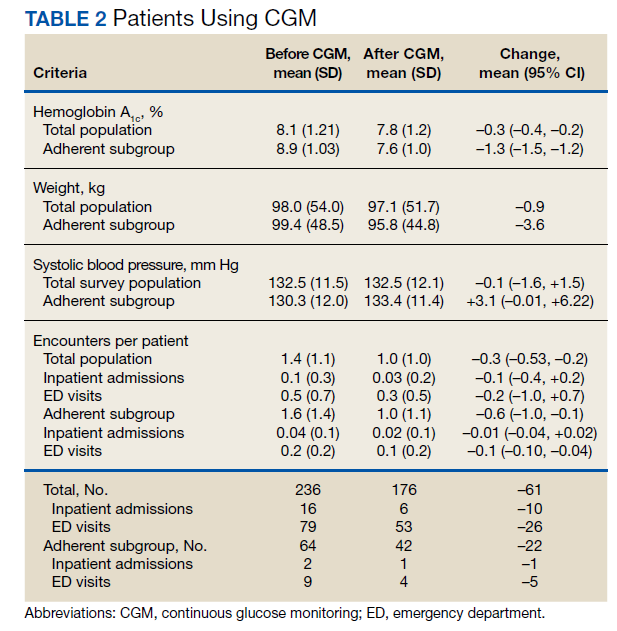
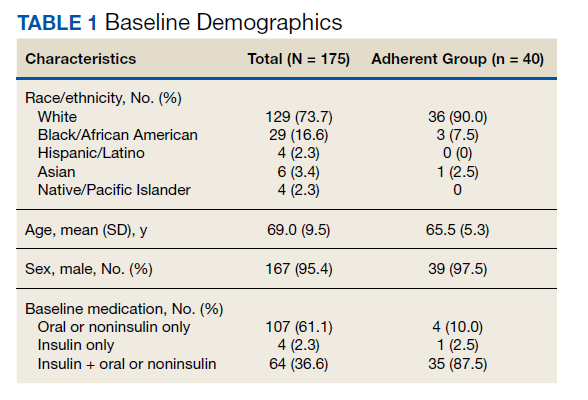
Results
Both the total population and the adherent subgroup showed reduction in HbA1c, the primary endpoint. The complete population showed a HbA1c change of –0.3 (95% CI, –0.4 to –0.2), and the adherent subgroup had a change of –1.3 (95% CI, –1.5 to –1.2). The total survey population had a mean change in weight of –1.9 lb (–0.9 kg) (95% CI, –3.7 to –0.1) and the adherent subgroup had an average change of –8.0 lb (–3.6 kg) (95% CI, –12.3 to –3.8). Average systolic BP changes were –0.1 mm Hg (95% CI, –1.6 to 1.5) in the total population and +3.3 mm Hg (95% CI, –0.01 to 6.22) in the adherent subgroup. A decrease in total encounters for DM complications was observed in the population (–0.3 total encounters per patient, 95% CI, –0.5 to –0.2) and the adherent subgroup (–0.6 total encounters per patient, 95% CI, –1.0 to –0.1) (Table 2).
Before the study, 107 (61.1%) patients were taking oral or noninsulin DM medication only, 4 (2.3%) were on insulin only, and 64 (36.6%) were prescribed both insulin and oral/noninsulin antihyperglycemics. Noninsulin and oral antihyperglycemic regimens included combinations of biguanide, dipeptidyl peptidase- 4 inhibitor, sodium-glucose cotransporter-2 inhibitor, sulfonylurea, meglitinide, β-glucosidase inhibitor, glucagon-like peptide-1 (GLP-1) analog, and thiazolidinedione drug classes. Nearly 70% (122) had no reported changes in DM treatment beyond dosage titrations. Among these patients, 18 (10.3%) were on an insulin pump for the duration of the study. Among the 53 (30.3%) patients who had changes in treatment, 31 (17.7%) transitioned from insulin injections to an insulin pump, 13 (7.4%) changed from 1 insulin injection to another (ie, addition of long-acting insulin, transition to u500 insulin, changing from 1 insulin category or brand to another), 8 (4.6%) began an oral/noninsulin antihyperglycemic, 4 (2.3%) began insulin injections, 13 (7.4%) discontinued noninsulin or oral antihyperglycemics, and 2 (1.1%) discontinued insulin during the study period.
Data showed that 113 (64.5%) patients had no changes in antihypertensives. The remaining 62 (35.4%) had the following adjustments: 14 (8%) increased dose of current medication(s), 9 (5.1%) decreased dose of current medication(s), 8 (4.6%) discontinued all antihypertensive medications, 10 (5.7%) switched to a different antihypertensive class, and 16 (9.1%) added additional antihypertensive medication(s) to their existing regimen during the study period.
Patients in the study group used 7 different types of CGM sensors. Chart review revealed that 84 (47.7%) patients used Medtronic devices, with 26 (14.8%) using first-generation Guardian sensors, 50 (28.4%) using Enlite sensors, and 8 (4.5) using Guardian 3 sensors. We found that 81 (46.0%) veterans were prescribed Dexcom devices, with 5 (2.8%) using SEVEN PLUS sensors, 68 (38.6%) using G4-5 sensors, and 8 (4.5%) using G6 sensors. The remaining 10 (5.7%) patients were using Freestyle Libre sensors during the study period.
Discussion
CGM did not correspond with clinically significant reductions in HbA1c. However, veterans with increased health care engagement were likely to achieve clinically significant HbA1c improvements. The veterans in the adherent subgroup had a higher baseline HbA1c, which could be because of a variety of factors mentioned in patient care notes, including insulin resistance, poor dietary habits, and exercise regimen nonadherence. These patients might have had more room to improve their glycemic control without concern of hypoglycemia, and their higher baseline HbA1c could have provided increased motivation for improving their health during the study period.
Adherent patients also had a greater reduction in weight and hospital or clinic visits with CGM compared with the total population. These veterans’ increased involvement in their health care might have led to better dietary and exercise adherence, which would have decreased insulin dosing and contributed to weight loss. Only 1 patient in the adherent subgroup initiated a GLP-1 agonist during the study period, making it unlikely that medication changes had a significant impact on weight loss in the subgroup analysis. This improvement in overall health status might have contributed to the reduction in hospital or clinic visits observed in this population.
Average systolic BP data decreased minimally in the total survey population and increased in the adherent subgroup over the course of the study. These results were determined to be statistically significant. Changes in systolic BP readings were minimal, indicating that it is unlikely that these changes contributed meaningfully to the patients’ overall health status.
Although not related to the study objectives, the adherent population required less antihypertensive adjustments with similar BP control. This could be explained by improved overall health or better adherence and engagement in therapy. The results of this project show that despite limited medication changes, T2DM management improved among adherent patients using CGM. The general study population, which was more likely to have documented nonadherence with treatment or clinic appointments, had minimal benefit. CGM technology in the T2DM veteran population is more likely to have significant clinical benefit in patients who are adherent with their medication regimens and follow-up appointments compared with the larger study population.
The results of this study are in line with previous studies on CGM use in the T2DM patient population. We agree with the previously published research that CGM alone does not have a meaningful impact on HbA1c reduction. Our study population also was older than those in previous studies, adding to the Haak and colleagues conclusion that patients aged < 65 years might have better outcomes with CGM.4
Strengths of this study include specificity to the veteran population using VA resources, as well as including nondiabetes outcomes. This allows for specific application to the veteran population and could provide broader evidence for CGM use. Demonstrated decreases in HbA1c, weight, and clinic visits in the adherent population suggest that providing veterans with CGM therapy with frequent endocrinology follow-up improves health outcomes and could decrease overall health spending.
Limitations
Limitations of this study include retrospective design, a small sample size, and solely focusing on T2DM. As a retrospective study, we cannot rule out the influence of outside factors, such as participation in a non-VA weight loss program. This study lacked the power to assess the impact of the different CGM brands. The study did not include data on severe hypoglycemic or hyperglycemic episodes as veterans might have needed emergent care at non-VA facilities. Future research will evaluate the impact of CGM on symptomatic and severe hypoglycemic episodes and use of insulin vs oral or noninsulin antihyperglycemics and the comparative efficacy of different CGM brands among veterans.
Conclusions
CGM did not correspond with clinically significant reductions in HbA1c. However, veterans with increased health care engagement were likely to achieve clinically significant HbA1c improvements. Adherent patients also had more reduction in weight and hospital or clinic visits with CGM compared with the total population. These veterans’ increased involvement in their health care might have led to better dietary and exercise adherence, which would have decreased insulin dosing and contributed to weight loss.
1. Liu Y, Sayam S, Shao X, et al. Prevalence of and trends in diabetes among veterans, United States, 2005-2014. Prev Chronic Dis. 2017;14:E135. Published 2017 Dec 14. doi:10.5888/pcd14.170230
2. Hackett M. VA pharmacies now carry the Dexcom G6 CGM at no cost for qualifying patients. September 23, 2020. Accessed September 28, 2021. https://www.mobihealthnews.com/news/va-pharmacies-now-carry-dexcom-g6-cgm-no-cost-qualifying-patients
3. Peters AL. The evidence base for continuous glucose monitoring. In: Role of Continuous Glucose Monitoring in Diabetes Treatment. Arlington (VA): American Diabetes Association; August 2018.3-7. doi:10.2337/db20181-3
4. Haak T, Hanaire H, Ajjan R, Hermanns N, Riveline JP, Rayman G. Flash glucose-sensing technology as a replacement for blood glucose monitoring for the management of insulin-treated type 2 diabetes: a multicenter, open-label randomized controlled trial. Diabetes Ther. 2017;8(1):55-73. doi:10.1007/s13300-016-0223-6
5. Yoo HJ, An HG, Park SY, et al. Use of a real time continuous glucose monitoring system as a motivational device for poorly controlled type 2 diabetes. Diabetes Res Clin Pract. 2008;82(1):73-79. doi:10.1016/j.diabres.2008.06.015
6. Taylor PJ, Thompson CH, Brinkworth GD. Effectiveness and acceptability of continuous glucose monitoring for type 2 diabetes management: A narrative review. J Diabetes Investig. 2018;9(4):713-725. doi:10.1111/jdi.12807
Nearly 25% of patients served in the US Department of Veterans Affairs (VA) have been diagnosed with type 2 diabetes mellitus (T2DM), although the prevalence among adults in the United States is 9%.1 Patients with DM typically monitor their blood glucose using intermittent fingerstick self-testing. Continuous glucose monitoring (CGM) might offer a more comprehensive picture of glucose control to improve disease management. Within the VA, criteria for CGM use varies among facilities, but generally veterans prescribed at least 3 daily insulin injections and 4 daily blood glucose checks qualify.2
CGM therapy has been extensively researched for type 1 DM (T1DM); however, outcomes of CGM use among older adults with T2DM have not been fully evaluated. In a 2018 review of randomized clinical trials evaluating CGM use, 17 trials examined only patients with T1DM (2009 participants), 4 included only patients with T2DM patients (547 patients), 3 evaluated patients with T1DM or T2DM (655 patients), and 3 included women with gestational diabetes (585 patients).3 Of 27 studies that included change in hemoglobin A1c (HbA1c) as an endpoint, 15 found a statistically significant reduction in HbA1c for the CGM group. Four trials evaluated CGM use in adults with T2DM and 3 found no difference in HbA1c overall. However, 1 study found a difference in HbA1c only in individuals aged < 65 years, and another study found a greater improvement in the CGM group (approximately 0.5%).4,5 These mixed results indicate a need for further subgroup analysis in specific populations to determine the optimal use of CGM in adults with T2DM. Although this study was not designed to measure changes in hypoglycemic episodes or the relative efficacy of different CGM products, it establishes a baseline from which to conduct additional research.
Our primary objective was to determine change in HbA1c in each patient from the year before CGM initiation to the year after. Secondary objectives included changes in blood pressure (BP), weight, and diabetes-related hospital and clinic visits during the same time frame. We also completed subanalysis comparing primary outcomes in engaged or adherent patients compared with the entire study group. This study was completed as a quality improvement project with approval from the Lexington Veterans Affairs Health Care System in Kentucky information security office and was exempted from institutional review board review.
Methods
This project was a retrospective evaluation using the VA database of patient records. Rather than using a control group, our study used a pre–post model to determine the impact of CGM for each patient. For the primary outcome, average HbA1c values were calculated for the year before and year after CGM initiation. Hemoglobin and hematocrit values were included if reported within 3 months of the HbA1c values to ensure validity of HbA1c results. Average HbA1c was 13.37 g/dL (range, 10.5-17.3), and average hematocrit was 43.3% (range, 36-52). Change in average HbA1c was recorded for each patient. Based on research by Taylor and colleagues, a change in HbA1c of 0.8% was considered clinically significant for this project.6
Mean BP and weight were calculated for the years before and after CGM initiation. Only values for routine clinic visits were included; values taken during an acute health incident, inpatient stay, infusion clinic appointments, or home readings were excluded. Changes were recorded for each patient. Patient encounter notes were used to determine the number of DM-related hospital, emergency department, and clinic visits, such as nephrology, podiatry, vascular medicine, or infectious disease clinic or inpatient encounters during the study period. Routine endocrinology or primary care visits were not included, and patient care notes were consulted to ensure that the encounters were related to a DM complication. The change in number of visits was calculated for each patient.
Adherence was defined as patients receiving active medication management, documented treatment regimen adherence, and > 4 annual endocrinology clinic visits. Active medication management was defined as having > 1 dosage or medication change for oral or noninsulin antihyperglycemics, initiation, or adjustment of insulin dosages according to the patient records. Treatment adherence was determined based on medication reconciliation notes and refill request history. Only endocrinology clinic visits at VA outpatient clinics were included.
Study Population
A sample of 166 patients was needed to detect an HbA1c change of 0.8 per power analysis. The normal approximation method using the z statistic was used, with 2-tailed α = 0.05, β = 0.05, E = 0.8, and S = 1.2. We randomly selected 175 patients among all individuals with an active prescription for CGM in 2018 and 2019, who had a diagnosis of T2DM, and were managed by VA endocrinology clinics (including endocrine clinics, diabetes clinics, and patient aligned care team clinics) at 87 VA medical centers. Patients with types of DM other than T2DM were excluded, as well as those with a diagnosed hemoglobinopathy or HbA1c < 10 g/dL. The adherent subgroup included 40 patients of the 175 sample population (Table 1).
Results
Both the total population and the adherent subgroup showed reduction in HbA1c, the primary endpoint. The complete population showed a HbA1c change of –0.3 (95% CI, –0.4 to –0.2), and the adherent subgroup had a change of –1.3 (95% CI, –1.5 to –1.2). The total survey population had a mean change in weight of –1.9 lb (–0.9 kg) (95% CI, –3.7 to –0.1) and the adherent subgroup had an average change of –8.0 lb (–3.6 kg) (95% CI, –12.3 to –3.8). Average systolic BP changes were –0.1 mm Hg (95% CI, –1.6 to 1.5) in the total population and +3.3 mm Hg (95% CI, –0.01 to 6.22) in the adherent subgroup. A decrease in total encounters for DM complications was observed in the population (–0.3 total encounters per patient, 95% CI, –0.5 to –0.2) and the adherent subgroup (–0.6 total encounters per patient, 95% CI, –1.0 to –0.1) (Table 2).
Before the study, 107 (61.1%) patients were taking oral or noninsulin DM medication only, 4 (2.3%) were on insulin only, and 64 (36.6%) were prescribed both insulin and oral/noninsulin antihyperglycemics. Noninsulin and oral antihyperglycemic regimens included combinations of biguanide, dipeptidyl peptidase- 4 inhibitor, sodium-glucose cotransporter-2 inhibitor, sulfonylurea, meglitinide, β-glucosidase inhibitor, glucagon-like peptide-1 (GLP-1) analog, and thiazolidinedione drug classes. Nearly 70% (122) had no reported changes in DM treatment beyond dosage titrations. Among these patients, 18 (10.3%) were on an insulin pump for the duration of the study. Among the 53 (30.3%) patients who had changes in treatment, 31 (17.7%) transitioned from insulin injections to an insulin pump, 13 (7.4%) changed from 1 insulin injection to another (ie, addition of long-acting insulin, transition to u500 insulin, changing from 1 insulin category or brand to another), 8 (4.6%) began an oral/noninsulin antihyperglycemic, 4 (2.3%) began insulin injections, 13 (7.4%) discontinued noninsulin or oral antihyperglycemics, and 2 (1.1%) discontinued insulin during the study period.
Data showed that 113 (64.5%) patients had no changes in antihypertensives. The remaining 62 (35.4%) had the following adjustments: 14 (8%) increased dose of current medication(s), 9 (5.1%) decreased dose of current medication(s), 8 (4.6%) discontinued all antihypertensive medications, 10 (5.7%) switched to a different antihypertensive class, and 16 (9.1%) added additional antihypertensive medication(s) to their existing regimen during the study period.
Patients in the study group used 7 different types of CGM sensors. Chart review revealed that 84 (47.7%) patients used Medtronic devices, with 26 (14.8%) using first-generation Guardian sensors, 50 (28.4%) using Enlite sensors, and 8 (4.5) using Guardian 3 sensors. We found that 81 (46.0%) veterans were prescribed Dexcom devices, with 5 (2.8%) using SEVEN PLUS sensors, 68 (38.6%) using G4-5 sensors, and 8 (4.5%) using G6 sensors. The remaining 10 (5.7%) patients were using Freestyle Libre sensors during the study period.
Discussion
CGM did not correspond with clinically significant reductions in HbA1c. However, veterans with increased health care engagement were likely to achieve clinically significant HbA1c improvements. The veterans in the adherent subgroup had a higher baseline HbA1c, which could be because of a variety of factors mentioned in patient care notes, including insulin resistance, poor dietary habits, and exercise regimen nonadherence. These patients might have had more room to improve their glycemic control without concern of hypoglycemia, and their higher baseline HbA1c could have provided increased motivation for improving their health during the study period.
Adherent patients also had a greater reduction in weight and hospital or clinic visits with CGM compared with the total population. These veterans’ increased involvement in their health care might have led to better dietary and exercise adherence, which would have decreased insulin dosing and contributed to weight loss. Only 1 patient in the adherent subgroup initiated a GLP-1 agonist during the study period, making it unlikely that medication changes had a significant impact on weight loss in the subgroup analysis. This improvement in overall health status might have contributed to the reduction in hospital or clinic visits observed in this population.
Average systolic BP data decreased minimally in the total survey population and increased in the adherent subgroup over the course of the study. These results were determined to be statistically significant. Changes in systolic BP readings were minimal, indicating that it is unlikely that these changes contributed meaningfully to the patients’ overall health status.
Although not related to the study objectives, the adherent population required less antihypertensive adjustments with similar BP control. This could be explained by improved overall health or better adherence and engagement in therapy. The results of this project show that despite limited medication changes, T2DM management improved among adherent patients using CGM. The general study population, which was more likely to have documented nonadherence with treatment or clinic appointments, had minimal benefit. CGM technology in the T2DM veteran population is more likely to have significant clinical benefit in patients who are adherent with their medication regimens and follow-up appointments compared with the larger study population.
The results of this study are in line with previous studies on CGM use in the T2DM patient population. We agree with the previously published research that CGM alone does not have a meaningful impact on HbA1c reduction. Our study population also was older than those in previous studies, adding to the Haak and colleagues conclusion that patients aged < 65 years might have better outcomes with CGM.4
Strengths of this study include specificity to the veteran population using VA resources, as well as including nondiabetes outcomes. This allows for specific application to the veteran population and could provide broader evidence for CGM use. Demonstrated decreases in HbA1c, weight, and clinic visits in the adherent population suggest that providing veterans with CGM therapy with frequent endocrinology follow-up improves health outcomes and could decrease overall health spending.
Limitations
Limitations of this study include retrospective design, a small sample size, and solely focusing on T2DM. As a retrospective study, we cannot rule out the influence of outside factors, such as participation in a non-VA weight loss program. This study lacked the power to assess the impact of the different CGM brands. The study did not include data on severe hypoglycemic or hyperglycemic episodes as veterans might have needed emergent care at non-VA facilities. Future research will evaluate the impact of CGM on symptomatic and severe hypoglycemic episodes and use of insulin vs oral or noninsulin antihyperglycemics and the comparative efficacy of different CGM brands among veterans.
Conclusions
CGM did not correspond with clinically significant reductions in HbA1c. However, veterans with increased health care engagement were likely to achieve clinically significant HbA1c improvements. Adherent patients also had more reduction in weight and hospital or clinic visits with CGM compared with the total population. These veterans’ increased involvement in their health care might have led to better dietary and exercise adherence, which would have decreased insulin dosing and contributed to weight loss.
1. Liu Y, Sayam S, Shao X, et al. Prevalence of and trends in diabetes among veterans, United States, 2005-2014. Prev Chronic Dis. 2017;14:E135. Published 2017 Dec 14. doi:10.5888/pcd14.170230
2. Hackett M. VA pharmacies now carry the Dexcom G6 CGM at no cost for qualifying patients. September 23, 2020. Accessed September 28, 2021. https://www.mobihealthnews.com/news/va-pharmacies-now-carry-dexcom-g6-cgm-no-cost-qualifying-patients
3. Peters AL. The evidence base for continuous glucose monitoring. In: Role of Continuous Glucose Monitoring in Diabetes Treatment. Arlington (VA): American Diabetes Association; August 2018.3-7. doi:10.2337/db20181-3
4. Haak T, Hanaire H, Ajjan R, Hermanns N, Riveline JP, Rayman G. Flash glucose-sensing technology as a replacement for blood glucose monitoring for the management of insulin-treated type 2 diabetes: a multicenter, open-label randomized controlled trial. Diabetes Ther. 2017;8(1):55-73. doi:10.1007/s13300-016-0223-6
5. Yoo HJ, An HG, Park SY, et al. Use of a real time continuous glucose monitoring system as a motivational device for poorly controlled type 2 diabetes. Diabetes Res Clin Pract. 2008;82(1):73-79. doi:10.1016/j.diabres.2008.06.015
6. Taylor PJ, Thompson CH, Brinkworth GD. Effectiveness and acceptability of continuous glucose monitoring for type 2 diabetes management: A narrative review. J Diabetes Investig. 2018;9(4):713-725. doi:10.1111/jdi.12807
Rosuvastatin-Induced Rhabdomyolysis, Pancreatitis, Transaminitis, and Acute Kidney Injury
Changing medications within a drug class requires considering the indication and dosage, possible adverse effects, and drug-drug interactions.
Attention should be paid to changing a tolerated medication to another within its class. Many drugs approved by the US Food and Drug Administration (FDA), have equivalent therapeutic properties as existing drugs. Rarely do such medications share the same potency and adverse effect (AE) profile.
Case Presentation
A 77-year-old man presented to the emergency department (ED) at the Raymond G. Murphy Medical Center in Albuquerque, New Mexico, with a 1-month history of progressive muscle weakness, which was so severe that he required assistance rising from chairs. The symptoms began when he switched from atorvastatin 40 mg daily to rosuvastatin 40 mg daily. A nephrology consultation was requested for an elevated plasma creatinine.
The patient reported strict adherence to his prescribed medications. In the days following the switch to rosuvastatin, he noticed that his urine turned black. He described the color as “like burnt coffee.” The color gradually cleared before his ED presentation. The patient stopped taking rosuvastatin the day prior to presentation and noted improvement of his symptoms. Review of symptoms was significant for lower extremity paresthesia and numbness the day he started rosuvastatin. He had no symptoms of decompensated heart failure and no recent exacerbations requiring alteration of his diuretic regimen.
The patient’s medical history was significant for traumatic brain injury with complex partial seizures, carpal tunnel syndrome, dyslipidemia, coronary artery disease with percutaneous intervention to the right coronary artery in the late 1990s, atrial fibrillation and ventricular tachycardia, status post implantable cardioverter defibrillator, heart failure with reduced ejection fraction (25%) attributed to ischemic cardiomyopathy, hypertension, lower urinary tract symptoms/prostatism, and previous bladder cancer. In the mid-1960s, the patient served in the US Army and had been deployed to South Korea. After the service, he worked for the local city government. He was retired for about 15 years. He reported no tobacco, alcohol, or recreational drug use and no tattoos. He did not require prior blood or blood product transfusions. None of his family members—parents, siblings, or children—had any history of kidney disease.
The patient’s outpatient medications included levetiracetam 750 mg twice daily, melatonin 9 mg at night, menthol 16%/methyl-salicylate 30% topically up to 4 times per day as needed, aspirin 81 mg once daily, fish oil 1000 mg twice daily, amiodarone 400 mg twice daily, hydralazine 20 mg 3 times daily, isosorbide mononitrate 60 mg daily, metoprolol succinate 100 mg daily, and tamsulosin 0.4 mg at night. His vital signs were stable: afebrile (97.5 ºF), normocardic (74 beats per minute), normotensive (118/78 mm Hg), and normoxic (98% on room air). On examination, he appeared elderly, somewhat frail, and chronically ill but in no acute distress. Affect was pleasant and appropriate, attention was high, and his thought process was logical. He had sparse, grey scalp hair. Extraocular movements were intact. Oral mucosa was pink and moist. His back was nontender, and there was no costovertebral tenderness bilaterally. The patient was in no respiratory distress, with a slightly hyperresonant chest to percussion bilaterally, very faint inspiratory basilar crepitant rales (that cleared with repeat inspiration), and was otherwise clear to auscultation throughout. An outline of an implanted pacemaker was evident on the chest under his left clavicle, with a laterally displaced apical impulse. The rate was normal and the rhythm was regular. Upper extremities demonstrated papyraceous skin but without cyanosis, clubbing, or edema. Radial pulses were slightly diminished. He had no lower extremity edema.
His laboratory values are provided in Table 1. Kidney function was stable months prior to admission. Of note, the blood urea nitrogen and plasma creatinine were increased from his baseline up to 47 and 5.89 mg/dL, respectively. The serum glutamic-oxaloacetic transaminase and serum glutamic pyruvic transaminase were 1051 U/L and 408 U/L, respectively. Plasma amylase and lipase levels also were elevated, 230 U/L and 892 U/L, respectively. Creatine kinase was 41,099 U/L. Urinalysis demonstrated a specific gravity of 1.017, pH of 5, and a large amount of blood (92 red blood cells/high power field).
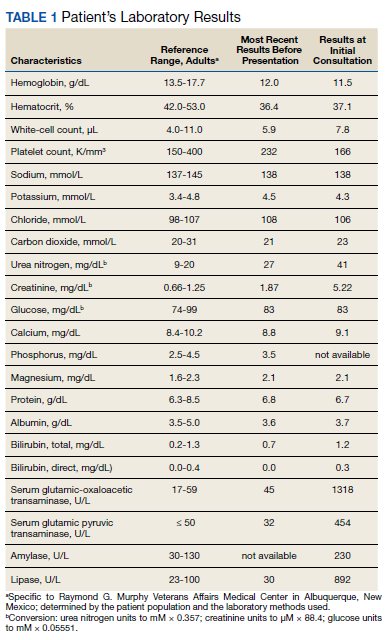
A 12-lead electrocardiogram demonstrated a sinus rhythm, PR interval of 0.20 ms, narrow QRS with a leftward frontal axis deviation, R-transition between precordial leads V1 and V2, and flattening of the ST segments in III, V1-V3 (Figure 1). A portable chest X-ray demonstrated clear lung fields, no evidence of effusion in the costophrenic area. Ultrasonography was conducted at the time of the examination (Figure 2). The kidneys were smoothly contoured, each measuring > 10 cm; there was an exophytic cyst on the left. Otherwise, the cortices, perhaps slightly echogenic, did not appear diminished. The bladder was not abnormally enlarged.
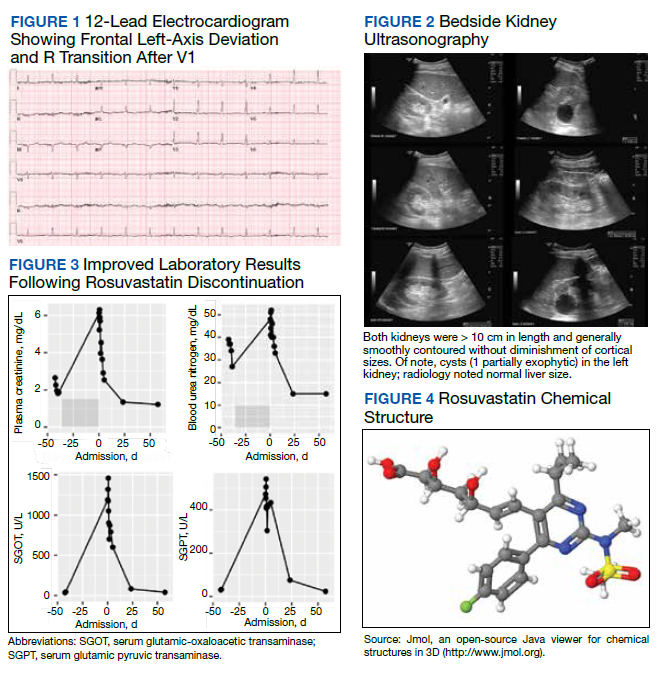
Rosuvastatin-induced rhabdomyolysis, pancreatitis, transaminitis, and drug-induced acute kidney injury were considered high among the diagnostic differentials. The 3-hydroxy-3-methyl-glutaryl-CoA (HMG-CoA) reductase inhibitor was stopped, and he was prescribed an acute renal insufficiency diet. All laboratory parameters improved with this change (Figure 3). Two months after presentation (and with rosuvastatin added to his list of adverse reactions), all symptoms resolved and his plasma creatinine reached a nadir of 1.22 mg/dL.
Discussion
Statin-class drugs inhibit the HMG-CoA reductase (Table 2). Upregulation of low-density lipoprotein cholesterol (LDL-C) receptors in the liver result in increased LDL-C uptake and cholesterol catabolism.1 Prescribed inhibitors of the HMG-CoA reductase—statins—are known to reduce mortality due to cardiovascular disease (CVD). Much like any other pharmaceutical agent with any measurable potency, HMG-CoA inhibitors can have AEs. Statin therapy has been associated with pancreatitis.2 Muscle toxicity is a complication of HMG-CoA reductase inhibitors, and statin-associated symptoms are a leading cause of nonadherence.3 Rosuvastatin had higher AE and drug reactions compared with that of atorvastatin and pitavastatin (35.6%, 8.7%, and 22.2%, respectively) in clinical trials for approval.4 We have reported concomitant adermatopathic dermatomyositis with statin-induced myopathy in a 48-year-old man from simvastatin (40 to 80 mg daily).1
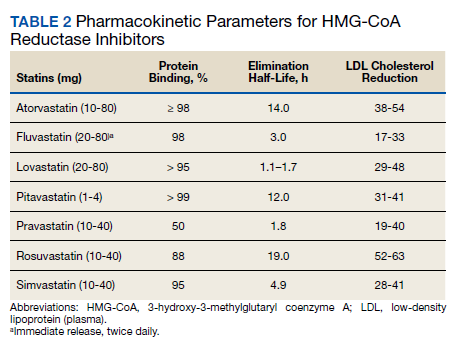
Toxin-induced myopathy should be considered early in the differential diagnosis of weakness.5 All HMG-CoA inhibitors have been associated with acute kidney injury, particularly at high doses and also are known to induce myopathies, sometimes with inclusion bodies.1 Muscle-related AEs correlate with the potency of an HMG-CoA reductase inhibitor according to an analysis using the FDA AE Reporting System (AERS).6 Myalgia and rhabdomyolysis are well-known AEs of this class of medications. Furthermore, type II muscle atrophy—particularly in the proximal limb muscles—has been reported.5 Patients may have difficulty rising from chairs.1 Rosuvastatin had the strongest signal for muscular AEs (eg, myalgia, rhabdomyolysis, increased creatine phosphokinase level) from an FDA analysis of AERS.7
Rosuvastatin is the only HMG-CoA reductase inhibitor that causes dose-dependent increases in proteinuria and hematuria (Figure 4).8 Rosuvastatin at a 5-mg dose may induce 4 times the proteinuria as a placebo. Typically, other statins potentially reduce proteinuria (without hematuria). Proteinuria may be induced by rosuvastatin even at low doses.8 Proteinuria is attributed to how rosuvastatin impacts proximal tubular function.9 The drug is transported into the proximal tubule by the organic anion transporter-3. Acute kidney injury has been associated with several statins, including rosuvastatin.7,10 This may be associated with denuded tubular epithelia, active urinary sediment, acute tubular toxicity, vacuolated epithelial cells, and tubular cell casts. Unlike atorvastatin, the increase in proteinuria and hematuria also is dose dependent.
In patients with renal insufficiency (short of end-stage renal disease [ESRD]), most statins other than rosuvastatin are well tolerated and recommended for reduction of overall and CVD mortality risk. However, these benefits seem to diminish once ESRD is reached. Atorvastatin did not impact CVD mortality in patients with type 2 diabetes mellitus (T2DM) and ESRD (despite decreasing LDL-C).11 The AURORA study randomized 10 mg of statin vs placebo in 2776 maintenance dialysis patients aged 50 to 80 years. Rosuvastatin lowered the LDL-C but did not affect all-cause mortality (13.5 vs 14.0 events per 100 patient-years). Patients randomized to rosuvastatin had more than twice as many unclassified strokes (9 vs 4). Rosuvastatin, although efficacious in reducing LDL-C, had no impact on CVD mortality, nonfatal myocardial infarction, or nonfatal stroke.12 Post hoc analysis demonstrated that in patients with T2DM with ESRD the hazard ratio for hemorrhagic stroke was 5.2.13
Rosuvastatin ranked lower than lovastatin, pravastatin, simvastatin, atorvastatin, and fluvastatin with respect to reduction of all-cause mortality in trials of participants with or without prior coronary artery disease.14 AEs, such as rhabdomyolysis, proteinuria, nephropathy, renal failure, liver, and muscle toxicity are higher with rosuvastatin than other medications in its class.15
Conclusions
For patients with existing CVD, standard clinical practice is to encourage increased and regular physical activity, cholesterol-lowering diets, weight loss, and smoking cessation. Hypertension should be treated. Glycemia should be well controlled in the setting of T2DM. β-blockers may be beneficial in those with histories of myocardial infarction or heart failure with reduced systolic function. Statins are a valuable tool in the treatment of dyslipidemia.
Statin-induced muscle symptoms are a major reason for discontinuation and nonadherence.16 Statin-induced myalgia, myositis, and myopathy have been used interchangeably.17 Rhabdomyolysis, myalgia, increased creatine kinase, statin myopathy, and immune-mediated necrotizing myopathy are among the clinical phenotypes caused by statins.17 There are 33,695 serious cases—1808 deaths—reported with rosuvastatin in the FDA AERS as of June 30, 2021. Myalgia, pain in extremity, muscle spasms, pain, and arthralgia top the list of AEs. When statin-induced symptoms occur, adherence is rarely improved by dismissive clinicians.18
Drugs in the same class often have common therapeutic properties. Potencies and AE profiles are seldom uniform. The decision to add or change the brand of medication within a class should be balanced with considerations for the indication, duplications, simplification, AEs, appropriate dosage, and drug-drug interactions.
Acknowledgments
Brent Wagner is funded by a US Department of Veterans Affairs Merit Award (I01 BX001958), a National Institutes of Health R01 grant (DK-102085), Dialysis Clinic, Inc., and partially supported by the University of New Mexico Brain and Behavioral Health Institute (BBHI 2018-1008, 2020-21-002) and in part by the University of New Mexico’s Signature Program in Cardiovascular and Metabolic Disease (CVMD); and the University of New Mexico School of Medicine Research Allocation Committee (C-2459-RAC, New Mexico Medical Trust). Brent Wagner is an Associate Member to the University of New Mexico Health Sciences Center Autophagy, Inflammation, and Metabolism Center of Biomedical Research Excellence (AIM CoBRE) supported by NIH grant P20GM121176.
Funding
National Institutes of Health Grant R01 DK-102085, Dialysis Clinic Inc., VA Merit Award I01 BX001958, Center for Integrated Nanotechnologies User Agreement 2019AU0120, Brain & Behavioral Health Institute (grants 2018-1008, 2020-21-002), University of New Mexico’s Signature Program in Cardiovascular and Metabolic Disease (CVMD), the University of New Mexico School of Medicine Research Allocation Committee (C-2459-RAC, New Mexico Medical Trust) and a metabolomics voucher from the AIM Center (NIH P20GM121176).
1. Wagner B, Kagan-Hallet KS, Russell IJ. Concomitant presentation of adermatopathic dermatomyositis, statin myopathy, fibromyalgia syndrome, piriformis muscle myofascial pain and diabetic neuropathy. J Musculoskeletal Pain. 2003;11(2):25-30. doi:10.1300/J094v11n02_05
2. Collins R, Reith C, Emberson J, et al. Interpretation of the evidence for the efficacy and safety of statin therapy [published correction appears in Lancet. 2017 Feb 11;389(10069):602]. Lancet. 2016;388(10059):2532-2561. doi:10.1016/S0140-6736(16)31357-5
3. Stroes ES, Thompson PD, Corsini A, et al. Statin-associated muscle symptoms: impact on statin therapy-European Atherosclerosis Society Consensus Panel Statement on Assessment, Aetiology and Management. Eur Heart J. 2015;36(17):1012-1022. doi:10.1093/eurheartj/ehv043
4. Saku K, Zhang B, Noda K; PATROL Trial Investigators. Randomized head-to-head comparison of pitavastatin, atorvastatin, and rosuvastatin for safety and efficacy (quantity and quality of LDL): the PATROL trial. Circ J. 2011;75(6):1493-1505. doi:10.1253/circj.cj-10-1281
5. Wald JJ. The effects of toxins on muscle. Neurol Clin. 2000;18(3):695-718. doi:10.1016/s0733-8619(05)70219-x
6. Hoffman KB, Kraus C, Dimbil M, Golomb BA. A survey of the FDA’s AERS database regarding muscle and tendon adverse events linked to the statin drug class. PLoS One. 2012;7(8):e42866. doi:10.1371/journal.pone.0042866
7. Sakaeda T, Kadoyama K, Okuno Y. Statin-associated muscular and renal adverse events: data mining of the public version of the FDA adverse event reporting system. PLoS One. 2011;6(12):e28124. doi:10.1371/journal.pone.0028124
8. Tiwari A. An overview of statin-associated proteinuria. Drug Discov Today. 2006;11(9-10):458-464. doi:10.1016/j.drudis.2006.03.017
9. Verhulst A, Sayer R, De Broe ME, D’Haese PC, Brown CD. Human proximal tubular epithelium actively secretes but does not retain rosuvastatin. Mol Pharmacol. 2008;74(4):1084-1091. doi:10.1124/mol.108.047647
10. Jones PH, Davidson MH, Stein EA, et al. Comparison of the efficacy and safety of rosuvastatin versus atorvastatin, simvastatin, and pravastatin across doses (STELLAR* Trial). Am J Cardiol. 2003;92(2):152-160. doi:10.1016/s0002-9149(03)00530-7
11. Wanner C, Krane V, März W, et al. Atorvastatin in patients with type 2 diabetes mellitus undergoing hemodialysis [published correction appears in N Engl J Med. 2005 Oct 13;353(15):1640]. N Engl J Med. 2005;353(3):238-248. doi:10.1056/NEJMoa043545
12. Fellström BC, Jardine AG, Schmieder RE, et al. Rosuvastatin and cardiovascular events in patients undergoing hemodialysis [published correction appears in N Engl J Med. 2010 Apr 15;362(15):1450]. N Engl J Med. 2009;360(14):1395-1407. doi:10.1056/NEJMoa0810177
13. Holdaas H, Holme I, Schmieder RE, et al. Rosuvastatin in diabetic hemodialysis patients. J Am Soc Nephrol. 2011;22(7):1335-1341. doi:10.1681/ASN.2010090987
14. Naci H, Brugts JJ, Fleurence R, Tsoi B, Toor H, Ades AE. Comparative benefits of statins in the primary and secondary prevention of major coronary events and all-cause mortality: a network meta-analysis of placebo-controlled and active-comparator trials. Eur J Prev Cardiol. 2013;20(4):641-657. doi:10.1177/2047487313480435
15. Alsheikh-Ali AA, Ambrose MS, Kuvin JT, Karas RH. The safety of rosuvastatin as used in common clinical practice: a postmarketing analysis. Circulation. 2005;111(23):3051-3057. doi:10.1161/CIRCULATIONAHA.105.555482
16. Ward NC, Watts GF, Eckel RH. Statin toxicity. Circ Res. 2019;124(2):328-350. doi:10.1161/CIRCRESAHA.118.312782
17. Selva-O’Callaghan A, Alvarado-Cardenas M, Pinal-Fernández I, et al. Statin-induced myalgia and myositis: an update on pathogenesis and clinical recommendations. Expert Rev Clin Immunol. 2018;14(3):215-224. doi:10.1080/1744666X.2018.1440206
18. Koslik HJ, Meskimen AH, Golomb BA. Physicians’ Experiences as patients with statin side effects: a case series. Drug Saf Case Rep. 2017;4(1):3. doi:10.1007/s40800-017-0045-0
Changing medications within a drug class requires considering the indication and dosage, possible adverse effects, and drug-drug interactions.
Changing medications within a drug class requires considering the indication and dosage, possible adverse effects, and drug-drug interactions.
Attention should be paid to changing a tolerated medication to another within its class. Many drugs approved by the US Food and Drug Administration (FDA), have equivalent therapeutic properties as existing drugs. Rarely do such medications share the same potency and adverse effect (AE) profile.
Case Presentation
A 77-year-old man presented to the emergency department (ED) at the Raymond G. Murphy Medical Center in Albuquerque, New Mexico, with a 1-month history of progressive muscle weakness, which was so severe that he required assistance rising from chairs. The symptoms began when he switched from atorvastatin 40 mg daily to rosuvastatin 40 mg daily. A nephrology consultation was requested for an elevated plasma creatinine.
The patient reported strict adherence to his prescribed medications. In the days following the switch to rosuvastatin, he noticed that his urine turned black. He described the color as “like burnt coffee.” The color gradually cleared before his ED presentation. The patient stopped taking rosuvastatin the day prior to presentation and noted improvement of his symptoms. Review of symptoms was significant for lower extremity paresthesia and numbness the day he started rosuvastatin. He had no symptoms of decompensated heart failure and no recent exacerbations requiring alteration of his diuretic regimen.
The patient’s medical history was significant for traumatic brain injury with complex partial seizures, carpal tunnel syndrome, dyslipidemia, coronary artery disease with percutaneous intervention to the right coronary artery in the late 1990s, atrial fibrillation and ventricular tachycardia, status post implantable cardioverter defibrillator, heart failure with reduced ejection fraction (25%) attributed to ischemic cardiomyopathy, hypertension, lower urinary tract symptoms/prostatism, and previous bladder cancer. In the mid-1960s, the patient served in the US Army and had been deployed to South Korea. After the service, he worked for the local city government. He was retired for about 15 years. He reported no tobacco, alcohol, or recreational drug use and no tattoos. He did not require prior blood or blood product transfusions. None of his family members—parents, siblings, or children—had any history of kidney disease.
The patient’s outpatient medications included levetiracetam 750 mg twice daily, melatonin 9 mg at night, menthol 16%/methyl-salicylate 30% topically up to 4 times per day as needed, aspirin 81 mg once daily, fish oil 1000 mg twice daily, amiodarone 400 mg twice daily, hydralazine 20 mg 3 times daily, isosorbide mononitrate 60 mg daily, metoprolol succinate 100 mg daily, and tamsulosin 0.4 mg at night. His vital signs were stable: afebrile (97.5 ºF), normocardic (74 beats per minute), normotensive (118/78 mm Hg), and normoxic (98% on room air). On examination, he appeared elderly, somewhat frail, and chronically ill but in no acute distress. Affect was pleasant and appropriate, attention was high, and his thought process was logical. He had sparse, grey scalp hair. Extraocular movements were intact. Oral mucosa was pink and moist. His back was nontender, and there was no costovertebral tenderness bilaterally. The patient was in no respiratory distress, with a slightly hyperresonant chest to percussion bilaterally, very faint inspiratory basilar crepitant rales (that cleared with repeat inspiration), and was otherwise clear to auscultation throughout. An outline of an implanted pacemaker was evident on the chest under his left clavicle, with a laterally displaced apical impulse. The rate was normal and the rhythm was regular. Upper extremities demonstrated papyraceous skin but without cyanosis, clubbing, or edema. Radial pulses were slightly diminished. He had no lower extremity edema.
His laboratory values are provided in Table 1. Kidney function was stable months prior to admission. Of note, the blood urea nitrogen and plasma creatinine were increased from his baseline up to 47 and 5.89 mg/dL, respectively. The serum glutamic-oxaloacetic transaminase and serum glutamic pyruvic transaminase were 1051 U/L and 408 U/L, respectively. Plasma amylase and lipase levels also were elevated, 230 U/L and 892 U/L, respectively. Creatine kinase was 41,099 U/L. Urinalysis demonstrated a specific gravity of 1.017, pH of 5, and a large amount of blood (92 red blood cells/high power field).
A 12-lead electrocardiogram demonstrated a sinus rhythm, PR interval of 0.20 ms, narrow QRS with a leftward frontal axis deviation, R-transition between precordial leads V1 and V2, and flattening of the ST segments in III, V1-V3 (Figure 1). A portable chest X-ray demonstrated clear lung fields, no evidence of effusion in the costophrenic area. Ultrasonography was conducted at the time of the examination (Figure 2). The kidneys were smoothly contoured, each measuring > 10 cm; there was an exophytic cyst on the left. Otherwise, the cortices, perhaps slightly echogenic, did not appear diminished. The bladder was not abnormally enlarged.
Rosuvastatin-induced rhabdomyolysis, pancreatitis, transaminitis, and drug-induced acute kidney injury were considered high among the diagnostic differentials. The 3-hydroxy-3-methyl-glutaryl-CoA (HMG-CoA) reductase inhibitor was stopped, and he was prescribed an acute renal insufficiency diet. All laboratory parameters improved with this change (Figure 3). Two months after presentation (and with rosuvastatin added to his list of adverse reactions), all symptoms resolved and his plasma creatinine reached a nadir of 1.22 mg/dL.
Discussion
Statin-class drugs inhibit the HMG-CoA reductase (Table 2). Upregulation of low-density lipoprotein cholesterol (LDL-C) receptors in the liver result in increased LDL-C uptake and cholesterol catabolism.1 Prescribed inhibitors of the HMG-CoA reductase—statins—are known to reduce mortality due to cardiovascular disease (CVD). Much like any other pharmaceutical agent with any measurable potency, HMG-CoA inhibitors can have AEs. Statin therapy has been associated with pancreatitis.2 Muscle toxicity is a complication of HMG-CoA reductase inhibitors, and statin-associated symptoms are a leading cause of nonadherence.3 Rosuvastatin had higher AE and drug reactions compared with that of atorvastatin and pitavastatin (35.6%, 8.7%, and 22.2%, respectively) in clinical trials for approval.4 We have reported concomitant adermatopathic dermatomyositis with statin-induced myopathy in a 48-year-old man from simvastatin (40 to 80 mg daily).1
Toxin-induced myopathy should be considered early in the differential diagnosis of weakness.5 All HMG-CoA inhibitors have been associated with acute kidney injury, particularly at high doses and also are known to induce myopathies, sometimes with inclusion bodies.1 Muscle-related AEs correlate with the potency of an HMG-CoA reductase inhibitor according to an analysis using the FDA AE Reporting System (AERS).6 Myalgia and rhabdomyolysis are well-known AEs of this class of medications. Furthermore, type II muscle atrophy—particularly in the proximal limb muscles—has been reported.5 Patients may have difficulty rising from chairs.1 Rosuvastatin had the strongest signal for muscular AEs (eg, myalgia, rhabdomyolysis, increased creatine phosphokinase level) from an FDA analysis of AERS.7
Rosuvastatin is the only HMG-CoA reductase inhibitor that causes dose-dependent increases in proteinuria and hematuria (Figure 4).8 Rosuvastatin at a 5-mg dose may induce 4 times the proteinuria as a placebo. Typically, other statins potentially reduce proteinuria (without hematuria). Proteinuria may be induced by rosuvastatin even at low doses.8 Proteinuria is attributed to how rosuvastatin impacts proximal tubular function.9 The drug is transported into the proximal tubule by the organic anion transporter-3. Acute kidney injury has been associated with several statins, including rosuvastatin.7,10 This may be associated with denuded tubular epithelia, active urinary sediment, acute tubular toxicity, vacuolated epithelial cells, and tubular cell casts. Unlike atorvastatin, the increase in proteinuria and hematuria also is dose dependent.
In patients with renal insufficiency (short of end-stage renal disease [ESRD]), most statins other than rosuvastatin are well tolerated and recommended for reduction of overall and CVD mortality risk. However, these benefits seem to diminish once ESRD is reached. Atorvastatin did not impact CVD mortality in patients with type 2 diabetes mellitus (T2DM) and ESRD (despite decreasing LDL-C).11 The AURORA study randomized 10 mg of statin vs placebo in 2776 maintenance dialysis patients aged 50 to 80 years. Rosuvastatin lowered the LDL-C but did not affect all-cause mortality (13.5 vs 14.0 events per 100 patient-years). Patients randomized to rosuvastatin had more than twice as many unclassified strokes (9 vs 4). Rosuvastatin, although efficacious in reducing LDL-C, had no impact on CVD mortality, nonfatal myocardial infarction, or nonfatal stroke.12 Post hoc analysis demonstrated that in patients with T2DM with ESRD the hazard ratio for hemorrhagic stroke was 5.2.13
Rosuvastatin ranked lower than lovastatin, pravastatin, simvastatin, atorvastatin, and fluvastatin with respect to reduction of all-cause mortality in trials of participants with or without prior coronary artery disease.14 AEs, such as rhabdomyolysis, proteinuria, nephropathy, renal failure, liver, and muscle toxicity are higher with rosuvastatin than other medications in its class.15
Conclusions
For patients with existing CVD, standard clinical practice is to encourage increased and regular physical activity, cholesterol-lowering diets, weight loss, and smoking cessation. Hypertension should be treated. Glycemia should be well controlled in the setting of T2DM. β-blockers may be beneficial in those with histories of myocardial infarction or heart failure with reduced systolic function. Statins are a valuable tool in the treatment of dyslipidemia.
Statin-induced muscle symptoms are a major reason for discontinuation and nonadherence.16 Statin-induced myalgia, myositis, and myopathy have been used interchangeably.17 Rhabdomyolysis, myalgia, increased creatine kinase, statin myopathy, and immune-mediated necrotizing myopathy are among the clinical phenotypes caused by statins.17 There are 33,695 serious cases—1808 deaths—reported with rosuvastatin in the FDA AERS as of June 30, 2021. Myalgia, pain in extremity, muscle spasms, pain, and arthralgia top the list of AEs. When statin-induced symptoms occur, adherence is rarely improved by dismissive clinicians.18
Drugs in the same class often have common therapeutic properties. Potencies and AE profiles are seldom uniform. The decision to add or change the brand of medication within a class should be balanced with considerations for the indication, duplications, simplification, AEs, appropriate dosage, and drug-drug interactions.
Acknowledgments
Brent Wagner is funded by a US Department of Veterans Affairs Merit Award (I01 BX001958), a National Institutes of Health R01 grant (DK-102085), Dialysis Clinic, Inc., and partially supported by the University of New Mexico Brain and Behavioral Health Institute (BBHI 2018-1008, 2020-21-002) and in part by the University of New Mexico’s Signature Program in Cardiovascular and Metabolic Disease (CVMD); and the University of New Mexico School of Medicine Research Allocation Committee (C-2459-RAC, New Mexico Medical Trust). Brent Wagner is an Associate Member to the University of New Mexico Health Sciences Center Autophagy, Inflammation, and Metabolism Center of Biomedical Research Excellence (AIM CoBRE) supported by NIH grant P20GM121176.
Funding
National Institutes of Health Grant R01 DK-102085, Dialysis Clinic Inc., VA Merit Award I01 BX001958, Center for Integrated Nanotechnologies User Agreement 2019AU0120, Brain & Behavioral Health Institute (grants 2018-1008, 2020-21-002), University of New Mexico’s Signature Program in Cardiovascular and Metabolic Disease (CVMD), the University of New Mexico School of Medicine Research Allocation Committee (C-2459-RAC, New Mexico Medical Trust) and a metabolomics voucher from the AIM Center (NIH P20GM121176).
1. Wagner B, Kagan-Hallet KS, Russell IJ. Concomitant presentation of adermatopathic dermatomyositis, statin myopathy, fibromyalgia syndrome, piriformis muscle myofascial pain and diabetic neuropathy. J Musculoskeletal Pain. 2003;11(2):25-30. doi:10.1300/J094v11n02_05
2. Collins R, Reith C, Emberson J, et al. Interpretation of the evidence for the efficacy and safety of statin therapy [published correction appears in Lancet. 2017 Feb 11;389(10069):602]. Lancet. 2016;388(10059):2532-2561. doi:10.1016/S0140-6736(16)31357-5
3. Stroes ES, Thompson PD, Corsini A, et al. Statin-associated muscle symptoms: impact on statin therapy-European Atherosclerosis Society Consensus Panel Statement on Assessment, Aetiology and Management. Eur Heart J. 2015;36(17):1012-1022. doi:10.1093/eurheartj/ehv043
4. Saku K, Zhang B, Noda K; PATROL Trial Investigators. Randomized head-to-head comparison of pitavastatin, atorvastatin, and rosuvastatin for safety and efficacy (quantity and quality of LDL): the PATROL trial. Circ J. 2011;75(6):1493-1505. doi:10.1253/circj.cj-10-1281
5. Wald JJ. The effects of toxins on muscle. Neurol Clin. 2000;18(3):695-718. doi:10.1016/s0733-8619(05)70219-x
6. Hoffman KB, Kraus C, Dimbil M, Golomb BA. A survey of the FDA’s AERS database regarding muscle and tendon adverse events linked to the statin drug class. PLoS One. 2012;7(8):e42866. doi:10.1371/journal.pone.0042866
7. Sakaeda T, Kadoyama K, Okuno Y. Statin-associated muscular and renal adverse events: data mining of the public version of the FDA adverse event reporting system. PLoS One. 2011;6(12):e28124. doi:10.1371/journal.pone.0028124
8. Tiwari A. An overview of statin-associated proteinuria. Drug Discov Today. 2006;11(9-10):458-464. doi:10.1016/j.drudis.2006.03.017
9. Verhulst A, Sayer R, De Broe ME, D’Haese PC, Brown CD. Human proximal tubular epithelium actively secretes but does not retain rosuvastatin. Mol Pharmacol. 2008;74(4):1084-1091. doi:10.1124/mol.108.047647
10. Jones PH, Davidson MH, Stein EA, et al. Comparison of the efficacy and safety of rosuvastatin versus atorvastatin, simvastatin, and pravastatin across doses (STELLAR* Trial). Am J Cardiol. 2003;92(2):152-160. doi:10.1016/s0002-9149(03)00530-7
11. Wanner C, Krane V, März W, et al. Atorvastatin in patients with type 2 diabetes mellitus undergoing hemodialysis [published correction appears in N Engl J Med. 2005 Oct 13;353(15):1640]. N Engl J Med. 2005;353(3):238-248. doi:10.1056/NEJMoa043545
12. Fellström BC, Jardine AG, Schmieder RE, et al. Rosuvastatin and cardiovascular events in patients undergoing hemodialysis [published correction appears in N Engl J Med. 2010 Apr 15;362(15):1450]. N Engl J Med. 2009;360(14):1395-1407. doi:10.1056/NEJMoa0810177
13. Holdaas H, Holme I, Schmieder RE, et al. Rosuvastatin in diabetic hemodialysis patients. J Am Soc Nephrol. 2011;22(7):1335-1341. doi:10.1681/ASN.2010090987
14. Naci H, Brugts JJ, Fleurence R, Tsoi B, Toor H, Ades AE. Comparative benefits of statins in the primary and secondary prevention of major coronary events and all-cause mortality: a network meta-analysis of placebo-controlled and active-comparator trials. Eur J Prev Cardiol. 2013;20(4):641-657. doi:10.1177/2047487313480435
15. Alsheikh-Ali AA, Ambrose MS, Kuvin JT, Karas RH. The safety of rosuvastatin as used in common clinical practice: a postmarketing analysis. Circulation. 2005;111(23):3051-3057. doi:10.1161/CIRCULATIONAHA.105.555482
16. Ward NC, Watts GF, Eckel RH. Statin toxicity. Circ Res. 2019;124(2):328-350. doi:10.1161/CIRCRESAHA.118.312782
17. Selva-O’Callaghan A, Alvarado-Cardenas M, Pinal-Fernández I, et al. Statin-induced myalgia and myositis: an update on pathogenesis and clinical recommendations. Expert Rev Clin Immunol. 2018;14(3):215-224. doi:10.1080/1744666X.2018.1440206
18. Koslik HJ, Meskimen AH, Golomb BA. Physicians’ Experiences as patients with statin side effects: a case series. Drug Saf Case Rep. 2017;4(1):3. doi:10.1007/s40800-017-0045-0