User login
Contralateral Constrictor Dose Predicts Swallowing Function After Radiation for Head and Neck Cancer
Radiation therapy can cause long-term dysphagia that seriously affects quality of life for survivors of head and neck (H&N) cancer.1-3 Numerous studies have linked pharyngeal constrictor dose to long-term dysphagia, but conclusions about the dose distribution that can be safely tolerated have been inconsistent. For example, a group from the Netherlands found that the mean dose to the superior pharyngeal constrictor muscle and the supraglottic larynx were each predictive of dysphagia.4 A subsequent Vanderbilt study refuted these findings, reporting that these structures were not predictive but that dose to the inferior pharyngeal constrictor muscle was.5 Other studies have connected late dysphagia with dose to the middle pharyngeal constrictor muscle, total larynx, oral cavity, contralateral submandibular gland, contralateral parotid gland, or a combination of these structures.6-14 NRG Oncology trials commonly evaluate dose to the “uninvolved pharynx,” which is the total pharyngeal constrictor muscle volume minus the planning target volume for the lowest dose target volume. NRG H&N trials 3, 4, 5, 6, 8, and 9 all use uninvolved pharynx mean dose ≤ 45 Gy as a constraint to judge radiation plan quality.
Differences in methodology or patient population may explain the inconsistency of prior studies on dosimetric predictors of dysphagia, but it is possible that these studies did not evaluate the optimal metric for dysphagia. This study evaluates a novel organ at risk, the contralateral pharyngeal constrictor muscle, to determine whether dose to this structure is predictive of late swallowing function. The study also compares a constraint based on this structure to the NRG uninvolved pharynx constraint mentioned earlier.
Methods
This study is a retrospective review of patients treated at the Richard L. Roudebush Veterans Affairs (VA) Medical Center in Indianapolis, Indiana. Patients were identified by searching the VA Cancer Registry for patients treated for H&N squamous cell carcinoma between September 1, 2016, and August 30, 2019. Eligible sites included cancers of the nasopharynx, oropharynx, hypopharynx, larynx and oral cavity, as well as H&N cancer of an unknown primary site. Only patients treated with primary radiation with concurrent systemic therapy were included. Patients were excluded if they had prior surgery or radiation to the H&N.
The pharyngeal constrictor muscles were contoured per the techniques described by Bhide and colleagues.11 The contralateral constrictor was defined as the half of the constrictor volume contralateral to the primary site. For midline tumors, the side of the neck with a lower volume of lymph node metastases was judged to be the contralateral side. 
One-year dysphagia was defined as having a gastronomy tube (G-tube) in place or an abnormal modified barium swallow (MBS) ≥ 12 months after the completion of radiation. At the study institution, MBS is not routinely done after therapy but is ordered if a patient or clinician has concerns about swallowing function. MBS was considered abnormal if there was laryngeal penetration that reached the level of the glottis or was not ejected from the larynx.
Results
The VA Cancer Registry identified 113 patients treated for H&N cancer during the study period. Of these, 55 patients met the inclusion criteria. No patients were lost to follow-up. The median follow-up was 29 months. The median age was 67 years (range, 41-83) (Table 1). 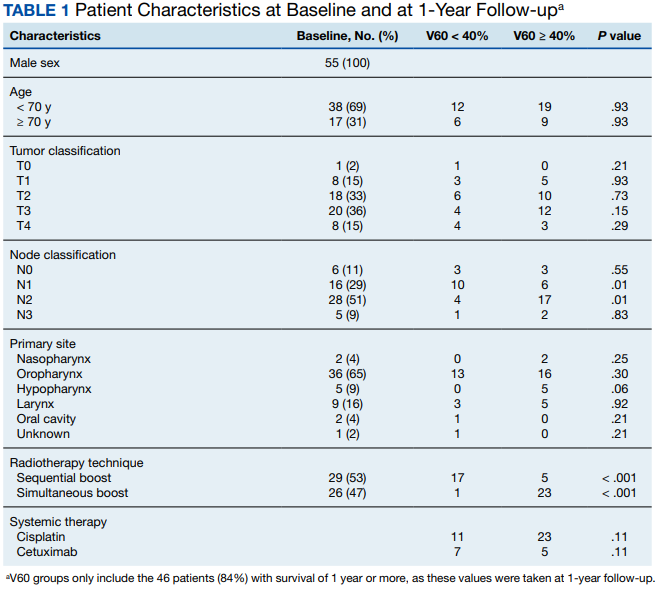
All patients were treated with intensity-modulated radiotherapy (IMRT). Patients treated with a sequential boost had an initial dose of 54 Gy and/or 50 Gy, followed by a boost to a total of 70 Gy at 2 Gy per fraction. Patients treated with a simultaneous integrated boost (SIB) technique received 69.96 Gy in 33 fractions, with elective volumes treated to 54.45 Gy in 33 fractions. Both patients with nasopharyngeal cancer were treated with SIB plans and had an intermediate dose volume of 59.4 Gy.
Systemic therapy was weekly cisplatin in 41 patients (75%) and cetuximab in 14 (25%). Twenty percent of patients receiving cisplatin switched to an alternative agent during treatment, most commonly carboplatin.
Forty-nine patients (89%) had a G-tube placed before starting radiation. G-tubes were in place for an interval of 0 to 47 months (mean, 8.6); 12 (22%) had a G-tube > 12 months. After completion of radiation, 18 patients (33%) had an abnormal MBS. These were done 1 to 50 months (mean, 14.8) after completion of radiation. Abnormal MBS occurred ≥ 12 months after radiation in 9 patients, 5 of whom had their G-tube in place for less than a year.
Forty-six patients (84%) survived more than 1 year and could be evaluated for late swallowing function. One-year dysphagia was seen in 17 (37%) of these patients. Recurrence was seen in 20 patients (36%), with locoregional recurrence in 12 (60%) of these cases. Recurrence occurred at a range of 0 to 15 months (mean, 5.6). Neither recurrence (P = .69) nor locoregional recurrence (P = .11) was associated with increased 1-year dysphagia.
In patients who could be evaluated for long-term swallowing function, contralateral constrictor V60 ranged from 0% to 100% (median, 51%). V60 was < 40% in 18 patients (39%). With V60 < 40%, there was a 6% rate of 1-year dysphagia compared with 57% for V60 ≥ 40% (P < .001).
Patients with contralateral constrictor V60 < 40 and V60 ≥ 40 both had a mean age of 65 years. χ2 analysis did not show a difference in T stage or systemic treatment but did show that patients with V60 < 40% were more likely to have N1 disease (P = .01), and less likely to have N2 disease (P = .01) compared with patients with V60 ≥ 40%. The difference in 1-year dysphagia between N0 to N1 patients (27%) and N2 to N3 patients (46%) was not statistically significant (P = .19).
In patients who could be evaluated for long-term swallowing function, the uninvolved pharynx volume median of the total constrictor volume was 32% (range, < 1%-62%). The uninvolved pharynx mean dose ranged from 28 to 68 Gy (median, 45). When the uninvolved pharynx mean dose was < 45 Gy, 1-year dysphagia was 22% compared with 52% with a dose ≥ 45 Gy (P = .03).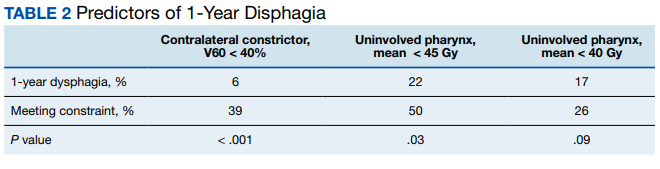
Air cavity editing was performed in 27 patients (49%). One-year survival was 93% with air cavity editing, and 75% without, which was not statistically significant. Locoregional recurrence occurred in 3 patients (11%) with air cavity editing, and 9 (32%) without, which was not statistically significant. In patients surviving at least 1 year, contralateral constrictor V60 averaged 33% with editing and 62% without editing (P < .001). One-year dysphagia was 12% with air cavity editing and 67% without editing (P < .001).
An SIB technique was done in 26 patients (47%). One-year survival was 85% (n = 22) with SIB and 83% (n = 24) with sequential boost, which was not statistically significant. Locoregional recurrence occurred in 19% with SIB, and 32% with sequential boost, which was not statistically significant. For SIB patients alive at 1 year, the median contralateral V60 was 28%, compared with 66% for patients treated with sequential technique. Seventeen patients (77%) with SIB had V60 < 40%. Nineteen (86%) of SIB plans also had air cavity editing. One patient (5%) with SIB had dysphagia at 1 year, compared with 16 (67%) sequential patients (P < .001).
Discussion
This is the first study to link contralateral constrictor dose to long-term dysphagia in patients treated with radiation for H&N cancer. Editing the boost volume off air cavities was associated with lower contralateral constrictor V60 and with less long-term dysphagia. This may indicate that optimizing plans to meet a contralateral constrictor constraint can reduce rates of long-term dysphagia.
The most useful clinical predictors are those that identify a patient at low risk for toxicity. These constraints are useful because they reassure physicians that treatments will have a favorable risk/benefit ratio while identifying plans that may need modification before starting treatment.
The contralateral constrictor outperformed the uninvolved pharynx in identifying patients at low risk for long-term dysphagia. This difference could not be overcome by decreasing the threshold of the pharynx constraint, as 17% of patients with dysphagia had a mean dose of < 40 Gy to the uninvolved pharynx, which was not statistically significant.
An advantage of contralateral constrictor is that it is independent of planning target volume (PTV) size. The uninvolved pharynx structure depends on the PTV contour, so it may obscure a connection between PTV size and dysphagia.
In the context of a clinical trial, only measuring dose to the uninvolved pharynx may allow more plans to meet constraints, but even in NRG trials, physicians have some control over target volumes. For example, NRG HN009, a national trial for patients with H&N cancer, recommends editing the CTV_7000 (clinical target volume treated to 70 Gy) off air cavities but does not define how much the volume should be cropped or specify protocol violations if the volume is not cropped.15 Furthermore, constraints used in clinical trials are often adopted for use outside the trial, where physicians have extensive control over target volumes.
The broad range of uninvolved pharynx volume relative to total constrictor volume confounds predictions using this variable. For example, according to the NRG constraint, a patient with an uninvolved pharynx mean dose of 44 Gy will have a low risk of dysphagia even if this structure is only 1% of the total constrictor. The contralateral constrictor is always about 50% of the total constrictor volume, which means that predictions using this structure will not be confounded by the same variation in volume size.
Figure 2 shows a representative patient who met the NRG uninvolved pharynx constraint but developed long-term dysphagia. 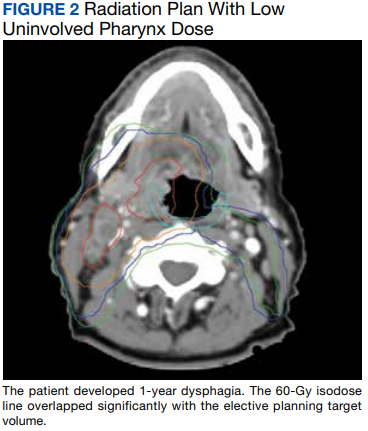
Pharyngoesophageal stricture is a common cause of dysphagia after IMRT for H&N cancer.16 Radiation has been shown to decrease pharyngeal function in patients with H&N cancer.17 Sparing one side of the pharynx may allow for better pharyngeal compliance throughout the length of the pharynx, possibly decreasing the rate of pharyngoesophageal stricture. Additionally, constraining the contralateral constrictor may preserve strength on this side, allowing it to compensate for weakness on the side of the primary cancer. An exercise sometimes used for dysphagia involves head rotation toward the affected side during swallowing. This technique has been shown to cause food to move to the unaffected side.18 Sparing the contralateral constrictor may help such techniques work better in patients with H&N cancer.
Few studies have commented specifically on dose to swallowing structures contralateral to the primary tumor. Two studies have proposed contralateral submandibular gland constraints for dysphagia (not xerostomia), but neither measured the dose to the contralateral constrictor muscle.9,10 Although the contralateral submandibular dose may correlate with dose to the constrictor on that side, the submandibular gland may have a less direct impact on swallowing than the constrictor muscle, and its limited dimensions may make constraints based on the gland less robust for cancers outside the oropharynx.
Another study reported improved quality of life in patients who were not treated with elective contralateral retropharyngeal radiation.19 Although it is likely that doses to the contralateral constrictor were lower in patients who did not receive elective radiation to this area, this study did not measure or constrain doses to the contralateral constrictors.
Limitations
This study is limited by its single institution, retrospective design, small sample size, and by all patients being male. The high correlation between air cavity editing and the use of SIB makes it impossible to assess the impact of each technique individually. Patients with contralateral constrictor V60 < 40% were less likely to have N2 disease, but N2 to N3 disease did not predict higher 1-year dysphagia, so the difference in N-category cannot fully explain the difference in 1-year dysphagia. It is possible that unreported factors, such as CTV, may contribute significantly to swallowing function. Nevertheless, within the study population, contralateral constrictor dose was able to identify a group with a low rate of long-term dysphagia.
Conclusions
Contralateral constrictor dose is a promising predictor of late dysphagia for patients with H&N cancer treated with radiation with concurrent systemic therapy. Contralateral constrictor V60 < 40% was able to identify a group of patients with a low rate of 1-year dysphagia in this single-center retrospective study. The correlation between air cavity editing and contralateral constrictor V60 suggests that contralateral constrictor dose may depend partly on technique. Further studies are needed to see if the contralateral constrictor dose can be used to predict long-term dysphagia prospectively and in other patient populations.
1. Langendijk JA, Doornaert P, Verdonck-de Leeuw IM, et al. Impact of late treatment-related toxicity on quality of life among patients with head and neck cancer treated with radiotherapy. J Clin Oncol. 2008;26(22):3770-3776. doi:10.1200/JCO.2007.14.6647
2. Nguyen NP, Frank C, Moltz CC, et al. Impact of dysphagia on quality of life after treatment of head-and-neck cancer. Int J Radiat Oncol Biol Phys. 2005;61(3):772-778. doi:10.1016/j.ijrobp.2004.06.017
3. Ramaekers BLT, Joore MA, Grutters JPC, et al. The impact of late treatment-toxicity on generic health-related quality of life in head and neck cancer patients after radiotherapy. Oral Oncol. 2011;47(8):768-774. doi:10.1016/j.oraloncology.2011.05.012
4. Christianen MEMC, Schilstra C, Beetz I, et al. Predictive modelling for swallowing dysfunction after primary (chemo)radiation: results of a prospective observational study. Radiother Oncol. 2012;105(1):107-114. doi:10.1016/j.radonc.2011.08.009
5. Vlachich G, Spratt DE, Diaz R, et al. Dose to inferior pharyngeal conctrictor predicts prolonged gastrostomy tube dependence with concurrent intensity-modulated radiation therapy and chemotherapy for locally-advanced head and neck cancer. Radiother Oncol. 2014;110(3):435-440. doi:10.1016/j.radonc.2013.12.007
6. Mogadas S, Busch CJ, Pflug Cet al. Influence of radiation dose to pharyngeal constrictor muscles on late dysphagia and quality of life in patients with locally advanced oropharyngeal carcinoma. Strahlenther Onkol. 2020;196(6):522-529. doi:10.1007/s00066-019-01572-0
7. Caglar HB, Tishler RB, Othus M, et al. Dose to larynx predicts of swallowing complications after intensity-modulated radiotherapy. Int J Radiat Oncol Biol Phys. 2008;72(4):1110-1118. doi:10.1016/j.ijrobp.2008.02.048
8. Schwartz DL, Hutcheson K, Barringer D, et al. Candidate dosimetric predictors of long-term swallowing dysfunction after oropharyngeal intensity-modulated radiotherapy. Int J Radiat Oncol Biol Phys. 2010;78(5):1356-1365. doi:10.1016/j.ijrobp.2009.10.002
9. Gensheimer MF, Nyflot M, Laramore GE, Laio JL, Parvathaneni U. Contribution of submandibular gland and swallowing structure sparing to post-radiation therapy peg dependence in oropharynx cancer patients treated with split-neck IMRT technique. Radiat Oncol. 2015;11(1):1-7. doi:10.1186/s13014-016-0726-3
10. Hedström J, Tuomi L, Finizia C, Olsson C. Identifying organs at risk for radiation-induced late dysphagia in head and neck cancer patients. Clin Transl Radiat Oncol. 2019;19:87-95. doi:10.1016/j.ctro.2019.08.005
11. Bhide SA, Gulliford S, Kazi R, et al. Correlation between dose to the pharyngeal constrictors and patient quality of life and late dysphagia following chemo-IMRT for head and neck cancer. Radiother Oncol. 2009;93(3):539-544. doi:10.1016/j.radonc.2009.09.017
12. Caudell JJ, Schaner PE, Desmond RA, Meredith RF, Spencer SA, Bonner JA. Dosimetric factors associated with long-term dysphagia after definitive radiotherapy for squamous cell carcinoma of the head and neck. Int J Radiat Oncol Biol Phys. 2010;76(2):403-409. doi:10.1016/j.ijrobp.2009.02.017
13. Levendag PC, Teguh DN, Voet P, et al. Dysphagia disorders in patients with cancer of the oropharynx are significantly affected by the radiation therapy dose to the superior and middle constrictor muscle: a dose-effect relationship. Radiother Oncol. 2007;85(1):64-73. doi:10.1016/j.radonc.2007.07.009
14. Eisbruch A, Schwartz M, Rasch C, et al. Dysphagia and aspiration after chemoradiotherapy for head-and-neck cancer: which anatomic structures are affected and can they be spared by IMRT? Int J Radiat Oncol Biol Phys. 2004;60(5):1425-1439. doi:10.1016/j.ijrobp.2004.05.050
15. Harari PM; NRG Oncology. Comparing high-dose cisplatin every three weeks to low-dose cisplatin weekly when combined with radiation for patients with advanced head and neck cancer. ClinicalTrials.gov identifier: NCT05050162. Updated November 25, 2022. Accessed December 7, 2022. https://clinicaltrials.gov/ct2/show/NCT05050162
16. Wang JJ, Goldsmith TA, Holman AS, Cianchetti M, Chan AW. Pharyngoesophageal stricture after treatment for head and neck cancer. Head Neck. 2011;34(7):967-973. doi:10.1002/hed.21842
17. Kendall KA, McKenzie SW, Leonard RJ, Jones CU. Timing of swallowing events after single-modality treatment of head and neck carcinoma with radiotherapy. Ann Otol Rhinol Laryngol. 2000;109(8, pt 1):767-775. doi:10.1177/000348940010900812
18. Ohmae Y, Ogura M, Kitahara S. Effects of head rotation on pharyngeal function during normal swallow. Ann Otol Rhinol Laryngol. 1998;107(4):344-348. doi:10.1177/000348949810700414
19. Spencer CR, Gay HA, Haughey BH, et al. Eliminating radiotherapy to the contralateral retropharyngeal and high level II lymph nodes in head and neck squamous cell carcinoma is safe and improves quality of life. Cancer. 2014;120(24):3994-4002. doi:10.1002/cncr.28938
Radiation therapy can cause long-term dysphagia that seriously affects quality of life for survivors of head and neck (H&N) cancer.1-3 Numerous studies have linked pharyngeal constrictor dose to long-term dysphagia, but conclusions about the dose distribution that can be safely tolerated have been inconsistent. For example, a group from the Netherlands found that the mean dose to the superior pharyngeal constrictor muscle and the supraglottic larynx were each predictive of dysphagia.4 A subsequent Vanderbilt study refuted these findings, reporting that these structures were not predictive but that dose to the inferior pharyngeal constrictor muscle was.5 Other studies have connected late dysphagia with dose to the middle pharyngeal constrictor muscle, total larynx, oral cavity, contralateral submandibular gland, contralateral parotid gland, or a combination of these structures.6-14 NRG Oncology trials commonly evaluate dose to the “uninvolved pharynx,” which is the total pharyngeal constrictor muscle volume minus the planning target volume for the lowest dose target volume. NRG H&N trials 3, 4, 5, 6, 8, and 9 all use uninvolved pharynx mean dose ≤ 45 Gy as a constraint to judge radiation plan quality.
Differences in methodology or patient population may explain the inconsistency of prior studies on dosimetric predictors of dysphagia, but it is possible that these studies did not evaluate the optimal metric for dysphagia. This study evaluates a novel organ at risk, the contralateral pharyngeal constrictor muscle, to determine whether dose to this structure is predictive of late swallowing function. The study also compares a constraint based on this structure to the NRG uninvolved pharynx constraint mentioned earlier.
Methods
This study is a retrospective review of patients treated at the Richard L. Roudebush Veterans Affairs (VA) Medical Center in Indianapolis, Indiana. Patients were identified by searching the VA Cancer Registry for patients treated for H&N squamous cell carcinoma between September 1, 2016, and August 30, 2019. Eligible sites included cancers of the nasopharynx, oropharynx, hypopharynx, larynx and oral cavity, as well as H&N cancer of an unknown primary site. Only patients treated with primary radiation with concurrent systemic therapy were included. Patients were excluded if they had prior surgery or radiation to the H&N.
The pharyngeal constrictor muscles were contoured per the techniques described by Bhide and colleagues.11 The contralateral constrictor was defined as the half of the constrictor volume contralateral to the primary site. For midline tumors, the side of the neck with a lower volume of lymph node metastases was judged to be the contralateral side.
One-year dysphagia was defined as having a gastronomy tube (G-tube) in place or an abnormal modified barium swallow (MBS) ≥ 12 months after the completion of radiation. At the study institution, MBS is not routinely done after therapy but is ordered if a patient or clinician has concerns about swallowing function. MBS was considered abnormal if there was laryngeal penetration that reached the level of the glottis or was not ejected from the larynx.
Results
The VA Cancer Registry identified 113 patients treated for H&N cancer during the study period. Of these, 55 patients met the inclusion criteria. No patients were lost to follow-up. The median follow-up was 29 months. The median age was 67 years (range, 41-83) (Table 1).
All patients were treated with intensity-modulated radiotherapy (IMRT). Patients treated with a sequential boost had an initial dose of 54 Gy and/or 50 Gy, followed by a boost to a total of 70 Gy at 2 Gy per fraction. Patients treated with a simultaneous integrated boost (SIB) technique received 69.96 Gy in 33 fractions, with elective volumes treated to 54.45 Gy in 33 fractions. Both patients with nasopharyngeal cancer were treated with SIB plans and had an intermediate dose volume of 59.4 Gy.
Systemic therapy was weekly cisplatin in 41 patients (75%) and cetuximab in 14 (25%). Twenty percent of patients receiving cisplatin switched to an alternative agent during treatment, most commonly carboplatin.
Forty-nine patients (89%) had a G-tube placed before starting radiation. G-tubes were in place for an interval of 0 to 47 months (mean, 8.6); 12 (22%) had a G-tube > 12 months. After completion of radiation, 18 patients (33%) had an abnormal MBS. These were done 1 to 50 months (mean, 14.8) after completion of radiation. Abnormal MBS occurred ≥ 12 months after radiation in 9 patients, 5 of whom had their G-tube in place for less than a year.
Forty-six patients (84%) survived more than 1 year and could be evaluated for late swallowing function. One-year dysphagia was seen in 17 (37%) of these patients. Recurrence was seen in 20 patients (36%), with locoregional recurrence in 12 (60%) of these cases. Recurrence occurred at a range of 0 to 15 months (mean, 5.6). Neither recurrence (P = .69) nor locoregional recurrence (P = .11) was associated with increased 1-year dysphagia.
In patients who could be evaluated for long-term swallowing function, contralateral constrictor V60 ranged from 0% to 100% (median, 51%). V60 was < 40% in 18 patients (39%). With V60 < 40%, there was a 6% rate of 1-year dysphagia compared with 57% for V60 ≥ 40% (P < .001).
Patients with contralateral constrictor V60 < 40 and V60 ≥ 40 both had a mean age of 65 years. χ2 analysis did not show a difference in T stage or systemic treatment but did show that patients with V60 < 40% were more likely to have N1 disease (P = .01), and less likely to have N2 disease (P = .01) compared with patients with V60 ≥ 40%. The difference in 1-year dysphagia between N0 to N1 patients (27%) and N2 to N3 patients (46%) was not statistically significant (P = .19).
In patients who could be evaluated for long-term swallowing function, the uninvolved pharynx volume median of the total constrictor volume was 32% (range, < 1%-62%). The uninvolved pharynx mean dose ranged from 28 to 68 Gy (median, 45). When the uninvolved pharynx mean dose was < 45 Gy, 1-year dysphagia was 22% compared with 52% with a dose ≥ 45 Gy (P = .03).
Air cavity editing was performed in 27 patients (49%). One-year survival was 93% with air cavity editing, and 75% without, which was not statistically significant. Locoregional recurrence occurred in 3 patients (11%) with air cavity editing, and 9 (32%) without, which was not statistically significant. In patients surviving at least 1 year, contralateral constrictor V60 averaged 33% with editing and 62% without editing (P < .001). One-year dysphagia was 12% with air cavity editing and 67% without editing (P < .001).
An SIB technique was done in 26 patients (47%). One-year survival was 85% (n = 22) with SIB and 83% (n = 24) with sequential boost, which was not statistically significant. Locoregional recurrence occurred in 19% with SIB, and 32% with sequential boost, which was not statistically significant. For SIB patients alive at 1 year, the median contralateral V60 was 28%, compared with 66% for patients treated with sequential technique. Seventeen patients (77%) with SIB had V60 < 40%. Nineteen (86%) of SIB plans also had air cavity editing. One patient (5%) with SIB had dysphagia at 1 year, compared with 16 (67%) sequential patients (P < .001).
Discussion
This is the first study to link contralateral constrictor dose to long-term dysphagia in patients treated with radiation for H&N cancer. Editing the boost volume off air cavities was associated with lower contralateral constrictor V60 and with less long-term dysphagia. This may indicate that optimizing plans to meet a contralateral constrictor constraint can reduce rates of long-term dysphagia.
The most useful clinical predictors are those that identify a patient at low risk for toxicity. These constraints are useful because they reassure physicians that treatments will have a favorable risk/benefit ratio while identifying plans that may need modification before starting treatment.
The contralateral constrictor outperformed the uninvolved pharynx in identifying patients at low risk for long-term dysphagia. This difference could not be overcome by decreasing the threshold of the pharynx constraint, as 17% of patients with dysphagia had a mean dose of < 40 Gy to the uninvolved pharynx, which was not statistically significant.
An advantage of contralateral constrictor is that it is independent of planning target volume (PTV) size. The uninvolved pharynx structure depends on the PTV contour, so it may obscure a connection between PTV size and dysphagia.
In the context of a clinical trial, only measuring dose to the uninvolved pharynx may allow more plans to meet constraints, but even in NRG trials, physicians have some control over target volumes. For example, NRG HN009, a national trial for patients with H&N cancer, recommends editing the CTV_7000 (clinical target volume treated to 70 Gy) off air cavities but does not define how much the volume should be cropped or specify protocol violations if the volume is not cropped.15 Furthermore, constraints used in clinical trials are often adopted for use outside the trial, where physicians have extensive control over target volumes.
The broad range of uninvolved pharynx volume relative to total constrictor volume confounds predictions using this variable. For example, according to the NRG constraint, a patient with an uninvolved pharynx mean dose of 44 Gy will have a low risk of dysphagia even if this structure is only 1% of the total constrictor. The contralateral constrictor is always about 50% of the total constrictor volume, which means that predictions using this structure will not be confounded by the same variation in volume size.
Figure 2 shows a representative patient who met the NRG uninvolved pharynx constraint but developed long-term dysphagia.
Pharyngoesophageal stricture is a common cause of dysphagia after IMRT for H&N cancer.16 Radiation has been shown to decrease pharyngeal function in patients with H&N cancer.17 Sparing one side of the pharynx may allow for better pharyngeal compliance throughout the length of the pharynx, possibly decreasing the rate of pharyngoesophageal stricture. Additionally, constraining the contralateral constrictor may preserve strength on this side, allowing it to compensate for weakness on the side of the primary cancer. An exercise sometimes used for dysphagia involves head rotation toward the affected side during swallowing. This technique has been shown to cause food to move to the unaffected side.18 Sparing the contralateral constrictor may help such techniques work better in patients with H&N cancer.
Few studies have commented specifically on dose to swallowing structures contralateral to the primary tumor. Two studies have proposed contralateral submandibular gland constraints for dysphagia (not xerostomia), but neither measured the dose to the contralateral constrictor muscle.9,10 Although the contralateral submandibular dose may correlate with dose to the constrictor on that side, the submandibular gland may have a less direct impact on swallowing than the constrictor muscle, and its limited dimensions may make constraints based on the gland less robust for cancers outside the oropharynx.
Another study reported improved quality of life in patients who were not treated with elective contralateral retropharyngeal radiation.19 Although it is likely that doses to the contralateral constrictor were lower in patients who did not receive elective radiation to this area, this study did not measure or constrain doses to the contralateral constrictors.
Limitations
This study is limited by its single institution, retrospective design, small sample size, and by all patients being male. The high correlation between air cavity editing and the use of SIB makes it impossible to assess the impact of each technique individually. Patients with contralateral constrictor V60 < 40% were less likely to have N2 disease, but N2 to N3 disease did not predict higher 1-year dysphagia, so the difference in N-category cannot fully explain the difference in 1-year dysphagia. It is possible that unreported factors, such as CTV, may contribute significantly to swallowing function. Nevertheless, within the study population, contralateral constrictor dose was able to identify a group with a low rate of long-term dysphagia.
Conclusions
Contralateral constrictor dose is a promising predictor of late dysphagia for patients with H&N cancer treated with radiation with concurrent systemic therapy. Contralateral constrictor V60 < 40% was able to identify a group of patients with a low rate of 1-year dysphagia in this single-center retrospective study. The correlation between air cavity editing and contralateral constrictor V60 suggests that contralateral constrictor dose may depend partly on technique. Further studies are needed to see if the contralateral constrictor dose can be used to predict long-term dysphagia prospectively and in other patient populations.
1. Langendijk JA, Doornaert P, Verdonck-de Leeuw IM, et al. Impact of late treatment-related toxicity on quality of life among patients with head and neck cancer treated with radiotherapy. J Clin Oncol. 2008;26(22):3770-3776. doi:10.1200/JCO.2007.14.6647
2. Nguyen NP, Frank C, Moltz CC, et al. Impact of dysphagia on quality of life after treatment of head-and-neck cancer. Int J Radiat Oncol Biol Phys. 2005;61(3):772-778. doi:10.1016/j.ijrobp.2004.06.017
3. Ramaekers BLT, Joore MA, Grutters JPC, et al. The impact of late treatment-toxicity on generic health-related quality of life in head and neck cancer patients after radiotherapy. Oral Oncol. 2011;47(8):768-774. doi:10.1016/j.oraloncology.2011.05.012
4. Christianen MEMC, Schilstra C, Beetz I, et al. Predictive modelling for swallowing dysfunction after primary (chemo)radiation: results of a prospective observational study. Radiother Oncol. 2012;105(1):107-114. doi:10.1016/j.radonc.2011.08.009
5. Vlachich G, Spratt DE, Diaz R, et al. Dose to inferior pharyngeal conctrictor predicts prolonged gastrostomy tube dependence with concurrent intensity-modulated radiation therapy and chemotherapy for locally-advanced head and neck cancer. Radiother Oncol. 2014;110(3):435-440. doi:10.1016/j.radonc.2013.12.007
6. Mogadas S, Busch CJ, Pflug Cet al. Influence of radiation dose to pharyngeal constrictor muscles on late dysphagia and quality of life in patients with locally advanced oropharyngeal carcinoma. Strahlenther Onkol. 2020;196(6):522-529. doi:10.1007/s00066-019-01572-0
7. Caglar HB, Tishler RB, Othus M, et al. Dose to larynx predicts of swallowing complications after intensity-modulated radiotherapy. Int J Radiat Oncol Biol Phys. 2008;72(4):1110-1118. doi:10.1016/j.ijrobp.2008.02.048
8. Schwartz DL, Hutcheson K, Barringer D, et al. Candidate dosimetric predictors of long-term swallowing dysfunction after oropharyngeal intensity-modulated radiotherapy. Int J Radiat Oncol Biol Phys. 2010;78(5):1356-1365. doi:10.1016/j.ijrobp.2009.10.002
9. Gensheimer MF, Nyflot M, Laramore GE, Laio JL, Parvathaneni U. Contribution of submandibular gland and swallowing structure sparing to post-radiation therapy peg dependence in oropharynx cancer patients treated with split-neck IMRT technique. Radiat Oncol. 2015;11(1):1-7. doi:10.1186/s13014-016-0726-3
10. Hedström J, Tuomi L, Finizia C, Olsson C. Identifying organs at risk for radiation-induced late dysphagia in head and neck cancer patients. Clin Transl Radiat Oncol. 2019;19:87-95. doi:10.1016/j.ctro.2019.08.005
11. Bhide SA, Gulliford S, Kazi R, et al. Correlation between dose to the pharyngeal constrictors and patient quality of life and late dysphagia following chemo-IMRT for head and neck cancer. Radiother Oncol. 2009;93(3):539-544. doi:10.1016/j.radonc.2009.09.017
12. Caudell JJ, Schaner PE, Desmond RA, Meredith RF, Spencer SA, Bonner JA. Dosimetric factors associated with long-term dysphagia after definitive radiotherapy for squamous cell carcinoma of the head and neck. Int J Radiat Oncol Biol Phys. 2010;76(2):403-409. doi:10.1016/j.ijrobp.2009.02.017
13. Levendag PC, Teguh DN, Voet P, et al. Dysphagia disorders in patients with cancer of the oropharynx are significantly affected by the radiation therapy dose to the superior and middle constrictor muscle: a dose-effect relationship. Radiother Oncol. 2007;85(1):64-73. doi:10.1016/j.radonc.2007.07.009
14. Eisbruch A, Schwartz M, Rasch C, et al. Dysphagia and aspiration after chemoradiotherapy for head-and-neck cancer: which anatomic structures are affected and can they be spared by IMRT? Int J Radiat Oncol Biol Phys. 2004;60(5):1425-1439. doi:10.1016/j.ijrobp.2004.05.050
15. Harari PM; NRG Oncology. Comparing high-dose cisplatin every three weeks to low-dose cisplatin weekly when combined with radiation for patients with advanced head and neck cancer. ClinicalTrials.gov identifier: NCT05050162. Updated November 25, 2022. Accessed December 7, 2022. https://clinicaltrials.gov/ct2/show/NCT05050162
16. Wang JJ, Goldsmith TA, Holman AS, Cianchetti M, Chan AW. Pharyngoesophageal stricture after treatment for head and neck cancer. Head Neck. 2011;34(7):967-973. doi:10.1002/hed.21842
17. Kendall KA, McKenzie SW, Leonard RJ, Jones CU. Timing of swallowing events after single-modality treatment of head and neck carcinoma with radiotherapy. Ann Otol Rhinol Laryngol. 2000;109(8, pt 1):767-775. doi:10.1177/000348940010900812
18. Ohmae Y, Ogura M, Kitahara S. Effects of head rotation on pharyngeal function during normal swallow. Ann Otol Rhinol Laryngol. 1998;107(4):344-348. doi:10.1177/000348949810700414
19. Spencer CR, Gay HA, Haughey BH, et al. Eliminating radiotherapy to the contralateral retropharyngeal and high level II lymph nodes in head and neck squamous cell carcinoma is safe and improves quality of life. Cancer. 2014;120(24):3994-4002. doi:10.1002/cncr.28938
New Razor Technology Improves Appearance and Quality of Life in Men With Pseudofolliculitis Barbae
Pseudofolliculitis barbae (PFB)(also known as razor bumps or shaving bumps)1 is a skin condition that consists of papules resulting from ingrown hairs.2 In more severe cases, papules become pustules, then abscesses, which can cause scarring.1,2 The condition can be distressing for patients, with considerable negative impact on their daily lives.3 The condition also is associated with shaving-related stinging, burning, pruritus, and cuts on the skin.4
Pseudofolliculitis barbae is most common in men of African descent due to the curved nature of the hair follicle,2,5,6 with an estimated prevalence in this population of 45% to 83%,1,6 but it can affect men of other ethnicities.7 A genetic polymorphism in a gene encoding a keratin specific to the hair follicle also has been found to predispose some individuals to PFB.5 When hair from a curved or destabilized hair follicle is cut to form a sharp tip, it is susceptible to extrafollicular and/or transfollicular penetration,5,6,8 as illustrated in Figure 1.

With extrafollicular or transfollicular penetration, the hair shaft re-enters or retracts into the dermis, triggering an inflammatory response that may be exacerbated by subsequent shaving.2 Few studies have been published that aim to identify potential shaving solutions for individuals with PFB who elect to or need to continue shaving.
A new razor technology comprising 2 blades separated by a bridge feature has been designed specifically for men with razor bumps (SkinGuard [Procter & Gamble]). The SkinGuard razor redistributes shaving pressure so that there is less force from the blades on the skin and inflamed lesions than without the bridge, as seen in Figure 2. The razor has been designed to protect the skin from the blades, thereby minimizing the occurrence of new lesions and allowing existing lesions to heal.
![Test razor bridge feature (SkinGuard [Procter & Gamble]) minimizes the force of the razor blades on the skin. Copyright 2022 The Procter & Gamble Company.](https://cdn.mdedge.com/files/s3fs-public/Moran_2.jpg "Test razor bridge feature (SkinGuard [Procter & Gamble]) minimizes the force of the razor blades on the skin. Copyright 2022 The Procter & Gamble Company.")
The primary purpose of this study was to assess the appearance of males with razor bumps and shaving irritation when using the new razor technology in a regular shaving routine. The secondary objective was to measure satisfaction of the shaving experience when using the new razor by means of assessing itching, burning, and stinging using the participant global severity assessment (PGSA) and the impact on quality of life (QOL) measures.
Methods
Participants—Eligible participants were male, aged 20 to 60 years, and had clinically diagnosed PFB as well as symptoms of skin irritation from shaving. Participants were recruited from a dermatology clinic and via institutional review board–approved advertising.
Those eligible for inclusion in the study had a shaving routine that comprised shaving at least 3 times a week using a wet-shave, blade-razor technique accompanied by only a shave gel or foam. In addition, eligible participants had mild to moderate symptoms of skin irritation (a minimum of 10 razor bumps) from shaving based on investigator global severity assessment (IGSA) rating scales and were willing to shave at least 5 times a week during the study period. Participants could continue certain topical and systemic interventions for their skin.
Participants were excluded from the study if they had an underlying inflammatory disease that could manifest with a skin rash or were using any of these medications: topical benzoyl peroxide, topical clindamycin, topical retinoids, or oral antibiotics.
Study Design—A prospective, open-label study was conducted over a period of 12 weeks at a single site in the United States. Investigators instructed participants to shave 5 or more times per week with the test razor and to keep a daily shaving journal to track the number of shaves and compliance.
Participants were evaluated at the baseline screening visit, then at 4, 8, and 12 weeks. Evaluations included an investigator lesion count, the IGSA, and the PGSA. The PGSA was used to evaluate subjective clinical measurements (ie, indicate how much postshave burning/itching/stinging the participant was experiencing). The impact of shaving on daily life was evaluated at the baseline screening visit and at 12 weeks with the Participant Quality of Life Questionnaire comprised of 22 QOL statements. eTable 1 summarizes the investigator assessments used in the study, and eTable 2 summarizes the participant self-assessments. Both tables include the scale details and results interpretation for each assessment.

The study was approved by the local institutional review board, and all participants provided written informed consent in accordance with Title 21 of the Code of Federal Regulations, Part 50.

Study Visits—At the baseline screening visit, participants provided written informed consent and completed a prestudy shave questionnaire concerning shaving preparations, techniques, and opinions. Participants also provided a medical history, including prior and concomitant medications, and were evaluated using the inclusion/exclusion criteria. Investigators explained adverse event reporting to the participants. Participants were provided with an adequate supply of test razors for the 12-week period.
Data Analysis—Means and SDs were calculated for the study measures assessed at each visit. Analyses were performed evaluating change from baseline in repeated-measures analysis of variance models. These models were adjusted for baseline levels of the outcome measure and visit number. The magnitude of change from baseline was evaluated against a null hypothesis of 0% change. This longitudinal model adjusted for any potential differing baseline levels among participants. Statistical significance was defined as P<.05. SAS version 9.4 (SAS Institute Inc) was used for all analyses.
Results
In total, 21 individuals were enrolled, and 20 completed the study. Participants who completed the study were non-Hispanic Black (n=10); non-Hispanic White (n=8); Asian (n=1); or White, American Indian (n=1). All participants adhered to the protocol and reported shaving at least 5 times a week for 12 weeks using the test razor. One participant was removed after he was found to have a history of sarcoidosis, making him ineligible for the study. No study-related adverse events were reported.
Papules and Pustules—Over the course of the 12-week study, the papule count decreased significantly from baseline. Results from the investigator lesion count (see eTable 1 for key) indicated that by week 12—adjusted for number of papules at baseline—the mean percentage reduction was estimated to be 59.6% (P<.0001). A significant decrease in papule count also was observed between the baseline visit and week 8 (57.2%; P<.0001). A nonsignificant decrease was observed at week 4 (18.9%; P=.17). Only 3 participants presented with pustules at baseline, and the pustule count remained low over the course of the study. No significant change was noted at week 12 vs baseline (P=.98). Notably, there was no increase in pustule count at the end of the study compared with baseline (Table 1).
Skin Appearance—An improvement in the skin’s appearance over the course of the study from baseline was consistent with an improvement in the IGSA. The IGSA score significantly improved from a mean (SD) measurement of 2.5 (0.6) (indicating mild to moderate inflammation) at baseline to 1.4 (0.8) at week 8 (P<.0001) and 1.2 (1.1) (indicating mild inflammation to almost clear) at week 12 (P<.0001). The observed decrease in severity of skin condition and skin inflammation is shown in Figure 3.
 scores (0=clear; 1=almost clear; 2=mild; 3=moderate; 4=severe; 5=very severe) from baseline to 12 weeks. Error bars indicate SD.")
Significant improvements were observed in every category of the PGSA at week 12 vs baseline (P≤.0007)(Table 2). At week 12, there was a significant (P≤.05) increase from baseline in participant agreement for all 22 QOL metrics describing positive shave experience, achieving results, skin feel, self-confidence, and social interactions (Figure 4), which supports the positive impact of adopting a shaving regimen with the test razor. Notably, after using the test razor for 12 weeks, men reported that they were more likely to agree with the statements “my skin felt smooth,” “my skin felt good to touch,” and “I was able to achieve a consistently good shave.” Other meaningful increases occurred in “shaving was something I looked forward to doing,” “others thought I looked clean cut,” “I looked my best for my family/others/work,” and “I felt comfortable/confident getting closer to others.” All QOL statements are shown in Figure 4.
 scores at baseline (visit 1) and at week 12 (visit 4). All week 12 scores were significantly higher (P≤.05 vs baseline)")
Comment
Improvement With Novel Razor Technology—For the first time, frequent use of a novel razor technology designed specifically for men with PFB was found to significantly improve skin appearance, shave satisfaction, and QOL after 12 weeks vs baseline in participants clinically diagnosed with PFB. In men with shave-related skin irritation and razor bumps who typically wet-shaved with a razor at least 3 times a week, use of the test razor with their regular shaving preparation product 5 or more times per week for 12 weeks was associated with significant improvements from baseline in investigator lesion count, IGSA, PGSA, and Participant Quality of Life Questionnaire measurements.
Study strengths included the quantification of the change in the number of lesions and the degree of severity by a trained investigator in a prospective clinical study along with an assessment of the impact on participant QOL. A lack of a control arm could be considered a limitation of the study; however, study end points were evaluated compared with baseline, with each participant serving as their own control. Spontaneous resolution of the condition with their standard routine was considered highly unlikely in these participants; therefore, in the absence of any other changes, improvements were attributed to regular use of the test product over the course of the study. The results presented here provide strong support for the effectiveness of the new razor technology in improving the appearance of men with razor bumps and shaving irritation.
Hair Removal Tools for the Management of PFB—Although various tools and techniques have been proposed in the past for men with PFB, the current test razor technology provided unique benefits, including improvements in appearance and severity of the condition as well as a positive impact on QOL. In 1979, Conte and Lawrence9 evaluated the effect of using an electric hair clipper and twice-daily use of a skin-cleansing pad on the occurrence of PFB. Participants (n=96) allowed their beards to grow out for 1 month, after which they started shaving with an electric clipper with a triple O head. The authors reported a favorable response in 95% (91/96) of cases. However, the electric clippers left 1 mm of beard at the skin level,9 which may not be acceptable for those who prefer a clean-shaven appearance.6
A prospective survey of 22 men of African descent with PFB found use of a safety razor was preferred over an electric razor.10 The single-arm study evaluated use of a foil-guarded shaver (single-razor blade) in the management of PFB based on investigator lesion counts and a participant questionnaire. Participants were asked to shave at least every other day and use a specially designed preshave brush. A mean reduction in lesion counts was observed at 2 weeks (29.6%), 4 weeks (38.1%), and 6 weeks (47.1%); statistical significance was not reported. At 6 weeks, 77.3% (17/22) of participants judged the foil-guarded shaver to be superior to other shaving devices in controlling their razor bumps, and 90.9% (20/22) indicated they would recommend the shaver to others with PFB. The authors hypothesized that the guard buffered the skin from the blade, which might otherwise facilitate the penetration of ingrowing hairs and cause trauma to existing lesions.
The mean reduction in lesion count from baseline observed at week 4 was greater in the study with the foil-guarded shaver and preshave brush (38% reduction)10 than in our study (19% reduction in papule count). Different methodologies, use of a preshave brush in the earlier study, and a difference in lesion severity at baseline may have contributed to this difference. The study with the foil-guarded shaver concluded after 6 weeks, and there was a 47.1% reduction in lesion counts vs baseline.10 In contrast, the current study continued for 12 weeks, and a 59.6% reduction in lesion counts was reported. Participants from both studies reported an improved shaving experience compared with their usual practice,10 though only the current study explored the positive impact of the new razor technology on participant QOL.
Preventing Hairs From Being Cut Too Close—The closeness of the shave is believed to be a contributory factor in the development and persistence of PFB6,8,11 based on a tendency for the distal portion of tightly curled hair shafts to re-enter the skin after shaving via transfollicular penetration.12 Inclusion of a buffer in the razor between the sharp blades and the skin has been proposed to prevent hairs from being cut too close and causing transfollicular penetration.12
In the test razor used in the current study, the bridge technology acted as the buffer to prevent hairs from being cut too close to the skin and to reduce blade contact with the skin (Figure 2). Having only 2 blades also reduced the closeness of the shave compared with 5-bladed technologies,13 as each hair can only be pulled and cut up to a maximum of 2 times per shaving stroke. Notably, this did not impact the participants’ QOL scores related to achieving a close shave or skin feeling smooth; both attributes were significantly improved at 12 weeks vs baseline (Figure 4).
By reducing blade contact with the skin, the bridge technology in the test razor was designed to prevent excessive force from being applied to the skin through the blades. Reduced blade loading minimizes contact with and impact on sensitive skin.14 Additional design features of the test razor to minimize the impact of shaving on the skin include treatment of the 2 blades with low-friction coatings, which allows the blades to cut through the beard hair with minimal force, helping to reduce the tug-and-pull effect that may otherwise result in irritation and inflammation.13,15 Lubrication strips before and after the blades in the test razor reduce friction between the blades and the skin to further protect the skin from the blades.15
Shaving With Multiblade Razors Does Not Exacerbate PFB—In a 1-week, split-faced, randomized study of 45 Black men, shaving with a manual 3-bladed razor was compared with use of 3 different chemical depilatory formulations.16 Shaving every other day for 1 week with the manual razor resulted in more papule formation but less irritation than use of the depilatories. The authors concluded that a study with longer duration was needed to explore the impact of shaving on papule formation in participants with a history of PFB.16
In 2013, an investigator-blinded study of 90 African American men with PFB compared the impact of different shaving regimens on the signs and symptoms of PFB over a 12-week period.4 Participants were randomized to 1 of 3 arms: (1) shaving 2 to 3 times per week with a triple-blade razor and standard products (control group); (2) shaving daily with a 5-bladed razor and standard products; and (3) shaving daily with a 5-bladed razor and “advanced” specific pre- and postshave products. The researchers found that the mean papule measurement significantly decreased from baseline in the advanced (P=.01) and control (P=.016) groups. Between-group comparison revealed no significant differences for papule or pustule count among each arm. For the investigator-graded severity, the change from baseline was significant for all 3 groups (P≤.04); however, the differences among groups were not significant. Importantly, these data demonstrated that PFB was not exacerbated by multiblade razors used as part of a daily shaving regimen.4
The findings of the current study were consistent with those of Daniel et al4 in that there was no exacerbation of the signs and symptoms of PFB associated with daily shaving. However, rather than requiring participants to change their entire shaving regimen, the present study only required a change of razor type. Moreover, the use of the new razor technology significantly decreased papule counts at week 12 vs the baseline measurement (P<.0001) and was associated with an improvement in subjective skin severity measurements. The participants in the present study reported significantly less burning, stinging, and itching after using the test product for 12 weeks (P<.0001).
Impact of Treatment on QOL—The current study further expanded on prior findings by combining these clinical end points with the QOL results to assess the test razor’s impact on participants’ lives. Results showed that over the course of 12 weeks, the new razor technology significantly improved the participants’ QOL in all questions related to shaving experience, achieving results, skin feel, self-confidence, and social interactions. The significant improvement in QOL included statements such as “shaving was a pleasant experience,” “I was able to achieve a consistently good shave,” and “my skin felt smooth.” Participants also reported improvements in meaningful categories such as “my shave made me feel attractive” and “I felt comfortable/confident getting closer to others.” As the current study showed, a shave regimen has the potential to change participants’ overall assessment of their QOL, a variable that must not be overlooked.
Conclusion
In men with clinically diagnosed PFB, regular shaving with a razor designed to protect the skin was found to significantly decrease lesion counts, increase shave satisfaction, and improve QOL after 12 weeks compared with their usual shaving practice (baseline measures). This razor technology provides another option to help manage PFB for men who wish to or need to continue shaving.
Acknowledgments—The clinical study was funded by the Procter & Gamble Company. Editorial writing assistance, supported financially by the Procter & Gamble Company, was provided by Gill McFeat, PhD, of McFeat Science Ltd (Devon, United Kingdom).
- Alexander AM, Delph WI. Pseudofolliculitis barbae in the military. a medical, administrative and social problem. J Natl Med Assoc. 1974;66:459-464, 479.
- Kligman AM, Strauss JS. Pseudofolliculitis of the beard. AMA Arch Derm. 1956;74:533-542.
- Banta J, Bowen C, Wong E, et al. Perceptions of shaving profiles and their potential impacts on career progression in the United States Air Force. Mil Med. 2021;186:187-189.
- Daniel A, Gustafson CJ, Zupkosky PJ, et al. Shave frequency and regimen variation effects on the management of pseudofolliculitis barbae. J Drugs Dermatol. 2013;12:410-418.
- Winter H, Schissel D, Parry DA, et al. An unusual Ala12Thr polymorphism in the 1A alpha-helical segment of the companion layer-specific keratin K6hf: evidence for a risk factor in the etiology of the common hair disorder pseudofolliculitis barbae. J Invest Dermatol. 2004;122:652-657.
- Perry PK, Cook-Bolden FE, Rahman Z, et al. Defining pseudofolliculitis barbae in 2001: a review of the literature and current trends. J Am Acad Dermatol. 2002;46(2 suppl understanding):S113-S119.
- McMichael AJ. Hair and scalp disorders in ethnic populations. Dermatol Clin. 2003;21:629-644.
- Ribera M, Fernández-Chico N, Casals M. Pseudofolliculitis barbae [in Spanish]. Actas Dermosifiliogr. 2010;101:749-757.
- Conte MS, Lawrence JE. Pseudofolliculitis barbae. no ‘pseudoproblem.’ JAMA. 1979;241:53-54.
- Alexander AM. Evaluation of a foil-guarded shaver in the management of pseudofolliculitis barbae. Cutis. 1981;27:534-537, 540-542.
- Weiss AN, Arballo OM, Miletta NR, et al. Military grooming standards and their impact on skin diseases of the head and neck. Cutis. 2018;102:328;331-333.
- Alexis A, Heath CR, Halder RM. Folliculitis keloidalis nuchae and pseudofolliculitis barbae: are prevention and effective treatment within reach? Dermatol Clin. 2014;32:183-191.
- Cowley K, Vanoosthuyze K, Ertel K, et al. Blade shaving. In: Draelos ZD, ed. Cosmetic Dermatology: Products and Procedures. 2nd ed. John Wiley & Sons; 2015:166-173.
- Cowley K, Vanoosthuyze K. Insights into shaving and its impact on skin. Br J Dermatol. 2012;166(suppl 1):6-12.
- Cowley K, Vanoosthuyze K. The biomechanics of blade shaving. Int J Cosmet Sci. 2016;38(suppl 1):17-23.
- Kindred C, Oresajo CO, Yatskayer M, et al. Comparative evaluation of men’s depilatory composition versus razor in black men. Cutis. 2011;88:98-103.
Pseudofolliculitis barbae (PFB)(also known as razor bumps or shaving bumps)1 is a skin condition that consists of papules resulting from ingrown hairs.2 In more severe cases, papules become pustules, then abscesses, which can cause scarring.1,2 The condition can be distressing for patients, with considerable negative impact on their daily lives.3 The condition also is associated with shaving-related stinging, burning, pruritus, and cuts on the skin.4
Pseudofolliculitis barbae is most common in men of African descent due to the curved nature of the hair follicle,2,5,6 with an estimated prevalence in this population of 45% to 83%,1,6 but it can affect men of other ethnicities.7 A genetic polymorphism in a gene encoding a keratin specific to the hair follicle also has been found to predispose some individuals to PFB.5 When hair from a curved or destabilized hair follicle is cut to form a sharp tip, it is susceptible to extrafollicular and/or transfollicular penetration,5,6,8 as illustrated in Figure 1.
With extrafollicular or transfollicular penetration, the hair shaft re-enters or retracts into the dermis, triggering an inflammatory response that may be exacerbated by subsequent shaving.2 Few studies have been published that aim to identify potential shaving solutions for individuals with PFB who elect to or need to continue shaving.
A new razor technology comprising 2 blades separated by a bridge feature has been designed specifically for men with razor bumps (SkinGuard [Procter & Gamble]). The SkinGuard razor redistributes shaving pressure so that there is less force from the blades on the skin and inflamed lesions than without the bridge, as seen in Figure 2. The razor has been designed to protect the skin from the blades, thereby minimizing the occurrence of new lesions and allowing existing lesions to heal.
The primary purpose of this study was to assess the appearance of males with razor bumps and shaving irritation when using the new razor technology in a regular shaving routine. The secondary objective was to measure satisfaction of the shaving experience when using the new razor by means of assessing itching, burning, and stinging using the participant global severity assessment (PGSA) and the impact on quality of life (QOL) measures.
Methods
Participants—Eligible participants were male, aged 20 to 60 years, and had clinically diagnosed PFB as well as symptoms of skin irritation from shaving. Participants were recruited from a dermatology clinic and via institutional review board–approved advertising.
Those eligible for inclusion in the study had a shaving routine that comprised shaving at least 3 times a week using a wet-shave, blade-razor technique accompanied by only a shave gel or foam. In addition, eligible participants had mild to moderate symptoms of skin irritation (a minimum of 10 razor bumps) from shaving based on investigator global severity assessment (IGSA) rating scales and were willing to shave at least 5 times a week during the study period. Participants could continue certain topical and systemic interventions for their skin.
Participants were excluded from the study if they had an underlying inflammatory disease that could manifest with a skin rash or were using any of these medications: topical benzoyl peroxide, topical clindamycin, topical retinoids, or oral antibiotics.
Study Design—A prospective, open-label study was conducted over a period of 12 weeks at a single site in the United States. Investigators instructed participants to shave 5 or more times per week with the test razor and to keep a daily shaving journal to track the number of shaves and compliance.
Participants were evaluated at the baseline screening visit, then at 4, 8, and 12 weeks. Evaluations included an investigator lesion count, the IGSA, and the PGSA. The PGSA was used to evaluate subjective clinical measurements (ie, indicate how much postshave burning/itching/stinging the participant was experiencing). The impact of shaving on daily life was evaluated at the baseline screening visit and at 12 weeks with the Participant Quality of Life Questionnaire comprised of 22 QOL statements. eTable 1 summarizes the investigator assessments used in the study, and eTable 2 summarizes the participant self-assessments. Both tables include the scale details and results interpretation for each assessment.
The study was approved by the local institutional review board, and all participants provided written informed consent in accordance with Title 21 of the Code of Federal Regulations, Part 50.
Study Visits—At the baseline screening visit, participants provided written informed consent and completed a prestudy shave questionnaire concerning shaving preparations, techniques, and opinions. Participants also provided a medical history, including prior and concomitant medications, and were evaluated using the inclusion/exclusion criteria. Investigators explained adverse event reporting to the participants. Participants were provided with an adequate supply of test razors for the 12-week period.
Data Analysis—Means and SDs were calculated for the study measures assessed at each visit. Analyses were performed evaluating change from baseline in repeated-measures analysis of variance models. These models were adjusted for baseline levels of the outcome measure and visit number. The magnitude of change from baseline was evaluated against a null hypothesis of 0% change. This longitudinal model adjusted for any potential differing baseline levels among participants. Statistical significance was defined as P<.05. SAS version 9.4 (SAS Institute Inc) was used for all analyses.
Results
In total, 21 individuals were enrolled, and 20 completed the study. Participants who completed the study were non-Hispanic Black (n=10); non-Hispanic White (n=8); Asian (n=1); or White, American Indian (n=1). All participants adhered to the protocol and reported shaving at least 5 times a week for 12 weeks using the test razor. One participant was removed after he was found to have a history of sarcoidosis, making him ineligible for the study. No study-related adverse events were reported.
Papules and Pustules—Over the course of the 12-week study, the papule count decreased significantly from baseline. Results from the investigator lesion count (see eTable 1 for key) indicated that by week 12—adjusted for number of papules at baseline—the mean percentage reduction was estimated to be 59.6% (P<.0001). A significant decrease in papule count also was observed between the baseline visit and week 8 (57.2%; P<.0001). A nonsignificant decrease was observed at week 4 (18.9%; P=.17). Only 3 participants presented with pustules at baseline, and the pustule count remained low over the course of the study. No significant change was noted at week 12 vs baseline (P=.98). Notably, there was no increase in pustule count at the end of the study compared with baseline (Table 1).
Skin Appearance—An improvement in the skin’s appearance over the course of the study from baseline was consistent with an improvement in the IGSA. The IGSA score significantly improved from a mean (SD) measurement of 2.5 (0.6) (indicating mild to moderate inflammation) at baseline to 1.4 (0.8) at week 8 (P<.0001) and 1.2 (1.1) (indicating mild inflammation to almost clear) at week 12 (P<.0001). The observed decrease in severity of skin condition and skin inflammation is shown in Figure 3.
Significant improvements were observed in every category of the PGSA at week 12 vs baseline (P≤.0007)(Table 2). At week 12, there was a significant (P≤.05) increase from baseline in participant agreement for all 22 QOL metrics describing positive shave experience, achieving results, skin feel, self-confidence, and social interactions (Figure 4), which supports the positive impact of adopting a shaving regimen with the test razor. Notably, after using the test razor for 12 weeks, men reported that they were more likely to agree with the statements “my skin felt smooth,” “my skin felt good to touch,” and “I was able to achieve a consistently good shave.” Other meaningful increases occurred in “shaving was something I looked forward to doing,” “others thought I looked clean cut,” “I looked my best for my family/others/work,” and “I felt comfortable/confident getting closer to others.” All QOL statements are shown in Figure 4.
Comment
Improvement With Novel Razor Technology—For the first time, frequent use of a novel razor technology designed specifically for men with PFB was found to significantly improve skin appearance, shave satisfaction, and QOL after 12 weeks vs baseline in participants clinically diagnosed with PFB. In men with shave-related skin irritation and razor bumps who typically wet-shaved with a razor at least 3 times a week, use of the test razor with their regular shaving preparation product 5 or more times per week for 12 weeks was associated with significant improvements from baseline in investigator lesion count, IGSA, PGSA, and Participant Quality of Life Questionnaire measurements.
Study strengths included the quantification of the change in the number of lesions and the degree of severity by a trained investigator in a prospective clinical study along with an assessment of the impact on participant QOL. A lack of a control arm could be considered a limitation of the study; however, study end points were evaluated compared with baseline, with each participant serving as their own control. Spontaneous resolution of the condition with their standard routine was considered highly unlikely in these participants; therefore, in the absence of any other changes, improvements were attributed to regular use of the test product over the course of the study. The results presented here provide strong support for the effectiveness of the new razor technology in improving the appearance of men with razor bumps and shaving irritation.
Hair Removal Tools for the Management of PFB—Although various tools and techniques have been proposed in the past for men with PFB, the current test razor technology provided unique benefits, including improvements in appearance and severity of the condition as well as a positive impact on QOL. In 1979, Conte and Lawrence9 evaluated the effect of using an electric hair clipper and twice-daily use of a skin-cleansing pad on the occurrence of PFB. Participants (n=96) allowed their beards to grow out for 1 month, after which they started shaving with an electric clipper with a triple O head. The authors reported a favorable response in 95% (91/96) of cases. However, the electric clippers left 1 mm of beard at the skin level,9 which may not be acceptable for those who prefer a clean-shaven appearance.6
A prospective survey of 22 men of African descent with PFB found use of a safety razor was preferred over an electric razor.10 The single-arm study evaluated use of a foil-guarded shaver (single-razor blade) in the management of PFB based on investigator lesion counts and a participant questionnaire. Participants were asked to shave at least every other day and use a specially designed preshave brush. A mean reduction in lesion counts was observed at 2 weeks (29.6%), 4 weeks (38.1%), and 6 weeks (47.1%); statistical significance was not reported. At 6 weeks, 77.3% (17/22) of participants judged the foil-guarded shaver to be superior to other shaving devices in controlling their razor bumps, and 90.9% (20/22) indicated they would recommend the shaver to others with PFB. The authors hypothesized that the guard buffered the skin from the blade, which might otherwise facilitate the penetration of ingrowing hairs and cause trauma to existing lesions.
The mean reduction in lesion count from baseline observed at week 4 was greater in the study with the foil-guarded shaver and preshave brush (38% reduction)10 than in our study (19% reduction in papule count). Different methodologies, use of a preshave brush in the earlier study, and a difference in lesion severity at baseline may have contributed to this difference. The study with the foil-guarded shaver concluded after 6 weeks, and there was a 47.1% reduction in lesion counts vs baseline.10 In contrast, the current study continued for 12 weeks, and a 59.6% reduction in lesion counts was reported. Participants from both studies reported an improved shaving experience compared with their usual practice,10 though only the current study explored the positive impact of the new razor technology on participant QOL.
Preventing Hairs From Being Cut Too Close—The closeness of the shave is believed to be a contributory factor in the development and persistence of PFB6,8,11 based on a tendency for the distal portion of tightly curled hair shafts to re-enter the skin after shaving via transfollicular penetration.12 Inclusion of a buffer in the razor between the sharp blades and the skin has been proposed to prevent hairs from being cut too close and causing transfollicular penetration.12
In the test razor used in the current study, the bridge technology acted as the buffer to prevent hairs from being cut too close to the skin and to reduce blade contact with the skin (Figure 2). Having only 2 blades also reduced the closeness of the shave compared with 5-bladed technologies,13 as each hair can only be pulled and cut up to a maximum of 2 times per shaving stroke. Notably, this did not impact the participants’ QOL scores related to achieving a close shave or skin feeling smooth; both attributes were significantly improved at 12 weeks vs baseline (Figure 4).
By reducing blade contact with the skin, the bridge technology in the test razor was designed to prevent excessive force from being applied to the skin through the blades. Reduced blade loading minimizes contact with and impact on sensitive skin.14 Additional design features of the test razor to minimize the impact of shaving on the skin include treatment of the 2 blades with low-friction coatings, which allows the blades to cut through the beard hair with minimal force, helping to reduce the tug-and-pull effect that may otherwise result in irritation and inflammation.13,15 Lubrication strips before and after the blades in the test razor reduce friction between the blades and the skin to further protect the skin from the blades.15
Shaving With Multiblade Razors Does Not Exacerbate PFB—In a 1-week, split-faced, randomized study of 45 Black men, shaving with a manual 3-bladed razor was compared with use of 3 different chemical depilatory formulations.16 Shaving every other day for 1 week with the manual razor resulted in more papule formation but less irritation than use of the depilatories. The authors concluded that a study with longer duration was needed to explore the impact of shaving on papule formation in participants with a history of PFB.16
In 2013, an investigator-blinded study of 90 African American men with PFB compared the impact of different shaving regimens on the signs and symptoms of PFB over a 12-week period.4 Participants were randomized to 1 of 3 arms: (1) shaving 2 to 3 times per week with a triple-blade razor and standard products (control group); (2) shaving daily with a 5-bladed razor and standard products; and (3) shaving daily with a 5-bladed razor and “advanced” specific pre- and postshave products. The researchers found that the mean papule measurement significantly decreased from baseline in the advanced (P=.01) and control (P=.016) groups. Between-group comparison revealed no significant differences for papule or pustule count among each arm. For the investigator-graded severity, the change from baseline was significant for all 3 groups (P≤.04); however, the differences among groups were not significant. Importantly, these data demonstrated that PFB was not exacerbated by multiblade razors used as part of a daily shaving regimen.4
The findings of the current study were consistent with those of Daniel et al4 in that there was no exacerbation of the signs and symptoms of PFB associated with daily shaving. However, rather than requiring participants to change their entire shaving regimen, the present study only required a change of razor type. Moreover, the use of the new razor technology significantly decreased papule counts at week 12 vs the baseline measurement (P<.0001) and was associated with an improvement in subjective skin severity measurements. The participants in the present study reported significantly less burning, stinging, and itching after using the test product for 12 weeks (P<.0001).
Impact of Treatment on QOL—The current study further expanded on prior findings by combining these clinical end points with the QOL results to assess the test razor’s impact on participants’ lives. Results showed that over the course of 12 weeks, the new razor technology significantly improved the participants’ QOL in all questions related to shaving experience, achieving results, skin feel, self-confidence, and social interactions. The significant improvement in QOL included statements such as “shaving was a pleasant experience,” “I was able to achieve a consistently good shave,” and “my skin felt smooth.” Participants also reported improvements in meaningful categories such as “my shave made me feel attractive” and “I felt comfortable/confident getting closer to others.” As the current study showed, a shave regimen has the potential to change participants’ overall assessment of their QOL, a variable that must not be overlooked.
Conclusion
In men with clinically diagnosed PFB, regular shaving with a razor designed to protect the skin was found to significantly decrease lesion counts, increase shave satisfaction, and improve QOL after 12 weeks compared with their usual shaving practice (baseline measures). This razor technology provides another option to help manage PFB for men who wish to or need to continue shaving.
Acknowledgments—The clinical study was funded by the Procter & Gamble Company. Editorial writing assistance, supported financially by the Procter & Gamble Company, was provided by Gill McFeat, PhD, of McFeat Science Ltd (Devon, United Kingdom).
- Alexander AM, Delph WI. Pseudofolliculitis barbae in the military. a medical, administrative and social problem. J Natl Med Assoc. 1974;66:459-464, 479.
- Kligman AM, Strauss JS. Pseudofolliculitis of the beard. AMA Arch Derm. 1956;74:533-542.
- Banta J, Bowen C, Wong E, et al. Perceptions of shaving profiles and their potential impacts on career progression in the United States Air Force. Mil Med. 2021;186:187-189.
- Daniel A, Gustafson CJ, Zupkosky PJ, et al. Shave frequency and regimen variation effects on the management of pseudofolliculitis barbae. J Drugs Dermatol. 2013;12:410-418.
- Winter H, Schissel D, Parry DA, et al. An unusual Ala12Thr polymorphism in the 1A alpha-helical segment of the companion layer-specific keratin K6hf: evidence for a risk factor in the etiology of the common hair disorder pseudofolliculitis barbae. J Invest Dermatol. 2004;122:652-657.
- Perry PK, Cook-Bolden FE, Rahman Z, et al. Defining pseudofolliculitis barbae in 2001: a review of the literature and current trends. J Am Acad Dermatol. 2002;46(2 suppl understanding):S113-S119.
- McMichael AJ. Hair and scalp disorders in ethnic populations. Dermatol Clin. 2003;21:629-644.
- Ribera M, Fernández-Chico N, Casals M. Pseudofolliculitis barbae [in Spanish]. Actas Dermosifiliogr. 2010;101:749-757.
- Conte MS, Lawrence JE. Pseudofolliculitis barbae. no ‘pseudoproblem.’ JAMA. 1979;241:53-54.
- Alexander AM. Evaluation of a foil-guarded shaver in the management of pseudofolliculitis barbae. Cutis. 1981;27:534-537, 540-542.
- Weiss AN, Arballo OM, Miletta NR, et al. Military grooming standards and their impact on skin diseases of the head and neck. Cutis. 2018;102:328;331-333.
- Alexis A, Heath CR, Halder RM. Folliculitis keloidalis nuchae and pseudofolliculitis barbae: are prevention and effective treatment within reach? Dermatol Clin. 2014;32:183-191.
- Cowley K, Vanoosthuyze K, Ertel K, et al. Blade shaving. In: Draelos ZD, ed. Cosmetic Dermatology: Products and Procedures. 2nd ed. John Wiley & Sons; 2015:166-173.
- Cowley K, Vanoosthuyze K. Insights into shaving and its impact on skin. Br J Dermatol. 2012;166(suppl 1):6-12.
- Cowley K, Vanoosthuyze K. The biomechanics of blade shaving. Int J Cosmet Sci. 2016;38(suppl 1):17-23.
- Kindred C, Oresajo CO, Yatskayer M, et al. Comparative evaluation of men’s depilatory composition versus razor in black men. Cutis. 2011;88:98-103.
Practice Points
- Pseudofolliculitis barbae (PFB) is a common follicular inflammatory disorder associated with shaving, most commonly seen in men of African ancestry. It can be distressing and cause a substantial impact on quality of life (QOL).
- Frequent use of a novel razor technology designed specifically for men with PFB was found to improve skin appearance and QOL after 12 weeks vs baseline.
- This razor technology provides an alternative approach to help manage PFB for men who wish to or need to continue shaving.

Neurosurgery Operating Room Efficiency During the COVID-19 Era
From the Department of Neurological Surgery, Vanderbilt University Medical Center, Nashville, TN (Stefan W. Koester, Puja Jagasia, and Drs. Liles, Dambrino IV, Feldman, and Chambless), and the Department of Anesthesiology, Vanderbilt University Medical Center, Nashville, TN (Drs. Mathews and Tiwari).
ABSTRACT
Background: The COVID-19 pandemic has had broad effects on surgical care, including operating room (OR) staffing, personal protective equipment (PPE) utilization, and newly implemented anti-infective measures. Our aim was to assess neurosurgery OR efficiency before the COVID-19 pandemic, during peak COVID-19, and during current times.
Methods: Institutional perioperative databases at a single, high-volume neurosurgical center were queried for operations performed from December 2019 until October 2021. March 12, 2020, the day that the state of Tennessee declared a state of emergency, was chosen as the onset of the COVID-19 pandemic. The 90-day periods before and after this day were used to define the pre-COVID-19, peak-COVID-19, and post-peak restrictions time periods for comparative analysis. Outcomes included delay in first-start and OR turnover time between neurosurgical cases. Preset threshold times were used in analyses to adjust for normal leniency in OR scheduling (15 minutes for first start and 90 minutes for turnover). Univariate analysis used Wilcoxon rank-sum test for continuous outcomes, while chi-square test and Fisher’s exact test were used for categorical comparisons. Significance was defined as P < .05.
Results: First-start time was analyzed in 426 pre-COVID-19, 357 peak-restrictions, and 2304 post-peak-restrictions cases. The unadjusted mean delay length was found to be significantly different between the time periods, but the magnitude of increase in minutes was immaterial (mean [SD] minutes, 6 [18] vs 10 [21] vs 8 [20], respectively; P = .004). The adjusted average delay length and proportion of cases delayed beyond the 15-minute threshold were not significantly different. The proportion of cases that started early, as well as significantly early past a 15-minute threshold, have not been impacted. There was no significant change in turnover time during peak restrictions relative to the pre-COVID-19 period (88 [100] minutes vs 85 [95] minutes), and turnover time has since remained unchanged (83 [87] minutes).
Conclusion: Our center was able to maintain OR efficiency before, during, and after peak restrictions even while instituting advanced infection-control strategies. While there were significant changes, delays were relatively small in magnitude.
Keywords: operating room timing, hospital efficiency, socioeconomics, pandemic.
The COVID-19 pandemic has led to major changes in patient care both from a surgical perspective and in regard to inpatient hospital course. Safety protocols nationwide have been implemented to protect both patients and providers. Some elements of surgical care have drastically changed, including operating room (OR) staffing, personal protective equipment (PPE) utilization, and increased sterilization measures. Furloughs, layoffs, and reassignments due to the focus on nonelective and COVID-19–related cases challenged OR staffing and efficiency. Operating room staff with COVID-19 exposures or COVID-19 infections also caused last-minute changes in staffing. All of these scenarios can cause issues due to actual understaffing or due to staff members being pushed into highly specialized areas, such as neurosurgery, in which they have very little experience. A further obstacle to OR efficiency included policy changes involving PPE utilization, sterilization measures, and supply chain shortages of necessary resources such as PPE.
Neurosurgery in particular has been susceptible to COVID-19–related system-wide changes given operator proximity to the patient’s respiratory passages, frequency of emergent cases, and varying anesthetic needs, as well as the high level of specialization needed to perform neurosurgical care. Previous studies have shown a change in the makeup of neurosurgical patients seeking care, as well as in the acuity of neurological consult of these patients.1 A study in orthopedic surgery by Andreata et al demonstrated worsened OR efficiency, with significantly increased first-start and turnover times.2 In the COVID-19 era, OR quality and safety are crucially important to both patients and providers. Providing this safe and effective care in an efficient manner is important for optimal neurosurgical management in the long term.3 Moreover, the financial burden of implementing new protocols and standards can be compounded by additional financial losses due to reduced OR efficiency.
Methods
To analyze the effect of COVID-19 on neurosurgical OR efficiency, institutional perioperative databases at a single high-volume center were queried for operations performed from December 2019 until October 2021. March 12, 2020, was chosen as the onset of COVID-19 for analytic purposes, as this was the date when the state of Tennessee declared a state of emergency. The 90-day periods before and after this date were used for comparative analysis for pre-COVID-19, peak COVID-19, and post-peak-restrictions time periods. The peak COVID-19 period was defined as the 90-day period following the initial onset of COVID-19 and the surge of cases. For comparison purposes, post-peak COVID-19 was defined as the months following the first peak until October 2021 (approximately 17 months). COVID-19 burden was determined using a COVID-19 single-institution census of confirmed cases by polymerase chain reaction (PCR) for which the average number of cases of COVID-19 during a given month was determined. This number is a scaled trend, and a true number of COVID-19 cases in our hospital was not reported.
Neurosurgical and neuroendovascular cases were included in the analysis. Outcomes included delay in first-start and OR turnover time between neurosurgical cases, defined as the time from the patient leaving the room until the next patient entered the room. Preset threshold times were used in analyses to adjust for normal leniency in OR scheduling (15 minutes for first start and 90 minutes for turnover, which is a standard for our single-institution perioperative center). Statistical analyses, including data aggregation, were performed using R, version 4.0.1 (R Foundation for Statistical Computing). Patients’ demographic and clinical characteristics were analyzed using an independent 2-sample t-test for interval variables and a chi-square test for categorical variables. Significance was defined as P < .05.
Results
First-Start Time
First-start time was analyzed in 426 pre-COVID-19, 357 peak-COVID-19, and 2304 post-peak-COVID-19 cases. The unadjusted mean delay length was significantly different between the time periods, but the magnitude of increase in minutes was immaterial (mean [SD] minutes, 6 [18] vs 10 [21] vs 8 [20], respectively; P = .004) (Table 1). 
The adjusted average delay length and proportion of cases delayed beyond the 15-minute threshold were not significantly different, but they have been slightly higher since the onset of COVID-19. The proportion of cases that have started early, as well as significantly early past a 15-minute threshold, have also trended down since the onset of the COVID-19 pandemic, but this difference was again not significant. The temporal relationship of first-start delay, both unadjusted and adjusted, from December 2019 to October 2021 is shown in Figure 1. The trend of increasing delay is loosely associated with the COVID-19 burden experienced by our hospital. The start of COVID-19 as well as both COVID-19 peaks have been associated with increased delays in our hospital. Unadjusted and (B) adjusted first-start delay in operating room efficiency relative to COVID-19 census.")
Turnover Time
Turnover time was assessed in 437 pre-COVID-19, 278 peak-restrictions, and 2411 post-peak-restrictions cases. Turnover time during peak restrictions was not significantly different from pre-COVID-19 (88 [100] vs 85 [95]) and has since remained relatively unchanged (83 [87], P = .78). A similar trend held for comparisons of proportion of cases with turnover time past 90 minutes and average times past the 90-minute threshold (Table 2). The temporal relationship between COVID-19 burden and turnover time, both unadjusted and adjusted, from December 2019 to October 2021 is shown in Figure 2. Both figures demonstrate a slight initial increase in turnover time delay at the start of COVID-19, which stabilized with little variation thereafter.

 Unadjusted and (B) adjusted turnover time in operating room efficiency relative to COVID-19 census.")
Discussion
We analyzed the OR efficiency metrics of first-start and turnover time during the 90-day period before COVID-19 (pre-COVID-19), the 90 days following Tennessee declaring a state of emergency (peak COVID-19), and the time following this period (post-COVID-19) for all neurosurgical and neuroendovascular cases at Vanderbilt University Medical Center (VUMC). We found a significant difference in unadjusted mean delay length in first-start time between the time periods, but the magnitude of increase in minutes was immaterial (mean [SD] minutes for pre-COVID-19, peak-COVID-19, and post-COVID-19: 6 [18] vs 10 [21] vs 8 [20], respectively; P = .004). No significant increase in turnover time between cases was found between these 3 time periods. Based on metrics from first-start delay and turnover time, our center was able to maintain OR efficiency before, during, and after peak COVID-19.
After the Centers for Disease Control and Prevention released guidelines recommending deferring elective procedures to conserve beds and PPE, VUMC made the decision to suspend all elective surgical procedures from March 18 to April 24, 2020. Prior research conducted during the COVID-19 pandemic has demonstrated more than 400 types of surgical procedures with negatively impacted outcomes when compared to surgical outcomes from the same time frame in 2018 and 2019.4 For more than 20 of these types of procedures, there was a significant association between procedure delay and adverse patient outcomes.4 Testing protocols for patients prior to surgery varied throughout the pandemic based on vaccination status and type of procedure. Before vaccines became widely available, all patients were required to obtain a PCR SARS-CoV-2 test within 48 to 72 hours of the scheduled procedure. If the patient’s procedure was urgent and testing was not feasible, the patient was treated as a SARS-CoV-2–positive patient, which required all health care workers involved in the case to wear gowns, gloves, surgical masks, and eye protection. Testing patients preoperatively likely helped to maintain OR efficiency since not all patients received test results prior to the scheduled procedure, leading to cancellations of cases and therefore more staff available for fewer cases.
After vaccines became widely available to the public, testing requirements for patients preoperatively were relaxed, and only patients who were not fully vaccinated or severely immunocompromised were required to test prior to procedures. However, approximately 40% of the population in Tennessee was fully vaccinated in 2021, which reflects the patient population of VUMC.5 This means that many patients who received care at VUMC were still tested prior to procedures.
Adopting adequate safety protocols was found to be key for OR efficiency during the COVID-19 pandemic since performing surgery increased the risk of infection for each health care worker in the OR.6 VUMC protocols identified procedures that required enhanced safety measures to prevent infection of health care workers and avoid staffing shortages, which would decrease OR efficiency. Protocols mandated that only anesthesia team members were allowed to be in the OR during intubation and extubation of patients, which could be one factor leading to increased delays and decreased efficiency for some institutions. Methods for neurosurgeons to decrease risk of infection in the OR include postponing all nonurgent cases, reappraising the necessity for general anesthesia and endotracheal intubation, considering alternative surgical approaches that avoid the respiratory tract, and limiting the use of aerosol-generating instruments.7,8 VUMC’s success in implementing these protocols likely explains why our center was able to maintain OR efficiency throughout the COVID-19 pandemic.
A study conducted by Andreata et al showed a significantly increased mean first-case delay and a nonsignificant increased turnover time in orthopedic surgeries in Northern Italy when comparing surgeries performed during the COVID-19 pandemic to those performed prior to COVID-19.2 Other studies have indicated a similar trend in decreased OR efficiency during COVID-19 in other areas around the world.9,10 These findings are not consistent with our own findings for neurosurgical and neuroendovascular surgeries at VUMC, and any change at our institution was relatively immaterial. Factors that threatened to change OR efficiency—but did not result in meaningful changes in our institutional experience—include delays due to pending COVID-19 test results, safety procedures such as PPE donning, and planning difficulties to ensure the existence of teams with non-overlapping providers in the case of a surgeon being infected.2,11-13
Globally, many surgery centers halted all elective surgeries during the initial COVID-19 spike to prevent a PPE shortage and mitigate risk of infection of patients and health care workers.8,12,14 However, there is no centralized definition of which neurosurgical procedures are elective, so that decision was made on a surgeon or center level, which could lead to variability in efficiency trends.14 One study on neurosurgical procedures during COVID-19 found a 30% decline in all cases and a 23% decline in emergent procedures, showing that the decrease in volume was not only due to cancellation of elective procedures.15 This decrease in elective and emergent surgeries created a backlog of surgeries as well as a loss in health care revenue, and caused many patients to go without adequate health care.10 Looking forward, it is imperative that surgical centers study trends in OR efficiency from COVID-19 and learn how to better maintain OR efficiency during future pandemic conditions to prevent a backlog of cases, loss of health care revenue, and decreased health care access.
Limitations
Our data are from a single center and therefore may not be representative of experiences of other hospitals due to different populations and different impacts from COVID-19. However, given our center’s high volume and diverse patient population, we believe our analysis highlights important trends in neurosurgery practice. Notably, data for patient and OR timing are digitally generated and are entered manually by nurses in the electronic medical record, making it prone to errors and variability. This is in our experience, and if any error is present, we believe it is minimal.
Conclusion
The COVID-19 pandemic has had far-reaching effects on health care worldwide, including neurosurgical care. OR efficiency across the United States generally worsened given the stresses of supply chain issues, staffing shortages, and cancellations. At our institution, we were able to maintain OR efficiency during the known COVID-19 peaks until October 2021. Continually functional neurosurgical ORs are important in preventing delays in care and maintaining a steady revenue in order for hospitals and other health care entities to remain solvent. Further study of OR efficiency is needed for health care systems to prepare for future pandemics and other resource-straining events in order to provide optimal patient care.
Corresponding author: Campbell Liles, MD, Vanderbilt University Medical Center, Department of Neurological Surgery, 1161 21st Ave. South, T4224 Medical Center North, Nashville, TN 37232-2380; david.c.liles.1@vumc.org
Disclosures: None reported.
1. Koester SW, Catapano JS, Ma KL, et al. COVID-19 and neurosurgery consultation call volume at a single large tertiary center with a propensity- adjusted analysis. World Neurosurg. 2021;146:e768-e772. doi:10.1016/j.wneu.2020.11.017
2. Andreata M, Faraldi M, Bucci E, Lombardi G, Zagra L. Operating room efficiency and timing during coronavirus disease 2019 outbreak in a referral orthopaedic hospital in Northern Italy. Int Orthop. 2020;44(12):2499-2504. doi:10.1007/s00264-020-04772-x
3. Dexter F, Abouleish AE, Epstein RH, et al. Use of operating room information system data to predict the impact of reducing turnover times on staffing costs. Anesth Analg. 2003;97(4):1119-1126. doi:10.1213/01.ANE.0000082520.68800.79
4. Zheng NS, Warner JL, Osterman TJ, et al. A retrospective approach to evaluating potential adverse outcomes associated with delay of procedures for cardiovascular and cancer-related diagnoses in the context of COVID-19. J Biomed Inform. 2021;113:103657. doi:10.1016/j.jbi.2020.103657
5. Alcendor DJ. Targeting COVID-19 vaccine hesitancy in rural communities in Tennessee: implications for extending the COVID- 19 pandemic in the South. Vaccines (Basel). 2021;9(11):1279. doi:10.3390/vaccines9111279
6. Perrone G, Giuffrida M, Bellini V, et al. Operating room setup: how to improve health care professionals safety during pandemic COVID- 19: a quality improvement study. J Laparoendosc Adv Surg Tech A. 2021;31(1):85-89. doi:10.1089/lap.2020.0592
7. Iorio-Morin C, Hodaie M, Sarica C, et al. Letter: the risk of COVID-19 infection during neurosurgical procedures: a review of severe acute respiratory distress syndrome coronavirus 2 (SARS-CoV-2) modes of transmission and proposed neurosurgery-specific measures for mitigation. Neurosurgery. 2020;87(2):E178-E185. doi:10.1093/ neuros/nyaa157
8. Gupta P, Muthukumar N, Rajshekhar V, et al. Neurosurgery and neurology practices during the novel COVID-19 pandemic: a consensus statement from India. Neurol India. 2020;68(2):246-254. doi:10.4103/0028-3886.283130
9. Mercer ST, Agarwal R, Dayananda KSS, et al. A comparative study looking at trauma and orthopaedic operating efficiency in the COVID-19 era. Perioper Care Oper Room Manag. 2020;21:100142. doi:10.1016/j.pcorm.2020.100142
10. Rozario N, Rozario D. Can machine learning optimize the efficiency of the operating room in the era of COVID-19? Can J Surg. 2020;63(6):E527-E529. doi:10.1503/cjs.016520
11. Toh KHQ, Barazanchi A, Rajaretnam NS, et al. COVID-19 response by New Zealand general surgical departments in tertiary metropolitan hospitals. ANZ J Surg. 2021;91(7-8):1352-1357. doi:10.1111/ ans.17044
12. Moorthy RK, Rajshekhar V. Impact of COVID-19 pandemic on neurosurgical practice in India: a survey on personal protective equipment usage, testing, and perceptions on disease transmission. Neurol India. 2020;68(5):1133-1138. doi:10.4103/0028- 3886.299173
13. Meneghini RM. Techniques and strategies to optimize efficiencies in the office and operating room: getting through the patient backlog and preserving hospital resources. J Arthroplasty. 2021;36(7S):S49-S51. doi:10.1016/j.arth.2021.03.010
14. Jean WC, Ironside NT, Sack KD, et al. The impact of COVID- 19 on neurosurgeons and the strategy for triaging non-emergent operations: a global neurosurgery study. Acta Neurochir (Wien). 2020;162(6):1229-1240. doi:10.1007/s00701-020- 04342-5
15. Raneri F, Rustemi O, Zambon G, et al. Neurosurgery in times of a pandemic: a survey of neurosurgical services during the COVID-19 outbreak in the Veneto region in Italy. Neurosurg Focus. 2020;49(6):E9. doi:10.3171/2020.9.FOCUS20691
From the Department of Neurological Surgery, Vanderbilt University Medical Center, Nashville, TN (Stefan W. Koester, Puja Jagasia, and Drs. Liles, Dambrino IV, Feldman, and Chambless), and the Department of Anesthesiology, Vanderbilt University Medical Center, Nashville, TN (Drs. Mathews and Tiwari).
ABSTRACT
Background: The COVID-19 pandemic has had broad effects on surgical care, including operating room (OR) staffing, personal protective equipment (PPE) utilization, and newly implemented anti-infective measures. Our aim was to assess neurosurgery OR efficiency before the COVID-19 pandemic, during peak COVID-19, and during current times.
Methods: Institutional perioperative databases at a single, high-volume neurosurgical center were queried for operations performed from December 2019 until October 2021. March 12, 2020, the day that the state of Tennessee declared a state of emergency, was chosen as the onset of the COVID-19 pandemic. The 90-day periods before and after this day were used to define the pre-COVID-19, peak-COVID-19, and post-peak restrictions time periods for comparative analysis. Outcomes included delay in first-start and OR turnover time between neurosurgical cases. Preset threshold times were used in analyses to adjust for normal leniency in OR scheduling (15 minutes for first start and 90 minutes for turnover). Univariate analysis used Wilcoxon rank-sum test for continuous outcomes, while chi-square test and Fisher’s exact test were used for categorical comparisons. Significance was defined as P < .05.
Results: First-start time was analyzed in 426 pre-COVID-19, 357 peak-restrictions, and 2304 post-peak-restrictions cases. The unadjusted mean delay length was found to be significantly different between the time periods, but the magnitude of increase in minutes was immaterial (mean [SD] minutes, 6 [18] vs 10 [21] vs 8 [20], respectively; P = .004). The adjusted average delay length and proportion of cases delayed beyond the 15-minute threshold were not significantly different. The proportion of cases that started early, as well as significantly early past a 15-minute threshold, have not been impacted. There was no significant change in turnover time during peak restrictions relative to the pre-COVID-19 period (88 [100] minutes vs 85 [95] minutes), and turnover time has since remained unchanged (83 [87] minutes).
Conclusion: Our center was able to maintain OR efficiency before, during, and after peak restrictions even while instituting advanced infection-control strategies. While there were significant changes, delays were relatively small in magnitude.
Keywords: operating room timing, hospital efficiency, socioeconomics, pandemic.
The COVID-19 pandemic has led to major changes in patient care both from a surgical perspective and in regard to inpatient hospital course. Safety protocols nationwide have been implemented to protect both patients and providers. Some elements of surgical care have drastically changed, including operating room (OR) staffing, personal protective equipment (PPE) utilization, and increased sterilization measures. Furloughs, layoffs, and reassignments due to the focus on nonelective and COVID-19–related cases challenged OR staffing and efficiency. Operating room staff with COVID-19 exposures or COVID-19 infections also caused last-minute changes in staffing. All of these scenarios can cause issues due to actual understaffing or due to staff members being pushed into highly specialized areas, such as neurosurgery, in which they have very little experience. A further obstacle to OR efficiency included policy changes involving PPE utilization, sterilization measures, and supply chain shortages of necessary resources such as PPE.
Neurosurgery in particular has been susceptible to COVID-19–related system-wide changes given operator proximity to the patient’s respiratory passages, frequency of emergent cases, and varying anesthetic needs, as well as the high level of specialization needed to perform neurosurgical care. Previous studies have shown a change in the makeup of neurosurgical patients seeking care, as well as in the acuity of neurological consult of these patients.1 A study in orthopedic surgery by Andreata et al demonstrated worsened OR efficiency, with significantly increased first-start and turnover times.2 In the COVID-19 era, OR quality and safety are crucially important to both patients and providers. Providing this safe and effective care in an efficient manner is important for optimal neurosurgical management in the long term.3 Moreover, the financial burden of implementing new protocols and standards can be compounded by additional financial losses due to reduced OR efficiency.
Methods
To analyze the effect of COVID-19 on neurosurgical OR efficiency, institutional perioperative databases at a single high-volume center were queried for operations performed from December 2019 until October 2021. March 12, 2020, was chosen as the onset of COVID-19 for analytic purposes, as this was the date when the state of Tennessee declared a state of emergency. The 90-day periods before and after this date were used for comparative analysis for pre-COVID-19, peak COVID-19, and post-peak-restrictions time periods. The peak COVID-19 period was defined as the 90-day period following the initial onset of COVID-19 and the surge of cases. For comparison purposes, post-peak COVID-19 was defined as the months following the first peak until October 2021 (approximately 17 months). COVID-19 burden was determined using a COVID-19 single-institution census of confirmed cases by polymerase chain reaction (PCR) for which the average number of cases of COVID-19 during a given month was determined. This number is a scaled trend, and a true number of COVID-19 cases in our hospital was not reported.
Neurosurgical and neuroendovascular cases were included in the analysis. Outcomes included delay in first-start and OR turnover time between neurosurgical cases, defined as the time from the patient leaving the room until the next patient entered the room. Preset threshold times were used in analyses to adjust for normal leniency in OR scheduling (15 minutes for first start and 90 minutes for turnover, which is a standard for our single-institution perioperative center). Statistical analyses, including data aggregation, were performed using R, version 4.0.1 (R Foundation for Statistical Computing). Patients’ demographic and clinical characteristics were analyzed using an independent 2-sample t-test for interval variables and a chi-square test for categorical variables. Significance was defined as P < .05.
Results
First-Start Time
First-start time was analyzed in 426 pre-COVID-19, 357 peak-COVID-19, and 2304 post-peak-COVID-19 cases. The unadjusted mean delay length was significantly different between the time periods, but the magnitude of increase in minutes was immaterial (mean [SD] minutes, 6 [18] vs 10 [21] vs 8 [20], respectively; P = .004) (Table 1).
The adjusted average delay length and proportion of cases delayed beyond the 15-minute threshold were not significantly different, but they have been slightly higher since the onset of COVID-19. The proportion of cases that have started early, as well as significantly early past a 15-minute threshold, have also trended down since the onset of the COVID-19 pandemic, but this difference was again not significant. The temporal relationship of first-start delay, both unadjusted and adjusted, from December 2019 to October 2021 is shown in Figure 1. The trend of increasing delay is loosely associated with the COVID-19 burden experienced by our hospital. The start of COVID-19 as well as both COVID-19 peaks have been associated with increased delays in our hospital.
Turnover Time
Turnover time was assessed in 437 pre-COVID-19, 278 peak-restrictions, and 2411 post-peak-restrictions cases. Turnover time during peak restrictions was not significantly different from pre-COVID-19 (88 [100] vs 85 [95]) and has since remained relatively unchanged (83 [87], P = .78). A similar trend held for comparisons of proportion of cases with turnover time past 90 minutes and average times past the 90-minute threshold (Table 2). The temporal relationship between COVID-19 burden and turnover time, both unadjusted and adjusted, from December 2019 to October 2021 is shown in Figure 2. Both figures demonstrate a slight initial increase in turnover time delay at the start of COVID-19, which stabilized with little variation thereafter.
Discussion
We analyzed the OR efficiency metrics of first-start and turnover time during the 90-day period before COVID-19 (pre-COVID-19), the 90 days following Tennessee declaring a state of emergency (peak COVID-19), and the time following this period (post-COVID-19) for all neurosurgical and neuroendovascular cases at Vanderbilt University Medical Center (VUMC). We found a significant difference in unadjusted mean delay length in first-start time between the time periods, but the magnitude of increase in minutes was immaterial (mean [SD] minutes for pre-COVID-19, peak-COVID-19, and post-COVID-19: 6 [18] vs 10 [21] vs 8 [20], respectively; P = .004). No significant increase in turnover time between cases was found between these 3 time periods. Based on metrics from first-start delay and turnover time, our center was able to maintain OR efficiency before, during, and after peak COVID-19.
After the Centers for Disease Control and Prevention released guidelines recommending deferring elective procedures to conserve beds and PPE, VUMC made the decision to suspend all elective surgical procedures from March 18 to April 24, 2020. Prior research conducted during the COVID-19 pandemic has demonstrated more than 400 types of surgical procedures with negatively impacted outcomes when compared to surgical outcomes from the same time frame in 2018 and 2019.4 For more than 20 of these types of procedures, there was a significant association between procedure delay and adverse patient outcomes.4 Testing protocols for patients prior to surgery varied throughout the pandemic based on vaccination status and type of procedure. Before vaccines became widely available, all patients were required to obtain a PCR SARS-CoV-2 test within 48 to 72 hours of the scheduled procedure. If the patient’s procedure was urgent and testing was not feasible, the patient was treated as a SARS-CoV-2–positive patient, which required all health care workers involved in the case to wear gowns, gloves, surgical masks, and eye protection. Testing patients preoperatively likely helped to maintain OR efficiency since not all patients received test results prior to the scheduled procedure, leading to cancellations of cases and therefore more staff available for fewer cases.
After vaccines became widely available to the public, testing requirements for patients preoperatively were relaxed, and only patients who were not fully vaccinated or severely immunocompromised were required to test prior to procedures. However, approximately 40% of the population in Tennessee was fully vaccinated in 2021, which reflects the patient population of VUMC.5 This means that many patients who received care at VUMC were still tested prior to procedures.
Adopting adequate safety protocols was found to be key for OR efficiency during the COVID-19 pandemic since performing surgery increased the risk of infection for each health care worker in the OR.6 VUMC protocols identified procedures that required enhanced safety measures to prevent infection of health care workers and avoid staffing shortages, which would decrease OR efficiency. Protocols mandated that only anesthesia team members were allowed to be in the OR during intubation and extubation of patients, which could be one factor leading to increased delays and decreased efficiency for some institutions. Methods for neurosurgeons to decrease risk of infection in the OR include postponing all nonurgent cases, reappraising the necessity for general anesthesia and endotracheal intubation, considering alternative surgical approaches that avoid the respiratory tract, and limiting the use of aerosol-generating instruments.7,8 VUMC’s success in implementing these protocols likely explains why our center was able to maintain OR efficiency throughout the COVID-19 pandemic.
A study conducted by Andreata et al showed a significantly increased mean first-case delay and a nonsignificant increased turnover time in orthopedic surgeries in Northern Italy when comparing surgeries performed during the COVID-19 pandemic to those performed prior to COVID-19.2 Other studies have indicated a similar trend in decreased OR efficiency during COVID-19 in other areas around the world.9,10 These findings are not consistent with our own findings for neurosurgical and neuroendovascular surgeries at VUMC, and any change at our institution was relatively immaterial. Factors that threatened to change OR efficiency—but did not result in meaningful changes in our institutional experience—include delays due to pending COVID-19 test results, safety procedures such as PPE donning, and planning difficulties to ensure the existence of teams with non-overlapping providers in the case of a surgeon being infected.2,11-13
Globally, many surgery centers halted all elective surgeries during the initial COVID-19 spike to prevent a PPE shortage and mitigate risk of infection of patients and health care workers.8,12,14 However, there is no centralized definition of which neurosurgical procedures are elective, so that decision was made on a surgeon or center level, which could lead to variability in efficiency trends.14 One study on neurosurgical procedures during COVID-19 found a 30% decline in all cases and a 23% decline in emergent procedures, showing that the decrease in volume was not only due to cancellation of elective procedures.15 This decrease in elective and emergent surgeries created a backlog of surgeries as well as a loss in health care revenue, and caused many patients to go without adequate health care.10 Looking forward, it is imperative that surgical centers study trends in OR efficiency from COVID-19 and learn how to better maintain OR efficiency during future pandemic conditions to prevent a backlog of cases, loss of health care revenue, and decreased health care access.
Limitations
Our data are from a single center and therefore may not be representative of experiences of other hospitals due to different populations and different impacts from COVID-19. However, given our center’s high volume and diverse patient population, we believe our analysis highlights important trends in neurosurgery practice. Notably, data for patient and OR timing are digitally generated and are entered manually by nurses in the electronic medical record, making it prone to errors and variability. This is in our experience, and if any error is present, we believe it is minimal.
Conclusion
The COVID-19 pandemic has had far-reaching effects on health care worldwide, including neurosurgical care. OR efficiency across the United States generally worsened given the stresses of supply chain issues, staffing shortages, and cancellations. At our institution, we were able to maintain OR efficiency during the known COVID-19 peaks until October 2021. Continually functional neurosurgical ORs are important in preventing delays in care and maintaining a steady revenue in order for hospitals and other health care entities to remain solvent. Further study of OR efficiency is needed for health care systems to prepare for future pandemics and other resource-straining events in order to provide optimal patient care.
Corresponding author: Campbell Liles, MD, Vanderbilt University Medical Center, Department of Neurological Surgery, 1161 21st Ave. South, T4224 Medical Center North, Nashville, TN 37232-2380; david.c.liles.1@vumc.org
Disclosures: None reported.
1. Koester SW, Catapano JS, Ma KL, et al. COVID-19 and neurosurgery consultation call volume at a single large tertiary center with a propensity- adjusted analysis. World Neurosurg. 2021;146:e768-e772. doi:10.1016/j.wneu.2020.11.017
2. Andreata M, Faraldi M, Bucci E, Lombardi G, Zagra L. Operating room efficiency and timing during coronavirus disease 2019 outbreak in a referral orthopaedic hospital in Northern Italy. Int Orthop. 2020;44(12):2499-2504. doi:10.1007/s00264-020-04772-x
3. Dexter F, Abouleish AE, Epstein RH, et al. Use of operating room information system data to predict the impact of reducing turnover times on staffing costs. Anesth Analg. 2003;97(4):1119-1126. doi:10.1213/01.ANE.0000082520.68800.79
4. Zheng NS, Warner JL, Osterman TJ, et al. A retrospective approach to evaluating potential adverse outcomes associated with delay of procedures for cardiovascular and cancer-related diagnoses in the context of COVID-19. J Biomed Inform. 2021;113:103657. doi:10.1016/j.jbi.2020.103657
5. Alcendor DJ. Targeting COVID-19 vaccine hesitancy in rural communities in Tennessee: implications for extending the COVID- 19 pandemic in the South. Vaccines (Basel). 2021;9(11):1279. doi:10.3390/vaccines9111279
6. Perrone G, Giuffrida M, Bellini V, et al. Operating room setup: how to improve health care professionals safety during pandemic COVID- 19: a quality improvement study. J Laparoendosc Adv Surg Tech A. 2021;31(1):85-89. doi:10.1089/lap.2020.0592
7. Iorio-Morin C, Hodaie M, Sarica C, et al. Letter: the risk of COVID-19 infection during neurosurgical procedures: a review of severe acute respiratory distress syndrome coronavirus 2 (SARS-CoV-2) modes of transmission and proposed neurosurgery-specific measures for mitigation. Neurosurgery. 2020;87(2):E178-E185. doi:10.1093/ neuros/nyaa157
8. Gupta P, Muthukumar N, Rajshekhar V, et al. Neurosurgery and neurology practices during the novel COVID-19 pandemic: a consensus statement from India. Neurol India. 2020;68(2):246-254. doi:10.4103/0028-3886.283130
9. Mercer ST, Agarwal R, Dayananda KSS, et al. A comparative study looking at trauma and orthopaedic operating efficiency in the COVID-19 era. Perioper Care Oper Room Manag. 2020;21:100142. doi:10.1016/j.pcorm.2020.100142
10. Rozario N, Rozario D. Can machine learning optimize the efficiency of the operating room in the era of COVID-19? Can J Surg. 2020;63(6):E527-E529. doi:10.1503/cjs.016520
11. Toh KHQ, Barazanchi A, Rajaretnam NS, et al. COVID-19 response by New Zealand general surgical departments in tertiary metropolitan hospitals. ANZ J Surg. 2021;91(7-8):1352-1357. doi:10.1111/ ans.17044
12. Moorthy RK, Rajshekhar V. Impact of COVID-19 pandemic on neurosurgical practice in India: a survey on personal protective equipment usage, testing, and perceptions on disease transmission. Neurol India. 2020;68(5):1133-1138. doi:10.4103/0028- 3886.299173
13. Meneghini RM. Techniques and strategies to optimize efficiencies in the office and operating room: getting through the patient backlog and preserving hospital resources. J Arthroplasty. 2021;36(7S):S49-S51. doi:10.1016/j.arth.2021.03.010
14. Jean WC, Ironside NT, Sack KD, et al. The impact of COVID- 19 on neurosurgeons and the strategy for triaging non-emergent operations: a global neurosurgery study. Acta Neurochir (Wien). 2020;162(6):1229-1240. doi:10.1007/s00701-020- 04342-5
15. Raneri F, Rustemi O, Zambon G, et al. Neurosurgery in times of a pandemic: a survey of neurosurgical services during the COVID-19 outbreak in the Veneto region in Italy. Neurosurg Focus. 2020;49(6):E9. doi:10.3171/2020.9.FOCUS20691

Safety and Efficacy of GLP-1 Receptor Agonists and SGLT2 Inhibitors Among Veterans With Type 2 Diabetes
Selecting the best medication regimen for a patient with type 2 diabetes mellitus (T2DM) depends on many factors, such as glycemic control, adherence, adverse effect (AE) profile, and comorbid conditions.1 Selected agents from 2 newer medication classes, glucagon-like peptide 1 receptor agonists (GLP-1 RA) and sodium-glucose cotransporter 2 inhibitors (SGLT2i), have demonstrated cardiovascular and renal protective properties, creating a new paradigm in management.
The American Diabetes Association recommends medications with proven benefit in cardiovascular disease (CVD), such as the GLP-1 RAs liraglutide, injectable semaglutide, or dulaglutide, or the SGLT2i empagliflozin or canagliflozin, as second-line after metformin in patients with established atherosclerotic CVD or indicators of high risk to reduce the risk of major adverse cardiovascular events (MACE).1 SGLT2i are preferred in patients with diabetic kidney disease, and GLP-1 RAs are next in line for selection of agents with proven nephroprotection (liraglutide, injectable semaglutide, dulaglutide). The mechanisms of these benefits are not fully understood but may be due to their extraglycemic effects. The classes likely induce these benefits by different mechanisms: SGLT2i by hemodynamic effects and GLP-1 RAs by anti-inflammatory mechanisms.2 Although there is much interest, evidence is limited regarding the cardiovascular and renal protection benefits of these agents used in combination.
The combined use of GLP-1 RA and SGLT2i agents demonstrated greater benefit than separate use in trials with nonveteran populations.3-7 These studies evaluated effects on hemoglobin A1c (HbA1c) levels, weight loss, blood pressure (BP), and estimated glomerular filtration rate (eGFR). A meta-analysis of 7 trials found that the combination of GLP-1 RA and SGLT2i reduced HbA1c levels, body weight, and systolic blood pressure (SBP).8 All of the changes were statistically significant except for body weight with combination vs SGLT2i alone. Combination therapy was not associated with increased risk of severe hypoglycemia compared with either therapy separately.
The purpose of our study was to evaluate the safety and efficacy of the combined use of GLP-1 RA and SGLT2i in a real-world, US Department of Veterans Affairs (VA) population with T2DM.
Methods
This study was a pre-post, retrospective, single-center chart review. Subjects served as their own control. The project was reviewed and approved by the VA Ann Arbor Healthcare System Institutional Review Board. Subjects prescribed both a GLP-1 RA (semaglutide or liraglutide) and SGLT2i (empagliflozin) between January 1, 2014, and November 10, 2019, were extracted from the Corporate Data Warehouse (CDW) for possible inclusion in the study.
Patients were excluded if they received < 12 weeks of combination GLP-1 RA and SGLT2i therapy or did not have a corresponding 12-week HbA1c level. Patients also were excluded if they had < 12 weeks of monotherapy before starting combination therapy or did not have a baseline HbA1c level, or if the start date of combination therapy was not recorded in the VA electronic health record (EHR). We reviewed data for each patient from 6 months before to 1 year after the second agent was started. Start of the first agent (GLP-1 RA or SGLT2i) was recorded as the date the prescription was picked up in-person or 7 days after release date if mailed to the patient. Start of the second agent (GLP-1 RA or SGLT2i) was defined as baseline and was the date the prescription was picked up in person or 7 days after the release date if mailed.
Baseline measures were taken anytime from 8 weeks after the start of the first agent through 2 weeks after the start of the second agent. Data collected included age, sex, race, height, weight, BP, HbA1c levels, serum creatinine (SCr), eGFR, classes of medications for the treatment of T2DM, and the number of prescribed antihypertensive medications. HbA1c levels, SCr, eGFR, weight, and BP also were collected at 12 weeks (within 8-21 weeks); 26 weeks (within 22-35 weeks); and 52 weeks (within 36-57 weeks) of combination therapy. We reviewed progress notes and laboratory results to determine AEs within 26 weeks before initiating second agent (baseline) and 0 to 26 weeks and 26 to 52 weeks after initiating combination therapy.
The primary objective was to determine the effect on HbA1c levels at 12 weeks when using a GLP-1 RA and SGLT2i in combination vs separately. Secondary objectives were to determine change from baseline in mean body weight, BP, SCr, and eGFR at 12, 26, and 52 weeks; change in HbA1c levels at 26 and 52 weeks; and incidence of prespecified adverse drug reactions during combination therapy vs separately.
Statistical Analysis
Assuming a SD of 1, 80% power, significance level of P < .05, 2-sided test, and a correlation between baseline and follow-up of 0.5, we determined that a sample size of 34 subjects was required to detect a 0.5% change in baseline HbA1c level at 12 weeks. A t test (or Wilcoxon signed rank test if outcome not normally distributed) was conducted to examine whether the expected change from baseline was different from 0 for continuous outcomes. Median change from baseline was reported for SCr as a nonparametric t test (Wilcoxon signed rank test) was used.
Results
We identified 110 patients for possible study inclusion and 39 met eligibility criteria. After record review, 30 patients were excluded for receiving < 12 weeks of combination therapy or no 12 week HbA1c level; 26 patients were excluded for receiving < 12 weeks of monotherapy before starting combination therapy or no baseline HbA1c level; and 15 patients were excluded for lack of documentation in the VA EHR. Of the 39 patients included, 24 (62%) were prescribed empagliflozin first and then 8 started liraglutide and 16 started semaglutide. 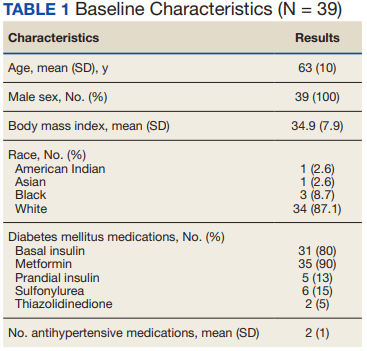
HbA1c levels decreased by 1% after 12 weeks of combination therapy compared with baseline (P < .001), and this reduction was sustained through the duration of the study period (Table 2). 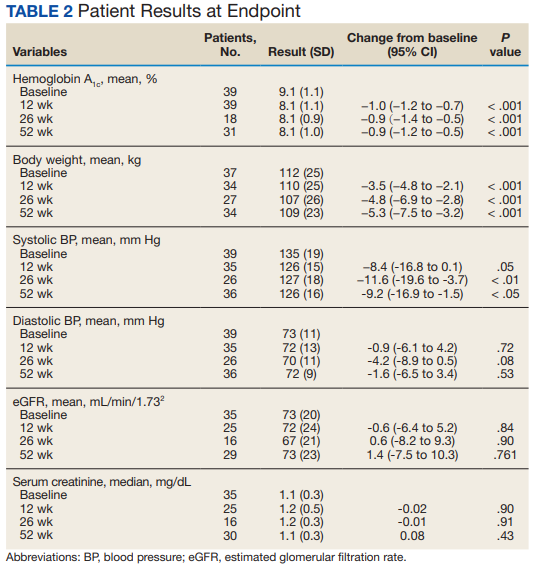
The most common AE during the trial was hypoglycemia, which was mostly mild (level 1) (Table 3). 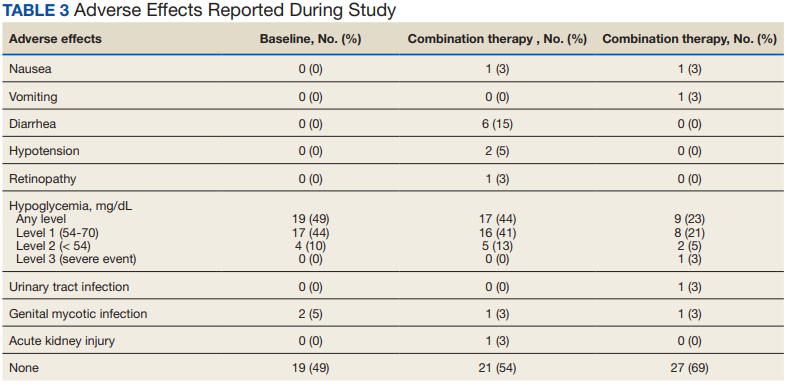
Discussion
This study evaluated the safety and efficacy of combined use of semaglutide or liraglutide and empagliflozin in a veteran population with T2DM. The retrospective chart review captured real-world practice and outcomes. Combination therapy was associated with a significant reduction in HbA1c levels, body weight, and SBP compared with either agent alone. No significant change was seen in DBP, SCr, or eGFR. Overall, the combination of GLP-1 RA and SGLT2i medications demonstrated a good safety profile with most patients reporting no AEs.
Several other studies have assessed the safety and efficacy of using GLP-1 RA and SGLT2i in combination. The DURATION 8 trial is the only double-blind trial to randomize subjects to receive either exenatide once weekly, dapagliflozin, or the combination of both for up to 52 weeks.3 Other controlled trials required stable background therapy with either SGLT2i or GLP-1 RA before randomization to receive the other class or placebo and had durations between 18 and 30 weeks.4-7 The AWARD 10 trial studied the combination of canagliflozin and dulaglutide, which both have proven CVD benefit.4 Other studies did not restrict SGLT2i or GLP-1 RA background therapy to agents with proven CVD benefit.5-7 The present study evaluated the combination of empagliflozin plus liraglutide or semaglutide, agents that all have proven CVD benefit.
A meta-analysis of 7 trials, including those previously mentioned, was conducted to evaluate the combination of GLP-1 RA and SGLT2i.8 The combination significantly reduced HbA1c levels by 0.61% and 0.85% compared with GLP-1 RA or SGLT2i, respectively. Our trial showed greater HbA1c level reduction of 1% with combination therapy compared with either agent separately. This may have been due in part to a higher baseline HbA1c level in our real-world veteran population. The meta-analysis found the combination decreased body weight 2.6 kg and 1.5 kg compared with GLP-1 RA or SGLT2i, respectively.8 This only reached significance with comparison vs GLP-1 RA alone. Our study demonstrated impressive weight loss of up to about 5 kg after 26 and 52 weeks of combination therapy. This is equivalent to about 5% weight loss from baseline, which is clinically significant.9 Liraglutide and semaglutide are the GLP-1 RAs associated with the greatest weight loss, which may contribute to greater weight loss efficacy seen in the present trial.1
In our trial SBP fell lower compared with the meta-analysis. Combination therapy significantly reduced SBP by 4.1 mm Hg and 2.7 mm Hg compared with GLP-1 RA or SGLT2i, respectively, in the meta-analysis.8 We observed a significant 9 to 12 mm Hg reduction in SBP after 26 to 52 weeks of combination therapy compared with baseline. This reduction occurred despite relatively controlled SBP at baseline (135 mm Hg). Each reduction of 10 mm Hg in SBP significantly reduces the risk of MACE, stroke, and heart failure, making our results clinically significant.10 Neither the meta-analysis nor present study found a significant difference in DBP or eGFR with combination therapy.
AEs were similar in this trial compared with the meta-analysis. Combination treatment with GLP-1 RA and SGLT2i did not increase the incidence of severe hypoglycemia in either study.8 Hypoglycemia was the most common AE in this study, but frequency was similar with combination and separate therapy. Both medication classes are associated with low or no risk of hypoglycemia on their own.1 Baseline medications likely contributed to episodes of hypoglycemia seen in this study: About 80% of patients were prescribed basal insulin, 15% were prescribed a sulfonylurea, and 13% were prescribed prandial insulin. There is limited overlap between the known AEs of GLP-1 RA and SGLT2i, making combination therapy a safe option for use in patients with T2DM.
Our study confirms greater reduction in HbA1c levels, weight, and SBP in veterans taking GLP-1 RA and SGLT2i medications in combination compared with separate use in a real-world setting in a veteran population. The magnitude of change seen in this population appears greater compared with previous studies.
Limitations
There were several limitations to our study. Given the retrospective nature, many patients included in the study did not have bloodwork drawn during the specified time frames. Because of this, many patients were excluded and missing data on renal outcomes limited the power to detect differences. Data regarding AEs were limited to what was recorded in the EHR, which may underrepresent the AEs that patients experienced. Finally, our study size was small, consisting primarily of a White and male population, which may limit generalizability.
Further research is needed to validate these findings in this population and should include a larger study population. The impact of combining GLP-1 RA with SGLT2i on cardiorenal outcomes is an important area of ongoing research.
ConclusionS
The combined use of GLP-1 RA and SGLT2i resulted in significant improvement in HbA1c levels, weight, and SBP compared with separate use in this real-world study of a VA population with T2DM. The combination was well tolerated overall. Awareness of these results can facilitate optimal care and outcomes in the VA population.
Acknowledgments
Serena Kelley, PharmD, and Michael Brenner, PharmD, assisted with study design and initial data collection. Julie Strominger, MS, provided statistical support.
1. American Diabetes Association. 9. Pharmacologic approaches to glycemic treatment: standards of medical care in diabetes-2021. Diabetes Care. 2021;44(suppl 1):S111-S124. doi.10.2337/dc21-S009
2. DeFronzo RA. Combination therapy with GLP-1 receptor agonist and SGLT2 inhibitor. Diabetes Obes Metab. 2017;19(10):1353-1362. doi.10.1111/dom.12982
3. Jabbour S, Frias J, Guja C, Hardy E, Ahmed A, Ohman P. Effects of exenatide once weekly plus dapagliflozin, exenatide once weekly, or dapagliflozin, added to metformin monotherapy, on body weight, systolic blood pressure, and triglycerides in patients with type 2 diabetes in the DURATION-8 study. Diabetes Obes Metab. 2018;20(6):1515-1519. doi:10.1111/dom.13206
4. Ludvik B, Frias J, Tinahones F, et al. Dulaglutide as add-on therapy to SGLT2 inhibitors in patients with inadequately controlled type 2 diabetes (AWARD-10): a 24-week, randomised, double-blind, placebo-controlled trial. Lancet Diabetes Endocrinol. 2018;6(5):370-381. doi:10.1016/S2213-8587(18)30023-8
5. Blonde L, Belousova L, Fainberg U, et al. Liraglutide as add-on to sodium-glucose co-transporter-2 inhibitors in patients with inadequately controlled type 2 diabetes: LIRA-ADD2SGLT2i, a 26-week, randomized, double-blind, placebo-controlled trial. Diabetes Obes Metab. 2020;22(6):929-937. doi:10.1111/dom.13978
6. Fulcher G, Matthews D, Perkovic V, et al; CANVAS trial collaborative group. Efficacy and safety of canagliflozin when used in conjunction with incretin-mimetic therapy in patients with type 2 diabetes. Diabetes Obes Metab. 2016;18(1):82-91. doi:10.1111/dom.12589
7. Zinman B, Bhosekar V, Busch R, et al. Semaglutide once weekly as add-on to SGLT-2 inhibitor therapy in type 2 diabetes (SUSTAIN 9): a randomised, placebo-controlled trial. Lancet Diabetes Endocrinol. 2019;7(5):356-367. doi:10.1016/S2213-8587(19)30066-X
8. Mantsiou C, Karagiannis T, Kakotrichi P, et al. Glucagon-like peptide-1 receptor agonists and sodium-glucose co-transporter-2 inhibitors as combination therapy for type 2 diabetes: a systematic review and meta-analysis. Diabetes Obes Metab. 2020;22(10):1857-1868. doi:10.1111/dom.14108
9. US Department of Veterans Affairs, Department of Defense. VA/DoD clinical practice guideline for the management of adult overweight and obesity. Version 3.0. Accessed August 18, 2022. www.healthquality.va.gov/guidelines/CD/obesity/VADoDObesityCPGFinal5087242020.pdf
10. Ettehad D, Emdin CA, Kiran A, et al. Blood pressure lowering for prevention of cardiovascular disease and death: a systematic review and meta-analysis. Lancet. 2015;387(10022):957-967. doi.10.1016/S0140-6736(15)01225-8
Selecting the best medication regimen for a patient with type 2 diabetes mellitus (T2DM) depends on many factors, such as glycemic control, adherence, adverse effect (AE) profile, and comorbid conditions.1 Selected agents from 2 newer medication classes, glucagon-like peptide 1 receptor agonists (GLP-1 RA) and sodium-glucose cotransporter 2 inhibitors (SGLT2i), have demonstrated cardiovascular and renal protective properties, creating a new paradigm in management.
The American Diabetes Association recommends medications with proven benefit in cardiovascular disease (CVD), such as the GLP-1 RAs liraglutide, injectable semaglutide, or dulaglutide, or the SGLT2i empagliflozin or canagliflozin, as second-line after metformin in patients with established atherosclerotic CVD or indicators of high risk to reduce the risk of major adverse cardiovascular events (MACE).1 SGLT2i are preferred in patients with diabetic kidney disease, and GLP-1 RAs are next in line for selection of agents with proven nephroprotection (liraglutide, injectable semaglutide, dulaglutide). The mechanisms of these benefits are not fully understood but may be due to their extraglycemic effects. The classes likely induce these benefits by different mechanisms: SGLT2i by hemodynamic effects and GLP-1 RAs by anti-inflammatory mechanisms.2 Although there is much interest, evidence is limited regarding the cardiovascular and renal protection benefits of these agents used in combination.
The combined use of GLP-1 RA and SGLT2i agents demonstrated greater benefit than separate use in trials with nonveteran populations.3-7 These studies evaluated effects on hemoglobin A1c (HbA1c) levels, weight loss, blood pressure (BP), and estimated glomerular filtration rate (eGFR). A meta-analysis of 7 trials found that the combination of GLP-1 RA and SGLT2i reduced HbA1c levels, body weight, and systolic blood pressure (SBP).8 All of the changes were statistically significant except for body weight with combination vs SGLT2i alone. Combination therapy was not associated with increased risk of severe hypoglycemia compared with either therapy separately.
The purpose of our study was to evaluate the safety and efficacy of the combined use of GLP-1 RA and SGLT2i in a real-world, US Department of Veterans Affairs (VA) population with T2DM.
Methods
This study was a pre-post, retrospective, single-center chart review. Subjects served as their own control. The project was reviewed and approved by the VA Ann Arbor Healthcare System Institutional Review Board. Subjects prescribed both a GLP-1 RA (semaglutide or liraglutide) and SGLT2i (empagliflozin) between January 1, 2014, and November 10, 2019, were extracted from the Corporate Data Warehouse (CDW) for possible inclusion in the study.
Patients were excluded if they received < 12 weeks of combination GLP-1 RA and SGLT2i therapy or did not have a corresponding 12-week HbA1c level. Patients also were excluded if they had < 12 weeks of monotherapy before starting combination therapy or did not have a baseline HbA1c level, or if the start date of combination therapy was not recorded in the VA electronic health record (EHR). We reviewed data for each patient from 6 months before to 1 year after the second agent was started. Start of the first agent (GLP-1 RA or SGLT2i) was recorded as the date the prescription was picked up in-person or 7 days after release date if mailed to the patient. Start of the second agent (GLP-1 RA or SGLT2i) was defined as baseline and was the date the prescription was picked up in person or 7 days after the release date if mailed.
Baseline measures were taken anytime from 8 weeks after the start of the first agent through 2 weeks after the start of the second agent. Data collected included age, sex, race, height, weight, BP, HbA1c levels, serum creatinine (SCr), eGFR, classes of medications for the treatment of T2DM, and the number of prescribed antihypertensive medications. HbA1c levels, SCr, eGFR, weight, and BP also were collected at 12 weeks (within 8-21 weeks); 26 weeks (within 22-35 weeks); and 52 weeks (within 36-57 weeks) of combination therapy. We reviewed progress notes and laboratory results to determine AEs within 26 weeks before initiating second agent (baseline) and 0 to 26 weeks and 26 to 52 weeks after initiating combination therapy.
The primary objective was to determine the effect on HbA1c levels at 12 weeks when using a GLP-1 RA and SGLT2i in combination vs separately. Secondary objectives were to determine change from baseline in mean body weight, BP, SCr, and eGFR at 12, 26, and 52 weeks; change in HbA1c levels at 26 and 52 weeks; and incidence of prespecified adverse drug reactions during combination therapy vs separately.
Statistical Analysis
Assuming a SD of 1, 80% power, significance level of P < .05, 2-sided test, and a correlation between baseline and follow-up of 0.5, we determined that a sample size of 34 subjects was required to detect a 0.5% change in baseline HbA1c level at 12 weeks. A t test (or Wilcoxon signed rank test if outcome not normally distributed) was conducted to examine whether the expected change from baseline was different from 0 for continuous outcomes. Median change from baseline was reported for SCr as a nonparametric t test (Wilcoxon signed rank test) was used.
Results
We identified 110 patients for possible study inclusion and 39 met eligibility criteria. After record review, 30 patients were excluded for receiving < 12 weeks of combination therapy or no 12 week HbA1c level; 26 patients were excluded for receiving < 12 weeks of monotherapy before starting combination therapy or no baseline HbA1c level; and 15 patients were excluded for lack of documentation in the VA EHR. Of the 39 patients included, 24 (62%) were prescribed empagliflozin first and then 8 started liraglutide and 16 started semaglutide.
HbA1c levels decreased by 1% after 12 weeks of combination therapy compared with baseline (P < .001), and this reduction was sustained through the duration of the study period (Table 2).
The most common AE during the trial was hypoglycemia, which was mostly mild (level 1) (Table 3).
Discussion
This study evaluated the safety and efficacy of combined use of semaglutide or liraglutide and empagliflozin in a veteran population with T2DM. The retrospective chart review captured real-world practice and outcomes. Combination therapy was associated with a significant reduction in HbA1c levels, body weight, and SBP compared with either agent alone. No significant change was seen in DBP, SCr, or eGFR. Overall, the combination of GLP-1 RA and SGLT2i medications demonstrated a good safety profile with most patients reporting no AEs.
Several other studies have assessed the safety and efficacy of using GLP-1 RA and SGLT2i in combination. The DURATION 8 trial is the only double-blind trial to randomize subjects to receive either exenatide once weekly, dapagliflozin, or the combination of both for up to 52 weeks.3 Other controlled trials required stable background therapy with either SGLT2i or GLP-1 RA before randomization to receive the other class or placebo and had durations between 18 and 30 weeks.4-7 The AWARD 10 trial studied the combination of canagliflozin and dulaglutide, which both have proven CVD benefit.4 Other studies did not restrict SGLT2i or GLP-1 RA background therapy to agents with proven CVD benefit.5-7 The present study evaluated the combination of empagliflozin plus liraglutide or semaglutide, agents that all have proven CVD benefit.
A meta-analysis of 7 trials, including those previously mentioned, was conducted to evaluate the combination of GLP-1 RA and SGLT2i.8 The combination significantly reduced HbA1c levels by 0.61% and 0.85% compared with GLP-1 RA or SGLT2i, respectively. Our trial showed greater HbA1c level reduction of 1% with combination therapy compared with either agent separately. This may have been due in part to a higher baseline HbA1c level in our real-world veteran population. The meta-analysis found the combination decreased body weight 2.6 kg and 1.5 kg compared with GLP-1 RA or SGLT2i, respectively.8 This only reached significance with comparison vs GLP-1 RA alone. Our study demonstrated impressive weight loss of up to about 5 kg after 26 and 52 weeks of combination therapy. This is equivalent to about 5% weight loss from baseline, which is clinically significant.9 Liraglutide and semaglutide are the GLP-1 RAs associated with the greatest weight loss, which may contribute to greater weight loss efficacy seen in the present trial.1
In our trial SBP fell lower compared with the meta-analysis. Combination therapy significantly reduced SBP by 4.1 mm Hg and 2.7 mm Hg compared with GLP-1 RA or SGLT2i, respectively, in the meta-analysis.8 We observed a significant 9 to 12 mm Hg reduction in SBP after 26 to 52 weeks of combination therapy compared with baseline. This reduction occurred despite relatively controlled SBP at baseline (135 mm Hg). Each reduction of 10 mm Hg in SBP significantly reduces the risk of MACE, stroke, and heart failure, making our results clinically significant.10 Neither the meta-analysis nor present study found a significant difference in DBP or eGFR with combination therapy.
AEs were similar in this trial compared with the meta-analysis. Combination treatment with GLP-1 RA and SGLT2i did not increase the incidence of severe hypoglycemia in either study.8 Hypoglycemia was the most common AE in this study, but frequency was similar with combination and separate therapy. Both medication classes are associated with low or no risk of hypoglycemia on their own.1 Baseline medications likely contributed to episodes of hypoglycemia seen in this study: About 80% of patients were prescribed basal insulin, 15% were prescribed a sulfonylurea, and 13% were prescribed prandial insulin. There is limited overlap between the known AEs of GLP-1 RA and SGLT2i, making combination therapy a safe option for use in patients with T2DM.
Our study confirms greater reduction in HbA1c levels, weight, and SBP in veterans taking GLP-1 RA and SGLT2i medications in combination compared with separate use in a real-world setting in a veteran population. The magnitude of change seen in this population appears greater compared with previous studies.
Limitations
There were several limitations to our study. Given the retrospective nature, many patients included in the study did not have bloodwork drawn during the specified time frames. Because of this, many patients were excluded and missing data on renal outcomes limited the power to detect differences. Data regarding AEs were limited to what was recorded in the EHR, which may underrepresent the AEs that patients experienced. Finally, our study size was small, consisting primarily of a White and male population, which may limit generalizability.
Further research is needed to validate these findings in this population and should include a larger study population. The impact of combining GLP-1 RA with SGLT2i on cardiorenal outcomes is an important area of ongoing research.
ConclusionS
The combined use of GLP-1 RA and SGLT2i resulted in significant improvement in HbA1c levels, weight, and SBP compared with separate use in this real-world study of a VA population with T2DM. The combination was well tolerated overall. Awareness of these results can facilitate optimal care and outcomes in the VA population.
Acknowledgments
Serena Kelley, PharmD, and Michael Brenner, PharmD, assisted with study design and initial data collection. Julie Strominger, MS, provided statistical support.
1. American Diabetes Association. 9. Pharmacologic approaches to glycemic treatment: standards of medical care in diabetes-2021. Diabetes Care. 2021;44(suppl 1):S111-S124. doi.10.2337/dc21-S009
2. DeFronzo RA. Combination therapy with GLP-1 receptor agonist and SGLT2 inhibitor. Diabetes Obes Metab. 2017;19(10):1353-1362. doi.10.1111/dom.12982
3. Jabbour S, Frias J, Guja C, Hardy E, Ahmed A, Ohman P. Effects of exenatide once weekly plus dapagliflozin, exenatide once weekly, or dapagliflozin, added to metformin monotherapy, on body weight, systolic blood pressure, and triglycerides in patients with type 2 diabetes in the DURATION-8 study. Diabetes Obes Metab. 2018;20(6):1515-1519. doi:10.1111/dom.13206
4. Ludvik B, Frias J, Tinahones F, et al. Dulaglutide as add-on therapy to SGLT2 inhibitors in patients with inadequately controlled type 2 diabetes (AWARD-10): a 24-week, randomised, double-blind, placebo-controlled trial. Lancet Diabetes Endocrinol. 2018;6(5):370-381. doi:10.1016/S2213-8587(18)30023-8
5. Blonde L, Belousova L, Fainberg U, et al. Liraglutide as add-on to sodium-glucose co-transporter-2 inhibitors in patients with inadequately controlled type 2 diabetes: LIRA-ADD2SGLT2i, a 26-week, randomized, double-blind, placebo-controlled trial. Diabetes Obes Metab. 2020;22(6):929-937. doi:10.1111/dom.13978
6. Fulcher G, Matthews D, Perkovic V, et al; CANVAS trial collaborative group. Efficacy and safety of canagliflozin when used in conjunction with incretin-mimetic therapy in patients with type 2 diabetes. Diabetes Obes Metab. 2016;18(1):82-91. doi:10.1111/dom.12589
7. Zinman B, Bhosekar V, Busch R, et al. Semaglutide once weekly as add-on to SGLT-2 inhibitor therapy in type 2 diabetes (SUSTAIN 9): a randomised, placebo-controlled trial. Lancet Diabetes Endocrinol. 2019;7(5):356-367. doi:10.1016/S2213-8587(19)30066-X
8. Mantsiou C, Karagiannis T, Kakotrichi P, et al. Glucagon-like peptide-1 receptor agonists and sodium-glucose co-transporter-2 inhibitors as combination therapy for type 2 diabetes: a systematic review and meta-analysis. Diabetes Obes Metab. 2020;22(10):1857-1868. doi:10.1111/dom.14108
9. US Department of Veterans Affairs, Department of Defense. VA/DoD clinical practice guideline for the management of adult overweight and obesity. Version 3.0. Accessed August 18, 2022. www.healthquality.va.gov/guidelines/CD/obesity/VADoDObesityCPGFinal5087242020.pdf
10. Ettehad D, Emdin CA, Kiran A, et al. Blood pressure lowering for prevention of cardiovascular disease and death: a systematic review and meta-analysis. Lancet. 2015;387(10022):957-967. doi.10.1016/S0140-6736(15)01225-8
How Low Is Too Low? A Retrospective Analysis of Very Low LDL-C Levels in Veterans
According to the Centers for Disease Control and Prevention (CDC), approximately 795,000 strokes occur in the United States yearly and are the fifth leading cause of death.1 The CDC also states that about 43 million Americans who could benefit from cholesterol medication are currently taking them.2 As of 2019, West Virginia, Ohio, and Kentucky are 3 states with the highest rates of heart disease mortality.3
Low-density lipoprotein cholesterol (LDL-C) accumulates on the walls of blood vessels, which can lead to coronary heart disease. However, some LDL-C is necessary to maintain proper brain function. Guidelines from the American College of Cardiology (ACC) and American Heart Association (AHA) recommend LDL-C goal levels < 70 mg/dL.4 Yet, there is no consensus on how low LDL-C levels should be. According to clinical practice guidelines for dyslipidemia, developed by the US Department of Veterans Affairs (VA) and US Department of Defense, statin medications are first-line agents for lowering LDL-C. The intensity of the statin medication is based on primary or secondary prevention, atherosclerotic cardiovascular disease (ASCVD) risk, and current LDL-C levels prior to treatment.5
Statin medications are used for primary and secondary prevention of ASCVD. In addition, statin medications decrease total cholesterol, LDL-C, and triglycerides while causing a mild increase in high-density lipoprotein cholesterol. Although statin medications are first-line therapy for LDL-C lowering, other medications can be used to assist in decreasing LDL-C. Ezetimibe, fenofibrates, and proprotein convertase subtilisin/kexin type 9 (PCSK9) inhibitors can also be used.5 Statin medications do pose a risk of severe adverse drug reactions (ADRs), such as rhabdomyolysis and myopathy.6
One prospective cohort study looked at 27,937 women and analyzed total cholesterol, LDL-C, high-density lipoprotein cholesterol, triglycerides, and strokes. The study noted a mean 19.3-year follow-up and within that follow-up, 137 hemorrhagic strokes occurred. Based on the study’s results, LDL-C levels < 70 mg/dL had 2.17 times the risk of experiencing a hemorrhagic stroke.7 A meta-analysis of prospective studies analyzed 476,173 patients and 7487 hemorrhagic stroke cases. This review concluded that a 10 mg/dL increase in LDL-C was associated with a 3% lower risk of hemorrhagic stroke.8
An observational study conducted in Asia of Chinese adults found that 22% of all strokes were hemorrhagic. The incidence of the hemorrhagic strokes was higher for patients who had an LDL-C < 1.8 mmol/L than those who had an LDL-C between 1.8 and 2.6 mmol/L. This study also showed that if hypertension was inadequately treated, the risk of hemorrhagic stroke increased. This study concluded that the benefit of reducing ASCVD outweighs the small risk of hemorrhagic strokes.9
Another prospective cohort study included 96,043 stroke-free participants and analyzed LDL-C concentrations and incidence of intracranial hemorrhage. The average LDL-C concentrations were calculated from data collected in 4 separate reporting years, and incidence of intracranial hemorrhage was confirmed through review of medication records. Over a 9-year follow-up period, the study concluded that participants with an LDL-C level of < 70 mg/dL had a significantly higher risk of developing intracranial hemorrhage than participants with LDL-C levels 70 to 99 mg/dL.10
The safety and effects of prolonged very low LDL-C levels are currently unknown. The current study sought to gather information to determine the risks of very low LDL-C levels in a veteran population.
Methods
A retrospective chart review was conducted on patients aged 18 to 90 years receiving care at the Hershel “Woody” Williams Veterans Affairs Medical Center (HWW VAMC) in Huntington, West Virginia, between January 1, 2010, and September 1, 2020. Approval of the current study was obtained through the Marshall University Institutional Review Board, HWW VAMC Research and Development Committee, and Veterans Health Administration (VHA) DATA Access Request Tracker (DART)/VA Informatic and Computing Infrastructure (VINCI). Data were obtained via the VHA Corporate Data Warehouse (CDW) for the HWW VAMC using Microsoft Structured Query Language (SQL) server available in VINCI. Analysis of the data was conducted using STATA v. 15.
Patients were included if they had a diagnosis of hyperlipidemia/dyslipidemia, received treatment with HMG-CoA reductase inhibitors or PCSK9 medications, and had an LDL-C level ≤ 40 mg/dL. The primary outcome was the rate of intracranial hemorrhage that could be caused by very low LDL-C levels. The secondary outcomes included actions taken by clinicians to address LDL-C level < 40 mg/dL, ADRs, duration of therapy, and medication adherence. Patients were excluded if they were aged < 18 or > 90 years, were pregnant during the study period, had hypothyroidism, received chronic anticoagulation medications, or had a triglyceride level > 300 mg/dL.
Results
The study included 3027 patients. Of those patients, 78 patients were female while 2949 were male, and the mean (SD) age was 68.3 (9.4) years. A subsample of 32 patients was analyzed to determine whether an ADR was noted or low LDL-C level was addressed in the chart. The subsample size was determined through chart review and included patients who had a documented intracranial hemorrhage. None of the 32 patients had an ADR documented, and 6 (19%) had the low LDL-C level addressed in the chart by monitoring levels, reducing statin doses, or discontinuing the medication. Of the total population analyzed, 8 patients (0.3%) had a documented intracranial hemorrhage within 1 year following the low LDL-C level.
We also analyzed the intensity of statin related to the low LDL-C level (Table 1). 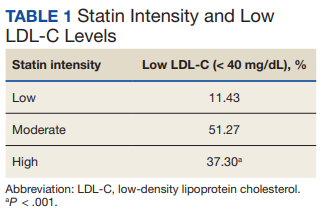
The most common ADRs were muscle, joint, and leg pain, rash, and cramps (Table 2). 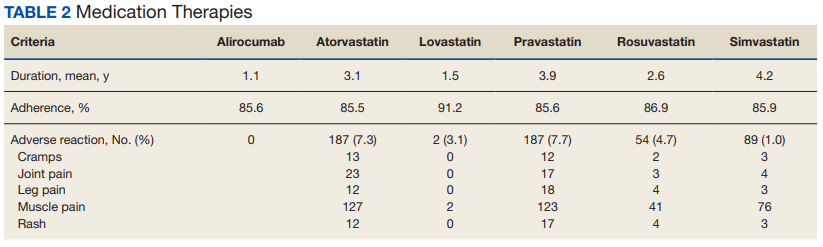
Adherence to the medications and duration of therapy was also analyzed and was found to be similar among the various medications. Lovastatin had the highest percent adherence with 91.2% while atorvastatin had the lowest with 85.5%. It can be noted that lovastatin had a lower documented percentage of ADRs while atorvastatin had a higher documented percentage of ADRs, which can be clinically meaningful when prescribing these medications; however, these similar adherence rates are not influencing the primary outcome of the rate of intracranial hemorrhage due to LDL-C level < 40 mg/dL. Mean duration of therapy lasted between 1 year and > 4 years with 1.1 years for alirocumab and 4.2 for simvastatin. The duration of therapy could be influenced by formulary restrictions during the study time. Nonetheless, patients, regardless of formulary restrictions, have taken these medications for a duration long enough to affect LDL-C levels.
Eight patients of the total sample analyzed had an intracranial hemorrhage within 1 year of having a recorded LDL-C level < 40 mg/dL. Secondarily, 32 patients had clinicians address an LDL-C level < 40 mg/dL through documentation or modifying the medication therapy. The most common ADRs among all medications analyzed were leg and joint pain, rash, and cramps. Of all medications included in this study, the mean duration of therapy was > 1 year, which would allow them to affect LDL-C levels and have those levels monitored and recorded in patients’ charts.
Discussion
When comparing our primary outcome of risk of intracranial hemorrhage with previous literature, the results are consistent with previous outcomes. Previous literature had a smaller sample size but analyzed LDL-C levels < 50 mg/dL and had an outcome of 48 patients experiencing an intracranial hemorrhage within 1 year of an LDL-C level < 50 mg/dL. Due to this study having stricter parameters of LDL-C levels < 40 mg/dL, there were fewer patients with documented intracranial hemorrhages. With there being a risk of intracranial hemorrhage with low LDL-C levels, the results demonstrate the need to monitor and address LDL-C levels.
Limitations
There were several notable limitations to this study. The retrospective, single-center nature coupled with the predominately male study population may affect the generalizability of the study results to patients outside of the facility in which the study was performed. Additionally, the study only included statin medications and PCSK9 inhibitors. With future studies, all lipid-lowering medications could be analyzed. The study was largely reliant on the proper documentation of International Statistical Classification of Diseases, Tenth Revision (ICD-10) codes exclusive to the HWW VAMC, which may exclude patients who first present to outside facilities. Due to time restraints, the incidence of hemorrhage was only analyzed 1 year following an LDL-C level < 40 mg/dL. For considerations for future investigation, the length of time to analyze incidence of hemorrhage could be expanded to be similar to previous studies, and the study could be expanded across the local Veterans Integrated Service Network or VA system. Additionally, the study could have analyzed the percentage of time a patient had an LDL-C level < 40 mg/dL in their lifetime.
Conclusions
These results show there is a risk that patients with an LDL-C level < 40 mg/dL may experience an intracranial hemorrhage. As seen by the results, there is a clinical need for practitioners to routinely monitor and address LDL-C levels. With various guidelines that recommend starting statin medication to reduce risk of ASCVD, it is necessary that practitioners routinely monitor cholesterol levels and adjust the medications according to laboratory results.11
Within 1 year of an LDL-C level < 40 mg/dL, 0.3% of patients had an intracranial hemorrhage. There was no statistical significance between the rate of ADRs among the medications analyzed. High-intensity statin medications were statistically significant in resulting in an LDL-C level < 40 mg/dL compared with moderate- and low-intensity statin medications. Of the 32 subsample of patients, LDL-C levels < 40 mg/mL are not routinely being addressed in the chart by the clinician.
1. Centers for Disease Control and Prevention. Stroke facts. Updated April 5, 2022. Accessed September 21, 2022. https://www.cdc.gov/stroke/facts.htm
2. Centers for Disease Control and Prevention. High cholesterol facts. Updated July 12, 2022. Accessed September 21, 2022. https://www.cdc.gov/cholesterol/facts.htm
3. Centers for Disease Control and Prevention. Heart disease mortality by state. Updated February 25, 2022. Accessed September 21, 2022. https://www.cdc.gov/nchs/pressroom/sosmap/heart_disease_mortality/heart_disease.htm
4. Grundy SM, Stone NJ, Bailey AL, et al. 2018 AHA/ACC/AACVPR/AAPA/ABC/ACPM/ADA/AGS/APhA/ASPC/NLA/PCNA Guideline on the Management of Blood Cholesterol: A Report of the American College of Cardiology/American Heart Association Task Force on Clinical Practice Guidelines. Circulation. 2019;139(25):e1082-e1143. doi:10.1161/CIR.0000000000000625
5. US Department of Veterans Affairs, US Department of Defense. VA/DoD Clinical Practice Guideline for the Management of Dyslipidemia for Cardiovascular Risk Reduction. Version 4.0. US Department of Veterans Affairs. June 2020. Accessed September 21, 2022. https://www.healthquality.va.gov/guidelines/CD/lipids/VADoDDyslipidemiaCPG5087212020.pdf
6. Tomaszewski M, Ste¸pien´ KM, Tomaszewska J, Czuczwar SJ. Statin-induced myopathies. Pharmacol Rep. 2011;63(4):859-66. doi:10.1016/s1734-1140(11)70601-6
7. Rist PM, Buring JE, Ridker PM, Kase CS, Kurth T, Rexrode KM. Lipid levels and the risk of hemorrhagic stroke among women. Neurology. 2019;92(19):e2286-e2294. doi:10.1212/WNL.0000000000007454
8. Ma C, Na M, Neumann S, Gao X. Low-density lipoprotein cholesterol and risk of hemorrhagic stroke: a systematic review and dose-response meta-analysis of prospective studies. Curr Atheroscler Rep. 2019;21(12):52. Published 2019 Nov 20. doi:10.1007/s11883-019-0815-5
9. Lui DT, Tan KC. Low-density lipoprotein cholesterol and stroke: How low should we go? J Diabetes Investig. 2020;11(6):1379-1381. doi:10.1111/jdi.13310
10. Ma C, Gurol ME, Huang Z, et al. Low-density lipoprotein cholesterol and risk of intracerebral hemorrhage: a prospective study. Neurology. 2019;93(5):e445-e457. doi:10.1212/WNL.0000000000007853
11. American Diabetes Association Professional Practice Committee. 10. Cardiovascular disease and risk management: standards of medical care in diabetes—2022. Diabetes Care. 2022;45(suppl 1):S144–S174. doi:10.2337/dc22-S010
According to the Centers for Disease Control and Prevention (CDC), approximately 795,000 strokes occur in the United States yearly and are the fifth leading cause of death.1 The CDC also states that about 43 million Americans who could benefit from cholesterol medication are currently taking them.2 As of 2019, West Virginia, Ohio, and Kentucky are 3 states with the highest rates of heart disease mortality.3
Low-density lipoprotein cholesterol (LDL-C) accumulates on the walls of blood vessels, which can lead to coronary heart disease. However, some LDL-C is necessary to maintain proper brain function. Guidelines from the American College of Cardiology (ACC) and American Heart Association (AHA) recommend LDL-C goal levels < 70 mg/dL.4 Yet, there is no consensus on how low LDL-C levels should be. According to clinical practice guidelines for dyslipidemia, developed by the US Department of Veterans Affairs (VA) and US Department of Defense, statin medications are first-line agents for lowering LDL-C. The intensity of the statin medication is based on primary or secondary prevention, atherosclerotic cardiovascular disease (ASCVD) risk, and current LDL-C levels prior to treatment.5
Statin medications are used for primary and secondary prevention of ASCVD. In addition, statin medications decrease total cholesterol, LDL-C, and triglycerides while causing a mild increase in high-density lipoprotein cholesterol. Although statin medications are first-line therapy for LDL-C lowering, other medications can be used to assist in decreasing LDL-C. Ezetimibe, fenofibrates, and proprotein convertase subtilisin/kexin type 9 (PCSK9) inhibitors can also be used.5 Statin medications do pose a risk of severe adverse drug reactions (ADRs), such as rhabdomyolysis and myopathy.6
One prospective cohort study looked at 27,937 women and analyzed total cholesterol, LDL-C, high-density lipoprotein cholesterol, triglycerides, and strokes. The study noted a mean 19.3-year follow-up and within that follow-up, 137 hemorrhagic strokes occurred. Based on the study’s results, LDL-C levels < 70 mg/dL had 2.17 times the risk of experiencing a hemorrhagic stroke.7 A meta-analysis of prospective studies analyzed 476,173 patients and 7487 hemorrhagic stroke cases. This review concluded that a 10 mg/dL increase in LDL-C was associated with a 3% lower risk of hemorrhagic stroke.8
An observational study conducted in Asia of Chinese adults found that 22% of all strokes were hemorrhagic. The incidence of the hemorrhagic strokes was higher for patients who had an LDL-C < 1.8 mmol/L than those who had an LDL-C between 1.8 and 2.6 mmol/L. This study also showed that if hypertension was inadequately treated, the risk of hemorrhagic stroke increased. This study concluded that the benefit of reducing ASCVD outweighs the small risk of hemorrhagic strokes.9
Another prospective cohort study included 96,043 stroke-free participants and analyzed LDL-C concentrations and incidence of intracranial hemorrhage. The average LDL-C concentrations were calculated from data collected in 4 separate reporting years, and incidence of intracranial hemorrhage was confirmed through review of medication records. Over a 9-year follow-up period, the study concluded that participants with an LDL-C level of < 70 mg/dL had a significantly higher risk of developing intracranial hemorrhage than participants with LDL-C levels 70 to 99 mg/dL.10
The safety and effects of prolonged very low LDL-C levels are currently unknown. The current study sought to gather information to determine the risks of very low LDL-C levels in a veteran population.
Methods
A retrospective chart review was conducted on patients aged 18 to 90 years receiving care at the Hershel “Woody” Williams Veterans Affairs Medical Center (HWW VAMC) in Huntington, West Virginia, between January 1, 2010, and September 1, 2020. Approval of the current study was obtained through the Marshall University Institutional Review Board, HWW VAMC Research and Development Committee, and Veterans Health Administration (VHA) DATA Access Request Tracker (DART)/VA Informatic and Computing Infrastructure (VINCI). Data were obtained via the VHA Corporate Data Warehouse (CDW) for the HWW VAMC using Microsoft Structured Query Language (SQL) server available in VINCI. Analysis of the data was conducted using STATA v. 15.
Patients were included if they had a diagnosis of hyperlipidemia/dyslipidemia, received treatment with HMG-CoA reductase inhibitors or PCSK9 medications, and had an LDL-C level ≤ 40 mg/dL. The primary outcome was the rate of intracranial hemorrhage that could be caused by very low LDL-C levels. The secondary outcomes included actions taken by clinicians to address LDL-C level < 40 mg/dL, ADRs, duration of therapy, and medication adherence. Patients were excluded if they were aged < 18 or > 90 years, were pregnant during the study period, had hypothyroidism, received chronic anticoagulation medications, or had a triglyceride level > 300 mg/dL.
Results
The study included 3027 patients. Of those patients, 78 patients were female while 2949 were male, and the mean (SD) age was 68.3 (9.4) years. A subsample of 32 patients was analyzed to determine whether an ADR was noted or low LDL-C level was addressed in the chart. The subsample size was determined through chart review and included patients who had a documented intracranial hemorrhage. None of the 32 patients had an ADR documented, and 6 (19%) had the low LDL-C level addressed in the chart by monitoring levels, reducing statin doses, or discontinuing the medication. Of the total population analyzed, 8 patients (0.3%) had a documented intracranial hemorrhage within 1 year following the low LDL-C level.
We also analyzed the intensity of statin related to the low LDL-C level (Table 1).
The most common ADRs were muscle, joint, and leg pain, rash, and cramps (Table 2).
Adherence to the medications and duration of therapy was also analyzed and was found to be similar among the various medications. Lovastatin had the highest percent adherence with 91.2% while atorvastatin had the lowest with 85.5%. It can be noted that lovastatin had a lower documented percentage of ADRs while atorvastatin had a higher documented percentage of ADRs, which can be clinically meaningful when prescribing these medications; however, these similar adherence rates are not influencing the primary outcome of the rate of intracranial hemorrhage due to LDL-C level < 40 mg/dL. Mean duration of therapy lasted between 1 year and > 4 years with 1.1 years for alirocumab and 4.2 for simvastatin. The duration of therapy could be influenced by formulary restrictions during the study time. Nonetheless, patients, regardless of formulary restrictions, have taken these medications for a duration long enough to affect LDL-C levels.
Eight patients of the total sample analyzed had an intracranial hemorrhage within 1 year of having a recorded LDL-C level < 40 mg/dL. Secondarily, 32 patients had clinicians address an LDL-C level < 40 mg/dL through documentation or modifying the medication therapy. The most common ADRs among all medications analyzed were leg and joint pain, rash, and cramps. Of all medications included in this study, the mean duration of therapy was > 1 year, which would allow them to affect LDL-C levels and have those levels monitored and recorded in patients’ charts.
Discussion
When comparing our primary outcome of risk of intracranial hemorrhage with previous literature, the results are consistent with previous outcomes. Previous literature had a smaller sample size but analyzed LDL-C levels < 50 mg/dL and had an outcome of 48 patients experiencing an intracranial hemorrhage within 1 year of an LDL-C level < 50 mg/dL. Due to this study having stricter parameters of LDL-C levels < 40 mg/dL, there were fewer patients with documented intracranial hemorrhages. With there being a risk of intracranial hemorrhage with low LDL-C levels, the results demonstrate the need to monitor and address LDL-C levels.
Limitations
There were several notable limitations to this study. The retrospective, single-center nature coupled with the predominately male study population may affect the generalizability of the study results to patients outside of the facility in which the study was performed. Additionally, the study only included statin medications and PCSK9 inhibitors. With future studies, all lipid-lowering medications could be analyzed. The study was largely reliant on the proper documentation of International Statistical Classification of Diseases, Tenth Revision (ICD-10) codes exclusive to the HWW VAMC, which may exclude patients who first present to outside facilities. Due to time restraints, the incidence of hemorrhage was only analyzed 1 year following an LDL-C level < 40 mg/dL. For considerations for future investigation, the length of time to analyze incidence of hemorrhage could be expanded to be similar to previous studies, and the study could be expanded across the local Veterans Integrated Service Network or VA system. Additionally, the study could have analyzed the percentage of time a patient had an LDL-C level < 40 mg/dL in their lifetime.
Conclusions
These results show there is a risk that patients with an LDL-C level < 40 mg/dL may experience an intracranial hemorrhage. As seen by the results, there is a clinical need for practitioners to routinely monitor and address LDL-C levels. With various guidelines that recommend starting statin medication to reduce risk of ASCVD, it is necessary that practitioners routinely monitor cholesterol levels and adjust the medications according to laboratory results.11
Within 1 year of an LDL-C level < 40 mg/dL, 0.3% of patients had an intracranial hemorrhage. There was no statistical significance between the rate of ADRs among the medications analyzed. High-intensity statin medications were statistically significant in resulting in an LDL-C level < 40 mg/dL compared with moderate- and low-intensity statin medications. Of the 32 subsample of patients, LDL-C levels < 40 mg/mL are not routinely being addressed in the chart by the clinician.
1. Centers for Disease Control and Prevention. Stroke facts. Updated April 5, 2022. Accessed September 21, 2022. https://www.cdc.gov/stroke/facts.htm
2. Centers for Disease Control and Prevention. High cholesterol facts. Updated July 12, 2022. Accessed September 21, 2022. https://www.cdc.gov/cholesterol/facts.htm
3. Centers for Disease Control and Prevention. Heart disease mortality by state. Updated February 25, 2022. Accessed September 21, 2022. https://www.cdc.gov/nchs/pressroom/sosmap/heart_disease_mortality/heart_disease.htm
4. Grundy SM, Stone NJ, Bailey AL, et al. 2018 AHA/ACC/AACVPR/AAPA/ABC/ACPM/ADA/AGS/APhA/ASPC/NLA/PCNA Guideline on the Management of Blood Cholesterol: A Report of the American College of Cardiology/American Heart Association Task Force on Clinical Practice Guidelines. Circulation. 2019;139(25):e1082-e1143. doi:10.1161/CIR.0000000000000625
5. US Department of Veterans Affairs, US Department of Defense. VA/DoD Clinical Practice Guideline for the Management of Dyslipidemia for Cardiovascular Risk Reduction. Version 4.0. US Department of Veterans Affairs. June 2020. Accessed September 21, 2022. https://www.healthquality.va.gov/guidelines/CD/lipids/VADoDDyslipidemiaCPG5087212020.pdf
6. Tomaszewski M, Ste¸pien´ KM, Tomaszewska J, Czuczwar SJ. Statin-induced myopathies. Pharmacol Rep. 2011;63(4):859-66. doi:10.1016/s1734-1140(11)70601-6
7. Rist PM, Buring JE, Ridker PM, Kase CS, Kurth T, Rexrode KM. Lipid levels and the risk of hemorrhagic stroke among women. Neurology. 2019;92(19):e2286-e2294. doi:10.1212/WNL.0000000000007454
8. Ma C, Na M, Neumann S, Gao X. Low-density lipoprotein cholesterol and risk of hemorrhagic stroke: a systematic review and dose-response meta-analysis of prospective studies. Curr Atheroscler Rep. 2019;21(12):52. Published 2019 Nov 20. doi:10.1007/s11883-019-0815-5
9. Lui DT, Tan KC. Low-density lipoprotein cholesterol and stroke: How low should we go? J Diabetes Investig. 2020;11(6):1379-1381. doi:10.1111/jdi.13310
10. Ma C, Gurol ME, Huang Z, et al. Low-density lipoprotein cholesterol and risk of intracerebral hemorrhage: a prospective study. Neurology. 2019;93(5):e445-e457. doi:10.1212/WNL.0000000000007853
11. American Diabetes Association Professional Practice Committee. 10. Cardiovascular disease and risk management: standards of medical care in diabetes—2022. Diabetes Care. 2022;45(suppl 1):S144–S174. doi:10.2337/dc22-S010
Assessment of Glucagon-like Peptide-1 Receptor Agonists in Veterans Taking Basal/Bolus Insulin Regimens
In 2019, diabetes mellitus (DM) was the seventh leading cause of death in the United States, and currently, about 11% of the American population has a DM diagnosis.1 Most have a diagnosis of type 2 diabetes (T2DM), which has a strong genetic predisposition, and the risk of developing T2DM increases with age, obesity, and lack of physical activity.1,2 Nearly one-quarter of veterans have a diagnosis of DM, and DM is the leading cause of comorbidities, such as blindness, end-stage renal disease, and amputation for patients receiving care from the Veterans Health Administration (VHA).2 The elevated incidence of DM in the veteran population is attributed to a variety of factors, including exposure to herbicides, such as Agent Orange, advanced age, increased risk of obesity, and limited access to high-quality food.3
After diagnosis, both the American Diabetes Association (ADA) and the American Association of Clinical Endocrinologists and American College of Endocrinology (AACE/ACE) emphasize the appropriate use of lifestyle management and pharmacologic therapy for DM care. The use of pharmacologic agents (oral medications, insulin, or noninsulin injectables) is often determined by efficacy, cost, potential adverse effects (AEs), and patient factors and comorbidities.4,5
The initial recommendation for pharmacologic treatment for T2DM differs slightly between expert guidelines. The ADA and AACE/ACE recommend any of the following as initial monotherapy, listed in order to represent a hierarchy of usage: metformin, glucagon-like peptide-1 receptor agonists (GLP-1 RAs), sodium-glucose cotransporter 2 (SGLT-2) inhibitors, or dipeptidyl peptidase-4 (DPP-4) inhibitors, with the first 3 agents carrying the strongest recommendations.4,5 For patients with established atherosclerotic cardiovascular disease (CVD), chronic kidney disease, or heart failure, it is recommended to start a long-acting GLP-1 RA or SGLT-2 inhibitor. For patients with T2DM and hemoglobin A1c (HbA1c) between 7.5% and 9.0% at diagnosis, the AACE/ACE recommend initiation of dual therapy using metformin alongside another first-line agent and recommend the addition of another antidiabetic agent if glycemic goals are not met after regular follow-up. AACE/ACE recommend the consideration of insulin therapy in symptomatic patients with HbA1c > 9.0%.5 In contrast, the ADA recommends metformin as first-line therapy for all patients with T2DM and recommends dual therapy using metformin and another preferred agent (selection based on comorbidities) when HbA1c is 1.5% to 2% above target. The ADA recommends the consideration of insulin with HbA1c > 10% or with evidence of ongoing catabolism or symptoms of hyperglycemia.4 There are several reasons why insulin may be initiated prior to GLP-1 RAs, including profound hyperglycemia at time of diagnosis or implementation of insulin agents prior to commercial availability of GLP-1 RA.
GLP-1 RAs are analogs of the hormone incretin, which increases glucose-dependent insulin secretion, decreases postprandial glucagon secretion, increases satiety, and slows gastric emptying.6,7 When used in combination with noninsulin agents, GLP-1 RAs have demonstrated HbA1c reductions of 0.5% to 1.5%.8 The use of GLP-1 RAs with basal insulin also has been studied extensively.6,8-10 When the combination of GLP-1 RAs and basal insulin was compared with basal/bolus insulin regimens, the use of the GLP-1 RAs resulted in lower HbA1c levels and lower incidence of hypoglycemia.6,9 Data have demonstrated the complementary mechanisms of using basal insulin and GLP 1 RAs in decreasing HbA1c levels, insulin requirements, and weight compared with using basal insulin monotherapy and basal/bolus combinations.6,9-13 Moreover, 3 GLP-1 RA medications currently on the market (liraglutide, dulaglutide, and semaglutide) have displayed cardiovascular and renal benefits, further supporting the use of these medications.2,5
Despite these benefits, GLP-1 RAs may have bothersome AEs and are associated with a high cost.6 In addition, some studies have found that as the length of therapy increases, the positive effects of these agents may diminish.9,11 In one study, which looked at the impact of the addition of exenatide to patients taking basal or basal/bolus insulin regimens, mean changes in weight were −2.4 kg at 0 to 6 months, −4.3 kg at 6 to 12 months, −6.2 kg at 12 to 18 months, and −5.5 kg at 18 to 27 months. After 18 months, an increase in weight was observed, but the increase remained lower than baseline.11 Another study, conducted over 12 months, found no significant decrease in weight or total daily dose (TDD) of insulin when exenatide or liraglutide were added to various insulin regimens (basal or basal/bolus).13 To date, minimal published data exist regarding the addition of newer GLP-1 RAs and the long-term use of these agents beyond 12 months in patients taking basal/bolus insulin regimens. The primary goal of this study was to evaluate the effect of adding GLP-1 RAs to basal/bolus insulin regimens over a 24-month period.
Methods
This study was a retrospective, electronic health record review of all patients on basal and bolus insulin regimens who received additional therapy with a GLP-1 RA at Veteran Health Indiana in Indianapolis from September 1, 2015, to June 30, 2019. Patients meeting inclusion criteria served as their own control. The primary outcome was change in HbA1c at 3, 6, 12, 18, and 24 months after initiation of the GLP-1 RA. Secondary outcomes included change in weight and TDD of insulin at 3, 6, 12, 18, and 24 months after the initiation of the GLP-1 RAs and incidence of patient-reported or laboratory-confirmed hypoglycemia and other AEs.
Patients were included if they were aged ≥ 18 years with a diagnosis of T2DM, had concomitant prescriptions for both a basal insulin (glargine, detemir, or NPH) and a bolus insulin (aspart, lispro, or regular) before receiving add-on therapy with a GLP-1 RA (exenatide, liraglutide, albiglutide, lixisenatide, dulaglutide, or semaglutide) from September 1, 2015, to June 30, 2019, and had baseline and subsequent HbA1c measurements available in the electronic health record. Patients were excluded if they had a diagnosis of type 1 DM (T1DM), were followed by an outside clinician for DM care, or if the GLP-1 RA was discontinued before subsequent HbA1c measurement. The study protocol was approved by the Research and Development Office of Veteran Health Indiana, and the project was deemed exempt from review by the Indiana University Institutional Review Board due to the retrospective nature of the study.
Data analysis was performed using Excel. Change from baseline for each interval was computed, and 1 sample t tests (2-tailed) compared change from baseline to no change. Due to the disparity in the number of patients with data available at each of the time intervals, a mean plot was presented for each group of patients within each interval, allowing mean changes in individual groups to be observed over time.
Results
One hundred twenty-three subjects met inclusion criteria; 16 patients were excluded due to GLP-1 RA discontinuation before follow-up measurement of HbA1c; 14 were excluded due to patients being managed by a clinician outside of the facility; 1 patient was excluded for lack of documentation regarding baseline and subsequent insulin doses. Ninety-two patient charts were reviewed. Participants had a mean age of 64 years, 95% were male, and 89% were White. Mean baseline HbA1c was 9.2%, mean body mass index was 38.9, and the mean TDD of insulin was 184 units. 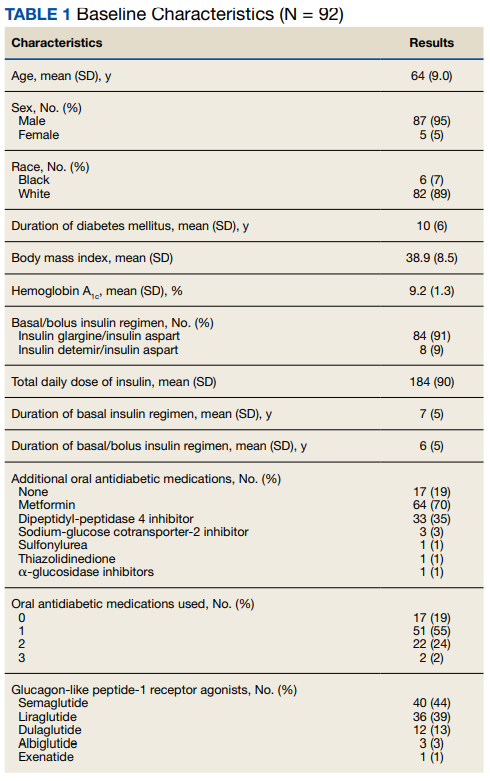
Since some patients switched between GLP-1 RAs throughout the study and there was variation in timing of laboratory and clinic follow-up, ![]()
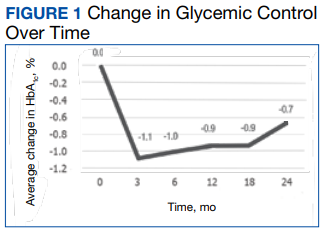
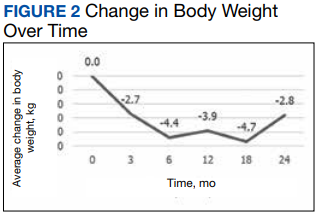
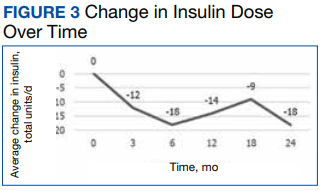
Discussion
Adding a GLP-1 RA to basal/bolus insulin regimens was associated with a statistically significant decrease in HbA1c at each time point through 18 months. The greatest improvement in glycemic control from baseline was seen at 3 months, with improvements in HbA1c diminishing at each subsequent period. The study also demonstrated a significant decrease in weight at each time point through 18 months. The greatest decrease in weight was observed at both 6 and 12 months. Statistically significant decreases in TDD were observed at 3, 6, and 12 months. Insulin changes after 12 months were not found to be statistically significant.
Few studies have previously evaluated the use of GLP-1 RAs in patients with T2DM who are already taking basal/bolus insulin regimens. Gyorffy and colleagues reported significant improvements in glycemic control at 3 and 6 months in a sample of 54 patients taking basal/bolus insulin when liraglutide or exenatide was added, although statistical significance was not found at the final 12-month time point.13 That study also found a significant decrease in weight at 6 months; however there was not a significant reduction in weight at both 3 and 12 months of GLP-1 RA therapy. There was not a significant decrease in TDD at any of the collected time points. Nonetheless, Gyorffy and colleagues concluded that reduction in TDD leveled off after 12 months, which is consistent with this study’s findings. The small size of the study may have limited the ability to detect statistical significance; however, this study was conducted in a population that was racially diverse and included a higher proportion of women, though average age was similar.13
Yoon and colleagues reported weight loss through 18 months, then saw weight increase, though weights did remain lower than baseline. The study also showed no significant change in TDD of insulin after 12 months of concomitant exenatide and insulin therapy.11 Although these results mirror the outcomes observed in this study, Yoon and colleagues did not differentiate results between basal and basal/bolus insulin groups.11 Seino and colleagues observed no significant change in weight after 36 weeks of GLP-1 RA therapy in Japanese patients when used with basal and basal/bolus insulin regimens. Despite the consideration that the population in the study was not overweight (mean body mass index was 25.6), the results of these studies support the idea that effects of GLP-1 RAs on weight and TDD may diminish over time.14
Within the VHA, GLP-1 RAs are nonformulary medications. Patients must meet certain criteria in order to be approved for these agents, which may include diagnosis of CVD, renal disease, or failure to reach glycemic control with the use of oral agents or insulin. Therefore, participants of this study represent a particular subset of VHA patients, many of whom may have been selected for consideration due to long-standing or uncontrolled T2DM and failure of previous therapies. The baseline demographics support this idea, given poor glycemic control at baseline and high insulin requirements. Once approved for GLP-1 RA therapy, semaglutide is currently the preferred agent within the VHA, with other agents available for select considerations. It should be noted that albiglutide, which was the primary agent selected for some of the patients included in this study, was removed from the market in 2017 for economic considerations.15 In the case for these patients, a conversion to a formulary-preferred GLP-1 RA was made.
Most of the patients included in this study (70%) were maintained on metformin from baseline throughout the study period. Fifty-seven percent of patients were taking TDD of insulin > 150 units. Considering the significant cost of concentrated insulins, the addition of GLP-1 RAs to standard insulin may prove to be beneficial from a cost standpoint. Additional research in this area may be warranted to establish more data regarding this potential benefit of GLP-1 RAs as add-on therapy.
Many adverse drug reactions were reported at different periods; however, most of these were associated with the gastrointestinal system, which is consistent with current literature, drug labeling, and the mechanism of action.16 Hypoglycemia occurred in about one-third of the participants; however, it should be noted that alone, GLP-1 RAs are not associated with a high risk of hypoglycemia. Previous studies have found that GLP-1 RA monotherapy is associated with hypoglycemia in 1.6% to 12.6% of patients.17,18 More likely, the combination of basal/bolus insulin and the GLP-1 RA’s effect on increasing insulin sensitivity through weight loss, improving glucose-dependent insulin secretion, or by decreasing appetite and therefore decreasing carbohydrate intake contributed to the hypoglycemia prevalence.
Limitations and Strengths
Limitations of this study include a small patient population and a gradual reduction in available data as time periods progressed, making even smaller sample sizes for subsequent time periods. A majority of participants were older, males and White race. This could have limited the determination of statistical significance and applicability of the results to other patient populations. Another potential limitation was the retrospective nature of the study design, which may have limited reporting of hypoglycemia and other AEs based on the documentation of the clinician.
Strengths included the study duration and the diversity of GLP-1 RAs used by participants, as the impact of many of these agents has not yet been assessed in the literature. In addition, the retrospective nature of the study allows for a more realistic representation of patient adherence, education, and motivation, which are likely different from those of patients included in prospective clinical trials.
There are no clear guidelines dictating the optimal duration of concomitant GLP-1 RA and insulin therapy; however, our study suggests that there may be continued benefits past short-term use. Also our study suggests that patients with T2DM treated with basal/bolus insulin regimens may glean additional benefit from adding GLP-1 RAs; however, further randomized, controlled studies are warranted, particularly in poorly controlled patients requiring even more aggressive treatment regimens, such as concentrated insulins.
Conclusions
In our study, adding GLP-1 RA to basal/bolus insulin was associated with a significant decrease in HbA1c from baseline through 18 months. An overall decrease in weight and TDD of insulin was observed through 24 months, but the change in weight was not significant past 18 months, and the change in insulin requirement was not significant past 12 months. Hypoglycemia was observed in almost one-third of patients, and gastrointestinal symptoms were the most common AE observed as a result of adding GLP-1 RAs. More studies are needed to better evaluate the durability and cost benefit of GLP-1 RAs, especially in patients with high insulin requirements.
Acknowledgments
This material is the result of work supported with resources and facilities at Veteran Health Indiana in Indianapolis. Study data were collected and managed using REDCap electronic data capture tools hosted at Veteran Health Indiana. The authors also acknowledge George Eckert for his assistance with data analysis.
1. American Diabetes Association. Statistics about diabetes. Accessed August 9, 2022. http://www.diabetes.org/diabetes-basics/statistics
2. US Department of Veterans Affairs, Veterans Health Administration, Office of Research and Development. VA research on: diabetes. Updated January 15, 2021. Accessed August 9, 2022. https://www.research.va.gov/topics/diabetes.cfm
3. Federal Practitioner. Federal Health Care Data Trends 2017, Diabetes mellitus. Accessed August 9, 2022. https://www.fedprac-digital.com/federalpractitioner/data_trends_2017?pg=20#pg20
4. American Diabetes Association Professional Practice Committee. 9. Pharmacologic approaches to glycemic treatment: Standards of Medical Care in Diabetes—2022. Diabetes Care. 2022;45(suppl 1):S125-S143. doi:10.2337/dc22-S009
5. Garber AJ, Abrahamson MJ, Barzilay JI, et al. Consensus statement by the American Association of Clinical Endocrinologists and American College of Endocrinology on the comprehensive type 2 diabetes management algorithm – 2019 executive summary. Endocr Pract. 2019;25(1):69-100. doi:10.4158/CS-2018-0535
6. St Onge E, Miller S, Clements E, Celauro L, Barnes K. The role of glucagon-like peptide-1 receptor agonists in the treatment of type 2 diabetes. J Transl Int Med. 2017;5(2):79-89. Published 2017 Jun 30. doi:10.1515/jtim-2017-0015
7. Almandoz JP, Lingvay I, Morales J, Campos C. Switching between glucagon-like peptide-1 receptor agonists: rationale and practical guidance. Clin Diabetes. 2020;38(4):390-402. doi:10.2337/cd19-0100
8. Davies ML, Pham DQ, Drab SR. GLP1-RA add-on therapy in patients with type 2 diabetes currently on a bolus containing insulin regimen. Pharmacotherapy. 2016;36(8):893-905. doi:10.1002/phar.1792
9. Rosenstock J, Guerci B, Hanefeld M, et al. Prandial options to advance basal insulin glargine therapy: testing lixisenatide plus basal insulin versus insulin glulisine either as basal-plus or basal-bolus in type 2 diabetes: the GetGoal Duo-2 Trial Investigators. Diabetes Care. 2016;39(8):1318-1328. doi:10.2337/dc16-0014
10. Levin PA, Mersey JH, Zhou S, Bromberger LA. Clinical outcomes using long-term combination therapy with insulin glargine and exenatide in patients with type 2 diabetes mellitus. Endocr Pract. 2012;18(1):17-25. doi:10.4158/EP11097.OR
11. Yoon NM, Cavaghan MK, Brunelle RL, Roach P. Exenatide added to insulin therapy: a retrospective review of clinical practice over two years in an academic endocrinology outpatient setting. Clin Ther. 2009;31(7):1511-1523. doi:10.1016/j.clinthera.2009.07.021
12. Weissman PN, Carr MC, Ye J, et al. HARMONY 4: randomised clinical trial comparing once-weekly albiglutide and insulin glargine in patients with type 2 diabetes inadequately controlled with metformin with or without sulfonylurea. Diabetologia. 2014;57(12):2475-2484. doi:10.1007/s00125-014-3360-3
13. Gyorffy JB, Keithler AN, Wardian JL, Zarzabal LA, Rittel A, True MW. The impact of GLP-1 receptor agonists on patients with diabetes on insulin therapy. Endocr Pract. 2019;25(9):935-942. doi:10.4158/EP-2019-0023
14. Seino Y, Kaneko S, Fukuda S, et al. Combination therapy with liraglutide and insulin in Japanese patients with type 2 diabetes: a 36-week, randomized, double-blind, parallel-group trial. J Diabetes Investig. 2016;7(4):565-573. doi:10.1111/jdi.12457
15. Optum. Tanzeum (albiglutide)–drug discontinuation. Published 2017. Accessed August 15, 2022. https://professionals.optumrx.com/content/dam/optum3/professional-optumrx/news/rxnews/drug-recalls-shortages/drugwithdrawal_tanzeum_2017-0801.pdf
16. Chun JH, Butts A. Long-acting GLP-1RAs: an overview of efficacy, safety, and their role in type 2 diabetes management. JAAPA. 2020;33(8):3-18. doi:10.1097/01.JAA.0000669456.13763.bd
17. Ozempic semaglutide injection. Prescribing information. Novo Nordisk; 2022. Accessed August 9, 2022. https://www.novo-pi.com/ozempic.pdf
18. Victoza liraglutide injection. Prescribing information. Novo Nordisk; 2021. Accessed August 9, 2022. https://www.novo-pi.com/victoza.pdf
In 2019, diabetes mellitus (DM) was the seventh leading cause of death in the United States, and currently, about 11% of the American population has a DM diagnosis.1 Most have a diagnosis of type 2 diabetes (T2DM), which has a strong genetic predisposition, and the risk of developing T2DM increases with age, obesity, and lack of physical activity.1,2 Nearly one-quarter of veterans have a diagnosis of DM, and DM is the leading cause of comorbidities, such as blindness, end-stage renal disease, and amputation for patients receiving care from the Veterans Health Administration (VHA).2 The elevated incidence of DM in the veteran population is attributed to a variety of factors, including exposure to herbicides, such as Agent Orange, advanced age, increased risk of obesity, and limited access to high-quality food.3
After diagnosis, both the American Diabetes Association (ADA) and the American Association of Clinical Endocrinologists and American College of Endocrinology (AACE/ACE) emphasize the appropriate use of lifestyle management and pharmacologic therapy for DM care. The use of pharmacologic agents (oral medications, insulin, or noninsulin injectables) is often determined by efficacy, cost, potential adverse effects (AEs), and patient factors and comorbidities.4,5
The initial recommendation for pharmacologic treatment for T2DM differs slightly between expert guidelines. The ADA and AACE/ACE recommend any of the following as initial monotherapy, listed in order to represent a hierarchy of usage: metformin, glucagon-like peptide-1 receptor agonists (GLP-1 RAs), sodium-glucose cotransporter 2 (SGLT-2) inhibitors, or dipeptidyl peptidase-4 (DPP-4) inhibitors, with the first 3 agents carrying the strongest recommendations.4,5 For patients with established atherosclerotic cardiovascular disease (CVD), chronic kidney disease, or heart failure, it is recommended to start a long-acting GLP-1 RA or SGLT-2 inhibitor. For patients with T2DM and hemoglobin A1c (HbA1c) between 7.5% and 9.0% at diagnosis, the AACE/ACE recommend initiation of dual therapy using metformin alongside another first-line agent and recommend the addition of another antidiabetic agent if glycemic goals are not met after regular follow-up. AACE/ACE recommend the consideration of insulin therapy in symptomatic patients with HbA1c > 9.0%.5 In contrast, the ADA recommends metformin as first-line therapy for all patients with T2DM and recommends dual therapy using metformin and another preferred agent (selection based on comorbidities) when HbA1c is 1.5% to 2% above target. The ADA recommends the consideration of insulin with HbA1c > 10% or with evidence of ongoing catabolism or symptoms of hyperglycemia.4 There are several reasons why insulin may be initiated prior to GLP-1 RAs, including profound hyperglycemia at time of diagnosis or implementation of insulin agents prior to commercial availability of GLP-1 RA.
GLP-1 RAs are analogs of the hormone incretin, which increases glucose-dependent insulin secretion, decreases postprandial glucagon secretion, increases satiety, and slows gastric emptying.6,7 When used in combination with noninsulin agents, GLP-1 RAs have demonstrated HbA1c reductions of 0.5% to 1.5%.8 The use of GLP-1 RAs with basal insulin also has been studied extensively.6,8-10 When the combination of GLP-1 RAs and basal insulin was compared with basal/bolus insulin regimens, the use of the GLP-1 RAs resulted in lower HbA1c levels and lower incidence of hypoglycemia.6,9 Data have demonstrated the complementary mechanisms of using basal insulin and GLP 1 RAs in decreasing HbA1c levels, insulin requirements, and weight compared with using basal insulin monotherapy and basal/bolus combinations.6,9-13 Moreover, 3 GLP-1 RA medications currently on the market (liraglutide, dulaglutide, and semaglutide) have displayed cardiovascular and renal benefits, further supporting the use of these medications.2,5
Despite these benefits, GLP-1 RAs may have bothersome AEs and are associated with a high cost.6 In addition, some studies have found that as the length of therapy increases, the positive effects of these agents may diminish.9,11 In one study, which looked at the impact of the addition of exenatide to patients taking basal or basal/bolus insulin regimens, mean changes in weight were −2.4 kg at 0 to 6 months, −4.3 kg at 6 to 12 months, −6.2 kg at 12 to 18 months, and −5.5 kg at 18 to 27 months. After 18 months, an increase in weight was observed, but the increase remained lower than baseline.11 Another study, conducted over 12 months, found no significant decrease in weight or total daily dose (TDD) of insulin when exenatide or liraglutide were added to various insulin regimens (basal or basal/bolus).13 To date, minimal published data exist regarding the addition of newer GLP-1 RAs and the long-term use of these agents beyond 12 months in patients taking basal/bolus insulin regimens. The primary goal of this study was to evaluate the effect of adding GLP-1 RAs to basal/bolus insulin regimens over a 24-month period.
Methods
This study was a retrospective, electronic health record review of all patients on basal and bolus insulin regimens who received additional therapy with a GLP-1 RA at Veteran Health Indiana in Indianapolis from September 1, 2015, to June 30, 2019. Patients meeting inclusion criteria served as their own control. The primary outcome was change in HbA1c at 3, 6, 12, 18, and 24 months after initiation of the GLP-1 RA. Secondary outcomes included change in weight and TDD of insulin at 3, 6, 12, 18, and 24 months after the initiation of the GLP-1 RAs and incidence of patient-reported or laboratory-confirmed hypoglycemia and other AEs.
Patients were included if they were aged ≥ 18 years with a diagnosis of T2DM, had concomitant prescriptions for both a basal insulin (glargine, detemir, or NPH) and a bolus insulin (aspart, lispro, or regular) before receiving add-on therapy with a GLP-1 RA (exenatide, liraglutide, albiglutide, lixisenatide, dulaglutide, or semaglutide) from September 1, 2015, to June 30, 2019, and had baseline and subsequent HbA1c measurements available in the electronic health record. Patients were excluded if they had a diagnosis of type 1 DM (T1DM), were followed by an outside clinician for DM care, or if the GLP-1 RA was discontinued before subsequent HbA1c measurement. The study protocol was approved by the Research and Development Office of Veteran Health Indiana, and the project was deemed exempt from review by the Indiana University Institutional Review Board due to the retrospective nature of the study.
Data analysis was performed using Excel. Change from baseline for each interval was computed, and 1 sample t tests (2-tailed) compared change from baseline to no change. Due to the disparity in the number of patients with data available at each of the time intervals, a mean plot was presented for each group of patients within each interval, allowing mean changes in individual groups to be observed over time.
Results
One hundred twenty-three subjects met inclusion criteria; 16 patients were excluded due to GLP-1 RA discontinuation before follow-up measurement of HbA1c; 14 were excluded due to patients being managed by a clinician outside of the facility; 1 patient was excluded for lack of documentation regarding baseline and subsequent insulin doses. Ninety-two patient charts were reviewed. Participants had a mean age of 64 years, 95% were male, and 89% were White. Mean baseline HbA1c was 9.2%, mean body mass index was 38.9, and the mean TDD of insulin was 184 units.
Since some patients switched between GLP-1 RAs throughout the study and there was variation in timing of laboratory and clinic follow-up, ![]()
Discussion
Adding a GLP-1 RA to basal/bolus insulin regimens was associated with a statistically significant decrease in HbA1c at each time point through 18 months. The greatest improvement in glycemic control from baseline was seen at 3 months, with improvements in HbA1c diminishing at each subsequent period. The study also demonstrated a significant decrease in weight at each time point through 18 months. The greatest decrease in weight was observed at both 6 and 12 months. Statistically significant decreases in TDD were observed at 3, 6, and 12 months. Insulin changes after 12 months were not found to be statistically significant.
Few studies have previously evaluated the use of GLP-1 RAs in patients with T2DM who are already taking basal/bolus insulin regimens. Gyorffy and colleagues reported significant improvements in glycemic control at 3 and 6 months in a sample of 54 patients taking basal/bolus insulin when liraglutide or exenatide was added, although statistical significance was not found at the final 12-month time point.13 That study also found a significant decrease in weight at 6 months; however there was not a significant reduction in weight at both 3 and 12 months of GLP-1 RA therapy. There was not a significant decrease in TDD at any of the collected time points. Nonetheless, Gyorffy and colleagues concluded that reduction in TDD leveled off after 12 months, which is consistent with this study’s findings. The small size of the study may have limited the ability to detect statistical significance; however, this study was conducted in a population that was racially diverse and included a higher proportion of women, though average age was similar.13
Yoon and colleagues reported weight loss through 18 months, then saw weight increase, though weights did remain lower than baseline. The study also showed no significant change in TDD of insulin after 12 months of concomitant exenatide and insulin therapy.11 Although these results mirror the outcomes observed in this study, Yoon and colleagues did not differentiate results between basal and basal/bolus insulin groups.11 Seino and colleagues observed no significant change in weight after 36 weeks of GLP-1 RA therapy in Japanese patients when used with basal and basal/bolus insulin regimens. Despite the consideration that the population in the study was not overweight (mean body mass index was 25.6), the results of these studies support the idea that effects of GLP-1 RAs on weight and TDD may diminish over time.14
Within the VHA, GLP-1 RAs are nonformulary medications. Patients must meet certain criteria in order to be approved for these agents, which may include diagnosis of CVD, renal disease, or failure to reach glycemic control with the use of oral agents or insulin. Therefore, participants of this study represent a particular subset of VHA patients, many of whom may have been selected for consideration due to long-standing or uncontrolled T2DM and failure of previous therapies. The baseline demographics support this idea, given poor glycemic control at baseline and high insulin requirements. Once approved for GLP-1 RA therapy, semaglutide is currently the preferred agent within the VHA, with other agents available for select considerations. It should be noted that albiglutide, which was the primary agent selected for some of the patients included in this study, was removed from the market in 2017 for economic considerations.15 In the case for these patients, a conversion to a formulary-preferred GLP-1 RA was made.
Most of the patients included in this study (70%) were maintained on metformin from baseline throughout the study period. Fifty-seven percent of patients were taking TDD of insulin > 150 units. Considering the significant cost of concentrated insulins, the addition of GLP-1 RAs to standard insulin may prove to be beneficial from a cost standpoint. Additional research in this area may be warranted to establish more data regarding this potential benefit of GLP-1 RAs as add-on therapy.
Many adverse drug reactions were reported at different periods; however, most of these were associated with the gastrointestinal system, which is consistent with current literature, drug labeling, and the mechanism of action.16 Hypoglycemia occurred in about one-third of the participants; however, it should be noted that alone, GLP-1 RAs are not associated with a high risk of hypoglycemia. Previous studies have found that GLP-1 RA monotherapy is associated with hypoglycemia in 1.6% to 12.6% of patients.17,18 More likely, the combination of basal/bolus insulin and the GLP-1 RA’s effect on increasing insulin sensitivity through weight loss, improving glucose-dependent insulin secretion, or by decreasing appetite and therefore decreasing carbohydrate intake contributed to the hypoglycemia prevalence.
Limitations and Strengths
Limitations of this study include a small patient population and a gradual reduction in available data as time periods progressed, making even smaller sample sizes for subsequent time periods. A majority of participants were older, males and White race. This could have limited the determination of statistical significance and applicability of the results to other patient populations. Another potential limitation was the retrospective nature of the study design, which may have limited reporting of hypoglycemia and other AEs based on the documentation of the clinician.
Strengths included the study duration and the diversity of GLP-1 RAs used by participants, as the impact of many of these agents has not yet been assessed in the literature. In addition, the retrospective nature of the study allows for a more realistic representation of patient adherence, education, and motivation, which are likely different from those of patients included in prospective clinical trials.
There are no clear guidelines dictating the optimal duration of concomitant GLP-1 RA and insulin therapy; however, our study suggests that there may be continued benefits past short-term use. Also our study suggests that patients with T2DM treated with basal/bolus insulin regimens may glean additional benefit from adding GLP-1 RAs; however, further randomized, controlled studies are warranted, particularly in poorly controlled patients requiring even more aggressive treatment regimens, such as concentrated insulins.
Conclusions
In our study, adding GLP-1 RA to basal/bolus insulin was associated with a significant decrease in HbA1c from baseline through 18 months. An overall decrease in weight and TDD of insulin was observed through 24 months, but the change in weight was not significant past 18 months, and the change in insulin requirement was not significant past 12 months. Hypoglycemia was observed in almost one-third of patients, and gastrointestinal symptoms were the most common AE observed as a result of adding GLP-1 RAs. More studies are needed to better evaluate the durability and cost benefit of GLP-1 RAs, especially in patients with high insulin requirements.
Acknowledgments
This material is the result of work supported with resources and facilities at Veteran Health Indiana in Indianapolis. Study data were collected and managed using REDCap electronic data capture tools hosted at Veteran Health Indiana. The authors also acknowledge George Eckert for his assistance with data analysis.
1. American Diabetes Association. Statistics about diabetes. Accessed August 9, 2022. http://www.diabetes.org/diabetes-basics/statistics
2. US Department of Veterans Affairs, Veterans Health Administration, Office of Research and Development. VA research on: diabetes. Updated January 15, 2021. Accessed August 9, 2022. https://www.research.va.gov/topics/diabetes.cfm
3. Federal Practitioner. Federal Health Care Data Trends 2017, Diabetes mellitus. Accessed August 9, 2022. https://www.fedprac-digital.com/federalpractitioner/data_trends_2017?pg=20#pg20
4. American Diabetes Association Professional Practice Committee. 9. Pharmacologic approaches to glycemic treatment: Standards of Medical Care in Diabetes—2022. Diabetes Care. 2022;45(suppl 1):S125-S143. doi:10.2337/dc22-S009
5. Garber AJ, Abrahamson MJ, Barzilay JI, et al. Consensus statement by the American Association of Clinical Endocrinologists and American College of Endocrinology on the comprehensive type 2 diabetes management algorithm – 2019 executive summary. Endocr Pract. 2019;25(1):69-100. doi:10.4158/CS-2018-0535
6. St Onge E, Miller S, Clements E, Celauro L, Barnes K. The role of glucagon-like peptide-1 receptor agonists in the treatment of type 2 diabetes. J Transl Int Med. 2017;5(2):79-89. Published 2017 Jun 30. doi:10.1515/jtim-2017-0015
7. Almandoz JP, Lingvay I, Morales J, Campos C. Switching between glucagon-like peptide-1 receptor agonists: rationale and practical guidance. Clin Diabetes. 2020;38(4):390-402. doi:10.2337/cd19-0100
8. Davies ML, Pham DQ, Drab SR. GLP1-RA add-on therapy in patients with type 2 diabetes currently on a bolus containing insulin regimen. Pharmacotherapy. 2016;36(8):893-905. doi:10.1002/phar.1792
9. Rosenstock J, Guerci B, Hanefeld M, et al. Prandial options to advance basal insulin glargine therapy: testing lixisenatide plus basal insulin versus insulin glulisine either as basal-plus or basal-bolus in type 2 diabetes: the GetGoal Duo-2 Trial Investigators. Diabetes Care. 2016;39(8):1318-1328. doi:10.2337/dc16-0014
10. Levin PA, Mersey JH, Zhou S, Bromberger LA. Clinical outcomes using long-term combination therapy with insulin glargine and exenatide in patients with type 2 diabetes mellitus. Endocr Pract. 2012;18(1):17-25. doi:10.4158/EP11097.OR
11. Yoon NM, Cavaghan MK, Brunelle RL, Roach P. Exenatide added to insulin therapy: a retrospective review of clinical practice over two years in an academic endocrinology outpatient setting. Clin Ther. 2009;31(7):1511-1523. doi:10.1016/j.clinthera.2009.07.021
12. Weissman PN, Carr MC, Ye J, et al. HARMONY 4: randomised clinical trial comparing once-weekly albiglutide and insulin glargine in patients with type 2 diabetes inadequately controlled with metformin with or without sulfonylurea. Diabetologia. 2014;57(12):2475-2484. doi:10.1007/s00125-014-3360-3
13. Gyorffy JB, Keithler AN, Wardian JL, Zarzabal LA, Rittel A, True MW. The impact of GLP-1 receptor agonists on patients with diabetes on insulin therapy. Endocr Pract. 2019;25(9):935-942. doi:10.4158/EP-2019-0023
14. Seino Y, Kaneko S, Fukuda S, et al. Combination therapy with liraglutide and insulin in Japanese patients with type 2 diabetes: a 36-week, randomized, double-blind, parallel-group trial. J Diabetes Investig. 2016;7(4):565-573. doi:10.1111/jdi.12457
15. Optum. Tanzeum (albiglutide)–drug discontinuation. Published 2017. Accessed August 15, 2022. https://professionals.optumrx.com/content/dam/optum3/professional-optumrx/news/rxnews/drug-recalls-shortages/drugwithdrawal_tanzeum_2017-0801.pdf
16. Chun JH, Butts A. Long-acting GLP-1RAs: an overview of efficacy, safety, and their role in type 2 diabetes management. JAAPA. 2020;33(8):3-18. doi:10.1097/01.JAA.0000669456.13763.bd
17. Ozempic semaglutide injection. Prescribing information. Novo Nordisk; 2022. Accessed August 9, 2022. https://www.novo-pi.com/ozempic.pdf
18. Victoza liraglutide injection. Prescribing information. Novo Nordisk; 2021. Accessed August 9, 2022. https://www.novo-pi.com/victoza.pdf
Outcomes After Prolonged ICU Stays in Postoperative Cardiac Surgery Patients
Prolonged intensive care unit (ICU) stays, variably defined as > 48 h to > 14 days, are a known complication of cardiac surgery.1-8 Prolonged stays are associated with higher resource utilization and higher mortality.2,3,9-12 Although there are several cardiac surgery risk models that can be used preoperatively to identify patients at risk for prolonged ICU stay, factors that influence outcomes for patients who experience prolonged ICU stays are poorly understood.2,13-19 Little information is available to inform discussions between health care practitioners (HCPs) and patients throughout a prolonged ICU stay, especially those ≥ 7 days.
As cardiac surgical complexity, patient age, and preexisting comorbidities have increased over time, so has the need to provide patients and HCPs with data to inform decision making, enhance prognostication, and set realistic expectations at varying time intervals during prolonged ICU stay. The purpose of this study was to evaluate short- and long-term outcomes in cardiac surgery patients after prolonged ICU stays at relevant time intervals (7, 14, 21, and 28 days) and to determine factors that may predict a patient’s outcome after a prolonged ICU stay.
Methods
The University of Michigan Health System Institutional Review Board approved this study and waived informed consent. We merged the University of Michigan Medical Center Society of Thoracic Surgeons (STS) database, which is updated periodically with late mortality, with elements of the electronic health record (EHR). Adult patients were included if they had cardiac surgery at the University of Michigan between January 2, 2001, and December 31, 2011. Late mortality was updated through December 1, 2014. Data are presented as frequency (%), mean (SD), and median (IQR) as appropriate. Bivariate comparisons between survivors and nonsurvivors were done with χ2 or Fisher exact test for categorical data, Student t test for continuous normally distributed data, and Wilcoxon rank sum test for continuous not normally distributed data. To determine factors associated with operative mortality (death within 30 days of surgery or hospital discharge, whichever occurred later), we used logistic regression with forward selection. All available factors were initially entered in the models.
Separate logistic models were created based on all data available at days 7, 14, 21, and 28. Final models consisted of factors with statistically significant P values (< .05) and adjusted odds ratios (AORs) with 95% CIs that excluded 1. To determine factors associated with late mortality, we used a Cox proportional hazard model, which used data available at discharge and STS complications. As these complications did not include their timing, they could only be used in models created at discharge and not for days 7, 14, 21, and 28 models. Final models consisted of factors with P values < .05 and 95% CIs of the AORs or the hazard ratios (HRs) that excluded 1. As the EHR did not start recording data until January 2, 2004, and its capture of data remained incomplete for several years, rather than imputing these missing data or excluding these patients, we chose to create an extra categorical level for each factor to represent missing data. For continuous factors with missing data, we first converted the continuous data to terciles and the missing data became the fourth level.20,21
The discrimination of the logistic models were determined by the c-statistic and for the Cox proportional hazards model with the Harrell concordance index (C index). Time trends were assessed with the Cochran-Armitage trend test. P < .05 was deemed statistically significant. Statistics were calculated with SPSS versions 21-23 or SAS 9.4.
Results
Of 8309 admissions to the ICU after cardiac surgery, 1174 (14%) had ICU stays ≥ 7 days, 386 (5%) ≥ 14 days, 201 (2%) ≥ 21 days, and 80 (0.9%) ≥ 28 days. The prolonged ICU study population was mostly male, White race, with a mean (SD) age of 62 (14) years. Patients had a variety of comorbidities, most notably 61% had hypertension and half had heart failure. Valve surgery (55%) was the most common procedure (n = 651). Twenty-nine percent required > 1 procedure (eAppendix 1).
The operative mortality 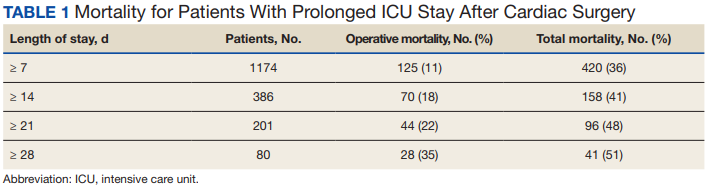
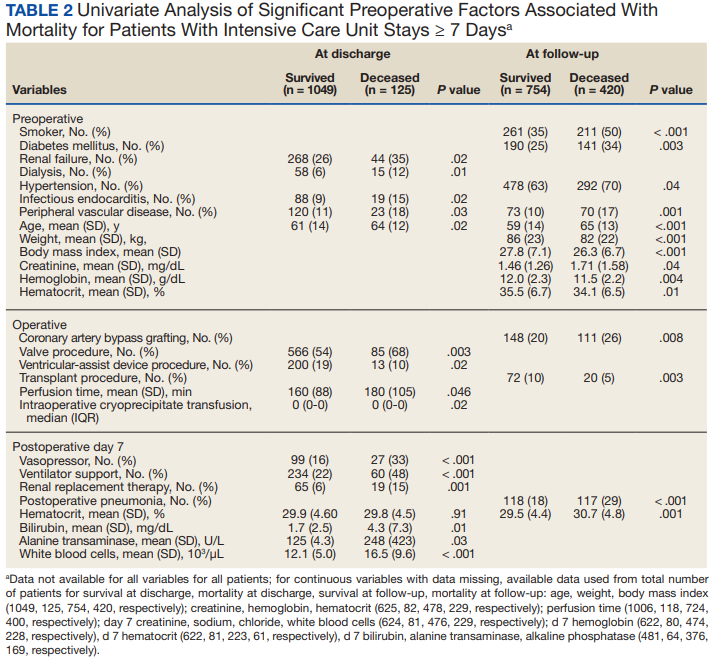
Using multivariable logistic regression to adjust for factors associated with mortality, we found that receiving mechanical ventilation on the day of analysis was associated with increased operative mortality with AOR increasing from 3.35 (95% CI, 2.82-3.98) for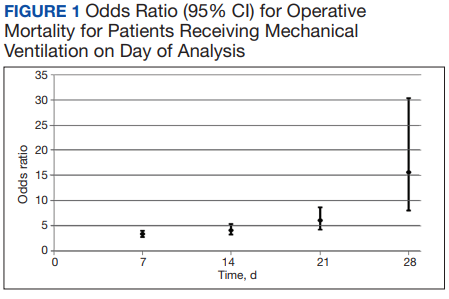
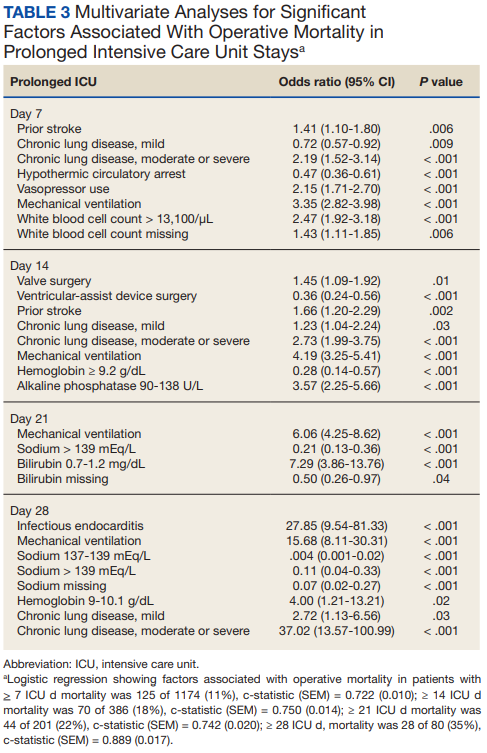
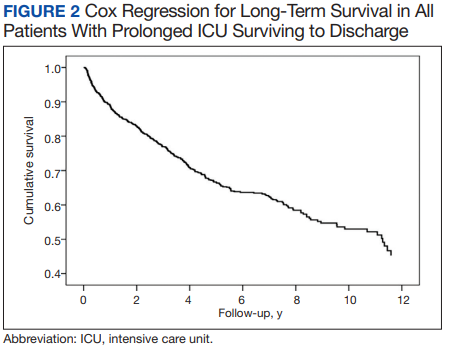

After multivariable Cox regression to adjust for confounders, we found that each postoperative week was associated with a 7% higher hazard of dying (HR, 1.07; 95% CI, 1.07-1.07; P < .001). Postoperative pneumonia was also associated with increased hazard of dying (HR, 1.59; 95% CI, 1.27-1.99; P < .001), 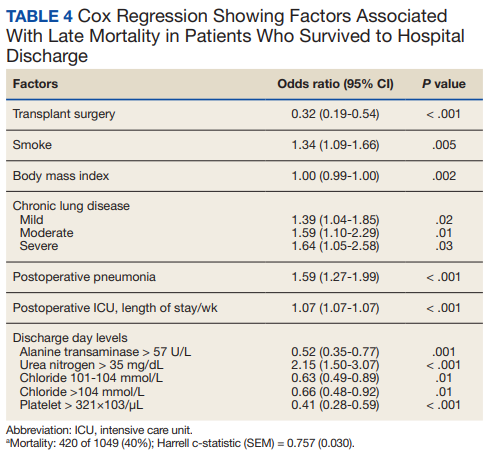
Discussion
We found that operative mortality increased the longer the patient stayed in the ICU, ranging from 11% for ≥ 7 days to 35% for ≥ 28 days. We further found that in ICU survivors, median (IQR) survival was 10.7 (0.7) years. While previous studies have evaluated prolonged ICU stays, they have been limited by studying limited subpopulations, such as patients who are dependent on dialysis or octogenarians, or used a single cutoff to define prolonged ICU stays, variably defined from > 48 hours to > 14 days.2-7,9-12,22 Our study is similar to others that used ≥ 2 cutoffs.1,8 However, our study was novel by providing 4 cutoffs to improve temporal prediction of hospital outcomes. Unlike a study by Ryan and colleagues, which found no increase in mortality with longer stay (43.5% for ≥ 14 days and 45% for ≥ 28 days), our study findings are similar to those of Yu and colleagues (11.1% mortality for prolonged ICU stays of 1 to 2 weeks, 26.6% for 2 to 4 weeks, and 31% for > 4 weeks) and others (8%, 3 to 14 days; 40%, >14 days; 10%, 1 to 2 weeks; 25.7% > 2 weeks) in finding a progressively increased hospital mortality with longer ICU stays.1,4,5,8 These differences may be related to different ICU populations or to improvements in care since Ryan and colleagues study was conducted.
Fewer studies have evaluated factors associated with mortality in cardiac surgery prolonged ICU stay patients. Our study is similar to other studies that evaluated risk factors by finding associations between a variety of comorbidities and process of care associated with both operative and long-term mortality; however, comparison between these studies is limited by the varying factors analyzed.1,3,5,6,8,9,11 We found that mechanical ventilation on days 7, 14, 21, and 28 was strongly associated with operative mortality, similar to noncardiac surgery patients and cardiac surgery patients.6,23,24 While we found several processes of care, such as catecholamine use and transfusions to be associated with mortality, which is similar to other studies, notably, we did not find an association between renal replacement therapy and mortality.1,25 While there is an association between renal replacement therapy and mortality in ICU patients, its status in cardiac surgery patients with prolonged ICU stays is less clear.26 While Ryan and colleagues found an association between renal replacement therapy and hospital mortality in patients staying ≥ 14 days, they did not find it in patients staying ≥.
28 days.1 Other studies of prolonged ICU stays for cardiac surgery patients have also failed to find an association between renal replacement therapy and mortality.5,6,9 Importantly, practice that expedites liberation from mechanical ventilation, such as fast tracking, daily spontaneous breathing trials, extubation to noninvasive respiratory support, and pulmonary rehabilitation may all have potential to limit mechanical ventilation duration and improve hospital survival and deserve further study.27-29Median (IQR) survival in hospital survivors was 10.7 (0.7) years, which is generally better than previously reported, but similar to that reported by Silberman and colleagues.2,4,6,8,11,12 Differences between these studies may relate to different patient populations within the cardiac surgery ICUs, definitions of prolonged ICU stays, or eras of care. Further study is needed to clarify these discrepancies. We found that cardiac transplantation and obesity were associated with the least risk of dying, while smoking, lung disease, and postoperative pneumonia were independently associated with increased hazard of dying. The obesity paradox, where obesity is protective, has been previously observed in cardiac surgery patients.30
Strengths and Limitations
There are several limitations of this study. This is a single center study, and our patient population and processes of care may differ from other centers, limiting its generalizability. Notably, we do fewer coronary bypass operations and more aortic reconstructions and ventricular assist device insertions than do many other centers. Second, we did not have laboratory values for about one-third of patients (preceded EHR implementation). However, we were able to compensate for this by binning values and including missing data as an extra bin.20,21
The main strength of this study is that we were able to combine disparate records to assess a large number of potential factors associated with both operative and long-term mortality. This produced models that had good to very good discrimination. By producing models at 7, 14, 21, and 28 days to predict operative mortality and a model at discharge, it may help to provide objective data to facilitate conversations with patients and their families. However, further studies to externally validate these models should be conducted.
Conclusions
We found that longer prolonged ICU stays are associated with both operative and late mortality. Receiving mechanical ventilation on days 7, 14, 21, or 28 was strongly associated with operative mortality.
1. Ryan TA, Rady MY, Bashour A, Leventhal M, Lytle B, Starr NJ. Predictors of outcome in cardiac surgical patients with prolonged intensive care stay. Chest. 1997;112(4):1035-1042. doi:10.1378/chest.112.4.1035
2. Hein OV, Birnbaum J, Wernecke K, England M, Konertz W, Spies C. Prolonged intensive care unit stay in cardiac surgery: risk factors and long-term-survival. Ann Thorac Surg. 2006;81(3):880-885. doi:10.1016/j.athoracsur.2005.09.077
3. Mahesh B, Choong CK, Goldsmith K, Gerrard C, Nashef SA, Vuylsteke A. Prolonged stay in intensive care unit is a powerful predictor of adverse outcomes after cardiac operations. Ann Thoracic Surg. 2012;94(1):109-116. doi:10.1016/j.athoracsur.2012.02.010
4. Silberman S, Bitran D, Fink D, Tauber R, Merin O. Very prolonged stay in the intensive care unit after cardiac operations: early results and late survival. Ann Thorac Surg. 2013;96(1):15-21. doi:10.1016/j.athoracsur.2013.01.103
5. Lapar DJ, Gillen JR, Crosby IK, et al. Predictors of operative mortality in cardiac surgical patients with prolonged intensive care unit duration. J Am Coll Surg. 2013;216(6):1116-1123. doi:10.1016/j.jamcollsurg.2013.02.028
6. Manji RA, Arora RC, Singal RK, et al. Long-term outcome and predictors of noninstitutionalized survival subsequent to prolonged intensive care unit stay after cardiac surgical procedures. Ann Thorac Surg. 2016;101(1):56-63. doi:10.1016/j.athoracsur.2015.07.004
7. Augustin P, Tanaka S, Chhor V, et al. Prognosis of prolonged intensive care unit stay after aortic valve replacement for severe aortic stenosis in octogenarians. J Cardiothorac Vasc Anesth. 2016;30(6):1555-1561. doi:10.1053/j.jvca.2016.07.029
8. Yu PJ, Cassiere HA, Fishbein J, Esposito RA, Hartman AR. Outcomes of patients with prolonged intensive care unit stay after cardiac surgery. J Cardiothorac Vasc Anesth. 2016;30(6):1550-1554. doi:10.1053/j.jvca.2016.03.145
9. Bashour CA, Yared JP, Ryan TA, et al. Long-term survival and functional capacity in cardiac surgery patients after prolonged intensive care. Crit Care Med. 2000;28(12):3847-3853. doi:10.1097/00003246-200012000-00018
10. Isgro F, Skuras JA, Kiessling AH, Lehmann A, Saggau W. Survival and quality of life after a long-term intensive care stay. Thorac Cardiovasc Surg. 2002;50(2):95-99. doi:10.1055/s-2002-26693
11. Williams MR, Wellner RB, Hartnett EA, Hartnett EA, Thornton B, Kavarana MN, Mahapatra R, Oz MC Sladen R. Long-term survival and quality of life in cardiac surgical patients with prolonged intensive care unit length of stay. Ann Thorac Surg. 2002;73(5):1472-1478.
12. Lagercrantz E, Lindblom D, Sartipy U. Survival and quality of life in cardiac surgery patients with prolonged intensive care. Ann Thorac Surg. 2010;89:490-495. doi:10.1016/s0003-4975(02)03464-1
13. Edwards FH, Clark RE, Schwartz M. Coronary artery bypass grafting: the Society of Thoracic Surgeons National Database experience. Ann Thorac Surg. 1994;57(1):12-19. doi:10.1016/0003-4975(94)90358-1
14. Lawrence DR, Valencia O, Smith EE, Murday A, Treasure T. Parsonnet score is a good predictor of the duration of intensive care unit stay following cardiac surgery. Heart. 2000;83(4):429-432. doi:10.1136/heart.83.4.429
15. Janssen DP, Noyez L, Wouters C, Brouwer RM. Preoperative prediction of prolonged stay in the intensive care unit for coronary bypass surgery. Eur J Cardiothorac Surg. 2004;25(2):203-207. doi:10.1016/j.ejcts.2003.11.005
16. Nilsson J, Algotsson L, Hoglund P, Luhrs C, Brandt J. EuroSCORE predicts intensive care unit stay and costs of open heart surgery. Ann Thorac Surg. 2004;78(5):1528-1534. doi:10.1016/j.athoracsur.2004.04.060
17. Ghotkar SV, Grayson AD, Fabri BM, Dihmis WC, Pullan DM. Preoperative calculation of risk for prolonged intensive care unit stay following coronary artery bypass grafting. J Cardiothorac Surg. 2006;1:14. doi:10.1186/1749-8090-1-1418. Messaoudi N, Decocker J, Stockman BA, Bossaert LL, Rodrigus IE. Is EuroSCORE useful in the prediction of extended intensive care unit stay after cardiac surgery? Eur J Cardiothoracic Surg. 2009;36(1):35-39. doi:10.1016/j.ejcts.2009.02.007
19. Ettema RG, Peelen LM, Schuurmans MJ, Nierich AP, Kalkman CJ, Moons KG. Prediction models for prolonged intensive care unit stay after cardiac surgery: systematic review and validation study. Circulation. 2010;122(7):682-689. doi:10.1161/CIRCULATIONAHA.109.926808
20. Engoren M. Does erythrocyte blood transfusion prevent acute kidney injury? Propensity-matched case control analysis. Anesthesiology. 2010;113(5):1126-1133. doi:10.1097/ALN.0b013e181f70f56
21. UK National Centre for Research Methods. Minimising the effect of missing data. Revised July 22, 2011. Accessed June 28, 2022. www.restore.ac.uk/srme/www/fac/soc/wie/research-new/srme/modules/mod3/9/index.html.
22. Leontyev S, Davierwala PM, Gaube LM, et al. Outcomes of dialysis-dependent patients after cardiac operations in a single-center experience of 483 patients. Ann Thorac Surg. 2017;103(4):1270-1276. doi:10.1016/j.athoracsur.2016.07.05223. Freundlich RE, Maile MD, Sferra JJ, Jewell ES, Kheterpal S, Engoren M. Complications associated with mortality in the National Surgical Quality Improvement Program Database. Anesth Analg. 2018;127(1):55-62. doi:10.1213/ANE.0000000000002799
24. Freundlich RE, Maile MD, Hajjar MM, et al. Years of life lost after complications of coronary artery bypass operations. Ann Thorac Surg. 2017;103(6):1893-1899. doi:10.1016/j.athoracsur.2016.09.048
25. Koch CG, Li L, Sessler DI, et al. Duration of red-cell storage and complications after cardiac surgery. N Engl J Med. 2008;358(12):1229-1239. doi:10.1056/NEJMoa070403
26. Truche AS, Ragey SP, Souweine B, et al. ICU survival and need of renal replacement therapy with respect to AKI duration in critically ill patients. Ann Intensive Care. 2018;8(1):127. doi:10.1186/s13613-018-0467-6
27. Kollef MH, Shapiro SD, Silver P, et al. A randomized, controlled trial of protocol-directed versus physician-directed weaning from mechanical ventilation. Crit Care Med. 1997;25(4):567-574. doi:10.1097/00003246-199704000-00004
28. McWilliams D, Weblin J, Atkins G, et al. Enhancing rehabilitation of mechanically ventilated patients in the intensive care unit: a quality improvement project. J Crit Care. 2015;30(1):13-18. doi:10.1016/j.jcrc.2014.09.018
29. Hernandez G, Vaquero C, Gonzalez P, et al. Effect of postextubation high-flow nasal cannula vs conventional oxygen therapy on reintubation in low-risk patients: a randomized clinical trial. JAMA. 2016;315(13):1354-1361. doi:10.1001/jama.2016.2711
30. Schwann TA, Ramira PS, Engoren MC, et al. Evidence and temporality of the obesity paradox in coronary bypass surgery: an analysis of cause-specific mortality. Eur J Cardiothorac Surg. 2018;54(5):896-903. doi:10.1093/ejcts/ezy207
Prolonged intensive care unit (ICU) stays, variably defined as > 48 h to > 14 days, are a known complication of cardiac surgery.1-8 Prolonged stays are associated with higher resource utilization and higher mortality.2,3,9-12 Although there are several cardiac surgery risk models that can be used preoperatively to identify patients at risk for prolonged ICU stay, factors that influence outcomes for patients who experience prolonged ICU stays are poorly understood.2,13-19 Little information is available to inform discussions between health care practitioners (HCPs) and patients throughout a prolonged ICU stay, especially those ≥ 7 days.
As cardiac surgical complexity, patient age, and preexisting comorbidities have increased over time, so has the need to provide patients and HCPs with data to inform decision making, enhance prognostication, and set realistic expectations at varying time intervals during prolonged ICU stay. The purpose of this study was to evaluate short- and long-term outcomes in cardiac surgery patients after prolonged ICU stays at relevant time intervals (7, 14, 21, and 28 days) and to determine factors that may predict a patient’s outcome after a prolonged ICU stay.
Methods
The University of Michigan Health System Institutional Review Board approved this study and waived informed consent. We merged the University of Michigan Medical Center Society of Thoracic Surgeons (STS) database, which is updated periodically with late mortality, with elements of the electronic health record (EHR). Adult patients were included if they had cardiac surgery at the University of Michigan between January 2, 2001, and December 31, 2011. Late mortality was updated through December 1, 2014. Data are presented as frequency (%), mean (SD), and median (IQR) as appropriate. Bivariate comparisons between survivors and nonsurvivors were done with χ2 or Fisher exact test for categorical data, Student t test for continuous normally distributed data, and Wilcoxon rank sum test for continuous not normally distributed data. To determine factors associated with operative mortality (death within 30 days of surgery or hospital discharge, whichever occurred later), we used logistic regression with forward selection. All available factors were initially entered in the models.
Separate logistic models were created based on all data available at days 7, 14, 21, and 28. Final models consisted of factors with statistically significant P values (< .05) and adjusted odds ratios (AORs) with 95% CIs that excluded 1. To determine factors associated with late mortality, we used a Cox proportional hazard model, which used data available at discharge and STS complications. As these complications did not include their timing, they could only be used in models created at discharge and not for days 7, 14, 21, and 28 models. Final models consisted of factors with P values < .05 and 95% CIs of the AORs or the hazard ratios (HRs) that excluded 1. As the EHR did not start recording data until January 2, 2004, and its capture of data remained incomplete for several years, rather than imputing these missing data or excluding these patients, we chose to create an extra categorical level for each factor to represent missing data. For continuous factors with missing data, we first converted the continuous data to terciles and the missing data became the fourth level.20,21
The discrimination of the logistic models were determined by the c-statistic and for the Cox proportional hazards model with the Harrell concordance index (C index). Time trends were assessed with the Cochran-Armitage trend test. P < .05 was deemed statistically significant. Statistics were calculated with SPSS versions 21-23 or SAS 9.4.
Results
Of 8309 admissions to the ICU after cardiac surgery, 1174 (14%) had ICU stays ≥ 7 days, 386 (5%) ≥ 14 days, 201 (2%) ≥ 21 days, and 80 (0.9%) ≥ 28 days. The prolonged ICU study population was mostly male, White race, with a mean (SD) age of 62 (14) years. Patients had a variety of comorbidities, most notably 61% had hypertension and half had heart failure. Valve surgery (55%) was the most common procedure (n = 651). Twenty-nine percent required > 1 procedure (eAppendix 1).
The operative mortality
Using multivariable logistic regression to adjust for factors associated with mortality, we found that receiving mechanical ventilation on the day of analysis was associated with increased operative mortality with AOR increasing from 3.35 (95% CI, 2.82-3.98) for
After multivariable Cox regression to adjust for confounders, we found that each postoperative week was associated with a 7% higher hazard of dying (HR, 1.07; 95% CI, 1.07-1.07; P < .001). Postoperative pneumonia was also associated with increased hazard of dying (HR, 1.59; 95% CI, 1.27-1.99; P < .001),
Discussion
We found that operative mortality increased the longer the patient stayed in the ICU, ranging from 11% for ≥ 7 days to 35% for ≥ 28 days. We further found that in ICU survivors, median (IQR) survival was 10.7 (0.7) years. While previous studies have evaluated prolonged ICU stays, they have been limited by studying limited subpopulations, such as patients who are dependent on dialysis or octogenarians, or used a single cutoff to define prolonged ICU stays, variably defined from > 48 hours to > 14 days.2-7,9-12,22 Our study is similar to others that used ≥ 2 cutoffs.1,8 However, our study was novel by providing 4 cutoffs to improve temporal prediction of hospital outcomes. Unlike a study by Ryan and colleagues, which found no increase in mortality with longer stay (43.5% for ≥ 14 days and 45% for ≥ 28 days), our study findings are similar to those of Yu and colleagues (11.1% mortality for prolonged ICU stays of 1 to 2 weeks, 26.6% for 2 to 4 weeks, and 31% for > 4 weeks) and others (8%, 3 to 14 days; 40%, >14 days; 10%, 1 to 2 weeks; 25.7% > 2 weeks) in finding a progressively increased hospital mortality with longer ICU stays.1,4,5,8 These differences may be related to different ICU populations or to improvements in care since Ryan and colleagues study was conducted.
Fewer studies have evaluated factors associated with mortality in cardiac surgery prolonged ICU stay patients. Our study is similar to other studies that evaluated risk factors by finding associations between a variety of comorbidities and process of care associated with both operative and long-term mortality; however, comparison between these studies is limited by the varying factors analyzed.1,3,5,6,8,9,11 We found that mechanical ventilation on days 7, 14, 21, and 28 was strongly associated with operative mortality, similar to noncardiac surgery patients and cardiac surgery patients.6,23,24 While we found several processes of care, such as catecholamine use and transfusions to be associated with mortality, which is similar to other studies, notably, we did not find an association between renal replacement therapy and mortality.1,25 While there is an association between renal replacement therapy and mortality in ICU patients, its status in cardiac surgery patients with prolonged ICU stays is less clear.26 While Ryan and colleagues found an association between renal replacement therapy and hospital mortality in patients staying ≥ 14 days, they did not find it in patients staying ≥.
28 days.1 Other studies of prolonged ICU stays for cardiac surgery patients have also failed to find an association between renal replacement therapy and mortality.5,6,9 Importantly, practice that expedites liberation from mechanical ventilation, such as fast tracking, daily spontaneous breathing trials, extubation to noninvasive respiratory support, and pulmonary rehabilitation may all have potential to limit mechanical ventilation duration and improve hospital survival and deserve further study.27-29Median (IQR) survival in hospital survivors was 10.7 (0.7) years, which is generally better than previously reported, but similar to that reported by Silberman and colleagues.2,4,6,8,11,12 Differences between these studies may relate to different patient populations within the cardiac surgery ICUs, definitions of prolonged ICU stays, or eras of care. Further study is needed to clarify these discrepancies. We found that cardiac transplantation and obesity were associated with the least risk of dying, while smoking, lung disease, and postoperative pneumonia were independently associated with increased hazard of dying. The obesity paradox, where obesity is protective, has been previously observed in cardiac surgery patients.30
Strengths and Limitations
There are several limitations of this study. This is a single center study, and our patient population and processes of care may differ from other centers, limiting its generalizability. Notably, we do fewer coronary bypass operations and more aortic reconstructions and ventricular assist device insertions than do many other centers. Second, we did not have laboratory values for about one-third of patients (preceded EHR implementation). However, we were able to compensate for this by binning values and including missing data as an extra bin.20,21
The main strength of this study is that we were able to combine disparate records to assess a large number of potential factors associated with both operative and long-term mortality. This produced models that had good to very good discrimination. By producing models at 7, 14, 21, and 28 days to predict operative mortality and a model at discharge, it may help to provide objective data to facilitate conversations with patients and their families. However, further studies to externally validate these models should be conducted.
Conclusions
We found that longer prolonged ICU stays are associated with both operative and late mortality. Receiving mechanical ventilation on days 7, 14, 21, or 28 was strongly associated with operative mortality.
1. Ryan TA, Rady MY, Bashour A, Leventhal M, Lytle B, Starr NJ. Predictors of outcome in cardiac surgical patients with prolonged intensive care stay. Chest. 1997;112(4):1035-1042. doi:10.1378/chest.112.4.1035
2. Hein OV, Birnbaum J, Wernecke K, England M, Konertz W, Spies C. Prolonged intensive care unit stay in cardiac surgery: risk factors and long-term-survival. Ann Thorac Surg. 2006;81(3):880-885. doi:10.1016/j.athoracsur.2005.09.077
3. Mahesh B, Choong CK, Goldsmith K, Gerrard C, Nashef SA, Vuylsteke A. Prolonged stay in intensive care unit is a powerful predictor of adverse outcomes after cardiac operations. Ann Thoracic Surg. 2012;94(1):109-116. doi:10.1016/j.athoracsur.2012.02.010
4. Silberman S, Bitran D, Fink D, Tauber R, Merin O. Very prolonged stay in the intensive care unit after cardiac operations: early results and late survival. Ann Thorac Surg. 2013;96(1):15-21. doi:10.1016/j.athoracsur.2013.01.103
5. Lapar DJ, Gillen JR, Crosby IK, et al. Predictors of operative mortality in cardiac surgical patients with prolonged intensive care unit duration. J Am Coll Surg. 2013;216(6):1116-1123. doi:10.1016/j.jamcollsurg.2013.02.028
6. Manji RA, Arora RC, Singal RK, et al. Long-term outcome and predictors of noninstitutionalized survival subsequent to prolonged intensive care unit stay after cardiac surgical procedures. Ann Thorac Surg. 2016;101(1):56-63. doi:10.1016/j.athoracsur.2015.07.004
7. Augustin P, Tanaka S, Chhor V, et al. Prognosis of prolonged intensive care unit stay after aortic valve replacement for severe aortic stenosis in octogenarians. J Cardiothorac Vasc Anesth. 2016;30(6):1555-1561. doi:10.1053/j.jvca.2016.07.029
8. Yu PJ, Cassiere HA, Fishbein J, Esposito RA, Hartman AR. Outcomes of patients with prolonged intensive care unit stay after cardiac surgery. J Cardiothorac Vasc Anesth. 2016;30(6):1550-1554. doi:10.1053/j.jvca.2016.03.145
9. Bashour CA, Yared JP, Ryan TA, et al. Long-term survival and functional capacity in cardiac surgery patients after prolonged intensive care. Crit Care Med. 2000;28(12):3847-3853. doi:10.1097/00003246-200012000-00018
10. Isgro F, Skuras JA, Kiessling AH, Lehmann A, Saggau W. Survival and quality of life after a long-term intensive care stay. Thorac Cardiovasc Surg. 2002;50(2):95-99. doi:10.1055/s-2002-26693
11. Williams MR, Wellner RB, Hartnett EA, Hartnett EA, Thornton B, Kavarana MN, Mahapatra R, Oz MC Sladen R. Long-term survival and quality of life in cardiac surgical patients with prolonged intensive care unit length of stay. Ann Thorac Surg. 2002;73(5):1472-1478.
12. Lagercrantz E, Lindblom D, Sartipy U. Survival and quality of life in cardiac surgery patients with prolonged intensive care. Ann Thorac Surg. 2010;89:490-495. doi:10.1016/s0003-4975(02)03464-1
13. Edwards FH, Clark RE, Schwartz M. Coronary artery bypass grafting: the Society of Thoracic Surgeons National Database experience. Ann Thorac Surg. 1994;57(1):12-19. doi:10.1016/0003-4975(94)90358-1
14. Lawrence DR, Valencia O, Smith EE, Murday A, Treasure T. Parsonnet score is a good predictor of the duration of intensive care unit stay following cardiac surgery. Heart. 2000;83(4):429-432. doi:10.1136/heart.83.4.429
15. Janssen DP, Noyez L, Wouters C, Brouwer RM. Preoperative prediction of prolonged stay in the intensive care unit for coronary bypass surgery. Eur J Cardiothorac Surg. 2004;25(2):203-207. doi:10.1016/j.ejcts.2003.11.005
16. Nilsson J, Algotsson L, Hoglund P, Luhrs C, Brandt J. EuroSCORE predicts intensive care unit stay and costs of open heart surgery. Ann Thorac Surg. 2004;78(5):1528-1534. doi:10.1016/j.athoracsur.2004.04.060
17. Ghotkar SV, Grayson AD, Fabri BM, Dihmis WC, Pullan DM. Preoperative calculation of risk for prolonged intensive care unit stay following coronary artery bypass grafting. J Cardiothorac Surg. 2006;1:14. doi:10.1186/1749-8090-1-1418. Messaoudi N, Decocker J, Stockman BA, Bossaert LL, Rodrigus IE. Is EuroSCORE useful in the prediction of extended intensive care unit stay after cardiac surgery? Eur J Cardiothoracic Surg. 2009;36(1):35-39. doi:10.1016/j.ejcts.2009.02.007
19. Ettema RG, Peelen LM, Schuurmans MJ, Nierich AP, Kalkman CJ, Moons KG. Prediction models for prolonged intensive care unit stay after cardiac surgery: systematic review and validation study. Circulation. 2010;122(7):682-689. doi:10.1161/CIRCULATIONAHA.109.926808
20. Engoren M. Does erythrocyte blood transfusion prevent acute kidney injury? Propensity-matched case control analysis. Anesthesiology. 2010;113(5):1126-1133. doi:10.1097/ALN.0b013e181f70f56
21. UK National Centre for Research Methods. Minimising the effect of missing data. Revised July 22, 2011. Accessed June 28, 2022. www.restore.ac.uk/srme/www/fac/soc/wie/research-new/srme/modules/mod3/9/index.html.
22. Leontyev S, Davierwala PM, Gaube LM, et al. Outcomes of dialysis-dependent patients after cardiac operations in a single-center experience of 483 patients. Ann Thorac Surg. 2017;103(4):1270-1276. doi:10.1016/j.athoracsur.2016.07.05223. Freundlich RE, Maile MD, Sferra JJ, Jewell ES, Kheterpal S, Engoren M. Complications associated with mortality in the National Surgical Quality Improvement Program Database. Anesth Analg. 2018;127(1):55-62. doi:10.1213/ANE.0000000000002799
24. Freundlich RE, Maile MD, Hajjar MM, et al. Years of life lost after complications of coronary artery bypass operations. Ann Thorac Surg. 2017;103(6):1893-1899. doi:10.1016/j.athoracsur.2016.09.048
25. Koch CG, Li L, Sessler DI, et al. Duration of red-cell storage and complications after cardiac surgery. N Engl J Med. 2008;358(12):1229-1239. doi:10.1056/NEJMoa070403
26. Truche AS, Ragey SP, Souweine B, et al. ICU survival and need of renal replacement therapy with respect to AKI duration in critically ill patients. Ann Intensive Care. 2018;8(1):127. doi:10.1186/s13613-018-0467-6
27. Kollef MH, Shapiro SD, Silver P, et al. A randomized, controlled trial of protocol-directed versus physician-directed weaning from mechanical ventilation. Crit Care Med. 1997;25(4):567-574. doi:10.1097/00003246-199704000-00004
28. McWilliams D, Weblin J, Atkins G, et al. Enhancing rehabilitation of mechanically ventilated patients in the intensive care unit: a quality improvement project. J Crit Care. 2015;30(1):13-18. doi:10.1016/j.jcrc.2014.09.018
29. Hernandez G, Vaquero C, Gonzalez P, et al. Effect of postextubation high-flow nasal cannula vs conventional oxygen therapy on reintubation in low-risk patients: a randomized clinical trial. JAMA. 2016;315(13):1354-1361. doi:10.1001/jama.2016.2711
30. Schwann TA, Ramira PS, Engoren MC, et al. Evidence and temporality of the obesity paradox in coronary bypass surgery: an analysis of cause-specific mortality. Eur J Cardiothorac Surg. 2018;54(5):896-903. doi:10.1093/ejcts/ezy207
Medicaid Expansion and Veterans’ Reliance on the VA for Depression Care
The US Department of Veterans Affairs (VA) is the largest integrated health care system in the United States, providing care for more than 9 million veterans.1 With veterans experiencing mental health conditions like posttraumatic stress disorder (PTSD), substance use disorders, and other serious mental illnesses (SMI) at higher rates compared with the general population, the VA plays an important role in the provision of mental health services.2-5 Since the implementation of its Mental Health Strategic Plan in 2004, the VA has overseen the development of a wide array of mental health programs geared toward the complex needs of veterans. Research has demonstrated VA care outperforming Medicaid-reimbursed services in terms of the percentage of veterans filling antidepressants for at least 12 weeks after initiation of treatment for major depressive disorder (MDD), as well as posthospitalization follow-up.6
Eligible veterans enrolled in the VA often also seek non-VA care. Medicaid covers nearly 10% of all nonelderly veterans, and of these veterans, 39% rely solely on Medicaid for health care access.7 Today, Medicaid is the largest payer for mental health services in the US, providing coverage for approximately 27% of Americans who have SMI and helping fulfill unmet mental health needs.8,9 Understanding which of these systems veterans choose to use, and under which circumstances, is essential in guiding the allocation of limited health care resources.10
Beyond Medicaid, alternatives to VA care may include TRICARE, Medicare, Indian Health Services, and employer-based or self-purchased private insurance. While these options potentially increase convenience, choice, and access to health care practitioners (HCPs) and services not available at local VA systems, cross-system utilization with poor integration may cause care coordination and continuity problems, such as medication mismanagement and opioid overdose, unnecessary duplicate utilization, and possible increased mortality.11-15 As recent national legislative changes, such as the Patient Protection and Affordable Care Act (ACA), Veterans Access, Choice and Accountability Act, and the VA MISSION Act, continue to shift the health care landscape for veterans, questions surrounding how veterans are changing their health care use become significant.16,17
Here, we approach the impacts of Medicaid expansion on veterans’ reliance on the VA for mental health services with a unique lens. We leverage a difference-in-difference design to study 2 historical Medicaid expansions in Arizona (AZ) and New York (NY), which extended eligibility to childless adults in 2001. Prior Medicaid dual-eligible mental health research investigated reliance shifts during the immediate postenrollment year in a subset of veterans newly enrolled in Medicaid.18 However, this study took place in a period of relative policy stability. In contrast, we investigate the potential effects of a broad policy shift by analyzing state-level changes in veterans’ reliance over 6 years after a statewide Medicaid expansion. We match expansion states with demographically similar nonexpansion states to account for unobserved trends and confounding effects. Prior studies have used this method to evaluate post-Medicaid expansion mortality changes and changes in veteran dual enrollment and hospitalizations.10,19 While a study of ACA Medicaid expansion states would be ideal, Medicaid data from most states were only available through 2014 at the time of this analysis. Our study offers a quasi-experimental framework leveraging longitudinal data that can be applied as more post-ACA data become available.
Given the rising incidence of suicide among veterans, understanding care-seeking behaviors for depression among veterans is important as it is the most common psychiatric condition found in those who died by suicide.20,21 Furthermore, depression may be useful as a clinical proxy for mental health policy impacts, given that the Patient Health Questionnaire-9 (PHQ-9) screening tool is well validated and increasingly research accessible, and it is a chronic condition responsive to both well-managed pharmacologic treatment and psychotherapeutic interventions.22,23
In this study, we quantify the change in care-seeking behavior for depression among veterans after Medicaid expansion, using a quasi-experimental design. We hypothesize that new access to Medicaid would be associated with a shift away from using VA services for depression. Given the income-dependent eligibility requirements of Medicaid, we also hypothesize that veterans who qualified for VA coverage due to low income, determined by a regional means test (Priority group 5, “income-eligible”), would be more likely to shift care compared with those whose serviced-connected conditions related to their military service (Priority groups 1-4, “service-connected”) provide VA access.
Methods
To investigate the relative changes in veterans’ reliance on the VA for depression care after the 2001 NY and AZ Medicaid expansions We used a retrospective, difference-in-difference analysis. Our comparison pairings, based on prior demographic analyses were as follows: NY with Pennsylvania(PA); AZ with New Mexico and Nevada (NM/NV).19 The time frame of our analysis was 1999 to 2006, with pre- and postexpansion periods defined as 1999 to 2000 and 2001 to 2006, respectively.
Data
We included veterans aged 18 to 64 years, seeking care for depression from 1999 to 2006, who were also VA-enrolled and residing in our states of interest. We counted veterans as enrolled in Medicaid if they were enrolled at least 1 month in a given year.
Using similar methods like those used in prior studies, we selected patients with encounters documenting depression as the primary outpatient or inpatient diagnosis using International Classification of Diseases, Ninth Revision, Clinical Modification (ICD-9-CM) codes: 296.2x for a single episode of major depressive disorder, 296.3x for a recurrent episode of MDD, 300.4 for dysthymia, and 311.0 for depression not otherwise specified.18,24 We used data from the Medicaid Analytic eXtract files (MAX) for Medicaid data and the VA Corporate Data Warehouse (CDW) for VA data. We chose 1999 as the first study year because it was the earliest year MAX data were available.
Our final sample included 1833 person-years pre-expansion and 7157 postexpansion in our inpatient analysis, as well as 31,767 person-years pre-expansion and 130,382 postexpansion in our outpatient analysis.
Outcomes and Variables
Our primary outcomes were comparative shifts in VA reliance between expansion and nonexpansion states after Medicaid expansion for both inpatient and outpatient depression care. For each year of study, we calculated a veteran’s VA reliance by aggregating the number of days with depression-related encounters at the VA and dividing by the total number of days with a VA or Medicaid depression-related encounters for the year. To provide context to these shifts in VA reliance, we further analyzed the changes in the proportion of annual VA-Medicaid dual users and annual per capita utilization of depression care across the VA and Medicaid.
We conducted subanalyses by income-eligible and service-connected veterans and adjusted our models for age, non-White race, sex, distances to the nearest inpatient and outpatient VA facilities, and VA Relative Risk Score, which is a measure of disease burden and clinical complexity validated specifically for veterans.25
Statistical Analysis
We used fractional logistic regression to model the adjusted effect of Medicaid expansion on VA reliance for depression care. In parallel, we leveraged ordered logit regression and negative binomial regression models to examine the proportion of VA-Medicaid dual users and the per capita utilization of Medicaid and VA depression care, respectively. To estimate the difference-in-difference effects, we used the interaction term of 2 categorical variables—expansion vs nonexpansion states and pre- vs postexpansion status—as the independent variable. We then calculated the average marginal effects with 95% CIs to estimate the differences in outcomes between expansion and nonexpansion states from pre- to postexpansion periods, as well as year-by-year shifts as a robustness check. We conducted these analyses using Stata MP, version 15.
Results
Baseline and postexpansion characteristics 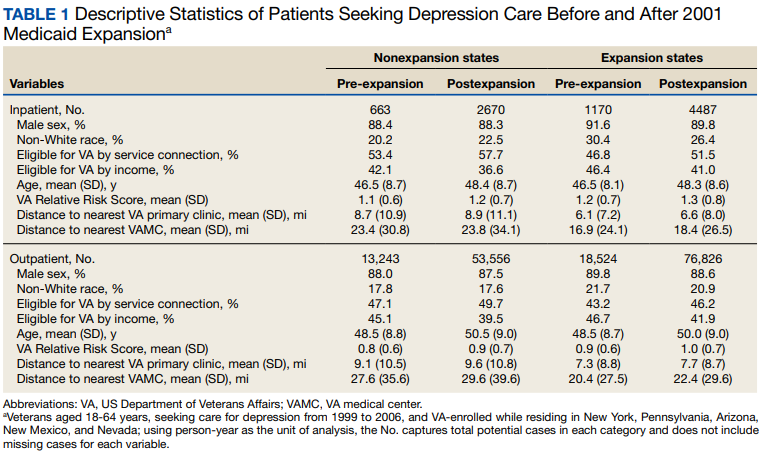
VA Reliance
Overall, we observed postexpansion decreases in VA reliance for depression care 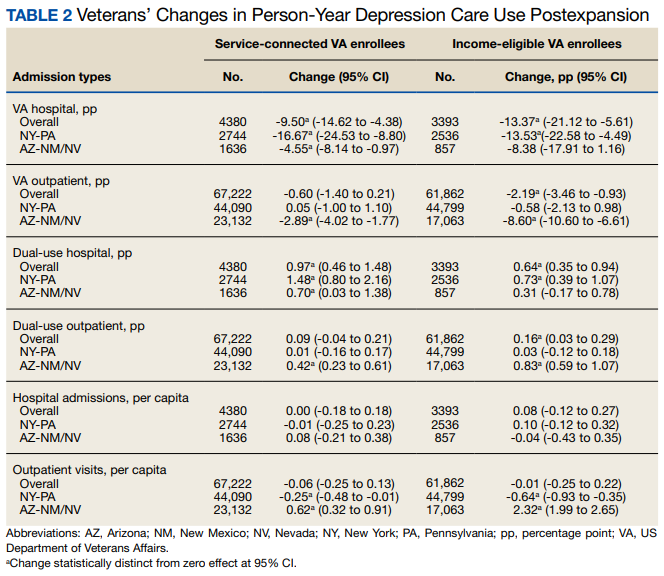
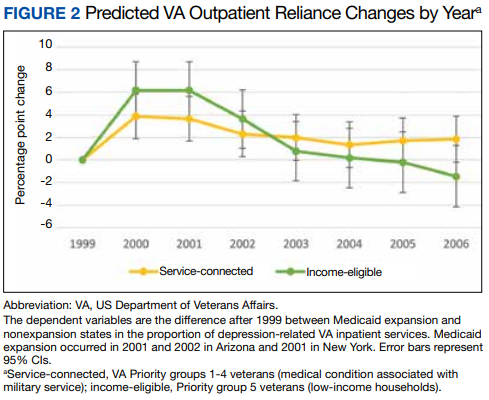
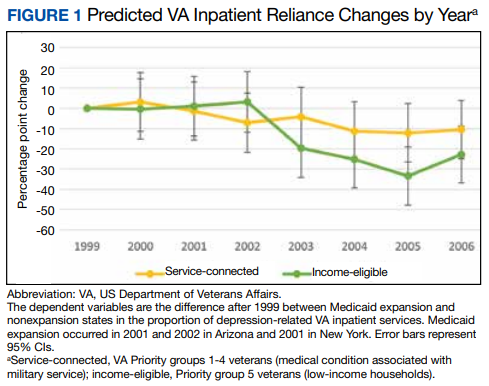
At the state level, reliance on the VA for inpatient depression care in NY decreased by 13.53 pp (95% CI, -22.58 to -4.49) for income-eligible veterans and 16.67 pp (95% CI, -24.53 to -8.80) for service-connected veterans. No relative differences were observed in the outpatient comparisons for both income-eligible (-0.58 pp; 95% CI, -2.13 to 0.98) and service-connected (0.05 pp; 95% CI, -1.00 to 1.10) veterans. In AZ, Medicaid expansion was associated with decreased VA reliance for outpatient depression care among income-eligible veterans (-8.60 pp; 95% CI, -10.60 to -6.61), greater than that for service-connected veterans (-2.89 pp; 95% CI, -4.02 to -1.77). This decrease in VA reliance was significant in the inpatient context only for service-connected veterans (-4.55 pp; 95% CI, -8.14 to -0.97), not income-eligible veterans (-8.38 pp; 95% CI, -17.91 to 1.16).
By applying the aggregate pp changes toward the postexpansion number of visits across both expansion and nonexpansion states, we found that expansion of Medicaid across all our study states would have resulted in 996 fewer hospitalizations and 10,109 fewer outpatient visits for depression at VA in the postexpansion period vs if no states had chosen to expand Medicaid.
Dual Use/Per Capita Utilization
Overall, Medicaid expansion was associated with greater dual use for inpatient depression care—a 0.97-pp (95% CI, 0.46 to 1.48) increase among service-connected veterans and a 0.64-pp (95% CI, 0.35 to 0.94) increase among income-eligible veterans.
At the state level, NY similarly showed increases in dual use among both service-connected (1.48 pp; 95% CI, 0.80 to 2.16) and income-eligible veterans (0.73 pp; 95% CI, 0.39 to 1.07) after Medicaid expansion. However, dual use in AZ increased significantly only among service-connected veterans (0.70 pp; 95% CI, 0.03 to 1.38), not income-eligible veterans (0.31 pp; 95% CI, -0.17 to 0.78).
Among outpatient visits, Medicaid expansion was associated with increased dual use only for income-eligible veterans (0.16 pp; 95% CI, 0.03-0.29), and not service-connected veterans (0.09 pp; 95% CI, -0.04 to 0.21). State-level analyses showed that Medicaid expansion in NY was not associated with changes in dual use for either service-connected (0.01 pp; 95% CI, -0.16 to 0.17) or income-eligible veterans (0.03 pp; 95% CI, -0.12 to 0.18), while expansion in AZ was associated with increases in dual use among both service-connected (0.42 pp; 95% CI, 0.23 to 0.61) and income-eligible veterans (0.83 pp; 95% CI, 0.59 to 1.07).
Concerning per capita utilization of depression care after Medicaid expansion, analyses showed no detectable changes for either inpatient or outpatient services, among both service-connected and income-eligible veterans. However, while this pattern held at the state level among hospitalizations, outpatient visit results showed divergent trends between AZ and NY. In NY, Medicaid expansion was associated with decreased per capita utilization of outpatient depression care among both service-connected (-0.25 visits annually; 95% CI, -0.48 to -0.01) and income-eligible veterans (-0.64 visits annually; 95% CI, -0.93 to -0.35). In AZ, Medicaid expansion was associated with increased per capita utilization of outpatient depression care among both service-connected (0.62 visits annually; 95% CI, 0.32-0.91) and income-eligible veterans (2.32 visits annually; 95% CI, 1.99-2.65).
Discussion
Our study quantified changes in depression-related health care utilization after Medicaid expansions in NY and AZ in 2001. Overall, the balance of evidence indicated that Medicaid expansion was associated with decreased reliance on the VA for depression-related services. There was an exception: income-eligible veterans in AZ did not shift their hospital care away from the VA in a statistically discernible way, although the point estimate was lower. More broadly, these findings concerning veterans’ reliance varied not only in inpatient vs outpatient services and income- vs service-connected eligibility, but also in the state-level contexts of veteran dual users and per capita utilization.
Given that the overall per capita utilization of depression care was unchanged from pre- to postexpansion periods, one might interpret the decreases in VA reliance and increases in Medicaid-VA dual users as a substitution effect from VA care to non-VA care. This could be plausible for hospitalizations where state-level analyses showed similarly stable levels of per capita utilization. However, state-level trends in our outpatient utilization analysis, especially with a substantial 2.32 pp increase in annual per capita visits among income-eligible veterans in AZ, leave open the possibility that in some cases veterans may be complementing VA care with Medicaid-reimbursed services.
The causes underlying these differences in reliance shifts between NY and AZ are likely also influenced by the policy contexts of their respective Medicaid expansions. For example, in 1999, NY passed Kendra’s Law, which established a procedure for obtaining court orders for assisted outpatient mental health treatment for individuals deemed unlikely to survive safely in the community.26 A reasonable inference is that there was less unfulfilled outpatient mental health need in NY under the existing accessibility provisioned by Kendra’s Law. In addition, while both states extended coverage to childless adults under 100% of the Federal Poverty level (FPL), the AZ Medicaid expansion was via a voters’ initiative and extended family coverage to 200% FPL vs 150% FPL for families in NY. Given that the AZ Medicaid expansion enjoyed both broader public participation and generosity in terms of eligibility, its uptake and therefore effect size may have been larger than in NY for nonacute outpatient care.
Our findings contribute to the growing body of literature surrounding the changes in health care utilization after Medicaid expansion, specifically for a newly dual-eligible population of veterans seeking mental health services for depression. While prior research concerning Medicare dual-enrolled veterans has shown high reliance on the VA for both mental health diagnoses and services, scholars have established the association of Medicaid enrollment with decreased VA reliance.27-29 Our analysis is the first to investigate state-level effects of Medicaid expansion on VA reliance for a single mental health condition using a natural experimental framework. We focus on a population that includes a large portion of veterans who are newly Medicaid-eligible due to a sweeping policy change and use demographically matched nonexpansion states to draw comparisons in VA reliance for depression care. Our findings of Medicaid expansion–associated decreases in VA reliance for depression care complement prior literature that describe Medicaid enrollment–associated decreases in VA reliance for overall mental health care.
Implications
From a systems-level perspective, the implications of shifting services away from the VA are complex and incompletely understood. The VA lacks interoperability with the electronic health records (EHRs) used by Medicaid clinicians. Consequently, significant issues of service duplication and incomplete clinical data exist for veterans seeking treatment outside of the VA system, posing health care quality and safety concerns.30 On one hand, Medicaid access is associated with increased health care utilization attributed to filling unmet needs for Medicare dual enrollees, as well as increased prescription filling for psychiatric medications.31,32 Furthermore, the only randomized control trial of Medicaid expansion to date was associated with a 9-pp decrease in positive screening rates for depression among those who received access at around 2 years postexpansion.33 On the other hand, the VA has developed a mental health system tailored to the particular needs of veterans, and health care practitioners at the VA have significantly greater rates of military cultural competency compared to those in nonmilitary settings (70% vs 24% in the TRICARE network and 8% among those with no military or TRICARE affiliation).34 Compared to individuals seeking mental health services with private insurance plans, veterans were about twice as likely to receive appropriate treatment for schizophrenia and depression at the VA.35 These documented strengths of VA mental health care may together help explain the small absolute number of visits that were associated with shifts away from VA overall after Medicaid expansion.
Finally, it is worth considering extrinsic factors that influence utilization among newly dual-eligible veterans. For example, hospitalizations are less likely to be planned than outpatient services, translating to a greater importance of proximity to a nearby medical facility than a veteran’s preference of where to seek care. In the same vein, major VA medical centers are fewer and more distant on average than VA outpatient clinics, therefore reducing the advantage of a Medicaid-reimbursed outpatient clinic in terms of distance.36 These realities may partially explain the proportionally larger shifts away from the VA for hospitalizations compared to outpatient care for depression.
Limitations and Future Directions
Our results should be interpreted within methodological and data limitations. With only 2 states in our sample, NY demonstrably skewed overall results, contributing 1.7 to 3 times more observations than AZ across subanalyses—a challenge also cited by Sommers and colleagues.19 Our veteran groupings were also unable to distinguish those veterans classified as service-connected who may also have qualified by income-eligible criteria (which would tend to understate the size of results) and those veterans who gained and then lost Medicaid coverage in a given year. Our study also faces limitations in generalizability and establishing causality. First, we included only 2 historical state Medicaid expansions, compared with the 38 states and Washington, DC, that have now expanded Medicaid to date under the ACA. Just in the 2 states from our study, we noted significant heterogeneity in the shifts associated with Medicaid expansion, which makes extrapolating specific trends difficult. Differences in underlying health care resources, legislation, and other external factors may limit the applicability of Medicaid expansion in the era of the ACA, as well as the Veterans Choice and MISSION acts. Second, while we leveraged a difference-in-difference analysis using demographically matched, neighboring comparison states, our findings are nevertheless drawn from observational data obviating causality. VA data for other sources of coverage such as private insurance are limited and not included in our study, and MAX datasets vary by quality across states, translating to potential gaps in our study cohort.28
Moving forward, our study demonstrates the potential for applying a natural experimental approach to studying dual-eligible veterans at the interface of Medicaid expansion. We focused on changes in VA reliance for the specific condition of depression and, in doing so, invite further inquiry into the impact of state mental health policy on outcomes more proximate to veterans’ outcomes. Clinical indicators, such as rates of antidepressant filling, utilization and duration of psychotherapy, and PHQ-9 scores, can similarly be investigated by natural experimental design. While current limits of administrative data and the siloing of EHRs may pose barriers to some of these avenues of research, multidisciplinary methodologies and data querying innovations such as natural language processing algorithms for clinical notes hold exciting opportunities to bridge the gap between policy and clinical efficacy.
Conclusions
This study applied a difference-in-difference analysis and found that Medicaid expansion is associated with decreases in VA reliance for both inpatient and outpatient services for depression. As additional data are generated from the Medicaid expansions of the ACA, similarly robust methods should be applied to further explore the impacts associated with such policy shifts and open the door to a better understanding of implications at the clinical level.
Acknowledgments
We acknowledge the efforts of Janine Wong, who proofread and formatted the manuscript.
1. US Department of Veterans Affairs, Veterans Health Administration. About VA. 2019. Updated September 27, 2022. Accessed September 29, 2022. https://www.va.gov/health/
2. Richardson LK, Frueh BC, Acierno R. Prevalence estimates of combat-related post-traumatic stress disorder: critical review. Aust N Z J Psychiatry. 2010;44(1):4-19. doi:10.3109/00048670903393597
3. Lan CW, Fiellin DA, Barry DT, et al. The epidemiology of substance use disorders in US veterans: a systematic review and analysis of assessment methods. Am J Addict. 2016;25(1):7-24. doi:10.1111/ajad.12319
4. Grant BF, Saha TD, June Ruan W, et al. Epidemiology of DSM-5 drug use disorder results from the national epidemiologic survey on alcohol and related conditions-III. JAMA Psychiat. 2016;73(1):39-47. doi:10.1001/jamapsychiatry.015.2132
5. Pemberton MR, Forman-Hoffman VL, Lipari RN, Ashley OS, Heller DC, Williams MR. Prevalence of past year substance use and mental illness by veteran status in a nationally representative sample. CBHSQ Data Review. Published November 9, 2016. Accessed October 6, 2022. https://www.samhsa.gov/data/report/prevalence-past-year-substance-use-and-mental-illness-veteran-status-nationally
6. Watkins KE, Pincus HA, Smith B, et al. Veterans Health Administration Mental Health Program Evaluation: Capstone Report. 2011. Accessed September 29, 2022. https://www.rand.org/pubs/technical_reports/TR956.html
7. Henry J. Kaiser Family Foundation. Medicaid’s role in covering veterans. June 29, 2017. Accessed September 29, 2022. https://www.kff.org/infographic/medicaids-role-in-covering-veterans
8. Substance Abuse and Mental Health Services Administration. Results from the 2016 National Survey on Drug Use and Health: detailed tables. September 7, 2017. Accessed September 29, 2022. https://www.samhsa.gov/data/sites/default/files/NSDUH-DetTabs-2016/NSDUH-DetTabs-2016.pdf
9. Wen H, Druss BG, Cummings JR. Effect of Medicaid expansions on health insurance coverage and access to care among low-income adults with behavioral health conditions. Health Serv Res. 2015;50:1787-1809. doi:10.1111/1475-6773.12411
10. O’Mahen PN, Petersen LA. Effects of state-level Medicaid expansion on Veterans Health Administration dual enrollment and utilization: potential implications for future coverage expansions. Med Care. 2020;58(6):526-533. doi:10.1097/MLR.0000000000001327
11. Ono SS, Dziak KM, Wittrock SM, et al. Treating dual-use patients across two health care systems: a qualitative study. Fed Pract. 2015;32(8):32-37.
12. Weeks WB, Mahar PJ, Wright SM. Utilization of VA and Medicare services by Medicare-eligible veterans: the impact of additional access points in a rural setting. J Healthc Manag. 2005;50(2):95-106.
13. Gellad WF, Thorpe JM, Zhao X, et al. Impact of dual use of Department of Veterans Affairs and Medicare part d drug benefits on potentially unsafe opioid use. Am J Public Health. 2018;108(2):248-255. doi:10.2105/AJPH.2017.304174
14. Coughlin SS, Young L. A review of dual health care system use by veterans with cardiometabolic disease. J Hosp Manag Health Policy. 2018;2:39. doi:10.21037/jhmhp.2018.07.05
15. Radomski TR, Zhao X, Thorpe CT, et al. The impact of medication-based risk adjustment on the association between veteran health outcomes and dual health system use. J Gen Intern Med. 2017;32(9):967-973. doi:10.1007/s11606-017-4064-4
16. Kullgren JT, Fagerlin A, Kerr EA. Completing the MISSION: a blueprint for helping veterans make the most of new choices. J Gen Intern Med. 2020;35(5):1567-1570. doi:10.1007/s11606-019-05404-w
17. VA MISSION Act of 2018, 38 USC §101 (2018). https://www.govinfo.gov/app/details/USCODE-2018-title38/USCODE-2018-title38-partI-chap1-sec101
18. Vanneman ME, Phibbs CS, Dally SK, Trivedi AN, Yoon J. The impact of Medicaid enrollment on Veterans Health Administration enrollees’ behavioral health services use. Health Serv Res. 2018;53(suppl 3):5238-5259. doi:10.1111/1475-6773.13062
19. Sommers BD, Baicker K, Epstein AM. Mortality and access to care among adults after state Medicaid expansions. N Engl J Med. 2012;367(11):1025-1034. doi:10.1056/NEJMsa1202099
20. US Department of Veterans Affairs Office of Mental Health. 2019 national veteran suicide prevention annual report. 2019. Accessed September 29, 2022. https://www.mentalhealth.va.gov/docs/data-sheets/2019/2019_National_Veteran_Suicide_Prevention_Annual_Report_508.pdf
21. Hawton K, Casañas I Comabella C, Haw C, Saunders K. Risk factors for suicide in individuals with depression: a systematic review. J Affect Disord. 2013;147(1-3):17-28. doi:10.1016/j.jad.2013.01.004
22. Adekkanattu P, Sholle ET, DeFerio J, Pathak J, Johnson SB, Campion TR Jr. Ascertaining depression severity by extracting Patient Health Questionnaire-9 (PHQ-9) scores from clinical notes. AMIA Annu Symp Proc. 2018;2018:147-156.
23. DeRubeis RJ, Siegle GJ, Hollon SD. Cognitive therapy versus medication for depression: treatment outcomes and neural mechanisms. Nat Rev Neurosci. 2008;9(10):788-796. doi:10.1038/nrn2345
24. Cully JA, Zimmer M, Khan MM, Petersen LA. Quality of depression care and its impact on health service use and mortality among veterans. Psychiatr Serv. 2008;59(12):1399-1405. doi:10.1176/ps.2008.59.12.1399
25. Byrne MM, Kuebeler M, Pietz K, Petersen LA. Effect of using information from only one system for dually eligible health care users. Med Care. 2006;44(8):768-773. doi:10.1097/01.mlr.0000218786.44722.14
26. Watkins KE, Smith B, Akincigil A, et al. The quality of medication treatment for mental disorders in the Department of Veterans Affairs and in private-sector plans. Psychiatr Serv. 2016;67(4):391-396. doi:10.1176/appi.ps.201400537
27. Petersen LA, Byrne MM, Daw CN, Hasche J, Reis B, Pietz K. Relationship between clinical conditions and use of Veterans Affairs health care among Medicare-enrolled veterans. Health Serv Res. 2010;45(3):762-791. doi:10.1111/j.1475-6773.2010.01107.x
28. Yoon J, Vanneman ME, Dally SK, Trivedi AN, Phibbs Ciaran S. Use of Veterans Affairs and Medicaid services for dually enrolled veterans. Health Serv Res. 2018;53(3):1539-1561. doi:10.1111/1475-6773.12727
29. Yoon J, Vanneman ME, Dally SK, Trivedi AN, Phibbs Ciaran S. Veterans’ reliance on VA care by type of service and distance to VA for nonelderly VA-Medicaid dual enrollees. Med Care. 2019;57(3):225-229. doi:10.1097/MLR.0000000000001066
30. Gaglioti A, Cozad A, Wittrock S, et al. Non-VA primary care providers’ perspectives on comanagement for rural veterans. Mil Med. 2014;179(11):1236-1243. doi:10.7205/MILMED-D-13-00342
31. Moon S, Shin J. Health care utilization among Medicare-Medicaid dual eligibles: a count data analysis. BMC Public Health. 2006;6(1):88. doi:10.1186/1471-2458-6-88
32. Henry J. Kaiser Family Foundation. Facilitating access to mental health services: a look at Medicaid, private insurance, and the uninsured. November 27, 2017. Accessed September 29, 2022. https://www.kff.org/medicaid/fact-sheet/facilitating-access-to-mental-health-services-a-look-at-medicaid-private-insurance-and-the-uninsured
33. Baicker K, Taubman SL, Allen HL, et al. The Oregon experiment - effects of Medicaid on clinical outcomes. N Engl J Med. 2013;368(18):1713-1722. doi:10.1056/NEJMsa1212321
34. Tanielian T, Farris C, Batka C, et al. Ready to serve: community-based provider capacity to deliver culturally competent, quality mental health care to veterans and their families. 2014. Accessed September 29, 2022. https://www.rand.org/content/dam/rand/pubs/research_reports/RR800/RR806/RAND_RR806.pdf
35. Kizer KW, Dudley RA. Extreme makeover: transformation of the Veterans Health Care System. Annu Rev Public Health. 2009;30(1):313-339. doi:10.1146/annurev.publhealth.29.020907.090940
36. Brennan KJ. Kendra’s Law: final report on the status of assisted outpatient treatment, appendix 2. 2002. Accessed September 29, 2022. https://omh.ny.gov/omhweb/kendra_web/finalreport/appendix2.htm
The US Department of Veterans Affairs (VA) is the largest integrated health care system in the United States, providing care for more than 9 million veterans.1 With veterans experiencing mental health conditions like posttraumatic stress disorder (PTSD), substance use disorders, and other serious mental illnesses (SMI) at higher rates compared with the general population, the VA plays an important role in the provision of mental health services.2-5 Since the implementation of its Mental Health Strategic Plan in 2004, the VA has overseen the development of a wide array of mental health programs geared toward the complex needs of veterans. Research has demonstrated VA care outperforming Medicaid-reimbursed services in terms of the percentage of veterans filling antidepressants for at least 12 weeks after initiation of treatment for major depressive disorder (MDD), as well as posthospitalization follow-up.6
Eligible veterans enrolled in the VA often also seek non-VA care. Medicaid covers nearly 10% of all nonelderly veterans, and of these veterans, 39% rely solely on Medicaid for health care access.7 Today, Medicaid is the largest payer for mental health services in the US, providing coverage for approximately 27% of Americans who have SMI and helping fulfill unmet mental health needs.8,9 Understanding which of these systems veterans choose to use, and under which circumstances, is essential in guiding the allocation of limited health care resources.10
Beyond Medicaid, alternatives to VA care may include TRICARE, Medicare, Indian Health Services, and employer-based or self-purchased private insurance. While these options potentially increase convenience, choice, and access to health care practitioners (HCPs) and services not available at local VA systems, cross-system utilization with poor integration may cause care coordination and continuity problems, such as medication mismanagement and opioid overdose, unnecessary duplicate utilization, and possible increased mortality.11-15 As recent national legislative changes, such as the Patient Protection and Affordable Care Act (ACA), Veterans Access, Choice and Accountability Act, and the VA MISSION Act, continue to shift the health care landscape for veterans, questions surrounding how veterans are changing their health care use become significant.16,17
Here, we approach the impacts of Medicaid expansion on veterans’ reliance on the VA for mental health services with a unique lens. We leverage a difference-in-difference design to study 2 historical Medicaid expansions in Arizona (AZ) and New York (NY), which extended eligibility to childless adults in 2001. Prior Medicaid dual-eligible mental health research investigated reliance shifts during the immediate postenrollment year in a subset of veterans newly enrolled in Medicaid.18 However, this study took place in a period of relative policy stability. In contrast, we investigate the potential effects of a broad policy shift by analyzing state-level changes in veterans’ reliance over 6 years after a statewide Medicaid expansion. We match expansion states with demographically similar nonexpansion states to account for unobserved trends and confounding effects. Prior studies have used this method to evaluate post-Medicaid expansion mortality changes and changes in veteran dual enrollment and hospitalizations.10,19 While a study of ACA Medicaid expansion states would be ideal, Medicaid data from most states were only available through 2014 at the time of this analysis. Our study offers a quasi-experimental framework leveraging longitudinal data that can be applied as more post-ACA data become available.
Given the rising incidence of suicide among veterans, understanding care-seeking behaviors for depression among veterans is important as it is the most common psychiatric condition found in those who died by suicide.20,21 Furthermore, depression may be useful as a clinical proxy for mental health policy impacts, given that the Patient Health Questionnaire-9 (PHQ-9) screening tool is well validated and increasingly research accessible, and it is a chronic condition responsive to both well-managed pharmacologic treatment and psychotherapeutic interventions.22,23
In this study, we quantify the change in care-seeking behavior for depression among veterans after Medicaid expansion, using a quasi-experimental design. We hypothesize that new access to Medicaid would be associated with a shift away from using VA services for depression. Given the income-dependent eligibility requirements of Medicaid, we also hypothesize that veterans who qualified for VA coverage due to low income, determined by a regional means test (Priority group 5, “income-eligible”), would be more likely to shift care compared with those whose serviced-connected conditions related to their military service (Priority groups 1-4, “service-connected”) provide VA access.
Methods
To investigate the relative changes in veterans’ reliance on the VA for depression care after the 2001 NY and AZ Medicaid expansions We used a retrospective, difference-in-difference analysis. Our comparison pairings, based on prior demographic analyses were as follows: NY with Pennsylvania(PA); AZ with New Mexico and Nevada (NM/NV).19 The time frame of our analysis was 1999 to 2006, with pre- and postexpansion periods defined as 1999 to 2000 and 2001 to 2006, respectively.
Data
We included veterans aged 18 to 64 years, seeking care for depression from 1999 to 2006, who were also VA-enrolled and residing in our states of interest. We counted veterans as enrolled in Medicaid if they were enrolled at least 1 month in a given year.
Using similar methods like those used in prior studies, we selected patients with encounters documenting depression as the primary outpatient or inpatient diagnosis using International Classification of Diseases, Ninth Revision, Clinical Modification (ICD-9-CM) codes: 296.2x for a single episode of major depressive disorder, 296.3x for a recurrent episode of MDD, 300.4 for dysthymia, and 311.0 for depression not otherwise specified.18,24 We used data from the Medicaid Analytic eXtract files (MAX) for Medicaid data and the VA Corporate Data Warehouse (CDW) for VA data. We chose 1999 as the first study year because it was the earliest year MAX data were available.
Our final sample included 1833 person-years pre-expansion and 7157 postexpansion in our inpatient analysis, as well as 31,767 person-years pre-expansion and 130,382 postexpansion in our outpatient analysis.
Outcomes and Variables
Our primary outcomes were comparative shifts in VA reliance between expansion and nonexpansion states after Medicaid expansion for both inpatient and outpatient depression care. For each year of study, we calculated a veteran’s VA reliance by aggregating the number of days with depression-related encounters at the VA and dividing by the total number of days with a VA or Medicaid depression-related encounters for the year. To provide context to these shifts in VA reliance, we further analyzed the changes in the proportion of annual VA-Medicaid dual users and annual per capita utilization of depression care across the VA and Medicaid.
We conducted subanalyses by income-eligible and service-connected veterans and adjusted our models for age, non-White race, sex, distances to the nearest inpatient and outpatient VA facilities, and VA Relative Risk Score, which is a measure of disease burden and clinical complexity validated specifically for veterans.25
Statistical Analysis
We used fractional logistic regression to model the adjusted effect of Medicaid expansion on VA reliance for depression care. In parallel, we leveraged ordered logit regression and negative binomial regression models to examine the proportion of VA-Medicaid dual users and the per capita utilization of Medicaid and VA depression care, respectively. To estimate the difference-in-difference effects, we used the interaction term of 2 categorical variables—expansion vs nonexpansion states and pre- vs postexpansion status—as the independent variable. We then calculated the average marginal effects with 95% CIs to estimate the differences in outcomes between expansion and nonexpansion states from pre- to postexpansion periods, as well as year-by-year shifts as a robustness check. We conducted these analyses using Stata MP, version 15.
Results
Baseline and postexpansion characteristics
VA Reliance
Overall, we observed postexpansion decreases in VA reliance for depression care
At the state level, reliance on the VA for inpatient depression care in NY decreased by 13.53 pp (95% CI, -22.58 to -4.49) for income-eligible veterans and 16.67 pp (95% CI, -24.53 to -8.80) for service-connected veterans. No relative differences were observed in the outpatient comparisons for both income-eligible (-0.58 pp; 95% CI, -2.13 to 0.98) and service-connected (0.05 pp; 95% CI, -1.00 to 1.10) veterans. In AZ, Medicaid expansion was associated with decreased VA reliance for outpatient depression care among income-eligible veterans (-8.60 pp; 95% CI, -10.60 to -6.61), greater than that for service-connected veterans (-2.89 pp; 95% CI, -4.02 to -1.77). This decrease in VA reliance was significant in the inpatient context only for service-connected veterans (-4.55 pp; 95% CI, -8.14 to -0.97), not income-eligible veterans (-8.38 pp; 95% CI, -17.91 to 1.16).
By applying the aggregate pp changes toward the postexpansion number of visits across both expansion and nonexpansion states, we found that expansion of Medicaid across all our study states would have resulted in 996 fewer hospitalizations and 10,109 fewer outpatient visits for depression at VA in the postexpansion period vs if no states had chosen to expand Medicaid.
Dual Use/Per Capita Utilization
Overall, Medicaid expansion was associated with greater dual use for inpatient depression care—a 0.97-pp (95% CI, 0.46 to 1.48) increase among service-connected veterans and a 0.64-pp (95% CI, 0.35 to 0.94) increase among income-eligible veterans.
At the state level, NY similarly showed increases in dual use among both service-connected (1.48 pp; 95% CI, 0.80 to 2.16) and income-eligible veterans (0.73 pp; 95% CI, 0.39 to 1.07) after Medicaid expansion. However, dual use in AZ increased significantly only among service-connected veterans (0.70 pp; 95% CI, 0.03 to 1.38), not income-eligible veterans (0.31 pp; 95% CI, -0.17 to 0.78).
Among outpatient visits, Medicaid expansion was associated with increased dual use only for income-eligible veterans (0.16 pp; 95% CI, 0.03-0.29), and not service-connected veterans (0.09 pp; 95% CI, -0.04 to 0.21). State-level analyses showed that Medicaid expansion in NY was not associated with changes in dual use for either service-connected (0.01 pp; 95% CI, -0.16 to 0.17) or income-eligible veterans (0.03 pp; 95% CI, -0.12 to 0.18), while expansion in AZ was associated with increases in dual use among both service-connected (0.42 pp; 95% CI, 0.23 to 0.61) and income-eligible veterans (0.83 pp; 95% CI, 0.59 to 1.07).
Concerning per capita utilization of depression care after Medicaid expansion, analyses showed no detectable changes for either inpatient or outpatient services, among both service-connected and income-eligible veterans. However, while this pattern held at the state level among hospitalizations, outpatient visit results showed divergent trends between AZ and NY. In NY, Medicaid expansion was associated with decreased per capita utilization of outpatient depression care among both service-connected (-0.25 visits annually; 95% CI, -0.48 to -0.01) and income-eligible veterans (-0.64 visits annually; 95% CI, -0.93 to -0.35). In AZ, Medicaid expansion was associated with increased per capita utilization of outpatient depression care among both service-connected (0.62 visits annually; 95% CI, 0.32-0.91) and income-eligible veterans (2.32 visits annually; 95% CI, 1.99-2.65).
Discussion
Our study quantified changes in depression-related health care utilization after Medicaid expansions in NY and AZ in 2001. Overall, the balance of evidence indicated that Medicaid expansion was associated with decreased reliance on the VA for depression-related services. There was an exception: income-eligible veterans in AZ did not shift their hospital care away from the VA in a statistically discernible way, although the point estimate was lower. More broadly, these findings concerning veterans’ reliance varied not only in inpatient vs outpatient services and income- vs service-connected eligibility, but also in the state-level contexts of veteran dual users and per capita utilization.
Given that the overall per capita utilization of depression care was unchanged from pre- to postexpansion periods, one might interpret the decreases in VA reliance and increases in Medicaid-VA dual users as a substitution effect from VA care to non-VA care. This could be plausible for hospitalizations where state-level analyses showed similarly stable levels of per capita utilization. However, state-level trends in our outpatient utilization analysis, especially with a substantial 2.32 pp increase in annual per capita visits among income-eligible veterans in AZ, leave open the possibility that in some cases veterans may be complementing VA care with Medicaid-reimbursed services.
The causes underlying these differences in reliance shifts between NY and AZ are likely also influenced by the policy contexts of their respective Medicaid expansions. For example, in 1999, NY passed Kendra’s Law, which established a procedure for obtaining court orders for assisted outpatient mental health treatment for individuals deemed unlikely to survive safely in the community.26 A reasonable inference is that there was less unfulfilled outpatient mental health need in NY under the existing accessibility provisioned by Kendra’s Law. In addition, while both states extended coverage to childless adults under 100% of the Federal Poverty level (FPL), the AZ Medicaid expansion was via a voters’ initiative and extended family coverage to 200% FPL vs 150% FPL for families in NY. Given that the AZ Medicaid expansion enjoyed both broader public participation and generosity in terms of eligibility, its uptake and therefore effect size may have been larger than in NY for nonacute outpatient care.
Our findings contribute to the growing body of literature surrounding the changes in health care utilization after Medicaid expansion, specifically for a newly dual-eligible population of veterans seeking mental health services for depression. While prior research concerning Medicare dual-enrolled veterans has shown high reliance on the VA for both mental health diagnoses and services, scholars have established the association of Medicaid enrollment with decreased VA reliance.27-29 Our analysis is the first to investigate state-level effects of Medicaid expansion on VA reliance for a single mental health condition using a natural experimental framework. We focus on a population that includes a large portion of veterans who are newly Medicaid-eligible due to a sweeping policy change and use demographically matched nonexpansion states to draw comparisons in VA reliance for depression care. Our findings of Medicaid expansion–associated decreases in VA reliance for depression care complement prior literature that describe Medicaid enrollment–associated decreases in VA reliance for overall mental health care.
Implications
From a systems-level perspective, the implications of shifting services away from the VA are complex and incompletely understood. The VA lacks interoperability with the electronic health records (EHRs) used by Medicaid clinicians. Consequently, significant issues of service duplication and incomplete clinical data exist for veterans seeking treatment outside of the VA system, posing health care quality and safety concerns.30 On one hand, Medicaid access is associated with increased health care utilization attributed to filling unmet needs for Medicare dual enrollees, as well as increased prescription filling for psychiatric medications.31,32 Furthermore, the only randomized control trial of Medicaid expansion to date was associated with a 9-pp decrease in positive screening rates for depression among those who received access at around 2 years postexpansion.33 On the other hand, the VA has developed a mental health system tailored to the particular needs of veterans, and health care practitioners at the VA have significantly greater rates of military cultural competency compared to those in nonmilitary settings (70% vs 24% in the TRICARE network and 8% among those with no military or TRICARE affiliation).34 Compared to individuals seeking mental health services with private insurance plans, veterans were about twice as likely to receive appropriate treatment for schizophrenia and depression at the VA.35 These documented strengths of VA mental health care may together help explain the small absolute number of visits that were associated with shifts away from VA overall after Medicaid expansion.
Finally, it is worth considering extrinsic factors that influence utilization among newly dual-eligible veterans. For example, hospitalizations are less likely to be planned than outpatient services, translating to a greater importance of proximity to a nearby medical facility than a veteran’s preference of where to seek care. In the same vein, major VA medical centers are fewer and more distant on average than VA outpatient clinics, therefore reducing the advantage of a Medicaid-reimbursed outpatient clinic in terms of distance.36 These realities may partially explain the proportionally larger shifts away from the VA for hospitalizations compared to outpatient care for depression.
Limitations and Future Directions
Our results should be interpreted within methodological and data limitations. With only 2 states in our sample, NY demonstrably skewed overall results, contributing 1.7 to 3 times more observations than AZ across subanalyses—a challenge also cited by Sommers and colleagues.19 Our veteran groupings were also unable to distinguish those veterans classified as service-connected who may also have qualified by income-eligible criteria (which would tend to understate the size of results) and those veterans who gained and then lost Medicaid coverage in a given year. Our study also faces limitations in generalizability and establishing causality. First, we included only 2 historical state Medicaid expansions, compared with the 38 states and Washington, DC, that have now expanded Medicaid to date under the ACA. Just in the 2 states from our study, we noted significant heterogeneity in the shifts associated with Medicaid expansion, which makes extrapolating specific trends difficult. Differences in underlying health care resources, legislation, and other external factors may limit the applicability of Medicaid expansion in the era of the ACA, as well as the Veterans Choice and MISSION acts. Second, while we leveraged a difference-in-difference analysis using demographically matched, neighboring comparison states, our findings are nevertheless drawn from observational data obviating causality. VA data for other sources of coverage such as private insurance are limited and not included in our study, and MAX datasets vary by quality across states, translating to potential gaps in our study cohort.28
Moving forward, our study demonstrates the potential for applying a natural experimental approach to studying dual-eligible veterans at the interface of Medicaid expansion. We focused on changes in VA reliance for the specific condition of depression and, in doing so, invite further inquiry into the impact of state mental health policy on outcomes more proximate to veterans’ outcomes. Clinical indicators, such as rates of antidepressant filling, utilization and duration of psychotherapy, and PHQ-9 scores, can similarly be investigated by natural experimental design. While current limits of administrative data and the siloing of EHRs may pose barriers to some of these avenues of research, multidisciplinary methodologies and data querying innovations such as natural language processing algorithms for clinical notes hold exciting opportunities to bridge the gap between policy and clinical efficacy.
Conclusions
This study applied a difference-in-difference analysis and found that Medicaid expansion is associated with decreases in VA reliance for both inpatient and outpatient services for depression. As additional data are generated from the Medicaid expansions of the ACA, similarly robust methods should be applied to further explore the impacts associated with such policy shifts and open the door to a better understanding of implications at the clinical level.
Acknowledgments
We acknowledge the efforts of Janine Wong, who proofread and formatted the manuscript.
1. US Department of Veterans Affairs, Veterans Health Administration. About VA. 2019. Updated September 27, 2022. Accessed September 29, 2022. https://www.va.gov/health/
2. Richardson LK, Frueh BC, Acierno R. Prevalence estimates of combat-related post-traumatic stress disorder: critical review. Aust N Z J Psychiatry. 2010;44(1):4-19. doi:10.3109/00048670903393597
3. Lan CW, Fiellin DA, Barry DT, et al. The epidemiology of substance use disorders in US veterans: a systematic review and analysis of assessment methods. Am J Addict. 2016;25(1):7-24. doi:10.1111/ajad.12319
4. Grant BF, Saha TD, June Ruan W, et al. Epidemiology of DSM-5 drug use disorder results from the national epidemiologic survey on alcohol and related conditions-III. JAMA Psychiat. 2016;73(1):39-47. doi:10.1001/jamapsychiatry.015.2132
5. Pemberton MR, Forman-Hoffman VL, Lipari RN, Ashley OS, Heller DC, Williams MR. Prevalence of past year substance use and mental illness by veteran status in a nationally representative sample. CBHSQ Data Review. Published November 9, 2016. Accessed October 6, 2022. https://www.samhsa.gov/data/report/prevalence-past-year-substance-use-and-mental-illness-veteran-status-nationally
6. Watkins KE, Pincus HA, Smith B, et al. Veterans Health Administration Mental Health Program Evaluation: Capstone Report. 2011. Accessed September 29, 2022. https://www.rand.org/pubs/technical_reports/TR956.html
7. Henry J. Kaiser Family Foundation. Medicaid’s role in covering veterans. June 29, 2017. Accessed September 29, 2022. https://www.kff.org/infographic/medicaids-role-in-covering-veterans
8. Substance Abuse and Mental Health Services Administration. Results from the 2016 National Survey on Drug Use and Health: detailed tables. September 7, 2017. Accessed September 29, 2022. https://www.samhsa.gov/data/sites/default/files/NSDUH-DetTabs-2016/NSDUH-DetTabs-2016.pdf
9. Wen H, Druss BG, Cummings JR. Effect of Medicaid expansions on health insurance coverage and access to care among low-income adults with behavioral health conditions. Health Serv Res. 2015;50:1787-1809. doi:10.1111/1475-6773.12411
10. O’Mahen PN, Petersen LA. Effects of state-level Medicaid expansion on Veterans Health Administration dual enrollment and utilization: potential implications for future coverage expansions. Med Care. 2020;58(6):526-533. doi:10.1097/MLR.0000000000001327
11. Ono SS, Dziak KM, Wittrock SM, et al. Treating dual-use patients across two health care systems: a qualitative study. Fed Pract. 2015;32(8):32-37.
12. Weeks WB, Mahar PJ, Wright SM. Utilization of VA and Medicare services by Medicare-eligible veterans: the impact of additional access points in a rural setting. J Healthc Manag. 2005;50(2):95-106.
13. Gellad WF, Thorpe JM, Zhao X, et al. Impact of dual use of Department of Veterans Affairs and Medicare part d drug benefits on potentially unsafe opioid use. Am J Public Health. 2018;108(2):248-255. doi:10.2105/AJPH.2017.304174
14. Coughlin SS, Young L. A review of dual health care system use by veterans with cardiometabolic disease. J Hosp Manag Health Policy. 2018;2:39. doi:10.21037/jhmhp.2018.07.05
15. Radomski TR, Zhao X, Thorpe CT, et al. The impact of medication-based risk adjustment on the association between veteran health outcomes and dual health system use. J Gen Intern Med. 2017;32(9):967-973. doi:10.1007/s11606-017-4064-4
16. Kullgren JT, Fagerlin A, Kerr EA. Completing the MISSION: a blueprint for helping veterans make the most of new choices. J Gen Intern Med. 2020;35(5):1567-1570. doi:10.1007/s11606-019-05404-w
17. VA MISSION Act of 2018, 38 USC §101 (2018). https://www.govinfo.gov/app/details/USCODE-2018-title38/USCODE-2018-title38-partI-chap1-sec101
18. Vanneman ME, Phibbs CS, Dally SK, Trivedi AN, Yoon J. The impact of Medicaid enrollment on Veterans Health Administration enrollees’ behavioral health services use. Health Serv Res. 2018;53(suppl 3):5238-5259. doi:10.1111/1475-6773.13062
19. Sommers BD, Baicker K, Epstein AM. Mortality and access to care among adults after state Medicaid expansions. N Engl J Med. 2012;367(11):1025-1034. doi:10.1056/NEJMsa1202099
20. US Department of Veterans Affairs Office of Mental Health. 2019 national veteran suicide prevention annual report. 2019. Accessed September 29, 2022. https://www.mentalhealth.va.gov/docs/data-sheets/2019/2019_National_Veteran_Suicide_Prevention_Annual_Report_508.pdf
21. Hawton K, Casañas I Comabella C, Haw C, Saunders K. Risk factors for suicide in individuals with depression: a systematic review. J Affect Disord. 2013;147(1-3):17-28. doi:10.1016/j.jad.2013.01.004
22. Adekkanattu P, Sholle ET, DeFerio J, Pathak J, Johnson SB, Campion TR Jr. Ascertaining depression severity by extracting Patient Health Questionnaire-9 (PHQ-9) scores from clinical notes. AMIA Annu Symp Proc. 2018;2018:147-156.
23. DeRubeis RJ, Siegle GJ, Hollon SD. Cognitive therapy versus medication for depression: treatment outcomes and neural mechanisms. Nat Rev Neurosci. 2008;9(10):788-796. doi:10.1038/nrn2345
24. Cully JA, Zimmer M, Khan MM, Petersen LA. Quality of depression care and its impact on health service use and mortality among veterans. Psychiatr Serv. 2008;59(12):1399-1405. doi:10.1176/ps.2008.59.12.1399
25. Byrne MM, Kuebeler M, Pietz K, Petersen LA. Effect of using information from only one system for dually eligible health care users. Med Care. 2006;44(8):768-773. doi:10.1097/01.mlr.0000218786.44722.14
26. Watkins KE, Smith B, Akincigil A, et al. The quality of medication treatment for mental disorders in the Department of Veterans Affairs and in private-sector plans. Psychiatr Serv. 2016;67(4):391-396. doi:10.1176/appi.ps.201400537
27. Petersen LA, Byrne MM, Daw CN, Hasche J, Reis B, Pietz K. Relationship between clinical conditions and use of Veterans Affairs health care among Medicare-enrolled veterans. Health Serv Res. 2010;45(3):762-791. doi:10.1111/j.1475-6773.2010.01107.x
28. Yoon J, Vanneman ME, Dally SK, Trivedi AN, Phibbs Ciaran S. Use of Veterans Affairs and Medicaid services for dually enrolled veterans. Health Serv Res. 2018;53(3):1539-1561. doi:10.1111/1475-6773.12727
29. Yoon J, Vanneman ME, Dally SK, Trivedi AN, Phibbs Ciaran S. Veterans’ reliance on VA care by type of service and distance to VA for nonelderly VA-Medicaid dual enrollees. Med Care. 2019;57(3):225-229. doi:10.1097/MLR.0000000000001066
30. Gaglioti A, Cozad A, Wittrock S, et al. Non-VA primary care providers’ perspectives on comanagement for rural veterans. Mil Med. 2014;179(11):1236-1243. doi:10.7205/MILMED-D-13-00342
31. Moon S, Shin J. Health care utilization among Medicare-Medicaid dual eligibles: a count data analysis. BMC Public Health. 2006;6(1):88. doi:10.1186/1471-2458-6-88
32. Henry J. Kaiser Family Foundation. Facilitating access to mental health services: a look at Medicaid, private insurance, and the uninsured. November 27, 2017. Accessed September 29, 2022. https://www.kff.org/medicaid/fact-sheet/facilitating-access-to-mental-health-services-a-look-at-medicaid-private-insurance-and-the-uninsured
33. Baicker K, Taubman SL, Allen HL, et al. The Oregon experiment - effects of Medicaid on clinical outcomes. N Engl J Med. 2013;368(18):1713-1722. doi:10.1056/NEJMsa1212321
34. Tanielian T, Farris C, Batka C, et al. Ready to serve: community-based provider capacity to deliver culturally competent, quality mental health care to veterans and their families. 2014. Accessed September 29, 2022. https://www.rand.org/content/dam/rand/pubs/research_reports/RR800/RR806/RAND_RR806.pdf
35. Kizer KW, Dudley RA. Extreme makeover: transformation of the Veterans Health Care System. Annu Rev Public Health. 2009;30(1):313-339. doi:10.1146/annurev.publhealth.29.020907.090940
36. Brennan KJ. Kendra’s Law: final report on the status of assisted outpatient treatment, appendix 2. 2002. Accessed September 29, 2022. https://omh.ny.gov/omhweb/kendra_web/finalreport/appendix2.htm
Randomized, Double-Blind Placebo-Controlled Trial to Assess the Effect of Probiotics on Irritable Bowel Syndrome in Veterans With Gulf War Illness
About 700,000 US military personnel were deployed in Operation Desert Storm (August 1990 to March 1991).1 Almost 30 years since the war, a large number of these veterans continue to experience a complex of symptoms of unknown etiology called Gulf War illness (GWI), which significantly affects health and quality of life (QOL). The lack of clear etiology of the illness has impaired research to find specific treatments and has further exacerbated the stress among veterans. GWI typically includes a mixture of chronic headache, cognitive difficulties, widespread pain, unexplained fatigue, memory and concentration problems, as well as chronic respiratory and gastrointestinal (GI) symptoms.2 Abdominal pain and alteration of bowel habits are also symptoms typical of irritable bowel syndrome (IBS). It has been estimated that IBS occurs in up to 30% of Gulf War veterans.3
The etiology of IBS is unknown. Possible mechanisms include visceral hypersensitivity, altered gut motor function, aberrant brain-gut interaction, and psychological factors, perhaps with a genetic predisposition.4 Gastroenteritis has been reported as a triggering mechanism in up to one-third of patients with IBS.5 Gastroenteritis can alter the gut microbiota and has been reported to be a significant risk factor for the development of IBS.6 In one study of Operation Desert Shield soldiers, > 50% of military personnel developed acute gastroenteritis while on duty.7 A high prevalence of extra-intestinal symptoms also has been reported, including fatigue, headache, joint pains, and anxiety, in Gulf War veterans with IBS. These extra-intestinal symptoms of IBS are consistent with the reported GWI symptoms. Change in gut microbiota also has been associated with many of the extra-intestinal symptoms of IBS, especially fatigue.8,9 Gut microbiota are known to change with travel, stress, and a change in diet, all potential factors that are relevant to Gulf War veterans. This would suggest that an imbalance in the gut microbiota, ie, dysbiosis, may play a role in the pathogenesis of both IBS and GWI. Dysbiosis could be a risk factor for or alternatively a consequence of GWI.
A systematic review highlighted the heterogeneity of the gut microbiota in patients with IBS.10 Overall, Enterobacteriaceae, Lactobacillaceae, and Bacteroides were increased, whereas Clostridiales, Faecalibacterium, and Bifidobacterium were decreased in patients with IBS compared with controls. Gut microbiota also has been associated with cognitive changes, anxiety, and depression—symptoms associated with IBS and are part of the GWI.
If altered gut microbiota contributes to the etiopathogenesis of IBS, its restoration of with probiotics should help. Probiotics are live organisms that when ingested may improve health by promoting the growth of naturally occurring flora and establishing a healthy gut flora. Probiotics have several mechanisms of actions. Probiotics work in the lumen of the gut by producing antibacterial molecules and enhancing the mucosal barrier.11 Probiotics also may produce metabolic compounds that alter the intestinal microbiota and improve intestinal barrier function.12 Probiotics also have been shown to activate receptors in the enteric nervous system with the potential to promote pain relief in the setting of visceral hyperalgesia.13,14 The anti-inflammatory properties of probiotics potentially could modulate the basic pathophysiology of IBS and improve motility, visceral hypersensitivity, and brain-gut interaction.15 Furthermore, significant gut dysbiosis has been shown with GWI; suggesting that probiotics may have a role in its management.16,17
Probiotics have not been studied in Gulf War veterans with IBS. We performed a prospective, double-blind placebo-controlled study to determine the efficacy of a commercially available probiotic containing 8 strains of bacteria (De Simone Formulation; formally known as VSL#3 and Visbiome) on symptoms of IBS and GWI. This probiotic was selected as the overall literature suggested benefit of combination probiotics in IBS, and VSL#3 has been shown to be efficacious in ulcerative colitis and microscopic colitis.18-20
Methods
Veterans who served in Operation Desert Storm (August 1990 to March 1991) and enrolled at the George E. Wahlen Veterans Affairs (VA) Medical Center (GEWVAMC), Salt Lake City, Utah, were eligible for the study. The inclusion criteria were: veterans aged ≥ 35 years; ≥ 2 nonintestinal GWI symptoms (eg, fatigue, joint pains, insomnia, general stiffness, and headache); IBS diagnosis based on the Rome III criteria; IBS symptoms > 6 months; normal gross appearance of the colonic mucosa; negative markers for celiac disease and inflammatory bowel disease (IBD); normal thyroid function; and serum calcium levels.21 Those who had a clinically significant cardiac, pulmonary, hepatic or renal dysfunction; history of/or presence of systemic malignancy; current evidence of celiac disease or IBD; unstable/significant psychiatric disease; recent change in GI medications; current pregnancy; or use of antibiotics or probiotics within the past 1 month were excluded. Subjects were enrolled from a list of veterans with GWI from the GEWVAMC Gulf War registry; referrals to gastroenterology clinics for IBS from internal medicine clinics; and posted advertisements.
Protocol
After written informed consent was obtained, each veteran was verified to have IBS and ≥ 2 GWI symptoms. All veterans had the following tests and panels: complete blood count, erythrocyte sedimentation rate, serum comprehensive metabolic panel, thyroid-stimulating hormone, tissue transglutaminase, stool test for ova and parasite, giardia antigen, and clostridia toxins to exclude organic cause of GI symptoms. Colonoscopy was performed in all veterans to exclude IBD, and to rule out microscopic or lymphocytic colitis.
Randomization was computer generated and maintained by the study pharmacist so that study personnel and patients were blinded to the trial groups. All investigators were blinded and allocation was concealed. The medication was supplied in a numbered container by the pharmacist after patient enrollment. After a 2-week run-in period, veterans were randomized (1:1) to receive either 1 sachet of probiotic (De Simone Formulation; formally known as VSL#3 and Visbiome) or placebo once daily for 8 weeks.
Each probiotic packet contains 900 billion probiotic bacteria per sachet.11 This formulation contained 8 viable strains of bacteria: 4 strains of Lactobacillus (L acidophilus, L plantarum, L paracasei, L delbrueckii subsp. bulgaricus); 3 strains of Bifidobacteria (Bifidobacterium breve, B lactis, B infantis); and 1 strain of Streptococcus thermophilus. This formulation had been commercialized and studied as VSL#3 and is currently available in the United States under the Visbiome trade name. While branding changed during the study, the formulation did not. The investigational medicine (VSL#3, Visbiome, and placebo) were shipped from the manufacturer Dupont/Danisco in Madison, Wisconsin. The subjects received placebo or probiotic (VSL#3/Visbiome) and both were identical in appearance. The medication was supplied in a numbered container by the pharmacist after patient enrollment.
Measures
Veterans completed the bowel disease questionnaire to record baseline bowel habits.22 All veterans recorded daily bowel symptoms to confirm the presence of IBS during the 2-week pretreatment period, at baseline, and at the end of the 8-week treatment. The symptoms assessed included severity of abdominal pain (0, none to 100, severe); severity of bloating (0, none to 100, severe); stool frequency; Bristol stool scale (1, very hard to 7, watery); severity of diarrhea (0, none to 100, severe); severity of constipation (0, none to 100, severe); satisfaction with bowel habits (0, none to 100, severe); and IBS affecting or interfering with life (0, none to 100, severe). The bowel symptom score is the sum of the 5 symptom scores.23,24
IBS-specific QOL (IBS-QOL) was recorded at baseline and at the end of treatment.25 The IBS-QOL consists of a 34-item validated disease-specific questionnaire that measures 8 domains relevant to subjects with IBS: dysphoria, interference with activity, body image, health worry, food avoidance, social reaction, sexual life, and relationships. We used the Somatic Symptom Checklist to detect the following extra-intestinal symptoms that are common among veterans with GWI: headache, backache, wheeziness, insomnia, bad breath, fatigue, general stiffness, dizziness, weakness, sensitivity to hot and cold, palpitation, and tightness in chest. Subjects rated symptoms on a scale of 1 to 5: how often (1, none; 2, monthly; 3, once weekly; 4, several times weekly; 5, daily), and how bothersome (1, not at all to 5, extremely).26
Subjects completed the Posttraumatic Stress Disorder (PTSD) Checklist–Military, which is specific to military experience with 17 items on a 1 to 5 scale (1, not at all to 5, extremely). Scores were summed to produce a total symptom severity score (range, 17-85).27 Subjects also completed the Brief Symptom Inventory 18 (BSI-18) during the baseline evaluation.28 BSI-18 measures subjects’ reported overall psychological distress. It assesses 3 symptoms dimensions (somatization, depression, and anxiety) and a global severity index. The raw scores were transferred to normative T scores based on samples of nonpatient normal men and women.

Symptom data were compared after 8 weeks of treatment. The primary study endpoint was change in bowel symptom score. The secondary endpoints were mean change in symptoms, QOL, extra-intestinal symptoms, and PTSD score. The study was approved by the Salt Lake City Veterans Affairs Medical Center and the University of Utah Institutional Review Board and registered in ClinicalTrials.gov (NCT03078530).
Statistical Methods
Comparisons of the probiotic vs placebo groups for demographic variable were analyzed using a 2-sample t test for continuous variables, and with a χ2 test or Fisher exact test for categorical variables. The primary and secondary outcome variables were recorded daily for 2 weeks as pretreatment baseline and for 2 weeks at the end of treatment. These symptoms were recorded as ordered categorical variables, which were then averaged across the week to produce a continuous measurement for statistical analysis. For the primary outcome of GI symptoms, posttreatment comparisons were made between the study groups using a 2-sample t test of the baseline vs posttreatment values. All P values were calculated for 2-sided comparisons. The planned sample size in our study protocol was to recruit 40 individuals per group in order to achieve 80% power to detect a 30% improvement between baseline and end of treatment in the primary bowel symptom score. This study recruited 53 subjects. With this sample size, the study had 80% power to detect a 0.8 SD in any of the outcomes.
Results
We screened 101 veterans with IBS and GWI; 39 veterans did not fulfill the inclusion/exclusion criteria, 22 declined to participate or did not complete the screening questionnaires and tests, and 9 were lost to follow-up. Sixty-two participants were randomized in a double-blind placebo-controlled study design; 9 dropped out before the end of the study. Data were analyzed from 53 veterans who completed the study, 29 in the placebo group and 24 in the probiotic group (Figure 1). The cohort was primarily male with a mean (SD) age of 55 (8) years (range, 42-73) (Table 1).
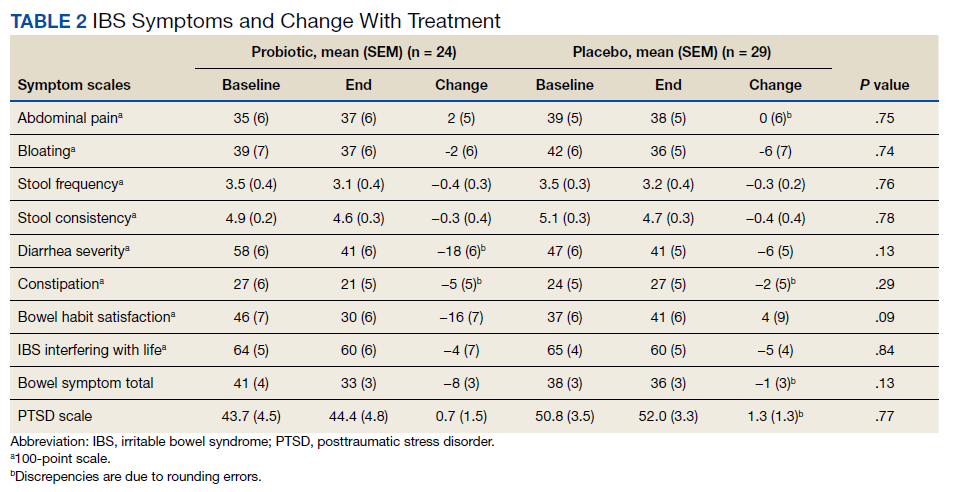
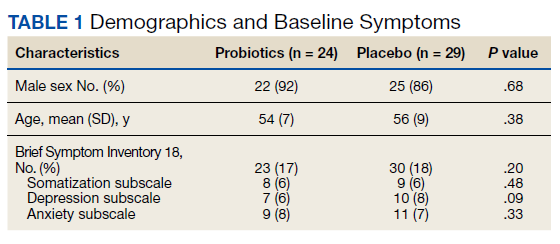
Overall, the treatment was well tolerated. All subjects were contacted every 2 weeks during the study to check for adverse effects, but no serious events were reported. There were no differences at baseline in any of the BSI-18 subscale scores in veterans between the groups. There was a greater mean (SEM) improvement of diarrhea severity in the probiotic group compared with the placebo group: 18 (6), a 31% improvement, vs 6 (5), a 13% improvement, respectively; however, the difference was not statistically significance (P = .13) (Table 2). There also was a greater mean (SEM) improvement in satisfaction of bowel habits in the probiotic group compared with the placebo group: 16 (7), a 35% improvement vs 4 (9), an 8% worsening; this also was not statistically significant (P = .09). There was no difference in the change of IBS-QOL before and after treatment in either group (Figure 2). There was no improvement in any of the symptoms of GWI (all P ≥ .06) (Appendix).
Discussion
GWI is a complex multisystem illness of unknown etiology. There was high prevalence of diarrhea during deployment, and veterans were exposed to several physical, environmental, and mental stresses of the war.3 A change in gut microbiota can occur during deployment due to diet changes, environmental and physical stress, and GI infections.29 These changes would suggest that manipulation of gut microbiota might offer a new modality of treatment of IBS and GWI. We evaluated the effect of a high-potency multistrain probiotic in veterans with IBS and GWI. We did not detect any statistically significant differences between the probiotic and placebo groups on bowel symptom score and individual symptoms of IBS and on QOL. Also, there was no improvement for the other symptoms of GWI. To our knowledge, this is the first study evaluating the effect of probiotics in veterans with IBS and GWI. Our results are consistent with the literature on probiotics and IBS.

The probiotic formulation used in our study has been evaluated in patients with IBS previously. Kim and colleagues found that after 8 weeks of treatment of patients with diarrhea-predominant IBS with VSL#3, there was improvement in bloating, but no effect was found on abdominal pain, gas, or urgency.30 A subsequent study by the same investigators on patients with all types of IBS found that VSL#3 showed no effect on abdominal pain, stool frequency and consistency, or on bloating, but there was improvement in flatulence.31 Another study that evaluated the effect of VSL#3 on symptoms of diarrhea-predominant IBS and QOL found improvement in IBS symptoms from baseline in both the probiotic and the placebo groups, but the difference between the 2 groups was not statistically significant.32 Similarly, Wong and colleagues performed a double-blind, placebo-controlled mechanistic study to evaluate the effect of VSL#3. They found improvement in bowel symptom score, abdominal pain intensity, and satisfaction with bowel habits with both the VSL#3 and placebo group but similar to our study, the differences were not statistically significant.
Several reviews have evaluated the efficacy of probiotics for IBS. A 2010 review found evidence that probiotics trended toward improved IBS symptoms compared with placebo.33 The 2014 follow-up by the same authors demonstrated that overall, probiotics improved global symptoms of IBS and multistrain probiotics were more effective.20 A third meta-analysis from the same group found evidence that multistrain probiotics seemed to have a beneficial effect but could not definitively conclude that probiotics are efficacious in improving IBS symptoms.34 Other authors also have seen inconsistent effects of probiotics compared with placebo on global symptoms, abdominal pain, and bloating after performing systematic reviews of the literature.35-38 Although several reviews support that multistrain probiotics are more effective, they fail to conclude which combinations are more efficacious.
The effect of probiotics on QOL has not been investigated by many studies.37 In our study, we did not find significant improvement in QOL in the probiotic group, which is in line with 2 previous studies that showed no effect on IBS QOL of VSL#3 vs placebo.32,39 Most of the research reports that multistrain probiotics are more effective than using a single strain.34,35,40Bifidobacterium and Lactobacillus are the most commonly used bacteria in the multistrain probiotics that have shown their positive effect on IBS.35,41 The probiotic used in our study contained other species along with these 2 microorganisms.
The dose and duration of treatment of probiotics also has been debated. In one meta-analysis, the investigators found that studies of ≥ 8 weeks were more likely to show a positive effect; 4 of the 7 studies with statistically significant improvement in IBS symptoms were longer than 8 weeks.35 However, another meta-analysis based on 35 randomized controlled trials found that there was not a statistically significant difference between groups treated for > 4 weeks vs < 4 weeks.42 In addition, another meta-analysis of VSL#3 on IBS in children and adults also found no difference in results based on the duration of treatment of probiotics.43 Similar to our study, 3 other studies of VSL#3 treated patients for 8 weeks and found no statistically significant effect.30-32 In the past, VSL#3 has been used at dosages of 450 or 900 billion bacteria per day.
An individual’s response to probiotics may depend on the subtype of IBS. However, most of the studies, like ours, included groups of all subtypes. It may be that probiotics are more effective in patients with moderate-to-severe symptoms. Most of our patients had milder symptoms, and we cannot discount how subjects with more severe disease may have responded to the drug. Interestingly, one study demonstrated that Lactobacillus was more effective in patients with moderately severe abdominal pain compared with mild symptoms.44
In our study, the probiotic did not improve PTSD symptoms or other extra-intestinal symptoms common in IBS and GWI. Similar to our study, Wong and colleagues did not find significant improvement of psychological and sleep scores after treatment with VSL#3.6 Similarly, there is evidence that alteration in gut microbiota is associated with health and diseases, but what specific alterations occur and whether they can be improved with probiotics remains unknown.45
Limitations
The inconsistent response to probiotics in various studies may be due to IBS heterogeneity. Furthermore, there are demographic differences between Gulf War veterans and patients enrolled in other studies: Gulf War veterans are predominantly male, many were deployed abroad and had a history of gastroenteritis during deployment, and were exposed to stressful situations.46 These factors may be involved in triggering or maintaining IBS in Gulf War veterans. A further limitation of our randomized trial is the relatively small sample size.
Conclusions
This study did not demonstrate statistically significant improvement in symptoms of IBS or improvement in QOL after treatment with a multistrain probiotic. We also did not find any improvement in symptoms of GWI or PTSD. There was no difference in psychological scores between the placebo and treatment groups, and it is unlikely that psychological factors confounded the response to treatment in this study.
The effectiveness of a probiotic may depend on the baseline gut microbiome of the individual and depend on the strain, amount, and frequency of bacteria used. A lack of response of the probiotics does not exclude gut viruses and fungi having a role in exacerbating GWI symptoms. It is also possible that the bacteria present or the dose of the probiotic used was not sufficient to improve symptoms. So far, the definitive benefit of probiotics has been demonstrated for only a few preparations, and none are approved by the US Food and Drug Administration for any disease. More research is needed to determine whether probiotics have any role in the treatment of IBS and GWI.
Acknowledgments
AKT received grant support from the US Department of Veterans Affairs and the US Department of Defense (W81XWH-10-1-0593, W81XWH-15-1-0636). We thank Keith G. Tolman, MD, for assistance in editing the initial proposal and for periodic consultation. We thank the manufacturer of the probiotic for supplying the active drug and the placebo. The manufacture of the probiotic had no role in the design and conduct of the study, analysis and interpretation of the data, and in the preparation of the manuscript.
1. O’Shea EF, Cotter PD, Stanton C, Ross RP, Hill C. Production of bioactive substances by intestinal bacteria as a basis for explaining probiotic mechanisms: bacteriocins and conjugated linoleic acid. Int J Food Microbiol. 2012;152(3):189-205. doi:10.1016/j.ijfoodmicro.2011.05.025.
2. Kamiya T, Wang L, Forsythe P, et al. Inhibitory effects of Lactobacillus reuteri on visceral pain induced by colorectal distension in Sprague-Dawley rats. Gut. 2006;55(2):191-196. doi:10.1136/gut.2005.070987.
3. Verdu EF, Bercik P, Verma-Gandhu M, et al. Specific probiotic therapy attenuates antibiotic induced visceral hypersensitivity in mice. Gut. 2006;55(2):182-190. doi:10.1136/gut.2005.066100
4. Ford AC, Harris LA, Lacy BE, Quigley EMM, Moayyedi P. Systematic review with meta-analysis: the efficacy of prebiotics, probiotics, synbiotics and antibiotics in irritable bowel syndrome. Aliment Pharmacol Ther. 2018;48(10):1044-1060. doi:10.1111/apt.15001.
5. Niu HL, Xiao JY. The efficacy and safety of probiotics in patients with irritable bowel syndrome: Evidence based on 35 randomized controlled trials. Int J Surg. 2020;75:116-127. doi:10.1016/j.ijsu.2020.01.142.
6. Wong RK, Yang C, Song GH, Wong J, Ho KY. Melatonin regulation as a possible mechanism for probiotic (VSL#3) in irritable bowel syndrome: a randomized double-blinded placebo study. Dig Dis Sci. 2015;60(1):186-194. doi:10.1007/s10620-014-3299-8.
7. Hyams KC, Bourgeois AL, Merrell BR, et al. Diarrheal disease during Operation Desert Shield. N Engl J Med. 1991;325(20):1423-1428. doi:10.1056/NEJM199111143252006 8. Clancy RL, Gleeson M, Cox A, et al. Reversal in fatigued athletes of a defect in interferon gamma secretion after administration of Lactobacillus acidophilus. Br J Sports Med. 2006;40(4):351-354. doi:10.1136/bjsm.2005.024364
9. Sullivan A, Nord CE, Evengard B. Effect of supplement with lactic-acid producing bacteria on fatigue and physical activity in patients with chronic fatigue syndrome. Nutr J. 2009;8:4. doi:10.1186/1475-2891-8-4
10. Pittayanon R, Lau JT, Yuan Y, et al. Gut microbiota in patients with irritable bowel syndrome—a systematic review. Gastroenterology. 2019;157(1):97-108. doi:10.1053/j.gastro.2019.03.049
11. Rao RK, Samak G. Protection and restitution of gut barrier by probiotics: nutritional and clinical implications. Curr Nutr Food Sci. 2013;9(2):99-107. doi:10.2174/1573401311309020004
12. O´Shea EF, Cotter PD, Stanton C, Ross RP, Hill C. Production of bioactive substances by intestinal bacteria as a basis for explaining probiotic mechanisms: bacteriocins and conjugated linoleic acid. Int J Food Microbiol. 2012;152(3):189-205. doi:10.1016/j.ijfoodmicro.2011.05.025
13. Kamiya T, Wang L, Forsythe P, et al. Inhibitory effects of Lactobacillus reuteri on visceral pain induced by colorectal distension in Sprague-Dawley rats. Gut. 2006;55(2):191-196. doi:10.1136/gut.2005.070987
14. Verdu EF, Bercik P, Verma-Gandhu M, et al. Specific probiotic therapy attenuates antibiotic induced visceral hypersensitivity in mice. Gut. 2006;55(2):182-190. doi:10.1136/gut.2005.06610015. O´Mahony L, McCarthy J, Kelly P, et al. Lactobacillus and bifidobacterium in irritable bowel syndrome: symptom responses and relationship to cytokine profiles. Gastroenterology. 2005;128(3):541-551. doi:10.1053/j.gastro.2004.11.050
16. Alhasson F, Das S, Seth R, et al. Altered gut microbiome in a mouse model of Gulf War Illness causes neuroinflammation and intestinal injury via leaky gut and TLR4 activation. PLoS One. 2017;12(3):e0172914. doi:10.1371/journal.pone.0172914.17. Janulewicz PA, Seth RK, Carlson JM, et al. The gut-microbiome in Gulf War veterans: a preliminary report. Int J Environ Res Public Health. 2019;16(19). doi:10.3390/ijerph16193751
18. Dang X, Xu M, Liu D, Zhou D, Yang W. Assessing the efficacy and safety of fecal microbiota transplantation and probiotic VSL#3 for active ulcerative colitis: a systematic review and meta-analysis. PLoS One. 2020;15(3):e0228846. doi:10.1371/journal.pone.0228846
19. Ford AC, Quigley EM, Lacy BE, et al. Efficacy of prebiotics, probiotics, and synbiotics in irritable bowel syndrome and chronic idiopathic constipation: systematic review and meta-analysis. Am J Gastroenterol. 2014;109(10):1547-1561; quiz 1546, 1562. doi:10.1038/ajg.2014.202
20. Rohatgi S, Ahuja V, Makharia GK, et al. VSL#3 induces and maintains short-term clinical response in patients with active microscopic colitis: a two-phase randomised clinical trial. BMJ Open Gastroenterol. 2015;2(1):e000018. doi:10.1136/bmjgast-2014-000018
21. Longstreth GF, Thompson WG, Chey WD, Houghton LA, Mearin F, Spiller RC. Functional bowel disorders. Gastroenterology. 2006;130(5):1480-1491. doi:10.1053/j.gastro.2005.11.061
22. Talley NJ, Phillips SF, Melton J, 3rd, Wiltgen C, Zinsmeister AR. A patient questionnaire to identify bowel disease. Ann Intern Med. 1989;111(8):671-674. doi:10.7326/0003-4819-111-8-671
23. Bensoussan A, Talley NJ, Hing M, Menzies R, Guo A, Ngu M. Treatment of irritable bowel syndrome with Chinese herbal medicine: a randomized controlled trial. JAMA. 1998;280(18):1585-1589. doi:10.1001/jama.280.18.1585
24. Francis CY, Morris J, Whorwell PJ. The irritable bowel severity scoring system: a simple method of monitoring irritable bowel syndrome and its progress. Aliment Pharmacol Ther. 1997;11(2):395-402. doi:10.1046/j.1365-2036.1997.142318000.x
25. Patrick DL, Drossman DA, Frederick IO, DiCesare J, Puder KL. Quality of life in persons with irritable bowel syndrome: development and validation of a new measure. Dig Dis Sci. 1998;43(2):400-411. doi:10.1023/a:1018831127942
26. Attanasio V, Andrasik F, Blanchard EB, Arena JG. Psychometric properties of the SUNYA revision of the Psychosomatic Symptom Checklist. J Behav Med. 1984;7(2):247-257. doi:10.1007/BF00845390
27. Weathers F, Litz B, Herman D, Huska J, Keane T. The PTSD Checklist (PCL): reliability, validity, and diagnostic utility. Accessed August 25, 2022. https://www.researchgate.net/publication/291448760_The_PTSD_Checklist_PCL_Reliability_validity_and_diagnostic_utility
28. Derogatis L. Brief Symptom Inventory-18 (BSI-18): Administration, Scoring, and Procedure Manual. Ed 3 ed. National Computer Systems; 2000.
29. Stamps BW, Lyon WJ, Irvin AP, Kelley-Loughnane N, Goodson MS. A pilot study of the effect of deployment on the gut microbiome and traveler´s diarrhea susceptibility. Front Cell Infect Microbiol. 2020;10:589297. doi:10.3389/fcimb.2020.589297
30. Kim HJ, Camilleri M, McKinzie S, et al. A randomized controlled trial of a probiotic, VSL#3, on gut transit and symptoms in diarrhoea-predominant irritable bowel syndrome. Aliment Pharmacol Ther. 2003;17(7):895-904. doi:10.1046/j.1365-2036.2003.01543.x
31. Kim HJ, Vazquez Roque MI, Camilleri M, et al. A randomized controlled trial of a probiotic combination VSL# 3 and placebo in irritable bowel syndrome with bloating. Neurogastroenterol Motil. 2005;17(5):687-696. doi:10.1111/j.1365-2982.2005.00695.x32. Michail S, Kenche H. Gut microbiota is not modified by randomized, double-blind, placebo-controlled trial of vsl#3 in diarrhea-predominant irritable bowel syndrome. Probiotics Antimicrob Proteins. 2011;3(1):1-7. doi:10.1007/s12602-010-9059-y
33. Moayyedi P, Ford AC, Talley NJ, et al. The efficacy of probiotics in the treatment of irritable bowel syndrome: a systematic review. Gut. 2010;59(3):325-332. doi:10.1136/gut.2008.167270

34. Ford AC, Harris LA, Lacy BE, Quigley EMM, Moayyedi P. Systematic review with meta-analysis: the efficacy of prebiotics, probiotics, synbiotics and antibiotics in irritable bowel syndrome. Aliment Pharmacol Ther. 2018;48(10):1044-1060. doi:10.1111/apt.15001
35. Dale HF, Rasmussen SH, Asiller OO, Lied GA. Probiotics in irritable bowel syndrome: an up-to-date systematic review. Nutrients. 2019;11(9). doi:10.3390/nu11092048
36. Didari T, Mozaffari S, Nikfar S, Abdollahi M. Effectiveness of probiotics in irritable bowel syndrome: Updated systematic review with meta-analysis. World J Gastroenterol. 2015;21(10):3072-84. doi:10.3748/wjg.v21.i10.3072
37. Hungin APS, Mitchell CR, Whorwell P, et al. Systematic review: probiotics in the management of lower gastrointestinal symptoms—an updated evidence-based international consensus. Aliment Pharmacol Ther. 2018;47(8):1054-1070. doi:10.1111/apt.14539
38. Niu HL, Xiao JY. The efficacy and safety of probiotics in patients with irritable bowel syndrome: evidence based on 35 randomized controlled trials. Int J Surg. 2020;75:116-127. doi:10.1016/j.ijsu.2020.01.142
39. Wong RK, Yang C, Song GH, Wong J, Ho KY. Melatonin regulation as a possible mechanism for probiotic (VSL#3) in irritable bowel syndrome: a randomized double-blinded placebo study. Dig Dis Sci. 2015;60(1):186-194. doi:10.1007/s10620-014-3299-8
40. Ford AC, Moayyedi P, Lacy BE, et al. American College of Gastroenterology monograph on the management of irritable bowel syndrome and chronic idiopathic constipation. Am J Gastroenterol. 2014;109(suppl 1):S2-26; quiz S27. doi: 10.1038/ajg.2014.187
41. Simren M, Barbara G, Flint HJ, et al. Intestinal microbiota in functional bowel disorders: a Rome foundation report. Gut. 2013;62(1):159-76. doi:10.1136/gutjnl-2012-302167
42. Ki Cha B, Mun Jung S, Hwan Choi C, et al. The effect of a multispecies probiotic mixture on the symptoms and fecal microbiota in diarrhea-dominant irritable bowel syndrome: a randomized, double-blind, placebo-controlled trial. J Clin Gastroenterol. 2012;46(3):220-7. doi:10.1097/MCG.0b013e31823712b1
43. Connell M, Shin A, James-Stevenson T, Xu H, Imperiale TF, Herron J. Systematic review and meta-analysis: Efficacy of patented probiotic, VSL#3, in irritable bowel syndrome. Neurogastroenterol Motil. 2018;30(12):e13427. doi:10.1111/nmo.13427
44. Lyra A, Hillila M, Huttunen T, et al. Irritable bowel syndrome symptom severity improves equally with probiotic and placebo. World J Gastroenterol. 2016;22(48):10631-10642. doi:10.3748/wjg.v22.i48.10631
45. Sanders ME, Guarner F, Guerrant R, et al. An update on the use and investigation of probiotics in health and disease. Gut. 2013;62(5):787-796. doi:10.1136/gutjnl-2012-302504
46. Tuteja AK. Deployment-associated functional gastrointestinal disorders: do we know the etiology? Dig Dis Sci. 2011;56(11):3109-3111. doi:10.1007/s10620-011-1856-y
About 700,000 US military personnel were deployed in Operation Desert Storm (August 1990 to March 1991).1 Almost 30 years since the war, a large number of these veterans continue to experience a complex of symptoms of unknown etiology called Gulf War illness (GWI), which significantly affects health and quality of life (QOL). The lack of clear etiology of the illness has impaired research to find specific treatments and has further exacerbated the stress among veterans. GWI typically includes a mixture of chronic headache, cognitive difficulties, widespread pain, unexplained fatigue, memory and concentration problems, as well as chronic respiratory and gastrointestinal (GI) symptoms.2 Abdominal pain and alteration of bowel habits are also symptoms typical of irritable bowel syndrome (IBS). It has been estimated that IBS occurs in up to 30% of Gulf War veterans.3
The etiology of IBS is unknown. Possible mechanisms include visceral hypersensitivity, altered gut motor function, aberrant brain-gut interaction, and psychological factors, perhaps with a genetic predisposition.4 Gastroenteritis has been reported as a triggering mechanism in up to one-third of patients with IBS.5 Gastroenteritis can alter the gut microbiota and has been reported to be a significant risk factor for the development of IBS.6 In one study of Operation Desert Shield soldiers, > 50% of military personnel developed acute gastroenteritis while on duty.7 A high prevalence of extra-intestinal symptoms also has been reported, including fatigue, headache, joint pains, and anxiety, in Gulf War veterans with IBS. These extra-intestinal symptoms of IBS are consistent with the reported GWI symptoms. Change in gut microbiota also has been associated with many of the extra-intestinal symptoms of IBS, especially fatigue.8,9 Gut microbiota are known to change with travel, stress, and a change in diet, all potential factors that are relevant to Gulf War veterans. This would suggest that an imbalance in the gut microbiota, ie, dysbiosis, may play a role in the pathogenesis of both IBS and GWI. Dysbiosis could be a risk factor for or alternatively a consequence of GWI.
A systematic review highlighted the heterogeneity of the gut microbiota in patients with IBS.10 Overall, Enterobacteriaceae, Lactobacillaceae, and Bacteroides were increased, whereas Clostridiales, Faecalibacterium, and Bifidobacterium were decreased in patients with IBS compared with controls. Gut microbiota also has been associated with cognitive changes, anxiety, and depression—symptoms associated with IBS and are part of the GWI.
If altered gut microbiota contributes to the etiopathogenesis of IBS, its restoration of with probiotics should help. Probiotics are live organisms that when ingested may improve health by promoting the growth of naturally occurring flora and establishing a healthy gut flora. Probiotics have several mechanisms of actions. Probiotics work in the lumen of the gut by producing antibacterial molecules and enhancing the mucosal barrier.11 Probiotics also may produce metabolic compounds that alter the intestinal microbiota and improve intestinal barrier function.12 Probiotics also have been shown to activate receptors in the enteric nervous system with the potential to promote pain relief in the setting of visceral hyperalgesia.13,14 The anti-inflammatory properties of probiotics potentially could modulate the basic pathophysiology of IBS and improve motility, visceral hypersensitivity, and brain-gut interaction.15 Furthermore, significant gut dysbiosis has been shown with GWI; suggesting that probiotics may have a role in its management.16,17
Probiotics have not been studied in Gulf War veterans with IBS. We performed a prospective, double-blind placebo-controlled study to determine the efficacy of a commercially available probiotic containing 8 strains of bacteria (De Simone Formulation; formally known as VSL#3 and Visbiome) on symptoms of IBS and GWI. This probiotic was selected as the overall literature suggested benefit of combination probiotics in IBS, and VSL#3 has been shown to be efficacious in ulcerative colitis and microscopic colitis.18-20
Methods
Veterans who served in Operation Desert Storm (August 1990 to March 1991) and enrolled at the George E. Wahlen Veterans Affairs (VA) Medical Center (GEWVAMC), Salt Lake City, Utah, were eligible for the study. The inclusion criteria were: veterans aged ≥ 35 years; ≥ 2 nonintestinal GWI symptoms (eg, fatigue, joint pains, insomnia, general stiffness, and headache); IBS diagnosis based on the Rome III criteria; IBS symptoms > 6 months; normal gross appearance of the colonic mucosa; negative markers for celiac disease and inflammatory bowel disease (IBD); normal thyroid function; and serum calcium levels.21 Those who had a clinically significant cardiac, pulmonary, hepatic or renal dysfunction; history of/or presence of systemic malignancy; current evidence of celiac disease or IBD; unstable/significant psychiatric disease; recent change in GI medications; current pregnancy; or use of antibiotics or probiotics within the past 1 month were excluded. Subjects were enrolled from a list of veterans with GWI from the GEWVAMC Gulf War registry; referrals to gastroenterology clinics for IBS from internal medicine clinics; and posted advertisements.
Protocol
After written informed consent was obtained, each veteran was verified to have IBS and ≥ 2 GWI symptoms. All veterans had the following tests and panels: complete blood count, erythrocyte sedimentation rate, serum comprehensive metabolic panel, thyroid-stimulating hormone, tissue transglutaminase, stool test for ova and parasite, giardia antigen, and clostridia toxins to exclude organic cause of GI symptoms. Colonoscopy was performed in all veterans to exclude IBD, and to rule out microscopic or lymphocytic colitis.
Randomization was computer generated and maintained by the study pharmacist so that study personnel and patients were blinded to the trial groups. All investigators were blinded and allocation was concealed. The medication was supplied in a numbered container by the pharmacist after patient enrollment. After a 2-week run-in period, veterans were randomized (1:1) to receive either 1 sachet of probiotic (De Simone Formulation; formally known as VSL#3 and Visbiome) or placebo once daily for 8 weeks.
Each probiotic packet contains 900 billion probiotic bacteria per sachet.11 This formulation contained 8 viable strains of bacteria: 4 strains of Lactobacillus (L acidophilus, L plantarum, L paracasei, L delbrueckii subsp. bulgaricus); 3 strains of Bifidobacteria (Bifidobacterium breve, B lactis, B infantis); and 1 strain of Streptococcus thermophilus. This formulation had been commercialized and studied as VSL#3 and is currently available in the United States under the Visbiome trade name. While branding changed during the study, the formulation did not. The investigational medicine (VSL#3, Visbiome, and placebo) were shipped from the manufacturer Dupont/Danisco in Madison, Wisconsin. The subjects received placebo or probiotic (VSL#3/Visbiome) and both were identical in appearance. The medication was supplied in a numbered container by the pharmacist after patient enrollment.
Measures
Veterans completed the bowel disease questionnaire to record baseline bowel habits.22 All veterans recorded daily bowel symptoms to confirm the presence of IBS during the 2-week pretreatment period, at baseline, and at the end of the 8-week treatment. The symptoms assessed included severity of abdominal pain (0, none to 100, severe); severity of bloating (0, none to 100, severe); stool frequency; Bristol stool scale (1, very hard to 7, watery); severity of diarrhea (0, none to 100, severe); severity of constipation (0, none to 100, severe); satisfaction with bowel habits (0, none to 100, severe); and IBS affecting or interfering with life (0, none to 100, severe). The bowel symptom score is the sum of the 5 symptom scores.23,24
IBS-specific QOL (IBS-QOL) was recorded at baseline and at the end of treatment.25 The IBS-QOL consists of a 34-item validated disease-specific questionnaire that measures 8 domains relevant to subjects with IBS: dysphoria, interference with activity, body image, health worry, food avoidance, social reaction, sexual life, and relationships. We used the Somatic Symptom Checklist to detect the following extra-intestinal symptoms that are common among veterans with GWI: headache, backache, wheeziness, insomnia, bad breath, fatigue, general stiffness, dizziness, weakness, sensitivity to hot and cold, palpitation, and tightness in chest. Subjects rated symptoms on a scale of 1 to 5: how often (1, none; 2, monthly; 3, once weekly; 4, several times weekly; 5, daily), and how bothersome (1, not at all to 5, extremely).26
Subjects completed the Posttraumatic Stress Disorder (PTSD) Checklist–Military, which is specific to military experience with 17 items on a 1 to 5 scale (1, not at all to 5, extremely). Scores were summed to produce a total symptom severity score (range, 17-85).27 Subjects also completed the Brief Symptom Inventory 18 (BSI-18) during the baseline evaluation.28 BSI-18 measures subjects’ reported overall psychological distress. It assesses 3 symptoms dimensions (somatization, depression, and anxiety) and a global severity index. The raw scores were transferred to normative T scores based on samples of nonpatient normal men and women.
Symptom data were compared after 8 weeks of treatment. The primary study endpoint was change in bowel symptom score. The secondary endpoints were mean change in symptoms, QOL, extra-intestinal symptoms, and PTSD score. The study was approved by the Salt Lake City Veterans Affairs Medical Center and the University of Utah Institutional Review Board and registered in ClinicalTrials.gov (NCT03078530).
Statistical Methods
Comparisons of the probiotic vs placebo groups for demographic variable were analyzed using a 2-sample t test for continuous variables, and with a χ2 test or Fisher exact test for categorical variables. The primary and secondary outcome variables were recorded daily for 2 weeks as pretreatment baseline and for 2 weeks at the end of treatment. These symptoms were recorded as ordered categorical variables, which were then averaged across the week to produce a continuous measurement for statistical analysis. For the primary outcome of GI symptoms, posttreatment comparisons were made between the study groups using a 2-sample t test of the baseline vs posttreatment values. All P values were calculated for 2-sided comparisons. The planned sample size in our study protocol was to recruit 40 individuals per group in order to achieve 80% power to detect a 30% improvement between baseline and end of treatment in the primary bowel symptom score. This study recruited 53 subjects. With this sample size, the study had 80% power to detect a 0.8 SD in any of the outcomes.
Results
We screened 101 veterans with IBS and GWI; 39 veterans did not fulfill the inclusion/exclusion criteria, 22 declined to participate or did not complete the screening questionnaires and tests, and 9 were lost to follow-up. Sixty-two participants were randomized in a double-blind placebo-controlled study design; 9 dropped out before the end of the study. Data were analyzed from 53 veterans who completed the study, 29 in the placebo group and 24 in the probiotic group (Figure 1). The cohort was primarily male with a mean (SD) age of 55 (8) years (range, 42-73) (Table 1).
Overall, the treatment was well tolerated. All subjects were contacted every 2 weeks during the study to check for adverse effects, but no serious events were reported. There were no differences at baseline in any of the BSI-18 subscale scores in veterans between the groups. There was a greater mean (SEM) improvement of diarrhea severity in the probiotic group compared with the placebo group: 18 (6), a 31% improvement, vs 6 (5), a 13% improvement, respectively; however, the difference was not statistically significance (P = .13) (Table 2). There also was a greater mean (SEM) improvement in satisfaction of bowel habits in the probiotic group compared with the placebo group: 16 (7), a 35% improvement vs 4 (9), an 8% worsening; this also was not statistically significant (P = .09). There was no difference in the change of IBS-QOL before and after treatment in either group (Figure 2). There was no improvement in any of the symptoms of GWI (all P ≥ .06) (Appendix).
Discussion
GWI is a complex multisystem illness of unknown etiology. There was high prevalence of diarrhea during deployment, and veterans were exposed to several physical, environmental, and mental stresses of the war.3 A change in gut microbiota can occur during deployment due to diet changes, environmental and physical stress, and GI infections.29 These changes would suggest that manipulation of gut microbiota might offer a new modality of treatment of IBS and GWI. We evaluated the effect of a high-potency multistrain probiotic in veterans with IBS and GWI. We did not detect any statistically significant differences between the probiotic and placebo groups on bowel symptom score and individual symptoms of IBS and on QOL. Also, there was no improvement for the other symptoms of GWI. To our knowledge, this is the first study evaluating the effect of probiotics in veterans with IBS and GWI. Our results are consistent with the literature on probiotics and IBS.
The probiotic formulation used in our study has been evaluated in patients with IBS previously. Kim and colleagues found that after 8 weeks of treatment of patients with diarrhea-predominant IBS with VSL#3, there was improvement in bloating, but no effect was found on abdominal pain, gas, or urgency.30 A subsequent study by the same investigators on patients with all types of IBS found that VSL#3 showed no effect on abdominal pain, stool frequency and consistency, or on bloating, but there was improvement in flatulence.31 Another study that evaluated the effect of VSL#3 on symptoms of diarrhea-predominant IBS and QOL found improvement in IBS symptoms from baseline in both the probiotic and the placebo groups, but the difference between the 2 groups was not statistically significant.32 Similarly, Wong and colleagues performed a double-blind, placebo-controlled mechanistic study to evaluate the effect of VSL#3. They found improvement in bowel symptom score, abdominal pain intensity, and satisfaction with bowel habits with both the VSL#3 and placebo group but similar to our study, the differences were not statistically significant.
Several reviews have evaluated the efficacy of probiotics for IBS. A 2010 review found evidence that probiotics trended toward improved IBS symptoms compared with placebo.33 The 2014 follow-up by the same authors demonstrated that overall, probiotics improved global symptoms of IBS and multistrain probiotics were more effective.20 A third meta-analysis from the same group found evidence that multistrain probiotics seemed to have a beneficial effect but could not definitively conclude that probiotics are efficacious in improving IBS symptoms.34 Other authors also have seen inconsistent effects of probiotics compared with placebo on global symptoms, abdominal pain, and bloating after performing systematic reviews of the literature.35-38 Although several reviews support that multistrain probiotics are more effective, they fail to conclude which combinations are more efficacious.
The effect of probiotics on QOL has not been investigated by many studies.37 In our study, we did not find significant improvement in QOL in the probiotic group, which is in line with 2 previous studies that showed no effect on IBS QOL of VSL#3 vs placebo.32,39 Most of the research reports that multistrain probiotics are more effective than using a single strain.34,35,40Bifidobacterium and Lactobacillus are the most commonly used bacteria in the multistrain probiotics that have shown their positive effect on IBS.35,41 The probiotic used in our study contained other species along with these 2 microorganisms.
The dose and duration of treatment of probiotics also has been debated. In one meta-analysis, the investigators found that studies of ≥ 8 weeks were more likely to show a positive effect; 4 of the 7 studies with statistically significant improvement in IBS symptoms were longer than 8 weeks.35 However, another meta-analysis based on 35 randomized controlled trials found that there was not a statistically significant difference between groups treated for > 4 weeks vs < 4 weeks.42 In addition, another meta-analysis of VSL#3 on IBS in children and adults also found no difference in results based on the duration of treatment of probiotics.43 Similar to our study, 3 other studies of VSL#3 treated patients for 8 weeks and found no statistically significant effect.30-32 In the past, VSL#3 has been used at dosages of 450 or 900 billion bacteria per day.
An individual’s response to probiotics may depend on the subtype of IBS. However, most of the studies, like ours, included groups of all subtypes. It may be that probiotics are more effective in patients with moderate-to-severe symptoms. Most of our patients had milder symptoms, and we cannot discount how subjects with more severe disease may have responded to the drug. Interestingly, one study demonstrated that Lactobacillus was more effective in patients with moderately severe abdominal pain compared with mild symptoms.44
In our study, the probiotic did not improve PTSD symptoms or other extra-intestinal symptoms common in IBS and GWI. Similar to our study, Wong and colleagues did not find significant improvement of psychological and sleep scores after treatment with VSL#3.6 Similarly, there is evidence that alteration in gut microbiota is associated with health and diseases, but what specific alterations occur and whether they can be improved with probiotics remains unknown.45
Limitations
The inconsistent response to probiotics in various studies may be due to IBS heterogeneity. Furthermore, there are demographic differences between Gulf War veterans and patients enrolled in other studies: Gulf War veterans are predominantly male, many were deployed abroad and had a history of gastroenteritis during deployment, and were exposed to stressful situations.46 These factors may be involved in triggering or maintaining IBS in Gulf War veterans. A further limitation of our randomized trial is the relatively small sample size.
Conclusions
This study did not demonstrate statistically significant improvement in symptoms of IBS or improvement in QOL after treatment with a multistrain probiotic. We also did not find any improvement in symptoms of GWI or PTSD. There was no difference in psychological scores between the placebo and treatment groups, and it is unlikely that psychological factors confounded the response to treatment in this study.
The effectiveness of a probiotic may depend on the baseline gut microbiome of the individual and depend on the strain, amount, and frequency of bacteria used. A lack of response of the probiotics does not exclude gut viruses and fungi having a role in exacerbating GWI symptoms. It is also possible that the bacteria present or the dose of the probiotic used was not sufficient to improve symptoms. So far, the definitive benefit of probiotics has been demonstrated for only a few preparations, and none are approved by the US Food and Drug Administration for any disease. More research is needed to determine whether probiotics have any role in the treatment of IBS and GWI.
Acknowledgments
AKT received grant support from the US Department of Veterans Affairs and the US Department of Defense (W81XWH-10-1-0593, W81XWH-15-1-0636). We thank Keith G. Tolman, MD, for assistance in editing the initial proposal and for periodic consultation. We thank the manufacturer of the probiotic for supplying the active drug and the placebo. The manufacture of the probiotic had no role in the design and conduct of the study, analysis and interpretation of the data, and in the preparation of the manuscript.
1. O’Shea EF, Cotter PD, Stanton C, Ross RP, Hill C. Production of bioactive substances by intestinal bacteria as a basis for explaining probiotic mechanisms: bacteriocins and conjugated linoleic acid. Int J Food Microbiol. 2012;152(3):189-205. doi:10.1016/j.ijfoodmicro.2011.05.025.
2. Kamiya T, Wang L, Forsythe P, et al. Inhibitory effects of Lactobacillus reuteri on visceral pain induced by colorectal distension in Sprague-Dawley rats. Gut. 2006;55(2):191-196. doi:10.1136/gut.2005.070987.
3. Verdu EF, Bercik P, Verma-Gandhu M, et al. Specific probiotic therapy attenuates antibiotic induced visceral hypersensitivity in mice. Gut. 2006;55(2):182-190. doi:10.1136/gut.2005.066100
4. Ford AC, Harris LA, Lacy BE, Quigley EMM, Moayyedi P. Systematic review with meta-analysis: the efficacy of prebiotics, probiotics, synbiotics and antibiotics in irritable bowel syndrome. Aliment Pharmacol Ther. 2018;48(10):1044-1060. doi:10.1111/apt.15001.
5. Niu HL, Xiao JY. The efficacy and safety of probiotics in patients with irritable bowel syndrome: Evidence based on 35 randomized controlled trials. Int J Surg. 2020;75:116-127. doi:10.1016/j.ijsu.2020.01.142.
6. Wong RK, Yang C, Song GH, Wong J, Ho KY. Melatonin regulation as a possible mechanism for probiotic (VSL#3) in irritable bowel syndrome: a randomized double-blinded placebo study. Dig Dis Sci. 2015;60(1):186-194. doi:10.1007/s10620-014-3299-8.
7. Hyams KC, Bourgeois AL, Merrell BR, et al. Diarrheal disease during Operation Desert Shield. N Engl J Med. 1991;325(20):1423-1428. doi:10.1056/NEJM199111143252006 8. Clancy RL, Gleeson M, Cox A, et al. Reversal in fatigued athletes of a defect in interferon gamma secretion after administration of Lactobacillus acidophilus. Br J Sports Med. 2006;40(4):351-354. doi:10.1136/bjsm.2005.024364
9. Sullivan A, Nord CE, Evengard B. Effect of supplement with lactic-acid producing bacteria on fatigue and physical activity in patients with chronic fatigue syndrome. Nutr J. 2009;8:4. doi:10.1186/1475-2891-8-4
10. Pittayanon R, Lau JT, Yuan Y, et al. Gut microbiota in patients with irritable bowel syndrome—a systematic review. Gastroenterology. 2019;157(1):97-108. doi:10.1053/j.gastro.2019.03.049
11. Rao RK, Samak G. Protection and restitution of gut barrier by probiotics: nutritional and clinical implications. Curr Nutr Food Sci. 2013;9(2):99-107. doi:10.2174/1573401311309020004
12. O´Shea EF, Cotter PD, Stanton C, Ross RP, Hill C. Production of bioactive substances by intestinal bacteria as a basis for explaining probiotic mechanisms: bacteriocins and conjugated linoleic acid. Int J Food Microbiol. 2012;152(3):189-205. doi:10.1016/j.ijfoodmicro.2011.05.025
13. Kamiya T, Wang L, Forsythe P, et al. Inhibitory effects of Lactobacillus reuteri on visceral pain induced by colorectal distension in Sprague-Dawley rats. Gut. 2006;55(2):191-196. doi:10.1136/gut.2005.070987
14. Verdu EF, Bercik P, Verma-Gandhu M, et al. Specific probiotic therapy attenuates antibiotic induced visceral hypersensitivity in mice. Gut. 2006;55(2):182-190. doi:10.1136/gut.2005.06610015. O´Mahony L, McCarthy J, Kelly P, et al. Lactobacillus and bifidobacterium in irritable bowel syndrome: symptom responses and relationship to cytokine profiles. Gastroenterology. 2005;128(3):541-551. doi:10.1053/j.gastro.2004.11.050
16. Alhasson F, Das S, Seth R, et al. Altered gut microbiome in a mouse model of Gulf War Illness causes neuroinflammation and intestinal injury via leaky gut and TLR4 activation. PLoS One. 2017;12(3):e0172914. doi:10.1371/journal.pone.0172914.17. Janulewicz PA, Seth RK, Carlson JM, et al. The gut-microbiome in Gulf War veterans: a preliminary report. Int J Environ Res Public Health. 2019;16(19). doi:10.3390/ijerph16193751
18. Dang X, Xu M, Liu D, Zhou D, Yang W. Assessing the efficacy and safety of fecal microbiota transplantation and probiotic VSL#3 for active ulcerative colitis: a systematic review and meta-analysis. PLoS One. 2020;15(3):e0228846. doi:10.1371/journal.pone.0228846
19. Ford AC, Quigley EM, Lacy BE, et al. Efficacy of prebiotics, probiotics, and synbiotics in irritable bowel syndrome and chronic idiopathic constipation: systematic review and meta-analysis. Am J Gastroenterol. 2014;109(10):1547-1561; quiz 1546, 1562. doi:10.1038/ajg.2014.202
20. Rohatgi S, Ahuja V, Makharia GK, et al. VSL#3 induces and maintains short-term clinical response in patients with active microscopic colitis: a two-phase randomised clinical trial. BMJ Open Gastroenterol. 2015;2(1):e000018. doi:10.1136/bmjgast-2014-000018
21. Longstreth GF, Thompson WG, Chey WD, Houghton LA, Mearin F, Spiller RC. Functional bowel disorders. Gastroenterology. 2006;130(5):1480-1491. doi:10.1053/j.gastro.2005.11.061
22. Talley NJ, Phillips SF, Melton J, 3rd, Wiltgen C, Zinsmeister AR. A patient questionnaire to identify bowel disease. Ann Intern Med. 1989;111(8):671-674. doi:10.7326/0003-4819-111-8-671
23. Bensoussan A, Talley NJ, Hing M, Menzies R, Guo A, Ngu M. Treatment of irritable bowel syndrome with Chinese herbal medicine: a randomized controlled trial. JAMA. 1998;280(18):1585-1589. doi:10.1001/jama.280.18.1585
24. Francis CY, Morris J, Whorwell PJ. The irritable bowel severity scoring system: a simple method of monitoring irritable bowel syndrome and its progress. Aliment Pharmacol Ther. 1997;11(2):395-402. doi:10.1046/j.1365-2036.1997.142318000.x
25. Patrick DL, Drossman DA, Frederick IO, DiCesare J, Puder KL. Quality of life in persons with irritable bowel syndrome: development and validation of a new measure. Dig Dis Sci. 1998;43(2):400-411. doi:10.1023/a:1018831127942
26. Attanasio V, Andrasik F, Blanchard EB, Arena JG. Psychometric properties of the SUNYA revision of the Psychosomatic Symptom Checklist. J Behav Med. 1984;7(2):247-257. doi:10.1007/BF00845390
27. Weathers F, Litz B, Herman D, Huska J, Keane T. The PTSD Checklist (PCL): reliability, validity, and diagnostic utility. Accessed August 25, 2022. https://www.researchgate.net/publication/291448760_The_PTSD_Checklist_PCL_Reliability_validity_and_diagnostic_utility
28. Derogatis L. Brief Symptom Inventory-18 (BSI-18): Administration, Scoring, and Procedure Manual. Ed 3 ed. National Computer Systems; 2000.
29. Stamps BW, Lyon WJ, Irvin AP, Kelley-Loughnane N, Goodson MS. A pilot study of the effect of deployment on the gut microbiome and traveler´s diarrhea susceptibility. Front Cell Infect Microbiol. 2020;10:589297. doi:10.3389/fcimb.2020.589297
30. Kim HJ, Camilleri M, McKinzie S, et al. A randomized controlled trial of a probiotic, VSL#3, on gut transit and symptoms in diarrhoea-predominant irritable bowel syndrome. Aliment Pharmacol Ther. 2003;17(7):895-904. doi:10.1046/j.1365-2036.2003.01543.x
31. Kim HJ, Vazquez Roque MI, Camilleri M, et al. A randomized controlled trial of a probiotic combination VSL# 3 and placebo in irritable bowel syndrome with bloating. Neurogastroenterol Motil. 2005;17(5):687-696. doi:10.1111/j.1365-2982.2005.00695.x32. Michail S, Kenche H. Gut microbiota is not modified by randomized, double-blind, placebo-controlled trial of vsl#3 in diarrhea-predominant irritable bowel syndrome. Probiotics Antimicrob Proteins. 2011;3(1):1-7. doi:10.1007/s12602-010-9059-y
33. Moayyedi P, Ford AC, Talley NJ, et al. The efficacy of probiotics in the treatment of irritable bowel syndrome: a systematic review. Gut. 2010;59(3):325-332. doi:10.1136/gut.2008.167270
34. Ford AC, Harris LA, Lacy BE, Quigley EMM, Moayyedi P. Systematic review with meta-analysis: the efficacy of prebiotics, probiotics, synbiotics and antibiotics in irritable bowel syndrome. Aliment Pharmacol Ther. 2018;48(10):1044-1060. doi:10.1111/apt.15001
35. Dale HF, Rasmussen SH, Asiller OO, Lied GA. Probiotics in irritable bowel syndrome: an up-to-date systematic review. Nutrients. 2019;11(9). doi:10.3390/nu11092048
36. Didari T, Mozaffari S, Nikfar S, Abdollahi M. Effectiveness of probiotics in irritable bowel syndrome: Updated systematic review with meta-analysis. World J Gastroenterol. 2015;21(10):3072-84. doi:10.3748/wjg.v21.i10.3072
37. Hungin APS, Mitchell CR, Whorwell P, et al. Systematic review: probiotics in the management of lower gastrointestinal symptoms—an updated evidence-based international consensus. Aliment Pharmacol Ther. 2018;47(8):1054-1070. doi:10.1111/apt.14539
38. Niu HL, Xiao JY. The efficacy and safety of probiotics in patients with irritable bowel syndrome: evidence based on 35 randomized controlled trials. Int J Surg. 2020;75:116-127. doi:10.1016/j.ijsu.2020.01.142
39. Wong RK, Yang C, Song GH, Wong J, Ho KY. Melatonin regulation as a possible mechanism for probiotic (VSL#3) in irritable bowel syndrome: a randomized double-blinded placebo study. Dig Dis Sci. 2015;60(1):186-194. doi:10.1007/s10620-014-3299-8
40. Ford AC, Moayyedi P, Lacy BE, et al. American College of Gastroenterology monograph on the management of irritable bowel syndrome and chronic idiopathic constipation. Am J Gastroenterol. 2014;109(suppl 1):S2-26; quiz S27. doi: 10.1038/ajg.2014.187
41. Simren M, Barbara G, Flint HJ, et al. Intestinal microbiota in functional bowel disorders: a Rome foundation report. Gut. 2013;62(1):159-76. doi:10.1136/gutjnl-2012-302167
42. Ki Cha B, Mun Jung S, Hwan Choi C, et al. The effect of a multispecies probiotic mixture on the symptoms and fecal microbiota in diarrhea-dominant irritable bowel syndrome: a randomized, double-blind, placebo-controlled trial. J Clin Gastroenterol. 2012;46(3):220-7. doi:10.1097/MCG.0b013e31823712b1
43. Connell M, Shin A, James-Stevenson T, Xu H, Imperiale TF, Herron J. Systematic review and meta-analysis: Efficacy of patented probiotic, VSL#3, in irritable bowel syndrome. Neurogastroenterol Motil. 2018;30(12):e13427. doi:10.1111/nmo.13427
44. Lyra A, Hillila M, Huttunen T, et al. Irritable bowel syndrome symptom severity improves equally with probiotic and placebo. World J Gastroenterol. 2016;22(48):10631-10642. doi:10.3748/wjg.v22.i48.10631
45. Sanders ME, Guarner F, Guerrant R, et al. An update on the use and investigation of probiotics in health and disease. Gut. 2013;62(5):787-796. doi:10.1136/gutjnl-2012-302504
46. Tuteja AK. Deployment-associated functional gastrointestinal disorders: do we know the etiology? Dig Dis Sci. 2011;56(11):3109-3111. doi:10.1007/s10620-011-1856-y
Margin Size for Unique Skin Tumors Treated With Mohs Micrographic Surgery: A Survey of Practice Patterns
Mohs micrographic surgery (MMS) is most commonly used for the surgical management of squamous cell carcinomas (SCCs) and basal cell carcinomas (BCCs) in high-risk locations. The ability for 100% margin evaluation with MMS also has shown lower recurrence rates compared with wide local excision for less common and/or more aggressive tumors. However, there is a lack of standardization on initial and subsequent margin size when treating these less common skin tumors, such as dermatofibrosarcoma protuberans (DFSP), atypical fibroxanthoma (AFX), and sebaceous carcinoma.
Because Mohs surgeons must balance normal tissue preservation with the importance of tumor clearance in the context of comprehensive margin control, we aimed to assess the practice patterns of Mohs surgeons regarding margin size for these unique tumors. The average margin size for each Mohs layer has been reported to be 1 to 3 mm for BCC compared with 3 to 6 mm or larger for other skin cancers, such as melanoma in situ (MIS).1-3 We hypothesized that the initial margin size would vary among surgeons and likely be greater for more aggressive and rarer malignancies as well as for lesions on the trunk and extremities.
Methods
A descriptive survey was created using SurveyMonkey and distributed to members of the American College of Mohs Surgery (ACMS). Survey participants and their responses were anonymous. Demographic information on survey participants was collected in addition to initial and subsequent MMS margin size for DFSP, AFX, MIS, invasive melanoma, sebaceous carcinoma, microcystic adnexal carcinoma (MAC), poorly differentiated SCC, Merkel cell carcinoma, extramammary Paget disease, leiomyosarcoma, and endocrine mucin-producing sweat gland carcinoma. Survey participants were asked to choose from a range of margin sizes: 1 to 3 mm, 4 to 6 mm, 7 to 9 mm, and greater than 9 mm. This study was approved by the University of Texas Southwest Medical Center (Dallas, Texas) institutional review board.
Results
Eighty-seven respondents from the ACMS listserve completed the survey (response rate <10%). Of these, 58 respondents (66.7%) reported practicing for more than 5 years, and 58 (66.7%) were male. Practice setting was primarily private/community (71.3% [62/87]), and survey respondents were located across the United States. More than 50% of survey respondents treated the following tumors on the head and neck in their respective practices: DFSP (80.9% [55/68]), AFX (95.6% [65/68]), MIS (67.7% [46/68]), sebaceous carcinoma (92.7% [63/68]), MAC (83.8% [57/68]), poorly differentiated SCC (97.1% [66/68]), and endocrine mucin-producing sweat gland carcinoma (51.5% [35/68]). More than 50% of survey respondents treated the following tumors on the trunk and extremities: DFSP (90.3% [47/52]), AFX (86.4% [45/52]), MIS (55.8% [29/52]), sebaceous carcinoma (80.8% [42/52]), MAC (73.1% [38/52]), poorly differentiated SCC (94.2% [49/52]), and extramammary Paget disease (53.9% [28/52]). Invasive melanoma, Merkel cell carcinoma, and leiomyosarcoma were overall less commonly treated.
In general, respondent Mohs surgeons were more likely to take larger initial and subsequent margins for tumors treated on the trunk and extremities compared with the head and neck (Table). In addition, initial margin size often was larger than the 1- to 3-mm margin commonly used in Mohs surgery for BCCs and less aggressive SCCs (Table). A larger initial margin size (>9 mm) and subsequent margin size (4–6 mm) was more commonly reported for certain tumors known to be more aggressive and/or have extensive subclinical extension, such as DFSP and invasive melanoma. Of note, most respondents performed 4- to 6-mm margins (37/67 [55.2%]) for poorly differentiated SCC. Overall, there was a high range of margin size variability among Mohs surgeons for these unique and/or more aggressive skin tumors.


Comment
Given that no guidelines exist on margins with MMS for less commonly treated skin tumors, this study helps give Mohs surgeons perspective on current practice patterns for both initial and subsequent Mohs margin sizes. High margin-size variability among Mohs surgeons is expected, as surgeons also need to account for high-risk features of the tumor or specific locations where tissue sparing is critical. Overall, Mohs surgeons are more likely to take larger initial margins for these less common skin tumors compared with BCCs or SCCs. Initial margin size was consistently larger on the trunk and extremities where tissue sparing often is less critical.
Our survey was limited by a small sample size and incomplete response of the ACMS membership. In addition, most respondents practiced in a private/community setting, which may have led to bias, as academic centers may manage rare malignancies more commonly and/or have increased access to immunostains and multispecialty care. Future registries for rare skin malignancies will hopefully be developed that will allow for further consensus on standardized margins. Additional studies on the average number of stages required to clear these less common tumors also are warranted.
- Muller FM, Dawe RS, Moseley H, et al. Randomized comparison of Mohs micrographic surgery and surgical excision for small nodular basal cell carcinoma: tissue‐sparing outcome. Dermatol Surg. 2009;35:1349-1354.
- van Loo E, Mosterd K, Krekels GA, et al. Surgical excision versus Mohs’ micrographic surgery for basal cell carcinoma of the face: a randomised clinical trial with 10 year follow-up. Eur J Cancer. 2014;50:3011-3020.
- Ellison PM, Zitelli JA, Brodland DG. Mohs micrographic surgery for melanoma: a prospective multicenter study. J Am Acad Dermatol. 2019;81:767-774.
Mohs micrographic surgery (MMS) is most commonly used for the surgical management of squamous cell carcinomas (SCCs) and basal cell carcinomas (BCCs) in high-risk locations. The ability for 100% margin evaluation with MMS also has shown lower recurrence rates compared with wide local excision for less common and/or more aggressive tumors. However, there is a lack of standardization on initial and subsequent margin size when treating these less common skin tumors, such as dermatofibrosarcoma protuberans (DFSP), atypical fibroxanthoma (AFX), and sebaceous carcinoma.
Because Mohs surgeons must balance normal tissue preservation with the importance of tumor clearance in the context of comprehensive margin control, we aimed to assess the practice patterns of Mohs surgeons regarding margin size for these unique tumors. The average margin size for each Mohs layer has been reported to be 1 to 3 mm for BCC compared with 3 to 6 mm or larger for other skin cancers, such as melanoma in situ (MIS).1-3 We hypothesized that the initial margin size would vary among surgeons and likely be greater for more aggressive and rarer malignancies as well as for lesions on the trunk and extremities.
Methods
A descriptive survey was created using SurveyMonkey and distributed to members of the American College of Mohs Surgery (ACMS). Survey participants and their responses were anonymous. Demographic information on survey participants was collected in addition to initial and subsequent MMS margin size for DFSP, AFX, MIS, invasive melanoma, sebaceous carcinoma, microcystic adnexal carcinoma (MAC), poorly differentiated SCC, Merkel cell carcinoma, extramammary Paget disease, leiomyosarcoma, and endocrine mucin-producing sweat gland carcinoma. Survey participants were asked to choose from a range of margin sizes: 1 to 3 mm, 4 to 6 mm, 7 to 9 mm, and greater than 9 mm. This study was approved by the University of Texas Southwest Medical Center (Dallas, Texas) institutional review board.
Results
Eighty-seven respondents from the ACMS listserve completed the survey (response rate <10%). Of these, 58 respondents (66.7%) reported practicing for more than 5 years, and 58 (66.7%) were male. Practice setting was primarily private/community (71.3% [62/87]), and survey respondents were located across the United States. More than 50% of survey respondents treated the following tumors on the head and neck in their respective practices: DFSP (80.9% [55/68]), AFX (95.6% [65/68]), MIS (67.7% [46/68]), sebaceous carcinoma (92.7% [63/68]), MAC (83.8% [57/68]), poorly differentiated SCC (97.1% [66/68]), and endocrine mucin-producing sweat gland carcinoma (51.5% [35/68]). More than 50% of survey respondents treated the following tumors on the trunk and extremities: DFSP (90.3% [47/52]), AFX (86.4% [45/52]), MIS (55.8% [29/52]), sebaceous carcinoma (80.8% [42/52]), MAC (73.1% [38/52]), poorly differentiated SCC (94.2% [49/52]), and extramammary Paget disease (53.9% [28/52]). Invasive melanoma, Merkel cell carcinoma, and leiomyosarcoma were overall less commonly treated.
In general, respondent Mohs surgeons were more likely to take larger initial and subsequent margins for tumors treated on the trunk and extremities compared with the head and neck (Table). In addition, initial margin size often was larger than the 1- to 3-mm margin commonly used in Mohs surgery for BCCs and less aggressive SCCs (Table). A larger initial margin size (>9 mm) and subsequent margin size (4–6 mm) was more commonly reported for certain tumors known to be more aggressive and/or have extensive subclinical extension, such as DFSP and invasive melanoma. Of note, most respondents performed 4- to 6-mm margins (37/67 [55.2%]) for poorly differentiated SCC. Overall, there was a high range of margin size variability among Mohs surgeons for these unique and/or more aggressive skin tumors.
Comment
Given that no guidelines exist on margins with MMS for less commonly treated skin tumors, this study helps give Mohs surgeons perspective on current practice patterns for both initial and subsequent Mohs margin sizes. High margin-size variability among Mohs surgeons is expected, as surgeons also need to account for high-risk features of the tumor or specific locations where tissue sparing is critical. Overall, Mohs surgeons are more likely to take larger initial margins for these less common skin tumors compared with BCCs or SCCs. Initial margin size was consistently larger on the trunk and extremities where tissue sparing often is less critical.
Our survey was limited by a small sample size and incomplete response of the ACMS membership. In addition, most respondents practiced in a private/community setting, which may have led to bias, as academic centers may manage rare malignancies more commonly and/or have increased access to immunostains and multispecialty care. Future registries for rare skin malignancies will hopefully be developed that will allow for further consensus on standardized margins. Additional studies on the average number of stages required to clear these less common tumors also are warranted.
- Muller FM, Dawe RS, Moseley H, et al. Randomized comparison of Mohs micrographic surgery and surgical excision for small nodular basal cell carcinoma: tissue‐sparing outcome. Dermatol Surg. 2009;35:1349-1354.
- van Loo E, Mosterd K, Krekels GA, et al. Surgical excision versus Mohs’ micrographic surgery for basal cell carcinoma of the face: a randomised clinical trial with 10 year follow-up. Eur J Cancer. 2014;50:3011-3020.
- Ellison PM, Zitelli JA, Brodland DG. Mohs micrographic surgery for melanoma: a prospective multicenter study. J Am Acad Dermatol. 2019;81:767-774.
Practice Points
- It is common for initial margin size for uncommon skin tumors to be larger than the 1 to 3 mm commonly used in Mohs surgery for basal cell carcinomas and less aggressive squamous cell carcinomas.
- Mohs surgeons commonly take larger starting and subsequent margins for uncommon skin tumors treated on the trunk and extremities compared with the head and neck.