User login
Utilization and Cost of Veterans Health Administration Referrals to Community Care-Based Physical Therapy
Utilization and Cost of Veterans Health Administration Referrals to Community Care-Based Physical Therapy
The Veterans Health Administration (VHA) is the largest US integrated health system, providing care to veterans through VHA and non-VHA practitioners and facilities.1,2 Providing high-quality, timely, and veteran-centric care remains a priority for the VHA. Legislative efforts have expanded opportunities for eligible veterans to receive care in the community purchased by VHA, known as community care (CC).1 The Veterans Access, Choice, and Accountability Act of 2014 came in response to reports of long wait times and drive times for patients.3-5 The MISSION Act of 2018 expanded access to CC by streamlining it and broadening eligibility criteria, especially for veterans in rural communities who often experience more barriers in accessing care than veterans living in urban communities.1,6-10 Since the implementation of the Choice and MISSION Acts, > 2.7 million veterans have received care through community practitioners within the VHA CC network.11
Background
Increased access to CC could benefit veterans living in rural communities by increasing care options and circumventing challenges to accessing VHA care (ie, geographic, transportation, and distance barriers, practitioner and specialist shortages, and hospital closures). 5,9,10,12,13 However, health care system deficits in rural areas could also limit CC effectiveness for veterans living in those communities. 3 Other challenges posed by using CC include care coordination, information sharing, care continuity, delayed payments to CC practitioners, and mixed findings regarding CC quality.5,8,13,14 VHA practitioners are specifically trained to meet the multifaceted needs unique to veterans’ health and subculture, training CC practitioners may not receive.5,15
CC offers services for primary care and a broad range of specialties, including rehabilitation services such as physical therapy (PT).6 PT is used for the effective treatment of various conditions veterans experience and promote wellbeing and independence.16 US Department of Veterans Affairs (VA) databases reveal a high prevalence of veterans receiving PT services through CC; PT is one of the most frequently used CC outpatient specialty services by veterans living in rural communities.14,17
Telerehabitltation Enterprisewide Initiative
VHA has greatly invested in delivering care virtually, especially for veterans living in rural communities.18 In 2017, the VHA Office of Rural Health funded the Telerehabilitation Enterprise-Wide Initiative (TR-EWI) in partnership with the Physical Medicine and Rehabilitation Services national program office to increase access to specialized rehabilitation services for veterans living in rural communities by leveraging telehealth technologies.18-21 This alternative mode of health care delivery allows clinicians to overcome access barriers by delivering rehabilitation therapies directly to veterans' homes or nearby community-based outpatient clinics. TR-EWI was conceived as a hub-and-spoke model, where rehabilitation expertise at the hub was virtually delivered to spoke sites that did not have in-house expertise. In subsequent years, the TR-EWI also evolved to provide targeted telerehabilitation programs within rural-serving community-based outpatient clinics, including PT as a predominant service.19,20
As TR-EWI progressed—and in conjunction with the uptake of telehealth across VHA during the COVID-19 pandemic—there has been increased focus on PT telerehabilitation, especially for the 4.6 million veterans in rural communities.18,22,23 Because health care delivery system deficits in rural areas could limit the effective use of CC, many TR-EWI sites hope to reduce their CC referrals by providing telehealth PT services to veterans who might otherwise need to be referred to CC. This strategy aligns with VHA goals of providing high-quality and timely care. To better understand opportunities for programs like TR-EWI to provide rehabilitation services for veterans and reduce care sent to the community, research that examines CC referral trends for PT over time is warranted.
This study examines CC from a rehabilitation perspective with a focus on CC referral trends for PT, specifically for Veterans Integrated Service Networks (VISNs) where TREWI sites are located. The study’s objectives were to describe rehabilitation PT services being referred to CC and examine associated CC costs for PT services. Two research questions guided the study. First, what are the utilization trends for CC PT referrals from fiscal year (FY) 2019 to FY 2022? Secondly, what is the cost breakdown of CC for PT referrals from FY 2020 to FY 2022?
Methods
This study was conducted by a multidisciplinary team comprised of public health, disability, rehabilitation counseling, and PT professionals. It was deemed a quality improvement project under VA guidance and followed the SQUIRE guidelines for quality improvement reporting.24,25 The study used the VA Common Operating Platform (Palantir) to obtain individual-level CC referral data from the HealthShare Referral Manager (HSRM) database and consult data from the Computerized Patient Record System. Palantir is used to store and integrate VA data derived from the VA Corporate Data Warehouse and VHA Support Service Center. Referrals are authorizations for care to be delivered by a CC practitioner.
TR-EWI is comprised of 7 sites: VISN 2, VISN 4, VISN 8, VISN 12, VISN 15, VISN 19, and VISN 22. Each site provides telerehabilitation services with an emphasis on reaching veterans living in rural communities. We joined the referrals and consults cubes in Palantir to extract PT referrals for FY 2019 to FY 2022 for the 7 VISNs with TR-EWI sites and obtain referral-specific information and demographic characteristics. 26 Data were extracted in October 2022.
The VHA Community Care Referral Dashboard (CC Dashboard) provided nonindividual level CC cost data.27 The CC Dashboard provides insights into the costs of CC services for VHA enrollees by category of care, standardized episode of care, and eligibility. Data are based on nationallevel HSRM referrals that are not suspended or linked to a canceled or discontinued consult. Data were aggregated by VISN. The dashboard only includes referrals dating back to FY 2020; therefore, PT data from FY 2020 through FY 2022 for VISNs with TR-EWI sites were collected. Data were extracted in December 2022.
This study examined CC referrals, station name, eligibility types, clinical diagnoses (International Classification of Diseases, Tenth Revision codes), and demographic information in the Palantir dataset. Six eligibility criteria can qualify a veteran to receive CC.28 Within clinical diagnoses, the variable of interest was the provisional diagnosis. Patient demographics included age, gender, and rurality of residence, as determined by the Rural-Urban Commuting Area system.29,30 Rural and highly rural categories were combined for analysis. For the CC cost dataset, this study examined CC referrals, referral cost, and eligibility type.
Analysis
For the first research question, we examined referral data from FY 2019 to FY 2022 using the Palantir dataset, performed descriptive statistical analysis for all variables, and analyzed data to identify trends. Descriptive statistics were completed using IBM SPSS Statistics for Windows Version 29.0.0.0.
A qualitative analysis of provisional diagnosis data revealed what is being referred to CC for PT. A preliminary overview of provisional diagnosis data was conducted to familiarize coders with the data. We developed a coding framework to categorize diagnoses based on anatomical location, body structure, and clinical areas of interest. Data were reviewed individually and grouped into categories within the coding framework before meeting as a team to achieve group consensus on categorization. We then totaled the frequency of occurrence for provisional diagnoses within each category. Qualitative analyses were completed using Microsoft Excel.
For the second research question, the study used the CC cost dataset to examine the cost breakdown of CC PT referrals from FY 2020 to FY 2022. We calculated the number and cost of PT referrals across eligibility groups for each FY and VISN. Data were analyzed using SPSS to identify cost trends.
Results
There were 344,406 referrals to CC for PT from FY 2019 to FY 2022 for the 7 VISNs analyzed (Table 1). Of these, 22.5% were from FY 2019, 19.1% from FY 2020, 28.2% from FY 2021, and 30.3% from FY 2022. VISN 8 and VISN 22 reported the most overall PT referrals, with VISN 8 comprising 22.2% and VISN 22 comprising 18.1% of all referrals. VISN 2 reported the least overall referrals (3.7%). VISN 4 and VISN 12 had decreases in referrals over time. VISN 2 and VISN 15 had decreases in referrals from FY 2019 to FY 2021 and slight increases from FY 2021 to FY 2022. VISN 19 and VISN 22 both saw slight increases from FY 2019 to FY 2020 and substantial increases from FY 2020 to FY 2022, with FY 2022 accounting for 40.0% and 42.3% of all referrals for VISN 19 and VISN 20, respectively (Figure 1).
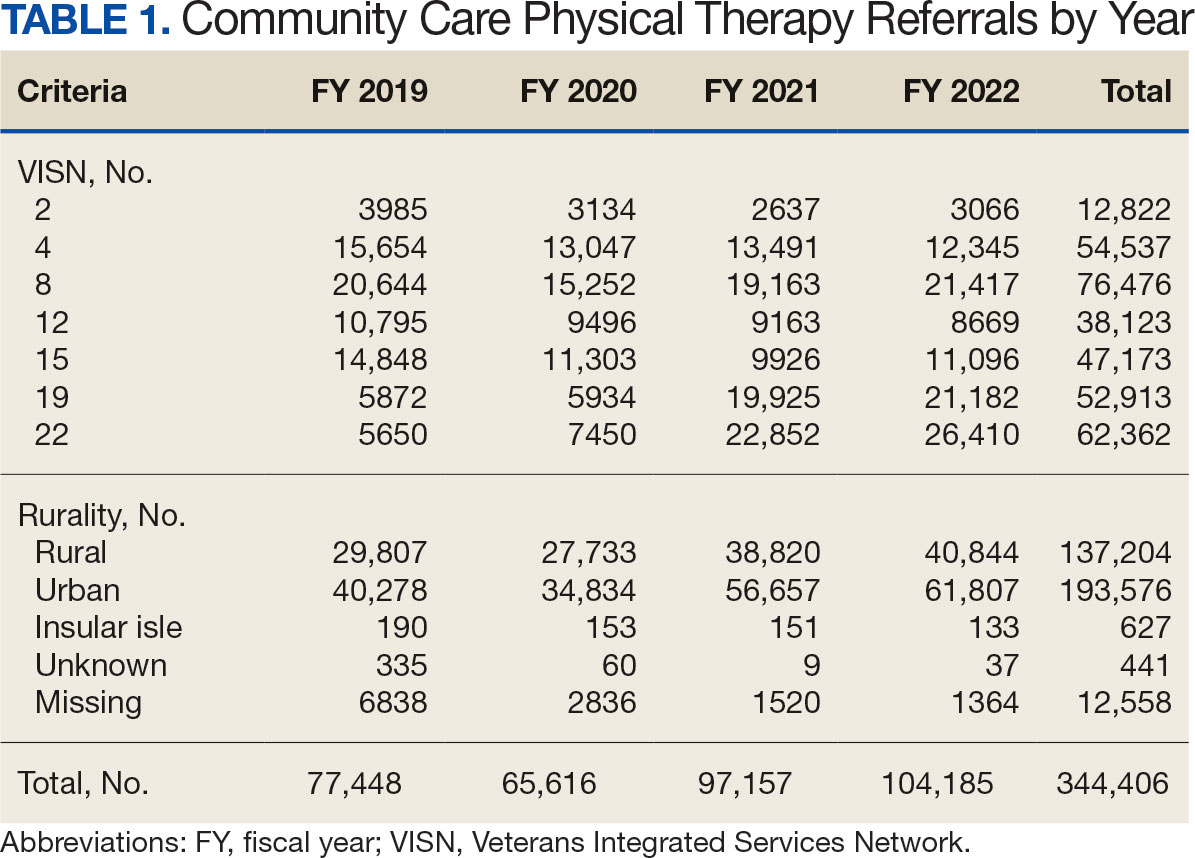
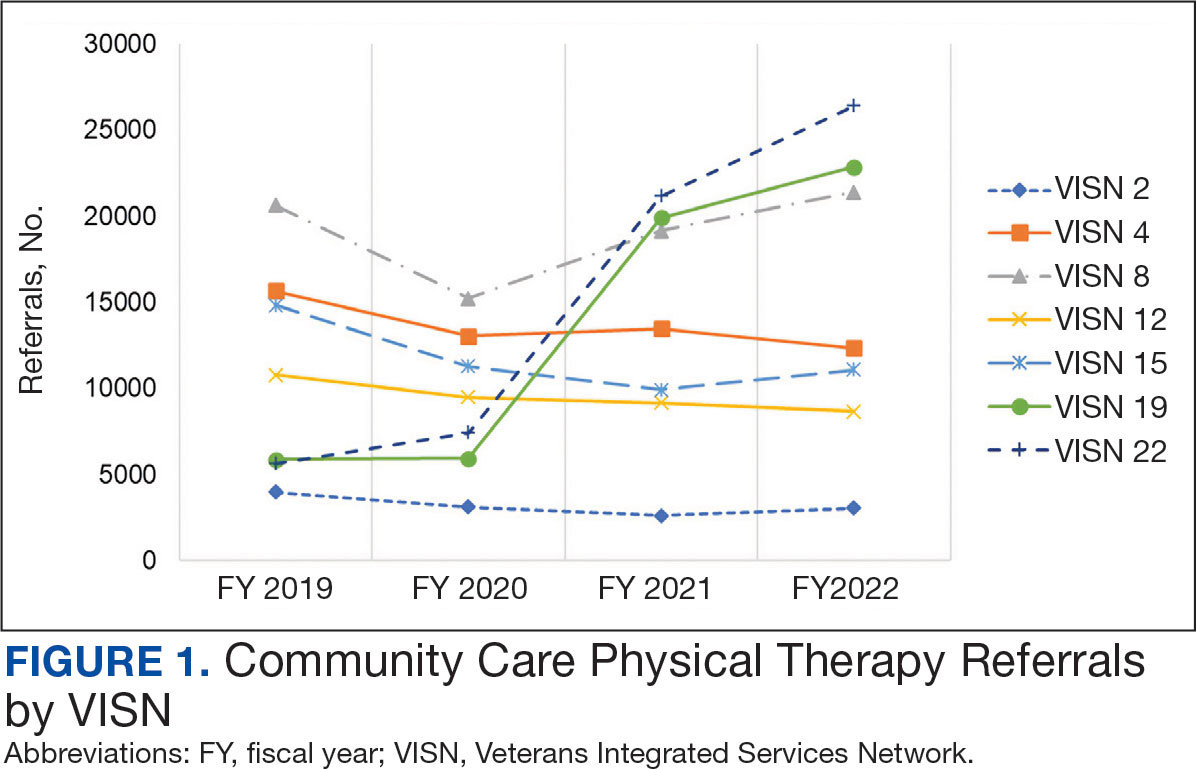
For FY 2019 and FY 2020, VISN 8 had the highest percentage of referrals (26.7% and 23.2%, respectively), whereas VISN 22 was among the lowest (7.3% and 11.4%, respectively). However, for FY 2021 and FY 2022, VISN 22 reported the highest percentage of referrals (23.5% and 25.3%, respectively) compared to all other VISNs. VISN 2 consistently reported the lowest percentage of referrals across all years.
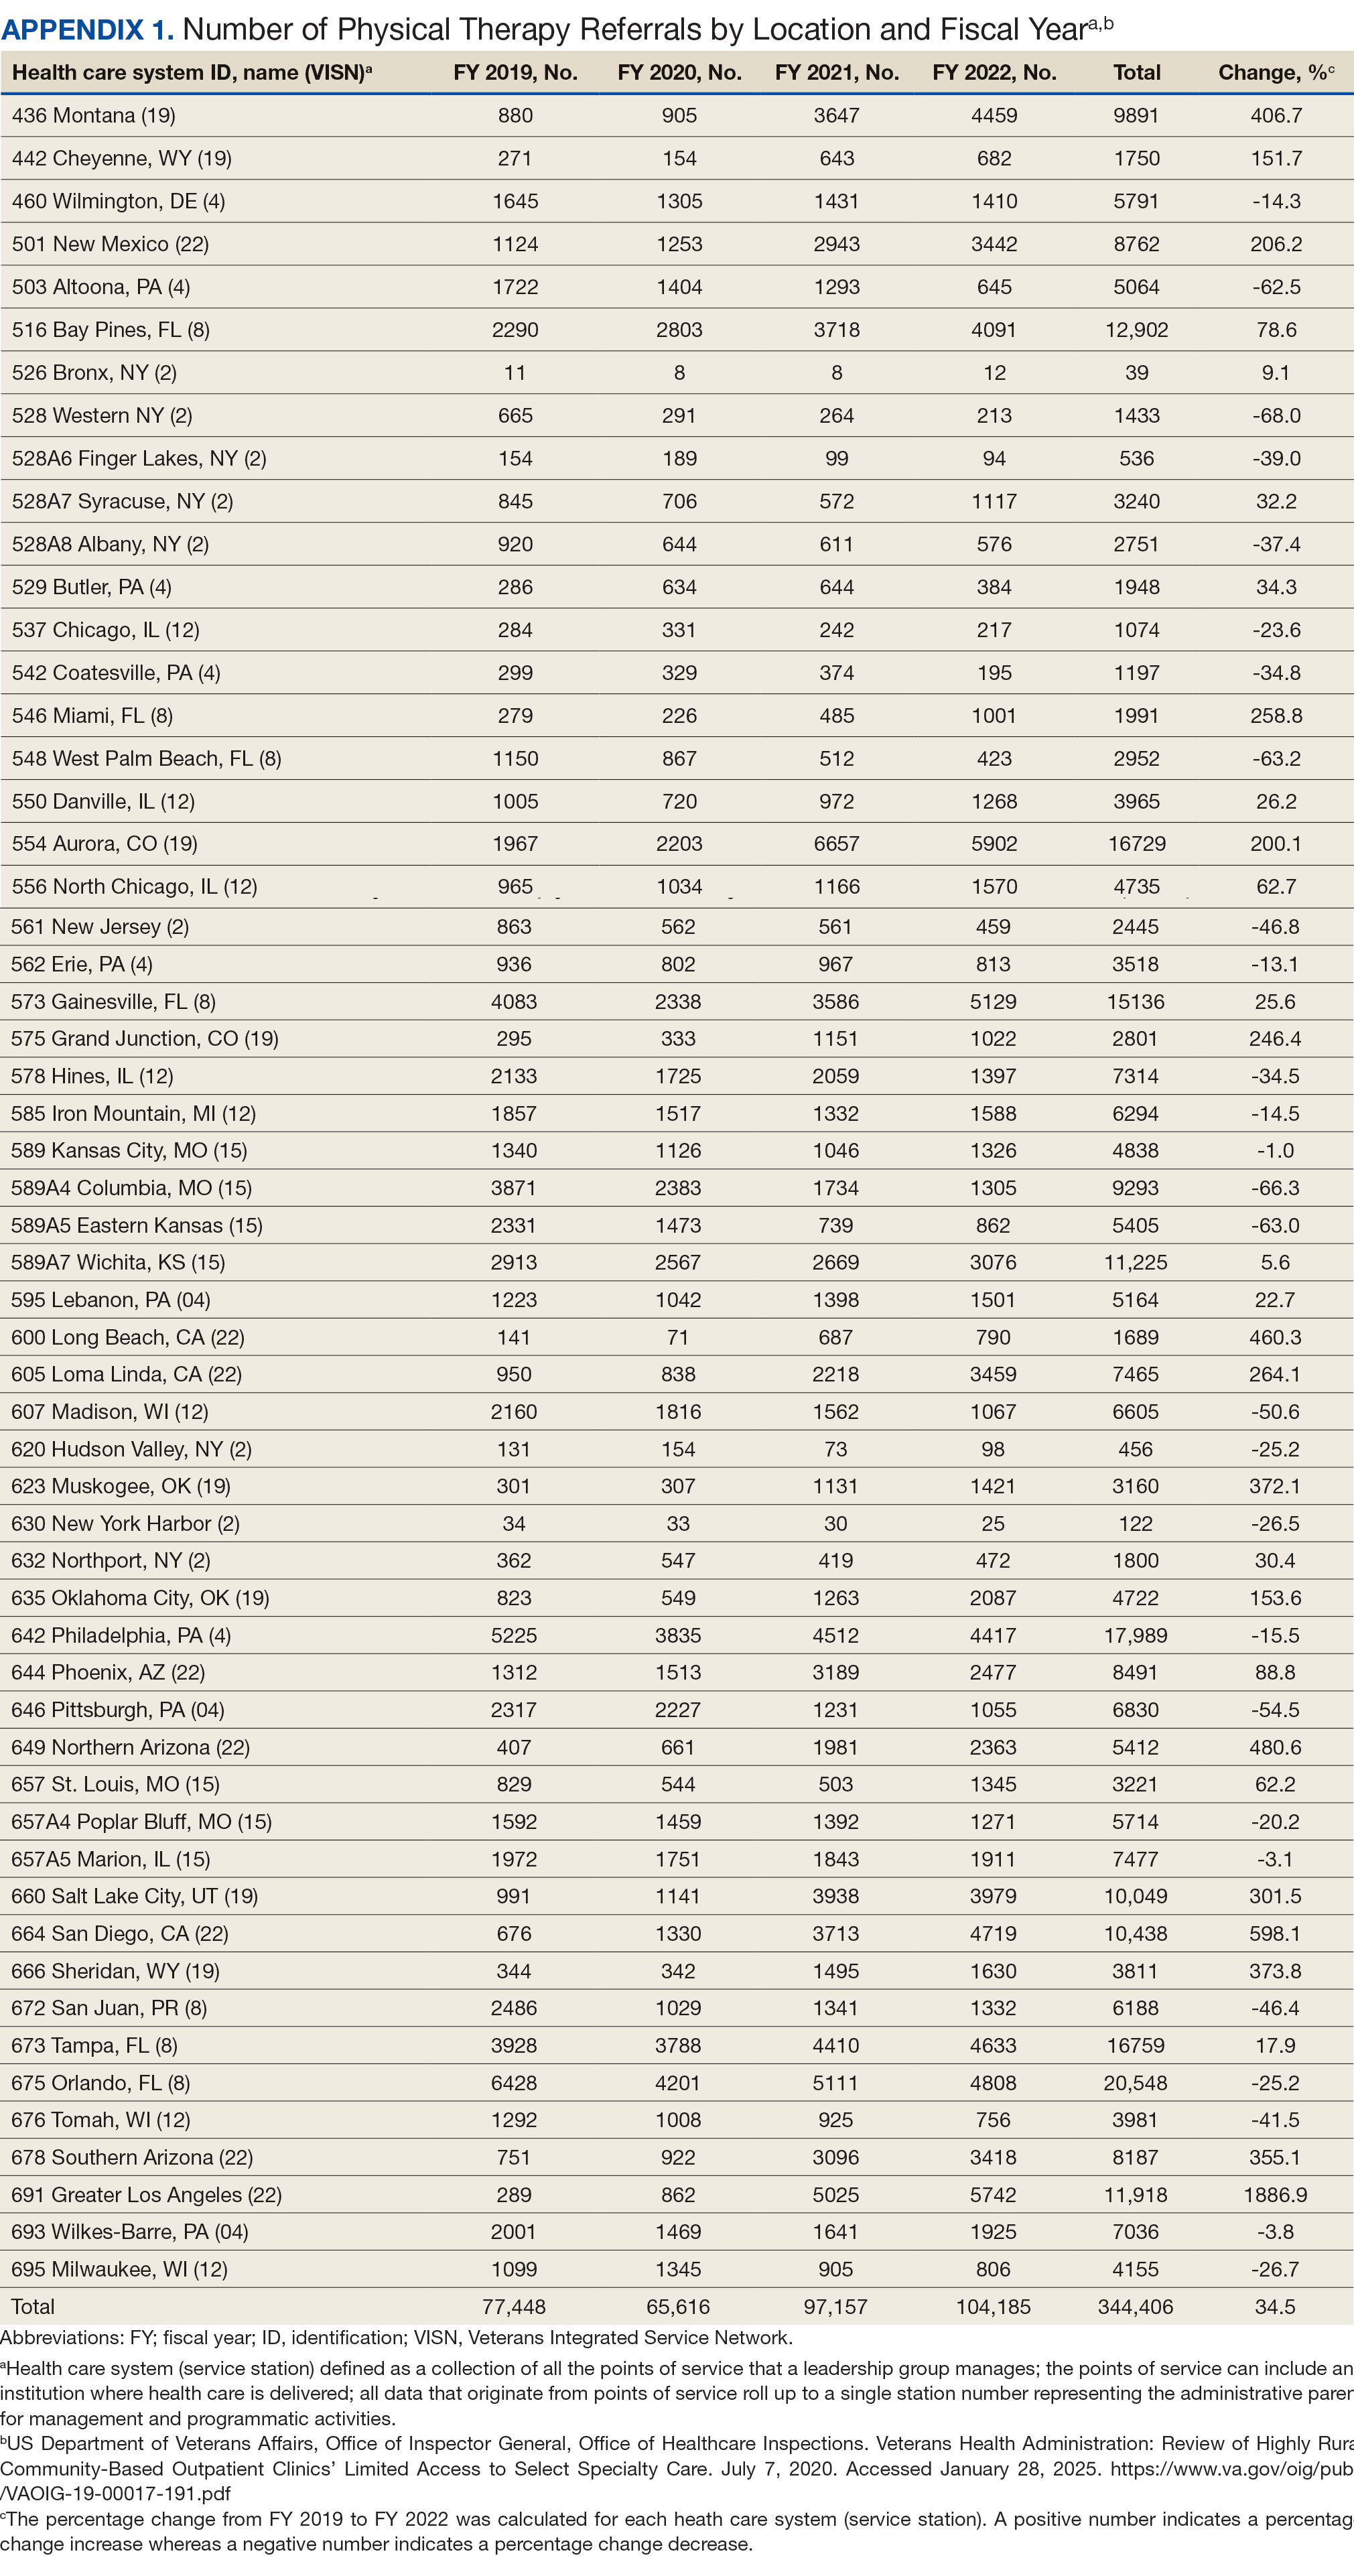
There were 56 stations analyzed across the 7 VISNs (Appendix 1). Nine stations each accounted for ≥ 3.0% of the total PT referrals and only 2 stations accounted for > 5.0% of referrals. Orlando, Florida (6.0%), Philadelphia, Pennsylvania (5.2%), Tampa, Florida (4.9%), Aurora, Colorado (4.9%), and Gainesville, Florida (4.4%) reported the top 5 highest referrals, with 3 being from VISN 8 (Orlando, Tampa, Gainesville). Stations with the lowest reported referrals were all in VISN 2 in New York: The Bronx, (0%), New York Harbor (0%), Hudson Valley (0.1%) and Finger Lakes (0.2%).
Rurality
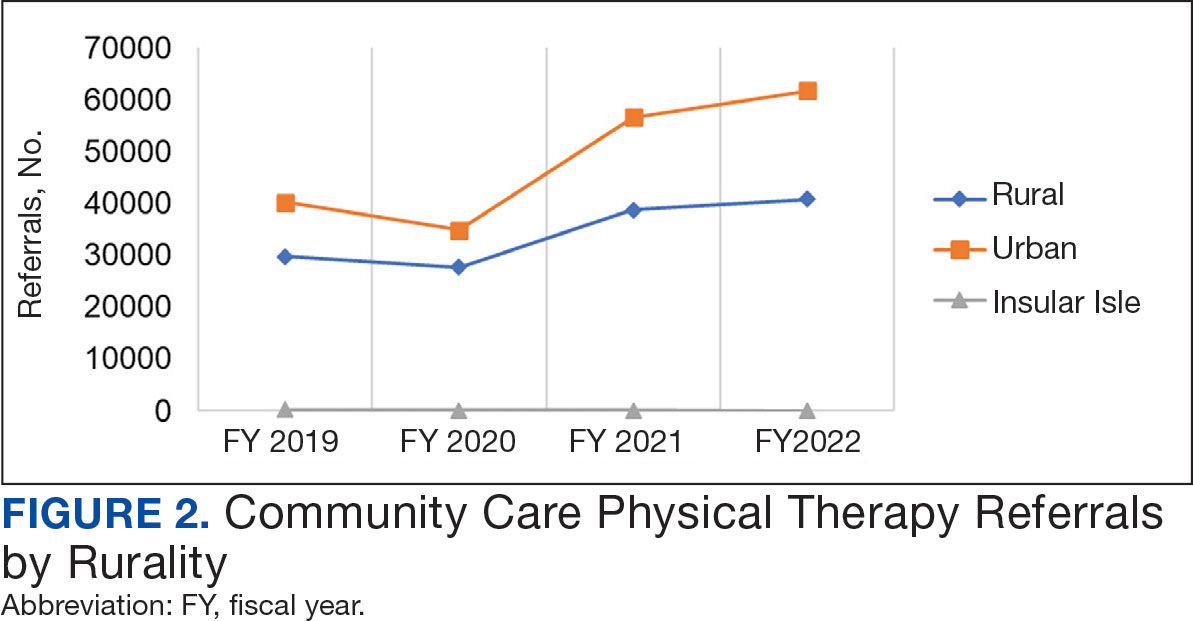
Urban stations comprised 56.2% and rural stations comprised 39.8% of PT CC referrals, while 0.2% of referrals were from insular isle US territories: Guam, American Samoa, Northern Marianas, and the Virgin Islands. The sample had missing or unknown data for 3.8% of referrals. FY 2022 had the largest difference in rural and urban referrals. Additionally, there was an overall trend of more referrals over time for rural and urban, with a large increase in rural (+40.0%) and urban (+62.7%) referrals from FY 2020 to FY 2021 and a modest increase from FY 2021 to FY 2022 (+5.2% for rural and +9.1% for urban). There was a decrease in rural (-7.0%) and urban (-3.5%) referrals from FY 2019 to FY 2020 (Figure 2).
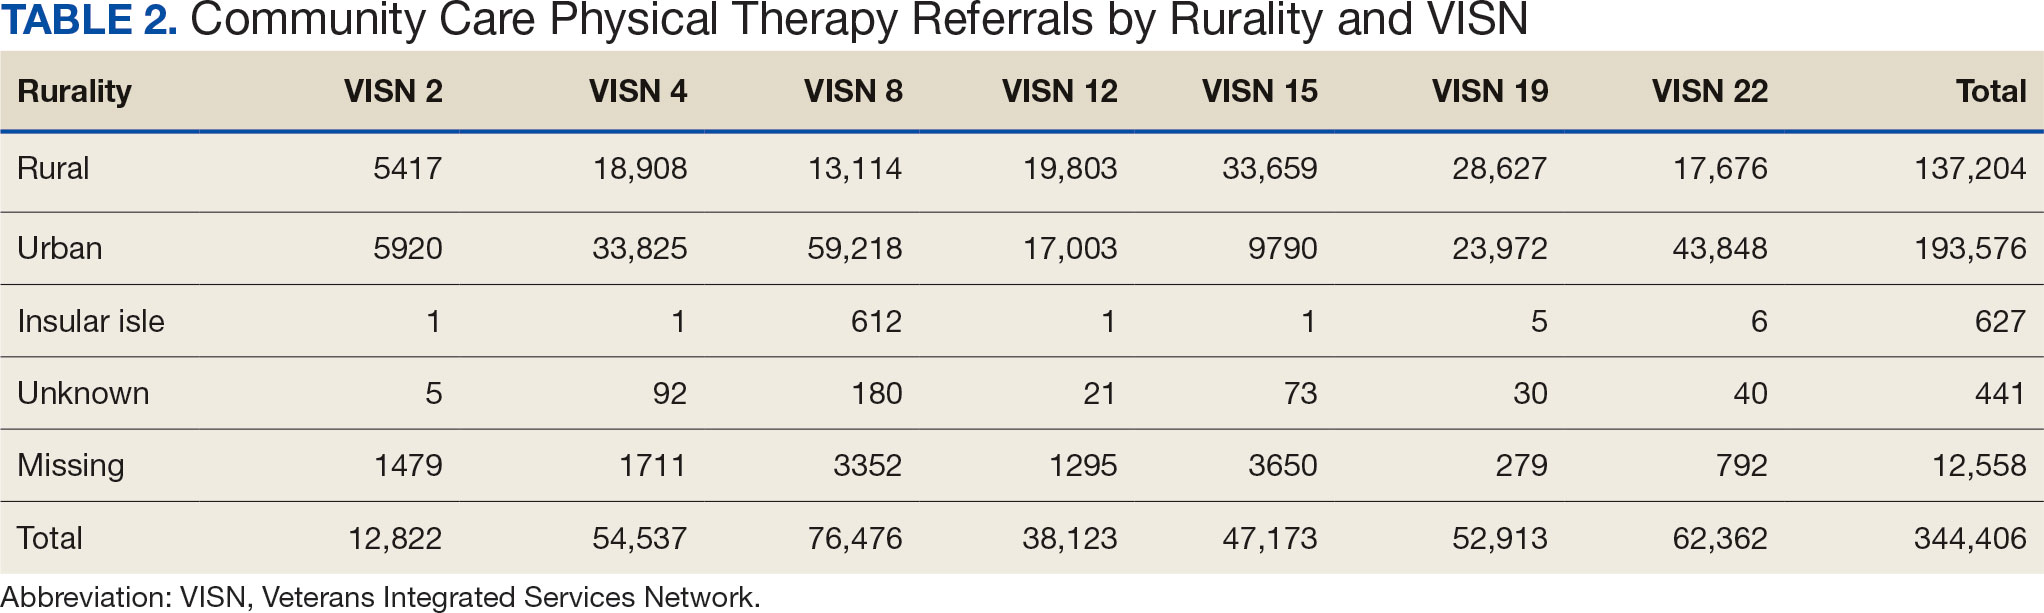
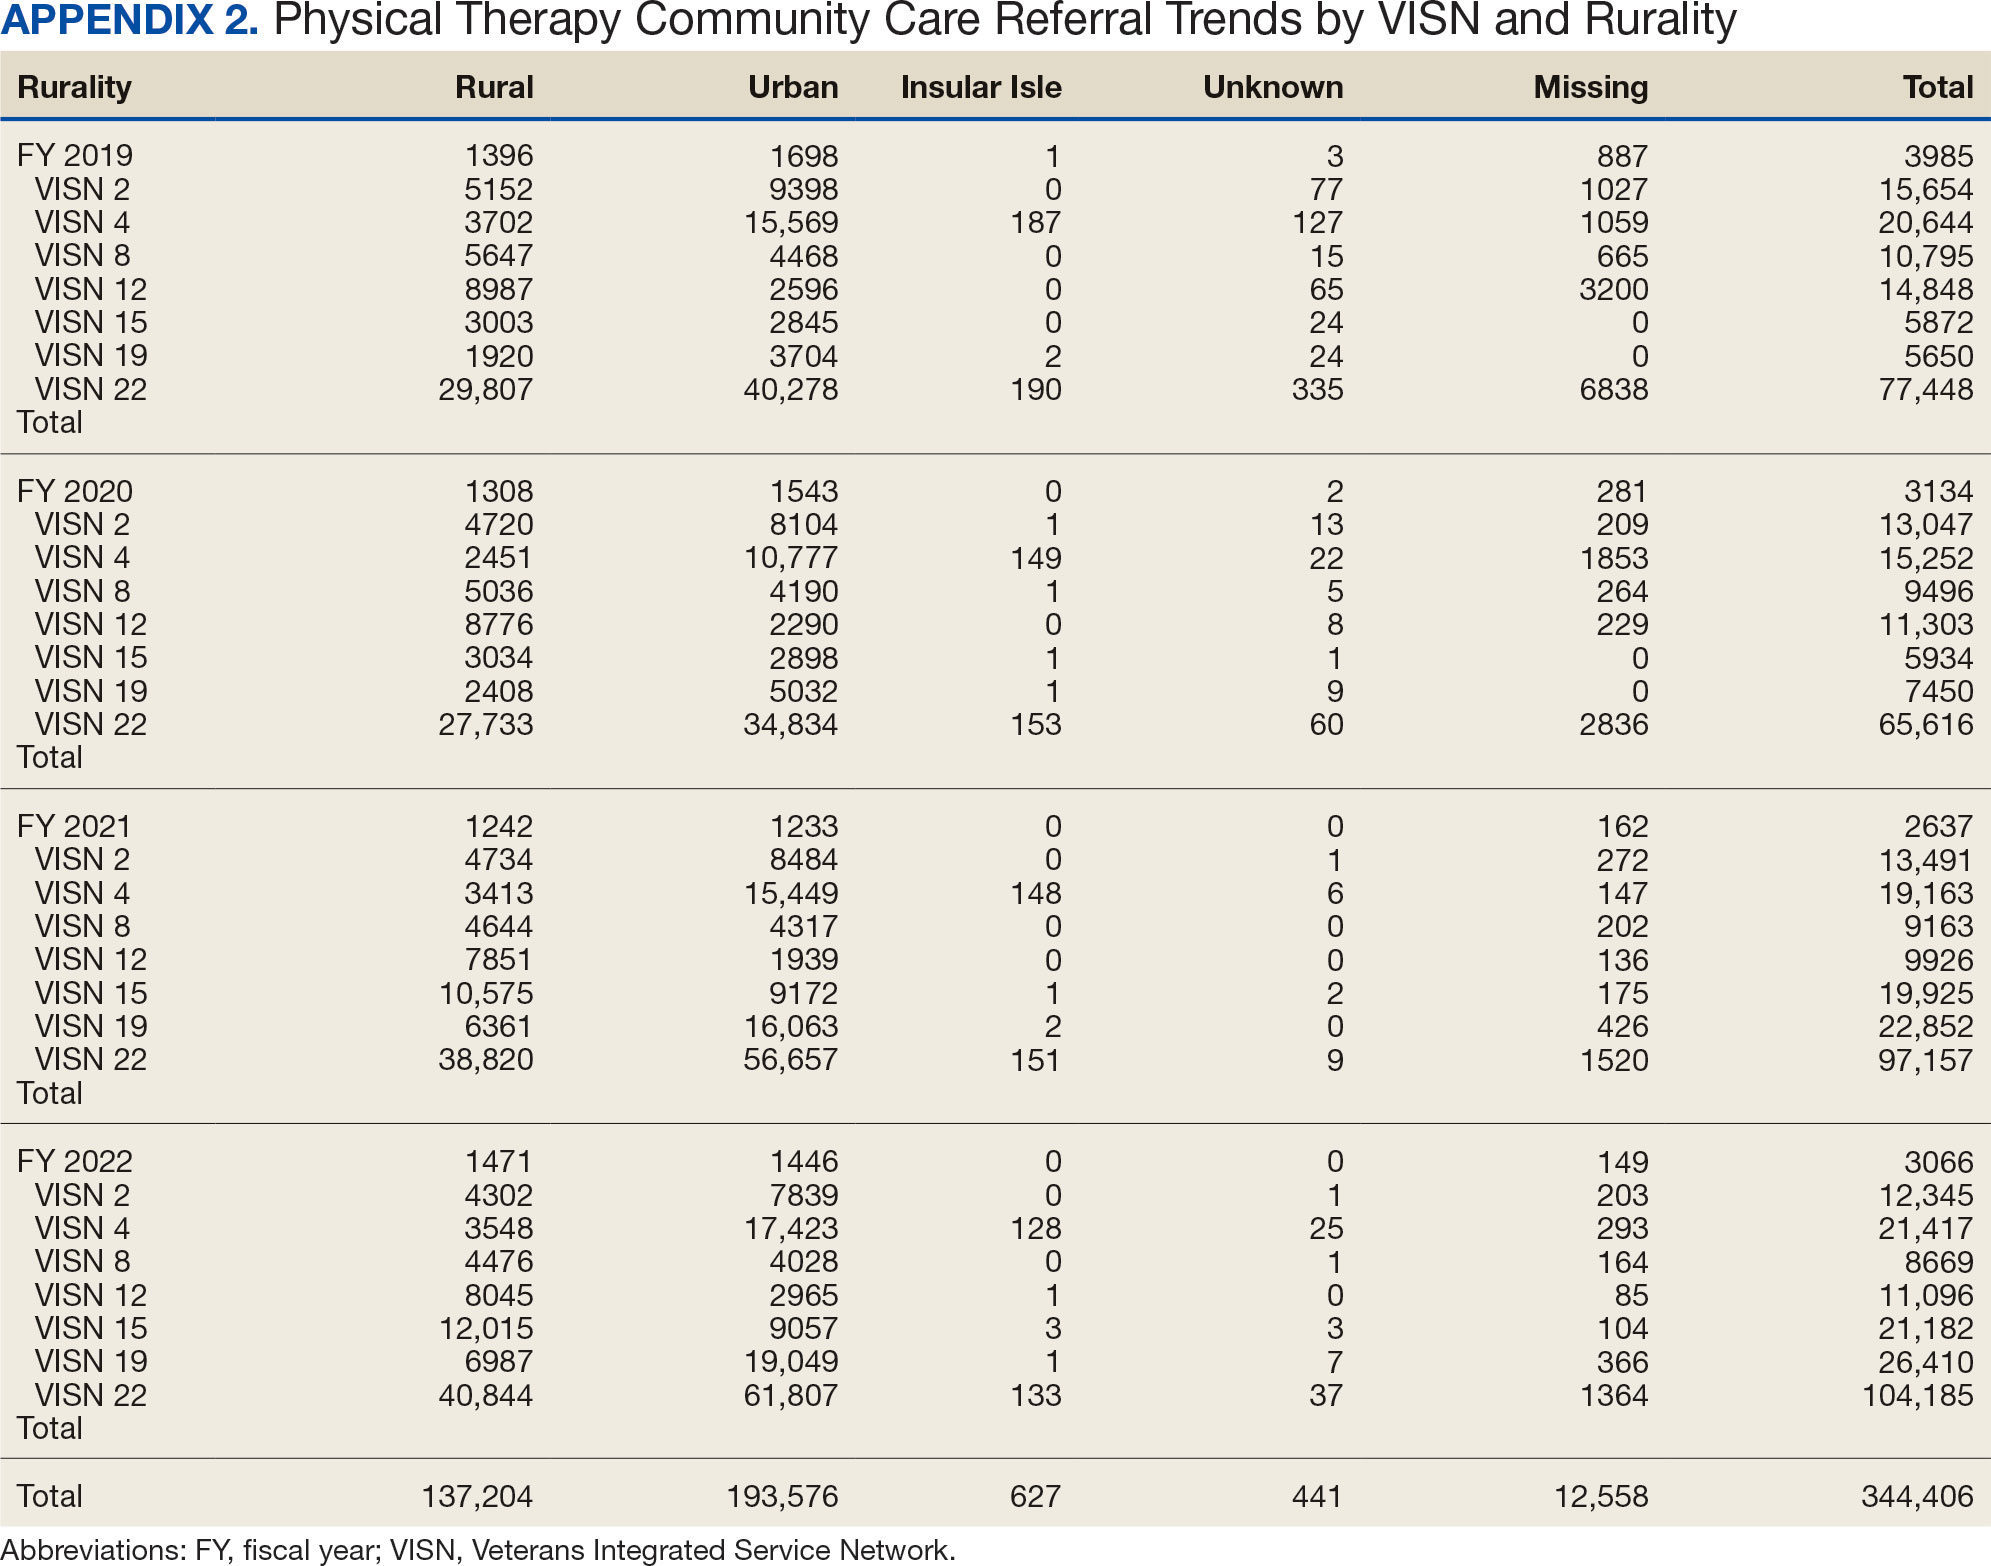
There were differences in referrals by rurality and VISN (Table 2). VISN 12, VISN 15, and VISN 19 reported more rural than urban referrals, whereas VISN 4, VISN 8, and VISN 22 reported more urban than rural referrals. VISN 2 reported similar numbers for both, with slightly more urban than rural referrals. When reviewing trends over time for each FY, VISN 12, VISN 15, and VISN 19 reported more rural than urban referrals and VISN 4, VISN 8, and VISN 22 had more urban than rural referrals. In FY 2019 and FY 2020, VISN 2 reported slightly more urban than rural referrals but almost the same number of referrals in FY 2021 and FY 2022 (Appendix 2).
Demographics
The mean (SD) age was 61.2 (15.8) years (range, 20-105). Most PT CC referrals were for veterans aged 70 to 79 years (26.9%), followed by 60 to 69 years (20.7%), and 50 to 59 years (16.4%) (Appendix 3). Trends were consistent across VISNs. There was less of a difference between rural and urban referral percentages as the population aged. Veterans aged < 49 years residing in more urban areas accounted for more referrals to CC compared to their rural counterparts. This difference was less apparent in the 70 to 79 years and 80 to 89 years age brackets.
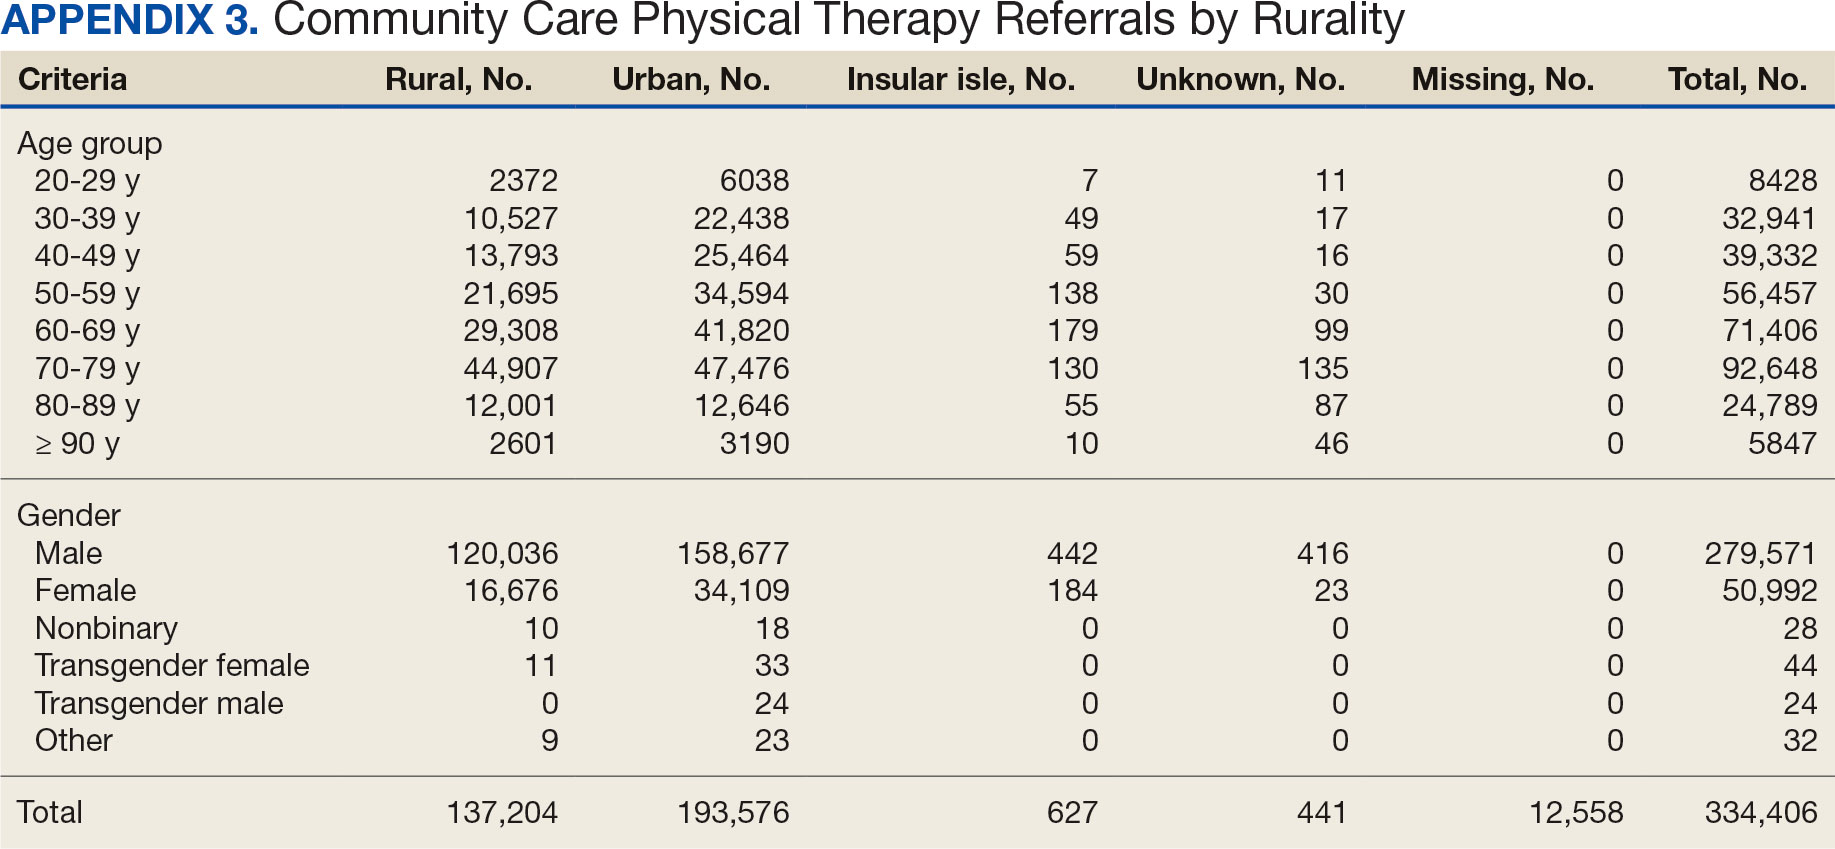
Most PT CC referrals (81.2%) were male and 14.8% were female. About 3.6% of referral data were missing sex information, and there was a smaller difference between male veterans living in rural communities and male veterans living in urban communities compared with female veterans. A total of 42.9% of male veterans resided in rural areas compared to 56.8% in urban areas; 32.7% of female veterans resided in rural areas compared to 66.9% in urban areas (Appendix 3).
Other Criteria
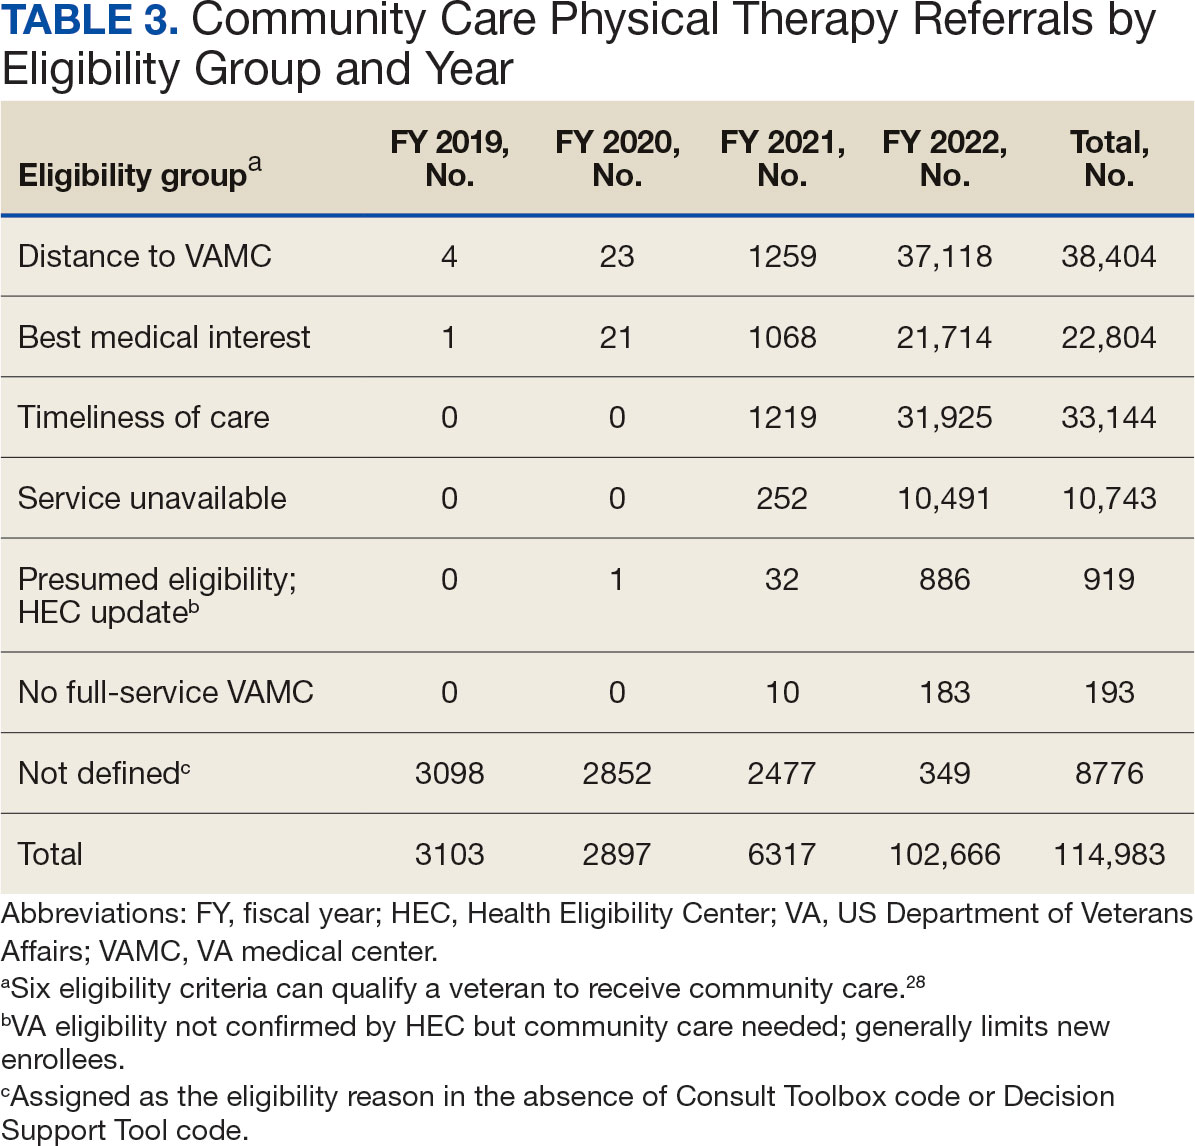
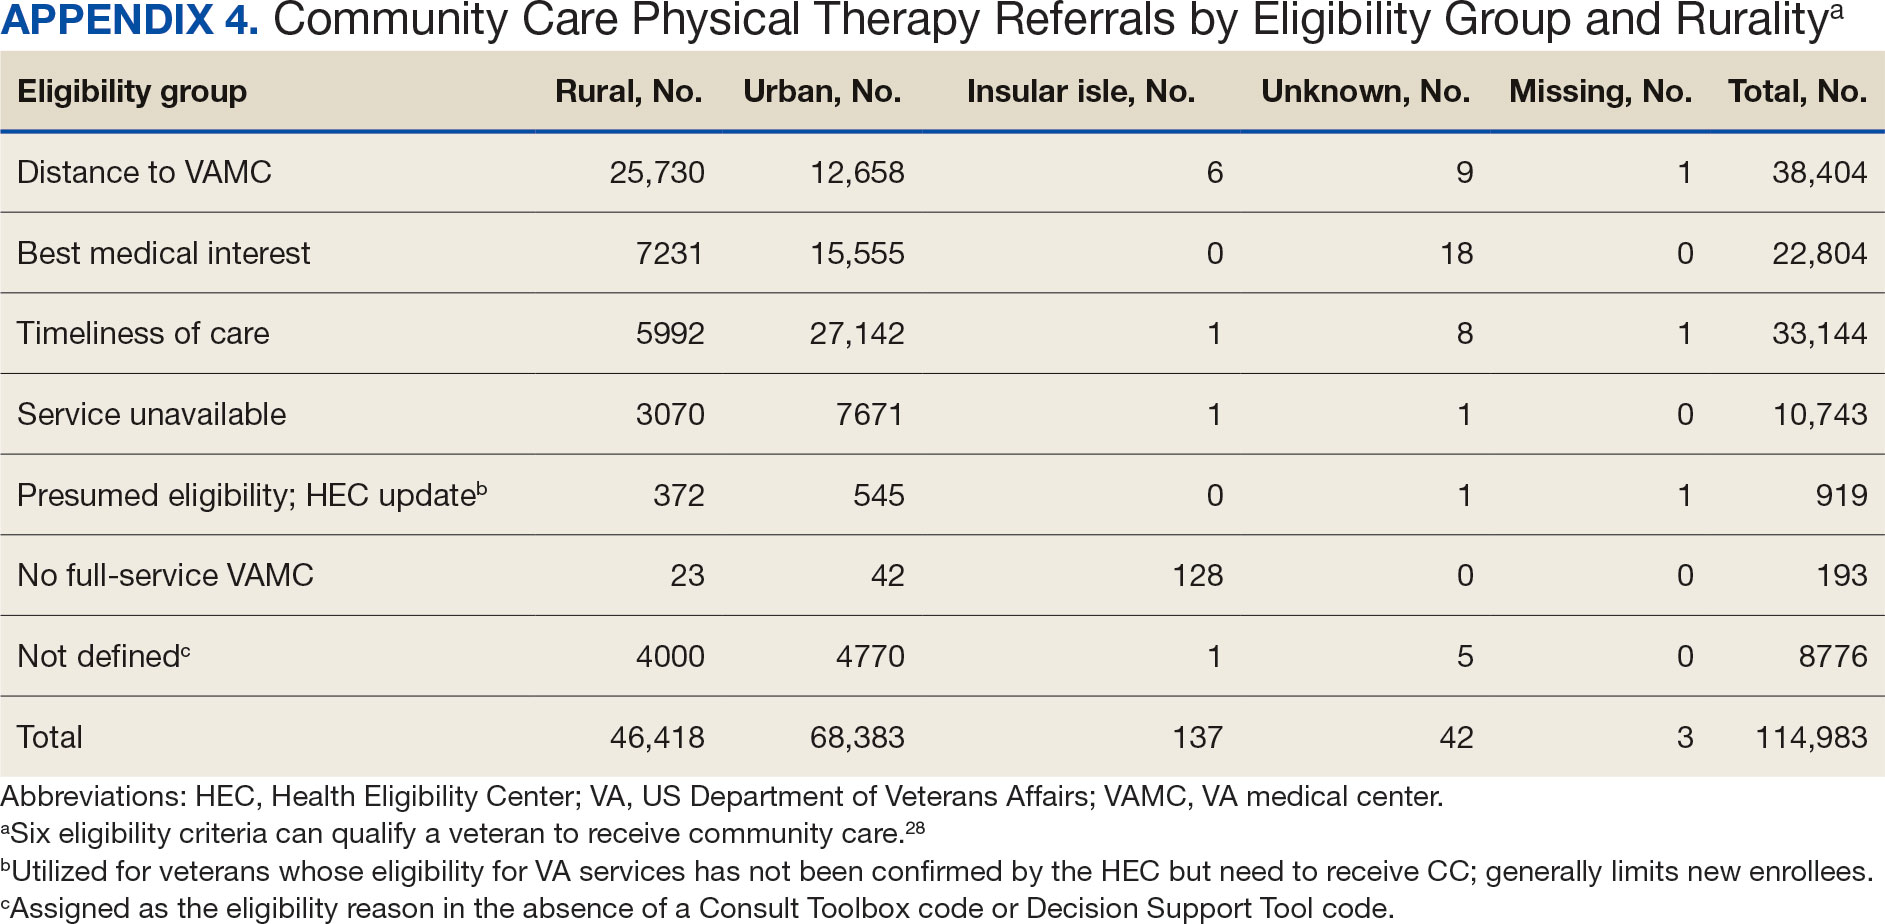
Of the 334,406 referrals, 114,983 (34.4%) had eligibility data, mostly from FY 2021 and FY 2022 (Table 3). Available eligibility data were likely affected by the MISSION Act and new regulations for reporting CC eligibility. Distance (33.4%) was the most common eligibility criteria, followed by timeliness of care (28.8%), and best medical interest (19.8%); 40.4% were rural and 59.5% were urban. Distance (55.4%) was most common for rural veterans, while timeliness of care (39.7%) was most common for urban veterans. For both groups, the second most common eligibility reason was best medical interest (Appendix 4).
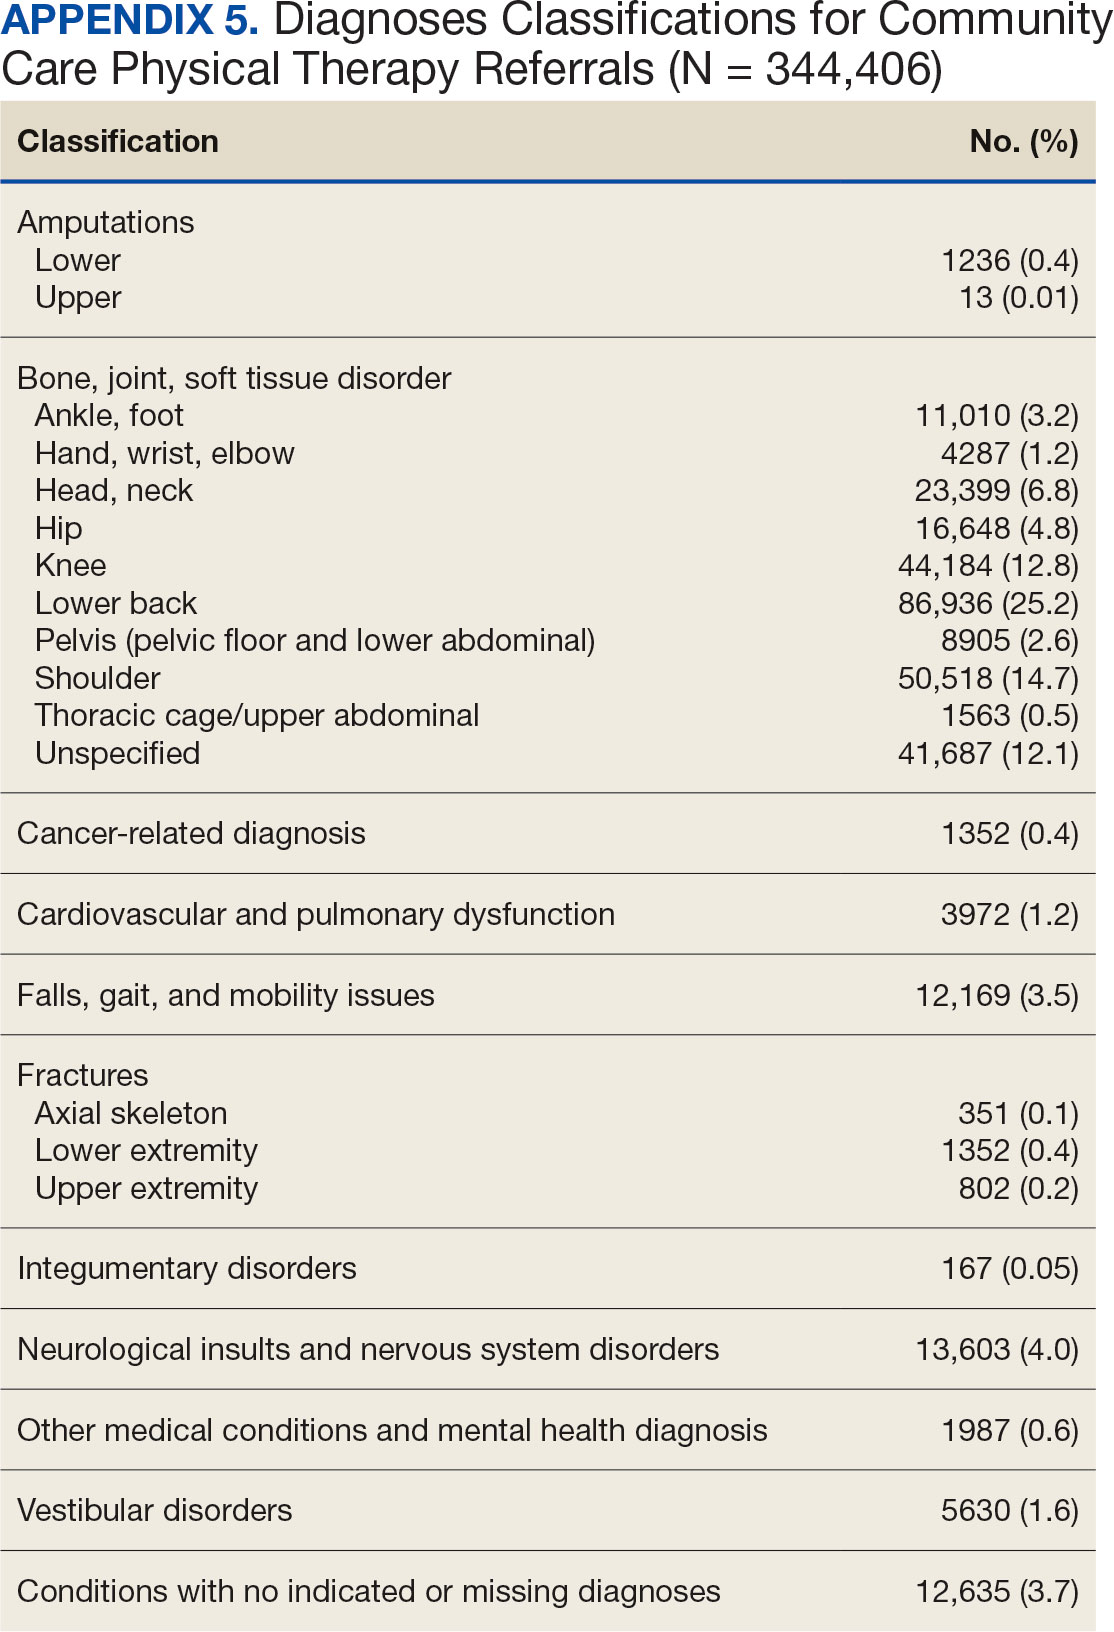
Bone, joint, or soft tissue disorders were common diagnoses, with 25.2% located in the lower back, 14.7% in the shoulder, and 12.8% in the knee (Appendix 5). Amputations of the upper and lower limbs, fractures, cancer-related diagnoses, integumentary system disorders, thoracic and abdominal injuries and disorders, and other medical and mental health conditions each accounted for < 1% of the total diagnoses.
Costs
At time of analysis, the CC Dashboard had cost data available for 200,204 CC PT referrals from FY 2020 to FY 2022. The difference in referral numbers for the 2 datasets is likely attributed to several factors: CC cost data is exclusively from the HSRM, whereas Palantir includes other data sources; how VA cleans data pulled into Palantir; how the CC Dashboard algorithm populates data; and variances based on timing of reporting and/or if referrals are eventually canceled.
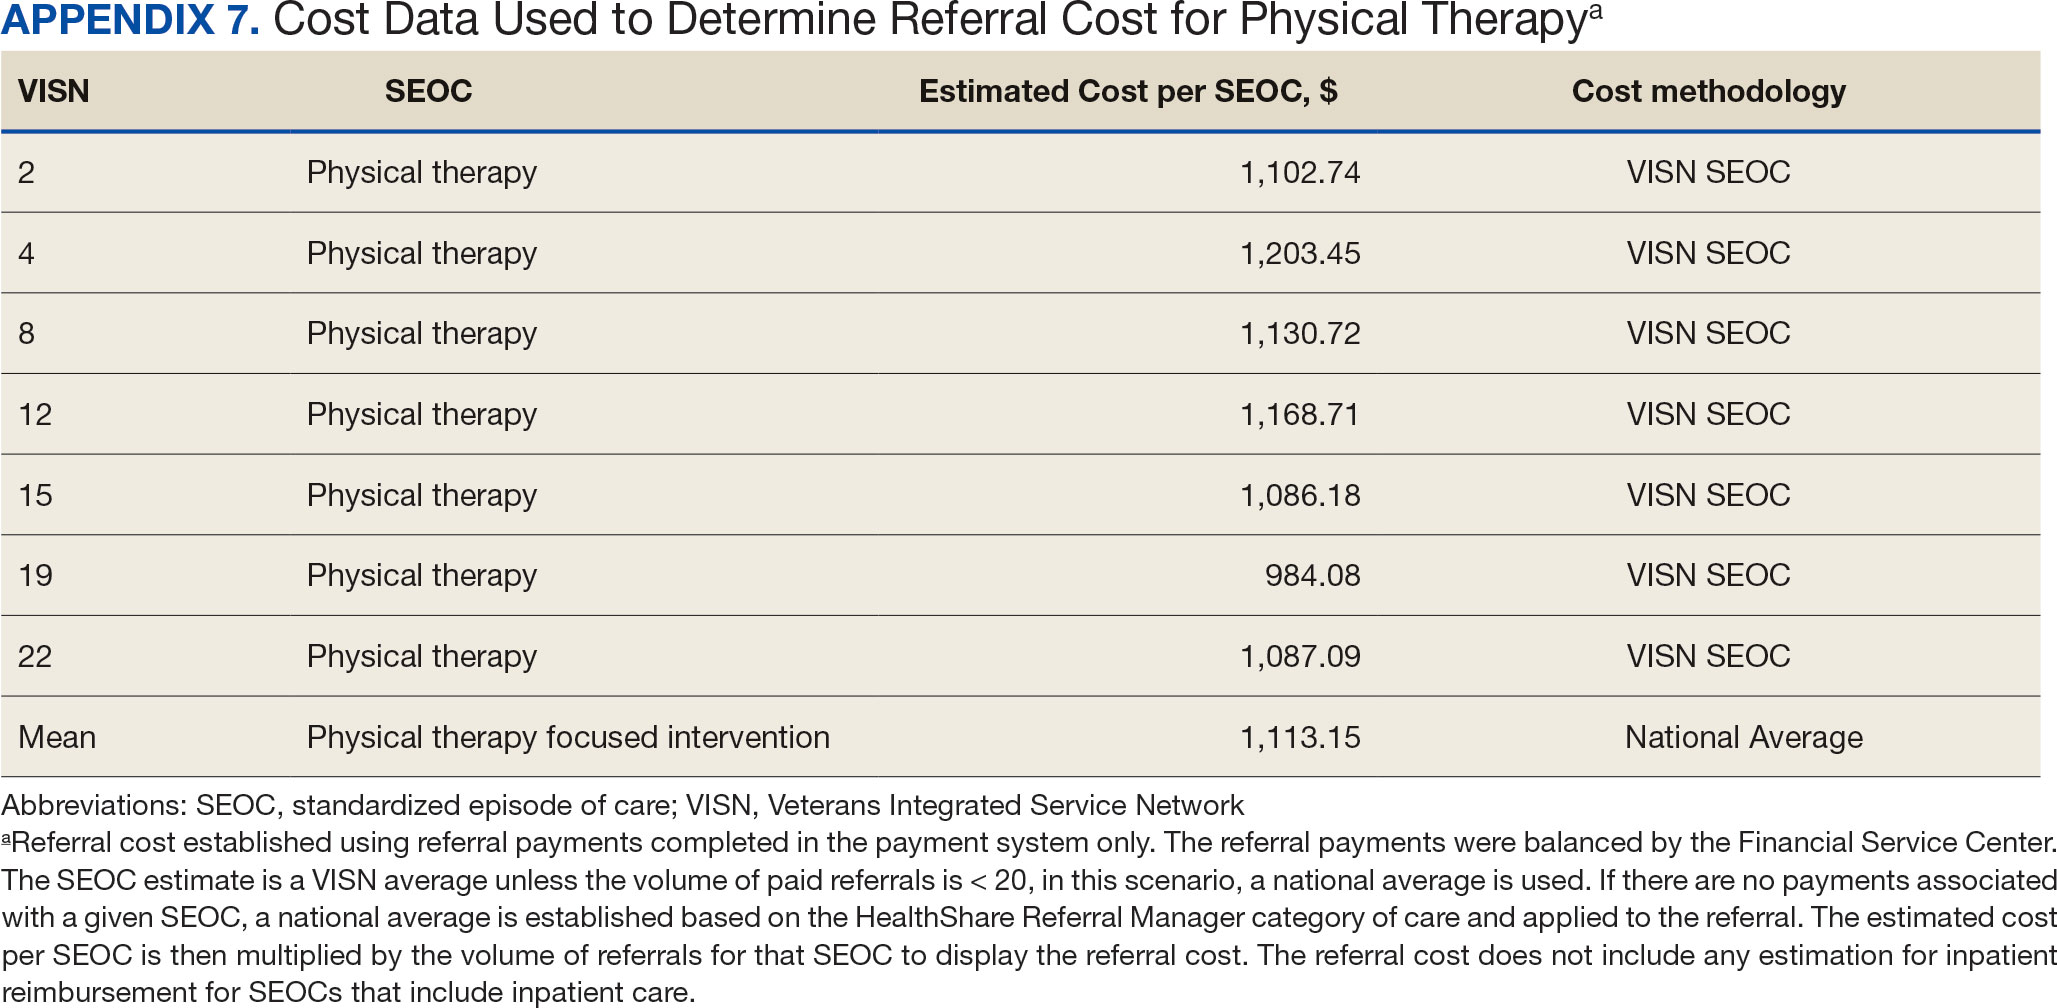
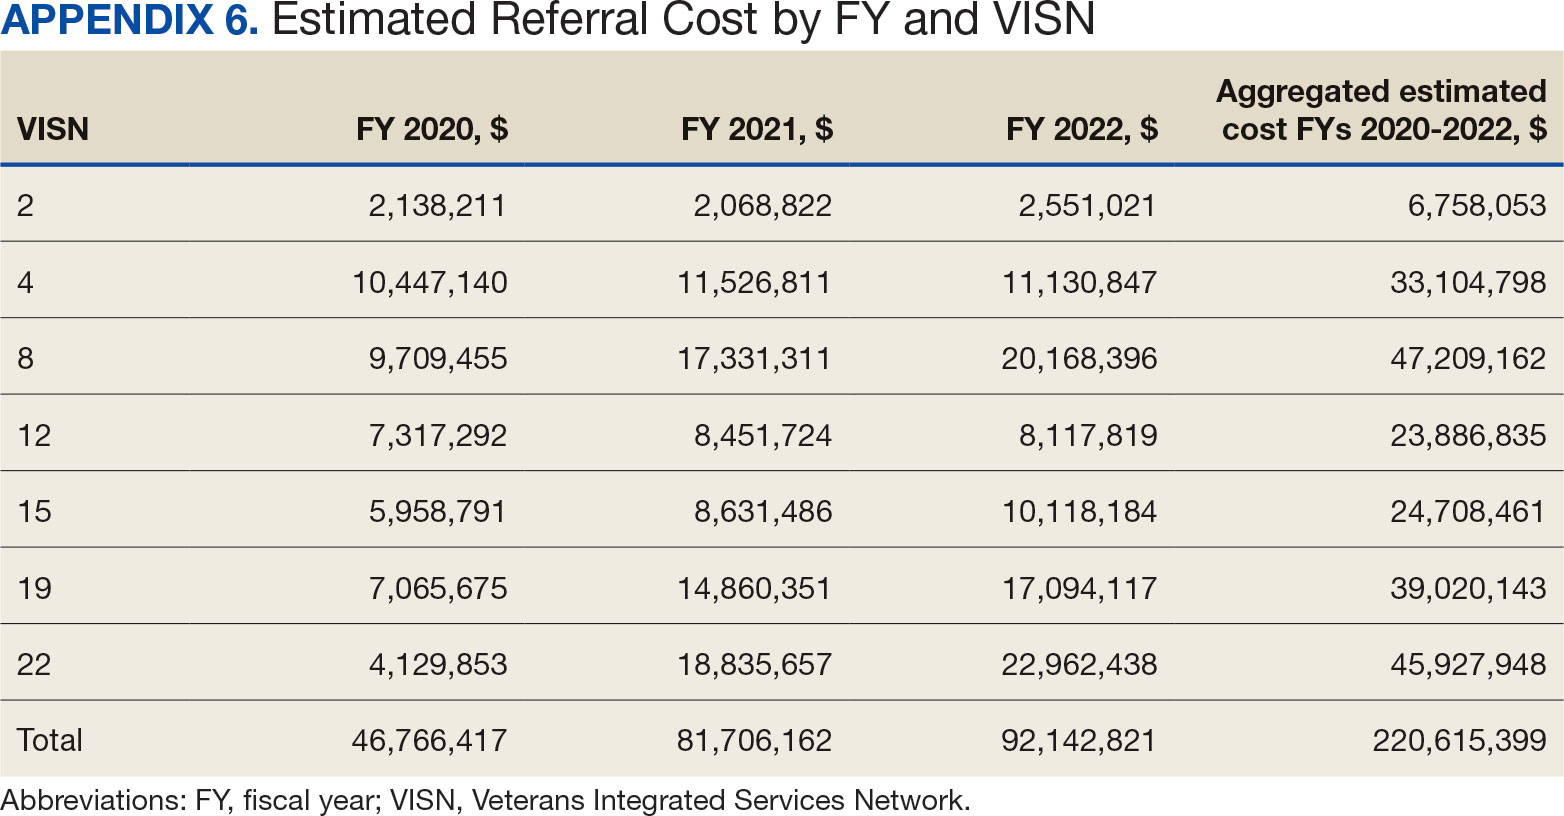
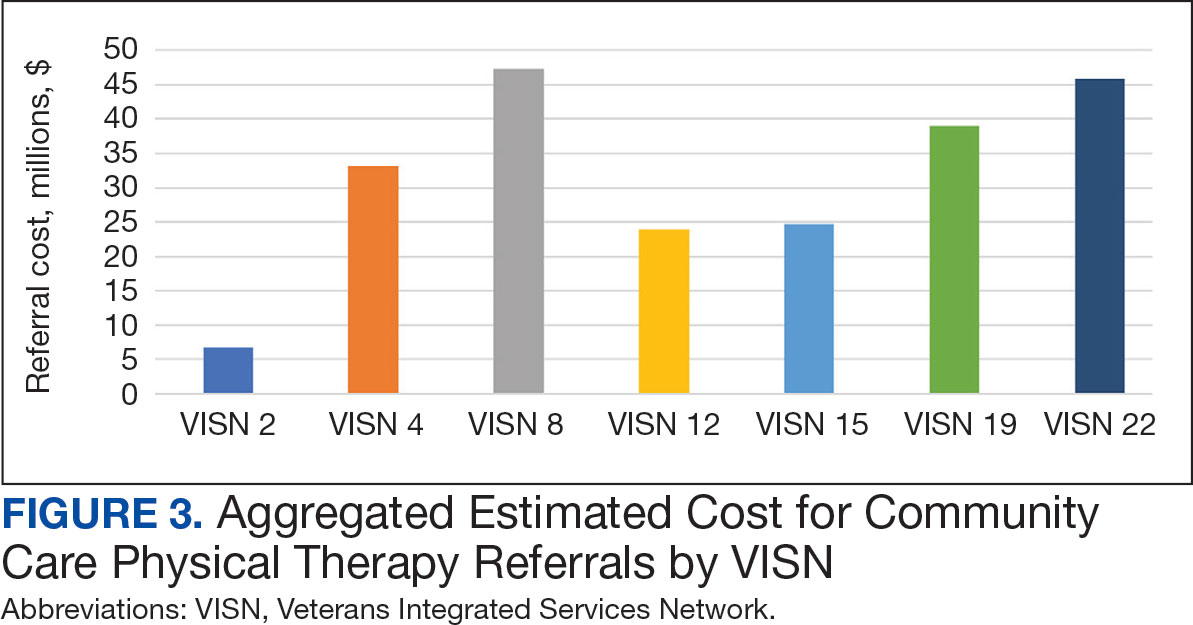
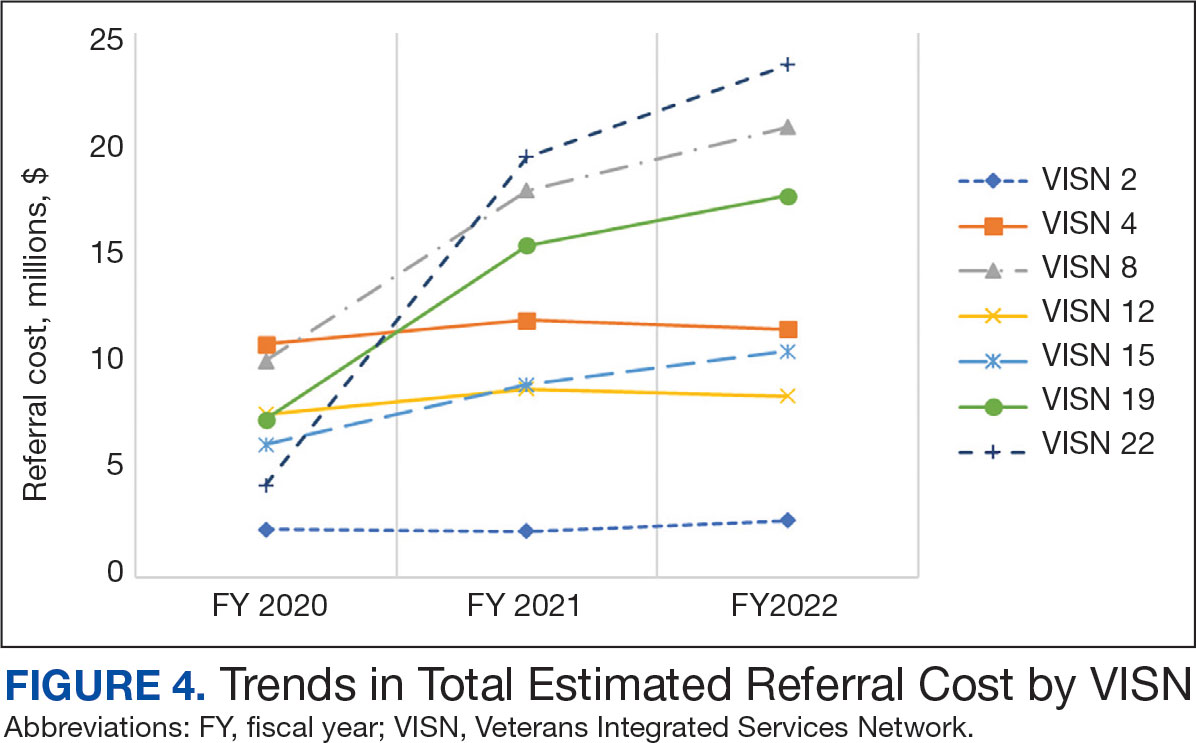
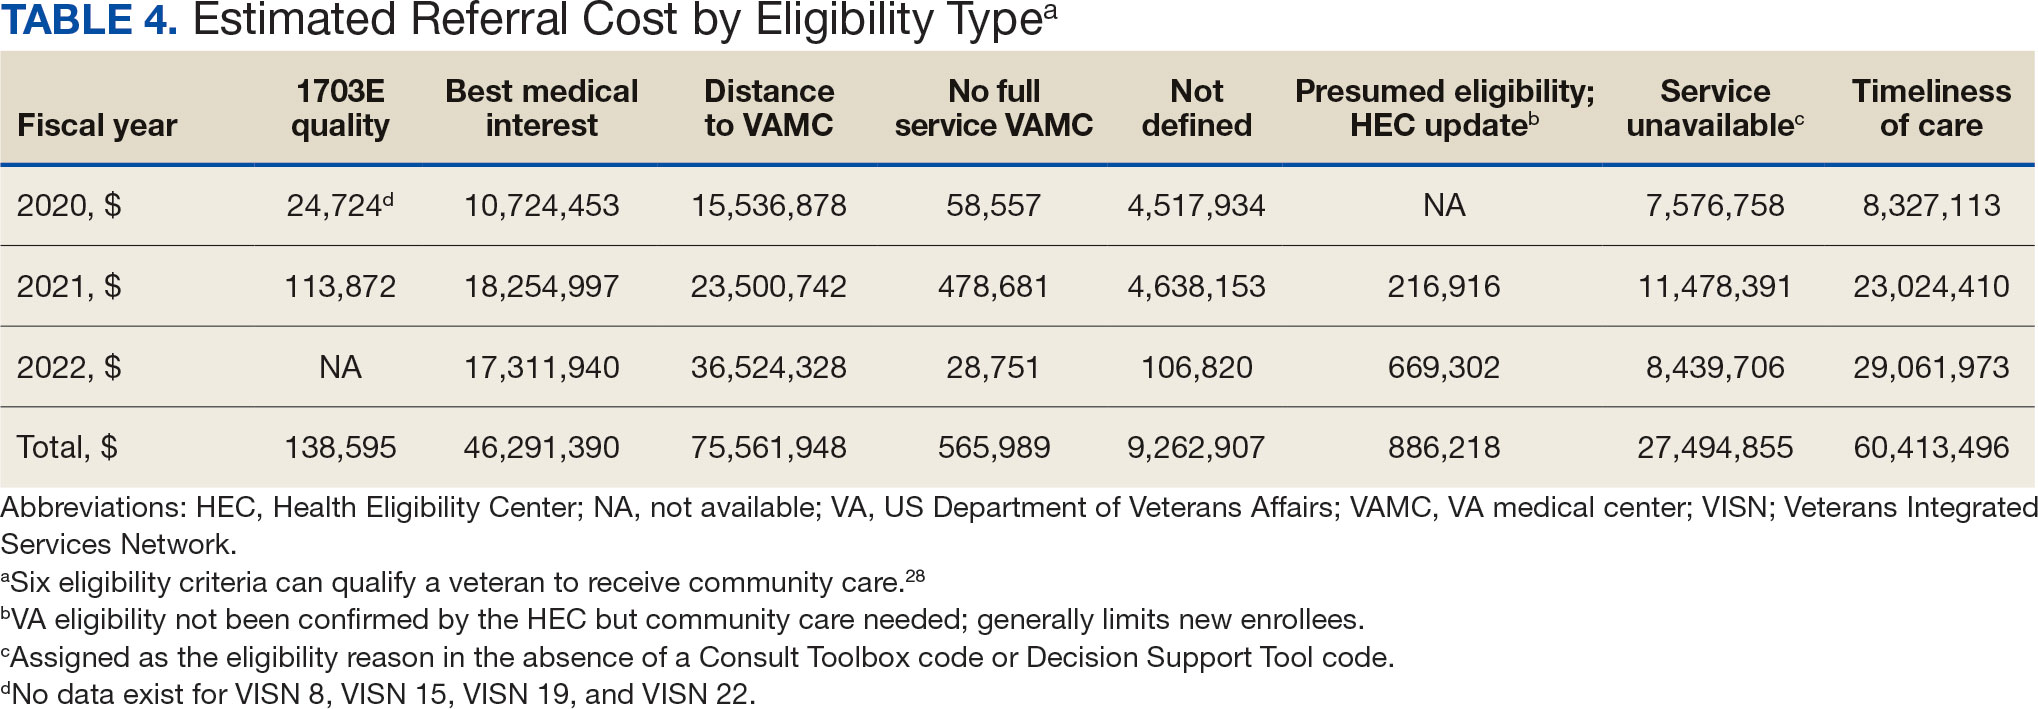
The total cost of PT CC referrals from FY 2020 to FY 2022 in selected VISNs was about $220,615,399 (Appendix 6). Appendix 7 details the methodology for determining the average standardized episode- of-care cost by VISN and how referral costs are calculated. Data show a continuous increase in total estimated cost from $46.8 million in FY 2020 to $92.1 million in FY 2022. From FY 2020 to FY 2022, aggregate costs ranged from $6,758,053 in VISN 2 to $47,209,162 in VISN 8 (Figure 3). The total referral cost for PT was highest at VISN 4 in FY 2020 ($10,447,140) and highest at VISN 22 in FY 2021 ($18,835,657) and FY 2022 ($22,962,438) (Figure 4). For referral costs from FY 2020 to FY 2022, distance accounted for $75,561,948 (34.3%), timeliness of care accounted for $60,413,496 (27.3%), and best medical interest accounted for $46,291,390 (21.0%) (Table 4).
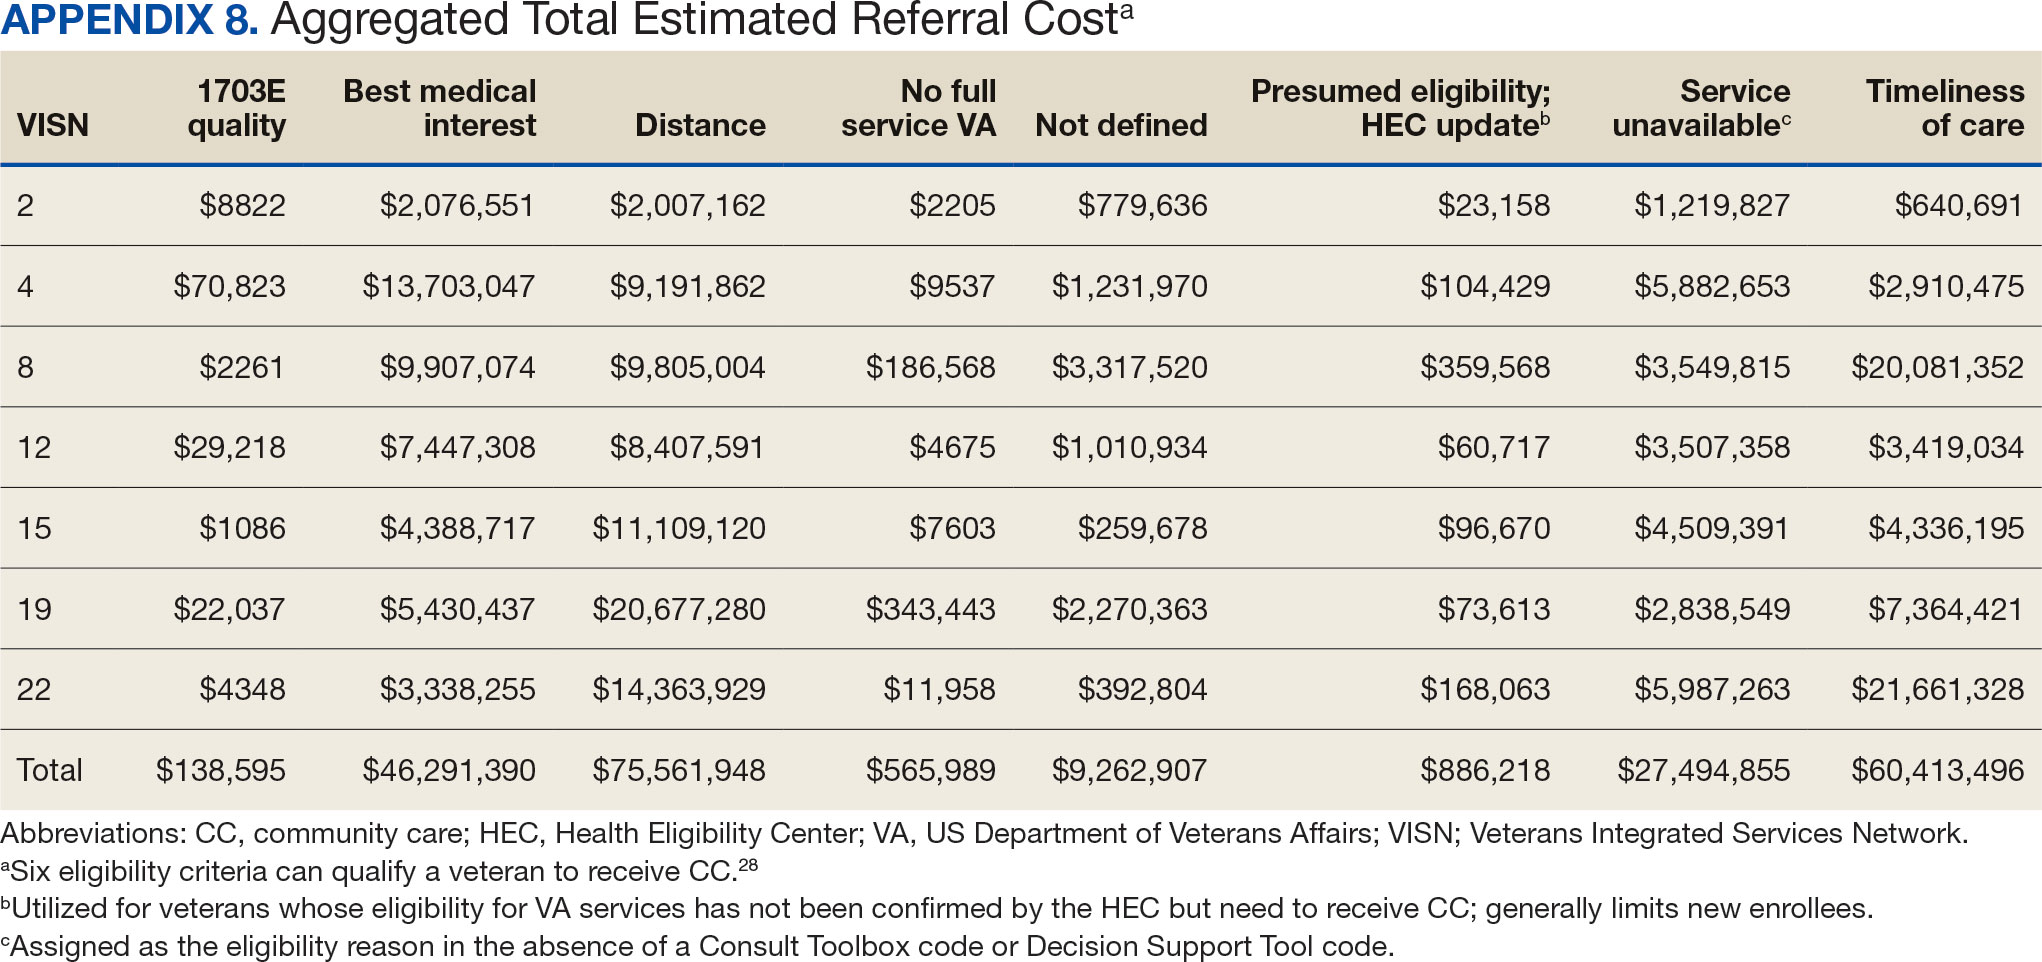
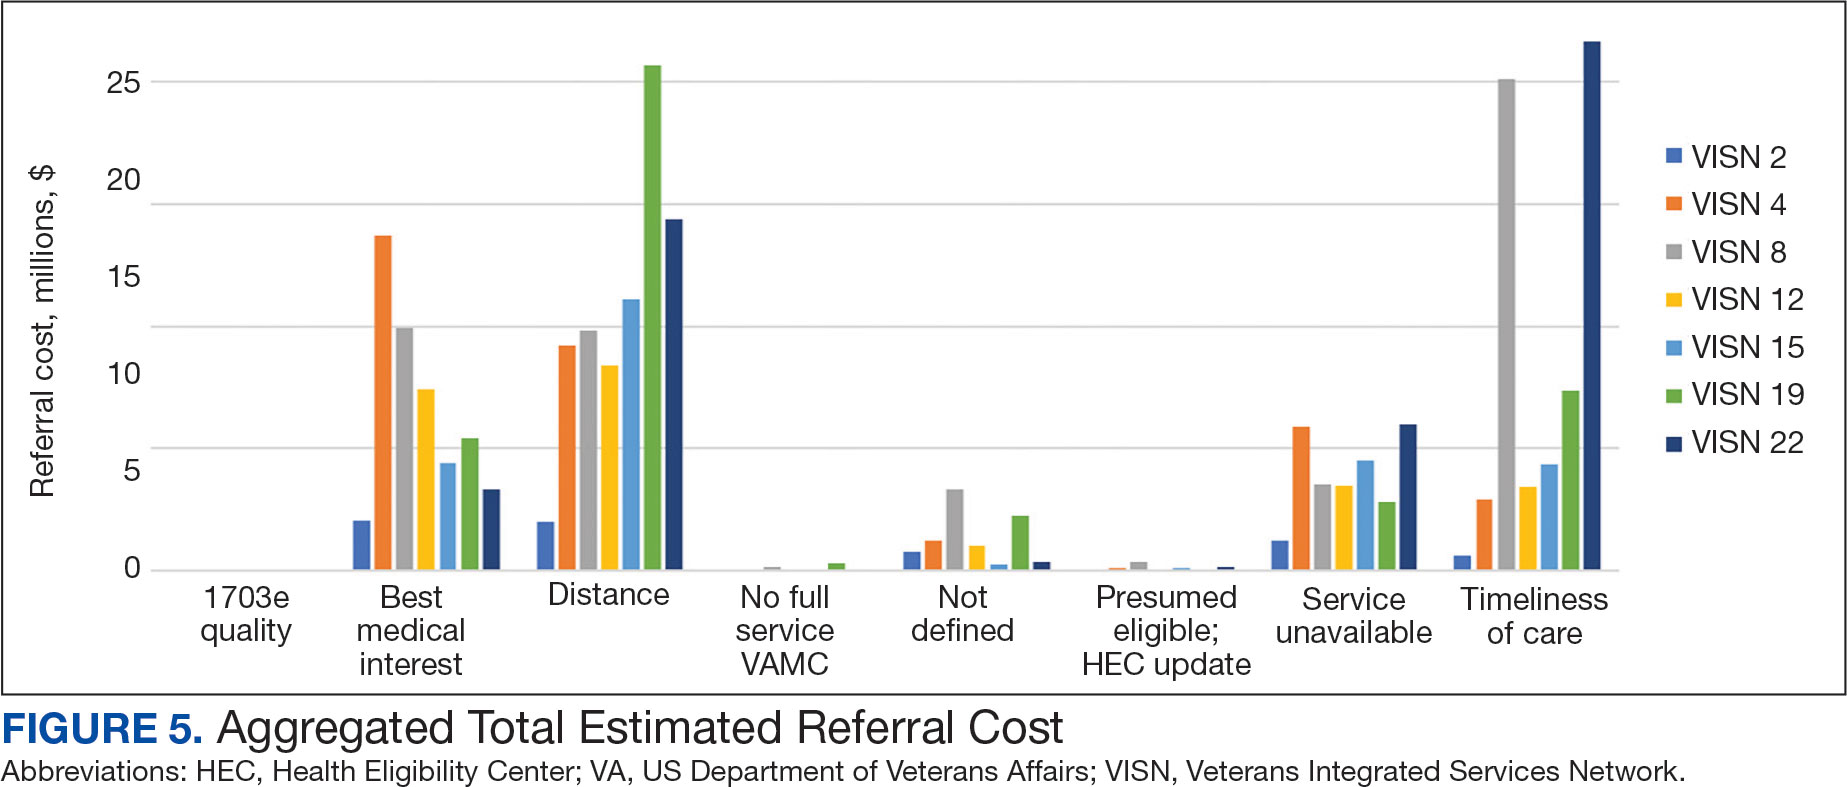
Overall costs were primarily driven by specific VISNs within each eligibility type (Appendix 8; Figure 5). VISN 19, VISN 22, and VISN 15 accounted for the highest referral costs for distance; VISN 22, VISN 8, and VISN 19 accounted for the secondhighest referral cost, timeliness of care; and VISN 4, VISN 8, and VISN 12 accounted for the third-highest referral cost, best medical interest (Figure 5). VISN 2, VISN 4, VISN 12, VISN 15, and VISN 22 had service unavailable as an eligibility type with 1 of the top 3 associated referral costs, which was higher in cost than timeliness of care for VISN 2, VISN 4, VISN 12, and VISN 15.
Discussion
This study examines the referral of rehabilitation PT services to CC, evaluates CC costs for PT services, and analyzes utilization and cost trends among veterans within the VHA. Utilization data demonstrated a decrease in referrals from FY 2019 to FY 2020 and increases in referrals from FY 2020 to FY 2022 for most variables of interest, with cost data exhibiting similar trends. Results highlight the need for further investigation to address variations in PT referrals and costs across VISNs and eligibility reasons for CC referral.
Results demonstrated a noteworthy increase in PT CC referrals over time. The largest increase occurred from FY 2020 to FY 2021, with a smaller increase from FY 2021 to FY 2022. During this period, total enrollee numbers decreased by 3.0% across the 7 VISNs included in this analysis and by 1.6% across all VISNs, a trend that illustrates an overall decrease in enrollees as CC use increased. Results align with the implementation of the MISSION Act of 2018, which further expanded veterans’ options to use CC.1,6,7 Results also align with the onset of the COVID-19 pandemic, which disrupted care access for many veterans, placed a larger emphasis on the use of telehealth, and increased opportunities to stay within the VA for care by rapidly shifting to telehealth and leveraging telerehabilitation investments and initiatives (such as TR-EWI).20,31
VISN 8, VISN 19, and VISN 22, accounted for more than half of PT referrals. These VISNs had higher enrollee counts compared to the other VISNs.32 VISN 8 consistently had high levels of referrals, whereas VISN 19 and VISN 22 saw dramatic increases in FY 2021 and FY 2022. In contrast, VISN 4 and VISN 12 gradually decreased referrals during the study. VISN 2 had the lowest referral numbers during the study period, and all stations with the lowest individual referral numbers were located within VISN 2. Of the VISNs included in this study, VISN 2 had the second lowest number of enrollees (324,042).32 Reasons for increases and decreases over time could not be determined based on data collected in this study.
There were more urban than rural PT CC referrals; however, both exhibited an increase in referrals over time. This is consistent with population trends showing that most VHA patients (62.6%) and veterans (75.9%) reside in urban areas, which could explain some of the trends in this study.33 Some VISNs have larger urban catchment areas (eg, VISN 8 and VISN 22), and some have larger rural catchment areas (eg, VISN 15 and VISN 19), which could partially explain the rural-urban differences by VISN.32 Rural-urban referral trends might also reflect existing health care delivery system deficits in rural areas and known challenges associated with accessing health care for veterans living in rural communities.8,9
This study found larger differences in rural and urban PT CC referrals for younger age groups, with more than twice as many urban referrals in veterans aged 20 to 29 years and aged 30 to 39 years, and roughly 1.8 times as many urban referrals in veterans aged 40 to 49 years. However, there were similar numbers of rural and urban referrals in those aged 70 to 79 years and aged 80 to 89 years. These trends are consistent with data showing veterans residing in rural communities are older than their urban counterparts.23,34 Data suggest that older veteran populations might seek PT at higher rates than younger veteran populations. Moreover, data suggest there could be differences in PT-seeking rates for younger veteran populations who reside in rural vs urban areas. Additional research is needed to understand these trends.
Distance and timeliness of care were the predominant reasons for referral among eligibility groups, which is consistent with the MISSION Act goals.1,6,7 The most common eligibility reason for rural referrals was distance; timeliness of care was most common for urban referrals. This finding is expected, as veterans living in rural communities are farther away from VHA facilities and have longer drive times, whereas veterans living in urban communities might live closer, yet experience longer wait times due to services and/or appointment availability. Best medical interest accounted for almost 20% of referrals, which does not provide detailed insights into why those veterans were referred to CC.
The top PT diagnoses referred to CC were related to bone, joint, or soft tissue disorders of the lower back, shoulder, and knee. This suggests that musculoskeletal-related issues are prevalent among veterans seeking PT care, which is consistent with research that found > 50% of veterans receiving VHA care have musculoskeletal disorders.35 The probability of experiencing musculoskeletal problems increases with age, as does the need for PT services. Amputations and fractures accounted for < 1% of CC referrals, which is consistent with the historic provision of VHA clinical specialized care to conditions prevalent among veterans. It may also represent VHA efforts to internally provide care for complex conditions requiring more extensive interdisciplinary coordination.
The total cost of referrals over time was about $221 million. VISN 8 accounted for the highest overall cost; VISN 2 had the lowest, mirroring referral utilization trends and aligning with VISN enrollee numbers. VISN 19 and VISN 22 reported large cost increases from FY 2020 to FY 2021. Total referral costs increased by $34.9 million from FY 2020 to FY 2021, which may be due to health care inflation (2.9% during FY 2019 to FY 2022), increased awareness of CC services, or increased VHA wait times.36 Additionally, there were limitations in care provided across health care systems during the COVID-19 pandemic, including the VA.5 The increase from FY 2020 to FY 2021 may reflect a rebound from restrictions in appointments across VA, CC, and the private sector.
While the increase in total referral cost may be partly attributed to inflation, the cost effectiveness and efficiency of referring veterans to CC vs keeping veterans within VHA care is an ongoing debate.5 Examining and addressing cost drivers within the top eligibility types and their respective VISNs is necessary to determine resource allocation and improve quality of care. This study found that best medical interest and unavailable services accounted for 33.4% of the total cost of CC referrals, highlighting the need for policies that strengthen in-house competencies and recruit personnel to provide PT services currently unavailable within the VA.
Future Directions
The VHA should explore opportunities for in-house care, especially for services appropriate for telehealth.18,20,37 Data indicated a smaller cost increase from FY 2021 to FY 2022 compared to the relatively large increase from FY 2020 to FY 2021. The increased telehealth usage across VHA by TR-EWI and non—TR-EWI sites within selected VISNs may have contributed to limiting the increase in CC costs. Future studies should investigate contextual factors of increased telehealth usage, which would offer guidance for implementation to optimize the integration of telehealth with PT rehabilitation provided in-house. Additionally, future studies can examine potential limitations experienced during PT telehealth visits, such as the inability to conduct hands-on assessments, challenges in viewing the quality of patient movement, ensuring patient safety in the remote environment, and the lack of PT equipment in homes for telehealth visits, and how these challenges are being addressed.38,39 Research is also needed to understand tradeoffs of CC vs VHA care and the potential and cost benefits of keeping veterans within VHA using programs like TR-EWI.5 Veterans living in rural communities may especially benefit from this as expanding telehealth options can provide access to PT care that may not be readily available, enabling them to stay connected and engaged in their care.18,40
Future studies could examine contributory factors to rising costs, such as demographic shifts, changes in PT service utilization, and policy. Researchers might also consider qualitative studies with clinicians and veterans within each VISN, which may provide insights into how local factors impact PT referral to the community.
Limitations
Due to its descriptive nature, this study can only speculate about factors influencing trends. Limitations include the inability to link the Palantir and CC Dashboard datasets for cost comparisons and potential data change over time on Palantir due to platform updates. The focus on VISNs with TREWI sites limited generalizability and this study did not compare CC PT vs VHA PT. Finally, there may have been cost drivers not identified in this study.
Conclusions
This descriptive study provides insights into the utilization and cost of PT CC referrals for selected VISNs. Cost trends underscore the financial commitment to providing PT services to veterans. Understanding what factors are driving this cost is necessary for VHA to optimally provide and manage the rehabilitation resources needed to serve veterans through traditional in-person care, telehealth, and CC options while ensuring timely, highquality care.
- Congressional Budget Office. The Veterans Community Care Program: Background and Early Effects. October 26, 2021. Accessed September 23, 2024. https://www.cbo.gov/publication/57257
- US Dept of Veterans Affairs. Providing Health Care for Veterans. Updated September 10, 2024. Accessed September 23, 2024. https://www.va.gov/health/
- Davila H, Rosen AK, Beilstein-Wedel E, Shwartz M, Chatelain LJ, Gurewich D. Rural veterans’ experiences with outpatient care in the Veterans Health Administration versus community care. Med Care. 2021;59(Suppl 3):S286-S291. doi:10.1097/MLR.0000000000001552
- Vanneman ME, Wagner TH, Shwartz M, et al. Veterans’ experiences with outpatient care: comparing the Veterans Affairs system with community-based care. Health Aff (Millwood). 2020;39(8):1368-1376. doi:10.1377/hlthaff.2019.01375
- Rasmussen P, Farmer CM. The promise and challenges of VA community care: veterans’ issues in focus. Rand Health Q. 2023;10(3):9.
- Feyman Y, Legler A, Griffith KN. Appointment wait time data for primary & specialty care in veterans health administration facilities vs. community medical centers. Data Brief. 2021;36:107134. doi:10.1016/j.dib.2021.107134
- Kelley AT, Greenstone CL, Kirsh SR. Defining access and the role of community care in the Veterans Health Administration. J Gen Intern Med. 2020;35(5):1584-1585. doi:10.1007/s11606-019-05358-z
- Garvin LA, Pugatch M, Gurewich D, Pendergast JN, Miller CJ. Interorganizational care coordination of rural veterans by Veterans Affairs and community care programs: a systematic review. Med Care. 2021;59(Suppl 3):S259-S269. doi:10.1097/MLR.0000000000001542
- US Dept of Veterans Affairs, Office of Rural Health. Rural Veterans: Rural Veteran Health Care Challenges. Updated May 14, 2024. Accessed September 23, 2024. https:// www.ruralhealth.va.gov/aboutus/ruralvets.asp
- Ohl ME, Carrell M, Thurman A, et al. “Availability of healthcare providers for rural veterans eligible for purchased care under the veterans choice act.” BMC Health Serv Res. 2018;18(1):315. doi:10.1186/s12913-018-3108-8
- Mattocks KM, Cunningham KJ, Greenstone C, Atkins D, Rosen AK, Upton M. Innovations in community care programs, policies, and research. Med Care. 2021;59(Suppl 3):S229-S231. doi:10.1097/MLR.0000000000001550
- Doyle JM, Streeter RA. Veterans’ location in health professional shortage areas: implications for access to care and workforce supply. Health Serv Res. 2017;52 Suppl 1(Suppl 1):459-480. doi:10.1111/1475-6773.12633
- Patzel M, Barnes C, Ramalingam N, et al. Jumping through hoops: community care clinician and staff experiences providing primary care to rural veterans. J Gen Intern Med. 2023;38(Suppl 3):821-828. doi:10.1007/s11606-023-08126-2
- Mattocks KM, Kroll-Desrosiers A, Kinney R, Elwy AR, Cunningham KJ, Mengeling MA. Understanding VA’s use of and relationships with community care providers under the MISSION Act. Med Care. 2021;59(Suppl 3):S252-S258. doi:10.1097/MLR.0000000000001545
- Olenick M, Flowers M, Diaz VJ. US veterans and their unique issues: enhancing health care professional awareness. Adv Med Educ Pract. 2015;6:635-639. doi:10.2147/AMEP.S89479
- Campbell P, Pope R, Simas V, Canetti E, Schram B, Orr R. The effects of early physiotherapy treatment on musculoskeletal injury outcomes in military personnel: a narrative review. Int J Environ Res Public Health. 2022;19(20):13416. doi:10.3390/ijerph192013416
- Gurewich D, Shwartz M, Beilstein-Wedel E, Davila H, Rosen AK. Did access to care improve since passage of the veterans choice act? Differences between rural and urban veterans. Med Care. 2021;59(Suppl 3):S270-S278. doi:10.1097/MLR.0000000000001490
- Myers US, Birks A, Grubaugh AL, Axon RN. Flattening the curve by getting ahead of it: how the VA healthcare system is leveraging telehealth to provide continued access to care for rural veterans. J Rural Health. 2021;37(1):194-196. doi:10.1111/jrh.12449
- Hale-Gallardo JL, Kreider CM, Jia H, et al. Telerehabilitation for rural veterans: a qualitative assessment of barriers and facilitators to implementation. J Multidiscip Healthc. 2020;13:559-570. doi:10.2147/JMDH.S247267
- Kreider CM, Hale-Gallardo J, Kramer JC, et al. Providers’ shift to telerehabilitation at the U.S. Veterans Health Administration during COVID-19: practical applications. Front Public Health. 2022;10:831762. doi:10.3389/fpubh.2022.831762
- Cowper-Ripley DC, Jia H, Wang X, et al. Trends in VA telerehabilitation patients and encounters over time and by rurality. Fed Pract. 2019;36(3):122-128.
- US Dept of Veterans Affairs, Office of Rural Health. VHA Office of Rural Health. Updated August 30, 2024. Accessed September 23, 2024. https://www.ruralhealth.va.gov/index.asp
- National Center for Veterans Analysis and Statistics. Rural Veterans: 2021-2023. April 2023. Accessed September 23, 2024. https://www.datahub.va.gov/stories/s/Rural-Veterans-FY2021-2023/kkh2-eymp/
- U.S. Department of Veterans Affairs, Office of Research & Development. Program Guide: 1200.21, VHA Operations Activities That May Constitute Research. January 9, 2019. https://www.research.va.gov/resources/policies/ProgramGuide-1200-21-VHA-Operations-Activities.pdf
- Ogrinc G, Davies L, Goodman D, Batalden P, Davidoff F, Stevens D. SQUIRE 2.0 (Standards for QUality Improvement Reporting Excellence): revised publication guidelines from a detailed consensus process. J Nurs Care Qual. 2016;31(1):1-8. doi:10.1097/NCQ.0000000000000153
- US Dept of Veterans Affairs. Veterans Health Administration: Veterans Integrated Service Networks (VISNs). Updated January 29, 2024. Accessed September 23, 2024. https://www.va.gov/HEALTH/visns.asp
- Stomberg C, Frost A, Becker C, Stang H, Windschitl M, Carrier E. Community Care referral dashboard [Data dashboard]. https://app.powerbigov.us/groups/me/reports/090d22a7-0e1f-4cc5-bea8-0a1b87aa0bd9/ReportSectionacfd03cdebd76ffca9ec [Source not verified]
- US Dept of Veterans Affairs. Eligibility for community care outside VA. Updated May 30, 2024. Accessed September 23, 2024. https://www.va.gov/COMMUNITYCARE/programs/veterans/General_Care.asp
- US Department of Veterans Affairs, Office of Rural Health. How to define rurality fact sheet. Updated December 2023. Accessed January 28, 2025. https://www.ruralhealth.va.gov/docs/ORH_RuralityFactSheet_508.pdf
- Rural-Urban Commuting Area Codes. Economic Research Service, US Dept of Agriculture. Updated September 25, 2023. Accessed September 23, 2024. https://www.ers.usda.gov/data-products/rural-urban-commuting-area-codes.aspx
- Gurewich D, Beilstein-Wedel E, Shwartz M, Davila H, Rosen AK. Disparities in wait times for care among US veterans by race and ethnici t y. JAMA Netw Open. 2023;6(1):e2252061. doi:10.1001/jamanetworkopen.2022.52061
- U.S. Department of Veterans Affairs, VA Office of Rural Health, Veterans Rural Health Resource Center-Gainesville, GeoSpatial Outcomes Division. VA and Community Healthcare, and VHA Rurality web map application. Published 2023. https://portal.vhagis.inv.vaec.va.gov/arcgis/apps/webappbuilder/index.html [source not verified]
- Chartbook on Healthcare for Veterans: National Healthcare Quality and Disparities Report. Agency for Healthcare Research and Quality; November 2020. Accessed September 23, 2024. https://www.ahrq.gov/research/findings/nhqrdr/chartbooks/veterans/index.html
- Lum HD, Nearing K, Pimentel CB, Levy CR, Hung WW. Anywhere to anywhere: use of telehealth to increase health care access for older, rural veterans. Public Policy Aging Rep. 2020;30(1):12-18. doi:10.1093/ppar/prz030
- Goulet JL, Kerns RD, Bair M, et al. The musculoskeletal diagnosis cohort: examining pain and pain care among veterans. Pain. 2016;157(8):1696-1703. doi:10.1097/j.pain.0000000000000567
- US Inflation Calculator. Health Care Inflation in the United States (1948-2024). Accessed September 23, 2024. https://www.usinflationcalculator.com/inflation/health-care-inflation-in-the-united-states/
- Cottrell MA, Galea OA, O’Leary SP, Hill AJ, Russell TG. Real-time telerehabilitation for the treatment of musculoskeletal conditions is effective and comparable to standard practice: a systematic review and meta-analysis. Clin Rehabil. 2017;31(5):625-638. doi:10.1177/0269215516645148
- Elor A, Conde S, Powel l M, Robbins A, Chen NN, Kurniawan S. Physical therapist impressions of telehealth and virtual reality needs amidst a pandemic. Front Virtual Real. 2022;3. doi:10.3389/frvir.2022.915332
- Lee AC, Harada N. Telehealth as a means of health care delivery for physical therapist practice. Phys Ther. 2012;92(3):463-468. doi:10.2522/ptj.20110100
- Hynes DM, Edwards S, Hickok A, et al. Veterans’ use of Veterans Health Administration primary care in an era of expanding choice. Med Care. 2021;59(Suppl 3):S292- S300. doi:10.1097/MLR.0000000000001554
The Veterans Health Administration (VHA) is the largest US integrated health system, providing care to veterans through VHA and non-VHA practitioners and facilities.1,2 Providing high-quality, timely, and veteran-centric care remains a priority for the VHA. Legislative efforts have expanded opportunities for eligible veterans to receive care in the community purchased by VHA, known as community care (CC).1 The Veterans Access, Choice, and Accountability Act of 2014 came in response to reports of long wait times and drive times for patients.3-5 The MISSION Act of 2018 expanded access to CC by streamlining it and broadening eligibility criteria, especially for veterans in rural communities who often experience more barriers in accessing care than veterans living in urban communities.1,6-10 Since the implementation of the Choice and MISSION Acts, > 2.7 million veterans have received care through community practitioners within the VHA CC network.11
Background
Increased access to CC could benefit veterans living in rural communities by increasing care options and circumventing challenges to accessing VHA care (ie, geographic, transportation, and distance barriers, practitioner and specialist shortages, and hospital closures). 5,9,10,12,13 However, health care system deficits in rural areas could also limit CC effectiveness for veterans living in those communities. 3 Other challenges posed by using CC include care coordination, information sharing, care continuity, delayed payments to CC practitioners, and mixed findings regarding CC quality.5,8,13,14 VHA practitioners are specifically trained to meet the multifaceted needs unique to veterans’ health and subculture, training CC practitioners may not receive.5,15
CC offers services for primary care and a broad range of specialties, including rehabilitation services such as physical therapy (PT).6 PT is used for the effective treatment of various conditions veterans experience and promote wellbeing and independence.16 US Department of Veterans Affairs (VA) databases reveal a high prevalence of veterans receiving PT services through CC; PT is one of the most frequently used CC outpatient specialty services by veterans living in rural communities.14,17
Telerehabitltation Enterprisewide Initiative
VHA has greatly invested in delivering care virtually, especially for veterans living in rural communities.18 In 2017, the VHA Office of Rural Health funded the Telerehabilitation Enterprise-Wide Initiative (TR-EWI) in partnership with the Physical Medicine and Rehabilitation Services national program office to increase access to specialized rehabilitation services for veterans living in rural communities by leveraging telehealth technologies.18-21 This alternative mode of health care delivery allows clinicians to overcome access barriers by delivering rehabilitation therapies directly to veterans' homes or nearby community-based outpatient clinics. TR-EWI was conceived as a hub-and-spoke model, where rehabilitation expertise at the hub was virtually delivered to spoke sites that did not have in-house expertise. In subsequent years, the TR-EWI also evolved to provide targeted telerehabilitation programs within rural-serving community-based outpatient clinics, including PT as a predominant service.19,20
As TR-EWI progressed—and in conjunction with the uptake of telehealth across VHA during the COVID-19 pandemic—there has been increased focus on PT telerehabilitation, especially for the 4.6 million veterans in rural communities.18,22,23 Because health care delivery system deficits in rural areas could limit the effective use of CC, many TR-EWI sites hope to reduce their CC referrals by providing telehealth PT services to veterans who might otherwise need to be referred to CC. This strategy aligns with VHA goals of providing high-quality and timely care. To better understand opportunities for programs like TR-EWI to provide rehabilitation services for veterans and reduce care sent to the community, research that examines CC referral trends for PT over time is warranted.
This study examines CC from a rehabilitation perspective with a focus on CC referral trends for PT, specifically for Veterans Integrated Service Networks (VISNs) where TREWI sites are located. The study’s objectives were to describe rehabilitation PT services being referred to CC and examine associated CC costs for PT services. Two research questions guided the study. First, what are the utilization trends for CC PT referrals from fiscal year (FY) 2019 to FY 2022? Secondly, what is the cost breakdown of CC for PT referrals from FY 2020 to FY 2022?
Methods
This study was conducted by a multidisciplinary team comprised of public health, disability, rehabilitation counseling, and PT professionals. It was deemed a quality improvement project under VA guidance and followed the SQUIRE guidelines for quality improvement reporting.24,25 The study used the VA Common Operating Platform (Palantir) to obtain individual-level CC referral data from the HealthShare Referral Manager (HSRM) database and consult data from the Computerized Patient Record System. Palantir is used to store and integrate VA data derived from the VA Corporate Data Warehouse and VHA Support Service Center. Referrals are authorizations for care to be delivered by a CC practitioner.
TR-EWI is comprised of 7 sites: VISN 2, VISN 4, VISN 8, VISN 12, VISN 15, VISN 19, and VISN 22. Each site provides telerehabilitation services with an emphasis on reaching veterans living in rural communities. We joined the referrals and consults cubes in Palantir to extract PT referrals for FY 2019 to FY 2022 for the 7 VISNs with TR-EWI sites and obtain referral-specific information and demographic characteristics. 26 Data were extracted in October 2022.
The VHA Community Care Referral Dashboard (CC Dashboard) provided nonindividual level CC cost data.27 The CC Dashboard provides insights into the costs of CC services for VHA enrollees by category of care, standardized episode of care, and eligibility. Data are based on nationallevel HSRM referrals that are not suspended or linked to a canceled or discontinued consult. Data were aggregated by VISN. The dashboard only includes referrals dating back to FY 2020; therefore, PT data from FY 2020 through FY 2022 for VISNs with TR-EWI sites were collected. Data were extracted in December 2022.
This study examined CC referrals, station name, eligibility types, clinical diagnoses (International Classification of Diseases, Tenth Revision codes), and demographic information in the Palantir dataset. Six eligibility criteria can qualify a veteran to receive CC.28 Within clinical diagnoses, the variable of interest was the provisional diagnosis. Patient demographics included age, gender, and rurality of residence, as determined by the Rural-Urban Commuting Area system.29,30 Rural and highly rural categories were combined for analysis. For the CC cost dataset, this study examined CC referrals, referral cost, and eligibility type.
Analysis
For the first research question, we examined referral data from FY 2019 to FY 2022 using the Palantir dataset, performed descriptive statistical analysis for all variables, and analyzed data to identify trends. Descriptive statistics were completed using IBM SPSS Statistics for Windows Version 29.0.0.0.
A qualitative analysis of provisional diagnosis data revealed what is being referred to CC for PT. A preliminary overview of provisional diagnosis data was conducted to familiarize coders with the data. We developed a coding framework to categorize diagnoses based on anatomical location, body structure, and clinical areas of interest. Data were reviewed individually and grouped into categories within the coding framework before meeting as a team to achieve group consensus on categorization. We then totaled the frequency of occurrence for provisional diagnoses within each category. Qualitative analyses were completed using Microsoft Excel.
For the second research question, the study used the CC cost dataset to examine the cost breakdown of CC PT referrals from FY 2020 to FY 2022. We calculated the number and cost of PT referrals across eligibility groups for each FY and VISN. Data were analyzed using SPSS to identify cost trends.
Results
There were 344,406 referrals to CC for PT from FY 2019 to FY 2022 for the 7 VISNs analyzed (Table 1). Of these, 22.5% were from FY 2019, 19.1% from FY 2020, 28.2% from FY 2021, and 30.3% from FY 2022. VISN 8 and VISN 22 reported the most overall PT referrals, with VISN 8 comprising 22.2% and VISN 22 comprising 18.1% of all referrals. VISN 2 reported the least overall referrals (3.7%). VISN 4 and VISN 12 had decreases in referrals over time. VISN 2 and VISN 15 had decreases in referrals from FY 2019 to FY 2021 and slight increases from FY 2021 to FY 2022. VISN 19 and VISN 22 both saw slight increases from FY 2019 to FY 2020 and substantial increases from FY 2020 to FY 2022, with FY 2022 accounting for 40.0% and 42.3% of all referrals for VISN 19 and VISN 20, respectively (Figure 1).
For FY 2019 and FY 2020, VISN 8 had the highest percentage of referrals (26.7% and 23.2%, respectively), whereas VISN 22 was among the lowest (7.3% and 11.4%, respectively). However, for FY 2021 and FY 2022, VISN 22 reported the highest percentage of referrals (23.5% and 25.3%, respectively) compared to all other VISNs. VISN 2 consistently reported the lowest percentage of referrals across all years.
There were 56 stations analyzed across the 7 VISNs (Appendix 1). Nine stations each accounted for ≥ 3.0% of the total PT referrals and only 2 stations accounted for > 5.0% of referrals. Orlando, Florida (6.0%), Philadelphia, Pennsylvania (5.2%), Tampa, Florida (4.9%), Aurora, Colorado (4.9%), and Gainesville, Florida (4.4%) reported the top 5 highest referrals, with 3 being from VISN 8 (Orlando, Tampa, Gainesville). Stations with the lowest reported referrals were all in VISN 2 in New York: The Bronx, (0%), New York Harbor (0%), Hudson Valley (0.1%) and Finger Lakes (0.2%).
Rurality
Urban stations comprised 56.2% and rural stations comprised 39.8% of PT CC referrals, while 0.2% of referrals were from insular isle US territories: Guam, American Samoa, Northern Marianas, and the Virgin Islands. The sample had missing or unknown data for 3.8% of referrals. FY 2022 had the largest difference in rural and urban referrals. Additionally, there was an overall trend of more referrals over time for rural and urban, with a large increase in rural (+40.0%) and urban (+62.7%) referrals from FY 2020 to FY 2021 and a modest increase from FY 2021 to FY 2022 (+5.2% for rural and +9.1% for urban). There was a decrease in rural (-7.0%) and urban (-3.5%) referrals from FY 2019 to FY 2020 (Figure 2).
There were differences in referrals by rurality and VISN (Table 2). VISN 12, VISN 15, and VISN 19 reported more rural than urban referrals, whereas VISN 4, VISN 8, and VISN 22 reported more urban than rural referrals. VISN 2 reported similar numbers for both, with slightly more urban than rural referrals. When reviewing trends over time for each FY, VISN 12, VISN 15, and VISN 19 reported more rural than urban referrals and VISN 4, VISN 8, and VISN 22 had more urban than rural referrals. In FY 2019 and FY 2020, VISN 2 reported slightly more urban than rural referrals but almost the same number of referrals in FY 2021 and FY 2022 (Appendix 2).
Demographics
The mean (SD) age was 61.2 (15.8) years (range, 20-105). Most PT CC referrals were for veterans aged 70 to 79 years (26.9%), followed by 60 to 69 years (20.7%), and 50 to 59 years (16.4%) (Appendix 3). Trends were consistent across VISNs. There was less of a difference between rural and urban referral percentages as the population aged. Veterans aged < 49 years residing in more urban areas accounted for more referrals to CC compared to their rural counterparts. This difference was less apparent in the 70 to 79 years and 80 to 89 years age brackets.
Most PT CC referrals (81.2%) were male and 14.8% were female. About 3.6% of referral data were missing sex information, and there was a smaller difference between male veterans living in rural communities and male veterans living in urban communities compared with female veterans. A total of 42.9% of male veterans resided in rural areas compared to 56.8% in urban areas; 32.7% of female veterans resided in rural areas compared to 66.9% in urban areas (Appendix 3).
Other Criteria
Of the 334,406 referrals, 114,983 (34.4%) had eligibility data, mostly from FY 2021 and FY 2022 (Table 3). Available eligibility data were likely affected by the MISSION Act and new regulations for reporting CC eligibility. Distance (33.4%) was the most common eligibility criteria, followed by timeliness of care (28.8%), and best medical interest (19.8%); 40.4% were rural and 59.5% were urban. Distance (55.4%) was most common for rural veterans, while timeliness of care (39.7%) was most common for urban veterans. For both groups, the second most common eligibility reason was best medical interest (Appendix 4).
Bone, joint, or soft tissue disorders were common diagnoses, with 25.2% located in the lower back, 14.7% in the shoulder, and 12.8% in the knee (Appendix 5). Amputations of the upper and lower limbs, fractures, cancer-related diagnoses, integumentary system disorders, thoracic and abdominal injuries and disorders, and other medical and mental health conditions each accounted for < 1% of the total diagnoses.
Costs
At time of analysis, the CC Dashboard had cost data available for 200,204 CC PT referrals from FY 2020 to FY 2022. The difference in referral numbers for the 2 datasets is likely attributed to several factors: CC cost data is exclusively from the HSRM, whereas Palantir includes other data sources; how VA cleans data pulled into Palantir; how the CC Dashboard algorithm populates data; and variances based on timing of reporting and/or if referrals are eventually canceled.
The total cost of PT CC referrals from FY 2020 to FY 2022 in selected VISNs was about $220,615,399 (Appendix 6). Appendix 7 details the methodology for determining the average standardized episode- of-care cost by VISN and how referral costs are calculated. Data show a continuous increase in total estimated cost from $46.8 million in FY 2020 to $92.1 million in FY 2022. From FY 2020 to FY 2022, aggregate costs ranged from $6,758,053 in VISN 2 to $47,209,162 in VISN 8 (Figure 3). The total referral cost for PT was highest at VISN 4 in FY 2020 ($10,447,140) and highest at VISN 22 in FY 2021 ($18,835,657) and FY 2022 ($22,962,438) (Figure 4). For referral costs from FY 2020 to FY 2022, distance accounted for $75,561,948 (34.3%), timeliness of care accounted for $60,413,496 (27.3%), and best medical interest accounted for $46,291,390 (21.0%) (Table 4).
Overall costs were primarily driven by specific VISNs within each eligibility type (Appendix 8; Figure 5). VISN 19, VISN 22, and VISN 15 accounted for the highest referral costs for distance; VISN 22, VISN 8, and VISN 19 accounted for the secondhighest referral cost, timeliness of care; and VISN 4, VISN 8, and VISN 12 accounted for the third-highest referral cost, best medical interest (Figure 5). VISN 2, VISN 4, VISN 12, VISN 15, and VISN 22 had service unavailable as an eligibility type with 1 of the top 3 associated referral costs, which was higher in cost than timeliness of care for VISN 2, VISN 4, VISN 12, and VISN 15.
Discussion
This study examines the referral of rehabilitation PT services to CC, evaluates CC costs for PT services, and analyzes utilization and cost trends among veterans within the VHA. Utilization data demonstrated a decrease in referrals from FY 2019 to FY 2020 and increases in referrals from FY 2020 to FY 2022 for most variables of interest, with cost data exhibiting similar trends. Results highlight the need for further investigation to address variations in PT referrals and costs across VISNs and eligibility reasons for CC referral.
Results demonstrated a noteworthy increase in PT CC referrals over time. The largest increase occurred from FY 2020 to FY 2021, with a smaller increase from FY 2021 to FY 2022. During this period, total enrollee numbers decreased by 3.0% across the 7 VISNs included in this analysis and by 1.6% across all VISNs, a trend that illustrates an overall decrease in enrollees as CC use increased. Results align with the implementation of the MISSION Act of 2018, which further expanded veterans’ options to use CC.1,6,7 Results also align with the onset of the COVID-19 pandemic, which disrupted care access for many veterans, placed a larger emphasis on the use of telehealth, and increased opportunities to stay within the VA for care by rapidly shifting to telehealth and leveraging telerehabilitation investments and initiatives (such as TR-EWI).20,31
VISN 8, VISN 19, and VISN 22, accounted for more than half of PT referrals. These VISNs had higher enrollee counts compared to the other VISNs.32 VISN 8 consistently had high levels of referrals, whereas VISN 19 and VISN 22 saw dramatic increases in FY 2021 and FY 2022. In contrast, VISN 4 and VISN 12 gradually decreased referrals during the study. VISN 2 had the lowest referral numbers during the study period, and all stations with the lowest individual referral numbers were located within VISN 2. Of the VISNs included in this study, VISN 2 had the second lowest number of enrollees (324,042).32 Reasons for increases and decreases over time could not be determined based on data collected in this study.
There were more urban than rural PT CC referrals; however, both exhibited an increase in referrals over time. This is consistent with population trends showing that most VHA patients (62.6%) and veterans (75.9%) reside in urban areas, which could explain some of the trends in this study.33 Some VISNs have larger urban catchment areas (eg, VISN 8 and VISN 22), and some have larger rural catchment areas (eg, VISN 15 and VISN 19), which could partially explain the rural-urban differences by VISN.32 Rural-urban referral trends might also reflect existing health care delivery system deficits in rural areas and known challenges associated with accessing health care for veterans living in rural communities.8,9
This study found larger differences in rural and urban PT CC referrals for younger age groups, with more than twice as many urban referrals in veterans aged 20 to 29 years and aged 30 to 39 years, and roughly 1.8 times as many urban referrals in veterans aged 40 to 49 years. However, there were similar numbers of rural and urban referrals in those aged 70 to 79 years and aged 80 to 89 years. These trends are consistent with data showing veterans residing in rural communities are older than their urban counterparts.23,34 Data suggest that older veteran populations might seek PT at higher rates than younger veteran populations. Moreover, data suggest there could be differences in PT-seeking rates for younger veteran populations who reside in rural vs urban areas. Additional research is needed to understand these trends.
Distance and timeliness of care were the predominant reasons for referral among eligibility groups, which is consistent with the MISSION Act goals.1,6,7 The most common eligibility reason for rural referrals was distance; timeliness of care was most common for urban referrals. This finding is expected, as veterans living in rural communities are farther away from VHA facilities and have longer drive times, whereas veterans living in urban communities might live closer, yet experience longer wait times due to services and/or appointment availability. Best medical interest accounted for almost 20% of referrals, which does not provide detailed insights into why those veterans were referred to CC.
The top PT diagnoses referred to CC were related to bone, joint, or soft tissue disorders of the lower back, shoulder, and knee. This suggests that musculoskeletal-related issues are prevalent among veterans seeking PT care, which is consistent with research that found > 50% of veterans receiving VHA care have musculoskeletal disorders.35 The probability of experiencing musculoskeletal problems increases with age, as does the need for PT services. Amputations and fractures accounted for < 1% of CC referrals, which is consistent with the historic provision of VHA clinical specialized care to conditions prevalent among veterans. It may also represent VHA efforts to internally provide care for complex conditions requiring more extensive interdisciplinary coordination.
The total cost of referrals over time was about $221 million. VISN 8 accounted for the highest overall cost; VISN 2 had the lowest, mirroring referral utilization trends and aligning with VISN enrollee numbers. VISN 19 and VISN 22 reported large cost increases from FY 2020 to FY 2021. Total referral costs increased by $34.9 million from FY 2020 to FY 2021, which may be due to health care inflation (2.9% during FY 2019 to FY 2022), increased awareness of CC services, or increased VHA wait times.36 Additionally, there were limitations in care provided across health care systems during the COVID-19 pandemic, including the VA.5 The increase from FY 2020 to FY 2021 may reflect a rebound from restrictions in appointments across VA, CC, and the private sector.
While the increase in total referral cost may be partly attributed to inflation, the cost effectiveness and efficiency of referring veterans to CC vs keeping veterans within VHA care is an ongoing debate.5 Examining and addressing cost drivers within the top eligibility types and their respective VISNs is necessary to determine resource allocation and improve quality of care. This study found that best medical interest and unavailable services accounted for 33.4% of the total cost of CC referrals, highlighting the need for policies that strengthen in-house competencies and recruit personnel to provide PT services currently unavailable within the VA.
Future Directions
The VHA should explore opportunities for in-house care, especially for services appropriate for telehealth.18,20,37 Data indicated a smaller cost increase from FY 2021 to FY 2022 compared to the relatively large increase from FY 2020 to FY 2021. The increased telehealth usage across VHA by TR-EWI and non—TR-EWI sites within selected VISNs may have contributed to limiting the increase in CC costs. Future studies should investigate contextual factors of increased telehealth usage, which would offer guidance for implementation to optimize the integration of telehealth with PT rehabilitation provided in-house. Additionally, future studies can examine potential limitations experienced during PT telehealth visits, such as the inability to conduct hands-on assessments, challenges in viewing the quality of patient movement, ensuring patient safety in the remote environment, and the lack of PT equipment in homes for telehealth visits, and how these challenges are being addressed.38,39 Research is also needed to understand tradeoffs of CC vs VHA care and the potential and cost benefits of keeping veterans within VHA using programs like TR-EWI.5 Veterans living in rural communities may especially benefit from this as expanding telehealth options can provide access to PT care that may not be readily available, enabling them to stay connected and engaged in their care.18,40
Future studies could examine contributory factors to rising costs, such as demographic shifts, changes in PT service utilization, and policy. Researchers might also consider qualitative studies with clinicians and veterans within each VISN, which may provide insights into how local factors impact PT referral to the community.
Limitations
Due to its descriptive nature, this study can only speculate about factors influencing trends. Limitations include the inability to link the Palantir and CC Dashboard datasets for cost comparisons and potential data change over time on Palantir due to platform updates. The focus on VISNs with TREWI sites limited generalizability and this study did not compare CC PT vs VHA PT. Finally, there may have been cost drivers not identified in this study.
Conclusions
This descriptive study provides insights into the utilization and cost of PT CC referrals for selected VISNs. Cost trends underscore the financial commitment to providing PT services to veterans. Understanding what factors are driving this cost is necessary for VHA to optimally provide and manage the rehabilitation resources needed to serve veterans through traditional in-person care, telehealth, and CC options while ensuring timely, highquality care.
- Congressional Budget Office. The Veterans Community Care Program: Background and Early Effects. October 26, 2021. Accessed September 23, 2024. https://www.cbo.gov/publication/57257
- US Dept of Veterans Affairs. Providing Health Care for Veterans. Updated September 10, 2024. Accessed September 23, 2024. https://www.va.gov/health/
- Davila H, Rosen AK, Beilstein-Wedel E, Shwartz M, Chatelain LJ, Gurewich D. Rural veterans’ experiences with outpatient care in the Veterans Health Administration versus community care. Med Care. 2021;59(Suppl 3):S286-S291. doi:10.1097/MLR.0000000000001552
- Vanneman ME, Wagner TH, Shwartz M, et al. Veterans’ experiences with outpatient care: comparing the Veterans Affairs system with community-based care. Health Aff (Millwood). 2020;39(8):1368-1376. doi:10.1377/hlthaff.2019.01375
- Rasmussen P, Farmer CM. The promise and challenges of VA community care: veterans’ issues in focus. Rand Health Q. 2023;10(3):9.
- Feyman Y, Legler A, Griffith KN. Appointment wait time data for primary & specialty care in veterans health administration facilities vs. community medical centers. Data Brief. 2021;36:107134. doi:10.1016/j.dib.2021.107134
- Kelley AT, Greenstone CL, Kirsh SR. Defining access and the role of community care in the Veterans Health Administration. J Gen Intern Med. 2020;35(5):1584-1585. doi:10.1007/s11606-019-05358-z
- Garvin LA, Pugatch M, Gurewich D, Pendergast JN, Miller CJ. Interorganizational care coordination of rural veterans by Veterans Affairs and community care programs: a systematic review. Med Care. 2021;59(Suppl 3):S259-S269. doi:10.1097/MLR.0000000000001542
- US Dept of Veterans Affairs, Office of Rural Health. Rural Veterans: Rural Veteran Health Care Challenges. Updated May 14, 2024. Accessed September 23, 2024. https:// www.ruralhealth.va.gov/aboutus/ruralvets.asp
- Ohl ME, Carrell M, Thurman A, et al. “Availability of healthcare providers for rural veterans eligible for purchased care under the veterans choice act.” BMC Health Serv Res. 2018;18(1):315. doi:10.1186/s12913-018-3108-8
- Mattocks KM, Cunningham KJ, Greenstone C, Atkins D, Rosen AK, Upton M. Innovations in community care programs, policies, and research. Med Care. 2021;59(Suppl 3):S229-S231. doi:10.1097/MLR.0000000000001550
- Doyle JM, Streeter RA. Veterans’ location in health professional shortage areas: implications for access to care and workforce supply. Health Serv Res. 2017;52 Suppl 1(Suppl 1):459-480. doi:10.1111/1475-6773.12633
- Patzel M, Barnes C, Ramalingam N, et al. Jumping through hoops: community care clinician and staff experiences providing primary care to rural veterans. J Gen Intern Med. 2023;38(Suppl 3):821-828. doi:10.1007/s11606-023-08126-2
- Mattocks KM, Kroll-Desrosiers A, Kinney R, Elwy AR, Cunningham KJ, Mengeling MA. Understanding VA’s use of and relationships with community care providers under the MISSION Act. Med Care. 2021;59(Suppl 3):S252-S258. doi:10.1097/MLR.0000000000001545
- Olenick M, Flowers M, Diaz VJ. US veterans and their unique issues: enhancing health care professional awareness. Adv Med Educ Pract. 2015;6:635-639. doi:10.2147/AMEP.S89479
- Campbell P, Pope R, Simas V, Canetti E, Schram B, Orr R. The effects of early physiotherapy treatment on musculoskeletal injury outcomes in military personnel: a narrative review. Int J Environ Res Public Health. 2022;19(20):13416. doi:10.3390/ijerph192013416
- Gurewich D, Shwartz M, Beilstein-Wedel E, Davila H, Rosen AK. Did access to care improve since passage of the veterans choice act? Differences between rural and urban veterans. Med Care. 2021;59(Suppl 3):S270-S278. doi:10.1097/MLR.0000000000001490
- Myers US, Birks A, Grubaugh AL, Axon RN. Flattening the curve by getting ahead of it: how the VA healthcare system is leveraging telehealth to provide continued access to care for rural veterans. J Rural Health. 2021;37(1):194-196. doi:10.1111/jrh.12449
- Hale-Gallardo JL, Kreider CM, Jia H, et al. Telerehabilitation for rural veterans: a qualitative assessment of barriers and facilitators to implementation. J Multidiscip Healthc. 2020;13:559-570. doi:10.2147/JMDH.S247267
- Kreider CM, Hale-Gallardo J, Kramer JC, et al. Providers’ shift to telerehabilitation at the U.S. Veterans Health Administration during COVID-19: practical applications. Front Public Health. 2022;10:831762. doi:10.3389/fpubh.2022.831762
- Cowper-Ripley DC, Jia H, Wang X, et al. Trends in VA telerehabilitation patients and encounters over time and by rurality. Fed Pract. 2019;36(3):122-128.
- US Dept of Veterans Affairs, Office of Rural Health. VHA Office of Rural Health. Updated August 30, 2024. Accessed September 23, 2024. https://www.ruralhealth.va.gov/index.asp
- National Center for Veterans Analysis and Statistics. Rural Veterans: 2021-2023. April 2023. Accessed September 23, 2024. https://www.datahub.va.gov/stories/s/Rural-Veterans-FY2021-2023/kkh2-eymp/
- U.S. Department of Veterans Affairs, Office of Research & Development. Program Guide: 1200.21, VHA Operations Activities That May Constitute Research. January 9, 2019. https://www.research.va.gov/resources/policies/ProgramGuide-1200-21-VHA-Operations-Activities.pdf
- Ogrinc G, Davies L, Goodman D, Batalden P, Davidoff F, Stevens D. SQUIRE 2.0 (Standards for QUality Improvement Reporting Excellence): revised publication guidelines from a detailed consensus process. J Nurs Care Qual. 2016;31(1):1-8. doi:10.1097/NCQ.0000000000000153
- US Dept of Veterans Affairs. Veterans Health Administration: Veterans Integrated Service Networks (VISNs). Updated January 29, 2024. Accessed September 23, 2024. https://www.va.gov/HEALTH/visns.asp
- Stomberg C, Frost A, Becker C, Stang H, Windschitl M, Carrier E. Community Care referral dashboard [Data dashboard]. https://app.powerbigov.us/groups/me/reports/090d22a7-0e1f-4cc5-bea8-0a1b87aa0bd9/ReportSectionacfd03cdebd76ffca9ec [Source not verified]
- US Dept of Veterans Affairs. Eligibility for community care outside VA. Updated May 30, 2024. Accessed September 23, 2024. https://www.va.gov/COMMUNITYCARE/programs/veterans/General_Care.asp
- US Department of Veterans Affairs, Office of Rural Health. How to define rurality fact sheet. Updated December 2023. Accessed January 28, 2025. https://www.ruralhealth.va.gov/docs/ORH_RuralityFactSheet_508.pdf
- Rural-Urban Commuting Area Codes. Economic Research Service, US Dept of Agriculture. Updated September 25, 2023. Accessed September 23, 2024. https://www.ers.usda.gov/data-products/rural-urban-commuting-area-codes.aspx
- Gurewich D, Beilstein-Wedel E, Shwartz M, Davila H, Rosen AK. Disparities in wait times for care among US veterans by race and ethnici t y. JAMA Netw Open. 2023;6(1):e2252061. doi:10.1001/jamanetworkopen.2022.52061
- U.S. Department of Veterans Affairs, VA Office of Rural Health, Veterans Rural Health Resource Center-Gainesville, GeoSpatial Outcomes Division. VA and Community Healthcare, and VHA Rurality web map application. Published 2023. https://portal.vhagis.inv.vaec.va.gov/arcgis/apps/webappbuilder/index.html [source not verified]
- Chartbook on Healthcare for Veterans: National Healthcare Quality and Disparities Report. Agency for Healthcare Research and Quality; November 2020. Accessed September 23, 2024. https://www.ahrq.gov/research/findings/nhqrdr/chartbooks/veterans/index.html
- Lum HD, Nearing K, Pimentel CB, Levy CR, Hung WW. Anywhere to anywhere: use of telehealth to increase health care access for older, rural veterans. Public Policy Aging Rep. 2020;30(1):12-18. doi:10.1093/ppar/prz030
- Goulet JL, Kerns RD, Bair M, et al. The musculoskeletal diagnosis cohort: examining pain and pain care among veterans. Pain. 2016;157(8):1696-1703. doi:10.1097/j.pain.0000000000000567
- US Inflation Calculator. Health Care Inflation in the United States (1948-2024). Accessed September 23, 2024. https://www.usinflationcalculator.com/inflation/health-care-inflation-in-the-united-states/
- Cottrell MA, Galea OA, O’Leary SP, Hill AJ, Russell TG. Real-time telerehabilitation for the treatment of musculoskeletal conditions is effective and comparable to standard practice: a systematic review and meta-analysis. Clin Rehabil. 2017;31(5):625-638. doi:10.1177/0269215516645148
- Elor A, Conde S, Powel l M, Robbins A, Chen NN, Kurniawan S. Physical therapist impressions of telehealth and virtual reality needs amidst a pandemic. Front Virtual Real. 2022;3. doi:10.3389/frvir.2022.915332
- Lee AC, Harada N. Telehealth as a means of health care delivery for physical therapist practice. Phys Ther. 2012;92(3):463-468. doi:10.2522/ptj.20110100
- Hynes DM, Edwards S, Hickok A, et al. Veterans’ use of Veterans Health Administration primary care in an era of expanding choice. Med Care. 2021;59(Suppl 3):S292- S300. doi:10.1097/MLR.0000000000001554
Utilization and Cost of Veterans Health Administration Referrals to Community Care-Based Physical Therapy
Utilization and Cost of Veterans Health Administration Referrals to Community Care-Based Physical Therapy

Impact of 3 Months of Supervised Exercise on Function by Arthritis Status
Impact of 3 Months of Supervised Exercise on Function by Arthritis Status
About half of US adults aged ≥ 65 years report arthritis, and of those, 44% have an arthritis-attributable activity limitation.1,2 Arthritis is a significant health issue for veterans, with veterans reporting higher rates of disability compared with the civilian population.3
Osteoarthritis (OA) is the most common type of arthritis.4 Among individuals aged ≥ 40 years, the incidence of OA is nearly twice as high among veterans compared with civilians and is a leading cause of separation from military service and disability.5,6 OA pain and disability have been shown to be associated with increases in health care and medication use, including opioids, nonsteroidal anti-inflammatory medications, and muscle relaxants.7,8 Because OA is chronic and has no cure, safe and effective management strategies—such as exercise— are critical to minimize pain and maintain physical function.9
Exercise can reduce pain and disability associated with OA and is a first-line recommendation in guidelines for the treatment of knee and hip OA.9 Given the limited exercise and high levels of physical inactivity among veterans with OA, there is a need to identify opportunities that support veterans with OA engaging in regular exercise.
Gerofit, an outpatient clinical exercise program available at 30 Veterans Health Administration (VHA) sites, may provide an opportunity for older veterans with arthritis to engage in exercise.10 Gerofit is specifically designed for veterans aged ≥ 65 years. It is not disease-specific and supports older veterans with multiple chronic conditions, including OA. Veterans aged ≥ 65 years with a referral from a VA clinician are eligible for Gerofit. Those who are unable to perform activities of daily living; unable to independently function without assistance; have a history of unstable angina, proliferative diabetic retinopathy, oxygen dependence, volatile behavioral issues, or are unable to work successfully in a group environment/setting; experience active substance abuse, homelessness, or uncontrolled incontinence; and have open wounds that cannot be appropriately dressed are excluded from Gerofit. Exercise sessions are held 3 times per week and last from 60 to 90 minutes. Sessions are supervised by Gerofit staff and include personalized exercise prescriptions based on functional assessments. Exercise prescriptions include aerobic, resistance, and balance/flexibility components and are modified by the Gerofit program staff as needed. Gerofit adopts a functional fitness approach and includes individual progression as appropriate according to evidence-based guidelines, using the Borg ratings of perceived exertion. 11 Assessments are performed at baseline, 3 months, 6 months, and annually thereafter. Clinical staff conduct all assessments, including physical function testing, and record them in a database. Assessments are reviewed with the veteran to chart progress and identify future goals or needs. Veterans perform personalized self-paced exercises in the Gerofit group setting. Exercise prescriptions are continuously modified to meet individualized needs and goals. Veterans may participate continuously with no end date.
Participation in supervised exercise is associated with improved physical function and individuals with arthritis can improve function even though their baseline functional status is lower than individuals without arthritis. 12 In this analysis, we examine the impact of exercise on the status and location of arthritis (upper body, lower body, or both). Lower body arthritis is more common than upper body arthritis and lower extremity function is associated with increased ability to perform activities of daily living, resulting in independence among older adults.13,14 We also include upper body strength measures to capture important functional movements such as reaching and pulling.15 Among those who participate in Gerofit, the greatest gains in physical function occur during the initial 3 months, which tend to be sustained over 12 months.16 For this reason, this study focused on the initial 3 months of the program.
Older adults with arthritis may have pain and functional limitations that exceed those of the general older adult population. Exercise programs for older adults that do not specifically target arthritis but are able to improve physical function among those with arthritis could potentially increase access to exercise for older adults living with arthritis. Therefore, the purpose of this study was to determine whether change in physical function with participation in Gerofit for 3 months varies by arthritis status, including no arthritis, any arthritis, lower body arthritis, or both upper and lower body arthritis compared with no arthritis.
Methods
This is a secondary analysis of previously collected data from 10 VHA Gerofit sites (Ann Arbor, Baltimore, Greater Los Angeles, Canandaigua, Cincinnati, Miami, Honolulu, Denver, Durham, and Pittsburgh) from 2002 to 2019. Implementation data regarding the consistency of the program delivery at Gerofit expansion sites have been previously published.16 Although the delivery of Gerofit transitioned to telehealth due to COVID-19, data for this analysis were collected from in-person exercise sessions prior to the pandemic.17 Data were collected for clinical purposes. This project was part of the Gerofit quality improvement initiative and was reviewed and approved by the Durham Institutional Review Board as quality improvement.
Participants in Gerofit who completed baseline and 3-month assessments were included to analyze the effects of exercise on physical function. At each of the time points, physical functional assessments included: (1) usual gait speed (> 10 meters [m/s], or 10- meter walk test [10MWT]); (2) lower body strength (chair stands [number completed in 30 seconds]); (3) upper body strength (number of arm curls [5-lb for females/8-lb for males] completed in 30 seconds); and (4) 6-minute walk distance [6MWD] in meters to measure aerobic endurance). These measures have been validated in older adults.18-21 Arm curls were added to the physical function assessments after the 10MWT, chair stands, and 6MWD; therefore, fewer participants had data for this measure. Participants self-reported at baseline on 45 common medical conditions, including arthritis or rheumatism (both upper body and lower body were offered as choices). Self-reporting has been shown to be an acceptable method of identifying arthritis in adults.22
Descriptive statistics at baseline were calculated for all participants. One-way analysis of variance and X2 tests were used to determine differences in baseline characteristics across arthritis status. The primary outcomes were changes in physical function measures from baseline to 3 months by arthritis status. Arthritis status was defined as: any arthritis, which includes individuals who reported upper body arthritis, lower body arthritis, or both; and arthritis status individuals reporting either upper body arthritis, lower body arthritis, or both. Categories of arthritis for arthritis status were mutually exclusive. Two separate linear models were constructed for each of the 4 physical function measures, with change from baseline to 3 months as the outcome (dependent variable) and arthritis status, age, and body mass index (BMI) as predictors (independent variables). The first model compared any arthritis with no arthritis and the second model compared arthritis status (both upper and lower body arthritis vs lower body arthritis) with no arthritis. These models were used to obtain mean changes and 95% CIs in physical function and to test for differences in the change in physical function measures by arthritis status. Statistical analyses were performed using R software, version 4.0.3.
Results
Baseline and 3-month data were available for 737 Gerofit participants and included in the analysis. The mean (SD) age was 73.5 (7.1) years. A total of 707 participants were male (95.9%) and 322 (43.6%) reported some arthritis, with arthritis in both the upper and lower body being reported by 168 participants (52.2%) (Table 1). There were no differences in age, sex, or race for those with any arthritis compared with those with no arthritis, but BMI was significantly higher in those reporting any arthritis compared with no arthritis. For the baseline functional measures, statistically significant differences were observed between those with no arthritis and those reporting any arthritis for the 10MWT (P = .001), chair stands (P = .046), and 6MWD (P = .001), but not for arm curls (P = .77), with those with no arthritis performing better.
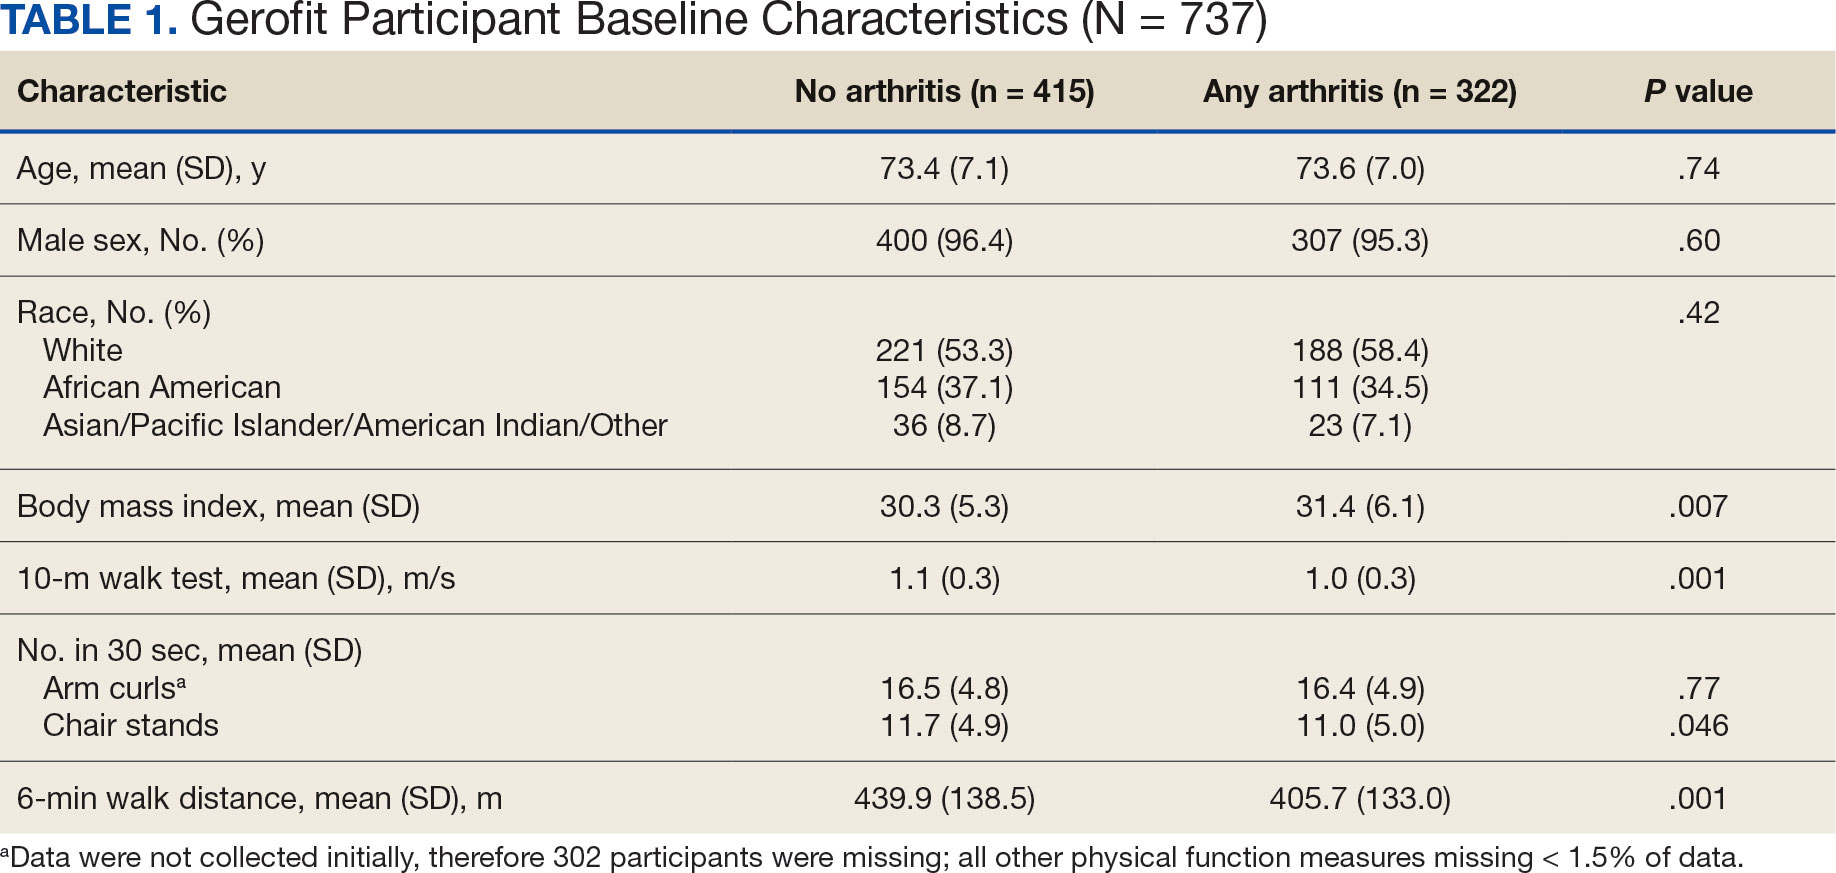
All 4 arthritis status groups showed improvements in each of the physical function measures over 3 months. For the 10MWT the mean change (95% CI) in gait speed (m/s) was 0.06 (0.04-0.08) for patients with no arthritis, 0.07 (0.05- 0.08) for any arthritis, 0.07 (0.04-0.11) for lower body arthritis, and 0.07 (0.04- 0.09) for both lower and upper body arthritis. For the number of arm curls in 30 seconds the mean change (95% CI) was 2.3 (1.8-2.8) for patients with no arthritis, 2.1 (1.5-2.6) for any arthritis, 2.0 (1.1-3.0) for lower body arthritis, and 1.9 (1.1-2.7) for both lower and upper body arthritis. For the number of chair stands in 30 seconds the mean change (95% CI) was 2.1 (1.7-2.4) for patients with no arthritis, 2.2 (1.8-2.6) for any arthritis, 2.3 (1.6-2.9), for lower body arthritis, and 2.0 (1.5-2.5) for both lower and upper body arthritis. For the 6MWD distance in meters the mean change (95% CI) was 21.5 (15.5-27.4) for patients with no arthritis, 28.6 (21.9-35.3) for any arthritis, 30.4 (19.5-41.3) for lower body arthritis, and 28.6 (19.2-38.0) for both lower and upper body arthritis (Figure).
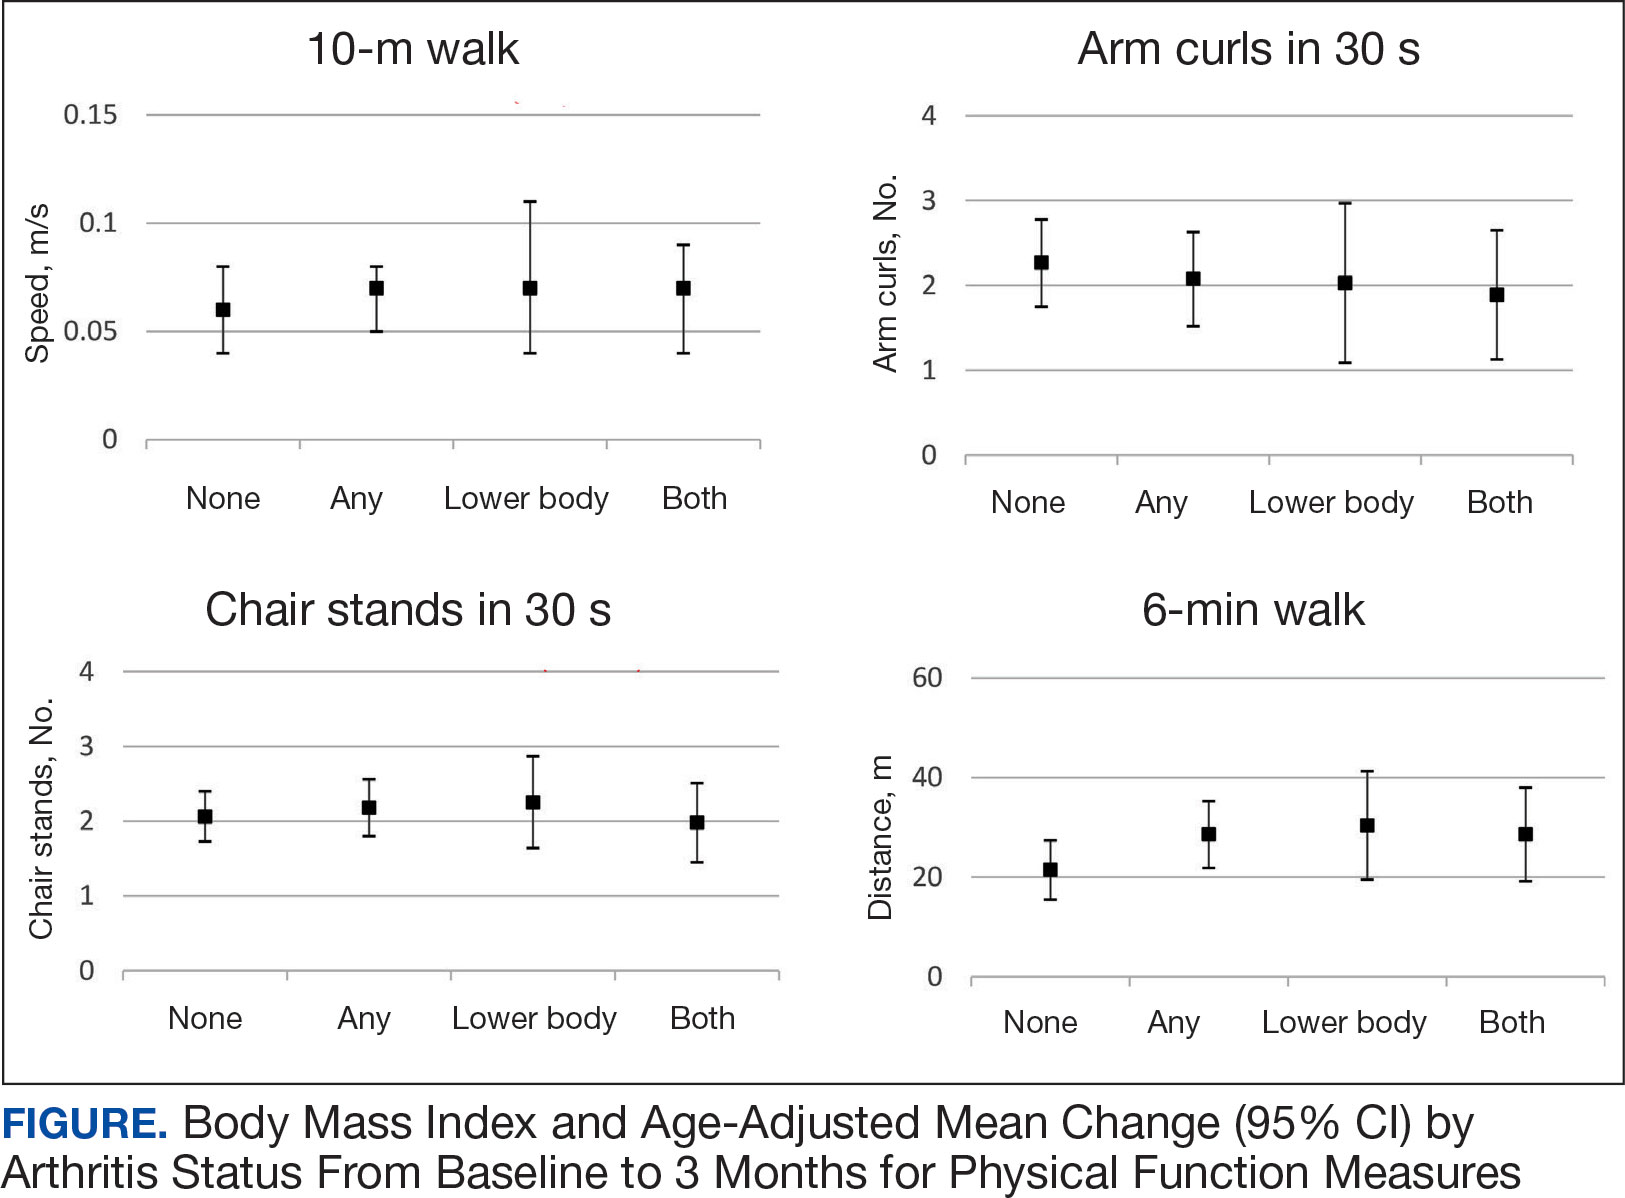
We used 2 models to measure the change from baseline to 3 months for each of the arthritis groups. Model 1 compared any arthritis vs no arthritis and model 2 compared lower body arthritis and both upper and lower body arthritis vs no arthritis for each physical function measure (Table 2). There were no statistically significant differences in 3-month change in physical function for any of the physical function measures between arthritis groups after adjusting for age and BMI.
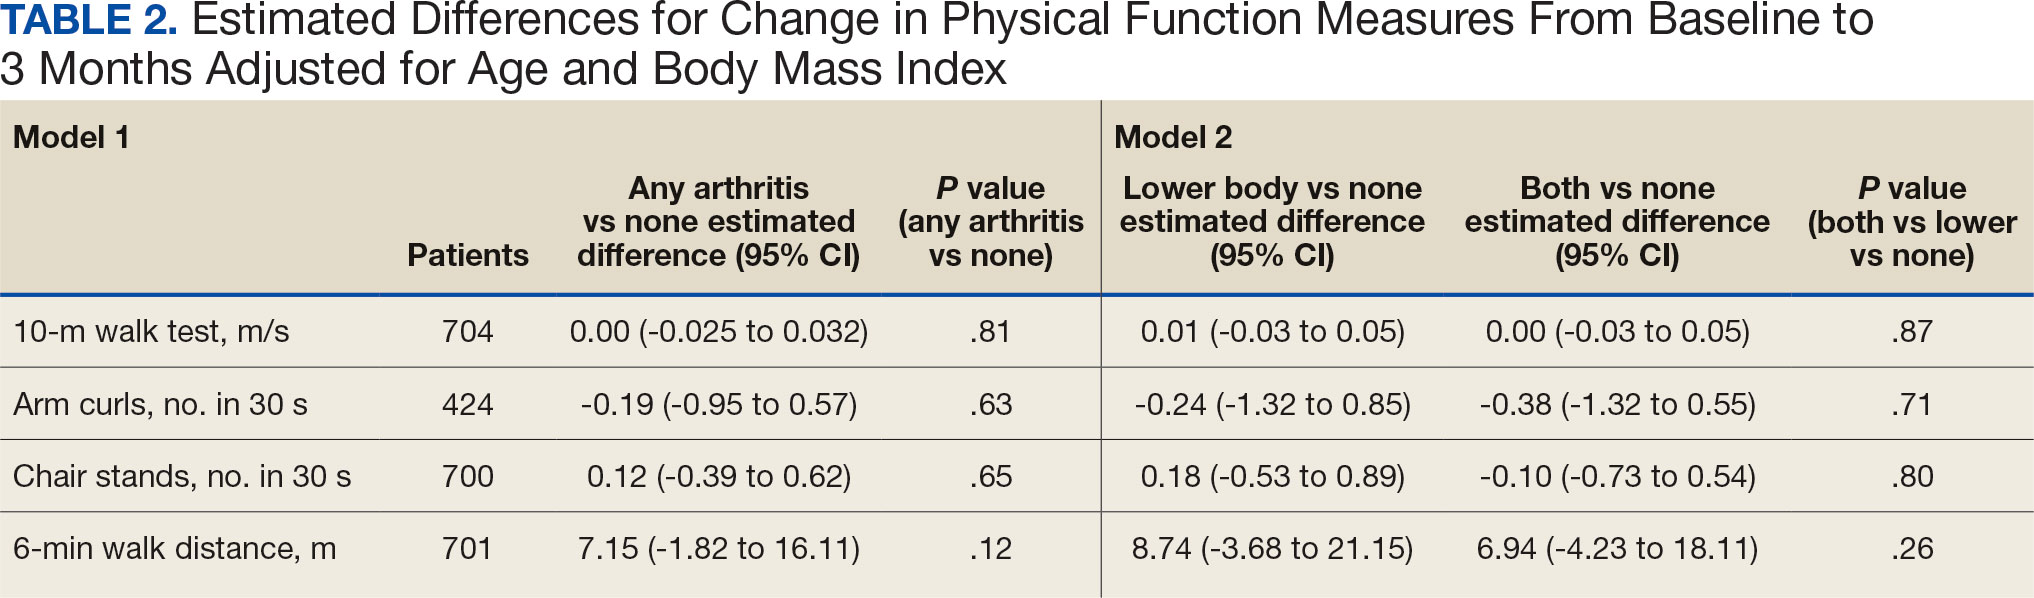
Discussion
Participation in Gerofit was associated with functional gains among all participants over 3 months, regardless of arthritis status. Older veterans reporting any arthritis had significantly lower physical function scores upon enrollment into Gerofit compared with those veterans reporting no arthritis. However, compared with individuals who reported no arthritis, individuals who reported arthritis (any arthritis, lower body arthritis only, or both lower and upper body arthritis) experienced similar improvements (ie, no statistically significant differences in mean change from baseline to follow-up among those with and without arthritis). This study suggests that progressive, multicomponent exercise programs for older adults may be beneficial for those with arthritis.
Involvement of multiple sites of arthritis is associated with moderate to severe functional limitations as well as lower healthrelated quality of life.23 While it has been found that individuals with arthritis can improve function with supervised exercise, even though their baseline functional status is lower than individuals without arthritis, it was not clear whether individuals with multiple joint involvement also would benefit.12 The results of this study suggest that these individuals can improve across various domains of physical function despite variation in arthritis location and status. As incidence of arthritis increases with age, targeting older adults for exercise programs such as Gerofit may improve functional limitations and health-related quality of life associated with arthritis.2
We evaluated physical function using multiple measures to assess upper (arm curls) and lower (chair stands, 10MWT) extremity physical function and aerobic endurance (6MWD). Participants in this study reached clinically meaningful changes with 3 months of participation in Gerofit for most of the physical function measures. Gerofit participants had a mean gait speed improvement of 0.05 to 0.07 m/s compared with 0.10 to 0.30 m/s, which was reported previously. 24,25 In this study, nearly all groups achieved the clinically important improvements in the chair stand in 30 seconds (2.0 to 2.6) and the 6MWD (21.8 to 59.1 m) that have been reported in the literature.24-26
The Osteoarthritis Research Society International recommends the chair stand and 6MWD performance-based tests for individuals with hip and knee arthritis because they align with patient-reported outcomes and represent the types of activities relevant to this population.27 The findings of this study suggest that improvement in these physical function measures with participation in exercise align with data from arthritis-specific exercise programs designed for wide implementation. Hughes and colleagues reported improvements in the 6MWD after the 8-week Fit and Strong exercise intervention, which included walking and lower body resistance training.28 The Arthritis Foundation’s Walk With Ease program is a 6-week walking program that has shown improvements in chair stands and gait speed.29 Another Arthritis Foundation program, People with Arthritis Can Exercise, is an 8-week course consisting of a variety of resistance, aerobic, and balance activities. This program has been associated with increases in chair stands but not gait speed or 6MWD.30,31
This study found that participation in a VHA outpatient clinical supervised exercise program results in improvements in physical function that can be realized by older adults regardless of arthritis burden. Gerofit programs typically require 1.5 to 2.0 dedicated full-time equivalent employees to run the program effectively and additional administrative support, depending on size of the program.32 The cost savings generated by the program include reductions in hospitalization rates, emergency department visits, days in hospital, and medication use and provide a compelling argument for the program’s financial viability to health care systems through long-term savings and improved health outcomes for older adults.33-36
While evidenced-based arthritis programs exist, this study illustrates that an exercise program without a focus on arthritis also improves physical function, potentially reducing the risk of disability related to arthritis. The clinical implication for these findings is that arthritis-specific exercise programs may not be needed to achieve functional improvements in individuals with arthritis. This is critical for under-resourced or exercise- limited health care systems or communities. Therefore, if exercise programming is limited, or arthritis-specific programs and interventions are not available, nonspecific exercise programs will also be beneficial to individuals with arthritis. Thus, individuals with arthritis should be encouraged to participate in any available exercise programming to achieve improvements in physical function. In addition, many older adults have multiple comorbidities, most of which improve with participation in exercise. 37 Disease-specific exercise programs can offer tailored exercises and coaching related to common barriers in participation, such as joint pain for arthritis.31 It is unclear whether these additional programmatic components are associated with greater improvements in outcomes, such as physical function. More research is needed to explore the benefits of disease-specific tailored exercise programs compared with general exercise programs.
Strengths and Limitations
This study demonstrated the effect of participation in a clinical, supervised exercise program in a real-world setting. It suggests that even exercise programs not specifically targeted for arthritis populations can improve physical function among those with arthritis.
As a VHA clinical supervised exercise program, Gerofit may not be generalizable to all older adults or other exercise programs. In addition, this analysis only included a veteran population that was > 95% male and may not be generalizable to other populations. Arthritis status was defined by self-report and not verified in the health record. However, this approach has been shown to be acceptable in this setting and the most common type of arthritis in this population (OA) is a painful musculoskeletal condition associated with functional limitations.4,22,38,39 Self-reported arthritis or rheumatism is associated with functional limitations.1 Therefore, it is unlikely that the results would differ for physician-diagnosed or radiographically defined OA. Additionally, the study did not have data on the total number of joints with arthritis or arthritis severity but rather used upper body, lower body, and both upper and lower body arthritis as a proxy for arthritis status. While our models were adjusted for age and BMI, 2 known confounding factors for the association between arthritis and physical function, there are other potential confounding factors that were not included in the models. 40,41 Finally, this study only included individuals with completed baseline and 3-month follow-up assessments, and the individuals who participated for longer or shorter periods may have had different physical function outcomes than individuals included in this study.
Conclusions
Participation in 3 months VHA Gerofit outpatient supervised exercise programs can improve physical function for all older adults, regardless of arthritis status. These programs may increase access to exercise programming that is beneficial for common conditions affecting older adults, such as arthritis.
- Centers for Disease Control and Prevention. Prevalence and most common causes of disability among adults- -United States, 2005. MMWR Morb Mortal Wkly Rep. 2009;58:421-426.
- Theis KA, Murphy LB, Guglielmo D, et al. Prevalence of arthritis and arthritis-attributable activity limitation—United States, 2016–2018. MMWR Morb Mortal Wkly Rep. 2021;70:1401-1407. doi:10.15585/mmwr.mm7040a2
- Murphy LB, Helmick CG, Allen KD, et al. Arthritis among veterans—United States, 2011–2013. MMWR Morb Mortal Wkly Rep. 2014;63:999-1003.
- Park J, Mendy A, Vieira ER. Various types of arthritis in the United States: prevalence and age-related trends from 1999 to 2014. Am J Public Health. 2018;108:256-258.
- Cameron KL, Hsiao MS, Owens BD, Burks R, Svoboda SJ. Incidence of physician-diagnosed osteoarthritis among active duty United States military service members. Arthritis Rheum. 2011;63:2974-2982. doi:10.1002/art.30498
- Patzkowski JC, Rivera JC, Ficke JR, Wenke JC. The changing face of disability in the US Army: the Operation Enduring Freedom and Operation Iraqi Freedom effect. J Am Acad Orthop Surg. 2012;20(suppl 1):S23-S30. doi:10.5435/JAAOS-20-08-S23
- Rivera JC, Amuan ME, Morris RM, Johnson AE, Pugh MJ. Arthritis, comorbidities, and care utilization in veterans of Operations Enduring and Iraqi Freedom. J Orthop Res. 2017;35:682-687. doi:10.1002/jor.23323
- Singh JA, Nelson DB, Fink HA, Nichol KL. Health-related quality of life predicts future health care utilization and mortality in veterans with self-reported physician-diagnosed arthritis: the Veterans Arthritis Quality of Life Study. Semin Arthritis Rheum. 2005;34:755- 765. doi:10.1016/j.semarthrit.2004.08.001
- Nelson AE, Allen KD, Golightly YM, Goode AP, Jordan JM. A systematic review of recommendations and guidelines for the management of osteoarthritis: the Chronic Osteoarthritis Management Initiative of the U.S. Bone and Joint Initiative. Semin Arthritis Rheum. 2014;43:701-712. doi:10.1016/j.semarthrit.2013.11.012
- Morey MC, Crowley GM, Robbins MS, Cowper PA, Sullivan RJ Jr. The Gerofit Program: a VA innovation. South Med J. 1994;87:S83-S87.
- Chen MJ, Fan X, Moe ST. Criterion-related validity of the Borg ratings of perceived exertion scale in healthy individuals: a meta-analysis. J Sports Sci. 2002;20:873-899. doi:10.1080/026404102320761787
- Morey MC, Pieper CF, Sullivan RJ Jr, Crowley GM, Cowper PA, Robbins MS. Five-year performance trends for older exercisers: a hierarchical model of endurance, strength, and flexibility. J Am Geriatr Soc. 1996;44:1226-1231. doi:10.1111/j.1532-5415.1996.tb01374.x
- Allen KD, Gol ight ly YM. State of the evidence. Curr Opin Rheumatol. 2015;27:276-283. doi:10.1097/BOR.0000000000000161
- den Ouden MEM, Schuurmans MJ, Arts IEMA, van der Schouw YT. Association between physical performance characteristics and independence in activities of daily living in middle-aged and elderly men. Geriatr Gerontol Int. 2013;13:274-280. doi:10.1111/j.1447-0594.2012.00890.x
- Daly M, Vidt ME, Eggebeen JD, et al. Upper extremity muscle volumes and functional strength after resistance training in older adults. J Aging Phys Act. 2013;21:186-207. doi:10.1123/japa.21.2.186
- Morey MC, Lee CC, Castle S, et al. Should structured exercise be promoted as a model of care? Dissemination of the Department of Veterans Affairs Gerofit Program. J Am Geriatr Soc. 2018;66:1009-1016. doi:10.1111/jgs.15276
- Jennings SC, Manning KM, Bettger JP, et al. Rapid transition to telehealth group exercise and functional assessments in response to COVID-19. Gerontol Geriatr Med. 2020;6:2333721420980313. doi:10.1177/ 2333721420980313
- Studenski S, Perera S, Wallace D, et al. Physical performance measures in the clinical setting. J Am Geriatr Soc. 2003;51:314-322. doi:10.1046/j.1532-5415.2003.51104.x
- Jones CJ, Rikli RE, Beam WC. A 30-s chair-stand test as a measure of lower body strength in community residing older adults. Res Q Exerc Sport. 1999;70:113- 119. doi:10.1080/02701367.1999.10608028
- Rikli RE, Jones CJ. Development and validation of a functional fitness test for community-residing older adults. J Aging Phys Act. 1999;7:129-161. doi:10.1123/japa.7.2.129
- Harada ND, Chiu V, Stewart AL. Mobility-related function in older adults: assessment with a 6-minute walk test. Arch Phys Med Rehabil. 1999;80:837-841. doi:10.1016/s0003-9993(99)90236-8
- Peeters GGME, Alshurafa M, Schaap L, de Vet HCW. Diagnostic accuracy of self-reported arthritis in the general adult population is acceptable. J Clin Epidemiol. 2015;68:452-459. doi:10.1016/j.jclinepi.2014.09.019
- Cuperus N, Vliet Vlieland TPM, Mahler EAM, Kersten CC, Hoogeboom TJ, van den Ende CHM. The clinical burden of generalized osteoarthritis represented by self-reported health-related quality of life and activity limitations: a cross-sectional study. Rheumatol Int. 2015;35:871-877. doi:10.1007/s00296-014-3149-1
- Coleman G, Dobson F, Hinman RS, Bennell K, White DK. Measures of physical performance. Arthritis Care Res (Hoboken). 2020;72(suppl 10):452-485. doi:10.1002/acr.24373
- Perera S, Mody SH, Woodman RC, Studenski SA. Meaningful change and responsiveness in common physical performance measures in older adults. J Am Geriatr Soc. 2006;54:743-749. doi:10.1111/j.1532-5415.2006.00701.x
- Wright AA, Cook CE, Baxter GD, Dockerty JD, Abbott JH. A comparison of 3 methodological approaches to defining major clinically important improvement of 4 performance measures in patients with hip osteoarthritis. J Orthop Sports Phys Ther. 2011;41:319-327. doi:10.2519/jospt.2011.3515
- Dobson F, Hinman R, Roos EM, et al. OARSI recommended performance-based tests to assess physical function in people diagnosed with hip or knee osteoarthritis. Osteoarthritis Cartilage. 2013;21:1042- 1052. doi:10.1016/j.joca.2013.05.002
- Hughes SL, Seymour RB, Campbell R, Pollak N, Huber G, Sharma L. Impact of the fit and strong intervention on older adults with osteoarthritis. Gerontologist. 2004;44:217-228. doi:10.1093/geront/44.2.217
- Callahan LF, Shreffler JH, Altpeter M, et al. Evaluation of group and self-directed formats of the Arthritis Foundation's Walk With Ease Program. Arthritis Care Res (Hoboken). 2011;63:1098-1107. doi:10.1002/acr.20490
- Boutaugh ML. Arthritis Foundation community-based physical activity programs: effectiveness and implementation issues. Arthritis Rheum. 2003;49:463-470. doi:10.1002/art.11050
- Callahan LF, Mielenz T, Freburger J, et al. A randomized controlled trial of the People with Arthritis Can Exercise Program: symptoms, function, physical activity, and psychosocial outcomes. Arthritis Rheum. 2008;59:92-101. doi:10.1002/art.23239
- Hall KS, Jennings SC, Pearson MP. Outpatient care models: the Gerofit model of care for exercise promotion in older adults. In: Malone ML, Boltz M, Macias Tejada J, White H, eds. Geriatrics Models of Care. Springer; 2024:205-213. doi:10.1007/978-3-031-56204-4_21
- Pepin MJ, Valencia WM, Bettger JP, et al. Impact of supervised exercise on one-year medication use in older veterans with multiple morbidities. Gerontol Geriatr Med. 2020;6:2333721420956751. doi:10.1177/ 2333721420956751
- Abbate L, Li J, Veazie P, et al. Does Gerofit exercise reduce veterans’ use of emergency department and inpatient care? Innov Aging. 2020;4(suppl 1):771. doi:10.1093/geroni/igaa057.2786
- Morey MC, Pieper CF, Crowley GM, Sullivan RJ Jr, Puglisi CM. Exercise adherence and 10-year mortality in chronically ill older adults. J Am Geriatr Soc. 2002;50:1929-1933. doi:10.1046/j.1532-5415.2002.50602.x
- Manning KM, Hall KS, Sloane R, et al. Longitudinal analysis of physical function in older adults: the effects of physical inactivity and exercise training. Aging Cell. 2024;23:e13987. doi:10.1111/acel.13987
- Bean JF, Vora A, Frontera WR. Benefits of exercise for community-dwelling older adults. Arch Phys Med Rehabil. 2004;85(7 suppl 3):S31-S42; quiz S3-S4. doi:10.1016/j.apmr.2004.03.010
- Covinsky KE, Lindquist K, Dunlop DD, Yelin E. Pain, functional limitations, and aging. J Am Geriatr Soc. 2009; 57:1556-1561. doi:10.1111/j.1532-5415.2009.02388.x
- Katz JN, Wright EA, Baron JA, Losina E. Development and validation of an index of musculoskeletal functional limitations. BMC Musculoskelet Disord. 2009;10:62. doi:10.1186/1471-2474-10-62
- Allen KD, Thoma LM, Golightly YM. Epidemiology of osteoarthritis. Osteoarthritis Cartilage. 2022;30:184-195. doi:10.1016/j.joca.2021.04.020
- Riebe D, Blissmer BJ, Greaney ML, Ewing Garber C, Lees FD, Clark PG. The relationship between obesity, physical activity, and physical function in older adults. J Aging Health. 2009;21:1159-1178. doi:10.1177/0898264309350076
About half of US adults aged ≥ 65 years report arthritis, and of those, 44% have an arthritis-attributable activity limitation.1,2 Arthritis is a significant health issue for veterans, with veterans reporting higher rates of disability compared with the civilian population.3
Osteoarthritis (OA) is the most common type of arthritis.4 Among individuals aged ≥ 40 years, the incidence of OA is nearly twice as high among veterans compared with civilians and is a leading cause of separation from military service and disability.5,6 OA pain and disability have been shown to be associated with increases in health care and medication use, including opioids, nonsteroidal anti-inflammatory medications, and muscle relaxants.7,8 Because OA is chronic and has no cure, safe and effective management strategies—such as exercise— are critical to minimize pain and maintain physical function.9
Exercise can reduce pain and disability associated with OA and is a first-line recommendation in guidelines for the treatment of knee and hip OA.9 Given the limited exercise and high levels of physical inactivity among veterans with OA, there is a need to identify opportunities that support veterans with OA engaging in regular exercise.
Gerofit, an outpatient clinical exercise program available at 30 Veterans Health Administration (VHA) sites, may provide an opportunity for older veterans with arthritis to engage in exercise.10 Gerofit is specifically designed for veterans aged ≥ 65 years. It is not disease-specific and supports older veterans with multiple chronic conditions, including OA. Veterans aged ≥ 65 years with a referral from a VA clinician are eligible for Gerofit. Those who are unable to perform activities of daily living; unable to independently function without assistance; have a history of unstable angina, proliferative diabetic retinopathy, oxygen dependence, volatile behavioral issues, or are unable to work successfully in a group environment/setting; experience active substance abuse, homelessness, or uncontrolled incontinence; and have open wounds that cannot be appropriately dressed are excluded from Gerofit. Exercise sessions are held 3 times per week and last from 60 to 90 minutes. Sessions are supervised by Gerofit staff and include personalized exercise prescriptions based on functional assessments. Exercise prescriptions include aerobic, resistance, and balance/flexibility components and are modified by the Gerofit program staff as needed. Gerofit adopts a functional fitness approach and includes individual progression as appropriate according to evidence-based guidelines, using the Borg ratings of perceived exertion. 11 Assessments are performed at baseline, 3 months, 6 months, and annually thereafter. Clinical staff conduct all assessments, including physical function testing, and record them in a database. Assessments are reviewed with the veteran to chart progress and identify future goals or needs. Veterans perform personalized self-paced exercises in the Gerofit group setting. Exercise prescriptions are continuously modified to meet individualized needs and goals. Veterans may participate continuously with no end date.
Participation in supervised exercise is associated with improved physical function and individuals with arthritis can improve function even though their baseline functional status is lower than individuals without arthritis. 12 In this analysis, we examine the impact of exercise on the status and location of arthritis (upper body, lower body, or both). Lower body arthritis is more common than upper body arthritis and lower extremity function is associated with increased ability to perform activities of daily living, resulting in independence among older adults.13,14 We also include upper body strength measures to capture important functional movements such as reaching and pulling.15 Among those who participate in Gerofit, the greatest gains in physical function occur during the initial 3 months, which tend to be sustained over 12 months.16 For this reason, this study focused on the initial 3 months of the program.
Older adults with arthritis may have pain and functional limitations that exceed those of the general older adult population. Exercise programs for older adults that do not specifically target arthritis but are able to improve physical function among those with arthritis could potentially increase access to exercise for older adults living with arthritis. Therefore, the purpose of this study was to determine whether change in physical function with participation in Gerofit for 3 months varies by arthritis status, including no arthritis, any arthritis, lower body arthritis, or both upper and lower body arthritis compared with no arthritis.
Methods
This is a secondary analysis of previously collected data from 10 VHA Gerofit sites (Ann Arbor, Baltimore, Greater Los Angeles, Canandaigua, Cincinnati, Miami, Honolulu, Denver, Durham, and Pittsburgh) from 2002 to 2019. Implementation data regarding the consistency of the program delivery at Gerofit expansion sites have been previously published.16 Although the delivery of Gerofit transitioned to telehealth due to COVID-19, data for this analysis were collected from in-person exercise sessions prior to the pandemic.17 Data were collected for clinical purposes. This project was part of the Gerofit quality improvement initiative and was reviewed and approved by the Durham Institutional Review Board as quality improvement.
Participants in Gerofit who completed baseline and 3-month assessments were included to analyze the effects of exercise on physical function. At each of the time points, physical functional assessments included: (1) usual gait speed (> 10 meters [m/s], or 10- meter walk test [10MWT]); (2) lower body strength (chair stands [number completed in 30 seconds]); (3) upper body strength (number of arm curls [5-lb for females/8-lb for males] completed in 30 seconds); and (4) 6-minute walk distance [6MWD] in meters to measure aerobic endurance). These measures have been validated in older adults.18-21 Arm curls were added to the physical function assessments after the 10MWT, chair stands, and 6MWD; therefore, fewer participants had data for this measure. Participants self-reported at baseline on 45 common medical conditions, including arthritis or rheumatism (both upper body and lower body were offered as choices). Self-reporting has been shown to be an acceptable method of identifying arthritis in adults.22
Descriptive statistics at baseline were calculated for all participants. One-way analysis of variance and X2 tests were used to determine differences in baseline characteristics across arthritis status. The primary outcomes were changes in physical function measures from baseline to 3 months by arthritis status. Arthritis status was defined as: any arthritis, which includes individuals who reported upper body arthritis, lower body arthritis, or both; and arthritis status individuals reporting either upper body arthritis, lower body arthritis, or both. Categories of arthritis for arthritis status were mutually exclusive. Two separate linear models were constructed for each of the 4 physical function measures, with change from baseline to 3 months as the outcome (dependent variable) and arthritis status, age, and body mass index (BMI) as predictors (independent variables). The first model compared any arthritis with no arthritis and the second model compared arthritis status (both upper and lower body arthritis vs lower body arthritis) with no arthritis. These models were used to obtain mean changes and 95% CIs in physical function and to test for differences in the change in physical function measures by arthritis status. Statistical analyses were performed using R software, version 4.0.3.
Results
Baseline and 3-month data were available for 737 Gerofit participants and included in the analysis. The mean (SD) age was 73.5 (7.1) years. A total of 707 participants were male (95.9%) and 322 (43.6%) reported some arthritis, with arthritis in both the upper and lower body being reported by 168 participants (52.2%) (Table 1). There were no differences in age, sex, or race for those with any arthritis compared with those with no arthritis, but BMI was significantly higher in those reporting any arthritis compared with no arthritis. For the baseline functional measures, statistically significant differences were observed between those with no arthritis and those reporting any arthritis for the 10MWT (P = .001), chair stands (P = .046), and 6MWD (P = .001), but not for arm curls (P = .77), with those with no arthritis performing better.
All 4 arthritis status groups showed improvements in each of the physical function measures over 3 months. For the 10MWT the mean change (95% CI) in gait speed (m/s) was 0.06 (0.04-0.08) for patients with no arthritis, 0.07 (0.05- 0.08) for any arthritis, 0.07 (0.04-0.11) for lower body arthritis, and 0.07 (0.04- 0.09) for both lower and upper body arthritis. For the number of arm curls in 30 seconds the mean change (95% CI) was 2.3 (1.8-2.8) for patients with no arthritis, 2.1 (1.5-2.6) for any arthritis, 2.0 (1.1-3.0) for lower body arthritis, and 1.9 (1.1-2.7) for both lower and upper body arthritis. For the number of chair stands in 30 seconds the mean change (95% CI) was 2.1 (1.7-2.4) for patients with no arthritis, 2.2 (1.8-2.6) for any arthritis, 2.3 (1.6-2.9), for lower body arthritis, and 2.0 (1.5-2.5) for both lower and upper body arthritis. For the 6MWD distance in meters the mean change (95% CI) was 21.5 (15.5-27.4) for patients with no arthritis, 28.6 (21.9-35.3) for any arthritis, 30.4 (19.5-41.3) for lower body arthritis, and 28.6 (19.2-38.0) for both lower and upper body arthritis (Figure).
We used 2 models to measure the change from baseline to 3 months for each of the arthritis groups. Model 1 compared any arthritis vs no arthritis and model 2 compared lower body arthritis and both upper and lower body arthritis vs no arthritis for each physical function measure (Table 2). There were no statistically significant differences in 3-month change in physical function for any of the physical function measures between arthritis groups after adjusting for age and BMI.
Discussion
Participation in Gerofit was associated with functional gains among all participants over 3 months, regardless of arthritis status. Older veterans reporting any arthritis had significantly lower physical function scores upon enrollment into Gerofit compared with those veterans reporting no arthritis. However, compared with individuals who reported no arthritis, individuals who reported arthritis (any arthritis, lower body arthritis only, or both lower and upper body arthritis) experienced similar improvements (ie, no statistically significant differences in mean change from baseline to follow-up among those with and without arthritis). This study suggests that progressive, multicomponent exercise programs for older adults may be beneficial for those with arthritis.
Involvement of multiple sites of arthritis is associated with moderate to severe functional limitations as well as lower healthrelated quality of life.23 While it has been found that individuals with arthritis can improve function with supervised exercise, even though their baseline functional status is lower than individuals without arthritis, it was not clear whether individuals with multiple joint involvement also would benefit.12 The results of this study suggest that these individuals can improve across various domains of physical function despite variation in arthritis location and status. As incidence of arthritis increases with age, targeting older adults for exercise programs such as Gerofit may improve functional limitations and health-related quality of life associated with arthritis.2
We evaluated physical function using multiple measures to assess upper (arm curls) and lower (chair stands, 10MWT) extremity physical function and aerobic endurance (6MWD). Participants in this study reached clinically meaningful changes with 3 months of participation in Gerofit for most of the physical function measures. Gerofit participants had a mean gait speed improvement of 0.05 to 0.07 m/s compared with 0.10 to 0.30 m/s, which was reported previously. 24,25 In this study, nearly all groups achieved the clinically important improvements in the chair stand in 30 seconds (2.0 to 2.6) and the 6MWD (21.8 to 59.1 m) that have been reported in the literature.24-26
The Osteoarthritis Research Society International recommends the chair stand and 6MWD performance-based tests for individuals with hip and knee arthritis because they align with patient-reported outcomes and represent the types of activities relevant to this population.27 The findings of this study suggest that improvement in these physical function measures with participation in exercise align with data from arthritis-specific exercise programs designed for wide implementation. Hughes and colleagues reported improvements in the 6MWD after the 8-week Fit and Strong exercise intervention, which included walking and lower body resistance training.28 The Arthritis Foundation’s Walk With Ease program is a 6-week walking program that has shown improvements in chair stands and gait speed.29 Another Arthritis Foundation program, People with Arthritis Can Exercise, is an 8-week course consisting of a variety of resistance, aerobic, and balance activities. This program has been associated with increases in chair stands but not gait speed or 6MWD.30,31
This study found that participation in a VHA outpatient clinical supervised exercise program results in improvements in physical function that can be realized by older adults regardless of arthritis burden. Gerofit programs typically require 1.5 to 2.0 dedicated full-time equivalent employees to run the program effectively and additional administrative support, depending on size of the program.32 The cost savings generated by the program include reductions in hospitalization rates, emergency department visits, days in hospital, and medication use and provide a compelling argument for the program’s financial viability to health care systems through long-term savings and improved health outcomes for older adults.33-36
While evidenced-based arthritis programs exist, this study illustrates that an exercise program without a focus on arthritis also improves physical function, potentially reducing the risk of disability related to arthritis. The clinical implication for these findings is that arthritis-specific exercise programs may not be needed to achieve functional improvements in individuals with arthritis. This is critical for under-resourced or exercise- limited health care systems or communities. Therefore, if exercise programming is limited, or arthritis-specific programs and interventions are not available, nonspecific exercise programs will also be beneficial to individuals with arthritis. Thus, individuals with arthritis should be encouraged to participate in any available exercise programming to achieve improvements in physical function. In addition, many older adults have multiple comorbidities, most of which improve with participation in exercise. 37 Disease-specific exercise programs can offer tailored exercises and coaching related to common barriers in participation, such as joint pain for arthritis.31 It is unclear whether these additional programmatic components are associated with greater improvements in outcomes, such as physical function. More research is needed to explore the benefits of disease-specific tailored exercise programs compared with general exercise programs.
Strengths and Limitations
This study demonstrated the effect of participation in a clinical, supervised exercise program in a real-world setting. It suggests that even exercise programs not specifically targeted for arthritis populations can improve physical function among those with arthritis.
As a VHA clinical supervised exercise program, Gerofit may not be generalizable to all older adults or other exercise programs. In addition, this analysis only included a veteran population that was > 95% male and may not be generalizable to other populations. Arthritis status was defined by self-report and not verified in the health record. However, this approach has been shown to be acceptable in this setting and the most common type of arthritis in this population (OA) is a painful musculoskeletal condition associated with functional limitations.4,22,38,39 Self-reported arthritis or rheumatism is associated with functional limitations.1 Therefore, it is unlikely that the results would differ for physician-diagnosed or radiographically defined OA. Additionally, the study did not have data on the total number of joints with arthritis or arthritis severity but rather used upper body, lower body, and both upper and lower body arthritis as a proxy for arthritis status. While our models were adjusted for age and BMI, 2 known confounding factors for the association between arthritis and physical function, there are other potential confounding factors that were not included in the models. 40,41 Finally, this study only included individuals with completed baseline and 3-month follow-up assessments, and the individuals who participated for longer or shorter periods may have had different physical function outcomes than individuals included in this study.
Conclusions
Participation in 3 months VHA Gerofit outpatient supervised exercise programs can improve physical function for all older adults, regardless of arthritis status. These programs may increase access to exercise programming that is beneficial for common conditions affecting older adults, such as arthritis.
- Centers for Disease Control and Prevention. Prevalence and most common causes of disability among adults- -United States, 2005. MMWR Morb Mortal Wkly Rep. 2009;58:421-426.
- Theis KA, Murphy LB, Guglielmo D, et al. Prevalence of arthritis and arthritis-attributable activity limitation—United States, 2016–2018. MMWR Morb Mortal Wkly Rep. 2021;70:1401-1407. doi:10.15585/mmwr.mm7040a2
- Murphy LB, Helmick CG, Allen KD, et al. Arthritis among veterans—United States, 2011–2013. MMWR Morb Mortal Wkly Rep. 2014;63:999-1003.
- Park J, Mendy A, Vieira ER. Various types of arthritis in the United States: prevalence and age-related trends from 1999 to 2014. Am J Public Health. 2018;108:256-258.
- Cameron KL, Hsiao MS, Owens BD, Burks R, Svoboda SJ. Incidence of physician-diagnosed osteoarthritis among active duty United States military service members. Arthritis Rheum. 2011;63:2974-2982. doi:10.1002/art.30498
- Patzkowski JC, Rivera JC, Ficke JR, Wenke JC. The changing face of disability in the US Army: the Operation Enduring Freedom and Operation Iraqi Freedom effect. J Am Acad Orthop Surg. 2012;20(suppl 1):S23-S30. doi:10.5435/JAAOS-20-08-S23
- Rivera JC, Amuan ME, Morris RM, Johnson AE, Pugh MJ. Arthritis, comorbidities, and care utilization in veterans of Operations Enduring and Iraqi Freedom. J Orthop Res. 2017;35:682-687. doi:10.1002/jor.23323
- Singh JA, Nelson DB, Fink HA, Nichol KL. Health-related quality of life predicts future health care utilization and mortality in veterans with self-reported physician-diagnosed arthritis: the Veterans Arthritis Quality of Life Study. Semin Arthritis Rheum. 2005;34:755- 765. doi:10.1016/j.semarthrit.2004.08.001
- Nelson AE, Allen KD, Golightly YM, Goode AP, Jordan JM. A systematic review of recommendations and guidelines for the management of osteoarthritis: the Chronic Osteoarthritis Management Initiative of the U.S. Bone and Joint Initiative. Semin Arthritis Rheum. 2014;43:701-712. doi:10.1016/j.semarthrit.2013.11.012
- Morey MC, Crowley GM, Robbins MS, Cowper PA, Sullivan RJ Jr. The Gerofit Program: a VA innovation. South Med J. 1994;87:S83-S87.
- Chen MJ, Fan X, Moe ST. Criterion-related validity of the Borg ratings of perceived exertion scale in healthy individuals: a meta-analysis. J Sports Sci. 2002;20:873-899. doi:10.1080/026404102320761787
- Morey MC, Pieper CF, Sullivan RJ Jr, Crowley GM, Cowper PA, Robbins MS. Five-year performance trends for older exercisers: a hierarchical model of endurance, strength, and flexibility. J Am Geriatr Soc. 1996;44:1226-1231. doi:10.1111/j.1532-5415.1996.tb01374.x
- Allen KD, Gol ight ly YM. State of the evidence. Curr Opin Rheumatol. 2015;27:276-283. doi:10.1097/BOR.0000000000000161
- den Ouden MEM, Schuurmans MJ, Arts IEMA, van der Schouw YT. Association between physical performance characteristics and independence in activities of daily living in middle-aged and elderly men. Geriatr Gerontol Int. 2013;13:274-280. doi:10.1111/j.1447-0594.2012.00890.x
- Daly M, Vidt ME, Eggebeen JD, et al. Upper extremity muscle volumes and functional strength after resistance training in older adults. J Aging Phys Act. 2013;21:186-207. doi:10.1123/japa.21.2.186
- Morey MC, Lee CC, Castle S, et al. Should structured exercise be promoted as a model of care? Dissemination of the Department of Veterans Affairs Gerofit Program. J Am Geriatr Soc. 2018;66:1009-1016. doi:10.1111/jgs.15276
- Jennings SC, Manning KM, Bettger JP, et al. Rapid transition to telehealth group exercise and functional assessments in response to COVID-19. Gerontol Geriatr Med. 2020;6:2333721420980313. doi:10.1177/ 2333721420980313
- Studenski S, Perera S, Wallace D, et al. Physical performance measures in the clinical setting. J Am Geriatr Soc. 2003;51:314-322. doi:10.1046/j.1532-5415.2003.51104.x
- Jones CJ, Rikli RE, Beam WC. A 30-s chair-stand test as a measure of lower body strength in community residing older adults. Res Q Exerc Sport. 1999;70:113- 119. doi:10.1080/02701367.1999.10608028
- Rikli RE, Jones CJ. Development and validation of a functional fitness test for community-residing older adults. J Aging Phys Act. 1999;7:129-161. doi:10.1123/japa.7.2.129
- Harada ND, Chiu V, Stewart AL. Mobility-related function in older adults: assessment with a 6-minute walk test. Arch Phys Med Rehabil. 1999;80:837-841. doi:10.1016/s0003-9993(99)90236-8
- Peeters GGME, Alshurafa M, Schaap L, de Vet HCW. Diagnostic accuracy of self-reported arthritis in the general adult population is acceptable. J Clin Epidemiol. 2015;68:452-459. doi:10.1016/j.jclinepi.2014.09.019
- Cuperus N, Vliet Vlieland TPM, Mahler EAM, Kersten CC, Hoogeboom TJ, van den Ende CHM. The clinical burden of generalized osteoarthritis represented by self-reported health-related quality of life and activity limitations: a cross-sectional study. Rheumatol Int. 2015;35:871-877. doi:10.1007/s00296-014-3149-1
- Coleman G, Dobson F, Hinman RS, Bennell K, White DK. Measures of physical performance. Arthritis Care Res (Hoboken). 2020;72(suppl 10):452-485. doi:10.1002/acr.24373
- Perera S, Mody SH, Woodman RC, Studenski SA. Meaningful change and responsiveness in common physical performance measures in older adults. J Am Geriatr Soc. 2006;54:743-749. doi:10.1111/j.1532-5415.2006.00701.x
- Wright AA, Cook CE, Baxter GD, Dockerty JD, Abbott JH. A comparison of 3 methodological approaches to defining major clinically important improvement of 4 performance measures in patients with hip osteoarthritis. J Orthop Sports Phys Ther. 2011;41:319-327. doi:10.2519/jospt.2011.3515
- Dobson F, Hinman R, Roos EM, et al. OARSI recommended performance-based tests to assess physical function in people diagnosed with hip or knee osteoarthritis. Osteoarthritis Cartilage. 2013;21:1042- 1052. doi:10.1016/j.joca.2013.05.002
- Hughes SL, Seymour RB, Campbell R, Pollak N, Huber G, Sharma L. Impact of the fit and strong intervention on older adults with osteoarthritis. Gerontologist. 2004;44:217-228. doi:10.1093/geront/44.2.217
- Callahan LF, Shreffler JH, Altpeter M, et al. Evaluation of group and self-directed formats of the Arthritis Foundation's Walk With Ease Program. Arthritis Care Res (Hoboken). 2011;63:1098-1107. doi:10.1002/acr.20490
- Boutaugh ML. Arthritis Foundation community-based physical activity programs: effectiveness and implementation issues. Arthritis Rheum. 2003;49:463-470. doi:10.1002/art.11050
- Callahan LF, Mielenz T, Freburger J, et al. A randomized controlled trial of the People with Arthritis Can Exercise Program: symptoms, function, physical activity, and psychosocial outcomes. Arthritis Rheum. 2008;59:92-101. doi:10.1002/art.23239
- Hall KS, Jennings SC, Pearson MP. Outpatient care models: the Gerofit model of care for exercise promotion in older adults. In: Malone ML, Boltz M, Macias Tejada J, White H, eds. Geriatrics Models of Care. Springer; 2024:205-213. doi:10.1007/978-3-031-56204-4_21
- Pepin MJ, Valencia WM, Bettger JP, et al. Impact of supervised exercise on one-year medication use in older veterans with multiple morbidities. Gerontol Geriatr Med. 2020;6:2333721420956751. doi:10.1177/ 2333721420956751
- Abbate L, Li J, Veazie P, et al. Does Gerofit exercise reduce veterans’ use of emergency department and inpatient care? Innov Aging. 2020;4(suppl 1):771. doi:10.1093/geroni/igaa057.2786
- Morey MC, Pieper CF, Crowley GM, Sullivan RJ Jr, Puglisi CM. Exercise adherence and 10-year mortality in chronically ill older adults. J Am Geriatr Soc. 2002;50:1929-1933. doi:10.1046/j.1532-5415.2002.50602.x
- Manning KM, Hall KS, Sloane R, et al. Longitudinal analysis of physical function in older adults: the effects of physical inactivity and exercise training. Aging Cell. 2024;23:e13987. doi:10.1111/acel.13987
- Bean JF, Vora A, Frontera WR. Benefits of exercise for community-dwelling older adults. Arch Phys Med Rehabil. 2004;85(7 suppl 3):S31-S42; quiz S3-S4. doi:10.1016/j.apmr.2004.03.010
- Covinsky KE, Lindquist K, Dunlop DD, Yelin E. Pain, functional limitations, and aging. J Am Geriatr Soc. 2009; 57:1556-1561. doi:10.1111/j.1532-5415.2009.02388.x
- Katz JN, Wright EA, Baron JA, Losina E. Development and validation of an index of musculoskeletal functional limitations. BMC Musculoskelet Disord. 2009;10:62. doi:10.1186/1471-2474-10-62
- Allen KD, Thoma LM, Golightly YM. Epidemiology of osteoarthritis. Osteoarthritis Cartilage. 2022;30:184-195. doi:10.1016/j.joca.2021.04.020
- Riebe D, Blissmer BJ, Greaney ML, Ewing Garber C, Lees FD, Clark PG. The relationship between obesity, physical activity, and physical function in older adults. J Aging Health. 2009;21:1159-1178. doi:10.1177/0898264309350076
Impact of 3 Months of Supervised Exercise on Function by Arthritis Status
Impact of 3 Months of Supervised Exercise on Function by Arthritis Status

Improving High-Risk Osteoporosis Medication Adherence and Safety With an Automated Dashboard
Improving High-Risk Osteoporosis Medication Adherence and Safety With an Automated Dashboard
Osteoporotic fragility fractures constitute a significant public health concern, with 1 in 2 women and 1 in 5 men aged > 50 years sustaining an osteoporotic fracture.1 Osteoporotic fractures are costly and associated with reduced quality of life and impaired survival.2-6 Many interventions including fall mitigation, calcium, vitamin D supplementation, and osteoporosis—specific medications reduce fracture risk.7 New medications for treating osteoporosis, including anabolic therapies, are costly and require clinical oversight to ensure safe delivery. This includes laboratory monitoring, timing of in-clinic dosing and provision of sequence therapy.8,9 COVID-19 introduced numerous barriers to osteoporosis care, raising concerns for medication interruption and patients lost to follow-up, which made monitoring these high risk and costly medications even more important.
The US Department of Veterans Affairs (VA) was an early adopter of using the electronic health record to analyze and implement system-wide processes for population management and quality improvement.10 This enabled the creation of clinical dashboards to display key performance indicator data that support quality improvement and patient care initiatives.11-15 The VA Puget Sound Health Care System (VAPSHCS) has a dedicated osteoporosis clinic focused on preventing and treating veterans at high risk for fracture. Considering the growing utilization of osteoporosis medications, particularly those requiring timed sequential therapy to prevent bone mineral density loss and rebound osteoporotic fractures, close monitoring and follow-up is required. The COVID-19 pandemic made clear the need for proactive osteoporosis management. This article describes the creation and use of an automated clinic dashboard to identify and contact veterans with osteoporosis-related care needs, such as prescription refills, laboratory tests, and clinical visits.
Methods
An automated dashboard was created in partnership with VA pharmacy clinical informatics to display the osteoporosis medication prescription (including last refill), monitoring laboratory test values and most recent osteoporosis clinic visit for each clinic patient. Data from the VA Corporate Data Warehouse were extracted. The resulting tables were used to create a patient cohort with ≥ 1 active medication for alendronate, zoledronic acid, the parathyroid hormone analogues (PTH) teriparatide or abaloparatide, denosumab, or romosozumab. Notably, alendronate was the only oral bisphosphonate prescribed in the clinic. These data were formatted and displayed using Microsoft SQL Server Reporting Services. The secure and encrypted dashboard alerts the clinic staff when prescriptions, appointments, or laboratory tests, such as estimated glomerular filtration rate, 25-hydroxy vitamin D, calcium, and PTH are overdue or out of reference range. The dashboard tracked the most recent clinic visit or dual-energy X-ray absorptiometry (DXA) scan if performed within the VA. Overdue laboratory test alerts for bisphosphonates were flagged if delayed 12 months and 6 months for all other medications.
On March 20, 2021, the VAPSHCS osteoporosis clinic was staffed by 1 endocrinologist, 1 geriatrician, 1 rheumatologist, and 1 registered nurse (RN) coordinator. Overdue or out-of-range alerts were reviewed weekly by the RN coordinator, who addressed alerts. For any overdue laboratory work or prescription refills, the RN coordinator alerted the primary osteoporosis physician via the electronic health record for updated orders. Patients were contacted by phone to schedule a clinic visit, complete ordered laboratory work, or discuss osteoporosis medication refills based on the need identified by the dashboard. A letter was mailed to the patient requesting they contact the osteoporosis clinic for patients who could not be reached by phone after 2 attempts. If 3 attempts (2 phone calls and a letter) were unsuccessful, the osteoporosis physician was alerted so they could either call the patient, alert the primary referring clinician, or discontinue the osteoporosis medication.
Results
As of March 20, 2021, 139 patients were included on the dashboard. Ninety-two patients (66%) had unmet care needs and 29% were female. Ages ranged from 40 to 100 years (Table). The dashboard alerted the team to 3 patients lost to follow-up, all of whom had transferred to care outside the clinic. Twenty-three patients (17%) had overdue medications, including 2 (9%) who had not refilled oral bisphosphonate and 18 (78%) who were overdue for intravenous bisphosphonate treatment. One veteran flagged as overdue for their denosumab injection was unable to receive it due to a significant change in health status. Two veterans were overdue for a PTH analogue refill, 1 of whom had completed their course and transitioned to bisphosphonate.
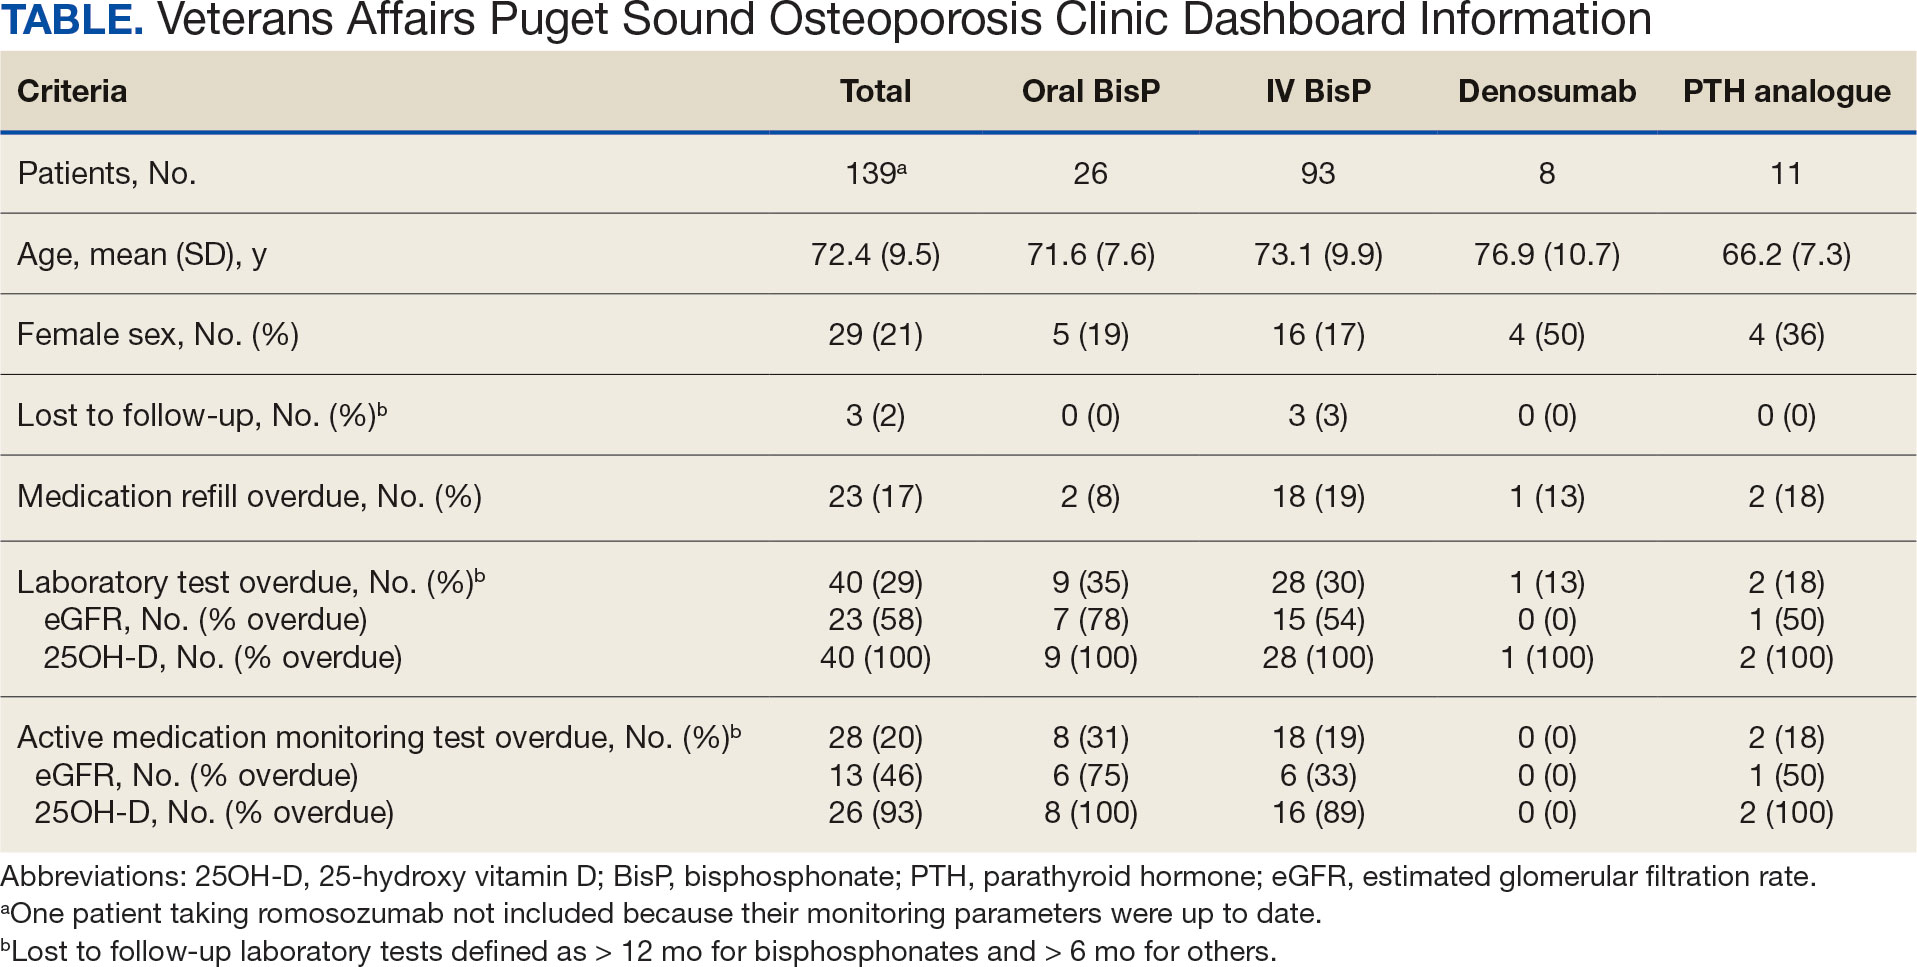
The most common alert was 40 patients (29%) with overdue laboratory tests, 37 of which were receiving bisphosphonates. One patient included on the dashboard was taking romosozumab and all their monitoring parameters were up to date, thus their data were not included in the Table to prevent possible identification.
Discussion
A dashboard alerted the osteoporosis clinic team to veterans who were overdue for visits, laboratory work, and prescription renewals. Overall, 92 patients (66%) had unmet care needs identified by the dashboard, all of which were addressed with phone calls and/or letters. Most of the overdue medication refills and laboratory tests were for patients taking bisphosphonates avoiding VAPSHCS during the COVID-19 pandemic. The dashboard enabled the RN coordinator to promptly contact the patient, facilitate coordination of care requirements, and guarantee the safe and efficient delivery of osteoporosis care.
The VA has historically been a leader in the creation of clinical dashboards to support health campaigns.11,12 These dashboards have successfully improved quality metrics towards the treatment of hepatitis C virus, heart failure, and highrisk opioid prescribing.13-15 Data have shown that successful clinical dashboard implementation must be done in conjunction with protected time or staff to support care improvements.16 Additionally, the time required for clinical dashboards can limit their sustainability and feasibility.17 A study aimed at improving osteoporosis care for patients with Parkinson disease found that weekly multidisciplinary review of at-risk patients resulted in all new patients and 91% of follow-up patients receiving evidence- based osteoporosis treatments.17 However, despite the benefits, the intervention required significant time and resources. In contrast, the osteoporosis dashboard implemented at VAPSHCS was not time or resource intensive, requiring about 1 hour per week for the RN coordinator to review the dashboard and coordinate patient care needs.
Limitations
This study setting is unique from other health care organizations or VA health care systems. Implementation of a similar dashboard in other clinical settings where patients receive medical care in multiple health care systems may differ. The VA dedicates resources to support veteran population health management, which may not be available in other health care systems.11,12 These issues may pose a barrier to implementing a similar osteoporosis dashboard in non-VA facilities. In addition, it is significant that while the dashboard can be reconfigured and adapted to track veterans across different VA facilities, certain complexities arise if essential data, such as laboratory tests and DXA imaging, are conducted outside of VA facilities. In such cases, manual entry of this information into the dashboard would be necessary. Because the dashboard was quickly developed during the COVID-19 pandemic, this study lacked preimplementation data on laboratory testing, medication refills, and DXA imaging, which would have enabled a comparison of adherence before and after dashboard implementation. Finally, we acknowledge the delay in publishing these findings; however, we believe sharing innovative approaches to providing care for high-risk populations is essential, as demonstrated during the COVID-19 pandemic.
Conclusions
An osteoporosis clinic dashboard served as a valuable clinical support tool to ensure safe and effective osteoporosis medication delivery at VAPSHCS. Considering the growing utilization of osteoporosis medications, this dashboard plays a vital role in facilitating care coordination for patients receiving these high-risk treatments.18 Use of the dashboard supported the effective use of high-cost osteoporosis medications and is likely to improve clinical osteoporosis outcomes.
Despite the known fracture risk reduction, osteoporosis medication adherence is low.19,20 Maintaining consistent pharmacotherapy for osteoporosis is essential not only for fracture prevention but also reducing health care costs related to osteoporosis and preserving patient independence and functionality.21-24 While initially developed in response to the COVID-19 pandemic, the dashboard remains useful. The VAPSHCS osteoporosis clinic is now staffed by 2 physicians (endocrine and rheumatology) and the dashboard is still in use. The RN coordinator spends about 15 minutes per week using the dashboard and managing the 67 veterans on osteoporosis therapy. This dashboard represents a sustainable clinical tool with the capacity to minimize osteoporosis care gaps and improve outcomes.
- Johnell O, Kanis J. Epidemiology of osteoporotic fractures. Osteoporos Int. 2005;16(suppl 2):S3-S7. doi:10.1007/s00198-004-1702-6
- van Staa TP, Dennison EM, Leufkens HG, Cooper C. Epidemiology of fractures in England and Wales. Bone. 2001;29:517-522. doi:10.1016/s8756-3282(01)00614-7
- Dennison E, Cooper C. Epidemiology of osteoporotic fractures. Horm Res. 2000;54(suppl 1):58-63. doi:10.1159/000063449
- Cooper C. Epidemiology and public health impact of osteoporosis. Baillieres Clin Rheumatol. 1993;7:459-477. doi:10.1016/s0950-3579(05)80073-1
- Dolan P, Torgerson DJ. The cost of treating osteoporotic fractures in the United Kingdom female population. Osteoporos Int. 1998;8:611-617. doi:10.1007/s001980050107
- Burge R, Dawson-Hughes B, Solomon DH, Wong JB, King A, Tosteson A. Incidence and economic burden of osteoporosis-related fractures in the United States, 2005-2025. J Bone Miner Res. 2007;22:465-475. doi:10.1359/jbmr.061113
- Palacios S. Medical treatment of osteoporosis. Climacteric. 2022;25:43-49. doi:10.1080/13697137.2021.1951697
- Eastell R, Rosen CJ, Black DM, Cheung AM, Murad MH, Shoback D. Pharmacological management of osteoporosis in postmenopausal women: an Endocrine Society* clinical practice guideline. J Clin Endocrinol Metab. 2019;104:1595-1622. doi:10.1210/jc.2019-00221
- Watts NB, Adler RA, Bilezikian JP, et al. Osteoporosis in men: an Endocrine Society clinical practice guideline. J Clin Endocrinol Metab. 2012;97:1802-1822. doi:10.1210/jc.2011-3045
- Lau MK, Bounthavong M, Kay CL, Harvey MA, Christopher MLD. Clinical dashboard development and use for academic detailing in the U.S. Department of Veterans Affairs. J Am Pharm Assoc (2003). 2019;59(2S):S96-S103.e3. doi:10.1016/j.japh.2018.12.006
- Mould DR, D’Haens G, Upton RN. Clinical decision support tools: the evolution of a revolution. Clin Pharmacol Ther. 2016;99:405-418. doi:10.1002/cpt.334
- Kizer KW, Fonseca ML, Long LM. The veterans healthcare system: preparing for the twenty-first century. Hosp Health Serv Adm. 1997;42:283-298.
- Park A, Gonzalez R, Chartier M, et al. Screening and treating hepatitis c in the VA: achieving excellence using lean and system redesign. Fed Pract. 2018;35:24-29.
- Brownell N, Kay C, Parra D, et al. Development and optimization of the Veterans Affairs’ national heart failure dashboard for population health management. J Card Fail. 2024;30:452-459. doi:10.1016/j.cardfail.2023.08.024
- Lin LA, Bohnert ASB, Kerns RD, Clay MA, Ganoczy D, Ilgen MA. Impact of the opioid safety initiative on opioidrelated prescribing in veterans. Pain. 2017;158:833-839. doi:10.1097/j.pain.0000000000000837
- Twohig PA, Rivington JR, Gunzler D, Daprano J, Margolius D. Clinician dashboard views and improvement in preventative health outcome measures: a retrospective analysis. BMC Health Serv Res. 2019;19:475. doi:10.1186/s12913-019-4327-3
- Singh I, Fletcher R, Scanlon L, Tyler M, Aithal S. A quality improvement initiative on the management of osteoporosis in older people with Parkinsonism. BMJ Qual Improv Rep. 2016;5:u210921.w5756. doi:10.1136/bmjquality.u210921.w5756
- Anastasilakis AD, Makras P, Yavropoulou MP, Tabacco G, Naciu AM, Palermo A. Denosumab discontinuation and the rebound phenomenon: a narrative review. J Clin Med. 2021;10:152. doi:10.3390/jcm10010152
- Sharman Moser S, Yu J, Goldshtein I, et al. Cost and consequences of nonadherence with oral bisphosphonate therapy: findings from a real-world data analysis. Ann Pharmacother. 2016;50:262-269. doi:10.1177/1060028015626935
- Olsen KR, Hansen C, Abrahamsen B. Association between refill compliance to oral bisphosphonate treatment, incident fractures, and health care costs--an analysis using national health databases. Osteoporos Int. 2013;24:2639-2647. doi:10.1007/s00198-013-2365-y
- Blouin J, Dragomir A, Fredette M, Ste-Marie LG, Fernandes JC, Perreault S. Comparison of direct health care costs related to the pharmacological treatment of osteoporosis and to the management of osteoporotic fractures among compliant and noncompliant users of alendronate and risedronate: a population-based study. Osteoporos Int. 2009;20:1571-1581. doi:10.1007/s00198-008-0818-5
- Cotté F-E, De Pouvourville G. Cost of non-persistence with oral bisphosphonates in post-menopausal osteoporosis treatment in France. BMC Health Serv Res. 2011;11:151. doi:10.1186/1472-6963-11-151
- Cho H, Byun J-H, Song I, et al. Effect of improved medication adherence on health care costs in osteoporosis patients. Medicine (Baltimore). 2018;97:e11470. doi:10.1097/MD.0000000000011470
- Li N, Cornelissen D, Silverman S, et al. An updated systematic review of cost-effectiveness analyses of drugs for osteoporosis. Pharmacoeconomics. 2021;39:181-209. doi:10.1007/s40273-020-00965-9
Osteoporotic fragility fractures constitute a significant public health concern, with 1 in 2 women and 1 in 5 men aged > 50 years sustaining an osteoporotic fracture.1 Osteoporotic fractures are costly and associated with reduced quality of life and impaired survival.2-6 Many interventions including fall mitigation, calcium, vitamin D supplementation, and osteoporosis—specific medications reduce fracture risk.7 New medications for treating osteoporosis, including anabolic therapies, are costly and require clinical oversight to ensure safe delivery. This includes laboratory monitoring, timing of in-clinic dosing and provision of sequence therapy.8,9 COVID-19 introduced numerous barriers to osteoporosis care, raising concerns for medication interruption and patients lost to follow-up, which made monitoring these high risk and costly medications even more important.
The US Department of Veterans Affairs (VA) was an early adopter of using the electronic health record to analyze and implement system-wide processes for population management and quality improvement.10 This enabled the creation of clinical dashboards to display key performance indicator data that support quality improvement and patient care initiatives.11-15 The VA Puget Sound Health Care System (VAPSHCS) has a dedicated osteoporosis clinic focused on preventing and treating veterans at high risk for fracture. Considering the growing utilization of osteoporosis medications, particularly those requiring timed sequential therapy to prevent bone mineral density loss and rebound osteoporotic fractures, close monitoring and follow-up is required. The COVID-19 pandemic made clear the need for proactive osteoporosis management. This article describes the creation and use of an automated clinic dashboard to identify and contact veterans with osteoporosis-related care needs, such as prescription refills, laboratory tests, and clinical visits.
Methods
An automated dashboard was created in partnership with VA pharmacy clinical informatics to display the osteoporosis medication prescription (including last refill), monitoring laboratory test values and most recent osteoporosis clinic visit for each clinic patient. Data from the VA Corporate Data Warehouse were extracted. The resulting tables were used to create a patient cohort with ≥ 1 active medication for alendronate, zoledronic acid, the parathyroid hormone analogues (PTH) teriparatide or abaloparatide, denosumab, or romosozumab. Notably, alendronate was the only oral bisphosphonate prescribed in the clinic. These data were formatted and displayed using Microsoft SQL Server Reporting Services. The secure and encrypted dashboard alerts the clinic staff when prescriptions, appointments, or laboratory tests, such as estimated glomerular filtration rate, 25-hydroxy vitamin D, calcium, and PTH are overdue or out of reference range. The dashboard tracked the most recent clinic visit or dual-energy X-ray absorptiometry (DXA) scan if performed within the VA. Overdue laboratory test alerts for bisphosphonates were flagged if delayed 12 months and 6 months for all other medications.
On March 20, 2021, the VAPSHCS osteoporosis clinic was staffed by 1 endocrinologist, 1 geriatrician, 1 rheumatologist, and 1 registered nurse (RN) coordinator. Overdue or out-of-range alerts were reviewed weekly by the RN coordinator, who addressed alerts. For any overdue laboratory work or prescription refills, the RN coordinator alerted the primary osteoporosis physician via the electronic health record for updated orders. Patients were contacted by phone to schedule a clinic visit, complete ordered laboratory work, or discuss osteoporosis medication refills based on the need identified by the dashboard. A letter was mailed to the patient requesting they contact the osteoporosis clinic for patients who could not be reached by phone after 2 attempts. If 3 attempts (2 phone calls and a letter) were unsuccessful, the osteoporosis physician was alerted so they could either call the patient, alert the primary referring clinician, or discontinue the osteoporosis medication.
Results
As of March 20, 2021, 139 patients were included on the dashboard. Ninety-two patients (66%) had unmet care needs and 29% were female. Ages ranged from 40 to 100 years (Table). The dashboard alerted the team to 3 patients lost to follow-up, all of whom had transferred to care outside the clinic. Twenty-three patients (17%) had overdue medications, including 2 (9%) who had not refilled oral bisphosphonate and 18 (78%) who were overdue for intravenous bisphosphonate treatment. One veteran flagged as overdue for their denosumab injection was unable to receive it due to a significant change in health status. Two veterans were overdue for a PTH analogue refill, 1 of whom had completed their course and transitioned to bisphosphonate.
The most common alert was 40 patients (29%) with overdue laboratory tests, 37 of which were receiving bisphosphonates. One patient included on the dashboard was taking romosozumab and all their monitoring parameters were up to date, thus their data were not included in the Table to prevent possible identification.
Discussion
A dashboard alerted the osteoporosis clinic team to veterans who were overdue for visits, laboratory work, and prescription renewals. Overall, 92 patients (66%) had unmet care needs identified by the dashboard, all of which were addressed with phone calls and/or letters. Most of the overdue medication refills and laboratory tests were for patients taking bisphosphonates avoiding VAPSHCS during the COVID-19 pandemic. The dashboard enabled the RN coordinator to promptly contact the patient, facilitate coordination of care requirements, and guarantee the safe and efficient delivery of osteoporosis care.
The VA has historically been a leader in the creation of clinical dashboards to support health campaigns.11,12 These dashboards have successfully improved quality metrics towards the treatment of hepatitis C virus, heart failure, and highrisk opioid prescribing.13-15 Data have shown that successful clinical dashboard implementation must be done in conjunction with protected time or staff to support care improvements.16 Additionally, the time required for clinical dashboards can limit their sustainability and feasibility.17 A study aimed at improving osteoporosis care for patients with Parkinson disease found that weekly multidisciplinary review of at-risk patients resulted in all new patients and 91% of follow-up patients receiving evidence- based osteoporosis treatments.17 However, despite the benefits, the intervention required significant time and resources. In contrast, the osteoporosis dashboard implemented at VAPSHCS was not time or resource intensive, requiring about 1 hour per week for the RN coordinator to review the dashboard and coordinate patient care needs.
Limitations
This study setting is unique from other health care organizations or VA health care systems. Implementation of a similar dashboard in other clinical settings where patients receive medical care in multiple health care systems may differ. The VA dedicates resources to support veteran population health management, which may not be available in other health care systems.11,12 These issues may pose a barrier to implementing a similar osteoporosis dashboard in non-VA facilities. In addition, it is significant that while the dashboard can be reconfigured and adapted to track veterans across different VA facilities, certain complexities arise if essential data, such as laboratory tests and DXA imaging, are conducted outside of VA facilities. In such cases, manual entry of this information into the dashboard would be necessary. Because the dashboard was quickly developed during the COVID-19 pandemic, this study lacked preimplementation data on laboratory testing, medication refills, and DXA imaging, which would have enabled a comparison of adherence before and after dashboard implementation. Finally, we acknowledge the delay in publishing these findings; however, we believe sharing innovative approaches to providing care for high-risk populations is essential, as demonstrated during the COVID-19 pandemic.
Conclusions
An osteoporosis clinic dashboard served as a valuable clinical support tool to ensure safe and effective osteoporosis medication delivery at VAPSHCS. Considering the growing utilization of osteoporosis medications, this dashboard plays a vital role in facilitating care coordination for patients receiving these high-risk treatments.18 Use of the dashboard supported the effective use of high-cost osteoporosis medications and is likely to improve clinical osteoporosis outcomes.
Despite the known fracture risk reduction, osteoporosis medication adherence is low.19,20 Maintaining consistent pharmacotherapy for osteoporosis is essential not only for fracture prevention but also reducing health care costs related to osteoporosis and preserving patient independence and functionality.21-24 While initially developed in response to the COVID-19 pandemic, the dashboard remains useful. The VAPSHCS osteoporosis clinic is now staffed by 2 physicians (endocrine and rheumatology) and the dashboard is still in use. The RN coordinator spends about 15 minutes per week using the dashboard and managing the 67 veterans on osteoporosis therapy. This dashboard represents a sustainable clinical tool with the capacity to minimize osteoporosis care gaps and improve outcomes.
- Johnell O, Kanis J. Epidemiology of osteoporotic fractures. Osteoporos Int. 2005;16(suppl 2):S3-S7. doi:10.1007/s00198-004-1702-6
- van Staa TP, Dennison EM, Leufkens HG, Cooper C. Epidemiology of fractures in England and Wales. Bone. 2001;29:517-522. doi:10.1016/s8756-3282(01)00614-7
- Dennison E, Cooper C. Epidemiology of osteoporotic fractures. Horm Res. 2000;54(suppl 1):58-63. doi:10.1159/000063449
- Cooper C. Epidemiology and public health impact of osteoporosis. Baillieres Clin Rheumatol. 1993;7:459-477. doi:10.1016/s0950-3579(05)80073-1
- Dolan P, Torgerson DJ. The cost of treating osteoporotic fractures in the United Kingdom female population. Osteoporos Int. 1998;8:611-617. doi:10.1007/s001980050107
- Burge R, Dawson-Hughes B, Solomon DH, Wong JB, King A, Tosteson A. Incidence and economic burden of osteoporosis-related fractures in the United States, 2005-2025. J Bone Miner Res. 2007;22:465-475. doi:10.1359/jbmr.061113
- Palacios S. Medical treatment of osteoporosis. Climacteric. 2022;25:43-49. doi:10.1080/13697137.2021.1951697
- Eastell R, Rosen CJ, Black DM, Cheung AM, Murad MH, Shoback D. Pharmacological management of osteoporosis in postmenopausal women: an Endocrine Society* clinical practice guideline. J Clin Endocrinol Metab. 2019;104:1595-1622. doi:10.1210/jc.2019-00221
- Watts NB, Adler RA, Bilezikian JP, et al. Osteoporosis in men: an Endocrine Society clinical practice guideline. J Clin Endocrinol Metab. 2012;97:1802-1822. doi:10.1210/jc.2011-3045
- Lau MK, Bounthavong M, Kay CL, Harvey MA, Christopher MLD. Clinical dashboard development and use for academic detailing in the U.S. Department of Veterans Affairs. J Am Pharm Assoc (2003). 2019;59(2S):S96-S103.e3. doi:10.1016/j.japh.2018.12.006
- Mould DR, D’Haens G, Upton RN. Clinical decision support tools: the evolution of a revolution. Clin Pharmacol Ther. 2016;99:405-418. doi:10.1002/cpt.334
- Kizer KW, Fonseca ML, Long LM. The veterans healthcare system: preparing for the twenty-first century. Hosp Health Serv Adm. 1997;42:283-298.
- Park A, Gonzalez R, Chartier M, et al. Screening and treating hepatitis c in the VA: achieving excellence using lean and system redesign. Fed Pract. 2018;35:24-29.
- Brownell N, Kay C, Parra D, et al. Development and optimization of the Veterans Affairs’ national heart failure dashboard for population health management. J Card Fail. 2024;30:452-459. doi:10.1016/j.cardfail.2023.08.024
- Lin LA, Bohnert ASB, Kerns RD, Clay MA, Ganoczy D, Ilgen MA. Impact of the opioid safety initiative on opioidrelated prescribing in veterans. Pain. 2017;158:833-839. doi:10.1097/j.pain.0000000000000837
- Twohig PA, Rivington JR, Gunzler D, Daprano J, Margolius D. Clinician dashboard views and improvement in preventative health outcome measures: a retrospective analysis. BMC Health Serv Res. 2019;19:475. doi:10.1186/s12913-019-4327-3
- Singh I, Fletcher R, Scanlon L, Tyler M, Aithal S. A quality improvement initiative on the management of osteoporosis in older people with Parkinsonism. BMJ Qual Improv Rep. 2016;5:u210921.w5756. doi:10.1136/bmjquality.u210921.w5756
- Anastasilakis AD, Makras P, Yavropoulou MP, Tabacco G, Naciu AM, Palermo A. Denosumab discontinuation and the rebound phenomenon: a narrative review. J Clin Med. 2021;10:152. doi:10.3390/jcm10010152
- Sharman Moser S, Yu J, Goldshtein I, et al. Cost and consequences of nonadherence with oral bisphosphonate therapy: findings from a real-world data analysis. Ann Pharmacother. 2016;50:262-269. doi:10.1177/1060028015626935
- Olsen KR, Hansen C, Abrahamsen B. Association between refill compliance to oral bisphosphonate treatment, incident fractures, and health care costs--an analysis using national health databases. Osteoporos Int. 2013;24:2639-2647. doi:10.1007/s00198-013-2365-y
- Blouin J, Dragomir A, Fredette M, Ste-Marie LG, Fernandes JC, Perreault S. Comparison of direct health care costs related to the pharmacological treatment of osteoporosis and to the management of osteoporotic fractures among compliant and noncompliant users of alendronate and risedronate: a population-based study. Osteoporos Int. 2009;20:1571-1581. doi:10.1007/s00198-008-0818-5
- Cotté F-E, De Pouvourville G. Cost of non-persistence with oral bisphosphonates in post-menopausal osteoporosis treatment in France. BMC Health Serv Res. 2011;11:151. doi:10.1186/1472-6963-11-151
- Cho H, Byun J-H, Song I, et al. Effect of improved medication adherence on health care costs in osteoporosis patients. Medicine (Baltimore). 2018;97:e11470. doi:10.1097/MD.0000000000011470
- Li N, Cornelissen D, Silverman S, et al. An updated systematic review of cost-effectiveness analyses of drugs for osteoporosis. Pharmacoeconomics. 2021;39:181-209. doi:10.1007/s40273-020-00965-9
Improving High-Risk Osteoporosis Medication Adherence and Safety With an Automated Dashboard
Improving High-Risk Osteoporosis Medication Adherence and Safety With an Automated Dashboard

Efficacy of Anti-Obesity Medications in Adult and Older Adult Veteran Populations
Efficacy of Anti-Obesity Medications in Adult and Older Adult Veteran Populations
The impact of obesity in the United States is significant. Between August 2021 and August 2023, the prevalence of obesity (body mass index ≥ 30) in US adults was 40.3%.1 The prevalence of obesity in adults aged 40 to 59 years was 46.4%, higher than the prevalence in adults aged 20 to 39 years (35.5%) and those aged ≥ 60 years (38.9%).1 The excess annual medical costs associated with obesity in the US are estimated at nearly $173 billion.2
The first-line treatment for obesity is lifestyle modifications, including a healthy diet and exercise. When lifestyle modifications are not enough to achieve weight-loss goals, bariatric surgery and anti-obesity medications (AOMs) are often considered. Five medications were approved for the long-term tretament of obesity by the US Food and Drug Administration (FDA) between 2021 and 2023, when this study was conducted: semaglutide (Wegovy), liraglutide (Saxenda), phentermine and topiramate, naltrexone and bupropion, and orlistat. The clinically meaningful (and commonly accepted) weight-loss target for these medications is ≥ 5% from baseline by week 12 of the maximally tolerated dose of therapy. A 5% weight loss has been shown to be clinically significant in improving cardiometabolic risk factors.3,4 These medications are intended to be used as an adjunct to healthy diet and exercise. Of note, semaglutide and liraglutide carry brand names, which are associated with different dosing for the treatment of type 2 diabetes mellitus (T2DM).
All 5 FDA-approved AOMs were available at the Veterans Affairs Sioux Falls Health Care System (VASFHCS) for the treatment of obesity at the time of the study. To qualify for an AOM, a veteran at VASFHCS must first work with a dietitian or be enrolled in the MOVE! clinic to participate in the weight management program, which focuses on dietary, exercise, and behavioral changes. At VASFHCS, AOMs are prescribed by primary care practitioners, clinical pharmacy providers, and advanced practitioners within the MOVE! program.
Ample data exist for the efficacy of AOMs. However, no published research has reported on AOM efficacy by age group (Appendix).5-11 While most of the AOM clinical trials included older adults, the average age of participants was typically between 40 and 50 years. It is well-known that pharmacokinetic and pharmacodynamic changes occur as age increases. Renal and hepatic clearance is reduced while the volume distribution and sensitivities to some medications may increase. 12 Although this study did not focus on specific pharmacokinetic and pharmacodynamic changes with respect to AOM, it is important to recognize that this may play a role in the efficacy and safety of AOMs in older adults.
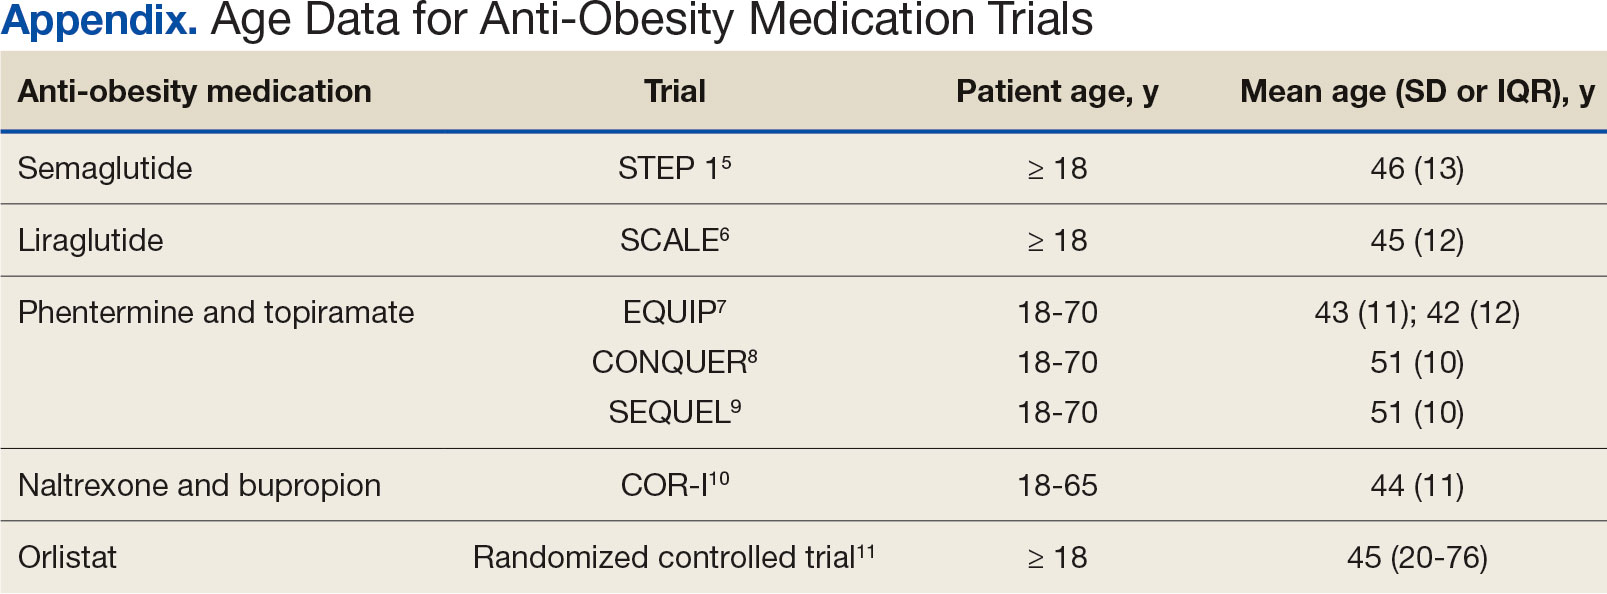
Methods
This retrospective single-center chart review was performed using the VASFHCS Computerized Patient Record System to compare the efficacy of AOMs in older adults (aged ≥ 65 years) vs adults (aged < 65 years). The primary endpoint was the percent change in body weight from baseline to 6 and 12 months after initiation of AOM therapy in the older adult vs adult population. Secondary endpoints included changes in low-density lipoprotein (LDL), hemoglobin A1c (HbA1c), and blood pressure (BP) from baseline compared to 12 months on AOM therapy. HbA1c was assessed in patients with T2DM or prediabetes at the time of AOM initiation. Two safety endpoints were also explored to determine the incidence of medication adverse events (AEs) and subsequent discontinuation of AOM. A subset analysis was performed to determine whether there was a difference in percent change in body weight between patients in 3 age groups: 18 to 40 years, 41 to 64 years, and ≥ 65 years.
The study population included patients who were prescribed an AOM between January 1, 2021, and June 30, 2023. Patients were excluded if they did not continue AOM therapy for ≥ 6 months after initiation or if they underwent gastric bypass surgery while undergoing AOM therapy. Patients taking semaglutide (Ozempic) or liraglutide (Victoza) for both T2DM and weight loss who were eventually switched to the weight loss formulations (Wegovy or Saxenda) were included. Patients who switched between semaglutide and liraglutide for weight loss were also included. Those taking semaglutide or liraglutide solely for T2DM treatment were excluded because they are dosed differently.
Collected data included age, gender, race, weight (baseline, 6 and 12 months after initiation of AOM), metabolic laboratory values/vital signs (HbA1c, LDL, and BP at baseline and 12 months after initiation of AOM), diagnosis of T2DM or prediabetes, reported AEs associated with AOM therapy, and date of AOM initiation and discontinuation (if applicable). Baseline values were defined at the time of medication initiation or values documented within 6 months prior to medication initiation if true baseline data were not reported. If values were not recorded at months 6 and 12 after AOM initiation, values documented closest to those targets were used. Weights were used for baseline, 6-, and 12-month data unless they were unavailable due to use of virtual care modalities. In these cases, patient-reported weights were used. Patients were included in the 6-month data, but not the 12-month data, if they were taking AOMs for > 6 months but not for 12 months. If patients had been on multiple AOMs, baseline data were recorded at the start of the first medication that was used for 6 months or longer. Twelve-month data were recorded after subsequent medication change. Twelve-month metabolic laboratory values/vital signs were recorded for patients included in the study even if they did not complete ≥ 12 months of AOM therapy.
Statistical Analysis
Data from patients who were prescribed an AOM from January 2021 to June 2023 and who remained on the medication for ≥ 6 months were analyzed. Baseline characteristics were analyzed using descriptive statistics. The primary and secondary endpoints were evaluated using the t test. The safety endpoints were analyzed using descriptive statistics. An analysis of variance test was used for the subset analysis. Results with P < .05 were statistically significant.
Results
A total of 144 participants were included in this study, 116 in the adult group (aged < 65 years) and 28 in the older adult group (aged ≥ 65 years). Sixty-seven patients were excluded due to prespecified inclusion and exclusion criteria.
Other than the predetermined mean age differences (48 years vs 71 years), there were multiple differences in patient baseline characteristics. When comparing older adults and adults, average weight (283 lb vs 269 lb) and White race (89% vs 87%) were slightly higher in the older adult group. Also, a higher prevalence of T2DM (54% and 18%) and a lower prevalence of prediabetes (21% and 33%) was noted in the older adult group. HbA1c and BP were similar between both groups at baseline, while LDL was slightly lower in the older adult group (Table 1).
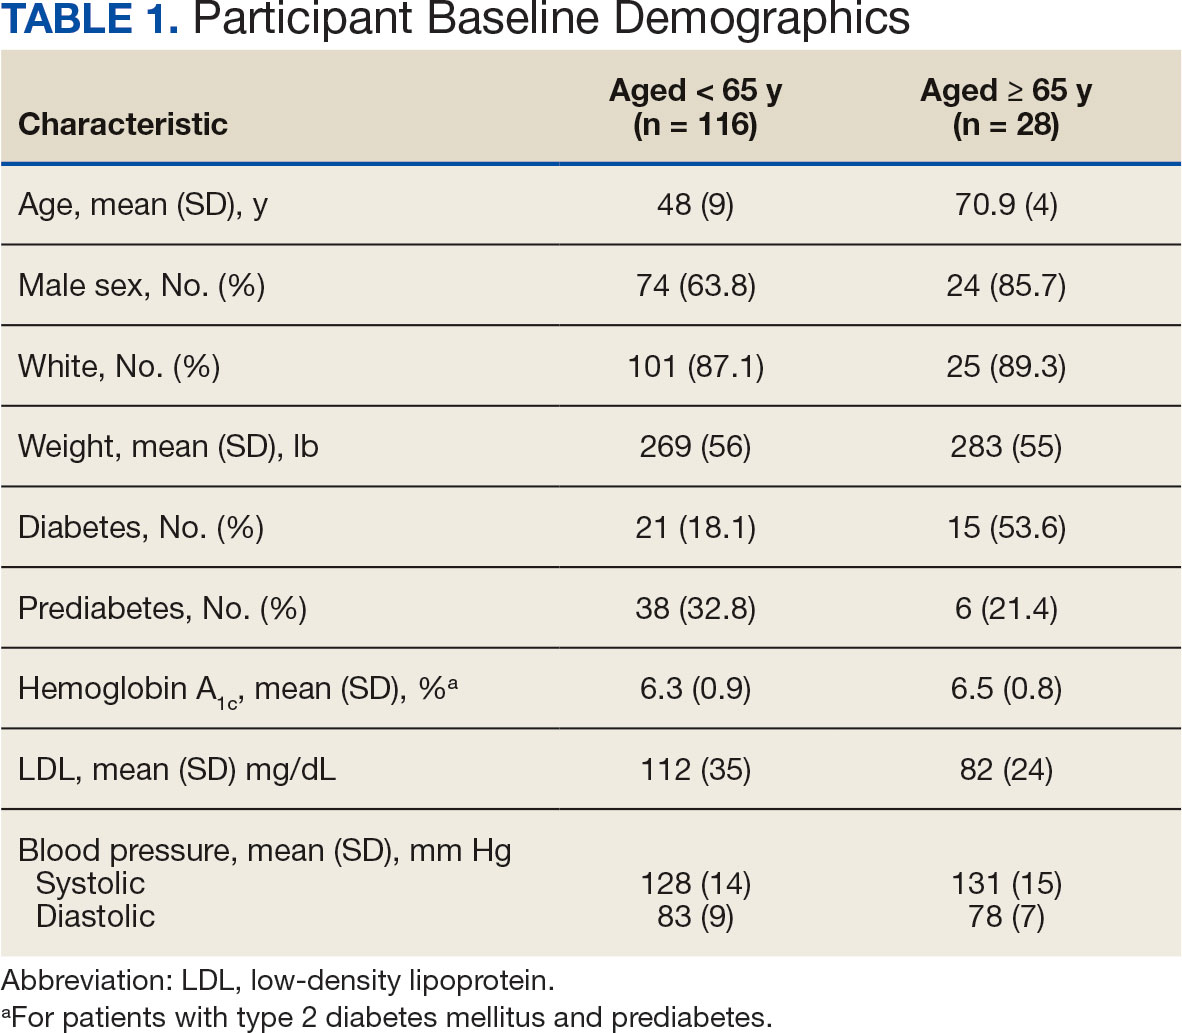
Patients in the adult group lost a mean 7.0% and 8.7% of body weight at 6 and 12 months, respectively, while the older adult group lost 5.0% and 6.6% body weight at 6 and 12 months, respectively. The difference in percent change in body weight was not statistically different at 6 (P = .08) or 12 (P = .26) months between patients in the adult group vs the older adult group or in the specific age groups (18-40 years, 41-64 years, ≥ 65 years) at 6 months (P = .24) or 12 months (P = .53) (Figure).
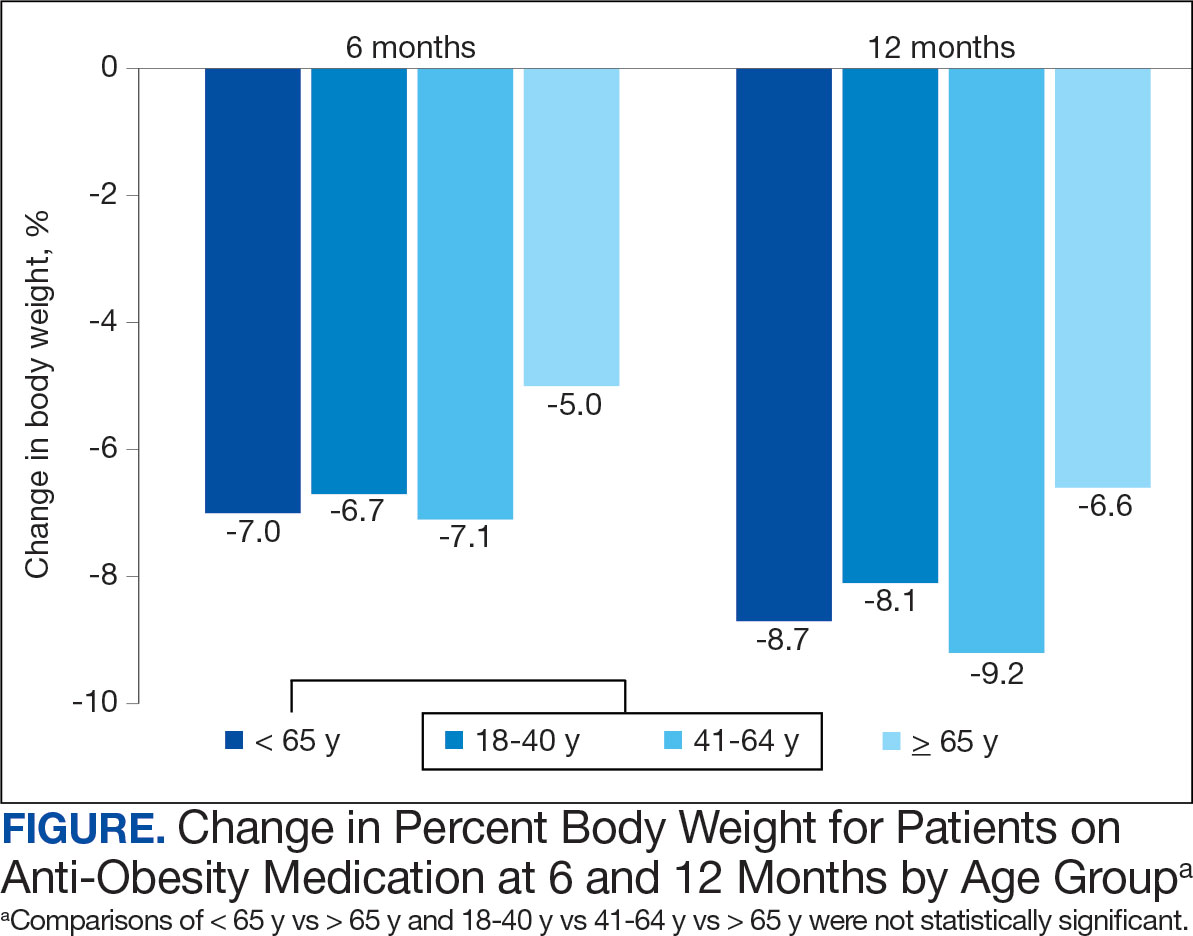
At 12 months, the difference between the adult group vs the older adult group was not statistically significant for HbA1c in patients with T2DM or prediabetes (P = .73), LDL (P = .95), systolic BP (P = .58), or diastolic BP (P = .51) (Table 2).
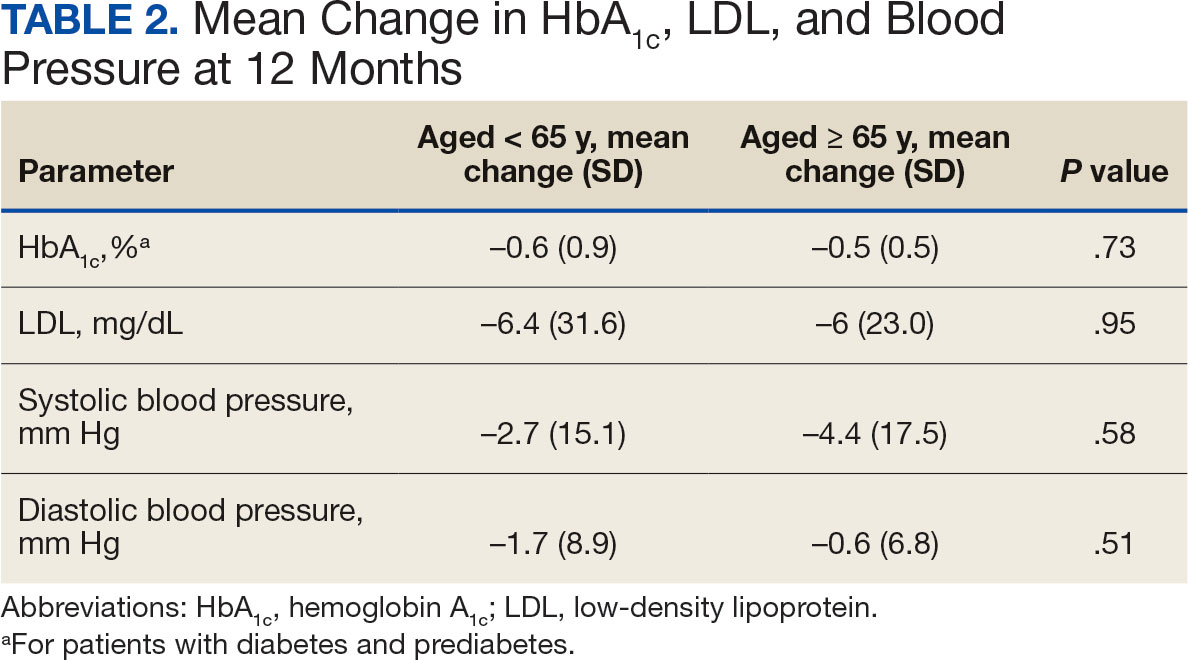
For the safety endpoint, the incidence of AEs was found to be different between groups. There were more reported AEs (61.2% vs 39.3%) and a greater increase in therapy discontinuation due to AEs (6.0% vs 0%) in the adult group compared to the older adult group (Table 3).
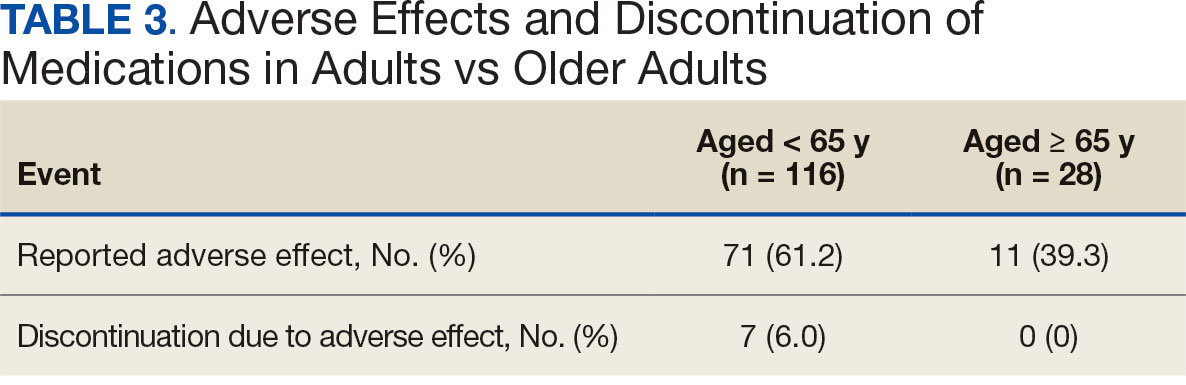
Discussion
Patients taking AOMs revealed no statistically significant difference in percent change in body weight at 6 or 12 months between adults aged < 65 years and older adults aged ≥ 65 years. The subset analysis also showed no statistically significant difference in change in percent body weight between more narrowly defined age groups of 18 to 40 years, 41 to 64 years, and ≥ 65 years. This suggests that AOM may have similar efficacy for weight loss in all ages of adults.
Secondary endpoint findings showed no statistically significant difference in HbA1c (in patients with T2DM or prediabetes), LDL, or BP at 12 months between the 2 groups. Although this study did not differentiate secondary outcomes based on the individual AOM, the change in HbA1c in both groups was expected, given that 70% of the patients included in this study were taking a glucagon-like peptide-1 agonist (liraglutide and semaglutide) at some point during the study. It’s also worth noting that secondary endpoints were collected for patients who discontinued the AOM between 6 and 12 months. Therefore, the patients’ HbA1c, LDL, and BP may not have accurately reflected the change that could have been expected if they had continued AOM therapy beyond the 12-month period.
Due to the different mechanisms and range in efficacy that AOMs have in regard to weight loss, changes in all outcomes, including weight, HbA1c, LDL, and BP were expected to vary as patients were included even after switching AOM (collection of data started after ≥ 6 months on a single AOM). Switching of AOM after the first 6 months of therapy was recorded in 25% of the patients in the ≥ 65 years group and 330% of the patients in the < 65 years group.
The incidence of AEs and subsequent discontinuation of AOMs in this study was higher in the adult group. This study excluded patients who did not continue taking an AOM for at least 6 months. As a result, the incidence of AEs between the 2 groups within the first 6 months of AOM therapy remains unknown. It is possible that during the first 6 months of therapy, patients aged < 65 years were more willing to tolerate or had fewer severe AEs compared with the older adult group. It’s also possible that the smaller number of patients in the older adult group was due to increased AEs that led them to discontinue early (before completion of 6 months of therapy) and/or prescriber discomfort in using AOMs in the older adult population. In addition, because the specific medication(s) taken by patients in each group were not detailed, it is unknown whether the adult group was taking AOMs associated with a greater number of AEs.
Limitations
This was a retrospective study with a relatively small sample size. A larger sample size may have shown more precise differences between age groups and may be more representative of the general population. Additionally, data were reliant on appropriate documentation, and adherence to AOM therapy was not assessed due to the retrospective nature of this study. At times, the study relied on patient reported data points, such as weight, if a clinic weight was not available. Also, this study did not account for many potential confounding factors such as other medications taken by the patient, which can affect outcomes including weight, HbA1c, LDL, blood pressure, and AEs.
Conclusions
This retrospective study of patients taking AOMs showed no statistically significant difference in weight loss at 6 or 12 months between adults aged < 65 years and older adults aged ≥ 65 years. A subset analysis found no statistically significant difference in change in body weight between specific age groups (18-40 years, 41-64 years, and ≥ 65 years). There was also no statistically significant difference in secondary outcomes, including change in HbA1c (in patients with T2DM or prediabetes), LDL or BP between age groups. The safety endpoints showed a higher incidence of medication AEs in the adult group, with more of these adults discontinuing therapy due to AEs. This study indicates that AOM may have similar outcomes for weight loss and metabolic laboratory values/vital sign changes between adults and older adults. Also, our findings suggest that patients aged < 65 years may experience more AEs than patients aged ≥ 65 years after ≥ 6 months of AOM therapy. Larger studies are needed to further evaluate these age-specific findings.
- Emmerich SD, Fryar CD, Stierman B, Ogden CL. Obesity and severe obesity prevalence in adults: United States, August 2021-August 2023. NCHS Data Brief No. 508. National Center for Health Statistics; 2024. Accessed December 11, 2024. https://www.cdc.gov/nchs/products/databriefs/db508.htm
- Ward ZJ, Bleich SN, Long MW, Gortmaker SL. Association of body mass index with health care expenditures in the United States by age and sex. PLoS One. 2021;16(3):e0247307. doi:10.1371/journal.pone.0247307
- Horn DB, Almandoz JP, Look M. What is clinically relevant weight loss for your patients and how can it be achieved? A narrative review. Postgrad Med. 2022;134(4):359-375. doi:10.1080/00325481.2022.2051366
- American Diabetes Association (ADA). Standards of care in diabetes–2023. Diabetes Care. 2023;46(suppl 1):S128- S2139. doi:10.2337/dc23-S008
- Wilding JPH, Batterham RL, Calanna S, et al. Onceweekly semaglutide in adults with overweight or obesity. N Engl J Med. 2021;384(11):989-1002. doi:10.1056/NEJMoa2032183
- Pi-Sunyer X, Astrup A, Fujioka K, et al. A randomized, controlled trial of 3.0 mg of liraglutide in weight management. N Engl J Med. 2015;373(1):11-22. doi:10.1056/NEJMoa1411892
- Allison DB, Gadde KM, Garvey WT, et al. Controlled-release phentermine/topiramate in severely obese adults: a randomized controlled trial (EQUIP). Obesity (Silver Spring). 2012;20(2):330-342. doi:10.1038/oby.2011.330
- Gadde KM, Allison DB, Ryan DH, et al. Effects of low-dose, controlled-release, phentermine plus topiramate combination on weight and associated comorbidities in overweight and obese adults (CONQUER): a randomised, placebo-controlled, phase 3 trial. Lancet. 2011;377(9774):1341-1352. doi:10.1016/S0140-6736(11)60205-5
- Garvey WT, Ryan DH, Look M, et al. Two-year sustained weight loss and metabolic benefits with controlled-release phentermine/topiramate in obese and overweight adults (SEQUEL): a randomized, placebo-controlled, phase 3 extension study. Am J Clin Nutr. 2012;95(2):297-308. doi:10.3945/ajcn.111.024927
- Greenway FL, Fujioka K, Plodkowski RA, et al. Effect of naltrexone plus bupropion on weight loss in overweight and obese adults (COR-I): a multicentre, randomised, double-blind, placebo-controlled, phase 3 trial. Lancet. 2010;376(9741):595-605. doi:10.1016/S0140-6736(10)60888-4
- Sjöström L, Rissanen A, Andersen T, et al. Randomised placebo-controlled trial of orlistat for weight loss and prevention of weight regain in obese patients. European Multicentre Orlistat Study Group. Lancet. 1998;352(9123):167-172. doi:10.1016s0140-6736(97)11509-4
- Mangoni AA, Jackson SHD. Age-related changes in pharmacokinetics and pharmacodynamics: basic principles and practical applications. Br J Clin Pharmacol. 2004;57(1):6-14. doi:10.1046/j.1365-2125.2003.02007.x
The impact of obesity in the United States is significant. Between August 2021 and August 2023, the prevalence of obesity (body mass index ≥ 30) in US adults was 40.3%.1 The prevalence of obesity in adults aged 40 to 59 years was 46.4%, higher than the prevalence in adults aged 20 to 39 years (35.5%) and those aged ≥ 60 years (38.9%).1 The excess annual medical costs associated with obesity in the US are estimated at nearly $173 billion.2
The first-line treatment for obesity is lifestyle modifications, including a healthy diet and exercise. When lifestyle modifications are not enough to achieve weight-loss goals, bariatric surgery and anti-obesity medications (AOMs) are often considered. Five medications were approved for the long-term tretament of obesity by the US Food and Drug Administration (FDA) between 2021 and 2023, when this study was conducted: semaglutide (Wegovy), liraglutide (Saxenda), phentermine and topiramate, naltrexone and bupropion, and orlistat. The clinically meaningful (and commonly accepted) weight-loss target for these medications is ≥ 5% from baseline by week 12 of the maximally tolerated dose of therapy. A 5% weight loss has been shown to be clinically significant in improving cardiometabolic risk factors.3,4 These medications are intended to be used as an adjunct to healthy diet and exercise. Of note, semaglutide and liraglutide carry brand names, which are associated with different dosing for the treatment of type 2 diabetes mellitus (T2DM).
All 5 FDA-approved AOMs were available at the Veterans Affairs Sioux Falls Health Care System (VASFHCS) for the treatment of obesity at the time of the study. To qualify for an AOM, a veteran at VASFHCS must first work with a dietitian or be enrolled in the MOVE! clinic to participate in the weight management program, which focuses on dietary, exercise, and behavioral changes. At VASFHCS, AOMs are prescribed by primary care practitioners, clinical pharmacy providers, and advanced practitioners within the MOVE! program.
Ample data exist for the efficacy of AOMs. However, no published research has reported on AOM efficacy by age group (Appendix).5-11 While most of the AOM clinical trials included older adults, the average age of participants was typically between 40 and 50 years. It is well-known that pharmacokinetic and pharmacodynamic changes occur as age increases. Renal and hepatic clearance is reduced while the volume distribution and sensitivities to some medications may increase. 12 Although this study did not focus on specific pharmacokinetic and pharmacodynamic changes with respect to AOM, it is important to recognize that this may play a role in the efficacy and safety of AOMs in older adults.
Methods
This retrospective single-center chart review was performed using the VASFHCS Computerized Patient Record System to compare the efficacy of AOMs in older adults (aged ≥ 65 years) vs adults (aged < 65 years). The primary endpoint was the percent change in body weight from baseline to 6 and 12 months after initiation of AOM therapy in the older adult vs adult population. Secondary endpoints included changes in low-density lipoprotein (LDL), hemoglobin A1c (HbA1c), and blood pressure (BP) from baseline compared to 12 months on AOM therapy. HbA1c was assessed in patients with T2DM or prediabetes at the time of AOM initiation. Two safety endpoints were also explored to determine the incidence of medication adverse events (AEs) and subsequent discontinuation of AOM. A subset analysis was performed to determine whether there was a difference in percent change in body weight between patients in 3 age groups: 18 to 40 years, 41 to 64 years, and ≥ 65 years.
The study population included patients who were prescribed an AOM between January 1, 2021, and June 30, 2023. Patients were excluded if they did not continue AOM therapy for ≥ 6 months after initiation or if they underwent gastric bypass surgery while undergoing AOM therapy. Patients taking semaglutide (Ozempic) or liraglutide (Victoza) for both T2DM and weight loss who were eventually switched to the weight loss formulations (Wegovy or Saxenda) were included. Patients who switched between semaglutide and liraglutide for weight loss were also included. Those taking semaglutide or liraglutide solely for T2DM treatment were excluded because they are dosed differently.
Collected data included age, gender, race, weight (baseline, 6 and 12 months after initiation of AOM), metabolic laboratory values/vital signs (HbA1c, LDL, and BP at baseline and 12 months after initiation of AOM), diagnosis of T2DM or prediabetes, reported AEs associated with AOM therapy, and date of AOM initiation and discontinuation (if applicable). Baseline values were defined at the time of medication initiation or values documented within 6 months prior to medication initiation if true baseline data were not reported. If values were not recorded at months 6 and 12 after AOM initiation, values documented closest to those targets were used. Weights were used for baseline, 6-, and 12-month data unless they were unavailable due to use of virtual care modalities. In these cases, patient-reported weights were used. Patients were included in the 6-month data, but not the 12-month data, if they were taking AOMs for > 6 months but not for 12 months. If patients had been on multiple AOMs, baseline data were recorded at the start of the first medication that was used for 6 months or longer. Twelve-month data were recorded after subsequent medication change. Twelve-month metabolic laboratory values/vital signs were recorded for patients included in the study even if they did not complete ≥ 12 months of AOM therapy.
Statistical Analysis
Data from patients who were prescribed an AOM from January 2021 to June 2023 and who remained on the medication for ≥ 6 months were analyzed. Baseline characteristics were analyzed using descriptive statistics. The primary and secondary endpoints were evaluated using the t test. The safety endpoints were analyzed using descriptive statistics. An analysis of variance test was used for the subset analysis. Results with P < .05 were statistically significant.
Results
A total of 144 participants were included in this study, 116 in the adult group (aged < 65 years) and 28 in the older adult group (aged ≥ 65 years). Sixty-seven patients were excluded due to prespecified inclusion and exclusion criteria.
Other than the predetermined mean age differences (48 years vs 71 years), there were multiple differences in patient baseline characteristics. When comparing older adults and adults, average weight (283 lb vs 269 lb) and White race (89% vs 87%) were slightly higher in the older adult group. Also, a higher prevalence of T2DM (54% and 18%) and a lower prevalence of prediabetes (21% and 33%) was noted in the older adult group. HbA1c and BP were similar between both groups at baseline, while LDL was slightly lower in the older adult group (Table 1).
Patients in the adult group lost a mean 7.0% and 8.7% of body weight at 6 and 12 months, respectively, while the older adult group lost 5.0% and 6.6% body weight at 6 and 12 months, respectively. The difference in percent change in body weight was not statistically different at 6 (P = .08) or 12 (P = .26) months between patients in the adult group vs the older adult group or in the specific age groups (18-40 years, 41-64 years, ≥ 65 years) at 6 months (P = .24) or 12 months (P = .53) (Figure).
At 12 months, the difference between the adult group vs the older adult group was not statistically significant for HbA1c in patients with T2DM or prediabetes (P = .73), LDL (P = .95), systolic BP (P = .58), or diastolic BP (P = .51) (Table 2).
For the safety endpoint, the incidence of AEs was found to be different between groups. There were more reported AEs (61.2% vs 39.3%) and a greater increase in therapy discontinuation due to AEs (6.0% vs 0%) in the adult group compared to the older adult group (Table 3).
Discussion
Patients taking AOMs revealed no statistically significant difference in percent change in body weight at 6 or 12 months between adults aged < 65 years and older adults aged ≥ 65 years. The subset analysis also showed no statistically significant difference in change in percent body weight between more narrowly defined age groups of 18 to 40 years, 41 to 64 years, and ≥ 65 years. This suggests that AOM may have similar efficacy for weight loss in all ages of adults.
Secondary endpoint findings showed no statistically significant difference in HbA1c (in patients with T2DM or prediabetes), LDL, or BP at 12 months between the 2 groups. Although this study did not differentiate secondary outcomes based on the individual AOM, the change in HbA1c in both groups was expected, given that 70% of the patients included in this study were taking a glucagon-like peptide-1 agonist (liraglutide and semaglutide) at some point during the study. It’s also worth noting that secondary endpoints were collected for patients who discontinued the AOM between 6 and 12 months. Therefore, the patients’ HbA1c, LDL, and BP may not have accurately reflected the change that could have been expected if they had continued AOM therapy beyond the 12-month period.
Due to the different mechanisms and range in efficacy that AOMs have in regard to weight loss, changes in all outcomes, including weight, HbA1c, LDL, and BP were expected to vary as patients were included even after switching AOM (collection of data started after ≥ 6 months on a single AOM). Switching of AOM after the first 6 months of therapy was recorded in 25% of the patients in the ≥ 65 years group and 330% of the patients in the < 65 years group.
The incidence of AEs and subsequent discontinuation of AOMs in this study was higher in the adult group. This study excluded patients who did not continue taking an AOM for at least 6 months. As a result, the incidence of AEs between the 2 groups within the first 6 months of AOM therapy remains unknown. It is possible that during the first 6 months of therapy, patients aged < 65 years were more willing to tolerate or had fewer severe AEs compared with the older adult group. It’s also possible that the smaller number of patients in the older adult group was due to increased AEs that led them to discontinue early (before completion of 6 months of therapy) and/or prescriber discomfort in using AOMs in the older adult population. In addition, because the specific medication(s) taken by patients in each group were not detailed, it is unknown whether the adult group was taking AOMs associated with a greater number of AEs.
Limitations
This was a retrospective study with a relatively small sample size. A larger sample size may have shown more precise differences between age groups and may be more representative of the general population. Additionally, data were reliant on appropriate documentation, and adherence to AOM therapy was not assessed due to the retrospective nature of this study. At times, the study relied on patient reported data points, such as weight, if a clinic weight was not available. Also, this study did not account for many potential confounding factors such as other medications taken by the patient, which can affect outcomes including weight, HbA1c, LDL, blood pressure, and AEs.
Conclusions
This retrospective study of patients taking AOMs showed no statistically significant difference in weight loss at 6 or 12 months between adults aged < 65 years and older adults aged ≥ 65 years. A subset analysis found no statistically significant difference in change in body weight between specific age groups (18-40 years, 41-64 years, and ≥ 65 years). There was also no statistically significant difference in secondary outcomes, including change in HbA1c (in patients with T2DM or prediabetes), LDL or BP between age groups. The safety endpoints showed a higher incidence of medication AEs in the adult group, with more of these adults discontinuing therapy due to AEs. This study indicates that AOM may have similar outcomes for weight loss and metabolic laboratory values/vital sign changes between adults and older adults. Also, our findings suggest that patients aged < 65 years may experience more AEs than patients aged ≥ 65 years after ≥ 6 months of AOM therapy. Larger studies are needed to further evaluate these age-specific findings.
- Emmerich SD, Fryar CD, Stierman B, Ogden CL. Obesity and severe obesity prevalence in adults: United States, August 2021-August 2023. NCHS Data Brief No. 508. National Center for Health Statistics; 2024. Accessed December 11, 2024. https://www.cdc.gov/nchs/products/databriefs/db508.htm
- Ward ZJ, Bleich SN, Long MW, Gortmaker SL. Association of body mass index with health care expenditures in the United States by age and sex. PLoS One. 2021;16(3):e0247307. doi:10.1371/journal.pone.0247307
- Horn DB, Almandoz JP, Look M. What is clinically relevant weight loss for your patients and how can it be achieved? A narrative review. Postgrad Med. 2022;134(4):359-375. doi:10.1080/00325481.2022.2051366
- American Diabetes Association (ADA). Standards of care in diabetes–2023. Diabetes Care. 2023;46(suppl 1):S128- S2139. doi:10.2337/dc23-S008
- Wilding JPH, Batterham RL, Calanna S, et al. Onceweekly semaglutide in adults with overweight or obesity. N Engl J Med. 2021;384(11):989-1002. doi:10.1056/NEJMoa2032183
- Pi-Sunyer X, Astrup A, Fujioka K, et al. A randomized, controlled trial of 3.0 mg of liraglutide in weight management. N Engl J Med. 2015;373(1):11-22. doi:10.1056/NEJMoa1411892
- Allison DB, Gadde KM, Garvey WT, et al. Controlled-release phentermine/topiramate in severely obese adults: a randomized controlled trial (EQUIP). Obesity (Silver Spring). 2012;20(2):330-342. doi:10.1038/oby.2011.330
- Gadde KM, Allison DB, Ryan DH, et al. Effects of low-dose, controlled-release, phentermine plus topiramate combination on weight and associated comorbidities in overweight and obese adults (CONQUER): a randomised, placebo-controlled, phase 3 trial. Lancet. 2011;377(9774):1341-1352. doi:10.1016/S0140-6736(11)60205-5
- Garvey WT, Ryan DH, Look M, et al. Two-year sustained weight loss and metabolic benefits with controlled-release phentermine/topiramate in obese and overweight adults (SEQUEL): a randomized, placebo-controlled, phase 3 extension study. Am J Clin Nutr. 2012;95(2):297-308. doi:10.3945/ajcn.111.024927
- Greenway FL, Fujioka K, Plodkowski RA, et al. Effect of naltrexone plus bupropion on weight loss in overweight and obese adults (COR-I): a multicentre, randomised, double-blind, placebo-controlled, phase 3 trial. Lancet. 2010;376(9741):595-605. doi:10.1016/S0140-6736(10)60888-4
- Sjöström L, Rissanen A, Andersen T, et al. Randomised placebo-controlled trial of orlistat for weight loss and prevention of weight regain in obese patients. European Multicentre Orlistat Study Group. Lancet. 1998;352(9123):167-172. doi:10.1016s0140-6736(97)11509-4
- Mangoni AA, Jackson SHD. Age-related changes in pharmacokinetics and pharmacodynamics: basic principles and practical applications. Br J Clin Pharmacol. 2004;57(1):6-14. doi:10.1046/j.1365-2125.2003.02007.x
Efficacy of Anti-Obesity Medications in Adult and Older Adult Veteran Populations
Efficacy of Anti-Obesity Medications in Adult and Older Adult Veteran Populations
Resident Participation Impact on Operative Time and Outcomes in Veterans Undergoing Total Laryngectomy
Resident Participation Impact on Operative Time and Outcomes in Veterans Undergoing Total Laryngectomy
The US Department of Veterans Affairs (VA) has been integral in resident training. Resident surgical training requires a balance of supervision and autonomy, along with procedure repetition and appropriate feedback.1-3 Non-VA research has found that resident participation across various otolaryngology procedures, including thyroidectomy, neck dissection, and laryngectomy, does not increase patient morbidity.4-7 However, resident involvement in private and academic settings that included nonhead and neck procedures was linked to increased operative time and reduced productivity, as determined by work relative value units (wRVUs).7-13 This has also been identified in other specialties, including general surgery, orthopedics, and ophthalmology.14-16
Unlike the private sector, surgeon compensation at the VA is not as closely linked to operative productivity, offering a unique setting for resident training. While VA integration in otolaryngology residency programs increases resident case numbers, particularly in head and neck cases, the impact on VA patient outcomes and productivity is unknown.17 The use of larynxpreserving treatment modalities for laryngeal cancer has led to a decline in the number of total laryngectomies performed, which could potentially impact resident operative training for laryngectomies.18-20
This study sought to determine the impact of resident participation on operative time, wRVUs, and patient outcomes in veterans who underwent a total laryngectomy. This study was reviewed and approved by the MedStar Georgetown University Hospital Institutional Review Board and Research and Development Committee (#1595672).
Methods
A retrospective cohort of veterans nationwide who underwent total laryngectomy between 2001 and 2021, with or without neck dissection, was identified from the Veterans Affairs Surgical Quality Improvement Program (VASQIP). Data were extracted via the VA Informatics and Computing Infrastructure and patients were included based on Current Procedural Terminology codes for total laryngectomy, with or without neck dissection (31320, 31360, 31365). Laryngopharyngectomies, partial laryngectomies, and minimally invasive laryngectomies were excluded. VASQIP nurse data managers reviewed patient data for operative data, postoperative outcomes (including 30- day morbidity and mortality), and preoperative risk factors (Appendix).21
The VASQIP data provide the highest resident or postgraduate year (PGY) per surgery. PGY 1, 2, and 3 were considered junior residents and PGY ≥4, surgical fellows, and individuals who took research years during residency were considered senior residents. Cases performed by attending physicians alone were compared with those involving junior or senior residents.
Patient demographic data included age, body mass index, smoking and alcohol use, weight loss, and functional status. Consumption of any tobacco products within 12 months of surgery was considered tobacco use. Drinking on average ≥2 alcoholic beverages daily was considered alcohol use. Weight loss was defined as a 10% reduction in body weight within the 6 months before surgery, excluding patients enrolled in a weight loss program. Functional status was categorized as independent, partially dependent, totally dependent, and unknown.
Primary outcomes included operative time, wRVUs generated, and wRVUs generated per hour of operative time. Postoperative complications were recorded both as a continuous variable and as a binary variable for presence or absence of a complication. Additional outcome variables included length of postoperative hospital stay, return to the operating room (OR), and death within 30 days of surgery.
Statistical Analysis
Data were summarized using frequency and percentage for categorical variables and median with IQR for continuous variables. Data were also summarized based on resident involvement in the surgery and the PGY level of the residents involved. The occurrence of total laryngectomy, rate of complications, and patient return to the OR were summarized by year.
Univariate associations between resident involvement and surgical outcomes were analyzed using the Kruskal-Wallis test for continuous variables and the ÷2 test for categorical variables. A Fisher exact test was used when the cell count in the contingency table was < 5. The univariate associations between surgical outcomes and demographic/preoperative variables were examined using 2-sided Wilcoxon ranksum tests or Kruskal-Wallis tests between continuous variables and categorical variables, X2 or Fisher exact test between 2 categorical variables, and 2-sided Spearman correlation test between 2 continuous variables. A false-discovery rate approach was used for simultaneous posthoc tests to determine the adjusted P values for wRVUs generated/operative time for attending physicians alone vs with junior residents and for attending physicians alone vs with senior residents. Models were used to evaluate the effects of resident involvement on surgical outcomes, adjusting for variables that showed significant univariate associations. Linear regression models were used for operative time, wRVUs generated, wRVUs generated/operative time, and length of postoperative stay. A logistic regression model was used for death within 30 days. Models were not built for postoperative complications or patient return to the OR, as these were only statistically significantly associated with the patient’s preoperative functional status. A finding was considered significant if P < .05. All analyses were performed using statistical software RStudio Version 2023.03.0.
Results
Between 2001 and 2021, 1857 patients who underwent total laryngectomy were identified from the VASQIP database nationwide. Most of the total laryngectomies were staffed by an attending physician with a senior resident (n = 1190, 64%), 446 (24%) were conducted by the attending physician alone, and 221 (12%) by an attending physician with a junior resident (Table 1). The mean operating time for an attending physician alone was 378 minutes, 384 minutes for an attending physician with a senior resident, and 432 minutes for an attending physician with a junior resident (Table 2). There was a statistically significant increase in operating time for laryngectomies with resident participation compared to attending physicians operating alone (P < .001).
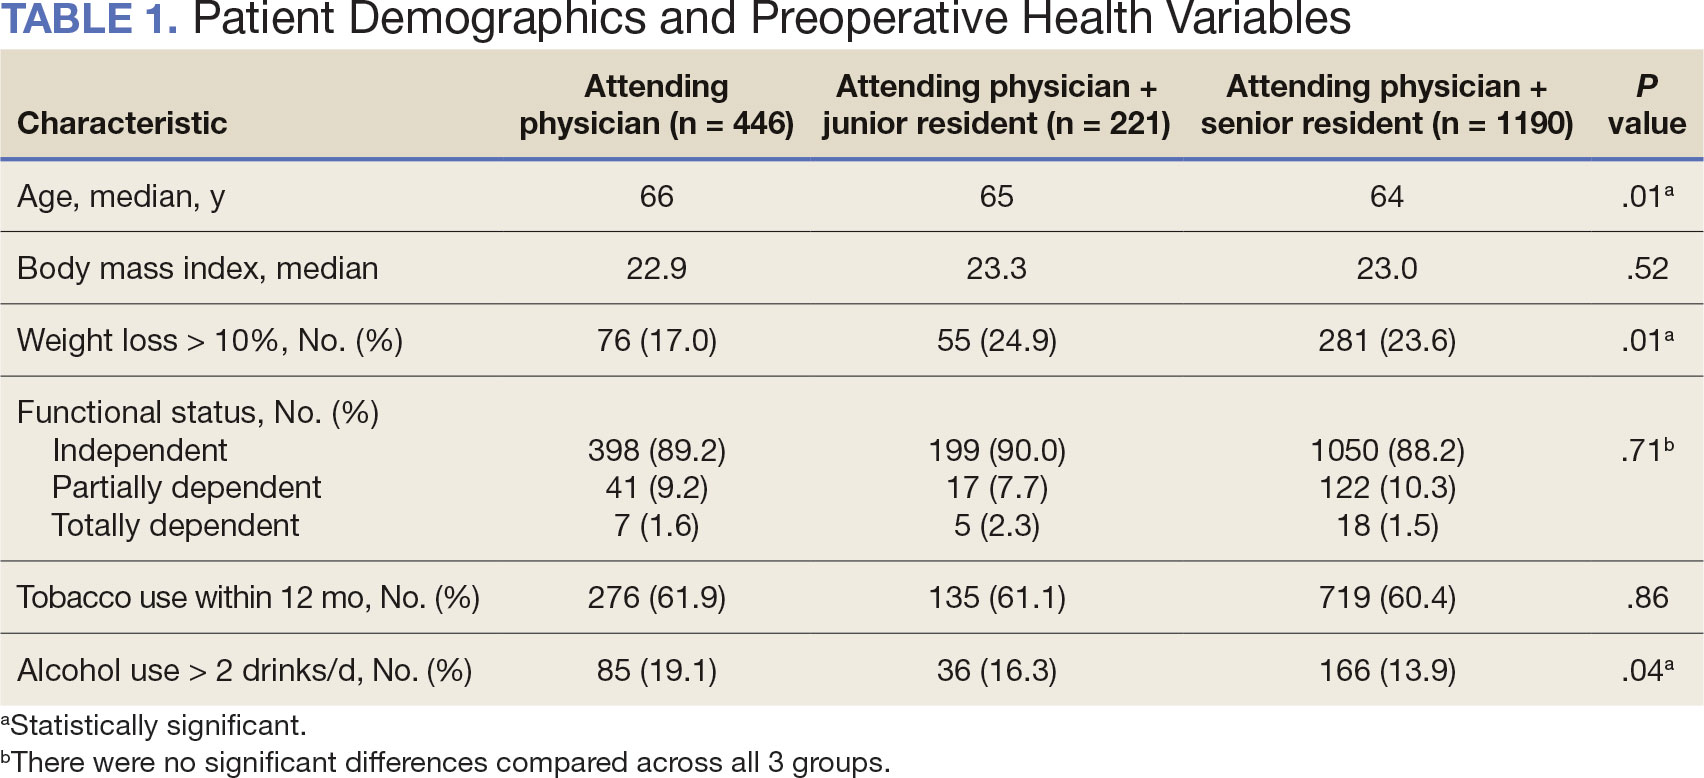
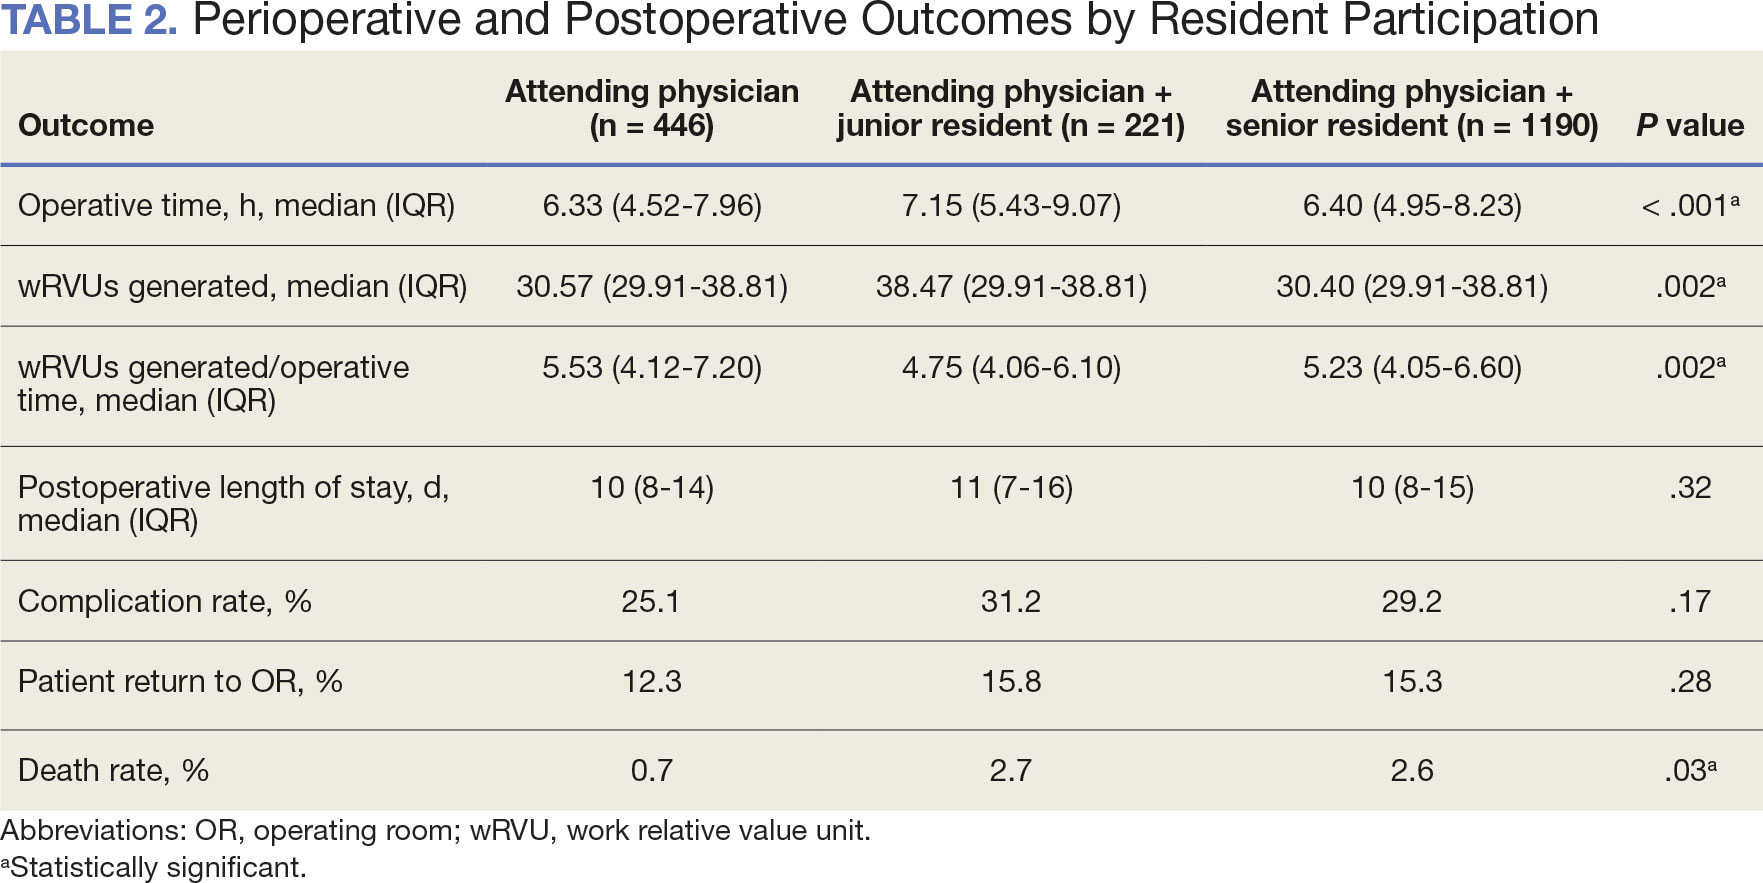
When the wRVUs generated/operative time was analyzed, there was a statistically significant difference between comparison groups. Total laryngectomies performed by attending physicians alone had the highest wRVUs generated/operative time (5.5), followed by laryngectomies performed by attending physicians with senior residents and laryngectomies performed by attending physicians with junior residents (5.2 and 4.8, respectively; P = .002). Table 3 describes adjusted P values for wRVUs generated/ operative time for total laryngectomies performed by attending physicians alone vs with junior residents (P = .003) and for attending physicians alone vs with senior residents (P = .02). Resident participation in total laryngectomies did not significantly impact the development or number of postoperative complications or the rate of return to the OR.
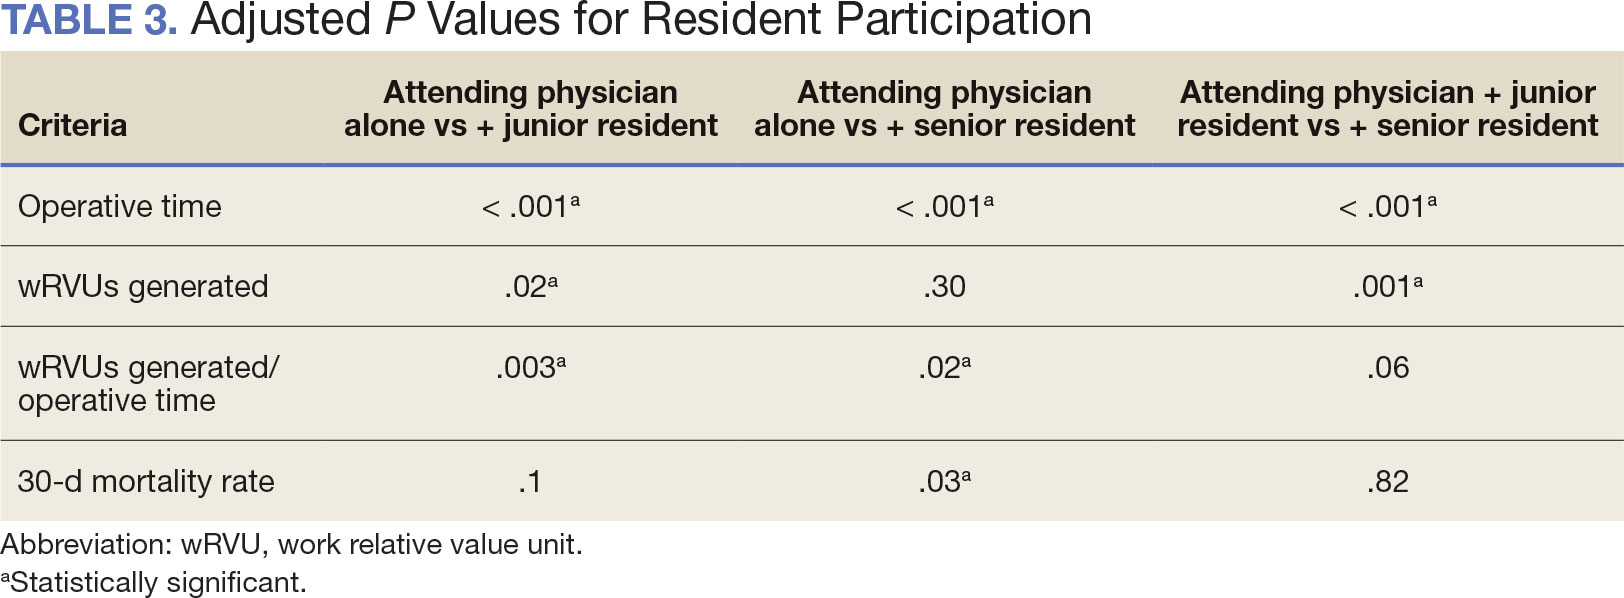
The number of laryngectomies performed in a single fiscal year peaked in 2010 at 170 cases (Figure 1). Between 2001 and 2021, the mean rates of postoperative complications (21.3%) and patient return to the OR (14.6%) did not significantly change. Resident participation in total laryngectomies also peaked in 2010 at 89.0% but has significantly declined, falling to a low of 43.6% in 2021 (Figure 2). From 2001 to 2011, the mean resident participation rate in total laryngectomies was 80.6%, compared with 68.3% from 2012 to 2021 (P < .001).
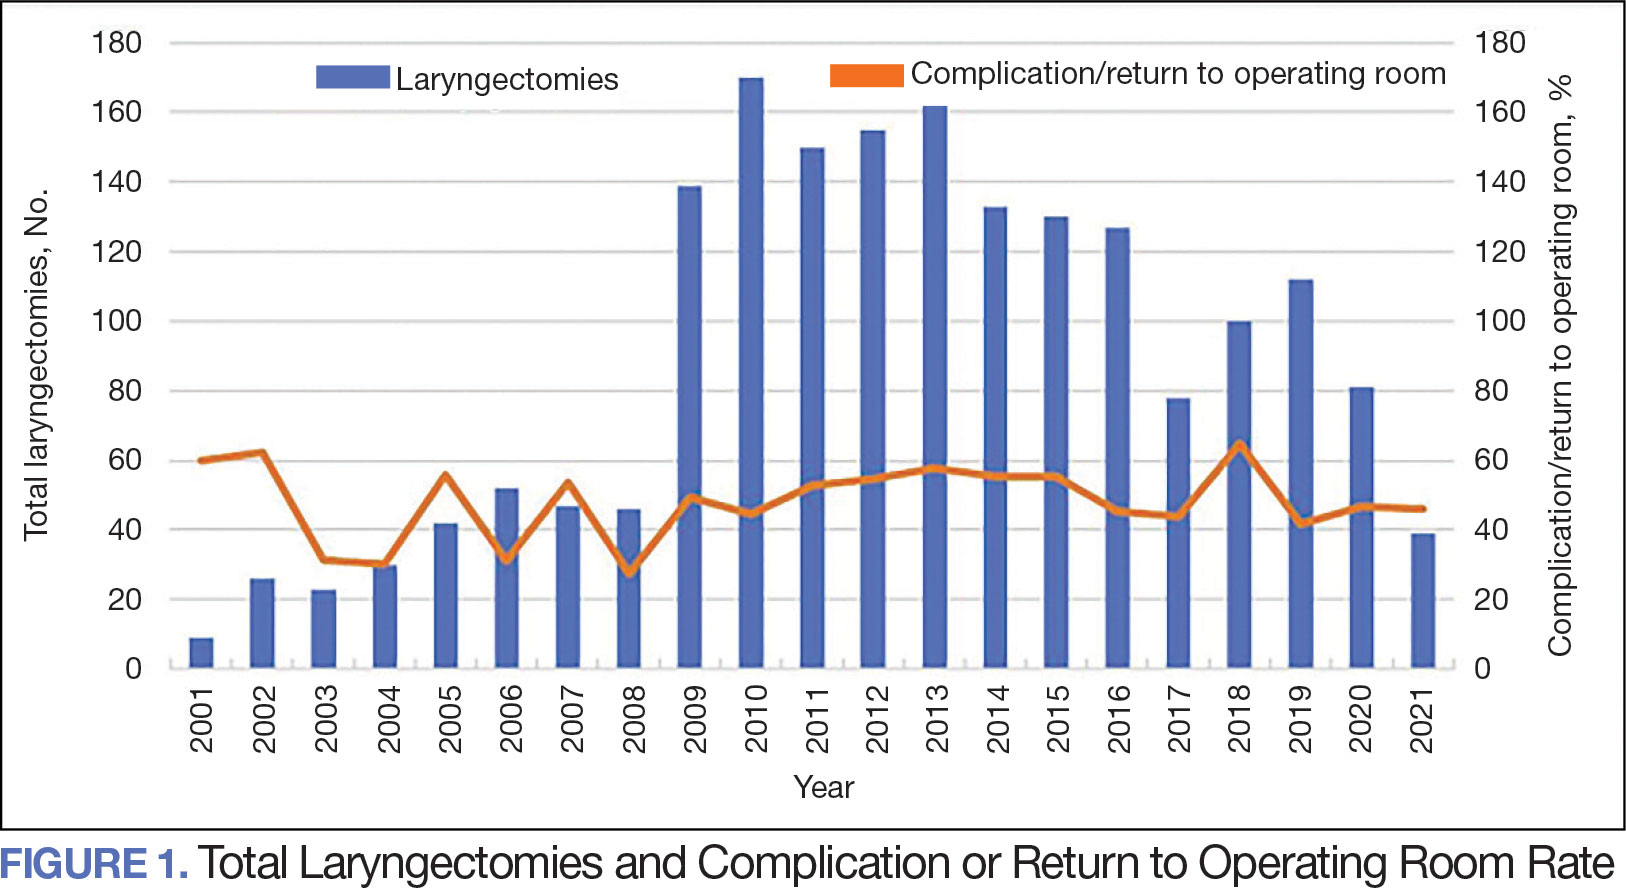
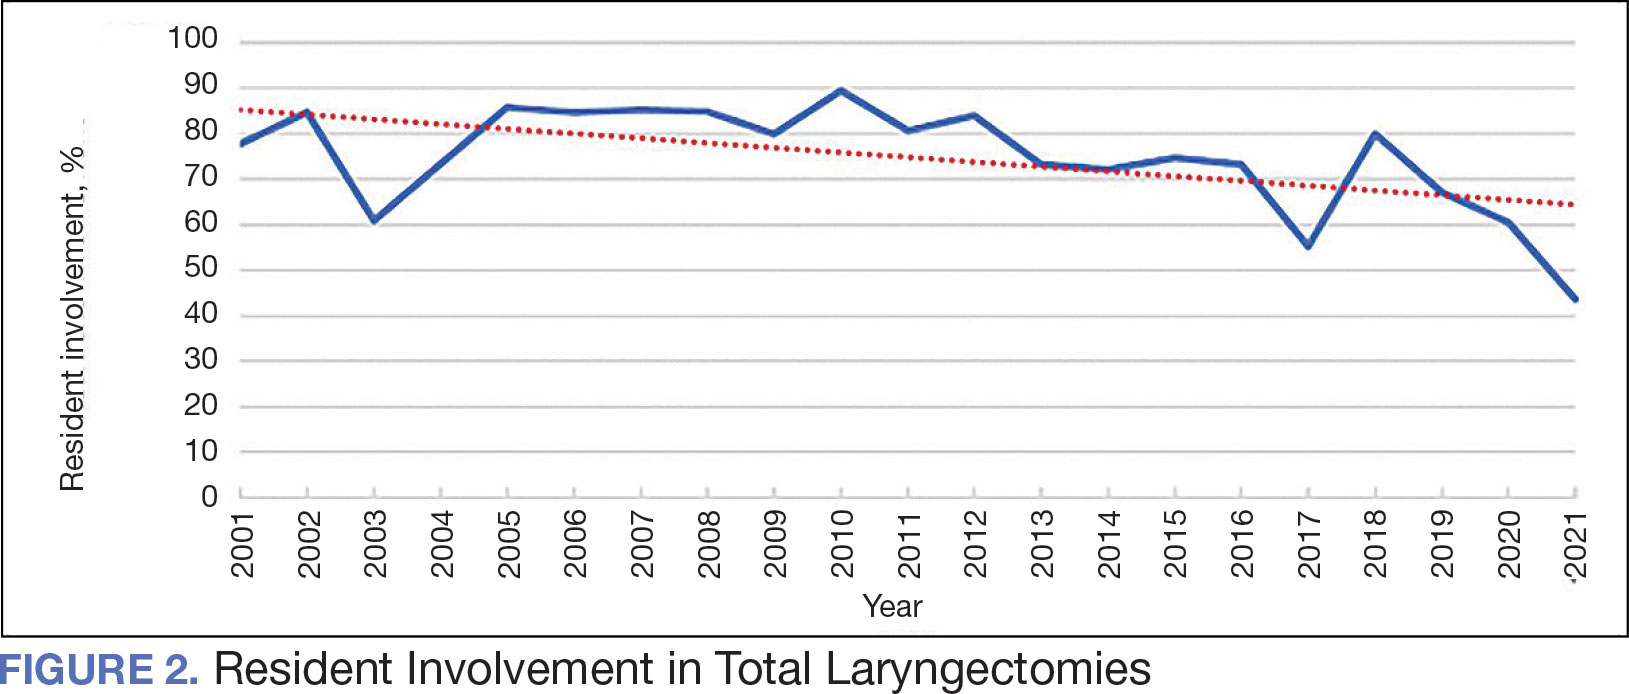
The effect of various demographic and preoperative characteristics on surgical outcomes was also analyzed. A linear regression model accounted for each variable significantly associated with operative time. On multivariable analysis, when all other variables were held constant, Table 4 shows the estimated change in operative time based on certain criteria. For instance, the operative time for attendings with junior residents surgeries was 40 minutes longer (95% CI, 16 to 64) than that of attending alone surgeries (P = .001). Furthermore, operative time decreased by 1.1 minutes (95% CI, 0.30 to 2.04) for each 1-year increase in patient age (P = .009).
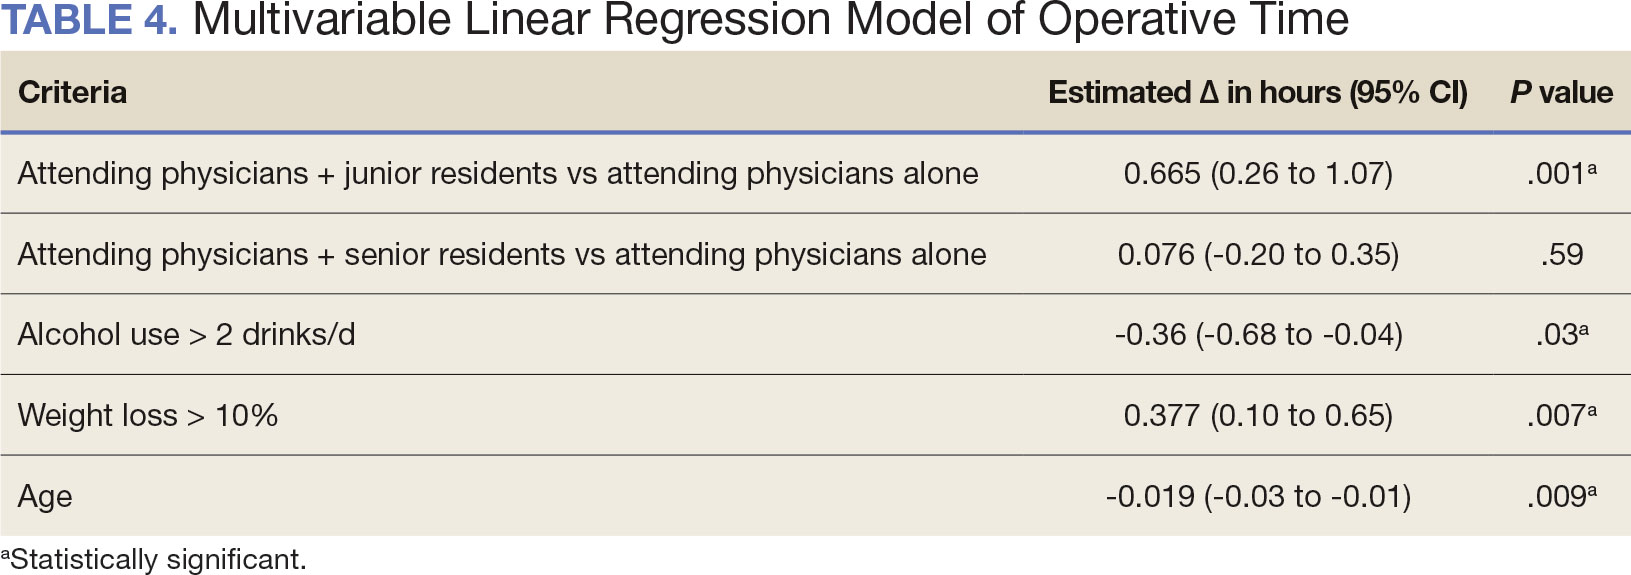
A multivariable logistic regression model evaluated the effect of resident involvement on 30-day mortality rates. Senior resident involvement (P = .02), partially dependent functional status (P = .01), totally dependent functional status (P < .001), and advanced age (P = .02) all were significantly associated with 30-day mortality (Table 5). When other variables remained constant, the odds of death for totally dependent patients were 10.4 times higher than that of patients with independent functional status. Thus, totally dependent functional status appeared to have a greater impact on this outcome than resident participation. The linear regression model for postoperative length of stay demonstrated that senior resident involvement (P = .04), functional status (partially dependent vs independent P < .001), and age (P = .03) were significantly associated with prolonged length of stay.
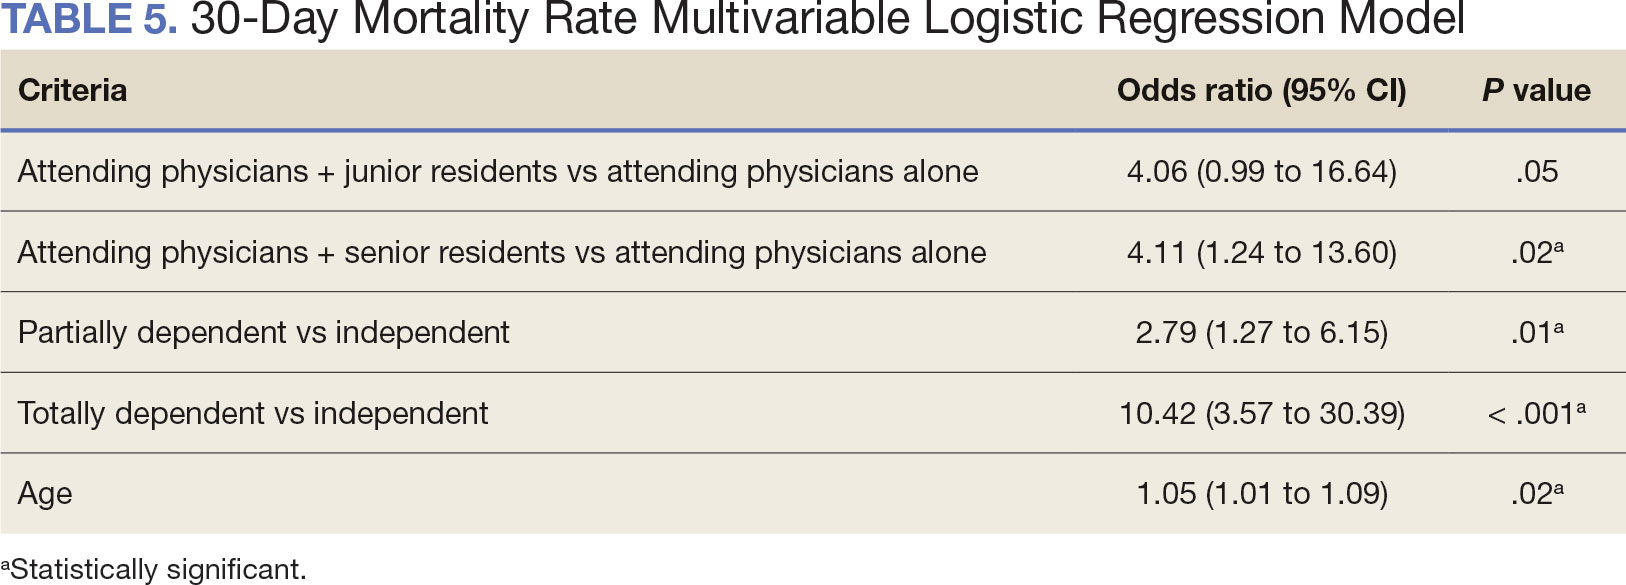
Discussion
Otolaryngology residency training is designed to educate future otolaryngologists through hands-on learning, adequate feedback, and supervision.1 Although this exposure is paramount for resident education, balancing appropriate supervision and autonomy while mitigating patient risk has been difficult. Numerous non-VA studies have reviewed the impact of resident participation on patient outcomes in various specialties, ranging from a single institution to the National Surgical Quality Improvement Program (NSQIP).4,5,7,22 This study is the first to describe the nationwide impact of resident participation on outcomes in veterans undergoing total laryngectomy.
This study found that resident participation increases operative time and decreases wRVUs generated/operative time without impacting complication rates or patient return to the OR. This reinforces the notion that under close supervision, resident participation does not negatively impact patient outcomes. Resident operative training requires time and dedication by the attending physician and surgical team, thereby increasing operative time. Because VA physician compensation is not linked with productivity as closely as it is in other private and academic settings, surgeons can dedicate more time to operative teaching. This study found that a total laryngectomy involving a junior resident took about 45 minutes longer than an attending physician working alone.
As expected, with longer operative times, the wRVUs generated/operative time ratio was lower in cases with resident participation. Even though resident participation leads to lower OR efficiency, their participation may not significantly impact ancillary costs.23 However, a recent study from NSQIP found an opportunity cost of $60.44 per hour for surgeons operating with a resident in head and neck cases.13
Postoperative complications and mortality are key measures of surgical outcomes in addition to operative time and efficiency. This study found that neither junior nor senior resident participation significantly increased complication rates or patient return to the OR. Despite declining resident involvement and the number of total laryngectomy surgeries in the VA, the complication rate has remained steady. The 30-day mortality rate was significantly higher in cases involving senior residents compared to cases with attending physicians alone. This could be a result of senior resident participation in more challenging cases, such as laryngectomies performed as salvage surgery following radiation. Residents are more often involved in cases with greater complexity at teaching institutions.24-26 Therefore, the higher mortality seen among laryngectomies with senior resident involvement is likely due to the higher complexity of those cases.
The proportion of resident involvement in laryngectomies at VA medical centers has been decreasing over time. Due to the single payer nature of the VA health care system and the number of complex and comorbid patients, the VA offers an invaluable space for resident education in the OR. The fact that less than half of laryngectomies in 2021 involved resident participation is noteworthy for residency training programs. As wRVU compensation models evolve, VA attending surgeons may face less pressure to move the case along, leading to a high potential for operative teaching. Therefore, complex cases, such as laryngectomies, are often ideal for resident participation in the VA.
The steady decline in total laryngectomies at the VA parallels the recent decrease seen in non-VA settings.20 This is due in part to the use of larynx-preserving treatment modalities for laryngeal cancer as well as decreases in the incidence of laryngeal cancer due to population level changes in smoking behaviors. 18,19 Although a laryngectomy is not a key indicator case as determined by the Accreditation Council for Graduate Medical Education, it is important for otolaryngology residents to be exposed to these cases and have a thorough understanding of the operative technique.27 Total laryngectomy was selected for this study because it is a complex and time-consuming surgery with somewhat standardized surgical steps. Unlike microvascular surgery that is very rarely performed by an attending physician alone, laryngectomies can be performed by attending physicians alone or with a resident.28
Limitations
Since this was a retrospective study, it was susceptible to errors in data entry and data extraction from the VASQIP database. Another limitation is the lack of preoperative treatment data on tumor stage and prior nonoperative treatment. For example, a salvage laryngectomy after treatment with radiation and/or chemoradiation is a higher risk procedure than an upfront laryngectomy. Senior resident involvement may be more common in patients undergoing salvage laryngectomy due to the high risk of postoperative fistula and other complications. This may have contributed to the association identified between senior resident participation and 30-day mortality.
Since we could not account for residents who took research years or were fellows, a senior resident may have been mislabeled as a junior resident or vice versa. However, because most research years occur following the third year of residency. We are confident that PGY-1, PGY-2, and PGY-3 is likely to capture junior residents. Other factors, such as coattending surgeon cases, medical student assistance, and fellow involvement may have also impacted the results of this study.
Conclusions
This study is the first to investigate the impact of resident participation on operative time, wRVUs generated, and complication rates in head and neck surgery at VA medical centers. It found that resident participation in total laryngectomies among veterans increased operative time and reduced wRVUs generated per hour but did not impact complication rate or patient return to the OR. The VA offers a unique and invaluable space for resident education and operative training, and the recent decline in resident participation among laryngectomies is important for residency programs to acknowledge and potentially address moving forward.
In contrast to oral cavity resections which can vary from partial glossectomies to composite resections, laryngectomy represents a homogenous procedure from which to draw meaningful conclusions about complication rates, operative time, and outcome. Future directions should include studying other types of head and neck surgery in the VA to determine whether the impact of resident participation mirrors the findings of this study.
- Chung RS. How much time do surgical residents need to learn operative surgery? Am J Surg. 2005;190(3):351-353. doi:10.1016/j.amjsurg.2005.06.035
- S, Darzi A. Defining quality in surgical training: perceptions of the profession. Am J Surg. 2014;207(4):628-636. doi:10.1016/j.amjsurg.2013.07.044
- Bhatti NI, Ahmed A, Choi SS. Identifying quality indicators of surgical of surgical training: a national survey. Laryngoscope. 2015;125(12):2685-2689. doi:10.1002/lary.25262
- Abt NB, Reh DD, Eisele DW, Francis HW, Gourin CG. Does resident participation influence otolaryngology-head and neck surgery morbidity and mortality? Laryngoscope. 2016;126(10):2263-2269. doi:10.1002/lary.25973
- Jubbal KT, Chang D, Izaddoost SA, Pederson W, Zavlin D, Echo A. Resident involvement in microsurgery: an American College of Surgeons national surgical quality improvement program analysis. J Surg Educ. 2017;74(6):1124-1132. doi:10.1016/j.jsurg.2017.05.017
- Kshirsagar RS, Chandy Z, Mahboubi H, Verma SP. Does resident involvement in thyroid surgery lead to increased postoperative complications? Laryngoscope. 2017;127(5):1242-1246. doi:10.1002/lary.26176
- Vieira BL, Hernandez DJ, Qin C, Smith SS, Kim JY, Dutra JC. The impact of resident involvement on otolaryngology surgical outcomes. Laryngoscope. 2016;126(3):602-607. doi:10.1002/lary.25046
- Advani V, Ahad S, Gonczy C, Markwell S, Hassan I. Does resident involvement effect surgical times and complication rates during laparoscopic appendectomy for uncomplicated appendicitis? An analysis of 16,849 cases from the ACS-NSQIP. Am J Surg. 2012;203(3):347-352. doi:10.1016/j.amjsurg.2011.08.015
- Quinn NA, Alt JA, Ashby S, Orlandi RR. Time, resident involvement, and supply drive cost variability in septoplasty with turbinate reduction. Otolaryngol Head Neck Surg. 2018;159(2):310-314. doi:10.1177/0194599818765099
- Leader BA, Wiebracht ND, Meinzen-Derr J, Ishman SL. The impact of resident involvement on tonsillectomy outcomes and surgical time. Laryngoscope. 2020;130(10):2481-2486. doi:10.1002/lary.28427
- Muelleman T, Shew M, Muelleman RJ, et al. Impact of resident participation on operative time and outcomes in otologic surgery. Otolaryngol Head Neck Surg. 2018;158(1):151-154. doi:10.1177/0194599817737270
- Puram SV, Kozin ED, Sethi R, et al. Impact of resident surgeons on procedure length based on common pediatric otolaryngology cases. Laryngoscope. 2015;125(4):991 -997. doi:10.1002/lary.24912
- Chow MS, Gordon AJ, Talwar A, Lydiatt WM, Yueh B, Givi B. The RVU compensation model and head and neck surgical education. Laryngoscope. 2024;134(1):113-119. doi:10.1002/lary.30807
- Papandria D, Rhee D, Ortega G, et al. Assessing trainee impact on operative time for common general surgical procedures in ACS-NSQIP. J Surg Educ. 2012;69(2):149-155. doi:10.1016/j.jsurg.2011.08.003
- Pugely AJ, Gao Y, Martin CT, Callagh JJ, Weinstein SL, Marsh JL. The effect of resident participation on short-term outcomes after orthopaedic surgery. Clin Orthop Relat Res. 2014;472(7):2290-2300. doi:10.1007/s11999-014-3567-0
- Hosler MR, Scott IU, Kunselman AR, Wolford KR, Oltra EZ, Murray WB. Impact of resident participation in cataract surgery on operative time and cost. Ophthalmology. 2012;119(1):95-98. doi:10.1016/j.ophtha.2011.06.026
- Lanigan A, Spaw M, Donaghe C, Brennan J. The impact of the Veteran’s Affairs medical system on an otolaryngology residency training program. Mil Med. 2018;183(11-12):e671-e675. doi:10.1093/milmed/usy041
- American Society of Clinical Oncology, Pfister DG, Laurie SA, et al. American Society of Clinical Oncology clinical practice guideline for the use of larynx-preservation strategies in the treatment of laryngeal cancer. J Clin Oncol. 2006;24(22):3693-3704. doi:10.1200/JCO.2006.07.4559
- Forastiere AA, Ismaila N, Lewin JS, et al. Use of larynxpreservation strategies in the treatment of laryngeal cancer: American Society of Clinical Oncology clinical practice guideline update. J Clin Oncol. 2018;36(11):1143-1169. doi:10.1200/JCO.2017.75.7385
- Verma SP, Mahboubi H. The changing landscape of total laryngectomy surgery. Otolaryngol Head Neck Surg. 2014;150(3):413-418. doi:10.1177/0194599813514515
- Habermann EB, Harris AHS, Giori NJ. Large surgical databases with direct data abstraction: VASQIP and ACSNSQIP. J Bone Joint Surg Am. 2022;104(suppl 3):9-14. doi:10.2106/JBJS.22.00596
- Benito DA, Mamidi I, Pasick LJ, et al. Evaluating resident involvement and the ‘July effect’ in parotidectomy. J Laryngol Otol. 2021;135(5):452-457. doi:10.1017/S0022215121000578
- Hwang CS, Wichterman KA, Alfrey EJ. The cost of resident education. J Surg Res. 2010;163(1):18-23. doi:10.1016/j.jss.2010.03.013
- Saliba AN, Taher AT, Tamim H, et al. Impact of resident involvement in surgery (IRIS-NSQIP): looking at the bigger picture based on the American College of Surgeons- NSQIP database. J Am Coll Surg. 2016; 222(1):30-40. doi:10.1016/j.jamcollsurg.2015.10.011
- Khuri SF, Najjar SF, Daley J, et al. Comparison of surgical outcomes between teaching and nonteaching hospitals in the Department of Veterans Affairs. Ann Surg. 2001;234(3):370-383. doi:10.1097/00000658-200109000-00011
- Relles DM, Burkhart RA, Pucci MJ et al. Does resident experience affect outcomes in complex abdominal surgery? Pancreaticoduodenectomy as an example. J Gastrointest Surg. 2014;18(2):279-285. doi:10.1007/s11605-013-2372-5
- Accreditation Council for Graduate Medical Education. Required minimum number of key indicator procedures for graduating residents. June 2019. Accessed January 2, 2025. https://www.acgme.org/globalassets/pfassets/programresources/280_core_case_log_minimums.pdf
- Brady JS, Crippen MM, Filimonov A, et al. The effect of training level on complications after free flap surgery of the head and neck. Am J Otolaryngol. 2017;38(5):560-564. doi:10.1016/j.amjoto.2017.06.001
The US Department of Veterans Affairs (VA) has been integral in resident training. Resident surgical training requires a balance of supervision and autonomy, along with procedure repetition and appropriate feedback.1-3 Non-VA research has found that resident participation across various otolaryngology procedures, including thyroidectomy, neck dissection, and laryngectomy, does not increase patient morbidity.4-7 However, resident involvement in private and academic settings that included nonhead and neck procedures was linked to increased operative time and reduced productivity, as determined by work relative value units (wRVUs).7-13 This has also been identified in other specialties, including general surgery, orthopedics, and ophthalmology.14-16
Unlike the private sector, surgeon compensation at the VA is not as closely linked to operative productivity, offering a unique setting for resident training. While VA integration in otolaryngology residency programs increases resident case numbers, particularly in head and neck cases, the impact on VA patient outcomes and productivity is unknown.17 The use of larynxpreserving treatment modalities for laryngeal cancer has led to a decline in the number of total laryngectomies performed, which could potentially impact resident operative training for laryngectomies.18-20
This study sought to determine the impact of resident participation on operative time, wRVUs, and patient outcomes in veterans who underwent a total laryngectomy. This study was reviewed and approved by the MedStar Georgetown University Hospital Institutional Review Board and Research and Development Committee (#1595672).
Methods
A retrospective cohort of veterans nationwide who underwent total laryngectomy between 2001 and 2021, with or without neck dissection, was identified from the Veterans Affairs Surgical Quality Improvement Program (VASQIP). Data were extracted via the VA Informatics and Computing Infrastructure and patients were included based on Current Procedural Terminology codes for total laryngectomy, with or without neck dissection (31320, 31360, 31365). Laryngopharyngectomies, partial laryngectomies, and minimally invasive laryngectomies were excluded. VASQIP nurse data managers reviewed patient data for operative data, postoperative outcomes (including 30- day morbidity and mortality), and preoperative risk factors (Appendix).21
The VASQIP data provide the highest resident or postgraduate year (PGY) per surgery. PGY 1, 2, and 3 were considered junior residents and PGY ≥4, surgical fellows, and individuals who took research years during residency were considered senior residents. Cases performed by attending physicians alone were compared with those involving junior or senior residents.
Patient demographic data included age, body mass index, smoking and alcohol use, weight loss, and functional status. Consumption of any tobacco products within 12 months of surgery was considered tobacco use. Drinking on average ≥2 alcoholic beverages daily was considered alcohol use. Weight loss was defined as a 10% reduction in body weight within the 6 months before surgery, excluding patients enrolled in a weight loss program. Functional status was categorized as independent, partially dependent, totally dependent, and unknown.
Primary outcomes included operative time, wRVUs generated, and wRVUs generated per hour of operative time. Postoperative complications were recorded both as a continuous variable and as a binary variable for presence or absence of a complication. Additional outcome variables included length of postoperative hospital stay, return to the operating room (OR), and death within 30 days of surgery.
Statistical Analysis
Data were summarized using frequency and percentage for categorical variables and median with IQR for continuous variables. Data were also summarized based on resident involvement in the surgery and the PGY level of the residents involved. The occurrence of total laryngectomy, rate of complications, and patient return to the OR were summarized by year.
Univariate associations between resident involvement and surgical outcomes were analyzed using the Kruskal-Wallis test for continuous variables and the ÷2 test for categorical variables. A Fisher exact test was used when the cell count in the contingency table was < 5. The univariate associations between surgical outcomes and demographic/preoperative variables were examined using 2-sided Wilcoxon ranksum tests or Kruskal-Wallis tests between continuous variables and categorical variables, X2 or Fisher exact test between 2 categorical variables, and 2-sided Spearman correlation test between 2 continuous variables. A false-discovery rate approach was used for simultaneous posthoc tests to determine the adjusted P values for wRVUs generated/operative time for attending physicians alone vs with junior residents and for attending physicians alone vs with senior residents. Models were used to evaluate the effects of resident involvement on surgical outcomes, adjusting for variables that showed significant univariate associations. Linear regression models were used for operative time, wRVUs generated, wRVUs generated/operative time, and length of postoperative stay. A logistic regression model was used for death within 30 days. Models were not built for postoperative complications or patient return to the OR, as these were only statistically significantly associated with the patient’s preoperative functional status. A finding was considered significant if P < .05. All analyses were performed using statistical software RStudio Version 2023.03.0.
Results
Between 2001 and 2021, 1857 patients who underwent total laryngectomy were identified from the VASQIP database nationwide. Most of the total laryngectomies were staffed by an attending physician with a senior resident (n = 1190, 64%), 446 (24%) were conducted by the attending physician alone, and 221 (12%) by an attending physician with a junior resident (Table 1). The mean operating time for an attending physician alone was 378 minutes, 384 minutes for an attending physician with a senior resident, and 432 minutes for an attending physician with a junior resident (Table 2). There was a statistically significant increase in operating time for laryngectomies with resident participation compared to attending physicians operating alone (P < .001).
When the wRVUs generated/operative time was analyzed, there was a statistically significant difference between comparison groups. Total laryngectomies performed by attending physicians alone had the highest wRVUs generated/operative time (5.5), followed by laryngectomies performed by attending physicians with senior residents and laryngectomies performed by attending physicians with junior residents (5.2 and 4.8, respectively; P = .002). Table 3 describes adjusted P values for wRVUs generated/ operative time for total laryngectomies performed by attending physicians alone vs with junior residents (P = .003) and for attending physicians alone vs with senior residents (P = .02). Resident participation in total laryngectomies did not significantly impact the development or number of postoperative complications or the rate of return to the OR.
The number of laryngectomies performed in a single fiscal year peaked in 2010 at 170 cases (Figure 1). Between 2001 and 2021, the mean rates of postoperative complications (21.3%) and patient return to the OR (14.6%) did not significantly change. Resident participation in total laryngectomies also peaked in 2010 at 89.0% but has significantly declined, falling to a low of 43.6% in 2021 (Figure 2). From 2001 to 2011, the mean resident participation rate in total laryngectomies was 80.6%, compared with 68.3% from 2012 to 2021 (P < .001).
The effect of various demographic and preoperative characteristics on surgical outcomes was also analyzed. A linear regression model accounted for each variable significantly associated with operative time. On multivariable analysis, when all other variables were held constant, Table 4 shows the estimated change in operative time based on certain criteria. For instance, the operative time for attendings with junior residents surgeries was 40 minutes longer (95% CI, 16 to 64) than that of attending alone surgeries (P = .001). Furthermore, operative time decreased by 1.1 minutes (95% CI, 0.30 to 2.04) for each 1-year increase in patient age (P = .009).
A multivariable logistic regression model evaluated the effect of resident involvement on 30-day mortality rates. Senior resident involvement (P = .02), partially dependent functional status (P = .01), totally dependent functional status (P < .001), and advanced age (P = .02) all were significantly associated with 30-day mortality (Table 5). When other variables remained constant, the odds of death for totally dependent patients were 10.4 times higher than that of patients with independent functional status. Thus, totally dependent functional status appeared to have a greater impact on this outcome than resident participation. The linear regression model for postoperative length of stay demonstrated that senior resident involvement (P = .04), functional status (partially dependent vs independent P < .001), and age (P = .03) were significantly associated with prolonged length of stay.
Discussion
Otolaryngology residency training is designed to educate future otolaryngologists through hands-on learning, adequate feedback, and supervision.1 Although this exposure is paramount for resident education, balancing appropriate supervision and autonomy while mitigating patient risk has been difficult. Numerous non-VA studies have reviewed the impact of resident participation on patient outcomes in various specialties, ranging from a single institution to the National Surgical Quality Improvement Program (NSQIP).4,5,7,22 This study is the first to describe the nationwide impact of resident participation on outcomes in veterans undergoing total laryngectomy.
This study found that resident participation increases operative time and decreases wRVUs generated/operative time without impacting complication rates or patient return to the OR. This reinforces the notion that under close supervision, resident participation does not negatively impact patient outcomes. Resident operative training requires time and dedication by the attending physician and surgical team, thereby increasing operative time. Because VA physician compensation is not linked with productivity as closely as it is in other private and academic settings, surgeons can dedicate more time to operative teaching. This study found that a total laryngectomy involving a junior resident took about 45 minutes longer than an attending physician working alone.
As expected, with longer operative times, the wRVUs generated/operative time ratio was lower in cases with resident participation. Even though resident participation leads to lower OR efficiency, their participation may not significantly impact ancillary costs.23 However, a recent study from NSQIP found an opportunity cost of $60.44 per hour for surgeons operating with a resident in head and neck cases.13
Postoperative complications and mortality are key measures of surgical outcomes in addition to operative time and efficiency. This study found that neither junior nor senior resident participation significantly increased complication rates or patient return to the OR. Despite declining resident involvement and the number of total laryngectomy surgeries in the VA, the complication rate has remained steady. The 30-day mortality rate was significantly higher in cases involving senior residents compared to cases with attending physicians alone. This could be a result of senior resident participation in more challenging cases, such as laryngectomies performed as salvage surgery following radiation. Residents are more often involved in cases with greater complexity at teaching institutions.24-26 Therefore, the higher mortality seen among laryngectomies with senior resident involvement is likely due to the higher complexity of those cases.
The proportion of resident involvement in laryngectomies at VA medical centers has been decreasing over time. Due to the single payer nature of the VA health care system and the number of complex and comorbid patients, the VA offers an invaluable space for resident education in the OR. The fact that less than half of laryngectomies in 2021 involved resident participation is noteworthy for residency training programs. As wRVU compensation models evolve, VA attending surgeons may face less pressure to move the case along, leading to a high potential for operative teaching. Therefore, complex cases, such as laryngectomies, are often ideal for resident participation in the VA.
The steady decline in total laryngectomies at the VA parallels the recent decrease seen in non-VA settings.20 This is due in part to the use of larynx-preserving treatment modalities for laryngeal cancer as well as decreases in the incidence of laryngeal cancer due to population level changes in smoking behaviors. 18,19 Although a laryngectomy is not a key indicator case as determined by the Accreditation Council for Graduate Medical Education, it is important for otolaryngology residents to be exposed to these cases and have a thorough understanding of the operative technique.27 Total laryngectomy was selected for this study because it is a complex and time-consuming surgery with somewhat standardized surgical steps. Unlike microvascular surgery that is very rarely performed by an attending physician alone, laryngectomies can be performed by attending physicians alone or with a resident.28
Limitations
Since this was a retrospective study, it was susceptible to errors in data entry and data extraction from the VASQIP database. Another limitation is the lack of preoperative treatment data on tumor stage and prior nonoperative treatment. For example, a salvage laryngectomy after treatment with radiation and/or chemoradiation is a higher risk procedure than an upfront laryngectomy. Senior resident involvement may be more common in patients undergoing salvage laryngectomy due to the high risk of postoperative fistula and other complications. This may have contributed to the association identified between senior resident participation and 30-day mortality.
Since we could not account for residents who took research years or were fellows, a senior resident may have been mislabeled as a junior resident or vice versa. However, because most research years occur following the third year of residency. We are confident that PGY-1, PGY-2, and PGY-3 is likely to capture junior residents. Other factors, such as coattending surgeon cases, medical student assistance, and fellow involvement may have also impacted the results of this study.
Conclusions
This study is the first to investigate the impact of resident participation on operative time, wRVUs generated, and complication rates in head and neck surgery at VA medical centers. It found that resident participation in total laryngectomies among veterans increased operative time and reduced wRVUs generated per hour but did not impact complication rate or patient return to the OR. The VA offers a unique and invaluable space for resident education and operative training, and the recent decline in resident participation among laryngectomies is important for residency programs to acknowledge and potentially address moving forward.
In contrast to oral cavity resections which can vary from partial glossectomies to composite resections, laryngectomy represents a homogenous procedure from which to draw meaningful conclusions about complication rates, operative time, and outcome. Future directions should include studying other types of head and neck surgery in the VA to determine whether the impact of resident participation mirrors the findings of this study.
- Chung RS. How much time do surgical residents need to learn operative surgery? Am J Surg. 2005;190(3):351-353. doi:10.1016/j.amjsurg.2005.06.035
- S, Darzi A. Defining quality in surgical training: perceptions of the profession. Am J Surg. 2014;207(4):628-636. doi:10.1016/j.amjsurg.2013.07.044
- Bhatti NI, Ahmed A, Choi SS. Identifying quality indicators of surgical of surgical training: a national survey. Laryngoscope. 2015;125(12):2685-2689. doi:10.1002/lary.25262
- Abt NB, Reh DD, Eisele DW, Francis HW, Gourin CG. Does resident participation influence otolaryngology-head and neck surgery morbidity and mortality? Laryngoscope. 2016;126(10):2263-2269. doi:10.1002/lary.25973
- Jubbal KT, Chang D, Izaddoost SA, Pederson W, Zavlin D, Echo A. Resident involvement in microsurgery: an American College of Surgeons national surgical quality improvement program analysis. J Surg Educ. 2017;74(6):1124-1132. doi:10.1016/j.jsurg.2017.05.017
- Kshirsagar RS, Chandy Z, Mahboubi H, Verma SP. Does resident involvement in thyroid surgery lead to increased postoperative complications? Laryngoscope. 2017;127(5):1242-1246. doi:10.1002/lary.26176
- Vieira BL, Hernandez DJ, Qin C, Smith SS, Kim JY, Dutra JC. The impact of resident involvement on otolaryngology surgical outcomes. Laryngoscope. 2016;126(3):602-607. doi:10.1002/lary.25046
- Advani V, Ahad S, Gonczy C, Markwell S, Hassan I. Does resident involvement effect surgical times and complication rates during laparoscopic appendectomy for uncomplicated appendicitis? An analysis of 16,849 cases from the ACS-NSQIP. Am J Surg. 2012;203(3):347-352. doi:10.1016/j.amjsurg.2011.08.015
- Quinn NA, Alt JA, Ashby S, Orlandi RR. Time, resident involvement, and supply drive cost variability in septoplasty with turbinate reduction. Otolaryngol Head Neck Surg. 2018;159(2):310-314. doi:10.1177/0194599818765099
- Leader BA, Wiebracht ND, Meinzen-Derr J, Ishman SL. The impact of resident involvement on tonsillectomy outcomes and surgical time. Laryngoscope. 2020;130(10):2481-2486. doi:10.1002/lary.28427
- Muelleman T, Shew M, Muelleman RJ, et al. Impact of resident participation on operative time and outcomes in otologic surgery. Otolaryngol Head Neck Surg. 2018;158(1):151-154. doi:10.1177/0194599817737270
- Puram SV, Kozin ED, Sethi R, et al. Impact of resident surgeons on procedure length based on common pediatric otolaryngology cases. Laryngoscope. 2015;125(4):991 -997. doi:10.1002/lary.24912
- Chow MS, Gordon AJ, Talwar A, Lydiatt WM, Yueh B, Givi B. The RVU compensation model and head and neck surgical education. Laryngoscope. 2024;134(1):113-119. doi:10.1002/lary.30807
- Papandria D, Rhee D, Ortega G, et al. Assessing trainee impact on operative time for common general surgical procedures in ACS-NSQIP. J Surg Educ. 2012;69(2):149-155. doi:10.1016/j.jsurg.2011.08.003
- Pugely AJ, Gao Y, Martin CT, Callagh JJ, Weinstein SL, Marsh JL. The effect of resident participation on short-term outcomes after orthopaedic surgery. Clin Orthop Relat Res. 2014;472(7):2290-2300. doi:10.1007/s11999-014-3567-0
- Hosler MR, Scott IU, Kunselman AR, Wolford KR, Oltra EZ, Murray WB. Impact of resident participation in cataract surgery on operative time and cost. Ophthalmology. 2012;119(1):95-98. doi:10.1016/j.ophtha.2011.06.026
- Lanigan A, Spaw M, Donaghe C, Brennan J. The impact of the Veteran’s Affairs medical system on an otolaryngology residency training program. Mil Med. 2018;183(11-12):e671-e675. doi:10.1093/milmed/usy041
- American Society of Clinical Oncology, Pfister DG, Laurie SA, et al. American Society of Clinical Oncology clinical practice guideline for the use of larynx-preservation strategies in the treatment of laryngeal cancer. J Clin Oncol. 2006;24(22):3693-3704. doi:10.1200/JCO.2006.07.4559
- Forastiere AA, Ismaila N, Lewin JS, et al. Use of larynxpreservation strategies in the treatment of laryngeal cancer: American Society of Clinical Oncology clinical practice guideline update. J Clin Oncol. 2018;36(11):1143-1169. doi:10.1200/JCO.2017.75.7385
- Verma SP, Mahboubi H. The changing landscape of total laryngectomy surgery. Otolaryngol Head Neck Surg. 2014;150(3):413-418. doi:10.1177/0194599813514515
- Habermann EB, Harris AHS, Giori NJ. Large surgical databases with direct data abstraction: VASQIP and ACSNSQIP. J Bone Joint Surg Am. 2022;104(suppl 3):9-14. doi:10.2106/JBJS.22.00596
- Benito DA, Mamidi I, Pasick LJ, et al. Evaluating resident involvement and the ‘July effect’ in parotidectomy. J Laryngol Otol. 2021;135(5):452-457. doi:10.1017/S0022215121000578
- Hwang CS, Wichterman KA, Alfrey EJ. The cost of resident education. J Surg Res. 2010;163(1):18-23. doi:10.1016/j.jss.2010.03.013
- Saliba AN, Taher AT, Tamim H, et al. Impact of resident involvement in surgery (IRIS-NSQIP): looking at the bigger picture based on the American College of Surgeons- NSQIP database. J Am Coll Surg. 2016; 222(1):30-40. doi:10.1016/j.jamcollsurg.2015.10.011
- Khuri SF, Najjar SF, Daley J, et al. Comparison of surgical outcomes between teaching and nonteaching hospitals in the Department of Veterans Affairs. Ann Surg. 2001;234(3):370-383. doi:10.1097/00000658-200109000-00011
- Relles DM, Burkhart RA, Pucci MJ et al. Does resident experience affect outcomes in complex abdominal surgery? Pancreaticoduodenectomy as an example. J Gastrointest Surg. 2014;18(2):279-285. doi:10.1007/s11605-013-2372-5
- Accreditation Council for Graduate Medical Education. Required minimum number of key indicator procedures for graduating residents. June 2019. Accessed January 2, 2025. https://www.acgme.org/globalassets/pfassets/programresources/280_core_case_log_minimums.pdf
- Brady JS, Crippen MM, Filimonov A, et al. The effect of training level on complications after free flap surgery of the head and neck. Am J Otolaryngol. 2017;38(5):560-564. doi:10.1016/j.amjoto.2017.06.001
Resident Participation Impact on Operative Time and Outcomes in Veterans Undergoing Total Laryngectomy
Resident Participation Impact on Operative Time and Outcomes in Veterans Undergoing Total Laryngectomy

Apremilast Treatment Outcomes and Adverse Events in Psoriasis Patients With HIV
Apremilast Treatment Outcomes and Adverse Events in Psoriasis Patients With HIV
To the Editor:
Psoriasis is a chronic systemic inflammatory disease that affects 1% to 3% of the global population.1,2 Due to dysregulation of the immune system, patients with HIV who have concurrent moderate to severe psoriasis present a clinical therapeutic challenge for dermatologists. Recent guidelines from the American Academy of Dermatology recommended avoiding certain systemic treatments (eg, methotrexate, cyclosporine) in patients who are HIV positive due to their immunosuppressive effects, as well as cautious use of certain biologics in populations with HIV.3 Traditional therapies for managing psoriasis in patients with HIV have included topical agents, antiretroviral therapy (ART), phototherapy, and acitretin; however, phototherapy can be logistically cumbersome for patients, and in the setting of ART, acitretin has the potential to exacerbate hypertriglyceridemia as well as other undesirable adverse effects.3
Apremilast is a phosphodiesterase 4 inhibitor that has emerged as a promising alternative in patients with HIV who require treatment for psoriasis. It has demonstrated clinical efficacy in psoriasis and has minimal immunosuppressive risk.4 Despite its potential in this population, reports of apremilast used in patients who are HIV positive are rare, and these patients often are excluded from larges studies. In this study, we reviewed the literature to evaluate outcomes and adverse events in patients with HIV who underwent psoriasis treatment with apremilast.
A search of PubMed articles indexed for MEDLINE from the inception of the database through January 2023 was conducted using the terms psoriasis, human immunodeficiency virus, acquired immunodeficiency syndrome, therapy, apremilast, and adverse events. The inclusion criteria were articles that reported patients with HIV and psoriasis undergoing treatment with apremilast with subsequent follow-up to delineate potential outcomes and adverse effects. Non–English language articles were excluded.
Our search of the literature yielded 7 patients with HIV and psoriasis who were treated with apremilast (eTable).5-11 All of the patients were male and ranged in age from 31 to 55 years, and all had pretreatment CD4 cell counts greater than 450 cells/mm3. All but 1 patient were confirmed to have undergone ART prior to treatment with apremilast, and all were treated using the traditional apremilast titration from 10 mg to 30 mg orally twice daily.
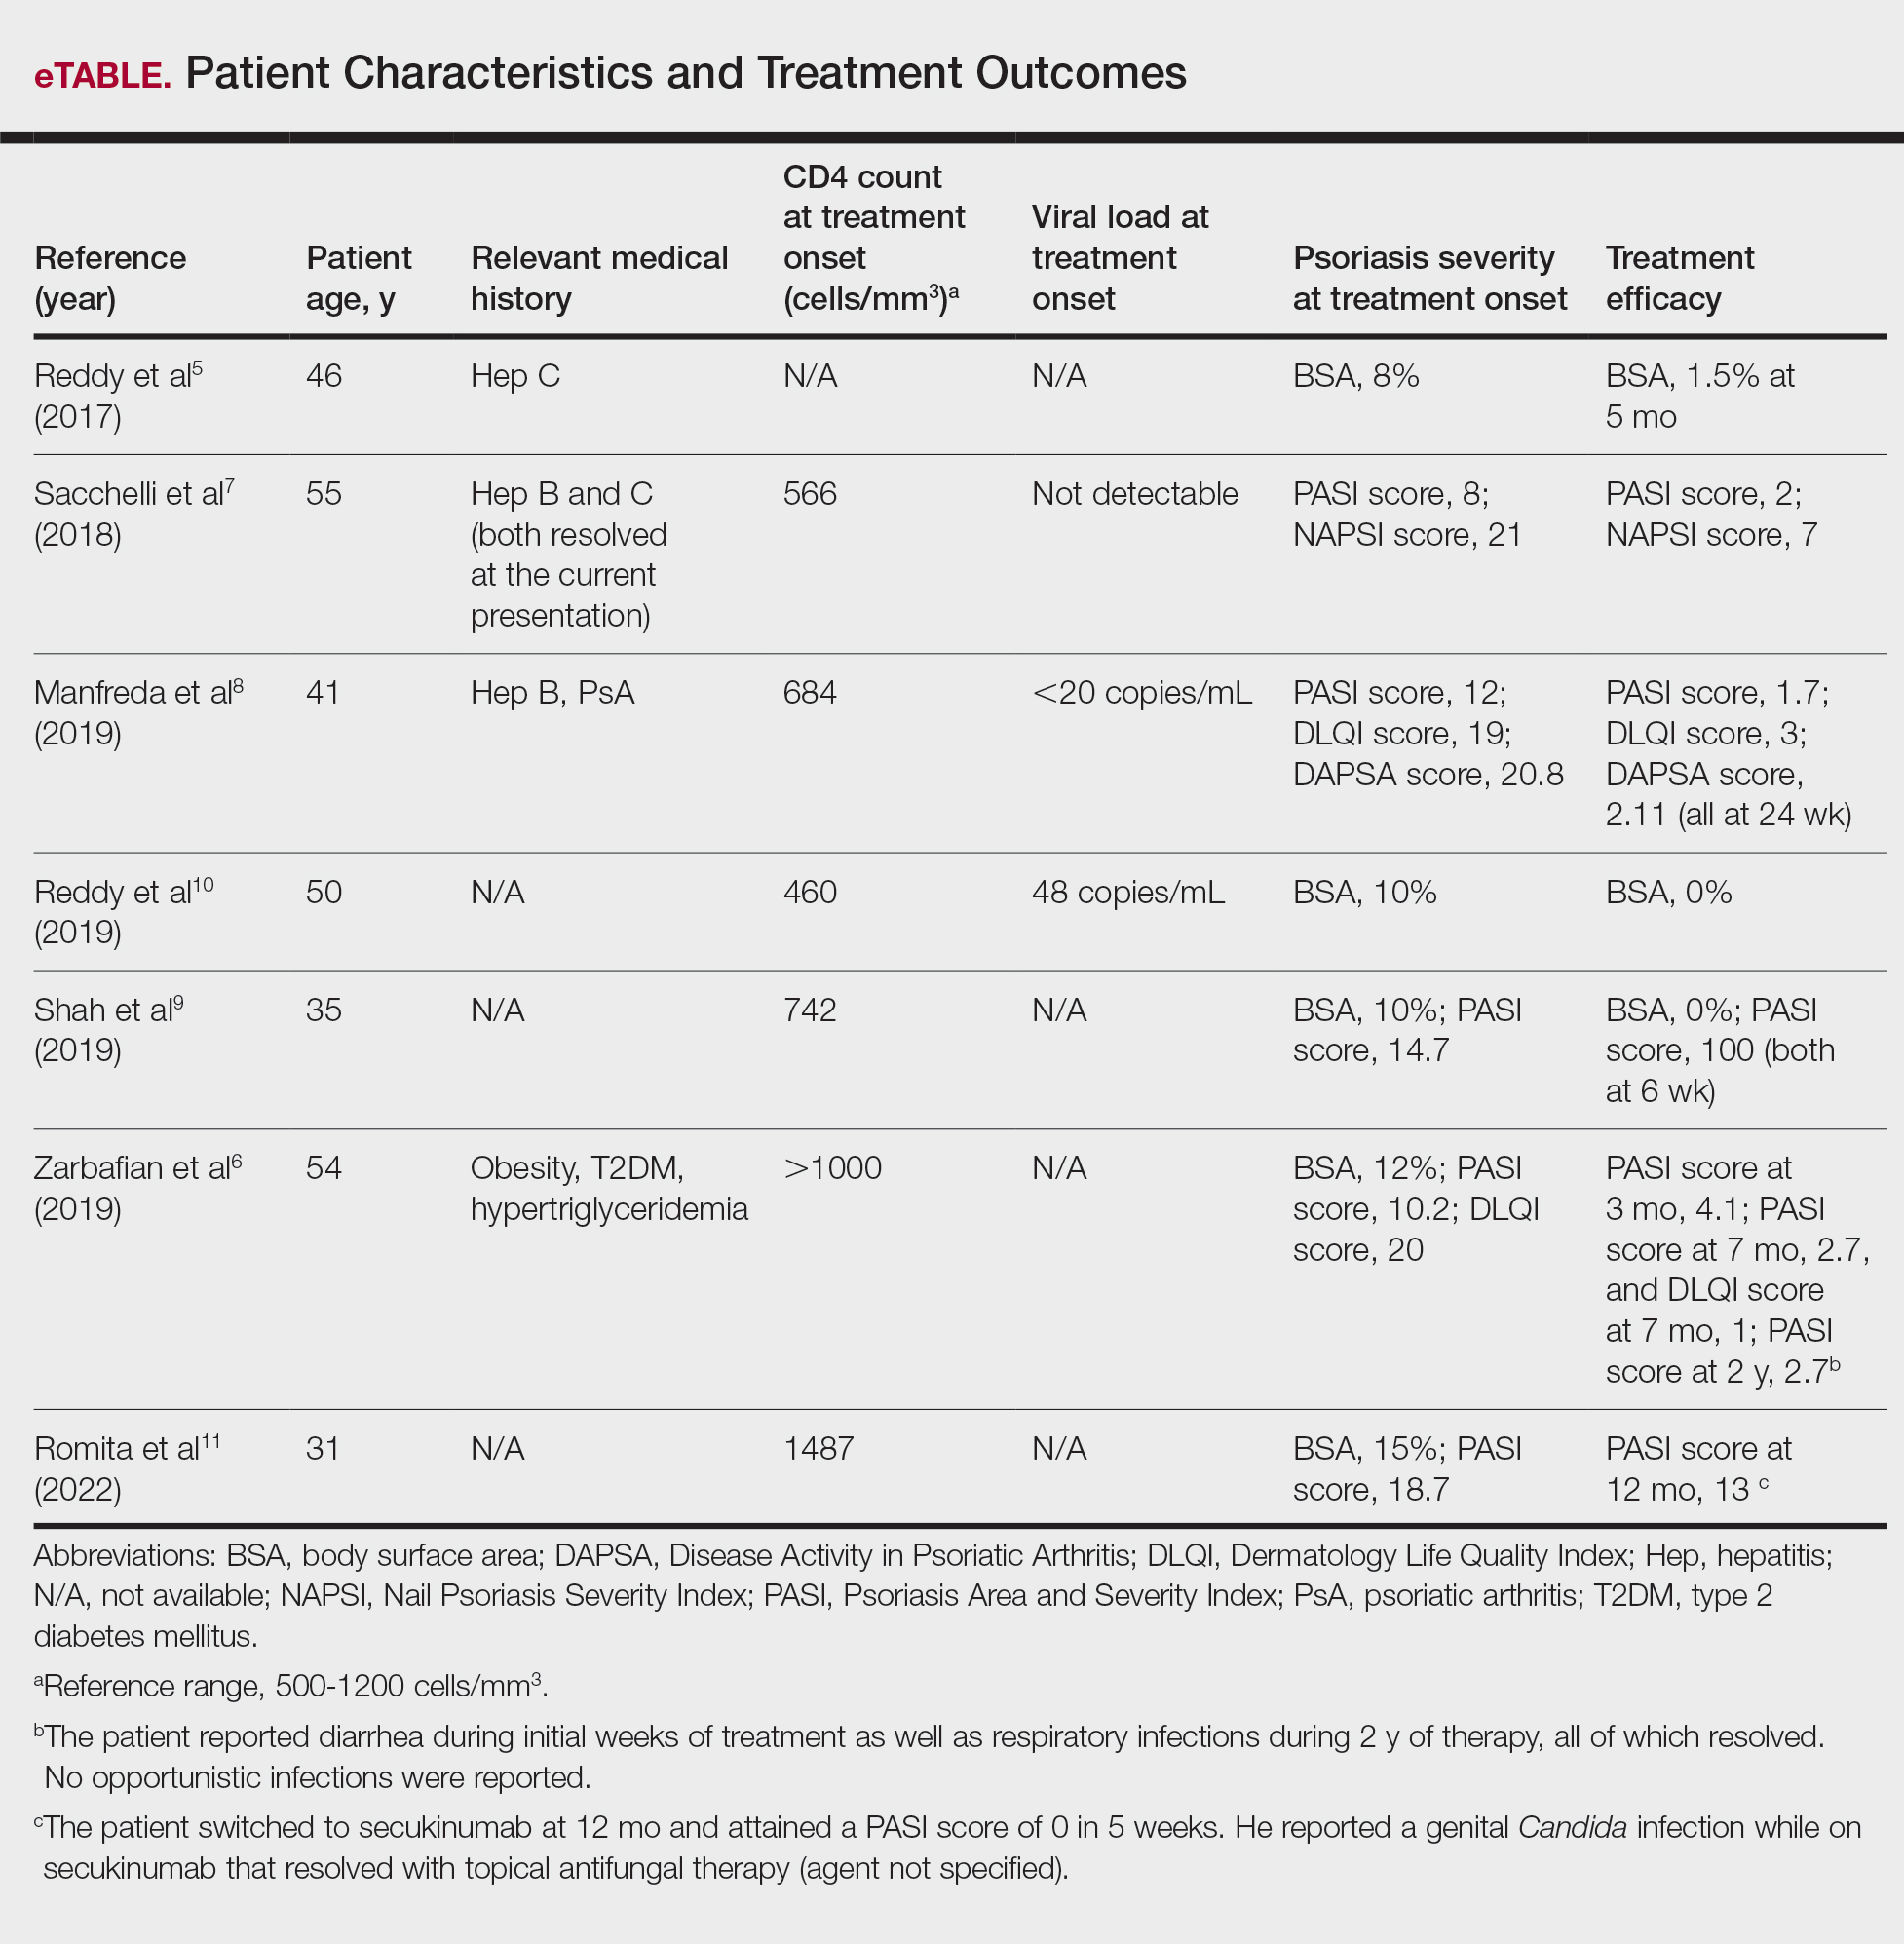
The mean pretreatment Psoriasis Area and Severity Index (PASI) score in the patients we evaluated was 12.2, with an average reduction in PASI score of 9.3. This equated to achievement of PASI 75 or greater (ie, representing at least a 75% improvement in psoriasis) in 4 (57.1%) patients, with clinical improvement confirmed in all 7 patients (100.0%)(eTable). The average follow-up time was 9.7 months (range, 6 weeks to 24 months). Only 1 (14.3%) patient experienced any adverse effects, which included self-resolving diarrhea and respiratory infections (nonopportunistic) over a follow-up period of 2 years.6 Of note, gastrointestinal upset is common with apremilast and usually improves over time.12
Apremilast represents a safe and effective alternative systemic therapy for patients with HIV and psoriasis.4 As a phosphodiesterase 4 inhibitor, apremilast leads to increased levels of cyclic adenosine monophosphate, which restores an equilibrium between proinflammatory (eg, tumor necrosis factors, interferons, IL-2, IL-6, IL-12, IL-23) and anti-inflammatory (eg, IL-10) cytokines.13 Unlike most biologics that target and inhibit a specific proinflammatory cytokine, apremilast’s homeostatic mechanism may explain its minimal immunosuppressive adverse effects.
In the majority of patients we evaluated, initiation of apremilast led to documented clinical improvement. It is worth noting that some patients presented with a relevant medical history and/or comorbidities such as hepatitis and metabolic conditions (eg, obesity, type 2 diabetes mellitus, hypertriglyceridemia). Despite these comorbidities, initiation of apremilast therapy in these patients led to clinical improvement of psoriasis overall. Notable cases from our study included a 41-year-old man with concurrent hepatitis B and psoriatic arthritis who achieved PASI 90 after 24 weeks of apremilast therapy8; a 46-year-old man with concurrent hepatitis C who went from 8% to 1.5% body surface area affected after 5 months of treatment with apremilast5; and a 54-year-old man with concurrent obesity, type 2 diabetes mellitus, and hypertriglyceridemia who went from a PASI score of 10.2 to 4.1 after 3 months of apremilast treatment and maintained a PASI score of 2.7 at 2 years’ follow up (eTable).6
Limitations of this study included the small sample size and homogeneous demographic consisting only of adult males, which restrict the external validity of the findings. Despite limitations, apremilast was utilized effectively for patients with both psoriasis and psoriatic arthritis. The observed effectiveness of apremilast in multiple forms of psoriasis provides valuable insights into the drug’s versatility in this patient population.
The use of apremilast for treatment of psoriasis in patients with HIV represents an important therapeutic development. Its effectiveness in reducing psoriasis symptoms in these immunocompromised patients makes it a viable alternative to traditional systemic therapies that might be contraindicated in this population. While larger studies would be ideal, the exclusion of patients with HIV from clinical trials presents an obstacle and therefore makes case series and reviews helpful for clinicians in bridging the gap with respect to treatment options for these patients. Apremilast may be a safe and effective medication for patients with HIV and psoriasis who require systemic therapy to treat their skin disease.
- Rachakonda TD, Schupp CW, Armstrong AW. Psoriasis prevalence among adults in the United States. J Am Acad Dermatol. 2014;70:512-516. doi:10.1016/j.jaad.2013.11.013
- Parisi R, Symmons DP, Griffiths CE, et al; Identification and Management of Psoriasis and Associated ComorbidiTy (IMPACT) project team. Global epidemiology of psoriasis: a systematic review of incidence and prevalence. J Invest Dermatol. 2013;133:377-385. doi:10.1038/jid.2012.339
- Kaushik SB, Lebwohl MG. Psoriasis: which therapy for which patient: focus on special populations and chronic infections. J Am Acad Dermatol. 2019;80:43-53. doi:10.1016/j.jaad.2018.06.056
- Crowley J, Thaci D, Joly P, et al. Long-term safety and tolerability of apremilast in patients with psoriasis: pooled safety analysis for >156 weeks from 2 phase 3, randomized, controlled trials (ESTEEM 1 and 2). J Am Acad Dermatol. 2017;77:310-317.e1.
- Reddy SP, Shah VV, Wu JJ. Apremilast for a psoriasis patient with HIV and hepatitis C. J Eur Acad Dermatol Venereol. 2017;31:E481-E482. doi:10.1111/jdv.14301
- Zarbafian M, Cote B, Richer V. Treatment of moderate to severe psoriasis with apremilast over 2 years in the context of long-term treated HIV infection: a case report. SAGE Open Med Case Rep. 2019;7:2050313X19845193. doi:10.1177/2050313X19845193 doi:10.1016/j.jaad.2017.01.052
- Sacchelli L, Patrizi A, Ferrara F, et al. Apremilast as therapeutic option in a HIV positive patient with severe psoriasis. Dermatol Ther. 2018;31:E12719. doi:10.1111/dth.12719
- Manfreda V, Esposito M, Campione E, et al. Apremilast efficacy and safety in a psoriatic arthritis patient affected by HIV and HBV virus infections. Postgrad Med. 2019;131:239-240. doi:10.1080/00325481.2019 .1575613
- Shah BJ, Mistry D, Chaudhary N. Apremilast in people living with HIV with psoriasis vulgaris: a case report. Indian J Dermatol. 2019;64:242- 244. doi:10.4103/ijd.IJD_633_18
- Reddy SP, Lee E, Wu JJ. Apremilast and phototherapy for treatment of psoriasis in a patient with human immunodeficiency virus. Cutis. 2019;103:E6-E7.
- Romita P, Foti C, Calianno G, et al. Successful treatment with secukinumab in an HIV-positive psoriatic patient after failure of apremilast. Dermatol Ther. 2022;35:E15610. doi:10.1111/dth.15610
- Zeb L, Mhaskar R, Lewis S, et al. Real-world drug survival and reasons for treatment discontinuation of biologics and apremilast in patients with psoriasis in an academic center. Dermatol Ther. 2021;34:E14826. doi:10.1111/dth.14826
- Schafer P. Apremilast mechanism of action and application to psoriasis and psoriatic arthritis. Biochem Pharmacol. 2012;83:1583-1590. doi:10.1016/j.bcp.2012.01.001
To the Editor:
Psoriasis is a chronic systemic inflammatory disease that affects 1% to 3% of the global population.1,2 Due to dysregulation of the immune system, patients with HIV who have concurrent moderate to severe psoriasis present a clinical therapeutic challenge for dermatologists. Recent guidelines from the American Academy of Dermatology recommended avoiding certain systemic treatments (eg, methotrexate, cyclosporine) in patients who are HIV positive due to their immunosuppressive effects, as well as cautious use of certain biologics in populations with HIV.3 Traditional therapies for managing psoriasis in patients with HIV have included topical agents, antiretroviral therapy (ART), phototherapy, and acitretin; however, phototherapy can be logistically cumbersome for patients, and in the setting of ART, acitretin has the potential to exacerbate hypertriglyceridemia as well as other undesirable adverse effects.3
Apremilast is a phosphodiesterase 4 inhibitor that has emerged as a promising alternative in patients with HIV who require treatment for psoriasis. It has demonstrated clinical efficacy in psoriasis and has minimal immunosuppressive risk.4 Despite its potential in this population, reports of apremilast used in patients who are HIV positive are rare, and these patients often are excluded from larges studies. In this study, we reviewed the literature to evaluate outcomes and adverse events in patients with HIV who underwent psoriasis treatment with apremilast.
A search of PubMed articles indexed for MEDLINE from the inception of the database through January 2023 was conducted using the terms psoriasis, human immunodeficiency virus, acquired immunodeficiency syndrome, therapy, apremilast, and adverse events. The inclusion criteria were articles that reported patients with HIV and psoriasis undergoing treatment with apremilast with subsequent follow-up to delineate potential outcomes and adverse effects. Non–English language articles were excluded.
Our search of the literature yielded 7 patients with HIV and psoriasis who were treated with apremilast (eTable).5-11 All of the patients were male and ranged in age from 31 to 55 years, and all had pretreatment CD4 cell counts greater than 450 cells/mm3. All but 1 patient were confirmed to have undergone ART prior to treatment with apremilast, and all were treated using the traditional apremilast titration from 10 mg to 30 mg orally twice daily.
The mean pretreatment Psoriasis Area and Severity Index (PASI) score in the patients we evaluated was 12.2, with an average reduction in PASI score of 9.3. This equated to achievement of PASI 75 or greater (ie, representing at least a 75% improvement in psoriasis) in 4 (57.1%) patients, with clinical improvement confirmed in all 7 patients (100.0%)(eTable). The average follow-up time was 9.7 months (range, 6 weeks to 24 months). Only 1 (14.3%) patient experienced any adverse effects, which included self-resolving diarrhea and respiratory infections (nonopportunistic) over a follow-up period of 2 years.6 Of note, gastrointestinal upset is common with apremilast and usually improves over time.12
Apremilast represents a safe and effective alternative systemic therapy for patients with HIV and psoriasis.4 As a phosphodiesterase 4 inhibitor, apremilast leads to increased levels of cyclic adenosine monophosphate, which restores an equilibrium between proinflammatory (eg, tumor necrosis factors, interferons, IL-2, IL-6, IL-12, IL-23) and anti-inflammatory (eg, IL-10) cytokines.13 Unlike most biologics that target and inhibit a specific proinflammatory cytokine, apremilast’s homeostatic mechanism may explain its minimal immunosuppressive adverse effects.
In the majority of patients we evaluated, initiation of apremilast led to documented clinical improvement. It is worth noting that some patients presented with a relevant medical history and/or comorbidities such as hepatitis and metabolic conditions (eg, obesity, type 2 diabetes mellitus, hypertriglyceridemia). Despite these comorbidities, initiation of apremilast therapy in these patients led to clinical improvement of psoriasis overall. Notable cases from our study included a 41-year-old man with concurrent hepatitis B and psoriatic arthritis who achieved PASI 90 after 24 weeks of apremilast therapy8; a 46-year-old man with concurrent hepatitis C who went from 8% to 1.5% body surface area affected after 5 months of treatment with apremilast5; and a 54-year-old man with concurrent obesity, type 2 diabetes mellitus, and hypertriglyceridemia who went from a PASI score of 10.2 to 4.1 after 3 months of apremilast treatment and maintained a PASI score of 2.7 at 2 years’ follow up (eTable).6
Limitations of this study included the small sample size and homogeneous demographic consisting only of adult males, which restrict the external validity of the findings. Despite limitations, apremilast was utilized effectively for patients with both psoriasis and psoriatic arthritis. The observed effectiveness of apremilast in multiple forms of psoriasis provides valuable insights into the drug’s versatility in this patient population.
The use of apremilast for treatment of psoriasis in patients with HIV represents an important therapeutic development. Its effectiveness in reducing psoriasis symptoms in these immunocompromised patients makes it a viable alternative to traditional systemic therapies that might be contraindicated in this population. While larger studies would be ideal, the exclusion of patients with HIV from clinical trials presents an obstacle and therefore makes case series and reviews helpful for clinicians in bridging the gap with respect to treatment options for these patients. Apremilast may be a safe and effective medication for patients with HIV and psoriasis who require systemic therapy to treat their skin disease.
- Rachakonda TD, Schupp CW, Armstrong AW. Psoriasis prevalence among adults in the United States. J Am Acad Dermatol. 2014;70:512-516. doi:10.1016/j.jaad.2013.11.013
- Parisi R, Symmons DP, Griffiths CE, et al; Identification and Management of Psoriasis and Associated ComorbidiTy (IMPACT) project team. Global epidemiology of psoriasis: a systematic review of incidence and prevalence. J Invest Dermatol. 2013;133:377-385. doi:10.1038/jid.2012.339
- Kaushik SB, Lebwohl MG. Psoriasis: which therapy for which patient: focus on special populations and chronic infections. J Am Acad Dermatol. 2019;80:43-53. doi:10.1016/j.jaad.2018.06.056
- Crowley J, Thaci D, Joly P, et al. Long-term safety and tolerability of apremilast in patients with psoriasis: pooled safety analysis for >156 weeks from 2 phase 3, randomized, controlled trials (ESTEEM 1 and 2). J Am Acad Dermatol. 2017;77:310-317.e1.
- Reddy SP, Shah VV, Wu JJ. Apremilast for a psoriasis patient with HIV and hepatitis C. J Eur Acad Dermatol Venereol. 2017;31:E481-E482. doi:10.1111/jdv.14301
- Zarbafian M, Cote B, Richer V. Treatment of moderate to severe psoriasis with apremilast over 2 years in the context of long-term treated HIV infection: a case report. SAGE Open Med Case Rep. 2019;7:2050313X19845193. doi:10.1177/2050313X19845193 doi:10.1016/j.jaad.2017.01.052
- Sacchelli L, Patrizi A, Ferrara F, et al. Apremilast as therapeutic option in a HIV positive patient with severe psoriasis. Dermatol Ther. 2018;31:E12719. doi:10.1111/dth.12719
- Manfreda V, Esposito M, Campione E, et al. Apremilast efficacy and safety in a psoriatic arthritis patient affected by HIV and HBV virus infections. Postgrad Med. 2019;131:239-240. doi:10.1080/00325481.2019 .1575613
- Shah BJ, Mistry D, Chaudhary N. Apremilast in people living with HIV with psoriasis vulgaris: a case report. Indian J Dermatol. 2019;64:242- 244. doi:10.4103/ijd.IJD_633_18
- Reddy SP, Lee E, Wu JJ. Apremilast and phototherapy for treatment of psoriasis in a patient with human immunodeficiency virus. Cutis. 2019;103:E6-E7.
- Romita P, Foti C, Calianno G, et al. Successful treatment with secukinumab in an HIV-positive psoriatic patient after failure of apremilast. Dermatol Ther. 2022;35:E15610. doi:10.1111/dth.15610
- Zeb L, Mhaskar R, Lewis S, et al. Real-world drug survival and reasons for treatment discontinuation of biologics and apremilast in patients with psoriasis in an academic center. Dermatol Ther. 2021;34:E14826. doi:10.1111/dth.14826
- Schafer P. Apremilast mechanism of action and application to psoriasis and psoriatic arthritis. Biochem Pharmacol. 2012;83:1583-1590. doi:10.1016/j.bcp.2012.01.001
Apremilast Treatment Outcomes and Adverse Events in Psoriasis Patients With HIV
Apremilast Treatment Outcomes and Adverse Events in Psoriasis Patients With HIV
PRACTICE POINT
- For patients with HIV who require systemic therapy for psoriasis, apremilast may provide an effective and safe therapeutic option, with minimal immunosuppressive adverse effects.
Association Between Psoriasis and Sunburn Prevalence in US Adults
Association Between Psoriasis and Sunburn Prevalence in US Adults
To the Editor:
UV light plays an essential role in various environmental and biological processes.1 Excessive exposure to UV radiation can lead to sunburn, which is marked by skin erythema and pain.2 A study of more than 31,000 individuals found that 34.2% of adults aged 18 years and older reported at least 1 sunburn during the survey year.3 A lack of research regarding the incidence of sunburns in patients with psoriasis is particularly important considering the heightened incidence of skin cancer observed in this population.4 Thus, the aim of our study was to analyze the prevalence of sunburns among US adults with psoriasis utilizing data from the National Health and Nutrition Examination Survey (NHANES) database.5
Our analysis initially included 11,842 participants ranging in age from 20 to 59 years; 35 did not respond to questions assessing psoriasis and sunburn prevalence and thus were excluded. Multivariable logistic regression analyses were performed using Stata/SE 18 (StataCorp LLC) to assess the relationship between psoriasis and sunburns. Our models controlled for patient age, sex, income, race, education, diabetes status, tobacco use, and body mass index. A P value <.05 was considered statistically significant. The study period from January 2009 to December 2014 was chosen based on the availability of the most recent and comprehensive psoriasis data within the NHANES database.
In the NHANES data we evaluated, psoriasis status was assessed by asking, “Have you ever been told by a doctor or other health professional that you had psoriasis?” History of sunburns in the survey year was assessed by the question, “How many times in the past year have you had sunburn?” Patients who reported 1 or more sunburns were included in the sunburn cohort, while those who did not report a sunburn were included in the no sunburn cohort.
In our analysis, the prevalence of at least 1 sunburn in the survey year in patients with psoriasis was 55.4% (weighted), compared to 45.6% (weighted) among those without psoriasis (eTable 1). Although there was no statistically significant relationship between psoriasis and history of sunburn in patients aged 20 to 59 years, a subgroup analysis revealed a significant association between psoriasis and sunburn in adults aged 20 to 39 years after adjusting for potential confounding variables (adjusted OR, 1.57 [95% CI, 1.00-2.45]; P=.049)(eTable 2). Further analysis of subgroups showed no statistically significant results with adjustment of the logistic regression model. Characterizing response rates is important for assessing the validity of survey studies. The NHANES response rate from 2009 to 2014 was 72.9%, enhancing the reliability of our findings.
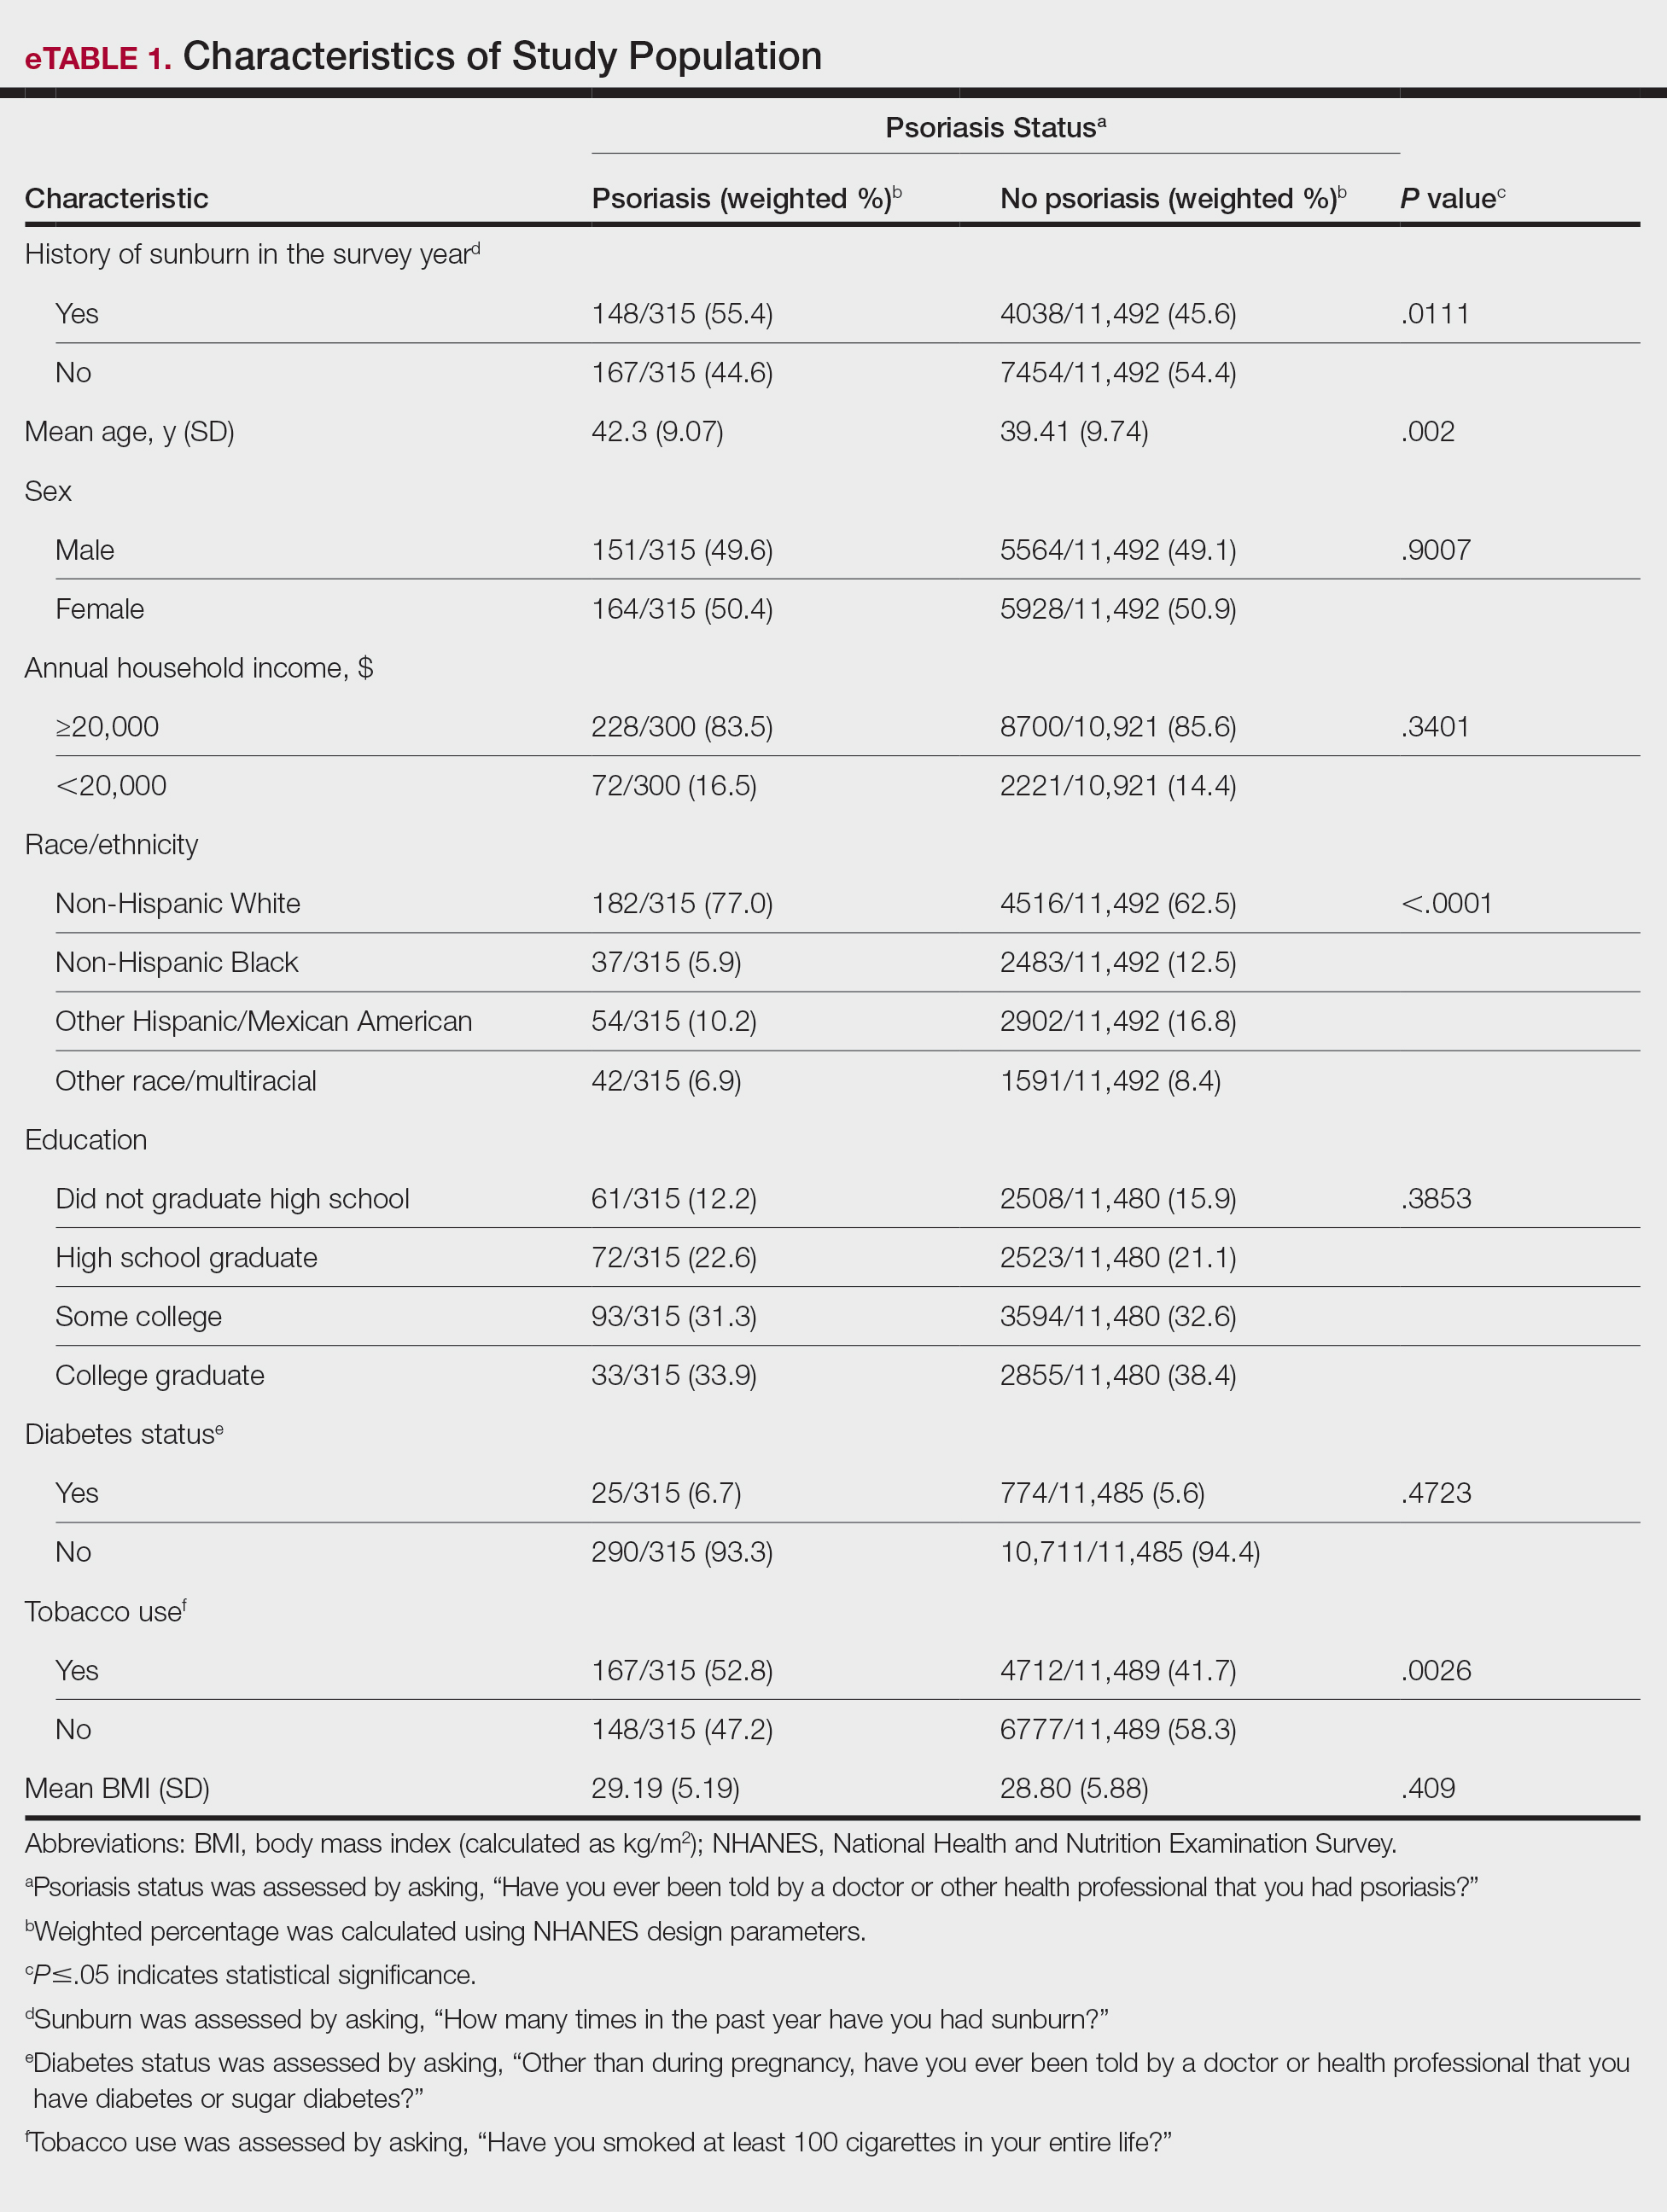
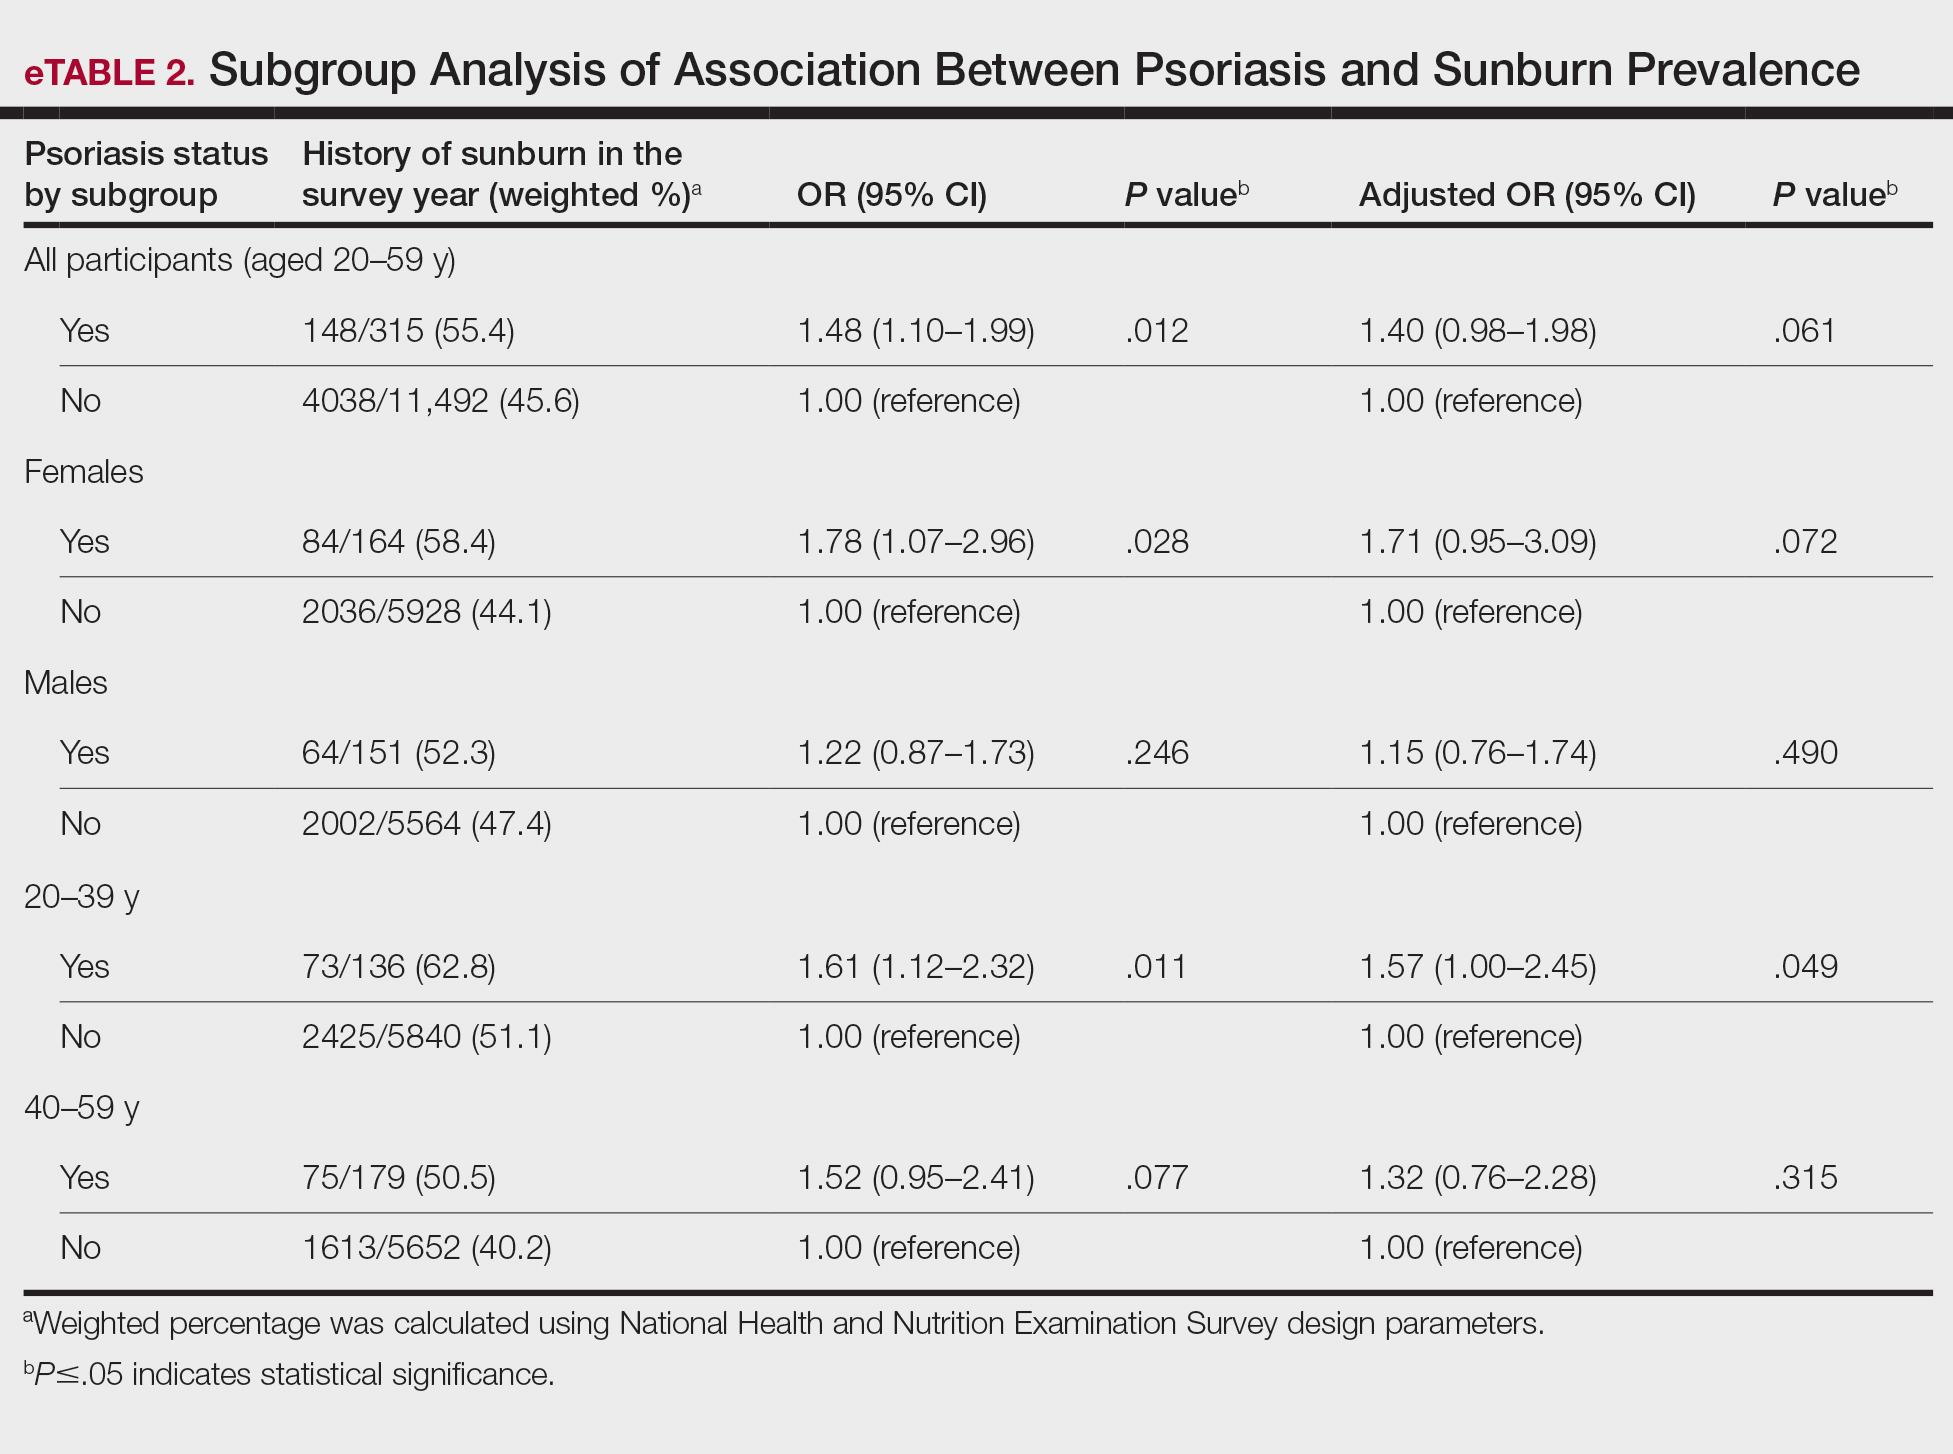
Our study revealed an increased prevalence of sunburn in US adults with psoriasis. A trend of increased sunburn prevalence among younger adults regardless of psoriasis status is corroborated by the literature. Surveys conducted in the United States in 2005, 2010, and 2015 showed that 43% to 50% of adults aged 18 to 39 years and 28% to 42% of those aged 40 to 59 years reported experiencing at least 1 sunburn within the respective survey year.6 Furthermore, in our study, patients with psoriasis reported higher rates of sunburn than their counterparts without psoriasis, both in those aged 20 to 39 years (psoriasis, 62.8% [73/136]; no psoriasis, 51.1% [2425/5840]) and those aged 40 to 59 years (psoriasis, 50.5% [n=75/179]; no psoriasis, 40.2% [1613/5652]), though it was only statistically significant in the 20-to-39 age group. This discrepancy may be attributed to differences in sun-protective behaviors in younger vs older adults. A study from the NHANES database found that, among individuals aged 20 to 39 years, 75.9% [4225/5493] reported staying in the shade, 50.0% [2346/5493] reported using sunscreen, and 31.2% [1874/5493] reported wearing sun-protective clothing.7 Interestingly, the likelihood of engaging in all 3 behaviors was 28% lower in the 20-to-39 age group vs the 40-to-59 age group (adjusted OR, 0.72; 95% CI, 0.62-0.83).7
While our analysis adjusted for age, race/ethnicity, and tobacco use to mitigate potential confounding, we acknowledge the statistically significant differences observed in these variables between study groups as presented in eTable 2. These differences may reflect inherent disparities in the study population. We employed multivariable regression analysis to control for these covariates in our primary analyses. Of note, there was a statistically significant difference associated with race/ethnicity when comparing non-Hispanic White individuals with psoriasis (77.0% [n=182/315]) and those without psoriasis (62.5% [n=4516/11,492])(P<.0001)(eTable 1). The higher proportion of non-Hispanic White patients in the psoriasis group may reflect an increased susceptibility to sunburn given their typically lighter skin pigmentation; however, our analysis controlled for race/ethnicity (eTable 2), thereby allowing us to isolate the effect of psoriasis on sunburn prevalence independent of racial/ethnic differences. There also were statistically significant differences in tobacco use (P=.0026) and age (P=.002) in our unadjusted findings (eTable 1). Again, our analysis controlled for these factors (eTable 2), thereby allowing us to isolate the effect of psoriasis on sunburn prevalence independent of tobacco use and age differences. This approach enhanced the reliability of our findings.
The association between psoriasis and skin cancer has previously been evaluated using the NHANES database—one study found that patients with psoriasis had a significantly higher prevalence of nonmelanoma skin cancer compared with those without psoriasis (3.0% vs 1.3%; relative risk, 2.29; P<.001).8 This difference remained significant after adjusting for confounding variables, as it was found that psoriasis was independently associated with a 1.5-fold increased risk for nonmelanoma skin cancer (adjusted relative risk, 2.06; P=.004).8
The relationship between psoriasis and sunburn may be due to behavioral choices, such as the use of phototherapy for managing psoriasis due to its recognized advantages.9 Patients may seek out both artificial and natural light sources more frequently, potentially increasing the risk for sunburn.10 Psoriasis-related sunburn susceptibility may stem from biological factors, including vitamin D insufficiency, as vitamin D is crucial for keratinocyte differentiation, immune function, and UV protection and repair.11 One study examined the effects of high-dose vitamin D3 on sunburn-induced inflammation.12 Patients who received high-dose vitamin D3 exhibited reduced skin inflammation, enhanced skin barrier repair, and increased anti-inflammatory response compared with those who did not receive the supplement. This improvement was associated with upregulation of arginase 1, an anti-inflammatory enzyme, leading to decreased levels of pro-inflammatory mediators such as tumor necrosis factor α and inducible nitric oxide synthase, thereby promoting tissue repair and reducing prolonged inflammation.12 These findings suggest that vitamin D insufficiency coupled with dysregulated immune responses may contribute to the heightened susceptibility of individuals with psoriasis to sunburn.
The established correlation between sunburn and skin cancer4,8 coupled with our findings of increased prevalence of sunburn in individuals with psoriasis underscores the need for additional research to clarify the underlying biological and behavioral factors that may contribute to a higher prevalence of sunburn in these patients, along with the implications for skin cancer development. Limitations of our study included potential recall bias, as individuals self-reported their clinical conditions and the inability to incorporate psoriasis severity into our analysis, as this was not consistently captured in the NHANES questionnaire during the study period.
- Blaustein AR, Searle C. Ultraviolet radiation. In: Levin SA, ed. Encyclopedia of Biodiversity. 2nd ed. Academic Press; 2013:296-303.
- D’Orazio J, Jarrett S, Amaro-Ortiz A, et al. UV radiation and the skin. Int J Mol Sci. 2013;14:12222-12248
- Holman DM, Ding H, Guy GP Jr, et al. Prevalence of sun protection use and sunburn and association of demographic and behavioral characteristics with sunburn among US adults. JAMA Dermatol. 2018;154:561-568.
- Balda A, Wani I, Roohi TF, et al. Psoriasis and skin cancer—is there a link? Int Immunopharmacol. 2023;121:110464.
- Centers for Disease Control and Prevention. National Health and Nutrition Examination Survey. NHANES questionnaires, datasets, and related documentation. Accessed December 4, 2024. https://wwwn.cdc.gov/nchs/nhanes/Default.aspx
- Holman DM, Ding H, Berkowitz Z, et al. Sunburn prevalence among US adults, National Health Interview Survey 2005, 2010, and 2015. J Am Acad Dermatol. 2019;80:817-820.
- Challapalli SD, Shetty KR, Bui Q, et al. Sun protective behaviors among adolescents and young adults in the United States. J Natl Med Assoc. 2023;115:353-361.
- Herbosa CM, Hodges W, Mann C, et al. Risk of cancer in psoriasis: study of a nationally representative sample of the US population with comparison to a single]institution cohort. J Am Acad Dermatol Venereol. 2020;34:E529-E531.
- Elmets CA, Lim HW, Stoff B, et al. Joint American Academy of Dermatology-National Psoriasis Foundation guidelines of care for the management and treatment of psoriasis with phototherapy. J Am Acad Dermatol. 2019;81:775-804.
- Åkerla P, Pukkala E, Helminen M, et al. Skin cancer risk of narrow-band UV-B (TL-01) phototherapy: a multi-center registry study with 4,815 patients. Acta Derm Venereol. 2024;104:adv39927.
- Filoni A, Vestita M, Congedo M, et al. Association between psoriasis and vitamin D: duration of disease correlates with decreased vitamin D serum levels: an observational case-control study. Medicine (Baltimore). 2018;97:E11185.
- Scott JF, Das LM, Ahsanuddin S, et al. Oral vitamin D rapidly attenuates inflammation from sunburn: an interventional study. J Invest Dermatol. 2017;137:2078-2086.
To the Editor:
UV light plays an essential role in various environmental and biological processes.1 Excessive exposure to UV radiation can lead to sunburn, which is marked by skin erythema and pain.2 A study of more than 31,000 individuals found that 34.2% of adults aged 18 years and older reported at least 1 sunburn during the survey year.3 A lack of research regarding the incidence of sunburns in patients with psoriasis is particularly important considering the heightened incidence of skin cancer observed in this population.4 Thus, the aim of our study was to analyze the prevalence of sunburns among US adults with psoriasis utilizing data from the National Health and Nutrition Examination Survey (NHANES) database.5
Our analysis initially included 11,842 participants ranging in age from 20 to 59 years; 35 did not respond to questions assessing psoriasis and sunburn prevalence and thus were excluded. Multivariable logistic regression analyses were performed using Stata/SE 18 (StataCorp LLC) to assess the relationship between psoriasis and sunburns. Our models controlled for patient age, sex, income, race, education, diabetes status, tobacco use, and body mass index. A P value <.05 was considered statistically significant. The study period from January 2009 to December 2014 was chosen based on the availability of the most recent and comprehensive psoriasis data within the NHANES database.
In the NHANES data we evaluated, psoriasis status was assessed by asking, “Have you ever been told by a doctor or other health professional that you had psoriasis?” History of sunburns in the survey year was assessed by the question, “How many times in the past year have you had sunburn?” Patients who reported 1 or more sunburns were included in the sunburn cohort, while those who did not report a sunburn were included in the no sunburn cohort.
In our analysis, the prevalence of at least 1 sunburn in the survey year in patients with psoriasis was 55.4% (weighted), compared to 45.6% (weighted) among those without psoriasis (eTable 1). Although there was no statistically significant relationship between psoriasis and history of sunburn in patients aged 20 to 59 years, a subgroup analysis revealed a significant association between psoriasis and sunburn in adults aged 20 to 39 years after adjusting for potential confounding variables (adjusted OR, 1.57 [95% CI, 1.00-2.45]; P=.049)(eTable 2). Further analysis of subgroups showed no statistically significant results with adjustment of the logistic regression model. Characterizing response rates is important for assessing the validity of survey studies. The NHANES response rate from 2009 to 2014 was 72.9%, enhancing the reliability of our findings.
Our study revealed an increased prevalence of sunburn in US adults with psoriasis. A trend of increased sunburn prevalence among younger adults regardless of psoriasis status is corroborated by the literature. Surveys conducted in the United States in 2005, 2010, and 2015 showed that 43% to 50% of adults aged 18 to 39 years and 28% to 42% of those aged 40 to 59 years reported experiencing at least 1 sunburn within the respective survey year.6 Furthermore, in our study, patients with psoriasis reported higher rates of sunburn than their counterparts without psoriasis, both in those aged 20 to 39 years (psoriasis, 62.8% [73/136]; no psoriasis, 51.1% [2425/5840]) and those aged 40 to 59 years (psoriasis, 50.5% [n=75/179]; no psoriasis, 40.2% [1613/5652]), though it was only statistically significant in the 20-to-39 age group. This discrepancy may be attributed to differences in sun-protective behaviors in younger vs older adults. A study from the NHANES database found that, among individuals aged 20 to 39 years, 75.9% [4225/5493] reported staying in the shade, 50.0% [2346/5493] reported using sunscreen, and 31.2% [1874/5493] reported wearing sun-protective clothing.7 Interestingly, the likelihood of engaging in all 3 behaviors was 28% lower in the 20-to-39 age group vs the 40-to-59 age group (adjusted OR, 0.72; 95% CI, 0.62-0.83).7
While our analysis adjusted for age, race/ethnicity, and tobacco use to mitigate potential confounding, we acknowledge the statistically significant differences observed in these variables between study groups as presented in eTable 2. These differences may reflect inherent disparities in the study population. We employed multivariable regression analysis to control for these covariates in our primary analyses. Of note, there was a statistically significant difference associated with race/ethnicity when comparing non-Hispanic White individuals with psoriasis (77.0% [n=182/315]) and those without psoriasis (62.5% [n=4516/11,492])(P<.0001)(eTable 1). The higher proportion of non-Hispanic White patients in the psoriasis group may reflect an increased susceptibility to sunburn given their typically lighter skin pigmentation; however, our analysis controlled for race/ethnicity (eTable 2), thereby allowing us to isolate the effect of psoriasis on sunburn prevalence independent of racial/ethnic differences. There also were statistically significant differences in tobacco use (P=.0026) and age (P=.002) in our unadjusted findings (eTable 1). Again, our analysis controlled for these factors (eTable 2), thereby allowing us to isolate the effect of psoriasis on sunburn prevalence independent of tobacco use and age differences. This approach enhanced the reliability of our findings.
The association between psoriasis and skin cancer has previously been evaluated using the NHANES database—one study found that patients with psoriasis had a significantly higher prevalence of nonmelanoma skin cancer compared with those without psoriasis (3.0% vs 1.3%; relative risk, 2.29; P<.001).8 This difference remained significant after adjusting for confounding variables, as it was found that psoriasis was independently associated with a 1.5-fold increased risk for nonmelanoma skin cancer (adjusted relative risk, 2.06; P=.004).8
The relationship between psoriasis and sunburn may be due to behavioral choices, such as the use of phototherapy for managing psoriasis due to its recognized advantages.9 Patients may seek out both artificial and natural light sources more frequently, potentially increasing the risk for sunburn.10 Psoriasis-related sunburn susceptibility may stem from biological factors, including vitamin D insufficiency, as vitamin D is crucial for keratinocyte differentiation, immune function, and UV protection and repair.11 One study examined the effects of high-dose vitamin D3 on sunburn-induced inflammation.12 Patients who received high-dose vitamin D3 exhibited reduced skin inflammation, enhanced skin barrier repair, and increased anti-inflammatory response compared with those who did not receive the supplement. This improvement was associated with upregulation of arginase 1, an anti-inflammatory enzyme, leading to decreased levels of pro-inflammatory mediators such as tumor necrosis factor α and inducible nitric oxide synthase, thereby promoting tissue repair and reducing prolonged inflammation.12 These findings suggest that vitamin D insufficiency coupled with dysregulated immune responses may contribute to the heightened susceptibility of individuals with psoriasis to sunburn.
The established correlation between sunburn and skin cancer4,8 coupled with our findings of increased prevalence of sunburn in individuals with psoriasis underscores the need for additional research to clarify the underlying biological and behavioral factors that may contribute to a higher prevalence of sunburn in these patients, along with the implications for skin cancer development. Limitations of our study included potential recall bias, as individuals self-reported their clinical conditions and the inability to incorporate psoriasis severity into our analysis, as this was not consistently captured in the NHANES questionnaire during the study period.
- Blaustein AR, Searle C. Ultraviolet radiation. In: Levin SA, ed. Encyclopedia of Biodiversity. 2nd ed. Academic Press; 2013:296-303.
- D’Orazio J, Jarrett S, Amaro-Ortiz A, et al. UV radiation and the skin. Int J Mol Sci. 2013;14:12222-12248
- Holman DM, Ding H, Guy GP Jr, et al. Prevalence of sun protection use and sunburn and association of demographic and behavioral characteristics with sunburn among US adults. JAMA Dermatol. 2018;154:561-568.
- Balda A, Wani I, Roohi TF, et al. Psoriasis and skin cancer—is there a link? Int Immunopharmacol. 2023;121:110464.
- Centers for Disease Control and Prevention. National Health and Nutrition Examination Survey. NHANES questionnaires, datasets, and related documentation. Accessed December 4, 2024. https://wwwn.cdc.gov/nchs/nhanes/Default.aspx
- Holman DM, Ding H, Berkowitz Z, et al. Sunburn prevalence among US adults, National Health Interview Survey 2005, 2010, and 2015. J Am Acad Dermatol. 2019;80:817-820.
- Challapalli SD, Shetty KR, Bui Q, et al. Sun protective behaviors among adolescents and young adults in the United States. J Natl Med Assoc. 2023;115:353-361.
- Herbosa CM, Hodges W, Mann C, et al. Risk of cancer in psoriasis: study of a nationally representative sample of the US population with comparison to a single]institution cohort. J Am Acad Dermatol Venereol. 2020;34:E529-E531.
- Elmets CA, Lim HW, Stoff B, et al. Joint American Academy of Dermatology-National Psoriasis Foundation guidelines of care for the management and treatment of psoriasis with phototherapy. J Am Acad Dermatol. 2019;81:775-804.
- Åkerla P, Pukkala E, Helminen M, et al. Skin cancer risk of narrow-band UV-B (TL-01) phototherapy: a multi-center registry study with 4,815 patients. Acta Derm Venereol. 2024;104:adv39927.
- Filoni A, Vestita M, Congedo M, et al. Association between psoriasis and vitamin D: duration of disease correlates with decreased vitamin D serum levels: an observational case-control study. Medicine (Baltimore). 2018;97:E11185.
- Scott JF, Das LM, Ahsanuddin S, et al. Oral vitamin D rapidly attenuates inflammation from sunburn: an interventional study. J Invest Dermatol. 2017;137:2078-2086.
Association Between Psoriasis and Sunburn Prevalence in US Adults
Association Between Psoriasis and Sunburn Prevalence in US Adults
PRACTICE POINTS
- It is important for dermatologists to encourage rigorous sun-safety practices in patients with psoriasis, particularly those aged 20 to 59 years.
- A thorough sunburn history should be taken for skin cancer risk assessment in patients with psoriasis.

Pharmacist-Led Deprescribing of Aspirin for Primary Prevention of Cardiovascular Disease Among Geriatric Veterans
Pharmacist-Led Deprescribing of Aspirin for Primary Prevention of Cardiovascular Disease Among Geriatric Veterans
Low-dose aspirin commonly is used for the prevention of cardiovascular disease (CVD) but is associated with an increased risk of major bleeding.1 The use of aspirin for primary prevention is largely extrapolated from clinical trials showing benefit in the secondary prevention of myocardial infarction and ischemic stroke. However, results from the Aspirin in Reducing Events in the Elderly (ASPREE) trial challenged this practice.2 The ASPREE trial, conducted in the United States and Australia from 2010 to 2014, sought to determine whether daily 100 mg aspirin, was superior to placebo in promoting disability-free survival among older adults. Participants were aged ≥ 70 years (≥ 65 years for Hispanic and Black US participants), living in the community, and were free from preexisting CVD, cerebrovascular disease, or any chronic condition likely to limit survival to < 5 years. The study found no significant difference in the primary endpoints of death, dementia, or persistent physical disability, but there was a significantly higher risk of major hemorrhage in the aspirin group (3.8% vs 2.8%; hazard ratio, 1.38; 95% CI, 1.18-1.62; P < .001).
Several medical societies have updated their guideline recommendations for aspirin for primary prevention of CVD. The 2022 United States Public Service Task Force (USPSTF) provides a grade C recommendation (at least moderate certainty that the net benefit is small) to consider low-dose aspirin for the primary prevention of CVD on an individual patient basis for adults aged 40 to 59 years who have a ≥ 10% 10-year CVD risk. For adults aged ≥ 60 years, the USPSTF recommendation is grade D (moderate or high certainty that the practice has no net benefit or that harms outweigh the benefits) for low-dose aspirin use.1,3 The American College of Cardiology and American Heart Association (ACC/AHA) recommend considering low-dose aspirin for primary prevention of atherosclerotic cardiovascular disease (ASCVD) among select adults aged 40 to 70 years at higher CVD risk but not at increased risk of bleeding.4 The American Diabetes Association (ADA) recommends low-dose aspirin for primary prevention of CVD in patients with diabetes and additional risk factors such as family history of premature ASCVD, hypertension, dyslipidemia, smoking, or chronic kidney disease, and who are not at higher risk of bleeding.5 The ADA standards also caution against the use of aspirin as primary prevention in patients aged > 70 years. Low-dose aspirin use is not recommended for the primary prevention of CVD in older adults or adults of any age who are at increased risk of bleeding.
Recent literature using the US Department of Veterans Affairs (VA) Corporate Data Warehouse database confirms 86,555 of 1.8 million veterans aged > 70 years (5%) were taking low-dose aspirin for primary prevention of ASCVD despite guideline recommendations.6 Higher risk of gastrointestinal and other major bleeding from low-dose aspirin has been reported in the literature.1 Major bleeds represent a significant burden to the health care system with an estimated mean $13,093 cost for gastrointestinal bleed hospitalization.7
Considering the large scale aspirin use without appropriate indication within the veteran population, the risk of adverse effects, and the significant cost to patients and the health care system, it is imperative to determine the best approach to efficiently deprescribe aspirin for primary prevention among geriatric patients. Deprescribing refers to the systematic and supervised process of dose reduction or drug discontinuation with the goal of improving health and/or reducing the risk of adverse effects.8 During patient visits, primary care practitioners (PCPs) have opportunities to discontinue aspirin, but these encounters are time-limited and deprescribing might be secondary to more acute primary care needs. The shortage of PCPs is expected to worsen in coming years, which could further reduce their availability to assess inappropriate aspirin use.9
VA clinical pharmacist practitioners (CPPs) serve as medication experts and work autonomously under a broad scope of practice as part of the patient aligned care team.10-12 CPPs can free up time for PCPs and facilitate deprescribing efforts, especially for older adults. One retrospective cohort study conducted at a VA medical center found that CPPs deprescribed more potentially inappropriate medications among individuals aged ≥ 80 years compared with usual care with PCPs (26.8% vs 16.1%; P < .001).12,13 An aspirin deprescribing protocol conducted in 2022 resulted in nearly half of veterans aged ≥ 70 years contacted by phone agreeing to stop aspirin. Although this study supports the role pharmacists can play in reducing aspirin use in accordance with guidelines, the authors acknowledge that their interventions had a mean time of 12 minutes per patient and would require workflow changes.14 The purpose of this study is to evaluate the efficiency of aspirin deprescribing through 2 approaches: direct deprescribing by pharmacists using populationlevel review compared with clinicians following a pharmacist-led education.
Methods
This was a single-center quality improvement cohort study at the Durham VA Health Care System (DVAHCS) in North Carolina. Patients included were aged ≥ 70 years without known ASCVD who received care at any of 3 DVAHCS community-based outpatient clinics and prescribed aspirin. Patient data was obtained using the VIONE (Deprescribing Dashboard called Vital, Important, Optional, Not indicated, and Every medication has a specific indication or diagnosis) dashboard.15 VIONE was developed to identify potentially inappropriate medications (PIMs) that are eligible to deprescribe based on Beers Criteria, Screening Tool of Older Personsf Prescriptions criteria, and common clinical scenarios when clinicians determine the risk outweighs the benefit to continue a specific medication. 16,17 VIONE is used to reduce polypharmacy and improve patient safety, comfort, and medication adherence. Aspirin for patients aged ≥ 70 years without a history of ASCVD is a PIM identified by VIONE. Patients aged ≥ 70 years were chosen as an inclusion criteria in this study to match the ASPREE trial inclusion criteria and age inclusion criteria in the VIONE dashboard for aspirin deprescribing.2 Patient lists were generated for these potentially inappropriate aspirin prescriptions for 3 months before clinician staff education presentations, the day of the presentations, and 3 months after.
The primary endpoint was the number of veterans with aspirin deprescribed directly by 2 pharmacists over 12 weeks, divided by total patient care time spent, compared with the change in number of veterans with aspirin deprescribed by any DVAHCS physician, nurse practitioner, physician assistant, or CPP over 12 weeks, divided by the total pharmacist time spent on PCP education. Secondary endpoints were the number of aspirin orders discontinued by pharmacists and CPPs, the number of aspirin orders discontinued 12 weeks before pharmacist-led education compared with the number of aspirin orders discontinued 12 weeks after CPP-led education, average and median pharmacist time spent per patient encounter, and time of direct patient encounters vs time spent on PCP education.
Pharmacists reviewed each patient who met the inclusion criteria from the list generated by VIONE on December 1, 2022, for aspirin appropriateness according to the ACC/AHA and USPSTF guidelines, with the goal to discontinue aspirin for primary prevention of ASCVD and no other indications.1,4 Pharmacists documented their visits using VIONE methodology in the Computerized Patient Record System (CPRS) using a polypharmacy review note. CPPs contacted patients who were taking aspirin for primary prevention by unscheduled telephone call to assess for aspirin adherence, undocumented history of ASCVD, cardiovascular risk factors, and history of bleeding. Aspirin was discontinued if patients met guideline criteria recommendations and agreed to discontinuation. Risk-benefit discussions were completed when patients without known ASCVD were considered high risk because the ACC/AHA guidelines mention there is insufficient evidence of safety and efficacy of aspirin for primary prevention for patients with other known ASCVD risk factors (eg, strong family history of premature myocardial infarction, inability to achieve lipid, blood pressure, or glucose targets, or significant elevation in coronary artery calcium score).
High risk was defined as family history of premature ASCVD (in a male first-degree relative aged < 55 years or a female first-degree relative aged < 65 years), most recent blood pressure or 2 blood pressure results in the last 12 months > 160/100 mm Hg, recent hemoglobin A1c > 9%, and/or low-density lipoprotein > 190 mg/dL or not prescribed an indicated statin.3 Aspirin was continued or discontinued according to patient preference after the personalized risk-benefit discussion.
For patients with a clinical indication for aspirin use other than ASCVD (eg, atrial fibrillation not on anticoagulation, venous thromboembolism prophylaxis, carotid artery disease), CPPs documented their assessment and when appropriate deferred to the PCP for consideration of stopping aspirin. For patients with undocumented ASCVD, CPPs added their ASCVD history to their problem list and aspirin was continued. PCPs were notified by alert when aspirin was discontinued and when patients could not be reached by telephone.
presented a review of recent guideline updates and supporting literature at 2 online staff meetings. The education sessions lasted about 10 minutes and were presented to PCPs across 3 community-based outpatient clinics. An estimated 40 minutes were spent creating the PowerPoint education materials, seeking feedback, making edits, and answering questions or emails from PCPs after the presentation. During the presentation, pharmacists encouraged PCPs to discontinue aspirin (active VA prescriptions and reported over-the-counter use) for primary prevention of ASCVD in patients aged ≥ 70 years during their upcoming appointments and consider risk factors recommended by the ACC/AHA guidelines when applicable. PCPs were notified that CPPs planned to start a population review for discontinuing active VA aspirin prescriptions on December 1, 2022. The primary endpoint and secondary endpoints were analyzed using descriptive statistics. All data were analyzed using Microsoft Excel.
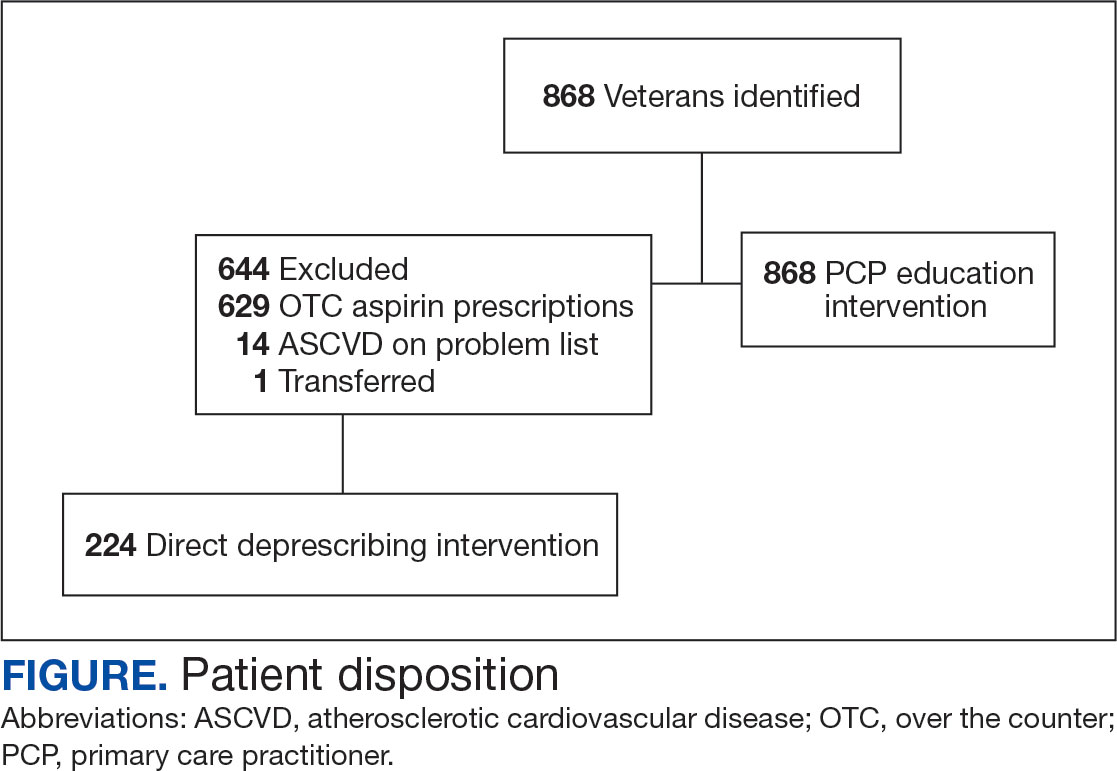
Results
A total of 868 patients aged ≥ 70 years with active prescriptions for aspirin were identified on December 1, 2022. After applying inclusion and exclusion criteria for the pharmacist population review, 224 patients were included for cohort final analysis (Figure). All 868 patients were eligible for the CPP intervention. Primary reasons for exclusion from the CPP population included over-thecounter aspirin and a history of ASCVD in the patient’s problem list. All patients were male, with a mean (SD) age of 75 (4.4) years (Table 1). Most patients were prescribed aspirin, 81 mg daily (n = 220; 98%).
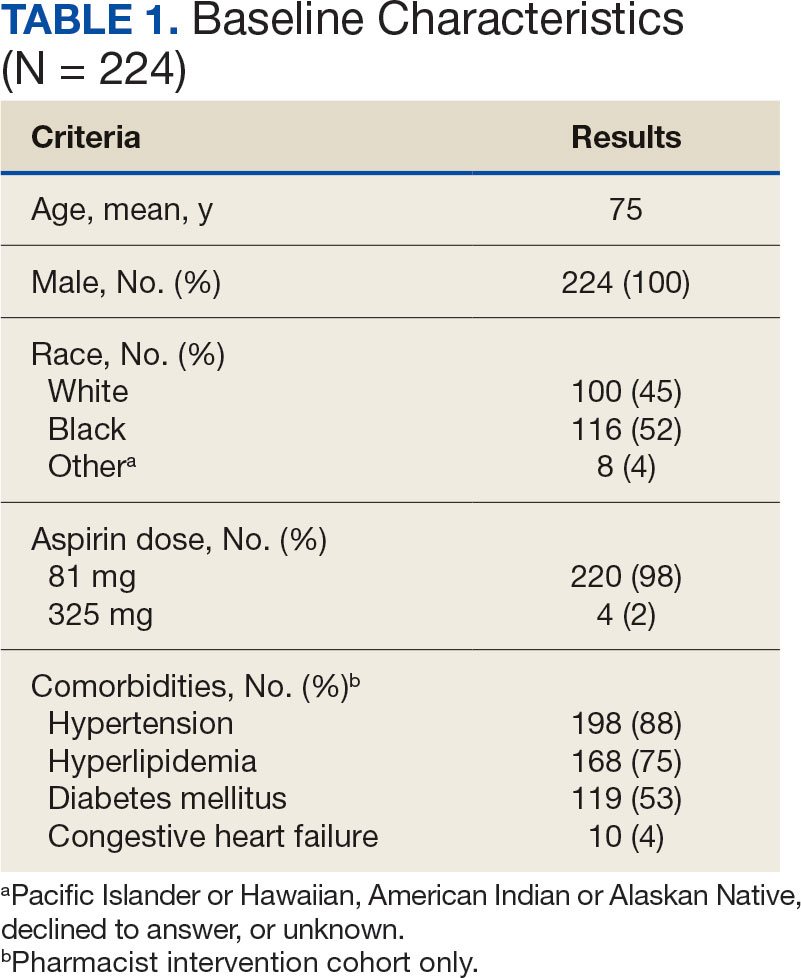
The direct CPP deprescribing intervention resulted in 2 aspirin prescriptions discontinued per hour of pharmacist time and 67 aspirin prescriptions discontinued per hour of pharmacist time via the PCP education intervention. CPPs discontinued 66 aspirin orders in the 12 weeks before the PCP education sessions. A total of 230 aspirin prescriptions were discontinued in the 12 weeks following the PCP education sessions, with 97 discontinued directly by CPPs and 133 discontinued by PCPs. The PCP education session yielded an additional 67 discontinued aspirin orders compared with the 12 weeks before the education sessions (Table 2).
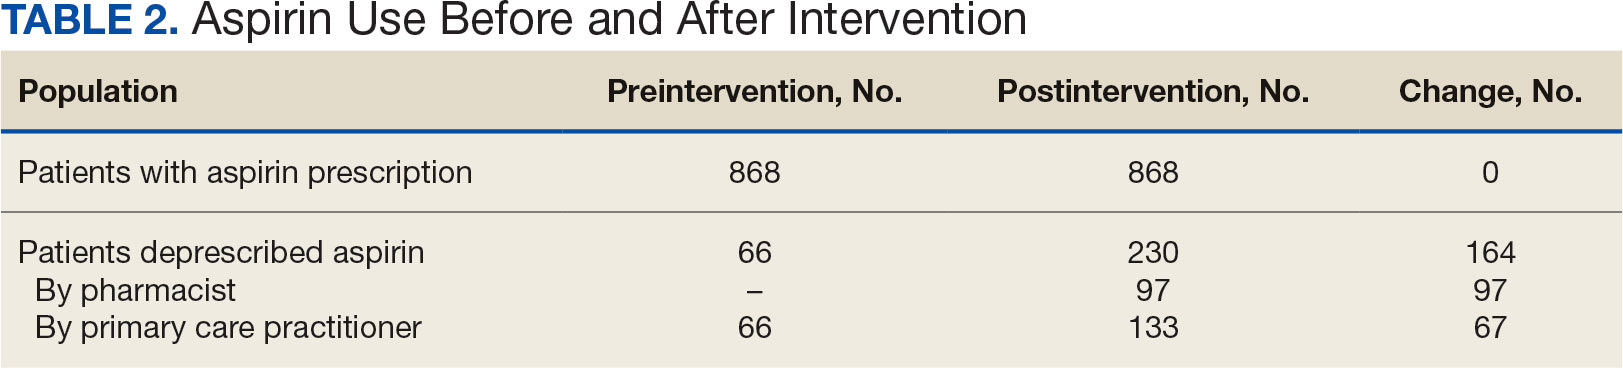
The CPP direct deprescribing intervention took about 48.3 hours, accounting for health record review and time interacting with patients. The PCP education intervention took about 60 minutes, which included time for preparing and delivering education materials (Table 3). CPP deprescribing encounter types, interventions, and related subcategories, and other identified indications to continue aspirin are listed in Table 4.
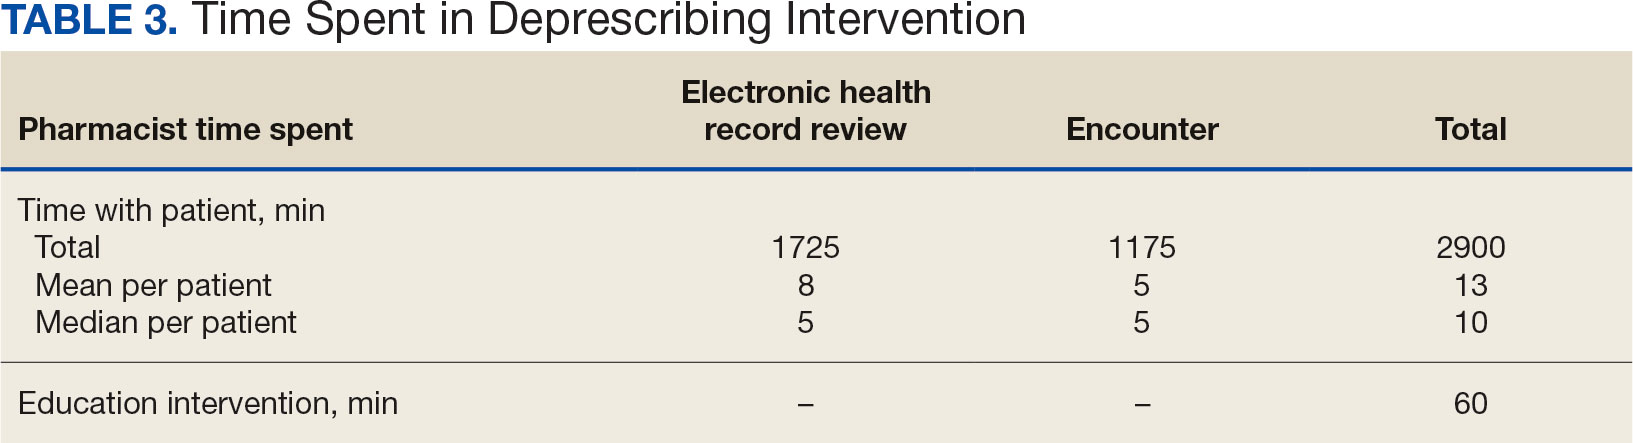
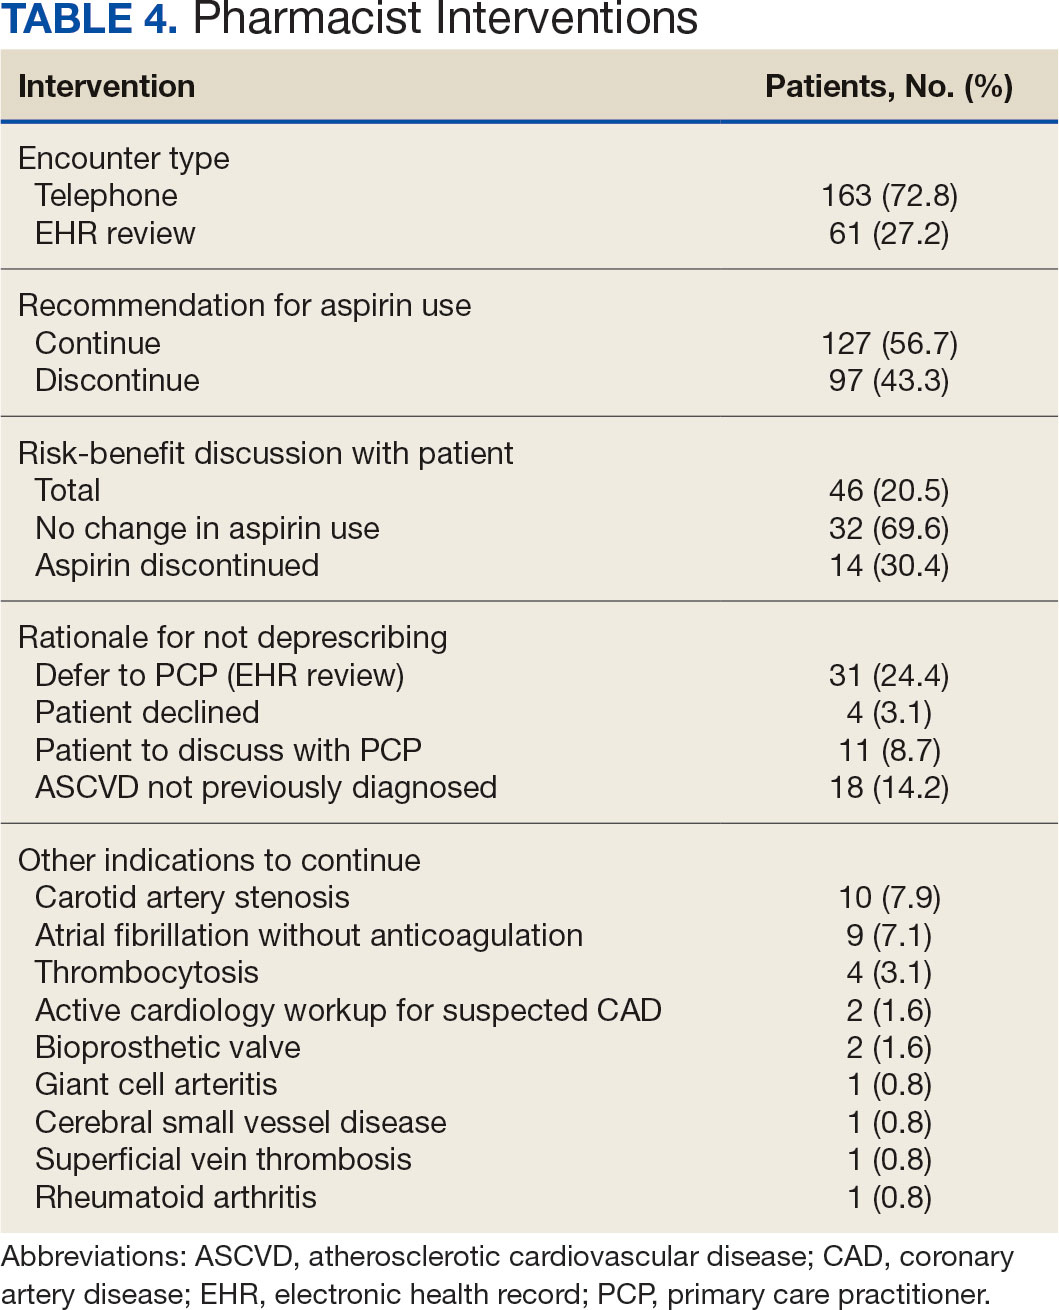
Discussion
Compared with direct deprescribing by pharmacists, the PCP education intervention was more efficient based on number of aspirin orders discontinued by pharmacist time. PCPs discontinued twice as many aspirin prescriptions in the 12 weeks after pharmacist-led education compared with the 12 weeks before.
Patients were primarily contacted by telephone (73%) for deprescribing. Among the 163 patients reached by phone and encouraged to discontinue aspirin, 97 patients (60%) accepted the recommendation, which was similar to the acceptance rates found in the literature (48% to 55%).14,18 Although many veterans continued taking aspirin (78%), most had indications for its continued use, such as a history of ASCVD, atrial fibrillation without anticoagulation, and carotid artery stenosis, and complex comorbidities that required further discussion with their PCP. Less common uses for aspirin were identified through CPRS review or patient reports included cerebral small vessel disease without history of ASCVD, subclavian artery stenosis, thrombocytosis, bioprosthetic valve replacement, giant cell arteritis, rheumatoid arthritis, and prevention of second eye involvement of ischemic optic neuropathy.
to describe the benefit of clinical pharmacy services for deprescribing aspirin for primary prevention of ASCVD through PCP education. Previously published literature has assessed alternative ways to identify or discontinue PIMs—including aspirin—among geriatric patients. One study evaluated the use of marking inappropriate aspirin prescriptions in the electronic health database, leading to a significant reduction in incidence of inappropriate aspirin prescribing; however, it did not assess changes in discontinuation rates of existing aspirin prescriptions.19 The previous VA pharmacist aspirin deprescribing protocol demonstrated pharmacists’ aptitude at discontinuing aspirin for primary prevention but only used direct patient contact and did not compare efficiency with other methods, including PCP education.14
This quality improvement project contributes new data to the existing literature to support the use of clinical pharmacists to discontinue aspirin for primary prevention and suggests a strong role for pharmacists as educators on clinical guidelines, in addition to their roles directly deprescribing PIMs in clinical practice. This study is further strengthened by its use of VIONE, which previously has demonstrated effectiveness in deprescribing a variety of PIMs in primary care settings.20
Despite using VIONE for generating a list of patients eligible for deprescription, our CPRS review found that this list was frequently inaccurate. For example, a small portion of patients were on the VIONE generated list indicating they had no ASCVD history, but had transient ischemic attack listed in their problem lists. Patient problem lists often were missing documented ASCVD history that was revealed by patient interview or CPRS review. It is possible that patients interviewed might have omitted relevant ASCVD history because of low health literacy, conditions affecting memory, or use of health care services outside the VA system.
There were several instances of aspirin used for other non-ASCVD indications, such as primary stroke prevention in atrial fibrillation. The ACC/AHA atrial fibrillation guidelines previously provided a Class IIb recommendation (benefit is greater than risk but additional studies are needed) for considering no antithrombic therapy or treatment with oral anticoagulant or aspirin for nonvalvular atrial fibrillation with CHA2DS2-VASc (Congestive heart failure, Hypertension, Age [> 65 y, 1 point; > 75 y, 2 points], Diabetes, previous Stroke/transient ischemic attack [2 points]) score of 1.21 The ACC/ AHA guidelines were updated in 2023 to recommend against antiplatelet therapy as an alternative to anticoagulation for reducing cardioembolic stroke risk among patients with atrial fibrillation with no indication for antiplatelet therapy because of risk of harm.22 If a patient has no risk factors for stroke, aspirin is not recommended to prevent thromboembolic events because of a lack of benefit. Interventions from this quality improvement study were completed before the 2023 atrial fibrillation guideline was published and therefore in this study aspirin was not discontinued when used for atrial fibrillation. Aspirin use for atrial fibrillation might benefit from similar discontinuation efforts analyzed within this study. Beyond atrial fibrillation, major guidelines do not comment on the use of aspirin for any other indications in the absence of clinical ASCVD.
Limitations
This study is limited by the lack of clinical consensus for complex patients and demonstrates the importance of individualized patient assessment when considering discontinuing aspirin. Because of the project’s relatively short intervention period, aspirin deprescribing rates could decrease over time and repeated education efforts might be necessary to see lasting impact. Health care professionals from services outside of primary care also might have discontinued aspirin during the study period unrelated to the education and these discontinued aspirin prescriptions could contribute to the higher rate observed among PCPs. This study included a specific population cohort of male, US veterans and might not reflect other populations where these interventions could be implemented.
The measurement of time spent by pharmacists and PCPs is an additional limitation. Although it is expected that PCPs attempt to discontinue aspirin during their existing patient care appointments, the time spent during visits was not measured or documented. Direct deprescribing by pharmacist CPRS review required a significant amount of time and could be a barrier to successful intervention by CPPs in patient aligned care teams.
To reduce the time pharmacists spent completing CPRS reviews, an aspirin deprescribing clinical reminder tool could be used to assess use and appropriate indication quickly during any primary care visit led by a PCP or CPP. In addition, it is recommended that pharmacists regularly educate health care professionals on guideline recommendations for aspirin use among geriatric patients. Future studies of the incidence of major cardiovascular events after aspirin deprescribing among geriatric patients and a longitudinal cost/benefit analysis could support these initiatives.
Conclusions
In this study, pharmacists successfully deprescribed inappropriate medications, such as aspirin. However, pharmacist-led PCP education is more efficient compared with direct deprescribing using a population-level review. PCP education requires less time and could allow ambulatory care pharmacists to spend more time on other direct patient care interventions to improve quality and access to care in primary care clinics. This study’s results further support the role of pharmacists in deprescribing PIMs for older adults and the use of a deprescribing tool, such as VIONE, in a primary care setting.
- US Preventive Services Task Force; Davidson KW, Barry MJ, et al. Aspirin use to prevent cardiovascular disease: US Preventive Services Task Force recommendation statement. JAMA. 2022;327(16):1577-1584. doi:10.1001/jama.2022.4983
- McNeil JJ, Nelson MR, Woods RL, et al. Effect of aspirin on all-cause mortality in the healthy elderly. N Engl J Med. 2018;379(16):1519-1528. doi:10.1056/NEJMoa1803955
- Barry MJ, Wolff TA, Pbert L, et al. Putting evidence into practice: an update on the US Preventive Services Task Force methods for developing recommendations for preventive services. Ann Fam Med. 2023;21(2):165-171. doi:10.1370/afm.2946
- Arnett DK, Blumenthal RS, Albert MA, et al. 2019 ACC/ AHA Guideline on the Primary Prevention of Cardiovascular Disease: A report of the American College of Cardiology/ American Heart Association Task Force on Clinical Practice Guidelines. Circulation. 2019;140(11):e596-e646. doi:10.1161/CIR.0000000000000678
- American Diabetes Association Professional Practice Committee. 10. Cardiovascular disease and risk management: Standards of care in diabetes-2024. Diabetes Care. 2024;47(Suppl 1):S179-S218. doi:10.2337/dc24-S010
- Ong SY, Chui P, Bhargava A, Justice A, Hauser RG. Estimating aspirin overuse for primary prevention of atherosclerotic cardiovascular disease (from a nationwide healthcare system). Am J Cardiol. 2020;137:25-30. doi:10.1016/j.amjcard.2020.09.042
- Weiss AJ, Jiang HJ. Overview of clinical conditions with frequent and costly hospital readmissions by payer, 2018. In: Healthcare Cost and Utilization Project (HCUP) Statistical Briefs. Agency for Healthcare Research and Quality (US); July 20, 2021.
- Krishnaswami A, Steinman MA, Goyal P, et al. Deprescribing in older adults with cardiovascular disease. J Am Coll Cardiol. 2019;73(20):2584-2595. doi:10.1016/j.jacc.2019.03.467
- Association of American Medical Colleges. The complexities of physician supply and demand: projections from 2019 to 2034. Accessed March 17, 2024. https://www.aamc.org/media/54681/download
- US Department of Veterans Affairs, Veterans Health Administration. VHA Directive 1108.07(1): General pharmacy service requirements. November 28, 2022. Accessed March 17, 2024. https://www.va.gov/vhapublications/ViewPublication.asp?pub_ID=10045
- US Department of Veterans Affairs, Veterans Health Administration. VHA Handbook 1108.11(3): Clinical pharmacy services. July 1, 2015. Accessed March 17, 2024. https://www.va.gov/vhapublications/ViewPublication.asp?pub_ID=3120
- US Department of Veterans Affairs. Clinical pharmacist practitioner (CPP) to improve access to and quality of care August 2021. August 2021. Accessed May 19, 2023. https://www.pbm.va.gov/PBM/CPPO/Documents/ExternalFactSheet_OptimizingtheCPPToImproveAccess_508.pdf
- Ammerman CA, Simpkins BA, Warman N, Downs TN. Potentially inappropriate medications in older adults: Deprescribing with a clinical pharmacist. J Am Geriatr Soc. 2019;67(1):115-118. doi:10.1111/jgs.15623
- Rothbauer K, Siodlak M, Dreischmeier E, Ranola TS, Welch L. Evaluation of a pharmacist-driven ambulatory aspirin deprescribing protocol. Fed Pract. 2022;39(suppl 5):S37- S41a. doi:10.12788/fp.0294
- US Department of Veterans Affairs. VIONE changes the way VA handles prescriptions. January 25, 2020. Accessed May 21, 2023. https://news.va.gov/70709/vione-changes-way-va-handles-prescriptions/
- 2023 American Geriatrics Society Beers Criteria Update Expert Panel. American Geriatrics Society 2023 updated AGS Beers Criteria for potentially inappropriate medication use in older adults. J Am Geriatr Soc. 2023;71(7):2052- 2081. doi:10.1111/jgs.18372
- O’Mahony D, Cherubini A, Guiteras AR, et al. STOPP/ START criteria for potentially inappropriate prescribing in older people: version 3. Eur Geriatr Med. 2023;14(4):625- 632. doi:10.1007/s41999-023-00777-y
- Draeger C, Lodhi F, Geissinger N, Larson T, Griesbach S. Interdisciplinary deprescribing of aspirin through prescriber education and provision of patient-specific recommendations. WMJ. 2022;121(3):220-225
- de Lusignan S, Hinton W, Seidu S, et al. Dashboards to reduce inappropriate prescribing of metformin and aspirin: A quality assurance programme in a primary care sentinel network. Prim Care Diabetes. 2021;15(6):1075-1079. doi:10.1016/j.pcd.2021.06.003
- Nelson MW, Downs TN, Puglisi GM, Simpkins BA, Collier AS. Use of a deprescribing tool in an interdisciplinary primary-care patient-aligned care team. Sr Care Pharm. 2022;37(1):34-43. doi:10.4140/TCP.n.2022.34
- January CT, Wann LS, Alpert JS, et al. 2014 AHA/ ACC/HRS guideline for the management of patients with atrial fibrillation: a report of the American College of Cardiology/American Heart Association Task Force on practice guidelines and the Heart Rhythm Society. Circulation. 2014;130(23):e199-e267. doi:10.1161/CIR.0000000000000041
- Joglar JA, Chung MK, Armbruster AL, et al. 2023 ACC/ AHA/ACCP/HRS Guideline for the Diagnosis and Management of Atrial Fibrillation: A Report of the American College of Cardiology/American Heart Association Joint Committee on Clinical Practice Guidelines Circulation. 2024;149(1):e1- e156. doi:10.1161/CIR.0000000000001193
Low-dose aspirin commonly is used for the prevention of cardiovascular disease (CVD) but is associated with an increased risk of major bleeding.1 The use of aspirin for primary prevention is largely extrapolated from clinical trials showing benefit in the secondary prevention of myocardial infarction and ischemic stroke. However, results from the Aspirin in Reducing Events in the Elderly (ASPREE) trial challenged this practice.2 The ASPREE trial, conducted in the United States and Australia from 2010 to 2014, sought to determine whether daily 100 mg aspirin, was superior to placebo in promoting disability-free survival among older adults. Participants were aged ≥ 70 years (≥ 65 years for Hispanic and Black US participants), living in the community, and were free from preexisting CVD, cerebrovascular disease, or any chronic condition likely to limit survival to < 5 years. The study found no significant difference in the primary endpoints of death, dementia, or persistent physical disability, but there was a significantly higher risk of major hemorrhage in the aspirin group (3.8% vs 2.8%; hazard ratio, 1.38; 95% CI, 1.18-1.62; P < .001).
Several medical societies have updated their guideline recommendations for aspirin for primary prevention of CVD. The 2022 United States Public Service Task Force (USPSTF) provides a grade C recommendation (at least moderate certainty that the net benefit is small) to consider low-dose aspirin for the primary prevention of CVD on an individual patient basis for adults aged 40 to 59 years who have a ≥ 10% 10-year CVD risk. For adults aged ≥ 60 years, the USPSTF recommendation is grade D (moderate or high certainty that the practice has no net benefit or that harms outweigh the benefits) for low-dose aspirin use.1,3 The American College of Cardiology and American Heart Association (ACC/AHA) recommend considering low-dose aspirin for primary prevention of atherosclerotic cardiovascular disease (ASCVD) among select adults aged 40 to 70 years at higher CVD risk but not at increased risk of bleeding.4 The American Diabetes Association (ADA) recommends low-dose aspirin for primary prevention of CVD in patients with diabetes and additional risk factors such as family history of premature ASCVD, hypertension, dyslipidemia, smoking, or chronic kidney disease, and who are not at higher risk of bleeding.5 The ADA standards also caution against the use of aspirin as primary prevention in patients aged > 70 years. Low-dose aspirin use is not recommended for the primary prevention of CVD in older adults or adults of any age who are at increased risk of bleeding.
Recent literature using the US Department of Veterans Affairs (VA) Corporate Data Warehouse database confirms 86,555 of 1.8 million veterans aged > 70 years (5%) were taking low-dose aspirin for primary prevention of ASCVD despite guideline recommendations.6 Higher risk of gastrointestinal and other major bleeding from low-dose aspirin has been reported in the literature.1 Major bleeds represent a significant burden to the health care system with an estimated mean $13,093 cost for gastrointestinal bleed hospitalization.7
Considering the large scale aspirin use without appropriate indication within the veteran population, the risk of adverse effects, and the significant cost to patients and the health care system, it is imperative to determine the best approach to efficiently deprescribe aspirin for primary prevention among geriatric patients. Deprescribing refers to the systematic and supervised process of dose reduction or drug discontinuation with the goal of improving health and/or reducing the risk of adverse effects.8 During patient visits, primary care practitioners (PCPs) have opportunities to discontinue aspirin, but these encounters are time-limited and deprescribing might be secondary to more acute primary care needs. The shortage of PCPs is expected to worsen in coming years, which could further reduce their availability to assess inappropriate aspirin use.9
VA clinical pharmacist practitioners (CPPs) serve as medication experts and work autonomously under a broad scope of practice as part of the patient aligned care team.10-12 CPPs can free up time for PCPs and facilitate deprescribing efforts, especially for older adults. One retrospective cohort study conducted at a VA medical center found that CPPs deprescribed more potentially inappropriate medications among individuals aged ≥ 80 years compared with usual care with PCPs (26.8% vs 16.1%; P < .001).12,13 An aspirin deprescribing protocol conducted in 2022 resulted in nearly half of veterans aged ≥ 70 years contacted by phone agreeing to stop aspirin. Although this study supports the role pharmacists can play in reducing aspirin use in accordance with guidelines, the authors acknowledge that their interventions had a mean time of 12 minutes per patient and would require workflow changes.14 The purpose of this study is to evaluate the efficiency of aspirin deprescribing through 2 approaches: direct deprescribing by pharmacists using populationlevel review compared with clinicians following a pharmacist-led education.
Methods
This was a single-center quality improvement cohort study at the Durham VA Health Care System (DVAHCS) in North Carolina. Patients included were aged ≥ 70 years without known ASCVD who received care at any of 3 DVAHCS community-based outpatient clinics and prescribed aspirin. Patient data was obtained using the VIONE (Deprescribing Dashboard called Vital, Important, Optional, Not indicated, and Every medication has a specific indication or diagnosis) dashboard.15 VIONE was developed to identify potentially inappropriate medications (PIMs) that are eligible to deprescribe based on Beers Criteria, Screening Tool of Older Personsf Prescriptions criteria, and common clinical scenarios when clinicians determine the risk outweighs the benefit to continue a specific medication. 16,17 VIONE is used to reduce polypharmacy and improve patient safety, comfort, and medication adherence. Aspirin for patients aged ≥ 70 years without a history of ASCVD is a PIM identified by VIONE. Patients aged ≥ 70 years were chosen as an inclusion criteria in this study to match the ASPREE trial inclusion criteria and age inclusion criteria in the VIONE dashboard for aspirin deprescribing.2 Patient lists were generated for these potentially inappropriate aspirin prescriptions for 3 months before clinician staff education presentations, the day of the presentations, and 3 months after.
The primary endpoint was the number of veterans with aspirin deprescribed directly by 2 pharmacists over 12 weeks, divided by total patient care time spent, compared with the change in number of veterans with aspirin deprescribed by any DVAHCS physician, nurse practitioner, physician assistant, or CPP over 12 weeks, divided by the total pharmacist time spent on PCP education. Secondary endpoints were the number of aspirin orders discontinued by pharmacists and CPPs, the number of aspirin orders discontinued 12 weeks before pharmacist-led education compared with the number of aspirin orders discontinued 12 weeks after CPP-led education, average and median pharmacist time spent per patient encounter, and time of direct patient encounters vs time spent on PCP education.
Pharmacists reviewed each patient who met the inclusion criteria from the list generated by VIONE on December 1, 2022, for aspirin appropriateness according to the ACC/AHA and USPSTF guidelines, with the goal to discontinue aspirin for primary prevention of ASCVD and no other indications.1,4 Pharmacists documented their visits using VIONE methodology in the Computerized Patient Record System (CPRS) using a polypharmacy review note. CPPs contacted patients who were taking aspirin for primary prevention by unscheduled telephone call to assess for aspirin adherence, undocumented history of ASCVD, cardiovascular risk factors, and history of bleeding. Aspirin was discontinued if patients met guideline criteria recommendations and agreed to discontinuation. Risk-benefit discussions were completed when patients without known ASCVD were considered high risk because the ACC/AHA guidelines mention there is insufficient evidence of safety and efficacy of aspirin for primary prevention for patients with other known ASCVD risk factors (eg, strong family history of premature myocardial infarction, inability to achieve lipid, blood pressure, or glucose targets, or significant elevation in coronary artery calcium score).
High risk was defined as family history of premature ASCVD (in a male first-degree relative aged < 55 years or a female first-degree relative aged < 65 years), most recent blood pressure or 2 blood pressure results in the last 12 months > 160/100 mm Hg, recent hemoglobin A1c > 9%, and/or low-density lipoprotein > 190 mg/dL or not prescribed an indicated statin.3 Aspirin was continued or discontinued according to patient preference after the personalized risk-benefit discussion.
For patients with a clinical indication for aspirin use other than ASCVD (eg, atrial fibrillation not on anticoagulation, venous thromboembolism prophylaxis, carotid artery disease), CPPs documented their assessment and when appropriate deferred to the PCP for consideration of stopping aspirin. For patients with undocumented ASCVD, CPPs added their ASCVD history to their problem list and aspirin was continued. PCPs were notified by alert when aspirin was discontinued and when patients could not be reached by telephone.
presented a review of recent guideline updates and supporting literature at 2 online staff meetings. The education sessions lasted about 10 minutes and were presented to PCPs across 3 community-based outpatient clinics. An estimated 40 minutes were spent creating the PowerPoint education materials, seeking feedback, making edits, and answering questions or emails from PCPs after the presentation. During the presentation, pharmacists encouraged PCPs to discontinue aspirin (active VA prescriptions and reported over-the-counter use) for primary prevention of ASCVD in patients aged ≥ 70 years during their upcoming appointments and consider risk factors recommended by the ACC/AHA guidelines when applicable. PCPs were notified that CPPs planned to start a population review for discontinuing active VA aspirin prescriptions on December 1, 2022. The primary endpoint and secondary endpoints were analyzed using descriptive statistics. All data were analyzed using Microsoft Excel.
Results
A total of 868 patients aged ≥ 70 years with active prescriptions for aspirin were identified on December 1, 2022. After applying inclusion and exclusion criteria for the pharmacist population review, 224 patients were included for cohort final analysis (Figure). All 868 patients were eligible for the CPP intervention. Primary reasons for exclusion from the CPP population included over-thecounter aspirin and a history of ASCVD in the patient’s problem list. All patients were male, with a mean (SD) age of 75 (4.4) years (Table 1). Most patients were prescribed aspirin, 81 mg daily (n = 220; 98%).
The direct CPP deprescribing intervention resulted in 2 aspirin prescriptions discontinued per hour of pharmacist time and 67 aspirin prescriptions discontinued per hour of pharmacist time via the PCP education intervention. CPPs discontinued 66 aspirin orders in the 12 weeks before the PCP education sessions. A total of 230 aspirin prescriptions were discontinued in the 12 weeks following the PCP education sessions, with 97 discontinued directly by CPPs and 133 discontinued by PCPs. The PCP education session yielded an additional 67 discontinued aspirin orders compared with the 12 weeks before the education sessions (Table 2).
The CPP direct deprescribing intervention took about 48.3 hours, accounting for health record review and time interacting with patients. The PCP education intervention took about 60 minutes, which included time for preparing and delivering education materials (Table 3). CPP deprescribing encounter types, interventions, and related subcategories, and other identified indications to continue aspirin are listed in Table 4.
Discussion
Compared with direct deprescribing by pharmacists, the PCP education intervention was more efficient based on number of aspirin orders discontinued by pharmacist time. PCPs discontinued twice as many aspirin prescriptions in the 12 weeks after pharmacist-led education compared with the 12 weeks before.
Patients were primarily contacted by telephone (73%) for deprescribing. Among the 163 patients reached by phone and encouraged to discontinue aspirin, 97 patients (60%) accepted the recommendation, which was similar to the acceptance rates found in the literature (48% to 55%).14,18 Although many veterans continued taking aspirin (78%), most had indications for its continued use, such as a history of ASCVD, atrial fibrillation without anticoagulation, and carotid artery stenosis, and complex comorbidities that required further discussion with their PCP. Less common uses for aspirin were identified through CPRS review or patient reports included cerebral small vessel disease without history of ASCVD, subclavian artery stenosis, thrombocytosis, bioprosthetic valve replacement, giant cell arteritis, rheumatoid arthritis, and prevention of second eye involvement of ischemic optic neuropathy.
to describe the benefit of clinical pharmacy services for deprescribing aspirin for primary prevention of ASCVD through PCP education. Previously published literature has assessed alternative ways to identify or discontinue PIMs—including aspirin—among geriatric patients. One study evaluated the use of marking inappropriate aspirin prescriptions in the electronic health database, leading to a significant reduction in incidence of inappropriate aspirin prescribing; however, it did not assess changes in discontinuation rates of existing aspirin prescriptions.19 The previous VA pharmacist aspirin deprescribing protocol demonstrated pharmacists’ aptitude at discontinuing aspirin for primary prevention but only used direct patient contact and did not compare efficiency with other methods, including PCP education.14
This quality improvement project contributes new data to the existing literature to support the use of clinical pharmacists to discontinue aspirin for primary prevention and suggests a strong role for pharmacists as educators on clinical guidelines, in addition to their roles directly deprescribing PIMs in clinical practice. This study is further strengthened by its use of VIONE, which previously has demonstrated effectiveness in deprescribing a variety of PIMs in primary care settings.20
Despite using VIONE for generating a list of patients eligible for deprescription, our CPRS review found that this list was frequently inaccurate. For example, a small portion of patients were on the VIONE generated list indicating they had no ASCVD history, but had transient ischemic attack listed in their problem lists. Patient problem lists often were missing documented ASCVD history that was revealed by patient interview or CPRS review. It is possible that patients interviewed might have omitted relevant ASCVD history because of low health literacy, conditions affecting memory, or use of health care services outside the VA system.
There were several instances of aspirin used for other non-ASCVD indications, such as primary stroke prevention in atrial fibrillation. The ACC/AHA atrial fibrillation guidelines previously provided a Class IIb recommendation (benefit is greater than risk but additional studies are needed) for considering no antithrombic therapy or treatment with oral anticoagulant or aspirin for nonvalvular atrial fibrillation with CHA2DS2-VASc (Congestive heart failure, Hypertension, Age [> 65 y, 1 point; > 75 y, 2 points], Diabetes, previous Stroke/transient ischemic attack [2 points]) score of 1.21 The ACC/ AHA guidelines were updated in 2023 to recommend against antiplatelet therapy as an alternative to anticoagulation for reducing cardioembolic stroke risk among patients with atrial fibrillation with no indication for antiplatelet therapy because of risk of harm.22 If a patient has no risk factors for stroke, aspirin is not recommended to prevent thromboembolic events because of a lack of benefit. Interventions from this quality improvement study were completed before the 2023 atrial fibrillation guideline was published and therefore in this study aspirin was not discontinued when used for atrial fibrillation. Aspirin use for atrial fibrillation might benefit from similar discontinuation efforts analyzed within this study. Beyond atrial fibrillation, major guidelines do not comment on the use of aspirin for any other indications in the absence of clinical ASCVD.
Limitations
This study is limited by the lack of clinical consensus for complex patients and demonstrates the importance of individualized patient assessment when considering discontinuing aspirin. Because of the project’s relatively short intervention period, aspirin deprescribing rates could decrease over time and repeated education efforts might be necessary to see lasting impact. Health care professionals from services outside of primary care also might have discontinued aspirin during the study period unrelated to the education and these discontinued aspirin prescriptions could contribute to the higher rate observed among PCPs. This study included a specific population cohort of male, US veterans and might not reflect other populations where these interventions could be implemented.
The measurement of time spent by pharmacists and PCPs is an additional limitation. Although it is expected that PCPs attempt to discontinue aspirin during their existing patient care appointments, the time spent during visits was not measured or documented. Direct deprescribing by pharmacist CPRS review required a significant amount of time and could be a barrier to successful intervention by CPPs in patient aligned care teams.
To reduce the time pharmacists spent completing CPRS reviews, an aspirin deprescribing clinical reminder tool could be used to assess use and appropriate indication quickly during any primary care visit led by a PCP or CPP. In addition, it is recommended that pharmacists regularly educate health care professionals on guideline recommendations for aspirin use among geriatric patients. Future studies of the incidence of major cardiovascular events after aspirin deprescribing among geriatric patients and a longitudinal cost/benefit analysis could support these initiatives.
Conclusions
In this study, pharmacists successfully deprescribed inappropriate medications, such as aspirin. However, pharmacist-led PCP education is more efficient compared with direct deprescribing using a population-level review. PCP education requires less time and could allow ambulatory care pharmacists to spend more time on other direct patient care interventions to improve quality and access to care in primary care clinics. This study’s results further support the role of pharmacists in deprescribing PIMs for older adults and the use of a deprescribing tool, such as VIONE, in a primary care setting.
- US Preventive Services Task Force; Davidson KW, Barry MJ, et al. Aspirin use to prevent cardiovascular disease: US Preventive Services Task Force recommendation statement. JAMA. 2022;327(16):1577-1584. doi:10.1001/jama.2022.4983
- McNeil JJ, Nelson MR, Woods RL, et al. Effect of aspirin on all-cause mortality in the healthy elderly. N Engl J Med. 2018;379(16):1519-1528. doi:10.1056/NEJMoa1803955
- Barry MJ, Wolff TA, Pbert L, et al. Putting evidence into practice: an update on the US Preventive Services Task Force methods for developing recommendations for preventive services. Ann Fam Med. 2023;21(2):165-171. doi:10.1370/afm.2946
- Arnett DK, Blumenthal RS, Albert MA, et al. 2019 ACC/ AHA Guideline on the Primary Prevention of Cardiovascular Disease: A report of the American College of Cardiology/ American Heart Association Task Force on Clinical Practice Guidelines. Circulation. 2019;140(11):e596-e646. doi:10.1161/CIR.0000000000000678
- American Diabetes Association Professional Practice Committee. 10. Cardiovascular disease and risk management: Standards of care in diabetes-2024. Diabetes Care. 2024;47(Suppl 1):S179-S218. doi:10.2337/dc24-S010
- Ong SY, Chui P, Bhargava A, Justice A, Hauser RG. Estimating aspirin overuse for primary prevention of atherosclerotic cardiovascular disease (from a nationwide healthcare system). Am J Cardiol. 2020;137:25-30. doi:10.1016/j.amjcard.2020.09.042
- Weiss AJ, Jiang HJ. Overview of clinical conditions with frequent and costly hospital readmissions by payer, 2018. In: Healthcare Cost and Utilization Project (HCUP) Statistical Briefs. Agency for Healthcare Research and Quality (US); July 20, 2021.
- Krishnaswami A, Steinman MA, Goyal P, et al. Deprescribing in older adults with cardiovascular disease. J Am Coll Cardiol. 2019;73(20):2584-2595. doi:10.1016/j.jacc.2019.03.467
- Association of American Medical Colleges. The complexities of physician supply and demand: projections from 2019 to 2034. Accessed March 17, 2024. https://www.aamc.org/media/54681/download
- US Department of Veterans Affairs, Veterans Health Administration. VHA Directive 1108.07(1): General pharmacy service requirements. November 28, 2022. Accessed March 17, 2024. https://www.va.gov/vhapublications/ViewPublication.asp?pub_ID=10045
- US Department of Veterans Affairs, Veterans Health Administration. VHA Handbook 1108.11(3): Clinical pharmacy services. July 1, 2015. Accessed March 17, 2024. https://www.va.gov/vhapublications/ViewPublication.asp?pub_ID=3120
- US Department of Veterans Affairs. Clinical pharmacist practitioner (CPP) to improve access to and quality of care August 2021. August 2021. Accessed May 19, 2023. https://www.pbm.va.gov/PBM/CPPO/Documents/ExternalFactSheet_OptimizingtheCPPToImproveAccess_508.pdf
- Ammerman CA, Simpkins BA, Warman N, Downs TN. Potentially inappropriate medications in older adults: Deprescribing with a clinical pharmacist. J Am Geriatr Soc. 2019;67(1):115-118. doi:10.1111/jgs.15623
- Rothbauer K, Siodlak M, Dreischmeier E, Ranola TS, Welch L. Evaluation of a pharmacist-driven ambulatory aspirin deprescribing protocol. Fed Pract. 2022;39(suppl 5):S37- S41a. doi:10.12788/fp.0294
- US Department of Veterans Affairs. VIONE changes the way VA handles prescriptions. January 25, 2020. Accessed May 21, 2023. https://news.va.gov/70709/vione-changes-way-va-handles-prescriptions/
- 2023 American Geriatrics Society Beers Criteria Update Expert Panel. American Geriatrics Society 2023 updated AGS Beers Criteria for potentially inappropriate medication use in older adults. J Am Geriatr Soc. 2023;71(7):2052- 2081. doi:10.1111/jgs.18372
- O’Mahony D, Cherubini A, Guiteras AR, et al. STOPP/ START criteria for potentially inappropriate prescribing in older people: version 3. Eur Geriatr Med. 2023;14(4):625- 632. doi:10.1007/s41999-023-00777-y
- Draeger C, Lodhi F, Geissinger N, Larson T, Griesbach S. Interdisciplinary deprescribing of aspirin through prescriber education and provision of patient-specific recommendations. WMJ. 2022;121(3):220-225
- de Lusignan S, Hinton W, Seidu S, et al. Dashboards to reduce inappropriate prescribing of metformin and aspirin: A quality assurance programme in a primary care sentinel network. Prim Care Diabetes. 2021;15(6):1075-1079. doi:10.1016/j.pcd.2021.06.003
- Nelson MW, Downs TN, Puglisi GM, Simpkins BA, Collier AS. Use of a deprescribing tool in an interdisciplinary primary-care patient-aligned care team. Sr Care Pharm. 2022;37(1):34-43. doi:10.4140/TCP.n.2022.34
- January CT, Wann LS, Alpert JS, et al. 2014 AHA/ ACC/HRS guideline for the management of patients with atrial fibrillation: a report of the American College of Cardiology/American Heart Association Task Force on practice guidelines and the Heart Rhythm Society. Circulation. 2014;130(23):e199-e267. doi:10.1161/CIR.0000000000000041
- Joglar JA, Chung MK, Armbruster AL, et al. 2023 ACC/ AHA/ACCP/HRS Guideline for the Diagnosis and Management of Atrial Fibrillation: A Report of the American College of Cardiology/American Heart Association Joint Committee on Clinical Practice Guidelines Circulation. 2024;149(1):e1- e156. doi:10.1161/CIR.0000000000001193
Pharmacist-Led Deprescribing of Aspirin for Primary Prevention of Cardiovascular Disease Among Geriatric Veterans
Pharmacist-Led Deprescribing of Aspirin for Primary Prevention of Cardiovascular Disease Among Geriatric Veterans
Weighted Blankets May Help Reduce Preoperative Anxiety During Mohs Micrographic Surgery
Weighted Blankets May Help Reduce Preoperative Anxiety During Mohs Micrographic Surgery
To the Editor:
Patients with nonmelanoma skin cancers exhibit high quality-of-life satisfaction after treatment with Mohs micrographic surgery (MMS) or excision.1,2 However, perioperative anxiety in patients undergoing MMS is common, especially during the immediate preoperative period.3 Anxiety activates the sympathetic nervous system, resulting in physiologic changes such as tachycardia and hypertension.4,5 These sequelae may not only increase patient distress but also increase intraoperative bleeding, complication rates, and recovery times.4,5 Thus, the preoperative period represents a critical window for interventions aimed at reducing anxiety. Anxiety peaks during the perioperative period for a myriad of reasons, including anticipation of pain or potential complications. Enhancing patient comfort and well-being during the procedure may help reduce negative emotional sequelae, alleviate fear during procedures, and increase patient satisfaction.3
Weighted blankets (WBs) frequently are utilized in occupational and physical therapy as a deep pressure stimulation tool to alleviate anxiety by mimicking the experience of being massaged or swaddled.6 Deep pressure tools increase parasympathetic tone, help reduce anxiety, and provide a calming effect.7,8 Nonhospitalized individuals were more relaxed during mental health evaluations when using a WB, and deep pressure tools have frequently been used to calm individuals with autism spectrum disorders or attention-deficit/hyperactivity disorders.6 Furthermore, WBs have successfully been used to reduce anxiety in mental health care settings, as well as during chemotherapy infusions.6,9 The literature is sparse regarding the use of WB in the perioperative setting. Potential benefit has been demonstrated in the setting of dental cleanings and wisdom teeth extractions.7,8 In the current study, we investigated whether use of a WB could reduce preoperative anxiety in the setting of MMS.
Institutional review board approval was obtained from the University of Virginia (Charlottesville, Virginia), and adult patients undergoing MMS to the head or neck were recruited to participate in a single-blind randomized controlled trial in the spring of 2023. Patients undergoing MMS on other areas of the body were excluded because the placement of the WB could interfere with the procedure. Other exclusion criteria included pregnancy, dementia, or current treatment with an anxiolytic medication.
Twenty-seven patients were included in the study, and informed consent was obtained. Patients were randomized to use a WB or standard hospital towel (control). The medical-grade WBs weighed 8.5 pounds, while the cotton hospital towels weighed less than 1 pound. The WBs were cleaned in between patients with standard germicidal disposable wipes.
Patient data were collected from electronic medical records including age, sex, weight, history of prior MMS, and current use of antihypertensives and/or beta-blockers. Data also were collected on the presence of anxiety disorders, major depression, fibromyalgia, tobacco and alcohol use, hyperthyroidism, hyperhidrosis, cardiac arrhythmias (including atrial fibrillation), chronic obstructive pulmonary disease, asthma, coronary artery disease, diabetes mellitus, peripheral neuropathy, and menopausal symptoms.
During the procedure, anxiety was monitored using the State-Trait Anxiety Inventory (STAI) Form Y-1, the visual analogue scale for anxiety (VAS-A), and vital signs including heart rate, blood pressure, and respiratory rate. Vital signs were evaluated by nursing staff with the patient sitting up and the WB or hospital towel removed. Using these assessments, anxiety was measured at 3 different timepoints: upon arrival to the clinic (timepoint A), after the patient rested in a reclined beach-chair position with the WB or hospital towel placed over them for 10 minutes before administration of local anesthetic and starting the procedure (timepoint B), and after the first MMS stage was taken (timepoint C).
A power analysis was not completed due to a lack of previous studies on the use of WBs during MMS. Group means were analyzed using two-tailed t-tests and one-way analysis of variance. A P value of .05 indicated statistical significance.
Fourteen patients were randomized to the WB group and 13 were randomized to the control group. Patient demographics are outlined in the eTable. In the WB group, mean STAI scores progressively decreased at each timepoint (A: 15.3, B: 13.6, C: 12.7) and mean VAS-A scores followed a similar trend (A: 24.2, B: 19.3, C: 10.5). In the control group, the mean STAI scores remained stable at timepoints A and B (17.7) and then decreased at timepoint C (14.8). The mean VAS-A scores in the control group followed a similar pattern, remaining stable at timepoints A (22.9) and B (22.8) and then decreasing at timepoint C (14.4). These changes were not statistically significant.
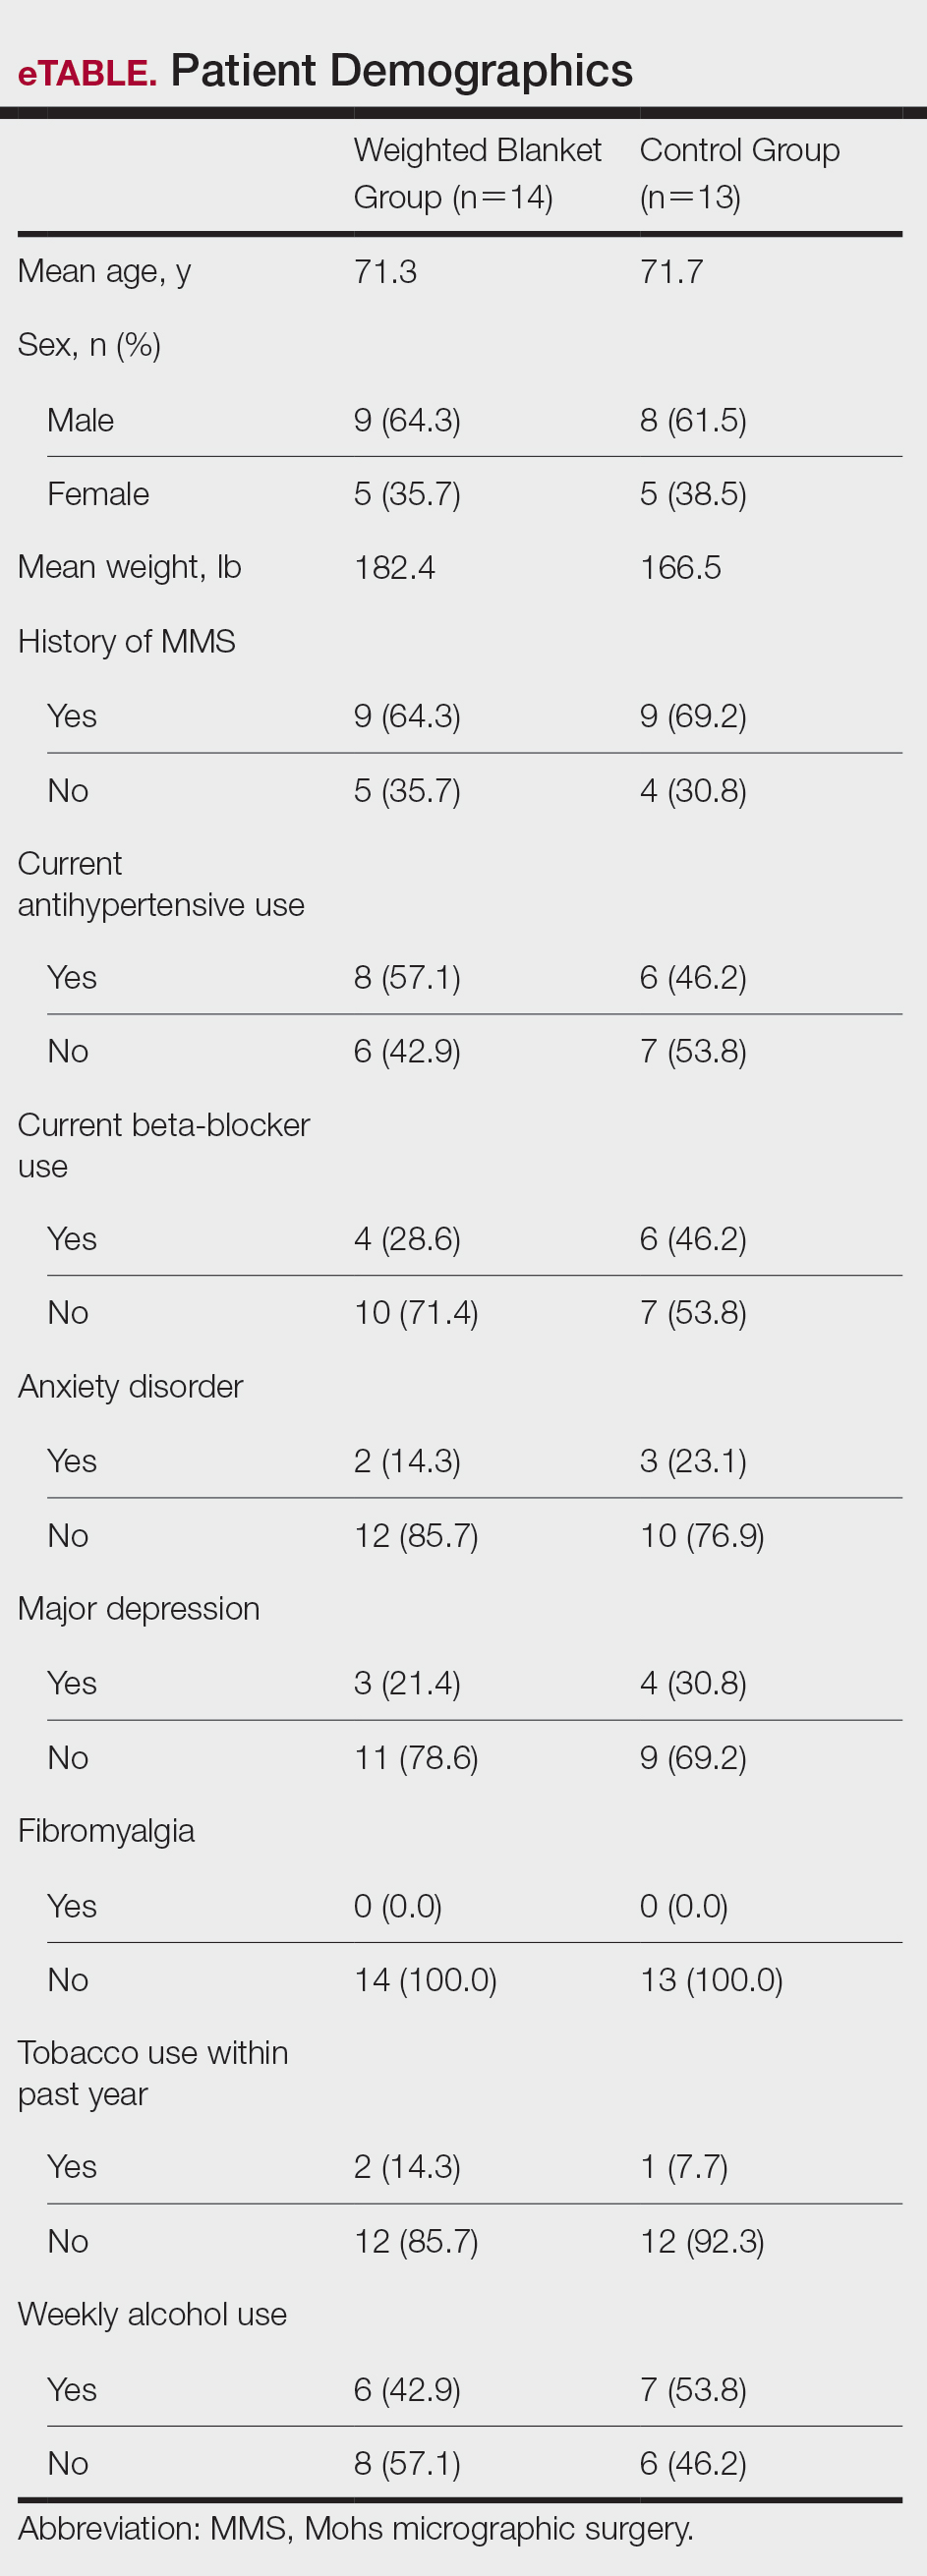
Mean vital signs for both the WB and control groups were relatively stable across all timepoints, although they tended to decrease by timepoint C. In the WB group, mean heart rates were 69, 69, and 67 beats per minute at timepoints A, B, and C, respectively. Mean systolic blood pressures were 137 mm Hg, 138 mm Hg, and 136 mm Hg and mean diastolic pressures were 71 mm Hg, 68 mm Hg, and 66 mm Hg at timepoints A, B, and C, respectively. Mean respiratory rates were 20, 19, and 18 breaths per minute at timepoints A, B, and C, respectively. In the control group, mean heart rates were 70, 69, and 68 beats per minute across timepoints A, B, and C, respectively. Mean systolic blood pressures were 137 mm Hg, 138 mm Hg, and 133 mm Hg and mean diastolic pressures were 71 mm Hg, 74 mm Hg, and 68 mm Hg at timepoints A, B, and C, respectively. Mean respiratory rates were 19, 18, and 18 breaths per minute at timepoints A, B, and C, respectively. These changes were not statistically significant.
Our pilot study examined the effects of using a WB to alleviate preoperative anxiety during MMS. Our results suggest that WBs may modestly improve subjective anxiety immediately prior to undergoing MMS. Mean STAI and VAS-A scores decreased from timepoint A to timepoint B in the WB group vs the control group in which these scores remained stable. Although our study was not powered to determine statistical differences and significance was not reached, our results suggest a favorable trend in decreased anxiety scores. Our analysis was limited by a small sample size; therefore, additional larger-scale studies will be needed to confirm this trend.
Our results are broadly consistent with earlier studies that found improvement in physiologic proxies of anxiety with the use of WBs during chemotherapy infusions, dental procedures, and acute inpatient mental health hospitalizations.7-10 During periods of high anxiety, use of WBs shifts the autonomic nervous system from a sympathetic to a parasympathetic state, as demonstrated by increased high-frequency heart rate variability, a marker of parasympathetic activity.6,11 While the exact mechanism of how WBs and other deep pressure stimulation tools affect high-frequency heart rate variability is unclear, one study showed that patients undergoing dental extractions were better equipped when using deep pressure stimulation tools to utilize calming techniques and regulate stress.12 The use of WBs and other deep pressure stimulation tools may extend beyond the perioperative setting and also may be an effective tool for clinicians in other settings (eg, clinic visits, physical examinations).
In our study, all participants demonstrated the greatest reduction in anxiety at timepoint C after the first MMS stage, likely related to patients relaxing more after knowing what to expect from the surgery; this also may have been reflected somewhat in the slight downward trend noted in vital signs across both study groups. One concern regarding WB use in surgical settings is whether the added pressure could trigger unfavorable circulatory effects, such as elevated blood pressure. In our study, with the exception of diastolic blood pressure, vital signs appeared unaffected by the type of blanket used and remained relatively stable from timepoint A to timepoint B and decreased at timepoint C. Diastolic blood pressure in the WB group decreased from timepoint A to timepoint B, then decreased further from timepoint B to timepoint C. This mirrored the decreasing STAI score trend, compared to the control group who increased from timepoint A to timepoint B and reached a nadir at timepoint C. Consistent with prior WB studies, there were no adverse effects from WBs, including adverse impacts on vital signs.6,9
The original recruitment goal was not met due to staffing issues related to the COVID-19 pandemic, and subgroup analyses were deferred as a result of sample size limitations. It is possible that the WB intervention may have a larger impact on subpopulations more prone to perioperative anxiety (eg, patients undergoing MMS for the first time). However, the results of our pilot study suggest a beneficial effect from the use of WBs. While these preliminary data are promising, additional studies in the perioperative setting are needed to more accurately determine the clinical utility of WBs during MMS and other procedures.
- Eberle FC, Schippert W, Trilling B, et al. Cosmetic results of histographically controlled excision of non-melanoma skin cancer in the head and neck region. J Dtsch Dermatol Ges. 2005;3:109-112. doi:10.1111/j.1610-0378.2005.04738.x
- Chren MM, Sahay AP, Bertenthal DS, et al. Quality-of-life outcomes of treatments for cutaneous basal cell carcinoma and squamous cell carcinoma. J Invest Dermatol. 2007;127:1351-1357. doi:10.1038/sj.jid.5700740
- Kossintseva I, Zloty D. Determinants and timeline of perioperative anxiety in Mohs surgery. Dermatol Surg. 2017;43:1029-1035. doi:10.1097 /DSS.0000000000001152
- Pritchard MJ. Identifying and assessing anxiety in pre-operative patients. Nurs Stand. 2009;23:35-40. doi:10.7748/ns2009.08.23.51.35.c7222.
- Mavros MN, Athanasiou S, Gkegkes ID, et al. Do psychological variables affect early surgical recovery? PLoS One. 2011;6:E20306. doi:10.1371/journal.pone.0020306
- Mullen B, Champagne T, Krishnamurty S, et al. Exploring the safety and therapeutic effects of deep pressure stimulation using a weighted blanket. Occup Ther Ment Health. 2008;24:65-89. doi:10.1300/ J004v24n01_05
- Chen HY, Yang H, Chi HJ, et al. Physiological effects of deep touch pressure on anxiety alleviation: the weighted blanket approach. J Med Biol Eng. 2013;33:463-470. doi:10.5405/jmbe.1043
- Chen HY, Yang H, Meng LF, et al. Effect of deep pressure input on parasympathetic system in patients with wisdom tooth surgery. J Formos Med Assoc. 2016;115:853-859. doi:10.1016 /j.jfma.2016.07.008
- Vinson J, Powers J, Mosesso K. Weighted blankets: anxiety reduction in adult patients receiving chemotherapy. Clin J Oncol Nurs. 2020; 24:360-368. doi:10.1188/20.CJON.360-368
- Champagne T, Mullen B, Dickson D, et al. Evaluating the safety and effectiveness of the weighted blanket with adults during an inpatient mental health hospitalization. Occup Ther Ment Health. 2015;31:211-233. doi:10.1080/0164212X.2015.1066220
- Lane RD, McRae K, Reiman EM, et al. Neural correlates of heart rate variability during emotion. Neuroimage. 2009;44:213-222. doi: 10.1016/j.neuroimage.2008.07.056
- Moyer CA, Rounds J, Hannum JW. A meta-analysis of massage therapy research. Psychol Bull. 2004;130:3-18. doi: 10.1037 /0033-2909.130.1.3
To the Editor:
Patients with nonmelanoma skin cancers exhibit high quality-of-life satisfaction after treatment with Mohs micrographic surgery (MMS) or excision.1,2 However, perioperative anxiety in patients undergoing MMS is common, especially during the immediate preoperative period.3 Anxiety activates the sympathetic nervous system, resulting in physiologic changes such as tachycardia and hypertension.4,5 These sequelae may not only increase patient distress but also increase intraoperative bleeding, complication rates, and recovery times.4,5 Thus, the preoperative period represents a critical window for interventions aimed at reducing anxiety. Anxiety peaks during the perioperative period for a myriad of reasons, including anticipation of pain or potential complications. Enhancing patient comfort and well-being during the procedure may help reduce negative emotional sequelae, alleviate fear during procedures, and increase patient satisfaction.3
Weighted blankets (WBs) frequently are utilized in occupational and physical therapy as a deep pressure stimulation tool to alleviate anxiety by mimicking the experience of being massaged or swaddled.6 Deep pressure tools increase parasympathetic tone, help reduce anxiety, and provide a calming effect.7,8 Nonhospitalized individuals were more relaxed during mental health evaluations when using a WB, and deep pressure tools have frequently been used to calm individuals with autism spectrum disorders or attention-deficit/hyperactivity disorders.6 Furthermore, WBs have successfully been used to reduce anxiety in mental health care settings, as well as during chemotherapy infusions.6,9 The literature is sparse regarding the use of WB in the perioperative setting. Potential benefit has been demonstrated in the setting of dental cleanings and wisdom teeth extractions.7,8 In the current study, we investigated whether use of a WB could reduce preoperative anxiety in the setting of MMS.
Institutional review board approval was obtained from the University of Virginia (Charlottesville, Virginia), and adult patients undergoing MMS to the head or neck were recruited to participate in a single-blind randomized controlled trial in the spring of 2023. Patients undergoing MMS on other areas of the body were excluded because the placement of the WB could interfere with the procedure. Other exclusion criteria included pregnancy, dementia, or current treatment with an anxiolytic medication.
Twenty-seven patients were included in the study, and informed consent was obtained. Patients were randomized to use a WB or standard hospital towel (control). The medical-grade WBs weighed 8.5 pounds, while the cotton hospital towels weighed less than 1 pound. The WBs were cleaned in between patients with standard germicidal disposable wipes.
Patient data were collected from electronic medical records including age, sex, weight, history of prior MMS, and current use of antihypertensives and/or beta-blockers. Data also were collected on the presence of anxiety disorders, major depression, fibromyalgia, tobacco and alcohol use, hyperthyroidism, hyperhidrosis, cardiac arrhythmias (including atrial fibrillation), chronic obstructive pulmonary disease, asthma, coronary artery disease, diabetes mellitus, peripheral neuropathy, and menopausal symptoms.
During the procedure, anxiety was monitored using the State-Trait Anxiety Inventory (STAI) Form Y-1, the visual analogue scale for anxiety (VAS-A), and vital signs including heart rate, blood pressure, and respiratory rate. Vital signs were evaluated by nursing staff with the patient sitting up and the WB or hospital towel removed. Using these assessments, anxiety was measured at 3 different timepoints: upon arrival to the clinic (timepoint A), after the patient rested in a reclined beach-chair position with the WB or hospital towel placed over them for 10 minutes before administration of local anesthetic and starting the procedure (timepoint B), and after the first MMS stage was taken (timepoint C).
A power analysis was not completed due to a lack of previous studies on the use of WBs during MMS. Group means were analyzed using two-tailed t-tests and one-way analysis of variance. A P value of .05 indicated statistical significance.
Fourteen patients were randomized to the WB group and 13 were randomized to the control group. Patient demographics are outlined in the eTable. In the WB group, mean STAI scores progressively decreased at each timepoint (A: 15.3, B: 13.6, C: 12.7) and mean VAS-A scores followed a similar trend (A: 24.2, B: 19.3, C: 10.5). In the control group, the mean STAI scores remained stable at timepoints A and B (17.7) and then decreased at timepoint C (14.8). The mean VAS-A scores in the control group followed a similar pattern, remaining stable at timepoints A (22.9) and B (22.8) and then decreasing at timepoint C (14.4). These changes were not statistically significant.
Mean vital signs for both the WB and control groups were relatively stable across all timepoints, although they tended to decrease by timepoint C. In the WB group, mean heart rates were 69, 69, and 67 beats per minute at timepoints A, B, and C, respectively. Mean systolic blood pressures were 137 mm Hg, 138 mm Hg, and 136 mm Hg and mean diastolic pressures were 71 mm Hg, 68 mm Hg, and 66 mm Hg at timepoints A, B, and C, respectively. Mean respiratory rates were 20, 19, and 18 breaths per minute at timepoints A, B, and C, respectively. In the control group, mean heart rates were 70, 69, and 68 beats per minute across timepoints A, B, and C, respectively. Mean systolic blood pressures were 137 mm Hg, 138 mm Hg, and 133 mm Hg and mean diastolic pressures were 71 mm Hg, 74 mm Hg, and 68 mm Hg at timepoints A, B, and C, respectively. Mean respiratory rates were 19, 18, and 18 breaths per minute at timepoints A, B, and C, respectively. These changes were not statistically significant.
Our pilot study examined the effects of using a WB to alleviate preoperative anxiety during MMS. Our results suggest that WBs may modestly improve subjective anxiety immediately prior to undergoing MMS. Mean STAI and VAS-A scores decreased from timepoint A to timepoint B in the WB group vs the control group in which these scores remained stable. Although our study was not powered to determine statistical differences and significance was not reached, our results suggest a favorable trend in decreased anxiety scores. Our analysis was limited by a small sample size; therefore, additional larger-scale studies will be needed to confirm this trend.
Our results are broadly consistent with earlier studies that found improvement in physiologic proxies of anxiety with the use of WBs during chemotherapy infusions, dental procedures, and acute inpatient mental health hospitalizations.7-10 During periods of high anxiety, use of WBs shifts the autonomic nervous system from a sympathetic to a parasympathetic state, as demonstrated by increased high-frequency heart rate variability, a marker of parasympathetic activity.6,11 While the exact mechanism of how WBs and other deep pressure stimulation tools affect high-frequency heart rate variability is unclear, one study showed that patients undergoing dental extractions were better equipped when using deep pressure stimulation tools to utilize calming techniques and regulate stress.12 The use of WBs and other deep pressure stimulation tools may extend beyond the perioperative setting and also may be an effective tool for clinicians in other settings (eg, clinic visits, physical examinations).
In our study, all participants demonstrated the greatest reduction in anxiety at timepoint C after the first MMS stage, likely related to patients relaxing more after knowing what to expect from the surgery; this also may have been reflected somewhat in the slight downward trend noted in vital signs across both study groups. One concern regarding WB use in surgical settings is whether the added pressure could trigger unfavorable circulatory effects, such as elevated blood pressure. In our study, with the exception of diastolic blood pressure, vital signs appeared unaffected by the type of blanket used and remained relatively stable from timepoint A to timepoint B and decreased at timepoint C. Diastolic blood pressure in the WB group decreased from timepoint A to timepoint B, then decreased further from timepoint B to timepoint C. This mirrored the decreasing STAI score trend, compared to the control group who increased from timepoint A to timepoint B and reached a nadir at timepoint C. Consistent with prior WB studies, there were no adverse effects from WBs, including adverse impacts on vital signs.6,9
The original recruitment goal was not met due to staffing issues related to the COVID-19 pandemic, and subgroup analyses were deferred as a result of sample size limitations. It is possible that the WB intervention may have a larger impact on subpopulations more prone to perioperative anxiety (eg, patients undergoing MMS for the first time). However, the results of our pilot study suggest a beneficial effect from the use of WBs. While these preliminary data are promising, additional studies in the perioperative setting are needed to more accurately determine the clinical utility of WBs during MMS and other procedures.
- Eberle FC, Schippert W, Trilling B, et al. Cosmetic results of histographically controlled excision of non-melanoma skin cancer in the head and neck region. J Dtsch Dermatol Ges. 2005;3:109-112. doi:10.1111/j.1610-0378.2005.04738.x
- Chren MM, Sahay AP, Bertenthal DS, et al. Quality-of-life outcomes of treatments for cutaneous basal cell carcinoma and squamous cell carcinoma. J Invest Dermatol. 2007;127:1351-1357. doi:10.1038/sj.jid.5700740
- Kossintseva I, Zloty D. Determinants and timeline of perioperative anxiety in Mohs surgery. Dermatol Surg. 2017;43:1029-1035. doi:10.1097 /DSS.0000000000001152
- Pritchard MJ. Identifying and assessing anxiety in pre-operative patients. Nurs Stand. 2009;23:35-40. doi:10.7748/ns2009.08.23.51.35.c7222.
- Mavros MN, Athanasiou S, Gkegkes ID, et al. Do psychological variables affect early surgical recovery? PLoS One. 2011;6:E20306. doi:10.1371/journal.pone.0020306
- Mullen B, Champagne T, Krishnamurty S, et al. Exploring the safety and therapeutic effects of deep pressure stimulation using a weighted blanket. Occup Ther Ment Health. 2008;24:65-89. doi:10.1300/ J004v24n01_05
- Chen HY, Yang H, Chi HJ, et al. Physiological effects of deep touch pressure on anxiety alleviation: the weighted blanket approach. J Med Biol Eng. 2013;33:463-470. doi:10.5405/jmbe.1043
- Chen HY, Yang H, Meng LF, et al. Effect of deep pressure input on parasympathetic system in patients with wisdom tooth surgery. J Formos Med Assoc. 2016;115:853-859. doi:10.1016 /j.jfma.2016.07.008
- Vinson J, Powers J, Mosesso K. Weighted blankets: anxiety reduction in adult patients receiving chemotherapy. Clin J Oncol Nurs. 2020; 24:360-368. doi:10.1188/20.CJON.360-368
- Champagne T, Mullen B, Dickson D, et al. Evaluating the safety and effectiveness of the weighted blanket with adults during an inpatient mental health hospitalization. Occup Ther Ment Health. 2015;31:211-233. doi:10.1080/0164212X.2015.1066220
- Lane RD, McRae K, Reiman EM, et al. Neural correlates of heart rate variability during emotion. Neuroimage. 2009;44:213-222. doi: 10.1016/j.neuroimage.2008.07.056
- Moyer CA, Rounds J, Hannum JW. A meta-analysis of massage therapy research. Psychol Bull. 2004;130:3-18. doi: 10.1037 /0033-2909.130.1.3
Weighted Blankets May Help Reduce Preoperative Anxiety During Mohs Micrographic Surgery
Weighted Blankets May Help Reduce Preoperative Anxiety During Mohs Micrographic Surgery
PRACTICE POINTS
- Preoperative anxiety in patients during Mohs micrographic surgery (MMS) may increase intraoperative bleeding, complication rates, and recovery times.
- Using weighted blankets may reduce anxiety in patients undergoing MMS of the head and neck.

Impact of NSAID Use on Bleeding Rates for Patients Taking Rivaroxaban or Apixaban
Impact of NSAID Use on Bleeding Rates for Patients Taking Rivaroxaban or Apixaban
Clinical practice has shifted from vitamin K antagonists to direct oral anticoagulants (DOACs) for atrial fibrillation treatment due to their more favorable risk-benefit profile and less lifestyle modification required.1,2 However, the advantage of a lower bleeding risk with DOACs could be compromised by potentially problematic pharmacokinetic interactions like those conferred by antiplatelets or nonsteroidal anti-inflammatory drugs (NSAIDs).3,4 Treating a patient needing anticoagulation with a DOAC who has comorbidities may introduce unavoidable drug-drug interactions. This particularly happens with over-the-counter and prescription NSAIDs used for the management of pain and inflammatory conditions.5
NSAIDs primarily affect 2 cyclooxygenase (COX) enzyme isomers, COX-1 and COX-2.6 COX-1 helps maintain gastrointestinal (GI) mucosa integrity and platelet aggregation processes, whereas COX-2 is engaged in pain signaling and inflammation mediation. COX-1 inhibition is associated with more bleeding-related adverse events (AEs), especially in the GI tract. COX-2 inhibition is thought to provide analgesia and anti-inflammatory properties without elevating bleeding risk. This premise is responsible for the preferential use of celecoxib, a COX-2 selective NSAID, which should confer a lower bleeding risk compared to nonselective NSAIDs such as ibuprofen and naproxen.7 NSAIDs have been documented as independent risk factors for bleeding. NSAID users are about 3 times as likely to develop GI AEs compared to nonNSAID users.8
Many clinicians aim to further mitigate NSAID-associated bleeding risk by coprescribing a proton pump inhibitor (PPI). PPIs provide gastroprotection against NSAID-induced mucosal injury and sequential complication of GI bleeding. In a multicenter randomized control trial, patients who received concomitant PPI therapy while undergoing chronic NSAID therapy—including nonselective and COX-2 selective NSAIDs—had a significantly lower risk of GI ulcer development (placebo, 17.0%; 20 mg esomeprazole, 5.2%; 40 mg esomeprazole, 4.6%).9 Current clinical guidelines for preventing NSAIDassociated bleeding complications recommend using a COX-2 selective NSAID in combination with PPI therapy for patients at high risk for GI-related bleeding, including the concomitant use of anticoagulants.10
There is evidence suggesting an increased bleeding risk with NSAIDs when used in combination with vitamin K antagonists such as warfarin.11,12 A systematic review of warfarin and concomitant NSAID use found an increased risk of overall bleeding with NSAID use in combination with warfarin (odds ratio 1.58; 95% CI, 1.18-2.12), compared to warfarin alone.12
Posthoc analyses of randomized clinical trials have also demonstrated an increased bleeding risk with oral anticoagulation and concomitant NSAID use.13,14 In the RE-LY trial, NSAID users on warfarin or dabigatran had a statistically significant increased risk of major bleeding compared to non-NSAID users (hazard ratio [HR] 1.68; 95% CI, 1.40- 2.02; P < .001).13 In the ARISTOTLE trial, patients on warfarin or apixaban who were incident NSAID users were found to have an increased risk of major bleeding (HR 1.61; 95% CI, 1.11-2.33) and clinically relevant nonmajor bleeding (HR 1.70; 95% CI, 1.16- 2.48).14 These trials found a statistically significant increased bleeding risk associated with NSAID use, though the populations evaluated included patients taking warfarin and patients taking DOACs. These trials did not evaluate the bleeding risk of concomitant NSAID use among DOACs alone.
Evidence on NSAID-associated bleeding risk with DOACs is lacking in settings where the patient population, prescribing practices, and monitoring levels are variable. Within the Veterans Health Administration, clinical pharmacist practitioners (CPPs) in anticoagulation clinics oversee DOAC therapy management. CPPs monitor safety and efficacy of DOAC therapies through a population health management tool, the DOAC Dashboard.15 The DOAC Dashboard creates alerts for patients who may require an intervention based on certain clinical parameters, such as drug-drug interactions.16 Whenever a patient on a DOAC is prescribed an NSAID, an alert is generated on the DOAC Dashboard to flag the CPPs for the potential need for an intervention. If NSAID therapy remains clinically indicated, CPPs may recommend risk reduction strategies such as a COX-2 selective NSAID or coprescribing a PPI.10
The DOAC Dashboard provides an ideal setting for investigating the effects of NSAID use, NSAID selectivity, and PPI coprescribing on DOAC bleeding rates. With an increasing population of patients receiving anticoagulation therapy with a DOAC, more guidance regarding the bleeding risk of concomitant NSAID use with DOACs is needed. Studies evaluating the bleeding risk with concomitant NSAID use in patients on a DOAC alone are limited. This is the first study to date to compare bleeding risk with concomitant NSAID use between DOACs. This study provides information on bleeding risk with NSAID use among commonly prescribed DOACs, rivaroxaban and apixaban, and the potential impacts of current risk reduction strategies.
METHODS
This single-center retrospective cohort review was performed using the electronic health records (EHRs) of patients enrolled in the US Department of Veterans Affairs (VA) Mountain Home Healthcare System who received rivaroxaban or apixaban from December 2020 to December 2022. This study received approval from the East Tennessee State University/VA Institutional Review Board committee.
Patients were identified through the DOAC Dashboard, aged 21 to 100 years, and received rivaroxaban or apixaban at a therapeutic dose: rivaroxaban 10 to 20 mg daily or apixaban 2.5 to 5 mg twice daily. Patients were excluded if they were prescribed dual antiplatelet therapy, received rivaroxaban at dosing indicated for peripheral vascular disease, were undergoing dialysis, had evidence of moderate to severe hepatic impairment or any hepatic disease with coagulopathy, were undergoing chemotherapy or radiation, or had hematological conditions with predisposed bleeding risk. These patients were excluded to mitigate the potential confounding impact from nontherapeutic DOAC dosing strategies and conditions associated with an increased bleeding risk.
Eligible patients were stratified based on NSAID use. NSAID users were defined as patients prescribed an oral NSAID, including both acute and chronic courses, at any point during the study time frame while actively on a DOAC. Bleeding events were reviewed to evaluate rates between rivaroxaban and apixaban among NSAID and nonNSAID users. Identified NSAID users were further assessed for NSAID selectivity and PPI coprescribing as a subgroup analysis for the secondary assessment.
Data Collection
Baseline data were collected, including age, body mass index, anticoagulation indication, DOAC agent, DOAC dose, and DOAC total daily dose. Baseline serum creatinine levels, liver function tests, hemoglobin levels, and platelet counts were collected from the most recent data available immediately prior to the bleeding event, if applicable.
The DOAC Dashboard was reviewed for active and dismissed drug interaction alerts to identify patients taking rivaroxaban or apixaban who were prescribed an NSAID. Patients were categorized in the NSAID group if an interacting drug alert with an NSAID was reported during the study time frame. Data available through the interacting drug alerts on NSAID use were limited to the interacting drug name and date of the reported flag. Manual EHR review was required to confirm dates of NSAID therapy initiation and NSAID discontinuation, if applicable.
Data regarding concomitant antiplatelet use were obtained through review of the active and dismissed drug interaction alerts on the DOAC Dashboard. Concomitant antiplatelet use was defined as the prescribing of a single antiplatelet agent at any point while receiving DOAC therapy. Data on concomitant antiplatelets were collected regardless of NSAID status.
Data on coprescribed PPI therapy were obtained through manual EHR review of identified NSAID users. Coprescribed PPI therapy was defined as the prescribing of a PPI at any point during NSAID therapy. Data regarding PPI use among non-NSAID users were not collected because the secondary endpoint was designed to assess PPI use only among patients coprescribed a DOAC and NSAID.
Outcomes
Bleeding events were identified through an outcomes report generated by the DOAC Dashboard based on International Classification of Diseases, Tenth Revision diagnosis codes associated with a bleeding event. The outcomes report captures diagnoses from the outpatient and inpatient care settings. Reported bleeding events were limited to patients who received a DOAC at any point in the 6 months prior to the event and excluded patients with recent DOAC initiation within 7 days of the event, as these patients are not captured on the DOAC Dashboard.
All reported bleeding events were manually reviewed in the EHR and categorized as a major or clinically relevant nonmajor bleed, according to International Society of Thrombosis and Haemostasis criteria. Validated bleeding events were then crossreferenced with the interacting drug alerts report to identify events with potentially overlapping NSAID therapy at the time of the event. Overlapping NSAID therapy was defined as the prescribing of an NSAID at any point in the 6 months prior to the event. All events with potential overlapping NSAID therapies were manually reviewed for confirmation of NSAID status at the time of the event.
The primary endpoint was a composite of any bleeding event per International Society of Thrombosis and Haemostasis criteria. The secondary endpoint evaluated the potential impact of NSAID selectivity or PPI coprescribing on the bleeding rate among the NSAID user groups.
Statistical Analysis
Analyses were performed consistent with the methods used in the ARISTOTLE and RE-LY trials. It was determined that a sample size of 504 patients, with ≥ 168 patients in each group, would provide 80% power using a 2-sided a of 0.05. HRs with 95% CIs and respective P values were calculated using a SPSS-adapted online calculator.
RESULTS
The DOAC Dashboard identified 681 patients on rivaroxaban and 3225 patients on apixaban; 72 patients on rivaroxaban (10.6%) and 300 patients on apixaban (9.3%) were NSAID users. The mean age of NSAID users was 66.9 years in the rivaroxaban group and 72.4 years in the apixaban group. The mean age of non-NSAID users was 71.5 years in the rivaroxaban group and 75.6 years in the apixaban group. No appreciable differences were observed among subgroups in body mass index, renal function, hepatic function, hemoglobin, or platelet counts, and no statistically significant differences were identified (Table 1). Antiplatelet agents identified included aspirin, clopidogrel, prasugrel, and ticagrelor. Fifteen patients (20.3%) in the rivaroxaban group and 87 patients (28.7%) in the apixaban group had concomitant antiplatelet and NSAID use. Forty-five patients on rivaroxaban (60.8%) and 170 (55.9%) on apixaban were prescribed concomitant PPI and NSAID at baseline. Among non-NSAID users, there was concomitant antiplatelet use for 265 patients (43.6%) in the rivaroxaban group and 1401 patients (47.9%) in the apixaban group. Concomitant PPI use was identified among 63 patients (60.0%) taking selective NSAIDs and 182 (57.2%) taking nonselective NSAIDs.
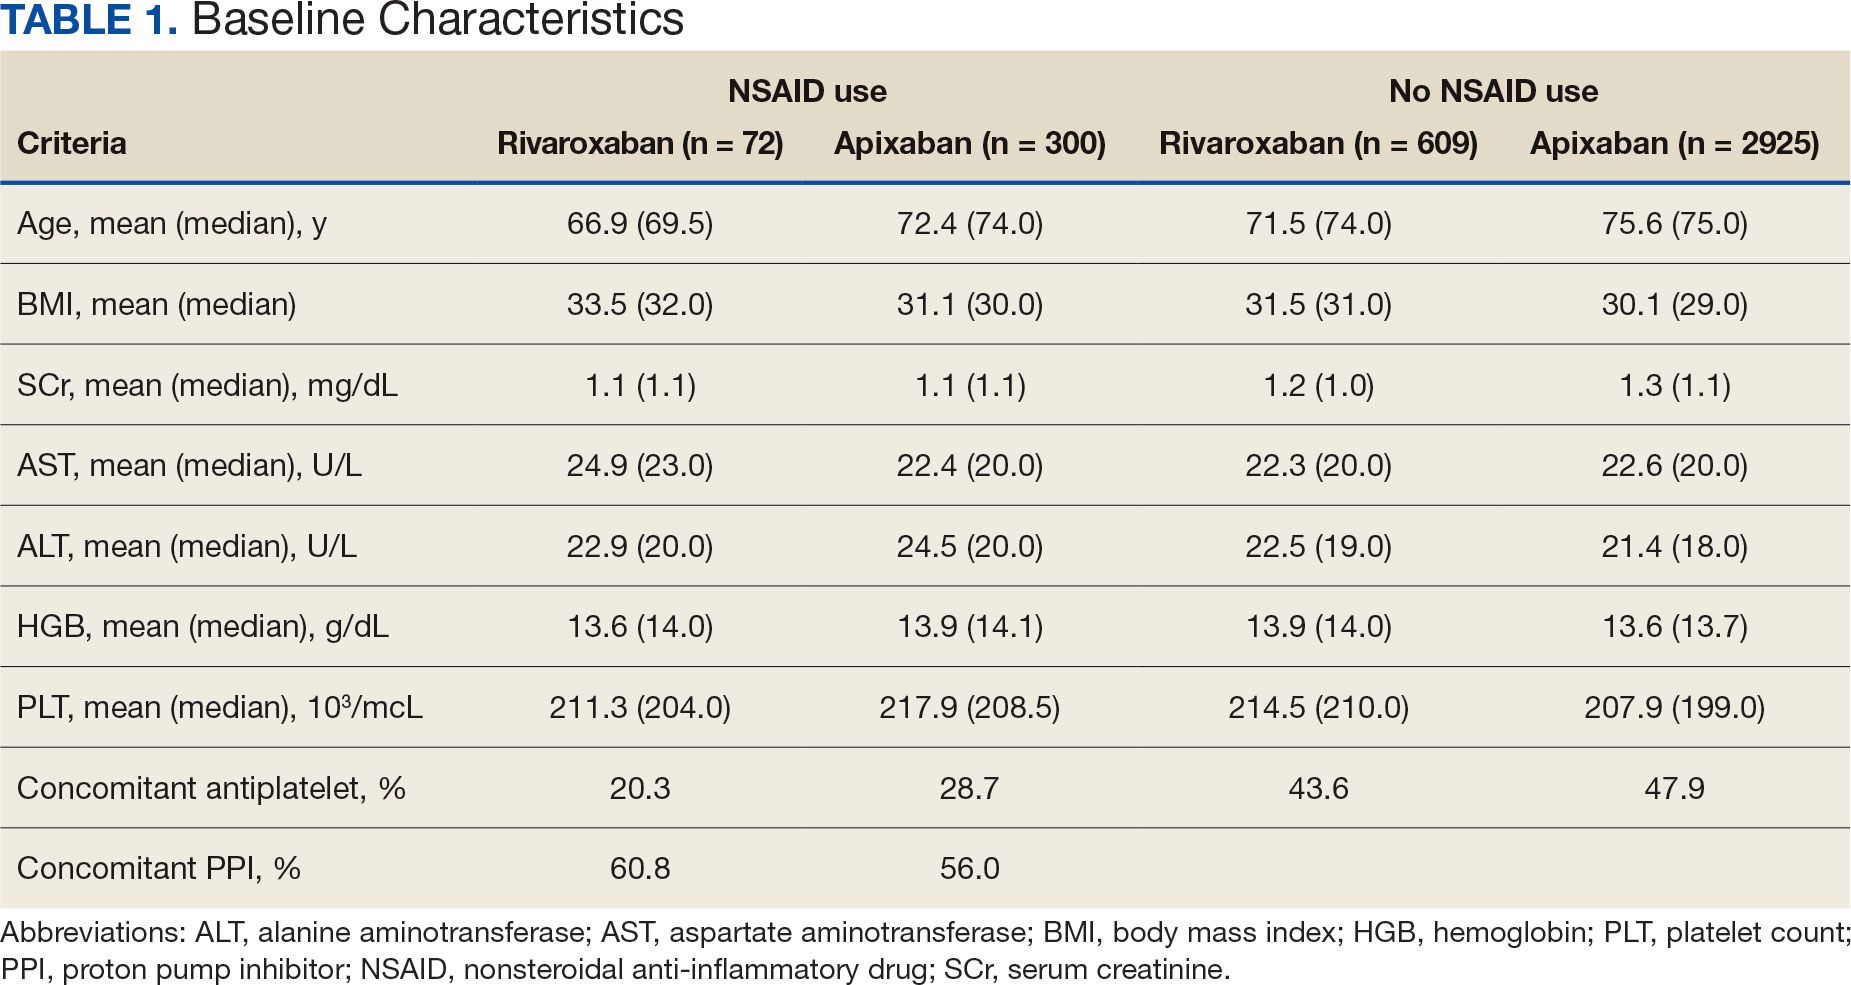
A total of 423 courses of NSAIDs were identified: 85 NSAID courses in the rivaroxaban group and 338 NSAID courses in the apixaban group. Most NSAID courses involved a nonselective NSAID in the rivaroxaban and apixaban NSAID user groups: 75.2% (n = 318) aggregately compared to 71.8% (n = 61) and 76.0% (n = 257) in the rivaroxaban and apixaban groups, respectively. The most frequent NSAID courses identified were meloxicam (26.7%; n = 113), celecoxib (24.8%; n = 105), ibuprofen (19.1%; n = 81), and naproxen (13.5%; n = 57). Data regarding NSAID therapy initiation and discontinuation dates were not readily available. As a result, the duration of NSAID courses was not captured.
There was no statistically significant difference in bleeding rates between rivaroxaban and apixaban among NSAID users (HR 1.04; 95% CI, 0.98-1.12) or non-NSAID users (HR 1.15; 95% CI, 0.80-1.66) (Table 2). Apixaban non-NSAID users had a higher rate of major bleeds (HR 0.32; 95% CI, 0.17-0.61) while rivaroxaban non-NSAID users had a higher rate of clinically relevant nonmajor bleeds (HR 1.63; 95% CI, 1.10-2.54).
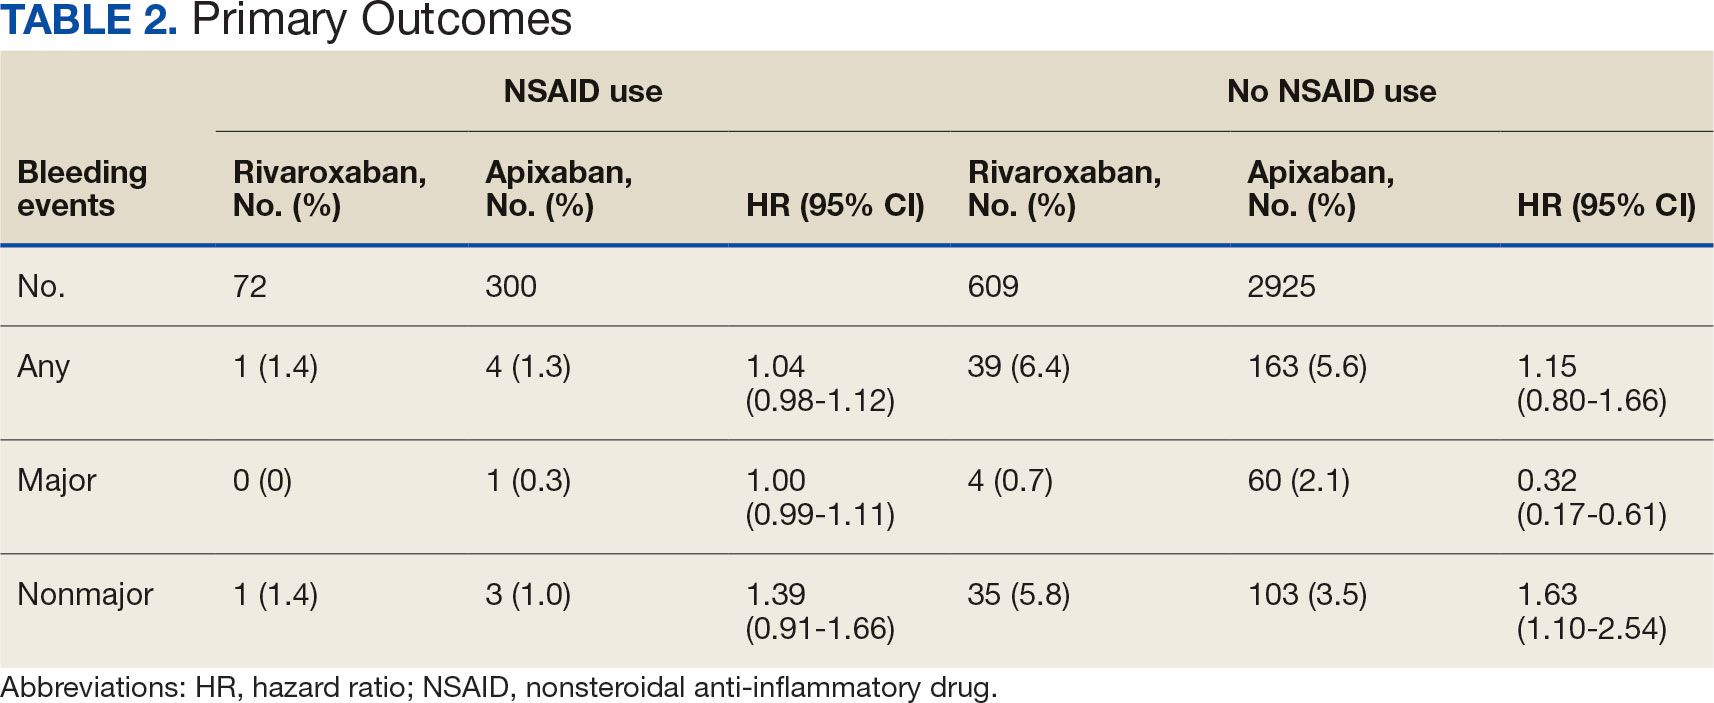
The sample size for the secondary endpoint consisted of bleeding events that were confirmed to have had an overlapping NSAID prescribed at the time of the event. For this secondary assessment, there was 1 rivaroxaban NSAID user bleeding event and 4 apixaban NSAID user bleeding events. For the rivaroxaban NSAID user bleeding event, the NSAID was nonselective and a PPI was not coprescribed. For the apixaban NSAID user bleeding events, 2 NSAIDs were nonselective and 2 were selective. All patients with apixaban and NSAID bleeding events had a coprescribed PPI. There was no clinically significant difference in the bleeding rates observed for NSAID selectivity or PPI coprescribing among the NSAID user subgroups.
DISCUSSION
This study found that there was no statistically significant difference for bleeding rates of major and nonmajor bleeding events between rivaroxaban and apixaban among NSAID users and non-NSAID users. This study did not identify a clinically significant impact on bleeding rates from NSAID selectivity or PPI coprescribing among the NSAID users.
There were notable but not statistically significant differences in baseline characteristics observed between the NSAID and non-NSAID user groups. On average, the rivaroxaban and apixaban NSAID users were younger compared with those not taking NSAIDs. NSAIDs, specifically nonselective NSAIDs, are recognized as potentially inappropriate medications for older adults given that this population is at an increased risk for GI ulcer development and/or GI bleeding.17 The non-NSAID user group likely consisted of older patients compared to the NSAID user group as clinicians may avoid prescribing NSAIDs to older adults regardless of concomitant DOAC therapy.
In addition to having an older patient population, non-NSAID users were more frequently prescribed a concomitant antiplatelet when compared with NSAID users. This prescribing pattern may be due to clinicians avoiding the use of NSAIDs in patients receiving DOAC therapy in combination with antiplatelet therapy, as these patients have been found to have an increased bleeding rate compared to DOAC therapy alone.18
Non-NSAID users had an overall higher bleeding rate for both major and nonmajor bleeding events. Based on this observation, it could be hypothesized that antiplatelet agents have a higher risk of bleeding in comparison to NSAIDs. In a subanalysis of the EXPAND study evaluating risk factors of major bleeding in patients receiving rivaroxaban, concomitant use of antiplatelet agents demonstrated a statistically significant increased risk of bleeding (HR 1.6; 95% CI, 1.2-2.3; P = .003) while concomitant use of NSAIDs did not (HR 0.8; 95% CI, 0.3-2.2; P = .67).19
In assessing PPI status at baseline, a majority of both rivaroxaban and apixaban NSAID users were coprescribed a PPI. This trend aligns with current clinical guideline recommendations for the prescribing of PPI therapy for GI protection in high-risk patients, such as those on DOAC therapy and concomitant NSAID therapy.10 Given the high proportion of NSAID users coprescribed a PPI at baseline, it may be possible that the true incidence of NSAID-associated bleeding events was higher than what this study found. This observation may reflect the impact from timely implementation of risk mitigation strategies by CPPs in the anticoagulation clinic. However, this study was not constructed to assess the efficacy of PPI use in this manner.
It is important to note the patients included in this study were followed by a pharmacist in an anticoagulation clinic using the DOAC Dashboard.15 This population management tool allows CPPs to make proactive interventions when a patient taking a DOAC receives an NSAID prescription, such as recommending the coprescribing of a PPI or use of a selective NSAID.10,16 These standards of care may have contributed to an overall reduced bleeding rate among the NSAID user group and may not be reflective of private practice.
The planned analysis of this study was modeled after the posthoc analysis of the RE-LY and ARISTOTLE trials. Both trials demonstrated an increased risk of bleeding with oral anticoagulation, including DOAC and warfarin, in combination with NSAID use. However, both trials found that NSAID use in patients treated with a DOAC was not independently associated with increased bleeding events compared with warfarin.13,14 The results of this study are comparable to the RE-LY and ARISTOTLE findings that NSAID use among patients treated with rivaroxaban or apixaban did not demonstrate a statistically significant increased bleeding risk.
Studies of NSAID use in combination with DOAC therapy have been limited to patient populations consisting of both DOAC and warfarin. Evidence from these trials outlines the increased bleeding risk associated with NSAID use in combination with oral anticoagulation; however, these patient populations include those on a DOAC and warfarin.13,14,19,20 Given the limited evidence on NSAID use among DOACs alone, it is assumed NSAID use in combination with DOACs has a similar risk of bleeding as warfarin use. This may cause clinicians to automatically exclude NSAID therapy as a treatment option for patients on a DOAC who are otherwise clinically appropriate candidates, such as those with underlying inflammatory conditions. Avoiding NSAID therapy in this patient population may lead to suboptimal pain management and increase the risk of patient harm from methods such as inappropriate opioid therapy prescribing.
DOAC therapy should not be a universal limitation to the use of NSAIDs. Although the risk of bleeding with NSAID therapy is always present, deliberate NSAID prescribing in addition to the timely implementation of risk mitigation strategies may provide an avenue for safe NSAID prescribing in patients receiving a DOAC. A population health-based approach to DOAC management, such as the DOAC Dashboard, appears to be effective at preventing patient harm when NSAIDs are prescribed in conjunction with DOACs.
Limitations
The DOAC Dashboard has been shown to be effective and efficient at monitoring DOAC therapy from a population-based approach.16 Reports generated through the DOAC Dashboard provide convenient access to patient data which allows for timely interventions; however, there are limits to its use for data collection. All the data elements necessary to properly assess bleeding risk with validated tools, such as HAS-BLED (hypertension, abnormal renal/liver function, stroke, bleeding history or predisposition, labile international normalized ratio, elderly, drugs/ alcohol concomitantly), are not available on DOAC Dashboard reports. Due to this constraint, bleeding risk assessments were not conducted at baseline and this study was unable to include risk modeling. Additionally, data elements like initiation and discontinuation dates and duration of therapies were not readily available. As a result, this study was unable to incorporate time as a data point.
This was a retrospective study that relied on manual review of chart documentation to verify bleeding events, but data obtained through the DOAC Dashboard were transferred directly from the EHR.15 Bleeding events available for evaluation were restricted to those that occurred at a VA facility. Additionally, the sample size within the rivaroxaban NSAID user group did not reach the predefined sample size required to reach power and may have been too small to detect a difference if one did exist. The secondary assessment had a low sample size of NSAID user bleeding events, making it difficult to fully assess its impact on NSAID selectivity and PPI coprescribing on bleeding rates. All courses of NSAIDs were equally valued regardless of the dose or therapy duration; however, this is consistent with how NSAID use was defined in the RE-LY and ARISTOTLE trials.
CONCLUSIONS
This retrospective cohort review found no statistically significant difference in the composite bleeding rates between rivaroxaban and apixaban among NSAID users and non-NSAID users. Moreover, there was no clinically significant impact observed for bleeding rates in regard to NSAID selectivity and PPI coprescribing among NSAID users. However, coprescribing of PPI therapy to patients on a DOAC who are clinically indicated for an NSAID may reduce the risk of bleeding. Population health management tools, such as the DOAC Dashboard, may also allow clinicians to safely prescribe NSAIDs to patients on a DOAC. Further large-scale observational studies are needed to quantify the real-world risk of bleeding with concomitant NSAID use among DOACs alone and to evaluate the impact from NSAID selectivity or PPI coprescribing.
- Ruff CT, Giugliano RP, Braunwald E, et al. Comparison of the efficacy and safety of new oral anticoagulants with warfarin in patients with atrial fibrillation: a meta-analysis of randomised trials. Lancet. 2014;383(9921):955-962. doi:10.1016/S0140-6736(13)62343-0
- Ageno W, Gallus AS, Wittkowsky A, Crowther M, Hylek EM, Palareti G. Oral anticoagulant therapy: antithrombotic therapy and prevention of thrombosis, 9th ed: American College of Chest Physicians Evidence-Based Clinical Practice Guidelines. Chest. 2012;141(2 Suppl):e44S-e88S. doi:10.1378/chest.11-2292
- Eikelboom J, Merli G. Bleeding with direct oral anticoagulants vs warfarin: clinical experience. Am J Med. 2016;129(11S):S33-S40. doi:10.1016/j.amjmed.2016.06.003
- Vranckx P, Valgimigli M, Heidbuchel H. The significance of drug-drug and drug-food interactions of oral anticoagulation. Arrhythm Electrophysiol Rev. 2018;7(1):55-61. doi:10.15420/aer.2017.50.1
- Davis JS, Lee HY, Kim J, et al. Use of non-steroidal antiinflammatory drugs in US adults: changes over time and by demographic. Open Heart. 2017;4(1):e000550. doi:10.1136/openhrt-2016-000550
- Schafer AI. Effects of nonsteroidal antiinflammatory drugs on platelet function and systemic hemostasis. J Clin Pharmacol. 1995;35(3):209-219. doi:10.1002/j.1552-4604.1995.tb04050.x
- Al-Saeed A. Gastrointestinal and cardiovascular risk of nonsteroidal anti-inflammatory drugs. Oman Med J. 2011;26(6):385-391. doi:10.5001/omj.2011.101
- Gabriel SE, Jaakkimainen L, Bombardier C. Risk for serious gastrointestinal complications related to use of nonsteroidal anti-inflammatory drugs. Ann Intern Med. 1991;115(10):787-796. doi:10.7326/0003-4819-115-10-787
- Scheiman JM, Yeomans ND, Talley NJ, et al. Prevention of ulcers by esomeprazole in at-risk patients using non-selective NSAIDs and COX-2 inhibitors. Am J Gastroenterol. 2006;101(4):701-710. doi:10.1111/j.1572-0241.2006.00499.x
- Freedberg DE, Kim LS, Yang YX. The risks and benefits of long-term use of proton pump inhibitors: expert review and best practice advice from the American Gastroenterological Association. Gastroenterology. 2017;152(4):706-715. doi:10.1053/j.gastro.2017.01.031
- Lamberts M, Lip GYH, Hansen ML, et al. Relation of nonsteroidal anti-inflammatory drugs to serious bleeding and thromboembolism risk in patients with atrial fibrillation receiving antithrombotic therapy: a nationwide cohort study. Ann Intern Med. 2014;161(10):690-698. doi:10.7326/M13-1581
- Villa Zapata L, Hansten PD, Panic J, et al. Risk of bleeding with exposure to warfarin and nonsteroidal anti-inflammatory drugs: a systematic review and metaanalysis. Thromb Haemost. 2020;120(7):1066-1074. doi:10.1055/s-0040-1710592
- Kent AP, Brueckmann M, Fraessdorf M, et al. Concomitant oral anticoagulant and nonsteroidal anti-inflammatory drug therapy in patients with atrial fibrillation. J Am Coll Cardiol. 2018;72(3):255-267. doi:10.1016/j.jacc.2018.04.063
- Dalgaard F, Mulder H, Wojdyla DM, et al. Patients with atrial fibrillation taking nonsteroidal antiinflammatory drugs and oral anticoagulants in the ARISTOTLE Trial. Circulation. 2020;141(1):10-20. doi:10.1161/CIRCULATIONAHA.119.041296
- Allen AL, Lucas J, Parra D, et al. Shifting the paradigm: a population health approach to the management of direct oral anticoagulants. J Am Heart Asssoc. 2021;10(24):e022758. doi:10.1161/JAHA.121.022758
- . Valencia D, Spoutz P, Stoppi J, et al. Impact of a direct oral anticoagulant population management tool on anticoagulation therapy monitoring in clinical practice. Ann Pharmacother. 2019;53(8):806-811. doi:10.1177/1060028019835843
- By the 2023 American Geriatrics Society Beers Criteria® Update Expert Panel. American Geriatrics Society 2023 Updated AGS Beers Criteria® for potentially inappropriate medication use in older adults. J Am Geriatr Soc. 2023;71(7):2052-2081. doi:10.1111/jgs.18372
- Kumar S, Danik SB, Altman RK, et al. Non-vitamin K antagonist oral anticoagulants and antiplatelet therapy for stroke prevention in patients with atrial fibrillation. Cardiol Rev. 2016;24(5):218-223. doi:10.1097/CRD.0000000000000088
- Sakuma I, Uchiyama S, Atarashi H, et al. Clinical risk factors of stroke and major bleeding in patients with nonvalvular atrial fibrillation under rivaroxaban: the EXPAND study sub-analysis. Heart Vessels. 2019;34(11):1839-1851. doi:10.1007/s00380-019-01425-x
- Davidson BL, Verheijen S, Lensing AWA, et al. Bleeding risk of patients with acute venous thromboembolism taking nonsteroidal anti-inflammatory drugs or aspirin. JAMA Intern Med. 2014;174(6):947-953. doi:10.1001/jamainternmed.2014.946
Clinical practice has shifted from vitamin K antagonists to direct oral anticoagulants (DOACs) for atrial fibrillation treatment due to their more favorable risk-benefit profile and less lifestyle modification required.1,2 However, the advantage of a lower bleeding risk with DOACs could be compromised by potentially problematic pharmacokinetic interactions like those conferred by antiplatelets or nonsteroidal anti-inflammatory drugs (NSAIDs).3,4 Treating a patient needing anticoagulation with a DOAC who has comorbidities may introduce unavoidable drug-drug interactions. This particularly happens with over-the-counter and prescription NSAIDs used for the management of pain and inflammatory conditions.5
NSAIDs primarily affect 2 cyclooxygenase (COX) enzyme isomers, COX-1 and COX-2.6 COX-1 helps maintain gastrointestinal (GI) mucosa integrity and platelet aggregation processes, whereas COX-2 is engaged in pain signaling and inflammation mediation. COX-1 inhibition is associated with more bleeding-related adverse events (AEs), especially in the GI tract. COX-2 inhibition is thought to provide analgesia and anti-inflammatory properties without elevating bleeding risk. This premise is responsible for the preferential use of celecoxib, a COX-2 selective NSAID, which should confer a lower bleeding risk compared to nonselective NSAIDs such as ibuprofen and naproxen.7 NSAIDs have been documented as independent risk factors for bleeding. NSAID users are about 3 times as likely to develop GI AEs compared to nonNSAID users.8
Many clinicians aim to further mitigate NSAID-associated bleeding risk by coprescribing a proton pump inhibitor (PPI). PPIs provide gastroprotection against NSAID-induced mucosal injury and sequential complication of GI bleeding. In a multicenter randomized control trial, patients who received concomitant PPI therapy while undergoing chronic NSAID therapy—including nonselective and COX-2 selective NSAIDs—had a significantly lower risk of GI ulcer development (placebo, 17.0%; 20 mg esomeprazole, 5.2%; 40 mg esomeprazole, 4.6%).9 Current clinical guidelines for preventing NSAIDassociated bleeding complications recommend using a COX-2 selective NSAID in combination with PPI therapy for patients at high risk for GI-related bleeding, including the concomitant use of anticoagulants.10
There is evidence suggesting an increased bleeding risk with NSAIDs when used in combination with vitamin K antagonists such as warfarin.11,12 A systematic review of warfarin and concomitant NSAID use found an increased risk of overall bleeding with NSAID use in combination with warfarin (odds ratio 1.58; 95% CI, 1.18-2.12), compared to warfarin alone.12
Posthoc analyses of randomized clinical trials have also demonstrated an increased bleeding risk with oral anticoagulation and concomitant NSAID use.13,14 In the RE-LY trial, NSAID users on warfarin or dabigatran had a statistically significant increased risk of major bleeding compared to non-NSAID users (hazard ratio [HR] 1.68; 95% CI, 1.40- 2.02; P < .001).13 In the ARISTOTLE trial, patients on warfarin or apixaban who were incident NSAID users were found to have an increased risk of major bleeding (HR 1.61; 95% CI, 1.11-2.33) and clinically relevant nonmajor bleeding (HR 1.70; 95% CI, 1.16- 2.48).14 These trials found a statistically significant increased bleeding risk associated with NSAID use, though the populations evaluated included patients taking warfarin and patients taking DOACs. These trials did not evaluate the bleeding risk of concomitant NSAID use among DOACs alone.
Evidence on NSAID-associated bleeding risk with DOACs is lacking in settings where the patient population, prescribing practices, and monitoring levels are variable. Within the Veterans Health Administration, clinical pharmacist practitioners (CPPs) in anticoagulation clinics oversee DOAC therapy management. CPPs monitor safety and efficacy of DOAC therapies through a population health management tool, the DOAC Dashboard.15 The DOAC Dashboard creates alerts for patients who may require an intervention based on certain clinical parameters, such as drug-drug interactions.16 Whenever a patient on a DOAC is prescribed an NSAID, an alert is generated on the DOAC Dashboard to flag the CPPs for the potential need for an intervention. If NSAID therapy remains clinically indicated, CPPs may recommend risk reduction strategies such as a COX-2 selective NSAID or coprescribing a PPI.10
The DOAC Dashboard provides an ideal setting for investigating the effects of NSAID use, NSAID selectivity, and PPI coprescribing on DOAC bleeding rates. With an increasing population of patients receiving anticoagulation therapy with a DOAC, more guidance regarding the bleeding risk of concomitant NSAID use with DOACs is needed. Studies evaluating the bleeding risk with concomitant NSAID use in patients on a DOAC alone are limited. This is the first study to date to compare bleeding risk with concomitant NSAID use between DOACs. This study provides information on bleeding risk with NSAID use among commonly prescribed DOACs, rivaroxaban and apixaban, and the potential impacts of current risk reduction strategies.
METHODS
This single-center retrospective cohort review was performed using the electronic health records (EHRs) of patients enrolled in the US Department of Veterans Affairs (VA) Mountain Home Healthcare System who received rivaroxaban or apixaban from December 2020 to December 2022. This study received approval from the East Tennessee State University/VA Institutional Review Board committee.
Patients were identified through the DOAC Dashboard, aged 21 to 100 years, and received rivaroxaban or apixaban at a therapeutic dose: rivaroxaban 10 to 20 mg daily or apixaban 2.5 to 5 mg twice daily. Patients were excluded if they were prescribed dual antiplatelet therapy, received rivaroxaban at dosing indicated for peripheral vascular disease, were undergoing dialysis, had evidence of moderate to severe hepatic impairment or any hepatic disease with coagulopathy, were undergoing chemotherapy or radiation, or had hematological conditions with predisposed bleeding risk. These patients were excluded to mitigate the potential confounding impact from nontherapeutic DOAC dosing strategies and conditions associated with an increased bleeding risk.
Eligible patients were stratified based on NSAID use. NSAID users were defined as patients prescribed an oral NSAID, including both acute and chronic courses, at any point during the study time frame while actively on a DOAC. Bleeding events were reviewed to evaluate rates between rivaroxaban and apixaban among NSAID and nonNSAID users. Identified NSAID users were further assessed for NSAID selectivity and PPI coprescribing as a subgroup analysis for the secondary assessment.
Data Collection
Baseline data were collected, including age, body mass index, anticoagulation indication, DOAC agent, DOAC dose, and DOAC total daily dose. Baseline serum creatinine levels, liver function tests, hemoglobin levels, and platelet counts were collected from the most recent data available immediately prior to the bleeding event, if applicable.
The DOAC Dashboard was reviewed for active and dismissed drug interaction alerts to identify patients taking rivaroxaban or apixaban who were prescribed an NSAID. Patients were categorized in the NSAID group if an interacting drug alert with an NSAID was reported during the study time frame. Data available through the interacting drug alerts on NSAID use were limited to the interacting drug name and date of the reported flag. Manual EHR review was required to confirm dates of NSAID therapy initiation and NSAID discontinuation, if applicable.
Data regarding concomitant antiplatelet use were obtained through review of the active and dismissed drug interaction alerts on the DOAC Dashboard. Concomitant antiplatelet use was defined as the prescribing of a single antiplatelet agent at any point while receiving DOAC therapy. Data on concomitant antiplatelets were collected regardless of NSAID status.
Data on coprescribed PPI therapy were obtained through manual EHR review of identified NSAID users. Coprescribed PPI therapy was defined as the prescribing of a PPI at any point during NSAID therapy. Data regarding PPI use among non-NSAID users were not collected because the secondary endpoint was designed to assess PPI use only among patients coprescribed a DOAC and NSAID.
Outcomes
Bleeding events were identified through an outcomes report generated by the DOAC Dashboard based on International Classification of Diseases, Tenth Revision diagnosis codes associated with a bleeding event. The outcomes report captures diagnoses from the outpatient and inpatient care settings. Reported bleeding events were limited to patients who received a DOAC at any point in the 6 months prior to the event and excluded patients with recent DOAC initiation within 7 days of the event, as these patients are not captured on the DOAC Dashboard.
All reported bleeding events were manually reviewed in the EHR and categorized as a major or clinically relevant nonmajor bleed, according to International Society of Thrombosis and Haemostasis criteria. Validated bleeding events were then crossreferenced with the interacting drug alerts report to identify events with potentially overlapping NSAID therapy at the time of the event. Overlapping NSAID therapy was defined as the prescribing of an NSAID at any point in the 6 months prior to the event. All events with potential overlapping NSAID therapies were manually reviewed for confirmation of NSAID status at the time of the event.
The primary endpoint was a composite of any bleeding event per International Society of Thrombosis and Haemostasis criteria. The secondary endpoint evaluated the potential impact of NSAID selectivity or PPI coprescribing on the bleeding rate among the NSAID user groups.
Statistical Analysis
Analyses were performed consistent with the methods used in the ARISTOTLE and RE-LY trials. It was determined that a sample size of 504 patients, with ≥ 168 patients in each group, would provide 80% power using a 2-sided a of 0.05. HRs with 95% CIs and respective P values were calculated using a SPSS-adapted online calculator.
RESULTS
The DOAC Dashboard identified 681 patients on rivaroxaban and 3225 patients on apixaban; 72 patients on rivaroxaban (10.6%) and 300 patients on apixaban (9.3%) were NSAID users. The mean age of NSAID users was 66.9 years in the rivaroxaban group and 72.4 years in the apixaban group. The mean age of non-NSAID users was 71.5 years in the rivaroxaban group and 75.6 years in the apixaban group. No appreciable differences were observed among subgroups in body mass index, renal function, hepatic function, hemoglobin, or platelet counts, and no statistically significant differences were identified (Table 1). Antiplatelet agents identified included aspirin, clopidogrel, prasugrel, and ticagrelor. Fifteen patients (20.3%) in the rivaroxaban group and 87 patients (28.7%) in the apixaban group had concomitant antiplatelet and NSAID use. Forty-five patients on rivaroxaban (60.8%) and 170 (55.9%) on apixaban were prescribed concomitant PPI and NSAID at baseline. Among non-NSAID users, there was concomitant antiplatelet use for 265 patients (43.6%) in the rivaroxaban group and 1401 patients (47.9%) in the apixaban group. Concomitant PPI use was identified among 63 patients (60.0%) taking selective NSAIDs and 182 (57.2%) taking nonselective NSAIDs.
A total of 423 courses of NSAIDs were identified: 85 NSAID courses in the rivaroxaban group and 338 NSAID courses in the apixaban group. Most NSAID courses involved a nonselective NSAID in the rivaroxaban and apixaban NSAID user groups: 75.2% (n = 318) aggregately compared to 71.8% (n = 61) and 76.0% (n = 257) in the rivaroxaban and apixaban groups, respectively. The most frequent NSAID courses identified were meloxicam (26.7%; n = 113), celecoxib (24.8%; n = 105), ibuprofen (19.1%; n = 81), and naproxen (13.5%; n = 57). Data regarding NSAID therapy initiation and discontinuation dates were not readily available. As a result, the duration of NSAID courses was not captured.
There was no statistically significant difference in bleeding rates between rivaroxaban and apixaban among NSAID users (HR 1.04; 95% CI, 0.98-1.12) or non-NSAID users (HR 1.15; 95% CI, 0.80-1.66) (Table 2). Apixaban non-NSAID users had a higher rate of major bleeds (HR 0.32; 95% CI, 0.17-0.61) while rivaroxaban non-NSAID users had a higher rate of clinically relevant nonmajor bleeds (HR 1.63; 95% CI, 1.10-2.54).
The sample size for the secondary endpoint consisted of bleeding events that were confirmed to have had an overlapping NSAID prescribed at the time of the event. For this secondary assessment, there was 1 rivaroxaban NSAID user bleeding event and 4 apixaban NSAID user bleeding events. For the rivaroxaban NSAID user bleeding event, the NSAID was nonselective and a PPI was not coprescribed. For the apixaban NSAID user bleeding events, 2 NSAIDs were nonselective and 2 were selective. All patients with apixaban and NSAID bleeding events had a coprescribed PPI. There was no clinically significant difference in the bleeding rates observed for NSAID selectivity or PPI coprescribing among the NSAID user subgroups.
DISCUSSION
This study found that there was no statistically significant difference for bleeding rates of major and nonmajor bleeding events between rivaroxaban and apixaban among NSAID users and non-NSAID users. This study did not identify a clinically significant impact on bleeding rates from NSAID selectivity or PPI coprescribing among the NSAID users.
There were notable but not statistically significant differences in baseline characteristics observed between the NSAID and non-NSAID user groups. On average, the rivaroxaban and apixaban NSAID users were younger compared with those not taking NSAIDs. NSAIDs, specifically nonselective NSAIDs, are recognized as potentially inappropriate medications for older adults given that this population is at an increased risk for GI ulcer development and/or GI bleeding.17 The non-NSAID user group likely consisted of older patients compared to the NSAID user group as clinicians may avoid prescribing NSAIDs to older adults regardless of concomitant DOAC therapy.
In addition to having an older patient population, non-NSAID users were more frequently prescribed a concomitant antiplatelet when compared with NSAID users. This prescribing pattern may be due to clinicians avoiding the use of NSAIDs in patients receiving DOAC therapy in combination with antiplatelet therapy, as these patients have been found to have an increased bleeding rate compared to DOAC therapy alone.18
Non-NSAID users had an overall higher bleeding rate for both major and nonmajor bleeding events. Based on this observation, it could be hypothesized that antiplatelet agents have a higher risk of bleeding in comparison to NSAIDs. In a subanalysis of the EXPAND study evaluating risk factors of major bleeding in patients receiving rivaroxaban, concomitant use of antiplatelet agents demonstrated a statistically significant increased risk of bleeding (HR 1.6; 95% CI, 1.2-2.3; P = .003) while concomitant use of NSAIDs did not (HR 0.8; 95% CI, 0.3-2.2; P = .67).19
In assessing PPI status at baseline, a majority of both rivaroxaban and apixaban NSAID users were coprescribed a PPI. This trend aligns with current clinical guideline recommendations for the prescribing of PPI therapy for GI protection in high-risk patients, such as those on DOAC therapy and concomitant NSAID therapy.10 Given the high proportion of NSAID users coprescribed a PPI at baseline, it may be possible that the true incidence of NSAID-associated bleeding events was higher than what this study found. This observation may reflect the impact from timely implementation of risk mitigation strategies by CPPs in the anticoagulation clinic. However, this study was not constructed to assess the efficacy of PPI use in this manner.
It is important to note the patients included in this study were followed by a pharmacist in an anticoagulation clinic using the DOAC Dashboard.15 This population management tool allows CPPs to make proactive interventions when a patient taking a DOAC receives an NSAID prescription, such as recommending the coprescribing of a PPI or use of a selective NSAID.10,16 These standards of care may have contributed to an overall reduced bleeding rate among the NSAID user group and may not be reflective of private practice.
The planned analysis of this study was modeled after the posthoc analysis of the RE-LY and ARISTOTLE trials. Both trials demonstrated an increased risk of bleeding with oral anticoagulation, including DOAC and warfarin, in combination with NSAID use. However, both trials found that NSAID use in patients treated with a DOAC was not independently associated with increased bleeding events compared with warfarin.13,14 The results of this study are comparable to the RE-LY and ARISTOTLE findings that NSAID use among patients treated with rivaroxaban or apixaban did not demonstrate a statistically significant increased bleeding risk.
Studies of NSAID use in combination with DOAC therapy have been limited to patient populations consisting of both DOAC and warfarin. Evidence from these trials outlines the increased bleeding risk associated with NSAID use in combination with oral anticoagulation; however, these patient populations include those on a DOAC and warfarin.13,14,19,20 Given the limited evidence on NSAID use among DOACs alone, it is assumed NSAID use in combination with DOACs has a similar risk of bleeding as warfarin use. This may cause clinicians to automatically exclude NSAID therapy as a treatment option for patients on a DOAC who are otherwise clinically appropriate candidates, such as those with underlying inflammatory conditions. Avoiding NSAID therapy in this patient population may lead to suboptimal pain management and increase the risk of patient harm from methods such as inappropriate opioid therapy prescribing.
DOAC therapy should not be a universal limitation to the use of NSAIDs. Although the risk of bleeding with NSAID therapy is always present, deliberate NSAID prescribing in addition to the timely implementation of risk mitigation strategies may provide an avenue for safe NSAID prescribing in patients receiving a DOAC. A population health-based approach to DOAC management, such as the DOAC Dashboard, appears to be effective at preventing patient harm when NSAIDs are prescribed in conjunction with DOACs.
Limitations
The DOAC Dashboard has been shown to be effective and efficient at monitoring DOAC therapy from a population-based approach.16 Reports generated through the DOAC Dashboard provide convenient access to patient data which allows for timely interventions; however, there are limits to its use for data collection. All the data elements necessary to properly assess bleeding risk with validated tools, such as HAS-BLED (hypertension, abnormal renal/liver function, stroke, bleeding history or predisposition, labile international normalized ratio, elderly, drugs/ alcohol concomitantly), are not available on DOAC Dashboard reports. Due to this constraint, bleeding risk assessments were not conducted at baseline and this study was unable to include risk modeling. Additionally, data elements like initiation and discontinuation dates and duration of therapies were not readily available. As a result, this study was unable to incorporate time as a data point.
This was a retrospective study that relied on manual review of chart documentation to verify bleeding events, but data obtained through the DOAC Dashboard were transferred directly from the EHR.15 Bleeding events available for evaluation were restricted to those that occurred at a VA facility. Additionally, the sample size within the rivaroxaban NSAID user group did not reach the predefined sample size required to reach power and may have been too small to detect a difference if one did exist. The secondary assessment had a low sample size of NSAID user bleeding events, making it difficult to fully assess its impact on NSAID selectivity and PPI coprescribing on bleeding rates. All courses of NSAIDs were equally valued regardless of the dose or therapy duration; however, this is consistent with how NSAID use was defined in the RE-LY and ARISTOTLE trials.
CONCLUSIONS
This retrospective cohort review found no statistically significant difference in the composite bleeding rates between rivaroxaban and apixaban among NSAID users and non-NSAID users. Moreover, there was no clinically significant impact observed for bleeding rates in regard to NSAID selectivity and PPI coprescribing among NSAID users. However, coprescribing of PPI therapy to patients on a DOAC who are clinically indicated for an NSAID may reduce the risk of bleeding. Population health management tools, such as the DOAC Dashboard, may also allow clinicians to safely prescribe NSAIDs to patients on a DOAC. Further large-scale observational studies are needed to quantify the real-world risk of bleeding with concomitant NSAID use among DOACs alone and to evaluate the impact from NSAID selectivity or PPI coprescribing.
- Ruff CT, Giugliano RP, Braunwald E, et al. Comparison of the efficacy and safety of new oral anticoagulants with warfarin in patients with atrial fibrillation: a meta-analysis of randomised trials. Lancet. 2014;383(9921):955-962. doi:10.1016/S0140-6736(13)62343-0
- Ageno W, Gallus AS, Wittkowsky A, Crowther M, Hylek EM, Palareti G. Oral anticoagulant therapy: antithrombotic therapy and prevention of thrombosis, 9th ed: American College of Chest Physicians Evidence-Based Clinical Practice Guidelines. Chest. 2012;141(2 Suppl):e44S-e88S. doi:10.1378/chest.11-2292
- Eikelboom J, Merli G. Bleeding with direct oral anticoagulants vs warfarin: clinical experience. Am J Med. 2016;129(11S):S33-S40. doi:10.1016/j.amjmed.2016.06.003
- Vranckx P, Valgimigli M, Heidbuchel H. The significance of drug-drug and drug-food interactions of oral anticoagulation. Arrhythm Electrophysiol Rev. 2018;7(1):55-61. doi:10.15420/aer.2017.50.1
- Davis JS, Lee HY, Kim J, et al. Use of non-steroidal antiinflammatory drugs in US adults: changes over time and by demographic. Open Heart. 2017;4(1):e000550. doi:10.1136/openhrt-2016-000550
- Schafer AI. Effects of nonsteroidal antiinflammatory drugs on platelet function and systemic hemostasis. J Clin Pharmacol. 1995;35(3):209-219. doi:10.1002/j.1552-4604.1995.tb04050.x
- Al-Saeed A. Gastrointestinal and cardiovascular risk of nonsteroidal anti-inflammatory drugs. Oman Med J. 2011;26(6):385-391. doi:10.5001/omj.2011.101
- Gabriel SE, Jaakkimainen L, Bombardier C. Risk for serious gastrointestinal complications related to use of nonsteroidal anti-inflammatory drugs. Ann Intern Med. 1991;115(10):787-796. doi:10.7326/0003-4819-115-10-787
- Scheiman JM, Yeomans ND, Talley NJ, et al. Prevention of ulcers by esomeprazole in at-risk patients using non-selective NSAIDs and COX-2 inhibitors. Am J Gastroenterol. 2006;101(4):701-710. doi:10.1111/j.1572-0241.2006.00499.x
- Freedberg DE, Kim LS, Yang YX. The risks and benefits of long-term use of proton pump inhibitors: expert review and best practice advice from the American Gastroenterological Association. Gastroenterology. 2017;152(4):706-715. doi:10.1053/j.gastro.2017.01.031
- Lamberts M, Lip GYH, Hansen ML, et al. Relation of nonsteroidal anti-inflammatory drugs to serious bleeding and thromboembolism risk in patients with atrial fibrillation receiving antithrombotic therapy: a nationwide cohort study. Ann Intern Med. 2014;161(10):690-698. doi:10.7326/M13-1581
- Villa Zapata L, Hansten PD, Panic J, et al. Risk of bleeding with exposure to warfarin and nonsteroidal anti-inflammatory drugs: a systematic review and metaanalysis. Thromb Haemost. 2020;120(7):1066-1074. doi:10.1055/s-0040-1710592
- Kent AP, Brueckmann M, Fraessdorf M, et al. Concomitant oral anticoagulant and nonsteroidal anti-inflammatory drug therapy in patients with atrial fibrillation. J Am Coll Cardiol. 2018;72(3):255-267. doi:10.1016/j.jacc.2018.04.063
- Dalgaard F, Mulder H, Wojdyla DM, et al. Patients with atrial fibrillation taking nonsteroidal antiinflammatory drugs and oral anticoagulants in the ARISTOTLE Trial. Circulation. 2020;141(1):10-20. doi:10.1161/CIRCULATIONAHA.119.041296
- Allen AL, Lucas J, Parra D, et al. Shifting the paradigm: a population health approach to the management of direct oral anticoagulants. J Am Heart Asssoc. 2021;10(24):e022758. doi:10.1161/JAHA.121.022758
- . Valencia D, Spoutz P, Stoppi J, et al. Impact of a direct oral anticoagulant population management tool on anticoagulation therapy monitoring in clinical practice. Ann Pharmacother. 2019;53(8):806-811. doi:10.1177/1060028019835843
- By the 2023 American Geriatrics Society Beers Criteria® Update Expert Panel. American Geriatrics Society 2023 Updated AGS Beers Criteria® for potentially inappropriate medication use in older adults. J Am Geriatr Soc. 2023;71(7):2052-2081. doi:10.1111/jgs.18372
- Kumar S, Danik SB, Altman RK, et al. Non-vitamin K antagonist oral anticoagulants and antiplatelet therapy for stroke prevention in patients with atrial fibrillation. Cardiol Rev. 2016;24(5):218-223. doi:10.1097/CRD.0000000000000088
- Sakuma I, Uchiyama S, Atarashi H, et al. Clinical risk factors of stroke and major bleeding in patients with nonvalvular atrial fibrillation under rivaroxaban: the EXPAND study sub-analysis. Heart Vessels. 2019;34(11):1839-1851. doi:10.1007/s00380-019-01425-x
- Davidson BL, Verheijen S, Lensing AWA, et al. Bleeding risk of patients with acute venous thromboembolism taking nonsteroidal anti-inflammatory drugs or aspirin. JAMA Intern Med. 2014;174(6):947-953. doi:10.1001/jamainternmed.2014.946
Impact of NSAID Use on Bleeding Rates for Patients Taking Rivaroxaban or Apixaban
Impact of NSAID Use on Bleeding Rates for Patients Taking Rivaroxaban or Apixaban