User login
Health Care‐Associated Candidemia
In the United States, candida now accounts for between 8% and 12% of all catheter‐associated blood stream infections (BSIs).1 Additionally, crude mortality rates in candidemia exceed 40%, and a recent systematic review demonstrated that the attributable mortality of candidemia ranges from 5% to 71%.2 Candidal BSIs also affect resource utilization. These infections independently increase length of stay and result in substantial excess costs.3 Most cases of candidemia arise in noncritically ill patients and thus may be managed by hospitalists.
Historically, the majority of candidal BSIs were caused by C. albicans. Presently, C. albicans accounts for only half of all yeast BSIs, and approximately 20% of these infections are caused by organisms such as C. glabrata and C. krusei.4 These 2 organisms have either variable or no susceptibility to agents, such as fluconazole, empirically employed against yeast. Parallel with the evolution in microbiology of candidemia has been recognition that inappropriate treatment of these infections independently increases mortality.5 These factors underscore the need for the clinician to treat suspected candidal BSIs aggressively in order to avoid the risks associated with inappropriate treatment.
Efforts to enhance rates of initial appropriate therapy for bacterial infections have encompassed the realization that health care‐associated infections (HAIs) represent a distinct syndrome.6, 7 Traditionally, infections were considered either community‐acquired or nosocomial in origin. However, with the spread of health care delivery beyond the hospital, multiple studies indicate that patients may now present to the emergency department with infections caused by pathogens such as Methicillin‐resistant Staphylococcus aureus (MRSA) and P. aeruginosaorganisms that were previously thought limited to hospital‐acquired processes.69 Furthermore, hospitalists often encounter subjects presenting to the hospital with suspected BSIs who have an active and ongoing interaction with the healthcare system.
The importance of candida as a health care‐associated pathogen in BSI remains unclear. We hypothesized that health care‐associated candidemia (HCAC) represented a distinct clinical entity. In order to confirm our theory, we conducted a retrospective analysis of all cases of candidal BSI at our institution over a 3‐year period.
Methods
We reviewed the records of all patients diagnosed with candidemia at our hospital between January 1, 2004 and December 31, 2006. Our institutional review board approved this study. We included adult patients diagnosed with candidemia. The diagnosis of candidemia was based on the isolation of yeast from the blood in at least one blood culture. We employ the BACTEC 9240 blood Culture System (Becton Dickinson Microbiology Systems, Sparks, MD). We excluded subjects who were admitted to the hospital within one month of a known diagnosis of candidemia.
We defined a nosocomial candidal BSI as the diagnosis of candidemia based on cultures drawn after the patient had been hospitalized for >48 hours. We considered HCAC to be present based on previously employed criteria for identifying HAI.69 Specifically, for patients with candidemia based on blood cultures obtained within 48 hours of hospitalization, a patient had to meet at least 1 of the following criteria: (1) receipt of intravenous therapy outside the hospital, (2) end stage renal disease necessitating hemodialysis (ESRD requiring HD), (3) hospitalization within previous 30 days, (4) residence in a nursing home or long term care facility, or (5) underwent an invasive procedure as an outpatient within 30 days of presentation. Community‐acquired candidemia was restricted to patients whose index culture was drawn within 48 hours of admission but who failed to meet the definition for HCAC.
The prevalence of the various forms of candidemia served as our primary endpoint. In addition, we compared patients with respect to demographic factors, comorbidities, and severity of illness. Severity of illness was calculated based on the Acute Physiology and Chronic Health Evaluation (APACHE) II score. We further noted rates of immune suppression in the cohort and defined this as treatment with corticosteroids (10 mg of prednisone or equivalent daily for more than 30 consecutive days), other immunosuppressants (eg, methotrexate), or chemotherapy. Those with acquired immune deficiency syndrome (AIDS) or another immunodeficiency syndrome were defined as immunosuppressed as well. We examined the distribution of yeast species across the 3 forms of candidemia. Finally, we assessed the prevalence of fluconazole resistance. Fluconazole susceptibilities were determined based on Etest (AB BIODISK, Solna, Sweden). An isolate was considered resistant to fluconazole if the minimum inhibitory concentration was >64 g/mL.
We compared categorical variables with the Fisher's exact test. Continuous variables were analyzed with either the Student's t‐test or a Mann‐Whitney test, as appropriate. All tests were 2 tailed and a P value of 0.05 was assumed to represent statistical significance. Analyses were performed with Stata 9.1 (Stata Corp., College Station, TX).
Results
The final cohort included 223 subjects. The mean age of the patients was 59.6 15.7 years and 49% were male. Nearly one quarter (n = 55) fulfilled our criteria for HCAC. The remainder met the definition for nosocomial candidemia. We observed no cases of community‐acquired candidemia. Most (n = 33) patients with HCAC had exposure to more than 1 health care‐related source and many were initially admitted to the medicine/hospitalist service as opposed to the intensive care unit (ICU). The most common criteria leading to categorization as HCAC was recent hospitalization (n = 30, 54.5% of all HCAC). The median time from recent hospitalization to admission was 17 days (Range: 5‐28 days). Other common reasons for classification as HCAC included ESRD requiring HD (30.9%), residence in a nursing home (25.5%), and undergoing an invasive outpatient procedure (16.4%). More than 75% of subjects with HCAC (n = 42) had central venous catheters in place at presentation. Between 2004 and 2006, the proportion of all candidemia due to HCAC increased from 20.9% to 26.9%, but this difference was not statistically significant.
Patients with HCAC were similar to those with nosocomial candidemia (Table 1). There was no difference in either severity of illness or the frequency of neutropenia. The prevalence of most comorbidities did not differ between those with nosocomial candidemia and persons with HCAC. However, immunosuppression was more prevalent among patients with HCAC (prevalence ratio, 1.67; 95% CI, 1.13‐3.08; P = 0.004). In part this finding is expected given that our definition of HCAC includes exposure to agents which may lead to immunosuppression, such as chemotherapy. Of patients with HCAC, the majority (n = 38, 69.1%) were initially admitted to the general medicine service and not to the ICU.
| Characteristic | Healthcare‐Associated Candidemia (n = 55) | Nosocomial Candidemia (n = 168) | P |
|---|---|---|---|
| |||
| Demographics | |||
| Age, mean SD | 61.0 12.9 | 59.1 16.6 | 0.45 |
| Male, % | 60.0 | 45.8 | 0.08 |
| Severity of illness | |||
| APACHE II score, mean SD | 15.9 6.8 | 14.6 6.3 | 0.21 |
| Co‐morbid illnesses | |||
| Diabetes mellitus, % | 36.4 | 32.7 | 0.87 |
| Malignancy, % | 36.4 | 22.6 | 0.04 |
| ESRD on HD, % | 30.9 | 23.2 | 0.25 |
| AIDS, % | 7.2 | 6.0 | 0.73 |
| Immunosupressed, % | 54.5 | 32.7 | 0.004 |
| White cell status | |||
| ANC, 1000/mm3, mean SD | 10.7 7.2 | 12.3 8.0 | 0.20 |
| Neutropenic, % | 2.0 | 2.2 | 0.91 |
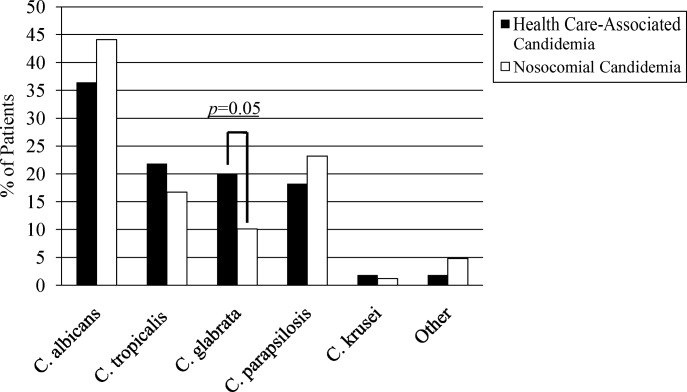
A multitude of various yeast species were recovered (Figure 1). Overall, nonalbicans candida were responsible for nearly 60% of all infections. Nonalbicans yeast were as likely to be recovered in HCAC as in nosocomial yeast infection. Among both types of Candidemia, C. krusei was a rare culprit accounting for fewer than 2% of infections. C. glabrata, however, occurred more often in HCAC. Specifically, C. glabrata represented 1 in 5 cases of HCAC as opposed to approximately 10% of all nosocomial yeast BSIs (P = 0.05). In part reflecting this, fluconazole resistance was noted more often in HCAC (18.2% of patients vs. 7.7% among nosocomial candidemia, P = 0.036). There was no difference in the eventual diagnosis of deep‐seeded yeast infections (ie, endocarditis, endopthlamitis, or osteomyelitis) between those with HCAC and persons with nosocomial candidemia (3 cases in each group).

Discussion
This analysis demonstrates that HCAC accounts for approximately a quarter of all candidemia. Our findings underscore that candidemia can present to the emergency department as an HAI and may potentially be initially cared for by a hospitalist. In addition, patients with HCAC and nosocomial candidemia share many attributes. Furthermore, nonalbicans yeast are as prevalent in HCAC as in nosocomial candidal infection. Nonetheless, there appear to be important differences in these syndromes. Immunosuppression appears to be more common in HCAC as does infection due to C. glabrata.
Others have explored the concept of HCAC. Kung et al.10 described community‐onset candidemia at a single center over a 10‐year period. They described 56 patients and noted that the majority had been recently hospitalized or had ongoing interaction with the healthcare system. Sofair et al.11 followed subjects presenting to emergency departments with candidemia. Overall, more than one‐third met criteria for community‐onset infection. In this analysis, though, Sofair et al.11 did not distinguish between community‐acquired processes and HCAC. From a population perspective, Chen et al.12 explored candidemia in Australia. Among over 1000 patients, the noted that 11.6% represented HCAC and, as we note, that select nonalbicans yeast occurred more often in HCAC than in nosocomial candidemia. Our project builds on and adds to these earlier efforts. First, we confirm the general observation that candidemia is no longer solely a nosocomial pathogen. Second, unlike several of these earlier reports we examined a larger cohort of candidemia. Third, beyond the observations of Chen et al.,12 we note that currently, the proportion of Candidal BSI classified as HACA relative to nosocomial candidemia seems larger than reported in the past. Finally, a unique aspect of our report is that we employed express criteria to define HAI.
Our findings have several implications. First, hospitalists and emergency department physicians, along with others, must remain vigilant when approaching patients presenting to the hospital with signs and symptoms of BSI and multiple risk factors for candidal BSI. The fact that the patient has not been hospitalized should not preclude consideration of and treatment for candidemia. The current evidence does not support broad, empiric use of antifungal agents, as this would lead to excessive costs and potentially expose many patients to unnecessary antifungal coverage. On the other hand, given the association between delayed antifungal therapy and the risk for death in candidemia, failure to consider this infection in at‐risk subjects may have adverse consequences. Second, our observations emphasize the need for clinical risk stratification schemes and rapid diagnostic modalities. Such tools are urgently needed if physicians hope to target antifungal therapies more appropriately. Third, if the clinician opts to initiate therapy for possible HCAC, reliance on fluconazole alone may prove inadequate. As the generalizability of our conclusions is necessarily limited, we recommend that infection control practitioners review local epidemiologic data regarding HCAC so that physicians can have the best available guidance.
Our study has several important limitations. Its retrospective nature exposes it to several forms of bias. The single center design limits the generalizability of our findings. Prospective, multicenter studies are needed to validate our results. Additionally, no universally accepted criteria exist to define HAI syndromes. Nonetheless, the criteria we employed have been used by others. We also lacked data on exposure to recent broad spectrum antimicrobials. Selection pressure via exposure to such agents is a risk factor for candidemia and without this data we cannot gauge the impact of this on our findings. Finally, we cannot control for the possibility that some patients were miscategorized. This could have arisen because of: (1) either limitations inherent in the definition of HCAC or (2) because the clinician delayed the decision to obtain blood cultures. Some patients classified as nosocomial may actually have had HCAC or community‐acquired diseasebut for some reason blood cultures were not drawn at time of admission but were deferred until later. Although a difficult issue to address in any study of the epidemiology of infection, the significance of this misclassification bias must be considered a significant concern.
In summary, Candidemia can be the cause of BSI presenting to the hospital. Moreover, HCAC represents a significant proportion of all Candidemia. Although patients with HCAC and nosocomial candidemia share select characteristics, there appear to be some differences in the microbiology of these syndromes.
- CDC.National Nosocomial Infections Surveillance (NNIS) System report, data summary from January 1990‐‐May 1999, issued June 1999.Am J Infect Control.1999;27:520–532.
- ,,.Attributable mortality of candidemia: a systematic review of matched cohort and case‐control studies.Eur J Clin Microbiol Infect Dis.2006;25:419–425.
- ,,, et al.Excess mortality, hospital stay, and cost due to candidemia: a case‐control study using data from population‐based candidemia surveillance.Infect Control Hosp Epidemiol.2005;26:540–547.
- .Shifting patterns in the epidemiology of nosocomial Candida infections.Chest.2003;123:500S–503S.
- ,,.Delaying the empiric treatment of candida bloodstream infection until positive blood culture results are obtained: a potential risk factor for hospital mortality.Antimicrob Agents Chemother.2005;49:3640–3645.
- ,,, et al.Healthcare‐associated bloodstream infection: A distinct entity? Insights from a large U.S. database.Crit Care Med.2006;34:2588–2595.
- ,,, et al.Health care‐‐associated bloodstream infections in adults: a reason to change the accepted definition of community‐acquired infections.Ann Intern Med.2002;137:791–797.
- ,.Epidemiology of healthcare‐associated pneumonia (HCAP).Semin Respir Crit Care Med.2009;30:10–15.
- ,,, et al.Health care associated pneumonia and community‐acquired pneumonia: a single‐center experience.Antimicrob Agents Chemother.2007;51:3568–3573.
- ,,, et al.Communtiy‐onset candidemia at a university hospital, 1995‐2005.J Microbiol Immunol Infect.2007;40:355–363.
- ,,, et al.Epidemiology of community‐onset candidemia in Connecticut and Maryland.Clin Infect Dis.2006;43:32–39.
- ,,, et al.Active surveillance for candidemia, Australia.Emerg Infect Dis.2006;12:1508–1516.
In the United States, candida now accounts for between 8% and 12% of all catheter‐associated blood stream infections (BSIs).1 Additionally, crude mortality rates in candidemia exceed 40%, and a recent systematic review demonstrated that the attributable mortality of candidemia ranges from 5% to 71%.2 Candidal BSIs also affect resource utilization. These infections independently increase length of stay and result in substantial excess costs.3 Most cases of candidemia arise in noncritically ill patients and thus may be managed by hospitalists.
Historically, the majority of candidal BSIs were caused by C. albicans. Presently, C. albicans accounts for only half of all yeast BSIs, and approximately 20% of these infections are caused by organisms such as C. glabrata and C. krusei.4 These 2 organisms have either variable or no susceptibility to agents, such as fluconazole, empirically employed against yeast. Parallel with the evolution in microbiology of candidemia has been recognition that inappropriate treatment of these infections independently increases mortality.5 These factors underscore the need for the clinician to treat suspected candidal BSIs aggressively in order to avoid the risks associated with inappropriate treatment.
Efforts to enhance rates of initial appropriate therapy for bacterial infections have encompassed the realization that health care‐associated infections (HAIs) represent a distinct syndrome.6, 7 Traditionally, infections were considered either community‐acquired or nosocomial in origin. However, with the spread of health care delivery beyond the hospital, multiple studies indicate that patients may now present to the emergency department with infections caused by pathogens such as Methicillin‐resistant Staphylococcus aureus (MRSA) and P. aeruginosaorganisms that were previously thought limited to hospital‐acquired processes.69 Furthermore, hospitalists often encounter subjects presenting to the hospital with suspected BSIs who have an active and ongoing interaction with the healthcare system.
The importance of candida as a health care‐associated pathogen in BSI remains unclear. We hypothesized that health care‐associated candidemia (HCAC) represented a distinct clinical entity. In order to confirm our theory, we conducted a retrospective analysis of all cases of candidal BSI at our institution over a 3‐year period.
Methods
We reviewed the records of all patients diagnosed with candidemia at our hospital between January 1, 2004 and December 31, 2006. Our institutional review board approved this study. We included adult patients diagnosed with candidemia. The diagnosis of candidemia was based on the isolation of yeast from the blood in at least one blood culture. We employ the BACTEC 9240 blood Culture System (Becton Dickinson Microbiology Systems, Sparks, MD). We excluded subjects who were admitted to the hospital within one month of a known diagnosis of candidemia.
We defined a nosocomial candidal BSI as the diagnosis of candidemia based on cultures drawn after the patient had been hospitalized for >48 hours. We considered HCAC to be present based on previously employed criteria for identifying HAI.69 Specifically, for patients with candidemia based on blood cultures obtained within 48 hours of hospitalization, a patient had to meet at least 1 of the following criteria: (1) receipt of intravenous therapy outside the hospital, (2) end stage renal disease necessitating hemodialysis (ESRD requiring HD), (3) hospitalization within previous 30 days, (4) residence in a nursing home or long term care facility, or (5) underwent an invasive procedure as an outpatient within 30 days of presentation. Community‐acquired candidemia was restricted to patients whose index culture was drawn within 48 hours of admission but who failed to meet the definition for HCAC.
The prevalence of the various forms of candidemia served as our primary endpoint. In addition, we compared patients with respect to demographic factors, comorbidities, and severity of illness. Severity of illness was calculated based on the Acute Physiology and Chronic Health Evaluation (APACHE) II score. We further noted rates of immune suppression in the cohort and defined this as treatment with corticosteroids (10 mg of prednisone or equivalent daily for more than 30 consecutive days), other immunosuppressants (eg, methotrexate), or chemotherapy. Those with acquired immune deficiency syndrome (AIDS) or another immunodeficiency syndrome were defined as immunosuppressed as well. We examined the distribution of yeast species across the 3 forms of candidemia. Finally, we assessed the prevalence of fluconazole resistance. Fluconazole susceptibilities were determined based on Etest (AB BIODISK, Solna, Sweden). An isolate was considered resistant to fluconazole if the minimum inhibitory concentration was >64 g/mL.
We compared categorical variables with the Fisher's exact test. Continuous variables were analyzed with either the Student's t‐test or a Mann‐Whitney test, as appropriate. All tests were 2 tailed and a P value of 0.05 was assumed to represent statistical significance. Analyses were performed with Stata 9.1 (Stata Corp., College Station, TX).
Results
The final cohort included 223 subjects. The mean age of the patients was 59.6 15.7 years and 49% were male. Nearly one quarter (n = 55) fulfilled our criteria for HCAC. The remainder met the definition for nosocomial candidemia. We observed no cases of community‐acquired candidemia. Most (n = 33) patients with HCAC had exposure to more than 1 health care‐related source and many were initially admitted to the medicine/hospitalist service as opposed to the intensive care unit (ICU). The most common criteria leading to categorization as HCAC was recent hospitalization (n = 30, 54.5% of all HCAC). The median time from recent hospitalization to admission was 17 days (Range: 5‐28 days). Other common reasons for classification as HCAC included ESRD requiring HD (30.9%), residence in a nursing home (25.5%), and undergoing an invasive outpatient procedure (16.4%). More than 75% of subjects with HCAC (n = 42) had central venous catheters in place at presentation. Between 2004 and 2006, the proportion of all candidemia due to HCAC increased from 20.9% to 26.9%, but this difference was not statistically significant.
Patients with HCAC were similar to those with nosocomial candidemia (Table 1). There was no difference in either severity of illness or the frequency of neutropenia. The prevalence of most comorbidities did not differ between those with nosocomial candidemia and persons with HCAC. However, immunosuppression was more prevalent among patients with HCAC (prevalence ratio, 1.67; 95% CI, 1.13‐3.08; P = 0.004). In part this finding is expected given that our definition of HCAC includes exposure to agents which may lead to immunosuppression, such as chemotherapy. Of patients with HCAC, the majority (n = 38, 69.1%) were initially admitted to the general medicine service and not to the ICU.
| Characteristic | Healthcare‐Associated Candidemia (n = 55) | Nosocomial Candidemia (n = 168) | P |
|---|---|---|---|
| |||
| Demographics | |||
| Age, mean SD | 61.0 12.9 | 59.1 16.6 | 0.45 |
| Male, % | 60.0 | 45.8 | 0.08 |
| Severity of illness | |||
| APACHE II score, mean SD | 15.9 6.8 | 14.6 6.3 | 0.21 |
| Co‐morbid illnesses | |||
| Diabetes mellitus, % | 36.4 | 32.7 | 0.87 |
| Malignancy, % | 36.4 | 22.6 | 0.04 |
| ESRD on HD, % | 30.9 | 23.2 | 0.25 |
| AIDS, % | 7.2 | 6.0 | 0.73 |
| Immunosupressed, % | 54.5 | 32.7 | 0.004 |
| White cell status | |||
| ANC, 1000/mm3, mean SD | 10.7 7.2 | 12.3 8.0 | 0.20 |
| Neutropenic, % | 2.0 | 2.2 | 0.91 |
A multitude of various yeast species were recovered (Figure 1). Overall, nonalbicans candida were responsible for nearly 60% of all infections. Nonalbicans yeast were as likely to be recovered in HCAC as in nosocomial yeast infection. Among both types of Candidemia, C. krusei was a rare culprit accounting for fewer than 2% of infections. C. glabrata, however, occurred more often in HCAC. Specifically, C. glabrata represented 1 in 5 cases of HCAC as opposed to approximately 10% of all nosocomial yeast BSIs (P = 0.05). In part reflecting this, fluconazole resistance was noted more often in HCAC (18.2% of patients vs. 7.7% among nosocomial candidemia, P = 0.036). There was no difference in the eventual diagnosis of deep‐seeded yeast infections (ie, endocarditis, endopthlamitis, or osteomyelitis) between those with HCAC and persons with nosocomial candidemia (3 cases in each group).
Discussion
This analysis demonstrates that HCAC accounts for approximately a quarter of all candidemia. Our findings underscore that candidemia can present to the emergency department as an HAI and may potentially be initially cared for by a hospitalist. In addition, patients with HCAC and nosocomial candidemia share many attributes. Furthermore, nonalbicans yeast are as prevalent in HCAC as in nosocomial candidal infection. Nonetheless, there appear to be important differences in these syndromes. Immunosuppression appears to be more common in HCAC as does infection due to C. glabrata.
Others have explored the concept of HCAC. Kung et al.10 described community‐onset candidemia at a single center over a 10‐year period. They described 56 patients and noted that the majority had been recently hospitalized or had ongoing interaction with the healthcare system. Sofair et al.11 followed subjects presenting to emergency departments with candidemia. Overall, more than one‐third met criteria for community‐onset infection. In this analysis, though, Sofair et al.11 did not distinguish between community‐acquired processes and HCAC. From a population perspective, Chen et al.12 explored candidemia in Australia. Among over 1000 patients, the noted that 11.6% represented HCAC and, as we note, that select nonalbicans yeast occurred more often in HCAC than in nosocomial candidemia. Our project builds on and adds to these earlier efforts. First, we confirm the general observation that candidemia is no longer solely a nosocomial pathogen. Second, unlike several of these earlier reports we examined a larger cohort of candidemia. Third, beyond the observations of Chen et al.,12 we note that currently, the proportion of Candidal BSI classified as HACA relative to nosocomial candidemia seems larger than reported in the past. Finally, a unique aspect of our report is that we employed express criteria to define HAI.
Our findings have several implications. First, hospitalists and emergency department physicians, along with others, must remain vigilant when approaching patients presenting to the hospital with signs and symptoms of BSI and multiple risk factors for candidal BSI. The fact that the patient has not been hospitalized should not preclude consideration of and treatment for candidemia. The current evidence does not support broad, empiric use of antifungal agents, as this would lead to excessive costs and potentially expose many patients to unnecessary antifungal coverage. On the other hand, given the association between delayed antifungal therapy and the risk for death in candidemia, failure to consider this infection in at‐risk subjects may have adverse consequences. Second, our observations emphasize the need for clinical risk stratification schemes and rapid diagnostic modalities. Such tools are urgently needed if physicians hope to target antifungal therapies more appropriately. Third, if the clinician opts to initiate therapy for possible HCAC, reliance on fluconazole alone may prove inadequate. As the generalizability of our conclusions is necessarily limited, we recommend that infection control practitioners review local epidemiologic data regarding HCAC so that physicians can have the best available guidance.
Our study has several important limitations. Its retrospective nature exposes it to several forms of bias. The single center design limits the generalizability of our findings. Prospective, multicenter studies are needed to validate our results. Additionally, no universally accepted criteria exist to define HAI syndromes. Nonetheless, the criteria we employed have been used by others. We also lacked data on exposure to recent broad spectrum antimicrobials. Selection pressure via exposure to such agents is a risk factor for candidemia and without this data we cannot gauge the impact of this on our findings. Finally, we cannot control for the possibility that some patients were miscategorized. This could have arisen because of: (1) either limitations inherent in the definition of HCAC or (2) because the clinician delayed the decision to obtain blood cultures. Some patients classified as nosocomial may actually have had HCAC or community‐acquired diseasebut for some reason blood cultures were not drawn at time of admission but were deferred until later. Although a difficult issue to address in any study of the epidemiology of infection, the significance of this misclassification bias must be considered a significant concern.
In summary, Candidemia can be the cause of BSI presenting to the hospital. Moreover, HCAC represents a significant proportion of all Candidemia. Although patients with HCAC and nosocomial candidemia share select characteristics, there appear to be some differences in the microbiology of these syndromes.
- CDC.National Nosocomial Infections Surveillance (NNIS) System report, data summary from January 1990‐‐May 1999, issued June 1999.Am J Infect Control.1999;27:520–532.
- ,,.Attributable mortality of candidemia: a systematic review of matched cohort and case‐control studies.Eur J Clin Microbiol Infect Dis.2006;25:419–425.
- ,,, et al.Excess mortality, hospital stay, and cost due to candidemia: a case‐control study using data from population‐based candidemia surveillance.Infect Control Hosp Epidemiol.2005;26:540–547.
- .Shifting patterns in the epidemiology of nosocomial Candida infections.Chest.2003;123:500S–503S.
- ,,.Delaying the empiric treatment of candida bloodstream infection until positive blood culture results are obtained: a potential risk factor for hospital mortality.Antimicrob Agents Chemother.2005;49:3640–3645.
- ,,, et al.Healthcare‐associated bloodstream infection: A distinct entity? Insights from a large U.S. database.Crit Care Med.2006;34:2588–2595.
- ,,, et al.Health care‐‐associated bloodstream infections in adults: a reason to change the accepted definition of community‐acquired infections.Ann Intern Med.2002;137:791–797.
- ,.Epidemiology of healthcare‐associated pneumonia (HCAP).Semin Respir Crit Care Med.2009;30:10–15.
- ,,, et al.Health care associated pneumonia and community‐acquired pneumonia: a single‐center experience.Antimicrob Agents Chemother.2007;51:3568–3573.
- ,,, et al.Communtiy‐onset candidemia at a university hospital, 1995‐2005.J Microbiol Immunol Infect.2007;40:355–363.
- ,,, et al.Epidemiology of community‐onset candidemia in Connecticut and Maryland.Clin Infect Dis.2006;43:32–39.
- ,,, et al.Active surveillance for candidemia, Australia.Emerg Infect Dis.2006;12:1508–1516.
Myth: LBBB Masks Hyperkalemia
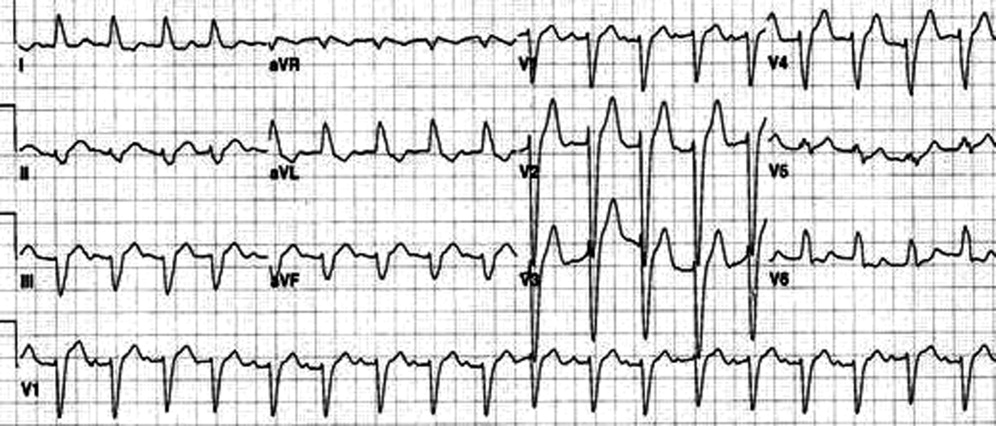
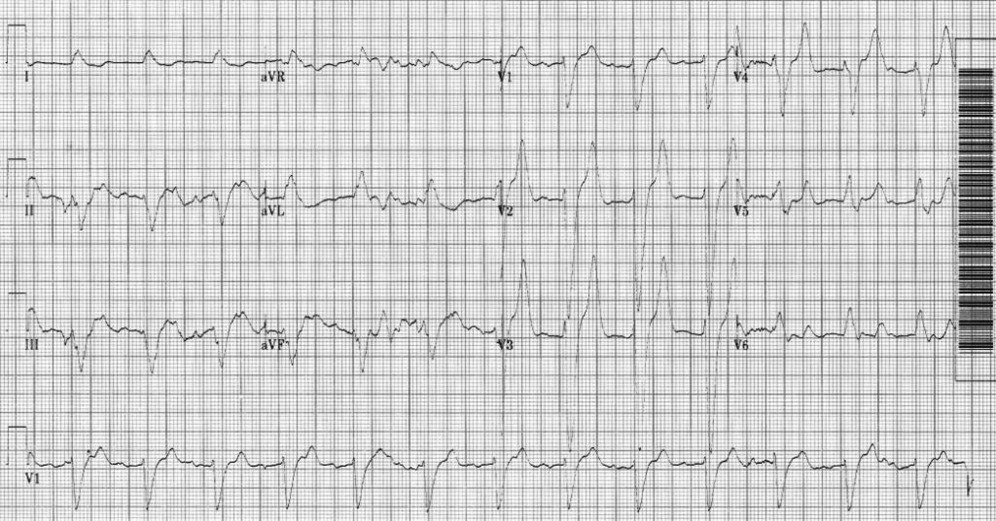
An 80‐year‐old man with end‐stage renal disease requiring maintenance hemodialysis was admitted to the emergency department (ED) with complaints of fever, generalized fatigue, and lethargy. Presenting electrocardiogram (ECG) revealed normal sinus rhythm at 82 beats per minute (bpm), prolonged PR interval, complete left bundle branch block (LBBB) with wide QRS interval and tall T waves (Figure 1). A baseline ECG done 3 months ago also showed LBBB (Figure 2). In view of the underlying LBBB, changes in the presenting ECG were ignored.

Hemodialysis was planned for the patient. A few hours later, repeat ECG revealed a sine wave pattern suggestive of severe hyperkalemia (Figure 3). Laboratory results were available then and his serum potassium was found to be 6.8 mmol/L. He was started on insulin, dextrose, and calcium gluconate, but he developed cardiorespiratory arrest and died.
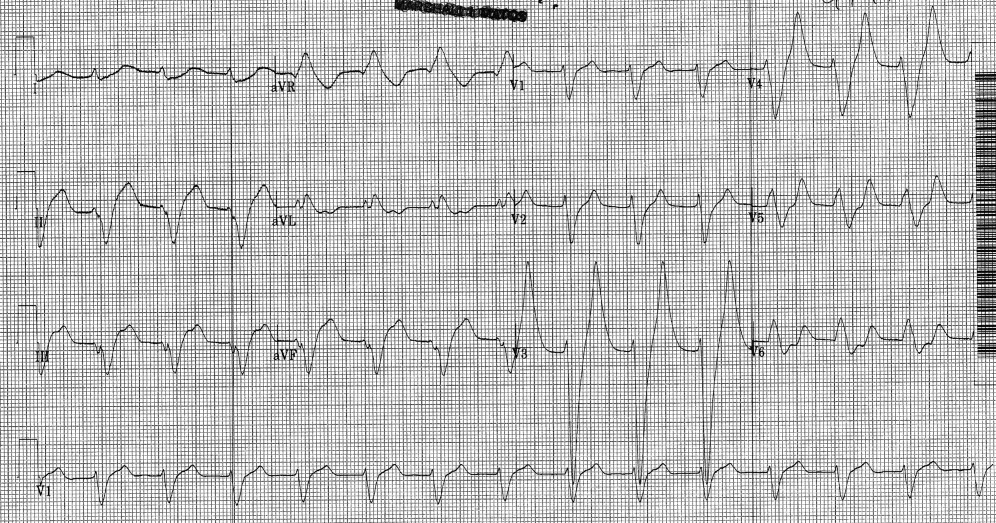
Retrospectively, looking at the presenting ECG (Figure 1), it was found that the PR interval was longer, the QRS was broader, and the T waves were taller and more peaked than the baseline ECG (Figure 2).
Discussion
Hyperkalemia is a true medical emergency with potential lethal consequences that must be treated accordingly.1, 2 It can be difficult to diagnose due to the paucity of distinctive signs and symptoms. Any ECG change due to hyperkalemia becomes an indication for stabilizing the myocardium with calcium infusion.
Often, the sequence of repolarization due to myocardial infarction is altered on ECG in patients with baseline LBBB, making it difficult to diagnose accurately. Although it is thought that changes due to electrolyte imbalances will also be masked by the presence of LBBB, there is no evidence supporting this in the literature. Hence, it is wrongly believed that LBBB masks changes due to hyperkalemia. It is important that in patients with suspected electrolyte imbalance, baseline ECG showing LBBB is compared to the presenting ECG. In our patient, the presenting ECG (Figure 1) might not look too impressive, but in comparison to the baseline ECG (Figure 2), the PR interval is longer, QRS is wider, and T waves are more peaked and taller. If the admitting physician had closely compared the presenting ECG (Figure 1) to the baseline ECG (Figure 2), the suspicion of hyperkalemia would have been high.
- ,,.Electrolyte disturbances. In:Marx JA,Hockberger RS,Walls RM, et al.,Rosen's Emergency Medicine: Concepts and Clinical Practice.5th ed. Vol2.St. Louis:Mosby;2002:1730–1731.
- ,.Hyperkalemia in hospitalized patients.Int Urol Nephrol.2000;32:177–180.
An 80‐year‐old man with end‐stage renal disease requiring maintenance hemodialysis was admitted to the emergency department (ED) with complaints of fever, generalized fatigue, and lethargy. Presenting electrocardiogram (ECG) revealed normal sinus rhythm at 82 beats per minute (bpm), prolonged PR interval, complete left bundle branch block (LBBB) with wide QRS interval and tall T waves (Figure 1). A baseline ECG done 3 months ago also showed LBBB (Figure 2). In view of the underlying LBBB, changes in the presenting ECG were ignored.
Hemodialysis was planned for the patient. A few hours later, repeat ECG revealed a sine wave pattern suggestive of severe hyperkalemia (Figure 3). Laboratory results were available then and his serum potassium was found to be 6.8 mmol/L. He was started on insulin, dextrose, and calcium gluconate, but he developed cardiorespiratory arrest and died.
Retrospectively, looking at the presenting ECG (Figure 1), it was found that the PR interval was longer, the QRS was broader, and the T waves were taller and more peaked than the baseline ECG (Figure 2).
Discussion
Hyperkalemia is a true medical emergency with potential lethal consequences that must be treated accordingly.1, 2 It can be difficult to diagnose due to the paucity of distinctive signs and symptoms. Any ECG change due to hyperkalemia becomes an indication for stabilizing the myocardium with calcium infusion.
Often, the sequence of repolarization due to myocardial infarction is altered on ECG in patients with baseline LBBB, making it difficult to diagnose accurately. Although it is thought that changes due to electrolyte imbalances will also be masked by the presence of LBBB, there is no evidence supporting this in the literature. Hence, it is wrongly believed that LBBB masks changes due to hyperkalemia. It is important that in patients with suspected electrolyte imbalance, baseline ECG showing LBBB is compared to the presenting ECG. In our patient, the presenting ECG (Figure 1) might not look too impressive, but in comparison to the baseline ECG (Figure 2), the PR interval is longer, QRS is wider, and T waves are more peaked and taller. If the admitting physician had closely compared the presenting ECG (Figure 1) to the baseline ECG (Figure 2), the suspicion of hyperkalemia would have been high.
- ,,.Electrolyte disturbances. In:Marx JA,Hockberger RS,Walls RM, et al.,Rosen's Emergency Medicine: Concepts and Clinical Practice.5th ed. Vol2.St. Louis:Mosby;2002:1730–1731.
- ,.Hyperkalemia in hospitalized patients.Int Urol Nephrol.2000;32:177–180.
- ,,.Electrolyte disturbances. In:Marx JA,Hockberger RS,Walls RM, et al.,Rosen's Emergency Medicine: Concepts and Clinical Practice.5th ed. Vol2.St. Louis:Mosby;2002:1730–1731.
- ,.Hyperkalemia in hospitalized patients.Int Urol Nephrol.2000;32:177–180.
Patient Knowledge of Hospital Medication
Inpatient medication errors represent an important patient safety issue. The magnitude of the problem is staggering, with 1 review finding almost 1 in every 5 medication doses in error, with 7% having potential for adverse drug events.1 While mistakes made at the ordering stage are frequently intercepted by pharmacist or nursing review, administration errors are particularly difficult to prevent.2 The patient, as the last link in the medication administration chain, represents the final individual capable of preventing an incorrect medication administration. It is perhaps surprising then that patients generally lack a formal role in detecting and preventing adverse medication administration events.3
There have been some ambitious attempts to improve patient education regarding hospital medications and involve selected patients in the medication administration process. Such initiatives may result in increased patient participation and satisfaction.47 There is also potential that increased patient knowledge of their hospital medications could promote the goal of medication safety, as the actively involved patient may be able to catch medication errors in the hospital.
Knowledge of prescribed medications is a prerequisite to patient involvement in prevention of inpatient medication errors and yet there is little research on patient knowledge of their hospital medications. Furthermore, as the experience of hospitalization may be disorienting and disempowering for patients, it remains to be seen if patient attitudes toward participation in inpatient medication safety are favorable. To that end, we conducted a pilot study in which we assessed current patient awareness of their in‐hospital medications and surveyed attitudes toward increased patient knowledge of hospital medications.
PATIENTS AND METHODS
We conducted a cross‐sectional study of 50 cognitively intact adult internal medicine inpatients at the University of Colorado Hospital, a tertiary‐care academic teaching hospital. This study was part of a larger project designed to examine potential for patient involvement in the medication reconciliation process. A professional research assistant approached eligible patients within 24 hours of admission. To be eligible, patients had to self‐identify as knowing their outpatient medications, speak English, and have been admitted from the community. Nursing home residents and patients with a past medical history of dementia were excluded. Enrollment was tracked during the first half of the study to estimate effect of inclusion/exclusion criteria. Thirty‐eight percent of hospital admissions to medicine services were excluded based on the specified criteria. Thirty‐four percent of eligible patients were approached and 50% of approached patients agreed to participate in the study. Patient knowledge of their outpatient medication regimen was compared to admitting physician medication reconciliation to assess accuracy of patient self‐report of outpatient medication knowledge.
After consenting to participate, study patients completed a structured list of their outpatient medications and a survey of attitudes about being shown their in‐hospital medications, hospital medication errors, and patient involvement in hospital safety. They then completed a list of the medications they believed to be prescribed to them in the hospital.
The primary outcomes were the proportions of as needed (PRN), scheduled, and total hospital medications omitted by the patient, compared to the inpatient medication administration record (MAR) (patient errors of omission). Secondary outcomes included the number of in‐hospital medications listed by the patient that did not appear on the inpatient MAR (patient errors of commission), as well as patient attitudes measured on a 5‐point Likert scale (1 indicated strongly disagree and 5 indicated strongly agree.) Descriptive data included age, race, gender, and number of inpatient medications prescribed. Separate analysis of variance (ANOVA) models provided mean estimates of the primary outcomes and tested differences according to each of the patient characteristics: age in years (65 or 65), self‐reported knowledge of hospital medications, and self‐reported desire to be involved in medication safety. Similar ANOVA models adjusted for number of medications were also examined to determine whether the relationship between the primary outcomes according to patient characteristics were altered by the number of medications. The protocol was approved by the Colorado Multiple Institutional Review Board.
RESULTS
Participants averaged 54 years of age (standard deviation [SD] = 17, range = 21‐89). Forty‐six percent (23/50) were male, and 74% (37/50) were non‐Hispanic white. Using a structured, patient‐completed, outpatient medication list, patients in the study were on an average of 5.3 outpatient prescription medications (range = 0‐17), 2.2 over‐the‐counter medications (range = 0‐8), and 0.2 herbal medications (range = 0‐7). The admitting physician's medication reconciliation list demonstrated similar number of outpatient prescription medications (average = 5.7) to the patient‐generated list. Fifty‐four percent of patient‐completed home medication lists included all of the prescription medications on the physician's medication reconciliation at admission. According to the inpatient MAR, study patients were prescribed an average of 11.3 scheduled and PRN hospital medications (range = 2‐26) at time of study enrollment.
Patient Knowledge of Their Hospital Medication List
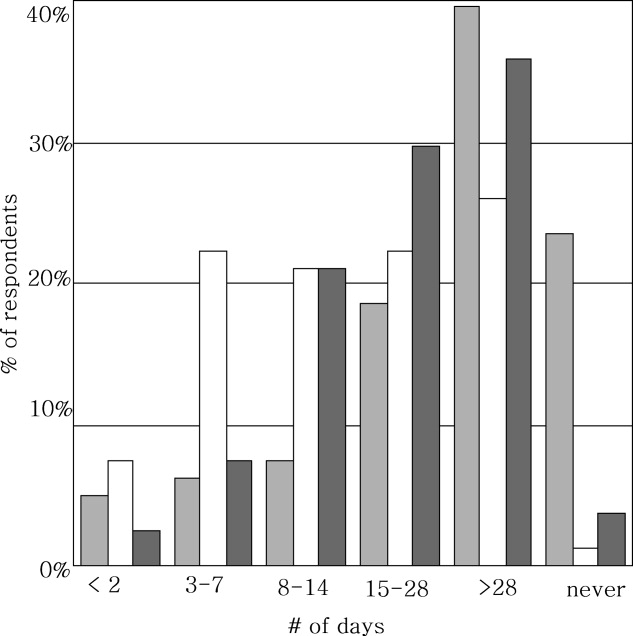
Ninety‐six percent (48/50) of study patients omitted 1 or more of their hospital medications. On average, patients omitted 6.8 medications (range = 0‐22) (Table 1). Among scheduled medications, patients most commonly omitted antibiotics (17%), cardiovascular medications (16%), and antithrombotics (15%) (Figure 1). Among PRN medications, patients most commonly omitted analgesics (33%) and gastrointestinal medications (29%) (Figure 2).
| Total Medications | Scheduled Medications | PRN Medications | |
|---|---|---|---|
| |||
| Percent of patients with at least 1 hospital medication they could not name (95% CI) | 96% (90‐100%) | 94% (87‐100%) | 80% (69‐92%) |
| Average number of hospital medications omitted by patient (range) | 6.8 (0‐22) | 5.2 (0‐15) | 1.6 (0‐7) |
| Percentage of hospital medications omitted by patient (95% CI) | 60% (52‐67%) | 60% (52‐67%) | 68% (57‐78%) |

Patients less than 65 years omitted 60% of their PRN medications whereas patients greater than 65 years omitted 88% (P = 0.01). This difference remained even after adjustment for number of medications. There were no significant differences, based on age, in ability to name scheduled or total medications. Forty‐four percent of patients (22/50) believed they were receiving a medication in the hospital that was not actually prescribed.
Patient Attitudes Toward Increased Knowledge of Hospital Medications
Only 28% (14/50) of patients reported having seen their hospital medication list, although 78% (39/50) favored being given such a list, and 81% (39/48) reported that this would improve their satisfaction with care. Ninety percent (45/50) wanted to review their hospital medication list for accuracy and 94% (47/50) felt patient participation in reviewing hospital medications had potential to reduce errors. No associations were found between self‐reported knowledge of hospital medications or self‐reported desire to be involved in medication safety and the proportion of PRN, scheduled, or total medications omitted.
DISCUSSION
Overall, patients in the study were able to name fewer than one‐half of their hospital medications. Our study suggests that adult medicine inpatients believe learning about their hospital medications would increase their satisfaction and has potential to promote medication safety. At the same time, patients did not know many of their hospital medications and this would limit their ability to fully participate in the medication safety process. Study patients frequently committed both errors of omission (ie, they did not know which medications were prescribed), and errors of commission (ie, they believed they were prescribed medications that were not prescribed). Younger patients were aware of more of their PRN medications than older patients, potentially reflecting greater patient care involvement in younger generations. However, study patients, regardless of age, were able to name fewer than one‐half of their PRN hospital medications. The most common scheduled hospital medications that patients were unable to name come from medication classes which can be associated with significant adverse events, including antibiotics, cardiovascular medications, and antithrombotics.
We posit that without systematically educating patients about their hospital medications, significant deficits in patient knowledge are inevitable. Some might argue that patients should not be asked to know their hospital medications or identify medication errors while sick and vulnerable. Certainly with multiple medication changes, formulary substitutions, and frequent modifications based on changes in clinical status, inpatient medication education could be time consuming and potentially introduce patient confusion or anxiety. Incorrect patient feedback could have potential to introduce new errors. An educational program might use graded participation based on patient interest and ability. Models for this exist in the literature, even extending to patient medication self‐administration.57 In our sample of inpatients, the majority desired a more active role in learning about their hospital medications and believed that their involvement might prevent hospital medication errors from occurring.
Medication literacy, education, and active patient involvement in medication monitoring as a means to improve patient outcomes has received significant attention in the outpatient setting, with lessons applicable to the hospital.8, 9 More broadly, the Joint Commission has established a Hospital National Patient Safety Goal to encourage patients' active involvement in their own care as a patient safety strategy.10 Examples set forth by the Joint Commission include involving patients in infection control measures, marking of procedural sites, and reporting of safety concerns relating to treatment.
While this study identifies patient knowledge deficit as a barrier to utilizing patients as part of the hospital medication safety process, it does not test whether reducing this knowledge deficit would actually reduce medication error. Our study population was limited to cognitively intact adult medicine patients at a single institution, limiting the generalizability of our conclusions. Our enrollment process may have resulted in a study population with less serious illness, greater knowledge of their hospital medications, and greater interest in participating in medication safety potentially overestimating patient knowledge of hospital medications. Finally, our small sample size limits the power to find differences in study comparisons.
Our findings are striking in that we found significant deficits in patient understanding of their hospital medications even among patients who believed they knew, or desired to know, what is being prescribed to them in the hospital. Without a system to incorporate the patient into hospital medication management, these patients will be disenfranchised from participating in inpatient medication safety. These results are a call to reexamine how we educate and involve patients regarding hospital medications. Mechanisms to allow patients to provide feedback to the medical team on their hospital medications might identify errors or improve patient satisfaction with their care. However, the systems and cultural changes needed to provide education on inpatient medications are considerable. Future research is needed to determine if increasing patient knowledge regarding their hospital medications would reduce medication errors in the inpatient setting and how this could be effectively implemented.
Acknowledgements
The authors thank Sue Felton, MA, Professional Research Assistant, for enrolling patients in this trial, and Traci Yamashita, MS, Professional Research Assistant, for statistical analysis.
- ,,,,.Medication errors observed in 36 health care facilities.Arch Intern Med.2002;162:1897–1903.
- ,,, et al.Incidence of adverse drug events and potential adverse drug events. Implications for prevention. ADE Prevention Study Group.JAMA.1995;274:29–34.
- ,.Patient Safety: what about the patient?Qual Saf Health Care.2002;11:76–80.
- ,,, et al.Pharmacist involvement in a multidisciplinary inpatient medication education program.Am J Health Syst Pharm.2003;60:1012–1018.
- ,,,.Self‐administration of medication by patients and family members during hospitalization.Patient Educ Couns.1996;27:103–112.
- ,,,.Hospital inpatient self‐administration of medicine programmes: a critical literature review.Pharm World Sci.2006;28:140–151.
- ,,,.Self‐administration of medication in hospital: patients' perspectives.J Adv Nurs.2004;46:194–203.
- ,.Outpatient drug safety: new steps in an old direction.Pharmacoepidemiol Drug Saf.2007;16:160–165.
- ,,.Impact of health literacy on health outcomes in ambulatory care patients: a systematic review.Phamacosociology.2008;42:1272–1281.
- Joint Commission.2009. Standards Improvement Initiative. Available at: http://www.jointcommission.org/NR/rdonlyres/31666E86‐E7F4–423E‐9BE8‐F05BD1CB0AA8/0/HAP_NPSG.pdf. Accessed June 2009.
Inpatient medication errors represent an important patient safety issue. The magnitude of the problem is staggering, with 1 review finding almost 1 in every 5 medication doses in error, with 7% having potential for adverse drug events.1 While mistakes made at the ordering stage are frequently intercepted by pharmacist or nursing review, administration errors are particularly difficult to prevent.2 The patient, as the last link in the medication administration chain, represents the final individual capable of preventing an incorrect medication administration. It is perhaps surprising then that patients generally lack a formal role in detecting and preventing adverse medication administration events.3
There have been some ambitious attempts to improve patient education regarding hospital medications and involve selected patients in the medication administration process. Such initiatives may result in increased patient participation and satisfaction.47 There is also potential that increased patient knowledge of their hospital medications could promote the goal of medication safety, as the actively involved patient may be able to catch medication errors in the hospital.
Knowledge of prescribed medications is a prerequisite to patient involvement in prevention of inpatient medication errors and yet there is little research on patient knowledge of their hospital medications. Furthermore, as the experience of hospitalization may be disorienting and disempowering for patients, it remains to be seen if patient attitudes toward participation in inpatient medication safety are favorable. To that end, we conducted a pilot study in which we assessed current patient awareness of their in‐hospital medications and surveyed attitudes toward increased patient knowledge of hospital medications.
PATIENTS AND METHODS
We conducted a cross‐sectional study of 50 cognitively intact adult internal medicine inpatients at the University of Colorado Hospital, a tertiary‐care academic teaching hospital. This study was part of a larger project designed to examine potential for patient involvement in the medication reconciliation process. A professional research assistant approached eligible patients within 24 hours of admission. To be eligible, patients had to self‐identify as knowing their outpatient medications, speak English, and have been admitted from the community. Nursing home residents and patients with a past medical history of dementia were excluded. Enrollment was tracked during the first half of the study to estimate effect of inclusion/exclusion criteria. Thirty‐eight percent of hospital admissions to medicine services were excluded based on the specified criteria. Thirty‐four percent of eligible patients were approached and 50% of approached patients agreed to participate in the study. Patient knowledge of their outpatient medication regimen was compared to admitting physician medication reconciliation to assess accuracy of patient self‐report of outpatient medication knowledge.
After consenting to participate, study patients completed a structured list of their outpatient medications and a survey of attitudes about being shown their in‐hospital medications, hospital medication errors, and patient involvement in hospital safety. They then completed a list of the medications they believed to be prescribed to them in the hospital.
The primary outcomes were the proportions of as needed (PRN), scheduled, and total hospital medications omitted by the patient, compared to the inpatient medication administration record (MAR) (patient errors of omission). Secondary outcomes included the number of in‐hospital medications listed by the patient that did not appear on the inpatient MAR (patient errors of commission), as well as patient attitudes measured on a 5‐point Likert scale (1 indicated strongly disagree and 5 indicated strongly agree.) Descriptive data included age, race, gender, and number of inpatient medications prescribed. Separate analysis of variance (ANOVA) models provided mean estimates of the primary outcomes and tested differences according to each of the patient characteristics: age in years (65 or 65), self‐reported knowledge of hospital medications, and self‐reported desire to be involved in medication safety. Similar ANOVA models adjusted for number of medications were also examined to determine whether the relationship between the primary outcomes according to patient characteristics were altered by the number of medications. The protocol was approved by the Colorado Multiple Institutional Review Board.
RESULTS
Participants averaged 54 years of age (standard deviation [SD] = 17, range = 21‐89). Forty‐six percent (23/50) were male, and 74% (37/50) were non‐Hispanic white. Using a structured, patient‐completed, outpatient medication list, patients in the study were on an average of 5.3 outpatient prescription medications (range = 0‐17), 2.2 over‐the‐counter medications (range = 0‐8), and 0.2 herbal medications (range = 0‐7). The admitting physician's medication reconciliation list demonstrated similar number of outpatient prescription medications (average = 5.7) to the patient‐generated list. Fifty‐four percent of patient‐completed home medication lists included all of the prescription medications on the physician's medication reconciliation at admission. According to the inpatient MAR, study patients were prescribed an average of 11.3 scheduled and PRN hospital medications (range = 2‐26) at time of study enrollment.
Patient Knowledge of Their Hospital Medication List
Ninety‐six percent (48/50) of study patients omitted 1 or more of their hospital medications. On average, patients omitted 6.8 medications (range = 0‐22) (Table 1). Among scheduled medications, patients most commonly omitted antibiotics (17%), cardiovascular medications (16%), and antithrombotics (15%) (Figure 1). Among PRN medications, patients most commonly omitted analgesics (33%) and gastrointestinal medications (29%) (Figure 2).
| Total Medications | Scheduled Medications | PRN Medications | |
|---|---|---|---|
| |||
| Percent of patients with at least 1 hospital medication they could not name (95% CI) | 96% (90‐100%) | 94% (87‐100%) | 80% (69‐92%) |
| Average number of hospital medications omitted by patient (range) | 6.8 (0‐22) | 5.2 (0‐15) | 1.6 (0‐7) |
| Percentage of hospital medications omitted by patient (95% CI) | 60% (52‐67%) | 60% (52‐67%) | 68% (57‐78%) |
Patients less than 65 years omitted 60% of their PRN medications whereas patients greater than 65 years omitted 88% (P = 0.01). This difference remained even after adjustment for number of medications. There were no significant differences, based on age, in ability to name scheduled or total medications. Forty‐four percent of patients (22/50) believed they were receiving a medication in the hospital that was not actually prescribed.
Patient Attitudes Toward Increased Knowledge of Hospital Medications
Only 28% (14/50) of patients reported having seen their hospital medication list, although 78% (39/50) favored being given such a list, and 81% (39/48) reported that this would improve their satisfaction with care. Ninety percent (45/50) wanted to review their hospital medication list for accuracy and 94% (47/50) felt patient participation in reviewing hospital medications had potential to reduce errors. No associations were found between self‐reported knowledge of hospital medications or self‐reported desire to be involved in medication safety and the proportion of PRN, scheduled, or total medications omitted.
DISCUSSION
Overall, patients in the study were able to name fewer than one‐half of their hospital medications. Our study suggests that adult medicine inpatients believe learning about their hospital medications would increase their satisfaction and has potential to promote medication safety. At the same time, patients did not know many of their hospital medications and this would limit their ability to fully participate in the medication safety process. Study patients frequently committed both errors of omission (ie, they did not know which medications were prescribed), and errors of commission (ie, they believed they were prescribed medications that were not prescribed). Younger patients were aware of more of their PRN medications than older patients, potentially reflecting greater patient care involvement in younger generations. However, study patients, regardless of age, were able to name fewer than one‐half of their PRN hospital medications. The most common scheduled hospital medications that patients were unable to name come from medication classes which can be associated with significant adverse events, including antibiotics, cardiovascular medications, and antithrombotics.
We posit that without systematically educating patients about their hospital medications, significant deficits in patient knowledge are inevitable. Some might argue that patients should not be asked to know their hospital medications or identify medication errors while sick and vulnerable. Certainly with multiple medication changes, formulary substitutions, and frequent modifications based on changes in clinical status, inpatient medication education could be time consuming and potentially introduce patient confusion or anxiety. Incorrect patient feedback could have potential to introduce new errors. An educational program might use graded participation based on patient interest and ability. Models for this exist in the literature, even extending to patient medication self‐administration.57 In our sample of inpatients, the majority desired a more active role in learning about their hospital medications and believed that their involvement might prevent hospital medication errors from occurring.
Medication literacy, education, and active patient involvement in medication monitoring as a means to improve patient outcomes has received significant attention in the outpatient setting, with lessons applicable to the hospital.8, 9 More broadly, the Joint Commission has established a Hospital National Patient Safety Goal to encourage patients' active involvement in their own care as a patient safety strategy.10 Examples set forth by the Joint Commission include involving patients in infection control measures, marking of procedural sites, and reporting of safety concerns relating to treatment.
While this study identifies patient knowledge deficit as a barrier to utilizing patients as part of the hospital medication safety process, it does not test whether reducing this knowledge deficit would actually reduce medication error. Our study population was limited to cognitively intact adult medicine patients at a single institution, limiting the generalizability of our conclusions. Our enrollment process may have resulted in a study population with less serious illness, greater knowledge of their hospital medications, and greater interest in participating in medication safety potentially overestimating patient knowledge of hospital medications. Finally, our small sample size limits the power to find differences in study comparisons.
Our findings are striking in that we found significant deficits in patient understanding of their hospital medications even among patients who believed they knew, or desired to know, what is being prescribed to them in the hospital. Without a system to incorporate the patient into hospital medication management, these patients will be disenfranchised from participating in inpatient medication safety. These results are a call to reexamine how we educate and involve patients regarding hospital medications. Mechanisms to allow patients to provide feedback to the medical team on their hospital medications might identify errors or improve patient satisfaction with their care. However, the systems and cultural changes needed to provide education on inpatient medications are considerable. Future research is needed to determine if increasing patient knowledge regarding their hospital medications would reduce medication errors in the inpatient setting and how this could be effectively implemented.
Acknowledgements
The authors thank Sue Felton, MA, Professional Research Assistant, for enrolling patients in this trial, and Traci Yamashita, MS, Professional Research Assistant, for statistical analysis.
- ,,,,.Medication errors observed in 36 health care facilities.Arch Intern Med.2002;162:1897–1903.
- ,,, et al.Incidence of adverse drug events and potential adverse drug events. Implications for prevention. ADE Prevention Study Group.JAMA.1995;274:29–34.
- ,.Patient Safety: what about the patient?Qual Saf Health Care.2002;11:76–80.
- ,,, et al.Pharmacist involvement in a multidisciplinary inpatient medication education program.Am J Health Syst Pharm.2003;60:1012–1018.
- ,,,.Self‐administration of medication by patients and family members during hospitalization.Patient Educ Couns.1996;27:103–112.
- ,,,.Hospital inpatient self‐administration of medicine programmes: a critical literature review.Pharm World Sci.2006;28:140–151.
- ,,,.Self‐administration of medication in hospital: patients' perspectives.J Adv Nurs.2004;46:194–203.
- ,.Outpatient drug safety: new steps in an old direction.Pharmacoepidemiol Drug Saf.2007;16:160–165.
- ,,.Impact of health literacy on health outcomes in ambulatory care patients: a systematic review.Phamacosociology.2008;42:1272–1281.
- Joint Commission.2009. Standards Improvement Initiative. Available at: http://www.jointcommission.org/NR/rdonlyres/31666E86‐E7F4–423E‐9BE8‐F05BD1CB0AA8/0/HAP_NPSG.pdf. Accessed June 2009.
Sleep Disruptions and Sedative Use
Adequate sleep is important for health, yet the hospital environment commonly disrupts sleep.13 Sleep improves after several days in the hospital.3, 4 Sleep deprivation increases cortisol levels5 and sleep loss of greater than 4 hours may be hyperalgesic.6 Even a few days' suppression of slow‐wave sleep worsens glucose tolerance.7 Sleep disruption may cause irritability and aggressiveness,8 impaired memory consolidation, and delirium.2
Noise may disrupt sleep. The World Health Organization recommends a maximum of 30 to 40 dBA in patients' rooms at night.9, 10 Normal conversation occurs at 60 dBA. Medical equipment alarms are about 80 dBA.
Sedative use is common in the hospital.3 Sedatives typically shorten sleep latency and suppress rapid eye movement (REM) sleep. However, some sedatives cause delirium, falls, amnesia, and confusion, particularly in the elderly.1113
Most research on sleep in hospitalized patients has been done in the critical care setting, often in sedated ventilated patients, where sleep disruption is well‐described.1416 Only a few small studies have assessed the sleep of hospitalized patients outside critical care.17, 18
A single blinded interventional trial assessed sedative use, but was a nonrandomized study.19, 20 As‐needed sedative use was measured among hospitalized elderly patients as a secondary endpoint. The intervention, known as the Hospital Elder Life Program (HELP), included a protocol with noise reduction, massage, music, and warm drinks, as well as rescheduling of medications and procedures; it resulted in a 24% reduction in as‐needed sedative use. Another trial decreased noise and reduced overnight X‐rays on a surgical unit, then measured staff and patient attitudes.21 Two interventional studies in nursing homes reduced noise and light, and/or increased daytime activity and found no effect on most objective measures of sleep.22, 23 One descriptive study found most sleep disturbances in medical‐surgical patients came from noise and sleeping in an unfamiliar bed.4
We hypothesized that an intervention designed to improve patient sleep through changes in staff behavior would decrease sedative use among unselected patients in a medical‐surgical unit. We measured sedative use as our primary endpoint as a marker for effective sleep, and because decreased sedative use is desirable. We also hypothesized that the intervention would lead to improved sleep experiences, as measured by a questionnaire and Verran Snyder‐Halpern (VSH) sleep scores as secondary endpoints.24
Materials And Methods
Study Design
This was a pre‐post study assessing the effect of the intervention on as‐needed sedative use, questionnaire responses, and sleep quality. It was an intention‐to‐treat analysis, and was blinded in terms of measurement of sedative use. The Institutional Review Board of Cambridge Health Alliance approved the study.
Setting and Patients
The site was the only medical‐surgical unit of Somerville Hospital, a small urban community teaching hospital that is part of Cambridge Health Alliance. The hospital unit was chosen for its architectural characteristics, and is organized spatially as 3 U‐shaped pods surrounding nursing workstations. Hence, patient rooms were nearly equidistant from the nurses' stations, unlike a hallway design where distant rooms are quieter. Six rooms were private; 11 were semiprivate. Most of the unit's 28 beds are used for medical patients covered by the hospitalist service. Residents see a minority of patients. A hospitalist is available around the clock. Few agency nurses are used.
Preintervention patients were recruited between April and August 2007. The intervention was planned and implemented from September 2007 to January 2008. Intervention patients were recruited between February and June 2008. The most common principle diagnoses on the unit were chest pain (11%), pneumonia (8%), congestive heart failure (CHF) (5.1%), and chronic obstructive pulmonary disease (COPD) flare (3%). Exclusion criteria ensured that no patient was ill enough to require intensive care unit (ICU)‐level care or was actively dying. All consecutive hospitalized patients on the unit on Tuesdays through Fridays were potentially eligible and invited to participate unless they met exclusion criteria. The limited days of the week ensured that technical support would be available during the intervention phase.
Exclusion criteria were: known sleep disorders; language other than English, Spanish, Portuguese, or Haitian Creole; surgery the prior day; arrival on the floor after 10 PM the prior evening; residence on the unit for more than 4 days; alcohol or drug withdrawal; end‐of‐life morphine drip; significant hearing loss; and blindness.
Study Protocol
A single investigator surveyed patients in the morning about the prior night's sleep experience. The surveys consisted of the VSH sleep scale, as well as an 8‐item questionnaire developed from informal pilot interviews with about 18 patients conducted by 1 of the investigators (M.B.) (Supporting Information Figure 1). The VSH scale is a visual analog scale using a 100‐cm line,24 which we modified with a 100‐mm line to make it easier to collect data. The questionnaire and VSH scores of patients with cognitive impairment were not included in the final analysis. Cognitive impairment was determined by diagnoses present in chart review. Surveys and consent forms were available in 4 languages and trained interpreters were used as needed. Nurses, providers, and patients were blinded to the measurement of as‐needed sedative use, and staff were unaware of which patients were study subjects.

Measurements
Nighttime administration of any medication ordered prn sleep or insomnia was measured using the pharmacy dispensing equipment (Pyxis; Cardinal Health, Dublin, OH), then verified by reviewing the patients' medication administration records. VSH sleep scores were created by measuring the distance in millimeters from the lower end of the scale (0) to the location marked.
We also tracked adherence to some aspects of the intervention. The questionnaire recorded door closing. Chart audits measured the numbers of different prescribers, and the frequency of medication orders using flexible timing.
Data Analysis
Medication use was analyzed as any as‐needed sedative use vs. none. The proportions of patients who used sedatives preintervention and postintervention were compared using a 2‐sample Z statistic, as were survey items. Mean VSH scores were compared with 2‐sample t tests. The study had greater than 80% power to detect a difference in proportion of at least 0.14 at alpha = 0.05.
Design and Implementation of the Intervention
Preintervention, routine vital signs were taken every 8 hours: 8 AM, 4 PM, and midnight. Night nurses arrived at 11 PM, and typically turned off the hallway lights, but the practice was variable and occurred at no set time.
Patients in our informal pilot interviews identified vital signs, medication administration, noise, and evening diuretic administration as disrupting their sleep. After the preintervention phase, we spent 4 months designing and implementing the intervention. We solicited opinions from staff, who identified inflexible timing of medications as disruptive. The plan was discussed at routine staff meetings of all shifts.
The intervention, called the Somerville Protocol (Figure 1) created an 8‐hour Quiet Time from 10 PM to 6 AM, when disruptions were minimized. Vital signs were taken 2 hours earlier (6 AM, 2 PM, and 10 PM); routine medication administration was avoided; and noise was reduced. As before, telemetry patients required vital signs every 4 hours. At 10 PM, hallway lights were turned off by a timer while the Lullaby by Brahms played overhead, signaling the start of Quiet Time to staff and patients. Inexpensive sound meters were installed in each nursing area. They flashed warning lights when 60 dBA was exceeded.
A physician and nurse served as champions. Educational signs were posted in the hospitalists' call room and in the nursing areas. The champions used e‐mail and detailed the intervention to staff. Because the staff played an active role in intervention planning, implementation went smoothly.
Results
During the preintervention phase, 334 patients were screened, 294 were eligible, and 54.7% of eligible subjects were enrolled (n = 161). During the intervention phase, 211 patients were screened, 188 were eligible, and 56.3% of eligible patients were enrolled (n = 106). The mean patient age was 60.6 years. The preintervention and intervention groups did not differ significantly in enrollment rate, age, gender, cognitive impairment, surgical status, or hearing deficiencies (Table 1). Over 93% of patients were nonsurgical.
| Preintervention Patients (n = 161) | Intervention Patients (n = 106) | P Values for Difference | |
|---|---|---|---|
| Mean age (years) | 59.1 | 62.95 | P = 0.146 |
| Males, n (%) | 79 (49.1%) | 46 (43.4%) | P = 0.38 |
| Hard of hearing, n (%) (self‐report) | 33/157 (21.0%) | 14/103 (13.6%) | P = 0.128 |
| English‐speaking, n (%) | 134 (83%) | 83 (78.3%) | P = 0.34 |
| Cognitive impairment, n (%) | 4 (2.5%) | 3 (2.8%) | P = 0.88 |
| Surgical patients, n (%) | 10 (6.2%) | 2 (1.8%) | P = 0.089 |
Sedative Use
Preintervention, 31.7% of patients received nighttime as‐needed sedatives, versus 16.0% of the intervention group, a 49.4% reduction (P = 0.0041; 95% confidence interval [CI]: 0.056‐0.26) (Figure 2). In patients aged 65 years or older, 38.2% received nighttime as‐needed sedatives preintervention, and 14.6% did postintervention, a 61.2% reduction (P = 0.0054; 95% CI: 0.084‐0.39).
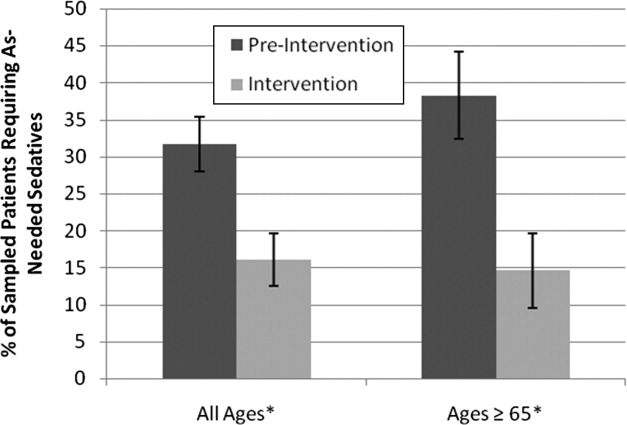
Questionnaire Results
Preintervention, hospital staff was by far the biggest factor keeping patients awake, with 42.4% of patients reporting it (Figure 3). This dropped to only 25.7% with the intervention, a 39.3% decrease (P = 0.009; 95% CI: 0.0452‐0.2765). Preintervention, 19.2% of patients selected voices as the noise most likely to bother them at night, and this dropped to 9.9% with the intervention, a 48% decrease (P = 0.045; 95% CI: 0.0074‐0.1787). No other significant differences were found.
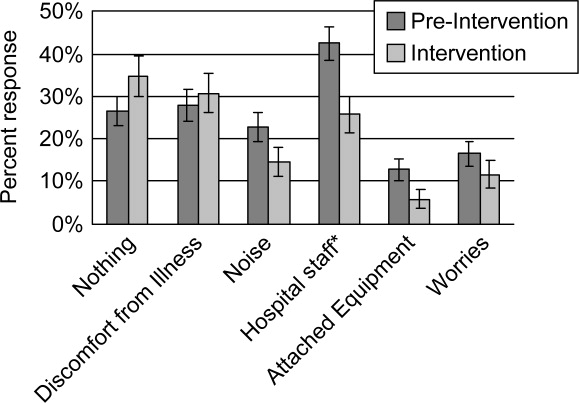
VSH Sleep Score Results
We found no improvement in any measure of the VSH sleep scale. However, 75% of our patients were unable to use the modified VSH scale, generally because they felt too ill, and were then prompted by the surveyor to choose a number between 1 and 10 that reflected their experience.
Protocol Adherence
Changes in unit routines resulted in complete adherence to the new vital signs schedule and avoidance of routine evening diuretics. The closing of patients' doors did not change. An audit of 40 charts found that the percentage of medication orders written with appropriate flexible timing increased from 82% (n = 228) to 95.5% (n = 200) (P = 0.001; 95% CI: 0.077‐0.192). From 20 to 30 different providers wrote orders during each phase.
Discussion
Our trial found that hospital staff was the factor most responsible for patient sleep disruption, and that behavioral interventions on hospital staff can reduce use of as‐needed sedatives. The only previously reported intervention to reduce sedative use, the HELP strategy, involved a complex intervention requiring extra staff, with adherence ranging from 10% to 75%.19, 20, 25 In contrast, our protocol can be easily replicated at minimal cost.
Our results are consistent with those of Freedman et al.,26 who found that noise was not the primary factor responsible for sleep disruption in ICU patients, and that staff activities were at least as important a factor. The study is also consistent with the nursing home studies in which decreases in noise and light did not improve sleep.22, 23 It refutes the study that showed that most sleep disturbance in medical‐surgical patients comes from noise and sleeping in an unfamiliar bed.4 Our results call into question the use of the VSH scale in hospitalized patients, which was designed for use in healthy subjects.
Limitations of this study were as follows: moderate size, lack of refined measures of disease severity, and, as in previous studies,19, 2123 the lack of randomized concurrent controls. Evaluation of secondary endpoints was limited by lack of validation of the questionnaire with objective observations, and inability to use the modified VSH scale. Self‐reports of sleep may correlate imperfectly with objective measures, such as polysomnography.27
A larger concurrent trial randomizing similar units at multiple hospitals would be ideal. Future research is needed to determine whether improving sleep in the hospital improves other outcomes, such as recovery times, delirium, falls, or cost.
The need to reduce as‐needed sedatives is an important safety issue and similar interventions in other hospitals may be helpful. Simple changes in staff routines and provider prescribing habits can yield significant reductions in sedative use.
Acknowledgements
The authors thank Gertrude Gavin, Steffie Woolhandler, MD, Linda Borodkin, John Brusch, MD, Patricia Crombie, Priscilla Dasse, Glen Dawson, Ben Davenny, Linda Kasten, Judith Krempin, Mark Letzeisen, Carmen Mohan, and Arun Mohan. Linda Kasten, Timothy Schmidt, and Glen Dawson provided statistical analysis. The sound meters (Yacker Trackers, Creative Toys of Colorado) were donated by John Brusch, who has no financial conflict of interest.
- ,,,.Sleep in hospitalized medical patients, Part 1: Factors affecting sleep.J Hosp Med.2008;3:473–482.
- ,.Sleep‐dependent learning and memory consolidation.Neuron.2004;44:121–133.
- ,,,,,.An assessment of quality of sleep and the use of drugs with sedating properties in hospitalized adult patients.Health Qual Life Outcomes.2004;2:17.
- ,,,.The sleep experience of medical and surgical patients.Clin Nurs Res.2003;12:159–173.
- .Metabolic and endocrine effects of sleep deprivation.Essent Psychopharmacol.2005;6:341–347.
- ,,,,.Sleep loss and REM sleep loss are hyperalgesic.Sleep.2006;29:145–151.
- ,,,.Slow‐wave sleep and the risk of type 2 diabetes in humans.Proc Natl Acad Sci USA.2008;105:1044–1049.
- .Sleep inquiry: a look with fresh eyes.Image J Nurs Sch.1993;25:249–256.
- Berglund B, Lindvall T, Schwela D, eds.Guidelines for Community Noise.World Health Organization;1999:47.
- ,,,,,.Noise levels in Johns Hopkins Hospital.J Acoust Soc Am.2005;118:3629–3645.
- .Explicit criteria for determining potentially inappropriate medication use by the elderly. An update.Arch Intern Med.1997;157:1531–1536.
- .Delirium in older persons.N Engl J Med.2006;354:1157–1165.
- ,,,,.Sedative hypnotics in older people with insomnia: meta‐analysis of risks and benefits.BMJ.2005;331:1169.
- .Sleep in acute care units.Sleep Breath.2006;10:6–15.
- ,,,,.Quantity and quality of sleep in the surgical intensive care unit: are our patients sleeping?J Trauma.2007;63:1210–1214.
- ,.Sleep in the critically ill patient.Sleep.2006;29:707–716.
- ,,.Sleep quality in hospitalized patients.J Clin Nurs.2005;14:107–113.
- ,.Interactive relationships between hospital patients' noise‐induced stress and other stress with sleep.Heart Lung.2001;30:237–243.
- ,,, et al.A multicomponent intervention to prevent delirium in hospitalized older patients.N Engl J Med.1999;340:669–676.
- ,,,,.The Hospital Elder Life Program: a model of care to prevent cognitive and functional decline in older hospitalized patients. Hospital Elder Life Program.J Am Geriatr Soc.2000;48:1697–1706.
- ,,,,.Noise control: a nursing team's approach to sleep promotion.Am J Nurs.2004;104:40–48; quiz 48‐49.
- ,,,,,.A nonpharmacological intervention to improve sleep in nursing home patients: results of a controlled clinical trial.J Am Geriatr Soc.2006;54:38–47.
- ,,,,.The nursing home at night: effects of an intervention on noise, light, and sleep.J Am Geriatr Soc.1999;47:430–438.
- ,.Instrumentation to describe subjective sleep characteristics in healthy subjects.Res Nurs Health.1987;10:155–163.
- ,,,,.The role of adherence on the effectiveness of nonpharmacologic interventions: evidence from the delirium prevention trial.Arch Intern Med.2003;163:958–964.
- ,,.Patient perception of sleep quality and etiology of sleep disruption in the intensive care unit.Am J Respir Crit Care Med.1999;159:1155–1162.
- ,,.When sleep is perceived as wakefulness: an experimental study on state perception during physiological sleep.J Sleep Res.2007;16:346–353.
Adequate sleep is important for health, yet the hospital environment commonly disrupts sleep.13 Sleep improves after several days in the hospital.3, 4 Sleep deprivation increases cortisol levels5 and sleep loss of greater than 4 hours may be hyperalgesic.6 Even a few days' suppression of slow‐wave sleep worsens glucose tolerance.7 Sleep disruption may cause irritability and aggressiveness,8 impaired memory consolidation, and delirium.2
Noise may disrupt sleep. The World Health Organization recommends a maximum of 30 to 40 dBA in patients' rooms at night.9, 10 Normal conversation occurs at 60 dBA. Medical equipment alarms are about 80 dBA.
Sedative use is common in the hospital.3 Sedatives typically shorten sleep latency and suppress rapid eye movement (REM) sleep. However, some sedatives cause delirium, falls, amnesia, and confusion, particularly in the elderly.1113
Most research on sleep in hospitalized patients has been done in the critical care setting, often in sedated ventilated patients, where sleep disruption is well‐described.1416 Only a few small studies have assessed the sleep of hospitalized patients outside critical care.17, 18
A single blinded interventional trial assessed sedative use, but was a nonrandomized study.19, 20 As‐needed sedative use was measured among hospitalized elderly patients as a secondary endpoint. The intervention, known as the Hospital Elder Life Program (HELP), included a protocol with noise reduction, massage, music, and warm drinks, as well as rescheduling of medications and procedures; it resulted in a 24% reduction in as‐needed sedative use. Another trial decreased noise and reduced overnight X‐rays on a surgical unit, then measured staff and patient attitudes.21 Two interventional studies in nursing homes reduced noise and light, and/or increased daytime activity and found no effect on most objective measures of sleep.22, 23 One descriptive study found most sleep disturbances in medical‐surgical patients came from noise and sleeping in an unfamiliar bed.4
We hypothesized that an intervention designed to improve patient sleep through changes in staff behavior would decrease sedative use among unselected patients in a medical‐surgical unit. We measured sedative use as our primary endpoint as a marker for effective sleep, and because decreased sedative use is desirable. We also hypothesized that the intervention would lead to improved sleep experiences, as measured by a questionnaire and Verran Snyder‐Halpern (VSH) sleep scores as secondary endpoints.24
Materials And Methods
Study Design
This was a pre‐post study assessing the effect of the intervention on as‐needed sedative use, questionnaire responses, and sleep quality. It was an intention‐to‐treat analysis, and was blinded in terms of measurement of sedative use. The Institutional Review Board of Cambridge Health Alliance approved the study.
Setting and Patients
The site was the only medical‐surgical unit of Somerville Hospital, a small urban community teaching hospital that is part of Cambridge Health Alliance. The hospital unit was chosen for its architectural characteristics, and is organized spatially as 3 U‐shaped pods surrounding nursing workstations. Hence, patient rooms were nearly equidistant from the nurses' stations, unlike a hallway design where distant rooms are quieter. Six rooms were private; 11 were semiprivate. Most of the unit's 28 beds are used for medical patients covered by the hospitalist service. Residents see a minority of patients. A hospitalist is available around the clock. Few agency nurses are used.
Preintervention patients were recruited between April and August 2007. The intervention was planned and implemented from September 2007 to January 2008. Intervention patients were recruited between February and June 2008. The most common principle diagnoses on the unit were chest pain (11%), pneumonia (8%), congestive heart failure (CHF) (5.1%), and chronic obstructive pulmonary disease (COPD) flare (3%). Exclusion criteria ensured that no patient was ill enough to require intensive care unit (ICU)‐level care or was actively dying. All consecutive hospitalized patients on the unit on Tuesdays through Fridays were potentially eligible and invited to participate unless they met exclusion criteria. The limited days of the week ensured that technical support would be available during the intervention phase.
Exclusion criteria were: known sleep disorders; language other than English, Spanish, Portuguese, or Haitian Creole; surgery the prior day; arrival on the floor after 10 PM the prior evening; residence on the unit for more than 4 days; alcohol or drug withdrawal; end‐of‐life morphine drip; significant hearing loss; and blindness.
Study Protocol
A single investigator surveyed patients in the morning about the prior night's sleep experience. The surveys consisted of the VSH sleep scale, as well as an 8‐item questionnaire developed from informal pilot interviews with about 18 patients conducted by 1 of the investigators (M.B.) (Supporting Information Figure 1). The VSH scale is a visual analog scale using a 100‐cm line,24 which we modified with a 100‐mm line to make it easier to collect data. The questionnaire and VSH scores of patients with cognitive impairment were not included in the final analysis. Cognitive impairment was determined by diagnoses present in chart review. Surveys and consent forms were available in 4 languages and trained interpreters were used as needed. Nurses, providers, and patients were blinded to the measurement of as‐needed sedative use, and staff were unaware of which patients were study subjects.
Measurements
Nighttime administration of any medication ordered prn sleep or insomnia was measured using the pharmacy dispensing equipment (Pyxis; Cardinal Health, Dublin, OH), then verified by reviewing the patients' medication administration records. VSH sleep scores were created by measuring the distance in millimeters from the lower end of the scale (0) to the location marked.
We also tracked adherence to some aspects of the intervention. The questionnaire recorded door closing. Chart audits measured the numbers of different prescribers, and the frequency of medication orders using flexible timing.
Data Analysis
Medication use was analyzed as any as‐needed sedative use vs. none. The proportions of patients who used sedatives preintervention and postintervention were compared using a 2‐sample Z statistic, as were survey items. Mean VSH scores were compared with 2‐sample t tests. The study had greater than 80% power to detect a difference in proportion of at least 0.14 at alpha = 0.05.
Design and Implementation of the Intervention
Preintervention, routine vital signs were taken every 8 hours: 8 AM, 4 PM, and midnight. Night nurses arrived at 11 PM, and typically turned off the hallway lights, but the practice was variable and occurred at no set time.
Patients in our informal pilot interviews identified vital signs, medication administration, noise, and evening diuretic administration as disrupting their sleep. After the preintervention phase, we spent 4 months designing and implementing the intervention. We solicited opinions from staff, who identified inflexible timing of medications as disruptive. The plan was discussed at routine staff meetings of all shifts.
The intervention, called the Somerville Protocol (Figure 1) created an 8‐hour Quiet Time from 10 PM to 6 AM, when disruptions were minimized. Vital signs were taken 2 hours earlier (6 AM, 2 PM, and 10 PM); routine medication administration was avoided; and noise was reduced. As before, telemetry patients required vital signs every 4 hours. At 10 PM, hallway lights were turned off by a timer while the Lullaby by Brahms played overhead, signaling the start of Quiet Time to staff and patients. Inexpensive sound meters were installed in each nursing area. They flashed warning lights when 60 dBA was exceeded.
A physician and nurse served as champions. Educational signs were posted in the hospitalists' call room and in the nursing areas. The champions used e‐mail and detailed the intervention to staff. Because the staff played an active role in intervention planning, implementation went smoothly.
Results
During the preintervention phase, 334 patients were screened, 294 were eligible, and 54.7% of eligible subjects were enrolled (n = 161). During the intervention phase, 211 patients were screened, 188 were eligible, and 56.3% of eligible patients were enrolled (n = 106). The mean patient age was 60.6 years. The preintervention and intervention groups did not differ significantly in enrollment rate, age, gender, cognitive impairment, surgical status, or hearing deficiencies (Table 1). Over 93% of patients were nonsurgical.
| Preintervention Patients (n = 161) | Intervention Patients (n = 106) | P Values for Difference | |
|---|---|---|---|
| Mean age (years) | 59.1 | 62.95 | P = 0.146 |
| Males, n (%) | 79 (49.1%) | 46 (43.4%) | P = 0.38 |
| Hard of hearing, n (%) (self‐report) | 33/157 (21.0%) | 14/103 (13.6%) | P = 0.128 |
| English‐speaking, n (%) | 134 (83%) | 83 (78.3%) | P = 0.34 |
| Cognitive impairment, n (%) | 4 (2.5%) | 3 (2.8%) | P = 0.88 |
| Surgical patients, n (%) | 10 (6.2%) | 2 (1.8%) | P = 0.089 |
Sedative Use
Preintervention, 31.7% of patients received nighttime as‐needed sedatives, versus 16.0% of the intervention group, a 49.4% reduction (P = 0.0041; 95% confidence interval [CI]: 0.056‐0.26) (Figure 2). In patients aged 65 years or older, 38.2% received nighttime as‐needed sedatives preintervention, and 14.6% did postintervention, a 61.2% reduction (P = 0.0054; 95% CI: 0.084‐0.39).
Questionnaire Results
Preintervention, hospital staff was by far the biggest factor keeping patients awake, with 42.4% of patients reporting it (Figure 3). This dropped to only 25.7% with the intervention, a 39.3% decrease (P = 0.009; 95% CI: 0.0452‐0.2765). Preintervention, 19.2% of patients selected voices as the noise most likely to bother them at night, and this dropped to 9.9% with the intervention, a 48% decrease (P = 0.045; 95% CI: 0.0074‐0.1787). No other significant differences were found.
VSH Sleep Score Results
We found no improvement in any measure of the VSH sleep scale. However, 75% of our patients were unable to use the modified VSH scale, generally because they felt too ill, and were then prompted by the surveyor to choose a number between 1 and 10 that reflected their experience.
Protocol Adherence
Changes in unit routines resulted in complete adherence to the new vital signs schedule and avoidance of routine evening diuretics. The closing of patients' doors did not change. An audit of 40 charts found that the percentage of medication orders written with appropriate flexible timing increased from 82% (n = 228) to 95.5% (n = 200) (P = 0.001; 95% CI: 0.077‐0.192). From 20 to 30 different providers wrote orders during each phase.
Discussion
Our trial found that hospital staff was the factor most responsible for patient sleep disruption, and that behavioral interventions on hospital staff can reduce use of as‐needed sedatives. The only previously reported intervention to reduce sedative use, the HELP strategy, involved a complex intervention requiring extra staff, with adherence ranging from 10% to 75%.19, 20, 25 In contrast, our protocol can be easily replicated at minimal cost.
Our results are consistent with those of Freedman et al.,26 who found that noise was not the primary factor responsible for sleep disruption in ICU patients, and that staff activities were at least as important a factor. The study is also consistent with the nursing home studies in which decreases in noise and light did not improve sleep.22, 23 It refutes the study that showed that most sleep disturbance in medical‐surgical patients comes from noise and sleeping in an unfamiliar bed.4 Our results call into question the use of the VSH scale in hospitalized patients, which was designed for use in healthy subjects.
Limitations of this study were as follows: moderate size, lack of refined measures of disease severity, and, as in previous studies,19, 2123 the lack of randomized concurrent controls. Evaluation of secondary endpoints was limited by lack of validation of the questionnaire with objective observations, and inability to use the modified VSH scale. Self‐reports of sleep may correlate imperfectly with objective measures, such as polysomnography.27
A larger concurrent trial randomizing similar units at multiple hospitals would be ideal. Future research is needed to determine whether improving sleep in the hospital improves other outcomes, such as recovery times, delirium, falls, or cost.
The need to reduce as‐needed sedatives is an important safety issue and similar interventions in other hospitals may be helpful. Simple changes in staff routines and provider prescribing habits can yield significant reductions in sedative use.
Acknowledgements
The authors thank Gertrude Gavin, Steffie Woolhandler, MD, Linda Borodkin, John Brusch, MD, Patricia Crombie, Priscilla Dasse, Glen Dawson, Ben Davenny, Linda Kasten, Judith Krempin, Mark Letzeisen, Carmen Mohan, and Arun Mohan. Linda Kasten, Timothy Schmidt, and Glen Dawson provided statistical analysis. The sound meters (Yacker Trackers, Creative Toys of Colorado) were donated by John Brusch, who has no financial conflict of interest.
- ,,,.Sleep in hospitalized medical patients, Part 1: Factors affecting sleep.J Hosp Med.2008;3:473–482.
- ,.Sleep‐dependent learning and memory consolidation.Neuron.2004;44:121–133.
- ,,,,,.An assessment of quality of sleep and the use of drugs with sedating properties in hospitalized adult patients.Health Qual Life Outcomes.2004;2:17.
- ,,,.The sleep experience of medical and surgical patients.Clin Nurs Res.2003;12:159–173.
- .Metabolic and endocrine effects of sleep deprivation.Essent Psychopharmacol.2005;6:341–347.
- ,,,,.Sleep loss and REM sleep loss are hyperalgesic.Sleep.2006;29:145–151.
- ,,,.Slow‐wave sleep and the risk of type 2 diabetes in humans.Proc Natl Acad Sci USA.2008;105:1044–1049.
- .Sleep inquiry: a look with fresh eyes.Image J Nurs Sch.1993;25:249–256.
- Berglund B, Lindvall T, Schwela D, eds.Guidelines for Community Noise.World Health Organization;1999:47.
- ,,,,,.Noise levels in Johns Hopkins Hospital.J Acoust Soc Am.2005;118:3629–3645.
- .Explicit criteria for determining potentially inappropriate medication use by the elderly. An update.Arch Intern Med.1997;157:1531–1536.
- .Delirium in older persons.N Engl J Med.2006;354:1157–1165.
- ,,,,.Sedative hypnotics in older people with insomnia: meta‐analysis of risks and benefits.BMJ.2005;331:1169.
- .Sleep in acute care units.Sleep Breath.2006;10:6–15.
- ,,,,.Quantity and quality of sleep in the surgical intensive care unit: are our patients sleeping?J Trauma.2007;63:1210–1214.
- ,.Sleep in the critically ill patient.Sleep.2006;29:707–716.
- ,,.Sleep quality in hospitalized patients.J Clin Nurs.2005;14:107–113.
- ,.Interactive relationships between hospital patients' noise‐induced stress and other stress with sleep.Heart Lung.2001;30:237–243.
- ,,, et al.A multicomponent intervention to prevent delirium in hospitalized older patients.N Engl J Med.1999;340:669–676.
- ,,,,.The Hospital Elder Life Program: a model of care to prevent cognitive and functional decline in older hospitalized patients. Hospital Elder Life Program.J Am Geriatr Soc.2000;48:1697–1706.
- ,,,,.Noise control: a nursing team's approach to sleep promotion.Am J Nurs.2004;104:40–48; quiz 48‐49.
- ,,,,,.A nonpharmacological intervention to improve sleep in nursing home patients: results of a controlled clinical trial.J Am Geriatr Soc.2006;54:38–47.
- ,,,,.The nursing home at night: effects of an intervention on noise, light, and sleep.J Am Geriatr Soc.1999;47:430–438.
- ,.Instrumentation to describe subjective sleep characteristics in healthy subjects.Res Nurs Health.1987;10:155–163.
- ,,,,.The role of adherence on the effectiveness of nonpharmacologic interventions: evidence from the delirium prevention trial.Arch Intern Med.2003;163:958–964.
- ,,.Patient perception of sleep quality and etiology of sleep disruption in the intensive care unit.Am J Respir Crit Care Med.1999;159:1155–1162.
- ,,.When sleep is perceived as wakefulness: an experimental study on state perception during physiological sleep.J Sleep Res.2007;16:346–353.
Improving Insulin Ordering Safely
The benefits of glycemic control include decreased patient morbidity, mortality, length of stay, and reduced hospital costs. In 2004, the American College of Endocrinology (ACE) issued glycemic guidelines for non‐critical‐care units (fasting glucose 110 mg/dL, nonfasting glucose 180 mg/dL).1 A comprehensive review of inpatient glycemic management called for development and evaluation of inpatient programs and tools.2 The 2006 ACE/American Diabetes Association (ADA) Statement on Inpatient Diabetes and Glycemic Control identified key components of an inpatient glycemic control program as: (1) solid administrative support; (2) a multidisciplinary committee; (3) assessment of current processes, care, and barriers; (4) development and implementation of order sets, protocols, policies, and educational efforts; and (5) metrics for evaluation.3
In 2003, Harborview Medical Center (HMC) formed a multidisciplinary committee to institute a Glycemic Control Program. The early goals were to decrease the use of sliding‐scale insulin, increase the appropriate use of basal and prandial insulin, and to avoid hypoglycemia. Here we report our program design and trends in physician insulin ordering from 2003 through 2006.
Patients and Methods
Setting
Seattle's HMC is a 400‐bed level‐1 regional trauma center managed by the University of Washington. The hospital's mission includes serving at‐risk populations. Based on illness, the University HealthSystem Consortium (UHC) assigns HMC the highest predicted mortality among its 131 affiliated hospitals nationwide.4
Patients
We included all patients hospitalized in non‐critical‐care wardsmedical, surgical, and psychiatric. Patients were categorized as dysglycemic if they: (1) received subcutaneous insulin or oral diabetic medications; or (2) had any single glucose level outside the normal range of 125 mg/dL or 60 mg/dL. Patients not meeting these criteria were classified as euglycemic. Approval was obtained from the University of Washington Human Subjects Review Committee.
Program Description
Since 2003, the multidisciplinary committeephysicians, nurses, pharmacy representatives, and dietary and administrative representativeshas directed the development of the Glycemic Control Program with support from hospital administration and the Department of Quality Improvement. Funding for this program has been provided by the hospital based on the prominence of glycemic control among quality and safety measures, a projected decrease in costs, and the high incidence of diabetes in our patient population. Figure 1 outlines the program's key interventions.

First, a Subcutaneous Insulin Order Form was released for elective use in May 2004 (Figure 2). This form incorporated the 3 components of quality insulin ordering (basal, scheduled prandial, and prandial correction dosing) and provides prompts and education. A Diabetes Nurse Specialist trained nursing staff on the use of the form.
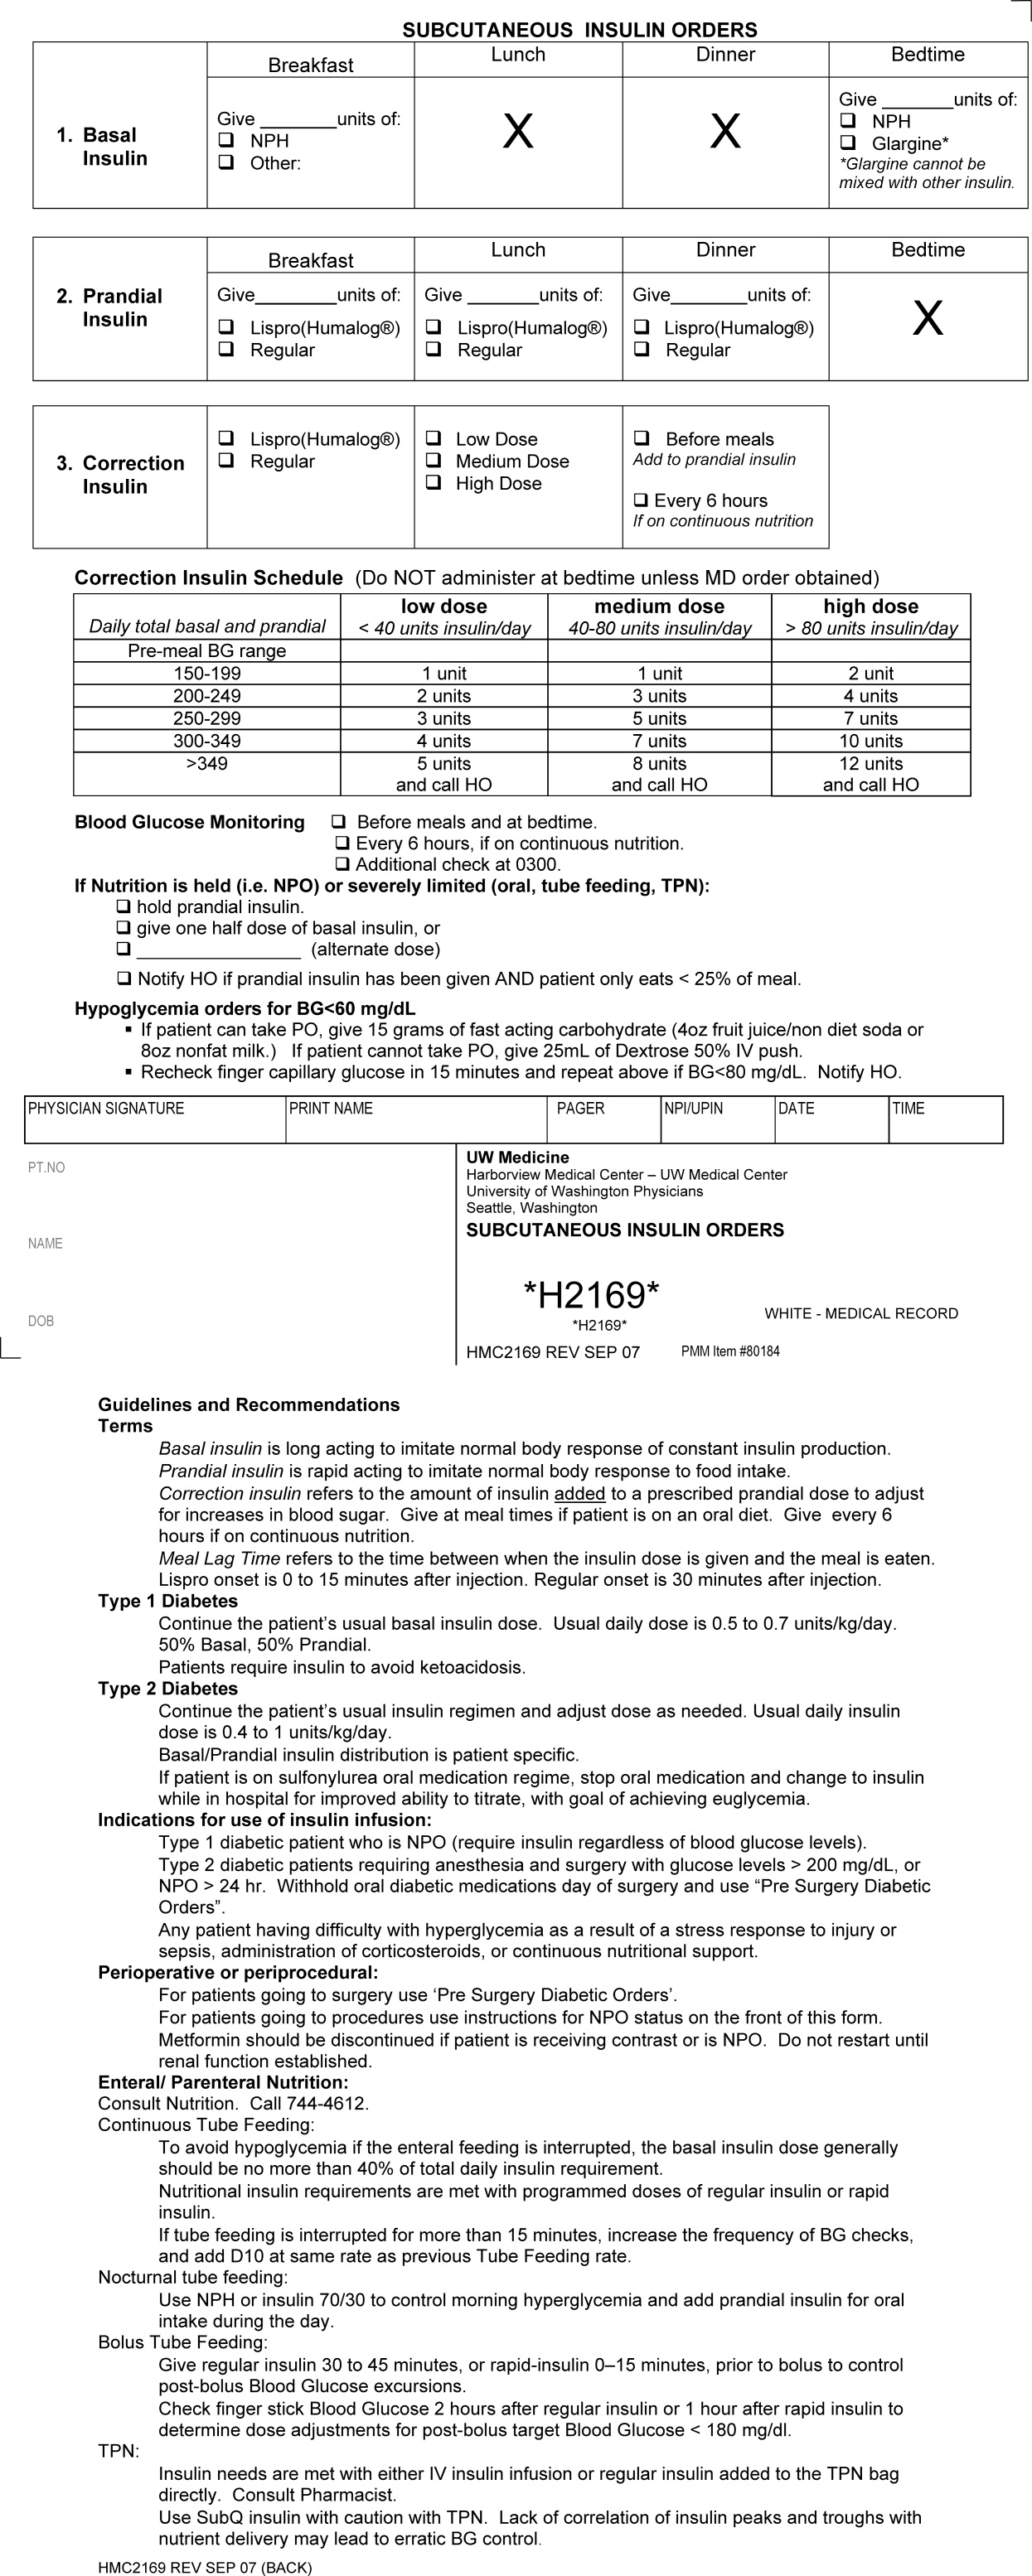
Second, we developed an automated daily data report identifying patients with out‐of‐range glucose levels defined as having any single glucose readings 60 mg/dL or any 2 readings 180 mg/dL within the prior 24 hours. In February 2006, this daily report became available to the clinicians on the committee.
Third, the Glycemic Control Program recruited a full‐time clinical Advanced Registered Nurse Practitioner (ARNP) and part‐time supervising physician to provide directed intervention and education for patients and medical personnel. Since August 2006, the ARNP has reviewed the out‐of‐range report daily, performs assessments, refines insulin orders, and educates clinicians. The assessments include chart review (of history and glycemic control), discussion with primary physician and nurse (and often the dietician), and interview of the patient and/or family. This leads to development and implementation of a glycemic control plan. Clinician education is performed both as direct education of the primary physician at the time of intervention and as didactic sessions.
Outcomes
Physician Insulin Ordering
The numbers of patients receiving basal and short‐acting insulin were identified from the electronic medication record. Basal insulin included glargine and neutral protamine Hagerdorn (NPH). Short‐acting insulin (lispro or regular) could be ordered as scheduled prandial, prandial correction, or sliding scale. The distinction between prandial correction and sliding scale is that correction precedes meals exclusively and is not intended for use without food; in contrast, sliding scale is given regardless of food being consumed and is considered substandard. Quality insulin ordering is defined as having basal, prandial scheduled, and prandial correction doses.
In the electronic record, however, we were unable to distinguish the intent of short‐acting insulin orders in the larger data set. Thus, we reviewed a subset of 100 randomly selected charts (25 from each year from 2003 through 2006) to differentiate scheduled prandial, prandial correction, and sliding scale.
Hyperglycemia
Hyperglycemia was defined as glucose 180 mg/dL. The proportion of dysglycemic patients with hyperglycemia was calculated daily as the percent of dysglycemic patients with any 2 glucose levels 180 mg/dL. Daily values were averaged for quarterly measures.
Hypoglycemia
Hypoglycemia was defined as glucose 60 mg/dL. The proportion of all dysglycemic patients with hypoglycemia was calculated daily as the percent of dysglycemic patients with a single glucose level of 60 mg/dL. Daily values were averaged for quarterly measures.
Data Collection
Data were retrieved from electronic medical records, hospital administrative decision support, and risk‐adjusted5 UHC clinical database information. Glucose data were obtained from laboratory records (venous) and nursing data from bedside chemsticks (capillary).
Statistical Analyses
Data were analyzed using SAS 9.1 (SAS Institute, Cary, NC) and SPSS 13.0 (SPSS, Chicago, IL). The mean and standard deviation (SD) for continuous variables and proportions for categorical variables were calculated. Data were examined, plotted, and trended over time. Where applicable, linear regression trend lines were fitted and tested for statistical significance (P value 0.05).
Results
Patients
In total, 44,225 patients were identified from January 1, 2003 through December 31, 2006; 18,087 patients (41%) were classified as dysglycemic as defined by either: (1) receiving insulin or oral diabetic medicine; or (2) having a glucose level 125 mg/dL or 60 mg/dL. Characteristics of the population are outlined in Table 1. Both groups shared similar ethnic distributions. Across all 4 years, dysglycemic patients tended to be older and have a higher severity of illness. As an additional descriptor of severity of illness, UHC mean expected length of stay (LOS) and mean expected mortality (risk‐adjusted5) were higher for dysglycemic patients.
| Dysglycemic | Euglycemic | |
|---|---|---|
| ||
| Number of patients | 18,088 | 26,144 |
| Age (years, mean SD) | 48.4 20.3 | 41.3 18.3 |
| Gender, male (%) | 64.7 | 62.7 |
| Ethnicity (%) | ||
| Caucasian | 68.2 | 70.1 |
| African‐American/Black | 11.0 | 12.0 |
| Hispanic | 6.8 | 6.2 |
| Native American | 1.8 | 18 |
| Asian | 7.9 | 5.5 |
| Unknown | 4.3 | 4.4 |
| UHC severity of illness index (%) | ||
| Minor | 18.3 | 38.8 |
| Moderate | 35.4 | 40.8 |
| Major | 29.5 | 16.7 |
| Extreme | 16.9 | 3.6 |
| UHC expected LOS (days, mean SD)* | 7.8 6.9 | 5.2 4.1 |
| UHC expected mortality (mean SD)* | 0.06 0.13 | 0.01 0.06 |
Physician Insulin Ordering
Ordering of both short‐acting and basal insulin increased (Figure 3). The ratio of short‐acting to basal orders decreased from 3.36 (1668/496) in 2003 to 1.97 (2226/1128) in 2006.
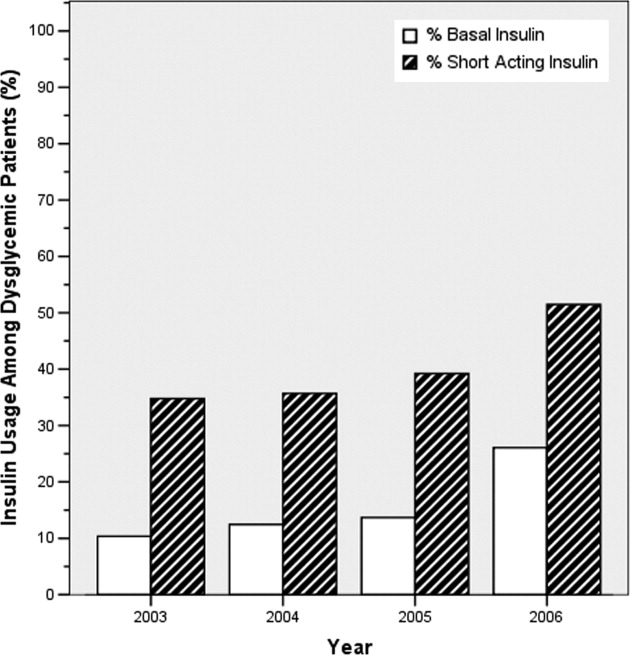
Chart review of the 100 randomly selected dysglycemic patients revealed increased ordering of prandial correction dosing from 8% of patients in 2003 to 32% in 2006. Yet, only 1 patient in 2003 and only 2 in 2006 had scheduled prandial. Ordering of sliding scale insulin fell from 16% in 2003 to 4% in 2006.
Glycemic Control Outcomes
The percentage of dysglycemic patients with hyperglycemia ranged from 19 to 24 without significant decline over the 4 years (Figure 4A). The percentage of hypoglycemic dysglycemic patients was increasing from 2003 to 2004, but in the years following the interventions (2005 through 2006) this declined significantly (P = 0.003; Figure 4B). On average, the observed LOS was higher for dysglycemic vs. euglycemic patients (mean SD days: 9.4 12.2 and 5.8 8.5, respectively). The mean observed to expected mortality ratio was 0.45 0.08 and 0.44 0.17 for the dysglycemic and euglycemic patients, respectively. Over the 4 years no statistically significant change in observed LOS or adjusted mortality was found (data not shown).
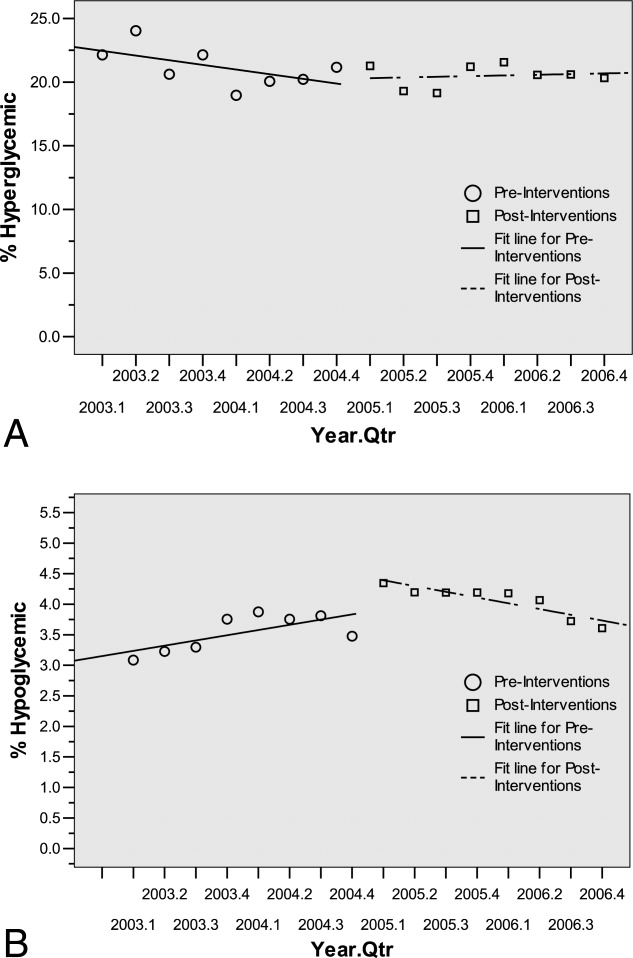
Conclusions
HMC, a safety net hospital with the highest UHC expected mortality of 131 hospitals nationwide, has demonstrated early successes in building its Glycemic Control Program, including: (1) decreased prescription of sliding scale; (2) a marked increase in prescription of basal insulin; and (3) significantly decreasing hypoglycemic events subsequent to the interventions. The decreased sliding scale and increased overall ordering of insulin could reflect increased awareness brought internationally through the literature and locally through our program. Two distinctive aspects of HMC's Glycemic Control Program, when compared to others,68 include: (1) the daily use of real‐time data to identify and target patients with out‐of‐range glucose levels; and (2) the coverage of all non‐critical‐care floors with a single clinician.
In 2003 and 2004, the increasing hypoglycemia we observed paralleled the international focus on aggressively treating hyperglycemia in the acute care setting. We observed a significant decrease in hypoglycemia in 2005 and 2006 that could be attributed to the education provided by the Glycemic Control Program and 2 features on the subcutaneous insulin order set: the prominent hypoglycemia protocol and the order hold prandial insulin if the patient cannot eat. These are similar features identified in a report on preventing hospital hypoglycemia.9 Additionally, hypoglycemia may have decreased secondary to the emphasis on not using short‐acting insulin at bedtime.
Despite increased and improved insulin ordering, we did not observe a significant change in the percent of dysglycemic patients with 2 glucose levels 180 mg/dL. In our program patients are identified for intervention after their glucose levels are out‐of‐range. To better evaluate the impact of our interventions on the glycemic control of each patient, we plan to analyze the glucose levels in the days following identification of patients. Alternatively, we could provide intervention to all patients with dysglycemia rather than waiting for glucoses to be out‐of‐range. Though this approach would require greater resources than the single clinician we currently employ.
Our early experience highlights areas for future evaluation and intervention. First, the lack of scheduled prandial insulin and that less than one‐third of dysglycemic patients have basal insulin ordered underscore a continued need to target quality insulin ordering to include all componentsbasal, scheduled prandial, and prandial correction. Second, while the daily report is a good rudimentary identification tool for at‐risk patients, it offers limited information as to the impact of our clinical intervention. Thus, refined evaluative metrics need be developed to prospectively assess the course of glycemic control for patients.
We acknowledge the limitations of this study. First, our most involved interventionthe addition of the clinical intervention teamcame only 6 months before the end of the study period. Second, this is an observational retrospective analysis and cannot distinguish confounders, such as physician preferences and decisions, that not easily quantified or controlled for. Third, our definition of dysglycemic incorporated 41% of non‐critical‐care patients, possibly reflecting too broad a definition.
In summary, we have described an inpatient Glycemic Control Program that relies on real‐time data to identify patients in need of intervention. Early in our program we observed improved insulin ordering quality and decreased rates of hypoglycemia. Future steps include evaluating the impact of our clinical intervention team and further refining glycemic control metrics to prospectively identify patients at risk for hyper‐ and hypoglycemia.
Acknowledgements
The authors thank Sofia Medvedev (UHC) and Derk B. Adams (HMC QI). The information contained in this article was based in part on the Clinical Data Products Data Base maintained by the UHC.
- ,,, et al.American College of Endocrinology position statement on inpatient diabetes and metabolic control.Endocr Pract.2004;10(suppl 2):4–9.
- ,,, et al.Management of diabetes and hyperglycemia in hospitals.Diabetes Care.2004;27:553–591.
- American College of Endocrinology and American Diabetes Association Consensus statement on inpatient diabetes and glycemic control.Diabetes Care.2006;29:1955–1962.
- University HealthSystem Consortium Mortality. Confidential Clinical Outcomes Report. Available at: http://www.uhc.edu. Accessed August2009 (Access with UHC permission only).
- Mortality risk adjustment for University HealthSystem Consortium's Clinical database. Available at: http://www.ahrq.gov/qual/mortality/Meurer.pdf. Accessed August2009.
- ,,, et al.Inpatient management of hyperglycemia: the Northwestern experience.Endocr Pract.2006;12:491–505.
- ,,,,.Evolution of a diabetes inpatient safety committee.Endocr Pract.2006;12(suppl 3):91–99.
- ,.Financial implications of glycemic control: results of an inpatient diabetes management program.Endocr Pract.2006;12(suppl 3):43–48.
- ,,, et al.Hospital hypoglycemia: not only treatment but also prevention.Endocr Pract.2004;10(suppl 2):89–99.
The benefits of glycemic control include decreased patient morbidity, mortality, length of stay, and reduced hospital costs. In 2004, the American College of Endocrinology (ACE) issued glycemic guidelines for non‐critical‐care units (fasting glucose 110 mg/dL, nonfasting glucose 180 mg/dL).1 A comprehensive review of inpatient glycemic management called for development and evaluation of inpatient programs and tools.2 The 2006 ACE/American Diabetes Association (ADA) Statement on Inpatient Diabetes and Glycemic Control identified key components of an inpatient glycemic control program as: (1) solid administrative support; (2) a multidisciplinary committee; (3) assessment of current processes, care, and barriers; (4) development and implementation of order sets, protocols, policies, and educational efforts; and (5) metrics for evaluation.3
In 2003, Harborview Medical Center (HMC) formed a multidisciplinary committee to institute a Glycemic Control Program. The early goals were to decrease the use of sliding‐scale insulin, increase the appropriate use of basal and prandial insulin, and to avoid hypoglycemia. Here we report our program design and trends in physician insulin ordering from 2003 through 2006.
Patients and Methods
Setting
Seattle's HMC is a 400‐bed level‐1 regional trauma center managed by the University of Washington. The hospital's mission includes serving at‐risk populations. Based on illness, the University HealthSystem Consortium (UHC) assigns HMC the highest predicted mortality among its 131 affiliated hospitals nationwide.4
Patients
We included all patients hospitalized in non‐critical‐care wardsmedical, surgical, and psychiatric. Patients were categorized as dysglycemic if they: (1) received subcutaneous insulin or oral diabetic medications; or (2) had any single glucose level outside the normal range of 125 mg/dL or 60 mg/dL. Patients not meeting these criteria were classified as euglycemic. Approval was obtained from the University of Washington Human Subjects Review Committee.
Program Description
Since 2003, the multidisciplinary committeephysicians, nurses, pharmacy representatives, and dietary and administrative representativeshas directed the development of the Glycemic Control Program with support from hospital administration and the Department of Quality Improvement. Funding for this program has been provided by the hospital based on the prominence of glycemic control among quality and safety measures, a projected decrease in costs, and the high incidence of diabetes in our patient population. Figure 1 outlines the program's key interventions.
First, a Subcutaneous Insulin Order Form was released for elective use in May 2004 (Figure 2). This form incorporated the 3 components of quality insulin ordering (basal, scheduled prandial, and prandial correction dosing) and provides prompts and education. A Diabetes Nurse Specialist trained nursing staff on the use of the form.
Second, we developed an automated daily data report identifying patients with out‐of‐range glucose levels defined as having any single glucose readings 60 mg/dL or any 2 readings 180 mg/dL within the prior 24 hours. In February 2006, this daily report became available to the clinicians on the committee.
Third, the Glycemic Control Program recruited a full‐time clinical Advanced Registered Nurse Practitioner (ARNP) and part‐time supervising physician to provide directed intervention and education for patients and medical personnel. Since August 2006, the ARNP has reviewed the out‐of‐range report daily, performs assessments, refines insulin orders, and educates clinicians. The assessments include chart review (of history and glycemic control), discussion with primary physician and nurse (and often the dietician), and interview of the patient and/or family. This leads to development and implementation of a glycemic control plan. Clinician education is performed both as direct education of the primary physician at the time of intervention and as didactic sessions.
Outcomes
Physician Insulin Ordering
The numbers of patients receiving basal and short‐acting insulin were identified from the electronic medication record. Basal insulin included glargine and neutral protamine Hagerdorn (NPH). Short‐acting insulin (lispro or regular) could be ordered as scheduled prandial, prandial correction, or sliding scale. The distinction between prandial correction and sliding scale is that correction precedes meals exclusively and is not intended for use without food; in contrast, sliding scale is given regardless of food being consumed and is considered substandard. Quality insulin ordering is defined as having basal, prandial scheduled, and prandial correction doses.
In the electronic record, however, we were unable to distinguish the intent of short‐acting insulin orders in the larger data set. Thus, we reviewed a subset of 100 randomly selected charts (25 from each year from 2003 through 2006) to differentiate scheduled prandial, prandial correction, and sliding scale.
Hyperglycemia
Hyperglycemia was defined as glucose 180 mg/dL. The proportion of dysglycemic patients with hyperglycemia was calculated daily as the percent of dysglycemic patients with any 2 glucose levels 180 mg/dL. Daily values were averaged for quarterly measures.
Hypoglycemia
Hypoglycemia was defined as glucose 60 mg/dL. The proportion of all dysglycemic patients with hypoglycemia was calculated daily as the percent of dysglycemic patients with a single glucose level of 60 mg/dL. Daily values were averaged for quarterly measures.
Data Collection
Data were retrieved from electronic medical records, hospital administrative decision support, and risk‐adjusted5 UHC clinical database information. Glucose data were obtained from laboratory records (venous) and nursing data from bedside chemsticks (capillary).
Statistical Analyses
Data were analyzed using SAS 9.1 (SAS Institute, Cary, NC) and SPSS 13.0 (SPSS, Chicago, IL). The mean and standard deviation (SD) for continuous variables and proportions for categorical variables were calculated. Data were examined, plotted, and trended over time. Where applicable, linear regression trend lines were fitted and tested for statistical significance (P value 0.05).
Results
Patients
In total, 44,225 patients were identified from January 1, 2003 through December 31, 2006; 18,087 patients (41%) were classified as dysglycemic as defined by either: (1) receiving insulin or oral diabetic medicine; or (2) having a glucose level 125 mg/dL or 60 mg/dL. Characteristics of the population are outlined in Table 1. Both groups shared similar ethnic distributions. Across all 4 years, dysglycemic patients tended to be older and have a higher severity of illness. As an additional descriptor of severity of illness, UHC mean expected length of stay (LOS) and mean expected mortality (risk‐adjusted5) were higher for dysglycemic patients.
| Dysglycemic | Euglycemic | |
|---|---|---|
| ||
| Number of patients | 18,088 | 26,144 |
| Age (years, mean SD) | 48.4 20.3 | 41.3 18.3 |
| Gender, male (%) | 64.7 | 62.7 |
| Ethnicity (%) | ||
| Caucasian | 68.2 | 70.1 |
| African‐American/Black | 11.0 | 12.0 |
| Hispanic | 6.8 | 6.2 |
| Native American | 1.8 | 18 |
| Asian | 7.9 | 5.5 |
| Unknown | 4.3 | 4.4 |
| UHC severity of illness index (%) | ||
| Minor | 18.3 | 38.8 |
| Moderate | 35.4 | 40.8 |
| Major | 29.5 | 16.7 |
| Extreme | 16.9 | 3.6 |
| UHC expected LOS (days, mean SD)* | 7.8 6.9 | 5.2 4.1 |
| UHC expected mortality (mean SD)* | 0.06 0.13 | 0.01 0.06 |
Physician Insulin Ordering
Ordering of both short‐acting and basal insulin increased (Figure 3). The ratio of short‐acting to basal orders decreased from 3.36 (1668/496) in 2003 to 1.97 (2226/1128) in 2006.
Chart review of the 100 randomly selected dysglycemic patients revealed increased ordering of prandial correction dosing from 8% of patients in 2003 to 32% in 2006. Yet, only 1 patient in 2003 and only 2 in 2006 had scheduled prandial. Ordering of sliding scale insulin fell from 16% in 2003 to 4% in 2006.
Glycemic Control Outcomes
The percentage of dysglycemic patients with hyperglycemia ranged from 19 to 24 without significant decline over the 4 years (Figure 4A). The percentage of hypoglycemic dysglycemic patients was increasing from 2003 to 2004, but in the years following the interventions (2005 through 2006) this declined significantly (P = 0.003; Figure 4B). On average, the observed LOS was higher for dysglycemic vs. euglycemic patients (mean SD days: 9.4 12.2 and 5.8 8.5, respectively). The mean observed to expected mortality ratio was 0.45 0.08 and 0.44 0.17 for the dysglycemic and euglycemic patients, respectively. Over the 4 years no statistically significant change in observed LOS or adjusted mortality was found (data not shown).
Conclusions
HMC, a safety net hospital with the highest UHC expected mortality of 131 hospitals nationwide, has demonstrated early successes in building its Glycemic Control Program, including: (1) decreased prescription of sliding scale; (2) a marked increase in prescription of basal insulin; and (3) significantly decreasing hypoglycemic events subsequent to the interventions. The decreased sliding scale and increased overall ordering of insulin could reflect increased awareness brought internationally through the literature and locally through our program. Two distinctive aspects of HMC's Glycemic Control Program, when compared to others,68 include: (1) the daily use of real‐time data to identify and target patients with out‐of‐range glucose levels; and (2) the coverage of all non‐critical‐care floors with a single clinician.
In 2003 and 2004, the increasing hypoglycemia we observed paralleled the international focus on aggressively treating hyperglycemia in the acute care setting. We observed a significant decrease in hypoglycemia in 2005 and 2006 that could be attributed to the education provided by the Glycemic Control Program and 2 features on the subcutaneous insulin order set: the prominent hypoglycemia protocol and the order hold prandial insulin if the patient cannot eat. These are similar features identified in a report on preventing hospital hypoglycemia.9 Additionally, hypoglycemia may have decreased secondary to the emphasis on not using short‐acting insulin at bedtime.
Despite increased and improved insulin ordering, we did not observe a significant change in the percent of dysglycemic patients with 2 glucose levels 180 mg/dL. In our program patients are identified for intervention after their glucose levels are out‐of‐range. To better evaluate the impact of our interventions on the glycemic control of each patient, we plan to analyze the glucose levels in the days following identification of patients. Alternatively, we could provide intervention to all patients with dysglycemia rather than waiting for glucoses to be out‐of‐range. Though this approach would require greater resources than the single clinician we currently employ.
Our early experience highlights areas for future evaluation and intervention. First, the lack of scheduled prandial insulin and that less than one‐third of dysglycemic patients have basal insulin ordered underscore a continued need to target quality insulin ordering to include all componentsbasal, scheduled prandial, and prandial correction. Second, while the daily report is a good rudimentary identification tool for at‐risk patients, it offers limited information as to the impact of our clinical intervention. Thus, refined evaluative metrics need be developed to prospectively assess the course of glycemic control for patients.
We acknowledge the limitations of this study. First, our most involved interventionthe addition of the clinical intervention teamcame only 6 months before the end of the study period. Second, this is an observational retrospective analysis and cannot distinguish confounders, such as physician preferences and decisions, that not easily quantified or controlled for. Third, our definition of dysglycemic incorporated 41% of non‐critical‐care patients, possibly reflecting too broad a definition.
In summary, we have described an inpatient Glycemic Control Program that relies on real‐time data to identify patients in need of intervention. Early in our program we observed improved insulin ordering quality and decreased rates of hypoglycemia. Future steps include evaluating the impact of our clinical intervention team and further refining glycemic control metrics to prospectively identify patients at risk for hyper‐ and hypoglycemia.
Acknowledgements
The authors thank Sofia Medvedev (UHC) and Derk B. Adams (HMC QI). The information contained in this article was based in part on the Clinical Data Products Data Base maintained by the UHC.
- ,,, et al.American College of Endocrinology position statement on inpatient diabetes and metabolic control.Endocr Pract.2004;10(suppl 2):4–9.
- ,,, et al.Management of diabetes and hyperglycemia in hospitals.Diabetes Care.2004;27:553–591.
- American College of Endocrinology and American Diabetes Association Consensus statement on inpatient diabetes and glycemic control.Diabetes Care.2006;29:1955–1962.
- University HealthSystem Consortium Mortality. Confidential Clinical Outcomes Report. Available at: http://www.uhc.edu. Accessed August2009 (Access with UHC permission only).
- Mortality risk adjustment for University HealthSystem Consortium's Clinical database. Available at: http://www.ahrq.gov/qual/mortality/Meurer.pdf. Accessed August2009.
- ,,, et al.Inpatient management of hyperglycemia: the Northwestern experience.Endocr Pract.2006;12:491–505.
- ,,,,.Evolution of a diabetes inpatient safety committee.Endocr Pract.2006;12(suppl 3):91–99.
- ,.Financial implications of glycemic control: results of an inpatient diabetes management program.Endocr Pract.2006;12(suppl 3):43–48.
- ,,, et al.Hospital hypoglycemia: not only treatment but also prevention.Endocr Pract.2004;10(suppl 2):89–99.
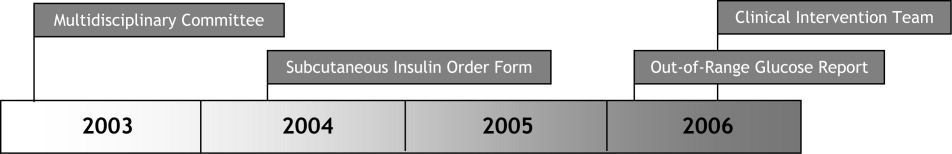
Enhanced End‐of‐Life Care and RRTs
In 2007, the Joint Commission for Accreditation of Healthcare Organizations (JCAHO) recommended deployment of rapid response teams (RRTs) in U.S. hospitals to hasten identification and treatment of physiologically unstable hospitalized patients.1 Clinical studies that have focused on whether RRTs improve restorative care outcomes, frequency of cardiac arrest, and critical care utilization have yielded mixed results.2‐11 One study suggested that RRTs might provide an opportunity to enhance palliative care of hospitalized patients.11 In this study, RRT personnel felt that prior do‐not‐resuscitate orders would have been appropriate in nearly a quarter of cases. However, no previous study has examined whether the RRT might be deployed to identify acutely decompensating patients who either do not want or would not benefit from a trial of aggressive restorative treatments. We hypothesized that actuation of an RRT in our hospital would expedite identification of patients not likely to benefit from restorative care and would promote more timely commencement of end‐of‐life comfort care, thereby improving their quality of death (QOD).12‐16
Materials and Methods
Study Design and Settings
This retrospective cohort study was approved by the Institutional Review Board (IRB) of and conducted at Bridgeport Hospital, a 425‐bed community teaching hospital. In October 2006, the hospital deployed its RRT, which includes a critical care nurse, respiratory therapist, and second‐year Medicine resident. Nurses on the hospital wards received educational in‐service training instructing them to request an RRT evaluation for: airway incompetence, oxygen desaturation despite fraction of inspired oxygen (FiO2) 60%, respiratory frequency 8 or >30/minute, heart rate 50 or >110/minute, systolic pressure 90 or >180 mmHg, acute significant bleeding, sudden neurologic changes, or patient changes that troubled the nurse. The critical care nurse and respiratory therapist responded to all calls. If assessment suggested a severe problem that required immediate physician supervision, the resident was summoned immediately. Otherwise, the nurse assessed the patient and suggested to the patient's primary doctor of record a trial of therapies. If ratified, the therapies were provided by the nurse and respiratory therapist until symptoms/signs resolved or failed to improve, in which case the resident‐physician was summoned. The resident‐physician would assess, attempt further relieving therapies, and, if appropriate, arrange for transfer to critical care units (in which case the case was presented to the staff intensivist who supervised care) after discussion with the patient and attending physician. No organizational changes in the administration or education of palliative care were implemented during the study period.
Data Extraction and Analysis
All patients dying in the hospital during the first 8 months of RRT activity (October 1, 2006 to May 31, 2007) and during the same months in the year prior to RRT were eligible for the study. Patients were excluded if they died in areas of the hospital not covered by the RRT, such as intensive care units, operating rooms, emergency department, recovery areas, or pediatric floors, or if they had been admitted or transferred to hospital wards with palliative care/end‐of‐life orders.
Physiologic data, including blood pressures (lowest), heart rate (highest), and respiratory rate (highest), were extracted from records of the 48 hours before and until resolution of the RRT assessment, or prior to death for those without RRT care. Outcomes were defined by World Health Organization (WHO) domains of palliative care (symptoms, social, and spiritual).14 The symptom domain was measured using patients' pain scores, 24 hours prior to death (0‐10). Subjective reports of healthcare providers recorded in hospital records, including the terms suffering, pain, anxiety, or distress were also extracted from notes 24 hours prior to patients' deaths. Administration of opioids in the 24 hours prior to death was also recorded. Social and spiritual domains were measured by documentation of presence of the family and chaplain, respectively, at the bedside in the 24 hours prior to death.
Analysis was performed using SPSS software (SPSS Inc., Chicago, IL). Categorical variables, described as proportions, were compared with chi‐square tests. Continuous variables are reported as means standard errors, or as medians with the interquartile ranges. Means were compared using Student t test if a normal distribution was detected. Nonparametric variables were compared with Wilcoxon rank sum tests. To adjust for confounding and assess possible effect modification, multiple logistic regression, multiple linear regression, and stratified analyses were performed when appropriate. Domains of the QOD were compared between patients who died in the pre‐RRT and post‐RRT epochs. Patients who died on hospital wards without RRT evaluation in the post‐RRT epoch were compared to those who died following RRT care. Unadjusted in‐hospital mortality, frequency of cardiopulmonary resuscitation, frequency of transfer from wards to critical care, and QOD were compiled and compared. A P value of 0.05 was considered statistically significant.
Results
A total of 394 patients died on the hospital wards and were not admitted with palliative, end‐of‐life medical therapies. The combined (pre‐RRT and post‐RRT epochs) cohort had a mean age of 77.2 13.2 years. A total of 48% were male, 79% White, 12% Black, and 8% Hispanic. A total of 128 patients (33%) were admitted to the hospital from a skilled nursing facility and 135 (35%) had written advance directives.
A total of 197 patients met the inclusion criteria during the pre‐RRT (October 1, 2005 to May 31, 2006) and 197 during the post‐RRT epochs (October 1, 2006 to May 31, 2007). There were no differences in age, sex, advance directives, ethnicity, or religion between the groups (Table 1). Primary admission diagnoses were significantly different; pre‐RRT patients were 9% more likely to die with malignancy compared to post‐RRT patients and less likely to come from nursing homes (38% vs. 27%; P = 0.02).
| Total | Pre‐RRT | Post‐RRT | P value | |
|---|---|---|---|---|
| ||||
| Total admissions | 25,943 | 12,926 | 13,017 | |
| Number of deaths | 394 | 197 | 197 | NS |
| Age (years) | 77.5 13.2 | 77.1 13.36 | 77.9 13.13 | 0.5 |
| Male gender | 190 (48%) | 99 (51%) | 91 (46%) | 0.4 |
| From SNF | 128 (32%) | 54 (27%) | 74 (38%) | 0.02 |
| Living will | 135 (34%) | 66 (33%) | 69 (35%) | 0.8 |
| Race | 0.3 | |||
| White | 314 (80%) | 163 (83%) | 151 (77%) | |
| Hispanic | 32 (8%) | 14 (7%) | 18 (9%) | |
| Black | 47 (12%) | 19 (10%) | 28 (14%) | |
| Other | 1 (1%) | 1 (1%) | 0 | |
| Religion (%) | 0.8 | |||
| Christian | 357 (91%) | 177 (90%) | 180 (91%) | |
| Non‐Christian | 37 (9%) | 20 (10%) | 17 (9%) | |
| Admission diagnosis | 0.01 | |||
| Malignancy | 96 (24%) | 56 (28%) | 40 (20%) | * |
| Sepsis | 44 (11%) | 21 (11%) | 23 (12%) | |
| Respiratory | 98 (25%) | 53 (27%) | 45 (23%) | * |
| Stroke | 31 (8%) | 16 (8%) | 15 (8%) | |
| Cardiac | 66 (17%) | 37 (19%) | 29 (15%) | * |
| Hepatic failure | 9 (2%) | 4 (2%) | 5 (2%) | |
| Surgical | 17 (5%) | 6 (3%) | 11 (5%) | |
| Others | 33 (8%) | 4 (2%) | 29 (15%) | * |
| Team | 0.01 | |||
| Medicine | 155 (39%) | 64 (32%) | 94 (47%) | |
| MICU | 44 (11%) | 3 (2%) | 41 (21%) | * |
| Surgery | 12 (3%) | 9 (5%) | 3 (1%) | |
| Restorative outcomes | ||||
| Mortality/1000 | 27/1000 | 30/1000 | 0.9 | |
| Unexpected ICU transfers/1000 | 17/1000 | 19/1000 | 0.8 | |
| CPR/1000 | 3/1000 | 2.5/1000 | 0.9 | |
Restorative Care Outcomes
Crude, unadjusted, in‐hospital mortality (27 vs. 30/1000 admissions), unexpected transfers to intensive care (17 vs. 19/1000 admissions), or cardiac arrests (3 vs. 2.5/1000 admissions) were similar in pre‐RRT and post‐RRT periods (all P > 0.05).
End‐of‐Life Care
At the time of death, 133 patients (68%) who died during the post‐RRT epoch had comfort care only orders whereas 90 (46%) had these orders in the pre‐RRT group (P = 0.0001; Table 2a). Post‐RRT patients were more likely than pre‐RRT patients to receive opioids prior to death (68% vs. 43%, respectively; P = 0.001) and had lower maximum pain scores in their last 24 hours (3.0 3.5 vs. 3.7 3.2; respectively; P = 0.045). Mention of patient distress by nurses in the hospital record following RRT deployment was less than one‐half of that recorded in the pre‐RRT period (26% vs. 62%; P = 0.0001). A chaplain visited post‐RRT patients in the 24 hours prior to death more frequently than in the pre‐RRT period (72% vs. 60%; P = 0.02). The frequency of family at the bedside was similar between epochs (61% post‐RRT vs. 58% pre‐RRT; P = 0.6). These findings were consistent across common primary diagnoses and origins (home vs. nursing home).
| a. Prior to RRT vs. During RRT Deployment | |||
|---|---|---|---|
| Pre‐RRT (n = 197) | Post‐RRT (n = 197) | P Value | |
| Comfort care only | 90 (46%) | 133 (68%) | 0.0001 |
| Pain score (0‐10) | 3.7 3.3 | 3.0 3.5 | 0.045 |
| Opioids administered | 84 (43%) | 134 (68%) | 0.0001 |
| Subjective suffering | 122 (62%) | 52 (26%) | 0.0001 |
| Family present | 115 (58%) | 120 (61%) | 0.6 |
| Chaplain present | 119 (60%) | 142 (72%) | 0.02 |
| b. During RRT Deployment: Those Dying with RRT Assessment vs. Those Dying Without | |||
| Post‐RRT RRT Care (n = 61) | Post‐RRT No RRT Care (n = 136) | P Value | |
| Comfort care only | 46 (75%) | 87 (64%) | 0.1 |
| Pain score (0‐10) | 3.0 3.5 | 3.0 3.5 | 0.9 |
| Opioids administered | 42 (69%) | 92 (67%) | 0.8 |
| Subjective suffering | 18 (29%) | 34 (25%) | 0.9 |
| Family present | 43 (71%) | 77 (57%) | 0.06 |
| Chaplain present | 49 (80%) | 93 (68%) | 0.0001 |
| c. Comparing Before and During RRT Deployment: Those Dying Without RRT Assessment | |||
| Pre‐RRT (n = 197) | Post‐RRT No RRT Care (n = 136) | P Value | |
| Comfort care (only) | 90 (46%) | 87 (64%) | 0.0001 |
| Pain score (0‐10) | 3.7 3.3 | 3.0 3.5 | 0.06 |
| Opioids administered | 84 (43%) | 92 (67%) | 0.0001 |
| Subjective suffering | 122 (62%) | 34 (25%) | 0.0001 |
| Family present | 115 (58%) | 77 (56.6%) | 0.8 |
| Chaplain present | 119 (60) | 74 (54.4%) | 0.2 |
Adjusting for age, gender, and race, the odds ratio (OR) of patients receiving formal end‐of‐life medical orders in post‐RRT was 2.5 that of pre‐RRT (95% confidence interval [CI], 1.7‐3.8), and odds of receiving opioids prior to death were nearly 3 times pre‐RRT (OR, 2.8; 95% CI, 1.9‐4.3). The odds of written mention of post‐RRT patients' suffering in the medical record was less than one‐fourth that of pre‐RRT patients (OR, 0.23; 95% CI, 0.2‐0.4).
To examine whether temporal trends might account for observed differences, patients in the post‐RRT period who received RRT care were compared to those who did not. Sixty‐one patients died with RRT assessments, whereas 136 died without RRT evaluations. End‐of‐life care outcomes were similar for these 2 groups, except more patients with RRT care had chaplain visits proximate to the time of death (80% vs. 68%; P = 0.0001; Table 2b). Outcomes (including comfort care orders, opioid administration, and suffering) of dying patients not cared for by the RRT (after deployment) were superior to those of pre‐RRT dying patients (Table 2c).
Discussion
This pilot study hypothesizes that our RRT impacted patients' QOD. Deployment of the RRT in our hospital was associated with improvement in both symptom and psychospiritual domains of care. Theoretically, RRTs should improve quality‐of‐care via early identification/reversal of physiologic decompensation. By either reversing acute diatheses with an expeditious trial of therapy or failing to reverse with early actuation of palliative therapies, the duration and magnitude of human suffering should be reduced. Attenuation of both duration and magnitude of suffering is the ultimate goal of both restorative and palliative care and is as important an outcome as mortality or length of stay. Previous studies of RRTs have focused on efficacy in reversing the decompensation: preventing cardiopulmonary arrest, avoiding the need for invasive, expensive, labor‐intensive interventions. Our RRT, like others, had no demonstrable impact on restorative outcomes. However, deployment of the RRT was highly associated with improved QOD of our patients. The impact was significant across WHO‐specified domains: pain scores decreased by 19%; (documentation of) patients' distress decreased by 50%; and chaplains' visits were more often documented in the 24 hours prior to death. These relationships held across common disease diagnoses, so the association is unlikely to be spurious.
Outcomes were similarly improved in patients who did not receive RRT care in the post‐RRT epoch. Our hospital did not have a palliative care service in either time period. No new educational efforts among physicians or nurses accounted for this observation. While it is possible that temporal effects accounted for our observation, an equally plausible explanation is that staff observed RRT interventions and applied them to dying patients not seen by the RRT. Our hospital educated caregivers regarding the RRT triggers, and simply making hospital personnel more vigilant for signs of suffering and/or observing the RRT approach may have contributed to enhanced end‐of‐life care for non‐RRT patients.
There are a number of limitations in this study. First, the sample size was relatively small compared to other published studies,2‐11 promoting the possibility that either epoch was not representative of pre‐RRT and post‐RRT parent populations. Another weakness is that QOD was measured using surrogate endpoints. The dead cannot be interviewed to definitively examine QOD; indices of cardiopulmonary distress and psychosocial measures (eg, religious preparations, family involvement) are endpoints suggested by palliative care investigators12, 13 and the World Health Organization.14 While some validated tools17 and consensus measures18 exist for critically ill patients, they do not readily apply to RRT patients. Retrospective records reviews raise the possibility of bias in extracting objective and subjective data. While we attempted to control for this by creating uniform a priori rules for data acquisition (ie, at what intervals and in which parts of the record they could be extracted), we cannot discount the possibility that bias affected the observed results. Finally, improvements in end‐of‐life care could have resulted from temporal trends. This retrospective study cannot prove a causeeffect relationship; a prospective randomized trial would be required to answer the question definitively. Based on the available data suggesting some benefit in restorative outcomes2‐8 and pressure from federal regulators to deploy RRTs regardless,1 a retrospective cohort design may provide the only realistic means of addressing this question.
In conclusion, this is the first (pilot) study to examine end‐of‐life outcomes associated with deployment of an RRT. While the limitations of these observations preclude firm conclusions, the plausibility of the hypothesis, coupled with our observations, suggests that this is a fertile area for future research. While RRTs may enhance restorative outcomes, to the extent that they hasten identification of candidates for palliative end‐of‐life‐care, before administration of invasive modalities that some patients do not want, these teams may simultaneously serve patients and reduce hospital resource utilization.
Addendum
Prior to publication, a contemporaneous study was published that concluded: These findings suggest that rapid response teams may not be decreasing code rates as much as catalyzing a compassionate dialogue of end‐of‐life care among terminally ill patients. This ability to improve end‐of‐life care may be an important benefit of rapid response teams, particularly given the difficulties in prior trials to increase rates of DNR status among seriously ill inpatients and potential decreases in resource use. Chan PS, Khalid A, Longmore LS, Berg RA, Midhail Kosiborod M, Spertus JA. Hospital‐wide code rates and mortality before and after implementation of a rapid response team. JAMA 2008;300: 25062513.
- Joint Commission on the Accreditation of Healthcare Organizations. The Joint Commission 2007 National Patient Safety Goals. Available at: http://www.jointcommission.org/NR/rdonlyres/BD4D59E0‐6D53‐404C‐8507‐883AF3BBC50A/0/audio_conference_091307.pdf. Accessed February2009.
- ,,, et al.Introducing critical care outreach: a ward‐randomised trial of phased introduction in a general hospital.Intensive Care Med.2004;30:1398–1404.
- ,,, et al.The effect of a MET team on postoperative morbidity and mortality rates.Crit Care Med.2004;32:916–921.
- ,,,,,.Effects of a medical emergency team on reduction of incidence of and mortality from unexpected cardiac arrests in hospital: a preliminary study.BMJ.2002;324:1–5.
- ,,, et al.Long‐term effect of a medical emergency team on mortality in a teaching hospital.Resuscitation.2007;74:235–241.
- ,,, et al.Use of medical emergency team responses to reduce hospital cardiopulmonary arrests.Qual Saf Health Care.2004;13:251–254.
- ,,, et al.Long‐term effect of a rapid response team on cardiac arrests in a teaching hospital.Crit Care.2005;R808–R815.
- ,,, et al.The effect of a rapid response team on major clinical outcome measures in a community teaching hospital.Crit Care Med.2007;35:2076–2082.
- ,,, et al.Introduction of a rapid response team (RRT) system: a cluster‐randomised trail.Lancet.2005;365:2901–2907.
- ,,, et al.Effect of a rapid response team on hospital‐wide mortality and code rates outside the ICU in a children's hospital.JAMA.2007;298:2267–2274.
- ,,,,.The medical emergency team: 12 month analysis of reasons for activation, immediate outcome and not‐for‐resuscitation orders.Resuscitation.2001;50:39–44.
- ,,.Evaluating the quality of dying and death.J Pain Symptom Manage.2001;22:717–726.
- ,.Measuring success of interventions to improve the quality of end‐of‐life care in the intensive care unit.Crit Care Med.2006;34:S341–S347.
- World Health Organization. WHO definition of palliative care. Available at: http://www.who.int/cancer/palliative/definition/en. Accessed February 2009.
- .Does a living will equal a DNR? Are living wills compromising patient safety?J Emerg Med.2007;33:299–305.
- ,,,,,.Quality of dying and death in two medical ICUs.Chest.2005;127:1775–1783.
- ,,,.Using the medical record to evaluate the quality of end‐of‐life care in the intensive care unit.Crit Care Med.2008;36:1138–1146.
- ,,, et al.Proposed quality of measures for palliative care in the critically ill: a consensus from the Robert Wood Johnson Foundation Critical Care Workgroup.Crit Care Med.2006;34:S404–S411.
In 2007, the Joint Commission for Accreditation of Healthcare Organizations (JCAHO) recommended deployment of rapid response teams (RRTs) in U.S. hospitals to hasten identification and treatment of physiologically unstable hospitalized patients.1 Clinical studies that have focused on whether RRTs improve restorative care outcomes, frequency of cardiac arrest, and critical care utilization have yielded mixed results.2‐11 One study suggested that RRTs might provide an opportunity to enhance palliative care of hospitalized patients.11 In this study, RRT personnel felt that prior do‐not‐resuscitate orders would have been appropriate in nearly a quarter of cases. However, no previous study has examined whether the RRT might be deployed to identify acutely decompensating patients who either do not want or would not benefit from a trial of aggressive restorative treatments. We hypothesized that actuation of an RRT in our hospital would expedite identification of patients not likely to benefit from restorative care and would promote more timely commencement of end‐of‐life comfort care, thereby improving their quality of death (QOD).12‐16
Materials and Methods
Study Design and Settings
This retrospective cohort study was approved by the Institutional Review Board (IRB) of and conducted at Bridgeport Hospital, a 425‐bed community teaching hospital. In October 2006, the hospital deployed its RRT, which includes a critical care nurse, respiratory therapist, and second‐year Medicine resident. Nurses on the hospital wards received educational in‐service training instructing them to request an RRT evaluation for: airway incompetence, oxygen desaturation despite fraction of inspired oxygen (FiO2) 60%, respiratory frequency 8 or >30/minute, heart rate 50 or >110/minute, systolic pressure 90 or >180 mmHg, acute significant bleeding, sudden neurologic changes, or patient changes that troubled the nurse. The critical care nurse and respiratory therapist responded to all calls. If assessment suggested a severe problem that required immediate physician supervision, the resident was summoned immediately. Otherwise, the nurse assessed the patient and suggested to the patient's primary doctor of record a trial of therapies. If ratified, the therapies were provided by the nurse and respiratory therapist until symptoms/signs resolved or failed to improve, in which case the resident‐physician was summoned. The resident‐physician would assess, attempt further relieving therapies, and, if appropriate, arrange for transfer to critical care units (in which case the case was presented to the staff intensivist who supervised care) after discussion with the patient and attending physician. No organizational changes in the administration or education of palliative care were implemented during the study period.
Data Extraction and Analysis
All patients dying in the hospital during the first 8 months of RRT activity (October 1, 2006 to May 31, 2007) and during the same months in the year prior to RRT were eligible for the study. Patients were excluded if they died in areas of the hospital not covered by the RRT, such as intensive care units, operating rooms, emergency department, recovery areas, or pediatric floors, or if they had been admitted or transferred to hospital wards with palliative care/end‐of‐life orders.
Physiologic data, including blood pressures (lowest), heart rate (highest), and respiratory rate (highest), were extracted from records of the 48 hours before and until resolution of the RRT assessment, or prior to death for those without RRT care. Outcomes were defined by World Health Organization (WHO) domains of palliative care (symptoms, social, and spiritual).14 The symptom domain was measured using patients' pain scores, 24 hours prior to death (0‐10). Subjective reports of healthcare providers recorded in hospital records, including the terms suffering, pain, anxiety, or distress were also extracted from notes 24 hours prior to patients' deaths. Administration of opioids in the 24 hours prior to death was also recorded. Social and spiritual domains were measured by documentation of presence of the family and chaplain, respectively, at the bedside in the 24 hours prior to death.
Analysis was performed using SPSS software (SPSS Inc., Chicago, IL). Categorical variables, described as proportions, were compared with chi‐square tests. Continuous variables are reported as means standard errors, or as medians with the interquartile ranges. Means were compared using Student t test if a normal distribution was detected. Nonparametric variables were compared with Wilcoxon rank sum tests. To adjust for confounding and assess possible effect modification, multiple logistic regression, multiple linear regression, and stratified analyses were performed when appropriate. Domains of the QOD were compared between patients who died in the pre‐RRT and post‐RRT epochs. Patients who died on hospital wards without RRT evaluation in the post‐RRT epoch were compared to those who died following RRT care. Unadjusted in‐hospital mortality, frequency of cardiopulmonary resuscitation, frequency of transfer from wards to critical care, and QOD were compiled and compared. A P value of 0.05 was considered statistically significant.
Results
A total of 394 patients died on the hospital wards and were not admitted with palliative, end‐of‐life medical therapies. The combined (pre‐RRT and post‐RRT epochs) cohort had a mean age of 77.2 13.2 years. A total of 48% were male, 79% White, 12% Black, and 8% Hispanic. A total of 128 patients (33%) were admitted to the hospital from a skilled nursing facility and 135 (35%) had written advance directives.
A total of 197 patients met the inclusion criteria during the pre‐RRT (October 1, 2005 to May 31, 2006) and 197 during the post‐RRT epochs (October 1, 2006 to May 31, 2007). There were no differences in age, sex, advance directives, ethnicity, or religion between the groups (Table 1). Primary admission diagnoses were significantly different; pre‐RRT patients were 9% more likely to die with malignancy compared to post‐RRT patients and less likely to come from nursing homes (38% vs. 27%; P = 0.02).
| Total | Pre‐RRT | Post‐RRT | P value | |
|---|---|---|---|---|
| ||||
| Total admissions | 25,943 | 12,926 | 13,017 | |
| Number of deaths | 394 | 197 | 197 | NS |
| Age (years) | 77.5 13.2 | 77.1 13.36 | 77.9 13.13 | 0.5 |
| Male gender | 190 (48%) | 99 (51%) | 91 (46%) | 0.4 |
| From SNF | 128 (32%) | 54 (27%) | 74 (38%) | 0.02 |
| Living will | 135 (34%) | 66 (33%) | 69 (35%) | 0.8 |
| Race | 0.3 | |||
| White | 314 (80%) | 163 (83%) | 151 (77%) | |
| Hispanic | 32 (8%) | 14 (7%) | 18 (9%) | |
| Black | 47 (12%) | 19 (10%) | 28 (14%) | |
| Other | 1 (1%) | 1 (1%) | 0 | |
| Religion (%) | 0.8 | |||
| Christian | 357 (91%) | 177 (90%) | 180 (91%) | |
| Non‐Christian | 37 (9%) | 20 (10%) | 17 (9%) | |
| Admission diagnosis | 0.01 | |||
| Malignancy | 96 (24%) | 56 (28%) | 40 (20%) | * |
| Sepsis | 44 (11%) | 21 (11%) | 23 (12%) | |
| Respiratory | 98 (25%) | 53 (27%) | 45 (23%) | * |
| Stroke | 31 (8%) | 16 (8%) | 15 (8%) | |
| Cardiac | 66 (17%) | 37 (19%) | 29 (15%) | * |
| Hepatic failure | 9 (2%) | 4 (2%) | 5 (2%) | |
| Surgical | 17 (5%) | 6 (3%) | 11 (5%) | |
| Others | 33 (8%) | 4 (2%) | 29 (15%) | * |
| Team | 0.01 | |||
| Medicine | 155 (39%) | 64 (32%) | 94 (47%) | |
| MICU | 44 (11%) | 3 (2%) | 41 (21%) | * |
| Surgery | 12 (3%) | 9 (5%) | 3 (1%) | |
| Restorative outcomes | ||||
| Mortality/1000 | 27/1000 | 30/1000 | 0.9 | |
| Unexpected ICU transfers/1000 | 17/1000 | 19/1000 | 0.8 | |
| CPR/1000 | 3/1000 | 2.5/1000 | 0.9 | |
Restorative Care Outcomes
Crude, unadjusted, in‐hospital mortality (27 vs. 30/1000 admissions), unexpected transfers to intensive care (17 vs. 19/1000 admissions), or cardiac arrests (3 vs. 2.5/1000 admissions) were similar in pre‐RRT and post‐RRT periods (all P > 0.05).
End‐of‐Life Care
At the time of death, 133 patients (68%) who died during the post‐RRT epoch had comfort care only orders whereas 90 (46%) had these orders in the pre‐RRT group (P = 0.0001; Table 2a). Post‐RRT patients were more likely than pre‐RRT patients to receive opioids prior to death (68% vs. 43%, respectively; P = 0.001) and had lower maximum pain scores in their last 24 hours (3.0 3.5 vs. 3.7 3.2; respectively; P = 0.045). Mention of patient distress by nurses in the hospital record following RRT deployment was less than one‐half of that recorded in the pre‐RRT period (26% vs. 62%; P = 0.0001). A chaplain visited post‐RRT patients in the 24 hours prior to death more frequently than in the pre‐RRT period (72% vs. 60%; P = 0.02). The frequency of family at the bedside was similar between epochs (61% post‐RRT vs. 58% pre‐RRT; P = 0.6). These findings were consistent across common primary diagnoses and origins (home vs. nursing home).
| a. Prior to RRT vs. During RRT Deployment | |||
|---|---|---|---|
| Pre‐RRT (n = 197) | Post‐RRT (n = 197) | P Value | |
| Comfort care only | 90 (46%) | 133 (68%) | 0.0001 |
| Pain score (0‐10) | 3.7 3.3 | 3.0 3.5 | 0.045 |
| Opioids administered | 84 (43%) | 134 (68%) | 0.0001 |
| Subjective suffering | 122 (62%) | 52 (26%) | 0.0001 |
| Family present | 115 (58%) | 120 (61%) | 0.6 |
| Chaplain present | 119 (60%) | 142 (72%) | 0.02 |
| b. During RRT Deployment: Those Dying with RRT Assessment vs. Those Dying Without | |||
| Post‐RRT RRT Care (n = 61) | Post‐RRT No RRT Care (n = 136) | P Value | |
| Comfort care only | 46 (75%) | 87 (64%) | 0.1 |
| Pain score (0‐10) | 3.0 3.5 | 3.0 3.5 | 0.9 |
| Opioids administered | 42 (69%) | 92 (67%) | 0.8 |
| Subjective suffering | 18 (29%) | 34 (25%) | 0.9 |
| Family present | 43 (71%) | 77 (57%) | 0.06 |
| Chaplain present | 49 (80%) | 93 (68%) | 0.0001 |
| c. Comparing Before and During RRT Deployment: Those Dying Without RRT Assessment | |||
| Pre‐RRT (n = 197) | Post‐RRT No RRT Care (n = 136) | P Value | |
| Comfort care (only) | 90 (46%) | 87 (64%) | 0.0001 |
| Pain score (0‐10) | 3.7 3.3 | 3.0 3.5 | 0.06 |
| Opioids administered | 84 (43%) | 92 (67%) | 0.0001 |
| Subjective suffering | 122 (62%) | 34 (25%) | 0.0001 |
| Family present | 115 (58%) | 77 (56.6%) | 0.8 |
| Chaplain present | 119 (60) | 74 (54.4%) | 0.2 |
Adjusting for age, gender, and race, the odds ratio (OR) of patients receiving formal end‐of‐life medical orders in post‐RRT was 2.5 that of pre‐RRT (95% confidence interval [CI], 1.7‐3.8), and odds of receiving opioids prior to death were nearly 3 times pre‐RRT (OR, 2.8; 95% CI, 1.9‐4.3). The odds of written mention of post‐RRT patients' suffering in the medical record was less than one‐fourth that of pre‐RRT patients (OR, 0.23; 95% CI, 0.2‐0.4).
To examine whether temporal trends might account for observed differences, patients in the post‐RRT period who received RRT care were compared to those who did not. Sixty‐one patients died with RRT assessments, whereas 136 died without RRT evaluations. End‐of‐life care outcomes were similar for these 2 groups, except more patients with RRT care had chaplain visits proximate to the time of death (80% vs. 68%; P = 0.0001; Table 2b). Outcomes (including comfort care orders, opioid administration, and suffering) of dying patients not cared for by the RRT (after deployment) were superior to those of pre‐RRT dying patients (Table 2c).
Discussion
This pilot study hypothesizes that our RRT impacted patients' QOD. Deployment of the RRT in our hospital was associated with improvement in both symptom and psychospiritual domains of care. Theoretically, RRTs should improve quality‐of‐care via early identification/reversal of physiologic decompensation. By either reversing acute diatheses with an expeditious trial of therapy or failing to reverse with early actuation of palliative therapies, the duration and magnitude of human suffering should be reduced. Attenuation of both duration and magnitude of suffering is the ultimate goal of both restorative and palliative care and is as important an outcome as mortality or length of stay. Previous studies of RRTs have focused on efficacy in reversing the decompensation: preventing cardiopulmonary arrest, avoiding the need for invasive, expensive, labor‐intensive interventions. Our RRT, like others, had no demonstrable impact on restorative outcomes. However, deployment of the RRT was highly associated with improved QOD of our patients. The impact was significant across WHO‐specified domains: pain scores decreased by 19%; (documentation of) patients' distress decreased by 50%; and chaplains' visits were more often documented in the 24 hours prior to death. These relationships held across common disease diagnoses, so the association is unlikely to be spurious.
Outcomes were similarly improved in patients who did not receive RRT care in the post‐RRT epoch. Our hospital did not have a palliative care service in either time period. No new educational efforts among physicians or nurses accounted for this observation. While it is possible that temporal effects accounted for our observation, an equally plausible explanation is that staff observed RRT interventions and applied them to dying patients not seen by the RRT. Our hospital educated caregivers regarding the RRT triggers, and simply making hospital personnel more vigilant for signs of suffering and/or observing the RRT approach may have contributed to enhanced end‐of‐life care for non‐RRT patients.
There are a number of limitations in this study. First, the sample size was relatively small compared to other published studies,2‐11 promoting the possibility that either epoch was not representative of pre‐RRT and post‐RRT parent populations. Another weakness is that QOD was measured using surrogate endpoints. The dead cannot be interviewed to definitively examine QOD; indices of cardiopulmonary distress and psychosocial measures (eg, religious preparations, family involvement) are endpoints suggested by palliative care investigators12, 13 and the World Health Organization.14 While some validated tools17 and consensus measures18 exist for critically ill patients, they do not readily apply to RRT patients. Retrospective records reviews raise the possibility of bias in extracting objective and subjective data. While we attempted to control for this by creating uniform a priori rules for data acquisition (ie, at what intervals and in which parts of the record they could be extracted), we cannot discount the possibility that bias affected the observed results. Finally, improvements in end‐of‐life care could have resulted from temporal trends. This retrospective study cannot prove a causeeffect relationship; a prospective randomized trial would be required to answer the question definitively. Based on the available data suggesting some benefit in restorative outcomes2‐8 and pressure from federal regulators to deploy RRTs regardless,1 a retrospective cohort design may provide the only realistic means of addressing this question.
In conclusion, this is the first (pilot) study to examine end‐of‐life outcomes associated with deployment of an RRT. While the limitations of these observations preclude firm conclusions, the plausibility of the hypothesis, coupled with our observations, suggests that this is a fertile area for future research. While RRTs may enhance restorative outcomes, to the extent that they hasten identification of candidates for palliative end‐of‐life‐care, before administration of invasive modalities that some patients do not want, these teams may simultaneously serve patients and reduce hospital resource utilization.
Addendum
Prior to publication, a contemporaneous study was published that concluded: These findings suggest that rapid response teams may not be decreasing code rates as much as catalyzing a compassionate dialogue of end‐of‐life care among terminally ill patients. This ability to improve end‐of‐life care may be an important benefit of rapid response teams, particularly given the difficulties in prior trials to increase rates of DNR status among seriously ill inpatients and potential decreases in resource use. Chan PS, Khalid A, Longmore LS, Berg RA, Midhail Kosiborod M, Spertus JA. Hospital‐wide code rates and mortality before and after implementation of a rapid response team. JAMA 2008;300: 25062513.
- Joint Commission on the Accreditation of Healthcare Organizations. The Joint Commission 2007 National Patient Safety Goals. Available at: http://www.jointcommission.org/NR/rdonlyres/BD4D59E0‐6D53‐404C‐8507‐883AF3BBC50A/0/audio_conference_091307.pdf. Accessed February2009.
- ,,, et al.Introducing critical care outreach: a ward‐randomised trial of phased introduction in a general hospital.Intensive Care Med.2004;30:1398–1404.
- ,,, et al.The effect of a MET team on postoperative morbidity and mortality rates.Crit Care Med.2004;32:916–921.
- ,,,,,.Effects of a medical emergency team on reduction of incidence of and mortality from unexpected cardiac arrests in hospital: a preliminary study.BMJ.2002;324:1–5.
- ,,, et al.Long‐term effect of a medical emergency team on mortality in a teaching hospital.Resuscitation.2007;74:235–241.
- ,,, et al.Use of medical emergency team responses to reduce hospital cardiopulmonary arrests.Qual Saf Health Care.2004;13:251–254.
- ,,, et al.Long‐term effect of a rapid response team on cardiac arrests in a teaching hospital.Crit Care.2005;R808–R815.
- ,,, et al.The effect of a rapid response team on major clinical outcome measures in a community teaching hospital.Crit Care Med.2007;35:2076–2082.
- ,,, et al.Introduction of a rapid response team (RRT) system: a cluster‐randomised trail.Lancet.2005;365:2901–2907.
- ,,, et al.Effect of a rapid response team on hospital‐wide mortality and code rates outside the ICU in a children's hospital.JAMA.2007;298:2267–2274.
- ,,,,.The medical emergency team: 12 month analysis of reasons for activation, immediate outcome and not‐for‐resuscitation orders.Resuscitation.2001;50:39–44.
- ,,.Evaluating the quality of dying and death.J Pain Symptom Manage.2001;22:717–726.
- ,.Measuring success of interventions to improve the quality of end‐of‐life care in the intensive care unit.Crit Care Med.2006;34:S341–S347.
- World Health Organization. WHO definition of palliative care. Available at: http://www.who.int/cancer/palliative/definition/en. Accessed February 2009.
- .Does a living will equal a DNR? Are living wills compromising patient safety?J Emerg Med.2007;33:299–305.
- ,,,,,.Quality of dying and death in two medical ICUs.Chest.2005;127:1775–1783.
- ,,,.Using the medical record to evaluate the quality of end‐of‐life care in the intensive care unit.Crit Care Med.2008;36:1138–1146.
- ,,, et al.Proposed quality of measures for palliative care in the critically ill: a consensus from the Robert Wood Johnson Foundation Critical Care Workgroup.Crit Care Med.2006;34:S404–S411.
Hospitalist Role in PICC Use
Peripherally inserted central catheters (PICCs) are being used with greater frequency than ever before for intravenous access in hospitals, and PICCs may offer advantages in safety over traditional central venous catheters (CVCs). Despite these potential advantages, a large number of CVCs are still being placed. In a recent 1‐day survey of 6 large urban teaching hospitals, 29% of all patients had a CVC in place (59.3% of intensive care unit [ICU] patients and 23.7% of non‐ICU patients).1 Most catheters were inserted in the subclavian (55%) or jugular (22%) veins, with femoral (6%) and peripheral (15%) sites less commonly used. Even in the non‐ICU setting, only 20% of all central catheters were PICCs.
PICCs may offer advantages over centrally‐inserted intravenous catheters, such as the reduced risks of pneumothorax,2 arterial puncture, uncontrolled bleeding of large central veins, central lineassociated bloodstream infections (CLAB),3, 4 and lower cost.5 In addition, central venous pressure monitoring can now be performed with the larger‐bore PICCs.6
The low risk of mechanical complications for PICC insertion has been well documented.7, 8 In contrast, femoral or retroperitoneal hematoma occurs in up to 1.3% of cases following femoral catheter insertion,9 and pneumothorax occurs in 1.5% to 2.3% of subclavian catheter insertions.10 However, there are only limited data to suggest that the risk of PICC‐related bacteremia is lower than that of centrally‐placed catheters.11, 12
The benefit of PICCs over centrally‐placed catheters in terms of venous thromboembolism (VTE) is also not as easy to show, and in fact the rate may be greater in PICCs. The reported incidence of PICC‐related VTE has been between 0.3% and 56.0%, and the wide variation in rates is likely related to the method of diagnosis.1315 It is likely that most patients with PICC‐related VTE are asymptomatic, and that its incidence is underestimated.16
In many hospitals PICCs are placed by a certified nurse, or by an interventional radiologist if the nurse is unsuccessful.17 There are few reports of PICCs being placed by nonradiology physicians. In one report of 894 patients referred to a critical care specialist for PICC insertion, venous access was achieved 100% of the time, there were no referrals to interventional radiology, and there were no incidents of pneumothorax or bleeding.8 In a university‐affiliated community hospital, we carried out a retrospective review of our experience with training hospital physicians to place PICCs.
Methods
In July 2006 our community hospital, which is affiliated with the University of Pittsburgh Medical Center, instituted a hospitalist program. Prior to the hospitalist program, 1 house physician was available to place PICCs in the antecubital vein without the aid of ultrasound, and there was no PICC‐certified nurse in the hospital. An interventional radiologist was available to place PICCs that could not be placed by the house physician. After July 2006 under the hospitalist service, 3 of the 5 physicians were trained to place PICCs in the deep veins of the arm with the use of ultrasound guidance.
Training included 1 day with the PICC training nurse at the tertiary hospital, followed by supervised placements in the community hospital until proficiency was obtained. Proficiency was relative and cumulative. Approximately 3 supervised procedures were necessary before the physician was able to place PICCs by him or herself. All PICCs were placed using 5 barrier precautions, with chlorhexidine cleansing, and with a time‐out prior to the procedure.
Retrospective hospital data for central catheter placement were examined for the 18 months prior to and following the start of the hospitalist program. These data were collected routinely by the hospital infection control nurse for purposes of quality improvement and patient safety. The data included central catheters placed by all physicians in the hospital; however, the vast majority of these were placed by the hospitalists. The catheters were placed throughout the hospital, both on the medical floors, cardiac step‐down unit, and the ICU. Information regarding the number of central catheters placed and the specific type of catheter (subclavian, jugular, femoral, or PICC) was available from July 2005 through December 2007. Also available from January 2005 were the numbers of femoral and nonfemoral catheter days (number of catheters multiplied by number of days in place) and the central catheterassociated bacteremia rates (number per 1000 catheter days) for femoral and nonfemoral catheters. The Centers for Disease Control and Prevention (CDC) definition of central lineassociated bacteremia was used, which is any documented bloodstream infection within 48 hours of the presence of a CVC in the absence of an alternate source of infection. Data for other complications such as pneumothorax and major bleeding were not consistently recorded.
Results
Figure 1 shows the number of internal jugular, subclavian, femoral, PICC, and total catheter placements from July 2005 through December 2007. The data are grouped into 3‐month increments for visual convenience. Comparing the periods before and after the inception of the hospitalist PICC service (Figure 1, dotted vertical line), the rate of PICC placements rose 4‐fold and the rate of total catheter placements approximately doubled. The rates of femoral and subclavian catheter placements decreased by approximately 50% and the rate of internal jugular catheter placement was roughly unchanged.
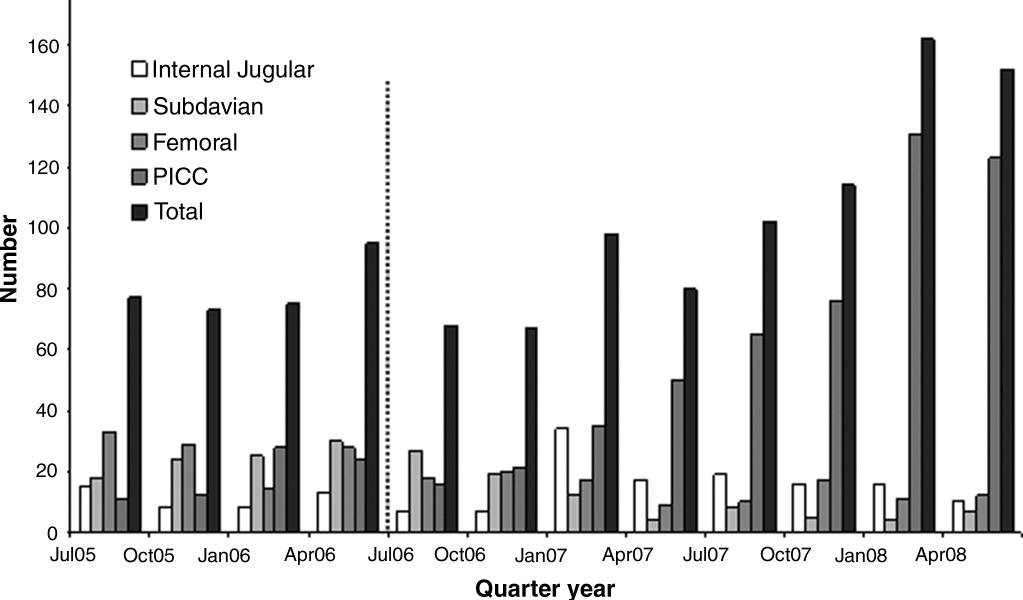
Figure 2 shows the numbers of femoral and nonfemoral catheter days by month for 2005 through 2007. The nonfemoral catheter days began to rise prior to the start of the hospitalist program and continued to rise afterward, showing an approximately 3‐fold increase by the end of the study period. The number of femoral catheters days was highly variable, but seemed to decrease by approximately 50%.
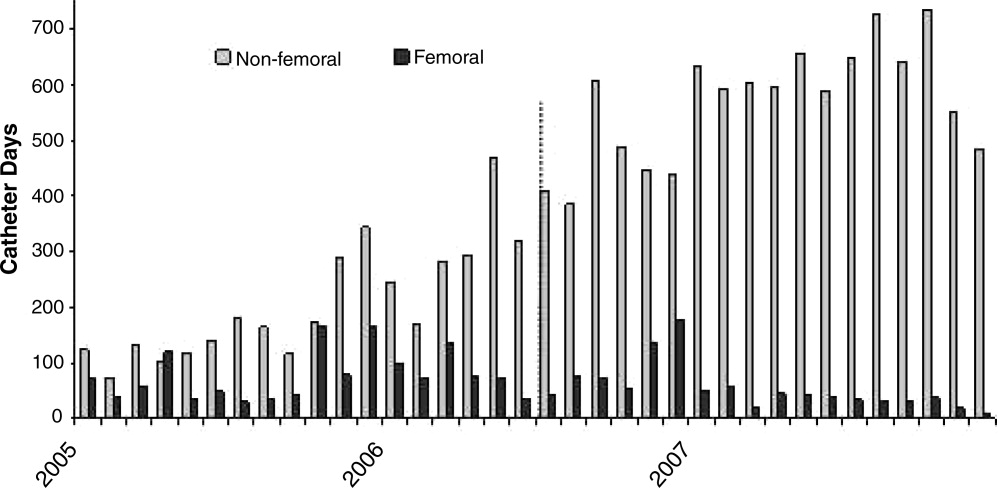
Figure 3 shows the rates of femoral and nonfemoral catheter‐associated bacteremia by month for 2005 through 2007. The absolute number of infections in both periods was low and is shown at the top of each bar in the figure.
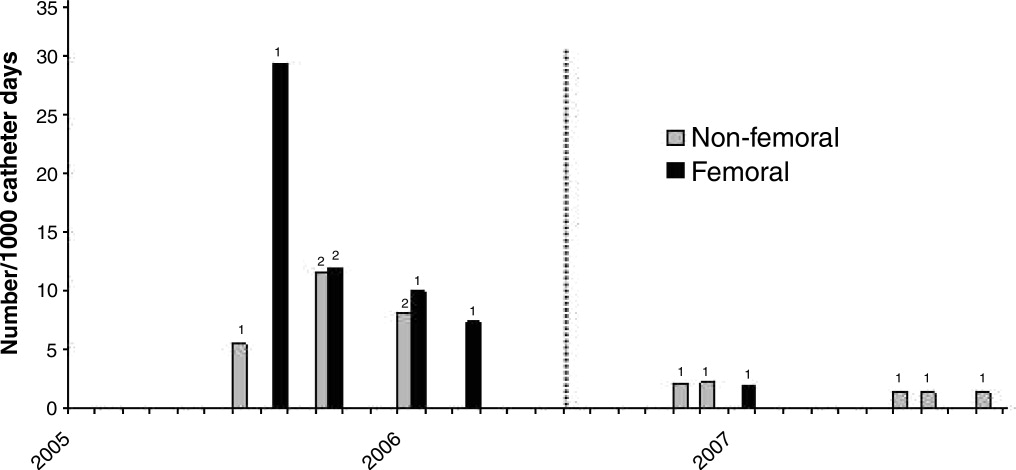
To our knowledge, there were no episodes of pneumothorax or major bleeding with PICC placement. There were 3 inadvertent arterial punctures, each of which was easily controlled with local pressure. There was 1 incident of a coiled guidewire that could not be removed at the bedside and had to be removed in interventional radiology with no significant consequence to the patient.
Discussion
The complications associated with central catheter insertion continue to place the hospitalized patient at risk. PICCs may offer significant advantages over other types of central catheters in terms of decreased rates of mechanical and infectious complications. Despite this, hospital physicians have not traditionally been trained to place PICCs. We have shown in our small, university‐affiliated community hospital that training hospital physicians to place PICCs was associated with a decrease in the placement of centrally‐inserted venous catheters and a reduced rate of femoral catheter days. At the same time, the rate of central catheterrelated bacteremia remained low.
There are many limitations to our study. Since the analysis was retrospective and uncontrolled, it is not possible to attribute the decrease in femoral catheter days and the low infection rates solely to the use of PICCs. There may have been other factors, either related or unrelated to the transition to a hospitalist service, that influenced the results, such as improved hand hygiene, attention to the use of 5 barrier precautions, and the use of chlorhexidine cleansing. Also, since the study was descriptive and outcome measures were either not available or the numbers small, we cannot prove that there was benefit to the patients or that the changes in rates were statistically significant.
Training hospital physicians to place PICCs in our study was associated with a 2‐fold increase in the overall rate of catheter placements. The reason for this increase in the total number of catheter placements is not clear, but it is likely related to the ease of PICC placement and the increasing number of patients with difficult intravenous access. It is unclear if an equivalent number of traditional central catheters would have been placed were the hospitalists not trained in PICC placement. However, this increase in total number of catheters did not appear to result in an increase in catheter‐related bacteremia or in mechanical complications.
We observed no apparent decrease in the insertion rate of internal jugular catheters in our study, despite a decrease in the rates of subclavian and femoral catheter placements. Although the current CDC guideline recommends using the subclavian vein as the preferred site, the UK National Institute for Clinical Excellence (NICE) is now recommending the use of real‐time ultrasound with each placement,18 and we find that this is best done in the internal jugular vein. Also, the rate of placement of femoral catheters remained higher than that of subclavian cathetersmost likely because the femoral vein remained the site of choice for emergently‐placed cathetersas PICC, more so than subclavian, became the preferred site for elective catheters.
Training physicians to place PICCs was not a simple task. In our experience, the availability of trainers at the tertiary care hospital was limited and the distractions of other duties of the hospitalist complicated the learning process. Two of our 5 physicians could not schedule time with the training nurse and were not able to acquire the skill. However, after training, the 3 hospitalists found that there was such a demand for PICCs that with time it was easy to maintain and even refine this skill. Since we only had 3 of 5 hospitalists trained in PICC placement, we could not have a PICC‐trained hospitalist on site 24 hours a day and the remaining 2 physicians had to rely on centrally‐placed catheters for access or have 1 of the trained physicians come to the hospital from home.
In summary, PICCs may be a safe and easy alternative to centrally‐placed catheters for the hospital physician attempting to secure central intravenous access and may lead to a decrease in the need for more risky CVC insertions. More definitive, controlled investigation, with patient outcome data, will be required before this can be advocated as a universal recommendation.
- ,,, et al.Prevalence of the use of central venous access devices within and outside of the intensive care unit: results of a survey among hospitals in the prevention epicenter program of the Centers for Disease Control and Prevention.Infect Control Hosp Epidemiol.2003;24:942–945.
- ,.Peripherally inserted central catheters: development of a hospital‐based program.J Intraven Nurs.1990;13:287–290.
- ,,, et al.Infectious complications among patients receiving home intravenous therapy with peripheral, central, or peripherally placed central venous catheters.Am J Med.1991;91:95S–100S.
- ,,.Peripherally inserted central catheters in patients with AIDS are associated with a low infection rate.Clin Infect Dis.2000;30:949–952.
- ,,,.Peripherally inserted central venous catheters in an acute care hospital.J Intraven Nurs.1990;154:1833–1837.
- ,,.Central venous pressure measurements: peripherally inserted catheters versus centrally inserted catheters.Crit Care Med.2000;28:3833–3836.
- ,,, et al.Survey of the use of peripherally inserted central venous catheters in children.Pediatrics.1997;99:e4.
- .Peripherally inserted central catheter (PICC) is effective in the care of critically ill patients using the basilic and cephalic veins and performed under ultrasound guidance at the patient's bedside by a pulmonary and critical care specialist. [October 23‐28, 2004, Seattle, Washington, USA. Abstracts].Chest.2004;126(4 suppl):705S–1014S.
- ,,, et al.Use of femoral venous catheters in critically ill adults: prospective study.Crit Care Med.1991;19:550–553.
- ,,,,.Complications and failures of subclavian‐vein catheterization.N Engl J Med.1994;331:1735–1738.
- ,.Risk of catheter‐related bloodstream infection with peripherally inserted central venous catheters used in hospitalized patients.Chest.2005;128:489–495.
- ,.The peripherally inserted central catheter (PICC): a prospective study of its natural history after cubital fossa insertion.Anaesth Intensive Care.2002;30:21–24.
- ,,.Venous thrombosis associated with peripherally inserted central catheters: a retrospective analysis of the Cleveland Clinic experience.Clin Infect Dis.2002;34:1179–1183.
- ,,,,.Peripherally inserted central catheters and upper extremity deep vein thrombosis.Australas Radiol.2006;50:451–454.
- ,,, et al.Incidence of upper limb venous thrombosis associated with peripherally inserted central catheters (PICC).Br J Radiol.2005;78:596–600.
- ,,, et al.Upper‐extremity deep vein thrombosis: risk factors, diagnosis, and complications.Arch Intern Med.1997;157:57–62.
- ,,,.Peripherally inserted central catheters: outcome as a function of the operator.J Vasc Interv Radiol.2001;12:723–729.
- ,,, et al.Ultrasonic locating devices for central venous cannulation: meta‐analysis.BMJ.2003;327:361.
Peripherally inserted central catheters (PICCs) are being used with greater frequency than ever before for intravenous access in hospitals, and PICCs may offer advantages in safety over traditional central venous catheters (CVCs). Despite these potential advantages, a large number of CVCs are still being placed. In a recent 1‐day survey of 6 large urban teaching hospitals, 29% of all patients had a CVC in place (59.3% of intensive care unit [ICU] patients and 23.7% of non‐ICU patients).1 Most catheters were inserted in the subclavian (55%) or jugular (22%) veins, with femoral (6%) and peripheral (15%) sites less commonly used. Even in the non‐ICU setting, only 20% of all central catheters were PICCs.
PICCs may offer advantages over centrally‐inserted intravenous catheters, such as the reduced risks of pneumothorax,2 arterial puncture, uncontrolled bleeding of large central veins, central lineassociated bloodstream infections (CLAB),3, 4 and lower cost.5 In addition, central venous pressure monitoring can now be performed with the larger‐bore PICCs.6
The low risk of mechanical complications for PICC insertion has been well documented.7, 8 In contrast, femoral or retroperitoneal hematoma occurs in up to 1.3% of cases following femoral catheter insertion,9 and pneumothorax occurs in 1.5% to 2.3% of subclavian catheter insertions.10 However, there are only limited data to suggest that the risk of PICC‐related bacteremia is lower than that of centrally‐placed catheters.11, 12
The benefit of PICCs over centrally‐placed catheters in terms of venous thromboembolism (VTE) is also not as easy to show, and in fact the rate may be greater in PICCs. The reported incidence of PICC‐related VTE has been between 0.3% and 56.0%, and the wide variation in rates is likely related to the method of diagnosis.1315 It is likely that most patients with PICC‐related VTE are asymptomatic, and that its incidence is underestimated.16
In many hospitals PICCs are placed by a certified nurse, or by an interventional radiologist if the nurse is unsuccessful.17 There are few reports of PICCs being placed by nonradiology physicians. In one report of 894 patients referred to a critical care specialist for PICC insertion, venous access was achieved 100% of the time, there were no referrals to interventional radiology, and there were no incidents of pneumothorax or bleeding.8 In a university‐affiliated community hospital, we carried out a retrospective review of our experience with training hospital physicians to place PICCs.
Methods
In July 2006 our community hospital, which is affiliated with the University of Pittsburgh Medical Center, instituted a hospitalist program. Prior to the hospitalist program, 1 house physician was available to place PICCs in the antecubital vein without the aid of ultrasound, and there was no PICC‐certified nurse in the hospital. An interventional radiologist was available to place PICCs that could not be placed by the house physician. After July 2006 under the hospitalist service, 3 of the 5 physicians were trained to place PICCs in the deep veins of the arm with the use of ultrasound guidance.
Training included 1 day with the PICC training nurse at the tertiary hospital, followed by supervised placements in the community hospital until proficiency was obtained. Proficiency was relative and cumulative. Approximately 3 supervised procedures were necessary before the physician was able to place PICCs by him or herself. All PICCs were placed using 5 barrier precautions, with chlorhexidine cleansing, and with a time‐out prior to the procedure.
Retrospective hospital data for central catheter placement were examined for the 18 months prior to and following the start of the hospitalist program. These data were collected routinely by the hospital infection control nurse for purposes of quality improvement and patient safety. The data included central catheters placed by all physicians in the hospital; however, the vast majority of these were placed by the hospitalists. The catheters were placed throughout the hospital, both on the medical floors, cardiac step‐down unit, and the ICU. Information regarding the number of central catheters placed and the specific type of catheter (subclavian, jugular, femoral, or PICC) was available from July 2005 through December 2007. Also available from January 2005 were the numbers of femoral and nonfemoral catheter days (number of catheters multiplied by number of days in place) and the central catheterassociated bacteremia rates (number per 1000 catheter days) for femoral and nonfemoral catheters. The Centers for Disease Control and Prevention (CDC) definition of central lineassociated bacteremia was used, which is any documented bloodstream infection within 48 hours of the presence of a CVC in the absence of an alternate source of infection. Data for other complications such as pneumothorax and major bleeding were not consistently recorded.
Results
Figure 1 shows the number of internal jugular, subclavian, femoral, PICC, and total catheter placements from July 2005 through December 2007. The data are grouped into 3‐month increments for visual convenience. Comparing the periods before and after the inception of the hospitalist PICC service (Figure 1, dotted vertical line), the rate of PICC placements rose 4‐fold and the rate of total catheter placements approximately doubled. The rates of femoral and subclavian catheter placements decreased by approximately 50% and the rate of internal jugular catheter placement was roughly unchanged.
Figure 2 shows the numbers of femoral and nonfemoral catheter days by month for 2005 through 2007. The nonfemoral catheter days began to rise prior to the start of the hospitalist program and continued to rise afterward, showing an approximately 3‐fold increase by the end of the study period. The number of femoral catheters days was highly variable, but seemed to decrease by approximately 50%.
Figure 3 shows the rates of femoral and nonfemoral catheter‐associated bacteremia by month for 2005 through 2007. The absolute number of infections in both periods was low and is shown at the top of each bar in the figure.
To our knowledge, there were no episodes of pneumothorax or major bleeding with PICC placement. There were 3 inadvertent arterial punctures, each of which was easily controlled with local pressure. There was 1 incident of a coiled guidewire that could not be removed at the bedside and had to be removed in interventional radiology with no significant consequence to the patient.
Discussion
The complications associated with central catheter insertion continue to place the hospitalized patient at risk. PICCs may offer significant advantages over other types of central catheters in terms of decreased rates of mechanical and infectious complications. Despite this, hospital physicians have not traditionally been trained to place PICCs. We have shown in our small, university‐affiliated community hospital that training hospital physicians to place PICCs was associated with a decrease in the placement of centrally‐inserted venous catheters and a reduced rate of femoral catheter days. At the same time, the rate of central catheterrelated bacteremia remained low.
There are many limitations to our study. Since the analysis was retrospective and uncontrolled, it is not possible to attribute the decrease in femoral catheter days and the low infection rates solely to the use of PICCs. There may have been other factors, either related or unrelated to the transition to a hospitalist service, that influenced the results, such as improved hand hygiene, attention to the use of 5 barrier precautions, and the use of chlorhexidine cleansing. Also, since the study was descriptive and outcome measures were either not available or the numbers small, we cannot prove that there was benefit to the patients or that the changes in rates were statistically significant.
Training hospital physicians to place PICCs in our study was associated with a 2‐fold increase in the overall rate of catheter placements. The reason for this increase in the total number of catheter placements is not clear, but it is likely related to the ease of PICC placement and the increasing number of patients with difficult intravenous access. It is unclear if an equivalent number of traditional central catheters would have been placed were the hospitalists not trained in PICC placement. However, this increase in total number of catheters did not appear to result in an increase in catheter‐related bacteremia or in mechanical complications.
We observed no apparent decrease in the insertion rate of internal jugular catheters in our study, despite a decrease in the rates of subclavian and femoral catheter placements. Although the current CDC guideline recommends using the subclavian vein as the preferred site, the UK National Institute for Clinical Excellence (NICE) is now recommending the use of real‐time ultrasound with each placement,18 and we find that this is best done in the internal jugular vein. Also, the rate of placement of femoral catheters remained higher than that of subclavian cathetersmost likely because the femoral vein remained the site of choice for emergently‐placed cathetersas PICC, more so than subclavian, became the preferred site for elective catheters.
Training physicians to place PICCs was not a simple task. In our experience, the availability of trainers at the tertiary care hospital was limited and the distractions of other duties of the hospitalist complicated the learning process. Two of our 5 physicians could not schedule time with the training nurse and were not able to acquire the skill. However, after training, the 3 hospitalists found that there was such a demand for PICCs that with time it was easy to maintain and even refine this skill. Since we only had 3 of 5 hospitalists trained in PICC placement, we could not have a PICC‐trained hospitalist on site 24 hours a day and the remaining 2 physicians had to rely on centrally‐placed catheters for access or have 1 of the trained physicians come to the hospital from home.
In summary, PICCs may be a safe and easy alternative to centrally‐placed catheters for the hospital physician attempting to secure central intravenous access and may lead to a decrease in the need for more risky CVC insertions. More definitive, controlled investigation, with patient outcome data, will be required before this can be advocated as a universal recommendation.
- ,,, et al.Prevalence of the use of central venous access devices within and outside of the intensive care unit: results of a survey among hospitals in the prevention epicenter program of the Centers for Disease Control and Prevention.Infect Control Hosp Epidemiol.2003;24:942–945.
- ,.Peripherally inserted central catheters: development of a hospital‐based program.J Intraven Nurs.1990;13:287–290.
- ,,, et al.Infectious complications among patients receiving home intravenous therapy with peripheral, central, or peripherally placed central venous catheters.Am J Med.1991;91:95S–100S.
- ,,.Peripherally inserted central catheters in patients with AIDS are associated with a low infection rate.Clin Infect Dis.2000;30:949–952.
- ,,,.Peripherally inserted central venous catheters in an acute care hospital.J Intraven Nurs.1990;154:1833–1837.
- ,,.Central venous pressure measurements: peripherally inserted catheters versus centrally inserted catheters.Crit Care Med.2000;28:3833–3836.
- ,,, et al.Survey of the use of peripherally inserted central venous catheters in children.Pediatrics.1997;99:e4.
- .Peripherally inserted central catheter (PICC) is effective in the care of critically ill patients using the basilic and cephalic veins and performed under ultrasound guidance at the patient's bedside by a pulmonary and critical care specialist. [October 23‐28, 2004, Seattle, Washington, USA. Abstracts].Chest.2004;126(4 suppl):705S–1014S.
- ,,, et al.Use of femoral venous catheters in critically ill adults: prospective study.Crit Care Med.1991;19:550–553.
- ,,,,.Complications and failures of subclavian‐vein catheterization.N Engl J Med.1994;331:1735–1738.
- ,.Risk of catheter‐related bloodstream infection with peripherally inserted central venous catheters used in hospitalized patients.Chest.2005;128:489–495.
- ,.The peripherally inserted central catheter (PICC): a prospective study of its natural history after cubital fossa insertion.Anaesth Intensive Care.2002;30:21–24.
- ,,.Venous thrombosis associated with peripherally inserted central catheters: a retrospective analysis of the Cleveland Clinic experience.Clin Infect Dis.2002;34:1179–1183.
- ,,,,.Peripherally inserted central catheters and upper extremity deep vein thrombosis.Australas Radiol.2006;50:451–454.
- ,,, et al.Incidence of upper limb venous thrombosis associated with peripherally inserted central catheters (PICC).Br J Radiol.2005;78:596–600.
- ,,, et al.Upper‐extremity deep vein thrombosis: risk factors, diagnosis, and complications.Arch Intern Med.1997;157:57–62.
- ,,,.Peripherally inserted central catheters: outcome as a function of the operator.J Vasc Interv Radiol.2001;12:723–729.
- ,,, et al.Ultrasonic locating devices for central venous cannulation: meta‐analysis.BMJ.2003;327:361.

Hypoglycemia in ICU
Since publication of the first randomized controlled trial of insulin infusion therapy in surgical intensive care unit (ICU) patients,1 most institutions have implemented insulin infusion protocols (IIP) for tight glycemic control in their ICUs.29 The major problem with tight glycemic control is the risk of hypoglycemia. In the randomized controlled trial involving medical ICU patients, 18.7% patients experienced at least 1 episode of blood glucose (BG) 40 mg/dL.10 Recently, a major insulin infusion trial involving patients with severe sepsis was stopped due to unacceptably high risk of hypoglycemia.11 Potential benefits of BG control may be offset by potential risks of hypoglycemia. While there can be multiple factors that could contribute to the risk of hypoglycemia, suboptimal protocol implementation is relatively amenable to correction.
Most IIPs are nurse driven. Nurses monitor BG levels every 30 to 60 minutes and make adjustments in insulin infusion rates. Each point of care testing and insulin dose adjustment takes about 5 minutes of nursing time.12 Given the numerous other nursing responsibilities for monitoring and documentation in very sick patients, nurses may not always be able check BGs at the recommended times. We investigated whether a delay in BG monitoring during insulin infusion therapy is associated with higher risk of hypoglycemia.
Methods
Data were collected for 50 consecutive patients treated with Brigham and Women's Hospital's insulin infusion protocol (BHIP) between September 27, 2006 and October 13, 2006. The investigation was part of the hospital's ongoing diabetes quality improvement program. Partners‐Health Human Research Committee approved the study. Patient demographics, history of diabetes mellitus, and glycosylated hemoglobin (A1C) were obtained from paper and electronic medical records. Point‐of‐care BG values were obtained from the bedside paper flow sheets. The exact times of individual BG measurements were ascertained from Point of Care Precision Web (QCM3.0; Abbott, Inc.).
Target BG range with BHIP is 80 to 110 mg/dL. BHIP requires BG testing every 60 minutes unless a BG value of 60 mg/dL is obtained; in which case, testing is required every 30 minutes. A time violation was assumed to have occurred if the BG was measured >70 minutes after a previous value of 60 mg/dL or >40 minutes after a previous BG value of 60 mg/dL (ie, >10 minutes after the recommended time for measurement). Although the choice of 10 minutes was arbitrary, we think it is a reasonable and practical time frame for getting a BG measurement. If a measurement was obtained earlier than the recommended time, it was not considered a time violation. However, measurements obtained within 30 minutes of a previous BG value (overwhelmingly drawn for confirmation of a previous BG value) were excluded from analysis.
BG values were divided into 2 categories: values following time violation and values following no time violation. The numbers of values in different BG ranges (80, 80110, >110 mg/dL) were compared in the 2 categories using a chi square test. Data are presented as mean standard deviation (SD), median and numbers with percentage. Statistical significance was set at P 0.05.
Results
Mean age of the 50 patients treated with BHIP was 64.0 13.6 years. There were 27 men and 23 women. Eighteen patients had preexisting diabetes (1 had type 1 and 17 had type 2 diabetes, mean A1C 7.1 1.7%) and 32 patients had no previous history of diabetes (mean A1C 5.9 0.9%). Mean serum creatinine was 1.34 1.0 mg/dL. Mean BG at the start of BHIP was 173 69.6 mg/dL; median 167.5 mg/dL. Mean BG during insulin infusion was 117.3 43.1 mg/dL; median 107 mg/dL. Mean BG during insulin infusion was higher in diabetic patients compared to nondiabetic patients (125.2 57.8 versus 113.4 38.8 mg/dL; P 0.01). Monitoring for BGs was done with similar frequency in all patients. Overall, 40.2% of the total 2,605 BG values were in a range of 80 to 110 mg/dL. A total of 1.5% of values were below 60 mg/dL; only 4 values were 40 mg/dL.
A total of 2,309 values could be studied for time violations. The remaining 296 values were either obtained within 30 minutes of the previous test or the exact time of measurement could not be ascertained. A total of 1,474 (63.9%) measurements had been obtained at the recommended time or earlier than the recommended time; 835 (36.1%) measurements had been obtained >10 minutes after the recommended time for measurement (time violation). The proportion of BG values below the target (80 mg/dL) was significantly higher following the time violation as compared to no time violation (Table 1). On the other hand, values >110 mg/dL were not more common following a time violation, compared to instances when no time violation occurred.
| Time Violation [n = 835 (100%)] | No Time Violation [n = 1,474 (100%)] | P Value | |
|---|---|---|---|
| |||
| BG values 80 mg/dL | 149 (17.8) | 171 (11.6) | 0.001 |
| BG values 80110 mg/dL | 316 (37.8) | 596 (40.4) | NS |
| BG values >110 mg/dL | 370 (44.3) | 708 (47.8) | NS |
Frequency of time violation was similar in subgroups of patients divided according to gender, presence of diabetes and the type of ICU (Table 2). Comparison among subgroups of admission diagnoses was not possible due to the small number of patients. Overall, the proportion of low BG values was lower in diabetic patients compared to nondiabetic patients (11.9% versus 15.0%, P = 0.03). An increased rate of hypoglycemia following time violations was present in all subgroups except for the diabetic subgroup (Table 3).
| Characteristic | Number of Patients | % of BG Values Associated with Time Violations | P Value |
|---|---|---|---|
| |||
| Gender | NS | ||
| Male | 27 | 36 | |
| Female | 23 | 36 | |
| Diabetes status | NS | ||
| Known diabetes | 18 | 37 | |
| No known diabetes | 32 | 35 | |
| Type of ICU | NS | ||
| Medical | 20 | 38 | |
| Surgical | 30 | 35 | |
| Admission diagnosis | |||
| Cardiovascular disease | 7 | 35 | |
| Gastrointestinal disease | 4 | 43 | |
| Malignant disorder | 8 | 32 | |
| Neurological disease | 7 | 36 | |
| Orthopedic problem | 2 | 51 | |
| Respiratory disease | 13 | 33 | |
| Renal failure | 3 | 46 | |
| Sepsis | 6 | 36 | |
| % BG Values 80 | |||
|---|---|---|---|
| Characteristic | Time Violation | No Time Violation | P Value |
| |||
| Male | 19.1 | 11.9 | 0.001 |
| Female | 16.1 | 11.2 | 0.03 |
| Known diabetes | 13.3 | 11.1 | NS |
| No diabetes | 20 | 11.9 | 0.001 |
| Medical ICU | 19.2 | 11.9 | 0.002 |
| Surgical ICU | 16.8 | 11.3 | 0.004 |
| Cardiovascular diseases | 21.1 | 14.1 | |
| Gastrointestinal diseases | 22.1 | 14.8 | |
| Malignant disorders | 22.0 | 11.7 | |
| Neurological diseases | 7.5 | 5.0 | |
| Orthopedic problems | 6.2 | 6.6 | |
| Respiratory diseases | 11.9 | 10.4 | |
| Renal failure | 35.7 | 15.6 | |
| Sepsis | 19.7 | 13.5 | |
Discussion
Our study shows that a delay in BG testing during BHIP is associated with higher chances of a low BG value. This effect was consistent in multiple subgroups. However, the effect was nonsignificant in diabetic patients, probably due to higher mean BG levels and less frequent low BG values. Over one‐third of all BG measurements were obtained after a time violation. Protocol violations in our study are no different from those reported by others.7, 13, 14 Our patient characteristics of severe hypoglycemic episodes and the overall BG control achieved with BHIP were also similar to those reported by others with similar protocols.5, 7, 1517 While the results of this study may still be specific to BHIP, we think they are applicable to other similar protocols.
Because a delay in testing by itself is unlikely to cause hypoglycemia, a more likely explanation for these results is that hypoglycemia occurred when insulin infusion adjustments were not made in a timely fashion due to prolonged BG monitoring intervals. Insulin infusions are the preferred treatment in rapidly changing clinical settings because changes in insulin doses can be made frequently. Most IIPs are designed with the assumption that insulin dose adjustments will be made regularly and frequently, based on BG measurements. Although there is no gold standard for the optimal BG test frequency, in most protocols BG testing is performed every hour in order to ensure safety as well as efficacy. Our results are consistent with the intuitive assumption that a timely measurement of the BG is important for successful implementation of an IIP.
It was somewhat surprising that high BG values were not more frequent following a time violation. We can only speculate as to the reason for this. It is possible that critically ill patients are near maximally insulin resistant and, once an effective insulin infusion rate is achieved, further increases are not as frequently required. On the other hand, insulin requirements may decrease rapidly as contributors to insulin resistance resolve. Another possibility is that there may be a limit to hepatic glucose production during acute illness making patients more prone to hypoglycemia. It is also possible that the nurses tend to test more promptly when the BG levels are running high. Thus, the insulin doses may be increased at proper times until BG levels are in the target range. However, when BG levels are in the target range, nurses may become less vigilant, leading to a delay in testing. As a result a decrease in insulin dose, when required, does not happen as promptly as an increase in dose.
In our study the absolute risk of hypoglycemia associated with time violation was 6%. Avoiding this hypoglycemia may have an impact on glycemic control in the ICU and may change clinical outcomes. Moreover, this is 1 of the few factors that are potentially amenable to correction. Therefore, measures to improve adherence to protocols, eg, prompts for BG testing and better nurse training regarding importance of timely testing, may reduce the risk of hypoglycemia.
- ,,, et al.Intensive insulin therapy in the surgical intensive care unit.N Engl J Med.2001;345(19):1359–1367.
- .Effect of an intensive glucose management protocol on the mortality of critically ill adult patients.Mayo Clin Proc.2004;79(8):992–1000.
- ,,,,.Implementing intensive insulin therapy: development and audit of the Bath insulin protocol.Anaesth Intensive Care.2004;32(3):311–316.
- ,,,,.Optimizing hospital use of intravenous insulin therapy: improved management of hyperglycemia and error reduction with a new nomogram.Endocr Pract.2005;11(4):240–253.
- ,,, et al.Efficacy and safety of an insulin infusion protocol in a surgical ICU.J Am Coll Surg.2006;202(1):1–9.
- ,,, et al.Implementation of a safe and effective insulin infusion protocol in a medical intensive care unit.Diabetes Care.2004;27(2):461–467.
- ,,, et al.Inpatient management of hyperglycemia: the Northwestern experience.Endocr Pract.2006;12(5):491–505.
- ,,, et al.Implementing an intravenous insulin infusion protocol in the intensive care unit.Am J Health Syst Pharm.2007;64(4):385–395.
- ,,,,.A practical approach to hyperglycemia management in the intensive care unit: evaluation of an intensive insulin infusion protocol.Pharmacotherapy.2006;26(10):1410–1420.
- ,,, et al.Intensive insulin therapy in the medical ICU.N Engl J Med.2006;354(5):449–461.
- ,,, et al.Intensive insulin therapy and pentastarch resuscitation in severe sepsis.N Engl J Med.2008;358(2):125–139.
- .Evaluation of nursing work effort and perceptions about blood glucose testing in tight glycemic control.Am J Crit Care.2006;15(4):370–377.
- ,,,,.Adherence to and efficacy and safety of an insulin protocol in the critically ill: a prospective observational study.Am J Crit Care.2007;16(6):599–608.
- ,,,,.Evaluation of an intensive insulin protocol for septic patients in a medical intensive care unit.Crit Care Med.2006;34(12):2974–2978.
- ,,, et al.The impact of a normoglycemic management protocol on clinical outcomes in the trauma intensive care unit.JPEN J Parenter Enteral Nutr.2005;29(5):353–358.
- ,,,,,.Standardization of intravenous insulin therapy improves the efficiency and safety of blood glucose control in critically ill adults.Intensive Care Med.2004;30(5):804–810.
- ,,, et al.Intensive versus modified conventional control of blood glucose level in medical intensive care patients: a pilot study.Am J Crit Care.2005;14(5):370–376.
Since publication of the first randomized controlled trial of insulin infusion therapy in surgical intensive care unit (ICU) patients,1 most institutions have implemented insulin infusion protocols (IIP) for tight glycemic control in their ICUs.29 The major problem with tight glycemic control is the risk of hypoglycemia. In the randomized controlled trial involving medical ICU patients, 18.7% patients experienced at least 1 episode of blood glucose (BG) 40 mg/dL.10 Recently, a major insulin infusion trial involving patients with severe sepsis was stopped due to unacceptably high risk of hypoglycemia.11 Potential benefits of BG control may be offset by potential risks of hypoglycemia. While there can be multiple factors that could contribute to the risk of hypoglycemia, suboptimal protocol implementation is relatively amenable to correction.
Most IIPs are nurse driven. Nurses monitor BG levels every 30 to 60 minutes and make adjustments in insulin infusion rates. Each point of care testing and insulin dose adjustment takes about 5 minutes of nursing time.12 Given the numerous other nursing responsibilities for monitoring and documentation in very sick patients, nurses may not always be able check BGs at the recommended times. We investigated whether a delay in BG monitoring during insulin infusion therapy is associated with higher risk of hypoglycemia.
Methods
Data were collected for 50 consecutive patients treated with Brigham and Women's Hospital's insulin infusion protocol (BHIP) between September 27, 2006 and October 13, 2006. The investigation was part of the hospital's ongoing diabetes quality improvement program. Partners‐Health Human Research Committee approved the study. Patient demographics, history of diabetes mellitus, and glycosylated hemoglobin (A1C) were obtained from paper and electronic medical records. Point‐of‐care BG values were obtained from the bedside paper flow sheets. The exact times of individual BG measurements were ascertained from Point of Care Precision Web (QCM3.0; Abbott, Inc.).
Target BG range with BHIP is 80 to 110 mg/dL. BHIP requires BG testing every 60 minutes unless a BG value of 60 mg/dL is obtained; in which case, testing is required every 30 minutes. A time violation was assumed to have occurred if the BG was measured >70 minutes after a previous value of 60 mg/dL or >40 minutes after a previous BG value of 60 mg/dL (ie, >10 minutes after the recommended time for measurement). Although the choice of 10 minutes was arbitrary, we think it is a reasonable and practical time frame for getting a BG measurement. If a measurement was obtained earlier than the recommended time, it was not considered a time violation. However, measurements obtained within 30 minutes of a previous BG value (overwhelmingly drawn for confirmation of a previous BG value) were excluded from analysis.
BG values were divided into 2 categories: values following time violation and values following no time violation. The numbers of values in different BG ranges (80, 80110, >110 mg/dL) were compared in the 2 categories using a chi square test. Data are presented as mean standard deviation (SD), median and numbers with percentage. Statistical significance was set at P 0.05.
Results
Mean age of the 50 patients treated with BHIP was 64.0 13.6 years. There were 27 men and 23 women. Eighteen patients had preexisting diabetes (1 had type 1 and 17 had type 2 diabetes, mean A1C 7.1 1.7%) and 32 patients had no previous history of diabetes (mean A1C 5.9 0.9%). Mean serum creatinine was 1.34 1.0 mg/dL. Mean BG at the start of BHIP was 173 69.6 mg/dL; median 167.5 mg/dL. Mean BG during insulin infusion was 117.3 43.1 mg/dL; median 107 mg/dL. Mean BG during insulin infusion was higher in diabetic patients compared to nondiabetic patients (125.2 57.8 versus 113.4 38.8 mg/dL; P 0.01). Monitoring for BGs was done with similar frequency in all patients. Overall, 40.2% of the total 2,605 BG values were in a range of 80 to 110 mg/dL. A total of 1.5% of values were below 60 mg/dL; only 4 values were 40 mg/dL.
A total of 2,309 values could be studied for time violations. The remaining 296 values were either obtained within 30 minutes of the previous test or the exact time of measurement could not be ascertained. A total of 1,474 (63.9%) measurements had been obtained at the recommended time or earlier than the recommended time; 835 (36.1%) measurements had been obtained >10 minutes after the recommended time for measurement (time violation). The proportion of BG values below the target (80 mg/dL) was significantly higher following the time violation as compared to no time violation (Table 1). On the other hand, values >110 mg/dL were not more common following a time violation, compared to instances when no time violation occurred.
| Time Violation [n = 835 (100%)] | No Time Violation [n = 1,474 (100%)] | P Value | |
|---|---|---|---|
| |||
| BG values 80 mg/dL | 149 (17.8) | 171 (11.6) | 0.001 |
| BG values 80110 mg/dL | 316 (37.8) | 596 (40.4) | NS |
| BG values >110 mg/dL | 370 (44.3) | 708 (47.8) | NS |
Frequency of time violation was similar in subgroups of patients divided according to gender, presence of diabetes and the type of ICU (Table 2). Comparison among subgroups of admission diagnoses was not possible due to the small number of patients. Overall, the proportion of low BG values was lower in diabetic patients compared to nondiabetic patients (11.9% versus 15.0%, P = 0.03). An increased rate of hypoglycemia following time violations was present in all subgroups except for the diabetic subgroup (Table 3).
| Characteristic | Number of Patients | % of BG Values Associated with Time Violations | P Value |
|---|---|---|---|
| |||
| Gender | NS | ||
| Male | 27 | 36 | |
| Female | 23 | 36 | |
| Diabetes status | NS | ||
| Known diabetes | 18 | 37 | |
| No known diabetes | 32 | 35 | |
| Type of ICU | NS | ||
| Medical | 20 | 38 | |
| Surgical | 30 | 35 | |
| Admission diagnosis | |||
| Cardiovascular disease | 7 | 35 | |
| Gastrointestinal disease | 4 | 43 | |
| Malignant disorder | 8 | 32 | |
| Neurological disease | 7 | 36 | |
| Orthopedic problem | 2 | 51 | |
| Respiratory disease | 13 | 33 | |
| Renal failure | 3 | 46 | |
| Sepsis | 6 | 36 | |
| % BG Values 80 | |||
|---|---|---|---|
| Characteristic | Time Violation | No Time Violation | P Value |
| |||
| Male | 19.1 | 11.9 | 0.001 |
| Female | 16.1 | 11.2 | 0.03 |
| Known diabetes | 13.3 | 11.1 | NS |
| No diabetes | 20 | 11.9 | 0.001 |
| Medical ICU | 19.2 | 11.9 | 0.002 |
| Surgical ICU | 16.8 | 11.3 | 0.004 |
| Cardiovascular diseases | 21.1 | 14.1 | |
| Gastrointestinal diseases | 22.1 | 14.8 | |
| Malignant disorders | 22.0 | 11.7 | |
| Neurological diseases | 7.5 | 5.0 | |
| Orthopedic problems | 6.2 | 6.6 | |
| Respiratory diseases | 11.9 | 10.4 | |
| Renal failure | 35.7 | 15.6 | |
| Sepsis | 19.7 | 13.5 | |
Discussion
Our study shows that a delay in BG testing during BHIP is associated with higher chances of a low BG value. This effect was consistent in multiple subgroups. However, the effect was nonsignificant in diabetic patients, probably due to higher mean BG levels and less frequent low BG values. Over one‐third of all BG measurements were obtained after a time violation. Protocol violations in our study are no different from those reported by others.7, 13, 14 Our patient characteristics of severe hypoglycemic episodes and the overall BG control achieved with BHIP were also similar to those reported by others with similar protocols.5, 7, 1517 While the results of this study may still be specific to BHIP, we think they are applicable to other similar protocols.
Because a delay in testing by itself is unlikely to cause hypoglycemia, a more likely explanation for these results is that hypoglycemia occurred when insulin infusion adjustments were not made in a timely fashion due to prolonged BG monitoring intervals. Insulin infusions are the preferred treatment in rapidly changing clinical settings because changes in insulin doses can be made frequently. Most IIPs are designed with the assumption that insulin dose adjustments will be made regularly and frequently, based on BG measurements. Although there is no gold standard for the optimal BG test frequency, in most protocols BG testing is performed every hour in order to ensure safety as well as efficacy. Our results are consistent with the intuitive assumption that a timely measurement of the BG is important for successful implementation of an IIP.
It was somewhat surprising that high BG values were not more frequent following a time violation. We can only speculate as to the reason for this. It is possible that critically ill patients are near maximally insulin resistant and, once an effective insulin infusion rate is achieved, further increases are not as frequently required. On the other hand, insulin requirements may decrease rapidly as contributors to insulin resistance resolve. Another possibility is that there may be a limit to hepatic glucose production during acute illness making patients more prone to hypoglycemia. It is also possible that the nurses tend to test more promptly when the BG levels are running high. Thus, the insulin doses may be increased at proper times until BG levels are in the target range. However, when BG levels are in the target range, nurses may become less vigilant, leading to a delay in testing. As a result a decrease in insulin dose, when required, does not happen as promptly as an increase in dose.
In our study the absolute risk of hypoglycemia associated with time violation was 6%. Avoiding this hypoglycemia may have an impact on glycemic control in the ICU and may change clinical outcomes. Moreover, this is 1 of the few factors that are potentially amenable to correction. Therefore, measures to improve adherence to protocols, eg, prompts for BG testing and better nurse training regarding importance of timely testing, may reduce the risk of hypoglycemia.
- ,,, et al.Intensive insulin therapy in the surgical intensive care unit.N Engl J Med.2001;345(19):1359–1367.
- .Effect of an intensive glucose management protocol on the mortality of critically ill adult patients.Mayo Clin Proc.2004;79(8):992–1000.
- ,,,,.Implementing intensive insulin therapy: development and audit of the Bath insulin protocol.Anaesth Intensive Care.2004;32(3):311–316.
- ,,,,.Optimizing hospital use of intravenous insulin therapy: improved management of hyperglycemia and error reduction with a new nomogram.Endocr Pract.2005;11(4):240–253.
- ,,, et al.Efficacy and safety of an insulin infusion protocol in a surgical ICU.J Am Coll Surg.2006;202(1):1–9.
- ,,, et al.Implementation of a safe and effective insulin infusion protocol in a medical intensive care unit.Diabetes Care.2004;27(2):461–467.
- ,,, et al.Inpatient management of hyperglycemia: the Northwestern experience.Endocr Pract.2006;12(5):491–505.
- ,,, et al.Implementing an intravenous insulin infusion protocol in the intensive care unit.Am J Health Syst Pharm.2007;64(4):385–395.
- ,,,,.A practical approach to hyperglycemia management in the intensive care unit: evaluation of an intensive insulin infusion protocol.Pharmacotherapy.2006;26(10):1410–1420.
- ,,, et al.Intensive insulin therapy in the medical ICU.N Engl J Med.2006;354(5):449–461.
- ,,, et al.Intensive insulin therapy and pentastarch resuscitation in severe sepsis.N Engl J Med.2008;358(2):125–139.
- .Evaluation of nursing work effort and perceptions about blood glucose testing in tight glycemic control.Am J Crit Care.2006;15(4):370–377.
- ,,,,.Adherence to and efficacy and safety of an insulin protocol in the critically ill: a prospective observational study.Am J Crit Care.2007;16(6):599–608.
- ,,,,.Evaluation of an intensive insulin protocol for septic patients in a medical intensive care unit.Crit Care Med.2006;34(12):2974–2978.
- ,,, et al.The impact of a normoglycemic management protocol on clinical outcomes in the trauma intensive care unit.JPEN J Parenter Enteral Nutr.2005;29(5):353–358.
- ,,,,,.Standardization of intravenous insulin therapy improves the efficiency and safety of blood glucose control in critically ill adults.Intensive Care Med.2004;30(5):804–810.
- ,,, et al.Intensive versus modified conventional control of blood glucose level in medical intensive care patients: a pilot study.Am J Crit Care.2005;14(5):370–376.
Discharge Planning
Hospitalized patients are often debilitated, either from their admitting illness or from the deconditioning that occurs with inactivity. Functional decline, which appears to progress in a hierarchical pattern,1 occurs in 24% to 50% of geriatric patients during hospitalization and is poorly documented.2 Such a decline is associated not only with longer hospital stays and increased health care costs but also with higher mortality.3 The American College of Physicians, through its Assessing Care of Vulnerable Elders project, expressly endorsed gait and mobility evaluation as a quality indicator, and examination insufficiency is well documented.4
Of the several existing mobility assessment tools, few are used routinely in hospital. Some require complex scoring; others require timing and/or a trained occupational therapist.5 We created a simplified tool named Independent Mobility Validation Examination (I‐MOVE) for use by bedside caregivers. We evaluated the tool's face validity and interobserver agreement.
I‐MOVE
I‐MOVE, represented schematically in Figure 1, is a performance test that assesses the patient's ability to perform a sequence of 6 basic tasks: rolling over in bed, sitting up, standing, transferring to a chair, walking in the room, and walking in the hallway. Most motor functions can be assumed to be hierarchical in nature; any patient who can perform at the highest level, such as walking safely, also would be expected to perform at the lowest level.
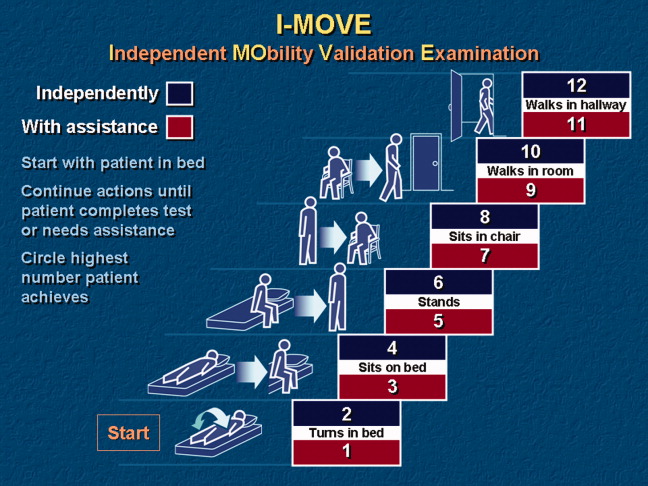
Instructions for administering I‐MOVE are as follows:
-
Review current orders. Exclude patients ordered on bed rest or non‐weight‐bearing or other orders precluding any of the 6 requested actions.
-
Prepare environment.
-
Chair at bedside.
-
Lower side bed rail closest to chair.
-
Clear path for patient to ambulate.
-
Ensure patient dons slippers.
-
Flatten bed.
-
Ensure any gait assistive device, if generally used by the patient, is within reach from the bedside.
-
Requests for patient action (for steps c through f, make available and within reach any appropriate gait‐assistance device such as walker or cane, if such is customarily used at home or newly prescribed):
-
With patient lying supine in bed, with close supervision, ask patient to turn from side to side in bed (request when both bed rails are up).
-
Lower side rail closer to chair and ask the patient to rise up to a sitting position and turn to sit up with legs dangling off the bed.
-
Ask the patient to stand.
-
Ask the patient to take a seat in the chair next to the bed.
-
Ask the patient to ambulate in the room.
-
Ask the patient to ambulate in the hallway.
-
At any point if the patient seems incapable, unsteady, or unsafe to accomplish the requested task, render hands‐on assistance and immediately end the test.
-
Document, by number (1‐12), the activity level successfully accomplished independently by the patient (even number levels) or accomplished with assistance (odd number levels).
-
Patient may be considered independent if able to perform the activity with a normal assistive device (cane, walker, brace, or crutches) but not using furniture.
-
Assistance is defined as any physical contact with the patient.
Findings
Face Validity
We sent surveys to 6 experienced practicing clinicians at our hospital: a geriatrician, a physiatrist, an exercise physiologist, an occupational therapist, a physical therapist, and a registered nurse. We asked each clinician to rate the 6 I‐MOVE elements (requested actions) for clinical relevance to mobility independence. Relevance of each element was measured on an ordinal scale with scores ranging from 1 to 4, with: 1 not relevant; 2 somewhat relevant; 3 quite relevant; and 4 very relevant. From the 5 responses we received, 4 evaluators ranked all 6 I‐MOVE requested actions as very relevant. The fifth evaluator ranked 5 of the 6 actions as very relevant and 1 action (walking in the room) as quite relevant. These results demonstrate general agreement that I‐MOVE is, at face value, a reasonable measure of independent mobility.
Interrater Reliability
The protocol was approved by the hospital's institutional review board. On a general medical unita non‐electrocardiographic telemetry, nonsurgical unit of an acute care hospital, where patients are assigned the primary service of an internal medicine physicianwe instructed 2 registered nurse (RN) volunteers (RN1 and RN2) in the I‐MOVE protocol. Each RN administered I‐MOVE independently to 41 consecutive, cognitively intact patients in a blinded fashion (ie, neither nurse was aware of the other's scoring of each patient) and within 1 hour of each other's assessment.
After administering I‐MOVE to each patient, the nurse judged and scored the patient's performance using the 12‐level I‐MOVE ordinal scale, ranging from a low value of 1, complete dependence, to the highest value of 12, complete independence. The patients' I‐MOVE score pairs recorded by RN1 and RN2 were statistically compared. Interrater reliability, a comparison of the 41 patients' score pairs, is graphically represented in Figure 2. The calculated intraclass correlation coefficient (r) was 0.90, indicating excellent agreement (r > 0.75).
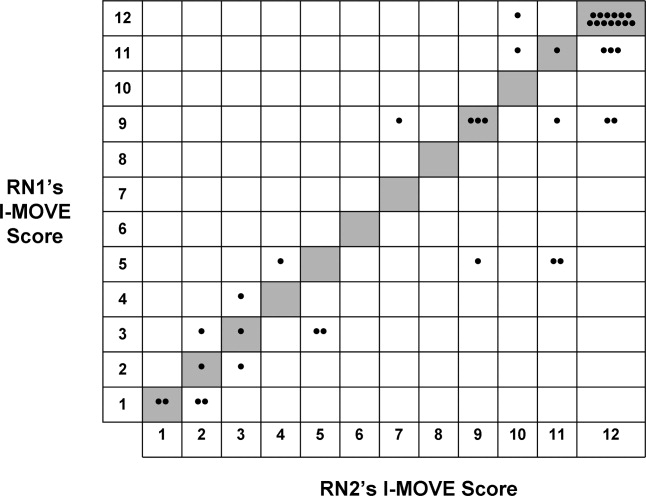
Discussion
Traditional physical examinations by physicians and assessments by nurses do not routinely extend to standardized mobility testing and may fail to recognize disability. Of the existing mobility assessment tools, we believe that most are not suited to patients hospitalized on general medical units. I‐MOVE has been designed to address this need, with an emphasis on practicality and brevity to allow repetition at appropriate intervals (tracking), as is done for vital signs. In this initial study, I‐MOVE was found to have face‐valid content and excellent interrater agreement.
Our study had several limitations. Only 1 pair of test administrators was involved; the sample population was chosen by convenience; clustering of outcomes occurred at level 12, which may have augmented the agreement; and the study was limited to cognitively intact patients. Note that we chose to use the intraclass correlation coefficient rather than the statistic because the weighting between the ordinal I‐MOVE scores has not yet been studied and defined. Also, the weighted is asymptotically equivalent to the intraclass correlation coefficient.
I‐MOVE is intended to aid caregivers in the recognition of debility so that appropriate interventions such as physical therapy may be prescribed. It was designed to complement, not replace, specialized evaluations such as those performed by physical therapists, occupational therapists, or comprehensive geriatric assessments. This practical assessment of basic functioning may enhance communication among caregivers, patients, and patients' family members, especially with regard to discharge planning. Further study is needed to validate I‐MOVE against existing tools, evaluate I‐MOVE's utility as a vital sign, and discern whether a sharp or unexpected decline portends a medical complication.
- .Health status and physical capacity. In:Osterweil D,Brummel‐Smith K,Beck JC, eds.Comprehensive Geriatric Assessment.New York:McGraw‐Hill;2000:41–66.
- ,,, et al.A predictive index for functional decline in hospitalized elderly medical patients.J Gen Intern Med.1993;8(12):645–652.
- ,,.Prevalence and outcomes of low mobility in hospitalized older patients.J Am Geriatr Soc.2004;52(8):1263–1270.
- ,,, et al.Detection and management of falls and instability in vulnerable elders by community physicians.J Am Geriatr Soc.2004;52(9):1527–1531.
- ,,.Exercising body and mind: an integrated approach to functional independence in hospitalized older people.J Am Geriatr Soc.2008;56(4):630–635.
Hospitalized patients are often debilitated, either from their admitting illness or from the deconditioning that occurs with inactivity. Functional decline, which appears to progress in a hierarchical pattern,1 occurs in 24% to 50% of geriatric patients during hospitalization and is poorly documented.2 Such a decline is associated not only with longer hospital stays and increased health care costs but also with higher mortality.3 The American College of Physicians, through its Assessing Care of Vulnerable Elders project, expressly endorsed gait and mobility evaluation as a quality indicator, and examination insufficiency is well documented.4
Of the several existing mobility assessment tools, few are used routinely in hospital. Some require complex scoring; others require timing and/or a trained occupational therapist.5 We created a simplified tool named Independent Mobility Validation Examination (I‐MOVE) for use by bedside caregivers. We evaluated the tool's face validity and interobserver agreement.
I‐MOVE
I‐MOVE, represented schematically in Figure 1, is a performance test that assesses the patient's ability to perform a sequence of 6 basic tasks: rolling over in bed, sitting up, standing, transferring to a chair, walking in the room, and walking in the hallway. Most motor functions can be assumed to be hierarchical in nature; any patient who can perform at the highest level, such as walking safely, also would be expected to perform at the lowest level.
Instructions for administering I‐MOVE are as follows:
-
Review current orders. Exclude patients ordered on bed rest or non‐weight‐bearing or other orders precluding any of the 6 requested actions.
-
Prepare environment.
-
Chair at bedside.
-
Lower side bed rail closest to chair.
-
Clear path for patient to ambulate.
-
Ensure patient dons slippers.
-
Flatten bed.
-
Ensure any gait assistive device, if generally used by the patient, is within reach from the bedside.
-
Requests for patient action (for steps c through f, make available and within reach any appropriate gait‐assistance device such as walker or cane, if such is customarily used at home or newly prescribed):
-
With patient lying supine in bed, with close supervision, ask patient to turn from side to side in bed (request when both bed rails are up).
-
Lower side rail closer to chair and ask the patient to rise up to a sitting position and turn to sit up with legs dangling off the bed.
-
Ask the patient to stand.
-
Ask the patient to take a seat in the chair next to the bed.
-
Ask the patient to ambulate in the room.
-
Ask the patient to ambulate in the hallway.
-
At any point if the patient seems incapable, unsteady, or unsafe to accomplish the requested task, render hands‐on assistance and immediately end the test.
-
Document, by number (1‐12), the activity level successfully accomplished independently by the patient (even number levels) or accomplished with assistance (odd number levels).
-
Patient may be considered independent if able to perform the activity with a normal assistive device (cane, walker, brace, or crutches) but not using furniture.
-
Assistance is defined as any physical contact with the patient.
Findings
Face Validity
We sent surveys to 6 experienced practicing clinicians at our hospital: a geriatrician, a physiatrist, an exercise physiologist, an occupational therapist, a physical therapist, and a registered nurse. We asked each clinician to rate the 6 I‐MOVE elements (requested actions) for clinical relevance to mobility independence. Relevance of each element was measured on an ordinal scale with scores ranging from 1 to 4, with: 1 not relevant; 2 somewhat relevant; 3 quite relevant; and 4 very relevant. From the 5 responses we received, 4 evaluators ranked all 6 I‐MOVE requested actions as very relevant. The fifth evaluator ranked 5 of the 6 actions as very relevant and 1 action (walking in the room) as quite relevant. These results demonstrate general agreement that I‐MOVE is, at face value, a reasonable measure of independent mobility.
Interrater Reliability
The protocol was approved by the hospital's institutional review board. On a general medical unita non‐electrocardiographic telemetry, nonsurgical unit of an acute care hospital, where patients are assigned the primary service of an internal medicine physicianwe instructed 2 registered nurse (RN) volunteers (RN1 and RN2) in the I‐MOVE protocol. Each RN administered I‐MOVE independently to 41 consecutive, cognitively intact patients in a blinded fashion (ie, neither nurse was aware of the other's scoring of each patient) and within 1 hour of each other's assessment.
After administering I‐MOVE to each patient, the nurse judged and scored the patient's performance using the 12‐level I‐MOVE ordinal scale, ranging from a low value of 1, complete dependence, to the highest value of 12, complete independence. The patients' I‐MOVE score pairs recorded by RN1 and RN2 were statistically compared. Interrater reliability, a comparison of the 41 patients' score pairs, is graphically represented in Figure 2. The calculated intraclass correlation coefficient (r) was 0.90, indicating excellent agreement (r > 0.75).
Discussion
Traditional physical examinations by physicians and assessments by nurses do not routinely extend to standardized mobility testing and may fail to recognize disability. Of the existing mobility assessment tools, we believe that most are not suited to patients hospitalized on general medical units. I‐MOVE has been designed to address this need, with an emphasis on practicality and brevity to allow repetition at appropriate intervals (tracking), as is done for vital signs. In this initial study, I‐MOVE was found to have face‐valid content and excellent interrater agreement.
Our study had several limitations. Only 1 pair of test administrators was involved; the sample population was chosen by convenience; clustering of outcomes occurred at level 12, which may have augmented the agreement; and the study was limited to cognitively intact patients. Note that we chose to use the intraclass correlation coefficient rather than the statistic because the weighting between the ordinal I‐MOVE scores has not yet been studied and defined. Also, the weighted is asymptotically equivalent to the intraclass correlation coefficient.
I‐MOVE is intended to aid caregivers in the recognition of debility so that appropriate interventions such as physical therapy may be prescribed. It was designed to complement, not replace, specialized evaluations such as those performed by physical therapists, occupational therapists, or comprehensive geriatric assessments. This practical assessment of basic functioning may enhance communication among caregivers, patients, and patients' family members, especially with regard to discharge planning. Further study is needed to validate I‐MOVE against existing tools, evaluate I‐MOVE's utility as a vital sign, and discern whether a sharp or unexpected decline portends a medical complication.
- .Health status and physical capacity. In:Osterweil D,Brummel‐Smith K,Beck JC, eds.Comprehensive Geriatric Assessment.New York:McGraw‐Hill;2000:41–66.
- ,,, et al.A predictive index for functional decline in hospitalized elderly medical patients.J Gen Intern Med.1993;8(12):645–652.
- ,,.Prevalence and outcomes of low mobility in hospitalized older patients.J Am Geriatr Soc.2004;52(8):1263–1270.
- ,,, et al.Detection and management of falls and instability in vulnerable elders by community physicians.J Am Geriatr Soc.2004;52(9):1527–1531.
- ,,.Exercising body and mind: an integrated approach to functional independence in hospitalized older people.J Am Geriatr Soc.2008;56(4):630–635.

Thrombolytics for VTE: Current Practice
More than a decade ago, we surveyed a group of practicing pulmonologists to determine their attitudes regarding the use of thrombolytic therapy in various settings of acute venous thromboembolism (VTE).1 Since that time, the literature regarding the treatment of acute VTE has grown dramatically.214 However, despite the available evidence, there remains considerable controversy regarding the appropriate setting for thrombolysis in acute pulmonary embolism (PE) or deep‐vein thrombosis (DVT). We therefore sought to better describe the current patterns of thrombolytic use among practicing pulmonologists and to determine if these patterns have changed over the last decade.
Methods
Five‐hundred and ten physicians in the southeastern US were selected from the American Thoracic Society (ATS) membership roster and were e‐mailed a link to an online questionnaire. The roster was searched for physicians who described their subspecialty as pulmonary disease or pulmonary and critical care.
Participants were asked background information and questions regarding hypothetical clinical scenarios. All participants were offered a $50 stipend, and to further improve the response rate, 2 reminder e‐mail messages were sent 30 days and 45 days after the initial request.
Baseline findings of the survey were summarized using descriptive statistics. Differences among participants and their responses were determined by Fisher's exact test. Analyses were performed using SAS E‐Guide Version 3.0 for Windows (SAS Institute, Cary, NC) with 2‐sided P values at the standard 0.05 level used to determine statistical significance.
Results
Baseline Characteristics
Eighty‐one physicians completed the questionnaire; their baseline characteristics are shown in Table 1. During the previous 2 years, all physicians surveyed had treated at least 1 patient with acute PE and all but 1 had treated at least 1 patient with DVT. Also, 68 respondents reported that they had used thrombolytic therapy in at least 1 case of PE in the past 2 years.
| |
| Age, mean (years) | 45.6 |
| Training completed, n (%) | |
| 1980‐1989 | 28 (34.5) |
| 1990‐1999 | 25 (31.0) |
| 2000‐2007 | 28 (34.5) |
| Practice type n (%) | |
| Academic | 35 (43) |
| Private practice | 37 (46) |
| Private practice with academic appointment | 6 (7) |
| Other | 3 (4) |
| Practice setting, n (%) | |
| Predominantly outpatient | 8 (10) |
| Predominantly inpatient | 29 (36) |
| Equal inpatient and outpatient | 44 (54) |
| Hospital size (beds), n (%) | |
| 50 | 1 (1) |
| 50‐100 | 1 (1) |
| 100‐300 | 20 (25) |
| 300‐500 | 22 (27) |
| >500 | 37 (46) |
| Number of patients treated with PE in the past 2 years, n (%) | |
| 0 | 0 (0) |
| 1‐5 | 3 (4) |
| 6‐10 | 14 (17) |
| 11‐15 | 12 (15) |
| 16‐20 | 17 (21) |
| >20 | 35 (43) |
| Number of patients treated with DVT in the past 2 years, n (%) | |
| 0 | 1 (1) |
| 1‐5 | 3 (4) |
| 6‐10 | 7 (9) |
| 11‐15 | 16 (20) |
| 16‐20 | 11 (14) |
| >20 | 43 (53) |
| Number of patients with PE treated with thrombolysis, n (%) | |
| 0 | 13 (16) |
| 1‐5 | 53 (65) |
| 6‐10 | 11 (14) |
| 11‐15 | 1 (1) |
| 16‐20 | 2 (2) |
| >20 | 1 (1) |
Use of Thrombolytic Therapy in Various Scenarios
The responses for the 8 clinical scenarios are shown in Table 2. Approximately equal numbers of academic and private practice physicians completed the questionnaire, and comparison between these groups showed no significant differences in decision‐making for each of the case scenarios. Less experienced physicians (>10 cases treated versus 10 cases treated) were more likely to consider thrombolytic therapy in a patient with a smaller PE but with poor cardiopulmonary reserve (P = 0.001), and with proximal symptomatic DVT of any size present less than 7 days (P = 0.047).
| Scenario | Current Study (%) | Previous Study1 (%) | P |
|---|---|---|---|
| |||
| Massive PE with hypotension | 80 (99) | 56 (100) | NS |
| Large PE with hypoxemia | 67 (83) | 41 (73) | NS |
| PE with RV strain or failure | 50 (62) | 31 (55) | NS |
| Large PE without hypotension, hypoxemia, or RV strain | 9 (11) | 6 (11) | NS |
| Smaller PE in a patient with poor cardiopulmonary reserve | 11 (14) | ||
| Massive symptomatic DVT, 7 days | 41 (51) | 33 (59) | NS |
| Massive symptomatic DVT, >7 days | 14 (17) | ||
| Proximal DVT, any size, 7 days | 6 (7) | 7 (13) | NS |
Use of Thrombolytic Therapy When Contraindications Exist
The vast majority of respondents reported that they would consider giving thrombolytic therapy to a patient with massive PE and hypotension requiring vasopressor therapy despite having a traditional contraindication (relative or absolute) to thrombolysis (Table 3). Most respondents would consider giving thrombolytic therapy to postoperative orthopedic, abdominal, or thoracic surgery patients if they were more than 2 weeks postoperation, and very few would give thrombolytic therapy to patients who were less than 2 days postoperation. Many respondents would also consider giving thrombolytic therapy to a patient with a massive PE and with a history of major gastrointestinal (GI) bleeding (requiring blood transfusion) if the bleed was more than 4 weeks prior to the embolism (Figure 1).

| Condition | Number of Physicians (%) |
|---|---|
| |
| Age >75 years | 58 (72) |
| Guaiac + stool | 54 (67) |
| CPR in past 10 days | 39 (48) |
| History of ischemic stroke | 37 (46) |
| Recent venipuncture of a noncompressible vessel | 33 (41) |
| History of ICH | 6 (7) |
| Brain tumor | 6 (7) |
| Would never use thrombolytics in these scenarios | 7 (9) |
Discussion
Given the paucity of data from randomized controlled trials, there remains considerable controversy regarding the indications for thrombolytic therapy. It may be difficult to define those patients in whom the benefit of a rapid reduction in clot burden outweighs the increased hemorrhagic risk. The case for thrombolysis is the strongest in patients with massive PE complicated by hypotension, in whom the mortality rate may be 30%.15 Our survey confirms that the vast majority of practicing pulmonologists would strongly consider systemic thrombolysis in this clinical setting, which is in accordance with current guidelines and with our previous survey results.1, 5, 10, 12
No clinical trial has specifically evaluated thrombolytic therapy in patients with large PE and hypoxemia but without hypotension, and it is interesting that so many physicians would consider thrombolytic therapy in this scenario. As right heart failure is the cause of death in PE, the absence of significant hypotension would imply less cardiovascular risk and thrombolytic use would seemingly be less justifiable from a physiologic point of view. It may be that further study and education is warranted in this area.
Many patients who present with acute, life‐threatening PE have contraindications or relative contraindications to systemic thrombolysis. Our study suggests that most practicing pulmonologists would consider giving thrombolytic therapy in some of these situations, such as if the patient was more than 2 weeks postoperative from major thoracic or abdominal surgery (or even a few days following orthopedic surgery), or in the setting of advanced age or guaiac positive stools. Physicians were appropriately very reluctant to use thrombolytic therapy in the setting of a brain tumor or prior intracranial hemorrhage. These scenarios emphasize the vagaries of the current guidelines and real‐world complexities of considering thrombolytic therapy in clinical practice, in which the risks and benefits must be weighed on a case‐by‐case basis.
One major difference between our current and past findings is the general experience with thrombolytic therapy in acute PE. In our first study, only 54% of physicians queried had employed systemic thrombolysis for acute PE. Our current findings were that 84% of physicians had used thrombolysis for acute PE within the last 2 years, perhaps suggesting a greater comfort with this therapy.
Response bias is a major limitation of our study. We sought to keep questions short and clear, and offered a small stipend to improve the return rate. Despite these measures, only 81 of 510 questionnaires were completed. We selected our list of participants from the ATS roster and by geographic location. As suggested by our findings, the results may have been different had we focused solely on VTE experts or those treating large numbers of VTE patients. One strength of this study is that our sample had approximately even numbers of academic and private practice physicians, and that we could compare current results with our prior findings.
In conclusion, practicing pulmonologists generally agreed that in the absence of contraindications, thrombolytic therapy should be considered in patients with massive PE and hypotension, which is in accordance with current guidelines. Furthermore, a majority would still consider thrombolytic therapy in this scenario even if certain contraindications were present. Although there is less agreement in other scenarios, a majority of physicians would consider using thrombolytics in patients with PE and severe hypoxemia or right ventricular (RV) dysfunction. Despite the evolving data and guidelines, our findings are similar to prior survey results, with the notable exception that more physicians reported thrombolytic therapy use in acute PE in the current study. This emphasizes the need for further physician education and future randomized clinical trials to delineate and unify therapeutic strategies in cases of VTE.
- ,,.Thrombolytic therapy for venous thromboembolism. Utilization by practicing pulmonologists.Arch Intern Med.1994;154:1601–1604.
- ,,, et al.Streptokinase vs alteplase in massive pulmonary embolism. A randomized trial assessing right heart haemodynamics and pulmonary vascular obstruction.Eur Heart J.1997;18:1141–1148.
- ,,, et al.Comparative efficacy of a two‐hour regimen of streptokinase versus alteplase in acute massive pulmonary embolism: immediate clinical and hemodynamic outcome and one‐year follow‐up.J Am Coll Cardiol.1998;31:1057–1063.
- ,,.Acute pulmonary embolism: clinical outcomes in the International Cooperative Pulmonary Embolism Registry (ICOPER).Lancet.1999;353:1386–1389.
- ,,, et al.Guidelines on diagnosis and management of acute pulmonary embolism. Task Force on Pulmonary Embolism, European Society of Cardiology.Eur Heart J.2000;21:1301–1336.
- ,,,.Long‐term benefit of thrombolytic therapy in patients with pulmonary embolism.Vasc Med.2000;5:91–95.
- ,,, et al.Thrombolytic therapy of pulmonary embolism: a meta‐analysis.J Am Coll Cardiol.2002;40:1660–1667.
- ,,, et al.Heparin plus alteplase compared with heparin alone in patients with submassive pulmonary embolism.N Engl J Med.2002;347:1143–1150.
- ,,.Thrombolysis vs heparin in the treatment of pulmonary embolism: a clinical outcome‐based meta‐analysis.Arch Intern Med.2002;162:2537–2541.
- ,,, et al.British Thoracic Society guidelines for the management of suspected acute pulmonary embolism.Thorax.2003;58:470–483.
- ,.Thrombolysis for acute deep vein thrombosis.Cochrane Database Syst Rev.2004;CD002783.
- ,,, et al.Antithrombotic therapy for venous thromboembolic disease: the Seventh ACCP Conference on Antithrombotic and Thrombolytic Therapy.Chest.2004;126:401S–428S.
- ,,, et al.Thrombolysis compared with heparin for the initial treatment of pulmonary embolism: a meta‐analysis of the randomized controlled trials.Circulation.2004;110:744–749.
- ,,, et al.Thrombolytic therapy for pulmonary embolism.Cochrane Database Syst Rev.2006;CD004437.
- ,,Thrombolytic therapy for pulmonary embolism: is it effective? Is it safe? When is it indicated?Arch Intern Med.1997;157:2550–2556.
More than a decade ago, we surveyed a group of practicing pulmonologists to determine their attitudes regarding the use of thrombolytic therapy in various settings of acute venous thromboembolism (VTE).1 Since that time, the literature regarding the treatment of acute VTE has grown dramatically.214 However, despite the available evidence, there remains considerable controversy regarding the appropriate setting for thrombolysis in acute pulmonary embolism (PE) or deep‐vein thrombosis (DVT). We therefore sought to better describe the current patterns of thrombolytic use among practicing pulmonologists and to determine if these patterns have changed over the last decade.
Methods
Five‐hundred and ten physicians in the southeastern US were selected from the American Thoracic Society (ATS) membership roster and were e‐mailed a link to an online questionnaire. The roster was searched for physicians who described their subspecialty as pulmonary disease or pulmonary and critical care.
Participants were asked background information and questions regarding hypothetical clinical scenarios. All participants were offered a $50 stipend, and to further improve the response rate, 2 reminder e‐mail messages were sent 30 days and 45 days after the initial request.
Baseline findings of the survey were summarized using descriptive statistics. Differences among participants and their responses were determined by Fisher's exact test. Analyses were performed using SAS E‐Guide Version 3.0 for Windows (SAS Institute, Cary, NC) with 2‐sided P values at the standard 0.05 level used to determine statistical significance.
Results
Baseline Characteristics
Eighty‐one physicians completed the questionnaire; their baseline characteristics are shown in Table 1. During the previous 2 years, all physicians surveyed had treated at least 1 patient with acute PE and all but 1 had treated at least 1 patient with DVT. Also, 68 respondents reported that they had used thrombolytic therapy in at least 1 case of PE in the past 2 years.
| |
| Age, mean (years) | 45.6 |
| Training completed, n (%) | |
| 1980‐1989 | 28 (34.5) |
| 1990‐1999 | 25 (31.0) |
| 2000‐2007 | 28 (34.5) |
| Practice type n (%) | |
| Academic | 35 (43) |
| Private practice | 37 (46) |
| Private practice with academic appointment | 6 (7) |
| Other | 3 (4) |
| Practice setting, n (%) | |
| Predominantly outpatient | 8 (10) |
| Predominantly inpatient | 29 (36) |
| Equal inpatient and outpatient | 44 (54) |
| Hospital size (beds), n (%) | |
| 50 | 1 (1) |
| 50‐100 | 1 (1) |
| 100‐300 | 20 (25) |
| 300‐500 | 22 (27) |
| >500 | 37 (46) |
| Number of patients treated with PE in the past 2 years, n (%) | |
| 0 | 0 (0) |
| 1‐5 | 3 (4) |
| 6‐10 | 14 (17) |
| 11‐15 | 12 (15) |
| 16‐20 | 17 (21) |
| >20 | 35 (43) |
| Number of patients treated with DVT in the past 2 years, n (%) | |
| 0 | 1 (1) |
| 1‐5 | 3 (4) |
| 6‐10 | 7 (9) |
| 11‐15 | 16 (20) |
| 16‐20 | 11 (14) |
| >20 | 43 (53) |
| Number of patients with PE treated with thrombolysis, n (%) | |
| 0 | 13 (16) |
| 1‐5 | 53 (65) |
| 6‐10 | 11 (14) |
| 11‐15 | 1 (1) |
| 16‐20 | 2 (2) |
| >20 | 1 (1) |
Use of Thrombolytic Therapy in Various Scenarios
The responses for the 8 clinical scenarios are shown in Table 2. Approximately equal numbers of academic and private practice physicians completed the questionnaire, and comparison between these groups showed no significant differences in decision‐making for each of the case scenarios. Less experienced physicians (>10 cases treated versus 10 cases treated) were more likely to consider thrombolytic therapy in a patient with a smaller PE but with poor cardiopulmonary reserve (P = 0.001), and with proximal symptomatic DVT of any size present less than 7 days (P = 0.047).
| Scenario | Current Study (%) | Previous Study1 (%) | P |
|---|---|---|---|
| |||
| Massive PE with hypotension | 80 (99) | 56 (100) | NS |
| Large PE with hypoxemia | 67 (83) | 41 (73) | NS |
| PE with RV strain or failure | 50 (62) | 31 (55) | NS |
| Large PE without hypotension, hypoxemia, or RV strain | 9 (11) | 6 (11) | NS |
| Smaller PE in a patient with poor cardiopulmonary reserve | 11 (14) | ||
| Massive symptomatic DVT, 7 days | 41 (51) | 33 (59) | NS |
| Massive symptomatic DVT, >7 days | 14 (17) | ||
| Proximal DVT, any size, 7 days | 6 (7) | 7 (13) | NS |
Use of Thrombolytic Therapy When Contraindications Exist
The vast majority of respondents reported that they would consider giving thrombolytic therapy to a patient with massive PE and hypotension requiring vasopressor therapy despite having a traditional contraindication (relative or absolute) to thrombolysis (Table 3). Most respondents would consider giving thrombolytic therapy to postoperative orthopedic, abdominal, or thoracic surgery patients if they were more than 2 weeks postoperation, and very few would give thrombolytic therapy to patients who were less than 2 days postoperation. Many respondents would also consider giving thrombolytic therapy to a patient with a massive PE and with a history of major gastrointestinal (GI) bleeding (requiring blood transfusion) if the bleed was more than 4 weeks prior to the embolism (Figure 1).
| Condition | Number of Physicians (%) |
|---|---|
| |
| Age >75 years | 58 (72) |
| Guaiac + stool | 54 (67) |
| CPR in past 10 days | 39 (48) |
| History of ischemic stroke | 37 (46) |
| Recent venipuncture of a noncompressible vessel | 33 (41) |
| History of ICH | 6 (7) |
| Brain tumor | 6 (7) |
| Would never use thrombolytics in these scenarios | 7 (9) |
Discussion
Given the paucity of data from randomized controlled trials, there remains considerable controversy regarding the indications for thrombolytic therapy. It may be difficult to define those patients in whom the benefit of a rapid reduction in clot burden outweighs the increased hemorrhagic risk. The case for thrombolysis is the strongest in patients with massive PE complicated by hypotension, in whom the mortality rate may be 30%.15 Our survey confirms that the vast majority of practicing pulmonologists would strongly consider systemic thrombolysis in this clinical setting, which is in accordance with current guidelines and with our previous survey results.1, 5, 10, 12
No clinical trial has specifically evaluated thrombolytic therapy in patients with large PE and hypoxemia but without hypotension, and it is interesting that so many physicians would consider thrombolytic therapy in this scenario. As right heart failure is the cause of death in PE, the absence of significant hypotension would imply less cardiovascular risk and thrombolytic use would seemingly be less justifiable from a physiologic point of view. It may be that further study and education is warranted in this area.
Many patients who present with acute, life‐threatening PE have contraindications or relative contraindications to systemic thrombolysis. Our study suggests that most practicing pulmonologists would consider giving thrombolytic therapy in some of these situations, such as if the patient was more than 2 weeks postoperative from major thoracic or abdominal surgery (or even a few days following orthopedic surgery), or in the setting of advanced age or guaiac positive stools. Physicians were appropriately very reluctant to use thrombolytic therapy in the setting of a brain tumor or prior intracranial hemorrhage. These scenarios emphasize the vagaries of the current guidelines and real‐world complexities of considering thrombolytic therapy in clinical practice, in which the risks and benefits must be weighed on a case‐by‐case basis.
One major difference between our current and past findings is the general experience with thrombolytic therapy in acute PE. In our first study, only 54% of physicians queried had employed systemic thrombolysis for acute PE. Our current findings were that 84% of physicians had used thrombolysis for acute PE within the last 2 years, perhaps suggesting a greater comfort with this therapy.
Response bias is a major limitation of our study. We sought to keep questions short and clear, and offered a small stipend to improve the return rate. Despite these measures, only 81 of 510 questionnaires were completed. We selected our list of participants from the ATS roster and by geographic location. As suggested by our findings, the results may have been different had we focused solely on VTE experts or those treating large numbers of VTE patients. One strength of this study is that our sample had approximately even numbers of academic and private practice physicians, and that we could compare current results with our prior findings.
In conclusion, practicing pulmonologists generally agreed that in the absence of contraindications, thrombolytic therapy should be considered in patients with massive PE and hypotension, which is in accordance with current guidelines. Furthermore, a majority would still consider thrombolytic therapy in this scenario even if certain contraindications were present. Although there is less agreement in other scenarios, a majority of physicians would consider using thrombolytics in patients with PE and severe hypoxemia or right ventricular (RV) dysfunction. Despite the evolving data and guidelines, our findings are similar to prior survey results, with the notable exception that more physicians reported thrombolytic therapy use in acute PE in the current study. This emphasizes the need for further physician education and future randomized clinical trials to delineate and unify therapeutic strategies in cases of VTE.
- ,,.Thrombolytic therapy for venous thromboembolism. Utilization by practicing pulmonologists.Arch Intern Med.1994;154:1601–1604.
- ,,, et al.Streptokinase vs alteplase in massive pulmonary embolism. A randomized trial assessing right heart haemodynamics and pulmonary vascular obstruction.Eur Heart J.1997;18:1141–1148.
- ,,, et al.Comparative efficacy of a two‐hour regimen of streptokinase versus alteplase in acute massive pulmonary embolism: immediate clinical and hemodynamic outcome and one‐year follow‐up.J Am Coll Cardiol.1998;31:1057–1063.
- ,,.Acute pulmonary embolism: clinical outcomes in the International Cooperative Pulmonary Embolism Registry (ICOPER).Lancet.1999;353:1386–1389.
- ,,, et al.Guidelines on diagnosis and management of acute pulmonary embolism. Task Force on Pulmonary Embolism, European Society of Cardiology.Eur Heart J.2000;21:1301–1336.
- ,,,.Long‐term benefit of thrombolytic therapy in patients with pulmonary embolism.Vasc Med.2000;5:91–95.
- ,,, et al.Thrombolytic therapy of pulmonary embolism: a meta‐analysis.J Am Coll Cardiol.2002;40:1660–1667.
- ,,, et al.Heparin plus alteplase compared with heparin alone in patients with submassive pulmonary embolism.N Engl J Med.2002;347:1143–1150.
- ,,.Thrombolysis vs heparin in the treatment of pulmonary embolism: a clinical outcome‐based meta‐analysis.Arch Intern Med.2002;162:2537–2541.
- ,,, et al.British Thoracic Society guidelines for the management of suspected acute pulmonary embolism.Thorax.2003;58:470–483.
- ,.Thrombolysis for acute deep vein thrombosis.Cochrane Database Syst Rev.2004;CD002783.
- ,,, et al.Antithrombotic therapy for venous thromboembolic disease: the Seventh ACCP Conference on Antithrombotic and Thrombolytic Therapy.Chest.2004;126:401S–428S.
- ,,, et al.Thrombolysis compared with heparin for the initial treatment of pulmonary embolism: a meta‐analysis of the randomized controlled trials.Circulation.2004;110:744–749.
- ,,, et al.Thrombolytic therapy for pulmonary embolism.Cochrane Database Syst Rev.2006;CD004437.
- ,,Thrombolytic therapy for pulmonary embolism: is it effective? Is it safe? When is it indicated?Arch Intern Med.1997;157:2550–2556.