User login
Limited communication and management of emergency department hyperglycemia in hospitalized patients
While increasing evidence suggests that hyperglycemia during illness is associated with poor clinical outcome,1, 2 hyperglycemia in the hospital setting is often overlooked and unaddressed.3, 4 Early and intensive management of hyperglycemia may improve outcomes in hospitalized patients.57 Emergency Department (ED) glucose values may present an early opportunity to identify hyperglycemic patients as having unrecognized glucose intolerance and improve early glycemic control for hospitalized patients. Serum glucose values are available for 18% of 110 million annual ED visits in the United States, and many others undergo capillary glucose measurements.8 Although stressors and lack of fasting may contribute to ED hyperglycemia, communication and management should be similar.5 In this study, we hypothesized that in less than 20% of patients ED hyperglycemia would be recognized, communicated to patients, or they would receive ED treatment.
PATIENTS AND METHODS
Study Design
This was a retrospective cohort study using a structured medical record review of consecutive ED patients presenting between September 1, 2004 and August 31, 2005. We obtained our Institutional Review Board's approval with waiver of informed consent.
Study Setting and Population
The site of data collection was an urban, academic institution with approximately 50,000 annual ED visits. Care of hospitalized patients on the medical service is provided or supervised by staff hospitalists. Using the hospital's electronic records, we identified all patients with serum glucose ordered from the ED during the study time period. When there were multiple glucose results, we included only the first glucose values. Based on conservative thresholds for association of random glucose with poor clinical outcomes in hospitalized patients and with undiagnosed diabetes,5, 9 we considered glucose 140 mg/dL (7.8 mmol/L) as normal and categorized the remaining values into 2 groups: 140‐199 mg/dL (7.8‐11.0 mmol/L) and 200 mg/dL (11.1 mmol/L).
Study Protocol
We selected 200 patients from each glucose group using a random number generator, and 2 investigators (D.J.S., A.A.G.) performed a detailed chart review using a standardized data abstraction form. The research team met frequently to maintain consistency in data collection and to resolve disputes.
We recorded demographic data, presence of a primary care provider, relevant past medical history, current medications, ED treatment (insulin, oral hypoglycemic agents, and intravenous fluids), disposition (admission or discharge), and final diagnoses. Additionally, we evaluated capillary blood glucose values during the ED stay and serum glucose values during the ED and hospital stay to evaluate for hypoglycemia (defined as glucose 65 mg/dL). We also evaluate diagnosis codes to identify concurrent infection, sepsis, or trauma that may have been associated with the hyperglycemia, based on previously reported methodology.10, 11 Finally, we examined the inpatient or ED written discharge instructions to evaluate newly started antidiabetic medications, communication of hyperglycemia, and recommendation of repeat glucose/diabetes testing.
Data Analysis
We performed statistical analyses using Stata 9.0 (Stata Corp., College Station, TX) and summarized data using basic descriptive statistics with 95% confidence intervals (95%CIs). We measured interrater agreement for chart abstraction by calculating the kappa statistic for a 5% sample of charts abstracted by both investigators. We considered kappa >0.80 as high interrater agreement. We evaluated differences between subgroups of interest using chi square test. All P values are 2‐tailed, with P 0.05 considered statistically significant.
RESULTS
During the data collection period, 27,688 (58%) ED visits had at least 1 serum glucose result. After excluding multiple glucose results for the same visit, the median glucose value was 106 mg/dL (range, 7‐2280 mg/dL); 3517 (13%) values were 140‐199 mg/dL, and 2304 (8%) values were 200 mg/dL. We located 385 of the 400 (96%) randomly selected charts. Interrater agreement for chart review was high (kappa = 0.91‐0.98).
Table 1 shows demographic characteristics and Table 2 shows clinical data of the sample, stratified by glucose group and charted diagnosis of diabetes. Overall, 55% of patients with glucose values 140‐199 mg/dL and 16% of patients with glucose 200 mg/dL had no prior diabetes diagnosis. Hyperglycemia was associated with sepsis for 22% of patients, infection without sepsis for 13% of patients, and traumatic injury for 19% of patients.
| Glucose 140199 mg/dL % (95%CI) or Median (IQR) | Glucose 200 mg/dL % (95%CI) or Median (IQR) | ||||
|---|---|---|---|---|---|
| Variable | Diabetes (n = 87) | No Diabetes (n = 107) | Diabetes (n = 160) | No Diabetes (n = 31) | Total n (%) or Median (IQR) (n = 385) |
| |||||
| Demographics | |||||
| Age | 66 (5475) | 68 (5083) | 63 (5275) | 58 (3376) | 64 (5176) |
| Female sex | 39% (2950) | 58% (4867) | 55% (4763) | 26% (1245) | 50% (4555) |
| Race/ethnicity | |||||
| White | 67% (5676) | 75% (6583) | 61% (5369) | 71% (5286) | 258 (67%) |
| Black | 22% (1432) | 9% (517) | 21% (1528) | 10% (226) | 65 (17%) |
| Hispanic | 2% (08) | 4% (19) | 6% (310) | 3% (017) | 26 (4%) |
| Other | 9% (417) | 12% (720) | 12% (819) | 16% (534) | 46 (12%) |
| Insurance | |||||
| Private | 32% (2343) | 41% (3251) | 32% (2540) | 45% (2764) | 137 (36%) |
| Medicare | 61% (5071) | 47%(3757) | 49% (4157) | 32% (1751) | 192 (50%) |
| Medicaid | 6% (213) | 7% (314) | 16% (1022) | 6% (121) | 40 (10%) |
| None | 1% (06) | 5% (211) | 3% (17) | 16% (534) | 16 (4%) |
| Assigned PCP | 95% (8999) | 84% (7690) | 86% (8091) | 71% (5286) | 86% (8390) |
| Past medical history | |||||
| Hypertension | 61% (5071) | 45% (3555) | 58% (5066) | 39% (2156) | 206 (54%) |
| Hyperlipidemia | 28% (1938) | 21% (1329) | 25% (1932) | 10% (226) | 90 (23%) |
| Coronary artery disease | 41% (3152) | 29% (2138) | 26% (2034) | 13% (430) | 113 (29%) |
| Current medications | |||||
| Insulin | 36% (2647) | 0 | 54% (4662) | 0 | 117 (30%) |
| Sulfonylurea | 25% (1736) | 0 | 26% (1933) | 0 | 63 (16%) |
| Other oral hypoglycemic | 39% (2950) | 0 | 24% (1832) | 0 | 73 (19%) |
| Systemic corticosteroids | 5% (111) | 10% (517) | 4% (18) | 6% (121) | 23 (6%) |
| Glucose 140199 mg/dL % (95%CI) or Median (IQR) | Glucose 200 mg/dL % (95%CI) or Median (IQR) | ||||
|---|---|---|---|---|---|
| Variable | Diabetes | No Diabetes | Diabetes | No Diabetes | Total n (%) or Median (IQR) |
| |||||
| ED clinical data | (n = 87) | (n = 107) | (n = 160) | (n = 31) | (n = 385) |
| Glucose value, mg/dL | 167 (163170) | 160 (157163) | 308 (285330) | 272 (242300) | 231 (220244) |
| Insulin | 6% (213) | 1% (03) | 31% (2439) | 19% (737) | 61 (16%) |
| IVF without dextrose* | 44% (3355) | 54% (4464) | 51% (4358) | 68% (4983) | 198 (51%) |
| Hyperglycemia charted as diagnosis | 3% (110) | 0 | 18% (1225) | 16% (534) | 36 (9%) |
| Hospital admission | 76% (6584) | 79% (7187) | 73% (6680) | 84% (6695) | 293 (76%) |
| Discharge data | (n = 84) | (n = 98) | (n = 156) | (n = 25) | (n = 363) |
| New insulin Rx | 8% (316) | 5% (212) | 6% (310) | 16% (536) | 26 (7%) |
| New sulfonylurea Rx | 2% (08) | 1% (06) | 4% (18) | 0 | 10 (3%) |
| New other oral hypoglycemic Rx | 1% (06) | 1% (06) | 3% (17) | 8% (126) | 9 (2%) |
| Any new diabetes Rx | 12% (621) | 7% (314) | 12% (718) | 24% (945) | 42 (12%) |
| Hyperglycemia noted in written instructions | 4% (110) | 3% (19) | 15% (1021) | 24% (945) | 36 (10%) |
| Repeat glucose/diabetes testing charted | 5% (112) | 1% (06) | 9% (515) | 16% (536) | 23 (6%) |
No patient received intravenous fluids with dextrose prior to initial serum glucose determination, and there was no difference in home corticosteroid use between groups (P = 0.23). Patients with known diabetes were more likely to receive insulin in the ED (P 0.01). Only 1 patient received an oral hypoglycemic agent in the ED. Three patients had documented hypoglycemia on capillary blood glucose during the ED stay, and no patients had hypoglycemia based on serum glucose during the ED or hospital stay. Among hospitalized patients, 61% had inpatient orders for diabetic‐consistent/carbohydrate‐consistent diet, 65% for capillary glucose tests daily, and 63% for sliding scale insulin.
We also present written discharge instructions data for 363 visits (253 inpatient and 110 ED) in Table 2; discharge instructions were not available for 22 visits (12 deaths during hospitalization, 10 missing instructions). New antidiabetic medications were prescribed for 42 (12%) patients, all from the inpatient setting. There was no difference between inpatient and ED communication of hyperglycemia (10% [95%CI, 7%‐14%] versus 9% [95%CI, 4%‐15%]) and recommendation for further outpatient testing (8% [95%CI, 4%‐11%] versus 4% [95%CI, 0%‐7%]) in written discharge instructions (P = 0.73 and 0.16, respectively). Compared to those with glucose 140‐199 mg/dL, patients with glucose 200 mg/dL were more likely to receive written communication of hyperglycemia (17% [95%CI, 11%‐22%] versus 3% [95%CI, 0%‐6%]) and recommendation for further outpatient testing (10% [95%CI, 6%‐14%] versus 3% [95%CI, 0%‐5%] (both, P 0.01).
DISCUSSION
Although noncritical ED glucose values may be overlooked, values sufficient to motivate inpatient and long‐term management are sometimes uncovered, and when unrecognized may be missed opportunities. Indeed, admission hyperglycemia has been linked to poor clinical outcomes in hospitalized patients for a variety of conditions, particularly for myocardial infarction, stroke, and critical illness.1215
In this study, we evaluated recognition, communication, and management of ED glucose values above a relatively conservative threshold of 140 mg/dL, occurring in 21% of ED glucose results. Diabetes screening thresholds for casual glucose values as low as 120 mg/dL,9 and intensive glycemic control in critically ill patients to a target as low as 110 mg/dL have been suggested.5 Nevertheless, only 16% of our sample received insulin in the ED for hyperglycemia, and hyperglycemia was charted as a diagnosis in only 9% of cases.
This is especially important because 77% of ED visits without hyperglycemia charted as a diagnosis resulted in hospitalization, and early glycemic control was infrequently initiated. Limited ED management of hyperglycemia may be driven by the presence of more critical management issues (eg, 54% of patients had concomitant infection or trauma), lack of familiarity with guidelines, which suggest treatment to glucose 140 mg/dL in critically ill patients and 180 mg/dL in all hospitalized patients,16 or fear of adverse events, such as hypoglycemia. Additionally, ED crowding has been shown to effect decreased quality and timeliness of treatment for pneumonia, and may have similar effects for hyperglycemia.17 Inpatient recognition of hyperglycemia, based on orders for diet, glucose checks, and insulin, appeared significantly better, but this did not translate to improved communication in written discharge instructions. Additionally, many hospitalized patients may spend many hours, or even days, in the ED waiting for beds, which currently is a missed opportunity to initiate early therapy.
Written discharge instructions informed less than 10% of patients of their hyperglycemia or outlined a plan for further evaluation and management. Our prior work suggests that nearly all (95%) ED patients want to be informed of elevated blood glucose and are willing to follow‐up, if instructed.18 The current data suggests that hyperglycemia in ED and hospitalized patients is frequently unrecognized and undertreated, and opportunities to institute an outpatient plan to address hyperglycemia are frequently missed.
This study has several potential limitations. This study was performed at a single academic center, which limits generalizability to other geographic areas and hospital types. Accuracy of abstracted data depended on chart review, which is limited by the possibility of missing, incomplete, or unreliable information. Standardized definitions and abstraction forms limited potential for bias, and high interrater agreement demonstrated internal reliability of the chart review. We considered only initial glucose values and were unable to determine nutritional status; it is possible that subsequent measurements were within an acceptable range. Conversely, hospitalized patients may have developed hyperglycemia subsequent to the initial glucose result, which would underestimate the scope of inpatient hyperglycemia. Also, because there are limited data for interpretation of ED hyperglycemia, we were unable to determine optimal glucose thresholds. Finally, we were unable to evaluate the content of verbal instructions or letters to outpatient providers, which limited our ability to fully describe communication of abnormal findings. However, patients do not often retain information in verbal instructions, in the context of new diagnoses and complex medical regimens.
In summary, recognition, management, and communication of ED hyperglycemia were suboptimal in our patient population and represent a missed opportunity. Enhanced recognition, management, and referral for hyperglycemia observed during usual ED care may provide an unobtrusive method to improve identification of undiagnosed diabetes/prediabetes and initiation of intensive glycemic control for hospitalized patients.
- ,,,,,.Hyperglycemia: an independent marker of in‐hospital mortality in patients with undiagnosed diabetes.J Clin Endocrinol Metab.2002;87:978–982.
- ,,,,,.The relation between hyperglycemia and outcomes in 2,471 patients admitted to the hospital with community‐acquired pneumonia.Diabetes Care.2005;28:810–815.
- ,,,,.Inpatient management of diabetes and hyperglycemia among general medicine patients at a large teaching hospital.J Hosp Med.2006;1:145–150.
- ,,,,.Unrecognized diabetes among hospitalized patients.Diabetes Care.1998;21:246–249.
- ACE/ADA Task Force on Inpatient Diabetes.American College of Endocrinology and American Diabetes Association Consensus statement on inpatient diabetes and glycemic control: a call to action.Diabetes Care.2006;29:1955–1962.
- ,,, et al.Intensive insulin therapy in the medical ICU.N Engl J Med.2006;354:449–461.
- ,,, et al.Randomized trial of insulin‐glucose infusion followed by subcutaneous insulin treatment in diabetic patients with acute myocardial infarction (DIGAMI study): effects on mortality at 1 year.JAm Coll Cardiol.1995;26:57–65.
- ,,.National Hospital Ambulatory Medical Care Survey: 2005 emergency department summary.Adv Data.2007;386:1–32.
- ,,, et al.Performance of recommended screening tests for undiagnosed diabetes and dysglycemia.Diabetes Care.2001;24:1899–1903.
- ,,, et al.The epidemiology of sepsis in the United States from 1979 through 2000.N Engl J Med.2003;348:1546–1554.
- ,,,,,.Completeness and accuracy of International Classification of Disease (ICD) external cause of injury codes in emergency department electronic data.Inj Prev.2007;13:422–425.
- ,,,.Stress hyperglycemia and increased risk of death after myocardial infarction in patients with and without diabetes: a systematic overview.Lancet.2000;355:773–778.
- ,,, et al.Admission blood glucose level as a risk indicator of death after myocardial infarction in patients with and without diabetes mellitus.Arch Intern Med.2004;164:982–989.
- ,,, et al.Effects of admission hyperglycemia on mortality and costs in acute ischemic stroke.Neurology.2002;59:67–71.
- .Association between hyperglycemia and increased hospital mortality in a heterogeneous population of critically ill patients.Mayo Clin Proc.2003;78:1471–1478.
- American Diabetes Association.Standards of Medical Care in Diabetes—2008.Diabetes Care.2008;31;S12–S54.
- ,,,.Effect of emergency department crowding on time to antibiotics in patients admitted with community‐acquired pneumonia.Ann Emerg Med.2007;50:501–509.
- ,,,,.Estimated risk for undiagnosed diabetes in the emergency department: a multicenter survey.Acad Emerg Med.2007;14:492–495.
While increasing evidence suggests that hyperglycemia during illness is associated with poor clinical outcome,1, 2 hyperglycemia in the hospital setting is often overlooked and unaddressed.3, 4 Early and intensive management of hyperglycemia may improve outcomes in hospitalized patients.57 Emergency Department (ED) glucose values may present an early opportunity to identify hyperglycemic patients as having unrecognized glucose intolerance and improve early glycemic control for hospitalized patients. Serum glucose values are available for 18% of 110 million annual ED visits in the United States, and many others undergo capillary glucose measurements.8 Although stressors and lack of fasting may contribute to ED hyperglycemia, communication and management should be similar.5 In this study, we hypothesized that in less than 20% of patients ED hyperglycemia would be recognized, communicated to patients, or they would receive ED treatment.
PATIENTS AND METHODS
Study Design
This was a retrospective cohort study using a structured medical record review of consecutive ED patients presenting between September 1, 2004 and August 31, 2005. We obtained our Institutional Review Board's approval with waiver of informed consent.
Study Setting and Population
The site of data collection was an urban, academic institution with approximately 50,000 annual ED visits. Care of hospitalized patients on the medical service is provided or supervised by staff hospitalists. Using the hospital's electronic records, we identified all patients with serum glucose ordered from the ED during the study time period. When there were multiple glucose results, we included only the first glucose values. Based on conservative thresholds for association of random glucose with poor clinical outcomes in hospitalized patients and with undiagnosed diabetes,5, 9 we considered glucose 140 mg/dL (7.8 mmol/L) as normal and categorized the remaining values into 2 groups: 140‐199 mg/dL (7.8‐11.0 mmol/L) and 200 mg/dL (11.1 mmol/L).
Study Protocol
We selected 200 patients from each glucose group using a random number generator, and 2 investigators (D.J.S., A.A.G.) performed a detailed chart review using a standardized data abstraction form. The research team met frequently to maintain consistency in data collection and to resolve disputes.
We recorded demographic data, presence of a primary care provider, relevant past medical history, current medications, ED treatment (insulin, oral hypoglycemic agents, and intravenous fluids), disposition (admission or discharge), and final diagnoses. Additionally, we evaluated capillary blood glucose values during the ED stay and serum glucose values during the ED and hospital stay to evaluate for hypoglycemia (defined as glucose 65 mg/dL). We also evaluate diagnosis codes to identify concurrent infection, sepsis, or trauma that may have been associated with the hyperglycemia, based on previously reported methodology.10, 11 Finally, we examined the inpatient or ED written discharge instructions to evaluate newly started antidiabetic medications, communication of hyperglycemia, and recommendation of repeat glucose/diabetes testing.
Data Analysis
We performed statistical analyses using Stata 9.0 (Stata Corp., College Station, TX) and summarized data using basic descriptive statistics with 95% confidence intervals (95%CIs). We measured interrater agreement for chart abstraction by calculating the kappa statistic for a 5% sample of charts abstracted by both investigators. We considered kappa >0.80 as high interrater agreement. We evaluated differences between subgroups of interest using chi square test. All P values are 2‐tailed, with P 0.05 considered statistically significant.
RESULTS
During the data collection period, 27,688 (58%) ED visits had at least 1 serum glucose result. After excluding multiple glucose results for the same visit, the median glucose value was 106 mg/dL (range, 7‐2280 mg/dL); 3517 (13%) values were 140‐199 mg/dL, and 2304 (8%) values were 200 mg/dL. We located 385 of the 400 (96%) randomly selected charts. Interrater agreement for chart review was high (kappa = 0.91‐0.98).
Table 1 shows demographic characteristics and Table 2 shows clinical data of the sample, stratified by glucose group and charted diagnosis of diabetes. Overall, 55% of patients with glucose values 140‐199 mg/dL and 16% of patients with glucose 200 mg/dL had no prior diabetes diagnosis. Hyperglycemia was associated with sepsis for 22% of patients, infection without sepsis for 13% of patients, and traumatic injury for 19% of patients.
| Glucose 140199 mg/dL % (95%CI) or Median (IQR) | Glucose 200 mg/dL % (95%CI) or Median (IQR) | ||||
|---|---|---|---|---|---|
| Variable | Diabetes (n = 87) | No Diabetes (n = 107) | Diabetes (n = 160) | No Diabetes (n = 31) | Total n (%) or Median (IQR) (n = 385) |
| |||||
| Demographics | |||||
| Age | 66 (5475) | 68 (5083) | 63 (5275) | 58 (3376) | 64 (5176) |
| Female sex | 39% (2950) | 58% (4867) | 55% (4763) | 26% (1245) | 50% (4555) |
| Race/ethnicity | |||||
| White | 67% (5676) | 75% (6583) | 61% (5369) | 71% (5286) | 258 (67%) |
| Black | 22% (1432) | 9% (517) | 21% (1528) | 10% (226) | 65 (17%) |
| Hispanic | 2% (08) | 4% (19) | 6% (310) | 3% (017) | 26 (4%) |
| Other | 9% (417) | 12% (720) | 12% (819) | 16% (534) | 46 (12%) |
| Insurance | |||||
| Private | 32% (2343) | 41% (3251) | 32% (2540) | 45% (2764) | 137 (36%) |
| Medicare | 61% (5071) | 47%(3757) | 49% (4157) | 32% (1751) | 192 (50%) |
| Medicaid | 6% (213) | 7% (314) | 16% (1022) | 6% (121) | 40 (10%) |
| None | 1% (06) | 5% (211) | 3% (17) | 16% (534) | 16 (4%) |
| Assigned PCP | 95% (8999) | 84% (7690) | 86% (8091) | 71% (5286) | 86% (8390) |
| Past medical history | |||||
| Hypertension | 61% (5071) | 45% (3555) | 58% (5066) | 39% (2156) | 206 (54%) |
| Hyperlipidemia | 28% (1938) | 21% (1329) | 25% (1932) | 10% (226) | 90 (23%) |
| Coronary artery disease | 41% (3152) | 29% (2138) | 26% (2034) | 13% (430) | 113 (29%) |
| Current medications | |||||
| Insulin | 36% (2647) | 0 | 54% (4662) | 0 | 117 (30%) |
| Sulfonylurea | 25% (1736) | 0 | 26% (1933) | 0 | 63 (16%) |
| Other oral hypoglycemic | 39% (2950) | 0 | 24% (1832) | 0 | 73 (19%) |
| Systemic corticosteroids | 5% (111) | 10% (517) | 4% (18) | 6% (121) | 23 (6%) |
| Glucose 140199 mg/dL % (95%CI) or Median (IQR) | Glucose 200 mg/dL % (95%CI) or Median (IQR) | ||||
|---|---|---|---|---|---|
| Variable | Diabetes | No Diabetes | Diabetes | No Diabetes | Total n (%) or Median (IQR) |
| |||||
| ED clinical data | (n = 87) | (n = 107) | (n = 160) | (n = 31) | (n = 385) |
| Glucose value, mg/dL | 167 (163170) | 160 (157163) | 308 (285330) | 272 (242300) | 231 (220244) |
| Insulin | 6% (213) | 1% (03) | 31% (2439) | 19% (737) | 61 (16%) |
| IVF without dextrose* | 44% (3355) | 54% (4464) | 51% (4358) | 68% (4983) | 198 (51%) |
| Hyperglycemia charted as diagnosis | 3% (110) | 0 | 18% (1225) | 16% (534) | 36 (9%) |
| Hospital admission | 76% (6584) | 79% (7187) | 73% (6680) | 84% (6695) | 293 (76%) |
| Discharge data | (n = 84) | (n = 98) | (n = 156) | (n = 25) | (n = 363) |
| New insulin Rx | 8% (316) | 5% (212) | 6% (310) | 16% (536) | 26 (7%) |
| New sulfonylurea Rx | 2% (08) | 1% (06) | 4% (18) | 0 | 10 (3%) |
| New other oral hypoglycemic Rx | 1% (06) | 1% (06) | 3% (17) | 8% (126) | 9 (2%) |
| Any new diabetes Rx | 12% (621) | 7% (314) | 12% (718) | 24% (945) | 42 (12%) |
| Hyperglycemia noted in written instructions | 4% (110) | 3% (19) | 15% (1021) | 24% (945) | 36 (10%) |
| Repeat glucose/diabetes testing charted | 5% (112) | 1% (06) | 9% (515) | 16% (536) | 23 (6%) |
No patient received intravenous fluids with dextrose prior to initial serum glucose determination, and there was no difference in home corticosteroid use between groups (P = 0.23). Patients with known diabetes were more likely to receive insulin in the ED (P 0.01). Only 1 patient received an oral hypoglycemic agent in the ED. Three patients had documented hypoglycemia on capillary blood glucose during the ED stay, and no patients had hypoglycemia based on serum glucose during the ED or hospital stay. Among hospitalized patients, 61% had inpatient orders for diabetic‐consistent/carbohydrate‐consistent diet, 65% for capillary glucose tests daily, and 63% for sliding scale insulin.
We also present written discharge instructions data for 363 visits (253 inpatient and 110 ED) in Table 2; discharge instructions were not available for 22 visits (12 deaths during hospitalization, 10 missing instructions). New antidiabetic medications were prescribed for 42 (12%) patients, all from the inpatient setting. There was no difference between inpatient and ED communication of hyperglycemia (10% [95%CI, 7%‐14%] versus 9% [95%CI, 4%‐15%]) and recommendation for further outpatient testing (8% [95%CI, 4%‐11%] versus 4% [95%CI, 0%‐7%]) in written discharge instructions (P = 0.73 and 0.16, respectively). Compared to those with glucose 140‐199 mg/dL, patients with glucose 200 mg/dL were more likely to receive written communication of hyperglycemia (17% [95%CI, 11%‐22%] versus 3% [95%CI, 0%‐6%]) and recommendation for further outpatient testing (10% [95%CI, 6%‐14%] versus 3% [95%CI, 0%‐5%] (both, P 0.01).
DISCUSSION
Although noncritical ED glucose values may be overlooked, values sufficient to motivate inpatient and long‐term management are sometimes uncovered, and when unrecognized may be missed opportunities. Indeed, admission hyperglycemia has been linked to poor clinical outcomes in hospitalized patients for a variety of conditions, particularly for myocardial infarction, stroke, and critical illness.1215
In this study, we evaluated recognition, communication, and management of ED glucose values above a relatively conservative threshold of 140 mg/dL, occurring in 21% of ED glucose results. Diabetes screening thresholds for casual glucose values as low as 120 mg/dL,9 and intensive glycemic control in critically ill patients to a target as low as 110 mg/dL have been suggested.5 Nevertheless, only 16% of our sample received insulin in the ED for hyperglycemia, and hyperglycemia was charted as a diagnosis in only 9% of cases.
This is especially important because 77% of ED visits without hyperglycemia charted as a diagnosis resulted in hospitalization, and early glycemic control was infrequently initiated. Limited ED management of hyperglycemia may be driven by the presence of more critical management issues (eg, 54% of patients had concomitant infection or trauma), lack of familiarity with guidelines, which suggest treatment to glucose 140 mg/dL in critically ill patients and 180 mg/dL in all hospitalized patients,16 or fear of adverse events, such as hypoglycemia. Additionally, ED crowding has been shown to effect decreased quality and timeliness of treatment for pneumonia, and may have similar effects for hyperglycemia.17 Inpatient recognition of hyperglycemia, based on orders for diet, glucose checks, and insulin, appeared significantly better, but this did not translate to improved communication in written discharge instructions. Additionally, many hospitalized patients may spend many hours, or even days, in the ED waiting for beds, which currently is a missed opportunity to initiate early therapy.
Written discharge instructions informed less than 10% of patients of their hyperglycemia or outlined a plan for further evaluation and management. Our prior work suggests that nearly all (95%) ED patients want to be informed of elevated blood glucose and are willing to follow‐up, if instructed.18 The current data suggests that hyperglycemia in ED and hospitalized patients is frequently unrecognized and undertreated, and opportunities to institute an outpatient plan to address hyperglycemia are frequently missed.
This study has several potential limitations. This study was performed at a single academic center, which limits generalizability to other geographic areas and hospital types. Accuracy of abstracted data depended on chart review, which is limited by the possibility of missing, incomplete, or unreliable information. Standardized definitions and abstraction forms limited potential for bias, and high interrater agreement demonstrated internal reliability of the chart review. We considered only initial glucose values and were unable to determine nutritional status; it is possible that subsequent measurements were within an acceptable range. Conversely, hospitalized patients may have developed hyperglycemia subsequent to the initial glucose result, which would underestimate the scope of inpatient hyperglycemia. Also, because there are limited data for interpretation of ED hyperglycemia, we were unable to determine optimal glucose thresholds. Finally, we were unable to evaluate the content of verbal instructions or letters to outpatient providers, which limited our ability to fully describe communication of abnormal findings. However, patients do not often retain information in verbal instructions, in the context of new diagnoses and complex medical regimens.
In summary, recognition, management, and communication of ED hyperglycemia were suboptimal in our patient population and represent a missed opportunity. Enhanced recognition, management, and referral for hyperglycemia observed during usual ED care may provide an unobtrusive method to improve identification of undiagnosed diabetes/prediabetes and initiation of intensive glycemic control for hospitalized patients.
- ,,,,,.Hyperglycemia: an independent marker of in‐hospital mortality in patients with undiagnosed diabetes.J Clin Endocrinol Metab.2002;87:978–982.
- ,,,,,.The relation between hyperglycemia and outcomes in 2,471 patients admitted to the hospital with community‐acquired pneumonia.Diabetes Care.2005;28:810–815.
- ,,,,.Inpatient management of diabetes and hyperglycemia among general medicine patients at a large teaching hospital.J Hosp Med.2006;1:145–150.
- ,,,,.Unrecognized diabetes among hospitalized patients.Diabetes Care.1998;21:246–249.
- ACE/ADA Task Force on Inpatient Diabetes.American College of Endocrinology and American Diabetes Association Consensus statement on inpatient diabetes and glycemic control: a call to action.Diabetes Care.2006;29:1955–1962.
- ,,, et al.Intensive insulin therapy in the medical ICU.N Engl J Med.2006;354:449–461.
- ,,, et al.Randomized trial of insulin‐glucose infusion followed by subcutaneous insulin treatment in diabetic patients with acute myocardial infarction (DIGAMI study): effects on mortality at 1 year.JAm Coll Cardiol.1995;26:57–65.
- ,,.National Hospital Ambulatory Medical Care Survey: 2005 emergency department summary.Adv Data.2007;386:1–32.
- ,,, et al.Performance of recommended screening tests for undiagnosed diabetes and dysglycemia.Diabetes Care.2001;24:1899–1903.
- ,,, et al.The epidemiology of sepsis in the United States from 1979 through 2000.N Engl J Med.2003;348:1546–1554.
- ,,,,,.Completeness and accuracy of International Classification of Disease (ICD) external cause of injury codes in emergency department electronic data.Inj Prev.2007;13:422–425.
- ,,,.Stress hyperglycemia and increased risk of death after myocardial infarction in patients with and without diabetes: a systematic overview.Lancet.2000;355:773–778.
- ,,, et al.Admission blood glucose level as a risk indicator of death after myocardial infarction in patients with and without diabetes mellitus.Arch Intern Med.2004;164:982–989.
- ,,, et al.Effects of admission hyperglycemia on mortality and costs in acute ischemic stroke.Neurology.2002;59:67–71.
- .Association between hyperglycemia and increased hospital mortality in a heterogeneous population of critically ill patients.Mayo Clin Proc.2003;78:1471–1478.
- American Diabetes Association.Standards of Medical Care in Diabetes—2008.Diabetes Care.2008;31;S12–S54.
- ,,,.Effect of emergency department crowding on time to antibiotics in patients admitted with community‐acquired pneumonia.Ann Emerg Med.2007;50:501–509.
- ,,,,.Estimated risk for undiagnosed diabetes in the emergency department: a multicenter survey.Acad Emerg Med.2007;14:492–495.
SHM Medication Reconciliation Survey Results
The Joint Commission's (TJC) National Patient Safety Goal (NPSG) #8Accurately and completely reconcile medications across the continuum of carechallenges hospitals to design and implement new medication management processes. With medication errors contributing to patient morbidity and mortality,1 establishing a comprehensive process for reconciling a patient's medications during the hospitalization episode is an important quality improvement and patient safety goal.
However, the current state of inpatient medication management is highly fragmented. Standard documentation is lacking, as is integration of information between care settings.2 There are now reports describing implementation of various medication reconciliation processes for admissions,3 transfers,4 and discharges.5
Hospitalists are well‐positioned to contribute to the implementation of medication reconciliation. Indeed, because TJC does not explicitly specify what type of health care provider (eg, physician, nurse, etc.) should assume responsibility for this process, institutions have designed workflows to suit their own needs, while striving to comply with national standards.
Given the complexity and lack of standardization around this NPSG, a survey was distributed to attendees of a Society of Hospital Medicine (SHM) national meeting to determine the various processes implemented thus far, and to ascertain existing challenges to implementation. We report here on the results.
METHODS
A survey tool (Appendix) was designed to query demographic and institutional factors, involvement in the process, and barriers to implementation of medication reconciliation. Surveys were included in all attendees' registration materials, resulting in the distributions of approximately 800 surveys.
Responses were entered into an Excel spreadsheet. Simple descriptive statistics were used to determine proportions for providers, processes, and barriers to implementation. Where appropriate, variables were dichotomized, allowing for paired t‐test analysis. Statistical significance was defined as a P value less than .05. Subgroup analyses by hospital type, provider type, and process method were performed.
RESULTS
A total of 295 completed surveys were collected. The responses are tabulated in Table 1.
| |
| Primary practice setting | |
| Academic tertiary center | 23% |
| Community teaching hospital | 29% |
| Non‐academic hospital | 43% |
| Patient population | |
| Adults only | 90% |
| Pediatrics only | 5% |
| Adults and pediatrics | 5% |
| State of implementation | |
| Fully implemented | 48% |
| Partially implemented | 35% |
| Planning stages | 11% |
| Unaware of plans to implement | 2% |
| Unaware of med reconciliation | 4% |
| Hospitalist involvement | |
| Active role | 36% |
| Peripheral role | 24% |
| No role | 31% |
| Process format | |
| Paper | 47% |
| Computer | 11% |
| Both paper and computer | 31% |
| Don't know | 2% |
| Measuring compliance | |
| Yes | 42% |
| No | 14% |
| Don't know | 34% |
| Measuring outcomes | |
| Yes | 22% |
| No | 25% |
| Don't know | 41% |
| Impact of medication reconciliation | |
| No impact | 9% |
| Positive impact | 58% |
| Negative impact | 7% |
| Don't know | 14% |
Process
A paper process was used most often (47%), followed by a combined process (31%), and computers alone in just 11% of cases. Measurement of process compliance was reported in less than half (42%), with 34% unaware if their institutions were monitoring compliance. Outcome measurement was recorded as not performed (25%) or unknown (41%) in a majority of cases. Respondents reported a favorable view of the future impact of medication reconciliation, with 58% citing likely positive impacts on patient safety and patient care; fewer were unsure (14%) or anticipated no impact (9%) or negative impact (7%). Survey results regarding responsibility for individual process steps are detailed in Table 2. Notably, respondents often indicated that both physicians and nurses would share responsibility for a given step. Physicians were more often responsible for reconciling home medications, updating discharge medication lists, and communicating to outpatient providers. Nursing performed reconciliation in only 10% of cases. Results across all steps demonstrated very low participation rates by pharmacists, with pharmacist responsibility for reconciliation only 6% of the time.
| Process Step | Physician | Nurse | Physician and Nurse | Pharmacist | Other |
|---|---|---|---|---|---|
| |||||
| Obtaining home med list | 15% | 39% | 41% | 3% | 2% |
| Documenting home med list | 17% | 41% | 37% | 2% | 3% |
| Reconciling medications | 56% | 10% | 21% | 6% | 7% |
| Updating discharge med list | 64% | 6% | 17% | 3% | 10% |
| Providing instructions at discharge | 15% | 46% | 32% | 2% | 5% |
| Communicating changes at follow‐up | 84% | 6% | 4% | 6% | 1% |
Hospital Type
Results of subgroup analyses by hospital type are detailed in Table 3. Community teaching hospitals (CTHs) were significantly more likely (57%) than nonteaching hospitals (NTHs) (49%) or tertiary academic centers (TACs) (35%) to have achieved full implementation. NTHs were significantly less likely to have involved hospitalists in implementation. Use of computer‐based processes at TACs was more common (27%) than in CTHs (9%) or NTHs (7%). TACs were significantly more likely to have a physician obtain the medication list (33%, compared with 15% and 7% for CTHs and NTHs, respectively), whereas NTHs were more likely to use nurses (50%) than were CTHs (31%) or TACs (26%). Similar significant differences were found among hospital types with regard to obtaining the preadmission medication list. Physicians in TACs (25%) were more likely to be responsible for giving discharge medication instructions than in CTHs (10%) or NTHs (14%, not significant compared with TACs).
| Academic Centers [AC] | Community Teaching Hospitals [CT] | Non‐Teaching Hospitals [NT] | P values (2‐tailed) | |||
|---|---|---|---|---|---|---|
| AC vs. CT | AC vs. NT | CT vs. NT | ||||
| ||||||
| State of implementation | ||||||
| Fully implemented | 25/71 (35) | 48/84 (57) | 68/139 (49) | 0.007 | 0.06 | 0.25 |
| Partially implemented | 31/71 (44) | 25/84 (30) | 48/139 (35) | 0.07 | 0.21 | 0.44 |
| Planning stages | 9/71 (13) | 9/84 (11) | 14/139 (10) | 0.70 | 0.51 | 0.81 |
| Unaware of plans to implement | 2/71 (3) | 1/84 (1) | 3/139 (2) | 0.37 | 0.65 | 0.57 |
| Unaware of med reconciliation | 4/71 (5) | 1/84 (1) | 6/139 (4) | 0.14 | 0.74 | 0.19 |
| Hospitalist involvement | ||||||
| Active role | 28/59 (47) | 34/80 (43) | 43/127 (34) | 0.64 | 0.09 | 0.19 |
| Peripheral role | 12/59 (20) | 25/80 (31) | 34/127 (27) | 0.15 | 0.30 | 0.54 |
| No role | 19/59 (32) | 19/80 (24) | 50/127 (39) | 0.30 | 0.36 | 0.03 |
| Process format | ||||||
| Paper | 26/59 (44) | 47/81 (58) | 63/127 (50) | 0.10 | 0.45 | 0.26 |
| Computer | 16/59 (27) | 7/81 (9) | 9/127 (7) | 0.005 | 0.001 | 0.60 |
| Both paper and computer | 17/59 (29) | 25/81 (31) | 51/127 (40) | 0.80 | 0.15 | 0.19 |
| Don't know | 0/59 (0) | 2/81 (2) | 4/127 (3) | 0.28 | 0.18 | 0.66 |
| Process steps (selected questions) | ||||||
| Obtaining home med list | ||||||
| Physician | 19/58 (33) | 12/80 (15) | 9/125 (7) | 0.013 | 0.001 | 0.07 |
| Physician and Nurse | 19/58 (33) | 39/80 (49) | 49/125 (39) | 0.47 | 0.44 | 0.16 |
| Nurse | 15/58 (26) | 25/80 (31) | 62/125 (50) | 0.005 | 0.003 | 0.008 |
| Pharmacist | 5/58 (9) | 1/80 (1) | 2/125 (2) | 0.06 | 0.03 | 0.58 |
| Documenting home med list | ||||||
| Physician | 22/58 (38) | 11/80 (14) | 11/125 (9) | 0.001 | 0.001 | 0.26 |
| Physician and Nurse | 15/58 (26) | 37/80 (46) | 45/125 (36) | 0.02 | 0.18 | 0.16 |
| Nurse | 18/58 (31) | 26/80 (32) | 64/125 (51) | 0.90 | 0.012 | 0.008 |
| Pharmacist | 3/58 (5) | 2/80 (3) | 1/125 (1) | 0.55 | 0.09 | 0.29 |
| Reconciling medications | ||||||
| Physician | 33/58 (57) | 51/80 (64) | 63/125 (50) | 0.41 | 0.42 | 0.051 |
| Physician and Nurse | 8/58 (14) | 14/80 (18) | 32/125 (26) | 0.53 | 0.09 | 0.18 |
| Nurse | 6/58 (10) | 6/80 (8) | 15/125 (12) | 0.68 | 0.71 | 0.36 |
| Pharmacist | 8/58 (14) | 5/80 (6) | 3/125 (2) | 0.11 | 0.007 | 0.13 |
| Updating discharge med list | ||||||
| Physician | 42/58 (72) | 50/80 (63) | 76/125 (61) | 0.27 | 0.15 | 0.77 |
| Physician and Nurse | 7/58 (12) | 16/80 (20) | 23/125 (18) | 0.22 | 0.31 | 0.72 |
| Nurse | 2/58 (3) | 5/80 (6) | 10/125 (8) | 0.41 | 0.20 | 0.59 |
| Pharmacist | 3/58 (5) | 3/80 (4) | 3/125 (2) | 0.78 | 0.27 | 0.40 |
| Providing instructions at discharge | ||||||
| Physician | 14/57 (25) | 8/80 (10) | 17/125 (14) | 0.02 | 0.07 | 0.40 |
| Physician and Nurse | 14/57 (25) | 30/80 (38) | 39/125 (31) | 0.11 | 0.41 | 0.30 |
| Nurse | 25/57 (44) | 37/80 (46) | 60/125 (48) | 0.82 | 0.62 | 0.80 |
| Pharmacist | 4/57 (7) | 1/80 (1) | 0/125 (0) | 0.06 | 0.003 | 0.26 |
Barriers
Results regarding barriers to successful implementation are shown in Table 4. Patient lack of knowledge of medications (87%) and absence of a preadmission medication list from other sources (80%) were common. Both paper and computer medication reconciliation processes were associated with respondents citing cumbersome hospital systems as a barrier; this barrier was cited more often when the implemented process was paper‐only (Table 5). Respondents who stated the medication reconciliation process takes too long did so regardless of whether the implemented process was paper‐based or computer‐based. Despite these barriers, only 16% of respondents stated that medication reconciliation was not worth the effort of implementation. Barriers reported were similar across hospital type (Table 6) with 2 exceptions. Formulary differences were noted to be a barrier more often in CTHs (78%) compared with NTHs (60%) and TACs (64%, not significant compared with CTHs). Language barriers were problematic more often in TACs (48%) than in NTHs (28%) or CTHs (36%, not significant compared with TACs).
| Barrier to Implementation | Yes | No | Unsure |
|---|---|---|---|
| |||
| Patient not knowing meds | 87% | 2% | 0% |
| Process takes too long | 53% | 28% | 8% |
| Med list not available | 80% | 9% | 0% |
| Process not worth effort | 16% | 60% | 12% |
| Cumbersome hospital systems | 52% | 33% | 4% |
| Formulary differences | 59% | 24% | 5% |
| Language barriers | 31% | 53% | 4% |
| No access to outside records | 63% | 23% | 2% |
| Lack of job clarity in process | 38% | 48% | 3% |
| Availability of med list at discharge | 27% | 57% | 3% |
| Barriers (Selected Questions) | Paper Only [P] | Computer Only [C] | Paper and Computer [PC] | P values (2‐tailed) | ||
|---|---|---|---|---|---|---|
| P vs. C | P vs. PC | C vs. PC | ||||
| ||||||
| Process takes too long | ||||||
| Yes | 77/134 (57) | 19/31 (61) | 55/91 (60) | 0.69 | 0.65 | 0.92 |
| No | 43/134 (32) | 11/31 (35) | 28/91 (31) | 0.75 | 0.87 | 0.68 |
| Unsure | 14/134 (10) | 1/31 (3) | 8/91 (9) | 0.21 | 0.80 | 0.27 |
| Process not worth effort | ||||||
| Yes | 24/133 (18) | 3/31 (10) | 17/91 (19) | 0.28 | 0.85 | 0.25 |
| No | 93/133 (70) | 22/31 (71) | 62/91 (68) | 0.91 | 0.75 | 0.76 |
| Unsure | 16/133 (12) | 6/31 (19) | 12/91 (13) | 0.30 | 0.82 | 0.41 |
| Cumbersome hospital systems | ||||||
| Yes | 86/133 (65) | 16/31 (52) | 46/92 (50) | 0.18 | 0.03 | 0.85 |
| No | 42/133 (32) | 13/31 (42) | 42/92 (46) | 0.29 | 0.03 | 0.70 |
| Unsure | 5/133 (4) | 2/31 (6) | 4/92 (4) | 0.62 | 0.82 | 0.64 |
| Barrier to Implementation (Selected Questions) | Academic Centers [AC] | Community Teaching Hospitals [CT] | Non‐Teaching Hospitals [NT] | P values | ||
|---|---|---|---|---|---|---|
| AC vs. CT | AC vs. NT | CT vs. NT | ||||
| ||||||
| Process takes too long | ||||||
| Yes | 37/58 (64) | 49/78 (63) | 70/124 (56) | 0.90 | 0.31 | 0.37 |
| No | 15/58 (26) | 24/78 (31) | 42/124 (34) | 0.53 | 0.28 | 0.66 |
| Unsure | 6/58 (10) | 5/78 (6) | 12/124 (10) | 0.39 | 0.88 | 0.32 |
| Process not worth effort | ||||||
| Yes | 7/58 (12) | 16/78 (21) | 23/123 (19) | 0.17 | 0.24 | 0.73 |
| No | 42/58 (72) | 52/78 (67) | 84/123 (68) | 0.53 | 0.59 | 0.88 |
| Unsure | 9/58 (16) | 10/78 (12) | 16/123 (13) | 0.50 | 0.59 | 0.84 |
| Cumbersome hospital systems | ||||||
| Yes | 36/58 (62) | 46/79 (58) | 69/123 (56) | 0.64 | 0.45 | 0.78 |
| No | 19/58 (33) | 32/79 (41) | 46/123 (37) | 0.34 | 0.60 | 0.57 |
| Unsure | 3/58 (5) | 1/79 (1) | 8/123 (7) | 0.16 | 0.61 | 0.049 |
| Formulary differences | ||||||
| Yes | 37/58 (64) | 61/78 (78) | 74/123 (60) | 0.07 | 0.61 | 0.009 |
| No | 16/58 (28) | 14/78 (18) | 41/123 (33) | 0.17 | 0.50 | 0.02 |
| Unsure | 5/58 (8) | 2/78 (3) | 8/123 (7) | 0.19 | 0.81 | 0.22 |
| Language barriers | ||||||
| Yes | 28/58 (48) | 28/77 (36) | 34/123 (28) | 0.16 | 0.009 | 0.24 |
| No | 28/58 (48) | 46/77 (60) | 82/123 (67) | 0.17 | 0.016 | 0.32 |
| Unsure | 2/58 (3) | 3/77 (4) | 7/123 (5) | 0.76 | 0.54 | 0.74 |
| No access to outside records | ||||||
| Yes | 38/58 (66) | 60/79 (76) | 87/123 (71) | 0.20 | 0.50 | 0.44 |
| No | 18/58 (31) | 18/79 (23) | 33/123 (27) | 0.30 | 0.58 | 0.52 |
| Unsure | 2/58 (3) | 1/79 (1) | 3/123 (2) | 0.39 | 0.68 | 0.58 |
| Lack of job clarity in process | ||||||
| Yes | 26/58 (45) | 31/79 (39) | 49/121 (40) | 0.48 | 0.53 | 0.89 |
| No | 28/58 (48) | 46/79 (58) | 68/121 (56) | 0.25 | 0.32 | 0.78 |
| Unsure | 4/58 (7) | 2/79 (3) | 4/121 (3) | 0.28 | 0.22 | 0.75 |
| Availability of med list at discharge | ||||||
| Yes | 20/58 (34) | 24/79 (30) | 35/120 (29) | 0.62 | 0.50 | 0.88 |
| No | 36/58 (62) | 54/79 (68) | 78/120 (65) | 0.47 | 0.70 | 0.66 |
| Unsure | 0/58 (0) | 1/79 (1) | 7/120 (6) | 0.45 | 0.06 | 0.08 |
DISCUSSION
Managing medication information for inpatients is an extremely complex task. On admission, home medication lists are often inaccurate or absent,6 requiring extra time and effort to discover this information. By discharge, medication regimens have frequently been altered,7 making communication of changes to the next provider essential. One study described myriad provider, patient, and health system issues in maintaining accurate outpatient medication lists.8 These issues are further compounded by the multiple prescribers, necessary hand‐offs, and formulary differences in the inpatient setting.
Over half of the hospitalists in this survey reported hospitalist involvement in design and implementation of medication reconciliation. Given the familiarity with hospital systems and inpatient workflow, hospitalists are well‐positioned to contribute to successful implementation. Nonetheless, many were unaware of efforts to implement this NPSG.
Measurement of both process and outcome measures is important when determining value in quality improvement. Beyond process measures, outcome measures such as adverse drug events, readmission rates, mortality, patient satisfaction, and outpatient provider satisfaction may be appropriate in evaluating medication reconciliation strategies. Even measuring the accuracy of the process with respect to the admission orders written would be a valuable source of information for further improvement. Unfortunately, respondents indicated that evaluation was occurring infrequently. Potentially more problematic is the apparent lack of clarity regarding identification of healthcare provider responsibility for specific process steps. By far the least uniformity is in the acquisition and documentation of the preadmission medication list. There is variability in who is assigned to perform this task, but a substantial number of respondents indicated that their process involved a shared responsibility between physicians and nurses. It is unclear whether this phenomenon reflects the complexity of inpatient medication information management, or is simply an attempt to distribute the work among providers. Sharing the work between physicians and nurses may increase the overall likelihood for compliance and possibly improve the safety and accuracy of the process, especially if the physicians and nurses take the medication history in a redundant fashion and share their findings. Conversely, compliance may decrease if each provider merely expects the other to complete the process. Optimally, an interdisciplinary workflow for medication history taking would be in place, involving both physicians and nurses, with the availability of pharmacist consultation in complex cases. However, our survey data suggest this is infrequent; resident physicians appear to be the ones shouldering substantial responsibility for medication reconciliation in tertiary academic centers. Further research into the accuracy of medication reconciliation processes involving different strategies for medication information collection would be useful.
We documented several barriers to successful implementation of medication reconciliation. Physicians cited a lack of medication knowledge on the part of the patient and unavailable prior medication lists as substantial barriers to success. Many medication reconciliation processes are limited by issues of poor health literacy or inadequate patient knowledge about medications. This lack of medication knowledge is especially problematic for patients new to a healthcare system. It will be important to implement processes that not only reconcile medications accurately, but also make medication information available for future care episodes.
Time required to complete the process was also important. Certain elements of the medication reconciliation process are new work, and integrating the process into existing workflows is crucial. Given the significant time commitment required, the rare involvement of pharmacists at most institutions is striking. It appears that hospital pharmacists do not currently own any of the medication reconciliation process steps at most facilities, despite having formal training in medication history‐taking. In the 2006 ASHP national hospital pharmacy survey, one‐third of pharmacists stated that there were not enough pharmacy resources to meet medication reconciliation demands; only 19% of those surveyed stated pharmacists provided medication education at discharge to more than 25% of their patients.9
This report has several limitations. The survey used was not comprehensive, and only represents a convenience sample of hospitalists attending anational meeting. Nearly 300 physicians responded, representing both teaching and private hospital settings. We consider the response rate of 37% reasonable for a survey of this nature, and the variety of processes described is likely indicative of the overall status of medication reconciliation implementation. The over‐representation of certain institutions in our survey is possible, especially those with large or influential hospital medicine programs. Our survey did not ask respondents to name their home institutions. In addition, this design is open to a convenience sample bias, in that surveying only national meeting attendees (rather than the entire SHM membership) risks overinclusion of those hospitalists involved in leadership roles and quality improvement projects. Despite this, the variety of processes described is likely indicative of the overall status of medication reconciliation implementation in mid‐2006. It is possible that processes have become more uniform nationwide in the interim.
Our survey results reflect the complexity surrounding medication reconciliation. It appears that full implementation has not yet occurred everywhere, significant barriers remain, and outcome measurement is limited. Importantly, physicians, nurses, and pharmacists do not have standardized roles. Responsibility for medication reconciliation has predominantly been added to the existing duties of inpatient physicians and nurses, with limited involvement of pharmacists. Hospitalists are well‐positioned to lead the ongoing implementation of medication reconciliation processes and should take advantage of their systems knowledge to effectively partner with other physicians, nurses, and pharmacists to achieve success in medication reconciliation.
Acknowledgements
The authors thank Ken Epstein, MD, and Renee Meadows, MD, along with the entire SHM Medication Reconciliation Task Force for their helpful review and comments on the article.
Appendix
|
|
- Kohn LT,Corrigan JM,Donaldson MS, eds.To Err Is Human: Building a Safer Health System.Washington, DC:National Academy Press;1999.
- .Medication reconciliation: transfer of medication information across settings – keeping it free from error.Am J Nurs.2005;105(3 Suppl):31–36.
- ,,, et al.Reconciliation of discrepancies in medication histories and admission orders of newly hospitalized patients.Am J Health‐Syst Pharm.2004;61(16):1689–1695.
- ,,, et al.Medication reconciliation: a practical tool to reduce the risk of medication errors.J Crit Care.2003;18(4):201–205.
- ,,,.Evaluation of a new integrated discharge prescription form.Ann Pharmacother.2001;35(7‐8):953–958.
- ,,, et al.Patient safety standardization as a mechanism to improve safety in health care.Jt Comm J Qual Saf.2004;30(1):5–14.
- ,,.What happens to long‐term medication when general practice patients are referred to hospital?Eur J Clin Pharmacol.1996;50(4):253–257.
- ,,, et al.An experiential interdisciplinary quality improvement education initiative.Am J Med Qual.2006;21(5):317–322.
- ,,.ASHP national survey of pharmacy practice in hospital settings: monitoring and patient education‐2006.Am J Health‐Syst Pharm.2007;64(5):507–520.
The Joint Commission's (TJC) National Patient Safety Goal (NPSG) #8Accurately and completely reconcile medications across the continuum of carechallenges hospitals to design and implement new medication management processes. With medication errors contributing to patient morbidity and mortality,1 establishing a comprehensive process for reconciling a patient's medications during the hospitalization episode is an important quality improvement and patient safety goal.
However, the current state of inpatient medication management is highly fragmented. Standard documentation is lacking, as is integration of information between care settings.2 There are now reports describing implementation of various medication reconciliation processes for admissions,3 transfers,4 and discharges.5
Hospitalists are well‐positioned to contribute to the implementation of medication reconciliation. Indeed, because TJC does not explicitly specify what type of health care provider (eg, physician, nurse, etc.) should assume responsibility for this process, institutions have designed workflows to suit their own needs, while striving to comply with national standards.
Given the complexity and lack of standardization around this NPSG, a survey was distributed to attendees of a Society of Hospital Medicine (SHM) national meeting to determine the various processes implemented thus far, and to ascertain existing challenges to implementation. We report here on the results.
METHODS
A survey tool (Appendix) was designed to query demographic and institutional factors, involvement in the process, and barriers to implementation of medication reconciliation. Surveys were included in all attendees' registration materials, resulting in the distributions of approximately 800 surveys.
Responses were entered into an Excel spreadsheet. Simple descriptive statistics were used to determine proportions for providers, processes, and barriers to implementation. Where appropriate, variables were dichotomized, allowing for paired t‐test analysis. Statistical significance was defined as a P value less than .05. Subgroup analyses by hospital type, provider type, and process method were performed.
RESULTS
A total of 295 completed surveys were collected. The responses are tabulated in Table 1.
| |
| Primary practice setting | |
| Academic tertiary center | 23% |
| Community teaching hospital | 29% |
| Non‐academic hospital | 43% |
| Patient population | |
| Adults only | 90% |
| Pediatrics only | 5% |
| Adults and pediatrics | 5% |
| State of implementation | |
| Fully implemented | 48% |
| Partially implemented | 35% |
| Planning stages | 11% |
| Unaware of plans to implement | 2% |
| Unaware of med reconciliation | 4% |
| Hospitalist involvement | |
| Active role | 36% |
| Peripheral role | 24% |
| No role | 31% |
| Process format | |
| Paper | 47% |
| Computer | 11% |
| Both paper and computer | 31% |
| Don't know | 2% |
| Measuring compliance | |
| Yes | 42% |
| No | 14% |
| Don't know | 34% |
| Measuring outcomes | |
| Yes | 22% |
| No | 25% |
| Don't know | 41% |
| Impact of medication reconciliation | |
| No impact | 9% |
| Positive impact | 58% |
| Negative impact | 7% |
| Don't know | 14% |
Process
A paper process was used most often (47%), followed by a combined process (31%), and computers alone in just 11% of cases. Measurement of process compliance was reported in less than half (42%), with 34% unaware if their institutions were monitoring compliance. Outcome measurement was recorded as not performed (25%) or unknown (41%) in a majority of cases. Respondents reported a favorable view of the future impact of medication reconciliation, with 58% citing likely positive impacts on patient safety and patient care; fewer were unsure (14%) or anticipated no impact (9%) or negative impact (7%). Survey results regarding responsibility for individual process steps are detailed in Table 2. Notably, respondents often indicated that both physicians and nurses would share responsibility for a given step. Physicians were more often responsible for reconciling home medications, updating discharge medication lists, and communicating to outpatient providers. Nursing performed reconciliation in only 10% of cases. Results across all steps demonstrated very low participation rates by pharmacists, with pharmacist responsibility for reconciliation only 6% of the time.
| Process Step | Physician | Nurse | Physician and Nurse | Pharmacist | Other |
|---|---|---|---|---|---|
| |||||
| Obtaining home med list | 15% | 39% | 41% | 3% | 2% |
| Documenting home med list | 17% | 41% | 37% | 2% | 3% |
| Reconciling medications | 56% | 10% | 21% | 6% | 7% |
| Updating discharge med list | 64% | 6% | 17% | 3% | 10% |
| Providing instructions at discharge | 15% | 46% | 32% | 2% | 5% |
| Communicating changes at follow‐up | 84% | 6% | 4% | 6% | 1% |
Hospital Type
Results of subgroup analyses by hospital type are detailed in Table 3. Community teaching hospitals (CTHs) were significantly more likely (57%) than nonteaching hospitals (NTHs) (49%) or tertiary academic centers (TACs) (35%) to have achieved full implementation. NTHs were significantly less likely to have involved hospitalists in implementation. Use of computer‐based processes at TACs was more common (27%) than in CTHs (9%) or NTHs (7%). TACs were significantly more likely to have a physician obtain the medication list (33%, compared with 15% and 7% for CTHs and NTHs, respectively), whereas NTHs were more likely to use nurses (50%) than were CTHs (31%) or TACs (26%). Similar significant differences were found among hospital types with regard to obtaining the preadmission medication list. Physicians in TACs (25%) were more likely to be responsible for giving discharge medication instructions than in CTHs (10%) or NTHs (14%, not significant compared with TACs).
| Academic Centers [AC] | Community Teaching Hospitals [CT] | Non‐Teaching Hospitals [NT] | P values (2‐tailed) | |||
|---|---|---|---|---|---|---|
| AC vs. CT | AC vs. NT | CT vs. NT | ||||
| ||||||
| State of implementation | ||||||
| Fully implemented | 25/71 (35) | 48/84 (57) | 68/139 (49) | 0.007 | 0.06 | 0.25 |
| Partially implemented | 31/71 (44) | 25/84 (30) | 48/139 (35) | 0.07 | 0.21 | 0.44 |
| Planning stages | 9/71 (13) | 9/84 (11) | 14/139 (10) | 0.70 | 0.51 | 0.81 |
| Unaware of plans to implement | 2/71 (3) | 1/84 (1) | 3/139 (2) | 0.37 | 0.65 | 0.57 |
| Unaware of med reconciliation | 4/71 (5) | 1/84 (1) | 6/139 (4) | 0.14 | 0.74 | 0.19 |
| Hospitalist involvement | ||||||
| Active role | 28/59 (47) | 34/80 (43) | 43/127 (34) | 0.64 | 0.09 | 0.19 |
| Peripheral role | 12/59 (20) | 25/80 (31) | 34/127 (27) | 0.15 | 0.30 | 0.54 |
| No role | 19/59 (32) | 19/80 (24) | 50/127 (39) | 0.30 | 0.36 | 0.03 |
| Process format | ||||||
| Paper | 26/59 (44) | 47/81 (58) | 63/127 (50) | 0.10 | 0.45 | 0.26 |
| Computer | 16/59 (27) | 7/81 (9) | 9/127 (7) | 0.005 | 0.001 | 0.60 |
| Both paper and computer | 17/59 (29) | 25/81 (31) | 51/127 (40) | 0.80 | 0.15 | 0.19 |
| Don't know | 0/59 (0) | 2/81 (2) | 4/127 (3) | 0.28 | 0.18 | 0.66 |
| Process steps (selected questions) | ||||||
| Obtaining home med list | ||||||
| Physician | 19/58 (33) | 12/80 (15) | 9/125 (7) | 0.013 | 0.001 | 0.07 |
| Physician and Nurse | 19/58 (33) | 39/80 (49) | 49/125 (39) | 0.47 | 0.44 | 0.16 |
| Nurse | 15/58 (26) | 25/80 (31) | 62/125 (50) | 0.005 | 0.003 | 0.008 |
| Pharmacist | 5/58 (9) | 1/80 (1) | 2/125 (2) | 0.06 | 0.03 | 0.58 |
| Documenting home med list | ||||||
| Physician | 22/58 (38) | 11/80 (14) | 11/125 (9) | 0.001 | 0.001 | 0.26 |
| Physician and Nurse | 15/58 (26) | 37/80 (46) | 45/125 (36) | 0.02 | 0.18 | 0.16 |
| Nurse | 18/58 (31) | 26/80 (32) | 64/125 (51) | 0.90 | 0.012 | 0.008 |
| Pharmacist | 3/58 (5) | 2/80 (3) | 1/125 (1) | 0.55 | 0.09 | 0.29 |
| Reconciling medications | ||||||
| Physician | 33/58 (57) | 51/80 (64) | 63/125 (50) | 0.41 | 0.42 | 0.051 |
| Physician and Nurse | 8/58 (14) | 14/80 (18) | 32/125 (26) | 0.53 | 0.09 | 0.18 |
| Nurse | 6/58 (10) | 6/80 (8) | 15/125 (12) | 0.68 | 0.71 | 0.36 |
| Pharmacist | 8/58 (14) | 5/80 (6) | 3/125 (2) | 0.11 | 0.007 | 0.13 |
| Updating discharge med list | ||||||
| Physician | 42/58 (72) | 50/80 (63) | 76/125 (61) | 0.27 | 0.15 | 0.77 |
| Physician and Nurse | 7/58 (12) | 16/80 (20) | 23/125 (18) | 0.22 | 0.31 | 0.72 |
| Nurse | 2/58 (3) | 5/80 (6) | 10/125 (8) | 0.41 | 0.20 | 0.59 |
| Pharmacist | 3/58 (5) | 3/80 (4) | 3/125 (2) | 0.78 | 0.27 | 0.40 |
| Providing instructions at discharge | ||||||
| Physician | 14/57 (25) | 8/80 (10) | 17/125 (14) | 0.02 | 0.07 | 0.40 |
| Physician and Nurse | 14/57 (25) | 30/80 (38) | 39/125 (31) | 0.11 | 0.41 | 0.30 |
| Nurse | 25/57 (44) | 37/80 (46) | 60/125 (48) | 0.82 | 0.62 | 0.80 |
| Pharmacist | 4/57 (7) | 1/80 (1) | 0/125 (0) | 0.06 | 0.003 | 0.26 |
Barriers
Results regarding barriers to successful implementation are shown in Table 4. Patient lack of knowledge of medications (87%) and absence of a preadmission medication list from other sources (80%) were common. Both paper and computer medication reconciliation processes were associated with respondents citing cumbersome hospital systems as a barrier; this barrier was cited more often when the implemented process was paper‐only (Table 5). Respondents who stated the medication reconciliation process takes too long did so regardless of whether the implemented process was paper‐based or computer‐based. Despite these barriers, only 16% of respondents stated that medication reconciliation was not worth the effort of implementation. Barriers reported were similar across hospital type (Table 6) with 2 exceptions. Formulary differences were noted to be a barrier more often in CTHs (78%) compared with NTHs (60%) and TACs (64%, not significant compared with CTHs). Language barriers were problematic more often in TACs (48%) than in NTHs (28%) or CTHs (36%, not significant compared with TACs).
| Barrier to Implementation | Yes | No | Unsure |
|---|---|---|---|
| |||
| Patient not knowing meds | 87% | 2% | 0% |
| Process takes too long | 53% | 28% | 8% |
| Med list not available | 80% | 9% | 0% |
| Process not worth effort | 16% | 60% | 12% |
| Cumbersome hospital systems | 52% | 33% | 4% |
| Formulary differences | 59% | 24% | 5% |
| Language barriers | 31% | 53% | 4% |
| No access to outside records | 63% | 23% | 2% |
| Lack of job clarity in process | 38% | 48% | 3% |
| Availability of med list at discharge | 27% | 57% | 3% |
| Barriers (Selected Questions) | Paper Only [P] | Computer Only [C] | Paper and Computer [PC] | P values (2‐tailed) | ||
|---|---|---|---|---|---|---|
| P vs. C | P vs. PC | C vs. PC | ||||
| ||||||
| Process takes too long | ||||||
| Yes | 77/134 (57) | 19/31 (61) | 55/91 (60) | 0.69 | 0.65 | 0.92 |
| No | 43/134 (32) | 11/31 (35) | 28/91 (31) | 0.75 | 0.87 | 0.68 |
| Unsure | 14/134 (10) | 1/31 (3) | 8/91 (9) | 0.21 | 0.80 | 0.27 |
| Process not worth effort | ||||||
| Yes | 24/133 (18) | 3/31 (10) | 17/91 (19) | 0.28 | 0.85 | 0.25 |
| No | 93/133 (70) | 22/31 (71) | 62/91 (68) | 0.91 | 0.75 | 0.76 |
| Unsure | 16/133 (12) | 6/31 (19) | 12/91 (13) | 0.30 | 0.82 | 0.41 |
| Cumbersome hospital systems | ||||||
| Yes | 86/133 (65) | 16/31 (52) | 46/92 (50) | 0.18 | 0.03 | 0.85 |
| No | 42/133 (32) | 13/31 (42) | 42/92 (46) | 0.29 | 0.03 | 0.70 |
| Unsure | 5/133 (4) | 2/31 (6) | 4/92 (4) | 0.62 | 0.82 | 0.64 |
| Barrier to Implementation (Selected Questions) | Academic Centers [AC] | Community Teaching Hospitals [CT] | Non‐Teaching Hospitals [NT] | P values | ||
|---|---|---|---|---|---|---|
| AC vs. CT | AC vs. NT | CT vs. NT | ||||
| ||||||
| Process takes too long | ||||||
| Yes | 37/58 (64) | 49/78 (63) | 70/124 (56) | 0.90 | 0.31 | 0.37 |
| No | 15/58 (26) | 24/78 (31) | 42/124 (34) | 0.53 | 0.28 | 0.66 |
| Unsure | 6/58 (10) | 5/78 (6) | 12/124 (10) | 0.39 | 0.88 | 0.32 |
| Process not worth effort | ||||||
| Yes | 7/58 (12) | 16/78 (21) | 23/123 (19) | 0.17 | 0.24 | 0.73 |
| No | 42/58 (72) | 52/78 (67) | 84/123 (68) | 0.53 | 0.59 | 0.88 |
| Unsure | 9/58 (16) | 10/78 (12) | 16/123 (13) | 0.50 | 0.59 | 0.84 |
| Cumbersome hospital systems | ||||||
| Yes | 36/58 (62) | 46/79 (58) | 69/123 (56) | 0.64 | 0.45 | 0.78 |
| No | 19/58 (33) | 32/79 (41) | 46/123 (37) | 0.34 | 0.60 | 0.57 |
| Unsure | 3/58 (5) | 1/79 (1) | 8/123 (7) | 0.16 | 0.61 | 0.049 |
| Formulary differences | ||||||
| Yes | 37/58 (64) | 61/78 (78) | 74/123 (60) | 0.07 | 0.61 | 0.009 |
| No | 16/58 (28) | 14/78 (18) | 41/123 (33) | 0.17 | 0.50 | 0.02 |
| Unsure | 5/58 (8) | 2/78 (3) | 8/123 (7) | 0.19 | 0.81 | 0.22 |
| Language barriers | ||||||
| Yes | 28/58 (48) | 28/77 (36) | 34/123 (28) | 0.16 | 0.009 | 0.24 |
| No | 28/58 (48) | 46/77 (60) | 82/123 (67) | 0.17 | 0.016 | 0.32 |
| Unsure | 2/58 (3) | 3/77 (4) | 7/123 (5) | 0.76 | 0.54 | 0.74 |
| No access to outside records | ||||||
| Yes | 38/58 (66) | 60/79 (76) | 87/123 (71) | 0.20 | 0.50 | 0.44 |
| No | 18/58 (31) | 18/79 (23) | 33/123 (27) | 0.30 | 0.58 | 0.52 |
| Unsure | 2/58 (3) | 1/79 (1) | 3/123 (2) | 0.39 | 0.68 | 0.58 |
| Lack of job clarity in process | ||||||
| Yes | 26/58 (45) | 31/79 (39) | 49/121 (40) | 0.48 | 0.53 | 0.89 |
| No | 28/58 (48) | 46/79 (58) | 68/121 (56) | 0.25 | 0.32 | 0.78 |
| Unsure | 4/58 (7) | 2/79 (3) | 4/121 (3) | 0.28 | 0.22 | 0.75 |
| Availability of med list at discharge | ||||||
| Yes | 20/58 (34) | 24/79 (30) | 35/120 (29) | 0.62 | 0.50 | 0.88 |
| No | 36/58 (62) | 54/79 (68) | 78/120 (65) | 0.47 | 0.70 | 0.66 |
| Unsure | 0/58 (0) | 1/79 (1) | 7/120 (6) | 0.45 | 0.06 | 0.08 |
DISCUSSION
Managing medication information for inpatients is an extremely complex task. On admission, home medication lists are often inaccurate or absent,6 requiring extra time and effort to discover this information. By discharge, medication regimens have frequently been altered,7 making communication of changes to the next provider essential. One study described myriad provider, patient, and health system issues in maintaining accurate outpatient medication lists.8 These issues are further compounded by the multiple prescribers, necessary hand‐offs, and formulary differences in the inpatient setting.
Over half of the hospitalists in this survey reported hospitalist involvement in design and implementation of medication reconciliation. Given the familiarity with hospital systems and inpatient workflow, hospitalists are well‐positioned to contribute to successful implementation. Nonetheless, many were unaware of efforts to implement this NPSG.
Measurement of both process and outcome measures is important when determining value in quality improvement. Beyond process measures, outcome measures such as adverse drug events, readmission rates, mortality, patient satisfaction, and outpatient provider satisfaction may be appropriate in evaluating medication reconciliation strategies. Even measuring the accuracy of the process with respect to the admission orders written would be a valuable source of information for further improvement. Unfortunately, respondents indicated that evaluation was occurring infrequently. Potentially more problematic is the apparent lack of clarity regarding identification of healthcare provider responsibility for specific process steps. By far the least uniformity is in the acquisition and documentation of the preadmission medication list. There is variability in who is assigned to perform this task, but a substantial number of respondents indicated that their process involved a shared responsibility between physicians and nurses. It is unclear whether this phenomenon reflects the complexity of inpatient medication information management, or is simply an attempt to distribute the work among providers. Sharing the work between physicians and nurses may increase the overall likelihood for compliance and possibly improve the safety and accuracy of the process, especially if the physicians and nurses take the medication history in a redundant fashion and share their findings. Conversely, compliance may decrease if each provider merely expects the other to complete the process. Optimally, an interdisciplinary workflow for medication history taking would be in place, involving both physicians and nurses, with the availability of pharmacist consultation in complex cases. However, our survey data suggest this is infrequent; resident physicians appear to be the ones shouldering substantial responsibility for medication reconciliation in tertiary academic centers. Further research into the accuracy of medication reconciliation processes involving different strategies for medication information collection would be useful.
We documented several barriers to successful implementation of medication reconciliation. Physicians cited a lack of medication knowledge on the part of the patient and unavailable prior medication lists as substantial barriers to success. Many medication reconciliation processes are limited by issues of poor health literacy or inadequate patient knowledge about medications. This lack of medication knowledge is especially problematic for patients new to a healthcare system. It will be important to implement processes that not only reconcile medications accurately, but also make medication information available for future care episodes.
Time required to complete the process was also important. Certain elements of the medication reconciliation process are new work, and integrating the process into existing workflows is crucial. Given the significant time commitment required, the rare involvement of pharmacists at most institutions is striking. It appears that hospital pharmacists do not currently own any of the medication reconciliation process steps at most facilities, despite having formal training in medication history‐taking. In the 2006 ASHP national hospital pharmacy survey, one‐third of pharmacists stated that there were not enough pharmacy resources to meet medication reconciliation demands; only 19% of those surveyed stated pharmacists provided medication education at discharge to more than 25% of their patients.9
This report has several limitations. The survey used was not comprehensive, and only represents a convenience sample of hospitalists attending anational meeting. Nearly 300 physicians responded, representing both teaching and private hospital settings. We consider the response rate of 37% reasonable for a survey of this nature, and the variety of processes described is likely indicative of the overall status of medication reconciliation implementation. The over‐representation of certain institutions in our survey is possible, especially those with large or influential hospital medicine programs. Our survey did not ask respondents to name their home institutions. In addition, this design is open to a convenience sample bias, in that surveying only national meeting attendees (rather than the entire SHM membership) risks overinclusion of those hospitalists involved in leadership roles and quality improvement projects. Despite this, the variety of processes described is likely indicative of the overall status of medication reconciliation implementation in mid‐2006. It is possible that processes have become more uniform nationwide in the interim.
Our survey results reflect the complexity surrounding medication reconciliation. It appears that full implementation has not yet occurred everywhere, significant barriers remain, and outcome measurement is limited. Importantly, physicians, nurses, and pharmacists do not have standardized roles. Responsibility for medication reconciliation has predominantly been added to the existing duties of inpatient physicians and nurses, with limited involvement of pharmacists. Hospitalists are well‐positioned to lead the ongoing implementation of medication reconciliation processes and should take advantage of their systems knowledge to effectively partner with other physicians, nurses, and pharmacists to achieve success in medication reconciliation.
Acknowledgements
The authors thank Ken Epstein, MD, and Renee Meadows, MD, along with the entire SHM Medication Reconciliation Task Force for their helpful review and comments on the article.
Appendix
|
|
- Kohn LT,Corrigan JM,Donaldson MS, eds.To Err Is Human: Building a Safer Health System.Washington, DC:National Academy Press;1999.
- .Medication reconciliation: transfer of medication information across settings – keeping it free from error.Am J Nurs.2005;105(3 Suppl):31–36.
- ,,, et al.Reconciliation of discrepancies in medication histories and admission orders of newly hospitalized patients.Am J Health‐Syst Pharm.2004;61(16):1689–1695.
- ,,, et al.Medication reconciliation: a practical tool to reduce the risk of medication errors.J Crit Care.2003;18(4):201–205.
- ,,,.Evaluation of a new integrated discharge prescription form.Ann Pharmacother.2001;35(7‐8):953–958.
- ,,, et al.Patient safety standardization as a mechanism to improve safety in health care.Jt Comm J Qual Saf.2004;30(1):5–14.
- ,,.What happens to long‐term medication when general practice patients are referred to hospital?Eur J Clin Pharmacol.1996;50(4):253–257.
- ,,, et al.An experiential interdisciplinary quality improvement education initiative.Am J Med Qual.2006;21(5):317–322.
- ,,.ASHP national survey of pharmacy practice in hospital settings: monitoring and patient education‐2006.Am J Health‐Syst Pharm.2007;64(5):507–520.
Percentage of Health Care Workers who Smoke at KHMC
Smoking represents the single most important cause of premature death and potentially lost years of life in the developing countries. Cigarette smoking causes more than 350,000 deaths each year in the United States and more than 4.9 million premature deaths worldwide.1 Death as a consequence of smoking is by no means limited to the elderly. Tobacco is the largest single cause of premature death and accounts for 3 of 10 of all deaths that occur among smokers and nonsmokers between the ages 35 and 69.2 Because most health professionals deal with different smoking‐related health problems, they make up the sector with the greatest potential to influence reducing smoking among their patients if they can show a positive attitude toward smoking‐cessation intervention.3 Tobacco smoking by health care workers has a negative influence on the general population.3, 4 The World Health Organization (WHO) has advocated that physicians should not smoke cigarettes, and surveys on this issue should be conducted among medical professionals.35 In Jordan, the prevalence of smoking is high and is increasing among women, but there are no data about the prevalence of smoking among physicians and other health care workers (HCWs).5 As members of an antismoking committee working at King Hussein Medical Center (KHMC) we realized that before applying any tobacco control strategy, it was important to understand the prevalence of smoking among HCWs at our center. To our knowledge, no representative survey of smoking among physicians in Jordan has been reported.
This study describes the prevalence of cigarettes smoking among HCWs in the largest tertiary‐care hospital in Jordan.
METHODS
The study was approved by the local ethics committee at KHMC and was conducted between June 1999 and September 1999. The study involved 600 representative samples of HCWs at KHMC. Subjects were divided into 3 groups according to their professions (physicians, nurses, and other professions). Each subject was interviewed personally. Questions were designed to obtain various demographic data and cigarette smoking characteristics. All other forms of tobacco consumption were not included into the questionnaire. Questions addressed various factors such as the age at which smoking was started and its duration and the number of cigarettes smoked per day. We defined smoking status as current smoker, occasional smoker, past smoker, or never smoker, according to WHO's 1995 definitions.4 Current smokers were those who had smoked at least 100 cigarettes and who were currently smoking on a daily basis. Occasional smokers were those who did not smoke daily. Past (ex‐)smokers were those nonsmokers who previously smoked every day for 6 months or more. The rate of cigarette smoking was calculated for each age group and for different medical specialties. Statistical analysis was performed with Statistical Package for Social Sciences 10.0 software (SPSS Inc., Chicago, IL). The 2 test was used to determine statistical significance. The 2‐tailed significance level was set at 5% (P 0.05).
RESULTS
Among the 600 respondents, there were 310 women (52%) and 290 men (48%), of whom 260 (43%) were physicians, 250 (42%) were nurses, and 90 (15%) were other HCWs. The total prevalence of smoking was 65%, ranging from 10% in the dermatologist group to 75% in the family practitioner group. We learned that 52% of smokers started before age 21 and that 78% started their habit during the first 2 years of college. The most common motive for starting smoking was pleasure encouraged by peer influence. Eighty‐two percent of male HCWs smoked cigarettes compared with 47% of female HCWs. The prevalence of current smokers was 77% and 33% in men and women, respectively (P = .002). Forty‐three percent of women did not smoke cigarettes, whereas only 14% of men did not smoke (P = .002; Table 1). Smoking prevalence did not significantly differ between age groups (P = .38; Table 2). The highest rate of smoking was among current smokers age 3140 years (58%). Of the 260 physicians, 46% were smokers, (currently or occasionally), 29% were ex‐smokers, and 25% were nonsmokers. Sixty‐seven percent of physicians who were smokers smoked 1120 cigarettes/day. There were fewer current smokers among physicians than among other HCWs (46% versus 74%, respectively). The highest percentage of smokers in the physician group was observed among family practitioners working in the emergency room (75%). On the other hand, dermatologists had the lowest percentage (10%). Women in general had a lower prevalence than men in all categories. Of the female nurses, 17% were smokers, 13% were ex‐smokers, and 70% were nonsmokers. The smoking rate of female nurses fell below their male counterparts (17% and 49%, respectively; P = .002). Seventy‐eight percent of the nonsmoking physicians reported that they do ask their patients routinely about their smoking history and encourage them to discontinue this habit. Only 36% of the physicians who smoked provide such advice during their clinical practice.
| Smoking status | Men (n = 310) | Women (n = 290) | Total (n = 600) | |||
|---|---|---|---|---|---|---|
| n | % | n | % | n | % | |
| Current smoker | 238 | 77 | 96 | 33 | 334 | 56 |
| Occasional smoker | 17 | 5 | 40 | 14 | 57 | 9 |
| Ex‐smoker | 12 | 4 | 30 | 10 | 42 | 7 |
| Nonsmoker | 43 | 14 | 124 | 43 | 167 | 28 |
| Smoking status | Age group | |||||
|---|---|---|---|---|---|---|
| 30 Years | 3140 Years | >40 Years | ||||
| n | % | n | % | n | % | |
| Current smoker | 92 | 54% | 170 | 58% | 72 | 52% |
| Occasional smoker | 19 | 11% | 22 | 8% | 16 | 12% |
| Ex‐smoker | 10 | 6% | 12 | 4% | 20 | 14% |
| Nonsmoker | 49 | 29% | 88 | 30% | 30 | 22% |
| Total | 170 | 292 | 138 | |||
DISCUSSION
Tobacco use, notably cigarette smoking, is the leading cause of an array of preventable diseases.12 It is estimated that approximately 30%40% of the adult population worldwide smokes. The situation is particularly alarming in adolescents.5, 6 The prevalence of smoking in developing countries now equals or exceeds the high smoking levels common in the United Kingdom 20 or 30 years ago.6 There is a significant difference in smoking prevalence between socioeconomic groups in the Western world. For professional people the prevalence is now 16%, whereas for unskilled manual workers the prevalence is 48%.7 HCWs are important opinion leaders in the community, and their behavior more than their words has a significant impact on the lifestyle of their patients.3, 89 It is therefore discouraging to learn that so many doctors and nurses still smoke. The smoking habits of health staff members may influence their attitudes toward patients.810 Numerous international studies have addressed the issue of smoking among physicians and other HCWs.816 In a study conducted by Ohida et al.,8 the prevalence of smoking among Japanese physicians was 27.1% for men and 6.8% for women, about half the general population in Japan (male, 54.0%; female, 14.5%). The prevalence of smoking varied in other industrialized countries: in the United States, the prevalence was 3% of men and 10% of women9; in the United Kingdom, it was 4% of men and 5% of women10; in France, 33% of men and 24% of women;11 and in the Netherlands, 41% of men and 24% of women12 Approximately 40% of Italian general practitioners and approximately 45% of their Spanish colleagues also smoke.13 There are limited published data addressing the issue of cigarette smoking among physicians and other HCWs in various Arab countries. Our results showed a higher rate of cigarette smoking among Jordanian physicians compared with that in the surrounding Arab countries.1416 Physicians at KHMC have a very high prevalence of cigarette smokingfar above the results reported in the above‐noted countries. It is comparable with that of unskilled manual workers in the Western world.2, 5 It has been reported that the highest smoking prevalence among young women in the East Mediterranean region occurs in Jordan.17 Our study showed that the smoking rate among women at KHMC, especially among nursing staff, is much lower than that of men, but this might change in the coming years if antismoking measures are not applied and directed toward younger generations. Smoking practice widely varies among the nonmedical KHMC staff and is reaching a very dangerous and worrisome level. This study was the first to be conducted to calculate the prevalence of smoking among HCWs at the largest tertiary‐care hospital in Jordan. A limitation of our study was that the number of responders included in this study might not fully represent the smoking status among HCWs in the country. However, the results raise some important issues to be discussed and analyzed further on a national level concerning this growing health problem. Physicians play an important role in accelerating the process of smoking cessation. Physicians should play an active role in the control of smoking by participating in public debate regarding smoking, both individually and through medical organizations. Nonsmoking physicians at KHMC were more active in asking patients about smoking habits than were those who smoked. The physician smokers were less critical of smoking than were the physician nonsmokers. Jordanian physicians do not fully comply with the rules against tobacco smoking in hospital. Smoking doctors frequently smoke in the hospital and do not counsel patients about smoking.10, 11, 13 Special effort is needed in the educational field concerning the issue of tobacco smoking for Jordanian physicians, and a strong initiative toward smoke‐free hospitals would help spread the message. To promote antismoking measures among doctors and nurses, it will be necessary to scrutinize the smoking habits and behavior of medical and nursing students18 and to conduct effective antismoking and health education activities before they acquire the smoking habit.
- Centers for Disease Control and Prevention.Smoking‐attributable mortality and years of potential life lost—United States, 1990.MMMWR Morb Mortal Wkly Rep.1993;42:645–648.
- ,,,,.Mortality from tobacco in developed countries: indirect estimation from national vital statistics.Lancet.1992;339:1268–1278.
- Working Group on Tobacco or Health.Guidelines for the conduct of tobacco smoking surveys among health professionals.Tokyo, Japan:World Health Organization Regional Office for Western Pacific;1987:9–19.
- World Health Organization.Leave the Pack Behind.Geneva, Switzerland:World Health Organization;1999:33–39.
- ,,,Tobacco Control Country Profiles.2nd ed.Atlanta, GA:American Cancer Society;2003:220–221.
- .The Seventh World Conference on Tobacco and Health.Thorax.1990;45:560–562.
- Department of Health.Smoke‐Free for Health, an Action Plan to Achieve the Health of the Nation Targets on Smoking.London:Department of Health;1994.
- ,,, et al.Smoking prevalence and attitudes toward smoking among Japanese physicians.JAMA.2001;286:917.
- ,,, et al.Trends in cigarette smoking among US physicians and nurses.JAMA.1994;271:1273–1275.
- ,,, et al.Attitudes to smoking and smoking habits among hospital staff.Thorax.1993;48:174–175.
- ,,,,.Smoking by French general practitioners: behaviour, attitudes and practice.Eur J Public Health.2005;15:33–38.
- ,,,.Prevalence of smoking in physicians and medical students, and the generation effect in the Netherlands.Soc Sci Med.1993;36:817–822.
- .Smoking habits of Italian health professionals.Ital Heart J.2001;2:110–112.
- ,,.Knowledge of and attitudes towards tobacco control among smoking and non‐smoking physicians in 2 Gulf Arab states.Saudi Med J.2004;25:585–591.
- ,,.Smoking habits among physicians in two Gulf countries.J R Soc Health.1993;113:298–301.
- .Smoking habits of primary health care physicians in Bahrain.J R Soc Health.1999;119:36–39.
- ,,,Tobacco Control Country Profiles.1st ed.Atlanta, GA:American Cancer Society;2000:30.
- ,,,.Smoking habits and attitudes of medical students towards smoking and antismoking campaigns in nine Asian countries. The Tobacco and Health Committee of the International Union Against Tuberculosis and Lung Diseases.Int J Epidemiol.1992;21:298–304.
Smoking represents the single most important cause of premature death and potentially lost years of life in the developing countries. Cigarette smoking causes more than 350,000 deaths each year in the United States and more than 4.9 million premature deaths worldwide.1 Death as a consequence of smoking is by no means limited to the elderly. Tobacco is the largest single cause of premature death and accounts for 3 of 10 of all deaths that occur among smokers and nonsmokers between the ages 35 and 69.2 Because most health professionals deal with different smoking‐related health problems, they make up the sector with the greatest potential to influence reducing smoking among their patients if they can show a positive attitude toward smoking‐cessation intervention.3 Tobacco smoking by health care workers has a negative influence on the general population.3, 4 The World Health Organization (WHO) has advocated that physicians should not smoke cigarettes, and surveys on this issue should be conducted among medical professionals.35 In Jordan, the prevalence of smoking is high and is increasing among women, but there are no data about the prevalence of smoking among physicians and other health care workers (HCWs).5 As members of an antismoking committee working at King Hussein Medical Center (KHMC) we realized that before applying any tobacco control strategy, it was important to understand the prevalence of smoking among HCWs at our center. To our knowledge, no representative survey of smoking among physicians in Jordan has been reported.
This study describes the prevalence of cigarettes smoking among HCWs in the largest tertiary‐care hospital in Jordan.
METHODS
The study was approved by the local ethics committee at KHMC and was conducted between June 1999 and September 1999. The study involved 600 representative samples of HCWs at KHMC. Subjects were divided into 3 groups according to their professions (physicians, nurses, and other professions). Each subject was interviewed personally. Questions were designed to obtain various demographic data and cigarette smoking characteristics. All other forms of tobacco consumption were not included into the questionnaire. Questions addressed various factors such as the age at which smoking was started and its duration and the number of cigarettes smoked per day. We defined smoking status as current smoker, occasional smoker, past smoker, or never smoker, according to WHO's 1995 definitions.4 Current smokers were those who had smoked at least 100 cigarettes and who were currently smoking on a daily basis. Occasional smokers were those who did not smoke daily. Past (ex‐)smokers were those nonsmokers who previously smoked every day for 6 months or more. The rate of cigarette smoking was calculated for each age group and for different medical specialties. Statistical analysis was performed with Statistical Package for Social Sciences 10.0 software (SPSS Inc., Chicago, IL). The 2 test was used to determine statistical significance. The 2‐tailed significance level was set at 5% (P 0.05).
RESULTS
Among the 600 respondents, there were 310 women (52%) and 290 men (48%), of whom 260 (43%) were physicians, 250 (42%) were nurses, and 90 (15%) were other HCWs. The total prevalence of smoking was 65%, ranging from 10% in the dermatologist group to 75% in the family practitioner group. We learned that 52% of smokers started before age 21 and that 78% started their habit during the first 2 years of college. The most common motive for starting smoking was pleasure encouraged by peer influence. Eighty‐two percent of male HCWs smoked cigarettes compared with 47% of female HCWs. The prevalence of current smokers was 77% and 33% in men and women, respectively (P = .002). Forty‐three percent of women did not smoke cigarettes, whereas only 14% of men did not smoke (P = .002; Table 1). Smoking prevalence did not significantly differ between age groups (P = .38; Table 2). The highest rate of smoking was among current smokers age 3140 years (58%). Of the 260 physicians, 46% were smokers, (currently or occasionally), 29% were ex‐smokers, and 25% were nonsmokers. Sixty‐seven percent of physicians who were smokers smoked 1120 cigarettes/day. There were fewer current smokers among physicians than among other HCWs (46% versus 74%, respectively). The highest percentage of smokers in the physician group was observed among family practitioners working in the emergency room (75%). On the other hand, dermatologists had the lowest percentage (10%). Women in general had a lower prevalence than men in all categories. Of the female nurses, 17% were smokers, 13% were ex‐smokers, and 70% were nonsmokers. The smoking rate of female nurses fell below their male counterparts (17% and 49%, respectively; P = .002). Seventy‐eight percent of the nonsmoking physicians reported that they do ask their patients routinely about their smoking history and encourage them to discontinue this habit. Only 36% of the physicians who smoked provide such advice during their clinical practice.
| Smoking status | Men (n = 310) | Women (n = 290) | Total (n = 600) | |||
|---|---|---|---|---|---|---|
| n | % | n | % | n | % | |
| Current smoker | 238 | 77 | 96 | 33 | 334 | 56 |
| Occasional smoker | 17 | 5 | 40 | 14 | 57 | 9 |
| Ex‐smoker | 12 | 4 | 30 | 10 | 42 | 7 |
| Nonsmoker | 43 | 14 | 124 | 43 | 167 | 28 |
| Smoking status | Age group | |||||
|---|---|---|---|---|---|---|
| 30 Years | 3140 Years | >40 Years | ||||
| n | % | n | % | n | % | |
| Current smoker | 92 | 54% | 170 | 58% | 72 | 52% |
| Occasional smoker | 19 | 11% | 22 | 8% | 16 | 12% |
| Ex‐smoker | 10 | 6% | 12 | 4% | 20 | 14% |
| Nonsmoker | 49 | 29% | 88 | 30% | 30 | 22% |
| Total | 170 | 292 | 138 | |||
DISCUSSION
Tobacco use, notably cigarette smoking, is the leading cause of an array of preventable diseases.12 It is estimated that approximately 30%40% of the adult population worldwide smokes. The situation is particularly alarming in adolescents.5, 6 The prevalence of smoking in developing countries now equals or exceeds the high smoking levels common in the United Kingdom 20 or 30 years ago.6 There is a significant difference in smoking prevalence between socioeconomic groups in the Western world. For professional people the prevalence is now 16%, whereas for unskilled manual workers the prevalence is 48%.7 HCWs are important opinion leaders in the community, and their behavior more than their words has a significant impact on the lifestyle of their patients.3, 89 It is therefore discouraging to learn that so many doctors and nurses still smoke. The smoking habits of health staff members may influence their attitudes toward patients.810 Numerous international studies have addressed the issue of smoking among physicians and other HCWs.816 In a study conducted by Ohida et al.,8 the prevalence of smoking among Japanese physicians was 27.1% for men and 6.8% for women, about half the general population in Japan (male, 54.0%; female, 14.5%). The prevalence of smoking varied in other industrialized countries: in the United States, the prevalence was 3% of men and 10% of women9; in the United Kingdom, it was 4% of men and 5% of women10; in France, 33% of men and 24% of women;11 and in the Netherlands, 41% of men and 24% of women12 Approximately 40% of Italian general practitioners and approximately 45% of their Spanish colleagues also smoke.13 There are limited published data addressing the issue of cigarette smoking among physicians and other HCWs in various Arab countries. Our results showed a higher rate of cigarette smoking among Jordanian physicians compared with that in the surrounding Arab countries.1416 Physicians at KHMC have a very high prevalence of cigarette smokingfar above the results reported in the above‐noted countries. It is comparable with that of unskilled manual workers in the Western world.2, 5 It has been reported that the highest smoking prevalence among young women in the East Mediterranean region occurs in Jordan.17 Our study showed that the smoking rate among women at KHMC, especially among nursing staff, is much lower than that of men, but this might change in the coming years if antismoking measures are not applied and directed toward younger generations. Smoking practice widely varies among the nonmedical KHMC staff and is reaching a very dangerous and worrisome level. This study was the first to be conducted to calculate the prevalence of smoking among HCWs at the largest tertiary‐care hospital in Jordan. A limitation of our study was that the number of responders included in this study might not fully represent the smoking status among HCWs in the country. However, the results raise some important issues to be discussed and analyzed further on a national level concerning this growing health problem. Physicians play an important role in accelerating the process of smoking cessation. Physicians should play an active role in the control of smoking by participating in public debate regarding smoking, both individually and through medical organizations. Nonsmoking physicians at KHMC were more active in asking patients about smoking habits than were those who smoked. The physician smokers were less critical of smoking than were the physician nonsmokers. Jordanian physicians do not fully comply with the rules against tobacco smoking in hospital. Smoking doctors frequently smoke in the hospital and do not counsel patients about smoking.10, 11, 13 Special effort is needed in the educational field concerning the issue of tobacco smoking for Jordanian physicians, and a strong initiative toward smoke‐free hospitals would help spread the message. To promote antismoking measures among doctors and nurses, it will be necessary to scrutinize the smoking habits and behavior of medical and nursing students18 and to conduct effective antismoking and health education activities before they acquire the smoking habit.
- Centers for Disease Control and Prevention.Smoking‐attributable mortality and years of potential life lost—United States, 1990.MMMWR Morb Mortal Wkly Rep.1993;42:645–648.
- ,,,,.Mortality from tobacco in developed countries: indirect estimation from national vital statistics.Lancet.1992;339:1268–1278.
- Working Group on Tobacco or Health.Guidelines for the conduct of tobacco smoking surveys among health professionals.Tokyo, Japan:World Health Organization Regional Office for Western Pacific;1987:9–19.
- World Health Organization.Leave the Pack Behind.Geneva, Switzerland:World Health Organization;1999:33–39.
- ,,,Tobacco Control Country Profiles.2nd ed.Atlanta, GA:American Cancer Society;2003:220–221.
- .The Seventh World Conference on Tobacco and Health.Thorax.1990;45:560–562.
- Department of Health.Smoke‐Free for Health, an Action Plan to Achieve the Health of the Nation Targets on Smoking.London:Department of Health;1994.
- ,,, et al.Smoking prevalence and attitudes toward smoking among Japanese physicians.JAMA.2001;286:917.
- ,,, et al.Trends in cigarette smoking among US physicians and nurses.JAMA.1994;271:1273–1275.
- ,,, et al.Attitudes to smoking and smoking habits among hospital staff.Thorax.1993;48:174–175.
- ,,,,.Smoking by French general practitioners: behaviour, attitudes and practice.Eur J Public Health.2005;15:33–38.
- ,,,.Prevalence of smoking in physicians and medical students, and the generation effect in the Netherlands.Soc Sci Med.1993;36:817–822.
- .Smoking habits of Italian health professionals.Ital Heart J.2001;2:110–112.
- ,,.Knowledge of and attitudes towards tobacco control among smoking and non‐smoking physicians in 2 Gulf Arab states.Saudi Med J.2004;25:585–591.
- ,,.Smoking habits among physicians in two Gulf countries.J R Soc Health.1993;113:298–301.
- .Smoking habits of primary health care physicians in Bahrain.J R Soc Health.1999;119:36–39.
- ,,,Tobacco Control Country Profiles.1st ed.Atlanta, GA:American Cancer Society;2000:30.
- ,,,.Smoking habits and attitudes of medical students towards smoking and antismoking campaigns in nine Asian countries. The Tobacco and Health Committee of the International Union Against Tuberculosis and Lung Diseases.Int J Epidemiol.1992;21:298–304.
Delays in Diagnosis and Treatment
Clostridium difficileassociated disease (CDAD) is a well‐known complication of hospitalization and is the most frequently identified cause of nosocomial diarrhea that hospitalists encounter. Despite widespread epidemiologic attempts to control the disease, its prevalence and clinical severity appear to be increasing.1 The resulting social and economic consequences are profound. The estimated 3 million inpatient cases of CDAD a year result in an average increase in the length of stay of 3.6 days at a cost in inpatient health care of more than $1 billion.2
Early diagnosis of index cases is crucial. A diagnostic delay can result in a treatment delay for the index case, as well as in a delay in implementing isolation procedures to prevent horizontal transmission. Acquisition of CDAD is time dependent and occurs in 20% to 30% of hospitalized patients at a rate of approximately 8% per week.3, 4 This transmission is primarily a result of environmental contamination with CDAD spores, found on 59% of the hands of hospital personnel caring for infected patients, in 49% of rooms of symptomatic patients, and in 29% of rooms of asymptomatic carriers.5 Despite the need for early diagnosis, a study from the United Kingdom documented that the average time from the onset of diarrhea to sampling of CDAD patients is 4.7 days.6 An additional challenge for early diagnosis is the delay in microbiological confirmation of CDAD in a suspected patient. Cytotoxic assays, which have become the standard diagnostic technique for CDAD, exhibit excellent sensitivity and specificity but have a lengthy processing time, between 2 and 4 days. Although antigen detection assays can be rapidly performed, many have inadequate sensitivity and specificity.7
These issues of diagnostic and treatment delays are compounded in patients with recurrent CDAD. As many as 15%35% of patients with an initial CDAD infection will experience a recurrence, usually within 2 months. At least half these infections are a result of reinfection, not relapse.8 This implies that early detection and strict isolation of infected patients is essential for reducing the exposure of at‐risk patients to the disease. There is evidence that the burden of patients on the same ward simultaneously having CDAD increases a patient's risk of acquiring the disease.9 It is currently unknown if recurrent CDAD cases are diagnosed or treated earlier than initial cases. If not, this is a potentially important patient population for hospitalists to target for aggressive containment strategies. This study sought to determine the mean time to sampling and treatment in patients with recurrent CDAD infection compared with those in patients who are initially infected.
Design
The study cohort consisted of all adult patients more than 18 years old with CDAD (by ICD9 code) who had been hospitalized at Brigham and Women's Hospital between 1997 and 2004. Retrospectively, patients were identified through the Partners Healthcare Research Patient Data Repository (RPDR). The RPDR is a centralized clinical data registry that gathers data from various hospital legacy systems and was used to determine the patient demographics and first date of treatment (with vancomycin or metronidazole). Medical and microbiologic records were reviewed to determine the dates of cytotoxic assay submission and symptom onset. Symptoms were defined as diarrhea, abdominal pain/cramping, or radiological/colonoscopic evidence of colitis. Recurrence was defined as any repeat inpatient CDAD diagnosis within 2 months (regardless of admission diagnosis). Baseline characteristics in the recurrence and no‐recurrence populations were compared by the 2‐sided Student t test or the chi‐square test (for continuous and categorical variables, respectively). Mean time from symptom to sampling, from symptom to treatment, and from sampling to treatment were compared between initial and recurrent disease episodes by the 2‐sided Student t test. All P values .05 were considered significant. Institutional review board approval was obtained by Partners Healthcare.
RESULTS
Between 1997 and 2004 there were 1309 patients with an ICD9 code for CDAD, 151 of whom (12%) had a recurrence. Of these, 125 had 1 recurrence, 23 had 2 recurrences, and 3 had 3 recurrences. There were no significant differences between the groups in basic demographics (Table 1). The mean time to sampling was not significantly different between initial and recurrent CDAD hospital episodes (Table 2). However, the mean time to treatment (from symptoms and sampling) was shorter in recurrent episodes (Table 2). From 1997 to 2004 there was no significant reduction in time to sampling, but there was a significant reduction in time to treatment, from 3.89 days (19972000) to 2.30 days (2001 2004), P = .0012.
| Characteristic | Patients without recurrent disease (n = 1158) | Patients with recurrent disease (n = 151) | P value |
|---|---|---|---|
| Sex (% male) | 45% | 45% | .98 |
| Age (mean) | 68.3 years | 69.9 years | .72 |
| Race (% white) | 80% | 80% | .97 |
| Language (English) | 94% | 92% | .83 |
| First episode (n = 1309) | Recurrence (n = 180)* | P value | |
|---|---|---|---|
| |||
| Symptoms to sampling | 2.24 days (117 days) | 2.09 days (116 days) | 0.700 |
| Symptoms to treatment | 3.64 days (118 days) | 2.52 days (119 days) | 0.024 |
| Sampling to treatment | 3.76 days (119 days) | 2.57 days (119 days) | 0.006 |
DISCUSSION
Clostridium difficileassociated disease (CDAD) has become a significant nosocomial infection in medical institutions, and recurrent CDAD is emerging as a disease of concern for hospitalists. Diagnostic delays represent a major epidemiologic problem, resulting in both delay of treatment delay of the index case and delay in implementing isolation procedures to prevent horizontal transmission. In this study, patients with recurrent disease did not have stool collected any earlier than did patients with their initial episode of CDAD, and these diagnostic delays did not change in successive eras. Recurrent disease patients did receive treatment earlier than did patients with initial episodes. Although this empiric treatment strategy is encouraging and likely reflects heightened awareness of the disease over time, the 2.5‐day span from symptoms to treatment is still a clinically significant delay. Also of concern is the range of time from symptoms to treatment, as long as 19 days in the recurrent treatment group. Although most patients were treated within 12 days, this variability represents the burden of infectious patients with the potential for infecting others. Targeting recurrent CDAD populations for early diagnosis, treatment, and isolation would almost certainly reduce the morbidity associated with horizontal transmission rates.9
This study had several limitations. Our data found a lower incidence of recurrent CDAD than previously published in the literature. This can be accounted for by the identification of cases by ICD9 code, which previously has been documented to underestimate true disease.10, 11 We also were not able to capture recurrent episodes in outpatients or episodes that occurred after the 2004 cohort, which underestimated the true frequency of recurrence. At worst, this underestimation could bias the results toward the null hypothesis. An additional limitation of the study was the assumption that time to treatment was accurately reflected by time to prescription of either vancomycin or flagyl. Some patients may have been treated by suspending treatment with the offending antibiotic along with watchful waiting, which is a reasonable strategy for patients with mild disease and is endorsed by the American College of Gastroenterology and the Society for Healthcare Epidemiology of America.12, 13 This would overestimate time to treatment for those individuals and would make time to treatment appear longer, but would not affect time to sampling. In addition, the symptoms collected from chart review were assumed to be a result of the patient's CDAD, but there is a chance that these symptoms such as diarrhea, abdominal pain, and cramping may have been a result of a different diagnosis. These data were also limited to a cohort from a single institution and may not reflect the patient characteristics or practice patterns at other institutions.
In conclusion, CDAD is a major contributor to morbidity from nosocomial infections, and recurrent CDAD patients are a likely source of horizontal disease transmission. This study documented that there are significant diagnostic and treatment delays, even in populations with recurrent disease. It is especially important that hospitalists take measures to improve the early diagnosis, treatment, and isolation of these patients in order to improve these deficiencies in care.
- ,,,.Ten years of prospective Clostridium difficile‐associated disease surveillance and treatment at the Minneapolis VA Medical Center, 1982–1991.Infect Control Hosp Epidemiol.1994;15:371–381.
- ,,,.Health care costs and mortality associated with nosocomial diarrhea due to clostridium difficile.Clin Infect Dis.2002;34:346–353.
- ,,, et al.Nosocomial Clostridium difficile colonization and disease.Lancet.1990;336:97–100.
- ,,,.Asymptomatic carriage of Clostridium difficile and serum levels of IgG antibody against Toxin A.N Engl J Med.2000;342:390–397.
- ,,,.Nosocomial acquisition of Clostridium difficile infection.N Engl J Med.1989;320:204–210.
- ,.Reducing delays in the diagnosis and treatment of Clostridium difficile diarrhoea.QJM.2003;96:579–582.
- ,,, et al.Multicenter evaluation of four methods for Clostridium difficile detection: ImmunoCard C. difficile, cytotoxin assay, culture, and latex agglutination.J Clin Microbiol.1996;34:2718–2721.
- ,,, et al.Epidemiology of recurrences or reinfections of Clostridium difficile–associated diarrhea.J Clin Microbiol.2000;38:2386–2388.
- ,,, et al.Evaluation of Clostridium difficile‐associated disease pressure as a risk factor for C difficile–associated disease.Arch Intern Med.2007;167:1092–1097.
- ,,,.Accuracy of ICD9 coding for Clostridium difficile infections.Epidemiol Infect.2006;135:1010–1013.
- Emerging Infectious Diseases online publication Available at: http://www.cdc.gov/ncidod/EID/vol12no10/06‐0016.htm. Accessed July 12,2007.
- .Guidelines for the diagnosis and management of Clostridium difficile–associated diarrhea and colitis.American College of Gastroenterology, Practice Parameters Committee.Am J Gastroenterol.1997;92:739–750.
- ,,,,.SHEA position paper. Clostridium difficile associated diarrhea and colitis.Infect Control Hosp Epidemiol.1995;16:459–477.
Clostridium difficileassociated disease (CDAD) is a well‐known complication of hospitalization and is the most frequently identified cause of nosocomial diarrhea that hospitalists encounter. Despite widespread epidemiologic attempts to control the disease, its prevalence and clinical severity appear to be increasing.1 The resulting social and economic consequences are profound. The estimated 3 million inpatient cases of CDAD a year result in an average increase in the length of stay of 3.6 days at a cost in inpatient health care of more than $1 billion.2
Early diagnosis of index cases is crucial. A diagnostic delay can result in a treatment delay for the index case, as well as in a delay in implementing isolation procedures to prevent horizontal transmission. Acquisition of CDAD is time dependent and occurs in 20% to 30% of hospitalized patients at a rate of approximately 8% per week.3, 4 This transmission is primarily a result of environmental contamination with CDAD spores, found on 59% of the hands of hospital personnel caring for infected patients, in 49% of rooms of symptomatic patients, and in 29% of rooms of asymptomatic carriers.5 Despite the need for early diagnosis, a study from the United Kingdom documented that the average time from the onset of diarrhea to sampling of CDAD patients is 4.7 days.6 An additional challenge for early diagnosis is the delay in microbiological confirmation of CDAD in a suspected patient. Cytotoxic assays, which have become the standard diagnostic technique for CDAD, exhibit excellent sensitivity and specificity but have a lengthy processing time, between 2 and 4 days. Although antigen detection assays can be rapidly performed, many have inadequate sensitivity and specificity.7
These issues of diagnostic and treatment delays are compounded in patients with recurrent CDAD. As many as 15%35% of patients with an initial CDAD infection will experience a recurrence, usually within 2 months. At least half these infections are a result of reinfection, not relapse.8 This implies that early detection and strict isolation of infected patients is essential for reducing the exposure of at‐risk patients to the disease. There is evidence that the burden of patients on the same ward simultaneously having CDAD increases a patient's risk of acquiring the disease.9 It is currently unknown if recurrent CDAD cases are diagnosed or treated earlier than initial cases. If not, this is a potentially important patient population for hospitalists to target for aggressive containment strategies. This study sought to determine the mean time to sampling and treatment in patients with recurrent CDAD infection compared with those in patients who are initially infected.
Design
The study cohort consisted of all adult patients more than 18 years old with CDAD (by ICD9 code) who had been hospitalized at Brigham and Women's Hospital between 1997 and 2004. Retrospectively, patients were identified through the Partners Healthcare Research Patient Data Repository (RPDR). The RPDR is a centralized clinical data registry that gathers data from various hospital legacy systems and was used to determine the patient demographics and first date of treatment (with vancomycin or metronidazole). Medical and microbiologic records were reviewed to determine the dates of cytotoxic assay submission and symptom onset. Symptoms were defined as diarrhea, abdominal pain/cramping, or radiological/colonoscopic evidence of colitis. Recurrence was defined as any repeat inpatient CDAD diagnosis within 2 months (regardless of admission diagnosis). Baseline characteristics in the recurrence and no‐recurrence populations were compared by the 2‐sided Student t test or the chi‐square test (for continuous and categorical variables, respectively). Mean time from symptom to sampling, from symptom to treatment, and from sampling to treatment were compared between initial and recurrent disease episodes by the 2‐sided Student t test. All P values .05 were considered significant. Institutional review board approval was obtained by Partners Healthcare.
RESULTS
Between 1997 and 2004 there were 1309 patients with an ICD9 code for CDAD, 151 of whom (12%) had a recurrence. Of these, 125 had 1 recurrence, 23 had 2 recurrences, and 3 had 3 recurrences. There were no significant differences between the groups in basic demographics (Table 1). The mean time to sampling was not significantly different between initial and recurrent CDAD hospital episodes (Table 2). However, the mean time to treatment (from symptoms and sampling) was shorter in recurrent episodes (Table 2). From 1997 to 2004 there was no significant reduction in time to sampling, but there was a significant reduction in time to treatment, from 3.89 days (19972000) to 2.30 days (2001 2004), P = .0012.
| Characteristic | Patients without recurrent disease (n = 1158) | Patients with recurrent disease (n = 151) | P value |
|---|---|---|---|
| Sex (% male) | 45% | 45% | .98 |
| Age (mean) | 68.3 years | 69.9 years | .72 |
| Race (% white) | 80% | 80% | .97 |
| Language (English) | 94% | 92% | .83 |
| First episode (n = 1309) | Recurrence (n = 180)* | P value | |
|---|---|---|---|
| |||
| Symptoms to sampling | 2.24 days (117 days) | 2.09 days (116 days) | 0.700 |
| Symptoms to treatment | 3.64 days (118 days) | 2.52 days (119 days) | 0.024 |
| Sampling to treatment | 3.76 days (119 days) | 2.57 days (119 days) | 0.006 |
DISCUSSION
Clostridium difficileassociated disease (CDAD) has become a significant nosocomial infection in medical institutions, and recurrent CDAD is emerging as a disease of concern for hospitalists. Diagnostic delays represent a major epidemiologic problem, resulting in both delay of treatment delay of the index case and delay in implementing isolation procedures to prevent horizontal transmission. In this study, patients with recurrent disease did not have stool collected any earlier than did patients with their initial episode of CDAD, and these diagnostic delays did not change in successive eras. Recurrent disease patients did receive treatment earlier than did patients with initial episodes. Although this empiric treatment strategy is encouraging and likely reflects heightened awareness of the disease over time, the 2.5‐day span from symptoms to treatment is still a clinically significant delay. Also of concern is the range of time from symptoms to treatment, as long as 19 days in the recurrent treatment group. Although most patients were treated within 12 days, this variability represents the burden of infectious patients with the potential for infecting others. Targeting recurrent CDAD populations for early diagnosis, treatment, and isolation would almost certainly reduce the morbidity associated with horizontal transmission rates.9
This study had several limitations. Our data found a lower incidence of recurrent CDAD than previously published in the literature. This can be accounted for by the identification of cases by ICD9 code, which previously has been documented to underestimate true disease.10, 11 We also were not able to capture recurrent episodes in outpatients or episodes that occurred after the 2004 cohort, which underestimated the true frequency of recurrence. At worst, this underestimation could bias the results toward the null hypothesis. An additional limitation of the study was the assumption that time to treatment was accurately reflected by time to prescription of either vancomycin or flagyl. Some patients may have been treated by suspending treatment with the offending antibiotic along with watchful waiting, which is a reasonable strategy for patients with mild disease and is endorsed by the American College of Gastroenterology and the Society for Healthcare Epidemiology of America.12, 13 This would overestimate time to treatment for those individuals and would make time to treatment appear longer, but would not affect time to sampling. In addition, the symptoms collected from chart review were assumed to be a result of the patient's CDAD, but there is a chance that these symptoms such as diarrhea, abdominal pain, and cramping may have been a result of a different diagnosis. These data were also limited to a cohort from a single institution and may not reflect the patient characteristics or practice patterns at other institutions.
In conclusion, CDAD is a major contributor to morbidity from nosocomial infections, and recurrent CDAD patients are a likely source of horizontal disease transmission. This study documented that there are significant diagnostic and treatment delays, even in populations with recurrent disease. It is especially important that hospitalists take measures to improve the early diagnosis, treatment, and isolation of these patients in order to improve these deficiencies in care.
- ,,,.Ten years of prospective Clostridium difficile‐associated disease surveillance and treatment at the Minneapolis VA Medical Center, 1982–1991.Infect Control Hosp Epidemiol.1994;15:371–381.
- ,,,.Health care costs and mortality associated with nosocomial diarrhea due to clostridium difficile.Clin Infect Dis.2002;34:346–353.
- ,,, et al.Nosocomial Clostridium difficile colonization and disease.Lancet.1990;336:97–100.
- ,,,.Asymptomatic carriage of Clostridium difficile and serum levels of IgG antibody against Toxin A.N Engl J Med.2000;342:390–397.
- ,,,.Nosocomial acquisition of Clostridium difficile infection.N Engl J Med.1989;320:204–210.
- ,.Reducing delays in the diagnosis and treatment of Clostridium difficile diarrhoea.QJM.2003;96:579–582.
- ,,, et al.Multicenter evaluation of four methods for Clostridium difficile detection: ImmunoCard C. difficile, cytotoxin assay, culture, and latex agglutination.J Clin Microbiol.1996;34:2718–2721.
- ,,, et al.Epidemiology of recurrences or reinfections of Clostridium difficile–associated diarrhea.J Clin Microbiol.2000;38:2386–2388.
- ,,, et al.Evaluation of Clostridium difficile‐associated disease pressure as a risk factor for C difficile–associated disease.Arch Intern Med.2007;167:1092–1097.
- ,,,.Accuracy of ICD9 coding for Clostridium difficile infections.Epidemiol Infect.2006;135:1010–1013.
- Emerging Infectious Diseases online publication Available at: http://www.cdc.gov/ncidod/EID/vol12no10/06‐0016.htm. Accessed July 12,2007.
- .Guidelines for the diagnosis and management of Clostridium difficile–associated diarrhea and colitis.American College of Gastroenterology, Practice Parameters Committee.Am J Gastroenterol.1997;92:739–750.
- ,,,,.SHEA position paper. Clostridium difficile associated diarrhea and colitis.Infect Control Hosp Epidemiol.1995;16:459–477.
Rules of Engagement
Peripheral arterial disease (PAD) is defined by the presence of stenosis or occlusion in peripheral arterial beds.1, 2 Based on large population‐based screening surveys, the prevalence of this disease ranges between 5.5% and 26.7% and is dependent on age, atherothrombotic risk factors, and the coexistence of other atherothrombotic diseases.35 Symptoms of PAD include mild to intermittent claudication, ischemic rest pain, and tissue loss.2 Disease severity is classified according to either Fontaine's stages or Rutherford categories. These categorization schema have value in improving communication between physicians, which is important in ensuring continuity of care between the inpatient and outpatient settings (Table 1).2
| Stage | Fontaine | Rutherford | ||
|---|---|---|---|---|
| Clinical | Grade | Category | Clinical | |
| ||||
| I | Asymptomatic | 0 | 0 | Asymptomatic |
| IIa | Mild claudication | I | 1 | Mild claudication |
| IIb | Moderate‐severe claudication | I | 2 | Moderate claudication |
| III | Ischemic rest pain | I | 3 | Severe claudication |
| IV | Ulceration or gangrene | II | 4 | Ischemic rest pain |
| III | 5 | Minor tissue loss | ||
| IV | 6 | Ulceration or gangrene | ||
Patients with PAD are at increased risk of dying from or experiencing a cardiovascular event.68 Among patients diagnosed with PAD, coronary artery disease (CAD), or cerebrovascular disease (CVD), those with PAD have the highest 1‐year rate of cardiovascular death, MI, stroke, or vascular‐related hospitalization (Fig. 1).8 This risk is attributable in part to the high rate of association of PAD with other atherothrombotic diseases. The Reduction of Atherothrombosis for Continued Health (REACH) Registry found that approximately 60% of participants with documented PAD have polyvascular disease, defined by the coexistence of CAD and/or CVD. In comparison, 25% of participants with CAD and 40% of participants with CVD have polyvascular disease.8 Thus, PAD can be considered a powerful indicator of systemic atherothrombotic disease and a predictor of cardiovascular and cerebrovascular morbidity and mortality.1

Unfortunately, asymptomatic PAD is more common than its symptomatic counterpart.3 In addition, symptomatic patients often fail to notify their physicians about PAD‐associated symptoms because they attribute them to aging.3 As a result, this disease is underdiagnosed and undertreated.1 Accordingly, several medical associations and physician task forces have called for an increase in screening for PAD in at‐risk populations that include: patients older than 70, patients older than 50 who have concomitant atherothrombotic risk factors, and patients with atherothrombotic disease of single or multiple vascular beds.1, 9 In many cases hospitalists encounter patients at high‐risk for PAD whose DRG for admission might be unrelated to this disease. Nonetheless, hospitalists have the opportunity to improve patient outcomes by being capable of screening for undiagnosed PAD and initiating appropriate interventions to reduce the risk of life‐threatening cardiovascular events.
DIAGNOSIS
Peripheral arterial disease can be diagnosed by either noninvasive or invasive methods. The ankle‐to‐brachial index (ABI) is an accurate, practical, inexpensive, and noninvasive method for detecting PAD.1 The sensitivity of ABI in detecting PAD is 95% with 99% specificity,10 which makes the method superior to other indicators (eg, absence of a pedal pulse, presence of a femoral arterial bruit, slow venous filling, or cold/abnormally colored skin) assessed during a physical examination.11 Under normal conditions, the systolic pressure at the ankle should be equal to or greater than that recorded from the upper arm. As PAD narrows arteries, the systolic pressure decreases at sites distal to the area of arterial narrowing. A resting ABI is quantified by taking 2 readings each of ankle and brachial blood pressures with a handheld Doppler device while the patient is supine and dividing the highest ankle systolic pressure by the highest brachial pressure.12
An ABI between 0.9 and 1.30 is considered normal. Ratios between 0.7 and 0.89 indicate mild PAD, 0.4 and 0.69 moderate PAD, and an ABI 0.4 severe PAD when patients are more likely to have ischemic pain when at rest. An ABI > 1.3 usually indicates the presence of noncompressible vessels, which can be common in the elderly and patients with diabetes mellitus who have calcification of the distal arteries.1, 2 The ABI is also inversely related to the number of atherosclerotic risk factors and the risk of adverse cardiovascular events and death.6, 1316 To identify individuals with suspected or asymptomatic lower‐extremity PAD, ABI has a class I recommendation from the American College of Cardiology and American Heart Association (ACC/AHA) for patients who present with leg symptoms, who are 70 years and older, or who are 50 years and older with a history of smoking or diabetes.2 This enables physicians to make therapeutic interventions to reduce the risk of adverse vascular events in these patient cohorts.
Additional detection methods for PAD include measuring the ABI before and after exercise on a treadmill, if the patient is ambulatory, or exercise by performing 50 repetitions of raising the heels maximally off the floor, if the patient is not ambulatory. These tests determine the extent of claudication.2 Duplex ultrasound is used to establish the location and severity of stenosis and to follow PAD progression.2
Invasive evaluations for PAD are used primarily to confirm an initial diagnosis of PAD and assess its severity. These methods include a conventional angiogram, which is the most readily available and widely used technique for defining arterial stenosis. Magnetic resonance (MR) angiography with gadolinium and computed tomographic (CT) angiography are used to determine the location and degree of stenosis. Both MR and CT angiography have advantages and disadvantages but are considered interchangeable with one another in patients with contraindications to either method (Table 2).2
| Diagostic method | Benefits | Limitations |
|---|---|---|
| ||
| Magnetic resonance angiography (MRA) | Useful to assess PAD anatomy and presence of significant stenosis | Tends to overestimate degree of stenosis |
| Useful to select patients who are candidates for endovascular of surgical revascularization | May be inaccurate in arteries treated with metal stents | |
| Cannot be used in patients with contraindication to magnetic resonance technique | ||
| Computed tomographic angiography (CTA) | Useful to assess PAD anatomy and presence of significant stenosis | Single‐detector CT lacks accuracy to detect stenoses |
| Useful to select patients who are candidates for endovascular or surgical revascularization | Spatial Resolution lower than digital subtraction angiography | |
| Helpful to provide associated soft‐tissue diagnostic information that may be associated with PAD | Venous opacification can obscure arterial filling | |
| Patients with contraindications to MRA | Asymmetric opacification of legs may obscure arterial phase in some vessels | |
| Metal clips, stents, and prostheses do not cause significant CTA artifacts | Accuracy and effectiveness not as well determined as MRA | |
| Scan times are significantly faster | Treatment plans based on CTA have not been compared to those of catheter angiography | |
| Requires contrast and radiation | ||
| Use may be limited in individuals with renal dysfunction | ||
ANTIPLATELET THERAPY FOR REDUCTION OF VASCULAR EVENTS
Hospitalists utilize a wide array of therapies to treat and manage PAD. Acute complications of PAD may require interventions to prevent tissue loss or infection, revascularization procedures, or surgical amputation. Treatment of mild to moderate PAD focuses on atherothrombotic risk factor management, exercise therapy to improve limb function, and interventions to reduce the risk of adverse vascular events.2, 9 The remainder of this report focuses on the role of antiplatelet therapy (eg, aspirin and thienopyridines) in reducing the risk of vascular events in patients with PAD.
The Antiplatelet Trialists' Collaboration performed an overview analysis of randomized trials conducted prior to 1990 in order to determine the association of prolonged antiplatelet therapy with the occurrence of major vascular events. As a whole, therapies thought to act through inhibition of platelet aggregation, adhesion, or both reduced the incidence of vascular events by 33% in patients with PAD and those at high risk, and by 25% in all patient groups. Antiplatelet agents were also well tolerated; the absolute risk of fatal or nonmajor hemorrhage was low.17
A similar meta‐analysis was conducted of antiplatelet therapies in high‐risk patients with atherothrombosis by the Antithrombotic Trialists' Collaboration. Antiplatelet therapies taken together reduced the odds of patients experiencing vascular events by 22% (SE = 2%) across all trials and 23% (SE = 8%) in patients with PAD.18 Similar to the Antiplatelet Trialists' Collaboration study, the absolute risk of major and minor bleeding was low compared to the benefits of antiplatelet therapy.18 The results of these studies provide supporting evidence for the ACC/AHA class I recommendation for the use of antiplatelet therapy to reduce the risk of MI, stroke, or vascular death in patients with PAD.
The Antithrombotic Trialists' Collaboration also examined the risk reduction associated with a specific antiplatelet agent, aspirin. All doses of aspirin (75‐150, 160‐325, and 500‐1500 mg/day) reduced the odds by 23% (SE = 2%); high doses were no more effective than medium or low doses.18 Although the effects of aspirin was not analyzed in a subgroup analysis of patients with PAD, this study and others support the ACC/AHA class I recommendations for the use of aspirin to reduce the risk of MI, stroke, or vascular death in patients with PAD.2, 1921
The CAPRIE trial compared the efficacy of another antiplatelet agent, clopidogrel, against aspirin in patients with PAD.22 Patients with a history of recent ischemic stroke, MI, or symptomatic PAD were randomized to receive either clopidogrel (75 mg/day) or aspirin (325 mg/day) for 1‐3 years (mean follow‐up time, 1.91 years). Study outcomes were the incidence of nonfatal MI, ischemic stroke, hemorrhagic stroke, leg amputation, and vascular deaths. The absolute risk reduction for all patients was 8.7% (95% confidence interval [CI], 0.3%‐16.5%) in favor of clopidogrel over aspirin. Moreover, subgroup analysis in patients with PAD revealed that clopidogrel reduced the risk of a vascular event by 23.8% (95% CI, 8.9%‐36.2%; P = 0.0028) compared with aspirin (Fig. 2). Clopidogrel and aspirin had similar safety profiles, but other studies have revealed bleeding incidence is numerically greater in patients treated with clopidogrel.2224 Although the CAPRIE trial is the only study to date to compare the efficacy of clopidogrel over aspirin in reducing vascular event in patients with PAD, its outcomes underlie the class I ACC/AHA recommendation for clopidogrel (75 mg/day) as an effective alternative to aspirin to reduce the risk of MI, stroke, or death in patients with PAD.2
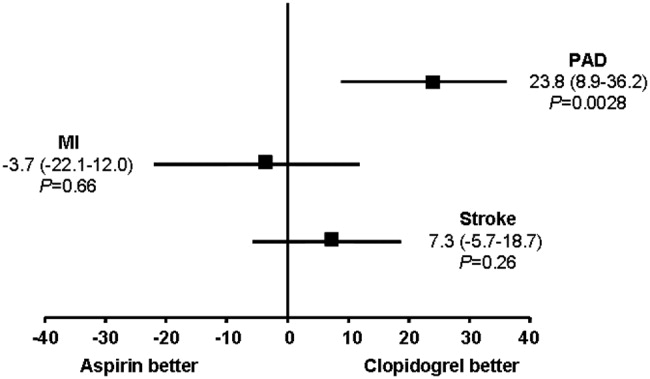
CONCLUSIONS
Despite the availability of accurate, practical, and inexpensive diagnostic testing, PAD remains underdiagnosed and undertreated. Early detection of PAD and subsequent intervention by hospitalists are important because peripheral arterial disease is strongly associated with an increased risk of mortality and morbidity from adverse vascular events. The ACC/AHA recommends screening for asymptomatic patients at risk for this disease so that therapies that reduce the risk of an MI, stroke, or vascular death can be administered immediately. Antiplatelet agents reduce the risk of adverse vascular events in patients with PAD. The use of aspirin or clopidogrel is recommended in this cohort of patients. However, further study is necessary to determine the efficacy and safety of combination therapy with aspirin and clopidogrel in patients with PAD. It is also important to note that coordination of care between hospitalists and cardiologists is critical in the management of patients with this disease. However, the appropriate handoff of patients between these 2 groups of physicians depends on the local expertise and support structure of these health care professionals. Thus, an interdisciplinary approach utilizing guideline‐based patient care will allow hospitalists to refer patients accordingly, ensuring optimal outcomes in patients with PAD.
- ,,, et al.Prevention of Atherothrombotic Disease Network. Critical issues in peripheral arterial disease detection and management: a call to action.Arch Intern Med.2003;163:884–892.
- ,,, et al.ACC/AHA 2005 Practice Guidelines for the management of patients with peripheral arterial disease (lower extremity, renal, mesenteric, and abdominal aortic).Circulation.2006;113:e463–e654.
- ,,,,,.Peripheral arterial disease in the elderly: the Rotterdam Study.Arterioscler Thromb Vasc Biol.1998;18:185–192.
- ,,, et al.Peripheral arterial disease detection, awareness, and treatment in primary care.JAMA.2001;286:1317–1324.
- ,.Prevalence of and risk factors for peripheral arterial disease in the United States: Results from the National Health and Nutrition Examination Survey, 1999‐2000.Circulation.2004;110:738–743.
- ,,, et al.Mortality over a period of 10 years in patients with peripheral arterial disease.N Engl J Med.1992;326:381–386.
- ,.Vascular event rates in patients with atherosclerotic cerebrovascular disease.Arch Neurol.1992;49:857–863.
- ,,, et al.;REACH Registry Investigators. One‐year cardiovascular event rates in outpatients with atherothrombosis.JAMA.2007;297:1197–1206.
- ,,, et al.Diagnosis and treatment of chronic arterial insufficiency of the lower extremities: A critical review.Circulation.1996;94:3026–3049.
- ,.Management of peripheral arterial disease (PAD): TASC Working Group. TransAtlantic Inter‐Society Consensus (TASC).J Vasc Surg.2000:31(1Pt 2):S1–S296.
- ,.Physical examination and chronic lower‐extremity ischemia.Arch Intern Med.1998;158:1357–1364.
- .Medical treatment of peripheral artery disease and claudication.N Engl J Med.2001;344:1608–1621.
- ,,, et al.Ankle‐arm index as a marker of atherosclerosis in the Cardiovascular Health Study. Cardiovascular Heart Study (CHS) Collaborative Research Group.Circulation.1993;88:837–845.
- ,,,.Morbidity and mortality in hypertensive adults with a low ankle/arm blood pressure index.JAMA.1993;270:487–489.
- ,,, et al.Ankle‐arm index as a predictor of cardiovascular disease and mortality in the Cardiovascular Health Study. The Cardiovascular Health Study Group.Arterioscler Thromb Vasc Biol.1999;19:538–545.
- ,,,,,;Framingham Study. The ankle‐brachial index in the elderly and risk of stroke, coronary disease, and death: the Framingham Study.Arch Intern Med.2003;163:1939–1942.
- Antiplatelet Trialists' Collaboration.Collaborative overview of randomized trials of antiplatelet therapy—1: Prevention of death, myocardial infarction, and stroke by prolonged antiplatelet therapy in various categories of patients.BMJ.1994;308:81–106.
- Antithrombotic Trialists' Collaboration.Collaborative meta‐analysis of randomized trials of antiplatelet therapy for prevention of death, myocardial infarction, and stroke in high risk patients.BMJ.2002;324:71–86.
- The Medical Research Council's General Practice Research Framework.Thrombosis prevention trial: randomised trial of low‐intensity oral anticoagulation with warfarin and low‐dose aspirin in the primary prevention of ischemic heart disease in men at increased risk.Lancet.1998;351:233–241.
- ,,, for theHOT Study Group.Effects of intensive blood pressure lowering and low‐dose aspirin in patients with hypertension: principal results of the Hypertension Optimal Treatment (HOT) randomised trial.Lancet1998;280:1930–1935.
- Collaborative Group of the Primary Prevention Project (PPP).Low‐dose aspirin and vitamin E in people at cardiovascular risk: a randomized trial in general practice.Lancet.2001;357:89–95.
- CAPRIE Steering Committee.A randomized, blinded, trial of clopidogrel versus aspirin in patients at risk of ischemic events (CAPRIE).Lancet.1996;348:1329–1339.
- ,,; for theCHARISMA Investigators.Clopidogrel and aspirin versus aspirin alone for the prevention of atherothrombotic events.N Engl J Med.2006;354:1706–1717.
- ,,; on behalf of theMATCH investigators.Aspirin and clopidogrel compared with clopidogrel alone after ischaemic stroke or transient ischaemic attack in high‐risk patients (MATCH): randomised, double‐blind, placebo‐controlled trial.Lancet.2004;364:331–337.
Peripheral arterial disease (PAD) is defined by the presence of stenosis or occlusion in peripheral arterial beds.1, 2 Based on large population‐based screening surveys, the prevalence of this disease ranges between 5.5% and 26.7% and is dependent on age, atherothrombotic risk factors, and the coexistence of other atherothrombotic diseases.35 Symptoms of PAD include mild to intermittent claudication, ischemic rest pain, and tissue loss.2 Disease severity is classified according to either Fontaine's stages or Rutherford categories. These categorization schema have value in improving communication between physicians, which is important in ensuring continuity of care between the inpatient and outpatient settings (Table 1).2
| Stage | Fontaine | Rutherford | ||
|---|---|---|---|---|
| Clinical | Grade | Category | Clinical | |
| ||||
| I | Asymptomatic | 0 | 0 | Asymptomatic |
| IIa | Mild claudication | I | 1 | Mild claudication |
| IIb | Moderate‐severe claudication | I | 2 | Moderate claudication |
| III | Ischemic rest pain | I | 3 | Severe claudication |
| IV | Ulceration or gangrene | II | 4 | Ischemic rest pain |
| III | 5 | Minor tissue loss | ||
| IV | 6 | Ulceration or gangrene | ||
Patients with PAD are at increased risk of dying from or experiencing a cardiovascular event.68 Among patients diagnosed with PAD, coronary artery disease (CAD), or cerebrovascular disease (CVD), those with PAD have the highest 1‐year rate of cardiovascular death, MI, stroke, or vascular‐related hospitalization (Fig. 1).8 This risk is attributable in part to the high rate of association of PAD with other atherothrombotic diseases. The Reduction of Atherothrombosis for Continued Health (REACH) Registry found that approximately 60% of participants with documented PAD have polyvascular disease, defined by the coexistence of CAD and/or CVD. In comparison, 25% of participants with CAD and 40% of participants with CVD have polyvascular disease.8 Thus, PAD can be considered a powerful indicator of systemic atherothrombotic disease and a predictor of cardiovascular and cerebrovascular morbidity and mortality.1
Unfortunately, asymptomatic PAD is more common than its symptomatic counterpart.3 In addition, symptomatic patients often fail to notify their physicians about PAD‐associated symptoms because they attribute them to aging.3 As a result, this disease is underdiagnosed and undertreated.1 Accordingly, several medical associations and physician task forces have called for an increase in screening for PAD in at‐risk populations that include: patients older than 70, patients older than 50 who have concomitant atherothrombotic risk factors, and patients with atherothrombotic disease of single or multiple vascular beds.1, 9 In many cases hospitalists encounter patients at high‐risk for PAD whose DRG for admission might be unrelated to this disease. Nonetheless, hospitalists have the opportunity to improve patient outcomes by being capable of screening for undiagnosed PAD and initiating appropriate interventions to reduce the risk of life‐threatening cardiovascular events.
DIAGNOSIS
Peripheral arterial disease can be diagnosed by either noninvasive or invasive methods. The ankle‐to‐brachial index (ABI) is an accurate, practical, inexpensive, and noninvasive method for detecting PAD.1 The sensitivity of ABI in detecting PAD is 95% with 99% specificity,10 which makes the method superior to other indicators (eg, absence of a pedal pulse, presence of a femoral arterial bruit, slow venous filling, or cold/abnormally colored skin) assessed during a physical examination.11 Under normal conditions, the systolic pressure at the ankle should be equal to or greater than that recorded from the upper arm. As PAD narrows arteries, the systolic pressure decreases at sites distal to the area of arterial narrowing. A resting ABI is quantified by taking 2 readings each of ankle and brachial blood pressures with a handheld Doppler device while the patient is supine and dividing the highest ankle systolic pressure by the highest brachial pressure.12
An ABI between 0.9 and 1.30 is considered normal. Ratios between 0.7 and 0.89 indicate mild PAD, 0.4 and 0.69 moderate PAD, and an ABI 0.4 severe PAD when patients are more likely to have ischemic pain when at rest. An ABI > 1.3 usually indicates the presence of noncompressible vessels, which can be common in the elderly and patients with diabetes mellitus who have calcification of the distal arteries.1, 2 The ABI is also inversely related to the number of atherosclerotic risk factors and the risk of adverse cardiovascular events and death.6, 1316 To identify individuals with suspected or asymptomatic lower‐extremity PAD, ABI has a class I recommendation from the American College of Cardiology and American Heart Association (ACC/AHA) for patients who present with leg symptoms, who are 70 years and older, or who are 50 years and older with a history of smoking or diabetes.2 This enables physicians to make therapeutic interventions to reduce the risk of adverse vascular events in these patient cohorts.
Additional detection methods for PAD include measuring the ABI before and after exercise on a treadmill, if the patient is ambulatory, or exercise by performing 50 repetitions of raising the heels maximally off the floor, if the patient is not ambulatory. These tests determine the extent of claudication.2 Duplex ultrasound is used to establish the location and severity of stenosis and to follow PAD progression.2
Invasive evaluations for PAD are used primarily to confirm an initial diagnosis of PAD and assess its severity. These methods include a conventional angiogram, which is the most readily available and widely used technique for defining arterial stenosis. Magnetic resonance (MR) angiography with gadolinium and computed tomographic (CT) angiography are used to determine the location and degree of stenosis. Both MR and CT angiography have advantages and disadvantages but are considered interchangeable with one another in patients with contraindications to either method (Table 2).2
| Diagostic method | Benefits | Limitations |
|---|---|---|
| ||
| Magnetic resonance angiography (MRA) | Useful to assess PAD anatomy and presence of significant stenosis | Tends to overestimate degree of stenosis |
| Useful to select patients who are candidates for endovascular of surgical revascularization | May be inaccurate in arteries treated with metal stents | |
| Cannot be used in patients with contraindication to magnetic resonance technique | ||
| Computed tomographic angiography (CTA) | Useful to assess PAD anatomy and presence of significant stenosis | Single‐detector CT lacks accuracy to detect stenoses |
| Useful to select patients who are candidates for endovascular or surgical revascularization | Spatial Resolution lower than digital subtraction angiography | |
| Helpful to provide associated soft‐tissue diagnostic information that may be associated with PAD | Venous opacification can obscure arterial filling | |
| Patients with contraindications to MRA | Asymmetric opacification of legs may obscure arterial phase in some vessels | |
| Metal clips, stents, and prostheses do not cause significant CTA artifacts | Accuracy and effectiveness not as well determined as MRA | |
| Scan times are significantly faster | Treatment plans based on CTA have not been compared to those of catheter angiography | |
| Requires contrast and radiation | ||
| Use may be limited in individuals with renal dysfunction | ||
ANTIPLATELET THERAPY FOR REDUCTION OF VASCULAR EVENTS
Hospitalists utilize a wide array of therapies to treat and manage PAD. Acute complications of PAD may require interventions to prevent tissue loss or infection, revascularization procedures, or surgical amputation. Treatment of mild to moderate PAD focuses on atherothrombotic risk factor management, exercise therapy to improve limb function, and interventions to reduce the risk of adverse vascular events.2, 9 The remainder of this report focuses on the role of antiplatelet therapy (eg, aspirin and thienopyridines) in reducing the risk of vascular events in patients with PAD.
The Antiplatelet Trialists' Collaboration performed an overview analysis of randomized trials conducted prior to 1990 in order to determine the association of prolonged antiplatelet therapy with the occurrence of major vascular events. As a whole, therapies thought to act through inhibition of platelet aggregation, adhesion, or both reduced the incidence of vascular events by 33% in patients with PAD and those at high risk, and by 25% in all patient groups. Antiplatelet agents were also well tolerated; the absolute risk of fatal or nonmajor hemorrhage was low.17
A similar meta‐analysis was conducted of antiplatelet therapies in high‐risk patients with atherothrombosis by the Antithrombotic Trialists' Collaboration. Antiplatelet therapies taken together reduced the odds of patients experiencing vascular events by 22% (SE = 2%) across all trials and 23% (SE = 8%) in patients with PAD.18 Similar to the Antiplatelet Trialists' Collaboration study, the absolute risk of major and minor bleeding was low compared to the benefits of antiplatelet therapy.18 The results of these studies provide supporting evidence for the ACC/AHA class I recommendation for the use of antiplatelet therapy to reduce the risk of MI, stroke, or vascular death in patients with PAD.
The Antithrombotic Trialists' Collaboration also examined the risk reduction associated with a specific antiplatelet agent, aspirin. All doses of aspirin (75‐150, 160‐325, and 500‐1500 mg/day) reduced the odds by 23% (SE = 2%); high doses were no more effective than medium or low doses.18 Although the effects of aspirin was not analyzed in a subgroup analysis of patients with PAD, this study and others support the ACC/AHA class I recommendations for the use of aspirin to reduce the risk of MI, stroke, or vascular death in patients with PAD.2, 1921
The CAPRIE trial compared the efficacy of another antiplatelet agent, clopidogrel, against aspirin in patients with PAD.22 Patients with a history of recent ischemic stroke, MI, or symptomatic PAD were randomized to receive either clopidogrel (75 mg/day) or aspirin (325 mg/day) for 1‐3 years (mean follow‐up time, 1.91 years). Study outcomes were the incidence of nonfatal MI, ischemic stroke, hemorrhagic stroke, leg amputation, and vascular deaths. The absolute risk reduction for all patients was 8.7% (95% confidence interval [CI], 0.3%‐16.5%) in favor of clopidogrel over aspirin. Moreover, subgroup analysis in patients with PAD revealed that clopidogrel reduced the risk of a vascular event by 23.8% (95% CI, 8.9%‐36.2%; P = 0.0028) compared with aspirin (Fig. 2). Clopidogrel and aspirin had similar safety profiles, but other studies have revealed bleeding incidence is numerically greater in patients treated with clopidogrel.2224 Although the CAPRIE trial is the only study to date to compare the efficacy of clopidogrel over aspirin in reducing vascular event in patients with PAD, its outcomes underlie the class I ACC/AHA recommendation for clopidogrel (75 mg/day) as an effective alternative to aspirin to reduce the risk of MI, stroke, or death in patients with PAD.2
CONCLUSIONS
Despite the availability of accurate, practical, and inexpensive diagnostic testing, PAD remains underdiagnosed and undertreated. Early detection of PAD and subsequent intervention by hospitalists are important because peripheral arterial disease is strongly associated with an increased risk of mortality and morbidity from adverse vascular events. The ACC/AHA recommends screening for asymptomatic patients at risk for this disease so that therapies that reduce the risk of an MI, stroke, or vascular death can be administered immediately. Antiplatelet agents reduce the risk of adverse vascular events in patients with PAD. The use of aspirin or clopidogrel is recommended in this cohort of patients. However, further study is necessary to determine the efficacy and safety of combination therapy with aspirin and clopidogrel in patients with PAD. It is also important to note that coordination of care between hospitalists and cardiologists is critical in the management of patients with this disease. However, the appropriate handoff of patients between these 2 groups of physicians depends on the local expertise and support structure of these health care professionals. Thus, an interdisciplinary approach utilizing guideline‐based patient care will allow hospitalists to refer patients accordingly, ensuring optimal outcomes in patients with PAD.
- ,,, et al.Prevention of Atherothrombotic Disease Network. Critical issues in peripheral arterial disease detection and management: a call to action.Arch Intern Med.2003;163:884–892.
- ,,, et al.ACC/AHA 2005 Practice Guidelines for the management of patients with peripheral arterial disease (lower extremity, renal, mesenteric, and abdominal aortic).Circulation.2006;113:e463–e654.
- ,,,,,.Peripheral arterial disease in the elderly: the Rotterdam Study.Arterioscler Thromb Vasc Biol.1998;18:185–192.
- ,,, et al.Peripheral arterial disease detection, awareness, and treatment in primary care.JAMA.2001;286:1317–1324.
- ,.Prevalence of and risk factors for peripheral arterial disease in the United States: Results from the National Health and Nutrition Examination Survey, 1999‐2000.Circulation.2004;110:738–743.
- ,,, et al.Mortality over a period of 10 years in patients with peripheral arterial disease.N Engl J Med.1992;326:381–386.
- ,.Vascular event rates in patients with atherosclerotic cerebrovascular disease.Arch Neurol.1992;49:857–863.
- ,,, et al.;REACH Registry Investigators. One‐year cardiovascular event rates in outpatients with atherothrombosis.JAMA.2007;297:1197–1206.
- ,,, et al.Diagnosis and treatment of chronic arterial insufficiency of the lower extremities: A critical review.Circulation.1996;94:3026–3049.
- ,.Management of peripheral arterial disease (PAD): TASC Working Group. TransAtlantic Inter‐Society Consensus (TASC).J Vasc Surg.2000:31(1Pt 2):S1–S296.
- ,.Physical examination and chronic lower‐extremity ischemia.Arch Intern Med.1998;158:1357–1364.
- .Medical treatment of peripheral artery disease and claudication.N Engl J Med.2001;344:1608–1621.
- ,,, et al.Ankle‐arm index as a marker of atherosclerosis in the Cardiovascular Health Study. Cardiovascular Heart Study (CHS) Collaborative Research Group.Circulation.1993;88:837–845.
- ,,,.Morbidity and mortality in hypertensive adults with a low ankle/arm blood pressure index.JAMA.1993;270:487–489.
- ,,, et al.Ankle‐arm index as a predictor of cardiovascular disease and mortality in the Cardiovascular Health Study. The Cardiovascular Health Study Group.Arterioscler Thromb Vasc Biol.1999;19:538–545.
- ,,,,,;Framingham Study. The ankle‐brachial index in the elderly and risk of stroke, coronary disease, and death: the Framingham Study.Arch Intern Med.2003;163:1939–1942.
- Antiplatelet Trialists' Collaboration.Collaborative overview of randomized trials of antiplatelet therapy—1: Prevention of death, myocardial infarction, and stroke by prolonged antiplatelet therapy in various categories of patients.BMJ.1994;308:81–106.
- Antithrombotic Trialists' Collaboration.Collaborative meta‐analysis of randomized trials of antiplatelet therapy for prevention of death, myocardial infarction, and stroke in high risk patients.BMJ.2002;324:71–86.
- The Medical Research Council's General Practice Research Framework.Thrombosis prevention trial: randomised trial of low‐intensity oral anticoagulation with warfarin and low‐dose aspirin in the primary prevention of ischemic heart disease in men at increased risk.Lancet.1998;351:233–241.
- ,,, for theHOT Study Group.Effects of intensive blood pressure lowering and low‐dose aspirin in patients with hypertension: principal results of the Hypertension Optimal Treatment (HOT) randomised trial.Lancet1998;280:1930–1935.
- Collaborative Group of the Primary Prevention Project (PPP).Low‐dose aspirin and vitamin E in people at cardiovascular risk: a randomized trial in general practice.Lancet.2001;357:89–95.
- CAPRIE Steering Committee.A randomized, blinded, trial of clopidogrel versus aspirin in patients at risk of ischemic events (CAPRIE).Lancet.1996;348:1329–1339.
- ,,; for theCHARISMA Investigators.Clopidogrel and aspirin versus aspirin alone for the prevention of atherothrombotic events.N Engl J Med.2006;354:1706–1717.
- ,,; on behalf of theMATCH investigators.Aspirin and clopidogrel compared with clopidogrel alone after ischaemic stroke or transient ischaemic attack in high‐risk patients (MATCH): randomised, double‐blind, placebo‐controlled trial.Lancet.2004;364:331–337.
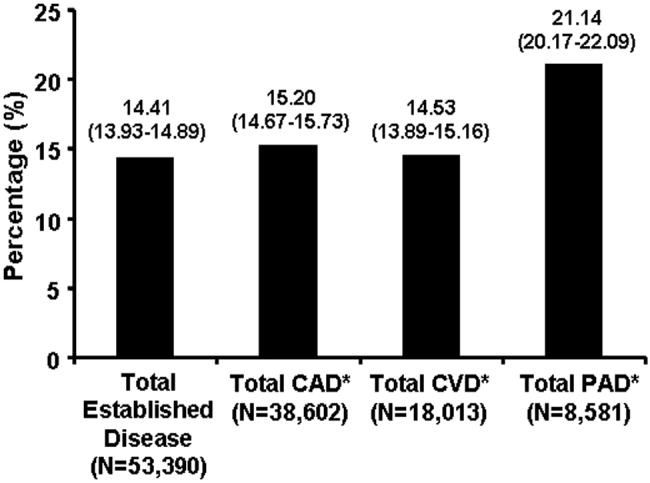
Rules of Engagement: Stroke
Stroke is the leading cause of disability and the third leading cause of death in the United States.1, 2 Each year approximately 700,000 strokes occur, 88% of which are considered ischemic; they predominately arise from atherothrombotic events in large or small cerebral vessels. Moreover, approximately 200,000 of these events are classified as recurrent.1 Patients who have had a stroke frequently also have coronary artery disease (CAD) and/or peripheral artery disease (PAD), putting them at high risk of adverse vascular events such as myocardial infarction (MI) or sudden vascular death.35 Hospitalists initiate and coordinate aggressive and rapid interventions in the acute care setting in order to minimize stroke progression and thus optimize outcomes. They also initiate long‐term treatments to prevent recurrence and secondary vascular events in the outpatient setting. Thus, the treatment plan developed by the hospitalist on admission is as important as the one created on discharge.
The hospitalist plays a central role in managing stroke. Prior to having an event, patients are at risk. The goal of clinical management is prevention. This is mainly focused on risk factor reduction and aspirin therapy. Outpatient medical providers direct this care. Once a stroke occurs and the victim is admitted to the hospital, the hospitalist becomes this patient's medical care coordinator. In the very acute phase, the goal of management is optimizing outcomes by restoring perfusion to ischemic tissue and minimizing injury progression. There are a number of interventions available to the hospitalist. If patients present within 3 hours of ictus, they may qualify for IV thrombolytic therapy and if within 6 hours for intra‐arterial therapy. If later, aspirin can have beneficial effects on outcomes. Also during this time, it is important to maintain adequate systemic perfusion, oxygenation/ventilation, cardiovascular function, and, importantly, close clinical monitoring.
STROKE MORTALITY
Stroke is a deadly diseaseas deadly as many malignancies. Most patients die of complications of vascular disease (eg, cerebrovascular, cardiovascular, and peripheral vascular diseases). The Oxfordshire Community Stroke Project and Perth Community Stroke Study has indicated that at least 50% of patients die within 5 years of a first‐time acute ischemic or hemorrhagic stroke. The highest risk of death occurs during the first year, with a mortality rate ranging between 31% and 36.5% (95% confidence interval [CI], 27%34% and 31.5%41.4%, respectively).6, 7 Moreover, the risk of death within 30 days after stroke was approximately 20%. The annual risk of death for patients who survived 1 year was 7% and 10% according to the Oxfordshire and Perth studies, respectively, which was approximately 2‐fold higher than that for stroke‐free patients of the same age and sex.6, 7
The proportion of death caused by stroke, recurrent stroke, cardiovascular events, or nonvascular events changes over time (Fig. 1). The Perth study showed that the predominant causes of death within the first 30 days were complications from the incident stroke and, to a lesser degree, recurrent stroke. Over time, cardiovascular events (eg, myocardial infarction, ruptured aortic aneurysms, PAD) become the most common cause of mortality in patients who have had a stroke. However, the risk of death from a recurrent stroke only diminishes slightly with time.7 This trend is consistent with the findings of the Oxfordshire study and the Northern Manhattan Stroke Study, which focused on long‐term survival after first‐ever ischemic stroke.6, 8 Thus, the short‐term goals of treatment implemented by hospitalists are to ensure survival and recovery from the index stroke, and the long‐term goals are to protect against recurrent stroke or secondary vascular events.

MANAGEMENT OF ACUTE ISCHEMIC STROKE
Stroke is no longer an untreatable disease. The introduction of thrombolytic therapy has provided an opportunity for medical providers to significantly improve short‐ and long‐term survival rates and functional outcomes of patients. Most ischemic strokes are caused by thrombotic arterial occlusions. Hence, thrombolytic therapy has been tested and approved for use in patients with acute ischemic stroke.9 The efficacy and safety of the thrombolytic agent, recombinant tissue plasminogen activator (rtPA), were demonstrated in the landmark National Institute of Neurological Disorders and Stroke (NINDS) rtPA Stroke Study.
When compared with patients who received placebo, the odds of a favorable treatment outcome increased by at least 30% in those who received rtPA within 3 hours of the onset of symptoms of an acute ischemic stroke. This benefit was sustained for 612 months.10, 11 Patients who received rtPA were at an increased risk for intracerebral hemorrhage, but this did not translate to an increased risk of death.10 Currently, this thrombolytic agent has a class I recommendation from the American Heart Association and American Stroke Association (AHA/ASA) for its administration within 3 hours of onset of ischemic stroke symptoms in patients who have no sign or history of subarachnoid hemorrhage and who meet the other 21 criteria based on those used in the NINDS study.9
Patients who arrive at the hospital 36 hours after symptom onset or those who have contraindications for IV rtPA may benefit from intra‐arterial administration of thrombolytic agents.12 However, there is no consensus on the optimal dose that should be delivered by intra‐arterial administration.13 In addition, this course of treatment requires rapid access to cerebral angiography and a qualified interventionalist, both of which may not be available to all hospitalists.9
If a patient presents beyond 6 hours, the hospitalist may initiate aspirin therapy, which has been shown to improve outcomes following acute stroke if therapy is begun within 48 hours. A planned meta‐analysis of approximately 40,000 patients with suspected ischemic stroke demonstrated that aspirin therapy proportionally reduces the risk of recurrent stroke and mortality from recurrent stroke or any other cause by 11% 3%. This benefit was apparent as early as 06 hours and as late as 2548 hours following stroke onset (Fig. 2), with only a slight increase in the risk of hemorrhagic stroke.14 The studies analyzed in the meta‐analysis underlie the AHA/ASA recommendations that aspirin (325 mg) be administered within 2448 hours of stroke onset or within 24 hours after thrombolytic therapy for the early management of ischemic stroke in adults.9 By contrast, heparin therapy is not a recommended treatment for acute ischemic stroke; its clinical benefits do not outweigh the risk of bleeding complications.9 In addition, clinical trial data do not support the use of heparin for cardioembolic stroke.13
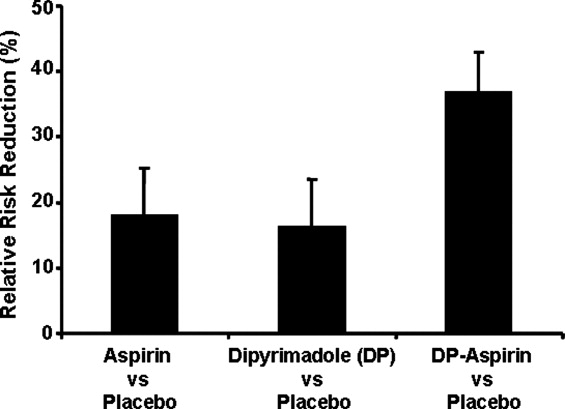
The AHA/ASA has made several recommendations to enhance outcomes and to prevent complications after an acute ischemic stroke. These include the stabilization and management of blood pressure (BP) and blood glucose levels and protection against deep vein thrombosis.9 Hypertension in the peristroke period is expected and is generally not treated. The rationale is that cerebral blood flow (CBF) is autoregulated in healthy brain tissue. As such, CBF remains constant at 50 cc/100 g of tissue per minute over a wide range of mean arterial pressures: 60150 mm Hg. However, in ischemic brain regions, autoregulation is lost, resulting in a pressure passive perfusion state (ie, local CBF is dependent on systemic blood pressure). As an injured brain is hypermetabolic, CBF adequate to meet its needs is dependent on a higher than normal blood pressure. Thus, reduction of high BP might worsen ischemia.
From a clinical practice standpoint, patients' outpatient antihypertensive medications are frequently held, with no additional treatment given for blood pressure elevation. The exception is, should the patient become encephalopathic, blood pressure may need to be reduced, as this may represent a state of hypertensive encephalopathy or luxury perfusion. There are no data indicating the use of a specific hypertensive agent in reducing blood pressure in such a setting. The AHA/ASA guidelines for early management of ischemic stroke recommend the use of antihypertensive agents on a case‐by‐case basis; although as recommended by consensus, there may be IV administration of labetalol or nicardipine if there is evidence of hypertensive encephalopathy, the diastolic BP is >120 mm Hg or the systolic BP is >220 mm Hg.9
Blood glucose should be kept stable, between 80 and 120 mg/dL. This can be achieved with either an oral hypoglycemic agent or sliding‐scale insulin regimen. Venous thrombus formation after stroke is a very serious concern as it can result in pulmonary embolism. As soon as possible, sequential compression devices and agents such as unfractionated heparin, low‐molecular‐weight heparin (ie, enoxaparin, dalteparin), fondaparinux, warfarin, or aspirin should be initiated.9
Hyperthermia has been shown to worsen functional outcome following stroke.15 Thus, maintenance of normal body temperature is recommended. This can be achieved with acetaminophen. Causes other than acute brain injury such as infection need to be investigated and treated as appropriate. Induced hypothermia has long been considered a potential therapy for improving outcome from acute stroke. Although preclinical studies in animals support induced hypothermia as a beneficial approach, there has not yet been a successful human clinical trial demonstrating efficacy. In addition, hypotonic intravenous solutions have the potential to worsen cerebral edema. Thus, normal saline without dextrose may be preferable. However, conclusive evidence supporting the use of hypertonic and colloid solutions remains insufficient.
Other important issues are gastrointestinal prophylaxis, early mobilization, and nutrition. The nutritional needs of acute brain‐injured patients cannot be overemphasized. Caloric intake should be maintained at 140% to compensate for the hypermetabolic state of the brain and to avoid weight loss. Patients should not be fed or treated with oral medications until a speech and swallow study is conducted to determine the extent of dysphagia and dysarthria or aphasia.9 However, in general, patients who are alert can usually be administered their oral medications, but only after a swallow evaluation has been passed.
ANTIPLATELET THERAPY FOR STROKE PREVENTION
Primary Stroke Prevention
Aspirin has been shown to be efficacious in preventing first stroke in women. The evidence supporting aspirin use in women for primary prevention of stroke is from the Women's Health Study, which showed that the occurrence of first stroke could be reduced in women older than 45 years old by taking 100 mg of aspirin every other day as compared with placebo.16 The AHA/ASA recommends aspirin therapy for primary ischemic stroke prevention in women whose risk of stroke outweighs the risk of aspirin‐related bleeding. Unfortunately, there are not enough supporting data to recommend its use in men for primary stroke prevention.17
Secondary Stroke Prevention
Aspirin, clopidogrel, and the extended‐release dipyridamole‐aspirin combination are the most commonly used antiplatelet agents for secondary stroke prevention. Ticlopidine is indicated for prevention of recurrent stroke18 but has fallen out of use because of safety concerns, and dipyridamole confers little cardiovascular protection compared with the other antiplatelet agents. Aspirin is widely regarded as the first‐line agent for preventing recurrent stroke. The optimal dose of aspirin for reducing the risk of secondary stroke is uncertain. However, most practitioners use doses between 75 and 325 mg. The numerous studies supporting this have been summarized by Hennekens et al.19 The Antiplatelet Trialists Collaboration demonstrated that lower‐dose aspirin (75150 mg) is effective and can reduce secondary stroke by 25%.20 The European Stroke Prevention Study 2 (ESPS‐2) showed an 18% reduction in the risk of a recurrent stroke with only 50 mg of aspirin.21 The AHA/ASA recommends 50350 mg/day aspirin to reduce the risk of recurrent stroke and or vascular events in patients with ischemic stroke.5
In the CAPRIE study, clopidogrel was shown to be effective, but not superior to aspirin, in the reduction of recurrent stroke.22 Taking their similar safety and efficacy profiles into account and aspirin's low cost, the AHA/ASA concluded that clopidogrel is an acceptable but not preferable alternative to aspirin therapy for the reduction of recurrent strokes.5 The combination of clopidogrel and aspirin reduces secondary vascular events in high‐risk cardiovascular patients and can be considered in high‐risk stroke patients. The CHARISMA study revealed that a combination of clopidogrel and aspirin has benefit over aspirin alone in secondary prevention of a combined end point of stroke, MI, and CV death.23 However, this same study also showed that aspirin alone is superior to the combination in primary prevention of this same end point. Subgroup analysis demonstrated that the combination of clopidogrel and aspirin provided a significant benefit in further reducing nonfatal strokes over aspirin alone (P .05) and a trend toward reducing all ischemic strokes (P .10).24 The MATCH study showed no evidence that a combination of clopidogrel and aspirin was superior to aspirin alone in patients with recent TIA or stroke.25, 26 However, the impact of aspirin resistance in the MATCH study population was not quantified but may have affected the study results, as 80% of the patients were already taking aspirin on enrollment.24 Of significance is the finding in both CHARISMA and MATCH that the addition of aspirin to clopidogrel therapy conveys a higher risk for bleeding.26 Combining clopidogrel with aspirin therapy is not routinely recommended by the AHA/ASA to reduce the risk of recurrent stroke.5
The ESPS‐2 trial demonstrated that the combination of extended‐release (ER) dipyridamole and aspirin was superior to aspirin alone for reducing the risk of recurrent stroke in patients with ischemic stroke.21 However, the combination of ER dipyridamole and aspirin was not different from placebo in preventing myocardial infarction or CV death. Thus, the AHA/ASA recommends that the combination of ER‐dipyridamole/aspirin can be considered for secondary stroke prevention.5
LONG‐TERM MANAGEMENT FOR SECONDARY PREVENTION OF NONSTROKE VASCULAR EVENTS
In the subacute period, the hospitalist transitions the patient from acute to chronic care. Here, the goals are optimizing functional outcome and preventing recurrence. Still, during the first few days after ictus, the patient remains at risk for recurrent stroke, cerebral edema, and hemorrhagic transformation, so continued hospitalization is required. By 57 days later, the most significant risk period has elapsed. Physical and occupational therapy are initiated while patients are still hospitalized. Patient and family education about stroke and related diseases is done. A rational and comprehensive plan to reduce risk of secondary stroke is critical. This plan must include diet, tobacco, diabetes, blood pressure and excessive weight interventions. These may require care from a specialized team with members such as dieticians, exercise therapists, and tobacco interventionalists. Especially critical is instituting a discharge plan that highlights continued control of all modifiable risk factors and antiplatelet therapy. Finally, coordination with the patient's outpatient provider is paramount.
There is a developing awareness of the importance of the overlapping syndrome of combined stroke and cardiovascular and peripheral vascular risk. In leading clinical trials, the coexistence of coronary artery disease and cerebral artery disease is as high as 40%; thus, patients who have had a stroke are at high risk for other vascular events such as MI, critical limb ischemia, or vascular death. The AHA/ASA scientific statement on coronary risk evaluation recommends testing for CAD after ischemic stroke, as it has been suggested that asymptomatic CAD is highly prevalent among these patients.4 Diagnostic testing for CAD should be conducted outside the acute stroke setting and optimized based on stroke subtype and the health status of individual patients.4 Testing for PAD should also be done in patients with ischemic stroke when not otherwise contraindicated.27 Thus, the hospitalist should determine the stroke patient's risk of having coexisting CAD and/or PAD. If significant, then appropriate follow‐up testing either during the hospitalization or after discharge should be arranged.
To prevent secondary vascular events including stroke, effective management of common risk factors shared by stroke, CAD, and PAD is recommended. Long‐term treatment goals include control of hypertension, lipid and glucose management, smoking cessation, weight control, and integration of physical activity.4, 5, 27 Except for blood pressure control, many of these should be initiated while still in the hospital. Acute hospitalization is also an opportunity for patient and family education regarding risk factor reduction.
Antiplatelet therapies are also recommended and are associated with an absolute risk reduction of serious vascular events of 36 6 per 1000 persons with previous stroke or transient ischemic attack.20 Aspirin use in patients at high risk for atherothrombotic events has been shown to be effective in reducing the risk of myocardial infarction and other vascular events.20 The AHA‐recommended dose of aspirin for preventing sudden coronary syndrome is 81 mg/day or higher. Clopidogrel has been shown to be effective in reducing the risk of recurrent sudden coronary artery syndrome and progression of peripheral vascular disease.22 When combined with aspirin, clopidogrel has been shown to reduce recurrent sudden coronary syndrome.28, 29
CONCLUSIONS
The hospitalist is involved in the spectrum of stroke care, from management of stroke in the acute care setting to establishing long‐term treatments for prevention of secondary vascular events. As such, hospitalists can significantly affect the lives of patients with ischemic stroke. Current treatment guidelines for stroke recommend aggressive and rapid response in the acute setting. Long‐term treatments focus on risk reduction for recurrent stroke or for other vascular events such as MI or critical limb ischemia. Antiplatelet therapies are a component of long‐term treatments. Current research suggests that antiplatelet agents differ in reducing recurrent strokes versus nonstroke events. Thus, treatments should be based on a patient's individual risk factors for recurrent stroke and/or CAD or PAD. Although hospitalists will transfer care back to outpatient providers, the interventions initiated in the hospital will optimize the patient's future. In many ways, the patient's first step to a better health began when crossing the entrance of the hospital.
- ,,, et al.Heart disease and stroke statistics—2006 update: a report from the American Heart Association statistics committee and stroke statistics subcommittee.Circulation.2006;113:85–151.
- ,,,.Trends in the leading causes of death in the United States, 1970–2002.JAMA.2005;294:1255–1259.
- ,,, et al.One‐year cardiovascular event rates in outpatients with atherothrombosis.JAMA.2007;297:1197–1206.
- ,,, et al.Coronary risk evaluation in patients with transient ischemic attack and ischemic stroke: a scientific statement for healthcare professionals from the Stroke Council and the Council on Clinical Cardiology of the American Heart Association/American Stroke Association.Circulation.2003;108:1278–1290.
- ,,, et al.Guidelines for prevention of stroke in patients with ischemic stroke or transient ischemic attack: A statement for healthcare professionals from the American Heart Association/American Stroke Association.Stroke.2006;37:577–617.
- ,,,,,.Long‐term survival after first‐ever stroke: the Oxfordshire Community Stroke Project.Stroke.1993;24:796–800.
- ,,, et al.Five‐year survival after first‐ever stroke and related prognostic factors in the Perth Community Stroke Study.Stroke.2000;31:2080–2086.
- ,,, et al.Mortality and causes of death after first ischemic stroke: the Northern Manhattan Stroke Study.Neurology.2001;57:2000–2005.
- ,,, et al.Guidelines for the early management of adults with ischemic stroke: A guideline from the American Heart Association/American Stroke Association.Stroke.2007;38:1655–1711.
- NINDS study group.Tissue plasminogen activator for acute ischemic stroke.N Engl J Med.1995;333:1581–1587.
- ,,, et al.Effects of tissue plasminogen activator for acute ischemic stroke at one year.N Engl J Med.1999;340:1781–1787.
- ,,, et al.Intraarterial recombinant tissue plasminogen activator for ischemic stroke: an accelerating dosing regimen.Neurosurgery.2000;47:473–476.
- ,,,,.Antithrombotic and thrombolytic therapy for ischemic stroke: the Seventh ACCP Conference on Antithrombotic and Thrombolytic Therapy.Chest.2004;126:483s–512s.
- ,,, et al.Indications for early aspirin use in acute ischemic stroke: a combined analysis of 40000 randomized patients from the Chinese acute stroke trial and the international stroke trial.Stroke.2000;31:1240–1249.
- ,,, et al.Body temperature in acute stroke: relation to stroke severity, infarct size, mortality, and outcome.Lancet.1996;347:422–425.
- ,,, et al.A randomized trial of low‐dose aspirin in the primary prevention of cardiovascular disease in women.N Engl J Med.2005;352:1293–1304.
- ,,, et al.Primary prevention of ischemic stroke: A guideline from the American Heart Association/American Stroke Association.Circulation.2006;113:873–823.
- ,,, et al.A randomized trial comparing ticlopidine hydrochloride with aspirin for the prevention of stroke in high‐risk patients.N Engl J Med.1989;321:501–517.
- ,,.Aspirin as a therapeutic agent in cardiovascular disease: a statement for healthcare professionals from the American Heart Association.Circulation.1997;96:2751–2753.
- Antithrombotic Trialists' Collaboration.Collaborative meta‐analysis of randomized trials of antiplatelet therapy for prevention of death, myocardial infarction, and stroke in high risk patients.BMJ.2002;324:71–86.
- ,,,,,.European stroke prevention study:2. Dipyridamole and acetylsalicylic acid in the secondary prevention of stroke.J Neurol Sci.1996;143:1–13.
- CAPRIE steering committee.A randomized, blinded, trial of clopidogrel versus aspirin in patients at risk of ischemic events (CAPRIE).Lancet.1996;348:1329–1339.
- ,,, et al.Clopidogrel and aspiring versus aspirin alone for the prevention of atherothrombotic events.N Engl J Med.2006;354:1706–1717.
- ,,, et al.Patients with prior myocardial infarction, stroke, or symptomatic peripheral arterial disease in the CHARISMA trial.J Am Coll Cardiol.2007;49:1982–1988.
- ,,, et al.Aspirin and clopidogrel compared with clopidogrel alone after recent ischemic stroke or transient ischemic attack in high‐risk patients (MATCH): Randomized, double‐blind placebo‐controlled trial.Lancet.2004;364:331–337.
- .Role of aspirin in MATCH.Lancet.2004;364:1661.
- ,,, et al.ACC/AHA 2005 practice guidelines for the management of patients with peripheral arterial disease (lower extremity, renal, mesenteric, and abdominal aortic).Circulation.2006;113:463–654.
- CURE Trial Investigators.Effects of clopidogrel in addition to aspirin in patients with acute coronary syndromes without ST‐segment elevation.N Engl J Med.2001;345:494–502.
- ,,, et al.Effects of pretreatment with clopidogrel and aspirin followed by long‐term therapy in patients undergoing percutaneous coronary intervention: PCI‐CURE study.Lancet.2001;358:527–533.
Stroke is the leading cause of disability and the third leading cause of death in the United States.1, 2 Each year approximately 700,000 strokes occur, 88% of which are considered ischemic; they predominately arise from atherothrombotic events in large or small cerebral vessels. Moreover, approximately 200,000 of these events are classified as recurrent.1 Patients who have had a stroke frequently also have coronary artery disease (CAD) and/or peripheral artery disease (PAD), putting them at high risk of adverse vascular events such as myocardial infarction (MI) or sudden vascular death.35 Hospitalists initiate and coordinate aggressive and rapid interventions in the acute care setting in order to minimize stroke progression and thus optimize outcomes. They also initiate long‐term treatments to prevent recurrence and secondary vascular events in the outpatient setting. Thus, the treatment plan developed by the hospitalist on admission is as important as the one created on discharge.
The hospitalist plays a central role in managing stroke. Prior to having an event, patients are at risk. The goal of clinical management is prevention. This is mainly focused on risk factor reduction and aspirin therapy. Outpatient medical providers direct this care. Once a stroke occurs and the victim is admitted to the hospital, the hospitalist becomes this patient's medical care coordinator. In the very acute phase, the goal of management is optimizing outcomes by restoring perfusion to ischemic tissue and minimizing injury progression. There are a number of interventions available to the hospitalist. If patients present within 3 hours of ictus, they may qualify for IV thrombolytic therapy and if within 6 hours for intra‐arterial therapy. If later, aspirin can have beneficial effects on outcomes. Also during this time, it is important to maintain adequate systemic perfusion, oxygenation/ventilation, cardiovascular function, and, importantly, close clinical monitoring.
STROKE MORTALITY
Stroke is a deadly diseaseas deadly as many malignancies. Most patients die of complications of vascular disease (eg, cerebrovascular, cardiovascular, and peripheral vascular diseases). The Oxfordshire Community Stroke Project and Perth Community Stroke Study has indicated that at least 50% of patients die within 5 years of a first‐time acute ischemic or hemorrhagic stroke. The highest risk of death occurs during the first year, with a mortality rate ranging between 31% and 36.5% (95% confidence interval [CI], 27%34% and 31.5%41.4%, respectively).6, 7 Moreover, the risk of death within 30 days after stroke was approximately 20%. The annual risk of death for patients who survived 1 year was 7% and 10% according to the Oxfordshire and Perth studies, respectively, which was approximately 2‐fold higher than that for stroke‐free patients of the same age and sex.6, 7
The proportion of death caused by stroke, recurrent stroke, cardiovascular events, or nonvascular events changes over time (Fig. 1). The Perth study showed that the predominant causes of death within the first 30 days were complications from the incident stroke and, to a lesser degree, recurrent stroke. Over time, cardiovascular events (eg, myocardial infarction, ruptured aortic aneurysms, PAD) become the most common cause of mortality in patients who have had a stroke. However, the risk of death from a recurrent stroke only diminishes slightly with time.7 This trend is consistent with the findings of the Oxfordshire study and the Northern Manhattan Stroke Study, which focused on long‐term survival after first‐ever ischemic stroke.6, 8 Thus, the short‐term goals of treatment implemented by hospitalists are to ensure survival and recovery from the index stroke, and the long‐term goals are to protect against recurrent stroke or secondary vascular events.
MANAGEMENT OF ACUTE ISCHEMIC STROKE
Stroke is no longer an untreatable disease. The introduction of thrombolytic therapy has provided an opportunity for medical providers to significantly improve short‐ and long‐term survival rates and functional outcomes of patients. Most ischemic strokes are caused by thrombotic arterial occlusions. Hence, thrombolytic therapy has been tested and approved for use in patients with acute ischemic stroke.9 The efficacy and safety of the thrombolytic agent, recombinant tissue plasminogen activator (rtPA), were demonstrated in the landmark National Institute of Neurological Disorders and Stroke (NINDS) rtPA Stroke Study.
When compared with patients who received placebo, the odds of a favorable treatment outcome increased by at least 30% in those who received rtPA within 3 hours of the onset of symptoms of an acute ischemic stroke. This benefit was sustained for 612 months.10, 11 Patients who received rtPA were at an increased risk for intracerebral hemorrhage, but this did not translate to an increased risk of death.10 Currently, this thrombolytic agent has a class I recommendation from the American Heart Association and American Stroke Association (AHA/ASA) for its administration within 3 hours of onset of ischemic stroke symptoms in patients who have no sign or history of subarachnoid hemorrhage and who meet the other 21 criteria based on those used in the NINDS study.9
Patients who arrive at the hospital 36 hours after symptom onset or those who have contraindications for IV rtPA may benefit from intra‐arterial administration of thrombolytic agents.12 However, there is no consensus on the optimal dose that should be delivered by intra‐arterial administration.13 In addition, this course of treatment requires rapid access to cerebral angiography and a qualified interventionalist, both of which may not be available to all hospitalists.9
If a patient presents beyond 6 hours, the hospitalist may initiate aspirin therapy, which has been shown to improve outcomes following acute stroke if therapy is begun within 48 hours. A planned meta‐analysis of approximately 40,000 patients with suspected ischemic stroke demonstrated that aspirin therapy proportionally reduces the risk of recurrent stroke and mortality from recurrent stroke or any other cause by 11% 3%. This benefit was apparent as early as 06 hours and as late as 2548 hours following stroke onset (Fig. 2), with only a slight increase in the risk of hemorrhagic stroke.14 The studies analyzed in the meta‐analysis underlie the AHA/ASA recommendations that aspirin (325 mg) be administered within 2448 hours of stroke onset or within 24 hours after thrombolytic therapy for the early management of ischemic stroke in adults.9 By contrast, heparin therapy is not a recommended treatment for acute ischemic stroke; its clinical benefits do not outweigh the risk of bleeding complications.9 In addition, clinical trial data do not support the use of heparin for cardioembolic stroke.13
The AHA/ASA has made several recommendations to enhance outcomes and to prevent complications after an acute ischemic stroke. These include the stabilization and management of blood pressure (BP) and blood glucose levels and protection against deep vein thrombosis.9 Hypertension in the peristroke period is expected and is generally not treated. The rationale is that cerebral blood flow (CBF) is autoregulated in healthy brain tissue. As such, CBF remains constant at 50 cc/100 g of tissue per minute over a wide range of mean arterial pressures: 60150 mm Hg. However, in ischemic brain regions, autoregulation is lost, resulting in a pressure passive perfusion state (ie, local CBF is dependent on systemic blood pressure). As an injured brain is hypermetabolic, CBF adequate to meet its needs is dependent on a higher than normal blood pressure. Thus, reduction of high BP might worsen ischemia.
From a clinical practice standpoint, patients' outpatient antihypertensive medications are frequently held, with no additional treatment given for blood pressure elevation. The exception is, should the patient become encephalopathic, blood pressure may need to be reduced, as this may represent a state of hypertensive encephalopathy or luxury perfusion. There are no data indicating the use of a specific hypertensive agent in reducing blood pressure in such a setting. The AHA/ASA guidelines for early management of ischemic stroke recommend the use of antihypertensive agents on a case‐by‐case basis; although as recommended by consensus, there may be IV administration of labetalol or nicardipine if there is evidence of hypertensive encephalopathy, the diastolic BP is >120 mm Hg or the systolic BP is >220 mm Hg.9
Blood glucose should be kept stable, between 80 and 120 mg/dL. This can be achieved with either an oral hypoglycemic agent or sliding‐scale insulin regimen. Venous thrombus formation after stroke is a very serious concern as it can result in pulmonary embolism. As soon as possible, sequential compression devices and agents such as unfractionated heparin, low‐molecular‐weight heparin (ie, enoxaparin, dalteparin), fondaparinux, warfarin, or aspirin should be initiated.9
Hyperthermia has been shown to worsen functional outcome following stroke.15 Thus, maintenance of normal body temperature is recommended. This can be achieved with acetaminophen. Causes other than acute brain injury such as infection need to be investigated and treated as appropriate. Induced hypothermia has long been considered a potential therapy for improving outcome from acute stroke. Although preclinical studies in animals support induced hypothermia as a beneficial approach, there has not yet been a successful human clinical trial demonstrating efficacy. In addition, hypotonic intravenous solutions have the potential to worsen cerebral edema. Thus, normal saline without dextrose may be preferable. However, conclusive evidence supporting the use of hypertonic and colloid solutions remains insufficient.
Other important issues are gastrointestinal prophylaxis, early mobilization, and nutrition. The nutritional needs of acute brain‐injured patients cannot be overemphasized. Caloric intake should be maintained at 140% to compensate for the hypermetabolic state of the brain and to avoid weight loss. Patients should not be fed or treated with oral medications until a speech and swallow study is conducted to determine the extent of dysphagia and dysarthria or aphasia.9 However, in general, patients who are alert can usually be administered their oral medications, but only after a swallow evaluation has been passed.
ANTIPLATELET THERAPY FOR STROKE PREVENTION
Primary Stroke Prevention
Aspirin has been shown to be efficacious in preventing first stroke in women. The evidence supporting aspirin use in women for primary prevention of stroke is from the Women's Health Study, which showed that the occurrence of first stroke could be reduced in women older than 45 years old by taking 100 mg of aspirin every other day as compared with placebo.16 The AHA/ASA recommends aspirin therapy for primary ischemic stroke prevention in women whose risk of stroke outweighs the risk of aspirin‐related bleeding. Unfortunately, there are not enough supporting data to recommend its use in men for primary stroke prevention.17
Secondary Stroke Prevention
Aspirin, clopidogrel, and the extended‐release dipyridamole‐aspirin combination are the most commonly used antiplatelet agents for secondary stroke prevention. Ticlopidine is indicated for prevention of recurrent stroke18 but has fallen out of use because of safety concerns, and dipyridamole confers little cardiovascular protection compared with the other antiplatelet agents. Aspirin is widely regarded as the first‐line agent for preventing recurrent stroke. The optimal dose of aspirin for reducing the risk of secondary stroke is uncertain. However, most practitioners use doses between 75 and 325 mg. The numerous studies supporting this have been summarized by Hennekens et al.19 The Antiplatelet Trialists Collaboration demonstrated that lower‐dose aspirin (75150 mg) is effective and can reduce secondary stroke by 25%.20 The European Stroke Prevention Study 2 (ESPS‐2) showed an 18% reduction in the risk of a recurrent stroke with only 50 mg of aspirin.21 The AHA/ASA recommends 50350 mg/day aspirin to reduce the risk of recurrent stroke and or vascular events in patients with ischemic stroke.5
In the CAPRIE study, clopidogrel was shown to be effective, but not superior to aspirin, in the reduction of recurrent stroke.22 Taking their similar safety and efficacy profiles into account and aspirin's low cost, the AHA/ASA concluded that clopidogrel is an acceptable but not preferable alternative to aspirin therapy for the reduction of recurrent strokes.5 The combination of clopidogrel and aspirin reduces secondary vascular events in high‐risk cardiovascular patients and can be considered in high‐risk stroke patients. The CHARISMA study revealed that a combination of clopidogrel and aspirin has benefit over aspirin alone in secondary prevention of a combined end point of stroke, MI, and CV death.23 However, this same study also showed that aspirin alone is superior to the combination in primary prevention of this same end point. Subgroup analysis demonstrated that the combination of clopidogrel and aspirin provided a significant benefit in further reducing nonfatal strokes over aspirin alone (P .05) and a trend toward reducing all ischemic strokes (P .10).24 The MATCH study showed no evidence that a combination of clopidogrel and aspirin was superior to aspirin alone in patients with recent TIA or stroke.25, 26 However, the impact of aspirin resistance in the MATCH study population was not quantified but may have affected the study results, as 80% of the patients were already taking aspirin on enrollment.24 Of significance is the finding in both CHARISMA and MATCH that the addition of aspirin to clopidogrel therapy conveys a higher risk for bleeding.26 Combining clopidogrel with aspirin therapy is not routinely recommended by the AHA/ASA to reduce the risk of recurrent stroke.5
The ESPS‐2 trial demonstrated that the combination of extended‐release (ER) dipyridamole and aspirin was superior to aspirin alone for reducing the risk of recurrent stroke in patients with ischemic stroke.21 However, the combination of ER dipyridamole and aspirin was not different from placebo in preventing myocardial infarction or CV death. Thus, the AHA/ASA recommends that the combination of ER‐dipyridamole/aspirin can be considered for secondary stroke prevention.5
LONG‐TERM MANAGEMENT FOR SECONDARY PREVENTION OF NONSTROKE VASCULAR EVENTS
In the subacute period, the hospitalist transitions the patient from acute to chronic care. Here, the goals are optimizing functional outcome and preventing recurrence. Still, during the first few days after ictus, the patient remains at risk for recurrent stroke, cerebral edema, and hemorrhagic transformation, so continued hospitalization is required. By 57 days later, the most significant risk period has elapsed. Physical and occupational therapy are initiated while patients are still hospitalized. Patient and family education about stroke and related diseases is done. A rational and comprehensive plan to reduce risk of secondary stroke is critical. This plan must include diet, tobacco, diabetes, blood pressure and excessive weight interventions. These may require care from a specialized team with members such as dieticians, exercise therapists, and tobacco interventionalists. Especially critical is instituting a discharge plan that highlights continued control of all modifiable risk factors and antiplatelet therapy. Finally, coordination with the patient's outpatient provider is paramount.
There is a developing awareness of the importance of the overlapping syndrome of combined stroke and cardiovascular and peripheral vascular risk. In leading clinical trials, the coexistence of coronary artery disease and cerebral artery disease is as high as 40%; thus, patients who have had a stroke are at high risk for other vascular events such as MI, critical limb ischemia, or vascular death. The AHA/ASA scientific statement on coronary risk evaluation recommends testing for CAD after ischemic stroke, as it has been suggested that asymptomatic CAD is highly prevalent among these patients.4 Diagnostic testing for CAD should be conducted outside the acute stroke setting and optimized based on stroke subtype and the health status of individual patients.4 Testing for PAD should also be done in patients with ischemic stroke when not otherwise contraindicated.27 Thus, the hospitalist should determine the stroke patient's risk of having coexisting CAD and/or PAD. If significant, then appropriate follow‐up testing either during the hospitalization or after discharge should be arranged.
To prevent secondary vascular events including stroke, effective management of common risk factors shared by stroke, CAD, and PAD is recommended. Long‐term treatment goals include control of hypertension, lipid and glucose management, smoking cessation, weight control, and integration of physical activity.4, 5, 27 Except for blood pressure control, many of these should be initiated while still in the hospital. Acute hospitalization is also an opportunity for patient and family education regarding risk factor reduction.
Antiplatelet therapies are also recommended and are associated with an absolute risk reduction of serious vascular events of 36 6 per 1000 persons with previous stroke or transient ischemic attack.20 Aspirin use in patients at high risk for atherothrombotic events has been shown to be effective in reducing the risk of myocardial infarction and other vascular events.20 The AHA‐recommended dose of aspirin for preventing sudden coronary syndrome is 81 mg/day or higher. Clopidogrel has been shown to be effective in reducing the risk of recurrent sudden coronary artery syndrome and progression of peripheral vascular disease.22 When combined with aspirin, clopidogrel has been shown to reduce recurrent sudden coronary syndrome.28, 29
CONCLUSIONS
The hospitalist is involved in the spectrum of stroke care, from management of stroke in the acute care setting to establishing long‐term treatments for prevention of secondary vascular events. As such, hospitalists can significantly affect the lives of patients with ischemic stroke. Current treatment guidelines for stroke recommend aggressive and rapid response in the acute setting. Long‐term treatments focus on risk reduction for recurrent stroke or for other vascular events such as MI or critical limb ischemia. Antiplatelet therapies are a component of long‐term treatments. Current research suggests that antiplatelet agents differ in reducing recurrent strokes versus nonstroke events. Thus, treatments should be based on a patient's individual risk factors for recurrent stroke and/or CAD or PAD. Although hospitalists will transfer care back to outpatient providers, the interventions initiated in the hospital will optimize the patient's future. In many ways, the patient's first step to a better health began when crossing the entrance of the hospital.
- ,,, et al.Heart disease and stroke statistics—2006 update: a report from the American Heart Association statistics committee and stroke statistics subcommittee.Circulation.2006;113:85–151.
- ,,,.Trends in the leading causes of death in the United States, 1970–2002.JAMA.2005;294:1255–1259.
- ,,, et al.One‐year cardiovascular event rates in outpatients with atherothrombosis.JAMA.2007;297:1197–1206.
- ,,, et al.Coronary risk evaluation in patients with transient ischemic attack and ischemic stroke: a scientific statement for healthcare professionals from the Stroke Council and the Council on Clinical Cardiology of the American Heart Association/American Stroke Association.Circulation.2003;108:1278–1290.
- ,,, et al.Guidelines for prevention of stroke in patients with ischemic stroke or transient ischemic attack: A statement for healthcare professionals from the American Heart Association/American Stroke Association.Stroke.2006;37:577–617.
- ,,,,,.Long‐term survival after first‐ever stroke: the Oxfordshire Community Stroke Project.Stroke.1993;24:796–800.
- ,,, et al.Five‐year survival after first‐ever stroke and related prognostic factors in the Perth Community Stroke Study.Stroke.2000;31:2080–2086.
- ,,, et al.Mortality and causes of death after first ischemic stroke: the Northern Manhattan Stroke Study.Neurology.2001;57:2000–2005.
- ,,, et al.Guidelines for the early management of adults with ischemic stroke: A guideline from the American Heart Association/American Stroke Association.Stroke.2007;38:1655–1711.
- NINDS study group.Tissue plasminogen activator for acute ischemic stroke.N Engl J Med.1995;333:1581–1587.
- ,,, et al.Effects of tissue plasminogen activator for acute ischemic stroke at one year.N Engl J Med.1999;340:1781–1787.
- ,,, et al.Intraarterial recombinant tissue plasminogen activator for ischemic stroke: an accelerating dosing regimen.Neurosurgery.2000;47:473–476.
- ,,,,.Antithrombotic and thrombolytic therapy for ischemic stroke: the Seventh ACCP Conference on Antithrombotic and Thrombolytic Therapy.Chest.2004;126:483s–512s.
- ,,, et al.Indications for early aspirin use in acute ischemic stroke: a combined analysis of 40000 randomized patients from the Chinese acute stroke trial and the international stroke trial.Stroke.2000;31:1240–1249.
- ,,, et al.Body temperature in acute stroke: relation to stroke severity, infarct size, mortality, and outcome.Lancet.1996;347:422–425.
- ,,, et al.A randomized trial of low‐dose aspirin in the primary prevention of cardiovascular disease in women.N Engl J Med.2005;352:1293–1304.
- ,,, et al.Primary prevention of ischemic stroke: A guideline from the American Heart Association/American Stroke Association.Circulation.2006;113:873–823.
- ,,, et al.A randomized trial comparing ticlopidine hydrochloride with aspirin for the prevention of stroke in high‐risk patients.N Engl J Med.1989;321:501–517.
- ,,.Aspirin as a therapeutic agent in cardiovascular disease: a statement for healthcare professionals from the American Heart Association.Circulation.1997;96:2751–2753.
- Antithrombotic Trialists' Collaboration.Collaborative meta‐analysis of randomized trials of antiplatelet therapy for prevention of death, myocardial infarction, and stroke in high risk patients.BMJ.2002;324:71–86.
- ,,,,,.European stroke prevention study:2. Dipyridamole and acetylsalicylic acid in the secondary prevention of stroke.J Neurol Sci.1996;143:1–13.
- CAPRIE steering committee.A randomized, blinded, trial of clopidogrel versus aspirin in patients at risk of ischemic events (CAPRIE).Lancet.1996;348:1329–1339.
- ,,, et al.Clopidogrel and aspiring versus aspirin alone for the prevention of atherothrombotic events.N Engl J Med.2006;354:1706–1717.
- ,,, et al.Patients with prior myocardial infarction, stroke, or symptomatic peripheral arterial disease in the CHARISMA trial.J Am Coll Cardiol.2007;49:1982–1988.
- ,,, et al.Aspirin and clopidogrel compared with clopidogrel alone after recent ischemic stroke or transient ischemic attack in high‐risk patients (MATCH): Randomized, double‐blind placebo‐controlled trial.Lancet.2004;364:331–337.
- .Role of aspirin in MATCH.Lancet.2004;364:1661.
- ,,, et al.ACC/AHA 2005 practice guidelines for the management of patients with peripheral arterial disease (lower extremity, renal, mesenteric, and abdominal aortic).Circulation.2006;113:463–654.
- CURE Trial Investigators.Effects of clopidogrel in addition to aspirin in patients with acute coronary syndromes without ST‐segment elevation.N Engl J Med.2001;345:494–502.
- ,,, et al.Effects of pretreatment with clopidogrel and aspirin followed by long‐term therapy in patients undergoing percutaneous coronary intervention: PCI‐CURE study.Lancet.2001;358:527–533.
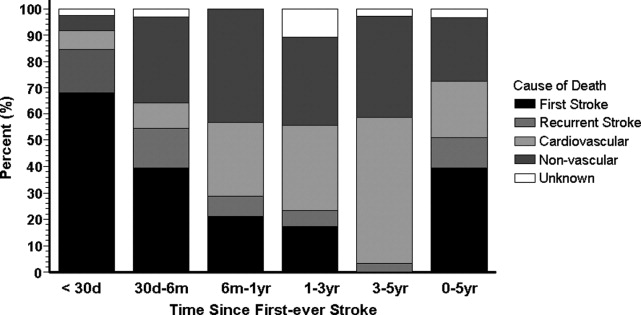
Hypoglycemia in Hospitalized Patients / Garg et al.
Glycemic control in hospitalized patients is receiving greater attention. The American Diabetes Association and the American College of Endocrinology recently issued a joint consensus statement on the need to implement tight blood glucose (BG) control in hospitalized patients.1, 2 The Joint Commission on Accreditation of Healthcare Organizations (JACHO) has developed an Advanced Inpatient Diabetes Care Certification Program for hospitals. However, despite all these efforts, it has been difficult to change how well glucose is controlled.3 A major hurdle in implementing glycemic control strategies is the prevalent fear of hypoglycemia among hospital staff. Although there are multiple protocols for insulin treatment,47 guidelines for the prevention and treatment of hypoglycemia are lacking. Once a hypoglycemic episode has occurred, reducing the dosage of diabetes medications may reduce subsequent episodes. This study was conducted to assess whether diabetes medications were decreased following an episode of hypoglycemia that led to treatment with intravenous (IV) dextrose.
METHODS
Data were collected by the Diabetes Subcommittee of the Pharmacy and Therapeutics Committee as part of a quality improvement initiative. Hypoglycemic episodes were identified by computerized orders for 50% dextrose solution. All orders in a 1‐month period (June 2006) were collected. Characteristics of patients experiencing these episodes were identified from the electronic medical records (EMR). The following data were collected: age, sex, history of diabetes, serum creatinine, diabetes medications at time of hypoglycemia, blood glucose at time of hypoglycemia, and all BG values in the 24 hours before hypoglycemia. BG values included those obtained in the laboratory as well as those obtained by bedside blood glucose testing. Treatment changes made right when the hypoglycemic episode occurred (immediate) and within 24 hours of the hypoglycemic episode (subsequent) were evaluated by 2 diabetes specialists, a board‐certified endocrinologist and a nurse‐practitioner working on the diabetes management service. The 2 practitioners regularly work together, but the data were evaluated independently. Because there are no specific guidelines, the appropriateness of change in treatment was based on general guidelines and experience. For example, if hypoglycemia developed while a patient was on insulin infusion therapy, it was appropriate to stop the drip when the episode of hypoglycemia occurred and to restart it at a lower rate according to the insulin infusion protocol. No subsequent changes would have been made in a situation such as this, and it was deemed appropriate. However, if a patient developed hypoglycemia while on subcutaneous (SC) insulin and then insulin was either completely discontinued or no change was made in subsequent orders, it was deemed inappropriate. The 2 diabetes specialists agreed in 87% of cases (kappa = 0.68, 95% CI 0.53‐0.84). In the 13% of cases in which the diabetes specialists had different opinions, they conferred to reach agreement. In patients with more than 1 episode, data related to the first episode were evaluated. Data are presented as means with SDs.
RESULTS
The EMR contained information on time of episode of hypoglycemia and medication changes for 52 patients, all of whom were in the study. Patient characteristics and mean blood glucose level are shown in Table 1. All patients were being treated with insulin when the episode of hypoglycemia occurred: 9 were on intravenous (IV) insulin alone, 3 on IV and subcutaneous (SC) insulin, 30 on scheduled SC insulin, and 10 on sliding‐scale SC insulin alone. Three patients were prescribed sulfonylurea drugs in addition to insulin. Insulin dosage of all 52 patients was held at the time of the hypoglycemic episode. Diabetes specialists agreed with this decision 100% of the time. Only 21 patients (40%) subsequently had reductions made in their treatment dosage, and diabetes specialists agreed with the changes made for 11 of these patients (52%). Thirty‐one patients (60%) had no changes made to their treatment, and diabetes specialists agreed with that decision for 10 of these patients (32%). When diabetes specialists disagreed with a decision, they would have decreased the insulin dose or changed the regimen in a different way. Details on the changes in treatment and whether diabetes specialists agreed with the changes are shown in Table 2. Twenty‐four hours after an episode of hypoglycemia, mean blood glucose of patients whose providers had made changes was 190.7 87.9 mg/dL and that of patients whose providers had not made changes was 122.6 43.2 mg/dL (P = NS). The mean BG of patients for whom the diabetologists agreed with the decision was 110.7 90.3 mg/dL, and that of patients for whom they disagreed with the decision was 139.7 42.8 mg/dL (P = NS).
| Number of patients | 52 |
| Age (years) | 64.8 15.8 |
| Sex (male:female), n | 29:23 |
| Preexisting diabetes, n (%) | |
| No diabetes | 17 (33%) |
| Type 1 diabetes | 9 (17%) |
| Type 2 diabetes | 26 (50%) |
| Serum creatinine (mg/dL) | 2.1 1.9 |
| Serum creatinine 2 mg/dL, n (%) | 21 (40%) |
| BG at time of hypoglycemia (mg/dL) | 52.1 9.3 |
| Mean BG during 24 hours before hypoglycemic episode (mg/dL) | 137.5 57.0 |
| Mean BG during 24 hours after hypoglycemic episode (mg/dL) | 112 74.7 |
| Change | Number of patients receiving change | Number of patients for whom diabetes specialists agreed with change, n (%) |
|---|---|---|
| Basal insulin decreased | 6 | 6 (100%) |
| Basal insulin stopped | 2 | 0 (0%) |
| IV insulin changed to scheduled SC insulin | 2 | 1 (50%) |
| IV insulin to SC sliding‐scale insulin | 1 | 0 (0%) |
| Change in sliding‐scale insulin dose | 3 | 1 (33%) |
| Sliding‐scale insulin stopped | 1 | 1 (100%) |
| IV insulin started | 1 | 1 (100%) |
| Sulfonylurea stopped | 1 | 1 (100%) |
| Scheduled insulin changed to sliding scale | 1 | 0 (0%) |
| Insulin discontinued | 3 | 0 (0%) |
| No change | 31 | 10 (32%) |
DISCUSSION
These results suggest that treatment modification following an episode of hypoglycemia may be suboptimal. These data provide no information about the clinical circumstances leading to the choice of treatment with IV dextrose, as opposed to oral glucose or glucagon. Presumably, dextrose was chosen for many patients whom the physician considered to require the most urgent treatment. Appropriately, immediate treatment with insulin was held for all patients. On the other hand, 60% of the patients continued to receive the same insulin dose 24 hours after the hypoglycemic episode. Diabetes specialists judged continuation of the same dose as inappropriate in two thirds of the cases. Even when changes in treatment were made, those changes were judged suboptimal in half the cases. Blood glucose level 24 hours after an episode of hypoglycemia reflects these problems. These findings suggest that opportunities to prevent hypoglycemic episodes in the future are frequently missed. Lack of knowledge and/or guidelines for adjusting insulin dose following an episode of hypoglycemia seemed to have led to suboptimal changes for most patients.
Overall incidence of hypoglycemia (60 mg/dL) among patients with diabetes admitted to a hospital has been reported to be 23%.8 In patients receiving continuous intravenous insulin infusion, the incidence of hypoglycemia has been variously reported as from 1.2% to 18.7%.9, 10 All insulin infusion protocols have guidelines for the immediate treatment of hypoglycemia and recommend steps to prevent further episodes. Although many hospitals have protocols for immediate action when hypoglycemia occurs (eg, hold insulin, give juice or dextrose), to our knowledge, no specific guidelines exist for adjustment of subcutaneous insulin following an episode of hypoglycemia. The vast majority of patients in a hospital are treated with SC insulin as opposed to IV insulin, and fear of hypoglycemia is a major barrier to intensified therapy. If widely applied, standardized protocols have the potential to be effective in preventing hypoglycemia.9
A limitation of our study was that it was a retrospective data analysis. We did not look at changes in clinical condition, in nutrition, and in other medications that might have led to the episode of hypoglycemia and affected the decision about which antidiabetic medications to treat with. Data on further episodes of hypoglycemia were also not available.
In conclusion, we have shown that treatment changes after an episode of hypoglycemia are chaotic and may be suboptimal. Standardized protocols may be helpful for making effective changes and potentially can reduce the risk of further episodes of hypoglycemia.
- American College of Endocrinology and American Diabetes Association Consensus statement on inpatient diabetes and glycemic control: a call to action.Diabetes Care.2006;29:1955–1962.
- American College of Endocrinology and American Diabetes Association consensus statement on inpatient diabetes and glycemic control.Endocr Pract.2006;12:458–468.
- ,,.Current state of inpatient diabetes burden and care, and goal of the conference.Endocr Pract.2006;12(suppl 3, sddendum):1–10.
- ,,,.Intravenous insulin infusion therapy: indications, methods, and transition to subcutaneous insulin therapy.Endocr Pract.2004;10(suppl 2):71–80.
- ,,,,.Evaluation of an intensive insulin protocol for septic patients in a medical intensive care unit.Crit Care Med.2006;34:2974–2978.
- ,,, et al.Implementation of a safe and effective insulin infusion protocol in a medical intensive care unit.Diabetes Care.2004;27:461–467.
- ,,, et al.Efficacy and safety of an insulin infusion protocol in a surgical ICU.J Am Coll Surg.2006;202(1):1–9.
- ,,.Glycemic control and sliding scale insulin use in medical inpatients with diabetes mellitus.Arch Intern Med.1997;157:545–552.
- ,,, et al.Hospital hypoglycemia: not only treatment but also prevention.Endocr Pract.2004;10(suppl 2):89–99.
- ,,, et al.Intensive insulin therapy in the medical ICU.N Engl J Med.2006;354:449–461.
Glycemic control in hospitalized patients is receiving greater attention. The American Diabetes Association and the American College of Endocrinology recently issued a joint consensus statement on the need to implement tight blood glucose (BG) control in hospitalized patients.1, 2 The Joint Commission on Accreditation of Healthcare Organizations (JACHO) has developed an Advanced Inpatient Diabetes Care Certification Program for hospitals. However, despite all these efforts, it has been difficult to change how well glucose is controlled.3 A major hurdle in implementing glycemic control strategies is the prevalent fear of hypoglycemia among hospital staff. Although there are multiple protocols for insulin treatment,47 guidelines for the prevention and treatment of hypoglycemia are lacking. Once a hypoglycemic episode has occurred, reducing the dosage of diabetes medications may reduce subsequent episodes. This study was conducted to assess whether diabetes medications were decreased following an episode of hypoglycemia that led to treatment with intravenous (IV) dextrose.
METHODS
Data were collected by the Diabetes Subcommittee of the Pharmacy and Therapeutics Committee as part of a quality improvement initiative. Hypoglycemic episodes were identified by computerized orders for 50% dextrose solution. All orders in a 1‐month period (June 2006) were collected. Characteristics of patients experiencing these episodes were identified from the electronic medical records (EMR). The following data were collected: age, sex, history of diabetes, serum creatinine, diabetes medications at time of hypoglycemia, blood glucose at time of hypoglycemia, and all BG values in the 24 hours before hypoglycemia. BG values included those obtained in the laboratory as well as those obtained by bedside blood glucose testing. Treatment changes made right when the hypoglycemic episode occurred (immediate) and within 24 hours of the hypoglycemic episode (subsequent) were evaluated by 2 diabetes specialists, a board‐certified endocrinologist and a nurse‐practitioner working on the diabetes management service. The 2 practitioners regularly work together, but the data were evaluated independently. Because there are no specific guidelines, the appropriateness of change in treatment was based on general guidelines and experience. For example, if hypoglycemia developed while a patient was on insulin infusion therapy, it was appropriate to stop the drip when the episode of hypoglycemia occurred and to restart it at a lower rate according to the insulin infusion protocol. No subsequent changes would have been made in a situation such as this, and it was deemed appropriate. However, if a patient developed hypoglycemia while on subcutaneous (SC) insulin and then insulin was either completely discontinued or no change was made in subsequent orders, it was deemed inappropriate. The 2 diabetes specialists agreed in 87% of cases (kappa = 0.68, 95% CI 0.53‐0.84). In the 13% of cases in which the diabetes specialists had different opinions, they conferred to reach agreement. In patients with more than 1 episode, data related to the first episode were evaluated. Data are presented as means with SDs.
RESULTS
The EMR contained information on time of episode of hypoglycemia and medication changes for 52 patients, all of whom were in the study. Patient characteristics and mean blood glucose level are shown in Table 1. All patients were being treated with insulin when the episode of hypoglycemia occurred: 9 were on intravenous (IV) insulin alone, 3 on IV and subcutaneous (SC) insulin, 30 on scheduled SC insulin, and 10 on sliding‐scale SC insulin alone. Three patients were prescribed sulfonylurea drugs in addition to insulin. Insulin dosage of all 52 patients was held at the time of the hypoglycemic episode. Diabetes specialists agreed with this decision 100% of the time. Only 21 patients (40%) subsequently had reductions made in their treatment dosage, and diabetes specialists agreed with the changes made for 11 of these patients (52%). Thirty‐one patients (60%) had no changes made to their treatment, and diabetes specialists agreed with that decision for 10 of these patients (32%). When diabetes specialists disagreed with a decision, they would have decreased the insulin dose or changed the regimen in a different way. Details on the changes in treatment and whether diabetes specialists agreed with the changes are shown in Table 2. Twenty‐four hours after an episode of hypoglycemia, mean blood glucose of patients whose providers had made changes was 190.7 87.9 mg/dL and that of patients whose providers had not made changes was 122.6 43.2 mg/dL (P = NS). The mean BG of patients for whom the diabetologists agreed with the decision was 110.7 90.3 mg/dL, and that of patients for whom they disagreed with the decision was 139.7 42.8 mg/dL (P = NS).
| Number of patients | 52 |
| Age (years) | 64.8 15.8 |
| Sex (male:female), n | 29:23 |
| Preexisting diabetes, n (%) | |
| No diabetes | 17 (33%) |
| Type 1 diabetes | 9 (17%) |
| Type 2 diabetes | 26 (50%) |
| Serum creatinine (mg/dL) | 2.1 1.9 |
| Serum creatinine 2 mg/dL, n (%) | 21 (40%) |
| BG at time of hypoglycemia (mg/dL) | 52.1 9.3 |
| Mean BG during 24 hours before hypoglycemic episode (mg/dL) | 137.5 57.0 |
| Mean BG during 24 hours after hypoglycemic episode (mg/dL) | 112 74.7 |
| Change | Number of patients receiving change | Number of patients for whom diabetes specialists agreed with change, n (%) |
|---|---|---|
| Basal insulin decreased | 6 | 6 (100%) |
| Basal insulin stopped | 2 | 0 (0%) |
| IV insulin changed to scheduled SC insulin | 2 | 1 (50%) |
| IV insulin to SC sliding‐scale insulin | 1 | 0 (0%) |
| Change in sliding‐scale insulin dose | 3 | 1 (33%) |
| Sliding‐scale insulin stopped | 1 | 1 (100%) |
| IV insulin started | 1 | 1 (100%) |
| Sulfonylurea stopped | 1 | 1 (100%) |
| Scheduled insulin changed to sliding scale | 1 | 0 (0%) |
| Insulin discontinued | 3 | 0 (0%) |
| No change | 31 | 10 (32%) |
DISCUSSION
These results suggest that treatment modification following an episode of hypoglycemia may be suboptimal. These data provide no information about the clinical circumstances leading to the choice of treatment with IV dextrose, as opposed to oral glucose or glucagon. Presumably, dextrose was chosen for many patients whom the physician considered to require the most urgent treatment. Appropriately, immediate treatment with insulin was held for all patients. On the other hand, 60% of the patients continued to receive the same insulin dose 24 hours after the hypoglycemic episode. Diabetes specialists judged continuation of the same dose as inappropriate in two thirds of the cases. Even when changes in treatment were made, those changes were judged suboptimal in half the cases. Blood glucose level 24 hours after an episode of hypoglycemia reflects these problems. These findings suggest that opportunities to prevent hypoglycemic episodes in the future are frequently missed. Lack of knowledge and/or guidelines for adjusting insulin dose following an episode of hypoglycemia seemed to have led to suboptimal changes for most patients.
Overall incidence of hypoglycemia (60 mg/dL) among patients with diabetes admitted to a hospital has been reported to be 23%.8 In patients receiving continuous intravenous insulin infusion, the incidence of hypoglycemia has been variously reported as from 1.2% to 18.7%.9, 10 All insulin infusion protocols have guidelines for the immediate treatment of hypoglycemia and recommend steps to prevent further episodes. Although many hospitals have protocols for immediate action when hypoglycemia occurs (eg, hold insulin, give juice or dextrose), to our knowledge, no specific guidelines exist for adjustment of subcutaneous insulin following an episode of hypoglycemia. The vast majority of patients in a hospital are treated with SC insulin as opposed to IV insulin, and fear of hypoglycemia is a major barrier to intensified therapy. If widely applied, standardized protocols have the potential to be effective in preventing hypoglycemia.9
A limitation of our study was that it was a retrospective data analysis. We did not look at changes in clinical condition, in nutrition, and in other medications that might have led to the episode of hypoglycemia and affected the decision about which antidiabetic medications to treat with. Data on further episodes of hypoglycemia were also not available.
In conclusion, we have shown that treatment changes after an episode of hypoglycemia are chaotic and may be suboptimal. Standardized protocols may be helpful for making effective changes and potentially can reduce the risk of further episodes of hypoglycemia.
- American College of Endocrinology and American Diabetes Association Consensus statement on inpatient diabetes and glycemic control: a call to action.Diabetes Care.2006;29:1955–1962.
- American College of Endocrinology and American Diabetes Association consensus statement on inpatient diabetes and glycemic control.Endocr Pract.2006;12:458–468.
- ,,.Current state of inpatient diabetes burden and care, and goal of the conference.Endocr Pract.2006;12(suppl 3, sddendum):1–10.
- ,,,.Intravenous insulin infusion therapy: indications, methods, and transition to subcutaneous insulin therapy.Endocr Pract.2004;10(suppl 2):71–80.
- ,,,,.Evaluation of an intensive insulin protocol for septic patients in a medical intensive care unit.Crit Care Med.2006;34:2974–2978.
- ,,, et al.Implementation of a safe and effective insulin infusion protocol in a medical intensive care unit.Diabetes Care.2004;27:461–467.
- ,,, et al.Efficacy and safety of an insulin infusion protocol in a surgical ICU.J Am Coll Surg.2006;202(1):1–9.
- ,,.Glycemic control and sliding scale insulin use in medical inpatients with diabetes mellitus.Arch Intern Med.1997;157:545–552.
- ,,, et al.Hospital hypoglycemia: not only treatment but also prevention.Endocr Pract.2004;10(suppl 2):89–99.
- ,,, et al.Intensive insulin therapy in the medical ICU.N Engl J Med.2006;354:449–461.
Referral for CT Pulmonary Angiography
Approximately 10 million patients present to emergency departments each year with symptoms raising concern of thromboembolism (VTE).1 The current gold standard for diagnosis of VTE is pulmonary angiography.2 As this study is invasive, alternative imaging protocols have been sought. CTPA, when combined with measures of pretest probability, equals or surpasses the ability of pulmonary angiography to detect VTE and can improve the ability of clinicians to rule out VTE.38 In a study of 930 patients, application of clinical rules in addition to D‐dimer testing decreased the number of CTPAs ordered by 50%.9 One of the most common clinical rule sets is the Wells Score, which relies on historical features related to the risk of DVT/VTE and physical examination findings.10, 11
Other institutions have demonstrated an increase in the number of CTPAs ordered and VTE diagnoses since the study became widely available.13 Based on the observation of an increasing number of CTPAs ordered at our institution without an increase in the number of VTEs diagnosed, we aimed to ascertain the physician ordering practices for CTPA. We hypothesized that CTPAs were ordered at a greater frequency in a low‐risk population because an institutional clinical algorithm was lacking.
METHODS
Charts of all patients aged 18‐100 with CTPA ordered to rule out acute VTE were retrospectively examined. A Simplified Wells Score was applied using only the information available to the ordering physician at the time the CTPA was performed. Patients were stratified by their Simplified Wells Score to low (0‐1 points), intermediate (2‐6 points), or high (>6 points) pretest clinical probability. A D‐dimer value, if ordered, was used to further stratify patients based on a positive or negative result. The official radiologic report of the CTPA was used to determine the rate of VTE diagnosis for the study population.
RESULTS
Three hundred and ninety‐four patients were referred for CTPA (Fig. 1). Two hundred and seventy‐nine had adequate clinical data to calculate a Simplified Wells Score and were included in the study. Of the 279 studies included, 75% were ordered through the emergency department and 25% from inpatient services (Table 1). The study patients were stratified according to the Simplified Wells criteria: 184 patients (66%) had low clinical probability, 91 (33%) had intermediate clinical probability, and 4 (1%) had high clinical probability. Nineteen (7%) patients had a history of DVT or VTE, and 28 (10%) had a history of active cancer at the time of their CTPA. One hundred and twenty‐five of the 279 patients had a D‐dimer performed (Fig. 2). One hundred and eight were positive, and 17 were negative. Of the 17 patients who had a negative D‐dimer and underwent CTPA testing, none were diagnosed with VTE. Eighty‐three low‐clinical‐probability patients underwent CTPA without D‐dimer testing, 4 of whom were diagnosed with VTE.

| Low (n = 184) | Intermediate (n = 91) | High (n = 4) | Total (n = 279) | |
|---|---|---|---|---|
| Age (years), mean | 52 | 59 | 62 | 58 |
| Male, n (%) | 82 (45) | 44 (48) | 1 (25) | 127 (46) |
| Female, n (%) | 102 (55) | 47 (52) | 3 (75) | 152 (54) |
| Emergency department, n (%) | 150 (82) | 47 (52) | 4 (100) | 225 (75) |
| Medical, n (%) | 22 (12) | 18 (20) | 0 | 40 (13) |
| Surgical, n (%) | 9 (5) | 14 (15) | 0 | 23 (7) |
| ICU, n (%) | 3 (1) | 12 (13) | 0 | 15 (5) |
| Wells Score, mean | 0.72 | 3.4 | 7.8 | 1.6 |
| D‐dimer performed, n (%) | 101 (55) | 21 (23) | 3 (75) | 125 (45) |
| D‐dimer positive, n (%) | 89 (88) | 16 (76) | 3 (100) | 108 (86) |
| D‐dimer negative, n (%) | 12 (12) | 5 (24) | 0 | 17 (14) |
| CTPA positive, n (%) | 8 (4) | 11 (12) | 1 (25) | 20 (7) |
| CPTA negative, n (%) | 176 (96) | 80 (88) | 3 (75) | 259 (93) |
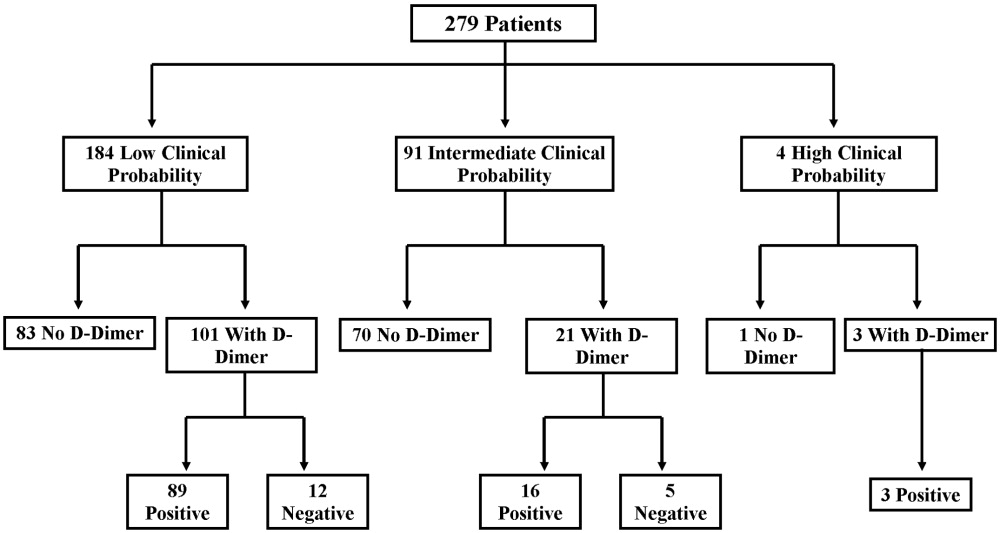
There were 20 positive CTPAs in the study group (Fig. 3). Review of the records for 3 months after the study of patients whose CTPA was negative disclosed no diagnoses of VTE by other modalities. VTE was diagnosed in 4% of patients in the low‐clinical‐probability group, 12% in the intermediate‐clinical‐probability group, and 25% in the high‐clinical‐probability group. The overall positive CTPA rate was 7.2%.

DISCUSSION
Many studies have examined the application of clinical rule sets in addition to D‐dimer testing and CTPA to exclude acute VTE.39 Most of these studies have shown that the use of an algorithm is safe and frequently reduces referral for CTPA in low‐clinical‐probability patients. However, others have noted that some physicians do not routinely use validated algorithms when making decisions related to patient evaluation.13 Our rate of positive CTPA was low compared with rates reported in the literature.3, 14 We believe the most likely explanation is the large number of low‐clinical‐probability patients who underwent CTPA, possibly because providers do not routinely use a validated clinical algorithm.
When our patient population was risk stratified by Simplified Wells criteria and compared with similar data from published studies, we had a much higher proportion of patients classified as low clinical probability.7, 8, 15 The low‐clinical‐probability group's mean Simplified Wells Score was 0.71; one‐third had a Simplified Wells Score of 0. This reflects a low‐risk population for VTE, supported by the low prevalence of prior DVT/VTE and active cancer in our population.4, 10 The rationale for referring patients with so few risk factors for CTPA is unclear. It is possible that providers used CTPA to evaluate symptoms not clearly explained and obtained the study to look for other diagnoses in addition to VTE. By not applying a clinical algorithm, very‐low‐risk patients underwent CTPA, increasing the number of negative studies and decreasing the overall positive rate.
Not using a clinical algorithm also resulted in indiscriminate D‐dimer testing. There were 83 patients risk‐stratified as low clinical probability who did not have a D‐dimer prior to undergoing CTPA. Some of these patients may well have had a negative D‐dimer, requiring no further workup to rule out VTE. Seventeen patients had a negative D‐dimer and still underwent CTPA; all these patients were negative for VTE. These aberrations likely occurred from unfamiliarity with use of the D‐dimer test or doubts about its ability to reliably exclude VTE. Appropriate application of D‐dimer testing could have decreased the number of CTPAs ordered and increased our overall rate of positive VTE diagnosis.
Perrier et al., Brown et al., and Kelly and Wells all describe different methods of introducing clinical algorithms to aid the diagnosis of VTE.46, 9 All agree that patients should be risk stratified by pretest clinical probability, and low‐probability patients should undergo intermediate testing with D‐dimer prior to CTPA. Implementation of a similar clinical algorithm at our facility would likely decrease the number of CTPAs ordered. If all patients presenting at our facility with signs and symptoms raising concern for VTE were first risk‐stratified by pretest clinical probability, and all low‐probability patients underwent highly‐sensitive D‐dimer testing as an initial step, fewer CTPAs would be performed on low‐probability patients. The largest group of patients in our study were low probability; therefore, decreasing CTPA in this group could have a significant effect on our institution.
The retrospective nature of our study resulted in the following limitations. It is impossible to determine how the ordering provider viewed the patient's pretest probability. In most of the medical records, a pretest clinical probability was not documented. We attempted to validate the ordering provider's decision by being as generous as possible in applying points to the Wells Score. For example, if a patient had a remote history of cancer and the ordering provider documented this as a risk factor for VTE, the point value for cancer was given even though the Wells Score has a much narrower definition of this category.10 This practice favors assigning patients a potentially higher clinical probability and may have increased the number of patients designated as intermediate and high clinical probability in our study.
Our hospital primarily relies on CTPA with lower extremity venogram as the diagnostic test for VTE. Indeterminate tests may have occurred and thus falsely lowered the number of VTEs diagnosed. However, no patient with a negative CTPA was diagnosed with VTE by any modality in the 3 months after their initial study at our institution; a diagnosis of VTE could have been made at another hospital. The Simplified Wells Score uses both objective and subjective components to arrive at a point total. Our results might be different if newer algorithms, such as the Revised Geneva Score,16 which relies only on objective measurements, had been used.
CONCLUSIONS
The reliance on CTPA alone to exclude a potentially life‐threatening illness without additional risk stratification or clinical information leads to overuse of this test in patients with very low to no clinical risk for VTE and a low rate of diagnosed VTE. Implementation of a clinical algorithm for the diagnosis of suspected VTE may eliminate the need for many CTPAs, improving the yield of this test without compromising patient safety, especially at institutions with a low prevalence of PE.
Acknowledgements
The authors thank Dr. John Rinard, DO, for assistance with initial editing of the abstract and Troy Patience for his assistance with statistical analysis.
- ,,, et al.Impact of a rapid‐rule out protocol for pulmonary embolism on the rate of screening, missed cases and pulmonary vascular imaging in an urban US emergency department.Ann Emerg Med.2004;44:490–502.
- ,,, et al.ATS 1999 Clinical practice guideline for the diagnostic approach to acute venous thromboembolism.Am J Respir Crit Care Med.1999;160:1043–1066.
- ,,, et al.Clinical validity of a negative computed tomography scan in patients with suspected pulmonary embolism.JAMA.2005;293:2012–2017.
- ,,, et al.Multidetector‐row computed tomography in suspected pulmonary embolism.N Engl J Med.2005;352:1760–1768.
- ,,.An emergency department guideline for the diagnosis of pulmonary embolism: an outcome study.Acad Emerg Med.2005;12:20–25.
- ,.A clinical probability assessment and D‐dimer measurement should be the initial step in the investigation of suspected venous thromboembolism.Chest.2003;124:1116–1119.
- ,,, et al.Prospective validation of Wells Criteria in the evaluation of patients with suspected pulmonary embolism.Ann Emerg Med.2004;44:503–510.
- ,.External validation and comparison of recently described prediction rules for suspected pulmonary embolism.Curr Opin Pulm Med.2004;10:345–349.
- ,,, et al.Excluding pulmonary embolism at the bedside without diagnostic imaging: management of patients with suspected pulmonary embolism presenting to the emergency department by using a simple clinical model and D‐dimer.Ann Intern Med.2001;135:98–107.
- ,,, et al.Evaluation of D‐dimer in the diagnosis of suspected deep‐vein thrombosis.N Engl J Med.2003;349:1227–1235.
- ,,, et al.Assessing the clinical probability of pulmonary embolism in the emergency ward: a simple score.Arch Intern Med.2001;161:92–97.
- ,,, et al.The effect of helical computed tomography on diagnostic and treatment strategies in patients with suspected pulmonary embolism.Am J Med.2004;116:84–90.
- Simplifying the evaluation of pulmonary embolism.Chest.2006:129:1400–1401.
- ,,, et al.Meta‐Analysis: Outcomes in patients with suspected pulmonary embolism managed with computed tomographic pulmonary angiography.Ann Intern Med.2004;141:866–874.
- ,,, et al.Multidetector computed tomography for acute pulmonary embolism.N Engl J Med.2006;354:2317–2327.
- ,,, et al.Prediction of pulmonary embolism in the emergency department: the revised Geneva score.Ann Intern Med.2006;144(3):165–171.
Approximately 10 million patients present to emergency departments each year with symptoms raising concern of thromboembolism (VTE).1 The current gold standard for diagnosis of VTE is pulmonary angiography.2 As this study is invasive, alternative imaging protocols have been sought. CTPA, when combined with measures of pretest probability, equals or surpasses the ability of pulmonary angiography to detect VTE and can improve the ability of clinicians to rule out VTE.38 In a study of 930 patients, application of clinical rules in addition to D‐dimer testing decreased the number of CTPAs ordered by 50%.9 One of the most common clinical rule sets is the Wells Score, which relies on historical features related to the risk of DVT/VTE and physical examination findings.10, 11
Other institutions have demonstrated an increase in the number of CTPAs ordered and VTE diagnoses since the study became widely available.13 Based on the observation of an increasing number of CTPAs ordered at our institution without an increase in the number of VTEs diagnosed, we aimed to ascertain the physician ordering practices for CTPA. We hypothesized that CTPAs were ordered at a greater frequency in a low‐risk population because an institutional clinical algorithm was lacking.
METHODS
Charts of all patients aged 18‐100 with CTPA ordered to rule out acute VTE were retrospectively examined. A Simplified Wells Score was applied using only the information available to the ordering physician at the time the CTPA was performed. Patients were stratified by their Simplified Wells Score to low (0‐1 points), intermediate (2‐6 points), or high (>6 points) pretest clinical probability. A D‐dimer value, if ordered, was used to further stratify patients based on a positive or negative result. The official radiologic report of the CTPA was used to determine the rate of VTE diagnosis for the study population.
RESULTS
Three hundred and ninety‐four patients were referred for CTPA (Fig. 1). Two hundred and seventy‐nine had adequate clinical data to calculate a Simplified Wells Score and were included in the study. Of the 279 studies included, 75% were ordered through the emergency department and 25% from inpatient services (Table 1). The study patients were stratified according to the Simplified Wells criteria: 184 patients (66%) had low clinical probability, 91 (33%) had intermediate clinical probability, and 4 (1%) had high clinical probability. Nineteen (7%) patients had a history of DVT or VTE, and 28 (10%) had a history of active cancer at the time of their CTPA. One hundred and twenty‐five of the 279 patients had a D‐dimer performed (Fig. 2). One hundred and eight were positive, and 17 were negative. Of the 17 patients who had a negative D‐dimer and underwent CTPA testing, none were diagnosed with VTE. Eighty‐three low‐clinical‐probability patients underwent CTPA without D‐dimer testing, 4 of whom were diagnosed with VTE.
| Low (n = 184) | Intermediate (n = 91) | High (n = 4) | Total (n = 279) | |
|---|---|---|---|---|
| Age (years), mean | 52 | 59 | 62 | 58 |
| Male, n (%) | 82 (45) | 44 (48) | 1 (25) | 127 (46) |
| Female, n (%) | 102 (55) | 47 (52) | 3 (75) | 152 (54) |
| Emergency department, n (%) | 150 (82) | 47 (52) | 4 (100) | 225 (75) |
| Medical, n (%) | 22 (12) | 18 (20) | 0 | 40 (13) |
| Surgical, n (%) | 9 (5) | 14 (15) | 0 | 23 (7) |
| ICU, n (%) | 3 (1) | 12 (13) | 0 | 15 (5) |
| Wells Score, mean | 0.72 | 3.4 | 7.8 | 1.6 |
| D‐dimer performed, n (%) | 101 (55) | 21 (23) | 3 (75) | 125 (45) |
| D‐dimer positive, n (%) | 89 (88) | 16 (76) | 3 (100) | 108 (86) |
| D‐dimer negative, n (%) | 12 (12) | 5 (24) | 0 | 17 (14) |
| CTPA positive, n (%) | 8 (4) | 11 (12) | 1 (25) | 20 (7) |
| CPTA negative, n (%) | 176 (96) | 80 (88) | 3 (75) | 259 (93) |
There were 20 positive CTPAs in the study group (Fig. 3). Review of the records for 3 months after the study of patients whose CTPA was negative disclosed no diagnoses of VTE by other modalities. VTE was diagnosed in 4% of patients in the low‐clinical‐probability group, 12% in the intermediate‐clinical‐probability group, and 25% in the high‐clinical‐probability group. The overall positive CTPA rate was 7.2%.
DISCUSSION
Many studies have examined the application of clinical rule sets in addition to D‐dimer testing and CTPA to exclude acute VTE.39 Most of these studies have shown that the use of an algorithm is safe and frequently reduces referral for CTPA in low‐clinical‐probability patients. However, others have noted that some physicians do not routinely use validated algorithms when making decisions related to patient evaluation.13 Our rate of positive CTPA was low compared with rates reported in the literature.3, 14 We believe the most likely explanation is the large number of low‐clinical‐probability patients who underwent CTPA, possibly because providers do not routinely use a validated clinical algorithm.
When our patient population was risk stratified by Simplified Wells criteria and compared with similar data from published studies, we had a much higher proportion of patients classified as low clinical probability.7, 8, 15 The low‐clinical‐probability group's mean Simplified Wells Score was 0.71; one‐third had a Simplified Wells Score of 0. This reflects a low‐risk population for VTE, supported by the low prevalence of prior DVT/VTE and active cancer in our population.4, 10 The rationale for referring patients with so few risk factors for CTPA is unclear. It is possible that providers used CTPA to evaluate symptoms not clearly explained and obtained the study to look for other diagnoses in addition to VTE. By not applying a clinical algorithm, very‐low‐risk patients underwent CTPA, increasing the number of negative studies and decreasing the overall positive rate.
Not using a clinical algorithm also resulted in indiscriminate D‐dimer testing. There were 83 patients risk‐stratified as low clinical probability who did not have a D‐dimer prior to undergoing CTPA. Some of these patients may well have had a negative D‐dimer, requiring no further workup to rule out VTE. Seventeen patients had a negative D‐dimer and still underwent CTPA; all these patients were negative for VTE. These aberrations likely occurred from unfamiliarity with use of the D‐dimer test or doubts about its ability to reliably exclude VTE. Appropriate application of D‐dimer testing could have decreased the number of CTPAs ordered and increased our overall rate of positive VTE diagnosis.
Perrier et al., Brown et al., and Kelly and Wells all describe different methods of introducing clinical algorithms to aid the diagnosis of VTE.46, 9 All agree that patients should be risk stratified by pretest clinical probability, and low‐probability patients should undergo intermediate testing with D‐dimer prior to CTPA. Implementation of a similar clinical algorithm at our facility would likely decrease the number of CTPAs ordered. If all patients presenting at our facility with signs and symptoms raising concern for VTE were first risk‐stratified by pretest clinical probability, and all low‐probability patients underwent highly‐sensitive D‐dimer testing as an initial step, fewer CTPAs would be performed on low‐probability patients. The largest group of patients in our study were low probability; therefore, decreasing CTPA in this group could have a significant effect on our institution.
The retrospective nature of our study resulted in the following limitations. It is impossible to determine how the ordering provider viewed the patient's pretest probability. In most of the medical records, a pretest clinical probability was not documented. We attempted to validate the ordering provider's decision by being as generous as possible in applying points to the Wells Score. For example, if a patient had a remote history of cancer and the ordering provider documented this as a risk factor for VTE, the point value for cancer was given even though the Wells Score has a much narrower definition of this category.10 This practice favors assigning patients a potentially higher clinical probability and may have increased the number of patients designated as intermediate and high clinical probability in our study.
Our hospital primarily relies on CTPA with lower extremity venogram as the diagnostic test for VTE. Indeterminate tests may have occurred and thus falsely lowered the number of VTEs diagnosed. However, no patient with a negative CTPA was diagnosed with VTE by any modality in the 3 months after their initial study at our institution; a diagnosis of VTE could have been made at another hospital. The Simplified Wells Score uses both objective and subjective components to arrive at a point total. Our results might be different if newer algorithms, such as the Revised Geneva Score,16 which relies only on objective measurements, had been used.
CONCLUSIONS
The reliance on CTPA alone to exclude a potentially life‐threatening illness without additional risk stratification or clinical information leads to overuse of this test in patients with very low to no clinical risk for VTE and a low rate of diagnosed VTE. Implementation of a clinical algorithm for the diagnosis of suspected VTE may eliminate the need for many CTPAs, improving the yield of this test without compromising patient safety, especially at institutions with a low prevalence of PE.
Acknowledgements
The authors thank Dr. John Rinard, DO, for assistance with initial editing of the abstract and Troy Patience for his assistance with statistical analysis.
- ,,, et al.Impact of a rapid‐rule out protocol for pulmonary embolism on the rate of screening, missed cases and pulmonary vascular imaging in an urban US emergency department.Ann Emerg Med.2004;44:490–502.
- ,,, et al.ATS 1999 Clinical practice guideline for the diagnostic approach to acute venous thromboembolism.Am J Respir Crit Care Med.1999;160:1043–1066.
- ,,, et al.Clinical validity of a negative computed tomography scan in patients with suspected pulmonary embolism.JAMA.2005;293:2012–2017.
- ,,, et al.Multidetector‐row computed tomography in suspected pulmonary embolism.N Engl J Med.2005;352:1760–1768.
- ,,.An emergency department guideline for the diagnosis of pulmonary embolism: an outcome study.Acad Emerg Med.2005;12:20–25.
- ,.A clinical probability assessment and D‐dimer measurement should be the initial step in the investigation of suspected venous thromboembolism.Chest.2003;124:1116–1119.
- ,,, et al.Prospective validation of Wells Criteria in the evaluation of patients with suspected pulmonary embolism.Ann Emerg Med.2004;44:503–510.
- ,.External validation and comparison of recently described prediction rules for suspected pulmonary embolism.Curr Opin Pulm Med.2004;10:345–349.
- ,,, et al.Excluding pulmonary embolism at the bedside without diagnostic imaging: management of patients with suspected pulmonary embolism presenting to the emergency department by using a simple clinical model and D‐dimer.Ann Intern Med.2001;135:98–107.
- ,,, et al.Evaluation of D‐dimer in the diagnosis of suspected deep‐vein thrombosis.N Engl J Med.2003;349:1227–1235.
- ,,, et al.Assessing the clinical probability of pulmonary embolism in the emergency ward: a simple score.Arch Intern Med.2001;161:92–97.
- ,,, et al.The effect of helical computed tomography on diagnostic and treatment strategies in patients with suspected pulmonary embolism.Am J Med.2004;116:84–90.
- Simplifying the evaluation of pulmonary embolism.Chest.2006:129:1400–1401.
- ,,, et al.Meta‐Analysis: Outcomes in patients with suspected pulmonary embolism managed with computed tomographic pulmonary angiography.Ann Intern Med.2004;141:866–874.
- ,,, et al.Multidetector computed tomography for acute pulmonary embolism.N Engl J Med.2006;354:2317–2327.
- ,,, et al.Prediction of pulmonary embolism in the emergency department: the revised Geneva score.Ann Intern Med.2006;144(3):165–171.
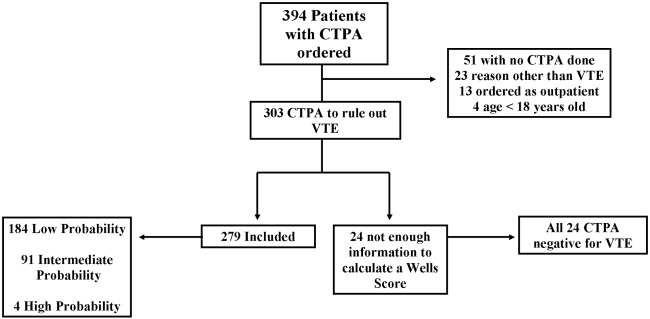
Quality of Life of Children with NI after Fundoplication for GERD
Aspiration pneumonia is the most common cause of death in children with severe neurological impairment (NI).13 For several reasons (eg, improved survival of extremely low‐birth‐weight infants, technological advances, and changing societal attitudes), the number of children with severe NI is increasing. Many children with severe NI have dysfunctional swallowing and gastroesophageal reflux disease (GERD).46 This combination places them at high risk for recurrent aspiration that, in turn, leads to aspiration pneumonia, repeated hospitalization, respiratory failure, compromised quality of life, and death.7, 8
The most common treatment approach for the combination of dysfunctional swallowing and GERD is surgical fundoplication with a gastrostomy feeding tube. Fundoplication is the third most common procedure performed in children by pediatric surgeons in the United States.9 Fifty percent of the children who receive a fundoplication have neurological impairment.10, 11 The goals of the surgery to treat GERD unresponsive to medical management are to reduce the risk of aspiration pneumonia, improve nutritional status, and improve the quality of life of the children and their families. However, few prospective longitudinal studies have determined whether the quality of life of the children or their caregivers actually improves over time.
The importance of caregiver and child quality of life is increasingly recognized as a critical outcome of any intervention in this population.12, 13 Previous studies of fundoplication in children with NI, GERD, and dysfunctional swallowing reported surgical mortality rates between 1% and 3% and other complications between 4% and 39%, reflecting the medical fragility of these children.5, 1418 Some of these studies had longitudinal follow‐up and reported long‐term data. Recurrence of symptoms was reported in up to 56% of patients, recurrence of AP in up to 39%, further surgical procedures in up to 19%, and mortality in up to 17%.14, 1921 Few case series of children with neurological impairment who have had a fundoplication have addressed child and caregiver quality of life following either a fundoplication or placement of a feeding tube.2224 In their study of 16 patients who had a fundoplication and gastrostomy tube placed, Tawfik et al. found improvements in children's happiness, ease of giving medicines, and time to devote to other children. Sullivan et al. found improvement in caregiver quality of life following placement of a gastrostomy tube in a child; however, they did not specifically identify those children who had been treated with a fundoplication. In their retrospective study, O'Neill et al. found improved child and caregiver quality of life following a fundoplication. Collectively, these studies have found that parents report improvement of both their own and their child's quality of life after either intervention. However, not having baseline measurements, not controlling for degree of functional impairment of the children, small sample sizes, and large loss to follow‐up limit the utility of these studies. In this ongoing, long‐term prospective longitudinal study, we report the initial impact of a fundoplication on the quality of life of both children and their caregivers.
The primary objective of this study was to determine change over time in the quality of life of children with neurological impairment who received surgical treatment of their GERD and of the caregivers of these children, controlling for the degree of functional impairment of the children. We hypothesized that child and caregiver quality of life would both improve after primary fundoplication and gastrostomy tube placement. Secondary objectives included describing rates of complications in this population.
METHODS
Setting and Study Population
We enrolled patients from newborn to 18 years of age who had a diagnosis compatible with neurological impairment and who received their first fundoplication for GERD between January 2005 and July 2006 at Primary Children's Medical Center (PCMC), in Salt Lake City, Utah. PCMC is a 232‐bed children's hospital in the Intermountain West owned and operated by Intermountain Healthcare, Inc., a large vertically integrated health care delivery system that serves as both the primary hospital for Salt Lake County and as the tertiary‐care hospital for 4 additional states (Wyoming, Nevada, Idaho, and Montana).25 Patients who had a previous gastrojejunal feeding tube were excluded as were patients who had a previous fundoplication, as these procedures may have biased their reported quality of life, our main outcome measure.
Patients were included in the study if they had GERD (based on clinical history or testing) that had been refractory to medical management (defined as continued gastroesophageal reflux symptoms despite antireflux medications). GERD was defined using the North American Society for Pediatric Gastroenterology, Hepatology and Nutrition (NASPGHAN) criteria.26 These include: the presence of clinical symptoms and at least 1 abnormal result from an upper gastrointestinal x‐ray series (recognizing that this test is neither sensitive nor specific for reflux), pH probe, upper gastrointestinal endoscopy with biopsy, nuclear medicine scan, or a modified barium swallow. As this was a prospective observational study, physicians were allowed to order testing as their practice dictated. Patients were excluded if they had neurological impairment but lacked objective documentation of GERD using the NASPGHAN recommendations, unless there were obvious clinical indications such as witnessed vomiting and aspiration (N = 3). No patient received a prophylactic fundoplication (fundoplication without documented GERD).
Study Design
This is an ongoing prospective longitudinal study. Patients who had a first fundoplication at PCMC were identified by the surgical service, with weekly lists shared with the research team. Patients were approached by a research assistant during that initial hospitalization to see if they met inclusion criteria for the study using data from the medical records and surgical team when necessary.
Data Variables and Sources
Indications for the fundoplication, performance and results of diagnostic testing for GERD, complications of the fundoplication, and reasons for the neurological impairment were obtained through review of the electronic and paper medical records. Mortality data, subsequent emergency department visits, and admissions to the hospital were obtained using Intermountain Healthcare's electronic data warehouse, which merges clinical, financial, and administrative data including the Utah Vital Statistics database.
Neurological impairment was defined from 2 sources: (1) clinical diagnoses as identified by providers and (2) International Classification of Diseases Codes Modified, version 9 (ICD‐9 CM) identified a priori as indicating neurological impairment.
Instruments and Study Outcomes
Functional status was measured using the WeeFIM. This instrument has been tested and shown to be valid and reliable for children more than 6 months old with neurodevelopmental disabilities including spina bifida and Down syndrome.2732 WeeFIM is a self‐administered parent instrument composed of 18 items and 6 domains (self‐care, sphincter control, transfers, locomotion, communication, and social cognition).33 The WeeFIM allows patients to be stratified into areas of function from severely impaired to normal.
The primary outcome was child quality of life as measured by the Child Health Questionnaire Parental Form 50 (CHQ‐PF50). Caregiver quality of life was measured using the Short‐Form Health Status Survey (SF‐36) and Parenting Stress Index/Short Form (PSI/SF). The CHQ‐PF50 is a self‐administered parent questionnaire of 50 questions that measures 6 domains, including physical function and abilities, pain and discomfort, general health perception, behavior, temperament and moods, and satisfaction with growth and development.34 This instrument has been tested for validity and reliability in children with cerebral palsy.35 The SF‐36 is a widely accepted measure of health status that measures 8 domains of health: physical functioning, role limitations due to physical problems, bodily pain, general health, vitality, social functioning, role limitations due to emotional problems, and mental health. The SF‐36 has been well studied and has been used to measure the effect on a caregiver's quality of life associated with caring for a chronically ill child with significant medical problems.36, 37 Higher scores in each domain of both the CHQPF50 and the SF‐36 reflect better quality of life. Caregiver stress was measured using the PSI/SF (Psychological Assessment Resources Inc, Odessa, FL).38 In the PSI/SF a parent rates the parentchild dyad on 36 items that are summarized in 3 subscales: parental distress, parentchild dysfunctional interaction, and difficult child. A parent scores each item as strongly agree, agree, not sure, disagree, or strongly disagree. The sum of the 3 subscale scores is the total stress score. Higher scores denote a greater degree of stress. The PSI/SF has been validated in several studies for caregivers of children with chronic diseases.3943
The CHQ‐PF50, SF‐36, and PSI/SF questionnaires and the WeeFIM functional status measure were administered to each study patient and caregiver in person at enrollment (baseline) and by mail 1 month after fundoplication. A follow‐up postcard reminder was mailed 1 week after the initial mailing. Second and final mailings were sent to nonresponders 3 and 5 weeks, respectively, after the initial mailing.
Secondary outcomes included rates of complications including failure of the fundoplication. Complications were defined as a subsequent emergency department visit, hospitalization, or death related to the surgery, gastrostomy tube, or aspiration pneumonia. Failures were defined as a second fundoplication or the insertion of a gastrojejunal feeding tube as nonsurgical management of recurrent GERD and/or paraesophageal hernia. Secondary outcomes were followed from the time of the first fundoplication until 1 month after surgery.
Analyses
The differential effect of the fundoplication on the quality of life measures was assessed and quantified through statistical analysis. Because the primary interest was to measure change in baseline characteristics over time, repeated‐measures models were used to compare the group relative to changes in functional status. In particular, changes from baseline values were modeled 1 month after the procedure. The Kenward‐Roger approximation of degrees of freedom was used to compute P values from the overall tests.44 Repeated‐measures models were fit to the data using restricted maximum likelihood estimation. An autoregressive covariance matrix was assumed for the multiple measurements of each individual, thus limiting the number of restrictions forced by the model on the data. The repeated‐measures models used all the available data on participants, including those who dropped out of the study. To obtain the most accurate comparison of the study group, the covariate of functional status at baseline was taken into account in the fitted models. Statistical analyses were performed with SAS statistical software (version 9.13; SAS Institute, Cary NC). Student t tests were performed for comparison of means of the quality‐of‐life domains for the study cohort compared to either the general population or specific groups of patients for comparative purposes.
The study was approved by the institutional review boards of the University of Utah Health Sciences Center and Primary Children's Medical Center.
RESULTS
Sixty‐three children met eligibility criteria. Forty‐four families (70%) initially agreed to participate in the study and completed the baseline questionnaires (see Fig. 1). The mean age of the children was 2.2 years. Twenty‐six parents of children completed the 1‐month postfundoplication quality‐of‐life questionnaires. Thirteen patients were lost to follow‐up, 5 of whom had not reached the 1‐month postfundoplication time point. The median WeeFIM (functional status) score of the whole group was 31.2 (95% confidence interval [CI] 11‐71) compared with a childhood matched‐age norm of 83 (95% CI 60‐110), P = .001. WeeFIM scores did not change significantly from baseline to 1 month, P = .98 (Kruskall‐Wallis test).
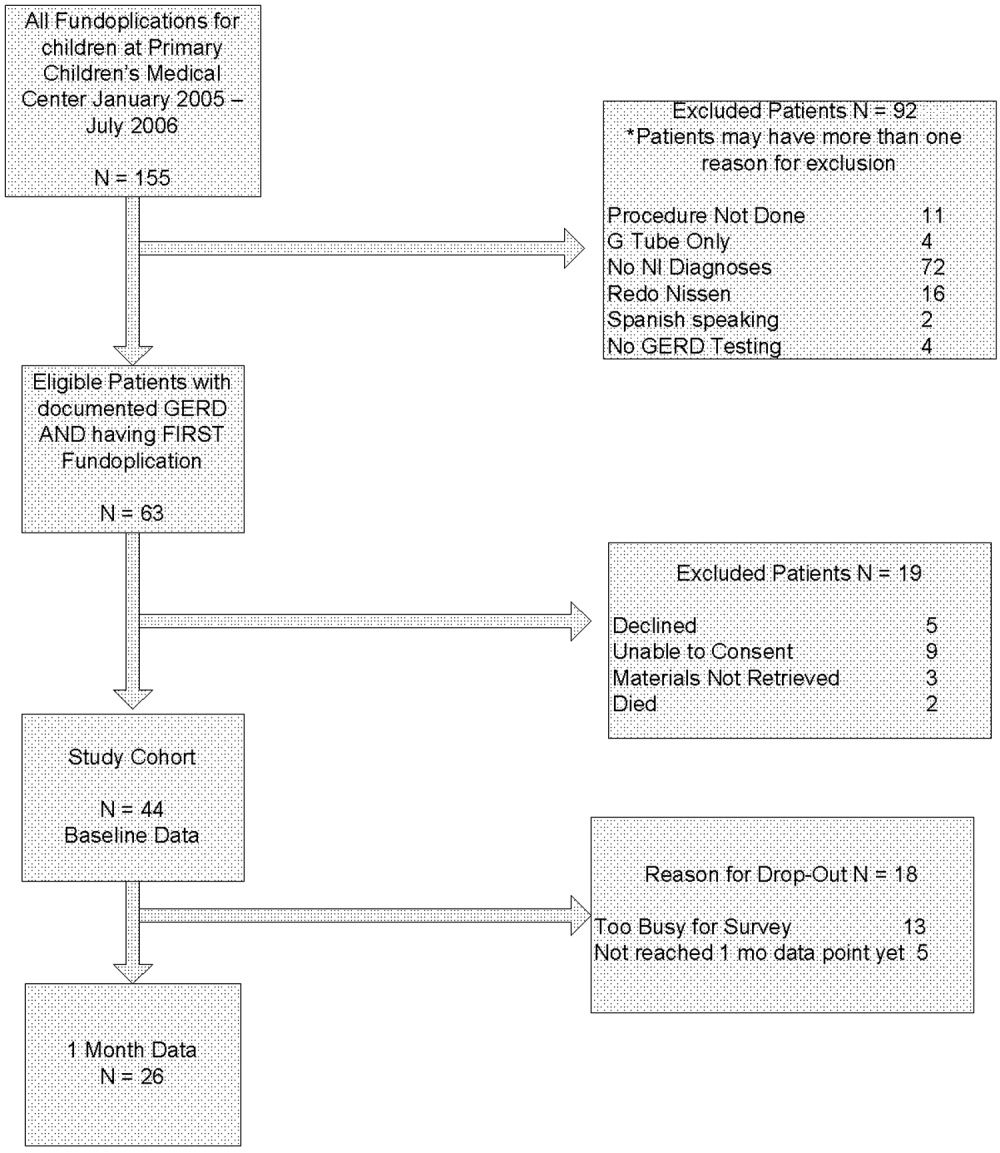
Data for the 13 parents and children (30%) who gave baseline data but were subsequently lost to follow‐up are shown in Table 1. Reasons for loss to follow‐up were caregiver reporting being too busy to fill out the questionnaires (n = 8) and no reason stated (n = 5).
In addition to the diagnosis of GERD, clinical indications for fundoplication were vomiting (55%), feeding‐related issues (47%), and failure to thrive (39%). Diagnosis of GERD was confirmed for 41 of 44 patients77% had an abnormal upper GI, 26% an abnormal pH probe, 14% an abnormal endoscopy, and 24% an abnormal swallow study. The remaining 3 had obvious clinical symptoms for GERD and did not require further testing according to their attending surgeon (2 with witnessed vomiting leading to aspiration and 1 who was exclusively gastrostomy‐fed and was witnessed having feeds coming from the tracheostomy). Various medications had been tried and were considered to have failed in these patients: 39% had been treated with acid‐suppressive agents; 80% with acid blocking agents; and 61% with prokinetic agents. Fourteen patients (32%) had cerebral palsy, and 14 (32%) had a brain or spinal cord abnormality (see Table 2).
| Diagnostic category | ICD‐9 codes used |
|---|---|
| |
| Brain or spinal cord anomaly | 335.22, 742.0, 742.1, 742.2, 742.4, 742.53 |
| Cerebral palsy | 343.0, 343.1, 343.2, 343.8, 343.9, 344.00 |
| Hydrocephalus | 331.3, 331.4, 742.3 |
| Down syndrome | 758.0 |
| Seizures | 345.10, 345.11, 345.3, 345.41, 345.50, 345.81, 345.90, 345.91 |
| Muscular dystrophy or myopathy | 359.0, 359.1, 359.2, 359.9 |
| Nervous system anomaly | 742.8, 742.9 |
| Cerebral degeneration | 330.8, 331.9 |
| Chromosomal anomaly | 758.2, 758.3, 758.5, 758.89 |
| Infantile spasms | 345.60, 345.61 |
| Menial retardation | 317.0, 318.1, 318.2 |
| Spinal muscle atrophy | 335.0, 335.10 |
Thirty‐four children underwent a laparoscopic Nissen fundoplication, and 10 had an open Nissen fundoplication. All had gastrostomy tubes placed or replaced at the time of surgery.
Analysis of the mean bodily pain scores from the CHQ‐PF50 revealed that bodily pain of patients in the study cohort had improved from baseline after 1 month of follow‐up (mean score at baseline, 32.8; after 1 month of follow‐up, 47.5; P = .01), after adjusting for functional status. However, these mean bodily pain scores were significantly lower than those of children with cerebral palsy (mean score, 73.9; P .001).34, 35 After adjusting for functional status, scores were improved for role/social‐physical limitations (mean baseline score, 30.6; 1‐month follow‐up score, 56.6; P = .01), mental health (mean baseline score, 62.7; 1‐month follow‐up score, 70.6; P = .01), family limitation of activities (mean baseline score, 43.3; 1‐month follow‐up score, 55.1; P = .03), and parental time (mean baseline score, 43.0; 1‐month follow‐up score, 55.3; P = .03). Scores were unchanged for physical function, global health, general health perception, physical summary, role/social‐emotional, mental health, self‐esteem, and psychological summary (see Table 3).
| Domain of Quality of Life | Baseline (Mean and SD) | 1‐Month Follow‐Up (Mean and SD) | P Value |
|---|---|---|---|
| Physical functioning | 19.3 (34.1) | 16.7 (30.8) | 0.77 |
| Role physical* | 30.6 (44.4) | 56.6 (40.5) | 0.01 |
| Bodily pain* | 32.8 (24.4) | 47.5 (25.7) | 0.01 |
| Global health | 42.0 (23.7) | 44.1 (22.6) | 0.19 |
| General behavior | 72.1 (29.3) | 78.7 (14.5) | 0.21 |
| Self‐esteem | 39.9 (21.1) | 32.8 (19.4) | 0.36 |
| Mental health | 62.7 (15.9) | 70.6 (16.6) | 0.01 |
| Family limitation of activity* | 43.3 (23.7) | 55.1 (21.3) | 0.03 |
| Parental time* | 43.0 (35.5) | 55.3 (32.5) | 0.03 |
| Physical summary | 23.1 (21.2) | 17.8 (13.9) | 0.17 |
| Psychological summary | 39.0 (11.8) | 39.6 (10.8) | 0.76 |
Analysis of the SF‐36 of the parents of these children revealed mean scores significantly lower than those in general U.S. population for all quality‐of‐life domains except physical function (see Table 4). Many baseline domain scores were similar to those of adults with clinical depression. The only domain that showed improvement in quality of life of the caregivers over the 1‐month follow‐up period was vitality (mean baseline score, 41.3; 1‐month follow‐up score, 48.2; P = .001).
| Quality‐of‐life domain | Study group mean (SD) | U.S. population norm mean (SD) | P value |
|---|---|---|---|
| |||
| Physical functioning | 89.35 (14.60) | 84.15 (23.26) | 0.10 |
| Role physical | 71.02 (39.96) | 80.96 (34.00) | 0.05 |
| Bodily pain | 82.50 (24.00) | 75.15 (23.69) | 0.04 |
| General Health* | 59.07 (18.75) | 71.95 (20.34) | 0.001 |
| Vitality* | 41.33 (19.49) | 60.86 (33.04) | 0.001 |
| Social functioning* | 63.33 (34.48) | 83.28 (22.69) | 0.001 |
| Role emotional | 60.60 (40.20) | 81.26 (33.04) | 0.001 |
| Mental health | 67.00 (19.61) | 74.74 (18.05) | 0.004 |
Total stress as measured by the PSI/SF mean was 79.1 at baseline and 77.6 1 month after fundoplication (P = .54). This was significantly higher stress than the parental norm of 71.0 (P = .01). One in 4 parents expressed clinically significant levels of stress (scores > 90, 90th percentile).
Patients suffered the following complications in the month after fundoplication. Eight children had at least 1 subsequent emergency department visit related to a complication of the gastrostomy tube (8 visits), to respiratory distress (1 visit), or tovomiting (1 visit). Seven children had a subsequent admission to the hospital related to a complication of the gastrostomy tube (4 admissions), complication of surgery (2 admissions), or aspiration pneumonia (1 admission). None of the children had a repeat fundoplication or subsequently underwent placement of a gastrojejunal feeding tube. One patient died. She was 10 months old when she died, which was 3 weeks after she had received a fundoplication. She had obstructive hydrocephalus, cortical blindness, and developmental delay, and respiratory arrest and subsequent tonsillar herniation led to her death.
DISCUSSION
Parents of children with neurological impairment and GERD who underwent their first fundoplication reported improved quality of life of their children in the domains of bodily pain, role/social‐physical limitations, mental health, family limitation of activities, and parental time over the first month after surgery, when controlling for the children's degree of functional impairment. The only significant similar improvement in the parent self‐reported quality of life was in the domain of vitality.
This study had several limitations. Loss to follow‐up may have led to a bias reflecting the phenomenon that patients who have poorer quality of life are less likely to report this, or even to be able to participate in the follow‐up component of a study like this. In survival analyses, this incomplete follow‐up of patients is called informative dropout and may be minimized by applying a statistical technique that accounts for this, using the Q‐TWiST.45 However, our current study design and analysis plan precluded using this methodology. As shown in Table 1, we did not find any differences between those patients who stayed in the study and those who dropped out. Also, we were able to contact most parents who reported being too busy to fill out the surveys. Patient heterogeneity is also a concern: Table 2 shows the wide array of diagnoses responsible for the children's neurological impairment. However, we used a standardized functional status measure to ensure we were analyzing similarly disabled patients. Also, the standard deviation of the mean WeeFIM score was small, implying little variability in the study cohort. Our study analyzed data from a single center, which reflects care in the western United States. However, our hospital is similar to other medium and large children's hospitals and our patient population similar to others that perform fundoplication for children with neurological impairment.46 We believe our findings are generalizable to other surgical centers that perform a similar volume of fundoplications in such children with NI.
Our study findings are similar to those reported by O'Neill et al., whose study found that parents reported improved quality of life of their children in ease of feedings, physical comfort during feeding, and ability of the child to enjoy life.23 The CHQPF50 does not specifically ask about feeding, but we did find similar improvement in the domain of role/social‐physical limitations. O'Neill et al. also found that after the children in their study received a fundoplication, caregivers reported their own quality of life improved in the areas of being able to spend more time caring for their child's needs, which is similar to our findings of fewer family limitations of activities and more parental time. Our findings were somewhat dissimilar to the O'Neill et al. study, as parents in their study found several additional areas of improvement in caregiver own quality of life. One explanation for the differing results may be differences in the populations studied. Parents in our study had SF‐36 scores for general health, vitality, and social functioning that were similar to those of adults with depression,47 whereas parents in the O'Neill study did not. Although the O'Neill et al. study was the first to examine these critical quality‐of‐life outcomes for children with NI who have received fundoplication, it had several methodological limitations. We have had the opportunity to build on the work of O'Neill et al. and in a prospective study to capture standardized baseline data (therefore not subject to recall bias, as was likely in the O'Neill et al. study) and collect long‐term data on this population. We also controlled for functional status, which did not improve over the 1 month and by itself could be responsible for the already poor caregiver quality of life. Some aspects of the children's care did improve, but perhaps not enough to overcome the severe disabilities the children and their caregivers live with on a daily basis. We found some evidence to support that the parents' PSI/SF scores were similar to those of parents of children with heart disease, other enterally fed children, and children with traumatic brain injury (who make up between 1 in 3 and 1 in 5 parents with severe stress).39, 41, 43 Future interventions should address the stress and quality of life of these caregivers, especially if surgery does not improve caregiver quality of life or decrease stress.
Contrary to an emerging body of literature in pediatrics that describes a positive correlation between the health of children with chronic illnesses and their caregivers' quality of life,12, 42 we did not find large immediate improvements in caregiver quality of life and decrease in stress as their children's quality of life improved. This may be related to the number of parents in our sample being too small to detect such changes or that changes in longer‐term (greater than 6 months or 1 year) quality of life not being reflected by short‐term assessment. Caregiver and child quality of life following fundoplication needs to be studied over the long term (eg, over many years). We are continuing to follow these patients and their families and will repeat the quality‐of‐life measures 6 and 12 months after fundoplication and report these findings.
Additional studies of treatments for neurologically impaired children with GERD are needed. Randomized trials of alternatives to fundoplication such as gastrojejunal feeding tubes have been proposed, with which we strongly agree.46, 48 We believe that any randomized, controlled trial of children with neurological impairment and GERD must measure child and caregiver quality of life and functional status outcomes. 0
| Variables | Study patients at baseline (N = 44) | Study patients at 1‐month follow‐up (N = 26) | P value |
|---|---|---|---|
| Functional Status Measure | |||
| WeeFIM Score | 24 | 36 | NS |
| Child CHQ‐PF50 Quality‐of‐Life Scores | |||
| Role physical | 30.6 | 56.6 | 0.01 |
| Bodily pain | 32.8 | 47.5 | 0.01 |
| Mental health | 62.7 | 70.6 | 0.01 |
| Family limitation of activity | 43.3 | 55.1 | 0.03 |
| Parental time | 43.0 | 55.3 | 0.03 |
| Global health | 42.0 | 44.1 | NS |
| Physical functioning | 19.3 | 16.7 | NS |
| General behavior | 72.1 | 78.7 | NS |
| Self‐esteem | 39.9 | 32.8 | NS |
| Role emotional | 27.1 | 37.1 | NS |
| Physical summary | 23.1 | 17.8 | NS |
| Psychological summary | 39.0 | 39.6 | NS |
| Caregiver SF‐36 Quality‐of‐Life Scores | |||
| Vitality | 41.3 | 46.9 | 0.001 |
| Role physical | 89.9 | 92.5 | NS |
| Bodily pain | 71.0 | 78.7 | NS |
| General health | 82.5 | 81.1 | NS |
| Social functioning | 59.1 | 59.5 | NS |
| Role emotional | 60.6 | 65.6 | NS |
| Mental health | 67.0 | 73.5 | NS |
| Parenting stress index | 79.1 | 77.7 | NS |
Acknowledgements
The authors thank Tanner Coleman and Matthew Swenson for their invaluable help in recruiting patients. Dr. Srivastava was supported in part by the Children's Health Research Center, University of Utah and Primary Children's Medical Center Foundation.
- ,,.Comparison of respiratory mortality in the profoundly mentally retarded and in the less retarded.J Ment Defic Res.1979;23(1):1–7.
- ,,.Cause of death in cerebral palsy: a descriptive study.Arch Dis Child.1999;81:390–394.
- .Survival rates of children with severe neurologic disabilities: a review.Semin Pediatr Neurol.2003;10(2):120–129.
- ,.Gastroesophageal reflux among severely retarded children.J Pediatr.1979;94:710–714.
- ,,,,,.Operation for gastro‐oesophageal reflux associated with severe mental retardation.Arch Dis Child.1993;68:347–351.
- ,,,,,.Prevalence and severity of feeding and nutritional problems in children with neurological impairment: Oxford Feeding Study.Dev Med Child Neurol.2000;42:674–680.
- ,,, et al.Aspiration pneumonia in pediatric age group: etiology, predisposing factors and clinical outcome.J Pak Med Assoc.1999;49(4):105–108.
- ,.Respiratory problems in children with neurological impairment.Arch Dis Child.2003;88(1):75–78.
- ,.Gastroesophageal reflux in childhood.Curr Probl Surg.1996;33(1):1–70.
- ,.Minimally invasive surgical techniques in reoperative surgery for gastroesophageal reflux disease in infants and children.Am Surg.2002;68:989–992.
- .Laparoscopic Nissen procedure in children.Semin Laparosc Surg.2002;9(3):146–152.
- ,,, et al.Caregiving process and caregiver burden: conceptual models to guide research and practice.BMC Pediatr.2004;4(1):1.
- ,.Theoretical and psychometric analysis of caregiver strain.Res Nurs Health.1996;19:499–510.
- ,,,,,.Complications and reoperation after Nissen fundoplication in childhood.Am J Surg.1987;153(2):177–183.
- ,,, et al.Surgical treatment of gastroesophageal reflux in children: a combined hospital study of 7467 patients.Pediatrics.1998;101:419–422.
- ,,,,,.Outcomes of surgical fundoplication in children.Clin Gastroenterol Hepatol.2004;2:978–984.
- ,,, et al.The respiratory advantage of laparoscopic Nissen fundoplication.J Pediatr Surg.2003;38:886–891.
- ,,,.Laparoscopic Nissen fundoplication in children: 2‐5‐year follow‐up.Pediatr Surg Int.2003;19:537–539.
- ,,.Recognition of recurrent gastroesophageal reflux following antireflux surgery in the neurologically disabled child: high index of suspicion and definitive evaluation.J Pediatr Surg.1992;27:983–988; discussion988–990.
- ,,.Sequelae of antireflux surgery in profoundly disabled children.J Pediatr Surg.1992;27(2):267–271; discussion271–263.
- ,,.Efficacy of the Nissen fundoplication in the management of gastroesophageal reflux following esophageal atresia repair.J Pediatr Surg.1993;28(1):53–55.
- ,,,.Caregivers' perceptions following gastrostomy in severely disabled children with feeding problems.Dev Med Child Neurol.1997;39:746–751.
- ,,,,.Care‐giver evaluation of anti‐gastroesophageal reflux procedures in neurologically impaired children: what is the real‐life outcome?J Pediatr Surg.1996;31:375–380.
- ,,, et al.Impact of gastrostomy tube feeding on the quality of life of carers of children with cerebral palsy.Dev Med Child Neurol.2004;46:796–800.
- ,.Organizational responses to managed care: issues for academic health centers and implications for pediatric programs.Pediatrics.1998;101:805–811; discussion811–802.
- Children's Digestive Health and Nutrition Foundation Website. Gastroesophageal Reflux Disease in the Neurologically Impaired Child. Available at: http://www.cdhnf.org/PractitionerSeries.asp. Accessed August 30,2006.
- ,,,,.Functional status of school‐aged children with Down syndrome.J Paediatr Child Health.2002;38(2):160–165.
- ,,,,,.Concurrent validity of the Functional Independence Measure for Children (WeeFIM) and the Pediatric Evaluation of Disabilities Inventory in children with developmental disabilities and acquired brain injuries.Phys Occup Ther Pediatr.2001;21(2–3):91–101.
- ,,, et al.The WeeFIM instrument: its utility in detecting change in children with developmental disabilities.Arch Phys Med Rehabil.2000;81:1317–1326.
- ,,, et al.Functional assessment and care of children with neurodevelopmental disabilities.Am J Phys Med Rehabil.2000;79(2):114–123.
- ,,,,,.Predictors of mortality, morbidity, and disability in a cohort of infants or = 28 weeks' gestation.Clin Pediatr (Phila).1993;32:521–527.
- ,.Content validity of a pediatric functional independence measure.Appl Nurs Res.1990;3(3):120–122.
- ,,, et al.The Functional Independence Measure for Children (WeeFIM). Conceptual basis and pilot use in children with developmental disabilities.Clin Pediatr (Phila). Jul1994;33:421–430.
- ,,.The CHQ User's Manual.1st ed.Boston, MA:The Health Institute, New England Medical Center,1996.
- ,,,,,.Comparing reliability and validity of pediatric instruments for measuring health and well‐being of children with spastic cerebral palsy.Dev Med Child Neurol.2002;44:468–476.
- ,,,,.Needs of carers of severely disabled people: are they identified and met adequately?Health Soc Care Community.2001;9(4):235–243.
- ,,.The realities of postoperative disability and the carer's burden.Ann R Coll Surg Engl.2001;83(3):215–218.
- Abdidin.Parenting Stress Index.3rd ed.Lutz, FL:Psychological Assessment Resources, Inc.;1995.
- ,,,.Parental stress and burden following traumatic brain injury amongst children and adolescents.Brain Inj. Jan2003;17(1):1–23.
- ,,.Comparing stress levels of parents of children with cancer and parents of children with physical disabilities.Psychooncology. Dec2004;13(12):898–903.
- ,,.Stress levels experienced by the parents of enterally fed children.Child Care Health Dev.2004;30:507–513.
- ,,, et al.The health and well‐being of caregivers of children with cerebral palsy.Pediatrics.2005;115:e626–e636.
- ,.Parenting stress and children with heart disease.J Pediatr Health Care.2003;17(4):163–168.
- ,.Small sample inference for fixed effects from restricted maximum likelihood.Biometrics.1997;53:983–997.
- ,,.Methods for the analysis of quality‐of‐life and survival data in health technology assessment.Health Technol Assess.1999;3(10):1–152.
- ,,, et al.Fundoplication and gastrostomy versus image‐guided gastrojejunal tube for enteral feeding in neurologically impaired children with gastroesophageal reflux.J Pediatr Surg.2002;37:407–412.
- SF‐36 Health Survey: Manual and Interpretation Guide.Lincoln, RI:QualityMetric Inc.;1993,year="2000"2000.
- ,,.The role of protective antireflux procedures in neurologically impaired children: a decision analysis.J Pediatr Surg. Mar2002;37:500–506.
Aspiration pneumonia is the most common cause of death in children with severe neurological impairment (NI).13 For several reasons (eg, improved survival of extremely low‐birth‐weight infants, technological advances, and changing societal attitudes), the number of children with severe NI is increasing. Many children with severe NI have dysfunctional swallowing and gastroesophageal reflux disease (GERD).46 This combination places them at high risk for recurrent aspiration that, in turn, leads to aspiration pneumonia, repeated hospitalization, respiratory failure, compromised quality of life, and death.7, 8
The most common treatment approach for the combination of dysfunctional swallowing and GERD is surgical fundoplication with a gastrostomy feeding tube. Fundoplication is the third most common procedure performed in children by pediatric surgeons in the United States.9 Fifty percent of the children who receive a fundoplication have neurological impairment.10, 11 The goals of the surgery to treat GERD unresponsive to medical management are to reduce the risk of aspiration pneumonia, improve nutritional status, and improve the quality of life of the children and their families. However, few prospective longitudinal studies have determined whether the quality of life of the children or their caregivers actually improves over time.
The importance of caregiver and child quality of life is increasingly recognized as a critical outcome of any intervention in this population.12, 13 Previous studies of fundoplication in children with NI, GERD, and dysfunctional swallowing reported surgical mortality rates between 1% and 3% and other complications between 4% and 39%, reflecting the medical fragility of these children.5, 1418 Some of these studies had longitudinal follow‐up and reported long‐term data. Recurrence of symptoms was reported in up to 56% of patients, recurrence of AP in up to 39%, further surgical procedures in up to 19%, and mortality in up to 17%.14, 1921 Few case series of children with neurological impairment who have had a fundoplication have addressed child and caregiver quality of life following either a fundoplication or placement of a feeding tube.2224 In their study of 16 patients who had a fundoplication and gastrostomy tube placed, Tawfik et al. found improvements in children's happiness, ease of giving medicines, and time to devote to other children. Sullivan et al. found improvement in caregiver quality of life following placement of a gastrostomy tube in a child; however, they did not specifically identify those children who had been treated with a fundoplication. In their retrospective study, O'Neill et al. found improved child and caregiver quality of life following a fundoplication. Collectively, these studies have found that parents report improvement of both their own and their child's quality of life after either intervention. However, not having baseline measurements, not controlling for degree of functional impairment of the children, small sample sizes, and large loss to follow‐up limit the utility of these studies. In this ongoing, long‐term prospective longitudinal study, we report the initial impact of a fundoplication on the quality of life of both children and their caregivers.
The primary objective of this study was to determine change over time in the quality of life of children with neurological impairment who received surgical treatment of their GERD and of the caregivers of these children, controlling for the degree of functional impairment of the children. We hypothesized that child and caregiver quality of life would both improve after primary fundoplication and gastrostomy tube placement. Secondary objectives included describing rates of complications in this population.
METHODS
Setting and Study Population
We enrolled patients from newborn to 18 years of age who had a diagnosis compatible with neurological impairment and who received their first fundoplication for GERD between January 2005 and July 2006 at Primary Children's Medical Center (PCMC), in Salt Lake City, Utah. PCMC is a 232‐bed children's hospital in the Intermountain West owned and operated by Intermountain Healthcare, Inc., a large vertically integrated health care delivery system that serves as both the primary hospital for Salt Lake County and as the tertiary‐care hospital for 4 additional states (Wyoming, Nevada, Idaho, and Montana).25 Patients who had a previous gastrojejunal feeding tube were excluded as were patients who had a previous fundoplication, as these procedures may have biased their reported quality of life, our main outcome measure.
Patients were included in the study if they had GERD (based on clinical history or testing) that had been refractory to medical management (defined as continued gastroesophageal reflux symptoms despite antireflux medications). GERD was defined using the North American Society for Pediatric Gastroenterology, Hepatology and Nutrition (NASPGHAN) criteria.26 These include: the presence of clinical symptoms and at least 1 abnormal result from an upper gastrointestinal x‐ray series (recognizing that this test is neither sensitive nor specific for reflux), pH probe, upper gastrointestinal endoscopy with biopsy, nuclear medicine scan, or a modified barium swallow. As this was a prospective observational study, physicians were allowed to order testing as their practice dictated. Patients were excluded if they had neurological impairment but lacked objective documentation of GERD using the NASPGHAN recommendations, unless there were obvious clinical indications such as witnessed vomiting and aspiration (N = 3). No patient received a prophylactic fundoplication (fundoplication without documented GERD).
Study Design
This is an ongoing prospective longitudinal study. Patients who had a first fundoplication at PCMC were identified by the surgical service, with weekly lists shared with the research team. Patients were approached by a research assistant during that initial hospitalization to see if they met inclusion criteria for the study using data from the medical records and surgical team when necessary.
Data Variables and Sources
Indications for the fundoplication, performance and results of diagnostic testing for GERD, complications of the fundoplication, and reasons for the neurological impairment were obtained through review of the electronic and paper medical records. Mortality data, subsequent emergency department visits, and admissions to the hospital were obtained using Intermountain Healthcare's electronic data warehouse, which merges clinical, financial, and administrative data including the Utah Vital Statistics database.
Neurological impairment was defined from 2 sources: (1) clinical diagnoses as identified by providers and (2) International Classification of Diseases Codes Modified, version 9 (ICD‐9 CM) identified a priori as indicating neurological impairment.
Instruments and Study Outcomes
Functional status was measured using the WeeFIM. This instrument has been tested and shown to be valid and reliable for children more than 6 months old with neurodevelopmental disabilities including spina bifida and Down syndrome.2732 WeeFIM is a self‐administered parent instrument composed of 18 items and 6 domains (self‐care, sphincter control, transfers, locomotion, communication, and social cognition).33 The WeeFIM allows patients to be stratified into areas of function from severely impaired to normal.
The primary outcome was child quality of life as measured by the Child Health Questionnaire Parental Form 50 (CHQ‐PF50). Caregiver quality of life was measured using the Short‐Form Health Status Survey (SF‐36) and Parenting Stress Index/Short Form (PSI/SF). The CHQ‐PF50 is a self‐administered parent questionnaire of 50 questions that measures 6 domains, including physical function and abilities, pain and discomfort, general health perception, behavior, temperament and moods, and satisfaction with growth and development.34 This instrument has been tested for validity and reliability in children with cerebral palsy.35 The SF‐36 is a widely accepted measure of health status that measures 8 domains of health: physical functioning, role limitations due to physical problems, bodily pain, general health, vitality, social functioning, role limitations due to emotional problems, and mental health. The SF‐36 has been well studied and has been used to measure the effect on a caregiver's quality of life associated with caring for a chronically ill child with significant medical problems.36, 37 Higher scores in each domain of both the CHQPF50 and the SF‐36 reflect better quality of life. Caregiver stress was measured using the PSI/SF (Psychological Assessment Resources Inc, Odessa, FL).38 In the PSI/SF a parent rates the parentchild dyad on 36 items that are summarized in 3 subscales: parental distress, parentchild dysfunctional interaction, and difficult child. A parent scores each item as strongly agree, agree, not sure, disagree, or strongly disagree. The sum of the 3 subscale scores is the total stress score. Higher scores denote a greater degree of stress. The PSI/SF has been validated in several studies for caregivers of children with chronic diseases.3943
The CHQ‐PF50, SF‐36, and PSI/SF questionnaires and the WeeFIM functional status measure were administered to each study patient and caregiver in person at enrollment (baseline) and by mail 1 month after fundoplication. A follow‐up postcard reminder was mailed 1 week after the initial mailing. Second and final mailings were sent to nonresponders 3 and 5 weeks, respectively, after the initial mailing.
Secondary outcomes included rates of complications including failure of the fundoplication. Complications were defined as a subsequent emergency department visit, hospitalization, or death related to the surgery, gastrostomy tube, or aspiration pneumonia. Failures were defined as a second fundoplication or the insertion of a gastrojejunal feeding tube as nonsurgical management of recurrent GERD and/or paraesophageal hernia. Secondary outcomes were followed from the time of the first fundoplication until 1 month after surgery.
Analyses
The differential effect of the fundoplication on the quality of life measures was assessed and quantified through statistical analysis. Because the primary interest was to measure change in baseline characteristics over time, repeated‐measures models were used to compare the group relative to changes in functional status. In particular, changes from baseline values were modeled 1 month after the procedure. The Kenward‐Roger approximation of degrees of freedom was used to compute P values from the overall tests.44 Repeated‐measures models were fit to the data using restricted maximum likelihood estimation. An autoregressive covariance matrix was assumed for the multiple measurements of each individual, thus limiting the number of restrictions forced by the model on the data. The repeated‐measures models used all the available data on participants, including those who dropped out of the study. To obtain the most accurate comparison of the study group, the covariate of functional status at baseline was taken into account in the fitted models. Statistical analyses were performed with SAS statistical software (version 9.13; SAS Institute, Cary NC). Student t tests were performed for comparison of means of the quality‐of‐life domains for the study cohort compared to either the general population or specific groups of patients for comparative purposes.
The study was approved by the institutional review boards of the University of Utah Health Sciences Center and Primary Children's Medical Center.
RESULTS
Sixty‐three children met eligibility criteria. Forty‐four families (70%) initially agreed to participate in the study and completed the baseline questionnaires (see Fig. 1). The mean age of the children was 2.2 years. Twenty‐six parents of children completed the 1‐month postfundoplication quality‐of‐life questionnaires. Thirteen patients were lost to follow‐up, 5 of whom had not reached the 1‐month postfundoplication time point. The median WeeFIM (functional status) score of the whole group was 31.2 (95% confidence interval [CI] 11‐71) compared with a childhood matched‐age norm of 83 (95% CI 60‐110), P = .001. WeeFIM scores did not change significantly from baseline to 1 month, P = .98 (Kruskall‐Wallis test).
Data for the 13 parents and children (30%) who gave baseline data but were subsequently lost to follow‐up are shown in Table 1. Reasons for loss to follow‐up were caregiver reporting being too busy to fill out the questionnaires (n = 8) and no reason stated (n = 5).
In addition to the diagnosis of GERD, clinical indications for fundoplication were vomiting (55%), feeding‐related issues (47%), and failure to thrive (39%). Diagnosis of GERD was confirmed for 41 of 44 patients77% had an abnormal upper GI, 26% an abnormal pH probe, 14% an abnormal endoscopy, and 24% an abnormal swallow study. The remaining 3 had obvious clinical symptoms for GERD and did not require further testing according to their attending surgeon (2 with witnessed vomiting leading to aspiration and 1 who was exclusively gastrostomy‐fed and was witnessed having feeds coming from the tracheostomy). Various medications had been tried and were considered to have failed in these patients: 39% had been treated with acid‐suppressive agents; 80% with acid blocking agents; and 61% with prokinetic agents. Fourteen patients (32%) had cerebral palsy, and 14 (32%) had a brain or spinal cord abnormality (see Table 2).
| Diagnostic category | ICD‐9 codes used |
|---|---|
| |
| Brain or spinal cord anomaly | 335.22, 742.0, 742.1, 742.2, 742.4, 742.53 |
| Cerebral palsy | 343.0, 343.1, 343.2, 343.8, 343.9, 344.00 |
| Hydrocephalus | 331.3, 331.4, 742.3 |
| Down syndrome | 758.0 |
| Seizures | 345.10, 345.11, 345.3, 345.41, 345.50, 345.81, 345.90, 345.91 |
| Muscular dystrophy or myopathy | 359.0, 359.1, 359.2, 359.9 |
| Nervous system anomaly | 742.8, 742.9 |
| Cerebral degeneration | 330.8, 331.9 |
| Chromosomal anomaly | 758.2, 758.3, 758.5, 758.89 |
| Infantile spasms | 345.60, 345.61 |
| Menial retardation | 317.0, 318.1, 318.2 |
| Spinal muscle atrophy | 335.0, 335.10 |
Thirty‐four children underwent a laparoscopic Nissen fundoplication, and 10 had an open Nissen fundoplication. All had gastrostomy tubes placed or replaced at the time of surgery.
Analysis of the mean bodily pain scores from the CHQ‐PF50 revealed that bodily pain of patients in the study cohort had improved from baseline after 1 month of follow‐up (mean score at baseline, 32.8; after 1 month of follow‐up, 47.5; P = .01), after adjusting for functional status. However, these mean bodily pain scores were significantly lower than those of children with cerebral palsy (mean score, 73.9; P .001).34, 35 After adjusting for functional status, scores were improved for role/social‐physical limitations (mean baseline score, 30.6; 1‐month follow‐up score, 56.6; P = .01), mental health (mean baseline score, 62.7; 1‐month follow‐up score, 70.6; P = .01), family limitation of activities (mean baseline score, 43.3; 1‐month follow‐up score, 55.1; P = .03), and parental time (mean baseline score, 43.0; 1‐month follow‐up score, 55.3; P = .03). Scores were unchanged for physical function, global health, general health perception, physical summary, role/social‐emotional, mental health, self‐esteem, and psychological summary (see Table 3).
| Domain of Quality of Life | Baseline (Mean and SD) | 1‐Month Follow‐Up (Mean and SD) | P Value |
|---|---|---|---|
| Physical functioning | 19.3 (34.1) | 16.7 (30.8) | 0.77 |
| Role physical* | 30.6 (44.4) | 56.6 (40.5) | 0.01 |
| Bodily pain* | 32.8 (24.4) | 47.5 (25.7) | 0.01 |
| Global health | 42.0 (23.7) | 44.1 (22.6) | 0.19 |
| General behavior | 72.1 (29.3) | 78.7 (14.5) | 0.21 |
| Self‐esteem | 39.9 (21.1) | 32.8 (19.4) | 0.36 |
| Mental health | 62.7 (15.9) | 70.6 (16.6) | 0.01 |
| Family limitation of activity* | 43.3 (23.7) | 55.1 (21.3) | 0.03 |
| Parental time* | 43.0 (35.5) | 55.3 (32.5) | 0.03 |
| Physical summary | 23.1 (21.2) | 17.8 (13.9) | 0.17 |
| Psychological summary | 39.0 (11.8) | 39.6 (10.8) | 0.76 |
Analysis of the SF‐36 of the parents of these children revealed mean scores significantly lower than those in general U.S. population for all quality‐of‐life domains except physical function (see Table 4). Many baseline domain scores were similar to those of adults with clinical depression. The only domain that showed improvement in quality of life of the caregivers over the 1‐month follow‐up period was vitality (mean baseline score, 41.3; 1‐month follow‐up score, 48.2; P = .001).
| Quality‐of‐life domain | Study group mean (SD) | U.S. population norm mean (SD) | P value |
|---|---|---|---|
| |||
| Physical functioning | 89.35 (14.60) | 84.15 (23.26) | 0.10 |
| Role physical | 71.02 (39.96) | 80.96 (34.00) | 0.05 |
| Bodily pain | 82.50 (24.00) | 75.15 (23.69) | 0.04 |
| General Health* | 59.07 (18.75) | 71.95 (20.34) | 0.001 |
| Vitality* | 41.33 (19.49) | 60.86 (33.04) | 0.001 |
| Social functioning* | 63.33 (34.48) | 83.28 (22.69) | 0.001 |
| Role emotional | 60.60 (40.20) | 81.26 (33.04) | 0.001 |
| Mental health | 67.00 (19.61) | 74.74 (18.05) | 0.004 |
Total stress as measured by the PSI/SF mean was 79.1 at baseline and 77.6 1 month after fundoplication (P = .54). This was significantly higher stress than the parental norm of 71.0 (P = .01). One in 4 parents expressed clinically significant levels of stress (scores > 90, 90th percentile).
Patients suffered the following complications in the month after fundoplication. Eight children had at least 1 subsequent emergency department visit related to a complication of the gastrostomy tube (8 visits), to respiratory distress (1 visit), or tovomiting (1 visit). Seven children had a subsequent admission to the hospital related to a complication of the gastrostomy tube (4 admissions), complication of surgery (2 admissions), or aspiration pneumonia (1 admission). None of the children had a repeat fundoplication or subsequently underwent placement of a gastrojejunal feeding tube. One patient died. She was 10 months old when she died, which was 3 weeks after she had received a fundoplication. She had obstructive hydrocephalus, cortical blindness, and developmental delay, and respiratory arrest and subsequent tonsillar herniation led to her death.
DISCUSSION
Parents of children with neurological impairment and GERD who underwent their first fundoplication reported improved quality of life of their children in the domains of bodily pain, role/social‐physical limitations, mental health, family limitation of activities, and parental time over the first month after surgery, when controlling for the children's degree of functional impairment. The only significant similar improvement in the parent self‐reported quality of life was in the domain of vitality.
This study had several limitations. Loss to follow‐up may have led to a bias reflecting the phenomenon that patients who have poorer quality of life are less likely to report this, or even to be able to participate in the follow‐up component of a study like this. In survival analyses, this incomplete follow‐up of patients is called informative dropout and may be minimized by applying a statistical technique that accounts for this, using the Q‐TWiST.45 However, our current study design and analysis plan precluded using this methodology. As shown in Table 1, we did not find any differences between those patients who stayed in the study and those who dropped out. Also, we were able to contact most parents who reported being too busy to fill out the surveys. Patient heterogeneity is also a concern: Table 2 shows the wide array of diagnoses responsible for the children's neurological impairment. However, we used a standardized functional status measure to ensure we were analyzing similarly disabled patients. Also, the standard deviation of the mean WeeFIM score was small, implying little variability in the study cohort. Our study analyzed data from a single center, which reflects care in the western United States. However, our hospital is similar to other medium and large children's hospitals and our patient population similar to others that perform fundoplication for children with neurological impairment.46 We believe our findings are generalizable to other surgical centers that perform a similar volume of fundoplications in such children with NI.
Our study findings are similar to those reported by O'Neill et al., whose study found that parents reported improved quality of life of their children in ease of feedings, physical comfort during feeding, and ability of the child to enjoy life.23 The CHQPF50 does not specifically ask about feeding, but we did find similar improvement in the domain of role/social‐physical limitations. O'Neill et al. also found that after the children in their study received a fundoplication, caregivers reported their own quality of life improved in the areas of being able to spend more time caring for their child's needs, which is similar to our findings of fewer family limitations of activities and more parental time. Our findings were somewhat dissimilar to the O'Neill et al. study, as parents in their study found several additional areas of improvement in caregiver own quality of life. One explanation for the differing results may be differences in the populations studied. Parents in our study had SF‐36 scores for general health, vitality, and social functioning that were similar to those of adults with depression,47 whereas parents in the O'Neill study did not. Although the O'Neill et al. study was the first to examine these critical quality‐of‐life outcomes for children with NI who have received fundoplication, it had several methodological limitations. We have had the opportunity to build on the work of O'Neill et al. and in a prospective study to capture standardized baseline data (therefore not subject to recall bias, as was likely in the O'Neill et al. study) and collect long‐term data on this population. We also controlled for functional status, which did not improve over the 1 month and by itself could be responsible for the already poor caregiver quality of life. Some aspects of the children's care did improve, but perhaps not enough to overcome the severe disabilities the children and their caregivers live with on a daily basis. We found some evidence to support that the parents' PSI/SF scores were similar to those of parents of children with heart disease, other enterally fed children, and children with traumatic brain injury (who make up between 1 in 3 and 1 in 5 parents with severe stress).39, 41, 43 Future interventions should address the stress and quality of life of these caregivers, especially if surgery does not improve caregiver quality of life or decrease stress.
Contrary to an emerging body of literature in pediatrics that describes a positive correlation between the health of children with chronic illnesses and their caregivers' quality of life,12, 42 we did not find large immediate improvements in caregiver quality of life and decrease in stress as their children's quality of life improved. This may be related to the number of parents in our sample being too small to detect such changes or that changes in longer‐term (greater than 6 months or 1 year) quality of life not being reflected by short‐term assessment. Caregiver and child quality of life following fundoplication needs to be studied over the long term (eg, over many years). We are continuing to follow these patients and their families and will repeat the quality‐of‐life measures 6 and 12 months after fundoplication and report these findings.
Additional studies of treatments for neurologically impaired children with GERD are needed. Randomized trials of alternatives to fundoplication such as gastrojejunal feeding tubes have been proposed, with which we strongly agree.46, 48 We believe that any randomized, controlled trial of children with neurological impairment and GERD must measure child and caregiver quality of life and functional status outcomes. 0
| Variables | Study patients at baseline (N = 44) | Study patients at 1‐month follow‐up (N = 26) | P value |
|---|---|---|---|
| Functional Status Measure | |||
| WeeFIM Score | 24 | 36 | NS |
| Child CHQ‐PF50 Quality‐of‐Life Scores | |||
| Role physical | 30.6 | 56.6 | 0.01 |
| Bodily pain | 32.8 | 47.5 | 0.01 |
| Mental health | 62.7 | 70.6 | 0.01 |
| Family limitation of activity | 43.3 | 55.1 | 0.03 |
| Parental time | 43.0 | 55.3 | 0.03 |
| Global health | 42.0 | 44.1 | NS |
| Physical functioning | 19.3 | 16.7 | NS |
| General behavior | 72.1 | 78.7 | NS |
| Self‐esteem | 39.9 | 32.8 | NS |
| Role emotional | 27.1 | 37.1 | NS |
| Physical summary | 23.1 | 17.8 | NS |
| Psychological summary | 39.0 | 39.6 | NS |
| Caregiver SF‐36 Quality‐of‐Life Scores | |||
| Vitality | 41.3 | 46.9 | 0.001 |
| Role physical | 89.9 | 92.5 | NS |
| Bodily pain | 71.0 | 78.7 | NS |
| General health | 82.5 | 81.1 | NS |
| Social functioning | 59.1 | 59.5 | NS |
| Role emotional | 60.6 | 65.6 | NS |
| Mental health | 67.0 | 73.5 | NS |
| Parenting stress index | 79.1 | 77.7 | NS |
Acknowledgements
The authors thank Tanner Coleman and Matthew Swenson for their invaluable help in recruiting patients. Dr. Srivastava was supported in part by the Children's Health Research Center, University of Utah and Primary Children's Medical Center Foundation.
- ,,.Comparison of respiratory mortality in the profoundly mentally retarded and in the less retarded.J Ment Defic Res.1979;23(1):1–7.
- ,,.Cause of death in cerebral palsy: a descriptive study.Arch Dis Child.1999;81:390–394.
- .Survival rates of children with severe neurologic disabilities: a review.Semin Pediatr Neurol.2003;10(2):120–129.
- ,.Gastroesophageal reflux among severely retarded children.J Pediatr.1979;94:710–714.
- ,,,,,.Operation for gastro‐oesophageal reflux associated with severe mental retardation.Arch Dis Child.1993;68:347–351.
- ,,,,,.Prevalence and severity of feeding and nutritional problems in children with neurological impairment: Oxford Feeding Study.Dev Med Child Neurol.2000;42:674–680.
- ,,, et al.Aspiration pneumonia in pediatric age group: etiology, predisposing factors and clinical outcome.J Pak Med Assoc.1999;49(4):105–108.
- ,.Respiratory problems in children with neurological impairment.Arch Dis Child.2003;88(1):75–78.
- ,.Gastroesophageal reflux in childhood.Curr Probl Surg.1996;33(1):1–70.
- ,.Minimally invasive surgical techniques in reoperative surgery for gastroesophageal reflux disease in infants and children.Am Surg.2002;68:989–992.
- .Laparoscopic Nissen procedure in children.Semin Laparosc Surg.2002;9(3):146–152.
- ,,, et al.Caregiving process and caregiver burden: conceptual models to guide research and practice.BMC Pediatr.2004;4(1):1.
- ,.Theoretical and psychometric analysis of caregiver strain.Res Nurs Health.1996;19:499–510.
- ,,,,,.Complications and reoperation after Nissen fundoplication in childhood.Am J Surg.1987;153(2):177–183.
- ,,, et al.Surgical treatment of gastroesophageal reflux in children: a combined hospital study of 7467 patients.Pediatrics.1998;101:419–422.
- ,,,,,.Outcomes of surgical fundoplication in children.Clin Gastroenterol Hepatol.2004;2:978–984.
- ,,, et al.The respiratory advantage of laparoscopic Nissen fundoplication.J Pediatr Surg.2003;38:886–891.
- ,,,.Laparoscopic Nissen fundoplication in children: 2‐5‐year follow‐up.Pediatr Surg Int.2003;19:537–539.
- ,,.Recognition of recurrent gastroesophageal reflux following antireflux surgery in the neurologically disabled child: high index of suspicion and definitive evaluation.J Pediatr Surg.1992;27:983–988; discussion988–990.
- ,,.Sequelae of antireflux surgery in profoundly disabled children.J Pediatr Surg.1992;27(2):267–271; discussion271–263.
- ,,.Efficacy of the Nissen fundoplication in the management of gastroesophageal reflux following esophageal atresia repair.J Pediatr Surg.1993;28(1):53–55.
- ,,,.Caregivers' perceptions following gastrostomy in severely disabled children with feeding problems.Dev Med Child Neurol.1997;39:746–751.
- ,,,,.Care‐giver evaluation of anti‐gastroesophageal reflux procedures in neurologically impaired children: what is the real‐life outcome?J Pediatr Surg.1996;31:375–380.
- ,,, et al.Impact of gastrostomy tube feeding on the quality of life of carers of children with cerebral palsy.Dev Med Child Neurol.2004;46:796–800.
- ,.Organizational responses to managed care: issues for academic health centers and implications for pediatric programs.Pediatrics.1998;101:805–811; discussion811–802.
- Children's Digestive Health and Nutrition Foundation Website. Gastroesophageal Reflux Disease in the Neurologically Impaired Child. Available at: http://www.cdhnf.org/PractitionerSeries.asp. Accessed August 30,2006.
- ,,,,.Functional status of school‐aged children with Down syndrome.J Paediatr Child Health.2002;38(2):160–165.
- ,,,,,.Concurrent validity of the Functional Independence Measure for Children (WeeFIM) and the Pediatric Evaluation of Disabilities Inventory in children with developmental disabilities and acquired brain injuries.Phys Occup Ther Pediatr.2001;21(2–3):91–101.
- ,,, et al.The WeeFIM instrument: its utility in detecting change in children with developmental disabilities.Arch Phys Med Rehabil.2000;81:1317–1326.
- ,,, et al.Functional assessment and care of children with neurodevelopmental disabilities.Am J Phys Med Rehabil.2000;79(2):114–123.
- ,,,,,.Predictors of mortality, morbidity, and disability in a cohort of infants or = 28 weeks' gestation.Clin Pediatr (Phila).1993;32:521–527.
- ,.Content validity of a pediatric functional independence measure.Appl Nurs Res.1990;3(3):120–122.
- ,,, et al.The Functional Independence Measure for Children (WeeFIM). Conceptual basis and pilot use in children with developmental disabilities.Clin Pediatr (Phila). Jul1994;33:421–430.
- ,,.The CHQ User's Manual.1st ed.Boston, MA:The Health Institute, New England Medical Center,1996.
- ,,,,,.Comparing reliability and validity of pediatric instruments for measuring health and well‐being of children with spastic cerebral palsy.Dev Med Child Neurol.2002;44:468–476.
- ,,,,.Needs of carers of severely disabled people: are they identified and met adequately?Health Soc Care Community.2001;9(4):235–243.
- ,,.The realities of postoperative disability and the carer's burden.Ann R Coll Surg Engl.2001;83(3):215–218.
- Abdidin.Parenting Stress Index.3rd ed.Lutz, FL:Psychological Assessment Resources, Inc.;1995.
- ,,,.Parental stress and burden following traumatic brain injury amongst children and adolescents.Brain Inj. Jan2003;17(1):1–23.
- ,,.Comparing stress levels of parents of children with cancer and parents of children with physical disabilities.Psychooncology. Dec2004;13(12):898–903.
- ,,.Stress levels experienced by the parents of enterally fed children.Child Care Health Dev.2004;30:507–513.
- ,,, et al.The health and well‐being of caregivers of children with cerebral palsy.Pediatrics.2005;115:e626–e636.
- ,.Parenting stress and children with heart disease.J Pediatr Health Care.2003;17(4):163–168.
- ,.Small sample inference for fixed effects from restricted maximum likelihood.Biometrics.1997;53:983–997.
- ,,.Methods for the analysis of quality‐of‐life and survival data in health technology assessment.Health Technol Assess.1999;3(10):1–152.
- ,,, et al.Fundoplication and gastrostomy versus image‐guided gastrojejunal tube for enteral feeding in neurologically impaired children with gastroesophageal reflux.J Pediatr Surg.2002;37:407–412.
- SF‐36 Health Survey: Manual and Interpretation Guide.Lincoln, RI:QualityMetric Inc.;1993,year="2000"2000.
- ,,.The role of protective antireflux procedures in neurologically impaired children: a decision analysis.J Pediatr Surg. Mar2002;37:500–506.

Brief Report
Tight glycemic control in the hospitalized patient is not a simple task. Hospitalized patients are characterized by high levels of counterregulatory hormones (catecholamines, cortisol, and growth hormone) and cytokines that vary greatly in the context of sepsis, burns, hypoxia, cardiovascular disease, pain, surgery, and trauma. In addition, inpatients have unpredictable eating times and little to no physical activity. Each of the major classes of oral glycemic agents has significant limitations for inpatient use and provides little flexibility or opportunity for titration in a setting where acute changes demand these qualities. As a result, sliding‐scale insulin (SSI) regimens are often used to treat hyperglycemia in patients with or without diabetes in these clinical situations.
SSI usually consists of rapid‐acting or regular insulin ordered in a specified number of units for a given degree of hyperglycemia without regard to the timing of food, any preexisting insulin administration, or even individualization of a patient's sensitivity to insulin. This is not a physiologic approach to insulin management and not an ideal strategy for managing hyperglycemia. Because many SSI regimens do not initiate therapy until the blood glucose level is more than 200 mg/dL, SSI uses hyperglycemia as a threshold. This allows hyperglycemia to persist for long periods without intervention. In turn, SSI is reactive instead of proactive. With SSI, the current dose of insulin is based on the inadequacy of the previous dose, creating a chase‐your‐tail phenomenon. In addition, once the SSI regimen begins, glycemic control is rarely assessed by a physician until blood glucose is dangerously low or high (60 or >400 mg/dL). Finally, SSI provides no basal insulin. Hospitalized patients with stress‐induced hyperglycemia require not only postprandial insulin but also basal insulin to control blood glucose between meals and at night.
Evidence supporting SSI as a primary method of blood glucose control in diabetic patients is lacking. A search of MEDLINE for the period from 1966 to 2003 with the terms sliding scale insulin, sliding scale, and sliding combined with insulin yielded a total of 52 publications, none of which showed a benefit of sliding‐scale insulin in improving glycemic control or clinical outcomes. Retrospective and nonrandomized studies confirmed that SSI is associated with more hyper‐ and hypoglycemia with longer hospital stays.13 Queale et al. published the largest prospective cohort study (n = 171) of diabetic patients on SSI.4 More than 40% had at least one episode of hyperglycemia (>300 mg/dL), and 25% had more than one episode. Use of SSI alone increased the likelihood of hyperglycemia 3‐fold. Hypoglycemia occurred in 23%. Despite this poor performance in controlling blood glucose, the SSI remained unadjusted throughout the hospital stay for more than 80% of patients. In total, the clinical studies and clinical reviews on SSI confirmed that it is an inappropriate approach to blood glucose control in diabetic patients. Yet, SSI use in the inpatient setting continues to be a routine passed down from attending physicians to residents and medical students. In one recent study, 61% of diabetic patients admitted to the hospital for reasons other than metabolic control were on SSI.5 This sliding‐scale culture tolerates hyperglycemia and relieves the burden on the medical team to closely manage the glucose. Clinicians rely on the SSI to manage hyperglycemia rather than make frequent insulin adjustments.
Insulin, given either intravenously as a continuous infusion or subcutaneously, is the most effective agent for achieving glycemic control in hospitalized patients. Intravenous insulin infusions have been used for many years and have a proven track record for efficacy and safety. It does require frequent bedside blood glucose monitoring, which may limit its use on regular medical floors. The ideal frequency for monitoring has not been studied, but it is generally recommended that blood glucose be tested every hour until a stable infusion rate is reached. Unlike SSI, effective subcutaneous insulin therapy should define the dose components physiologically in the form of basal, nutritional or prandial, and correction doses (Fig. 1). Basal insulin is a patient's baseline level of insulin available throughout the day. Basal insulin gives the patient enough insulin to suppress hepatic glucose output, and it keeps the body from becoming hyperglycemic and ketoacidotic when not eating. Nutritional insulin is defined as the insulin needed to cover any intravenous glucose the patient is receiving, intravenous or enteral alimentation, and calories consumed in meals. If the patient is eating and is not receiving any other sources of calories, nutritional insulin would be the same as prandial insulin. In addition to basal and nutritional insulin requirements, patients often require supplemental or correction doses of insulin to treat unexpected hyperglycemia. Therefore, subcutaneous insulin can be given as a scheduled or programmed dose (basal + nutritional) and then a rapid‐acting supplemental (correction) dose to cover any hyperglycemia above target. The supplemental dose should not be confused with SSI, which does not provide any programmed basal and nutritional insulin. To provide the right amounts of basal and prandial insulin, you need to choose from the available therapies by examining their properties (Table 1). The ideal basal insulin should be long acting without identifiable peaks in concentration. For patients who are not eating, nutritional doses can be programmed with intermediate‐acting insulin. When giving insulin to patients before meals, rapid‐acting insulin analogs are best suited for the hospitalized patient because of their short onset of action. Regular insulin is also short acting, but it takes 30 minutes to take effect; thus, the dose needs to be timed at least a half hour prior to the meal. In addition, regular insulin can last for 6‐8 hours if large doses are used, which is not an ideal quality to have if trying to control postprandial glucose. The best way to mimic normal physiology is to use a combination of several types of insulin. A common strategy is to give a single daily injection of basal insulin (glargine/detimir) and then use rapid‐acting insulin analogs (lispro/aspart/glulisine) to cover prandial and correction doses.

| Time to Action | Peak | Duration | |
|---|---|---|---|
| Lispro/aspart/glulisine | 5‐15 minutes | 1‐2 hours | 3‐6 hours |
| Human NPH | 1‐2 hours | 4‐8 hours | 10‐20 hours |
| Regular/human | 30‐60 minutes | 2‐4 hours | 6‐10 hours |
| Glargine/detimir | 1‐2 hours | Flat | 24 hours |
The initial doses of scheduled subcutaneous insulin are based on previously established dose requirements, previous experience of the same patient during similar circumstances, requirements during a stable continuous insulin infusion, and/or knowledge of how stable medical condition and nutritional intake are. For patients whose insulin requirements are unknown and whose nutritional intake will be adequate, a reasonable assumption based on body weight is 0.5‐0.7 units/kg per 24 hours. Type 2 diabetics may need more, however; regardless, the patient's regimen should be started low and worked up to the dose to meet the demonstrated need. For type 1 diabetics with limited nutritional intake, the amount of scheduled insulin calculated by body weight should be reduced by 50%. For type 2 diabetics with limited nutritional intake, endogenous insulin may be adequate for basal requirements, and until results of monitoring indicate a further need for scheduled insulin, only correction doses should be used initially.
Many patients will need to transition from intravenous to subcutaneous insulin therapy when transferred from the critical care unit to the regular nursing floor. To maintain effective blood levels of insulin, it is necessary to administer short‐ or rapid‐acting insulin subcutaneously 1‐2 hours before or intermediate‐ or long‐acting insulin 2‐3 hours before stopping the insulin infusion. Subcutaneous insulin with an appropriate duration of action may be administered as a single dose or repeatedly to maintain basal effect until the time of day when insulin or analog, whichever preferred for basal effect, normally would be provided. For example, patients who typically receive glargine at night but have their insulin infusion stopped at lunchtime could receive a one‐time dose of NPH before interruption of the insulin infusion.
Hypoglycemia is a concern in hospitalized patients with diabetes, and it has been a major barrier to aggressive treatment of hyperglycemia in the hospital. Yet hypoglycemia can be predicted and prevented. Factors that increase the risk of hypoglycemia in the hospital include inadequate glucose monitoring; lack of clear communication or coordination between dietary, transportation, and nursing staff; and illegible orders.6 Clear algorithms for insulin orders and clear hypoglycemia protocols will reduce the likelihood of severe hypoglycemia occurring.
Although most positive outcomes associated with the new glycemic targets are derived from the critical care setting, there is a rationale supporting their benefit for other patients. The current glycemic targets for hospitalized patients warrant an approach that stresses the use of insulin in a way that matches normal physiology. The traditional SSI regimen is ineffective, and using it to manage glucose in the inpatient setting can no longer be justified.
- ,,,,.Efficacy of sliding‐scale insulin therapy: a comparison with prospective regimens.Fam Pract Res J.1994;14:313–321.
- ,,,,.Causes of hyperglycemia and hypoglycemia in adult inpatients.Am J Health Syst Pharm.2005;62:714–719.
- ,.Sliding‐scale insulin: an antiquated approach to glycemic control in hospitalized patients.Am J Health Syst Pharm.2004;61:1611–1614.
- ,,.Glycemic control and sliding scale insulin use in medical inpatients with diabetes mellitus.Arch Intern Med.1997;157:545–552.
- .Hospital management of diabetes: beyond the sliding scale.Cleve Clin J Med.2004;71:801–808.
Tight glycemic control in the hospitalized patient is not a simple task. Hospitalized patients are characterized by high levels of counterregulatory hormones (catecholamines, cortisol, and growth hormone) and cytokines that vary greatly in the context of sepsis, burns, hypoxia, cardiovascular disease, pain, surgery, and trauma. In addition, inpatients have unpredictable eating times and little to no physical activity. Each of the major classes of oral glycemic agents has significant limitations for inpatient use and provides little flexibility or opportunity for titration in a setting where acute changes demand these qualities. As a result, sliding‐scale insulin (SSI) regimens are often used to treat hyperglycemia in patients with or without diabetes in these clinical situations.
SSI usually consists of rapid‐acting or regular insulin ordered in a specified number of units for a given degree of hyperglycemia without regard to the timing of food, any preexisting insulin administration, or even individualization of a patient's sensitivity to insulin. This is not a physiologic approach to insulin management and not an ideal strategy for managing hyperglycemia. Because many SSI regimens do not initiate therapy until the blood glucose level is more than 200 mg/dL, SSI uses hyperglycemia as a threshold. This allows hyperglycemia to persist for long periods without intervention. In turn, SSI is reactive instead of proactive. With SSI, the current dose of insulin is based on the inadequacy of the previous dose, creating a chase‐your‐tail phenomenon. In addition, once the SSI regimen begins, glycemic control is rarely assessed by a physician until blood glucose is dangerously low or high (60 or >400 mg/dL). Finally, SSI provides no basal insulin. Hospitalized patients with stress‐induced hyperglycemia require not only postprandial insulin but also basal insulin to control blood glucose between meals and at night.
Evidence supporting SSI as a primary method of blood glucose control in diabetic patients is lacking. A search of MEDLINE for the period from 1966 to 2003 with the terms sliding scale insulin, sliding scale, and sliding combined with insulin yielded a total of 52 publications, none of which showed a benefit of sliding‐scale insulin in improving glycemic control or clinical outcomes. Retrospective and nonrandomized studies confirmed that SSI is associated with more hyper‐ and hypoglycemia with longer hospital stays.13 Queale et al. published the largest prospective cohort study (n = 171) of diabetic patients on SSI.4 More than 40% had at least one episode of hyperglycemia (>300 mg/dL), and 25% had more than one episode. Use of SSI alone increased the likelihood of hyperglycemia 3‐fold. Hypoglycemia occurred in 23%. Despite this poor performance in controlling blood glucose, the SSI remained unadjusted throughout the hospital stay for more than 80% of patients. In total, the clinical studies and clinical reviews on SSI confirmed that it is an inappropriate approach to blood glucose control in diabetic patients. Yet, SSI use in the inpatient setting continues to be a routine passed down from attending physicians to residents and medical students. In one recent study, 61% of diabetic patients admitted to the hospital for reasons other than metabolic control were on SSI.5 This sliding‐scale culture tolerates hyperglycemia and relieves the burden on the medical team to closely manage the glucose. Clinicians rely on the SSI to manage hyperglycemia rather than make frequent insulin adjustments.
Insulin, given either intravenously as a continuous infusion or subcutaneously, is the most effective agent for achieving glycemic control in hospitalized patients. Intravenous insulin infusions have been used for many years and have a proven track record for efficacy and safety. It does require frequent bedside blood glucose monitoring, which may limit its use on regular medical floors. The ideal frequency for monitoring has not been studied, but it is generally recommended that blood glucose be tested every hour until a stable infusion rate is reached. Unlike SSI, effective subcutaneous insulin therapy should define the dose components physiologically in the form of basal, nutritional or prandial, and correction doses (Fig. 1). Basal insulin is a patient's baseline level of insulin available throughout the day. Basal insulin gives the patient enough insulin to suppress hepatic glucose output, and it keeps the body from becoming hyperglycemic and ketoacidotic when not eating. Nutritional insulin is defined as the insulin needed to cover any intravenous glucose the patient is receiving, intravenous or enteral alimentation, and calories consumed in meals. If the patient is eating and is not receiving any other sources of calories, nutritional insulin would be the same as prandial insulin. In addition to basal and nutritional insulin requirements, patients often require supplemental or correction doses of insulin to treat unexpected hyperglycemia. Therefore, subcutaneous insulin can be given as a scheduled or programmed dose (basal + nutritional) and then a rapid‐acting supplemental (correction) dose to cover any hyperglycemia above target. The supplemental dose should not be confused with SSI, which does not provide any programmed basal and nutritional insulin. To provide the right amounts of basal and prandial insulin, you need to choose from the available therapies by examining their properties (Table 1). The ideal basal insulin should be long acting without identifiable peaks in concentration. For patients who are not eating, nutritional doses can be programmed with intermediate‐acting insulin. When giving insulin to patients before meals, rapid‐acting insulin analogs are best suited for the hospitalized patient because of their short onset of action. Regular insulin is also short acting, but it takes 30 minutes to take effect; thus, the dose needs to be timed at least a half hour prior to the meal. In addition, regular insulin can last for 6‐8 hours if large doses are used, which is not an ideal quality to have if trying to control postprandial glucose. The best way to mimic normal physiology is to use a combination of several types of insulin. A common strategy is to give a single daily injection of basal insulin (glargine/detimir) and then use rapid‐acting insulin analogs (lispro/aspart/glulisine) to cover prandial and correction doses.
| Time to Action | Peak | Duration | |
|---|---|---|---|
| Lispro/aspart/glulisine | 5‐15 minutes | 1‐2 hours | 3‐6 hours |
| Human NPH | 1‐2 hours | 4‐8 hours | 10‐20 hours |
| Regular/human | 30‐60 minutes | 2‐4 hours | 6‐10 hours |
| Glargine/detimir | 1‐2 hours | Flat | 24 hours |
The initial doses of scheduled subcutaneous insulin are based on previously established dose requirements, previous experience of the same patient during similar circumstances, requirements during a stable continuous insulin infusion, and/or knowledge of how stable medical condition and nutritional intake are. For patients whose insulin requirements are unknown and whose nutritional intake will be adequate, a reasonable assumption based on body weight is 0.5‐0.7 units/kg per 24 hours. Type 2 diabetics may need more, however; regardless, the patient's regimen should be started low and worked up to the dose to meet the demonstrated need. For type 1 diabetics with limited nutritional intake, the amount of scheduled insulin calculated by body weight should be reduced by 50%. For type 2 diabetics with limited nutritional intake, endogenous insulin may be adequate for basal requirements, and until results of monitoring indicate a further need for scheduled insulin, only correction doses should be used initially.
Many patients will need to transition from intravenous to subcutaneous insulin therapy when transferred from the critical care unit to the regular nursing floor. To maintain effective blood levels of insulin, it is necessary to administer short‐ or rapid‐acting insulin subcutaneously 1‐2 hours before or intermediate‐ or long‐acting insulin 2‐3 hours before stopping the insulin infusion. Subcutaneous insulin with an appropriate duration of action may be administered as a single dose or repeatedly to maintain basal effect until the time of day when insulin or analog, whichever preferred for basal effect, normally would be provided. For example, patients who typically receive glargine at night but have their insulin infusion stopped at lunchtime could receive a one‐time dose of NPH before interruption of the insulin infusion.
Hypoglycemia is a concern in hospitalized patients with diabetes, and it has been a major barrier to aggressive treatment of hyperglycemia in the hospital. Yet hypoglycemia can be predicted and prevented. Factors that increase the risk of hypoglycemia in the hospital include inadequate glucose monitoring; lack of clear communication or coordination between dietary, transportation, and nursing staff; and illegible orders.6 Clear algorithms for insulin orders and clear hypoglycemia protocols will reduce the likelihood of severe hypoglycemia occurring.
Although most positive outcomes associated with the new glycemic targets are derived from the critical care setting, there is a rationale supporting their benefit for other patients. The current glycemic targets for hospitalized patients warrant an approach that stresses the use of insulin in a way that matches normal physiology. The traditional SSI regimen is ineffective, and using it to manage glucose in the inpatient setting can no longer be justified.
- ,,,,.Efficacy of sliding‐scale insulin therapy: a comparison with prospective regimens.Fam Pract Res J.1994;14:313–321.
- ,,,,.Causes of hyperglycemia and hypoglycemia in adult inpatients.Am J Health Syst Pharm.2005;62:714–719.
- ,.Sliding‐scale insulin: an antiquated approach to glycemic control in hospitalized patients.Am J Health Syst Pharm.2004;61:1611–1614.
- ,,.Glycemic control and sliding scale insulin use in medical inpatients with diabetes mellitus.Arch Intern Med.1997;157:545–552.
- .Hospital management of diabetes: beyond the sliding scale.Cleve Clin J Med.2004;71:801–808.