User login
Insulin Administration Errors
Diabetes care in the inpatient setting requires coordination between multiple service providers. Breakdowns in this process occur at all levels leading to potential serious harm.1 Error rates focusing on multiple areas related to diabetes care, including the inpatient provision of insulin, have been described as high as 19.5% in 14,000 patients surveyed in the United Kingdom.2 Missteps are important, as insulin prescribing errors are more commonly associated with patient harm.3 In the United States, medication errors related to provision of care to critically ill patients has been documented, but, to our knowledge, no such reports regarding general medical or surgical wards exist.4
Insulin errors can result from a wide range of possible reasons including: incorrect medication reconciliation, prescribing errors, dispensing errors, administration errors, suboptimal meal timing, or errors in communication for discharge plans regarding diabetes care. Examining each of these areas as a whole could be a daunting task. As such, we sought to examine 1 portion of insulin provision as an initial focus for performance improvement at our institution. Our purpose was to describe the rates of errors associated with insulin administration at our single academic medical center on general medicine and surgical wards.
Methods
Study patients for this observational, prospective snapshot were identified by electronic medical records in 4 consecutive weeks in April 2009 at Barnes‐Jewish Hospital (St Louis, MO), a 1200 bed academic medical center. This study was approved by the Washington University in St Louis School of Medicine Human Studies Committee, and the requirement for informed consent was waived.
On day 1 of each snapshot period, all patients on the identified wards were examined to determine if insulin was currently active as part of the inpatient medication orders. If active, this patient was enrolled into the evaluation data set. No patients were excluded if insulin was currently ordered. Four inpatient areas were selected to provide a representation of the non‐critically ill patient population at our institution. The 4 areas selected were: a cardiac care ward (typical census = 24), a general medicine ward (typical census = 24), an abdominal transplant ward (typical census = 18), and a general surgery ward (typical census = 22). Taken together, these areas represent about 20% of the total non‐critically ill patient population at our hospital. The transplant area was chosen because it represents a high‐risk population with medication (corticosteroid)‐induced diabetes. Nursing and physician care are typically exclusive in these areas, and very little crossover among these healthcare providers would have occurred among the units surveyed during the study period.
Each patient included on day 1 of each audit period was followed for a total of up to 7 days. Patients were only enrolled on day 1 of each audit period. Four survey periods were conducted, providing an evaluation of 28 days of insulin therapy in the studied units. Four periods were selected to pick up more patients on day 1 of each audit period. Electronic records of medication administration and evaluation of paper chart orders provided the information for insulin administration error rates. Additionally, physician notes regarding patients' histories and home insulin use were reviewed for background information for our patient population. Prospective daily assessments of insulin orders, doses charted, nursing notes, and blood glucose values were conducted for potential errors in insulin administration.
All definitions of insulin administration errors were defined prior to data collection. The investigators reviewed available literature involving insulin errors, and found no standardized definitions or previously published assessments at the time of inception of our study. As such, we examined our own clinical practice for areas of potential concern related to insulin administration. The following error categories were identified: transcription errors (eg, insulin glargine 10 units qpm written, but order transcribed and carried out as 20 units qpm); greater than 1 hour between obtained point‐of‐care blood glucose value and provision of correctional (sliding‐scale) insulin; insulin held without a physician order present in the medical records; missing documentation of insulin doses (glucose value of 150 mg/dL present, but no documented correctional dose corresponding to this value present in medical record); premeal and correctional insulin given at separate times; and no documentation of physician notification for hypoglycemia. Other reasons for potential insulin administration errors were collected if deemed pertinent by the individual auditors.
At the time of our survey, a standardized subcutaneous insulin administration order set was utilized in all of the surveyed units. As computerized physician order entry was not yet available at our institution, all orders were transcribed electronically from paper orders. This insulin order set has been in place for 5 years. Once initiated, all portions of the order set are initiated, including communication to nurses regarding glucose measuring times, requirement for documentation of hypoglycemia, and proposed glucose goals. A survey of insulin orders during the audit time revealed that >97% of all insulin orders were initiated from this standardized order set. These order sets encouraged the provision of physiological insulin (basal‐bolus) using insulin glargine and insulin aspart in eligible individuals. Although no systematic, standardized goal for glucose attainment was promoted, a fasting blood glucose of 90‐130 mg/dL and post‐prandial value of 180 mg/dL was encouraged. The order sets had a stated requirement of physician contact for all blood glucose values 70 mg/dL. Although lack of documentation of hypoglycemia may not be directly considered an error associated with administration of insulin, the research group decided to include this provision in the definition of administration errors, given the ability of this parameter to provide a sense of overall completeness of insulin orders and as a marker of collaborative practice in the management of inpatient hyperglycemia.
Nurses documented glucose values and responses in electronic medical administration records as a matter of routine. Point‐of‐care glucose values were obtained by either patient care technicians or nurses on each individual ward. As an academic medical institution, physicians were frequently paged by other members of the healthcare team.
Each auditor (E.N.D., A.L., L.L.W., K.A.H.) reviewed 1 consistent unit during the audit period. All data for insulin administration errors were tabulated, and descriptive rates of errors were used on a per‐patient or per‐stay basis
Results
A total of 116 patient‐audit periods were identified during the 28‐day study period (Table 1). Sixty‐five patients were on surgical services, and 51 were on medicine services, representing 378 inpatient days. Median length of stay was 3.5 days. Home insulin use was evident in 49% of the surveyed population. Patients' mean A1C (data available within 3 months prior to admission) was 8.1% (n = 41). Inpatient insulin regimens on day 1 included correctional insulin only (51.7% of cases). Regimens containing neutral protamine Hagedorn (NPH) or glargine also included correctional insulin in 95% of cases, and premeal insulin in 35%. Regimens including both premeal insulin and correctional insulin occurred in 25% of the patients. Diet status indicated that 83% of the population was taking an oral diet on day 1, and 13% were nil per os (nothing by mouth [NPO]).
| Characteristic | Result |
|---|---|
| |
| Mean age, years | 59 |
| Mean body mass index | 30.9 |
| Male | 58% |
| Reason for admission | |
| Diabetes‐related | 7 (6%) |
| Cardiovascular | 23 (19.8%) |
| Infection/sepsis | 12 (10.3%) |
| Transplant | 10 (8.6%) |
| Vascular surgery | 10 (8.6%) |
| Transplant complication | 8 (6.9%) |
| Other | 46 (39.6%) |
| History of diabetes | |
| DM1 | 7 (6%) |
| DM2 | 77 (67%) |
| Steroid‐induced | 8 (7%) |
| No history of diabetes | 24 (20%) |
| Most recent A1C (n = 41) (mean) | 8.1% |
| Home insulin use | 57 (49%) |
| Hospital NPH, day 1 | 14 (12.0%) |
| Hospital glargine, day 1 | 33 (28.4%) |
| Hospital correctional insulin only, day 1 | 60 (51.7%) |
| Day 1 diet | |
| Prudent diabetic | 58 (50%) |
| NPO | 15 (13%) |
| Other | 38 (32.7%) |
| Tube feeds | 3 (2.6%) |
| TPN | 2 (1.7%) |
A total of 199 administration errors occurred at a rate of 1.72 errors/patient‐period and 0.53 errors/patient day (Table 2). Missing documentation of doses (15.5% of all patients) and insulin being held without an order (25% of patients) were the most frequently occurring events. Errors classified as other were found in 13.1% of the defined events. These other errors consisted of not carrying out correctional dose insulin orders appropriately (eg, blood sugar value of 149 mg/dL should have resulted in a correctional dose of 2 units, but 3 units were documented as given instead), timing errors related to provision of mealtime insulin apart from documented provision of a meal, or not following the required documentation for insulin pumps.
| Category | No. of events (% Out of 199 Total Errors) |
|---|---|
| Transcription error | 15 (7.5) |
| Greater than 1 hr between blood sugar evaluation and insulin administration | 20 (10.1) |
| Insulin held without a physician order | 36 (18.1) |
| Missing documentation of insulin doses | 58 (29.1) |
| Premeal and correctional insulin given at separate time | 19 (9.5) |
| No documentation of physician notification of hypoglycemia | 25 (12.6) |
| Other | 26 (13.1) |
Forty‐two patients (36%) experienced no errors in insulin administration, 18 patients experienced 1 error, 21 patients had 2 errors, and 11 patients had 3 errors. The remainder of the patients (n = 23; 19.9%) had 4 or more errors during their observation period. Were similar across the units surveyed. Frequency of errors remained consistent regardless of reason for admission, history of diabetes or insulin use at home, or length of stay. Most errors occurred on days 1 and 2 of the hospital stay. Error rates and types were consistent across all units surveyed.
Discussion/Conclusion
We found that insulin administration errors were common in our inpatient snapshot of non‐critically ill patients. In our observational evaluation, 64% of patients had at least 1 error related to insulin administration. Errors related to missing documentation of scheduled doses, or doses held without a prescriber order, were the most common. Implications of missed or held doses could range from unclear approaches for dose adjustment due to missing information, incorrect titration due to incomplete information, or hypoglycemia and hyperglycemia.
This observed rate of error is much higher than the described error rate of 19.5% reported in the United Kingdom.2 This difference in error rates most likely reflects a difference in focus, as investigators in that national effort focused on prescriber error, aberrations in blood glucose values, and readmission rates. Our evaluation in assessing error rates regarding insulin administration supports the use of personnel keenly aware of the processes related to insulin administration, and provides insight into the importance of evaluating small portions of insulin provision (administration vs prescribing, etc) in assessing grounds for improvement in care. It is important to note that our findings may be exaggerated and are not entirely comparable to a study with a different scope and size.
Our snapshot tool and baseline evaluation is a simple method that could be undertaken at many institutions. As such, this methodology and error estimate serves as a gauge for future comparisons and areas for intervention. Limitations of our assessment include the small portion of patients audited during our evaluation versus using a snapshot of our entire hospital, utilizing nonstandardized criteria for determination of insulin errors, and the lack of correlation of clinical significance (aberrations in glucose values) with errors observed. Also, this single‐institution review may not be generalizable to all institutions. Additionally, we only examined errors related to administration of insulin. Other areas that would complete the picture, related to diabetic therapies and outcomes, would need to include prescribing errors or dispensing errors and relate these to glycemic outcomes. Assessment of these additional errors may have revealed more clinically important events that were not revealed in this small snapshot. Lastly, clinical endpoints such as intensive care unit (ICU) transfers, mortality, or readmissions were not assessed in this small study.
We are fortunate that many of these errors were apparently clinically silent, but in a subset of patients, the risk is real and life‐threatening. Risk occurs at both ends of the glucose spectrum, with the low end receiving the greatest attention. Severe hypoglycemia with harm and inpatient diabetic ketoacidosis have been qualified as newer events by Medicare. Hypoglycemia in the ICU population (40 mg/dL) is an independent marker of mortality.5 Hypoglycemia (50 mg/dL) has been associated with heart attacks, strokes, and death in the outpatient setting.6
The ability to safely control blood sugar in the hospital requires that medications are administered on time, and that communication occurs between the prescribing provider and the nursing staff providing care. Along with the case‐by‐case implications regarding the need for accurate administration of insulin for subsequent titration and determination of discharge prescriptions for patients with diabetes, there are many implications regarding the assessment of inpatient provision of insulin on determining institutional practices based on previous performance. If insulin administration is not accurately provided or documented, institutions will find it difficult to correctly make changes to insulin protocols for targeting future improvements. Our evaluation indicates an obvious need for quality improvement with 18.1% of the errors reflecting holding insulin without an order, and 12.6% of the errors showing no documentation for the physician being notified of hypoglycemia requiring treatment. The need to foster structured nurse‐physician communication will play a critical role in any process improvement. Communication is key for the optimal provision of insulin in the inpatient setting. Computerized order entry and bar‐code guided administration of doses of insulin may fix some types of the errors (transcription and missed documentation, respectively). That said, one of the largest impacts of this survey may reveal that these errors may not be fixed by technology, but may require more targeted and difficult interventions, such as continuing education and holding clinicians accountable. This study provides insight into the complicated issues regarding inpatient insulin administration and, due to its systematic approach, has given direction for process and system improvements.
- .Patient safety and inpatient glycemic control: translating concepts into action.Endocr Pract.2006;12:49–55.
- ,,,,.Safer administration of insulin: summary of a safety report from the National Patient Safety Agency.BMJ.341:883.
- ,,,,,.Medication administration errors in adult patients in the ICU.Intensive Care Med.2001;27(10):1592–1598.
- United States Pharmacopeia. MEDMARX 5th anniversary data report. A chartbook of 2003 findings and trends 1999–2003. Available at: http://www.usp.org/products/medMarx/index.html?USP_Print. Accessed December 1,2010.
- ,,, et al.Intensive insulin therapy in the medical ICU.N Engl J Med.2006;354:449–461.
- The ADVANCE Trial Collaborative Group.Intensive blood glucose control and vascular outcomes in patients with type 2 diabetes.N Engl J Med.2008;358:2560–2572.
Diabetes care in the inpatient setting requires coordination between multiple service providers. Breakdowns in this process occur at all levels leading to potential serious harm.1 Error rates focusing on multiple areas related to diabetes care, including the inpatient provision of insulin, have been described as high as 19.5% in 14,000 patients surveyed in the United Kingdom.2 Missteps are important, as insulin prescribing errors are more commonly associated with patient harm.3 In the United States, medication errors related to provision of care to critically ill patients has been documented, but, to our knowledge, no such reports regarding general medical or surgical wards exist.4
Insulin errors can result from a wide range of possible reasons including: incorrect medication reconciliation, prescribing errors, dispensing errors, administration errors, suboptimal meal timing, or errors in communication for discharge plans regarding diabetes care. Examining each of these areas as a whole could be a daunting task. As such, we sought to examine 1 portion of insulin provision as an initial focus for performance improvement at our institution. Our purpose was to describe the rates of errors associated with insulin administration at our single academic medical center on general medicine and surgical wards.
Methods
Study patients for this observational, prospective snapshot were identified by electronic medical records in 4 consecutive weeks in April 2009 at Barnes‐Jewish Hospital (St Louis, MO), a 1200 bed academic medical center. This study was approved by the Washington University in St Louis School of Medicine Human Studies Committee, and the requirement for informed consent was waived.
On day 1 of each snapshot period, all patients on the identified wards were examined to determine if insulin was currently active as part of the inpatient medication orders. If active, this patient was enrolled into the evaluation data set. No patients were excluded if insulin was currently ordered. Four inpatient areas were selected to provide a representation of the non‐critically ill patient population at our institution. The 4 areas selected were: a cardiac care ward (typical census = 24), a general medicine ward (typical census = 24), an abdominal transplant ward (typical census = 18), and a general surgery ward (typical census = 22). Taken together, these areas represent about 20% of the total non‐critically ill patient population at our hospital. The transplant area was chosen because it represents a high‐risk population with medication (corticosteroid)‐induced diabetes. Nursing and physician care are typically exclusive in these areas, and very little crossover among these healthcare providers would have occurred among the units surveyed during the study period.
Each patient included on day 1 of each audit period was followed for a total of up to 7 days. Patients were only enrolled on day 1 of each audit period. Four survey periods were conducted, providing an evaluation of 28 days of insulin therapy in the studied units. Four periods were selected to pick up more patients on day 1 of each audit period. Electronic records of medication administration and evaluation of paper chart orders provided the information for insulin administration error rates. Additionally, physician notes regarding patients' histories and home insulin use were reviewed for background information for our patient population. Prospective daily assessments of insulin orders, doses charted, nursing notes, and blood glucose values were conducted for potential errors in insulin administration.
All definitions of insulin administration errors were defined prior to data collection. The investigators reviewed available literature involving insulin errors, and found no standardized definitions or previously published assessments at the time of inception of our study. As such, we examined our own clinical practice for areas of potential concern related to insulin administration. The following error categories were identified: transcription errors (eg, insulin glargine 10 units qpm written, but order transcribed and carried out as 20 units qpm); greater than 1 hour between obtained point‐of‐care blood glucose value and provision of correctional (sliding‐scale) insulin; insulin held without a physician order present in the medical records; missing documentation of insulin doses (glucose value of 150 mg/dL present, but no documented correctional dose corresponding to this value present in medical record); premeal and correctional insulin given at separate times; and no documentation of physician notification for hypoglycemia. Other reasons for potential insulin administration errors were collected if deemed pertinent by the individual auditors.
At the time of our survey, a standardized subcutaneous insulin administration order set was utilized in all of the surveyed units. As computerized physician order entry was not yet available at our institution, all orders were transcribed electronically from paper orders. This insulin order set has been in place for 5 years. Once initiated, all portions of the order set are initiated, including communication to nurses regarding glucose measuring times, requirement for documentation of hypoglycemia, and proposed glucose goals. A survey of insulin orders during the audit time revealed that >97% of all insulin orders were initiated from this standardized order set. These order sets encouraged the provision of physiological insulin (basal‐bolus) using insulin glargine and insulin aspart in eligible individuals. Although no systematic, standardized goal for glucose attainment was promoted, a fasting blood glucose of 90‐130 mg/dL and post‐prandial value of 180 mg/dL was encouraged. The order sets had a stated requirement of physician contact for all blood glucose values 70 mg/dL. Although lack of documentation of hypoglycemia may not be directly considered an error associated with administration of insulin, the research group decided to include this provision in the definition of administration errors, given the ability of this parameter to provide a sense of overall completeness of insulin orders and as a marker of collaborative practice in the management of inpatient hyperglycemia.
Nurses documented glucose values and responses in electronic medical administration records as a matter of routine. Point‐of‐care glucose values were obtained by either patient care technicians or nurses on each individual ward. As an academic medical institution, physicians were frequently paged by other members of the healthcare team.
Each auditor (E.N.D., A.L., L.L.W., K.A.H.) reviewed 1 consistent unit during the audit period. All data for insulin administration errors were tabulated, and descriptive rates of errors were used on a per‐patient or per‐stay basis
Results
A total of 116 patient‐audit periods were identified during the 28‐day study period (Table 1). Sixty‐five patients were on surgical services, and 51 were on medicine services, representing 378 inpatient days. Median length of stay was 3.5 days. Home insulin use was evident in 49% of the surveyed population. Patients' mean A1C (data available within 3 months prior to admission) was 8.1% (n = 41). Inpatient insulin regimens on day 1 included correctional insulin only (51.7% of cases). Regimens containing neutral protamine Hagedorn (NPH) or glargine also included correctional insulin in 95% of cases, and premeal insulin in 35%. Regimens including both premeal insulin and correctional insulin occurred in 25% of the patients. Diet status indicated that 83% of the population was taking an oral diet on day 1, and 13% were nil per os (nothing by mouth [NPO]).
| Characteristic | Result |
|---|---|
| |
| Mean age, years | 59 |
| Mean body mass index | 30.9 |
| Male | 58% |
| Reason for admission | |
| Diabetes‐related | 7 (6%) |
| Cardiovascular | 23 (19.8%) |
| Infection/sepsis | 12 (10.3%) |
| Transplant | 10 (8.6%) |
| Vascular surgery | 10 (8.6%) |
| Transplant complication | 8 (6.9%) |
| Other | 46 (39.6%) |
| History of diabetes | |
| DM1 | 7 (6%) |
| DM2 | 77 (67%) |
| Steroid‐induced | 8 (7%) |
| No history of diabetes | 24 (20%) |
| Most recent A1C (n = 41) (mean) | 8.1% |
| Home insulin use | 57 (49%) |
| Hospital NPH, day 1 | 14 (12.0%) |
| Hospital glargine, day 1 | 33 (28.4%) |
| Hospital correctional insulin only, day 1 | 60 (51.7%) |
| Day 1 diet | |
| Prudent diabetic | 58 (50%) |
| NPO | 15 (13%) |
| Other | 38 (32.7%) |
| Tube feeds | 3 (2.6%) |
| TPN | 2 (1.7%) |
A total of 199 administration errors occurred at a rate of 1.72 errors/patient‐period and 0.53 errors/patient day (Table 2). Missing documentation of doses (15.5% of all patients) and insulin being held without an order (25% of patients) were the most frequently occurring events. Errors classified as other were found in 13.1% of the defined events. These other errors consisted of not carrying out correctional dose insulin orders appropriately (eg, blood sugar value of 149 mg/dL should have resulted in a correctional dose of 2 units, but 3 units were documented as given instead), timing errors related to provision of mealtime insulin apart from documented provision of a meal, or not following the required documentation for insulin pumps.
| Category | No. of events (% Out of 199 Total Errors) |
|---|---|
| Transcription error | 15 (7.5) |
| Greater than 1 hr between blood sugar evaluation and insulin administration | 20 (10.1) |
| Insulin held without a physician order | 36 (18.1) |
| Missing documentation of insulin doses | 58 (29.1) |
| Premeal and correctional insulin given at separate time | 19 (9.5) |
| No documentation of physician notification of hypoglycemia | 25 (12.6) |
| Other | 26 (13.1) |
Forty‐two patients (36%) experienced no errors in insulin administration, 18 patients experienced 1 error, 21 patients had 2 errors, and 11 patients had 3 errors. The remainder of the patients (n = 23; 19.9%) had 4 or more errors during their observation period. Were similar across the units surveyed. Frequency of errors remained consistent regardless of reason for admission, history of diabetes or insulin use at home, or length of stay. Most errors occurred on days 1 and 2 of the hospital stay. Error rates and types were consistent across all units surveyed.
Discussion/Conclusion
We found that insulin administration errors were common in our inpatient snapshot of non‐critically ill patients. In our observational evaluation, 64% of patients had at least 1 error related to insulin administration. Errors related to missing documentation of scheduled doses, or doses held without a prescriber order, were the most common. Implications of missed or held doses could range from unclear approaches for dose adjustment due to missing information, incorrect titration due to incomplete information, or hypoglycemia and hyperglycemia.
This observed rate of error is much higher than the described error rate of 19.5% reported in the United Kingdom.2 This difference in error rates most likely reflects a difference in focus, as investigators in that national effort focused on prescriber error, aberrations in blood glucose values, and readmission rates. Our evaluation in assessing error rates regarding insulin administration supports the use of personnel keenly aware of the processes related to insulin administration, and provides insight into the importance of evaluating small portions of insulin provision (administration vs prescribing, etc) in assessing grounds for improvement in care. It is important to note that our findings may be exaggerated and are not entirely comparable to a study with a different scope and size.
Our snapshot tool and baseline evaluation is a simple method that could be undertaken at many institutions. As such, this methodology and error estimate serves as a gauge for future comparisons and areas for intervention. Limitations of our assessment include the small portion of patients audited during our evaluation versus using a snapshot of our entire hospital, utilizing nonstandardized criteria for determination of insulin errors, and the lack of correlation of clinical significance (aberrations in glucose values) with errors observed. Also, this single‐institution review may not be generalizable to all institutions. Additionally, we only examined errors related to administration of insulin. Other areas that would complete the picture, related to diabetic therapies and outcomes, would need to include prescribing errors or dispensing errors and relate these to glycemic outcomes. Assessment of these additional errors may have revealed more clinically important events that were not revealed in this small snapshot. Lastly, clinical endpoints such as intensive care unit (ICU) transfers, mortality, or readmissions were not assessed in this small study.
We are fortunate that many of these errors were apparently clinically silent, but in a subset of patients, the risk is real and life‐threatening. Risk occurs at both ends of the glucose spectrum, with the low end receiving the greatest attention. Severe hypoglycemia with harm and inpatient diabetic ketoacidosis have been qualified as newer events by Medicare. Hypoglycemia in the ICU population (40 mg/dL) is an independent marker of mortality.5 Hypoglycemia (50 mg/dL) has been associated with heart attacks, strokes, and death in the outpatient setting.6
The ability to safely control blood sugar in the hospital requires that medications are administered on time, and that communication occurs between the prescribing provider and the nursing staff providing care. Along with the case‐by‐case implications regarding the need for accurate administration of insulin for subsequent titration and determination of discharge prescriptions for patients with diabetes, there are many implications regarding the assessment of inpatient provision of insulin on determining institutional practices based on previous performance. If insulin administration is not accurately provided or documented, institutions will find it difficult to correctly make changes to insulin protocols for targeting future improvements. Our evaluation indicates an obvious need for quality improvement with 18.1% of the errors reflecting holding insulin without an order, and 12.6% of the errors showing no documentation for the physician being notified of hypoglycemia requiring treatment. The need to foster structured nurse‐physician communication will play a critical role in any process improvement. Communication is key for the optimal provision of insulin in the inpatient setting. Computerized order entry and bar‐code guided administration of doses of insulin may fix some types of the errors (transcription and missed documentation, respectively). That said, one of the largest impacts of this survey may reveal that these errors may not be fixed by technology, but may require more targeted and difficult interventions, such as continuing education and holding clinicians accountable. This study provides insight into the complicated issues regarding inpatient insulin administration and, due to its systematic approach, has given direction for process and system improvements.
- .Patient safety and inpatient glycemic control: translating concepts into action.Endocr Pract.2006;12:49–55.
- ,,,,.Safer administration of insulin: summary of a safety report from the National Patient Safety Agency.BMJ.341:883.
- ,,,,,.Medication administration errors in adult patients in the ICU.Intensive Care Med.2001;27(10):1592–1598.
- United States Pharmacopeia. MEDMARX 5th anniversary data report. A chartbook of 2003 findings and trends 1999–2003. Available at: http://www.usp.org/products/medMarx/index.html?USP_Print. Accessed December 1,2010.
- ,,, et al.Intensive insulin therapy in the medical ICU.N Engl J Med.2006;354:449–461.
- The ADVANCE Trial Collaborative Group.Intensive blood glucose control and vascular outcomes in patients with type 2 diabetes.N Engl J Med.2008;358:2560–2572.
Serum Sickness with Clarithromycin
Serum sickness is an immunological condition characterized by fever, rash, arthralgia/arthritis, myalgia, edema, and localized lymphadenopathy. Historically, this syndrome was seen as an immunologic response to heterologous protein components administered for therapeutic purposes, such as in the treatment of diphtheria and scarlet fever. Following the decline in use of such heterologous proteins, this same condition is now seen with equine antitoxins, monoclonal antibodies, and some drugs.13 Specifically, the immunologic response to these drugs is referred to as serum sickness‐like reaction (SSLR). The classic serum sickness is described as a prototype Gell and Coombs type III or immune complex‐mediated hypersensitivity disease.4 When a foreign protein antitoxin is administered into human serum, immune system recognition and antibody production occurs. Antibodies become attached to antigens and, when there are sufficient antibody/antigen bonds, a lattice‐like aggregate called the immune complex forms. Normally these immune complexes are cleared from the blood by the reticulo‐endothelial system, but if the system is defective, or the complexes are in a sufficiently large quantity, then deposition into various tissues like the internal elastic lamina of arteries, perivascular regions, synovia, and glomeruli occurs. Following deposition, complement is activated, causing inflammation in these same tissues, resulting in fever, rash, arthralgia, and myalgia.5 A similar reaction has been seen with certain drug exposures as well. The mechanism for this reaction is less clear, but thought to be similar to haptens attaching to plasma proteins and inciting the immunological response.6
Case
A 57‐year‐old white female presented with rash and generalized body aches. She had no significant past medical history, except for sinusitis several years ago; she was prescribed clarithromycin but did not report any problem with this medication at that time. The patient was diagnosed with acute sinusitis 4 days before this presentation. She had visited a primary care physician for her sinusitis and had been prescribed clarithromycin 500 mg twice daily for 7 days. The patient did not use any prescribed or nonprescribed medications in the last 6 months, except the current use of clarithromycin. She used the medication for 3 days as directed, when she developed a generalized rash. The rash first developed on both arms and then migrated to involve the rest of the body within 1 day. The following day, she developed generalized weakness, muscle aches, and symmetric joint pain in the wrists, arms, fingers, and knees. She stopped taking the medication after her sixth dose because she thought her symptoms might be related to its use. Her rash began to fade away slightly. On the 4th day, her myalgias and arthralgias acutely worsened, limiting her normal activities. She developed shortness of breath, ultimately prompting her visit to the emergency department. On presentation, her temperature was 98F, pulse 76, blood pressure 115/73, and oxygen saturation 99% on room air. She was in no acute distress, had no signs of acute airway compromise, and was comfortable at rest. On examination, she had a pruritic morbilliform rash which was most prominent on her upper extremities. There was no muscular tenderness elicited on her body. The joint examination was entirely normal. Ear, nose, and throat examination was normal; there was no lip swelling, erythema, or swelling in the oral cavity or stridor. The chest was clear to auscultation, and the heart examination was normal. Pertinent labs (and normal ranges) included: C3, 83 mg/dL (79‐152 mg/dL); C4, 11 mg/dL (16‐38 mg/dL); total complement, 24 mg/dL (30‐75 mg/dL); erythrocyte sedimentation rate (ESR), 21 mm/hr (20 mm/hr); and C‐reactive protein (CRP), 0.8 mg/dL (normal, 0.8 mg/dL). Basic chemistries were unremarkable. Serum creatinine was 0.8 mg/dL, and blood urea nitrogen was 11 mg/dL. Creatine phosphokinase was 54 U/L. Liver function tests were normal. Complete blood count with differential showed: Hb, 12.5 g/dL; platelets, 228,000/mm3; polymorphonuclear cells, 76%; lymphocytes, 15%; and eosinophils, 5%. Given the history, the temporal association of symptoms with medication use, physical examination findings, low complement level, and elevated ESR, the diagnosis of serum sickness‐like reaction was made. The patient received intravenous dexamethasone 4 mg once and, following an observation period in the emergency department, was discharged on an oral prednisone taper, with diphenhydramine to use as needed. The patient responded well, and recovered uneventfully.
Discussion
Serum sickness‐like reaction has been described for many drugs, especially antibiotics.7 A clarithromycin‐associated reaction has not been reported previously. Diagnosis of SSLR in this case was suggested by several factors, including the temporal association between clarithromycin ingestion, as well as consistent physical examination and laboratory findings. The patient's past history of clarithromycin use caused the reaction to occur within 36 hours of drug ingestion. Important diagnoses that were considered included angioedema, systemic lupus erythematosus, StevensJohnson syndrome or other drug eruptions, viral exanthemata, reactive arthritis, and acute rheumatic fever. However, the typical morbilliform skin eruptions with mucosal sparing made both lupus and StevensJohnson syndrome unlikely. Without facial or lip edema, angioedema also seemed less probable. Typical features of viral exanthem were also not seen in this patient. The lack of a prior history of a similar reaction and prompt recovery with antiinflammatories also supported a diagnosis of SSLR. Clarithromycin is a very commonly prescribed antibiotic for the treatment of upper respiratory tract infections; this case emphasizes that clinicians should remain aware that its use may rarely be associated with SSLR.
- ,,,.Serum sickness‐like reactions in patients receiving intravenous infliximab.J Emerg Med.2006;30(1):41–44.
- ,,,.Severe serum sickness reaction to oral and intramuscular penicillin.Pharmacotherapy.2006;26(5):705–708.
- ,,,.Serum sickness‐like reactions to amoxicillin, cefaclor, cephalexin, and trimethoprim‐sulfamethoxazole.J Infect Dis.1988;158(2):474–477.
- ,,, et al.A prospective clinical and immunologic analysis of patients with serum sickness.N Engl J Med.1984;311(22):1407–1413.
- ,.Severe adverse cutaneous reactions to drugs.N Engl J Med.1994;331(19):1272–1285.
- ,,.Idiosyncratic drug reactions: the reactive metabolite syndromes.Lancet2000;356(9241):1587–1591.
- ,,,,.Cefaclor‐associated serum sickness‐like disease: eight cases and review of the literature.Ann Pharmacother.1992;26(7–8):910–914.
Serum sickness is an immunological condition characterized by fever, rash, arthralgia/arthritis, myalgia, edema, and localized lymphadenopathy. Historically, this syndrome was seen as an immunologic response to heterologous protein components administered for therapeutic purposes, such as in the treatment of diphtheria and scarlet fever. Following the decline in use of such heterologous proteins, this same condition is now seen with equine antitoxins, monoclonal antibodies, and some drugs.13 Specifically, the immunologic response to these drugs is referred to as serum sickness‐like reaction (SSLR). The classic serum sickness is described as a prototype Gell and Coombs type III or immune complex‐mediated hypersensitivity disease.4 When a foreign protein antitoxin is administered into human serum, immune system recognition and antibody production occurs. Antibodies become attached to antigens and, when there are sufficient antibody/antigen bonds, a lattice‐like aggregate called the immune complex forms. Normally these immune complexes are cleared from the blood by the reticulo‐endothelial system, but if the system is defective, or the complexes are in a sufficiently large quantity, then deposition into various tissues like the internal elastic lamina of arteries, perivascular regions, synovia, and glomeruli occurs. Following deposition, complement is activated, causing inflammation in these same tissues, resulting in fever, rash, arthralgia, and myalgia.5 A similar reaction has been seen with certain drug exposures as well. The mechanism for this reaction is less clear, but thought to be similar to haptens attaching to plasma proteins and inciting the immunological response.6
Case
A 57‐year‐old white female presented with rash and generalized body aches. She had no significant past medical history, except for sinusitis several years ago; she was prescribed clarithromycin but did not report any problem with this medication at that time. The patient was diagnosed with acute sinusitis 4 days before this presentation. She had visited a primary care physician for her sinusitis and had been prescribed clarithromycin 500 mg twice daily for 7 days. The patient did not use any prescribed or nonprescribed medications in the last 6 months, except the current use of clarithromycin. She used the medication for 3 days as directed, when she developed a generalized rash. The rash first developed on both arms and then migrated to involve the rest of the body within 1 day. The following day, she developed generalized weakness, muscle aches, and symmetric joint pain in the wrists, arms, fingers, and knees. She stopped taking the medication after her sixth dose because she thought her symptoms might be related to its use. Her rash began to fade away slightly. On the 4th day, her myalgias and arthralgias acutely worsened, limiting her normal activities. She developed shortness of breath, ultimately prompting her visit to the emergency department. On presentation, her temperature was 98F, pulse 76, blood pressure 115/73, and oxygen saturation 99% on room air. She was in no acute distress, had no signs of acute airway compromise, and was comfortable at rest. On examination, she had a pruritic morbilliform rash which was most prominent on her upper extremities. There was no muscular tenderness elicited on her body. The joint examination was entirely normal. Ear, nose, and throat examination was normal; there was no lip swelling, erythema, or swelling in the oral cavity or stridor. The chest was clear to auscultation, and the heart examination was normal. Pertinent labs (and normal ranges) included: C3, 83 mg/dL (79‐152 mg/dL); C4, 11 mg/dL (16‐38 mg/dL); total complement, 24 mg/dL (30‐75 mg/dL); erythrocyte sedimentation rate (ESR), 21 mm/hr (20 mm/hr); and C‐reactive protein (CRP), 0.8 mg/dL (normal, 0.8 mg/dL). Basic chemistries were unremarkable. Serum creatinine was 0.8 mg/dL, and blood urea nitrogen was 11 mg/dL. Creatine phosphokinase was 54 U/L. Liver function tests were normal. Complete blood count with differential showed: Hb, 12.5 g/dL; platelets, 228,000/mm3; polymorphonuclear cells, 76%; lymphocytes, 15%; and eosinophils, 5%. Given the history, the temporal association of symptoms with medication use, physical examination findings, low complement level, and elevated ESR, the diagnosis of serum sickness‐like reaction was made. The patient received intravenous dexamethasone 4 mg once and, following an observation period in the emergency department, was discharged on an oral prednisone taper, with diphenhydramine to use as needed. The patient responded well, and recovered uneventfully.
Discussion
Serum sickness‐like reaction has been described for many drugs, especially antibiotics.7 A clarithromycin‐associated reaction has not been reported previously. Diagnosis of SSLR in this case was suggested by several factors, including the temporal association between clarithromycin ingestion, as well as consistent physical examination and laboratory findings. The patient's past history of clarithromycin use caused the reaction to occur within 36 hours of drug ingestion. Important diagnoses that were considered included angioedema, systemic lupus erythematosus, StevensJohnson syndrome or other drug eruptions, viral exanthemata, reactive arthritis, and acute rheumatic fever. However, the typical morbilliform skin eruptions with mucosal sparing made both lupus and StevensJohnson syndrome unlikely. Without facial or lip edema, angioedema also seemed less probable. Typical features of viral exanthem were also not seen in this patient. The lack of a prior history of a similar reaction and prompt recovery with antiinflammatories also supported a diagnosis of SSLR. Clarithromycin is a very commonly prescribed antibiotic for the treatment of upper respiratory tract infections; this case emphasizes that clinicians should remain aware that its use may rarely be associated with SSLR.
- ,,,.Serum sickness‐like reactions in patients receiving intravenous infliximab.J Emerg Med.2006;30(1):41–44.
- ,,,.Severe serum sickness reaction to oral and intramuscular penicillin.Pharmacotherapy.2006;26(5):705–708.
- ,,,.Serum sickness‐like reactions to amoxicillin, cefaclor, cephalexin, and trimethoprim‐sulfamethoxazole.J Infect Dis.1988;158(2):474–477.
- ,,, et al.A prospective clinical and immunologic analysis of patients with serum sickness.N Engl J Med.1984;311(22):1407–1413.
- ,.Severe adverse cutaneous reactions to drugs.N Engl J Med.1994;331(19):1272–1285.
- ,,.Idiosyncratic drug reactions: the reactive metabolite syndromes.Lancet2000;356(9241):1587–1591.
- ,,,,.Cefaclor‐associated serum sickness‐like disease: eight cases and review of the literature.Ann Pharmacother.1992;26(7–8):910–914.
Discharge Summary Completion
Discharge summaries (DS) correlate with rates of rehospitalization1, 2 and adverse events after discharge.3 The Joint Commission on the Accreditation of Healthcare Organizations acknowledges their importance and mandates that certain elements be included.4 Thus far, however, DS are not standardized across institutions and there is no expectation that they be available at postdischarge visits. There have been numerous attempts to improve the quality of DS by using more structured formats or computer generated summaries with positive results in term of comprehensiveness, clarity, and practitioner satisfaction58 but with persistence of serious errors and omissions.9
Postgraduate training is often the first opportunity for physicians to learn information transfer management skills. Unfortunately, DS are created by house staff who have minimal training in this area11 and feel like they have to learn by osmosis,12 resulting in poor quality DS and lack of availability at the point of care.1315
Previous research suggested that individualized feedback sessions for Internal Medicine residents improved the quality of certain aspects of their completed DS.10 We postulated that an audit and feedback educational intervention on DS for first year geriatric medicine fellows would also improve their quality. This technique involves chart or case review of clinical practice behaviors for a specific task followed by recommendation of new behaviors when applicable.16 Audit and feedback incorporates adult learning theory,1719 an essential part of continuous quality improvement that fits within the Accreditation Council for Graduate Medical Education (ACGME) competency of practice based learning and improvement,20 as an educational activity.
Methods
Setting
We conducted a preintervention post intervention study at the Brookdale Department of Geriatrics and Palliative Medicine at Mount Sinai Medical Center (MSMC) in New York City between July 1, 2006 and June 30, 2007. The study received an exemption from the MSMC Institutional Review Board. First year geriatric medicine fellows at MSMC were required to complete 2 months of inpatient service; the first during the first 6 months of the academic year and the second during the last 6 months of the year. Fellows dictated all DS, which were transcribed and routed for signature to the attending of record. Prior to our study, a discharge summary template consisting of 21 items was developed for clinical use. Template items, agreed upon by an expert internal panel of geriatricians and interprofessional faculty, were selected for their importance in assuring a safe transition of older adults from the inpatient to the outpatient setting.
Participants
All 5 first‐year fellows at the Brookdale Department of Geriatrics and Palliative Medicine at MSMC were invited to participate in the study.
Intervention
Audit #1
All available DS for each fellow's first month of inpatient service were audited for completeness of the 21 item discharge summary template by 1 author (AD). The 21 items were focused on 4 distinct periods of the hospitalization: admission, hospital course, discharge planning, and postdischarge care (Figure 1).

Content under each of the 21 items was classified as complete, partially complete, or absent. An item was considered complete if most information was present and appropriate medical terms were used, partially complete if information was unclear, and absent if no information was present for that area of the DS. To ensure investigator reliability, a random sample of 25% of each fellow's DS was scored by 2 additional investigators (RK and HF) and all disagreements were reviewed and resolved by consensus.
Feedback
Between December 2006 and January 2007, one‐on‐one formative feedback sessions were scheduled. The sessions were approximately 30 minutes long, confidential, performed by 1 of the authors (AD) and followed a written format. During these sessions, each fellow received the results of their discharge summary audit, each partially complete or absent item was discussed, and the importance of DS was emphasized.
Audit #2
All available DS for each fellow's second month of inpatient service were audited for completeness, using the same 21 item assessment tool and the same scoring system.
Statistical Analysis
To determine the impact of our audit and feedback intervention, we compared scores before and after formative feedback sessions, both overall and for the composite discharge summary scores for each of the 4 domains of care: admission, hospital course, discharge‐planning, and postdischarge care. Scores were dichotomized as being complete or partially complete or absent. We used generalized estimating equations to account for the clustering of DS within fellows. Analyses were performed using SAS 9.1 (SAS Institute, Inc., Cary, NC). All statistical tests were 2‐tailed and used a type I error rate of 0.01 to account for multiple comparisons.
Results
Five fellows participated, 4 of whom were women; 2 were in postgraduate year 4, 3 in year 5. A total of 158 DS were audited, 89 prefeedback and 79 postfeedback. Each fellow dictated an average of 17 DS during each inpatient month.
During Audit #1, the 21 item DS were complete among 71%, incomplete among 18%, absent among 11%. Admission items, hospital course items, and discharge planning items were complete among 70%, 78%, and 77% of DS respectively, but postdischarge items were complete among only 57%. Examining individual items, the lowest completion rates were found for test result follow‐up (42%), caregiver information (10%), and home services (64%), as well for assessment at admission and discharge of cognitive and mental status (56% and 53% respectively) and functional status (57% and 40%). Of note, all these items are of particular importance to geriatric care.
After receiving the audit and feedback intervention, fellows were more likely to complete all required discharge summary data when compared to prior‐to‐feedback (91% vs. 71%, P 0.001). Discharge summary completeness improved for all composite outcomes examining the four domains of care: admission (93% vs. 70%, P 0.001), hospital course (93% vs. 78%, P 0.001), discharge planning (93% vs. 77%, P 0.02), and postdischarge care (83% vs. 57%., P 0.001) (Table 1).
| Criteria | Preintervention | Postintervention | P Value* | ||
|---|---|---|---|---|---|
| Complete | Absent | Complete | Absent | ||
| |||||
| Admission composite (5 items) | 70 (3585) | 30 (1565) | 93 (79100) | 7 (021) | 0.001 |
| HPI | 79 (38100) | 21 (1563) | 100 | 0 | 0.001 |
| PMH | 94 (75100) | 5 (025) | 99 (93100) | 1 (07) | 0.001 |
| Cognitive/mental status | 56 (1979) | 44 (2182) | 99 (93100) | 1 (07) | 0.001 |
| Functional status | 57 (2588) | 43 (1375) | 97 (89100) | 2 (010) | 0.001 |
| Physical exam | 63 (19100) | 37 (082) | 72 (0100) | 28 (5100) | 0.27 |
| Hospital course composite (3 items) | 78 (2593) | 22 (775) | 93 (76100) | 7 (023) | 0.001 |
| Hospital course | 84 (25100) | 15 (076) | 99 (93100) | 1 (07) | 0.001 |
| Procedures and tests | 70 (690) | 30 (1094) | 90 (57100) | 10 (043) | 0.001 |
| Complications | 80 (4490) | 20 (556) | 90 (77100) | 10 (023) | 0.07 |
| Discharge planning composite (8 items) | 77 (4989) | 22 (1151) | 93 (64100) | 7 (036) | 0.02 |
| Primary diagnosis | 93 (75100) | 6 (026) | 100 | 0 | 0.03 |
| Secondary diagnosis | 82 (56100) | 18 (044) | 100 | 0 | 0.002 |
| Overall condition | 81 (38100) | 19 (062) | 86 (21100) | 14 (079) | 0.47 |
| Cognitive/mental status | 53 (1380) | 57 (2088) | 97 (93100) | 3 (07) | 0.001 |
| Functional status | 40 (1381) | 50 (1988) | 99 (93100) | 1 (07) | 0.001 |
| Diet | 89 (63100) | 12 (538) | 81 (0100) | 19 (0100) | 0.25 |
| Activity | 89 (69100) | 11 (032) | 82 (0100) | 18 (0100) | 0.49 |
| Medications | 83 (50100) | 17 (050) | 100 | 0 | 0.002 |
| Postdischarge care composite (5 items) | 57 (4183) | 43 (1759) | 83 (6998) | 18 (231) | 0.001 |
| F/U results | 42 (1190) | 58 (1089) | 81 (50100) | 20 (050) | 0.02 |
| Discharge location | 92 (88100) | 8 (012) | 100 | 0 | 0.02 |
| Caregiver info | 10 (025) | 89 (75100) | 48 (795) | 52 (584) | 0.001 |
| Home services | 64 (32100) | 35 (068) | 87 (7195) | 12 (029) | 0.001 |
| F/U appointments | 78 (33100) | 23 (067) | 96 (86100) | 4 (014) | 0.001 |
| Overall composite (21 items) | 71 (4287) | 29 (1358) | 91 (7399) | 9 (227) | 0.001 |
Discussion
Our study found that audit and feedback sessions significantly improved the completeness of DS dictated by geriatric medicine fellows at 1 academic medical center. Before feedback, completeness was high in most traditional areas of the DS including admission data, hospital course, and discharge planning, but was low in other areas critical for safe transitions of older adults such as postdischarge care, test follow‐up, caregiver information, and cognitive and functional status changes. These findings were surprising, as using a template should render a completion rate close to 100%. Notably, during feedback sessions, fellows suggested low completion rates were due to lack of awareness regarding the importance of completing all 21 items of the template and missing documentation in patient medical records.
Feedback sessions dramatically improved overall completeness of subsequent DS and in most of areas of specific importance for geriatric care, although we remain uncertain why all areas did not show improvement (for example, caregiver information completion remained low). One possible explanation is the lack of accurate documentation for all necessary items in the hospital medical record. Moreover, we did not observe completion improvement for other items, ie, diet and activity. Overall, we believe that drawing attention to areas of particular importance to geriatric care transitions and providing learners with individual reports on their performance increased their awareness and motivated changes to their practice, improving discharge summary completion.
Our study has limitations. This study was a pilot intervention without a control group, because of time and budgetary constraints. Also, we were unable to assess for sustainability because the fellows studied for this project graduated after the second audit. Third, we studied discharge summary completion; further research should focus on accuracy of discharge summary content. Finally, while we did not use any advanced technologies or materials, faculty time required to conduct the audit and feedback in this study was estimated at 45 hours. In our opinion this estimate would classify our audit and feedback intervention as a low external cost and moderately‐high human cost intervention, which may represent a potential barrier to generalizability. On the other hand, we believe that even an audit of a small sample of DS done by a physician could provide valuable data for feedback and would involve less faculty time.
Our finding that audit and feedback sessions improved the completeness of DS among house‐staff is important for 2 reasons. First, we were able to demonstrate that focused feedback targeted to areas of particular importance to the transition of older adults changed subsequent behavior and resulted in improved documentation of these areas. Second, our study provides evidence of a programmatic approach to address the ACGME competency of practice‐based learning and improvement. We believe that our intervention can be reproduced by training programs across the country and are hopeful that such interventions will result in improved patient outcomes during critical care transitions such as hospital discharge.
- ,Quality assessment of a discharge summary system.CMAJ.1995;152:1437–1442.
- ,,Accuracy of information on medicines in hospital discharge summaries.Intern Med J.2006;36:221–225.
- ,,,,The incidence and severity of adverse events affecting patients after discharge from the hospital.Ann Intern Med.2003;138:161–167.
- Available at: http://www.jointcommission.org./. The Joint Commission Requirements/Hospitals/Record of Care/Patient safety. Accessed July2010.
- ,,,,General practitioners' attitudes to computer‐generated surgical discharge letters.Med J Aust.1992;157(6):380–382.
- ,,,Do primary care physicians prefer dictated or computer‐generated discharge summaries?Am J Dis Child.1993;147(9):986–988.
- ,,,,,Evaluation of a computer‐generated discharge summary for patients with acute coronary syndromes.Br J Gen Pract.1998;48(429):1163–1164.
- ,,, et al.Creating a better discharge summary: improvement in quality and timeliness using an electronic dischanrge summary,J Hosp Med.2009;4(4):219–225.
- ,Communication with general practitioners after accident and emergency attendance: computer generated letters are often deficient.Emerg Med J.2003;20(3):256–257.
- ,,Evaluation of electronic discharge summaries: a comparison of documentation in electronic and handwritten discharge summaries.Int J Med Inform.2008;77:613–620.
- ,,,,,Are discharge summaries teachable? The effects of a discharge summary curriculum on the quality of discharge summaries in an internal medicine residency program.Acad Med.2006;81:S5–S8.
- ,,Experience of medical senior house officers in preparing discharge summaries.BMJ.1996;312:350.
- ,,,,,Deficits in communication and information transfer between hospital‐based and primary care physicians: implications for patient safety and continuity of care.JAMA.2007;297:831–841.
- ,,,Primary care physician attitudes regarding communication with hospitalists.Dis Mon.2002;48:218–229.
- ,,Improving the continuity of care following discharge of patients hospitalized with heart failure: is the discharge summary adequate?Can J Cardiol.2003;19:365–370.
- Effects of continuing medical education on improving physician clinical care and patient health: a review of systematic reviews.Int J Technol Assess Health Care.2005;21:380–385.
- ,,, et al.Impact of feedback and didactic sessions on the reporting behavior of upper endoscopic findings by physicians and nurses.Clin Gastroenterol Hepatol.2007;5:326–330.
- ,,Prospective assessment of the impact of feedback on colonoscopy performance.Aliment Pharmacol Ther.2006;24:313–318.
- ,,, et al.Inpatient care to community care: improving clinical handover in the private mental health setting.Med J Aust.2009;190(11 Suppl):S144–S149.
- Available at: http://www.Acgme.org, Record of care, Treatment, and Serives, Standard RC.02.04.01. Accessed July2010.
Discharge summaries (DS) correlate with rates of rehospitalization1, 2 and adverse events after discharge.3 The Joint Commission on the Accreditation of Healthcare Organizations acknowledges their importance and mandates that certain elements be included.4 Thus far, however, DS are not standardized across institutions and there is no expectation that they be available at postdischarge visits. There have been numerous attempts to improve the quality of DS by using more structured formats or computer generated summaries with positive results in term of comprehensiveness, clarity, and practitioner satisfaction58 but with persistence of serious errors and omissions.9
Postgraduate training is often the first opportunity for physicians to learn information transfer management skills. Unfortunately, DS are created by house staff who have minimal training in this area11 and feel like they have to learn by osmosis,12 resulting in poor quality DS and lack of availability at the point of care.1315
Previous research suggested that individualized feedback sessions for Internal Medicine residents improved the quality of certain aspects of their completed DS.10 We postulated that an audit and feedback educational intervention on DS for first year geriatric medicine fellows would also improve their quality. This technique involves chart or case review of clinical practice behaviors for a specific task followed by recommendation of new behaviors when applicable.16 Audit and feedback incorporates adult learning theory,1719 an essential part of continuous quality improvement that fits within the Accreditation Council for Graduate Medical Education (ACGME) competency of practice based learning and improvement,20 as an educational activity.
Methods
Setting
We conducted a preintervention post intervention study at the Brookdale Department of Geriatrics and Palliative Medicine at Mount Sinai Medical Center (MSMC) in New York City between July 1, 2006 and June 30, 2007. The study received an exemption from the MSMC Institutional Review Board. First year geriatric medicine fellows at MSMC were required to complete 2 months of inpatient service; the first during the first 6 months of the academic year and the second during the last 6 months of the year. Fellows dictated all DS, which were transcribed and routed for signature to the attending of record. Prior to our study, a discharge summary template consisting of 21 items was developed for clinical use. Template items, agreed upon by an expert internal panel of geriatricians and interprofessional faculty, were selected for their importance in assuring a safe transition of older adults from the inpatient to the outpatient setting.
Participants
All 5 first‐year fellows at the Brookdale Department of Geriatrics and Palliative Medicine at MSMC were invited to participate in the study.
Intervention
Audit #1
All available DS for each fellow's first month of inpatient service were audited for completeness of the 21 item discharge summary template by 1 author (AD). The 21 items were focused on 4 distinct periods of the hospitalization: admission, hospital course, discharge planning, and postdischarge care (Figure 1).
Content under each of the 21 items was classified as complete, partially complete, or absent. An item was considered complete if most information was present and appropriate medical terms were used, partially complete if information was unclear, and absent if no information was present for that area of the DS. To ensure investigator reliability, a random sample of 25% of each fellow's DS was scored by 2 additional investigators (RK and HF) and all disagreements were reviewed and resolved by consensus.
Feedback
Between December 2006 and January 2007, one‐on‐one formative feedback sessions were scheduled. The sessions were approximately 30 minutes long, confidential, performed by 1 of the authors (AD) and followed a written format. During these sessions, each fellow received the results of their discharge summary audit, each partially complete or absent item was discussed, and the importance of DS was emphasized.
Audit #2
All available DS for each fellow's second month of inpatient service were audited for completeness, using the same 21 item assessment tool and the same scoring system.
Statistical Analysis
To determine the impact of our audit and feedback intervention, we compared scores before and after formative feedback sessions, both overall and for the composite discharge summary scores for each of the 4 domains of care: admission, hospital course, discharge‐planning, and postdischarge care. Scores were dichotomized as being complete or partially complete or absent. We used generalized estimating equations to account for the clustering of DS within fellows. Analyses were performed using SAS 9.1 (SAS Institute, Inc., Cary, NC). All statistical tests were 2‐tailed and used a type I error rate of 0.01 to account for multiple comparisons.
Results
Five fellows participated, 4 of whom were women; 2 were in postgraduate year 4, 3 in year 5. A total of 158 DS were audited, 89 prefeedback and 79 postfeedback. Each fellow dictated an average of 17 DS during each inpatient month.
During Audit #1, the 21 item DS were complete among 71%, incomplete among 18%, absent among 11%. Admission items, hospital course items, and discharge planning items were complete among 70%, 78%, and 77% of DS respectively, but postdischarge items were complete among only 57%. Examining individual items, the lowest completion rates were found for test result follow‐up (42%), caregiver information (10%), and home services (64%), as well for assessment at admission and discharge of cognitive and mental status (56% and 53% respectively) and functional status (57% and 40%). Of note, all these items are of particular importance to geriatric care.
After receiving the audit and feedback intervention, fellows were more likely to complete all required discharge summary data when compared to prior‐to‐feedback (91% vs. 71%, P 0.001). Discharge summary completeness improved for all composite outcomes examining the four domains of care: admission (93% vs. 70%, P 0.001), hospital course (93% vs. 78%, P 0.001), discharge planning (93% vs. 77%, P 0.02), and postdischarge care (83% vs. 57%., P 0.001) (Table 1).
| Criteria | Preintervention | Postintervention | P Value* | ||
|---|---|---|---|---|---|
| Complete | Absent | Complete | Absent | ||
| |||||
| Admission composite (5 items) | 70 (3585) | 30 (1565) | 93 (79100) | 7 (021) | 0.001 |
| HPI | 79 (38100) | 21 (1563) | 100 | 0 | 0.001 |
| PMH | 94 (75100) | 5 (025) | 99 (93100) | 1 (07) | 0.001 |
| Cognitive/mental status | 56 (1979) | 44 (2182) | 99 (93100) | 1 (07) | 0.001 |
| Functional status | 57 (2588) | 43 (1375) | 97 (89100) | 2 (010) | 0.001 |
| Physical exam | 63 (19100) | 37 (082) | 72 (0100) | 28 (5100) | 0.27 |
| Hospital course composite (3 items) | 78 (2593) | 22 (775) | 93 (76100) | 7 (023) | 0.001 |
| Hospital course | 84 (25100) | 15 (076) | 99 (93100) | 1 (07) | 0.001 |
| Procedures and tests | 70 (690) | 30 (1094) | 90 (57100) | 10 (043) | 0.001 |
| Complications | 80 (4490) | 20 (556) | 90 (77100) | 10 (023) | 0.07 |
| Discharge planning composite (8 items) | 77 (4989) | 22 (1151) | 93 (64100) | 7 (036) | 0.02 |
| Primary diagnosis | 93 (75100) | 6 (026) | 100 | 0 | 0.03 |
| Secondary diagnosis | 82 (56100) | 18 (044) | 100 | 0 | 0.002 |
| Overall condition | 81 (38100) | 19 (062) | 86 (21100) | 14 (079) | 0.47 |
| Cognitive/mental status | 53 (1380) | 57 (2088) | 97 (93100) | 3 (07) | 0.001 |
| Functional status | 40 (1381) | 50 (1988) | 99 (93100) | 1 (07) | 0.001 |
| Diet | 89 (63100) | 12 (538) | 81 (0100) | 19 (0100) | 0.25 |
| Activity | 89 (69100) | 11 (032) | 82 (0100) | 18 (0100) | 0.49 |
| Medications | 83 (50100) | 17 (050) | 100 | 0 | 0.002 |
| Postdischarge care composite (5 items) | 57 (4183) | 43 (1759) | 83 (6998) | 18 (231) | 0.001 |
| F/U results | 42 (1190) | 58 (1089) | 81 (50100) | 20 (050) | 0.02 |
| Discharge location | 92 (88100) | 8 (012) | 100 | 0 | 0.02 |
| Caregiver info | 10 (025) | 89 (75100) | 48 (795) | 52 (584) | 0.001 |
| Home services | 64 (32100) | 35 (068) | 87 (7195) | 12 (029) | 0.001 |
| F/U appointments | 78 (33100) | 23 (067) | 96 (86100) | 4 (014) | 0.001 |
| Overall composite (21 items) | 71 (4287) | 29 (1358) | 91 (7399) | 9 (227) | 0.001 |
Discussion
Our study found that audit and feedback sessions significantly improved the completeness of DS dictated by geriatric medicine fellows at 1 academic medical center. Before feedback, completeness was high in most traditional areas of the DS including admission data, hospital course, and discharge planning, but was low in other areas critical for safe transitions of older adults such as postdischarge care, test follow‐up, caregiver information, and cognitive and functional status changes. These findings were surprising, as using a template should render a completion rate close to 100%. Notably, during feedback sessions, fellows suggested low completion rates were due to lack of awareness regarding the importance of completing all 21 items of the template and missing documentation in patient medical records.
Feedback sessions dramatically improved overall completeness of subsequent DS and in most of areas of specific importance for geriatric care, although we remain uncertain why all areas did not show improvement (for example, caregiver information completion remained low). One possible explanation is the lack of accurate documentation for all necessary items in the hospital medical record. Moreover, we did not observe completion improvement for other items, ie, diet and activity. Overall, we believe that drawing attention to areas of particular importance to geriatric care transitions and providing learners with individual reports on their performance increased their awareness and motivated changes to their practice, improving discharge summary completion.
Our study has limitations. This study was a pilot intervention without a control group, because of time and budgetary constraints. Also, we were unable to assess for sustainability because the fellows studied for this project graduated after the second audit. Third, we studied discharge summary completion; further research should focus on accuracy of discharge summary content. Finally, while we did not use any advanced technologies or materials, faculty time required to conduct the audit and feedback in this study was estimated at 45 hours. In our opinion this estimate would classify our audit and feedback intervention as a low external cost and moderately‐high human cost intervention, which may represent a potential barrier to generalizability. On the other hand, we believe that even an audit of a small sample of DS done by a physician could provide valuable data for feedback and would involve less faculty time.
Our finding that audit and feedback sessions improved the completeness of DS among house‐staff is important for 2 reasons. First, we were able to demonstrate that focused feedback targeted to areas of particular importance to the transition of older adults changed subsequent behavior and resulted in improved documentation of these areas. Second, our study provides evidence of a programmatic approach to address the ACGME competency of practice‐based learning and improvement. We believe that our intervention can be reproduced by training programs across the country and are hopeful that such interventions will result in improved patient outcomes during critical care transitions such as hospital discharge.
- ,Quality assessment of a discharge summary system.CMAJ.1995;152:1437–1442.
- ,,Accuracy of information on medicines in hospital discharge summaries.Intern Med J.2006;36:221–225.
- ,,,,The incidence and severity of adverse events affecting patients after discharge from the hospital.Ann Intern Med.2003;138:161–167.
- Available at: http://www.jointcommission.org./. The Joint Commission Requirements/Hospitals/Record of Care/Patient safety. Accessed July2010.
- ,,,,General practitioners' attitudes to computer‐generated surgical discharge letters.Med J Aust.1992;157(6):380–382.
- ,,,Do primary care physicians prefer dictated or computer‐generated discharge summaries?Am J Dis Child.1993;147(9):986–988.
- ,,,,,Evaluation of a computer‐generated discharge summary for patients with acute coronary syndromes.Br J Gen Pract.1998;48(429):1163–1164.
- ,,, et al.Creating a better discharge summary: improvement in quality and timeliness using an electronic dischanrge summary,J Hosp Med.2009;4(4):219–225.
- ,Communication with general practitioners after accident and emergency attendance: computer generated letters are often deficient.Emerg Med J.2003;20(3):256–257.
- ,,Evaluation of electronic discharge summaries: a comparison of documentation in electronic and handwritten discharge summaries.Int J Med Inform.2008;77:613–620.
- ,,,,,Are discharge summaries teachable? The effects of a discharge summary curriculum on the quality of discharge summaries in an internal medicine residency program.Acad Med.2006;81:S5–S8.
- ,,Experience of medical senior house officers in preparing discharge summaries.BMJ.1996;312:350.
- ,,,,,Deficits in communication and information transfer between hospital‐based and primary care physicians: implications for patient safety and continuity of care.JAMA.2007;297:831–841.
- ,,,Primary care physician attitudes regarding communication with hospitalists.Dis Mon.2002;48:218–229.
- ,,Improving the continuity of care following discharge of patients hospitalized with heart failure: is the discharge summary adequate?Can J Cardiol.2003;19:365–370.
- Effects of continuing medical education on improving physician clinical care and patient health: a review of systematic reviews.Int J Technol Assess Health Care.2005;21:380–385.
- ,,, et al.Impact of feedback and didactic sessions on the reporting behavior of upper endoscopic findings by physicians and nurses.Clin Gastroenterol Hepatol.2007;5:326–330.
- ,,Prospective assessment of the impact of feedback on colonoscopy performance.Aliment Pharmacol Ther.2006;24:313–318.
- ,,, et al.Inpatient care to community care: improving clinical handover in the private mental health setting.Med J Aust.2009;190(11 Suppl):S144–S149.
- Available at: http://www.Acgme.org, Record of care, Treatment, and Serives, Standard RC.02.04.01. Accessed July2010.
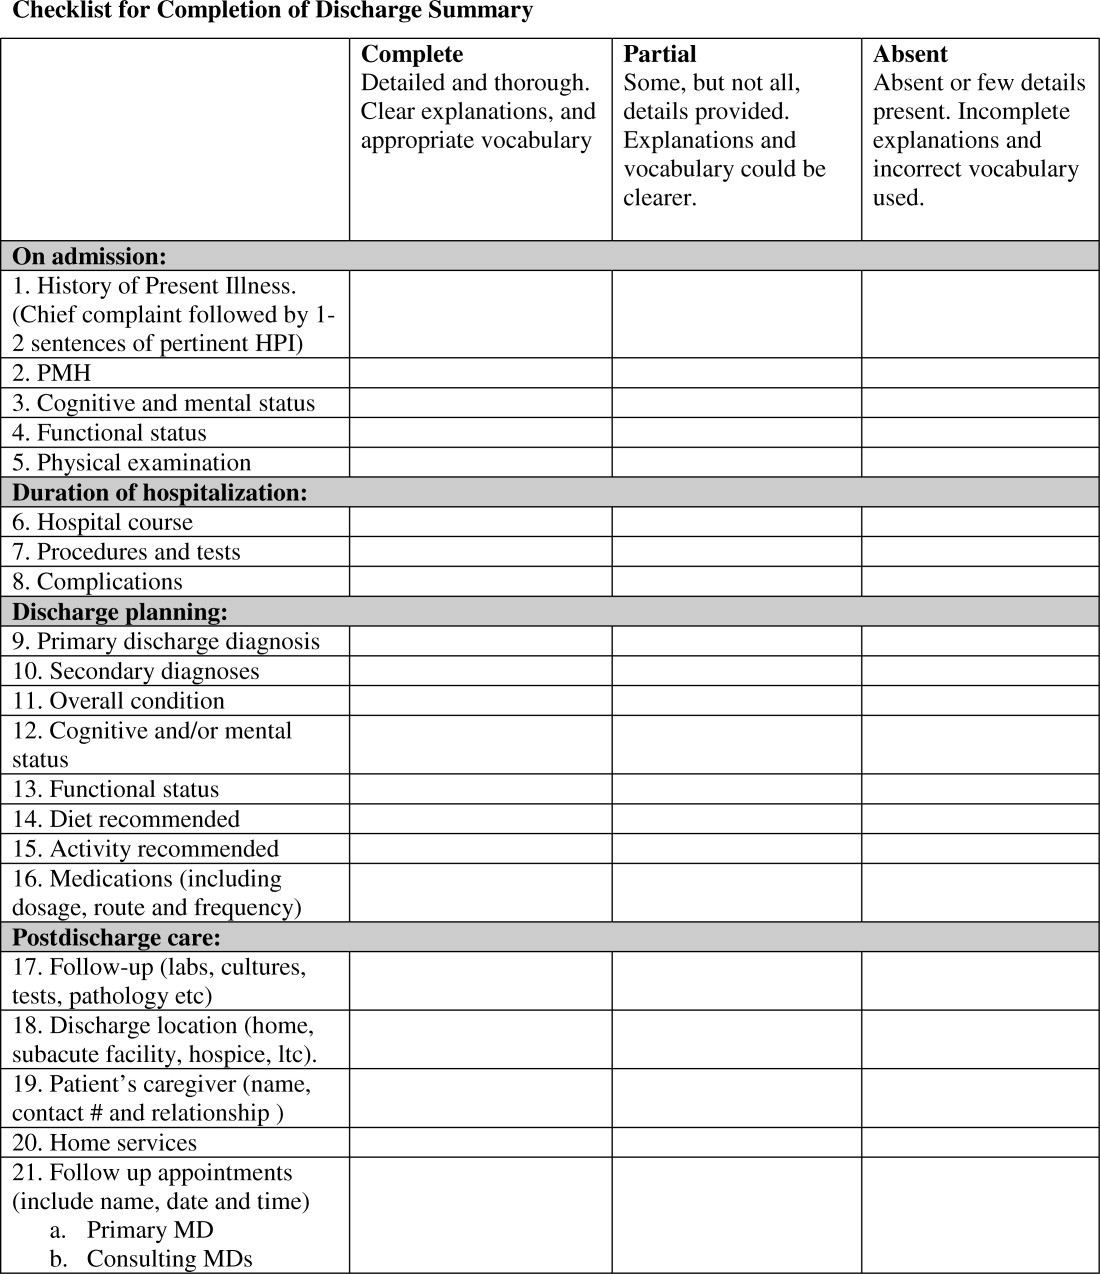
Family CPR Training Before Discharge
Patients discharged from the hospital with coronary disease complications experience an increased risk of sudden cardiac arrest (SCA), which afflicts over 200,000 people in the United States each year with an 80% to 90% mortality rate.17 Prompt delivery of cardiopulmonary resuscitation (CPR) can triple the probability of survival from SCA, yet less than 25% of SCA victims receive bystander CPR.8 Given that 80% of SCA events occur in the home environment, hospitalization could serve as an important point of capture for family instruction in CPR. Prior investigations have suggested conducting conventional CPR training courses before discharge for family members. However, significant barriers exist to this approach, including the requirement for a certified instructor and a large time commitment for standard training.912
To address these resource and time barriers, the American Heart Association recently established a video self‐instruction (VSI) course in CPR, eliminating the need for an instructor and reducing the time requirement for training to 25 minutes. The course consists of a digital video disc (DVD) and low‐cost inflatable mannequin in a self‐contained kit.13 Several investigations have shown that CPR performance skills of students after VSI courses are similar to those of students after traditional CPR training programs.1417 This VSI program presents the unique opportunity for secondary training, given that the DVD and mannequin may be shared by primary trainees with family members or friends. This VSI approach has not been evaluated in the hospital setting or with family members of patients at risk for SCA. We sought to test the feasibility of an in‐hospital CPR training program using the VSI tool, with the hypothesis that VSI training would be well‐accepted by family members of hospitalized patients with known or suspected coronary disease. We further hypothesized that subjects would be able to perform skills adequately and would be motivated to subsequently share the VSI course with others after their family member's hospital discharge.
METHODS
This prospective, multicenter investigation was approved by the University of Pennsylvania Institutional Review Board (IRB) and represents the initial component of an ongoing longitudinal study testing different methods of CPR education in the hospital setting. Enrollment was conducted at 3 hospitals: The Hospital of the University of Pennsylvania (a 700‐bed tertiary‐care academic medical center), Penn Presbyterian Medical Center (a 300‐bed tertiary‐care and community hospital) and Pennsylvania Hospital (a 400‐bed community hospital).
Recruitment Strategy
Family members of hospitalized patients with known or suspected coronary disease were targeted in this investigation (eg, patients admitted with known myocardial infarction, or patients over 40 years old admitted with chest pain or shortness of breath who had a known history of coronary risk factors). Recruitment took place in the cardiology and telemetry wards of each hospital site by research assistants who were previously CPR trained, but not certified as CPR instructors. Subjects were considered eligible for participation if they were a family member of a current inpatient with known or suspected coronary disease and had not received CPR instruction within the past 2 years. Subjects were excluded if they were under age 18 years, felt unwell, or considered themselves physically unable to undergo CPR training. Eligible individuals were approached using an IRB‐approved recruitment script. If the family member declined participation, the research assistant collected the individual's demographic information and reason for nonparticipation.
If the targeted individual expressed willingness to undergo CPR training, the research assistant administered a pretraining questionnaire to obtain demographic information and history of prior CPR instruction. Subjects then underwent the VSI training program in a family consultation room within the hospital unit, proctored by the research assistant. The VSI program contains an instructional DVD that teaches standard CPR (30 compressions: 2 breaths), as well as the importance of recognizing a nonresponsive patient and calling 9‐1‐1. The training process, including set‐up, video review, and practice routinely took less than 45 minutes per subject. Upon completion of the VSI session, subjects were tested in their newly acquired CPR skills using a VSI or a standard CPR‐recording mannequin, with CPR data analyzed via commercial software (Skill‐Reporter ResuciAnne and Skill‐Reporter software, Laerdal Medical Corporation, Wappinger Falls, NY). Compression rate was calculated as compressions per minute, omitting pauses, with video‐recorded data abstracted and combined with objective CPR recordings. Subjects then completed a Likert scale semi‐quantitative self‐assessment to rate their perspectives on the CPR training experience. Subjects were not compensated financially, but were given the VSI kit to bring home with them at no cost, for the opportunity of performing secondary training.
Assessment of Secondary Training
In an effort to determine whether subjects shared the VSI kit with other family members, follow‐up telephone contact was made with enrollees approximately 1 month after initial CPR training. Subjects were asked to complete a brief survey that included self‐reporting of whether they shared the kit, and if so, how many individuals were trained by the subject (measurement of secondary training, defined as the mean number of people trained for each kit distributed).
Data Analysis and Statistical Calculations
All data, including compiled survey results and CPR quantitative data, were abstracted using a spreadsheet application (Excel, Microsoft Corporation, Redmond, WA). Descriptive statistics were used to compare demographics of enrolled vs. nonenrolled populations, using either student's t‐tests for continuous variables or chi square tests for categorical data. Data are presented as mean standard deviation (SD), with significance set at an alpha = 0.05.
RESULTS
Subject Characteristics and Demographics
Subjects were recruited at the 3 hospital sites between May 2009 and January 2010. A total of 756 eligible individuals were approached, and 280 accepted enrollment for CPR training, representing a 37% enrollment rate (Figure 1). Of the 280 enrolled, 136 underwent instruction using the VSI training program as described, and 144 were enrolled using an experimental method of VSI training in CPR; this second cohort will be described elsewhere. When comparing the eligible individuals who declined enrollment versus those who accepted (Table 1), no significant differences were observed with regard to age, gender or race (P = NS for each). Common reasons cited for nonparticipation included lack of interest or lack of time (data not shown).

| Enrolled (%) n = 136 | Screened/Not Enrolled (%) n = 476 | |
|---|---|---|
| ||
| Age, years | 52 15 | 46 26 |
| Female | 94 (69) | 326 (68) |
| Race | ||
| White | 101 (74) | 316 (66) |
| Black | 30 (22) | 90 (19) |
| Hispanic | 5 (4) | 8 (2) |
| Other/no response | 0 (0) | 59 (13) |
| Relationship to patient | ||
| Spouse | 49 (36) | 171 (36) |
| Immediate family* | 58 (43) | 168 (35) |
| Other | 28 (21) | 76 (16) |
| No response | 1 (1) | 61 (13) |
| Highest Education | ||
| Elementary | 1 (1) | 1 (1) |
| Middle schoo1 | 1 (1) | 7 (1) |
| High school | 46 (34) | 157 (33) |
| Some college/vocation | 36 (26) | 86 (18) |
| College | 30 (22) | 92 (19) |
| Graduate school | 22 (16) | 39 (8) |
| No response | 0 (0) | 94 (20) |
| Previous CPR training | ||
| No | 78 (57) | |
| Yes: within past 2 years | 0 (0) | |
| Yes: within past 25 years | 13 (10) | |
| Yes: within past 510 years | 5 (4) | |
| Yes: more than 10 years ago | 40 (29) | |
Demographics of the enrolled subject cohort are detailed in Table 1. The mean age of subjects was 52 15, and 94 of 136 (69%) were female. Enrolled subjects represented spouses or immediate family members of the hospitalized patient in 107 of 136 (79%) of cases, and the vast majority, 118 of 136 (87%), had either never received CPR training or had received it over 10 years prior to current enrollment.
Subject Perspectives
A posttraining survey revealed that most respondents, 101 of 136 (74%) felt comfortable or very comfortable learning CPR from the VSI kit, and 127 of 136 (93%) felt likely or very likely to share the VSI kit (Figure 2).
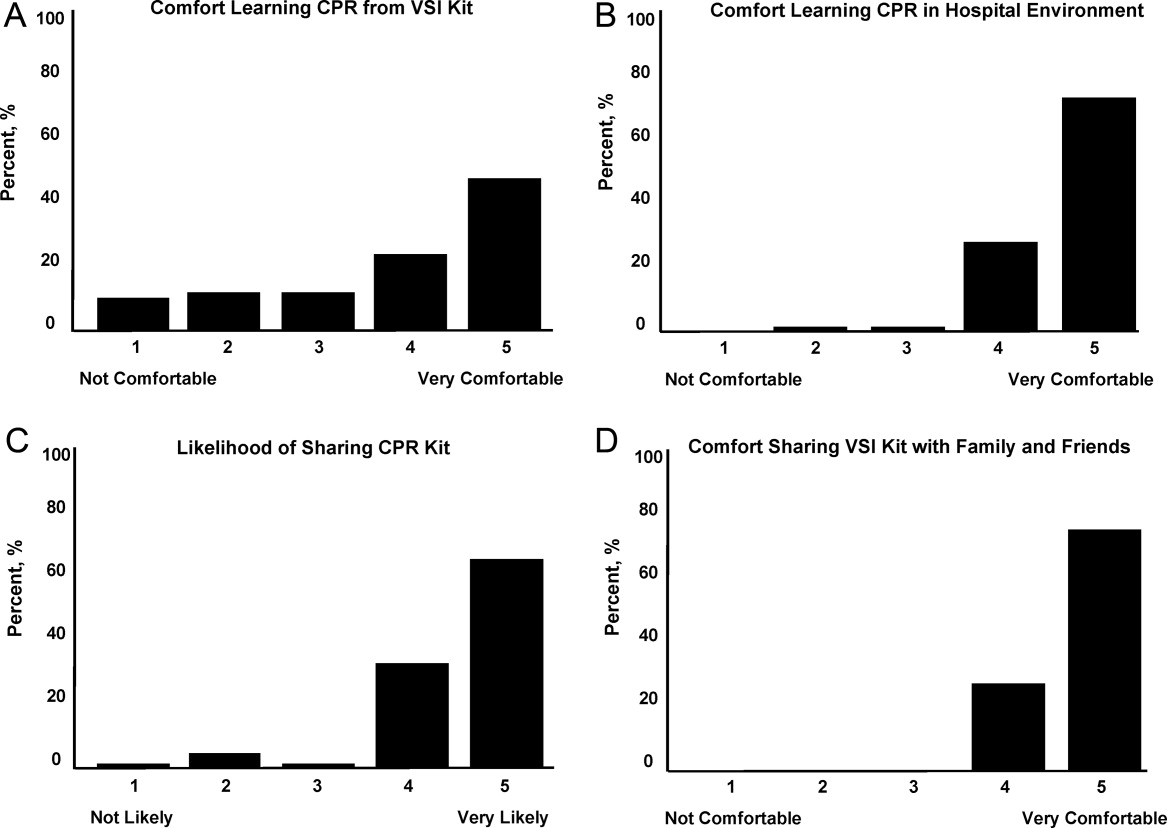
Resuscitation Skills Testing
After CPR training, subjects were asked to perform initial resuscitation actions including 2 minutes of CPR on a mannequin (Table 2). A total of 127 subjects completed these trainings, with 25 completing testing using a VSI kit and 102 using a depth‐recording mannequin; data from 9 subjects were excluded due to CPR recording technical problems. With regard to performance of initial resuscitation actions, 96 of 127 (76%) of subjects assessed responsiveness, 90 of 127 (71%) checked for breathing and 91 of 127 (72%) signaled the need to call for help. CPR was attempted by 127 of 127 (100%) subjects. The mean chest compression rate was 90 26 per minutes, and mean compression depth was 37 12 mm. The mean ventilation rate was 4 3 per minutes.
Secondary Training
Eligible subjects (n = 122) were surveyed via telephone 1 month after initial training, in which 95 individuals participated (78% response rate of those eligible for follow‐up). VSI kits were shared by 57 subjects, with a total of 132 additional individuals receiving VSI‐based CPR instruction. This represented a mean of 2.1 (median of 6) people trained per kit shared, with the actual number of people trained ranging from 1 to 15.
DISCUSSION
In the current work, we demonstrated the feasibility of using the hospital environment as a point of capture for training family members of at‐risk patients in CPR skills. Given that most SCA events occur in the home setting, family member training may hold greater potential for CPR delivery during actual events than training a similar number of younger laypersons at large. Other investigators have identified the focused identification and CPR training of populations at risk of SCA as an important and potentially efficient step to improve survival.10, 12, 18, 19 CPR education of family members before hospital discharge represents a logical extension of other cardiac risk factor‐focused health care education and services before patients are discharged home, including delivery of dietary counseling, diabetic teaching, and education regarding cardiac symptoms. To our knowledge, our work represents the first hospital‐based, adult, layperson, CPR training program using VSI as an instructional approach.
CPR training via a 25‐minute VSI program has been shown to yield CPR performance quality in trainees that is similar to that generated from formal CPR classes that require 3 hours to 4 hours.1416 While VSI training does not provide CPR certification, it is unlikely that the lack of testing and certification is a barrier to participation for the lay public. Indeed, the removal of the pressures of a formal class and testing may increase interest in CPR training through the VSI method.13, 20, 21
Several prior investigations have exploited VSI methodology as an outreach tool to teach CPR in various settings. A recent study in Norway used VSI CPR kits as refresher tools for hospital employees.22 Other work has focused on use of VSI implementation in schools.20, 21, 23 An example of this latter approach was a Danish initiative in which 35,000 VSI kits were distributed to seventh graders.20 Over 15,000 laypersons received secondary training at home by the initially trained students, highlighting a key advantage of the VSI kit approach. It has been argued that this secondary training phenomenon is among the reasons the VSI educational approach may offer a cost effective means for targeted family training.13, 20, 21
While participants in our program were able to adequately perform CPR skills and expressed self‐reported motivation and empowerment, it must be acknowledged that many trained laypersons still do not act when confronted with an actual arrest event.8 In addition, CPR quality at the time of actual performance may be variable, attenuating the survival benefit.2426 However, several population‐based observational studies have supported the notion that training more laypersons in CPR translates into improved overall survival rates from cardiac arrest.25, 27, 28 Further work will be required to follow newly trained, at‐risk family members over time to determine if SCA events occur, and if so, whether CPR was initiated.
Limitations
Willingness to undergo CPR training is likely to be confounded by cultural, regional, and educational factors. Therefore, the general applicability of this 3‐hospital program to other practice environments remains an open question. In our program, the majority of screened family members still refused participation; however, we did not discern a simple relationship between willingness to participate and age, gender, or race. Furthermore, we utilized paid research assistants as subject recruiters and proctors to the VSI training; from a broader implementation perspective, it would be important to determine whether hospital volunteers or staff could perform the training. In addition, while a VSI training kit currently costs $35 and a conventional CPR course could cost from $150 to $300, a formal cost‐effectiveness analysis of VSI training has yet to be performed. Another key limitation is that the secondary training effect was measured by participant self‐report, which may be prone to recall bias; however, no specific incentives or penalties were used to encourage over‐reporting of secondary training. Finally, in this short‐term feasibility study, no direct patient outcomes nor instances of CPR performance were measured.
CONCLUSIONS
In this prospective study of hospital‐based CPR training, we have shown that targeted training of families before hospital discharge is feasible, well received by trainees, and has the benefits of secondary training in the home environment, where most SCA events take place. This program could be easily implemented in other hospital or practice settings. Through targeted CPR training programs such as the one described in this investigation, at risk populations that are underrepresented in conventional CPR training classes can be equipped with important life‐saving skills. Further work on a larger scale will be required to measure the impact of such programs on patient outcomes.
Acknowledgements
The authors wish to thank Lori Albright, Matthew Buchwald, Laura Ebbeling, Emily Esposito, Lori Ingleton, Kristy Walsh, Benjamin Weisenthal, Julie Xu and Mariana Gonzalez for subject recruitment and data collection assistance.
- ,,, et al.Heart disease and stroke statistics–2010 update: a report from the American Heart Association.Circulation.2010;121(7):e46–e215.
- ,,, et al.Regional variation in out‐of‐hospital cardiac arrest incidence and outcome.JAMA.2008;300(12):1423–1431.
- ,,, et al.Prediction of sudden cardiac death after myocardial infarction in the beta‐blocking era.J Am Coll Cardiol.2003;42(4):652–658.
- ,,, et al.Sudden death in patients with myocardial infarction and left ventricular dysfunction, heart failure, or both.N Engl J Med.2005;352(25):2581–2588.
- ,,,.One‐year health status outcomes of unstable angina versus myocardial infarction: a prospective, observational cohort study of ACS survivors.BMC Cardiovasc Disord.2007;7:28.
- ,,,,.Sudden death after myocardial infarction.JAMA.2008;300(17):2022–2029.
- ,,.Elevated admission serum creatinine predicts poor myocardial blood flow and one‐year mortality in ST‐segment elevation myocardial infarction patients undergoing primary percutaneous coronary intervention.J Invasive Cardiol.2009;21(10):493–498.
- ,,,,,.CPR training and CPR performance: do CPR‐trained bystanders perform CPR?Acad Emerg Med.2006;13(6):596–601.
- ,,, et al.Reducing barriers for implementation of bystander‐initiated cardiopulmonary resuscitation: a scientific statement from the American Heart Association for healthcare providers, policymakers, and community leaders regarding the effectiveness of cardiopulmonary resuscitation.Circulation.2008;117(5):704–709.
- ,,.Understanding and improving low bystander CPR rates: a systematic review of the literature.CJEM.2008;10(1):51–65.
- ,.Are we training the right people yet? A survey of participants in public cardiopulmonary resuscitation classes.Resuscitation.1998;37(1):21–25.
- ,,, et al.Cardiac arrest in private locations: different strategies are needed to improve outcome.Resuscitation.2003;58(2):171–176.
- ,.The American Heart Association CPR Anytime Program: the potential impact of highly accessible training in cardiopulmonary resuscitation.J Cardiopulm Rehabil.2006;26(6):346–354.
- ,,,,.Laypersons may learn basic life support in 24 min using a personal resuscitation manikin.Resuscitation.2006;69(3):435–442.
- ,,, et al.Prospective, randomized trial of the effectiveness and retention of 30‐min layperson training for cardiopulmonary resuscitation and automated external defibrillators: The American Airlines Study.Resuscitation.2007;74(2):276–285.
- ,,,,,.Effectiveness of a 30‐min CPR self‐instruction program for lay responders: a controlled randomized study.Resuscitation.2005;67(1):31–43.
- ,,, et al.Randomized, controlled trial of video self‐instruction versus traditional CPR training.Ann Emerg Med.1998;31(3):364–369.
- ,,, et al.A randomized controlled trial of chest compression only CPR for older adults‐a pilot study.Resuscitation.2003;58(2):177–185.
- ,.Estimating cost‐effectiveness of mass cardiopulmonary resuscitation training strategies to improve survival from cardiac arrest in private locations.Prehosp Emerg Care.2004;8(4):420–423.
- ,,,.Disseminating cardiopulmonary resuscitation training by distributing 35,000 personal manikins among school children.Circulation.2007;116(12):1380–1385.
- ,,.Impact of a self‐instruction CPR kit on 7th graders' and adults' skills and CPR performance.Resuscitation.2008;79(1):103–108.
- ,,,,.Hospital employees improve basic life support skills and confidence with a personal resuscitation manikin and a 24‐min video instruction.Resuscitation.2009;80(8):898–902.
- ,,.High school students as ambassadors of CPR‐‐a model for reaching the most appropriate target population?Resuscitation.2010;81(1):78–81.
- ,,,.Three‐phase model of cardiac arrest: time‐dependent benefit of bystander cardiopulmonary resuscitation.Am J Cardiol.2006;98(4):497–499.
- ,,,.Performance of chest compressions by laypersons during the Public Access Defibrillation Trial.Resuscitation.2010;81(3):293–296.
- ,,, et al.Chest compression rates during cardiopulmonary resuscitation are suboptimal: a prospective study during in‐hospital cardiac arrest.Circulation.2005;111(4):428–434.
- ,,, et al.The Save Hearts in Arizona Registry and Education (SHARE) program: who is performing CPR and where are they doing it?Resuscitation.2007;75(1):68–75.
- ,,,,.Efficacy of bystander CPR: intervention by lay people and by health care professionals.Resuscitation.2005;66(3):291–295.
Patients discharged from the hospital with coronary disease complications experience an increased risk of sudden cardiac arrest (SCA), which afflicts over 200,000 people in the United States each year with an 80% to 90% mortality rate.17 Prompt delivery of cardiopulmonary resuscitation (CPR) can triple the probability of survival from SCA, yet less than 25% of SCA victims receive bystander CPR.8 Given that 80% of SCA events occur in the home environment, hospitalization could serve as an important point of capture for family instruction in CPR. Prior investigations have suggested conducting conventional CPR training courses before discharge for family members. However, significant barriers exist to this approach, including the requirement for a certified instructor and a large time commitment for standard training.912
To address these resource and time barriers, the American Heart Association recently established a video self‐instruction (VSI) course in CPR, eliminating the need for an instructor and reducing the time requirement for training to 25 minutes. The course consists of a digital video disc (DVD) and low‐cost inflatable mannequin in a self‐contained kit.13 Several investigations have shown that CPR performance skills of students after VSI courses are similar to those of students after traditional CPR training programs.1417 This VSI program presents the unique opportunity for secondary training, given that the DVD and mannequin may be shared by primary trainees with family members or friends. This VSI approach has not been evaluated in the hospital setting or with family members of patients at risk for SCA. We sought to test the feasibility of an in‐hospital CPR training program using the VSI tool, with the hypothesis that VSI training would be well‐accepted by family members of hospitalized patients with known or suspected coronary disease. We further hypothesized that subjects would be able to perform skills adequately and would be motivated to subsequently share the VSI course with others after their family member's hospital discharge.
METHODS
This prospective, multicenter investigation was approved by the University of Pennsylvania Institutional Review Board (IRB) and represents the initial component of an ongoing longitudinal study testing different methods of CPR education in the hospital setting. Enrollment was conducted at 3 hospitals: The Hospital of the University of Pennsylvania (a 700‐bed tertiary‐care academic medical center), Penn Presbyterian Medical Center (a 300‐bed tertiary‐care and community hospital) and Pennsylvania Hospital (a 400‐bed community hospital).
Recruitment Strategy
Family members of hospitalized patients with known or suspected coronary disease were targeted in this investigation (eg, patients admitted with known myocardial infarction, or patients over 40 years old admitted with chest pain or shortness of breath who had a known history of coronary risk factors). Recruitment took place in the cardiology and telemetry wards of each hospital site by research assistants who were previously CPR trained, but not certified as CPR instructors. Subjects were considered eligible for participation if they were a family member of a current inpatient with known or suspected coronary disease and had not received CPR instruction within the past 2 years. Subjects were excluded if they were under age 18 years, felt unwell, or considered themselves physically unable to undergo CPR training. Eligible individuals were approached using an IRB‐approved recruitment script. If the family member declined participation, the research assistant collected the individual's demographic information and reason for nonparticipation.
If the targeted individual expressed willingness to undergo CPR training, the research assistant administered a pretraining questionnaire to obtain demographic information and history of prior CPR instruction. Subjects then underwent the VSI training program in a family consultation room within the hospital unit, proctored by the research assistant. The VSI program contains an instructional DVD that teaches standard CPR (30 compressions: 2 breaths), as well as the importance of recognizing a nonresponsive patient and calling 9‐1‐1. The training process, including set‐up, video review, and practice routinely took less than 45 minutes per subject. Upon completion of the VSI session, subjects were tested in their newly acquired CPR skills using a VSI or a standard CPR‐recording mannequin, with CPR data analyzed via commercial software (Skill‐Reporter ResuciAnne and Skill‐Reporter software, Laerdal Medical Corporation, Wappinger Falls, NY). Compression rate was calculated as compressions per minute, omitting pauses, with video‐recorded data abstracted and combined with objective CPR recordings. Subjects then completed a Likert scale semi‐quantitative self‐assessment to rate their perspectives on the CPR training experience. Subjects were not compensated financially, but were given the VSI kit to bring home with them at no cost, for the opportunity of performing secondary training.
Assessment of Secondary Training
In an effort to determine whether subjects shared the VSI kit with other family members, follow‐up telephone contact was made with enrollees approximately 1 month after initial CPR training. Subjects were asked to complete a brief survey that included self‐reporting of whether they shared the kit, and if so, how many individuals were trained by the subject (measurement of secondary training, defined as the mean number of people trained for each kit distributed).
Data Analysis and Statistical Calculations
All data, including compiled survey results and CPR quantitative data, were abstracted using a spreadsheet application (Excel, Microsoft Corporation, Redmond, WA). Descriptive statistics were used to compare demographics of enrolled vs. nonenrolled populations, using either student's t‐tests for continuous variables or chi square tests for categorical data. Data are presented as mean standard deviation (SD), with significance set at an alpha = 0.05.
RESULTS
Subject Characteristics and Demographics
Subjects were recruited at the 3 hospital sites between May 2009 and January 2010. A total of 756 eligible individuals were approached, and 280 accepted enrollment for CPR training, representing a 37% enrollment rate (Figure 1). Of the 280 enrolled, 136 underwent instruction using the VSI training program as described, and 144 were enrolled using an experimental method of VSI training in CPR; this second cohort will be described elsewhere. When comparing the eligible individuals who declined enrollment versus those who accepted (Table 1), no significant differences were observed with regard to age, gender or race (P = NS for each). Common reasons cited for nonparticipation included lack of interest or lack of time (data not shown).
| Enrolled (%) n = 136 | Screened/Not Enrolled (%) n = 476 | |
|---|---|---|
| ||
| Age, years | 52 15 | 46 26 |
| Female | 94 (69) | 326 (68) |
| Race | ||
| White | 101 (74) | 316 (66) |
| Black | 30 (22) | 90 (19) |
| Hispanic | 5 (4) | 8 (2) |
| Other/no response | 0 (0) | 59 (13) |
| Relationship to patient | ||
| Spouse | 49 (36) | 171 (36) |
| Immediate family* | 58 (43) | 168 (35) |
| Other | 28 (21) | 76 (16) |
| No response | 1 (1) | 61 (13) |
| Highest Education | ||
| Elementary | 1 (1) | 1 (1) |
| Middle schoo1 | 1 (1) | 7 (1) |
| High school | 46 (34) | 157 (33) |
| Some college/vocation | 36 (26) | 86 (18) |
| College | 30 (22) | 92 (19) |
| Graduate school | 22 (16) | 39 (8) |
| No response | 0 (0) | 94 (20) |
| Previous CPR training | ||
| No | 78 (57) | |
| Yes: within past 2 years | 0 (0) | |
| Yes: within past 25 years | 13 (10) | |
| Yes: within past 510 years | 5 (4) | |
| Yes: more than 10 years ago | 40 (29) | |
Demographics of the enrolled subject cohort are detailed in Table 1. The mean age of subjects was 52 15, and 94 of 136 (69%) were female. Enrolled subjects represented spouses or immediate family members of the hospitalized patient in 107 of 136 (79%) of cases, and the vast majority, 118 of 136 (87%), had either never received CPR training or had received it over 10 years prior to current enrollment.
Subject Perspectives
A posttraining survey revealed that most respondents, 101 of 136 (74%) felt comfortable or very comfortable learning CPR from the VSI kit, and 127 of 136 (93%) felt likely or very likely to share the VSI kit (Figure 2).
Resuscitation Skills Testing
After CPR training, subjects were asked to perform initial resuscitation actions including 2 minutes of CPR on a mannequin (Table 2). A total of 127 subjects completed these trainings, with 25 completing testing using a VSI kit and 102 using a depth‐recording mannequin; data from 9 subjects were excluded due to CPR recording technical problems. With regard to performance of initial resuscitation actions, 96 of 127 (76%) of subjects assessed responsiveness, 90 of 127 (71%) checked for breathing and 91 of 127 (72%) signaled the need to call for help. CPR was attempted by 127 of 127 (100%) subjects. The mean chest compression rate was 90 26 per minutes, and mean compression depth was 37 12 mm. The mean ventilation rate was 4 3 per minutes.
Secondary Training
Eligible subjects (n = 122) were surveyed via telephone 1 month after initial training, in which 95 individuals participated (78% response rate of those eligible for follow‐up). VSI kits were shared by 57 subjects, with a total of 132 additional individuals receiving VSI‐based CPR instruction. This represented a mean of 2.1 (median of 6) people trained per kit shared, with the actual number of people trained ranging from 1 to 15.
DISCUSSION
In the current work, we demonstrated the feasibility of using the hospital environment as a point of capture for training family members of at‐risk patients in CPR skills. Given that most SCA events occur in the home setting, family member training may hold greater potential for CPR delivery during actual events than training a similar number of younger laypersons at large. Other investigators have identified the focused identification and CPR training of populations at risk of SCA as an important and potentially efficient step to improve survival.10, 12, 18, 19 CPR education of family members before hospital discharge represents a logical extension of other cardiac risk factor‐focused health care education and services before patients are discharged home, including delivery of dietary counseling, diabetic teaching, and education regarding cardiac symptoms. To our knowledge, our work represents the first hospital‐based, adult, layperson, CPR training program using VSI as an instructional approach.
CPR training via a 25‐minute VSI program has been shown to yield CPR performance quality in trainees that is similar to that generated from formal CPR classes that require 3 hours to 4 hours.1416 While VSI training does not provide CPR certification, it is unlikely that the lack of testing and certification is a barrier to participation for the lay public. Indeed, the removal of the pressures of a formal class and testing may increase interest in CPR training through the VSI method.13, 20, 21
Several prior investigations have exploited VSI methodology as an outreach tool to teach CPR in various settings. A recent study in Norway used VSI CPR kits as refresher tools for hospital employees.22 Other work has focused on use of VSI implementation in schools.20, 21, 23 An example of this latter approach was a Danish initiative in which 35,000 VSI kits were distributed to seventh graders.20 Over 15,000 laypersons received secondary training at home by the initially trained students, highlighting a key advantage of the VSI kit approach. It has been argued that this secondary training phenomenon is among the reasons the VSI educational approach may offer a cost effective means for targeted family training.13, 20, 21
While participants in our program were able to adequately perform CPR skills and expressed self‐reported motivation and empowerment, it must be acknowledged that many trained laypersons still do not act when confronted with an actual arrest event.8 In addition, CPR quality at the time of actual performance may be variable, attenuating the survival benefit.2426 However, several population‐based observational studies have supported the notion that training more laypersons in CPR translates into improved overall survival rates from cardiac arrest.25, 27, 28 Further work will be required to follow newly trained, at‐risk family members over time to determine if SCA events occur, and if so, whether CPR was initiated.
Limitations
Willingness to undergo CPR training is likely to be confounded by cultural, regional, and educational factors. Therefore, the general applicability of this 3‐hospital program to other practice environments remains an open question. In our program, the majority of screened family members still refused participation; however, we did not discern a simple relationship between willingness to participate and age, gender, or race. Furthermore, we utilized paid research assistants as subject recruiters and proctors to the VSI training; from a broader implementation perspective, it would be important to determine whether hospital volunteers or staff could perform the training. In addition, while a VSI training kit currently costs $35 and a conventional CPR course could cost from $150 to $300, a formal cost‐effectiveness analysis of VSI training has yet to be performed. Another key limitation is that the secondary training effect was measured by participant self‐report, which may be prone to recall bias; however, no specific incentives or penalties were used to encourage over‐reporting of secondary training. Finally, in this short‐term feasibility study, no direct patient outcomes nor instances of CPR performance were measured.
CONCLUSIONS
In this prospective study of hospital‐based CPR training, we have shown that targeted training of families before hospital discharge is feasible, well received by trainees, and has the benefits of secondary training in the home environment, where most SCA events take place. This program could be easily implemented in other hospital or practice settings. Through targeted CPR training programs such as the one described in this investigation, at risk populations that are underrepresented in conventional CPR training classes can be equipped with important life‐saving skills. Further work on a larger scale will be required to measure the impact of such programs on patient outcomes.
Acknowledgements
The authors wish to thank Lori Albright, Matthew Buchwald, Laura Ebbeling, Emily Esposito, Lori Ingleton, Kristy Walsh, Benjamin Weisenthal, Julie Xu and Mariana Gonzalez for subject recruitment and data collection assistance.
- ,,, et al.Heart disease and stroke statistics–2010 update: a report from the American Heart Association.Circulation.2010;121(7):e46–e215.
- ,,, et al.Regional variation in out‐of‐hospital cardiac arrest incidence and outcome.JAMA.2008;300(12):1423–1431.
- ,,, et al.Prediction of sudden cardiac death after myocardial infarction in the beta‐blocking era.J Am Coll Cardiol.2003;42(4):652–658.
- ,,, et al.Sudden death in patients with myocardial infarction and left ventricular dysfunction, heart failure, or both.N Engl J Med.2005;352(25):2581–2588.
- ,,,.One‐year health status outcomes of unstable angina versus myocardial infarction: a prospective, observational cohort study of ACS survivors.BMC Cardiovasc Disord.2007;7:28.
- ,,,,.Sudden death after myocardial infarction.JAMA.2008;300(17):2022–2029.
- ,,.Elevated admission serum creatinine predicts poor myocardial blood flow and one‐year mortality in ST‐segment elevation myocardial infarction patients undergoing primary percutaneous coronary intervention.J Invasive Cardiol.2009;21(10):493–498.
- ,,,,,.CPR training and CPR performance: do CPR‐trained bystanders perform CPR?Acad Emerg Med.2006;13(6):596–601.
- ,,, et al.Reducing barriers for implementation of bystander‐initiated cardiopulmonary resuscitation: a scientific statement from the American Heart Association for healthcare providers, policymakers, and community leaders regarding the effectiveness of cardiopulmonary resuscitation.Circulation.2008;117(5):704–709.
- ,,.Understanding and improving low bystander CPR rates: a systematic review of the literature.CJEM.2008;10(1):51–65.
- ,.Are we training the right people yet? A survey of participants in public cardiopulmonary resuscitation classes.Resuscitation.1998;37(1):21–25.
- ,,, et al.Cardiac arrest in private locations: different strategies are needed to improve outcome.Resuscitation.2003;58(2):171–176.
- ,.The American Heart Association CPR Anytime Program: the potential impact of highly accessible training in cardiopulmonary resuscitation.J Cardiopulm Rehabil.2006;26(6):346–354.
- ,,,,.Laypersons may learn basic life support in 24 min using a personal resuscitation manikin.Resuscitation.2006;69(3):435–442.
- ,,, et al.Prospective, randomized trial of the effectiveness and retention of 30‐min layperson training for cardiopulmonary resuscitation and automated external defibrillators: The American Airlines Study.Resuscitation.2007;74(2):276–285.
- ,,,,,.Effectiveness of a 30‐min CPR self‐instruction program for lay responders: a controlled randomized study.Resuscitation.2005;67(1):31–43.
- ,,, et al.Randomized, controlled trial of video self‐instruction versus traditional CPR training.Ann Emerg Med.1998;31(3):364–369.
- ,,, et al.A randomized controlled trial of chest compression only CPR for older adults‐a pilot study.Resuscitation.2003;58(2):177–185.
- ,.Estimating cost‐effectiveness of mass cardiopulmonary resuscitation training strategies to improve survival from cardiac arrest in private locations.Prehosp Emerg Care.2004;8(4):420–423.
- ,,,.Disseminating cardiopulmonary resuscitation training by distributing 35,000 personal manikins among school children.Circulation.2007;116(12):1380–1385.
- ,,.Impact of a self‐instruction CPR kit on 7th graders' and adults' skills and CPR performance.Resuscitation.2008;79(1):103–108.
- ,,,,.Hospital employees improve basic life support skills and confidence with a personal resuscitation manikin and a 24‐min video instruction.Resuscitation.2009;80(8):898–902.
- ,,.High school students as ambassadors of CPR‐‐a model for reaching the most appropriate target population?Resuscitation.2010;81(1):78–81.
- ,,,.Three‐phase model of cardiac arrest: time‐dependent benefit of bystander cardiopulmonary resuscitation.Am J Cardiol.2006;98(4):497–499.
- ,,,.Performance of chest compressions by laypersons during the Public Access Defibrillation Trial.Resuscitation.2010;81(3):293–296.
- ,,, et al.Chest compression rates during cardiopulmonary resuscitation are suboptimal: a prospective study during in‐hospital cardiac arrest.Circulation.2005;111(4):428–434.
- ,,, et al.The Save Hearts in Arizona Registry and Education (SHARE) program: who is performing CPR and where are they doing it?Resuscitation.2007;75(1):68–75.
- ,,,,.Efficacy of bystander CPR: intervention by lay people and by health care professionals.Resuscitation.2005;66(3):291–295.
Rapid Bedside Diagnosis of Shock
Shock has been defined as failure to deliver and/or utilize adequate amounts of oxygen1 and is a common cause of critical illness. Few studies have examined the predictive utility of bedside clinical examination in predicting the category of shock. Scholars have suggested a bedside approach that uses simple examination techniques and applied physiology to rapidly identify a patients' circulation as high vs. low cardiac output. Those with a high‐output examination are designated as high‐output, most often septic shock. Low‐output patients are further categorized as heart full or heart empty to distinguish cardiogenic from hypovolemic categories of shock, respectively.2 The predictive characteristics of this simple algorithm have not been studied. In this study, we examine the operating characteristics of selected elements of this algorithm when administered at the bedside by trainees in Internal Medicine.
Methods
This study was performed after approval of the Institutional Review Board; informed consent was waived. Patients with nonsurgical problems who present to the hospital or who develop sustained hypotension are managed by medical house officers on the intensive care and/or rapid response team with the supervision of patients' attending physicians. All house officers were asked to document explicitly in their assessment notes the following examination findings: finger capillary refill (same/quicker vs. slower than examiner's), hand skin temperature (same/warmer vs. cooler than examiner's) and pulse pressure (ie, same/wider vs. thinner than examiner's), presence or absence of crackles >1/3 from base on bilateral lung examination and jugular venous pressure (JVP) vs. 8 cmH2O. The documented examinations of either the rapid response team (PGY2; n = 14) or intensive care unit (ICU) resident (PGY3; n = 14) for patients evaluated between September 2008 and February 2009 were used for this study. Resuscitation was administered entirely by house officers, occasionally guided in person, but always supervised by attending physicians.
In May 2009, clinical data, including electrocardiograms/echocardiograms and laboratory (eg, cardiac enzymes, culture) results were abstracted from medical records of subjects. These were presented to a blinded senior clinician (DK) to review and apply evidence‐based or consensus criteria,36 whenever possible, to categorize the type of shock (septic vs. cardiogenic vs. hypovolemic) based on data acquired after the onset of shock. For example, patients with microbiologic and/or radiologic evidence of infection were classified as septic shock,1, 3, 4 those with acute left or right ventricular dysfunction on echocardiogram were classified as cardiogenic shock,1, 6 and those with clinical evidence of acute hemorrhage with hypovolemic shock.1, 5 While some of the patients were examined by DK as part of clinical care, he was blinded to the identity of patients and their algorithm‐related physical examination findings when he reviewed the abstracted data (>2 months after study closure) to adjudicate the final diagnosis of shock. These diagnoses were considered the reference standard for this study. The operating characteristics (sensitivity = true positive/true positive + false negative; specificity = true negative/true negative + false positive; negative predictive value (NPV) = true negative/all negatives; positive predictive value (PPV) = true positive/all positives; accuracy = true results/all results) were calculated for combinations of physical examination findings and correct final diagnosis (Figure 1).

Results
A total of 68 patients, averaging 71 16 years, were studied; 57% were male, and 66% were White, and 20% were Black. Table 1 lists characteristics of patients. A total of 37 patients were diagnosed as having septic shock, 11 had cardiogenic shock and 10 hypovolemic shock. Operating characteristics of the bedside examination techniques for predicting mechanism of shock are listed in Table 2. Capillary refill and skin temperature were 100% concordant yielding sensitivity of 89% (95% confidence interval [CI], 75‐97%), specificity of 68% (95% CI, 46‐83%), PPV of 77% (95% CI, 61‐88%), NPV of 84% (95% CI, 64‐96%) and overall accuracy of 79% (95% CI, 68‐88%) for diagnosis of high output (ie, septic shock). JVP 8 cmH2O was more accurate than crackles for predicting cardiogenic shock in low‐output patients with sensitivity of 82% (95% CI, 48‐98%), specificity of 79% (95% CI, 41‐95%), PPV of 75% (95% CI, 43‐95%), NPV of 85% (95% CI, 55‐98%), and overall accuracy of 80% (95%CI, 59‐93%). Using just skin temperature and JVP, the bedside approach misdiagnosed 19 of 75 cases (overall accuracy, 75%; 95% CI, 16‐37%).
| n Total | |
|---|---|
| |
| Gender, n (%) | n = 68 |
| Male | 39 (57) |
| Age, years | 71 16 |
| Race, n (%) | |
| White | 45 (66) |
| Black | 15 (22) |
| Hispanic | 7 (10) |
| Other | 1 (2) |
| High output, n (%) | n = 37 |
| Sepsis | |
| Pneumonia | 10 (27) |
| Urinary tract | 17 (46) |
| Skin | 3 (8) |
| Gastrointestinal | 5 (14) |
| Non‐infectious SIRS | 2 (5) |
| Low output heart full, n (%) | n = 18 |
| Pulmonary embolism | 3 (16) |
| AMI | 7 (40) |
| Cardiomyopathy | 5 (28) |
| Rhythm disturbance | 3 (16) |
| Low output heart empty, n (%) | n = 13 |
| Hemorrhagic | 9 (70) |
| NPO | 1 (7) |
| Diarrhea | 2 (14) |
| Adrenal crisis | 1 (7) |
| Prediction of SIRS | Capillary Refill Same/Faster (%) | Skin Same/ Warm (%) | Bounding Pulses (%) |
|---|---|---|---|
| |||
| Sensitivity | 89 | 89 | 65 |
| Specificity | 68 | 68 | 74 |
| Accuracy | 79 | 79 | 69 |
| Prediction of SIRS | Capillary Refill Same/Faster + Warm Skin + Bounding Pulse (%) | Capillary Refill Same/Faster + Warm Skin (%) | Any Other Combination of 2 (%) |
| Sensitivity | 62 | 89 | 62 |
| Specificity | 74 | 68 | 74 |
| Accuracy | 67 | 79 | 67 |
| Prediction of Cardiogenic | JVP (%) | Crackles (%) | JVP + Crackles (%) |
| Sensitivity | 82 | 55 | 55 |
| Specificity | 79 | 71 | 100 |
| Accuracy | 80 | 64 | 80 |
Discussion
This is the first study to examine the predictive characteristics of simple bedside physical examination techniques in correctly predicting the category/mechanism of shock. Overall, the algorithm performed well, and accurately predicted the category of shock in three‐quarters of patients. It also has the benefit of being very rapid, taking only seconds to complete, using bedside techniques that even inexperienced clinicians can apply.
Very few studies have examined the accuracy of examination techniques specifically for diagnosis of shock. In humans injected with endotoxin, body temperature and cardiac output increased, but skin temperature and capillary refill times are not well described.79 Schriger and Baraff10 reported that capillary refill >2 seconds was only 59% sensitive for diagnosing hypovolemia in patients with hypovolemic shock or orthostatic changes in blood pressure. Sensitivity was 77% in 13 patients with hypovolemic shock.10 However, some studies have demonstrated that age, sex, external temperature11 and fever12 can affect capillary refill times. Otieno et al.13 demonstrated a kappa statistic value of 0.49 for capillary refill 4 seconds, suggesting that reproducibility of this technique could be a major drawback. McGee et al.14 reviewed examination techniques for diagnosing hypovolemic states and concluded that postural changes in heart rate and blood pressure were the most accurate; capillary refill was not recommended. Stevenson and Perloff15 demonstrated that crackles and elevated JVP were absent in 18 of 43 patients with pulmonary capillary wedge pressures >22 mmHg. Butman et al.16 showed that elevated JVP was 82% accurate for predicting a wedge pressure >18 mmHg. Connors et al.17 demonstrated that clinicians' predictions of heart filling pressures and cardiac output were accurate (relative to pulmonary artery catheter measurements) in less than 50% of cases, though the examination techniques used were not qualified or quantified. No previous study has combined simple, semiobjective physical examination techniques for the purpose of distinguishing categories of shock.
Since identification of the pathogenesis of shock has important treatment/prognostic implications (eg, fluid and vasopressor therapies, early search for drainable focus of infection in sepsis, reestablishing vessel patency in myocardial infarction and pulmonary embolus), we believe that this simple, rapidly administered algorithm will prove useful in clinical medicine. In some clinical situations, the approach can lead to timely identification of the causative mechanism, allowing prompt definitive treatment. For example, a patient presenting with high‐output hypotension is so often sepsis/septic shock that treatment with antibiotics is justified (since success is time‐sensitive) even when the exact site/microbe has not yet been identified. Acute right heart overfilled low‐output hypotension should be considered pulmonary embolism (which also requires time‐sensitive therapies) until proven otherwise. Yet, a sizeable number of cases do not fit neatly into a single category. For example, 11% of patients with septic shock presented with cool extremities in the early phases of illness. In clinical decision‐making, 2 diagnostic‐therapeutic paradigms are common. In the first, the diagnosis is relatively certain and narrowly‐directed, mechanism‐specific treatment is appropriate. The second paradigm is 1 of significant uncertainty, when clinicians must treat empirically the most likely causes until more data become available to permit safe narrowing of therapies. For example, a patient presenting with hypotension, cool extremities, leukocytosis and apparent pneumonia should be treated empirically for septic shock while exploring explanations for the incongruous low‐output state (eg, profound hypovolemia, adrenal insufficiency, concurrent or precedent myocardial dysfunction). Patients often have several mechanisms contributing to hypotension. Since patients are not ideal forms, there can be no perfect decision‐tool; clinicians would be fool‐hardy to prematurely close decision‐making prior to definitive diagnosis. In the case of shock, such diagnostic arrogance would delay time‐sensitive therapies and thus contribute to morbidity and mortality. Nonetheless, this physical examination algorithmunderstanding its operating characteristics and limitationsmay add to the bedside clinician's diagnostic armamentarium.
Our study has several notable limitations. First, bedside examinations were performed by multiple observers who had limited (1 electronic mail) instruction on how to perform and document the data gathered for this study. So these results should be generalized cautiously until reproduced at other centers with greater numbers of observers (than the 28 of this study). The central supposition, that skin cooler, capillary refill longer, and pulse pressure more narrow than theirs, presupposes reasonable homogeneity of the normal state which is not necessarily true.11 Interobserver variability of physical examination further compromises the fidelity of findings recorded for this study.13 Since we conducted a retrospective review, and because of the emergency nature of the clinical problem, it would be difficult to conduct a study in which multiple examiners performed the same physical examinations to quantify interobserver variability. Irrespective, we would expect interobserver variability to systematically reduce accuracy; it is all‐the‐more impressive that trainees' examination results correctly diagnosed mechanism of shock in three‐quarters of cases. Also, examiners were not blinded to clinical history, so results of their examination could have been biased by their pre‐examination hypotheses of pathogenesis. Of course, they were not aware of the expert's final categorization of mechanism performed much later in time. Since there is no absolute reference standard for classification of the pathogenesis of shock, we depended upon careful review of selected data (same parameters for each patient) by a single senior investigatoralbeit armed with evidence‐based or consensus‐based standards of diagnosing shock. Finally, it can be argued that all forms of shock are mixed (with hypovolemia) early in the course; sepsis requires refilling of a leaky and dilated vasculature and the noncompliant ischemic ventricle often requires a higher filling pressure than normal to empty. To complicate even more, patients may have preexistent conditions (eg, chronic congestive heart failure, cirrhosis) that limit cardiovascular responses to acute shock. Our diagnostic approach was to identify the principal cause of the acute decompensation, assuming that many patients will have more than 1 single mechanism accounting for hypotension.
In conclusion, this is the first study to examine the utility of this simple physical examination algorithm to diagnose the mechanism of shock. Some have discounted or underemphasized examination techniques in favor of more time‐intensive and labor‐intensive diagnostic modalities, such as bedside echocardiography, which may waste precious time and resources. The simple physical examination algorithm assessed in this study has favorable operating characteristics and can be performed readily by even novice clinicians. If replicated at other centers and by greater numbers of observers, this approach could assist clinicians and teachers who train clinicians to rapidly diagnose and manage patients with shock.
- ,,, et al.Hemodynamic monitoring in shock and implications for management. International consensus conference. Paris, France, 27–28 April 2006.Intensive Care Med.2007;33:575–590.
- .The pathophysiology of the circulation in critical illness. In:Principles of Critical Care.New York:McGraw Hill;2005.
- ,,, et al.2001 SCCM/ESICM/ACCP/ATS/SIS. International Sepsis Definitions Conference.Crit Care Med.2003;31:1250–1256.
- ,,, et al.Definitions for sepsis and organ failure and guidelines for the use of innovative therapies in sepsis.Chest.1992;101:1644–1655;
- ,,, et al.Resuscitation from severe hemorrhage.Crit Care Med.1996;24(2 Suppl):S12–S23.
- ,.Cardiogenic shock: current concepts and improving outcomes circulation.Circulation.2008;117:686–697.
- ,,, et al.The cardiovascular response of normal humans to the administration of endotoxin.N Engl J Med.1989;321:280–287.
- ,,,,,.Experimental endotoxemia in humans: análysis of cytokine release and coagulation, fibrinolytic, an complement pathways.Blood.1990;76:2520–2526.
- ,,,,.Peripheral resistance changes during shock in man.Angiology.1968;19:268–276.
- ,.Capillary refill—is it a useful predictor of hypovolemic states?Ann Emerg Med.1991;20:601–605.
- ,.Defining normal capillary refill: variation with age, sex, and temperature.Ann Emerg Med.1988;17:113–116.
- ,,,.Effect of fever on capillary refill time.Pediatr Emerg Care.1997;13:305–307.
- ,,,,,.Are bedside features of shock reproducible between different observers?Arch Dis Child.2004;89:977–979.
- ,,.Is this patient hypovolemic?JAMA.1999;281:1022–1029.
- ,.The limited reliability of physical signs for estimating hemodynamics in chronic heart failure.JAMA.1989;261:884–888.
- ,,,,.Bedside cardiovascular examination in patients with severe chronic heart failure: importance of rest or inducible jugular venous distension.J Am Coll Cardiol.1993;22:968–974.
- ,,.Evaluation of right‐heart catheterization in the critically ill patients without acute myocardial infarction.N Engl J Med.1983;308(5):263–267.
Shock has been defined as failure to deliver and/or utilize adequate amounts of oxygen1 and is a common cause of critical illness. Few studies have examined the predictive utility of bedside clinical examination in predicting the category of shock. Scholars have suggested a bedside approach that uses simple examination techniques and applied physiology to rapidly identify a patients' circulation as high vs. low cardiac output. Those with a high‐output examination are designated as high‐output, most often septic shock. Low‐output patients are further categorized as heart full or heart empty to distinguish cardiogenic from hypovolemic categories of shock, respectively.2 The predictive characteristics of this simple algorithm have not been studied. In this study, we examine the operating characteristics of selected elements of this algorithm when administered at the bedside by trainees in Internal Medicine.
Methods
This study was performed after approval of the Institutional Review Board; informed consent was waived. Patients with nonsurgical problems who present to the hospital or who develop sustained hypotension are managed by medical house officers on the intensive care and/or rapid response team with the supervision of patients' attending physicians. All house officers were asked to document explicitly in their assessment notes the following examination findings: finger capillary refill (same/quicker vs. slower than examiner's), hand skin temperature (same/warmer vs. cooler than examiner's) and pulse pressure (ie, same/wider vs. thinner than examiner's), presence or absence of crackles >1/3 from base on bilateral lung examination and jugular venous pressure (JVP) vs. 8 cmH2O. The documented examinations of either the rapid response team (PGY2; n = 14) or intensive care unit (ICU) resident (PGY3; n = 14) for patients evaluated between September 2008 and February 2009 were used for this study. Resuscitation was administered entirely by house officers, occasionally guided in person, but always supervised by attending physicians.
In May 2009, clinical data, including electrocardiograms/echocardiograms and laboratory (eg, cardiac enzymes, culture) results were abstracted from medical records of subjects. These were presented to a blinded senior clinician (DK) to review and apply evidence‐based or consensus criteria,36 whenever possible, to categorize the type of shock (septic vs. cardiogenic vs. hypovolemic) based on data acquired after the onset of shock. For example, patients with microbiologic and/or radiologic evidence of infection were classified as septic shock,1, 3, 4 those with acute left or right ventricular dysfunction on echocardiogram were classified as cardiogenic shock,1, 6 and those with clinical evidence of acute hemorrhage with hypovolemic shock.1, 5 While some of the patients were examined by DK as part of clinical care, he was blinded to the identity of patients and their algorithm‐related physical examination findings when he reviewed the abstracted data (>2 months after study closure) to adjudicate the final diagnosis of shock. These diagnoses were considered the reference standard for this study. The operating characteristics (sensitivity = true positive/true positive + false negative; specificity = true negative/true negative + false positive; negative predictive value (NPV) = true negative/all negatives; positive predictive value (PPV) = true positive/all positives; accuracy = true results/all results) were calculated for combinations of physical examination findings and correct final diagnosis (Figure 1).
Results
A total of 68 patients, averaging 71 16 years, were studied; 57% were male, and 66% were White, and 20% were Black. Table 1 lists characteristics of patients. A total of 37 patients were diagnosed as having septic shock, 11 had cardiogenic shock and 10 hypovolemic shock. Operating characteristics of the bedside examination techniques for predicting mechanism of shock are listed in Table 2. Capillary refill and skin temperature were 100% concordant yielding sensitivity of 89% (95% confidence interval [CI], 75‐97%), specificity of 68% (95% CI, 46‐83%), PPV of 77% (95% CI, 61‐88%), NPV of 84% (95% CI, 64‐96%) and overall accuracy of 79% (95% CI, 68‐88%) for diagnosis of high output (ie, septic shock). JVP 8 cmH2O was more accurate than crackles for predicting cardiogenic shock in low‐output patients with sensitivity of 82% (95% CI, 48‐98%), specificity of 79% (95% CI, 41‐95%), PPV of 75% (95% CI, 43‐95%), NPV of 85% (95% CI, 55‐98%), and overall accuracy of 80% (95%CI, 59‐93%). Using just skin temperature and JVP, the bedside approach misdiagnosed 19 of 75 cases (overall accuracy, 75%; 95% CI, 16‐37%).
| n Total | |
|---|---|
| |
| Gender, n (%) | n = 68 |
| Male | 39 (57) |
| Age, years | 71 16 |
| Race, n (%) | |
| White | 45 (66) |
| Black | 15 (22) |
| Hispanic | 7 (10) |
| Other | 1 (2) |
| High output, n (%) | n = 37 |
| Sepsis | |
| Pneumonia | 10 (27) |
| Urinary tract | 17 (46) |
| Skin | 3 (8) |
| Gastrointestinal | 5 (14) |
| Non‐infectious SIRS | 2 (5) |
| Low output heart full, n (%) | n = 18 |
| Pulmonary embolism | 3 (16) |
| AMI | 7 (40) |
| Cardiomyopathy | 5 (28) |
| Rhythm disturbance | 3 (16) |
| Low output heart empty, n (%) | n = 13 |
| Hemorrhagic | 9 (70) |
| NPO | 1 (7) |
| Diarrhea | 2 (14) |
| Adrenal crisis | 1 (7) |
| Prediction of SIRS | Capillary Refill Same/Faster (%) | Skin Same/ Warm (%) | Bounding Pulses (%) |
|---|---|---|---|
| |||
| Sensitivity | 89 | 89 | 65 |
| Specificity | 68 | 68 | 74 |
| Accuracy | 79 | 79 | 69 |
| Prediction of SIRS | Capillary Refill Same/Faster + Warm Skin + Bounding Pulse (%) | Capillary Refill Same/Faster + Warm Skin (%) | Any Other Combination of 2 (%) |
| Sensitivity | 62 | 89 | 62 |
| Specificity | 74 | 68 | 74 |
| Accuracy | 67 | 79 | 67 |
| Prediction of Cardiogenic | JVP (%) | Crackles (%) | JVP + Crackles (%) |
| Sensitivity | 82 | 55 | 55 |
| Specificity | 79 | 71 | 100 |
| Accuracy | 80 | 64 | 80 |
Discussion
This is the first study to examine the predictive characteristics of simple bedside physical examination techniques in correctly predicting the category/mechanism of shock. Overall, the algorithm performed well, and accurately predicted the category of shock in three‐quarters of patients. It also has the benefit of being very rapid, taking only seconds to complete, using bedside techniques that even inexperienced clinicians can apply.
Very few studies have examined the accuracy of examination techniques specifically for diagnosis of shock. In humans injected with endotoxin, body temperature and cardiac output increased, but skin temperature and capillary refill times are not well described.79 Schriger and Baraff10 reported that capillary refill >2 seconds was only 59% sensitive for diagnosing hypovolemia in patients with hypovolemic shock or orthostatic changes in blood pressure. Sensitivity was 77% in 13 patients with hypovolemic shock.10 However, some studies have demonstrated that age, sex, external temperature11 and fever12 can affect capillary refill times. Otieno et al.13 demonstrated a kappa statistic value of 0.49 for capillary refill 4 seconds, suggesting that reproducibility of this technique could be a major drawback. McGee et al.14 reviewed examination techniques for diagnosing hypovolemic states and concluded that postural changes in heart rate and blood pressure were the most accurate; capillary refill was not recommended. Stevenson and Perloff15 demonstrated that crackles and elevated JVP were absent in 18 of 43 patients with pulmonary capillary wedge pressures >22 mmHg. Butman et al.16 showed that elevated JVP was 82% accurate for predicting a wedge pressure >18 mmHg. Connors et al.17 demonstrated that clinicians' predictions of heart filling pressures and cardiac output were accurate (relative to pulmonary artery catheter measurements) in less than 50% of cases, though the examination techniques used were not qualified or quantified. No previous study has combined simple, semiobjective physical examination techniques for the purpose of distinguishing categories of shock.
Since identification of the pathogenesis of shock has important treatment/prognostic implications (eg, fluid and vasopressor therapies, early search for drainable focus of infection in sepsis, reestablishing vessel patency in myocardial infarction and pulmonary embolus), we believe that this simple, rapidly administered algorithm will prove useful in clinical medicine. In some clinical situations, the approach can lead to timely identification of the causative mechanism, allowing prompt definitive treatment. For example, a patient presenting with high‐output hypotension is so often sepsis/septic shock that treatment with antibiotics is justified (since success is time‐sensitive) even when the exact site/microbe has not yet been identified. Acute right heart overfilled low‐output hypotension should be considered pulmonary embolism (which also requires time‐sensitive therapies) until proven otherwise. Yet, a sizeable number of cases do not fit neatly into a single category. For example, 11% of patients with septic shock presented with cool extremities in the early phases of illness. In clinical decision‐making, 2 diagnostic‐therapeutic paradigms are common. In the first, the diagnosis is relatively certain and narrowly‐directed, mechanism‐specific treatment is appropriate. The second paradigm is 1 of significant uncertainty, when clinicians must treat empirically the most likely causes until more data become available to permit safe narrowing of therapies. For example, a patient presenting with hypotension, cool extremities, leukocytosis and apparent pneumonia should be treated empirically for septic shock while exploring explanations for the incongruous low‐output state (eg, profound hypovolemia, adrenal insufficiency, concurrent or precedent myocardial dysfunction). Patients often have several mechanisms contributing to hypotension. Since patients are not ideal forms, there can be no perfect decision‐tool; clinicians would be fool‐hardy to prematurely close decision‐making prior to definitive diagnosis. In the case of shock, such diagnostic arrogance would delay time‐sensitive therapies and thus contribute to morbidity and mortality. Nonetheless, this physical examination algorithmunderstanding its operating characteristics and limitationsmay add to the bedside clinician's diagnostic armamentarium.
Our study has several notable limitations. First, bedside examinations were performed by multiple observers who had limited (1 electronic mail) instruction on how to perform and document the data gathered for this study. So these results should be generalized cautiously until reproduced at other centers with greater numbers of observers (than the 28 of this study). The central supposition, that skin cooler, capillary refill longer, and pulse pressure more narrow than theirs, presupposes reasonable homogeneity of the normal state which is not necessarily true.11 Interobserver variability of physical examination further compromises the fidelity of findings recorded for this study.13 Since we conducted a retrospective review, and because of the emergency nature of the clinical problem, it would be difficult to conduct a study in which multiple examiners performed the same physical examinations to quantify interobserver variability. Irrespective, we would expect interobserver variability to systematically reduce accuracy; it is all‐the‐more impressive that trainees' examination results correctly diagnosed mechanism of shock in three‐quarters of cases. Also, examiners were not blinded to clinical history, so results of their examination could have been biased by their pre‐examination hypotheses of pathogenesis. Of course, they were not aware of the expert's final categorization of mechanism performed much later in time. Since there is no absolute reference standard for classification of the pathogenesis of shock, we depended upon careful review of selected data (same parameters for each patient) by a single senior investigatoralbeit armed with evidence‐based or consensus‐based standards of diagnosing shock. Finally, it can be argued that all forms of shock are mixed (with hypovolemia) early in the course; sepsis requires refilling of a leaky and dilated vasculature and the noncompliant ischemic ventricle often requires a higher filling pressure than normal to empty. To complicate even more, patients may have preexistent conditions (eg, chronic congestive heart failure, cirrhosis) that limit cardiovascular responses to acute shock. Our diagnostic approach was to identify the principal cause of the acute decompensation, assuming that many patients will have more than 1 single mechanism accounting for hypotension.
In conclusion, this is the first study to examine the utility of this simple physical examination algorithm to diagnose the mechanism of shock. Some have discounted or underemphasized examination techniques in favor of more time‐intensive and labor‐intensive diagnostic modalities, such as bedside echocardiography, which may waste precious time and resources. The simple physical examination algorithm assessed in this study has favorable operating characteristics and can be performed readily by even novice clinicians. If replicated at other centers and by greater numbers of observers, this approach could assist clinicians and teachers who train clinicians to rapidly diagnose and manage patients with shock.
- ,,, et al.Hemodynamic monitoring in shock and implications for management. International consensus conference. Paris, France, 27–28 April 2006.Intensive Care Med.2007;33:575–590.
- .The pathophysiology of the circulation in critical illness. In:Principles of Critical Care.New York:McGraw Hill;2005.
- ,,, et al.2001 SCCM/ESICM/ACCP/ATS/SIS. International Sepsis Definitions Conference.Crit Care Med.2003;31:1250–1256.
- ,,, et al.Definitions for sepsis and organ failure and guidelines for the use of innovative therapies in sepsis.Chest.1992;101:1644–1655;
- ,,, et al.Resuscitation from severe hemorrhage.Crit Care Med.1996;24(2 Suppl):S12–S23.
- ,.Cardiogenic shock: current concepts and improving outcomes circulation.Circulation.2008;117:686–697.
- ,,, et al.The cardiovascular response of normal humans to the administration of endotoxin.N Engl J Med.1989;321:280–287.
- ,,,,,.Experimental endotoxemia in humans: análysis of cytokine release and coagulation, fibrinolytic, an complement pathways.Blood.1990;76:2520–2526.
- ,,,,.Peripheral resistance changes during shock in man.Angiology.1968;19:268–276.
- ,.Capillary refill—is it a useful predictor of hypovolemic states?Ann Emerg Med.1991;20:601–605.
- ,.Defining normal capillary refill: variation with age, sex, and temperature.Ann Emerg Med.1988;17:113–116.
- ,,,.Effect of fever on capillary refill time.Pediatr Emerg Care.1997;13:305–307.
- ,,,,,.Are bedside features of shock reproducible between different observers?Arch Dis Child.2004;89:977–979.
- ,,.Is this patient hypovolemic?JAMA.1999;281:1022–1029.
- ,.The limited reliability of physical signs for estimating hemodynamics in chronic heart failure.JAMA.1989;261:884–888.
- ,,,,.Bedside cardiovascular examination in patients with severe chronic heart failure: importance of rest or inducible jugular venous distension.J Am Coll Cardiol.1993;22:968–974.
- ,,.Evaluation of right‐heart catheterization in the critically ill patients without acute myocardial infarction.N Engl J Med.1983;308(5):263–267.
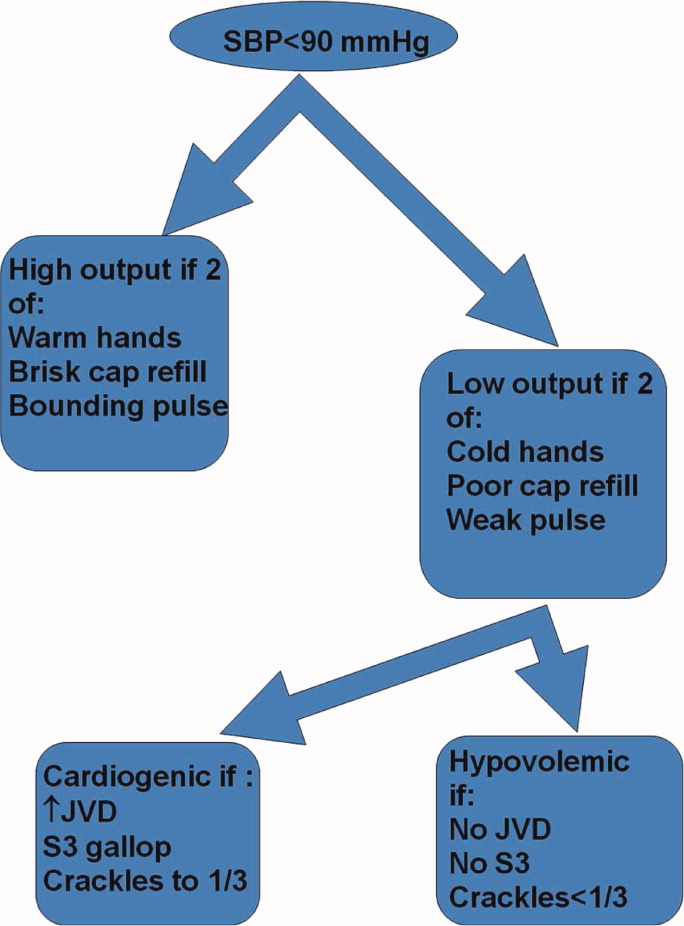
Community Hospitalist Time‐flow
In 2006, after introducing formal hospitalist programs at both an academic hospital and an affiliated community teaching hospital, we conducted a time study to gain insight into the effect of adopting a community model in an academic environment. This evaluation was conducted to identify similarities and differences between the 2 programs and to highlight opportunities for process and quality improvement. The hospitalist case mix index (CMI) was higher at the academic center (1.3) than at the community center (1.1). At both institutions documentation and most order entry were completed on paper, while lab and test results were electronically available. Both hospitalist programs were nonteaching services with day shifts staffed from 7:00 AM to 7:00 PM. At the academic center, a single hospitalist staffed the service for 7 days in a row with an average daily census of 10 patients. At the community hospital, 2 hospitalists carried the service, alternating days as the primary admitter. These hospitalists each carried an average census of 13 patients for 6 days in a row with staggered start/stop dates to ensure service continuity. The years of experience as a practicing hospitalist were similar between the 2 programs (median 4 years and range 1‐10 years for both programs); all hospitalists completed an internal medicine residency.
Methods
A paper‐based tool was used to collect data at 1‐minute intervals into 5 major categories validated through trial observation, content focus groups, and expert opinion. The 5 categories were Direct Patient Care, Indirect Patient Care, Travel, Personal, and Other (Table 1). Communication, a subcategory of Indirect Patient Care, was further classified by the job‐profession category and communication modality of the individual(s) interacting with the hospitalist. The tool allowed for more than 1 task category to be tracked at a time in order to capture multitasking. Three trained industrial engineers shadowed 9 different hospitalists during the day shifts, between 2 and 5 shifts per hospitalist, gathering approximately 355 hours of observational data over the 8 weeks of the study; 4 weeks at each hospital. Weekend and night shift data were not collected due to observer availability. Results for each setting were reported as the mean and standard deviation percentage of physician time observed for each task category. The results were also reported as the mean and standard deviation volume adjusted time per patient for each task category. The adjustment was made by dividing physician time by the number of patient encounters for that observation. Comparative analyses were calculated using a t‐test with a significance level of 0.05 and confidence intervals were reported at a 95% interval. Since this project was a quality improvement initiative analyzing the introduction of a new clinical service, Institutional Review Board (IRB) approval from our institution was not required.
| Category | Definition |
|---|---|
| |
| Direct patient care | Interviewing patient, examining patient, performing procedure on patient, family meeting |
| Indirect patient care | Subcategories listed below |
| Documentation | Writing rules, filling out forms, dictating |
| Orders | Writing paper orders in patient chart, entering orders in CPOE |
| Reviewing records | Looking up medical records in either electronic or paper chart |
| Medical references | Reviewing text books or using computer to consult UpToDate, do literature search, review Micromedix, or use personal digital assistant (PDA) to look up similar information |
| Other indirect patient care | Looking for paper chart, forms, procedural items or work space; waiting for page return, computer to lead, etc |
| Communication | Subcategories listed below |
| Nurse/tech | Nurse or medical technologist |
| Case manager | Case manager or social worker |
| Primary care physician | Talking with the patient's primary care physician |
| Inpatient physician | Specialist attendings, fellows, residents, medical students, other hospitalists |
| Other staff | Pharmacist, therapist, nurse practitioner, physician assistant, unit clerk |
| Phone | On the phone (attribute of Communication) |
| Emailing or text paging (attribute of Communication) | |
| In person | Face to face discussion (attribute of Communication) |
| Personal | Lunch, restroom, calls |
| Travel | Walking between units |
| Other | Meetings, administrative activities |
Results
Hospitalist time allocations at the 2 programs were comparatively similar (Table 2). At the academic center, hospitalists spent the majority of their time providing indirect patient care (69.8%, CI: 66.3‐73.3%), followed by direct patient care (13.1%, CI: 11.2‐14.9%), with the remaining time distributed among travel, personal, and other administrative duties. Likewise, the community hospitalists spent the majority of their time providing indirect patient care (68.7%, CI: 63.0‐74.5%), followed by direct patient care (16.7%, CI: 14.1‐19.4%), with travel, personal, and administrative duties completing the day. Additionally, the percent of time spent multitasking, defined as more than 1 task category observed at the same time, was strikingly similar between the 2 groups (Academic: 47.6% 16.5%, Community: 47.9% 9.8%).
| Academic (%) | Community (%) | P Value | |||
|---|---|---|---|---|---|
| Mean | Stdev | Mean | Stdev | ||
| Direct patient care | 13.8 | 4.1 | 17.2 | 6.3 | 0.032 |
| Indirect patient care | 68.2 | 8.0 | 68.0 | 13.2 | 0.756 |
| Documentation | 15.4 | 3.3% | 22.0 | 6.2 | 0.000 |
| Orders | 6.3 | 1.5 | 4.7 | 1.6 | 0.011 |
| Community Rev records | 21.3 | 5.0 | 21.7 | 6.2 | 0.000 |
| Medical refs | l.5 | 0.8 | 0.6 | 0.6 | 0.000 |
| Other indirect patient care | 2.0 | 1.3 | 2.6 | 1.6 | 0.210 |
| Communication | 21.7 | 4.2 | 16.5 | 4.7 | 0.000 |
| Nurse/tech | 5.4 | 2.0 | 5.3 | 2.8 | 0.895 |
| Care manager | 2.8 | 1.8 | 3.4 | 1.7 | 0.229 |
| Primary care physician | 1.1 | 1.2 | 1.1 | 1.1 | 0.818 |
| Inpatient physician | 12.5 | 3.9 | 6.7 | 2.6 | 0.000 |
| Other staff | 6.4 | 9.7 | 2.3 | 1.2 | 0.029 |
| Personal | 4.1 | 2.4 | 2.5 | 1.8 | 0.029 |
| Travel | 4.4 | 1.2 | 3.9 | 1.0 | 0.311 |
| Other | 9.5 | 8.9 | 8.4 | 17.4 | 0.850 |
While the difference in total percent of time spent on direct patient care was statistically significant (P = 0.03), the values converged after adjusting for the differences in average daily census (Table 3). On average, both the academic and community hospitalists spent approximately 10 minutes per patient per day interacting face to face with the patient and/or family (10.0 2.9 minutes and 10.1 3.6 minutes respectively, P = 0.89). However, after volume adjusting, other workflow differences became statistically significant, primarily in indirect patient care (Academic: 54.7 11.1 minutes/patient, Community: 41.9 9.8 minutes/patient, P 0.001). The academic hospitalists spent more time writing orders (4.6 1.3 minutes/patient vs. 2.8 1.1 minutes/patient, P 0.001), looking up and reviewing medical reference materials (1.1 0.6 minutes/patient vs. 0.3 0.4 minutes/patient, P 0.001), and communicating with other providers (20.5 7.7 min/patient vs. 11.1 3.1 min/patient, P 0.001) than their community hospitalist counterparts. Nearly half the time that the academic hospitalists spent communicating was dedicated to speaking with other physicians (9.2 3.5 minutes/patient); more than double that of the community hospitalists (4.0 1.6 minutes). Additionally, the academic hospitalists spent more time speaking with pharmacists (0.7 0.6 minutes vs. 0.1 0.2 minutes, P = 0.001).
| Academic | Community | P Value | |||
|---|---|---|---|---|---|
| Mean | Stdev | Mean | Stdev | ||
| Dir pt care | 10.0 | 2.9 | 10.1 | 3.6 | 0.890 |
| Indirect pt care | 50.1 | 8.4 | 40.5 | 9.8 | 0.000 |
| Documentation | 11.3 | 2.7 | 13.1 | 3.9 | 0.101 |
| Orders | 4.6 | 1.3 | 2.8 | 1.1 | 0.000 |
| Rev records | 15.6 | 4.0 | 13.0 | 4.8 | 0.069 |
| Medial refs | 1.1 | 0.6 | 0.3 | 0.4 | 0.000 |
| Other pt care | 1.5 | 1.0 | 1.5 | 1.0 | 0.833 |
| Communication | 16.0 | 3.8 | 9.7 | 2.8 | 0.000 |
| Nurse/tech | 3.9 | 1.4 | 3.1 | 1.6 | 0.102 |
| Case manager | 2.0 | 1.3 | 2.0 | 1.0 | 0.950 |
| Prim care physician | 0.8 | 0.9 | 0.7 | 0.7 | 0.547 |
| Inpatient physician | 9.2 | 3.5 | 4.0 | 1.6 | 0.000 |
| Other staff | 4.6 | 6.8 | 1.4 | 0.7 | 0.049 |
| Personal | 3.0 | 1.8 | 1.5 | 1.0 | 0.002 |
| Travel | 3.2 | 0.9 | 2.3 | 0.6 | 0.001 |
| Other | 6.8 | 6.0 | 4.4 | 8.4 | 0.306 |
Discussion
In 2006, O'Leary et al.1 demonstrated that academic hospitalists spend approximately 20% of their time engaged in direct patient care. Our results are consistent with these data and further expand these findings to a community setting. Although we found subtle workflow differences between the academic and community programs, their similarities were more striking than their differences. We suspect that these differences can be largely attributed to the higher CMI at the academic program as well as the greater complexity and additional communication hand‐offs inherent to this tertiary academic medical center. For example, at the academic medical center, medicine admissions were screened by a medicine triage resident and subsequently handed off to a hospitalist. In most cases, this system did not preclude the need to speak directly with the emergency department (ED) attending, adding a layer of complexity that did not exist in the community hospital. Finally, in contrast to the community hospital, there was little comanagement at the academic medical center, necessitating frequent transfers to and from medical and subspecialty services.
It appears that hospitalists, irrespective of their work environment, spend far more time documenting, communicating, and coordinating care than at the bedside. It is unclear whether this represents a desirable outcome of hospitalists' role as managers of complex hospital stays or inefficient and ineffective effort that should be mitigated through care delivery redesign. Further research to optimize hospital information management, streamline care processes and eliminate low value‐added effort is clearly needed.
Another notable finding of our study is that hospitalists spend roughly half of their time performing more than 1 work category at the same time deemed as multitasking.2 The prevalence and effects of multitasking are well‐characterized in emergency medicine and likely apply to hospitalists.3, 4 Fractured attention due to multitasking may hamper communication, jeopardize care handoffs, and increase risk for medical errors and litigation.46 While it is likely that multitasking is inherent to the practice of hospital medicine, it is unclear how this could be mitigated or better facilitated. Perhaps this could be done through structured communication and information management. This too merits further investigation.
Lastly, this study found that it takes approximately an hour of a hospitalist's time each day to manage 1 patient's care. This in and of itself, is very important from the standpoint of both billing and workload. In today's professional services fee model, there are a number of components that contribute to the level of service that a hospitalist can bill. One of those components is time, specifically the time spent counseling and/or coordinating care, which as this study suggests, dominates a hospitalist's workday. It is therefore critical that hospitalists accurately and consistently document the amount of time they spend with each patient and specifically describe the counseling and/or activities to coordinate care. Additionally, recognizing how much time is required for a hospitalist to care for a patient has important workload implications. If we assume that it takes approximately an hour per patient and a typical workday is around 11 hours after subtracting personal time, then it would be reasonable to expect that a single hospitalist should have, on average, 11 patient encounters per day. This number is, of course, completely dependent on organizational factors such as a specific hospital's support systems and the mix of admissions, follow‐ups, and discharges on that service.
Our study has several limitations. The time study occurred at 2 hospitals, in 1 mid‐sized Midwestern city, and the results may not be generalizable to other settings. However, the congruence of our findings with those of O'Leary et al.1 suggests that our results maintain external validity. Second, at the time of the study the 2 programs were relatively new and workflows were still evolving. Additionally, the academic and community hospitalist programs were under unified management and 2 of the surveyed hospitalists worked at both programs. This may have artificially homogenized the work patterns observed at both programs. Finally, observing hospitalist activities exclusively during the weekday daytime shifts has the potential to bias the results. However, the night and weekend duties and responsibilities of the 2 programs differed significantly, which would have made it very difficult to derive meaningful comparisons for those observations.
Conclusion
We found that hospitalists in both academic and community settings spend the majority of their time multitasking and engaged in indirect patient care. Further studies are necessary to determine the extent to which this is a necessary feature of the hospitalist care model and whether hospitalists should restructure their workflow to improve outcomes.
- , , .How hospitalists spend their time: Insights on efficiency and safety.J Hosp Med.2006;1:88–93.
- , , , .Emergency department workplace interruptions: Are emergency physicians “interrupt‐driven” and “multitasking”?Acad Emerg Med.2008;7:1239–1243.
- , , , .Work interrupted: a comparison of workplace interruptions in the emergency departments and primary care offices.Ann Emerg Med.2001;38:146–151.
- , , , , , .The multitasking clinician: Decision‐making and cognitive demand during and after team handoffs in emergency care.Int J Med Inform.2007;76:801–811.
- , , , , .Communication loads on clinical staff in the emergency department.Med J Aust.2002;176:415–418.
- , , .Why do people sue doctors? A study of patients and relatives taking legal action.Lancet.1994;343:1609–1613.
In 2006, after introducing formal hospitalist programs at both an academic hospital and an affiliated community teaching hospital, we conducted a time study to gain insight into the effect of adopting a community model in an academic environment. This evaluation was conducted to identify similarities and differences between the 2 programs and to highlight opportunities for process and quality improvement. The hospitalist case mix index (CMI) was higher at the academic center (1.3) than at the community center (1.1). At both institutions documentation and most order entry were completed on paper, while lab and test results were electronically available. Both hospitalist programs were nonteaching services with day shifts staffed from 7:00 AM to 7:00 PM. At the academic center, a single hospitalist staffed the service for 7 days in a row with an average daily census of 10 patients. At the community hospital, 2 hospitalists carried the service, alternating days as the primary admitter. These hospitalists each carried an average census of 13 patients for 6 days in a row with staggered start/stop dates to ensure service continuity. The years of experience as a practicing hospitalist were similar between the 2 programs (median 4 years and range 1‐10 years for both programs); all hospitalists completed an internal medicine residency.
Methods
A paper‐based tool was used to collect data at 1‐minute intervals into 5 major categories validated through trial observation, content focus groups, and expert opinion. The 5 categories were Direct Patient Care, Indirect Patient Care, Travel, Personal, and Other (Table 1). Communication, a subcategory of Indirect Patient Care, was further classified by the job‐profession category and communication modality of the individual(s) interacting with the hospitalist. The tool allowed for more than 1 task category to be tracked at a time in order to capture multitasking. Three trained industrial engineers shadowed 9 different hospitalists during the day shifts, between 2 and 5 shifts per hospitalist, gathering approximately 355 hours of observational data over the 8 weeks of the study; 4 weeks at each hospital. Weekend and night shift data were not collected due to observer availability. Results for each setting were reported as the mean and standard deviation percentage of physician time observed for each task category. The results were also reported as the mean and standard deviation volume adjusted time per patient for each task category. The adjustment was made by dividing physician time by the number of patient encounters for that observation. Comparative analyses were calculated using a t‐test with a significance level of 0.05 and confidence intervals were reported at a 95% interval. Since this project was a quality improvement initiative analyzing the introduction of a new clinical service, Institutional Review Board (IRB) approval from our institution was not required.
| Category | Definition |
|---|---|
| |
| Direct patient care | Interviewing patient, examining patient, performing procedure on patient, family meeting |
| Indirect patient care | Subcategories listed below |
| Documentation | Writing rules, filling out forms, dictating |
| Orders | Writing paper orders in patient chart, entering orders in CPOE |
| Reviewing records | Looking up medical records in either electronic or paper chart |
| Medical references | Reviewing text books or using computer to consult UpToDate, do literature search, review Micromedix, or use personal digital assistant (PDA) to look up similar information |
| Other indirect patient care | Looking for paper chart, forms, procedural items or work space; waiting for page return, computer to lead, etc |
| Communication | Subcategories listed below |
| Nurse/tech | Nurse or medical technologist |
| Case manager | Case manager or social worker |
| Primary care physician | Talking with the patient's primary care physician |
| Inpatient physician | Specialist attendings, fellows, residents, medical students, other hospitalists |
| Other staff | Pharmacist, therapist, nurse practitioner, physician assistant, unit clerk |
| Phone | On the phone (attribute of Communication) |
| Emailing or text paging (attribute of Communication) | |
| In person | Face to face discussion (attribute of Communication) |
| Personal | Lunch, restroom, calls |
| Travel | Walking between units |
| Other | Meetings, administrative activities |
Results
Hospitalist time allocations at the 2 programs were comparatively similar (Table 2). At the academic center, hospitalists spent the majority of their time providing indirect patient care (69.8%, CI: 66.3‐73.3%), followed by direct patient care (13.1%, CI: 11.2‐14.9%), with the remaining time distributed among travel, personal, and other administrative duties. Likewise, the community hospitalists spent the majority of their time providing indirect patient care (68.7%, CI: 63.0‐74.5%), followed by direct patient care (16.7%, CI: 14.1‐19.4%), with travel, personal, and administrative duties completing the day. Additionally, the percent of time spent multitasking, defined as more than 1 task category observed at the same time, was strikingly similar between the 2 groups (Academic: 47.6% 16.5%, Community: 47.9% 9.8%).
| Academic (%) | Community (%) | P Value | |||
|---|---|---|---|---|---|
| Mean | Stdev | Mean | Stdev | ||
| Direct patient care | 13.8 | 4.1 | 17.2 | 6.3 | 0.032 |
| Indirect patient care | 68.2 | 8.0 | 68.0 | 13.2 | 0.756 |
| Documentation | 15.4 | 3.3% | 22.0 | 6.2 | 0.000 |
| Orders | 6.3 | 1.5 | 4.7 | 1.6 | 0.011 |
| Community Rev records | 21.3 | 5.0 | 21.7 | 6.2 | 0.000 |
| Medical refs | l.5 | 0.8 | 0.6 | 0.6 | 0.000 |
| Other indirect patient care | 2.0 | 1.3 | 2.6 | 1.6 | 0.210 |
| Communication | 21.7 | 4.2 | 16.5 | 4.7 | 0.000 |
| Nurse/tech | 5.4 | 2.0 | 5.3 | 2.8 | 0.895 |
| Care manager | 2.8 | 1.8 | 3.4 | 1.7 | 0.229 |
| Primary care physician | 1.1 | 1.2 | 1.1 | 1.1 | 0.818 |
| Inpatient physician | 12.5 | 3.9 | 6.7 | 2.6 | 0.000 |
| Other staff | 6.4 | 9.7 | 2.3 | 1.2 | 0.029 |
| Personal | 4.1 | 2.4 | 2.5 | 1.8 | 0.029 |
| Travel | 4.4 | 1.2 | 3.9 | 1.0 | 0.311 |
| Other | 9.5 | 8.9 | 8.4 | 17.4 | 0.850 |
While the difference in total percent of time spent on direct patient care was statistically significant (P = 0.03), the values converged after adjusting for the differences in average daily census (Table 3). On average, both the academic and community hospitalists spent approximately 10 minutes per patient per day interacting face to face with the patient and/or family (10.0 2.9 minutes and 10.1 3.6 minutes respectively, P = 0.89). However, after volume adjusting, other workflow differences became statistically significant, primarily in indirect patient care (Academic: 54.7 11.1 minutes/patient, Community: 41.9 9.8 minutes/patient, P 0.001). The academic hospitalists spent more time writing orders (4.6 1.3 minutes/patient vs. 2.8 1.1 minutes/patient, P 0.001), looking up and reviewing medical reference materials (1.1 0.6 minutes/patient vs. 0.3 0.4 minutes/patient, P 0.001), and communicating with other providers (20.5 7.7 min/patient vs. 11.1 3.1 min/patient, P 0.001) than their community hospitalist counterparts. Nearly half the time that the academic hospitalists spent communicating was dedicated to speaking with other physicians (9.2 3.5 minutes/patient); more than double that of the community hospitalists (4.0 1.6 minutes). Additionally, the academic hospitalists spent more time speaking with pharmacists (0.7 0.6 minutes vs. 0.1 0.2 minutes, P = 0.001).
| Academic | Community | P Value | |||
|---|---|---|---|---|---|
| Mean | Stdev | Mean | Stdev | ||
| Dir pt care | 10.0 | 2.9 | 10.1 | 3.6 | 0.890 |
| Indirect pt care | 50.1 | 8.4 | 40.5 | 9.8 | 0.000 |
| Documentation | 11.3 | 2.7 | 13.1 | 3.9 | 0.101 |
| Orders | 4.6 | 1.3 | 2.8 | 1.1 | 0.000 |
| Rev records | 15.6 | 4.0 | 13.0 | 4.8 | 0.069 |
| Medial refs | 1.1 | 0.6 | 0.3 | 0.4 | 0.000 |
| Other pt care | 1.5 | 1.0 | 1.5 | 1.0 | 0.833 |
| Communication | 16.0 | 3.8 | 9.7 | 2.8 | 0.000 |
| Nurse/tech | 3.9 | 1.4 | 3.1 | 1.6 | 0.102 |
| Case manager | 2.0 | 1.3 | 2.0 | 1.0 | 0.950 |
| Prim care physician | 0.8 | 0.9 | 0.7 | 0.7 | 0.547 |
| Inpatient physician | 9.2 | 3.5 | 4.0 | 1.6 | 0.000 |
| Other staff | 4.6 | 6.8 | 1.4 | 0.7 | 0.049 |
| Personal | 3.0 | 1.8 | 1.5 | 1.0 | 0.002 |
| Travel | 3.2 | 0.9 | 2.3 | 0.6 | 0.001 |
| Other | 6.8 | 6.0 | 4.4 | 8.4 | 0.306 |
Discussion
In 2006, O'Leary et al.1 demonstrated that academic hospitalists spend approximately 20% of their time engaged in direct patient care. Our results are consistent with these data and further expand these findings to a community setting. Although we found subtle workflow differences between the academic and community programs, their similarities were more striking than their differences. We suspect that these differences can be largely attributed to the higher CMI at the academic program as well as the greater complexity and additional communication hand‐offs inherent to this tertiary academic medical center. For example, at the academic medical center, medicine admissions were screened by a medicine triage resident and subsequently handed off to a hospitalist. In most cases, this system did not preclude the need to speak directly with the emergency department (ED) attending, adding a layer of complexity that did not exist in the community hospital. Finally, in contrast to the community hospital, there was little comanagement at the academic medical center, necessitating frequent transfers to and from medical and subspecialty services.
It appears that hospitalists, irrespective of their work environment, spend far more time documenting, communicating, and coordinating care than at the bedside. It is unclear whether this represents a desirable outcome of hospitalists' role as managers of complex hospital stays or inefficient and ineffective effort that should be mitigated through care delivery redesign. Further research to optimize hospital information management, streamline care processes and eliminate low value‐added effort is clearly needed.
Another notable finding of our study is that hospitalists spend roughly half of their time performing more than 1 work category at the same time deemed as multitasking.2 The prevalence and effects of multitasking are well‐characterized in emergency medicine and likely apply to hospitalists.3, 4 Fractured attention due to multitasking may hamper communication, jeopardize care handoffs, and increase risk for medical errors and litigation.46 While it is likely that multitasking is inherent to the practice of hospital medicine, it is unclear how this could be mitigated or better facilitated. Perhaps this could be done through structured communication and information management. This too merits further investigation.
Lastly, this study found that it takes approximately an hour of a hospitalist's time each day to manage 1 patient's care. This in and of itself, is very important from the standpoint of both billing and workload. In today's professional services fee model, there are a number of components that contribute to the level of service that a hospitalist can bill. One of those components is time, specifically the time spent counseling and/or coordinating care, which as this study suggests, dominates a hospitalist's workday. It is therefore critical that hospitalists accurately and consistently document the amount of time they spend with each patient and specifically describe the counseling and/or activities to coordinate care. Additionally, recognizing how much time is required for a hospitalist to care for a patient has important workload implications. If we assume that it takes approximately an hour per patient and a typical workday is around 11 hours after subtracting personal time, then it would be reasonable to expect that a single hospitalist should have, on average, 11 patient encounters per day. This number is, of course, completely dependent on organizational factors such as a specific hospital's support systems and the mix of admissions, follow‐ups, and discharges on that service.
Our study has several limitations. The time study occurred at 2 hospitals, in 1 mid‐sized Midwestern city, and the results may not be generalizable to other settings. However, the congruence of our findings with those of O'Leary et al.1 suggests that our results maintain external validity. Second, at the time of the study the 2 programs were relatively new and workflows were still evolving. Additionally, the academic and community hospitalist programs were under unified management and 2 of the surveyed hospitalists worked at both programs. This may have artificially homogenized the work patterns observed at both programs. Finally, observing hospitalist activities exclusively during the weekday daytime shifts has the potential to bias the results. However, the night and weekend duties and responsibilities of the 2 programs differed significantly, which would have made it very difficult to derive meaningful comparisons for those observations.
Conclusion
We found that hospitalists in both academic and community settings spend the majority of their time multitasking and engaged in indirect patient care. Further studies are necessary to determine the extent to which this is a necessary feature of the hospitalist care model and whether hospitalists should restructure their workflow to improve outcomes.
- , , .How hospitalists spend their time: Insights on efficiency and safety.J Hosp Med.2006;1:88–93.
- , , , .Emergency department workplace interruptions: Are emergency physicians “interrupt‐driven” and “multitasking”?Acad Emerg Med.2008;7:1239–1243.
- , , , .Work interrupted: a comparison of workplace interruptions in the emergency departments and primary care offices.Ann Emerg Med.2001;38:146–151.
- , , , , , .The multitasking clinician: Decision‐making and cognitive demand during and after team handoffs in emergency care.Int J Med Inform.2007;76:801–811.
- , , , , .Communication loads on clinical staff in the emergency department.Med J Aust.2002;176:415–418.
- , , .Why do people sue doctors? A study of patients and relatives taking legal action.Lancet.1994;343:1609–1613.
Hospitalist‐Run Observation Unit
Hospitalists play key roles in many types of clinical services, including teaching, nonteaching, consultative, and comanagement services.14 While the impact of hospitalist programs on LOS for inpatient medicine services has been studied,58 less work has focused on the impact of hospitalists in other types of service delivery, such as in short‐stay or observation units.
While many hospitals now have short‐stay units to care for observation patients, most are adjuncts of the emergency department. A Canadian hospitalist‐run short‐stay unit that targeted patients with an expected LOS of less than 3 days has been described.9 The experience of a single, chest‐painspecific service has also been reported.10
In August 2005, we introduced a hospitalist‐run observation unit, the Clinical Decision Unit (CDU), at University Hospital, the primary teaching affiliate of the University of Texas Health Science Center at San Antonio (San Antonio, TX). The rationale was that observation‐level care in a dedicated short‐stay unit would be more efficient than in an inpatient general medicine service. Through the creation of this unit, we consolidated the care of all medical observation patients, including patients previously evaluated in a cardiology‐run chest pain unit.
In this brief report, we present a description of the unit as well as a preliminary analysis of the impact of the unit on LOS for the most common CDU diagnoses.
Methods
CDU Structure
University Hospital is the Bexar County public hospital. It contains 604 acute care beds, and averages 70,000 emergency visits annually. The CDU is a geographically separate, 10‐bed unit, staffed with dedicated nurses in 8‐hour shifts and 24/7 by hospitalists in 12‐hour shifts. Four to five hospitalists rotate through the CDU monthly. About 30% of shifts are staffed through moonlighting by hospitalist faculty or fellows.
For admissions, through examining hospital LOS data, we targeted diagnoses for which patients might be expected to stay less than 24 hours. Potentially appropriate diagnoses were discussed by the group, and general admission guidelines were created based on consensus. These diagnoses included chest pain, cellulitis, pyelonephritis, syncope, asthma exacerbation, chronic obstructive pulmonary disease exacerbation, hyperglycemia, and hepatic encephalopathy. Table 1 lists these guidelines.
| Diagnosis | Guidelines |
|---|---|
| |
| Chest pain | Patients without EKG changes or positive troponins, but for whom stress test was indicated based on history or risk factors |
| Asthma | Patients with oxygen saturation >90% and demonstrating improvement in with ED nebulizer treatment |
| Syncope | Patients without known structural heart disease based on past medical history or exam findings |
| Cellulitis | Patients without suspicion for abscess or osteomyelitis |
| Pyelonephritis | Patients without change from baseline renal function; kidney transplant recipients excluded |
If a patient's stay exceeded 23 hours, the hospitalist could transfer the patient from the CDU to a general medicine team. Formal transfer guidelines were not created, but if patients were expected to be discharged within 12 hours, they generally remained in the CDU to minimize transitions. The census of the general medicine teams could also be a factor in transfer decisions: if they were at admitting capacity, the patient remained in the CDU.
Patients admitted to the general medicine units were cared for by 5 teaching teams, staffed exclusively by hospitalists.
Assessment of CDU Implementation on LOS
To examine the impact of unit implementation on LOS, we performed a retrospective, preimplementation/postimplementation comparison of the LOS of patients discharged 12 months before and after the unit opening on August 1, 2005. To ensure a comparison of similar patients, we identified the top 5 most common CDU discharge diagnoses, and identified people discharged from general medicine with the same diagnoses. Specifically, we compared the LOS of patients discharged from the general medicine units from August 1, 2004 to July 31, 2005, vs. those with the same diagnoses discharged from either the CDU or general medicine units from August 1, 2005 to July 31, 2006.
The 5 most common CDU discharge diagnoses were identified using hospital administrative discharge data. All International Statistical Classification of Diseases and Related Health Problems, 9th edition (ICD‐9) codes associated with CDU discharges were identified and listed in order of frequency. Related ICD‐9 codes were grouped. For example, angina (413.0) and chest pain (786.50, 786.59) were considered related, and were included as chest pain. These ICD‐9 codes were then used to identify patients discharged with these diagnoses in the pre‐CDU and post‐CDU periods. Patients on general medicine units were identified using admission location and admitting attending. Only patients admitted by a hospitalist to a general medicine floor were included. Patients were analyzed according to their admission location. All patients with relevant ICD‐9 codes were included in the analysis. None were excluded. For each patient identified, all data elements were present.
The acuity of patients admitted in the preimplementation and postimplementation periods was compared using the case‐mix index calculated by 3M Incorporated's All Patient RefinedDiagnosis‐Related Group methodology (3M APR‐DRG; 3M, St. Paul, MN). This adjusts administrative data for severity of illness and mortality risk based on primary diagnoses, comorbidities, age, and procedures. Patients are assigned to mortality classes with corresponding scores of 0 or higher.
Statistical Analysis
Statistical analyses were performed using STATA 8.0. LOS and acuity differences were assessed using 2‐sample t tests with equal variances.
Results
Clinical Experience with the CDU
The 5 most common CDU discharge diagnoses accounted for 724 discharges, and included chest pain, asthma, syncope, cellulitis, and pyelonephritis. The ICD‐9 codes, as well as the numbers of patients discharged from the general medicine units and CDU with each diagnosis are listed in Table 2. The average daily census in the unit was 7.2 patients with a standard deviation of 0.8. Overall, 22% of CDU admissions were changed from observation to admission status.
| Diagnosis | ICD‐9 Codes | Pre‐CDU | Post‐CDU | Post‐CDU Admitted to CDU | Post‐CDU Admitted to Ward Team |
|---|---|---|---|---|---|
| |||||
| Top 5 diagnoses | 2240 | 2148 | 724 | 1424 | |
| Cellulitis | 681.0, 682.0‐682.9 | 1002 | 819 | 48 | 771 |
| Asthma | 493.02, 493.12 | 199 | 176 | 71 | 105 |
| Chest pain | 786.50, 786.59, 413.0 | 837 | 917 | 520 | 397 |
| Pyelonephritis | 590.1, 590.8 | 143 | 163 | 61 | 102 |
| Syncope | 780.2 | 59 | 73 | 24 | 49 |
Impact of CDU Implementation on LOS
The overall LOS for patients with the 5 most common diagnoses decreased from 2.4 to 2.2 days (P = 0.05) between the 12‐month preimplementation and postimplementation periods. A significant decrease was seen for patients with cellulitis (2.4‐1.9 days; P 0.001) and asthma (2.2‐1.2 days; P 0.001). Differences in LOS for patients with chest pain, pyelonephritis, and syncope were not statistically significant. These results are summarized in Table 3. The acuity of patients admitted in the pre‐CDU and post‐CDU implementation, shown in Table 4, was not significantly different.
| Diagnosis | Pre‐CDU | Post‐CDU | P Value |
|---|---|---|---|
| |||
| Top 5 diagnoses | 2.4 (3.8) | 2.2 (2.8) | 0.05 |
| Cellulitis | 2.4 (3.2) | 1.9 (2.6) | 0.001 |
| Asthma | 2.2 (1.9) | 1.2 (0.7) | 0.001 |
| Chest pain | 1.5 (1.3) | 1.6 (2.4) | 0.75 |
| Pyelonephritis | 3.3 (4.9) | 2.7 (2.8) | 0.27 |
| Syncope | 2.0 (2.9) | 2.2 (2.0) | 0.68 |
| Diagnosis | All Patients2005 | All Patients2006 |
|---|---|---|
| ||
| Top 5 diagnoses | 0.6987 | 0.7240 |
| Cellulitis | 0.7393 | 0.7630 |
| Asthma | 0.4382 | 0.4622 |
| Chest pain | 0.7428 | 0.7545 |
| Pyelonephritis | 0.7205 | 0.6662 |
| Syncope | 0.6769 | 0.6619 |
Discussion and Conclusions
Implementation of a hospitalist‐run observation unit was associated with an overall decreased LOS for patients with the 5 most common CDU discharge diagnoses of chest pain, cellulitis, asthma, pyelonephritis, and syncope. The lack of statistically significantly differences in patient acuity in the preimplementation and postimplementation periods suggests this result is not due to acuity differences, but rather to unit implementation. We believe this reduction resulted from the greater efficiencies of care that occur from clustering observation patients in a geographically separate unit with dedicated nursing staff and efficient workflow. The reduction of 0.2 days over 2148 patients (total number of postimplementation discharges) led to an additional 429.6 days of capacity without adding additional beds. Thus, what might appear to be a modest LOS reduction has a larger impact when patient volume is considered.
For individual diagnoses, significant differences in LOS were seen for patients with cellulitis and asthma The lack of a difference for chest pain may be related to the fact that these patients were cared for in a chest pain unit prior to CDU creation, which likely fostered similar efficiencies. This finding may suggest that hospitalists are as efficient as cardiologists in assessing patients with chest pain. The lack of a difference in LOS for syncope may have reflected a bottleneck in obtaining echocardiogram tests. Finally, the lack of a difference for pyelonephritis may indicate that it is not a diagnosis for which observation is beneficial.
While our use of administrative data over the year‐long preimplementation and postimplementation periods allows for the inclusion of a large number of discharges, the retrospective study design limits the strength of our results. A prospective study would more definitively reduce the possibility of bias and ensure the validity of our finding of reduced LOS.
The creation of a hospitalist‐run observation unit may represent an alternative to emergency departmentrun units. It allows physicians with greater expertise in inpatient medicine to make admission and discharge decisions, allowing emergency department physicians to concentrate on the care of other patients. This can be particularly critical for high‐volume emergency departments. The CDU also offers an alternative to specialist‐run chest pain units. Because patients either stay for only the observation period or are admitted and typically moved off the unit, there is little need for provider continuity, and the discontinuous shift staffing model works well.
In addition to the geographic localization, several aspects of the CDU model may be critical to the successful implementation of similar hospitalist‐run observation units. Dedicated nursing staff with expertise in caring for high‐turnover patients with a more limited spectrum of diagnoses may be a factor. Another factor may be that the lack of less‐experienced trainees in a nonteaching service leads to more efficient care.
A potential area of further exploration includes understanding the differences between CDU patients who are discharged within 23 hours and those who are later admitted. This understanding may help us better differentiate patients appropriate for CDU admission, allowing the creation of more formal admission criteria.
Acknowledgements
The views expressed in this article are those of the authors and do not necessarily reflect the position or policy of the Department of Veterans Affairs.
- ,.The role of hospitalists in medical education.Am J Med.1999;107(4):305–309.
- ,,,,.Reorganizing an academic medical service: impact on cost, quality, patient satisfaction, and education.JAMA.1998;279:1560–1565.
- ,,, et al.,Hospitalist‐Orthopedic Team Trial Investigators. Medical and surgical comanagement after elective hip and knee arthroplasty: a randomized, controlled trial.Ann Intern Med.2004;141(1):28–38.
- ,,,,,.Implementation of a voluntary hospitalist service at a community teaching hospital: improved efficiency and patient outcomes.Ann Intern Med.2002;137:859–865.
- ,,,,,.Outcomes of care by hospitalists, general internists, and family physicians.N Engl J Med.2007;357(25):2589–2600.
- ,,,,.Hospitalist care and length of stay in patients requiring complex discharge planning and close clinical monitoring.Arch Intern Med.2007;167(17):1869–1874.
- ,,.Comparison of hospital costs and length of stay for community internists, hospitalists, and academicians.J Gen Int Med.2007;22(5):662–667.
- ,,, et al.Effects of physician experience on cost and outcomes on an academic general medicine service: results of a trial of hospitalists.Ann Intern Med.2002;37:866–875.
- ,,,.Program description: a hospitalist‐run, medical short‐stay unit in a teaching hospital.CMAJ.2000;163(11):1477–1480.
- ,,,,.Improving resource utilization in a teaching hospital: development of a nonteaching service for chest pain admissions.Acad Med.2006;81(5):432–435.
Hospitalists play key roles in many types of clinical services, including teaching, nonteaching, consultative, and comanagement services.14 While the impact of hospitalist programs on LOS for inpatient medicine services has been studied,58 less work has focused on the impact of hospitalists in other types of service delivery, such as in short‐stay or observation units.
While many hospitals now have short‐stay units to care for observation patients, most are adjuncts of the emergency department. A Canadian hospitalist‐run short‐stay unit that targeted patients with an expected LOS of less than 3 days has been described.9 The experience of a single, chest‐painspecific service has also been reported.10
In August 2005, we introduced a hospitalist‐run observation unit, the Clinical Decision Unit (CDU), at University Hospital, the primary teaching affiliate of the University of Texas Health Science Center at San Antonio (San Antonio, TX). The rationale was that observation‐level care in a dedicated short‐stay unit would be more efficient than in an inpatient general medicine service. Through the creation of this unit, we consolidated the care of all medical observation patients, including patients previously evaluated in a cardiology‐run chest pain unit.
In this brief report, we present a description of the unit as well as a preliminary analysis of the impact of the unit on LOS for the most common CDU diagnoses.
Methods
CDU Structure
University Hospital is the Bexar County public hospital. It contains 604 acute care beds, and averages 70,000 emergency visits annually. The CDU is a geographically separate, 10‐bed unit, staffed with dedicated nurses in 8‐hour shifts and 24/7 by hospitalists in 12‐hour shifts. Four to five hospitalists rotate through the CDU monthly. About 30% of shifts are staffed through moonlighting by hospitalist faculty or fellows.
For admissions, through examining hospital LOS data, we targeted diagnoses for which patients might be expected to stay less than 24 hours. Potentially appropriate diagnoses were discussed by the group, and general admission guidelines were created based on consensus. These diagnoses included chest pain, cellulitis, pyelonephritis, syncope, asthma exacerbation, chronic obstructive pulmonary disease exacerbation, hyperglycemia, and hepatic encephalopathy. Table 1 lists these guidelines.
| Diagnosis | Guidelines |
|---|---|
| |
| Chest pain | Patients without EKG changes or positive troponins, but for whom stress test was indicated based on history or risk factors |
| Asthma | Patients with oxygen saturation >90% and demonstrating improvement in with ED nebulizer treatment |
| Syncope | Patients without known structural heart disease based on past medical history or exam findings |
| Cellulitis | Patients without suspicion for abscess or osteomyelitis |
| Pyelonephritis | Patients without change from baseline renal function; kidney transplant recipients excluded |
If a patient's stay exceeded 23 hours, the hospitalist could transfer the patient from the CDU to a general medicine team. Formal transfer guidelines were not created, but if patients were expected to be discharged within 12 hours, they generally remained in the CDU to minimize transitions. The census of the general medicine teams could also be a factor in transfer decisions: if they were at admitting capacity, the patient remained in the CDU.
Patients admitted to the general medicine units were cared for by 5 teaching teams, staffed exclusively by hospitalists.
Assessment of CDU Implementation on LOS
To examine the impact of unit implementation on LOS, we performed a retrospective, preimplementation/postimplementation comparison of the LOS of patients discharged 12 months before and after the unit opening on August 1, 2005. To ensure a comparison of similar patients, we identified the top 5 most common CDU discharge diagnoses, and identified people discharged from general medicine with the same diagnoses. Specifically, we compared the LOS of patients discharged from the general medicine units from August 1, 2004 to July 31, 2005, vs. those with the same diagnoses discharged from either the CDU or general medicine units from August 1, 2005 to July 31, 2006.
The 5 most common CDU discharge diagnoses were identified using hospital administrative discharge data. All International Statistical Classification of Diseases and Related Health Problems, 9th edition (ICD‐9) codes associated with CDU discharges were identified and listed in order of frequency. Related ICD‐9 codes were grouped. For example, angina (413.0) and chest pain (786.50, 786.59) were considered related, and were included as chest pain. These ICD‐9 codes were then used to identify patients discharged with these diagnoses in the pre‐CDU and post‐CDU periods. Patients on general medicine units were identified using admission location and admitting attending. Only patients admitted by a hospitalist to a general medicine floor were included. Patients were analyzed according to their admission location. All patients with relevant ICD‐9 codes were included in the analysis. None were excluded. For each patient identified, all data elements were present.
The acuity of patients admitted in the preimplementation and postimplementation periods was compared using the case‐mix index calculated by 3M Incorporated's All Patient RefinedDiagnosis‐Related Group methodology (3M APR‐DRG; 3M, St. Paul, MN). This adjusts administrative data for severity of illness and mortality risk based on primary diagnoses, comorbidities, age, and procedures. Patients are assigned to mortality classes with corresponding scores of 0 or higher.
Statistical Analysis
Statistical analyses were performed using STATA 8.0. LOS and acuity differences were assessed using 2‐sample t tests with equal variances.
Results
Clinical Experience with the CDU
The 5 most common CDU discharge diagnoses accounted for 724 discharges, and included chest pain, asthma, syncope, cellulitis, and pyelonephritis. The ICD‐9 codes, as well as the numbers of patients discharged from the general medicine units and CDU with each diagnosis are listed in Table 2. The average daily census in the unit was 7.2 patients with a standard deviation of 0.8. Overall, 22% of CDU admissions were changed from observation to admission status.
| Diagnosis | ICD‐9 Codes | Pre‐CDU | Post‐CDU | Post‐CDU Admitted to CDU | Post‐CDU Admitted to Ward Team |
|---|---|---|---|---|---|
| |||||
| Top 5 diagnoses | 2240 | 2148 | 724 | 1424 | |
| Cellulitis | 681.0, 682.0‐682.9 | 1002 | 819 | 48 | 771 |
| Asthma | 493.02, 493.12 | 199 | 176 | 71 | 105 |
| Chest pain | 786.50, 786.59, 413.0 | 837 | 917 | 520 | 397 |
| Pyelonephritis | 590.1, 590.8 | 143 | 163 | 61 | 102 |
| Syncope | 780.2 | 59 | 73 | 24 | 49 |
Impact of CDU Implementation on LOS
The overall LOS for patients with the 5 most common diagnoses decreased from 2.4 to 2.2 days (P = 0.05) between the 12‐month preimplementation and postimplementation periods. A significant decrease was seen for patients with cellulitis (2.4‐1.9 days; P 0.001) and asthma (2.2‐1.2 days; P 0.001). Differences in LOS for patients with chest pain, pyelonephritis, and syncope were not statistically significant. These results are summarized in Table 3. The acuity of patients admitted in the pre‐CDU and post‐CDU implementation, shown in Table 4, was not significantly different.
| Diagnosis | Pre‐CDU | Post‐CDU | P Value |
|---|---|---|---|
| |||
| Top 5 diagnoses | 2.4 (3.8) | 2.2 (2.8) | 0.05 |
| Cellulitis | 2.4 (3.2) | 1.9 (2.6) | 0.001 |
| Asthma | 2.2 (1.9) | 1.2 (0.7) | 0.001 |
| Chest pain | 1.5 (1.3) | 1.6 (2.4) | 0.75 |
| Pyelonephritis | 3.3 (4.9) | 2.7 (2.8) | 0.27 |
| Syncope | 2.0 (2.9) | 2.2 (2.0) | 0.68 |
| Diagnosis | All Patients2005 | All Patients2006 |
|---|---|---|
| ||
| Top 5 diagnoses | 0.6987 | 0.7240 |
| Cellulitis | 0.7393 | 0.7630 |
| Asthma | 0.4382 | 0.4622 |
| Chest pain | 0.7428 | 0.7545 |
| Pyelonephritis | 0.7205 | 0.6662 |
| Syncope | 0.6769 | 0.6619 |
Discussion and Conclusions
Implementation of a hospitalist‐run observation unit was associated with an overall decreased LOS for patients with the 5 most common CDU discharge diagnoses of chest pain, cellulitis, asthma, pyelonephritis, and syncope. The lack of statistically significantly differences in patient acuity in the preimplementation and postimplementation periods suggests this result is not due to acuity differences, but rather to unit implementation. We believe this reduction resulted from the greater efficiencies of care that occur from clustering observation patients in a geographically separate unit with dedicated nursing staff and efficient workflow. The reduction of 0.2 days over 2148 patients (total number of postimplementation discharges) led to an additional 429.6 days of capacity without adding additional beds. Thus, what might appear to be a modest LOS reduction has a larger impact when patient volume is considered.
For individual diagnoses, significant differences in LOS were seen for patients with cellulitis and asthma The lack of a difference for chest pain may be related to the fact that these patients were cared for in a chest pain unit prior to CDU creation, which likely fostered similar efficiencies. This finding may suggest that hospitalists are as efficient as cardiologists in assessing patients with chest pain. The lack of a difference in LOS for syncope may have reflected a bottleneck in obtaining echocardiogram tests. Finally, the lack of a difference for pyelonephritis may indicate that it is not a diagnosis for which observation is beneficial.
While our use of administrative data over the year‐long preimplementation and postimplementation periods allows for the inclusion of a large number of discharges, the retrospective study design limits the strength of our results. A prospective study would more definitively reduce the possibility of bias and ensure the validity of our finding of reduced LOS.
The creation of a hospitalist‐run observation unit may represent an alternative to emergency departmentrun units. It allows physicians with greater expertise in inpatient medicine to make admission and discharge decisions, allowing emergency department physicians to concentrate on the care of other patients. This can be particularly critical for high‐volume emergency departments. The CDU also offers an alternative to specialist‐run chest pain units. Because patients either stay for only the observation period or are admitted and typically moved off the unit, there is little need for provider continuity, and the discontinuous shift staffing model works well.
In addition to the geographic localization, several aspects of the CDU model may be critical to the successful implementation of similar hospitalist‐run observation units. Dedicated nursing staff with expertise in caring for high‐turnover patients with a more limited spectrum of diagnoses may be a factor. Another factor may be that the lack of less‐experienced trainees in a nonteaching service leads to more efficient care.
A potential area of further exploration includes understanding the differences between CDU patients who are discharged within 23 hours and those who are later admitted. This understanding may help us better differentiate patients appropriate for CDU admission, allowing the creation of more formal admission criteria.
Acknowledgements
The views expressed in this article are those of the authors and do not necessarily reflect the position or policy of the Department of Veterans Affairs.
- ,.The role of hospitalists in medical education.Am J Med.1999;107(4):305–309.
- ,,,,.Reorganizing an academic medical service: impact on cost, quality, patient satisfaction, and education.JAMA.1998;279:1560–1565.
- ,,, et al.,Hospitalist‐Orthopedic Team Trial Investigators. Medical and surgical comanagement after elective hip and knee arthroplasty: a randomized, controlled trial.Ann Intern Med.2004;141(1):28–38.
- ,,,,,.Implementation of a voluntary hospitalist service at a community teaching hospital: improved efficiency and patient outcomes.Ann Intern Med.2002;137:859–865.
- ,,,,,.Outcomes of care by hospitalists, general internists, and family physicians.N Engl J Med.2007;357(25):2589–2600.
- ,,,,.Hospitalist care and length of stay in patients requiring complex discharge planning and close clinical monitoring.Arch Intern Med.2007;167(17):1869–1874.
- ,,.Comparison of hospital costs and length of stay for community internists, hospitalists, and academicians.J Gen Int Med.2007;22(5):662–667.
- ,,, et al.Effects of physician experience on cost and outcomes on an academic general medicine service: results of a trial of hospitalists.Ann Intern Med.2002;37:866–875.
- ,,,.Program description: a hospitalist‐run, medical short‐stay unit in a teaching hospital.CMAJ.2000;163(11):1477–1480.
- ,,,,.Improving resource utilization in a teaching hospital: development of a nonteaching service for chest pain admissions.Acad Med.2006;81(5):432–435.
Thromboembolism Prophylaxis in Liver Disease
Venous thromboembolism (VTE) is a major cause of morbidity and mortality in hospitalized patients.13 Major efforts are underway to increase appropriate VTE prophylaxis (VTEP)4 and adherence to VTEP guidelines are increasingly used as a quality of care measure. National 2008 VTEP guidelines suggest that all medical patients ill enough to require hospitalization, particularly those requiring admission to the Intensive Care Unit (ICU), have at least a moderate risk of developing VTE and prophylaxis is recommended.4 Hospitalized patients with end‐stage liver disease (ESLD), despite their coagulopathy, are known to be at risk for VTE48 and may be VTEP candidates.
Based on available literature, it is unknown whether pharmacologic VTEP should be utilized in acutely ill, hospitalized patients with ESLD, particularly in those admitted with variceal bleeding. These patients are at high risk for rebleeding, with the highest risk in the first 5 days.9 Early rebleeding, defined as recurrent bleeding within 6 weeks of initial bleed, declined from 47% in the 1980s to 13% by 2000 because of increased early endoscopic intervention and use of medications to prevent rebleeding.911 In multicenter cohort studies, D'Amico and De Franchis12 reported that 13% of patients with variceal bleeding had uncontrolled bleeding, rebleeding, or death within 5 days of admission while Bahmba et al.13 reported a 16% rate of rebleeding within 5 days. We are unaware of prior reports regarding the safety of VTEP in this high‐risk group of patients.
Objective
We sought to describe rebleeding in a series of 22 patients with ESLD admitted with variceal bleeding who received pharmacologic VTEP.
Methods
We identified all patients 18 years and older with upper gastrointestinal bleeding admitted to Harborview Medical Center, a 400‐bed urban county teaching hospital in Seattle, Washington, between January 1, 2003 and December 31, 2005 (Figure 1), just prior to medical center‐wide implementation of a VTEP guideline. Potential cases were identified using administrative data based on 8 discharge diagnoses (Supporting Information Appendix 1) and 10 procedure codes (Supporting Information Appendix 2).14 Inpatient pharmacy data indicating continuous octreotide infusion were used to refine the sample. At our institution, it is a standard of care to initiate octreotide in patients admitted with variceal bleeding. We excluded patients who did not have ESLD (defined as evidence of cirrhosis and associated complications including but not limited to ascites, encephalopathy, variceal bleeding, portal hypertension) documented in their problem list or past medical history and those with no variceal bleeding based on medical record review. We identified cases receiving pharmacologic VTEP, either subcutaneous unfractionated heparin (UFH) or low molecular weight heparin (LMWH), during hospitalization from pharmacy records.

We obtained demographic and clinical data from administrative billing systems, electronic and paper medical records, and inpatient pharmacy databases and verified transfusion data from the Puget Sound Blood Center. We abstracted esophagogastroduodenoscopy (EGD) findings indicating high risk of rebleeding including variceal grade and stigmata of recent bleeding such as red spots or wales.15, 16 Data were abstracted by the first 3 authors (AS, MS, KJ) and reviewed again by 2 authors (AS, KJ) blinded to the others' abstractions.
We calculated Model for ESLD (MELD) scores on admission. These scores correlate with 3 month mortality in ESLD.17 We tabulated 5 factors shown in some studies to predict bleeding including high International Normalized Ratio (INR) (>1.5), low hematocrit (25%), low platelet count (100,000 per microliter), active bleeding at EGD, and transfusion of four or more units of red cells within 24 hours of admission.1013
We defined rebleeding as a decrease in hematocrit of greater than 5 percentage points compared with postresuscitation hematocrit, transfusion of additional red cells more than 48 hours after initial resuscitation, repeat unscheduled EGD, or return to the ICU for therapies related to rebleeding.18 The University of Washington Human Subjects Board approved this study.
Results
Of 224 patients initially identified, 36 received pharmacologic VTEP. We excluded 14 who did not have ESLD (n = 1) or did not have a variceal bleed (n = 13). The remaining 22 patients form the sample described in Figure 1.
The median age of patients was 52 years (range 42‐85) and 77% were men (Table 1). Twenty‐one of 22 patients (95%) were initially admitted to the ICU; median length of stay was 8 days (range 4‐30). Median MELD score on admission was 15 (range 825). On EGD, the number of variceal columns ranged from 1 to 4; 17 patients (77%) had at least 3. A total of 15 patients (68%) had stigmata of recent bleeding and 16 (72%) underwent banding (range 16 bands). All patients had at least 1 bleeding risk factor (Table 1) of which the most common factors observed were initial transfusion of 4 or more units of red cells (50%, n = 11), INR > 1.5 (45%, n = 10), and hematocrit 25% (45%, n = 10).
| Parameter | Range | Median Value/% | Interquartile Range | Mean | Standard Deviation |
|---|---|---|---|---|---|
| |||||
| Age (years) | 4285 | 52 | 4758 | 53 | 9 |
| Sex (men) | 17 | 77% | |||
| MELD scores | 825 | 14.5 | 1120 | 15 | 5 |
| Initial ICU admission | 21 | 95% | |||
| Hospital length of stay (days) | 430 | 8 | 9.9 | 6.7 | |
| Initial INR | 1.12.4 | 1.5 | 1.42.0 | 1.7 | 0.4 |
| Initial hematocrit (%) | 1444 | 26 | 2232 | 27 | 8 |
| Initial platelets (thousand/L) | 43494 | 131 | 83159 | 147 | 98 |
| EGD results | |||||
| Grade 1 | 3 | 14% | |||
| Grade 2 | 6 | 27% | |||
| Grade 3 | 12 | 55% | |||
| Grade 4 | 1 | 5% | |||
| Stigmata of recent bleeding | 15 | 68% | |||
| Number of risk factors for rebleeding* | |||||
| 0 | 0 | 0% | |||
| 1 | 9 | 41% | |||
| 2 | 7 | 32% | |||
| 3 | 5 | 23% | |||
| 4 | 1 | 4% | |||
| Initial transfusion red blood cells | |||||
| None | 2 | 9% | |||
| 13 units | 9 | 41% | |||
| 4+ units | 11 | 50% | |||
| Initial transfusion frozen plasma | |||||
| None | 10 | 45% | |||
| 14 units | 3 | 14% | |||
| 58 units | 6 | 27% | |||
| 9+ units | 4 | 18% | |||
| Initial transfusion platelets | |||||
| None | 13 | 59% | |||
| 14 units | 4 | 18% | |||
| 5+ units | 5 | 23% | |||
A total of 12 patients (55%) received 5000 units of UFH every 8 hours, 8 (36%) received 5000 units UFH every 12 hours, and 2 (9%) received LMWH. VTEP was initiated as early as day of admission and as late as day 19. Median VTEP start date was hospital day 4. Median duration of of VTEP was 5 days.
Only 1 patient (4.5%) rebled after VTEP initiation. The patient received UFH every 8 hours starting on hospital day 6, and rebleeding occurred on day 9. Repeat EGD showed ulcers at banding sites. The patient was restarted on VTEP on hospital day 13 without recurrence of rebleeding. This patient had a MELD score of 24, initial INR >2, hematocrit 25%, had grade 3 varices and stigmata of recent bleeding on EGD, and received 4 units of packed red cells. These values are similar to those of the cohort as a whole (Table 1). This patient also was diagnosed with DVT while receiving VTEP on hospital day 15. This patient's coagulopathy was in the setting of terminal illness; the patient expired on hospital day 25.
One additional patient rebled prior to VTEP initiation on day 3 with repeat EGD showing a bleeding varix. This patient was nevertheless started on VTEP 4 days after rebleeding. Despite use of VTEP, this patient was diagnosed with DVT on hospital day 9 (and may well have had the DVT at the time of VTEP initiation). The patient was transitioned to therapeutic dose heparin which was tolerated without recurrence of rebleeding.
There were no other confirmed cases of DVT in this series. One additional patient underwent angiogram that showed no pulmonary embolism; 2 other patients underwent lower extremity ultrasounds that were negative for DVT.
Discussion
At our medical center, only a few inpatients with ESLD admitted with variceal bleed received VTEP. These patients were seemingly at high risk for bleeding and rebleeding given high MELD scores, variceal bleeding, and presence of at least one clinical factor suggesting bleeding risk, and in several cases 3 or more such factors.13, 18 Despite this, only 1 patient rebled while receiving VTEP. We captured rebleeding rates only during the index hospitalization. We therefore may underestimate early rebleeding rates.1013 Nevertheless, our inpatient data included complete coverage of the earliest period after the index bleeds and the period during which patients were exposed to VTEP, which should be the time of highest rebleeding risk related to VTEP exposure. Interestingly the patient who rebled while on VTEP was also diagnosed with VTE while on VTEP. Two patients (9%) in our sample were diagnosed with VTE.
This case series is limited by its small sample size, retrospective nature, single center observation, and perhaps especially by possible selection bias. We were unable to specifically quantify rebleeding risk. Several authors have identified individual factors associated with rebleeding,1013 these were tabulated for patients in this case series (Table 1) and all patients had at least 1 of these factors. Concurrent infection and hepatic vein pressure gradient have been shown to predict rebleeding;9, 19 we were unable to identify these factors in our data.
There was considerable variability in this case series in timing of VTEP initiation relative to initial bleed. We were unable to characterize provider or patient characteristics that may have influenced the decision to initiate VTEP and timing. The sample size was also too small to comment upon factors associated with choice of UFH versus LMWH and any potential differences in rebleeding risk between the 2. We also did not look at outcomes postindex hospitalization so we can not comment on the extended risk of rebleeding with VTEP after discharge. However, the risk of rebleeding is highest within the first 96 hours13 and all patients in this series were hospitalized at least 4 days. Nonetheless, we captured all patients with ESLD and variceal bleeding exposed to VTEP at a large center over a three‐year period and found rebleeding rates less than what might be expected.
Conclusions
Our observations suggest that some inpatients with ESLD and variceal bleeding may tolerate pharmacologic VTEP. In this small group of patients, VTEP was associated with an unexpectedly low incidence of rebleeding. While this case series does not support broad use of VTEP in this population, the lower‐than‐expected rates of rebleeding suggest that further study of the safety and effectiveness of pharmacologic VTEP in inpatient populations with ESLD may be warranted, particularly given the recommendations of recent national VTE prophylaxis guidelines.4
- ,,, et al.Validation of a model to predict adverse outcomes in patients with pulmonary embolism.Eur Heart J.2006;27(4):476–481.
- .The epidemiology of venous thromboembolism.Circulation.2003;107(23 Suppl 1):I4–I8.
- ,,,,.The prevalence of risk factors for venous thromboembolism among hospital patients.Arch Intern Med.1992;152(8):1660–1664.
- ,,, et al.Prevention of venous thromboembolism: American College of Chest Physicians Evidence‐Based Clinical Practice Guidelines. 8th Edition.Chest.2008;133(6 Suppl):381S–453S.
- ,,, et al.Coagulopathy does not fully protect hospitalized cirrhosis patients from peripheral venous thromboembolism.Am J Gastroenterol.2006;101(7):1524–1528; quiz 680.
- ,,,.Coagulation disorders in liver disease.Semin Liver Dis.2002;22(1):83–96.
- ,,,,.Deep vein thrombosis and pulmonary embolism in cirrhosis patients.Dig Dis Sci.2008;53(11):3012–3017.
- ,,,,,.Risk of venous thromboembolism in patients with liver disease: a nationwide population‐based case‐control study.Am J Gastroenterol.2009;104(1):96–101.
- ,.Non‐invasive diagnosis of cirrhosis and the natural history of its complications.Best Pract Res Clin Gastroenterol.2007;21(1):3–18.
- ,,,et al.Improved patient survival after acute variceal bleeding: a multicenter, cohort study.Am J Gastroenterol.2003;98(3):653–659.
- ,,,,,.Improved survival after variceal bleeding in patients with cirrhosis over the past two decades.Hepatology.2004;40(3):652–659.
- ,.Upper digestive bleeding in cirrhosis. Post‐therapeutic outcome and prognostic indicators.Hepatology.2003;38(3):599–612.
- ,,,,,.Predictors of early re‐bleeding and mortality after acute variceal haemorrhage in patients with cirrhosis.Gut.2008;57(6):814–820.
- ,,,,,.Use of hospital administrative data to assess quality improvement initiatives.J Gen Intern Med.2007;22(Supplement).
- ,.UK guidelines on the management of variceal haemorrhage in cirrhotic patients.Gut.2000,year="2000"2000;46(90003):iii1–15.
- ,,,,,.Prognostic significance of the white nipple sign in variceal bleeding.Gastrointest Endosc.1991;37(1):51–55.
- ,,, et al.A model to predict survival in patients with end‐stage liver disease.Hepatology.2001;33(2):464–470.
- .Evolving consensus in portal hypertension. Report of the Baveno IV consensus workshop on methodology of diagnosis and therapy in portal hypertension.J Hepatol.2005;43(1):167–176.
- ,,, et al.Antibiotic prophylaxis after endoscopic therapy prevents rebleeding in acute variceal hemorrhage: a randomized trial.Hepatology.2004;39(3):746–753.
Venous thromboembolism (VTE) is a major cause of morbidity and mortality in hospitalized patients.13 Major efforts are underway to increase appropriate VTE prophylaxis (VTEP)4 and adherence to VTEP guidelines are increasingly used as a quality of care measure. National 2008 VTEP guidelines suggest that all medical patients ill enough to require hospitalization, particularly those requiring admission to the Intensive Care Unit (ICU), have at least a moderate risk of developing VTE and prophylaxis is recommended.4 Hospitalized patients with end‐stage liver disease (ESLD), despite their coagulopathy, are known to be at risk for VTE48 and may be VTEP candidates.
Based on available literature, it is unknown whether pharmacologic VTEP should be utilized in acutely ill, hospitalized patients with ESLD, particularly in those admitted with variceal bleeding. These patients are at high risk for rebleeding, with the highest risk in the first 5 days.9 Early rebleeding, defined as recurrent bleeding within 6 weeks of initial bleed, declined from 47% in the 1980s to 13% by 2000 because of increased early endoscopic intervention and use of medications to prevent rebleeding.911 In multicenter cohort studies, D'Amico and De Franchis12 reported that 13% of patients with variceal bleeding had uncontrolled bleeding, rebleeding, or death within 5 days of admission while Bahmba et al.13 reported a 16% rate of rebleeding within 5 days. We are unaware of prior reports regarding the safety of VTEP in this high‐risk group of patients.
Objective
We sought to describe rebleeding in a series of 22 patients with ESLD admitted with variceal bleeding who received pharmacologic VTEP.
Methods
We identified all patients 18 years and older with upper gastrointestinal bleeding admitted to Harborview Medical Center, a 400‐bed urban county teaching hospital in Seattle, Washington, between January 1, 2003 and December 31, 2005 (Figure 1), just prior to medical center‐wide implementation of a VTEP guideline. Potential cases were identified using administrative data based on 8 discharge diagnoses (Supporting Information Appendix 1) and 10 procedure codes (Supporting Information Appendix 2).14 Inpatient pharmacy data indicating continuous octreotide infusion were used to refine the sample. At our institution, it is a standard of care to initiate octreotide in patients admitted with variceal bleeding. We excluded patients who did not have ESLD (defined as evidence of cirrhosis and associated complications including but not limited to ascites, encephalopathy, variceal bleeding, portal hypertension) documented in their problem list or past medical history and those with no variceal bleeding based on medical record review. We identified cases receiving pharmacologic VTEP, either subcutaneous unfractionated heparin (UFH) or low molecular weight heparin (LMWH), during hospitalization from pharmacy records.
We obtained demographic and clinical data from administrative billing systems, electronic and paper medical records, and inpatient pharmacy databases and verified transfusion data from the Puget Sound Blood Center. We abstracted esophagogastroduodenoscopy (EGD) findings indicating high risk of rebleeding including variceal grade and stigmata of recent bleeding such as red spots or wales.15, 16 Data were abstracted by the first 3 authors (AS, MS, KJ) and reviewed again by 2 authors (AS, KJ) blinded to the others' abstractions.
We calculated Model for ESLD (MELD) scores on admission. These scores correlate with 3 month mortality in ESLD.17 We tabulated 5 factors shown in some studies to predict bleeding including high International Normalized Ratio (INR) (>1.5), low hematocrit (25%), low platelet count (100,000 per microliter), active bleeding at EGD, and transfusion of four or more units of red cells within 24 hours of admission.1013
We defined rebleeding as a decrease in hematocrit of greater than 5 percentage points compared with postresuscitation hematocrit, transfusion of additional red cells more than 48 hours after initial resuscitation, repeat unscheduled EGD, or return to the ICU for therapies related to rebleeding.18 The University of Washington Human Subjects Board approved this study.
Results
Of 224 patients initially identified, 36 received pharmacologic VTEP. We excluded 14 who did not have ESLD (n = 1) or did not have a variceal bleed (n = 13). The remaining 22 patients form the sample described in Figure 1.
The median age of patients was 52 years (range 42‐85) and 77% were men (Table 1). Twenty‐one of 22 patients (95%) were initially admitted to the ICU; median length of stay was 8 days (range 4‐30). Median MELD score on admission was 15 (range 825). On EGD, the number of variceal columns ranged from 1 to 4; 17 patients (77%) had at least 3. A total of 15 patients (68%) had stigmata of recent bleeding and 16 (72%) underwent banding (range 16 bands). All patients had at least 1 bleeding risk factor (Table 1) of which the most common factors observed were initial transfusion of 4 or more units of red cells (50%, n = 11), INR > 1.5 (45%, n = 10), and hematocrit 25% (45%, n = 10).
| Parameter | Range | Median Value/% | Interquartile Range | Mean | Standard Deviation |
|---|---|---|---|---|---|
| |||||
| Age (years) | 4285 | 52 | 4758 | 53 | 9 |
| Sex (men) | 17 | 77% | |||
| MELD scores | 825 | 14.5 | 1120 | 15 | 5 |
| Initial ICU admission | 21 | 95% | |||
| Hospital length of stay (days) | 430 | 8 | 9.9 | 6.7 | |
| Initial INR | 1.12.4 | 1.5 | 1.42.0 | 1.7 | 0.4 |
| Initial hematocrit (%) | 1444 | 26 | 2232 | 27 | 8 |
| Initial platelets (thousand/L) | 43494 | 131 | 83159 | 147 | 98 |
| EGD results | |||||
| Grade 1 | 3 | 14% | |||
| Grade 2 | 6 | 27% | |||
| Grade 3 | 12 | 55% | |||
| Grade 4 | 1 | 5% | |||
| Stigmata of recent bleeding | 15 | 68% | |||
| Number of risk factors for rebleeding* | |||||
| 0 | 0 | 0% | |||
| 1 | 9 | 41% | |||
| 2 | 7 | 32% | |||
| 3 | 5 | 23% | |||
| 4 | 1 | 4% | |||
| Initial transfusion red blood cells | |||||
| None | 2 | 9% | |||
| 13 units | 9 | 41% | |||
| 4+ units | 11 | 50% | |||
| Initial transfusion frozen plasma | |||||
| None | 10 | 45% | |||
| 14 units | 3 | 14% | |||
| 58 units | 6 | 27% | |||
| 9+ units | 4 | 18% | |||
| Initial transfusion platelets | |||||
| None | 13 | 59% | |||
| 14 units | 4 | 18% | |||
| 5+ units | 5 | 23% | |||
A total of 12 patients (55%) received 5000 units of UFH every 8 hours, 8 (36%) received 5000 units UFH every 12 hours, and 2 (9%) received LMWH. VTEP was initiated as early as day of admission and as late as day 19. Median VTEP start date was hospital day 4. Median duration of of VTEP was 5 days.
Only 1 patient (4.5%) rebled after VTEP initiation. The patient received UFH every 8 hours starting on hospital day 6, and rebleeding occurred on day 9. Repeat EGD showed ulcers at banding sites. The patient was restarted on VTEP on hospital day 13 without recurrence of rebleeding. This patient had a MELD score of 24, initial INR >2, hematocrit 25%, had grade 3 varices and stigmata of recent bleeding on EGD, and received 4 units of packed red cells. These values are similar to those of the cohort as a whole (Table 1). This patient also was diagnosed with DVT while receiving VTEP on hospital day 15. This patient's coagulopathy was in the setting of terminal illness; the patient expired on hospital day 25.
One additional patient rebled prior to VTEP initiation on day 3 with repeat EGD showing a bleeding varix. This patient was nevertheless started on VTEP 4 days after rebleeding. Despite use of VTEP, this patient was diagnosed with DVT on hospital day 9 (and may well have had the DVT at the time of VTEP initiation). The patient was transitioned to therapeutic dose heparin which was tolerated without recurrence of rebleeding.
There were no other confirmed cases of DVT in this series. One additional patient underwent angiogram that showed no pulmonary embolism; 2 other patients underwent lower extremity ultrasounds that were negative for DVT.
Discussion
At our medical center, only a few inpatients with ESLD admitted with variceal bleed received VTEP. These patients were seemingly at high risk for bleeding and rebleeding given high MELD scores, variceal bleeding, and presence of at least one clinical factor suggesting bleeding risk, and in several cases 3 or more such factors.13, 18 Despite this, only 1 patient rebled while receiving VTEP. We captured rebleeding rates only during the index hospitalization. We therefore may underestimate early rebleeding rates.1013 Nevertheless, our inpatient data included complete coverage of the earliest period after the index bleeds and the period during which patients were exposed to VTEP, which should be the time of highest rebleeding risk related to VTEP exposure. Interestingly the patient who rebled while on VTEP was also diagnosed with VTE while on VTEP. Two patients (9%) in our sample were diagnosed with VTE.
This case series is limited by its small sample size, retrospective nature, single center observation, and perhaps especially by possible selection bias. We were unable to specifically quantify rebleeding risk. Several authors have identified individual factors associated with rebleeding,1013 these were tabulated for patients in this case series (Table 1) and all patients had at least 1 of these factors. Concurrent infection and hepatic vein pressure gradient have been shown to predict rebleeding;9, 19 we were unable to identify these factors in our data.
There was considerable variability in this case series in timing of VTEP initiation relative to initial bleed. We were unable to characterize provider or patient characteristics that may have influenced the decision to initiate VTEP and timing. The sample size was also too small to comment upon factors associated with choice of UFH versus LMWH and any potential differences in rebleeding risk between the 2. We also did not look at outcomes postindex hospitalization so we can not comment on the extended risk of rebleeding with VTEP after discharge. However, the risk of rebleeding is highest within the first 96 hours13 and all patients in this series were hospitalized at least 4 days. Nonetheless, we captured all patients with ESLD and variceal bleeding exposed to VTEP at a large center over a three‐year period and found rebleeding rates less than what might be expected.
Conclusions
Our observations suggest that some inpatients with ESLD and variceal bleeding may tolerate pharmacologic VTEP. In this small group of patients, VTEP was associated with an unexpectedly low incidence of rebleeding. While this case series does not support broad use of VTEP in this population, the lower‐than‐expected rates of rebleeding suggest that further study of the safety and effectiveness of pharmacologic VTEP in inpatient populations with ESLD may be warranted, particularly given the recommendations of recent national VTE prophylaxis guidelines.4
- ,,, et al.Validation of a model to predict adverse outcomes in patients with pulmonary embolism.Eur Heart J.2006;27(4):476–481.
- .The epidemiology of venous thromboembolism.Circulation.2003;107(23 Suppl 1):I4–I8.
- ,,,,.The prevalence of risk factors for venous thromboembolism among hospital patients.Arch Intern Med.1992;152(8):1660–1664.
- ,,, et al.Prevention of venous thromboembolism: American College of Chest Physicians Evidence‐Based Clinical Practice Guidelines. 8th Edition.Chest.2008;133(6 Suppl):381S–453S.
- ,,, et al.Coagulopathy does not fully protect hospitalized cirrhosis patients from peripheral venous thromboembolism.Am J Gastroenterol.2006;101(7):1524–1528; quiz 680.
- ,,,.Coagulation disorders in liver disease.Semin Liver Dis.2002;22(1):83–96.
- ,,,,.Deep vein thrombosis and pulmonary embolism in cirrhosis patients.Dig Dis Sci.2008;53(11):3012–3017.
- ,,,,,.Risk of venous thromboembolism in patients with liver disease: a nationwide population‐based case‐control study.Am J Gastroenterol.2009;104(1):96–101.
- ,.Non‐invasive diagnosis of cirrhosis and the natural history of its complications.Best Pract Res Clin Gastroenterol.2007;21(1):3–18.
- ,,,et al.Improved patient survival after acute variceal bleeding: a multicenter, cohort study.Am J Gastroenterol.2003;98(3):653–659.
- ,,,,,.Improved survival after variceal bleeding in patients with cirrhosis over the past two decades.Hepatology.2004;40(3):652–659.
- ,.Upper digestive bleeding in cirrhosis. Post‐therapeutic outcome and prognostic indicators.Hepatology.2003;38(3):599–612.
- ,,,,,.Predictors of early re‐bleeding and mortality after acute variceal haemorrhage in patients with cirrhosis.Gut.2008;57(6):814–820.
- ,,,,,.Use of hospital administrative data to assess quality improvement initiatives.J Gen Intern Med.2007;22(Supplement).
- ,.UK guidelines on the management of variceal haemorrhage in cirrhotic patients.Gut.2000,year="2000"2000;46(90003):iii1–15.
- ,,,,,.Prognostic significance of the white nipple sign in variceal bleeding.Gastrointest Endosc.1991;37(1):51–55.
- ,,, et al.A model to predict survival in patients with end‐stage liver disease.Hepatology.2001;33(2):464–470.
- .Evolving consensus in portal hypertension. Report of the Baveno IV consensus workshop on methodology of diagnosis and therapy in portal hypertension.J Hepatol.2005;43(1):167–176.
- ,,, et al.Antibiotic prophylaxis after endoscopic therapy prevents rebleeding in acute variceal hemorrhage: a randomized trial.Hepatology.2004;39(3):746–753.
Short‐term Femoral Vein Catheterization
Central venous catheters (CVC) are routinely used to deliver medications and monitor intravascular pressures of critically ill patients. Experts and national regulatory bodies have questioned the safety of femoral vein catheterization (FVC), and currently recommend against venous access at this site whenever possible. 13 However, a large prospective nonrandomized study has suggested that rates of FVC infections are not higher than jugular or subclavian sites. 4 Some authors have suggested that increased risk of deep vein thrombosis (DVT) also relatively contraindicates the femoral site. 5 No study has prospectively examined rates of DVT in patients receiving FVC for short durations (72 hours). In this brief report, we prospectively examined the rates of catheter‐related bloodstream infections (CRBI) and DVT in critically ill patients receiving CVC.
Methods
This prospective observational cohort study was conducted in the medical intensive care unit (MICU) of Bridgeport Hospital, a 350‐bed community teaching hospital. The hospital's Institutional Review Board approved the study and waived the informed consent requirement because it has been the practice for the past decade to favor use of the femoral site for initial resuscitations with very low complication rates. All patients admitted to the MICU between September 1, 2008 and March 31, 2009 were eligible. VC were defined as catheters placed in the jugular, subclavian or femoral veins or peripherally inserted and guided to a central intrathoracic vein (PICC). CVC refers to catheters placed directly into central veins. In early 2008, a hospital‐wide initiative was introduced to insert all CVC using the Pronovost check‐list. 1 VC sites were chosen at the discretion of caregivers in the emergency department and MICU. The policy of our intensive care units is to use only saline flushes of VCs.
Demographic data including age, gender, and body mass index, were collected on all patients. In addition the following parameters were monitored for the duration of ICU stay for the purpose of this study: (1) site and duration of installation of all intravascular catheters, (2) level of training of clinician inserting CVC, (3) catheter/blood culture results. For the purposes of this study, bilateral femoral Doppler compression ultrasound studies were expected to be performed by radiology house officers within 24 hours of removing and again 5 to 7 days following removal of FVC. Local VC complications, methods of thromboprophylaxis and risk factors for venous thromboembolism (VTE) were recorded. Patient outcomes and disposition destinations were also recorded.
CRBI were defined using the Centers for Disease Control definitions. 2 CRBI were identified by daily review of all positive blood cultures and review of patients' medical records. In addition, Infection Control Committee data were reviewed to corroborate contemporaneously determined CRBI during the study period and for 1 year prior to the study period. Patients with FVC were examined each day for signs or symptoms of thrombosis (tenderness along the vein, leg swelling, pitting edema or visible collateral superficial veins). Patients were followed up until death or hospital discharge for clinical signs, symptoms or diagnosis of thromboembolic disease.
Bedside Duplex ultrasounds of bilateral common femoral and superficial femoral veins were performed using graded compression and color Doppler techniques. The leg without FVC served as the control. Evaluations were conducted by senior radiology residents (>100 hours training) utilizing a high‐resolution (>7.5 MHz) linear array transducer. Frame capture images were digitally stored and subsequently reviewed by a Board‐certified radiologist, who was blinded to side of insertion and clinical outcomes, and rendered a final interpretation.
Values are listed as means standard deviations. Comparisons of group means were performed using nonpaired Student's t tests. A P value of 0.05 signified statistical significance.
Results
During the study period, 675 patients were admitted to the MICU. VCs were inserted in 238 (35% of) patients. During their MICU stay, 182 (77% of) patients had 1 VC, 48 (20%) had 2 VC, and 8 (3%) had 3 VC. On admission, 38 patients (6%) had preexisting VC (tunneled catheter 58%, PICC 32%, and dialysis catheters 10%). Additional VCs were placed in 10 of these patients (26%).
Of the 302 VC, 85 (28%) were PICCs and 217 were CVC (107, 49% FVC; 82, 38% internal jugular; 28, 13% subclavian). A total of 151 (28%) patients had radial arterial catheters placed around the time of admission. The types of CVC included triple lumen in 164 (75%), dialysis catheters in 29 (13%), single‐lumen large bore catheters in 17 (8%), and tunneled catheters in 4 patients (2%). The average duration (standard deviation [SD]) of CVC was 2.7 2.2 days for FVC, 5.7 9.6 days for internal jugular and 3.6 3.1 days for subclavian vein catheters.
During these seven months, including 1200 catheter‐days, only 1 CRBI was identified in a patient who only had a PICC, yielding an infection rate of 0.83 CRBI per 1000 catheter‐days. No femoral, subclavian or internal jugular catheter infections were detected. Hospital epidemiologic data confirmed this finding, and demonstrated only 1 other CRBI during 3721 line‐days, in the 7 months of this study and 12 months before, yielding an average of 0.40 CRBI/1000 catheter‐days.
Of 107 FVC, 101 were placed during initial resuscitations and 6 as second‐access sites, (2 for dialysis, 4 triple lumen catheters). Thromboprophylaxis was administered to 104 (97% of) patients with FVC. Thromboprophylaxis was pharmacological (heparins) in 63 (59% of) patients and mechanical (pneumatic compression) in 46 (43%). Five patients had both mechanical and pharmacological prophylaxis. Catheters were placed by a critical care or emergency department attending in 11%, critical care fellows in 11%, and residents in 78%. Ultrasound studies of the legs were performed in 57 patients; 56 had studies within 24 hours of removing FVC. Of these 56 patients, 53 studies were interpreted as negative and 3 were considered incomplete. The 3 initially incomplete studies were repeated, and found to be negative. Six patients were discharged from the hospital before the post‐FVC‐removal ultrasound could be performed. Of the 50 patients who had both ultrasounds (initial and follow up 57 days after removal of FVC), none had a DVT on the side of the catheter or in the control leg. Of the 50 patients with no ultrasound follow‐up, no patient developed clinically detected VTE; these patients had FVC for shorter duration (2.4 2.4 vs. 3.4 1.9 days for those with 2 Duplex; P = 0.02) and their ICU length of stay was shorter (3.8 4.6 vs. 6.6 5.6 days for those with 2 Duplex; P = 0.01).
Since no VTE or CRBI were detected further analyses regarding risks for these complications was not possible.
Discussion
Contrary to regulatory guidelines suggesting a poor safety profile, we found that short‐term FVC was associated with no episode of DVT or CRBI. While the incidence of complications is lower in more experienced operators, 6 most FVC in our hospital were placed by resident‐trainees (78%) with or without supervision from an attending physician. There were no immediate or subacute (ie, thrombosis, infection) major complications. There are a number of features that favor short‐term FVC for initial resuscitation of critically ill patients. Subclavian and intrajugular CVC require prolonged Trendelenburg position, which may not be well tolerated by some patients. FVC does not require Trendelenburg position. Major bleeding1.0% to 1.5% for all the CVCis minimized because direct compression of femoral vessels is possible. Compression of subclavian hemorrhage is impossible while compression of the jugular vessels is uncomfortable. Pneumothorax, while uncommon in the subclavian and intrajugular approaches, 7 has serious consequences for an unstable patient, whereas FVC obviates the risk. Some might argue that FVC cannot accurately reflect cardiovascular filling thereby defeating 1 of the important purposes of the catheter. While this is certainly true in patients with raised intraabdominal pressures, a small case series suggests that (longer‐than‐normal) FVC can accurately measure central filling pressures. 8 Another potential shortcoming of FVC is that if used only for short durations during initial resuscitationsas in this studysome patients will require a second CVC or PICC with incumbent risks.
Our study differs from previous studies that have shown infection rates ranging from 1.5/1000 to 20/1000 catheter‐days 4, 9, 10 and thrombosis rates of 6.6% to 25%. 5, 1013 Some previous studies have suggested higher rates of infection of FVC relative to internal jugular or subclavian sites (3.7/1000 vs. 20/1000 catheter‐days) 9 while others found similar infection or colonization rates between femoral and nonfemoral sites. 4, 10 Our 0.83 CRBSI per 1000 catheter‐day rate is similar to that of Pronovost et al. 1 who avoided FVC, whereas it was the preferred site (nearly half of all CVC) in our MICU. The incidence of VTE in critically ill patients ranges from 9% to 33 %, 14, 15 and CVC are a well recognized risk factor of VTE. 5 The reported incidence of DVT in patients with CVC varies widely from 3% to 10% in subclavian catheters 9 to 6.6% to 25% in FVC. 11, 12 We attribute the remarkable difference in our results to the fact that FVC was used for brief durations (mean 2.7 days, range 116 days) for the primary purpose of resuscitating critically ill patients. Also, techniques introduced by Pronovost et al. 1 to reduce CRBI had permeated our institutional practices by the time of this study; our results match his, of very low rates of CRBI when checklists are employed. In previous studies, FVC was used for extended durations similar to other CVC sites (ranging from 4 to 9.6 days). 5, 9, 12, 13, 16 Additionally, almost all of our patients received VTE prophylaxis whereas rates were variable in previous studies.
This study has several limitations. First, catheter insertion sites were not randomly assigned. This can introduce selection bias. For example, often femoral access is used in more unstable patients 4 who are less tolerant of Trendelenberg position whereas it is often avoided in obese patients. Another important limitation is that ultrasound studies were not performed in 47% of patients who had FVC. While these missed cases were not advertent (eg, CVC on weekends when no study personnel available), we cannot exclude the possibility of bias. However, no FVC patients who did not have ultrasounds developed clinically detected VTE. It is also possible that DVT could have appeared >5 to 7 days after our follow‐up ultrasound, though later development might favor spontaneous DVT unrelated to CVC. Finally, this was a relatively small study, but it appears that the rate of DVT from FVC, if placed for short durations and accompanied by thromboprophylaxis, is very low.
In conclusion, short‐term FVC was used safelywith no major complicationsin our MICU. Our data support that short‐term FVC (with thromboprophylaxis) has a reasonable safety profile for initial resuscitation of critically ill patients. Notwithstanding the limitations of our study, we suggest that it may be premature to abandon entirely 3, 17 the use of FVC for resuscitation of critically ill patients. We propose that our data suggest the need for a larger study to examine more definitively the safety profile of short‐term FVC.
- , , , et al. An intervention to decrease catheter related bloodstream infections in the ICU. N Engl J Med. 2006; 355: 2725– 2732.
- , , , et al. Guidelines for the prevention of intravascular catheter‐related infection. MMWR Website. Available at: http://www.cdc.gov/mmwr/preview/mmwrhtml/rr5110a1.htm. Accessed February 2010.
- Joint Commission. National Accreditation: Hospital Patient Safety Goals. Available at: http://www.jointcommission.org/NR/rdonlyres/31666E86‐E7F4‐423E‐9BE8‐F05BD1CB0AA8/0/HAP_NPSG.pdf. Accessed February 2010.
- , , , et al. The incidence of infectious complications of central venous catheters at the subclavian, internal jugular and femoral sites in an intensive care unit population. Crit Care Med. 2005; 33: 13– 20.
- , , , . Femoral deep vein thrombosis associated with central venous catheterization: Results from a prospective, randomized trial. Crit Care Med. 1995; 23: 52– 59.
- , , , , . Central vein catheterization. Failure and complicagtion rates by three percutaneous approaches. Arch Intern Med. 1986; 146: 259– 261.
- , , . Complications of central venous catheters: internal jugular versus subclavian access—a systematic review. Crit Care Med. 2002; 30: 454– 460.
- , , , , , . Comparison of intrathoracic and intra‐abdominal measurements of central venous pressure. Lancet. 1996; 347: 1155– 1157.
- , , , et al. Complications of femoral and subclavian venous catheterization in critically ill patients. A randomized controlled trial. JAMA. 2001; 286: 700– 707.
- , , , et al. Femoral vs jugular venous catheterization and risk of nosocomial events in adults requiring acute renal replacement therapy. A randomized trial. JAMA. 2008; 299: 2413– 2422.
- , , , , , . A prospective evaluation of the use of femoral venous catheters in critically ill adults. Crit Care Med. 1997; 25: 1986– 1989.
- , , , , . Lower extremity deep vein thrombosis: a prospective, randomized, controlled trial in comatose or sedated patients undergoing femoral vein catheterization. Crit Care Med. 1997; 25: 1982– 1985.
- , , , , . Deep venous thrombosis caused by femoral venous catheters in critically ill adult patients. Chest. 2000; 117: 178– 183.
- , , . The incidence of deep venous thrombosis in ICU patients. Chest. 1997; 111: 661– 664.
- , , , et al. Deep venous thrombosis in medical‐surgical critically il patients: prevalence, incidence and risk factors. Crit Care Med. 2005; 33: 1565– 1571.
- , , , et al. Central vein catheter related thrombosis in intensive care patients: incidence, risk factors and relationship with catheter related sepsis. Chest. 1998; 114: 207– 213.
- Institute for Healthcare Improvement. Optimal catheter site selection, with avoidance of the femoral vein for central venous access in adults. Available at: http://www.ihi.org/IHI/Topics/CriticalCare/IntensiveCare/Changes/IndividualChanges/OptimalCatheterSiteSelectionwithAvoidanceofFemoralVeinforCentralVenousAccessinAdultPatients.htm. Accessed February 2010.
Central venous catheters (CVC) are routinely used to deliver medications and monitor intravascular pressures of critically ill patients. Experts and national regulatory bodies have questioned the safety of femoral vein catheterization (FVC), and currently recommend against venous access at this site whenever possible. 13 However, a large prospective nonrandomized study has suggested that rates of FVC infections are not higher than jugular or subclavian sites. 4 Some authors have suggested that increased risk of deep vein thrombosis (DVT) also relatively contraindicates the femoral site. 5 No study has prospectively examined rates of DVT in patients receiving FVC for short durations (72 hours). In this brief report, we prospectively examined the rates of catheter‐related bloodstream infections (CRBI) and DVT in critically ill patients receiving CVC.
Methods
This prospective observational cohort study was conducted in the medical intensive care unit (MICU) of Bridgeport Hospital, a 350‐bed community teaching hospital. The hospital's Institutional Review Board approved the study and waived the informed consent requirement because it has been the practice for the past decade to favor use of the femoral site for initial resuscitations with very low complication rates. All patients admitted to the MICU between September 1, 2008 and March 31, 2009 were eligible. VC were defined as catheters placed in the jugular, subclavian or femoral veins or peripherally inserted and guided to a central intrathoracic vein (PICC). CVC refers to catheters placed directly into central veins. In early 2008, a hospital‐wide initiative was introduced to insert all CVC using the Pronovost check‐list. 1 VC sites were chosen at the discretion of caregivers in the emergency department and MICU. The policy of our intensive care units is to use only saline flushes of VCs.
Demographic data including age, gender, and body mass index, were collected on all patients. In addition the following parameters were monitored for the duration of ICU stay for the purpose of this study: (1) site and duration of installation of all intravascular catheters, (2) level of training of clinician inserting CVC, (3) catheter/blood culture results. For the purposes of this study, bilateral femoral Doppler compression ultrasound studies were expected to be performed by radiology house officers within 24 hours of removing and again 5 to 7 days following removal of FVC. Local VC complications, methods of thromboprophylaxis and risk factors for venous thromboembolism (VTE) were recorded. Patient outcomes and disposition destinations were also recorded.
CRBI were defined using the Centers for Disease Control definitions. 2 CRBI were identified by daily review of all positive blood cultures and review of patients' medical records. In addition, Infection Control Committee data were reviewed to corroborate contemporaneously determined CRBI during the study period and for 1 year prior to the study period. Patients with FVC were examined each day for signs or symptoms of thrombosis (tenderness along the vein, leg swelling, pitting edema or visible collateral superficial veins). Patients were followed up until death or hospital discharge for clinical signs, symptoms or diagnosis of thromboembolic disease.
Bedside Duplex ultrasounds of bilateral common femoral and superficial femoral veins were performed using graded compression and color Doppler techniques. The leg without FVC served as the control. Evaluations were conducted by senior radiology residents (>100 hours training) utilizing a high‐resolution (>7.5 MHz) linear array transducer. Frame capture images were digitally stored and subsequently reviewed by a Board‐certified radiologist, who was blinded to side of insertion and clinical outcomes, and rendered a final interpretation.
Values are listed as means standard deviations. Comparisons of group means were performed using nonpaired Student's t tests. A P value of 0.05 signified statistical significance.
Results
During the study period, 675 patients were admitted to the MICU. VCs were inserted in 238 (35% of) patients. During their MICU stay, 182 (77% of) patients had 1 VC, 48 (20%) had 2 VC, and 8 (3%) had 3 VC. On admission, 38 patients (6%) had preexisting VC (tunneled catheter 58%, PICC 32%, and dialysis catheters 10%). Additional VCs were placed in 10 of these patients (26%).
Of the 302 VC, 85 (28%) were PICCs and 217 were CVC (107, 49% FVC; 82, 38% internal jugular; 28, 13% subclavian). A total of 151 (28%) patients had radial arterial catheters placed around the time of admission. The types of CVC included triple lumen in 164 (75%), dialysis catheters in 29 (13%), single‐lumen large bore catheters in 17 (8%), and tunneled catheters in 4 patients (2%). The average duration (standard deviation [SD]) of CVC was 2.7 2.2 days for FVC, 5.7 9.6 days for internal jugular and 3.6 3.1 days for subclavian vein catheters.
During these seven months, including 1200 catheter‐days, only 1 CRBI was identified in a patient who only had a PICC, yielding an infection rate of 0.83 CRBI per 1000 catheter‐days. No femoral, subclavian or internal jugular catheter infections were detected. Hospital epidemiologic data confirmed this finding, and demonstrated only 1 other CRBI during 3721 line‐days, in the 7 months of this study and 12 months before, yielding an average of 0.40 CRBI/1000 catheter‐days.
Of 107 FVC, 101 were placed during initial resuscitations and 6 as second‐access sites, (2 for dialysis, 4 triple lumen catheters). Thromboprophylaxis was administered to 104 (97% of) patients with FVC. Thromboprophylaxis was pharmacological (heparins) in 63 (59% of) patients and mechanical (pneumatic compression) in 46 (43%). Five patients had both mechanical and pharmacological prophylaxis. Catheters were placed by a critical care or emergency department attending in 11%, critical care fellows in 11%, and residents in 78%. Ultrasound studies of the legs were performed in 57 patients; 56 had studies within 24 hours of removing FVC. Of these 56 patients, 53 studies were interpreted as negative and 3 were considered incomplete. The 3 initially incomplete studies were repeated, and found to be negative. Six patients were discharged from the hospital before the post‐FVC‐removal ultrasound could be performed. Of the 50 patients who had both ultrasounds (initial and follow up 57 days after removal of FVC), none had a DVT on the side of the catheter or in the control leg. Of the 50 patients with no ultrasound follow‐up, no patient developed clinically detected VTE; these patients had FVC for shorter duration (2.4 2.4 vs. 3.4 1.9 days for those with 2 Duplex; P = 0.02) and their ICU length of stay was shorter (3.8 4.6 vs. 6.6 5.6 days for those with 2 Duplex; P = 0.01).
Since no VTE or CRBI were detected further analyses regarding risks for these complications was not possible.
Discussion
Contrary to regulatory guidelines suggesting a poor safety profile, we found that short‐term FVC was associated with no episode of DVT or CRBI. While the incidence of complications is lower in more experienced operators, 6 most FVC in our hospital were placed by resident‐trainees (78%) with or without supervision from an attending physician. There were no immediate or subacute (ie, thrombosis, infection) major complications. There are a number of features that favor short‐term FVC for initial resuscitation of critically ill patients. Subclavian and intrajugular CVC require prolonged Trendelenburg position, which may not be well tolerated by some patients. FVC does not require Trendelenburg position. Major bleeding1.0% to 1.5% for all the CVCis minimized because direct compression of femoral vessels is possible. Compression of subclavian hemorrhage is impossible while compression of the jugular vessels is uncomfortable. Pneumothorax, while uncommon in the subclavian and intrajugular approaches, 7 has serious consequences for an unstable patient, whereas FVC obviates the risk. Some might argue that FVC cannot accurately reflect cardiovascular filling thereby defeating 1 of the important purposes of the catheter. While this is certainly true in patients with raised intraabdominal pressures, a small case series suggests that (longer‐than‐normal) FVC can accurately measure central filling pressures. 8 Another potential shortcoming of FVC is that if used only for short durations during initial resuscitationsas in this studysome patients will require a second CVC or PICC with incumbent risks.
Our study differs from previous studies that have shown infection rates ranging from 1.5/1000 to 20/1000 catheter‐days 4, 9, 10 and thrombosis rates of 6.6% to 25%. 5, 1013 Some previous studies have suggested higher rates of infection of FVC relative to internal jugular or subclavian sites (3.7/1000 vs. 20/1000 catheter‐days) 9 while others found similar infection or colonization rates between femoral and nonfemoral sites. 4, 10 Our 0.83 CRBSI per 1000 catheter‐day rate is similar to that of Pronovost et al. 1 who avoided FVC, whereas it was the preferred site (nearly half of all CVC) in our MICU. The incidence of VTE in critically ill patients ranges from 9% to 33 %, 14, 15 and CVC are a well recognized risk factor of VTE. 5 The reported incidence of DVT in patients with CVC varies widely from 3% to 10% in subclavian catheters 9 to 6.6% to 25% in FVC. 11, 12 We attribute the remarkable difference in our results to the fact that FVC was used for brief durations (mean 2.7 days, range 116 days) for the primary purpose of resuscitating critically ill patients. Also, techniques introduced by Pronovost et al. 1 to reduce CRBI had permeated our institutional practices by the time of this study; our results match his, of very low rates of CRBI when checklists are employed. In previous studies, FVC was used for extended durations similar to other CVC sites (ranging from 4 to 9.6 days). 5, 9, 12, 13, 16 Additionally, almost all of our patients received VTE prophylaxis whereas rates were variable in previous studies.
This study has several limitations. First, catheter insertion sites were not randomly assigned. This can introduce selection bias. For example, often femoral access is used in more unstable patients 4 who are less tolerant of Trendelenberg position whereas it is often avoided in obese patients. Another important limitation is that ultrasound studies were not performed in 47% of patients who had FVC. While these missed cases were not advertent (eg, CVC on weekends when no study personnel available), we cannot exclude the possibility of bias. However, no FVC patients who did not have ultrasounds developed clinically detected VTE. It is also possible that DVT could have appeared >5 to 7 days after our follow‐up ultrasound, though later development might favor spontaneous DVT unrelated to CVC. Finally, this was a relatively small study, but it appears that the rate of DVT from FVC, if placed for short durations and accompanied by thromboprophylaxis, is very low.
In conclusion, short‐term FVC was used safelywith no major complicationsin our MICU. Our data support that short‐term FVC (with thromboprophylaxis) has a reasonable safety profile for initial resuscitation of critically ill patients. Notwithstanding the limitations of our study, we suggest that it may be premature to abandon entirely 3, 17 the use of FVC for resuscitation of critically ill patients. We propose that our data suggest the need for a larger study to examine more definitively the safety profile of short‐term FVC.
- , , , et al. An intervention to decrease catheter related bloodstream infections in the ICU. N Engl J Med. 2006; 355: 2725– 2732.
- , , , et al. Guidelines for the prevention of intravascular catheter‐related infection. MMWR Website. Available at: http://www.cdc.gov/mmwr/preview/mmwrhtml/rr5110a1.htm. Accessed February 2010.
- Joint Commission. National Accreditation: Hospital Patient Safety Goals. Available at: http://www.jointcommission.org/NR/rdonlyres/31666E86‐E7F4‐423E‐9BE8‐F05BD1CB0AA8/0/HAP_NPSG.pdf. Accessed February 2010.
- , , , et al. The incidence of infectious complications of central venous catheters at the subclavian, internal jugular and femoral sites in an intensive care unit population. Crit Care Med. 2005; 33: 13– 20.
- , , , . Femoral deep vein thrombosis associated with central venous catheterization: Results from a prospective, randomized trial. Crit Care Med. 1995; 23: 52– 59.
- , , , , . Central vein catheterization. Failure and complicagtion rates by three percutaneous approaches. Arch Intern Med. 1986; 146: 259– 261.
- , , . Complications of central venous catheters: internal jugular versus subclavian access—a systematic review. Crit Care Med. 2002; 30: 454– 460.
- , , , , , . Comparison of intrathoracic and intra‐abdominal measurements of central venous pressure. Lancet. 1996; 347: 1155– 1157.
- , , , et al. Complications of femoral and subclavian venous catheterization in critically ill patients. A randomized controlled trial. JAMA. 2001; 286: 700– 707.
- , , , et al. Femoral vs jugular venous catheterization and risk of nosocomial events in adults requiring acute renal replacement therapy. A randomized trial. JAMA. 2008; 299: 2413– 2422.
- , , , , , . A prospective evaluation of the use of femoral venous catheters in critically ill adults. Crit Care Med. 1997; 25: 1986– 1989.
- , , , , . Lower extremity deep vein thrombosis: a prospective, randomized, controlled trial in comatose or sedated patients undergoing femoral vein catheterization. Crit Care Med. 1997; 25: 1982– 1985.
- , , , , . Deep venous thrombosis caused by femoral venous catheters in critically ill adult patients. Chest. 2000; 117: 178– 183.
- , , . The incidence of deep venous thrombosis in ICU patients. Chest. 1997; 111: 661– 664.
- , , , et al. Deep venous thrombosis in medical‐surgical critically il patients: prevalence, incidence and risk factors. Crit Care Med. 2005; 33: 1565– 1571.
- , , , et al. Central vein catheter related thrombosis in intensive care patients: incidence, risk factors and relationship with catheter related sepsis. Chest. 1998; 114: 207– 213.
- Institute for Healthcare Improvement. Optimal catheter site selection, with avoidance of the femoral vein for central venous access in adults. Available at: http://www.ihi.org/IHI/Topics/CriticalCare/IntensiveCare/Changes/IndividualChanges/OptimalCatheterSiteSelectionwithAvoidanceofFemoralVeinforCentralVenousAccessinAdultPatients.htm. Accessed February 2010.
Hospitalists' Awareness of Patient Charges
Hospitalists have been suggested to offer rational and efficient medical care through specialized knowledge about inpatient care services.1 The goal that hospitalists will use care resources more efficiently presumes hospitalists' accurate knowledge about charges and costs.
Data regarding physicians' awareness of care charges and its impact upon care is limited. An international meta‐analysis of clinicians' awareness of pharmaceutical prices demonstrated poor accuracy of physicians' estimates of charges, but effects of increasing their knowledge remained unexamined.2 Continuous exposure to education and alerts about charges have been demonstrated to diminish physicians' unnecessary use of specific laboratory assays in a single teaching hospital, in a pediatric emergency department, and an outpatient primary care system; test use declined when physicians were alerted to test charges at the point‐of‐care without negative impact upon clinical outcomes; when the notices ceased, utilization climbed back towards baseline levels. Specific to inpatient care, a single‐center study evaluated the impact of price‐alerts upon laboratory and imaging use, but showed no effects.36
Applicability of these existing data for contemporary hospitalists are limited, and most data were collected before hospitalists developed as an organized focus of practice. A review of existing literature revealed no published data demonstrating hospitalists' higher expert awareness of charges generated by inpatient care. Published comparisons of the care expense generated by hospitalists' care versus that of general internists or academic teams have shown minimal and inconsistent effects.79 Those data showing reduced costs from hospitalists were associated with small length‐of‐stay reductions, rather than more expert resource utilization.7 We measured the accuracy and precision of hospitalist's estimates of charges associated with services commonly used in inpatient care.
Setting
Two community‐based private, academic‐affiliated hospitals operated by a not‐for‐profit health system in Washington State, comprising together 895 inpatient beds. The questionnaire instrument was approved by the governing Institutional Review Board (IRB).
Methods
A list of true charges for 14 services, procedures, tests, and physician charges commonly ordered by adult medicine hospitalists was acquired directly from the responsible departments of a multi‐hospital system operated by a single non‐profit entity using a unified chargemaster. Specifically, we acquired the charge that a hypothetical self‐paying patient would receive for each service, excluding any adjustments exercised by other payer sources. The list of charges was reported to the organization's financial officers for affirmation. Physician charges were standardized to geographically‐adjusted Medicare charges obtained directly from the American Medical Assocation's online Common Procedural Terminology tool.10 A cross‐section of hospitalists (n = 25) was surveyed from a private hospitalist group and an academically‐affiliated hospitalist service. Hospitalists included US and international medical graduates, new‐graduates from residency training and clinicians with a range of prior experiences in academic centers, government hospital systems, and private primary care. Respondents were asked to estimate to the nearest dollar the billing charge that a hypothetical self‐pay patient would receive for each care item. Direct data collection was arranged through the groups' medical directors and occurred in the hospitalist groups' regular business meetings. The design gathered no data on individual characteristics of respondents such as domestic or international education, sex, age, or time in practice, nor from which practice‐group a given respondent originated, to affirm to participants that their responses could not be used to imply performance measures or quality profiles.
Findings
Hospitalists tended to rank the expense of items in essentially the correct order, as reflected by the rough trend of rising estimates compared to true‐charges (Figure 1). Of note, we did not ask hospitalists to discern the different charges of 2 appropriate competing clinical choices, but asked for estimated prices of diverse services. The range of respondents' estimates about each item was broad. The mean‐value of hospitalists' estimates for each care item was less revealing than the range and diversity of estimates about each care item. Accuracy of hospitalists' estimates of charges was poor. Only 10.8% of hospitalists' estimates were within 10% of the actual unadjusted charge, 17.8% within 20% of that charge, and 24.8% were within a 30% margin of accuracy. Summary results are presented (Table 1). Pearson's r correlation value between the unadjusted charges and the estimates made by hospitalists was 0.548, a coefficient of determination equal to 0.300. Thus, the true charges list we obtained had only a low‐grade association with hospitalists' estimates (Figure 1). Hospitalists' estimates about the charges of relatively‐expensive items (abdominal computed tomography [CT]) overlapped with their estimates about the least‐expensive items (such as a urine culture ). Inter‐hospitalist agreement about charges associated with each care item was also low; estimates for each care item charge varied over logarithmic orders of magnitude.
| Care Service | Unadjusted Charge, USD$ | Mean Estimate, USD$ | Minimum Estimate, USD$ | Maximum Estimate, USD$ | % of Estimates Within 10% Accuracy | % of Estimates Within 20% Accuracy | % of Estimates Within 30% Accuracy |
|---|---|---|---|---|---|---|---|
| |||||||
| Complete blood count | 30 | 73 | 10 | 440 | 16 | 20 | 20 |
| Complete metabolic panel | 37 | 135 | 15 | 1200 | 4 | 16 | 16 |
| Urinalysis with microscopy | 37 | 53 | 15 | 105 | 12 | 20 | 24 |
| Urine culture | 26 | 77 | 20 | 200 | 4 | 16 | 20 |
| Ward bed, charge per night | 744 | 998 | 300 | 3000 | 20 | 20 | 20 |
| ICU Bed, charge per night | 1107 | 2018 | 750 | 6000 | 8 | 12 | 12 |
| Chest x‐ray | 271 | 169 | 60 | 700 | 12 | 16 | 24 |
| CT scan, abdomen | 2204 | 803 | 150 | 1800 | 0 | 4 | 4 |
| Methylpredisolone 125 mg IV dose | 26.63 | 63 | 3 | 200 | 4 | 20 | 24 |
| Levofloxacin 500 mg IV dose | 105.41 | 114 | 10 | 500 | 24 | 28 | 36 |
| Levofloxacin 500 mg oral dose | 29.78 | 25 | 4 | 70 | 12 | 12 | 20 |
| Admission services (CPT code 99223) | 169.56 | 225 | 100 | 700 | 8 | 36 | 52 |
| Inpatient care services (CPT code 99232) | 62.47 | 110 | 40 | 400 | 12 | 28 | 48 |
| Central venous catheter placement (CPT 36569) | 286.04 | 338 | 50 | 1200 | 8 | 16 | 28 |
| Average % correct | 10.8 | 17.8 | 24.8 | ||||

Discussion
To date, hospitalist programs have shown little impact upon care costs when compared with other inpatient care staffing models. One limiting factor may be the opacity of medical care pricing. Patients have been demonstrated to have little access to knowledge of what care will cost them and complex barriers prevent them from gaining pricing information.11, 12 Hospitalists may be conjectured to serve as expert sources on the costs and values of medical care services on behalf of inpatients, but our observations suggest that hospitalists' actual knowledge of patient‐charges is lacking. The opacity of US medical prices to patients appears to extend to hospital‐care physicians as well. We observe that no widespread mechanism exists by which hospitalists would be well‐positioned to become informed about the actual charges their patients receive. Unadjusted chargemaster lists are generally restricted information, and would be difficult to access outside of participation in the charge‐notifications used in the existing studies cited above.
The inquiry was specifically limited to how closely hospitalists' estimates of the unadjusted charges for some commonly‐ordered items compare to the actual unadjusted chargemaster at their own institutions. We did not assess the hospitalists' perceptions about the accuracy of their estimates, nor the impact of specific hospitalist characteristics upon accuracy. Our sample's representation of the larger national population of hospital physicians is not established, but engenders no expectation that these clinicians' charge‐awareness is substantively different from that of hospitalists in most other institutions. It is not known what specific clinician or practice‐setting characteristics will direct charge‐awareness, or will influence the impact of charge‐awareness upon clinical practices.
The range of estimates different hospitalists made about the same care items in the same facilities was very broad, which argues that respondents did not estimate charges based upon a different knowledge base of which the investigators were unaware. This is important because our use of unadjusted charges to self‐pay patients as true prices is necessarily somewhat arbitrary. Chargemaster price may not reflect the institution's cost of performing the service, the different prices paid for a single service by different payer sources, nor reflect services' true value based upon outcomes. However, recognizing that these actual prices are somewhat artificial, the use of these prices suffices for the current inquiry, and does not negate our findings of hospitalists' low accuracy and low agreement. Also noteworthy, an unadjusted chargemaster can often represent the charges received by those uninsured US patients for whom payer‐source adjustment is inaccessible, and informs downstream accounting such as the value of unpaid care a hospital delivers annually.
The most immediate matter for examination among hospitalists is what effects increased charge‐awareness may exert upon clinical decisions and practice processes. It appears that the premise that hospitalists' exercise expert knowledge of costs is likely not valid; but it is unknown whether accurate charge‐awareness among hospitalists will improve cost‐reductions by hospitalists. In some payer‐arrangements, accurate charge‐awareness might engender reduced care quantity, rather than increased efficiency or quality. The impact of upgrading hospitalists' knowledge about the charges and costs they generate, and the most effective method to do so, is worthy of investigation; based upon this initial data we encourage and are undertaking a larger‐scale study and exploration of the effects of enhanced hospitalist charge‐awareness.
Conclusion
Hospitalists have low awareness of the charges associated with inpatient care. The opacity of hospital care pricing to patient populations extends also to hospitalist physicians. Hospitalists likely do not improve cost‐efficiency through expert knowledge of services' costs to patients. Education and reminder systems to apprise hospitalists of charges should be examined as possible tools to optimize the use of inpatient care resources.
- ,, et al.The positive impact of initiation of hospitalist clinician educators.J Gen Intern Med.2004;19(4):293–201.
- ,,.Physician awareness of drug cost: a systematic review.PLoS Med.2007;4(9):e283.
- ,,,,.The effect of price information on test‐ordering behavior and patient outcomes in a pediatric emergency department.Pediatrics.1999;103(4):877–882.
- ,,.The effect on test ordering of informing physicians of the charges for outpatient diagnostic tests.N Engl J Med1990;322:1499–1504.
- ,,,.Factors contributing to inappropriate ordering of tests in an academic medical department and the effect of an educational feedback strategy.Postgrad Med J.2006;82:823–829.
- ,,, et al.Tanasijevic does the computerized display of charges affect inpatient ancillary test utilization?Arch Intern Med.1997;157(21):2501–2508.
- ,.The impact of hospitalists on the cost and quality of inpatient care in the united states: a research synthesis.Med Care Res Rev.2005;62:379–406.
- ,,.Comparison of hospital costs and length of stay for community internists, hospitalists, and academicians.J Gen Intern Med.2007;22:662–667.
- ,,,,,.Outcomes of care by hospitalists, general internists, and family physicians.N Engl J Med.2007;357(25):2589–2600.
- American Medical Association, CPT and RVU Search utility. Available at: https://catalog.ama‐assn.org/Catalog/cpt/cpt_search.jsp. Accessed December 2009.
- ,.Does price tranparency improve market efficiency? Implications of empirical evidence in other markets for the health sector. 2007, Congressional Research Service Report RL34101. Available at: http://ftp.fas.org/sgp/crs/secrecy/RL34101. Accessed December2009.
- .The pricing of US hospital services.Health Aff.2006;25(1):57–69.
Hospitalists have been suggested to offer rational and efficient medical care through specialized knowledge about inpatient care services.1 The goal that hospitalists will use care resources more efficiently presumes hospitalists' accurate knowledge about charges and costs.
Data regarding physicians' awareness of care charges and its impact upon care is limited. An international meta‐analysis of clinicians' awareness of pharmaceutical prices demonstrated poor accuracy of physicians' estimates of charges, but effects of increasing their knowledge remained unexamined.2 Continuous exposure to education and alerts about charges have been demonstrated to diminish physicians' unnecessary use of specific laboratory assays in a single teaching hospital, in a pediatric emergency department, and an outpatient primary care system; test use declined when physicians were alerted to test charges at the point‐of‐care without negative impact upon clinical outcomes; when the notices ceased, utilization climbed back towards baseline levels. Specific to inpatient care, a single‐center study evaluated the impact of price‐alerts upon laboratory and imaging use, but showed no effects.36
Applicability of these existing data for contemporary hospitalists are limited, and most data were collected before hospitalists developed as an organized focus of practice. A review of existing literature revealed no published data demonstrating hospitalists' higher expert awareness of charges generated by inpatient care. Published comparisons of the care expense generated by hospitalists' care versus that of general internists or academic teams have shown minimal and inconsistent effects.79 Those data showing reduced costs from hospitalists were associated with small length‐of‐stay reductions, rather than more expert resource utilization.7 We measured the accuracy and precision of hospitalist's estimates of charges associated with services commonly used in inpatient care.
Setting
Two community‐based private, academic‐affiliated hospitals operated by a not‐for‐profit health system in Washington State, comprising together 895 inpatient beds. The questionnaire instrument was approved by the governing Institutional Review Board (IRB).
Methods
A list of true charges for 14 services, procedures, tests, and physician charges commonly ordered by adult medicine hospitalists was acquired directly from the responsible departments of a multi‐hospital system operated by a single non‐profit entity using a unified chargemaster. Specifically, we acquired the charge that a hypothetical self‐paying patient would receive for each service, excluding any adjustments exercised by other payer sources. The list of charges was reported to the organization's financial officers for affirmation. Physician charges were standardized to geographically‐adjusted Medicare charges obtained directly from the American Medical Assocation's online Common Procedural Terminology tool.10 A cross‐section of hospitalists (n = 25) was surveyed from a private hospitalist group and an academically‐affiliated hospitalist service. Hospitalists included US and international medical graduates, new‐graduates from residency training and clinicians with a range of prior experiences in academic centers, government hospital systems, and private primary care. Respondents were asked to estimate to the nearest dollar the billing charge that a hypothetical self‐pay patient would receive for each care item. Direct data collection was arranged through the groups' medical directors and occurred in the hospitalist groups' regular business meetings. The design gathered no data on individual characteristics of respondents such as domestic or international education, sex, age, or time in practice, nor from which practice‐group a given respondent originated, to affirm to participants that their responses could not be used to imply performance measures or quality profiles.
Findings
Hospitalists tended to rank the expense of items in essentially the correct order, as reflected by the rough trend of rising estimates compared to true‐charges (Figure 1). Of note, we did not ask hospitalists to discern the different charges of 2 appropriate competing clinical choices, but asked for estimated prices of diverse services. The range of respondents' estimates about each item was broad. The mean‐value of hospitalists' estimates for each care item was less revealing than the range and diversity of estimates about each care item. Accuracy of hospitalists' estimates of charges was poor. Only 10.8% of hospitalists' estimates were within 10% of the actual unadjusted charge, 17.8% within 20% of that charge, and 24.8% were within a 30% margin of accuracy. Summary results are presented (Table 1). Pearson's r correlation value between the unadjusted charges and the estimates made by hospitalists was 0.548, a coefficient of determination equal to 0.300. Thus, the true charges list we obtained had only a low‐grade association with hospitalists' estimates (Figure 1). Hospitalists' estimates about the charges of relatively‐expensive items (abdominal computed tomography [CT]) overlapped with their estimates about the least‐expensive items (such as a urine culture ). Inter‐hospitalist agreement about charges associated with each care item was also low; estimates for each care item charge varied over logarithmic orders of magnitude.
| Care Service | Unadjusted Charge, USD$ | Mean Estimate, USD$ | Minimum Estimate, USD$ | Maximum Estimate, USD$ | % of Estimates Within 10% Accuracy | % of Estimates Within 20% Accuracy | % of Estimates Within 30% Accuracy |
|---|---|---|---|---|---|---|---|
| |||||||
| Complete blood count | 30 | 73 | 10 | 440 | 16 | 20 | 20 |
| Complete metabolic panel | 37 | 135 | 15 | 1200 | 4 | 16 | 16 |
| Urinalysis with microscopy | 37 | 53 | 15 | 105 | 12 | 20 | 24 |
| Urine culture | 26 | 77 | 20 | 200 | 4 | 16 | 20 |
| Ward bed, charge per night | 744 | 998 | 300 | 3000 | 20 | 20 | 20 |
| ICU Bed, charge per night | 1107 | 2018 | 750 | 6000 | 8 | 12 | 12 |
| Chest x‐ray | 271 | 169 | 60 | 700 | 12 | 16 | 24 |
| CT scan, abdomen | 2204 | 803 | 150 | 1800 | 0 | 4 | 4 |
| Methylpredisolone 125 mg IV dose | 26.63 | 63 | 3 | 200 | 4 | 20 | 24 |
| Levofloxacin 500 mg IV dose | 105.41 | 114 | 10 | 500 | 24 | 28 | 36 |
| Levofloxacin 500 mg oral dose | 29.78 | 25 | 4 | 70 | 12 | 12 | 20 |
| Admission services (CPT code 99223) | 169.56 | 225 | 100 | 700 | 8 | 36 | 52 |
| Inpatient care services (CPT code 99232) | 62.47 | 110 | 40 | 400 | 12 | 28 | 48 |
| Central venous catheter placement (CPT 36569) | 286.04 | 338 | 50 | 1200 | 8 | 16 | 28 |
| Average % correct | 10.8 | 17.8 | 24.8 | ||||
Discussion
To date, hospitalist programs have shown little impact upon care costs when compared with other inpatient care staffing models. One limiting factor may be the opacity of medical care pricing. Patients have been demonstrated to have little access to knowledge of what care will cost them and complex barriers prevent them from gaining pricing information.11, 12 Hospitalists may be conjectured to serve as expert sources on the costs and values of medical care services on behalf of inpatients, but our observations suggest that hospitalists' actual knowledge of patient‐charges is lacking. The opacity of US medical prices to patients appears to extend to hospital‐care physicians as well. We observe that no widespread mechanism exists by which hospitalists would be well‐positioned to become informed about the actual charges their patients receive. Unadjusted chargemaster lists are generally restricted information, and would be difficult to access outside of participation in the charge‐notifications used in the existing studies cited above.
The inquiry was specifically limited to how closely hospitalists' estimates of the unadjusted charges for some commonly‐ordered items compare to the actual unadjusted chargemaster at their own institutions. We did not assess the hospitalists' perceptions about the accuracy of their estimates, nor the impact of specific hospitalist characteristics upon accuracy. Our sample's representation of the larger national population of hospital physicians is not established, but engenders no expectation that these clinicians' charge‐awareness is substantively different from that of hospitalists in most other institutions. It is not known what specific clinician or practice‐setting characteristics will direct charge‐awareness, or will influence the impact of charge‐awareness upon clinical practices.
The range of estimates different hospitalists made about the same care items in the same facilities was very broad, which argues that respondents did not estimate charges based upon a different knowledge base of which the investigators were unaware. This is important because our use of unadjusted charges to self‐pay patients as true prices is necessarily somewhat arbitrary. Chargemaster price may not reflect the institution's cost of performing the service, the different prices paid for a single service by different payer sources, nor reflect services' true value based upon outcomes. However, recognizing that these actual prices are somewhat artificial, the use of these prices suffices for the current inquiry, and does not negate our findings of hospitalists' low accuracy and low agreement. Also noteworthy, an unadjusted chargemaster can often represent the charges received by those uninsured US patients for whom payer‐source adjustment is inaccessible, and informs downstream accounting such as the value of unpaid care a hospital delivers annually.
The most immediate matter for examination among hospitalists is what effects increased charge‐awareness may exert upon clinical decisions and practice processes. It appears that the premise that hospitalists' exercise expert knowledge of costs is likely not valid; but it is unknown whether accurate charge‐awareness among hospitalists will improve cost‐reductions by hospitalists. In some payer‐arrangements, accurate charge‐awareness might engender reduced care quantity, rather than increased efficiency or quality. The impact of upgrading hospitalists' knowledge about the charges and costs they generate, and the most effective method to do so, is worthy of investigation; based upon this initial data we encourage and are undertaking a larger‐scale study and exploration of the effects of enhanced hospitalist charge‐awareness.
Conclusion
Hospitalists have low awareness of the charges associated with inpatient care. The opacity of hospital care pricing to patient populations extends also to hospitalist physicians. Hospitalists likely do not improve cost‐efficiency through expert knowledge of services' costs to patients. Education and reminder systems to apprise hospitalists of charges should be examined as possible tools to optimize the use of inpatient care resources.
- ,, et al.The positive impact of initiation of hospitalist clinician educators.J Gen Intern Med.2004;19(4):293–201.
- ,,.Physician awareness of drug cost: a systematic review.PLoS Med.2007;4(9):e283.
- ,,,,.The effect of price information on test‐ordering behavior and patient outcomes in a pediatric emergency department.Pediatrics.1999;103(4):877–882.
- ,,.The effect on test ordering of informing physicians of the charges for outpatient diagnostic tests.N Engl J Med1990;322:1499–1504.
- ,,,.Factors contributing to inappropriate ordering of tests in an academic medical department and the effect of an educational feedback strategy.Postgrad Med J.2006;82:823–829.
- ,,, et al.Tanasijevic does the computerized display of charges affect inpatient ancillary test utilization?Arch Intern Med.1997;157(21):2501–2508.
- ,.The impact of hospitalists on the cost and quality of inpatient care in the united states: a research synthesis.Med Care Res Rev.2005;62:379–406.
- ,,.Comparison of hospital costs and length of stay for community internists, hospitalists, and academicians.J Gen Intern Med.2007;22:662–667.
- ,,,,,.Outcomes of care by hospitalists, general internists, and family physicians.N Engl J Med.2007;357(25):2589–2600.
- American Medical Association, CPT and RVU Search utility. Available at: https://catalog.ama‐assn.org/Catalog/cpt/cpt_search.jsp. Accessed December 2009.
- ,.Does price tranparency improve market efficiency? Implications of empirical evidence in other markets for the health sector. 2007, Congressional Research Service Report RL34101. Available at: http://ftp.fas.org/sgp/crs/secrecy/RL34101. Accessed December2009.
- .The pricing of US hospital services.Health Aff.2006;25(1):57–69.