User login
Teaching Scripts and Faculty Development
Patient complexity,1 productivity, and documentation pressures have increased substantially over the past 2 decades. Within this environment, time for teaching is often limited. The same pressures which limit faculty members' teaching time also limit their availability to learn how to teach; faculty development efforts need to be both effective and efficient.
In a seminal study of exemplary clinical teachers, Irby discovered that expert teachers often developed and utilized teaching scripts for commonly encountered teachable moments.2 Teaching scripts consist of a trigger, key teaching points, and teaching strategies.2 A trigger may be a specific clinical situation or a learner knowledge gap identified by the teacher. The trigger prompts the teacher to select key teaching points about the topic (the content), and utilize strategies for making these teaching points comprehensible (the process).2 Through a reflective process, these expert teachers evaluated the effectiveness of each teaching session and honed their scripts over time.2 While additional reports have described the use of teaching scripts,35 we found no studies evaluating the impact of collaboratively developing teaching scripts. In the present study, we sought to understand faculty members' early experiences with a program of collaboratively developing teaching scripts and the impact on their self‐efficacy with teaching about commonly encountered clinical conditions on attending rounds.
METHODS
Participants were the 22 internal medicine, or combined internal medicine and pediatrics (med‐peds), hospitalists in a 750‐bed university teaching hospital in upstate New York. Nine hospitalists worked for only 1 year (eg, chief residents and recent graduates awaiting fellowship training), and were present for half of the program year. All hospitalists conducted daily bedside attending rounds, lasting 1.52 hours, with a dual purpose of teaching the residents and students, and making management decisions for their shared patients.
Hospitalists were surveyed to identify 10 commonly encountered diagnoses about which they wanted to learn how to teach. The faculty development director (V.J.L.) conducted a 1‐hour workshop to introduce the concept of teaching scripts, and role‐play a teaching script. Nine hospitalists volunteered to write scripts for the remaining target diagnoses. They were provided with a template; example teaching script (see Supporting Information, Supplemental Content 1, in the online version of this article); and guidelines on writing scripts which highlighted effective clinical teaching principles for hospitalists, including: managing time with short scripts and high‐yield teaching points, knowledge acquisition with evidence‐based resources, self‐reflection/emnsight, patient‐centered teaching (identifying triggers among commonly encountered situations), and learner‐centered teaching (identifying common misconceptions and strategies for engaging all levels of learners) (Figure 1).2, 6 Faculty were encouraged to practice their scripts on attending rounds, using lessons learned to refine and write the script for presentation. Each script was presented verbally and on paper at a monthly 1‐hour interactive workshop where lunch was provided. Authors received feedback and incorporated suggestions for teaching strategies from the other hospitalists. Revised scripts were distributed electronically.
Baseline surveys measured prior teaching and faculty development experience, and self‐efficacy with teaching about the 10 target diagnoses, ranging from Not confident at all to Very confident on a 4‐point Likert scale. Using open‐ended surveys, we asked all of the hospitalists about their experiences with presenting scripts and participating in peer feedback, and the impact of the program on their teaching skills and patient care.
Because the learning objectives for each teaching script were determined by each script's author and were not known prior to the program, we were unable to assess changes in residents' and students' knowledge directly. As a surrogate measure, we surveyed students, residents, and faculty regarding how often the hospitalist taught about the 10 target diagnoses and whether teaching points were applicable to current or future patients. We administered the surveys online weekly for 8 weeks before and after the program. Residents and students were notified that participation had no impact on their evaluations. They received a $2.50 coffee gift card for each survey. The study received an exemption from the university's Institutional Review Board.
The number of teaching episodes per week related to the target diagnoses was averaged across survey weeks. Student t tests were used to compare results before versus after the intervention, and 95% confidence interval (CI) calculated. We considered P 0.05 to be statistically significant. Data were analyzed using SAS version 9.2 (Cary, NC).
Qualitative data were analyzed by coding each statement, then developing themes using an iterative process. Three investigators independently developed themes, and met twice to review the categorization of each statement until consensus was achieved. Two of the investigators were involved in the program (V.J.L. and A.B.) and one did not participate in the workshops (C.G.).
RESULTS
The 22 faculty had an average of 5 years' experience as hospitalists (range 0.824 years). Previous experience formally learning how to teach ranged from 0 to 150 hours (average 33.1 hours; median 15 hours). A mean of 9.4 hospitalists attended each of the 10 1‐hour workshops. Script writers estimated that scripts required a mean of 4.3 hours to prepare. A total of 105 (59%) resident/student and 22 (55%) faculty surveys were returned preintervention, and 83 (47%) resident/student and 19 (48%) faculty surveys were returned postintervention. There were no significant differences in the number or applicability of teaching events from before to after the program. Faculty self‐efficacy with teaching was available for 7 of the 10 diagnoses, and increased from a mean of 3.26 (n = 77) preintervention to 3.72 (n = 52) postintervention (95% CI for the difference in means 0.350.51; P 0.0001).
A total of 8 (80%) script‐writers and 5 (42%) non‐writers responded to the qualitative survey, and 77 comments were coded. Three major themes and 8 subthemes were identified (for representative comments, see Supporting Information, Supplemental Content 2, in the online version of this article). The major theme of individual professional development related especially to the personal satisfaction of researching a topic and becoming a local expert. While most comments were positive, 2 described apprehension about presenting to peers. Fifteen comments specifically addressed the development of teaching skills, 13 positive and 2 neutral. Some focused on strategies consistent with the teaching script framework, including recognizing teachable moments and the importance of preparation for teaching. Others focused on changes in teaching style, shifting to a more interactive method and involving multiple levels of learners. Others revealed that participants adjusted the content of their teaching, adding new material and changing the focus to important clinical pearls. Another subtheme was the impact on clinical care and medical knowledge base. Of the 11 comments, 7 were positive and emphasized the development of a framework for making decisions, based on an understanding of the evidence behind those decisions. Four were neutral, noting that care of patients had not changed. Two comments remarked on the time invested in developing teaching scripts. A second major theme was the development of a shared mental model of professional responsibility. This was demonstrated by comments relating to participants' motivation for learning, and development or strengthening of responsibility for teaching. The third major theme described interpersonal relationships among colleagues. Four commented on how the opportunity to see how others teach led them to appreciate the diversity of approaches, while 14 focused on collegiality among the faculty. Thirteen of these identified an increased sense of community and camaraderie, while one was neutral.
CONCLUSIONS
We had successful early experience with a faculty development intervention that involved hospitalists in creating and implementing teaching scripts related to commonly encountered diagnoses. The intervention was time‐ and resource‐efficient. Following the intervention, we found increased faculty self‐efficacy and beneficial effects in several domains related to professional development and satisfaction. We found no significant difference in the frequency or applicability of teaching about the targeted diagnoses.
In addition to the formal program evaluation results, we learned several additional lessons informally. Faculty who developed scripts had varying levels of familiarity with evidence‐based approaches to teaching. Some faculty requested to have their scripts reviewed by the program leader before presentation, and small revisions were made, emphasizing use of the tips included in Figure 1. Using volunteers, rather than assigning the responsibility for script development, ensured that we had a group of enthusiastic participants. In fact, several hospitalists volunteered to write additional scripts the following year.
This program used a conceptual framework of best practices, namely evidence‐based principles of effective faculty development for teaching in medical education.7 Different instructional methods were utilized: experiential learning was simulated by demonstrating scripts; the reasoning underlying scripts was provided; feedback was provided; and scripts were provided in written, electronic, and verbal formats. Allowing hospitalists to choose which script to develop gave them a chance to showcase an area of strength or explore an area of weakness, a feature of self‐directed learning. Focusing scripts on common diagnoses and easily identifiable triggers enhanced the functional value of the workshops. By having each hospitalist develop a script with input from each other, the unit built a body of knowledge and skill, enhancing collegiality and building a community of learners. Studies of other longitudinal faculty development programs have found that they create a supportive, learner‐centered environment that fosters a sense of commonality and interdisciplinary collegiality.8, 9
Other faculty development initiatives specific to hospitalists have been described, several focusing on the care of geriatric patients,1012 and one focusing on general academic development.13 While effective, these programs depended on a few individuals to develop the materials, and one required extensive time away from clinical duties for attendance.12 By sharing responsibility for developing teaching scripts, our program was efficient to conduct and capitalized on unique contributions from each faculty member.
This study has several limitations. While we attempted to quantify the amount and applicability of teaching, we were not able to account for the number of inpatients on the teams who had the diagnoses for which teaching scripts had been developed. It was impossible to determine whether these diagnoses were the most important topics to discuss on rounds. Because learning objectives were developed as each script was written, we were unable to assess changes in resident and student knowledge or patient outcomes. The study was conducted at a single center with interested faculty.
Future studies are needed to compare the effectiveness of collaborative teaching script development programs with other faculty development initiatives, and assess the impact on downstream outcomes, such as learners' decision‐making, patient outcomes, and faculty retention.
Acknowledgements
The authors thank the members of the University of Rochester Hospital Medicine Division.
Disclosures: Funding: University of Rochester School of Medicine and Dentistry, Office of the Dean of Faculty DevelopmentMedical Education. Conflicts of interest: Nothing to report. Ethics approval: Exemption given by the University of Rochester Research Subjects Review Board. Previous presentations: University of Rochester Faculty Development Colloquium, June 2011.
- ,,,.2006 National hospital discharge survey. Centers for Disease Control and Prevention.Natl Health Stat.2008;5:1–20.
- .How attending physicians make instructional decisions when conducting teaching rounds.Acad Med.1992;67(10):630–638.
- ,.How pediatric educators know what to teach: the use of teaching scripts.Pediatrics.1999;104:148–150.
- ,,,.Tips for teachers of evidence‐based medicine: making sense of diagnostic tests using likelihood ratios.J Gen Intern Med.2006;23(1):87–92.
- .Teaching scripts for inpatient medicine. In: Wiese J, ed.Teaching in the Hospital. ACP Teaching Medicine Series.Philadelphia, PA:American College of Physicians (ACP);2010.
- ,,,,,.The qualities and skills of exemplary pediatric hospitalist educators: a qualitative study.Acad Med.2010;85(12):1905–1913.
- ,,, et al.A systematic review of faculty development initiatives designed to improve teaching effectiveness in medical education: BEME guide no. 8.Med Teach.2006;28(6):497–526.
- ,.Humanising medical education through faculty development: linking self‐awareness and teaching skills.Med Educ.2005;39:154–162.
- ,,,,,.Educational fellowship programs: common themes and overarching issues.Acad Med.2006;81:990–994.
- ,,,,,.Advancing geriatrics education: an efficient faculty development program for academic hospitalists increases geriatrics teaching.J Hosp Med.2010;5(9):541–546.
- ,,,.Hazards of hospitalization: hospitalists and geriatricians educating medical students about delirium and falls in geriatric inpatients.Gerontol Geriatr Educ.2008;28(4):94–104.
- ,,, et al.The curriculum for the hospitalized aging medical patient program: a collaborative faculty development program for hospitalists, general internists, and geriatricians.J Hosp Med.2008;3:384–393.
- ,,,.Investing in the future: building an academic hospitalist faculty development program.J Hosp Med.2011;6(3):161–166.
Patient complexity,1 productivity, and documentation pressures have increased substantially over the past 2 decades. Within this environment, time for teaching is often limited. The same pressures which limit faculty members' teaching time also limit their availability to learn how to teach; faculty development efforts need to be both effective and efficient.
In a seminal study of exemplary clinical teachers, Irby discovered that expert teachers often developed and utilized teaching scripts for commonly encountered teachable moments.2 Teaching scripts consist of a trigger, key teaching points, and teaching strategies.2 A trigger may be a specific clinical situation or a learner knowledge gap identified by the teacher. The trigger prompts the teacher to select key teaching points about the topic (the content), and utilize strategies for making these teaching points comprehensible (the process).2 Through a reflective process, these expert teachers evaluated the effectiveness of each teaching session and honed their scripts over time.2 While additional reports have described the use of teaching scripts,35 we found no studies evaluating the impact of collaboratively developing teaching scripts. In the present study, we sought to understand faculty members' early experiences with a program of collaboratively developing teaching scripts and the impact on their self‐efficacy with teaching about commonly encountered clinical conditions on attending rounds.
METHODS
Participants were the 22 internal medicine, or combined internal medicine and pediatrics (med‐peds), hospitalists in a 750‐bed university teaching hospital in upstate New York. Nine hospitalists worked for only 1 year (eg, chief residents and recent graduates awaiting fellowship training), and were present for half of the program year. All hospitalists conducted daily bedside attending rounds, lasting 1.52 hours, with a dual purpose of teaching the residents and students, and making management decisions for their shared patients.
Hospitalists were surveyed to identify 10 commonly encountered diagnoses about which they wanted to learn how to teach. The faculty development director (V.J.L.) conducted a 1‐hour workshop to introduce the concept of teaching scripts, and role‐play a teaching script. Nine hospitalists volunteered to write scripts for the remaining target diagnoses. They were provided with a template; example teaching script (see Supporting Information, Supplemental Content 1, in the online version of this article); and guidelines on writing scripts which highlighted effective clinical teaching principles for hospitalists, including: managing time with short scripts and high‐yield teaching points, knowledge acquisition with evidence‐based resources, self‐reflection/emnsight, patient‐centered teaching (identifying triggers among commonly encountered situations), and learner‐centered teaching (identifying common misconceptions and strategies for engaging all levels of learners) (Figure 1).2, 6 Faculty were encouraged to practice their scripts on attending rounds, using lessons learned to refine and write the script for presentation. Each script was presented verbally and on paper at a monthly 1‐hour interactive workshop where lunch was provided. Authors received feedback and incorporated suggestions for teaching strategies from the other hospitalists. Revised scripts were distributed electronically.
Baseline surveys measured prior teaching and faculty development experience, and self‐efficacy with teaching about the 10 target diagnoses, ranging from Not confident at all to Very confident on a 4‐point Likert scale. Using open‐ended surveys, we asked all of the hospitalists about their experiences with presenting scripts and participating in peer feedback, and the impact of the program on their teaching skills and patient care.
Because the learning objectives for each teaching script were determined by each script's author and were not known prior to the program, we were unable to assess changes in residents' and students' knowledge directly. As a surrogate measure, we surveyed students, residents, and faculty regarding how often the hospitalist taught about the 10 target diagnoses and whether teaching points were applicable to current or future patients. We administered the surveys online weekly for 8 weeks before and after the program. Residents and students were notified that participation had no impact on their evaluations. They received a $2.50 coffee gift card for each survey. The study received an exemption from the university's Institutional Review Board.
The number of teaching episodes per week related to the target diagnoses was averaged across survey weeks. Student t tests were used to compare results before versus after the intervention, and 95% confidence interval (CI) calculated. We considered P 0.05 to be statistically significant. Data were analyzed using SAS version 9.2 (Cary, NC).
Qualitative data were analyzed by coding each statement, then developing themes using an iterative process. Three investigators independently developed themes, and met twice to review the categorization of each statement until consensus was achieved. Two of the investigators were involved in the program (V.J.L. and A.B.) and one did not participate in the workshops (C.G.).
RESULTS
The 22 faculty had an average of 5 years' experience as hospitalists (range 0.824 years). Previous experience formally learning how to teach ranged from 0 to 150 hours (average 33.1 hours; median 15 hours). A mean of 9.4 hospitalists attended each of the 10 1‐hour workshops. Script writers estimated that scripts required a mean of 4.3 hours to prepare. A total of 105 (59%) resident/student and 22 (55%) faculty surveys were returned preintervention, and 83 (47%) resident/student and 19 (48%) faculty surveys were returned postintervention. There were no significant differences in the number or applicability of teaching events from before to after the program. Faculty self‐efficacy with teaching was available for 7 of the 10 diagnoses, and increased from a mean of 3.26 (n = 77) preintervention to 3.72 (n = 52) postintervention (95% CI for the difference in means 0.350.51; P 0.0001).
A total of 8 (80%) script‐writers and 5 (42%) non‐writers responded to the qualitative survey, and 77 comments were coded. Three major themes and 8 subthemes were identified (for representative comments, see Supporting Information, Supplemental Content 2, in the online version of this article). The major theme of individual professional development related especially to the personal satisfaction of researching a topic and becoming a local expert. While most comments were positive, 2 described apprehension about presenting to peers. Fifteen comments specifically addressed the development of teaching skills, 13 positive and 2 neutral. Some focused on strategies consistent with the teaching script framework, including recognizing teachable moments and the importance of preparation for teaching. Others focused on changes in teaching style, shifting to a more interactive method and involving multiple levels of learners. Others revealed that participants adjusted the content of their teaching, adding new material and changing the focus to important clinical pearls. Another subtheme was the impact on clinical care and medical knowledge base. Of the 11 comments, 7 were positive and emphasized the development of a framework for making decisions, based on an understanding of the evidence behind those decisions. Four were neutral, noting that care of patients had not changed. Two comments remarked on the time invested in developing teaching scripts. A second major theme was the development of a shared mental model of professional responsibility. This was demonstrated by comments relating to participants' motivation for learning, and development or strengthening of responsibility for teaching. The third major theme described interpersonal relationships among colleagues. Four commented on how the opportunity to see how others teach led them to appreciate the diversity of approaches, while 14 focused on collegiality among the faculty. Thirteen of these identified an increased sense of community and camaraderie, while one was neutral.
CONCLUSIONS
We had successful early experience with a faculty development intervention that involved hospitalists in creating and implementing teaching scripts related to commonly encountered diagnoses. The intervention was time‐ and resource‐efficient. Following the intervention, we found increased faculty self‐efficacy and beneficial effects in several domains related to professional development and satisfaction. We found no significant difference in the frequency or applicability of teaching about the targeted diagnoses.
In addition to the formal program evaluation results, we learned several additional lessons informally. Faculty who developed scripts had varying levels of familiarity with evidence‐based approaches to teaching. Some faculty requested to have their scripts reviewed by the program leader before presentation, and small revisions were made, emphasizing use of the tips included in Figure 1. Using volunteers, rather than assigning the responsibility for script development, ensured that we had a group of enthusiastic participants. In fact, several hospitalists volunteered to write additional scripts the following year.
This program used a conceptual framework of best practices, namely evidence‐based principles of effective faculty development for teaching in medical education.7 Different instructional methods were utilized: experiential learning was simulated by demonstrating scripts; the reasoning underlying scripts was provided; feedback was provided; and scripts were provided in written, electronic, and verbal formats. Allowing hospitalists to choose which script to develop gave them a chance to showcase an area of strength or explore an area of weakness, a feature of self‐directed learning. Focusing scripts on common diagnoses and easily identifiable triggers enhanced the functional value of the workshops. By having each hospitalist develop a script with input from each other, the unit built a body of knowledge and skill, enhancing collegiality and building a community of learners. Studies of other longitudinal faculty development programs have found that they create a supportive, learner‐centered environment that fosters a sense of commonality and interdisciplinary collegiality.8, 9
Other faculty development initiatives specific to hospitalists have been described, several focusing on the care of geriatric patients,1012 and one focusing on general academic development.13 While effective, these programs depended on a few individuals to develop the materials, and one required extensive time away from clinical duties for attendance.12 By sharing responsibility for developing teaching scripts, our program was efficient to conduct and capitalized on unique contributions from each faculty member.
This study has several limitations. While we attempted to quantify the amount and applicability of teaching, we were not able to account for the number of inpatients on the teams who had the diagnoses for which teaching scripts had been developed. It was impossible to determine whether these diagnoses were the most important topics to discuss on rounds. Because learning objectives were developed as each script was written, we were unable to assess changes in resident and student knowledge or patient outcomes. The study was conducted at a single center with interested faculty.
Future studies are needed to compare the effectiveness of collaborative teaching script development programs with other faculty development initiatives, and assess the impact on downstream outcomes, such as learners' decision‐making, patient outcomes, and faculty retention.
Acknowledgements
The authors thank the members of the University of Rochester Hospital Medicine Division.
Disclosures: Funding: University of Rochester School of Medicine and Dentistry, Office of the Dean of Faculty DevelopmentMedical Education. Conflicts of interest: Nothing to report. Ethics approval: Exemption given by the University of Rochester Research Subjects Review Board. Previous presentations: University of Rochester Faculty Development Colloquium, June 2011.
- ,,,.2006 National hospital discharge survey. Centers for Disease Control and Prevention.Natl Health Stat.2008;5:1–20.
- .How attending physicians make instructional decisions when conducting teaching rounds.Acad Med.1992;67(10):630–638.
- ,.How pediatric educators know what to teach: the use of teaching scripts.Pediatrics.1999;104:148–150.
- ,,,.Tips for teachers of evidence‐based medicine: making sense of diagnostic tests using likelihood ratios.J Gen Intern Med.2006;23(1):87–92.
- .Teaching scripts for inpatient medicine. In: Wiese J, ed.Teaching in the Hospital. ACP Teaching Medicine Series.Philadelphia, PA:American College of Physicians (ACP);2010.
- ,,,,,.The qualities and skills of exemplary pediatric hospitalist educators: a qualitative study.Acad Med.2010;85(12):1905–1913.
- ,,, et al.A systematic review of faculty development initiatives designed to improve teaching effectiveness in medical education: BEME guide no. 8.Med Teach.2006;28(6):497–526.
- ,.Humanising medical education through faculty development: linking self‐awareness and teaching skills.Med Educ.2005;39:154–162.
- ,,,,,.Educational fellowship programs: common themes and overarching issues.Acad Med.2006;81:990–994.
- ,,,,,.Advancing geriatrics education: an efficient faculty development program for academic hospitalists increases geriatrics teaching.J Hosp Med.2010;5(9):541–546.
- ,,,.Hazards of hospitalization: hospitalists and geriatricians educating medical students about delirium and falls in geriatric inpatients.Gerontol Geriatr Educ.2008;28(4):94–104.
- ,,, et al.The curriculum for the hospitalized aging medical patient program: a collaborative faculty development program for hospitalists, general internists, and geriatricians.J Hosp Med.2008;3:384–393.
- ,,,.Investing in the future: building an academic hospitalist faculty development program.J Hosp Med.2011;6(3):161–166.

PMI After Hip Fracture Surgery
Perioperative myocardial infarction (PMI) often remains unrecognized with higher mortality in the aged.13 Perioperative ischemic symptoms are often masked by analgesia, sedation, and transient and subtle electrocardiographic (ECG) changes. Postoperative troponin measurement is not routinely done for PMI diagnosis. Hip fracture surgery is the most common non‐cardiac surgical procedure in the elderly, with limited data on clinical presentation of PMI.46 Moreover, the elderly are significantly underrepresented in clinical studies.7 We therefore examined the clinical presentation of PMI and its outcomes among elderly patients admitted for hip fracture repair.
METHODS
Study Population
A population‐based, retrospective, case‐control study was conducted of all residents in Olmsted County, Minnesota undergoing surgery for hip fracture repair from January 1, 1988 through December 31, 2002. Primary indication for the surgery was proximal femur (femoral neck or subtrochanteric) fracture. Patients who were 65 years old, had a pathological hip fracture, multiple injuries or fractures, surgery >72 hours after injury (due to higher mortality with delayed surgery),8 nonsurgical management of hip fracture repair, or incomplete data were excluded. All patients provided prior authorization to use their medical records for research, per institutional protocols.9
Criteria for Perioperative Myocardial Infarction and Death
We utilized the universal definition of acute myocardial infarction10 to define PMI within the first 7 days following hip fracture surgery. We included creatine kinase‐MB fraction (CK‐MB) as the biomarker for 1988July 2000, and troponin as the biomarker for August 20002002. Mortality was defined as death from any cause within the first year following hip fracture repair. Deaths were identified through the National Death Index.
Statistical Analysis
For each case of PMI, we identified 2 control patients who were selected at random from the non‐PMI patient population. These controls were matched to cases based on age at the time of surgery (5 years) and gender in 1:2 ratios. Baseline characteristics across PMI and non‐PMI groups were compared using the Kruskal‐Wallis test (for continuous data) and the chi‐square or Fisher's exact tests (for categorical data). Mean values were utilized in place of the missing values for the following variables: preoperative troponin (missing values 88 [17.5%]), CK‐MB (8 [1.6%]), troponin (21 [5.4%]), and postoperative hemoglobin (17 [3.4%]). Univariate predictors of PMI with P 0.2 baseline characteristics were entered into a multivariate, conditional, logistic regression analysis. Rates of outcomes were calculated using the Kaplan‐Meier method, and by a landmark survival curve for those with and without PMI. Cox proportional hazards analysis was utilized for survival analysis at 30 days and 1 year. All statistical tests were 2‐sided, and P values 0.05 were considered significant. All analyses were performed using SAS for UNIX (version 9.1.3; SAS Institute, Inc, Cary, NC).
RESULTS
In the cohort of 1212 with hip fracture surgeries, 167 (13.8%) cases of PMI occurred in the first 7 days, of which 153 (92%) occurred within the first 48 hours. A total of 334 controls were matched with 167 cases of PMI. Table 1 summarizes the demographic characteristics of the study participants. Of the patients with PMI, 25.2% experienced symptoms of ischemia; 7% reported chest pain, and 12% reported dyspnea. Only 22.8% of patients with PMI had ECG changes consistent with ischemia. ST elevation MI was present in 7.2% patients. PMI patients had a lower mean hemoglobin compared to the patients without PMI (8.9 mg/dL vs 9.4 mg/dL, P 0.001). Median length of stay (LOS) in the hospital was higher among patients who experienced PMI (11.6 vs 7.4 days, P 0.001). Overall in‐hospital mortality was 5.6%. There were 24 deaths (14.4%) in the PMI group compared to 4 (1.2%) in‐hospital deaths in patients without PMI (P 0.001). A total of 473 (94%) patients survived to discharge. At 30‐day follow‐up, there were 29 (17.4%) deaths in the PMI group and 14 (4.2%) deaths in non‐PMI group. During the follow‐up for 1 year, there were 143 (29%) deaths: PMI 66 (39.5%) and 77 (23%) non‐PMI group (P 0.01).
| Characteristics, n (%) | Patients With PMI | Patients Without PMI | P Value* |
|---|---|---|---|
| (N = 167) | (N = 334) | ||
| |||
| Age mean SD | 85.3 7.4 | 85.2 7.1 | 0.5 |
| Weight (kg) mean SD | 59.98 16.7 | 59.80 13.9 | 0.5 |
| Women | 127 (76.4) | 254 (76) | 0.5 |
| Any symptom of ischemia, n (%) | |||
| Chest/arm pain | 11 (7) | 4 (1) | 0.002 |
| Dyspnea | 20 (12) | 14 (4) | 0.001 |
| Nausea/vomiting | 8 (5) | 6 (2) | 0.08 |
| Diaphoresis | 1 (1) | 1 (0.3) | 1.0 |
| PND | 3 (2) | 1 (0.3) | 0.3 |
| ECG changes, n (%) | |||
| ST‐segment elevation MI | 12 (7.2) | 0 | 0.01 |
| New ECG changes consistent with ischemia | 38 (22.8) | 1(0.3) | 0.01 |
| Biochemical evidence of ischemia, n (%) | |||
| CK‐MB | 147 (88) | 20 (6) | 0.01 |
| Troponin | 52 (33) | 9 (3) | 0.001 |
| Laboratory markers | |||
| Hemoglobin gm/dL mean (SD) | 8.9 1.0 | 9.4 1.2 | 0.001 |
| Postoperative anemia (8.0 gm/dL), n (%) | 22 (13.2) | 37 (11.1) | 0.5 |
| Length of stay (days), mean SD | 11.6 7.7 | 7.4 6.4 | 0.001 |
| In‐hospital outcome | 0.001 | ||
| Dead | 24 (14.4) | 4 (1.2) | |
| Alive | 143 (85.6) | 330 (98.8) | |
| 30‐Day outcome | 0.001 | ||
| Dead | 29 (17.4) | 14 (4.2) | |
| Alive | 138 (82.6) | 320 (95.8) | |
| 1‐Year outcome | 0.001 | ||
| Dead | 66 (39.5) | 77 (23) | |
| Alive | 101 (60.4) | 257 (77) | |
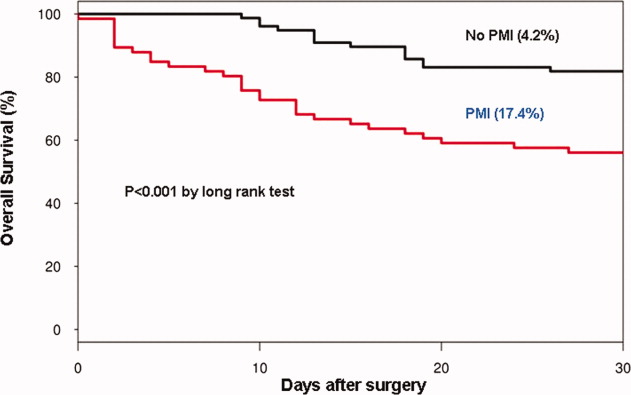
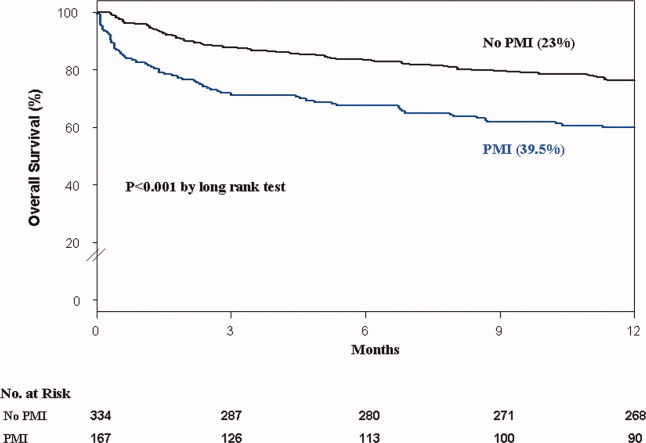
Table 2 describes the risk factors associated with PMI in‐hospital, 30‐day, and 1‐year mortality. Risk factors for PMI were coronary artery disease (CAD) (odds ratio [OR], 3.5; confidence interval [CI], 2.25.6), and serum creatinine >2 mg/dL (OR, 2.4; CI, 1.34.4). Risk factors for in‐hospital mortality were age 8589 (OR, 5.3; CI, 1.617.7), age 90 (OR, 8.9; CI, 2.630.8), PMI (OR 15.1; CI, 4.648.8), male gender (OR 5.8; CI, 2.215.2), dyspnea (OR 5.4; CI, 1.816.9), and hemoglobin 8.0 gm/dL (OR, 3.5; CI, 1.29.9). PMI was a strong predictor for 30‐day mortality (hazard ratio [HR], 4.3; CI, 2.18.9). Risk factors for 1‐year mortality were: age 90 (HR, 2.0; CI, 1.43.1), male gender (HR, 2.1; CI, 1.53.0), and PMI (HR, 1.9; CI, 1.42.7). Figures 1 and 2 describe the Kaplan‐Meier survival curves for patients with and without PMI.
| Unadjusted OR (95% CI) | Adjusted OR (95% CI) | P Value | |
|---|---|---|---|
| |||
| Perioperative myocardial infarction | |||
| Coronary artery disease | 3.0 (2.14.5) | 3.5 (2.25.6) | 0.001 |
| Serum creatinine >2.0 mg/dL | 2.7 (1.64.8) | 2.4 (1.34.4) | 0.003 |
| In‐hospital mortality | |||
| Age 8589 | 1.7 (0.83.7) | 5.3 (1.617.7) | 0.01 |
| Age 90 | 2.2 (1.04.8) | 8.9 (2.630.8) | 0.001 |
| Male gender | 3.0 (1.46.4) | 5.8 (2.215.2) | 0.001 |
| Postoperative anemia (8.0 gm/dL) | 4.2 (1.710.0) | 3.5 (1.29.9) | 0.02 |
| Perioperative myocardial infarction | 14.0 (5.248.0) | 15.1 (4.649.0) | 0.001 |
| 30‐Day mortality | |||
| Perioperative myocardial infarction | 4.1 (2.27.8) | 4.3 (2.18.9) | 0.001 |
| 1‐Year mortality | |||
| Age 8589 | 1.3 (0.81.9) | 1.6 (1.02.4) | 0.03 |
| Age 90 | 1.9 (1.32.9) | 2.0 (1.43.1) | 0.001 |
| Male gender | 1.9 (1.32.6) | 2.1 (1.53.0) | 0.001 |
| Dementia | 2.5 (1.83.6) | 2.7 (1.93.8) | 0.001 |
| Perioperative myocardial infarction | 2.0 (1.52.8) | 1.9 (1.42.7) | 0.001 |
DISCUSSION
We report the high incidence of PMI (13.8%) in the cohort of 1212 elderly patients (mean age 85 years) undergoing hip fracture surgery. Most PMI events (92%) occurred within the first 48 hours of surgery. Most of the events (75%) were asymptomatic. Elderly patients with PMI had an increased hospital LOS by 4.2 days, with high in‐hospital mortality (13.8%), 30‐day mortality (17.4%), and 1‐year mortality (39.5%).
Most of the PMI patients were identified with cardiac biomarkers on the basis of universal definition of MI within the first 48 hours. Although universal definition of MI does not define PMI as a separate type, PMI shares common pathophysiological pathways of Type 1 MI (primary coronary event) and Type 2 MI (myocardial oxygen supplydemand imbalance). Postoperative tachycardia, hemodynamic instability, anemia, and hypoxemia may initiate pathways causing more Type 2 MI. Our study highlights the continued need for active surveillance of clinical symptoms, postoperative ECG monitoring for STT changes, and utilizing cardiac troponin in older postoperative patients to improve diagnostic accuracy of PMI.
The current study has higher asymptomatic PMI events when compared to a study of Devereaux et al.11 The current study had an older population undergoing urgent hip fracture surgery, with a higher burden of CAD (60%) and renal failure (20%) with serum creatinine >2 gm/dL (see Supporting Information, Appendix 1, in the online version of this article). Older age and a higher burden of these risk factors may explain the higher incidence of PMI in the current study. Perioperative liberal use of analgesics in hip fracture surgery may explain more asymptomatic patients.
In light of the recently published FOCUS12 trial, an important finding from our study is that postoperative anemia among elderly (8.0 gm/dL) is associated with a 3.5‐fold increased in‐hospital mortality. It is critical to maintain perioperative hemoglobin above 8.0 gm/dL in very elderly patients, due to asymptomatic presentation of PMI.
In the current study, PMI is associated with a 15‐fold increased risk of in‐hospital death and a 4.3‐fold increased risk of 30‐day mortality in the elderly. Advanced age (85 years) is a well known strong predictor of initial hospital admission and death in elderly patients after outpatient surgery.13 Furthermore, the odds for an in‐hospital death increase by 70% for each 10‐year increase in age.14 Therefore, early detection of silent PMI among at‐risk elderly patients by cardiac biomarkers may help in optimization of cardiac pharmacotherapy known to decrease short‐ and long‐term mortality.
There are limitations inherent to the retrospective design and methodology. Data collection was done through the year 2002. CK was used for the period that spans from 1988 to mid‐2000. Troponin was used from 2000 to 2002. Statin use was not analyzed for lack of significant data. Limited use of beta‐blockers (15%) and angiotensin‐converting‐enzyme (ACE) inhibitors (25%) may also contribute to higher events (see Supporting Information, Appendix 1, in the online version of this article).
CONCLUSIONS
Elderly patients have a higher incidence of PMI and mortality after hip fracture surgery than what guidelines indicate. The majority of the elderly patients with PMI did not experience ischemic symptoms and required cardiac biomarkers for diagnosis. The results of our study support the measurement of troponin in postoperative elderly patients for the diagnosis of PMI to implement in‐hospital preventive strategies to reduce PMI‐associated mortality.
Acknowledgements
The authors gratefully acknowledge the assistance of Ms Dawn Bergen in drafting and editing the manuscript.
Disclosures: This research was supported by funding from AHA grant 03‐30103N‐04, Rochester Epidemiology Project (grant RO1‐AR30582 from the National Institute of Arthritis and Musculoskeletal and Skin Diseases). The project was also supported by the National Center for Research Resources and the National Center for Advancing Translational Sciences, National Institutes of Health, through grant UL1 RR024150. The content is solely the responsibility of the authors and does not necessarily represent the official views of the NIH.
- , , , et al. Impact of age on perioperative complications and length of stay in patients undergoing noncardiac surgery. Ann Intern Med. 2001;134(8):637–643.
- , , , et al. Meta‐analysis: excess mortality after hip fracture among older women and men. Ann Intern Med. 2010;152(6):380–390.
- , , , et al. Body mass index (BMI) and risk of noncardiac postoperative medical complications in elderly hip fracture patients: a population‐based study. J Hosp Med. 2009;4(8):E1–E9.
- . History of the Rochester Epidemiology Project. Mayo Clin Proc. 1996;71(3):266–274.
- , , , . Incidence and mortality of hip fractures in the United States. JAMA. 2009;302(14):1573–1579.
- , , , et al. Body mass index and risk of adverse cardiac events in elderly patients with hip fracture: a population‐based study. J Am Geriatr Soc. 2009;57(3):419–426.
- , , , et al. Acute coronary care in the elderly, part I. Non‐ST‐segment‐elevation acute coronary syndromes: a scientific statement for healthcare professionals from the American Heart Association Council on Clinical Cardiology: in collaboration with the Society of Geriatric Cardiology. Circulation. 2007;115(19):2549–2569.
- , . Hip fracture mortality. A prospective, multifactorial study to predict and minimize death risk. Clin Orthop Relat Res. 1992;280:214–222.
- , , , et al. ACC/AHA/ACP‐ASIM guidelines for the management of patients with chronic stable angina. J Am Coll Cardiol. 1999;33(7):2092–2190.
- , , ; for the Joint ESC/ACCF/AHA/WHF Task Force for the Redefinition of Myocardial Infarction. Universal definition of myocardial infarction. J Am Coll Cardiol. 2007;50(22):2173–2195.
- , , , et al. Characteristics and short‐term prognosis of perioperative myocardial infarction in patients undergoing noncardiac surgery. Ann Intern Med. 2011;154(8):523–528.
- , , , et al. Liberal or restrictive transfusion in high‐risk patients after hip surgery. N Engl J Med. 2011;365(26):2453–2462.
- , , , . Inpatient hospital admission and death after outpatient surgery in elderly patients: importance of patient and system characteristics and location of care. Arch Surg. 2004;139(1):67–72.
- , , , et al. Predictors of hospital mortality in the global registry of acute coronary events. Arch Intern Med. 2003;163(19):2345–2353.
Perioperative myocardial infarction (PMI) often remains unrecognized with higher mortality in the aged.13 Perioperative ischemic symptoms are often masked by analgesia, sedation, and transient and subtle electrocardiographic (ECG) changes. Postoperative troponin measurement is not routinely done for PMI diagnosis. Hip fracture surgery is the most common non‐cardiac surgical procedure in the elderly, with limited data on clinical presentation of PMI.46 Moreover, the elderly are significantly underrepresented in clinical studies.7 We therefore examined the clinical presentation of PMI and its outcomes among elderly patients admitted for hip fracture repair.
METHODS
Study Population
A population‐based, retrospective, case‐control study was conducted of all residents in Olmsted County, Minnesota undergoing surgery for hip fracture repair from January 1, 1988 through December 31, 2002. Primary indication for the surgery was proximal femur (femoral neck or subtrochanteric) fracture. Patients who were 65 years old, had a pathological hip fracture, multiple injuries or fractures, surgery >72 hours after injury (due to higher mortality with delayed surgery),8 nonsurgical management of hip fracture repair, or incomplete data were excluded. All patients provided prior authorization to use their medical records for research, per institutional protocols.9
Criteria for Perioperative Myocardial Infarction and Death
We utilized the universal definition of acute myocardial infarction10 to define PMI within the first 7 days following hip fracture surgery. We included creatine kinase‐MB fraction (CK‐MB) as the biomarker for 1988July 2000, and troponin as the biomarker for August 20002002. Mortality was defined as death from any cause within the first year following hip fracture repair. Deaths were identified through the National Death Index.
Statistical Analysis
For each case of PMI, we identified 2 control patients who were selected at random from the non‐PMI patient population. These controls were matched to cases based on age at the time of surgery (5 years) and gender in 1:2 ratios. Baseline characteristics across PMI and non‐PMI groups were compared using the Kruskal‐Wallis test (for continuous data) and the chi‐square or Fisher's exact tests (for categorical data). Mean values were utilized in place of the missing values for the following variables: preoperative troponin (missing values 88 [17.5%]), CK‐MB (8 [1.6%]), troponin (21 [5.4%]), and postoperative hemoglobin (17 [3.4%]). Univariate predictors of PMI with P 0.2 baseline characteristics were entered into a multivariate, conditional, logistic regression analysis. Rates of outcomes were calculated using the Kaplan‐Meier method, and by a landmark survival curve for those with and without PMI. Cox proportional hazards analysis was utilized for survival analysis at 30 days and 1 year. All statistical tests were 2‐sided, and P values 0.05 were considered significant. All analyses were performed using SAS for UNIX (version 9.1.3; SAS Institute, Inc, Cary, NC).
RESULTS
In the cohort of 1212 with hip fracture surgeries, 167 (13.8%) cases of PMI occurred in the first 7 days, of which 153 (92%) occurred within the first 48 hours. A total of 334 controls were matched with 167 cases of PMI. Table 1 summarizes the demographic characteristics of the study participants. Of the patients with PMI, 25.2% experienced symptoms of ischemia; 7% reported chest pain, and 12% reported dyspnea. Only 22.8% of patients with PMI had ECG changes consistent with ischemia. ST elevation MI was present in 7.2% patients. PMI patients had a lower mean hemoglobin compared to the patients without PMI (8.9 mg/dL vs 9.4 mg/dL, P 0.001). Median length of stay (LOS) in the hospital was higher among patients who experienced PMI (11.6 vs 7.4 days, P 0.001). Overall in‐hospital mortality was 5.6%. There were 24 deaths (14.4%) in the PMI group compared to 4 (1.2%) in‐hospital deaths in patients without PMI (P 0.001). A total of 473 (94%) patients survived to discharge. At 30‐day follow‐up, there were 29 (17.4%) deaths in the PMI group and 14 (4.2%) deaths in non‐PMI group. During the follow‐up for 1 year, there were 143 (29%) deaths: PMI 66 (39.5%) and 77 (23%) non‐PMI group (P 0.01).
| Characteristics, n (%) | Patients With PMI | Patients Without PMI | P Value* |
|---|---|---|---|
| (N = 167) | (N = 334) | ||
| |||
| Age mean SD | 85.3 7.4 | 85.2 7.1 | 0.5 |
| Weight (kg) mean SD | 59.98 16.7 | 59.80 13.9 | 0.5 |
| Women | 127 (76.4) | 254 (76) | 0.5 |
| Any symptom of ischemia, n (%) | |||
| Chest/arm pain | 11 (7) | 4 (1) | 0.002 |
| Dyspnea | 20 (12) | 14 (4) | 0.001 |
| Nausea/vomiting | 8 (5) | 6 (2) | 0.08 |
| Diaphoresis | 1 (1) | 1 (0.3) | 1.0 |
| PND | 3 (2) | 1 (0.3) | 0.3 |
| ECG changes, n (%) | |||
| ST‐segment elevation MI | 12 (7.2) | 0 | 0.01 |
| New ECG changes consistent with ischemia | 38 (22.8) | 1(0.3) | 0.01 |
| Biochemical evidence of ischemia, n (%) | |||
| CK‐MB | 147 (88) | 20 (6) | 0.01 |
| Troponin | 52 (33) | 9 (3) | 0.001 |
| Laboratory markers | |||
| Hemoglobin gm/dL mean (SD) | 8.9 1.0 | 9.4 1.2 | 0.001 |
| Postoperative anemia (8.0 gm/dL), n (%) | 22 (13.2) | 37 (11.1) | 0.5 |
| Length of stay (days), mean SD | 11.6 7.7 | 7.4 6.4 | 0.001 |
| In‐hospital outcome | 0.001 | ||
| Dead | 24 (14.4) | 4 (1.2) | |
| Alive | 143 (85.6) | 330 (98.8) | |
| 30‐Day outcome | 0.001 | ||
| Dead | 29 (17.4) | 14 (4.2) | |
| Alive | 138 (82.6) | 320 (95.8) | |
| 1‐Year outcome | 0.001 | ||
| Dead | 66 (39.5) | 77 (23) | |
| Alive | 101 (60.4) | 257 (77) | |
Table 2 describes the risk factors associated with PMI in‐hospital, 30‐day, and 1‐year mortality. Risk factors for PMI were coronary artery disease (CAD) (odds ratio [OR], 3.5; confidence interval [CI], 2.25.6), and serum creatinine >2 mg/dL (OR, 2.4; CI, 1.34.4). Risk factors for in‐hospital mortality were age 8589 (OR, 5.3; CI, 1.617.7), age 90 (OR, 8.9; CI, 2.630.8), PMI (OR 15.1; CI, 4.648.8), male gender (OR 5.8; CI, 2.215.2), dyspnea (OR 5.4; CI, 1.816.9), and hemoglobin 8.0 gm/dL (OR, 3.5; CI, 1.29.9). PMI was a strong predictor for 30‐day mortality (hazard ratio [HR], 4.3; CI, 2.18.9). Risk factors for 1‐year mortality were: age 90 (HR, 2.0; CI, 1.43.1), male gender (HR, 2.1; CI, 1.53.0), and PMI (HR, 1.9; CI, 1.42.7). Figures 1 and 2 describe the Kaplan‐Meier survival curves for patients with and without PMI.
| Unadjusted OR (95% CI) | Adjusted OR (95% CI) | P Value | |
|---|---|---|---|
| |||
| Perioperative myocardial infarction | |||
| Coronary artery disease | 3.0 (2.14.5) | 3.5 (2.25.6) | 0.001 |
| Serum creatinine >2.0 mg/dL | 2.7 (1.64.8) | 2.4 (1.34.4) | 0.003 |
| In‐hospital mortality | |||
| Age 8589 | 1.7 (0.83.7) | 5.3 (1.617.7) | 0.01 |
| Age 90 | 2.2 (1.04.8) | 8.9 (2.630.8) | 0.001 |
| Male gender | 3.0 (1.46.4) | 5.8 (2.215.2) | 0.001 |
| Postoperative anemia (8.0 gm/dL) | 4.2 (1.710.0) | 3.5 (1.29.9) | 0.02 |
| Perioperative myocardial infarction | 14.0 (5.248.0) | 15.1 (4.649.0) | 0.001 |
| 30‐Day mortality | |||
| Perioperative myocardial infarction | 4.1 (2.27.8) | 4.3 (2.18.9) | 0.001 |
| 1‐Year mortality | |||
| Age 8589 | 1.3 (0.81.9) | 1.6 (1.02.4) | 0.03 |
| Age 90 | 1.9 (1.32.9) | 2.0 (1.43.1) | 0.001 |
| Male gender | 1.9 (1.32.6) | 2.1 (1.53.0) | 0.001 |
| Dementia | 2.5 (1.83.6) | 2.7 (1.93.8) | 0.001 |
| Perioperative myocardial infarction | 2.0 (1.52.8) | 1.9 (1.42.7) | 0.001 |
DISCUSSION
We report the high incidence of PMI (13.8%) in the cohort of 1212 elderly patients (mean age 85 years) undergoing hip fracture surgery. Most PMI events (92%) occurred within the first 48 hours of surgery. Most of the events (75%) were asymptomatic. Elderly patients with PMI had an increased hospital LOS by 4.2 days, with high in‐hospital mortality (13.8%), 30‐day mortality (17.4%), and 1‐year mortality (39.5%).
Most of the PMI patients were identified with cardiac biomarkers on the basis of universal definition of MI within the first 48 hours. Although universal definition of MI does not define PMI as a separate type, PMI shares common pathophysiological pathways of Type 1 MI (primary coronary event) and Type 2 MI (myocardial oxygen supplydemand imbalance). Postoperative tachycardia, hemodynamic instability, anemia, and hypoxemia may initiate pathways causing more Type 2 MI. Our study highlights the continued need for active surveillance of clinical symptoms, postoperative ECG monitoring for STT changes, and utilizing cardiac troponin in older postoperative patients to improve diagnostic accuracy of PMI.
The current study has higher asymptomatic PMI events when compared to a study of Devereaux et al.11 The current study had an older population undergoing urgent hip fracture surgery, with a higher burden of CAD (60%) and renal failure (20%) with serum creatinine >2 gm/dL (see Supporting Information, Appendix 1, in the online version of this article). Older age and a higher burden of these risk factors may explain the higher incidence of PMI in the current study. Perioperative liberal use of analgesics in hip fracture surgery may explain more asymptomatic patients.
In light of the recently published FOCUS12 trial, an important finding from our study is that postoperative anemia among elderly (8.0 gm/dL) is associated with a 3.5‐fold increased in‐hospital mortality. It is critical to maintain perioperative hemoglobin above 8.0 gm/dL in very elderly patients, due to asymptomatic presentation of PMI.
In the current study, PMI is associated with a 15‐fold increased risk of in‐hospital death and a 4.3‐fold increased risk of 30‐day mortality in the elderly. Advanced age (85 years) is a well known strong predictor of initial hospital admission and death in elderly patients after outpatient surgery.13 Furthermore, the odds for an in‐hospital death increase by 70% for each 10‐year increase in age.14 Therefore, early detection of silent PMI among at‐risk elderly patients by cardiac biomarkers may help in optimization of cardiac pharmacotherapy known to decrease short‐ and long‐term mortality.
There are limitations inherent to the retrospective design and methodology. Data collection was done through the year 2002. CK was used for the period that spans from 1988 to mid‐2000. Troponin was used from 2000 to 2002. Statin use was not analyzed for lack of significant data. Limited use of beta‐blockers (15%) and angiotensin‐converting‐enzyme (ACE) inhibitors (25%) may also contribute to higher events (see Supporting Information, Appendix 1, in the online version of this article).
CONCLUSIONS
Elderly patients have a higher incidence of PMI and mortality after hip fracture surgery than what guidelines indicate. The majority of the elderly patients with PMI did not experience ischemic symptoms and required cardiac biomarkers for diagnosis. The results of our study support the measurement of troponin in postoperative elderly patients for the diagnosis of PMI to implement in‐hospital preventive strategies to reduce PMI‐associated mortality.
Acknowledgements
The authors gratefully acknowledge the assistance of Ms Dawn Bergen in drafting and editing the manuscript.
Disclosures: This research was supported by funding from AHA grant 03‐30103N‐04, Rochester Epidemiology Project (grant RO1‐AR30582 from the National Institute of Arthritis and Musculoskeletal and Skin Diseases). The project was also supported by the National Center for Research Resources and the National Center for Advancing Translational Sciences, National Institutes of Health, through grant UL1 RR024150. The content is solely the responsibility of the authors and does not necessarily represent the official views of the NIH.
- , , , et al. Impact of age on perioperative complications and length of stay in patients undergoing noncardiac surgery. Ann Intern Med. 2001;134(8):637–643.
- , , , et al. Meta‐analysis: excess mortality after hip fracture among older women and men. Ann Intern Med. 2010;152(6):380–390.
- , , , et al. Body mass index (BMI) and risk of noncardiac postoperative medical complications in elderly hip fracture patients: a population‐based study. J Hosp Med. 2009;4(8):E1–E9.
- . History of the Rochester Epidemiology Project. Mayo Clin Proc. 1996;71(3):266–274.
- , , , . Incidence and mortality of hip fractures in the United States. JAMA. 2009;302(14):1573–1579.
- , , , et al. Body mass index and risk of adverse cardiac events in elderly patients with hip fracture: a population‐based study. J Am Geriatr Soc. 2009;57(3):419–426.
- , , , et al. Acute coronary care in the elderly, part I. Non‐ST‐segment‐elevation acute coronary syndromes: a scientific statement for healthcare professionals from the American Heart Association Council on Clinical Cardiology: in collaboration with the Society of Geriatric Cardiology. Circulation. 2007;115(19):2549–2569.
- , . Hip fracture mortality. A prospective, multifactorial study to predict and minimize death risk. Clin Orthop Relat Res. 1992;280:214–222.
- , , , et al. ACC/AHA/ACP‐ASIM guidelines for the management of patients with chronic stable angina. J Am Coll Cardiol. 1999;33(7):2092–2190.
- , , ; for the Joint ESC/ACCF/AHA/WHF Task Force for the Redefinition of Myocardial Infarction. Universal definition of myocardial infarction. J Am Coll Cardiol. 2007;50(22):2173–2195.
- , , , et al. Characteristics and short‐term prognosis of perioperative myocardial infarction in patients undergoing noncardiac surgery. Ann Intern Med. 2011;154(8):523–528.
- , , , et al. Liberal or restrictive transfusion in high‐risk patients after hip surgery. N Engl J Med. 2011;365(26):2453–2462.
- , , , . Inpatient hospital admission and death after outpatient surgery in elderly patients: importance of patient and system characteristics and location of care. Arch Surg. 2004;139(1):67–72.
- , , , et al. Predictors of hospital mortality in the global registry of acute coronary events. Arch Intern Med. 2003;163(19):2345–2353.

Survey of Hospitalist Supervision
In 2003, the Accreditation Council for Graduate Medical Education (ACGME) announced the first in a series of guidelines related to the regulation and oversight of residency training.1 The initial iteration specifically focused on the total and consecutive numbers of duty hours worked by trainees. These limitations began a new era of shift work in internal medicine residency training. With decreases in housestaff admitting capacity, clinical work has frequently been offloaded to non‐teaching or attending‐only services, increasing the demand for hospitalists to fill the void in physician‐staffed care in the hospital.2, 3 Since the implementation of the 2003 ACGME guidelines and a growing focus on patient safety, there has been increased study of, and call for, oversight of trainees in medicine; among these was the 2008 Institute of Medicine report,4 calling for 24/7 attending‐level supervision. The updated ACGME requirements,5 effective July 1, 2011, mandate enhanced on‐site supervision of trainee physicians. These new regulations not only define varying levels of supervision for trainees, including direct supervision with the physical presence of a supervisor and the degree of availability of said supervisor, they also describe ensuring the quality of supervision provided.5 While continuous attending‐level supervision is not yet mandated, many residency programs look to their academic hospitalists to fill the supervisory void, particularly at night. However, what specific roles hospitalists play in the nighttime supervision of trainees or the impact of this supervision remains unclear. To date, no study has examined a broad sample of hospitalist programs in teaching hospitals and the types of resident oversight they provide. We aimed to describe the current state of academic hospitalists in the clinical supervision of housestaff, specifically during the overnight period, and hospitalist perceptions of how the new ACGME requirements would impact traineehospitalist interactions.
METHODS
The Housestaff Oversight Subcommittee, a working group of the Society of General Internal Medicine (SGIM) Academic Hospitalist Task Force, surveyed a sample of academic hospitalist program leaders to assess the current status of trainee supervision performed by hospitalists. Programs were considered academic if they were located in the primary hospital of a residency that participates in the National Resident Matching Program for Internal Medicine. To obtain a broad geographic spectrum of academic hospitalist programs, all programs, both university and community‐based, in 4 states and 2 metropolitan regions were sampled: Washington, Oregon, Texas, Maryland, and the Philadelphia and Chicago metropolitan areas. Hospitalist program leaders were identified by members of the Taskforce using individual program websites and by querying departmental leadership at eligible teaching hospitals. Respondents were contacted by e‐mail for participation. None of the authors of the manuscript were participants in the survey.
The survey was developed by consensus of the working group after reviewing the salient literature and included additional questions queried to internal medicine program directors.6 The 19‐item SurveyMonkey instrument included questions about hospitalists' role in trainees' education and evaluation. A Likert‐type scale was used to assess perceptions regarding the impact of on‐site hospitalist supervision on trainee autonomy and hospitalist workload (1 = strongly disagree to 5 = strongly agree). Descriptive statistics were performed and, where appropriate, t test and Fisher's exact test were performed to identify associations between program characteristics and perceptions. Stata SE was used (STATA Corp, College Station, TX) for all statistical analysis.
RESULTS
The survey was sent to 47 individuals identified as likely hospitalist program leaders and completed by 41 individuals (87%). However, 7 respondents turned out not to be program leaders and were therefore excluded, resulting in a 72% (34/47) survey response rate.
The programs for which we did not obtain responses were similar to respondent programs, and did not include a larger proportion of community‐based programs or overrepresent a specific geographic region. Twenty‐five (73%) of the 34 hospitalist program leaders were male, with an average age of 44.3 years, and an average of 12 years post‐residency training (range, 530 years). They reported leading groups with an average of 18 full‐time equivalent (FTE) faculty (range, 350 persons).
Relationship of Hospitalist Programs With the Residency Program
The majority (32/34, 94%) of respondents describe their program as having traditional housestaffhospitalist interactions on an attending‐covered housestaff teaching service. Other hospitalists' clinical roles included: attending on uncovered (non‐housestaff services; 29/34, 85%); nighttime coverage (24/34, 70%); attending on consult services with housestaff (24/34, 70%). All respondents reported that hospitalist faculty are expected to participate in housestaff teaching or to fulfill other educational roles within the residency training program. These educational roles include participating in didactics or educational conferences, and serving as advisors. Additionally, the faculty of 30 (88%) programs have a formal evaluative role over the housestaff they supervise on teaching services (eg, members of formal housestaff evaluation committee). Finally, 28 (82%) programs have faculty who play administrative roles in the residency programs, such as involvement in program leadership or recruitment. Although 63% of the corresponding internal medicine residency programs have a formal housestaff supervision policy, only 43% of program leaders stated that their hospitalists receive formal faculty development on how to provide this supervision to resident trainees. Instead, the majority of hospitalist programs were described as having teaching expectations in the absence of a formal policy.
Twenty‐one programs (21/34, 61%) described having an attending hospitalist physician on‐site overnight to provide ongoing patient care or admit new patients. Of those with on‐site attending coverage, a minority of programs (8/21, 38%) reported having a formal defined supervisory role of housestaff trainees for hospitalists during the overnight period. In these 8 programs, this defined role included a requirement for housestaff to present newly admitted patients or contact hospitalists with questions regarding patient management. Twenty‐four percent (5/21) of the programs with nighttime coverage stated that the role of the nocturnal attending was only to cover the non‐teaching services, without housestaff interaction or supervision. The remainder of programs (8/21, 38%) describe only informal interactions between housestaff and hospitalist faculty, without clearly defined expectations for supervision.
Perceptions of New Regulations and Night Work
Hospitalist leaders viewed increased supervision of housestaff both positively and negatively. Leaders were asked their level of agreement with the potential impact of increased hospitalist nighttime supervision. Of respondents, 85% (27/32) agreed that formal overnight supervision by an attending hospitalist would improve patient safety, and 60% (20/33) agreed that formal overnight supervision would improve traineehospitalist relationships. In addition, 60% (20/33) of respondents felt that nighttime supervision of housestaff by faculty hospitalists would improve resident education. However, approximately 40% (13/33) expressed concern that increased on‐site hospitalist supervision would hamper resident decision‐making autonomy, and 75% (25/33) agreed that a formal housestaff supervisory role would increase hospitalist work load. The perception of increased workload was influenced by a hospitalist program's current supervisory role. Hospitalists programs providing formal nighttime supervision for housestaff, compared to those with informal or poorly defined faculty roles, were less likely to perceive these new regulations as resulting in an increase in hospitalist workload (3.72 vs 4.42; P = 0.02). In addition, hospitalist programs with a formal nighttime role were more likely to identify lack of specific parameters for attending‐level contact as a barrier to residents not contacting their supervisors during the overnight period (2.54 vs 3.54; P = 0.03). No differences in perception of the regulations were noted for those hospitalist programs which had existing faculty development on clinical supervision.
DISCUSSION
This study provides important information about how academic hospitalists currently contribute to the supervision of internal medicine residents. While academic hospitalist groups frequently have faculty providing clinical care on‐site at night, and often hospitalists provide overnight supervision of internal medicine trainees, formal supervision of trainees is not uniform, and few hospitalists groups have a mechanism to provide training or faculty development on how to effectively supervise resident trainees. Hospitalist leaders expressed concerns that creating additional formal overnight supervisory responsibilities may add to an already burdened overnight hospitalist. Formalizing this supervisory role, including explicit role definitions and faculty training for trainee supervision, is necessary.
Though our sample size is small, we captured a diverse geographic range of both university and community‐based academic hospitalist programs by surveying group leaders in several distinct regions. We are unable to comment on differences between responding and non‐responding hospitalist programs, but there does not appear to be a systematic difference between these groups.
Our findings are consistent with work describing a lack of structured conceptual frameworks in effectively supervising trainees,7, 8 and also, at times, nebulous expectations for hospitalist faculty. We found that the existence of a formal supervisory policy within the associated residency program, as well as defined roles for hospitalists, increases the likelihood of positive perceptions of the new ACGME supervisory recommendations. However, the existence of these requirements does not mean that all programs are capable of following them. While additional discussion is required to best delineate a formal overnight hospitalist role in trainee supervision, clearly defining expectations for both faculty and trainees, and their interactions, may alleviate the struggles that exist in programs with ill‐defined roles for hospitalist faculty supervision. While faculty duty hours standards do not exist, additional duties of nighttime coverage for hospitalists suggests that close attention should be paid to burn‐out.9 Faculty development on nighttime supervision and teaching may help maximize both learning and patient care efficiency, and provide a framework for this often unstructured educational time.
Acknowledgements
The research reported here was supported by the Department of Veterans Affairs, Veterans Health Administration, Health Services Research and Development Service (REA 05‐129, CDA 07‐022). The views expressed in this article are those of the authors and do not necessarily reflect the position or policy of the Department of Veterans Affairs.
- ,,.New requirements for resident duty hours.JAMA.2002;288:1112–1114.
- ,,,,.Cost implications of reduced work hours and workloads for resident physicians.N Engl J Med.2009;360:2202–2215.
- Why have working hour restrictions apparently not improved patient safety?BMJ.2011;342:d1200.
- Ulmer C, Wolman DM, Johns MME, eds.Resident Duty Hours: Enhancing Sleep, Supervision, and Safety.Washington, DC:National Academies Press;2008.
- ,,;for the ACGME Duty Hour Task Force.The new recommendations on duty hours from the ACGME Task Force.N Engl J Med.2010;363.
- Association of Program Directors in Internal Medicine (APDIM) Survey 2009. Available at: http://www.im.org/toolbox/surveys/SurveyDataand Reports/APDIMSurveyData/Documents/2009_APDIM_summary_web. pdf. Accessed on July 30, 2012.
- ,,,,.Clinical oversight: conceptualizing the relationship between supervision and safety.J Gen Intern Med.2007;22(8):1080–1085.
- ,,, et al.Strategies for effective on‐call supervision for internal medicine residents: the SUPERB/SAFETY model.J Grad Med Educ.2010;2(1):46–52.
- ,,,,,.Career satisfaction and burn‐out in academic hospital medicine.Arch Intern Med.2011;171(8):782–785.
In 2003, the Accreditation Council for Graduate Medical Education (ACGME) announced the first in a series of guidelines related to the regulation and oversight of residency training.1 The initial iteration specifically focused on the total and consecutive numbers of duty hours worked by trainees. These limitations began a new era of shift work in internal medicine residency training. With decreases in housestaff admitting capacity, clinical work has frequently been offloaded to non‐teaching or attending‐only services, increasing the demand for hospitalists to fill the void in physician‐staffed care in the hospital.2, 3 Since the implementation of the 2003 ACGME guidelines and a growing focus on patient safety, there has been increased study of, and call for, oversight of trainees in medicine; among these was the 2008 Institute of Medicine report,4 calling for 24/7 attending‐level supervision. The updated ACGME requirements,5 effective July 1, 2011, mandate enhanced on‐site supervision of trainee physicians. These new regulations not only define varying levels of supervision for trainees, including direct supervision with the physical presence of a supervisor and the degree of availability of said supervisor, they also describe ensuring the quality of supervision provided.5 While continuous attending‐level supervision is not yet mandated, many residency programs look to their academic hospitalists to fill the supervisory void, particularly at night. However, what specific roles hospitalists play in the nighttime supervision of trainees or the impact of this supervision remains unclear. To date, no study has examined a broad sample of hospitalist programs in teaching hospitals and the types of resident oversight they provide. We aimed to describe the current state of academic hospitalists in the clinical supervision of housestaff, specifically during the overnight period, and hospitalist perceptions of how the new ACGME requirements would impact traineehospitalist interactions.
METHODS
The Housestaff Oversight Subcommittee, a working group of the Society of General Internal Medicine (SGIM) Academic Hospitalist Task Force, surveyed a sample of academic hospitalist program leaders to assess the current status of trainee supervision performed by hospitalists. Programs were considered academic if they were located in the primary hospital of a residency that participates in the National Resident Matching Program for Internal Medicine. To obtain a broad geographic spectrum of academic hospitalist programs, all programs, both university and community‐based, in 4 states and 2 metropolitan regions were sampled: Washington, Oregon, Texas, Maryland, and the Philadelphia and Chicago metropolitan areas. Hospitalist program leaders were identified by members of the Taskforce using individual program websites and by querying departmental leadership at eligible teaching hospitals. Respondents were contacted by e‐mail for participation. None of the authors of the manuscript were participants in the survey.
The survey was developed by consensus of the working group after reviewing the salient literature and included additional questions queried to internal medicine program directors.6 The 19‐item SurveyMonkey instrument included questions about hospitalists' role in trainees' education and evaluation. A Likert‐type scale was used to assess perceptions regarding the impact of on‐site hospitalist supervision on trainee autonomy and hospitalist workload (1 = strongly disagree to 5 = strongly agree). Descriptive statistics were performed and, where appropriate, t test and Fisher's exact test were performed to identify associations between program characteristics and perceptions. Stata SE was used (STATA Corp, College Station, TX) for all statistical analysis.
RESULTS
The survey was sent to 47 individuals identified as likely hospitalist program leaders and completed by 41 individuals (87%). However, 7 respondents turned out not to be program leaders and were therefore excluded, resulting in a 72% (34/47) survey response rate.
The programs for which we did not obtain responses were similar to respondent programs, and did not include a larger proportion of community‐based programs or overrepresent a specific geographic region. Twenty‐five (73%) of the 34 hospitalist program leaders were male, with an average age of 44.3 years, and an average of 12 years post‐residency training (range, 530 years). They reported leading groups with an average of 18 full‐time equivalent (FTE) faculty (range, 350 persons).
Relationship of Hospitalist Programs With the Residency Program
The majority (32/34, 94%) of respondents describe their program as having traditional housestaffhospitalist interactions on an attending‐covered housestaff teaching service. Other hospitalists' clinical roles included: attending on uncovered (non‐housestaff services; 29/34, 85%); nighttime coverage (24/34, 70%); attending on consult services with housestaff (24/34, 70%). All respondents reported that hospitalist faculty are expected to participate in housestaff teaching or to fulfill other educational roles within the residency training program. These educational roles include participating in didactics or educational conferences, and serving as advisors. Additionally, the faculty of 30 (88%) programs have a formal evaluative role over the housestaff they supervise on teaching services (eg, members of formal housestaff evaluation committee). Finally, 28 (82%) programs have faculty who play administrative roles in the residency programs, such as involvement in program leadership or recruitment. Although 63% of the corresponding internal medicine residency programs have a formal housestaff supervision policy, only 43% of program leaders stated that their hospitalists receive formal faculty development on how to provide this supervision to resident trainees. Instead, the majority of hospitalist programs were described as having teaching expectations in the absence of a formal policy.
Twenty‐one programs (21/34, 61%) described having an attending hospitalist physician on‐site overnight to provide ongoing patient care or admit new patients. Of those with on‐site attending coverage, a minority of programs (8/21, 38%) reported having a formal defined supervisory role of housestaff trainees for hospitalists during the overnight period. In these 8 programs, this defined role included a requirement for housestaff to present newly admitted patients or contact hospitalists with questions regarding patient management. Twenty‐four percent (5/21) of the programs with nighttime coverage stated that the role of the nocturnal attending was only to cover the non‐teaching services, without housestaff interaction or supervision. The remainder of programs (8/21, 38%) describe only informal interactions between housestaff and hospitalist faculty, without clearly defined expectations for supervision.
Perceptions of New Regulations and Night Work
Hospitalist leaders viewed increased supervision of housestaff both positively and negatively. Leaders were asked their level of agreement with the potential impact of increased hospitalist nighttime supervision. Of respondents, 85% (27/32) agreed that formal overnight supervision by an attending hospitalist would improve patient safety, and 60% (20/33) agreed that formal overnight supervision would improve traineehospitalist relationships. In addition, 60% (20/33) of respondents felt that nighttime supervision of housestaff by faculty hospitalists would improve resident education. However, approximately 40% (13/33) expressed concern that increased on‐site hospitalist supervision would hamper resident decision‐making autonomy, and 75% (25/33) agreed that a formal housestaff supervisory role would increase hospitalist work load. The perception of increased workload was influenced by a hospitalist program's current supervisory role. Hospitalists programs providing formal nighttime supervision for housestaff, compared to those with informal or poorly defined faculty roles, were less likely to perceive these new regulations as resulting in an increase in hospitalist workload (3.72 vs 4.42; P = 0.02). In addition, hospitalist programs with a formal nighttime role were more likely to identify lack of specific parameters for attending‐level contact as a barrier to residents not contacting their supervisors during the overnight period (2.54 vs 3.54; P = 0.03). No differences in perception of the regulations were noted for those hospitalist programs which had existing faculty development on clinical supervision.
DISCUSSION
This study provides important information about how academic hospitalists currently contribute to the supervision of internal medicine residents. While academic hospitalist groups frequently have faculty providing clinical care on‐site at night, and often hospitalists provide overnight supervision of internal medicine trainees, formal supervision of trainees is not uniform, and few hospitalists groups have a mechanism to provide training or faculty development on how to effectively supervise resident trainees. Hospitalist leaders expressed concerns that creating additional formal overnight supervisory responsibilities may add to an already burdened overnight hospitalist. Formalizing this supervisory role, including explicit role definitions and faculty training for trainee supervision, is necessary.
Though our sample size is small, we captured a diverse geographic range of both university and community‐based academic hospitalist programs by surveying group leaders in several distinct regions. We are unable to comment on differences between responding and non‐responding hospitalist programs, but there does not appear to be a systematic difference between these groups.
Our findings are consistent with work describing a lack of structured conceptual frameworks in effectively supervising trainees,7, 8 and also, at times, nebulous expectations for hospitalist faculty. We found that the existence of a formal supervisory policy within the associated residency program, as well as defined roles for hospitalists, increases the likelihood of positive perceptions of the new ACGME supervisory recommendations. However, the existence of these requirements does not mean that all programs are capable of following them. While additional discussion is required to best delineate a formal overnight hospitalist role in trainee supervision, clearly defining expectations for both faculty and trainees, and their interactions, may alleviate the struggles that exist in programs with ill‐defined roles for hospitalist faculty supervision. While faculty duty hours standards do not exist, additional duties of nighttime coverage for hospitalists suggests that close attention should be paid to burn‐out.9 Faculty development on nighttime supervision and teaching may help maximize both learning and patient care efficiency, and provide a framework for this often unstructured educational time.
Acknowledgements
The research reported here was supported by the Department of Veterans Affairs, Veterans Health Administration, Health Services Research and Development Service (REA 05‐129, CDA 07‐022). The views expressed in this article are those of the authors and do not necessarily reflect the position or policy of the Department of Veterans Affairs.
- ,,.New requirements for resident duty hours.JAMA.2002;288:1112–1114.
- ,,,,.Cost implications of reduced work hours and workloads for resident physicians.N Engl J Med.2009;360:2202–2215.
- Why have working hour restrictions apparently not improved patient safety?BMJ.2011;342:d1200.
- Ulmer C, Wolman DM, Johns MME, eds.Resident Duty Hours: Enhancing Sleep, Supervision, and Safety.Washington, DC:National Academies Press;2008.
- ,,;for the ACGME Duty Hour Task Force.The new recommendations on duty hours from the ACGME Task Force.N Engl J Med.2010;363.
- Association of Program Directors in Internal Medicine (APDIM) Survey 2009. Available at: http://www.im.org/toolbox/surveys/SurveyDataand Reports/APDIMSurveyData/Documents/2009_APDIM_summary_web. pdf. Accessed on July 30, 2012.
- ,,,,.Clinical oversight: conceptualizing the relationship between supervision and safety.J Gen Intern Med.2007;22(8):1080–1085.
- ,,, et al.Strategies for effective on‐call supervision for internal medicine residents: the SUPERB/SAFETY model.J Grad Med Educ.2010;2(1):46–52.
- ,,,,,.Career satisfaction and burn‐out in academic hospital medicine.Arch Intern Med.2011;171(8):782–785.
Perceptions of Readmitted Patients
Over 14% of all patients hospitalized in the United States are readmitted within 30 days of discharge.1 Numerous studies have used administrative data in order to identify clinical and operational predictors of readmission. However, few studies have explored patients' perspectives on readmission.27 As a result, we know little about potentially modifiable challenges which patients face during the transition from hospital to home. Lack of understanding of the patient perspective has hampered the ability of hospitals to create interventions which address these underlying causes of readmissions.
Patients with low socioeconomic status (SES) are up to 43% more likely to require readmission than their higher‐SES counterparts,8, 9 and qualitative data has described unique challenges faced by low‐SES patients during transition.2 Our objectives were to understand the transition experiences of readmitted patients and to compare these experiences across SES and diagnostic categories.
METHODS
Development of a Survey Instrument
A collaborative team of physicians, nurses, and social workers used a previously defined conceptual framework,10 literature search, and expert interviews to construct a 36‐item survey that addressed the following domains: preparedness for prior discharge; delays in care‐seeking; medication adherence; follow‐up with a primary care provider (PCP); and overarching challenges faced during transition which contributed to readmission. Each question had multiple answer choices including Other which allowed patients to provide open‐ended answers; patients could select all answer choices that applied. Prior to administration, the survey was pretested with 15 random patients and revised to improve reliability and comprehensibility. (See Supporting Information, Survey Script Versions 1.0 and 2.0, in the online version of this article.)
Sampling Strategy and Patient Enrollment
Patients were eligible to participate if they: 1) had capacity to complete an interview; and 2) were readmitted within 30 days of a prior discharge from the Hospital of the University of Pennsylvania (HUP), a 695‐bed academic medical center, or Penn Presbyterian Medical Center (PPMC), a 317‐bed affiliated community hospital. Both hospitals are located in Philadelphia and serve a population which is 45.4% privately insured, 33.5% insured by Medicare, and 21.2% uninsured or insured by Medicaid. We excluded readmissions that were planned or from another facility because these were less sensitive to patient domains such as adherence, access, and social support.
Eligible participants were identified by survey administrators (bedside nurses, social workers, or clinical resource managers) on the day of hospital readmission. Because data were being used immediately for quality improvement, the Institutional Review Board (IRB) waived the need for consent. Administrators typically took 10 minutes to conduct the survey in‐person and record responses directly into patients' electronic medical record (EMR). Inpatient care teams could view responses in real time and work to resolve identified challenges prior to patients' discharge.
Between November 10, 2010 and July 5, 2011, 3881 patients were readmitted to study hospitals. Five hundred eighty‐four readmissions were ineligible for the study because they lacked capacity, were planned readmissions, or were readmitted from another facility. This left 3297 eligible individuals. We surveyed 1084 individuals yielding a response rate of 32.9%11; the remainder either refused the survey, or were not approached for the survey due to time restraints of administrators. Characteristics of responders and nonresponders are displayed in Table 1, and were similar in all measured categories with the exception of age (58.0 vs 55.7, P 0.01) and the number of 60‐day readmissions (2.0 vs 1.3, P 0.01).
| Characteristics of Patients | Survey Sample (n = 1084) | Not in Survey Sample (n = 2797) | P Value* |
|---|---|---|---|
| |||
| Age mean (SD) | 55.7 (16.6) | 58.0 (18.2) | 0.01 |
| Gender, n (%) | 0.88 | ||
| Male | 546 (50.4%) | 1428 (51.1%) | |
| Race, n (%) | 0.96 | ||
| Black | 502 (46.4%) | 1146 (41.3%) | |
| White | 504 (46.6%) | 1362 (49.1%) | |
| Principal discharge diagnosis, n (%) | 0.98 | ||
| Medical | |||
| Acute on chronic systolic heart failure | 44 (4.6%) | 23 (1.3%) | |
| Acute renal failure | 24 (2.5%) | 29 (1.7%) | |
| Surgical | |||
| Postoperative infection | 48 (14.8%) | 53 (5.2%) | |
| Digestive system problems | 17 (5.2%) | 23 (2.2%) | |
| APR‐DRG score, n (%) | 0.13 | ||
| 0 (Not assigned) | 9 (0.7%) | 28 (1.0%) | |
| 1 (Minor) | 113 (10.1%) | 628 (22.7%) | |
| 2 (Moderate) | 338 (31.4%) | 881 (31.8%) | |
| 3 (Major) | 470 (43.7%) | 883 (31.9%) | |
| 4 (Extreme) | 154 (14.3%) | 369 (13.3%) | |
| Length of stay mean (SD) | 6.2 (6.9) | 6.5 (10.1) | 0.33 |
| Insurance payer, n (%) | 0.77 | ||
| Uninsured/Medicaid | 234 (21.6%) | 489 (17.5%) | |
| Medicaid + Medicare | 85 (7.84%) | 172 (6.2%) | |
| Medicare | 345 (31.8%) | 878 (31.5%) | |
| Private | 420 (38.8%) | 1253 (44.9%) | |
| No. of 60‐d readmissions mean (SD) | 1.3 (0.02) | 2.0 (0.02) | 0.01 |
Statistical Analysis
Survey responses were extracted from the EMR and linked with patient clinical and demographic data. Variables pertaining to hospitalization, such as admitting service and principal diagnosis, were associated with patients' index hospitalization rather than the readmission. A trained research assistant extracted open‐ended free‐text answers to any survey questions marked, Other and coded them using a grounded theory approach.12
In our primary analysis, we described challenges reported by readmitted patients. In a secondary analysis, we tested for differences in transition challenges by SES using lack of insurance or Medicaid as a proxy for low SES. Using insurance status as a marker for material aspects of SES is well‐described in health services research.1316 In addition, income data from our institution demonstrated that 86.5% of uninsured and Medicaid patients have a median household income below $15,000. We tested for differences by diagnostic category using the index admitting service (medical vs surgical) as a proxy for diagnostic category (Table 2).
| Low vs High SES (ref) OR (95% CI) | Medical vs Surgical (ref) OR (95% CI) | |
|---|---|---|
| ||
| Unprepared for DC | 1.3 (0.9, 1.9) | 1.0 (0.7, 1.6) |
| Understanding DC instructions | 2.7 (1.1, 6.6) | 1.7 (0.5, 5.8) |
| Executing DC instructions | 2.2 (1.1, 4.4) | 1.6 (0.6, 3.7) |
| Activities of daily living | 1.0 (0.6, 1.5) | 1.1 (0.7, 1.7) |
| Medication access | 1.6 (0.9, 2.8) | 2.3 (1.0, 4.9) |
| Medication adherence | 1.8 (1.2, 3.0) | 2.6 (1.2, 5.4) |
| Lack of social support | 2.0 (1.2, 3.6) | 2.3 (1.0, 5.2) |
| Lack of food, transportation, telephone | 2.6 (1.1, 6.1) | 7.1 (0.9, 53.2) |
| Substance abuse | 6.7 (2.3, 19.2) | 1.5 (0.4, 5.2) |
We compared continuous variables using the two‐sample t test and categorical variables using Pearson's chi‐square test. The Cuzick nonparametric test was used to test for trends across ordered groups. We used multivariable logistic regression models to estimate the association between each binary transition challenge outcome and predictors: SES and diagnostic group. These models were adjusted for potential confounders: age, gender, length of stay, and severity of illness, as determined by All Patient Refined‐Diagnosis Related Groups (APR‐DRGs). We did not adjust for race because it was strongly correlated with SES in our dataset (P 0.0001). Confounders were included in final models if their association with outcomes had a P value less than 0.10. Analyses were performed using the STATA software package, version 11.0 (StataCorp LP, College Station, TX). The survey was approved by the University of Pennsylvania IRB.
RESULTS
Patient Characteristics
We surveyed 1084 unique individuals; 50.4% of participants were male, 46.4% were black. The most common index principal diagnosis in the medical group was systolic heart failure (4.6%), while the most common index principal diagnosis in the surgical group was postoperative infection (14.8%) (Table 1).
Discharge Preparedness, Medication Adherence, and PCP Follow‐up
At the time of prior discharge, 86.4% of respondents felt that they had been prepared for self‐care. 80.3% reported being able to take all discharge medications as prescribed. The most common reasons for not being able to take medications included: 1) side effects or worry about side effects (13.1%); 2) trouble paying for medications (10.7%); and 3) lack of transportation to the pharmacy (8.4%). Since their prior discharge, 52.9% of participants reported that they had visited a PCP; 28.7% of participants report being referred by their PCP to the emergency room for readmission.
Transition Challenges in Overall Survey Sample
During the transition from hospital to home, 45.5% of readmitted patients reported experiencing challenges which contributed to readmission. The most commonly reported issues contributing to readmission were: 1) feeling unprepared for discharge (11.8%); 2) difficulty performing activities of daily living (ADLs) (10.6%); 3) trouble adhering to discharge medications (5.7%); 4) difficulty accessing discharge medications (5.0%); and 5) lack of social support (4.7%).
Transition Challenges by Subgroup
Low‐SES patients were more likely than high‐SES patients to report difficulty understanding (odds ratio [OR] 2.7; 95% confidence interval [CI] 1.1, 6.6) and executing (OR 2.2; 95% CI 1.1, 4.4) discharge instructions, difficulty adhering to medications (OR 1.8; 95% CI 1.2, 3.0), lack of social support (OR 2.0; 95% CI 1.2, 3.6), lack of basic resources (OR 2.6; 95% CI 1.1, 6.1), and substance abuse (OR 6.7; 95% CI 2.3, 19.2) as perceived reasons for readmission. Of the patients who described Other issues contributing to readmission, low‐SES patients most commonly described stress or depression (49.0%), while high‐SES patients most commonly reported a recurrence of symptoms (74.8%). Medical and surgical patients had similar odds of facing each transition challenge with one exception: medical patients were more likely to report difficulty adhering to medications (OR 2.6; 95% CI 1.2, 5.4).
DISCUSSION
Several findings from this study are of interest to practicing hospitalists or hospital administrators. First, of the issues to which patients most commonly attributed readmission, lack of discharge preparedness is the only one which occurs during index hospitalization; in order to address most transition challenges, hospitals must think beyond their walls. By penalizing hospitals for excess rates of readmission, The Hospital Readmission Reduction Program (HRRP) will effectively hold hospitals accountable for addressing issues which occur in patients' homes and communities.17 Hospitals that have robust partnerships with community pharmacies, social service agencies, and PCPs may have the most influence on these issues and the most success in reducing readmissions. Second, consistent with other literature describing increased rates of readmission with enhanced PCP follow‐up,18 our findings demonstrate that PCPs often refer their patients to the emergency room for readmission. This suggests that PCP follow‐up, while perhaps essential for patient care, may not necessarily reduce readmissions and may actually facilitate readmission. Third, this study describes underlying reasons for patient nonadherence with discharge medications: side effects, cost, and transportation. Targeted interventions to improve adherence may include floor‐based pharmacists who counsel on side effects, determine co‐pays prior to discharge, and encourage patients to fill prescriptions from the hospital pharmacy to avoid transportation barriers.
Finally, and perhaps most importantly, these data suggest that one transition experience does not fit all. Patients with low SES appear to have a distinct and challenging transition experience. Currently, there is an emphasis on tailoring transition interventions to specific disease populations, such as patients with congestive heart failure. Our study suggests that it may be more effective to tailor interventions for low‐SES patients across diagnostic category, helping these patients gain access to outpatient medical resources and address competing issues, such as food insecurity or substance abuse.
Our study has several limitations. First, the low survey response rate makes it susceptible to nonresponse bias. Second, survey administration by a member of the care team may have increased social desirability bias. Third, because it was important to the study team to incorporate our survey into hospital workflow, survey responses were recorded directly into the EMR which limited administrators to recording a yes response for each answer choice which the participant endorsed. Therefore, in our dataset, we are unable to distinguish a definite no from a missing response; however, the survey was short, making it unlikely that questions were skipped. Fourth, closed‐ended questions may have failed to capture the range of participant responses, although the inclusion of an open‐ended answer choice ameliorates this issue. Finally, we are unable to draw conclusions regarding association of survey responses with the risk of readmission, because this study was administered only to readmitted patients.
CONCLUSIONS
This report of patients' perspectives challenges many commonly held assumptions regarding readmission. Readmission reflects not only the quality of hospital care, but a variety of factors in patients' homes and communities. PCP follow‐up, while perhaps critical for patient care, may not be a panacea for reducing hospital readmissions. Targeted medication counseling focused on side effects, co‐pay, and medication delivery may address patients' underlying reasons for nonadherence. And most importantly, one transition experience does not fit all. Hospitalists and administrators must tailor interventions to address challenges reported by their patients, particularly those of low SES.
Acknowledgements
The authors are grateful to the Society of General Internal Medicine (SGIM) for selecting our abstract Perceptions of Readmitted Patients on the Transition From Hospital to Home as a Lipkin Award Finalist during the 2012 SGIM National Meeting.
Disclosures: Support for this study was provided by a grant from the Leonard Davis Institute of Health Economics. Dr Grande has received honoraria from the Johns Hopkins University CME Program; has a consultancy with the National Nursing Centers Consortium; and has received grant support from, or has grants pending with, the HealthWell Foundation, the National Human Genome Research Institute, and the Agency for Healthcare Research and Quality. Dr Shannon is the founder of a biotech company, Ventrigen, LLC; is a senior fellow at IHI; is on the scientific advisory boards for Glasgow Smith Klein, Pfizer, Merck, and Value Capture; and is a member of the Board of Directors of the ABIM.
- ,,,.All‐Cause Readmissions by Payer and Age, 2008: Statistical Brief #115. Healthcare Cost and Utilization Project (HCUP) Statistical Briefs.Rockville, MD:Agency for Health Care Policy and Research; February 2006–June2011.
- ,,.Understanding rehospitalization risk: can hospital discharge be modified to reduce recurrent hospitalization?J Hosp Med.2007;2(5):297–304.
- ,,.Patients' and caregivers' transition from hospital to home: needs and recommendations.Home Health Care Serv Q.1999;17(3):27–48.
- ,,.Reasons for readmission in heart failure: perspectives of patients, caregivers, cardiologists, and heart failure nurses.Heart Lung.2009;38(5):427–434.
- ,.Psychiatric rehospitalization of the severely mentally ill: patient and staff perspectives.Nurs Res.1992;41(5):301–305.
- ,,,,,.Continuity of care and monitoring pain after discharge: patient perspective.J Adv Nurs.2010;66(1):40–48.
- ,,,.Going home from hospital: the carer/patient dyad.J Adv Nurs.2001;35(2):206–217.
- ,,.The impact of patient socioeconomic status and other social factors on readmission. A prospective study in 4 Massachusetts hospitals.Inquiry.1994;31(2):163–172.
- ,,,.Redefining readmission risk factors for general medicine patients.J Hosp Med.2011;6(2):54–60.
- ,.Hospital readmissions—not just a measure of quality.JAMA.2011;306(16):1796–1797.
- American Association for Public Opinion Research (AAPOR).Standard Definitions: Final Dispositions of Case Codes and Outcome Rates for Surveys.7th ed.Deerfield, IL:AAPOR;2011.
- ,.The Discovery of Grounded Theory: Strategies for Qualitative Research.New York:Aldine;1967.
- ,,,.The relation between health insurance coverage and clinical outcomes among women with breast cancer.N Engl J Med.1993;329(5):326–331.
- ,,,,,.Neighborhood socioeconomic status, Medicaid coverage and medical management of myocardial infarction: atherosclerosis risk in communities (ARIC) community surveillance.BMC Public Health.2010;10:632.
- ,,,,.Effects of practice setting on quality of lipid‐lowering management in patients with coronary artery disease.Am J Cardiol.1998;81(12):1416–1420.
- .Income Data by Insurance Category.2012.
- ,.Hospital readmissions and the Affordable Care Act: paying for coordinated quality care.JAMA.2011;306(16):1794–1795.
- ,,.Does increased access to primary care reduce hospital readmissions?N Engl J Med.1996;334(22):1441–1447.
Over 14% of all patients hospitalized in the United States are readmitted within 30 days of discharge.1 Numerous studies have used administrative data in order to identify clinical and operational predictors of readmission. However, few studies have explored patients' perspectives on readmission.27 As a result, we know little about potentially modifiable challenges which patients face during the transition from hospital to home. Lack of understanding of the patient perspective has hampered the ability of hospitals to create interventions which address these underlying causes of readmissions.
Patients with low socioeconomic status (SES) are up to 43% more likely to require readmission than their higher‐SES counterparts,8, 9 and qualitative data has described unique challenges faced by low‐SES patients during transition.2 Our objectives were to understand the transition experiences of readmitted patients and to compare these experiences across SES and diagnostic categories.
METHODS
Development of a Survey Instrument
A collaborative team of physicians, nurses, and social workers used a previously defined conceptual framework,10 literature search, and expert interviews to construct a 36‐item survey that addressed the following domains: preparedness for prior discharge; delays in care‐seeking; medication adherence; follow‐up with a primary care provider (PCP); and overarching challenges faced during transition which contributed to readmission. Each question had multiple answer choices including Other which allowed patients to provide open‐ended answers; patients could select all answer choices that applied. Prior to administration, the survey was pretested with 15 random patients and revised to improve reliability and comprehensibility. (See Supporting Information, Survey Script Versions 1.0 and 2.0, in the online version of this article.)
Sampling Strategy and Patient Enrollment
Patients were eligible to participate if they: 1) had capacity to complete an interview; and 2) were readmitted within 30 days of a prior discharge from the Hospital of the University of Pennsylvania (HUP), a 695‐bed academic medical center, or Penn Presbyterian Medical Center (PPMC), a 317‐bed affiliated community hospital. Both hospitals are located in Philadelphia and serve a population which is 45.4% privately insured, 33.5% insured by Medicare, and 21.2% uninsured or insured by Medicaid. We excluded readmissions that were planned or from another facility because these were less sensitive to patient domains such as adherence, access, and social support.
Eligible participants were identified by survey administrators (bedside nurses, social workers, or clinical resource managers) on the day of hospital readmission. Because data were being used immediately for quality improvement, the Institutional Review Board (IRB) waived the need for consent. Administrators typically took 10 minutes to conduct the survey in‐person and record responses directly into patients' electronic medical record (EMR). Inpatient care teams could view responses in real time and work to resolve identified challenges prior to patients' discharge.
Between November 10, 2010 and July 5, 2011, 3881 patients were readmitted to study hospitals. Five hundred eighty‐four readmissions were ineligible for the study because they lacked capacity, were planned readmissions, or were readmitted from another facility. This left 3297 eligible individuals. We surveyed 1084 individuals yielding a response rate of 32.9%11; the remainder either refused the survey, or were not approached for the survey due to time restraints of administrators. Characteristics of responders and nonresponders are displayed in Table 1, and were similar in all measured categories with the exception of age (58.0 vs 55.7, P 0.01) and the number of 60‐day readmissions (2.0 vs 1.3, P 0.01).
| Characteristics of Patients | Survey Sample (n = 1084) | Not in Survey Sample (n = 2797) | P Value* |
|---|---|---|---|
| |||
| Age mean (SD) | 55.7 (16.6) | 58.0 (18.2) | 0.01 |
| Gender, n (%) | 0.88 | ||
| Male | 546 (50.4%) | 1428 (51.1%) | |
| Race, n (%) | 0.96 | ||
| Black | 502 (46.4%) | 1146 (41.3%) | |
| White | 504 (46.6%) | 1362 (49.1%) | |
| Principal discharge diagnosis, n (%) | 0.98 | ||
| Medical | |||
| Acute on chronic systolic heart failure | 44 (4.6%) | 23 (1.3%) | |
| Acute renal failure | 24 (2.5%) | 29 (1.7%) | |
| Surgical | |||
| Postoperative infection | 48 (14.8%) | 53 (5.2%) | |
| Digestive system problems | 17 (5.2%) | 23 (2.2%) | |
| APR‐DRG score, n (%) | 0.13 | ||
| 0 (Not assigned) | 9 (0.7%) | 28 (1.0%) | |
| 1 (Minor) | 113 (10.1%) | 628 (22.7%) | |
| 2 (Moderate) | 338 (31.4%) | 881 (31.8%) | |
| 3 (Major) | 470 (43.7%) | 883 (31.9%) | |
| 4 (Extreme) | 154 (14.3%) | 369 (13.3%) | |
| Length of stay mean (SD) | 6.2 (6.9) | 6.5 (10.1) | 0.33 |
| Insurance payer, n (%) | 0.77 | ||
| Uninsured/Medicaid | 234 (21.6%) | 489 (17.5%) | |
| Medicaid + Medicare | 85 (7.84%) | 172 (6.2%) | |
| Medicare | 345 (31.8%) | 878 (31.5%) | |
| Private | 420 (38.8%) | 1253 (44.9%) | |
| No. of 60‐d readmissions mean (SD) | 1.3 (0.02) | 2.0 (0.02) | 0.01 |
Statistical Analysis
Survey responses were extracted from the EMR and linked with patient clinical and demographic data. Variables pertaining to hospitalization, such as admitting service and principal diagnosis, were associated with patients' index hospitalization rather than the readmission. A trained research assistant extracted open‐ended free‐text answers to any survey questions marked, Other and coded them using a grounded theory approach.12
In our primary analysis, we described challenges reported by readmitted patients. In a secondary analysis, we tested for differences in transition challenges by SES using lack of insurance or Medicaid as a proxy for low SES. Using insurance status as a marker for material aspects of SES is well‐described in health services research.1316 In addition, income data from our institution demonstrated that 86.5% of uninsured and Medicaid patients have a median household income below $15,000. We tested for differences by diagnostic category using the index admitting service (medical vs surgical) as a proxy for diagnostic category (Table 2).
| Low vs High SES (ref) OR (95% CI) | Medical vs Surgical (ref) OR (95% CI) | |
|---|---|---|
| ||
| Unprepared for DC | 1.3 (0.9, 1.9) | 1.0 (0.7, 1.6) |
| Understanding DC instructions | 2.7 (1.1, 6.6) | 1.7 (0.5, 5.8) |
| Executing DC instructions | 2.2 (1.1, 4.4) | 1.6 (0.6, 3.7) |
| Activities of daily living | 1.0 (0.6, 1.5) | 1.1 (0.7, 1.7) |
| Medication access | 1.6 (0.9, 2.8) | 2.3 (1.0, 4.9) |
| Medication adherence | 1.8 (1.2, 3.0) | 2.6 (1.2, 5.4) |
| Lack of social support | 2.0 (1.2, 3.6) | 2.3 (1.0, 5.2) |
| Lack of food, transportation, telephone | 2.6 (1.1, 6.1) | 7.1 (0.9, 53.2) |
| Substance abuse | 6.7 (2.3, 19.2) | 1.5 (0.4, 5.2) |
We compared continuous variables using the two‐sample t test and categorical variables using Pearson's chi‐square test. The Cuzick nonparametric test was used to test for trends across ordered groups. We used multivariable logistic regression models to estimate the association between each binary transition challenge outcome and predictors: SES and diagnostic group. These models were adjusted for potential confounders: age, gender, length of stay, and severity of illness, as determined by All Patient Refined‐Diagnosis Related Groups (APR‐DRGs). We did not adjust for race because it was strongly correlated with SES in our dataset (P 0.0001). Confounders were included in final models if their association with outcomes had a P value less than 0.10. Analyses were performed using the STATA software package, version 11.0 (StataCorp LP, College Station, TX). The survey was approved by the University of Pennsylvania IRB.
RESULTS
Patient Characteristics
We surveyed 1084 unique individuals; 50.4% of participants were male, 46.4% were black. The most common index principal diagnosis in the medical group was systolic heart failure (4.6%), while the most common index principal diagnosis in the surgical group was postoperative infection (14.8%) (Table 1).
Discharge Preparedness, Medication Adherence, and PCP Follow‐up
At the time of prior discharge, 86.4% of respondents felt that they had been prepared for self‐care. 80.3% reported being able to take all discharge medications as prescribed. The most common reasons for not being able to take medications included: 1) side effects or worry about side effects (13.1%); 2) trouble paying for medications (10.7%); and 3) lack of transportation to the pharmacy (8.4%). Since their prior discharge, 52.9% of participants reported that they had visited a PCP; 28.7% of participants report being referred by their PCP to the emergency room for readmission.
Transition Challenges in Overall Survey Sample
During the transition from hospital to home, 45.5% of readmitted patients reported experiencing challenges which contributed to readmission. The most commonly reported issues contributing to readmission were: 1) feeling unprepared for discharge (11.8%); 2) difficulty performing activities of daily living (ADLs) (10.6%); 3) trouble adhering to discharge medications (5.7%); 4) difficulty accessing discharge medications (5.0%); and 5) lack of social support (4.7%).
Transition Challenges by Subgroup
Low‐SES patients were more likely than high‐SES patients to report difficulty understanding (odds ratio [OR] 2.7; 95% confidence interval [CI] 1.1, 6.6) and executing (OR 2.2; 95% CI 1.1, 4.4) discharge instructions, difficulty adhering to medications (OR 1.8; 95% CI 1.2, 3.0), lack of social support (OR 2.0; 95% CI 1.2, 3.6), lack of basic resources (OR 2.6; 95% CI 1.1, 6.1), and substance abuse (OR 6.7; 95% CI 2.3, 19.2) as perceived reasons for readmission. Of the patients who described Other issues contributing to readmission, low‐SES patients most commonly described stress or depression (49.0%), while high‐SES patients most commonly reported a recurrence of symptoms (74.8%). Medical and surgical patients had similar odds of facing each transition challenge with one exception: medical patients were more likely to report difficulty adhering to medications (OR 2.6; 95% CI 1.2, 5.4).
DISCUSSION
Several findings from this study are of interest to practicing hospitalists or hospital administrators. First, of the issues to which patients most commonly attributed readmission, lack of discharge preparedness is the only one which occurs during index hospitalization; in order to address most transition challenges, hospitals must think beyond their walls. By penalizing hospitals for excess rates of readmission, The Hospital Readmission Reduction Program (HRRP) will effectively hold hospitals accountable for addressing issues which occur in patients' homes and communities.17 Hospitals that have robust partnerships with community pharmacies, social service agencies, and PCPs may have the most influence on these issues and the most success in reducing readmissions. Second, consistent with other literature describing increased rates of readmission with enhanced PCP follow‐up,18 our findings demonstrate that PCPs often refer their patients to the emergency room for readmission. This suggests that PCP follow‐up, while perhaps essential for patient care, may not necessarily reduce readmissions and may actually facilitate readmission. Third, this study describes underlying reasons for patient nonadherence with discharge medications: side effects, cost, and transportation. Targeted interventions to improve adherence may include floor‐based pharmacists who counsel on side effects, determine co‐pays prior to discharge, and encourage patients to fill prescriptions from the hospital pharmacy to avoid transportation barriers.
Finally, and perhaps most importantly, these data suggest that one transition experience does not fit all. Patients with low SES appear to have a distinct and challenging transition experience. Currently, there is an emphasis on tailoring transition interventions to specific disease populations, such as patients with congestive heart failure. Our study suggests that it may be more effective to tailor interventions for low‐SES patients across diagnostic category, helping these patients gain access to outpatient medical resources and address competing issues, such as food insecurity or substance abuse.
Our study has several limitations. First, the low survey response rate makes it susceptible to nonresponse bias. Second, survey administration by a member of the care team may have increased social desirability bias. Third, because it was important to the study team to incorporate our survey into hospital workflow, survey responses were recorded directly into the EMR which limited administrators to recording a yes response for each answer choice which the participant endorsed. Therefore, in our dataset, we are unable to distinguish a definite no from a missing response; however, the survey was short, making it unlikely that questions were skipped. Fourth, closed‐ended questions may have failed to capture the range of participant responses, although the inclusion of an open‐ended answer choice ameliorates this issue. Finally, we are unable to draw conclusions regarding association of survey responses with the risk of readmission, because this study was administered only to readmitted patients.
CONCLUSIONS
This report of patients' perspectives challenges many commonly held assumptions regarding readmission. Readmission reflects not only the quality of hospital care, but a variety of factors in patients' homes and communities. PCP follow‐up, while perhaps critical for patient care, may not be a panacea for reducing hospital readmissions. Targeted medication counseling focused on side effects, co‐pay, and medication delivery may address patients' underlying reasons for nonadherence. And most importantly, one transition experience does not fit all. Hospitalists and administrators must tailor interventions to address challenges reported by their patients, particularly those of low SES.
Acknowledgements
The authors are grateful to the Society of General Internal Medicine (SGIM) for selecting our abstract Perceptions of Readmitted Patients on the Transition From Hospital to Home as a Lipkin Award Finalist during the 2012 SGIM National Meeting.
Disclosures: Support for this study was provided by a grant from the Leonard Davis Institute of Health Economics. Dr Grande has received honoraria from the Johns Hopkins University CME Program; has a consultancy with the National Nursing Centers Consortium; and has received grant support from, or has grants pending with, the HealthWell Foundation, the National Human Genome Research Institute, and the Agency for Healthcare Research and Quality. Dr Shannon is the founder of a biotech company, Ventrigen, LLC; is a senior fellow at IHI; is on the scientific advisory boards for Glasgow Smith Klein, Pfizer, Merck, and Value Capture; and is a member of the Board of Directors of the ABIM.
- ,,,.All‐Cause Readmissions by Payer and Age, 2008: Statistical Brief #115. Healthcare Cost and Utilization Project (HCUP) Statistical Briefs.Rockville, MD:Agency for Health Care Policy and Research; February 2006–June2011.
- ,,.Understanding rehospitalization risk: can hospital discharge be modified to reduce recurrent hospitalization?J Hosp Med.2007;2(5):297–304.
- ,,.Patients' and caregivers' transition from hospital to home: needs and recommendations.Home Health Care Serv Q.1999;17(3):27–48.
- ,,.Reasons for readmission in heart failure: perspectives of patients, caregivers, cardiologists, and heart failure nurses.Heart Lung.2009;38(5):427–434.
- ,.Psychiatric rehospitalization of the severely mentally ill: patient and staff perspectives.Nurs Res.1992;41(5):301–305.
- ,,,,,.Continuity of care and monitoring pain after discharge: patient perspective.J Adv Nurs.2010;66(1):40–48.
- ,,,.Going home from hospital: the carer/patient dyad.J Adv Nurs.2001;35(2):206–217.
- ,,.The impact of patient socioeconomic status and other social factors on readmission. A prospective study in 4 Massachusetts hospitals.Inquiry.1994;31(2):163–172.
- ,,,.Redefining readmission risk factors for general medicine patients.J Hosp Med.2011;6(2):54–60.
- ,.Hospital readmissions—not just a measure of quality.JAMA.2011;306(16):1796–1797.
- American Association for Public Opinion Research (AAPOR).Standard Definitions: Final Dispositions of Case Codes and Outcome Rates for Surveys.7th ed.Deerfield, IL:AAPOR;2011.
- ,.The Discovery of Grounded Theory: Strategies for Qualitative Research.New York:Aldine;1967.
- ,,,.The relation between health insurance coverage and clinical outcomes among women with breast cancer.N Engl J Med.1993;329(5):326–331.
- ,,,,,.Neighborhood socioeconomic status, Medicaid coverage and medical management of myocardial infarction: atherosclerosis risk in communities (ARIC) community surveillance.BMC Public Health.2010;10:632.
- ,,,,.Effects of practice setting on quality of lipid‐lowering management in patients with coronary artery disease.Am J Cardiol.1998;81(12):1416–1420.
- .Income Data by Insurance Category.2012.
- ,.Hospital readmissions and the Affordable Care Act: paying for coordinated quality care.JAMA.2011;306(16):1794–1795.
- ,,.Does increased access to primary care reduce hospital readmissions?N Engl J Med.1996;334(22):1441–1447.
Hospitalist Physical Diagnosis Curricula
Deficiencies in physical examination skills among medical students, housestaff, and even faculty have been reported for decades. For example, cardiac examination skills have been shown to improve during the early years of medical school and then plateau by the third year, with no measurable improvement through residency or beyond without fellowship training.13
Despite efforts by residency programs to promote bedside teaching, many general medicine faculty shy away due to lack of confidence and comfort in teaching physical diagnosis.4 The presence of hospitalists increases satisfaction among trainees with inpatient teaching,5 and medical faculty's ability has been shown to positively impact medical students' test scores.6 This lack of bedside teaching is a missed opportunity, as general medicine faculty are assuming more teaching responsibility.
The Merrin Bedside Teaching Program was founded in 2004 at New York University (NYU) School of Medicine to improve the quality of bedside teaching in the Department of Medicine/Division of General Internal Medicine. In this article, we describe the development process and early outcomes of this program.
METHODS
The principal teaching institution of NYU is Bellevue Hospital, an 800‐bed tertiary care safety‐net facility located in New York City. Approximately 30 general medicine faculty members at Bellevue Hospital attend on the inpatient teaching service 12 weeks per year each, with the remaining time spent in the hospital‐based clinics and other inpatient services.
Prior to the initiation of this program, our faculty did not receive formal instruction in bedside teaching, in general, or in teaching physical diagnosis, in particular. Housestaff and students were reporting that bedside rounds were not being conducted consistently and were of variable educational quality. Among a number of our residency and fellowship programs, there were concerns about meeting Accreditation Counsel for Graduate Medical Education (ACGME) requirements for quantity and quality of bedside rounds and faculty development.
To inform program development, we conducted a literature review, a series of focus groups with residents and faculty, and a survey of 39 general medicine hospital and ambulatory‐based clinician teachers to determine the perceived bedside teaching faculty development needs of our department. Then, over the next 2 years, we recruited 32 hospitalists and fellowship faculty to participate in a videotaped bedside teaching simulation. Each attending reviewed the videotape one‐on‐one with an experienced facilitator (A.K.), who elicited the attending's goals and instructional models and methods used for clinical teaching. To address the wide variety in teaching approaches identified in the assessment, 4 to 6 attendings met weekly for 1 month to observe each other conducting rounds with their teams. The facilitator of these groups used materials derived from relevant medical education theory79 and related conceptual models to frame the debriefing. Participants enthusiastically supported the educational value of this learner‐centered, experiential teaching approach.
We integrated this needs assessment with an individualized approach, incorporating learner goal‐setting with interactive and highly experiential teaching strategies,7,9,10 to create the Merrin Bedside Teaching Program in 2004. This program recruits faculty, with reputations as excellent teachers, to design a program to develop their own bedside teaching skills and disseminate what they learn to their peers. Faculty fellows are recruited through an open call for applications, which includes a letter of support from a supervisor and a detailed independent learning plan, including an identified mentor. Fellows are selected by the program's executive committee based on the likelihood of the success of their proposed program. A stipend equivalent of between 5% and 10% of base salary is provided to each fellow for a period of 2 years. Selected faculty fellows are encouraged to focus on an aspect of the physical examination, work in groups of 2 or 3, and to identify and recruit a mentor who is considered a master clinician in the target specialty. Master clinicians are given an honorarium to acknowledge their selection and incentivize them to spend time with the faculty fellows. This is funded with philanthropic support from the Merrin Family Foundation.
Fellows are guided by program leadership in their independent study, development of clinical teaching skills, and curriculum development using the same theory‐driven, systematic approach that framed program inception.911 Bedside rounds are the core instructional method used by each group of fellows and are supplemented by lectures, interactive small‐group seminars, and Web‐based modules in certain cases. Bedside sessions are run by the master‐clinician mentor until the faculty fellows are deemed competent by the mentor and feel confident enough to lead independently.
Since 2004, there have been 14 fellows who have developed programs focused on the examination of the heart, skin, knee, and shoulder. Program development is underway in motivational interviewing, the pulmonary examination, and the examination of the critically ill patient. We describe the work of the first 4 fellows as an example of how this fellowship creates value for the individual fellows, our departmental teaching programs, and the medical school.
Our first cohort of fellows chose, out of personal interest, to concentrate on the cardiac examination. They spent the first year working with highly respected cardiologists to hone their own clinical skills, reviewing the literature on the evidence‐based cardiac physical examination and effective teaching methods,12,13 researching the use of electronic stethoscopes and related technology for teaching at the bedside, and piloting a variety of approaches to teaching their busy colleagues these skills.
Bedside rounds focus on pertinent physical findings with an emphasis on an evidence‐based approach. We find we are most effective when the patient's diagnosis is unknown by the group leader to avoid bias when formulating the differential diagnosis. Sessions include a discussion of how the exam correlates with the diagnosis, relevant pathophysiology, imaging, and treatment options.
Two, 1‐hour‐long lectures in cardiac examination are delivered: the first reviews basics of heart sounds, both normal and abnormal, and the second reviews the most common systolic and diastolic murmurs. These lectures, scheduled into routine faculty conference time, utilize a PowerPoint format, with an overview of basic physiology and pathophysiology, aided by phonocardiograms, frequency spectrographs, and audio recordings delivered via a loudspeaker. Interactive cases offered by Blaufuss Multimedia (Rolling Hills Estates, CA) are an excellent teaching tool that incorporate case presentations, videos of key physical findings, auscultatory recordings, and relevant pathophysiology. We initially used this resource because of its high quality and ease of use; we now use our own interactive case presentations, which allow for flexibility with content and style, and which reinforce the prevalence of interesting cases at our institution to the audience members.
Technology has proven to be an invaluable tool in teaching cardiac physical diagnosis, both at the bedside and in the classroom. Electronic stethoscopes provide the ability to record heart sounds for use in teaching venues on short notice, such as morning report, and for use in creating the interactive case presentations described above. The electronic stethoscopes we use can be wired to peripheral devices, such as camcorders, iPods, and speaker pads. Speaker pads are devices, approximately the size of a stethoscope head, that can be connected by wires in series, each attached to a stethoscope, allowing a group of people to listen to the same sounds simultaneously with excellent sound reproduction. This technology allows each person standing around the bedside to listen to a patient while the group leader auscultates and explains the findings in real time. There are distinct advantages of simultaneous auscultation both for describing auditory findings and minimizing discomfort to the patient.
Applications are available for the iPod (Stethoscope App, Thinklabs Technology, LLC, Centennial, CO) which can record and display real‐time phonocardiography when attached to an electronic stethoscope, even at the terminus of a speaker pad chain. This application also allows recorded sounds to be played directly through a speaker, or transferred to a computer with the corresponding phonocardiographic and spectrographic images, that can all be incorporated into an interactive case presentation. Frequency spectrographs allow visualization of differences between low‐ and high‐frequency sounds, which, in conjunction with the timing and amplitude displayed by phonocardiography, can aid in teaching subtle findings, such as shapes of murmurs, patterns of splitting, gallups, etc.14 Playback of heart sounds in a conference room setting can be challenging, given the often subtle and low‐frequency findings typical of cardiac pathology, and is effectively achieved by using a musician‐quality loudspeaker. We have found that speaker pads offer the best sound quality at the bedside, although they are inconvenient for larger groups.
DISCUSSION
A new framework has been proposed for considering faculty development programs that focuses on the participants, program, content, facilitator, and the context in which the program occurs.15 We have effectively addressed and synthesized these components in a rich, high impact, learner‐centered faculty development program that also responds to challenges raised by changes in the health delivery system, concerns about accreditation requirements, and targeted local needs assessment.
We have been fortunate to recruit specialty faculty who are outstanding teachers, have welcomed the fellows into their clinics, and have dedicated countless hours to supervision and education. An unintended, but important, outcome of the program is that we are able to highlight the exceptional skills of our senior, experienced clinicians. These are colleagues who all too often do not receive adequate recognition in the modern‐day academic medical center environment, but who are undoubtedly invaluable to the education mission of these centers.
The existence of the program has resulted in our general medicine faculty showing great enthusiasm, both to develop an area of expertise and to participate as learners in the programs developed by peers. The faculty fellows in each specialty have become a valuable resource to peer faculty, residents, and medical students alike, who are now less dependent on consultants to identify and explain physical findings. The faculty teaching the knee and shoulder exams started a Sports Medicine Clinic within primary care, and assist with joint injections throughout the clinic. In addition to providing clinical support, their educational curriculum is included in both the attending and housestaff conference schedules. The cardiac lectures, both didactic and interactive case presentations, are included in the attending conference schedule, intern and resident core curricula, and the third‐year medicine clerkship lecture series. The dermatology group has created a series of comprehensive online modules that provide content tailored to general medicine. All this durable material is available broadly to trainees of all professions in our medical center.
Given the ever‐growing burden of patient care and extra‐clinical responsibilities, the principal factor limiting the effectiveness of bedside rounds is faculty availability. Despite this, all of our hospitalists have attended at least 1 bedside cardiac session, and the majority have attended multiple times. Varying the time and day of the sessions, offering to join attending rounds, and being available for impromptu diagnostic consultations have maximized the fellows' contact with faculty, residents, and students.
Although funding for evaluation of the program has been limited, a research agenda is emerging. Both the pulmonary physical exam and critical care groups are in the process of evaluating the effectiveness of their programs on the quality of bedside rounds, student and resident learning, and, to the extent possible, on patient care.
CONCLUSION
We believe wholeheartedly that bedside instruction both in physical diagnosis and interview skills must not become a lost art. General medicine faculty are ideally situated to take on this challenge. An educational program targeting hospitalists and general medicine faculty energizes faculty and leverages local resources to fill in gaps in skills for faculty and then for trainees. Generalist faculty relish the opportunity to champion a particular element of the doctorpatient encounter, which has contributed to our ultimate goal of strengthening the core diagnostic skills of our faculty who are at the forefront of clinical care and medical education.
Acknowledgements
The authors thank the Merrin Family for their generous support of the program; Drs Gregory Mints, Tanping Wong, and Sabrina Felson for their initial work in developing the Merrin Faculty Development Program; and Dr Martin Kahn for his tireless dedication to mentorship and bedside teaching.
Disclosure: Drs Janjigian, Charap, and Kalet report receiving funding from the Merrin Family Foundation.
- , . Cardiac auscultatory skills of internal medicine and family practice trainees. A comparison of diagnostic proficiency. JAMA. 1997;278(9):717–722.
- , , , et al. Competency in cardiac examination skills in medical students, trainees, physicians, and faculty: a multicenter study. Arch Intern Med. 2006;166(6):610–616.
- , , , et al. Confidential testing of cardiac examination competency in cardiology and noncardiology faculty and trainees: a multicenter study. Clin Cardiol. 2010;33(12):738–745.
- , , , . Whither bedside teaching? A focus‐group study of clinical teachers. Acad Med. 2003;78(4):384–390.
- , , , . Effect of hospitalist attending physicians on trainee educational experiences: a systematic review. J Hosp Med. 2009;4(8):490–498.
- , , , , , . Is there a relationship between attending physicians' and residents' teaching skills and students' examination scores? Acad Med. 2000;75(11):1144–1146.
- , , , . A five‐step “microskills” model of clinical teaching. J Am Board Fam Pract. 1992;5(4):419–424.
- , , , , . Attributes of excellent attending‐physician role models. N Engl J Med. 1998;339(27):1986–1993.
- , . Teaching at the bedside: a new model. Med Teach. 2003;25(2):127–130.
- . A theory‐based faculty development program for clinician‐educators. Acad Med. 2000;75(5):498–501.
- Kern D, Thomas P, Howard D, Bass E, ed. Curriculum Development for Medical Education: A Six‐Step Approach. Baltimore, MD: The Johns Hopkins University Press; 1998.
- , , , , . Innovative web‐based multimedia curriculum improves cardiac examination competency of residents. J Hosp Med. 2008;3(2):124–133.
- , , , , . Using virtual patients to improve cardiac examination competency in medical students. Clin Cardiol. 2008;31(7):334–339.
- . Cardiac auscultation: a glorious past—and it does have a future! Circulation. 2006;113(9):1255–1259.
- , . Reframing research on faculty development. Acad Med. 2011;86(4):421–428.
Deficiencies in physical examination skills among medical students, housestaff, and even faculty have been reported for decades. For example, cardiac examination skills have been shown to improve during the early years of medical school and then plateau by the third year, with no measurable improvement through residency or beyond without fellowship training.13
Despite efforts by residency programs to promote bedside teaching, many general medicine faculty shy away due to lack of confidence and comfort in teaching physical diagnosis.4 The presence of hospitalists increases satisfaction among trainees with inpatient teaching,5 and medical faculty's ability has been shown to positively impact medical students' test scores.6 This lack of bedside teaching is a missed opportunity, as general medicine faculty are assuming more teaching responsibility.
The Merrin Bedside Teaching Program was founded in 2004 at New York University (NYU) School of Medicine to improve the quality of bedside teaching in the Department of Medicine/Division of General Internal Medicine. In this article, we describe the development process and early outcomes of this program.
METHODS
The principal teaching institution of NYU is Bellevue Hospital, an 800‐bed tertiary care safety‐net facility located in New York City. Approximately 30 general medicine faculty members at Bellevue Hospital attend on the inpatient teaching service 12 weeks per year each, with the remaining time spent in the hospital‐based clinics and other inpatient services.
Prior to the initiation of this program, our faculty did not receive formal instruction in bedside teaching, in general, or in teaching physical diagnosis, in particular. Housestaff and students were reporting that bedside rounds were not being conducted consistently and were of variable educational quality. Among a number of our residency and fellowship programs, there were concerns about meeting Accreditation Counsel for Graduate Medical Education (ACGME) requirements for quantity and quality of bedside rounds and faculty development.
To inform program development, we conducted a literature review, a series of focus groups with residents and faculty, and a survey of 39 general medicine hospital and ambulatory‐based clinician teachers to determine the perceived bedside teaching faculty development needs of our department. Then, over the next 2 years, we recruited 32 hospitalists and fellowship faculty to participate in a videotaped bedside teaching simulation. Each attending reviewed the videotape one‐on‐one with an experienced facilitator (A.K.), who elicited the attending's goals and instructional models and methods used for clinical teaching. To address the wide variety in teaching approaches identified in the assessment, 4 to 6 attendings met weekly for 1 month to observe each other conducting rounds with their teams. The facilitator of these groups used materials derived from relevant medical education theory79 and related conceptual models to frame the debriefing. Participants enthusiastically supported the educational value of this learner‐centered, experiential teaching approach.
We integrated this needs assessment with an individualized approach, incorporating learner goal‐setting with interactive and highly experiential teaching strategies,7,9,10 to create the Merrin Bedside Teaching Program in 2004. This program recruits faculty, with reputations as excellent teachers, to design a program to develop their own bedside teaching skills and disseminate what they learn to their peers. Faculty fellows are recruited through an open call for applications, which includes a letter of support from a supervisor and a detailed independent learning plan, including an identified mentor. Fellows are selected by the program's executive committee based on the likelihood of the success of their proposed program. A stipend equivalent of between 5% and 10% of base salary is provided to each fellow for a period of 2 years. Selected faculty fellows are encouraged to focus on an aspect of the physical examination, work in groups of 2 or 3, and to identify and recruit a mentor who is considered a master clinician in the target specialty. Master clinicians are given an honorarium to acknowledge their selection and incentivize them to spend time with the faculty fellows. This is funded with philanthropic support from the Merrin Family Foundation.
Fellows are guided by program leadership in their independent study, development of clinical teaching skills, and curriculum development using the same theory‐driven, systematic approach that framed program inception.911 Bedside rounds are the core instructional method used by each group of fellows and are supplemented by lectures, interactive small‐group seminars, and Web‐based modules in certain cases. Bedside sessions are run by the master‐clinician mentor until the faculty fellows are deemed competent by the mentor and feel confident enough to lead independently.
Since 2004, there have been 14 fellows who have developed programs focused on the examination of the heart, skin, knee, and shoulder. Program development is underway in motivational interviewing, the pulmonary examination, and the examination of the critically ill patient. We describe the work of the first 4 fellows as an example of how this fellowship creates value for the individual fellows, our departmental teaching programs, and the medical school.
Our first cohort of fellows chose, out of personal interest, to concentrate on the cardiac examination. They spent the first year working with highly respected cardiologists to hone their own clinical skills, reviewing the literature on the evidence‐based cardiac physical examination and effective teaching methods,12,13 researching the use of electronic stethoscopes and related technology for teaching at the bedside, and piloting a variety of approaches to teaching their busy colleagues these skills.
Bedside rounds focus on pertinent physical findings with an emphasis on an evidence‐based approach. We find we are most effective when the patient's diagnosis is unknown by the group leader to avoid bias when formulating the differential diagnosis. Sessions include a discussion of how the exam correlates with the diagnosis, relevant pathophysiology, imaging, and treatment options.
Two, 1‐hour‐long lectures in cardiac examination are delivered: the first reviews basics of heart sounds, both normal and abnormal, and the second reviews the most common systolic and diastolic murmurs. These lectures, scheduled into routine faculty conference time, utilize a PowerPoint format, with an overview of basic physiology and pathophysiology, aided by phonocardiograms, frequency spectrographs, and audio recordings delivered via a loudspeaker. Interactive cases offered by Blaufuss Multimedia (Rolling Hills Estates, CA) are an excellent teaching tool that incorporate case presentations, videos of key physical findings, auscultatory recordings, and relevant pathophysiology. We initially used this resource because of its high quality and ease of use; we now use our own interactive case presentations, which allow for flexibility with content and style, and which reinforce the prevalence of interesting cases at our institution to the audience members.
Technology has proven to be an invaluable tool in teaching cardiac physical diagnosis, both at the bedside and in the classroom. Electronic stethoscopes provide the ability to record heart sounds for use in teaching venues on short notice, such as morning report, and for use in creating the interactive case presentations described above. The electronic stethoscopes we use can be wired to peripheral devices, such as camcorders, iPods, and speaker pads. Speaker pads are devices, approximately the size of a stethoscope head, that can be connected by wires in series, each attached to a stethoscope, allowing a group of people to listen to the same sounds simultaneously with excellent sound reproduction. This technology allows each person standing around the bedside to listen to a patient while the group leader auscultates and explains the findings in real time. There are distinct advantages of simultaneous auscultation both for describing auditory findings and minimizing discomfort to the patient.
Applications are available for the iPod (Stethoscope App, Thinklabs Technology, LLC, Centennial, CO) which can record and display real‐time phonocardiography when attached to an electronic stethoscope, even at the terminus of a speaker pad chain. This application also allows recorded sounds to be played directly through a speaker, or transferred to a computer with the corresponding phonocardiographic and spectrographic images, that can all be incorporated into an interactive case presentation. Frequency spectrographs allow visualization of differences between low‐ and high‐frequency sounds, which, in conjunction with the timing and amplitude displayed by phonocardiography, can aid in teaching subtle findings, such as shapes of murmurs, patterns of splitting, gallups, etc.14 Playback of heart sounds in a conference room setting can be challenging, given the often subtle and low‐frequency findings typical of cardiac pathology, and is effectively achieved by using a musician‐quality loudspeaker. We have found that speaker pads offer the best sound quality at the bedside, although they are inconvenient for larger groups.
DISCUSSION
A new framework has been proposed for considering faculty development programs that focuses on the participants, program, content, facilitator, and the context in which the program occurs.15 We have effectively addressed and synthesized these components in a rich, high impact, learner‐centered faculty development program that also responds to challenges raised by changes in the health delivery system, concerns about accreditation requirements, and targeted local needs assessment.
We have been fortunate to recruit specialty faculty who are outstanding teachers, have welcomed the fellows into their clinics, and have dedicated countless hours to supervision and education. An unintended, but important, outcome of the program is that we are able to highlight the exceptional skills of our senior, experienced clinicians. These are colleagues who all too often do not receive adequate recognition in the modern‐day academic medical center environment, but who are undoubtedly invaluable to the education mission of these centers.
The existence of the program has resulted in our general medicine faculty showing great enthusiasm, both to develop an area of expertise and to participate as learners in the programs developed by peers. The faculty fellows in each specialty have become a valuable resource to peer faculty, residents, and medical students alike, who are now less dependent on consultants to identify and explain physical findings. The faculty teaching the knee and shoulder exams started a Sports Medicine Clinic within primary care, and assist with joint injections throughout the clinic. In addition to providing clinical support, their educational curriculum is included in both the attending and housestaff conference schedules. The cardiac lectures, both didactic and interactive case presentations, are included in the attending conference schedule, intern and resident core curricula, and the third‐year medicine clerkship lecture series. The dermatology group has created a series of comprehensive online modules that provide content tailored to general medicine. All this durable material is available broadly to trainees of all professions in our medical center.
Given the ever‐growing burden of patient care and extra‐clinical responsibilities, the principal factor limiting the effectiveness of bedside rounds is faculty availability. Despite this, all of our hospitalists have attended at least 1 bedside cardiac session, and the majority have attended multiple times. Varying the time and day of the sessions, offering to join attending rounds, and being available for impromptu diagnostic consultations have maximized the fellows' contact with faculty, residents, and students.
Although funding for evaluation of the program has been limited, a research agenda is emerging. Both the pulmonary physical exam and critical care groups are in the process of evaluating the effectiveness of their programs on the quality of bedside rounds, student and resident learning, and, to the extent possible, on patient care.
CONCLUSION
We believe wholeheartedly that bedside instruction both in physical diagnosis and interview skills must not become a lost art. General medicine faculty are ideally situated to take on this challenge. An educational program targeting hospitalists and general medicine faculty energizes faculty and leverages local resources to fill in gaps in skills for faculty and then for trainees. Generalist faculty relish the opportunity to champion a particular element of the doctorpatient encounter, which has contributed to our ultimate goal of strengthening the core diagnostic skills of our faculty who are at the forefront of clinical care and medical education.
Acknowledgements
The authors thank the Merrin Family for their generous support of the program; Drs Gregory Mints, Tanping Wong, and Sabrina Felson for their initial work in developing the Merrin Faculty Development Program; and Dr Martin Kahn for his tireless dedication to mentorship and bedside teaching.
Disclosure: Drs Janjigian, Charap, and Kalet report receiving funding from the Merrin Family Foundation.
- , . Cardiac auscultatory skills of internal medicine and family practice trainees. A comparison of diagnostic proficiency. JAMA. 1997;278(9):717–722.
- , , , et al. Competency in cardiac examination skills in medical students, trainees, physicians, and faculty: a multicenter study. Arch Intern Med. 2006;166(6):610–616.
- , , , et al. Confidential testing of cardiac examination competency in cardiology and noncardiology faculty and trainees: a multicenter study. Clin Cardiol. 2010;33(12):738–745.
- , , , . Whither bedside teaching? A focus‐group study of clinical teachers. Acad Med. 2003;78(4):384–390.
- , , , . Effect of hospitalist attending physicians on trainee educational experiences: a systematic review. J Hosp Med. 2009;4(8):490–498.
- , , , , , . Is there a relationship between attending physicians' and residents' teaching skills and students' examination scores? Acad Med. 2000;75(11):1144–1146.
- , , , . A five‐step “microskills” model of clinical teaching. J Am Board Fam Pract. 1992;5(4):419–424.
- , , , , . Attributes of excellent attending‐physician role models. N Engl J Med. 1998;339(27):1986–1993.
- , . Teaching at the bedside: a new model. Med Teach. 2003;25(2):127–130.
- . A theory‐based faculty development program for clinician‐educators. Acad Med. 2000;75(5):498–501.
- Kern D, Thomas P, Howard D, Bass E, ed. Curriculum Development for Medical Education: A Six‐Step Approach. Baltimore, MD: The Johns Hopkins University Press; 1998.
- , , , , . Innovative web‐based multimedia curriculum improves cardiac examination competency of residents. J Hosp Med. 2008;3(2):124–133.
- , , , , . Using virtual patients to improve cardiac examination competency in medical students. Clin Cardiol. 2008;31(7):334–339.
- . Cardiac auscultation: a glorious past—and it does have a future! Circulation. 2006;113(9):1255–1259.
- , . Reframing research on faculty development. Acad Med. 2011;86(4):421–428.
Impact of In‐Hospital EVPCR Testing
Non‐polio enteroviruses are the most common cause of aseptic meningitis in children.1 While bacterial meningitis requires parenteral antibiotics, aseptic meningitis requires only supportive care.1 Enteroviral reverse transcription polymerase chain reaction (EVPCR) testing of the cerebrospinal fluid (CSF) allows the virus to be detected with high sensitivity and specificity.2 Because children with a positive EVPCR test are at low risk of bacterial meningitis,3 access to rapid EVPCR results has the potential to impact the clinical management of children with meningitis.4, 5 We studied the impact of implementing an in‐hospital EVPCR testing protocol on the clinical management of children with meningitis in a single‐center retrospective cohort.
MATERIALS AND METHODS
Study Design and Population
We identified children, 19 years of age, with meningitis evaluated at a single tertiary care pediatric center between July 2006 and June 2010. We defined meningitis as a CSF white blood cell (WBC) count 10 cells/mm3 corrected for the presence of CSF red blood cells (RBCs) (1 WBC for every 500 RBCs).6 We excluded children with any of the following: critical illness (defined as hypotension or respiratory failure), purpura, recent neurosurgery, ventricular shunt, immunosuppression, focal bacterial infection requiring parenteral antibiotics, positive CSF Gram stain, or known Lyme disease. The Institutional Review Board approved this study with waiver of informed consent.
Data Collection and Case Definitions
We abstracted historical and physical examination findings, as well as laboratory and microbiologic results, from the medical record. We defined bacterial meningitis as the isolation of pathogenic bacteria from the CSF or blood cultures. Children who had received antibiotics within 72 hours of diagnostic lumbar puncture, with negative cultures, were considered to have pretreated culture‐negative meningitis. Otherwise, children with negative bacterial cultures were classified as having aseptic meningitis.
EVPCR Testing
During the study pre‐period (July 1, 2006 through June 23, 2008), EVPCR tests were flown once daily to a commercial laboratory (ARUP Laboratories, Salt Lake City, UT) where they were run in batches. During the post‐period (June 24, 2008 through June 30, 2010), the study institution replaced the send‐out test with an in‐hospital EVPCR test (Gene Xpert EV Technology; Cepheid, Sunnyvale, CA)7 that allows multiple specimens to be run simultaneously, multiple times daily (between 7:00 AM and 10:00 PM), with results available in as little as 2.5 hours. We defined turnaround time for the test from specimen obtainment to test result.
Outcome Measures
Our 2 primary outcomes were length of stay and duration of parenteral antibiotics. Length of stay was measured as time from emergency department arrival to discharge (emergency department or inpatient discharge). We defined the duration of parenteral antibiotics as time from the first to the last dose of parenteral antibiotics administered, plus the standard antibiotic dosing interval for that antibiotic. For children with Lyme meningitis, the duration of parenteral antibiotic coverage was defined a priori as 48 hours, the standard time to reliably exclude bacterial growth from culture.8
Statistical Methods
Primary outcomes were compared using univariate analyses in 6 patient groups: 1) all patients, and those with 2) a positive EVPCR test, 3) a negative EVPCR test, and a positive test who were 4) 90 days old, 5) >90 days old, and 6) presented during peak enteroviral season (June through October). We utilized MannWhitney tests for continuous variables and 2 tests for proportions. We compared the median turnaround time for EVPCR results and the percentage of tests returning prior to discharge between the pre‐ and post‐periods. We performed interrupted time series spline analyses to assess for trends in our primary outcomes, independent of the change in EVPCR testing protocol. All analyses were conducted using the Statistical Package for the Social Sciences (IBM SPSS Inc, Chicago, IL).9
RESULTS
Of the 593 children with meningitis, 152 (26%) were excluded for the reasons noted above. The 441 patients included in our analyses had the following final diagnoses: bacterial meningitis (1 patient with Streptococcus pneumoniae, 0.2%), pretreated culture‐negative meningitis (42 patients, 10%), and aseptic meningitis (398 patients, 90%).
We compared patient populations and EVPCR testing characteristics between the pre‐ and post‐study periods (Table 1). While CSF glucose differed between study periods, the difference was not felt to be clinically significant. However, during the post‐period, more children presented during enteroviral season. Clinicians were more likely to order an EVPCR test for children with aseptic, than bacterial, meningitis (213/370 [58%] vs 0/1 [0%]).
| Characteristic | Pre‐period (N = 225) | Post‐period (N = 216) | P Value |
|---|---|---|---|
| |||
| Demographics | |||
| Age (months)* | 3 (2106) | 3 (188) | 0.20 |
| Male, n (%) | 135 (60) | 129 (60) | 0.95 |
| Historical features | |||
| Duration of illness (days)* | 2 (14) | 2 (14) | 0.20 |
| Duration of fever (days)* | 1 (12) | 1 (12) | 0.52 |
| Antibiotic pretreatment, n (%) | 29 (13) | 13 (6.0) | 0.015 |
| Temperature at ED presentation* (C) | 37.6 (36.838.4) | 37.8 (37.138.2) | 0.51 |
| Presentation June through October, n (%) | 127 (56) | 143 (66) | 0.040 |
| Laboratory results | |||
| Peripheral WBC (cells/mm3)* | 10.4 (8.213.7) | 10.4 (7.813.6) | 0.67 |
| Peripheral ANC (cells/mm3)* | 5.2 (3.17.4) | 4.9 (2.68.2) | 0.47 |
| CSF WBC (cells/mm3)* | 55 (19176) | 62 (17250) | 0.66 |
| CSF ANC (cells/mm3)* | 8 (045) | 7 (141) | 0.78 |
| CSF glucose (mg/dL)* | 57 (5065) | 54 (4860) | 0.01 |
| CSF protein(mg/dL)* | 50 (3480) | 48 (3470) | 0.73 |
| Traumatic lumbar puncture (CSF RBC 500 cells/mm3), n (%) | 48 (21) | 43 (20) | 0.71 |
| Patient management | |||
| Admission to the hospital, n (%) | 196 (87) | 190 (88) | 0.68 |
| Parenteral antibiotics initiated, n (%) | 206 (92) | 200 (93) | 0.80 |
| Enteroviral PCR Testing | |||
| Testing utilization, n (%) | 62 (28) | 133 (62) | 0.001 |
| 90 days of age, n (%) | 18 (16) | 57/114 (50) | 0.001 |
| >90 days of age, n (%) | 44 (39) | 76/102 (75) | 0.001 |
| Positive test result, n (%) | 33 (53) | 80 (60) | 0.22 |
| Test turnaround time, hours* | 53 (4667) | 12 (617) | 0.001 |
We evaluated the impact of the in‐hospital EVPCR test on the length of stay and duration of parenteral antibiotics for the 6 predefined patient groups (Table 2). Length of stay could be determined for 432 (98%) of study patients, and duration of parenteral antibiotics for 365 (83%). We found a clinically important decrease in both length of stay and duration of parenteral antibiotics for children with a positive EVPCR test in the post‐period. For every hour earlier the EVPCR results returned, length of stay was reduced by 0.3 hours ( = 0.3, 95% confidence interval [CI] 0.10.5), and parenteral antibiotics were reduced by 0.3 hours ( = 0.3, 95% CI 0.10.5). However, even in the post‐period, the median length of time from a positive EVPCR test result to hospital discharge was 14 hours (interquartile range, 533 hours).
| Patient Group | Pre‐Period | Post‐Period | P Value1 |
|---|---|---|---|
| |||
| 1) All study patients | N = 225 | N = 216 | |
| Length of stay* | 49 (2662) | 47 (2662) | 0.09 |
| Duration of parenteral antibiotics* | 48 (2464) | 48 (2460) | 0.23 |
| 2) Children with a positive EVPCR test | N = 32 | N = 80 | |
| Length of stay* | 44 (2854) | 28 (1946) | 0.005 |
| Duration of parenteral antibiotics* | 48 (3072) | 36 (2449) | 0.037 |
| 3) Children with a negative EVPCR test | N = 29 | N = 53 | |
| Length of stay* | 61 (30114) | 59 (45109) | 0.67 |
| Duration of parenteral antibiotics* | 52 (4784) | 54 (4870) | 0.93 |
| 4) Children 90 days of age with positive EVPCR test | N = 9 | N =39 | |
| Length of stay* | 66 (5071) | 37 (2753) | 0.003 |
| Duration of parenteral antibiotics* | 74 (6994) | 48 (3660) | 0.002 |
| 5) Children >90 days of age with positive EVPCR test | N = 23 | N = 41 | |
| Length of stay* | 32 (2750) | 21 (430) | 0.002 |
| Duration of parenteral antibiotics* | 38 (2460) | 24 (2436) | 0.009 |
| 6) Children with a positive EVPCR test who presented during peak enteroviral season | N = 29 | N = 72 | |
| Length of stay* | 43 (2853) | 26 (1738) | 0.002 |
| Duration of parenteral antibiotics* | 46 (2470) | 36 (2448) | 0.05 |
We observed no trend in length of stay in either testing period ( = 0.17, 95% CI 3.9 to 3.6 pre vs = 1.64, 95% CI 6.3 to 3.0 post), with no change following the introduction of the faster EVPCR protocol (P = 0.52). We observed an increase in duration of parenteral antibiotics in the pre‐period ( = 5.4, 95% CI 0.3 to 10.6), with no trend in the post‐period ( = 1.7, 95% CI 5.2 to 1.8), but the difference was not significant (P = 0.08).
DISCUSSION
The in‐hospital EVPCR testing protocol reduced test turnaround time and increased testing. Children with a positive test had a shorter length of stay and duration of parenteral antibiotics. Decreasing the test turnaround time for EVPCR improved the care of children with enteroviral meningitis by reducing the length of unnecessary hospitalizations and parenteral antibiotics, with the potential for reducing the costs associated with these admissions.
Accurate identification of children with enteroviral meningitis, an often self‐limited infection requiring supportive care, can reduce hospitalization and unnecessary antibiotics. Previously, a positive EVPCR test result has been associated with a reduction in length of stay and of parenteral antibiotics,4, 5, 1012 with a direct correlation between test turnaround time and length of stay.12, 13 Moreover, positive EVPCR test results that were available prior to hospital discharge resulted in shorter length of hospital stay and duration of parenteral antibiotics.10
Our study is the largest to investigate the impact of implementing an in‐hospital EVPCR testing protocol, with the goal of making results available in a clinically useful time frame for all patients. Older EVPCR tests were typically performed in batches, or at centralized laboratories.4, 5, 1013 The in‐hospital EVPCR test utilized is a simple testing platform, which can be run multiple times daily. While there were higher charges associated with increased testing in the post‐period, these were more than offset by a reduced length of stay. Using study institution patient charges, we estimate that overall patient charges decreased approximately $80,000 in the post‐period, compared to the pre‐period (an average reduction of $375 per patient).
Many children were not discharged when a positive EVPCR test result became available. Some children with enteroviral meningitis will have persistent symptoms that require inpatient management. In addition, results that returned in the evening or nighttime were less likely to result in immediate hospital discharge. However, children with a positive EVPCR test are at very low risk for bacterial meningitis.3 As clinicians' knowledge of, and comfort with, the EVPCR test increase, this technology has the potential to further decrease the costs of caring for children with enteroviral meningitis.14
Our study had several limitations. First, it was retrospective; however, primary outcomes were objective measures accurately recorded in the medical record for most patients. Second, our study was single‐center, and findings may not be generalizable to other settings. Third, the management of children with meningitis may have been changing over the study period, independent of the in‐hospital EVPCR test. However, among children with a negative test, we observed no change in either of our primary outcomes. Fourth, given the large number of physicians involved with testing and treatment decisions, we could not adjust for clustering at the physician level. Fifth, we corrected CSF WBC in the case of a traumatic lumbar puncture (LP). Although use of this correction might underestimate the true CSF WBC count,6 the percentage of children with traumatic lumbar punctures was the same in both testing periods. Lastly, we evaluated the impact of a diagnostic test immediately after introduction into the clinical setting. As new medical technologies often take time to be adopted into clinical practice,15 we would expect the impact to increase over time.
CONCLUSIONS
In‐hospital EVPCR testing can improve the care of children with meningitis by reducing the length of unnecessary hospitalizations and parenteral antibiotics. Clinicians caring for children with meningitis should have access to in‐hospital EVPCR testing.
Acknowledgements
Disclosure: Nothing to report.
- .Enteroviral infections of the central nervous system.Clin Infect Dis.1995;20(4):971–981.
- ,,, et al.Clinical utility of the polymerase chain reaction for diagnosis of enteroviral meningitis in infancy.J Pediatr.1997;131(3):393–397.
- ,,,.Low risk of bacterial meningitis in children with a positive enteroviral polymerase chain reaction test result.Clin Infect Dis.2010;51(10):1221–1222.
- ,,,,,.Impact of rapid polymerase chain reaction results on management of pediatric patients with enteroviral meningitis.Pediatr Infect Dis J.2002;21(4):283–286.
- ,,,,,.Routine cerebrospinal fluid enterovirus polymerase chain reaction testing reduces hospitalization and antibiotic use for infants 90 days of age or younger.Pediatrics.2007;120(3):489–496.
- ,,,,,.Traumatic lumbar punctures in neonates: test performance of the cerebrospinal fluid white blood cell count.Pediatr Infect Dis J.2008;27(12):1047–1051.
- ,,, et al.Multicenter beta trial of the GeneXpert enterovirus assay.J Clin Microbiol.2007;45(4):1081–1086.
- ,.Most cerebrospinal fluid cultures in children with bacterial meningitis are positive within two days.Pediatr Infect Dis J.1999;18(8):732–733.
- SPSS for Windows [computer program]. Version 19.0.0.Chicago, IL:IBM SPSS Inc;2009.
- ,,,,.Impact of a diagnostic cerebrospinal fluid enterovirus polymerase chain reaction test on patient management.JAMA.2000;283(20):2680–2685.
- ,,,,.The impact of an enteroviral RT‐PCR assay on the diagnosis of aseptic meningitis and patient management.J Clin Virol.2002;25(suppl 1):S19–S26.
- ,,, et al.Impact of rapid enterovirus molecular diagnosis on the management of infants, children, and adults with aseptic meningitis.J Med Virol.2009;81(1):42–48.
- ,,, et al.A one‐step RT‐PCR assay using an enzyme‐linked detection system for the diagnosis of enterovirus meningitis.J Clin Virol.2000;17(3):143–149.
- ,.Cost analysis of enteroviral polymerase chain reaction in infants with fever and cerebrospinal fluid pleocytosis.Arch Pediatr Adolesc Med.2000;154(8):817–821.
- .Adoption of new surgical technology.BMJ.2006;332(7533):112–114.
Non‐polio enteroviruses are the most common cause of aseptic meningitis in children.1 While bacterial meningitis requires parenteral antibiotics, aseptic meningitis requires only supportive care.1 Enteroviral reverse transcription polymerase chain reaction (EVPCR) testing of the cerebrospinal fluid (CSF) allows the virus to be detected with high sensitivity and specificity.2 Because children with a positive EVPCR test are at low risk of bacterial meningitis,3 access to rapid EVPCR results has the potential to impact the clinical management of children with meningitis.4, 5 We studied the impact of implementing an in‐hospital EVPCR testing protocol on the clinical management of children with meningitis in a single‐center retrospective cohort.
MATERIALS AND METHODS
Study Design and Population
We identified children, 19 years of age, with meningitis evaluated at a single tertiary care pediatric center between July 2006 and June 2010. We defined meningitis as a CSF white blood cell (WBC) count 10 cells/mm3 corrected for the presence of CSF red blood cells (RBCs) (1 WBC for every 500 RBCs).6 We excluded children with any of the following: critical illness (defined as hypotension or respiratory failure), purpura, recent neurosurgery, ventricular shunt, immunosuppression, focal bacterial infection requiring parenteral antibiotics, positive CSF Gram stain, or known Lyme disease. The Institutional Review Board approved this study with waiver of informed consent.
Data Collection and Case Definitions
We abstracted historical and physical examination findings, as well as laboratory and microbiologic results, from the medical record. We defined bacterial meningitis as the isolation of pathogenic bacteria from the CSF or blood cultures. Children who had received antibiotics within 72 hours of diagnostic lumbar puncture, with negative cultures, were considered to have pretreated culture‐negative meningitis. Otherwise, children with negative bacterial cultures were classified as having aseptic meningitis.
EVPCR Testing
During the study pre‐period (July 1, 2006 through June 23, 2008), EVPCR tests were flown once daily to a commercial laboratory (ARUP Laboratories, Salt Lake City, UT) where they were run in batches. During the post‐period (June 24, 2008 through June 30, 2010), the study institution replaced the send‐out test with an in‐hospital EVPCR test (Gene Xpert EV Technology; Cepheid, Sunnyvale, CA)7 that allows multiple specimens to be run simultaneously, multiple times daily (between 7:00 AM and 10:00 PM), with results available in as little as 2.5 hours. We defined turnaround time for the test from specimen obtainment to test result.
Outcome Measures
Our 2 primary outcomes were length of stay and duration of parenteral antibiotics. Length of stay was measured as time from emergency department arrival to discharge (emergency department or inpatient discharge). We defined the duration of parenteral antibiotics as time from the first to the last dose of parenteral antibiotics administered, plus the standard antibiotic dosing interval for that antibiotic. For children with Lyme meningitis, the duration of parenteral antibiotic coverage was defined a priori as 48 hours, the standard time to reliably exclude bacterial growth from culture.8
Statistical Methods
Primary outcomes were compared using univariate analyses in 6 patient groups: 1) all patients, and those with 2) a positive EVPCR test, 3) a negative EVPCR test, and a positive test who were 4) 90 days old, 5) >90 days old, and 6) presented during peak enteroviral season (June through October). We utilized MannWhitney tests for continuous variables and 2 tests for proportions. We compared the median turnaround time for EVPCR results and the percentage of tests returning prior to discharge between the pre‐ and post‐periods. We performed interrupted time series spline analyses to assess for trends in our primary outcomes, independent of the change in EVPCR testing protocol. All analyses were conducted using the Statistical Package for the Social Sciences (IBM SPSS Inc, Chicago, IL).9
RESULTS
Of the 593 children with meningitis, 152 (26%) were excluded for the reasons noted above. The 441 patients included in our analyses had the following final diagnoses: bacterial meningitis (1 patient with Streptococcus pneumoniae, 0.2%), pretreated culture‐negative meningitis (42 patients, 10%), and aseptic meningitis (398 patients, 90%).
We compared patient populations and EVPCR testing characteristics between the pre‐ and post‐study periods (Table 1). While CSF glucose differed between study periods, the difference was not felt to be clinically significant. However, during the post‐period, more children presented during enteroviral season. Clinicians were more likely to order an EVPCR test for children with aseptic, than bacterial, meningitis (213/370 [58%] vs 0/1 [0%]).
| Characteristic | Pre‐period (N = 225) | Post‐period (N = 216) | P Value |
|---|---|---|---|
| |||
| Demographics | |||
| Age (months)* | 3 (2106) | 3 (188) | 0.20 |
| Male, n (%) | 135 (60) | 129 (60) | 0.95 |
| Historical features | |||
| Duration of illness (days)* | 2 (14) | 2 (14) | 0.20 |
| Duration of fever (days)* | 1 (12) | 1 (12) | 0.52 |
| Antibiotic pretreatment, n (%) | 29 (13) | 13 (6.0) | 0.015 |
| Temperature at ED presentation* (C) | 37.6 (36.838.4) | 37.8 (37.138.2) | 0.51 |
| Presentation June through October, n (%) | 127 (56) | 143 (66) | 0.040 |
| Laboratory results | |||
| Peripheral WBC (cells/mm3)* | 10.4 (8.213.7) | 10.4 (7.813.6) | 0.67 |
| Peripheral ANC (cells/mm3)* | 5.2 (3.17.4) | 4.9 (2.68.2) | 0.47 |
| CSF WBC (cells/mm3)* | 55 (19176) | 62 (17250) | 0.66 |
| CSF ANC (cells/mm3)* | 8 (045) | 7 (141) | 0.78 |
| CSF glucose (mg/dL)* | 57 (5065) | 54 (4860) | 0.01 |
| CSF protein(mg/dL)* | 50 (3480) | 48 (3470) | 0.73 |
| Traumatic lumbar puncture (CSF RBC 500 cells/mm3), n (%) | 48 (21) | 43 (20) | 0.71 |
| Patient management | |||
| Admission to the hospital, n (%) | 196 (87) | 190 (88) | 0.68 |
| Parenteral antibiotics initiated, n (%) | 206 (92) | 200 (93) | 0.80 |
| Enteroviral PCR Testing | |||
| Testing utilization, n (%) | 62 (28) | 133 (62) | 0.001 |
| 90 days of age, n (%) | 18 (16) | 57/114 (50) | 0.001 |
| >90 days of age, n (%) | 44 (39) | 76/102 (75) | 0.001 |
| Positive test result, n (%) | 33 (53) | 80 (60) | 0.22 |
| Test turnaround time, hours* | 53 (4667) | 12 (617) | 0.001 |
We evaluated the impact of the in‐hospital EVPCR test on the length of stay and duration of parenteral antibiotics for the 6 predefined patient groups (Table 2). Length of stay could be determined for 432 (98%) of study patients, and duration of parenteral antibiotics for 365 (83%). We found a clinically important decrease in both length of stay and duration of parenteral antibiotics for children with a positive EVPCR test in the post‐period. For every hour earlier the EVPCR results returned, length of stay was reduced by 0.3 hours ( = 0.3, 95% confidence interval [CI] 0.10.5), and parenteral antibiotics were reduced by 0.3 hours ( = 0.3, 95% CI 0.10.5). However, even in the post‐period, the median length of time from a positive EVPCR test result to hospital discharge was 14 hours (interquartile range, 533 hours).
| Patient Group | Pre‐Period | Post‐Period | P Value1 |
|---|---|---|---|
| |||
| 1) All study patients | N = 225 | N = 216 | |
| Length of stay* | 49 (2662) | 47 (2662) | 0.09 |
| Duration of parenteral antibiotics* | 48 (2464) | 48 (2460) | 0.23 |
| 2) Children with a positive EVPCR test | N = 32 | N = 80 | |
| Length of stay* | 44 (2854) | 28 (1946) | 0.005 |
| Duration of parenteral antibiotics* | 48 (3072) | 36 (2449) | 0.037 |
| 3) Children with a negative EVPCR test | N = 29 | N = 53 | |
| Length of stay* | 61 (30114) | 59 (45109) | 0.67 |
| Duration of parenteral antibiotics* | 52 (4784) | 54 (4870) | 0.93 |
| 4) Children 90 days of age with positive EVPCR test | N = 9 | N =39 | |
| Length of stay* | 66 (5071) | 37 (2753) | 0.003 |
| Duration of parenteral antibiotics* | 74 (6994) | 48 (3660) | 0.002 |
| 5) Children >90 days of age with positive EVPCR test | N = 23 | N = 41 | |
| Length of stay* | 32 (2750) | 21 (430) | 0.002 |
| Duration of parenteral antibiotics* | 38 (2460) | 24 (2436) | 0.009 |
| 6) Children with a positive EVPCR test who presented during peak enteroviral season | N = 29 | N = 72 | |
| Length of stay* | 43 (2853) | 26 (1738) | 0.002 |
| Duration of parenteral antibiotics* | 46 (2470) | 36 (2448) | 0.05 |
We observed no trend in length of stay in either testing period ( = 0.17, 95% CI 3.9 to 3.6 pre vs = 1.64, 95% CI 6.3 to 3.0 post), with no change following the introduction of the faster EVPCR protocol (P = 0.52). We observed an increase in duration of parenteral antibiotics in the pre‐period ( = 5.4, 95% CI 0.3 to 10.6), with no trend in the post‐period ( = 1.7, 95% CI 5.2 to 1.8), but the difference was not significant (P = 0.08).
DISCUSSION
The in‐hospital EVPCR testing protocol reduced test turnaround time and increased testing. Children with a positive test had a shorter length of stay and duration of parenteral antibiotics. Decreasing the test turnaround time for EVPCR improved the care of children with enteroviral meningitis by reducing the length of unnecessary hospitalizations and parenteral antibiotics, with the potential for reducing the costs associated with these admissions.
Accurate identification of children with enteroviral meningitis, an often self‐limited infection requiring supportive care, can reduce hospitalization and unnecessary antibiotics. Previously, a positive EVPCR test result has been associated with a reduction in length of stay and of parenteral antibiotics,4, 5, 1012 with a direct correlation between test turnaround time and length of stay.12, 13 Moreover, positive EVPCR test results that were available prior to hospital discharge resulted in shorter length of hospital stay and duration of parenteral antibiotics.10
Our study is the largest to investigate the impact of implementing an in‐hospital EVPCR testing protocol, with the goal of making results available in a clinically useful time frame for all patients. Older EVPCR tests were typically performed in batches, or at centralized laboratories.4, 5, 1013 The in‐hospital EVPCR test utilized is a simple testing platform, which can be run multiple times daily. While there were higher charges associated with increased testing in the post‐period, these were more than offset by a reduced length of stay. Using study institution patient charges, we estimate that overall patient charges decreased approximately $80,000 in the post‐period, compared to the pre‐period (an average reduction of $375 per patient).
Many children were not discharged when a positive EVPCR test result became available. Some children with enteroviral meningitis will have persistent symptoms that require inpatient management. In addition, results that returned in the evening or nighttime were less likely to result in immediate hospital discharge. However, children with a positive EVPCR test are at very low risk for bacterial meningitis.3 As clinicians' knowledge of, and comfort with, the EVPCR test increase, this technology has the potential to further decrease the costs of caring for children with enteroviral meningitis.14
Our study had several limitations. First, it was retrospective; however, primary outcomes were objective measures accurately recorded in the medical record for most patients. Second, our study was single‐center, and findings may not be generalizable to other settings. Third, the management of children with meningitis may have been changing over the study period, independent of the in‐hospital EVPCR test. However, among children with a negative test, we observed no change in either of our primary outcomes. Fourth, given the large number of physicians involved with testing and treatment decisions, we could not adjust for clustering at the physician level. Fifth, we corrected CSF WBC in the case of a traumatic lumbar puncture (LP). Although use of this correction might underestimate the true CSF WBC count,6 the percentage of children with traumatic lumbar punctures was the same in both testing periods. Lastly, we evaluated the impact of a diagnostic test immediately after introduction into the clinical setting. As new medical technologies often take time to be adopted into clinical practice,15 we would expect the impact to increase over time.
CONCLUSIONS
In‐hospital EVPCR testing can improve the care of children with meningitis by reducing the length of unnecessary hospitalizations and parenteral antibiotics. Clinicians caring for children with meningitis should have access to in‐hospital EVPCR testing.
Acknowledgements
Disclosure: Nothing to report.
- .Enteroviral infections of the central nervous system.Clin Infect Dis.1995;20(4):971–981.
- ,,, et al.Clinical utility of the polymerase chain reaction for diagnosis of enteroviral meningitis in infancy.J Pediatr.1997;131(3):393–397.
- ,,,.Low risk of bacterial meningitis in children with a positive enteroviral polymerase chain reaction test result.Clin Infect Dis.2010;51(10):1221–1222.
- ,,,,,.Impact of rapid polymerase chain reaction results on management of pediatric patients with enteroviral meningitis.Pediatr Infect Dis J.2002;21(4):283–286.
- ,,,,,.Routine cerebrospinal fluid enterovirus polymerase chain reaction testing reduces hospitalization and antibiotic use for infants 90 days of age or younger.Pediatrics.2007;120(3):489–496.
- ,,,,,.Traumatic lumbar punctures in neonates: test performance of the cerebrospinal fluid white blood cell count.Pediatr Infect Dis J.2008;27(12):1047–1051.
- ,,, et al.Multicenter beta trial of the GeneXpert enterovirus assay.J Clin Microbiol.2007;45(4):1081–1086.
- ,.Most cerebrospinal fluid cultures in children with bacterial meningitis are positive within two days.Pediatr Infect Dis J.1999;18(8):732–733.
- SPSS for Windows [computer program]. Version 19.0.0.Chicago, IL:IBM SPSS Inc;2009.
- ,,,,.Impact of a diagnostic cerebrospinal fluid enterovirus polymerase chain reaction test on patient management.JAMA.2000;283(20):2680–2685.
- ,,,,.The impact of an enteroviral RT‐PCR assay on the diagnosis of aseptic meningitis and patient management.J Clin Virol.2002;25(suppl 1):S19–S26.
- ,,, et al.Impact of rapid enterovirus molecular diagnosis on the management of infants, children, and adults with aseptic meningitis.J Med Virol.2009;81(1):42–48.
- ,,, et al.A one‐step RT‐PCR assay using an enzyme‐linked detection system for the diagnosis of enterovirus meningitis.J Clin Virol.2000;17(3):143–149.
- ,.Cost analysis of enteroviral polymerase chain reaction in infants with fever and cerebrospinal fluid pleocytosis.Arch Pediatr Adolesc Med.2000;154(8):817–821.
- .Adoption of new surgical technology.BMJ.2006;332(7533):112–114.
Verbal Communication at Discharge
Hospital discharge can be hazardous because discontinuity and fragmentation of care increase risks to the patient. Inadequate communication has been identified as a major etiology for errors and adverse events occurring shortly after discharge.1, 2 Another potential result of a failed hospital discharge is patient dissatisfaction. Increased patient involvement in care improves health outcomes, and may improve patient satisfaction.3 To engage patients in their care, healthcare providers must collaborate with patients to coordinate care across settings.
In this study, we sought to determine what patients and their caregivers view as essential elements of a safe and high‐quality discharge process. We developed a survey with a broad range of questions related to the hospital discharge process (see Supporting Information, Appendix A, in the online version of this article). The survey included several questions derived from Project BOOST (Better Outcomes for Older adults through Safe Transitions) discharge care plans.4
METHODS
Study Design
We surveyed patients on the second day of admission to the internal medicine wards at the University of Washington Medical Center (a 450‐bed tertiary care teaching hospital) and Harborview Medical Center (a 412‐bed county teaching hospital) from June 1, 2010 to August 1, 2010. All patients 18 years old who were admitted during weekdays were considered for participation. Any potential participant unable to manually fill out the survey was offered the opportunity to use a proxy to help complete the survey. A proxy was any adult support person who was present in the room at the time the patient was approached with the opportunity to participate. Patients were excluded only if they (or their proxies) could not read English. The second day of hospitalization was chosen for several reasons: 1) to attempt to assess patients at a similar point in their hospital stay; 2) to avoid the day of discharge, as this may have introduced confounders such as patients who were actively engaged in the discharge process; and 3) to avoid the day of admission to increase the likelihood that patients would be medically stable at the time of the survey.
The Survey
The study protocol was reviewed and approved by the University of Washington Committee for the Protection of Human Subjects. All subjects gave verbal informed consent. The survey consisted of 3 sections: demographics, questions gauging the importance of various key points in the discharge process to patients, and open‐ended questions. Responses to questions used a Likert scale. Responses to open‐ended questions were handwritten on the paper survey.
Statistical Analysis
The quantitative data were classified categorically and analyzed using Fisher's exact test. Three investigators (M.S., S.E.M., M.B.J.) individually reviewed and coded all written patient or proxy comments using grounded theory methodology.5 Discrepant coding was identified and reconciled. The reconciled coded comments were aggregated into themes.
RESULTS
Demographics
We screened 240 patients or proxies and 200 completed the survey; 10.4% were ineligible due to language barrier, and 6.3% refused. Ninety‐two percent of patients completed the surveys. A majority were male (62.5%), 1859 years old (80%); spoke English as their first language (66%); were community‐dwelling prior to hospitalization (59%); were followed by a primary care provider (PCP) (53%), and many had at least a 4‐year‐college education (45%). One hundred eighty‐five surveys (92.5%) were completed by patients, and 15 (7.5%) were completed by proxies. Ninety surveys were completed at the county teaching hospital, and 110 surveys were completed at the tertiary teaching hospital. See Table 1 for detailed demographic information.
| Patient age, n (%) | |
| 1859 yr | 160 (80) |
| 6069 yr | 30 (15) |
| 7079 yr | 5 (2.5) |
| 80 and older | 5 (2.5) |
| Patient gender, n (%) | |
| Male | 125 (62.5) |
| Female | 75 (37.5) |
| Patient schooling, n (%) | |
| Less than high school | 20 (10) |
| High school | 50 (25) |
| Two‐year college | 40 (20) |
| Four‐year college | 70 (35) |
| Graduate education | 20 (10) |
| English is patient's first language, n (%) | |
| Yes | 132 (66) |
| No | 68 (34) |
| Patient has a primary care doctor, n (%) | |
| Yes | 106 (53) |
| No | 94 (47) |
| Patient's residence before hospitalization, n (%) | |
| Home without home health | 64 (32) |
| Home with home health | 54 (27) |
| Skilled nursing facility | 52 (26) |
| Shelter | 30 (15) |
Survey Results
One hundred percent of patients rated the following items as essential (highest category on Likert Scale): when you need to follow‐up with primary care doctor, warning signs to call primary care doctor, and medicines to continue post‐hospitalization (Figure 1). Patients rated the following items as less important (these items were not unanimously rated as extremely important or essential): treatment you received, medicines you took pre‐hospitalization, importance of bringing all your medicines to follow‐up appointments, and given the side effect of each medication. One hundred percent of patients wanted a lot of explanation (highest category on Likert Scale) about my condition and my test results. Only 39% of patients wanted a lot of explanation about discharge medications. Sixty‐one percent wanted somewhat of an explanation about discharge medications. When asked to choose the most important piece of information, 67.5% of patients chose lifestyle changes. See Figure 1 for the relative importance of the items.

The majority of patients surveyed, 173 (86.5%), wanted verbal discharge instructions with or without written discharge instructions, with only 10.5% requesting only written discharge instructions (P 0.0001). The majority of patients, 168 (84%), wanted resources to read about their medical condition, with 97 (57%) requesting brochures and 62 (36.9%) requesting Web sites. One hundred percent of patients thought that personal communication between the inpatient provider and the primary care doctor was extremely important or essential.
We identified 4 major themes in our qualitative review of the patients' and proxies' comments: verbal communication, frustration, opacity of system, and too many physicians. Participant quotes related to the 4 major themes are presented in Table 2. Many participants expressed a desire for verbal, rather than written, communication at the time of discharge with their healthcare team; patients particularly requested time for verbal communication with their physician. In the frustration theme, many patients and caregivers expressed frustration that the healthcare team was not carefully listening to them. In the theme of too many physicians, many patients expressed feeling overwhelmed by the number of different doctors involved in their care; particularly at discharge, patients did not know to whom to direct questions. Finally, as part of the opacity of system theme, patient comments included concerns regarding how information will be passed to outside doctors, and that the system of communication is not clear.
| Verbal communication |
| Can we just stop and talk? Everybody is rushing in and out. |
| I just want my doctor to stop by before I go home and tell me what the plan is. |
| Sometimes I feel like no one is talking to me. All they do is give me paperwork. |
| I want my doctors to sit down with me before I leave the hospital and tell me exactly what I need to do so that I don't come back. |
| I don't want papers, I want people. I want to talk to someone and not read my problems from a sheet of paper. |
| Frustration |
| I wonder sometimes if anyone is listening to me I seem to be part of a very elaborate organization that has its own rules and regulations and will not alter its ways. |
| Why do I have to keep retelling my story? It gets tiring. I wish my story could just be told once. |
| Too many physicians |
| I saw lots of doctors during my time here, but I didn't see them again when I was leaving. |
| I see so many doctors I have no idea who is in charge and who I should direct my questions to. |
| I feel overwhelmed by the number of doctors I see every time I come into the hospital. |
| I want my main doctor to talk to me. I get so confused when I hear from more than one doctor. |
| I miss the days when my primary doctor came in to check on me. He knew exactly what I needed. Now, I meet new people every time I go into the hospital. |
| Opacity of system |
| I wonder if all my doctors talk to each other. Sometimes, it seems like they don't. |
| Who keeps track of all this information? Is there someone who will pass on what happened to me here to the outside world? |
DISCUSSION
Discharge is a period of transition from hospital to home that involves a transfer in responsibility from the inpatient care team to the patient and/or caregivers and primary care physician. Ineffective communication, planning, and coordination of care can undermine patient satisfaction, increase adverse events, and contribute to more frequent hospital readmissions.
The patients we surveyed uniformly placed high value on verbal (more than written) communication about discharge care plans. Protected time during the discharge process for hospital staff to provide verbal recommendations to patients, especially about when they should return for follow‐up, warning signs to contact PCP sooner, and medications to continue after discharge, may improve patient satisfaction.
In open‐ended comments, several subjects suggested that physicians should sit down in the patient's room and provide verbal discharge instructions. Although it is well recognized that verbal communication alone has limitations and that providing patients with written instructions remains crucial, verbal reinforcement may highlight the most important instructions.
Interestingly, subjects valued information about lifestyle changes over detailed information about their medications. This may suggest that hospitalized patients are particularly receptive to information about lifestyle changes such as smoking cessation or importance of compliance with medical appointments.
Lastly, patients we surveyed value personal communication between inpatient and outpatient providers. It is plausible that this would improve transitions of care, and previous studies have suggested that direct communication between inpatient and outpatient providers occurs infrequently, with only 20% of primary care providers in 1 study reporting that they are always notified when their patient is being discharged from a hospitalist service.6
The themes that emerged from our open‐ended questions also highlight the importance of direct verbal communication with patients and careful coordination of care with outside physicians. Because patients may be unlikely to fully remember verbal instructions at discharge, providers may consider providing patients and family members with patient‐centered written materials to take home in order to reinforce important self‐care instructions. The patient comments further suggest that patients may be more satisfied, and that discharges may be smoother, if 1 or 2 physicians were always identified to the patients and their caregivers as the leaders of the care team throughout the hospital course and discharge process.
Our study had several limitations. We only surveyed patients on general medicine services, so our findings might not apply to other populations. We did not enroll participants on weekends and holidays; it is possible that this led to some bias in the enrollment of subjects. We also only surveyed patients and/or proxies who could speak and read English, and this was a fairly highly educated population, with almost half having completed 4 years of college. Finally, we relied on participant self‐report for demographic information because we did not have access to the electronic medical record. This study was conducted at 2 large academic medical centers that include resident physicians in the daily care of patients; thus, these results may not be generalizable to other settings.
Effective verbal communication between physicians, outpatient providers, patients, and their caregivers about discharge care plans might improve patients' understanding of their hospitalizations, increase their satisfaction with care, and reduce readmissions. In addition, physicians should recognize that patients value advice about lifestyle interventions that might improve their health, as part of the discharge care plan. Intervention studies are necessary to test these hypotheses in large, diverse populations.
Acknowledgements
Disclosure: Nothing to report.
- ,,,.Medical errors related to discontinuity of care from an inpatient to an outpatient setting.J Gen Intern Med.2003;18(8):646–651.
- ,,,,,.Deficits in communication and information transfer between hospital‐based and primary care physicians: implications for patient safety and continuity of care.JAMA.2007;297(8):831–841.
- ,,.Expanding patient involvement in care. Effects on patient outcomes.Ann Intern Med.1985;102(4):520–528.
- Society of Hospital Medicine. Project BOOST, Better Outcomes for Older adults through Safe Transitions. Available at: http://www.hospitalmedicine.org/AM/Template.cfm?Section=Home1998.
- ,,,.Primary care physician attitudes regarding communication with hospitalists.Am J Med.2001;111(9B):15S–20S.
Hospital discharge can be hazardous because discontinuity and fragmentation of care increase risks to the patient. Inadequate communication has been identified as a major etiology for errors and adverse events occurring shortly after discharge.1, 2 Another potential result of a failed hospital discharge is patient dissatisfaction. Increased patient involvement in care improves health outcomes, and may improve patient satisfaction.3 To engage patients in their care, healthcare providers must collaborate with patients to coordinate care across settings.
In this study, we sought to determine what patients and their caregivers view as essential elements of a safe and high‐quality discharge process. We developed a survey with a broad range of questions related to the hospital discharge process (see Supporting Information, Appendix A, in the online version of this article). The survey included several questions derived from Project BOOST (Better Outcomes for Older adults through Safe Transitions) discharge care plans.4
METHODS
Study Design
We surveyed patients on the second day of admission to the internal medicine wards at the University of Washington Medical Center (a 450‐bed tertiary care teaching hospital) and Harborview Medical Center (a 412‐bed county teaching hospital) from June 1, 2010 to August 1, 2010. All patients 18 years old who were admitted during weekdays were considered for participation. Any potential participant unable to manually fill out the survey was offered the opportunity to use a proxy to help complete the survey. A proxy was any adult support person who was present in the room at the time the patient was approached with the opportunity to participate. Patients were excluded only if they (or their proxies) could not read English. The second day of hospitalization was chosen for several reasons: 1) to attempt to assess patients at a similar point in their hospital stay; 2) to avoid the day of discharge, as this may have introduced confounders such as patients who were actively engaged in the discharge process; and 3) to avoid the day of admission to increase the likelihood that patients would be medically stable at the time of the survey.
The Survey
The study protocol was reviewed and approved by the University of Washington Committee for the Protection of Human Subjects. All subjects gave verbal informed consent. The survey consisted of 3 sections: demographics, questions gauging the importance of various key points in the discharge process to patients, and open‐ended questions. Responses to questions used a Likert scale. Responses to open‐ended questions were handwritten on the paper survey.
Statistical Analysis
The quantitative data were classified categorically and analyzed using Fisher's exact test. Three investigators (M.S., S.E.M., M.B.J.) individually reviewed and coded all written patient or proxy comments using grounded theory methodology.5 Discrepant coding was identified and reconciled. The reconciled coded comments were aggregated into themes.
RESULTS
Demographics
We screened 240 patients or proxies and 200 completed the survey; 10.4% were ineligible due to language barrier, and 6.3% refused. Ninety‐two percent of patients completed the surveys. A majority were male (62.5%), 1859 years old (80%); spoke English as their first language (66%); were community‐dwelling prior to hospitalization (59%); were followed by a primary care provider (PCP) (53%), and many had at least a 4‐year‐college education (45%). One hundred eighty‐five surveys (92.5%) were completed by patients, and 15 (7.5%) were completed by proxies. Ninety surveys were completed at the county teaching hospital, and 110 surveys were completed at the tertiary teaching hospital. See Table 1 for detailed demographic information.
| Patient age, n (%) | |
| 1859 yr | 160 (80) |
| 6069 yr | 30 (15) |
| 7079 yr | 5 (2.5) |
| 80 and older | 5 (2.5) |
| Patient gender, n (%) | |
| Male | 125 (62.5) |
| Female | 75 (37.5) |
| Patient schooling, n (%) | |
| Less than high school | 20 (10) |
| High school | 50 (25) |
| Two‐year college | 40 (20) |
| Four‐year college | 70 (35) |
| Graduate education | 20 (10) |
| English is patient's first language, n (%) | |
| Yes | 132 (66) |
| No | 68 (34) |
| Patient has a primary care doctor, n (%) | |
| Yes | 106 (53) |
| No | 94 (47) |
| Patient's residence before hospitalization, n (%) | |
| Home without home health | 64 (32) |
| Home with home health | 54 (27) |
| Skilled nursing facility | 52 (26) |
| Shelter | 30 (15) |
Survey Results
One hundred percent of patients rated the following items as essential (highest category on Likert Scale): when you need to follow‐up with primary care doctor, warning signs to call primary care doctor, and medicines to continue post‐hospitalization (Figure 1). Patients rated the following items as less important (these items were not unanimously rated as extremely important or essential): treatment you received, medicines you took pre‐hospitalization, importance of bringing all your medicines to follow‐up appointments, and given the side effect of each medication. One hundred percent of patients wanted a lot of explanation (highest category on Likert Scale) about my condition and my test results. Only 39% of patients wanted a lot of explanation about discharge medications. Sixty‐one percent wanted somewhat of an explanation about discharge medications. When asked to choose the most important piece of information, 67.5% of patients chose lifestyle changes. See Figure 1 for the relative importance of the items.
The majority of patients surveyed, 173 (86.5%), wanted verbal discharge instructions with or without written discharge instructions, with only 10.5% requesting only written discharge instructions (P 0.0001). The majority of patients, 168 (84%), wanted resources to read about their medical condition, with 97 (57%) requesting brochures and 62 (36.9%) requesting Web sites. One hundred percent of patients thought that personal communication between the inpatient provider and the primary care doctor was extremely important or essential.
We identified 4 major themes in our qualitative review of the patients' and proxies' comments: verbal communication, frustration, opacity of system, and too many physicians. Participant quotes related to the 4 major themes are presented in Table 2. Many participants expressed a desire for verbal, rather than written, communication at the time of discharge with their healthcare team; patients particularly requested time for verbal communication with their physician. In the frustration theme, many patients and caregivers expressed frustration that the healthcare team was not carefully listening to them. In the theme of too many physicians, many patients expressed feeling overwhelmed by the number of different doctors involved in their care; particularly at discharge, patients did not know to whom to direct questions. Finally, as part of the opacity of system theme, patient comments included concerns regarding how information will be passed to outside doctors, and that the system of communication is not clear.
| Verbal communication |
| Can we just stop and talk? Everybody is rushing in and out. |
| I just want my doctor to stop by before I go home and tell me what the plan is. |
| Sometimes I feel like no one is talking to me. All they do is give me paperwork. |
| I want my doctors to sit down with me before I leave the hospital and tell me exactly what I need to do so that I don't come back. |
| I don't want papers, I want people. I want to talk to someone and not read my problems from a sheet of paper. |
| Frustration |
| I wonder sometimes if anyone is listening to me I seem to be part of a very elaborate organization that has its own rules and regulations and will not alter its ways. |
| Why do I have to keep retelling my story? It gets tiring. I wish my story could just be told once. |
| Too many physicians |
| I saw lots of doctors during my time here, but I didn't see them again when I was leaving. |
| I see so many doctors I have no idea who is in charge and who I should direct my questions to. |
| I feel overwhelmed by the number of doctors I see every time I come into the hospital. |
| I want my main doctor to talk to me. I get so confused when I hear from more than one doctor. |
| I miss the days when my primary doctor came in to check on me. He knew exactly what I needed. Now, I meet new people every time I go into the hospital. |
| Opacity of system |
| I wonder if all my doctors talk to each other. Sometimes, it seems like they don't. |
| Who keeps track of all this information? Is there someone who will pass on what happened to me here to the outside world? |
DISCUSSION
Discharge is a period of transition from hospital to home that involves a transfer in responsibility from the inpatient care team to the patient and/or caregivers and primary care physician. Ineffective communication, planning, and coordination of care can undermine patient satisfaction, increase adverse events, and contribute to more frequent hospital readmissions.
The patients we surveyed uniformly placed high value on verbal (more than written) communication about discharge care plans. Protected time during the discharge process for hospital staff to provide verbal recommendations to patients, especially about when they should return for follow‐up, warning signs to contact PCP sooner, and medications to continue after discharge, may improve patient satisfaction.
In open‐ended comments, several subjects suggested that physicians should sit down in the patient's room and provide verbal discharge instructions. Although it is well recognized that verbal communication alone has limitations and that providing patients with written instructions remains crucial, verbal reinforcement may highlight the most important instructions.
Interestingly, subjects valued information about lifestyle changes over detailed information about their medications. This may suggest that hospitalized patients are particularly receptive to information about lifestyle changes such as smoking cessation or importance of compliance with medical appointments.
Lastly, patients we surveyed value personal communication between inpatient and outpatient providers. It is plausible that this would improve transitions of care, and previous studies have suggested that direct communication between inpatient and outpatient providers occurs infrequently, with only 20% of primary care providers in 1 study reporting that they are always notified when their patient is being discharged from a hospitalist service.6
The themes that emerged from our open‐ended questions also highlight the importance of direct verbal communication with patients and careful coordination of care with outside physicians. Because patients may be unlikely to fully remember verbal instructions at discharge, providers may consider providing patients and family members with patient‐centered written materials to take home in order to reinforce important self‐care instructions. The patient comments further suggest that patients may be more satisfied, and that discharges may be smoother, if 1 or 2 physicians were always identified to the patients and their caregivers as the leaders of the care team throughout the hospital course and discharge process.
Our study had several limitations. We only surveyed patients on general medicine services, so our findings might not apply to other populations. We did not enroll participants on weekends and holidays; it is possible that this led to some bias in the enrollment of subjects. We also only surveyed patients and/or proxies who could speak and read English, and this was a fairly highly educated population, with almost half having completed 4 years of college. Finally, we relied on participant self‐report for demographic information because we did not have access to the electronic medical record. This study was conducted at 2 large academic medical centers that include resident physicians in the daily care of patients; thus, these results may not be generalizable to other settings.
Effective verbal communication between physicians, outpatient providers, patients, and their caregivers about discharge care plans might improve patients' understanding of their hospitalizations, increase their satisfaction with care, and reduce readmissions. In addition, physicians should recognize that patients value advice about lifestyle interventions that might improve their health, as part of the discharge care plan. Intervention studies are necessary to test these hypotheses in large, diverse populations.
Acknowledgements
Disclosure: Nothing to report.
- ,,,.Medical errors related to discontinuity of care from an inpatient to an outpatient setting.J Gen Intern Med.2003;18(8):646–651.
- ,,,,,.Deficits in communication and information transfer between hospital‐based and primary care physicians: implications for patient safety and continuity of care.JAMA.2007;297(8):831–841.
- ,,.Expanding patient involvement in care. Effects on patient outcomes.Ann Intern Med.1985;102(4):520–528.
- Society of Hospital Medicine. Project BOOST, Better Outcomes for Older adults through Safe Transitions. Available at: http://www.hospitalmedicine.org/AM/Template.cfm?Section=Home1998.
- ,,,.Primary care physician attitudes regarding communication with hospitalists.Am J Med.2001;111(9B):15S–20S.
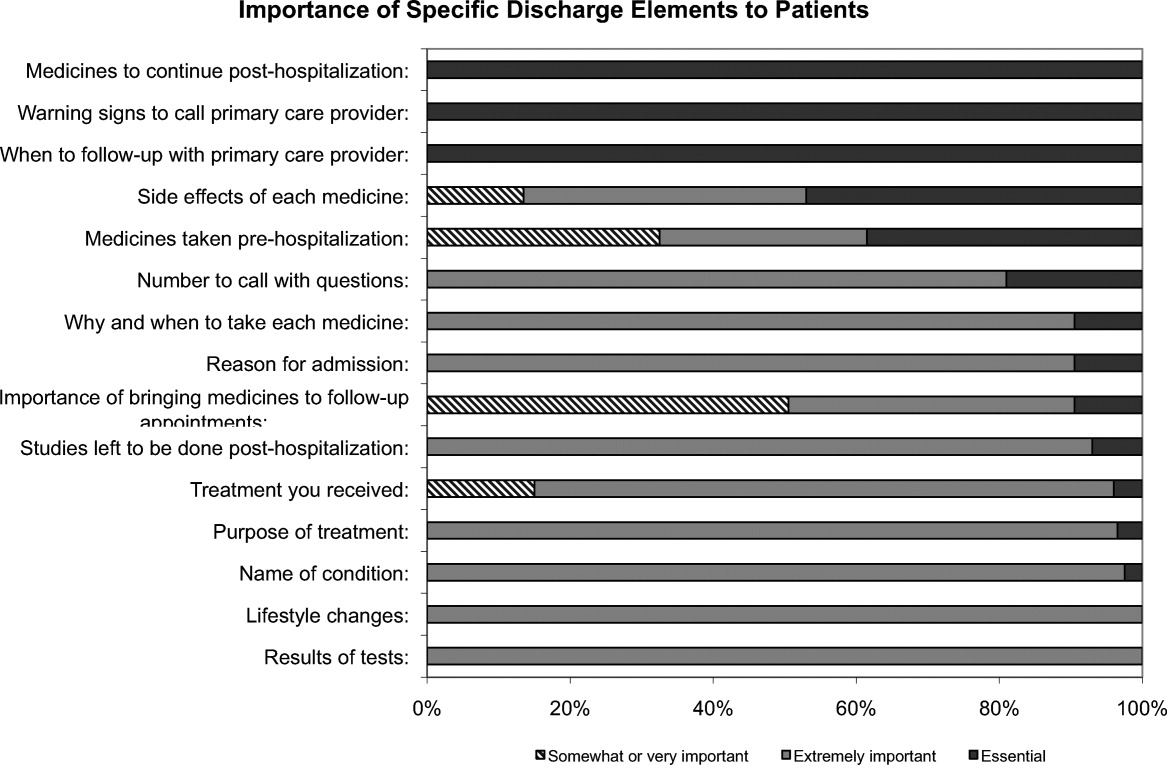
ACUTE Center for Eating Disorders
Anorexia nervosa occurs in 0.9% of women and 0.3% of men in the United States1 and is associated with a prolonged course,2 extensive medical complications that can affect almost every organ system,3, 4 and a 5% mean crude mortality rate9.6 times expected for age‐matched women in the United States.2, 5 Those with anorexia nervosa die as a complication of their illness more frequently than any other mental illness.3 Anorexia nervosa is commonly diagnosed during the adolescent years,2 with almost 25% going on to develop chronic anorexia nervosa.2, 6 Consequently, many patients with severe anorexia nervosa will receive treatment by adult medicine practitioners.
Patients with anorexia nervosa frequently require hospitalization. Published guidelines suggest that those who are 70% or less than ideal body weight, bradycardic, hypotensive, or those with severe electrolyte disturbances warrant admission for medical stabilization.79 Once admitted, however, there are no published guidelines for best practices to medically stabilize patients.7, 10 Although most experts advocate a multidisciplinary approach with weight restoration and medical stability as the goals of hospital admission,8, 9 controversy exists in the literature about how best to achieve these goals.7, 10
It is known, however, that for patients with complicated medical illnesses, such as human immunodeficiency virus (HIV) and sepsis, higher volumes of patient caseloads treated by physicians with disease‐specific expertise has been found to lead to improved outcomes in patients.11, 12 The adult patient with severe anorexia nervosa who requires inpatient medical stabilization may also benefit from a multidisciplinary trained staff familiar with the medical management of anorexia nervosa. Accordingly, we have developed the Acute Comprehensive Urgent Treatment for Eating Disorders (ACUTE) Center.
PROGRAM DESCRIPTION
The ACUTE Center at Denver Health is a 5‐bed unit dedicated to the medical stabilization of patients with severe malnutrition due to anorexia nervosa or severe electrolyte disorders due to bulimia nervosa. ACUTE accepts patients 17 years and older with medical complications related to chronic malnutrition and refeeding.
ACUTE uses a multidisciplinary approach to patient care. The physician team is composed of a hospital medicine attending physician, consultative expertise by an internal medicine specialist in the management of the medical complications of eating disorders, and a psychiatrist specializing in eating disorders. There is a dedicated team of nurses, two dieticians, physical therapists, certified nursing assistants, speech therapists, a psychotherapist, and a chaplain.
ACUTE patients are on continuous telemetry monitoring for the duration of their hospitalization to monitor for arrhythmias as well as signs of covert exercise. As part of the initial intake, a full set of vital signs is obtained, including height and weight. Patients are weighed daily with their back to the scale. There is no discussion of weight fluctuations. Patients may walk at a slow pace around the unit. No exercise is allowed.
Each patient at the ACUTE Center has an individualized meal plan and are started on an oral caloric intake 200 kcal below their basal energy expenditure (BEE). Indirect calorimetry is performed on the first hospital day. Each patient meets on a daily basis with the registered dietician to choose meals that meet their caloric goals.
All patients have a sitter continuously for their first week, and thereafter sitter time may be reduced to supervision surrounding each meal. Patients who fail to finish their prescribed meal are required to drink a liquid supplement to meet caloric goals. Calories are increased weekly until the patient's weight shows a clear pattern of weight increase. 0

Patients are discharged from the ACUTE Center when they have achieved several basic goals: They are consuming greater than 2000 kcal per day, they are consistently gaining 23 pounds per week, their laboratory values have stabilized without electrolyte supplementation, and they are strong enough for an inpatient eating disorder program.
METHODS
Patients admitted to the ACUTE Center between October 2008 and December 2010 for medical stabilization and monitored refeeding were included. Patients with a diagnosis of bulimia nervosa were excluded. Demographic data and laboratory results were obtained electronically from our data repository, whereas weight, height, and other clinical characteristics were obtained by manual chart abstraction. The statistical analysis was conducted in SAS Enterprise Guide v4.1 (SAS Institute, Cary, NC).
RESULTS
In its first 27 months, the ACUTE Center had 76 total admissions, comprising 59 patients. Of the 76 admissions, the 62 admissions for medical stabilization and monitored refeeding of 54 patients with anorexia nervosa were included. Forty‐eight of the 54 (89%) included patients were female. Six patients were hospitalized twice, and 1 patient 3 times. There were 3 transfers to the intensive care unit, and no inpatient mortality. Of the 62 admissions, 11 (18%) discharges were to home, and 51 (82%) were to inpatient psychiatric eating disorder units.
The mean age at admission was 27 years (range 1765 years). The mean percent of ideal body weight (IBW) on admission was 62.2% 10.2%. The mean body mass index (BMI) was 12.9 2.0 kg/m2 on admission, and 13.1 1.9 kg/m2 upon discharge. The median length of stay was 16 days (interquartile range [IQR] 929 days). Median calculated BEE (1119 [10671184 IQR]) was higher than measured BEE by indirect calorimetry (792 [6341094]), (Table 1).
| Median (Interquartile Range)* | Range | |
|---|---|---|
| ||
| Age, yr | 27 (2135) | 1765 |
| Female | 56 | 90% |
| Length of hospitalization, days | 16 (929) | 570 |
| Calculated BEE | 1119 (10671184) | 9061491 |
| Measured BEE | 792 (6341094) | 5001742 |
| DEXA Z‐score | 2.2 1.1 | 4.40.7 |
| Height, in | 65 (6167) | 5774 |
| Weight on admission, lb | 76.1 14.4 | 50.8110.0 |
| % Ideal body weight on admission | 62.2 10.2 | 42.4101.0 |
| % Ideal body weight on discharge | 63.2 9.1 | 42.3 82.7 |
| BMI on admission | 12.9 2.0 | 8.719.7 |
| BMI nadir | 12.4 1.9 | 8.415.7 |
| BMI on discharge | 13.1 1.9 | 8.717.0 |
The majority of admission laboratory values, including serum albumin, blood urea nitrogen (BUN), creatinine, potassium, magnesium, and phosphate levels, were within normal limits. Fifty‐six percent were hyponatremic at admission, with a mean serum sodium level of 133 6 mmol/L (Table 2).
| Median (Interquartile Range)* | Range | |
|---|---|---|
| ||
| Sodium (135143 mmol/L) | 133 6 | 117145 |
| Potassium (3.65.1 mmol/L) | 3.8 (3.0 4.0) | 1.85.5 |
| Carbon dioxide (1827 mmol/L) | 28 (2531) | 1845 |
| Glucose (60199 mg/dL) | 85 (76105) | 41166 |
| BUN (622 mg/dL) | 16 (923) | 344 |
| Creatinine (0.61.2 mg/dL) | 0.7 (0.61.0) | 0.31.6 |
| Calcium (8.110.5 mg/dL) | 8.9 0.6 | 7.610.1 |
| Phosphorus (2.74.8 mg/dL) | 3.2 (2.83.7) | 2.15.7 |
| Magnesium (1.32.1 mEq/L) | 1.8 0.3 | 1.22.5 |
| AST (1040 U/L) | 38 (2391) | 122402 |
| ALT (745 U/L) | 45 (2498) | 152436 |
| Total bilirubin (0.01.2 mg/dL) | 0.5 (0.30.7) | 0.12.2 |
| Pre‐albumin (2052 mg/dL) | 21 7 | 842 |
| Albumin (3.05.3 g/dL) | 3.7 0.7 | 1.64.8 |
| WBC (4.510.0 k/L) | 4.0 (3.25.7) | 1.120.3 |
| Neutrophils (%) (48.069.0%) | 55.5 13.1 | 17.082.0 |
| Lymphocytes (%) (21.043.0%) | 34.9 13.0 | 10.864.0 |
| Platelet count (150450 k/L) | 266 (193371) | 40819 |
| Hematocrit (37.047.0%) | 36.1 5.4 | 19.145.7 |
| MCV (80100 fL) | 91 7 | 73105 |
| TSH (0.346.00 IU/mL) | 1.52 (0.962.84) | 0.1864.1 |
| INR (0.821.17) | 1.09 (1.001.22) | 0.812.05 |
| 1,25 Hydroxy vitamin D (3080 ng/mL) | 41 (3058) | 8171 |
DISCUSSION
Hospital Medicine is currently the fastest growing area of specialization in medicine.13 Palliative care, inpatient geriatrics, short stay units, and bedside procedures have evolved into hospitalist‐led services.1418 The management of the medical complications of severe eating disorders is another potential niche for hospitalists.
The ACUTE Center at Denver Health represents a center in which highly specialized, multidisciplinary care is provided for a rare and extremely ill population of patients. Prior to entering the ACUTE Center, the patients described in our program had each experienced prolonged and unsuccessful stays for medical stabilization in acute care hospitals across the country, after being denied treatment in eating disorder programs due to medical instability.
Patients transferred to ACUTE often received medical care reflecting a lack of specific expertise, training, and exposure. The most common management discrepancy we noted was over‐aggressive provision of intravenous fluids. Consequently, we often diurese 1020 pounds of edema weight, gained during a prior medical hospitalization, before beginning the process of weight restoration. This edema weight artificially increases admission weight and results in less than expected weight gain from admission to discharge.
Even without substantial weight gain, medical stabilization is evidenced by consistent caloric oral intake, and fluid and electrolyte stabilization after initial refeeding. Accordingly, patients who have been treated at the ACUTE Center often become eligible for admission to eating disorder programs at body weights below the typical 70% of ideal body weight that most programs use as a threshold for admission.
From a clinical research perspective, centers such as ACUTE allow for opportunities to better understand and investigate the nuances of patient care in the setting of severe malnutrition. From our cohort of patients to date, we have noted unique issues in albumin levels,19 coagulopathy,20 and liver function,21 among others. As an example, the cohort of patients with anorexia nervosa described here had profoundly low body weight, but relatively normal admission labs. Even the serum albumin, a parameter often used to reflect nutrition in an adult internal medicine setting, is usually normal, reflecting, in an otherwise generally healthy young population, the absence of a malignant, inflammatory, or infectious etiology of weight loss.19
Hospitalists also advocate for their patients by helping to maximize the benefits of their health care coverage. Many health care plans place limits on inpatient psychiatric care benefits. Patients who are severely malnourished from their eating disorder may waste valuable psychiatric care benefits undergoing medical stabilization in psychiatric units while physically unable to undergo psychotherapy. This has become increasingly important as health insurance plans continue to decrease coverage for residential care of patients with anorexia.22
In contrast, the medical benefits of most health plans are more robust. Accordingly, from the patient perspective, medical stabilization in an acute medical unit before admission to a psychiatry unit maximizes their ability to participate in the intensive psychiatric therapy which is still needed after medical stabilization. A recent study from a residential eating disorder program confirmed that a higher discharge BMI was the single best predictor of full recovery from anorexia nervosa.23
In the future, we believe that a continuing concentration of care and experience may also lend itself to the development of protocols and management guidelines which may benefit patients beyond our own unit. Severely malnourished patients with anorexia nervosa, or bulimic patients with complicated electrolyte disorders, are likely to benefit both medically and financially from centers of excellence. Inpatient or residential psychiatric eating disorder programs may act in synergy with medical eating disorders units, like ACUTE, to most efficiently care for the severely malnourished patient. Hospitalists, with the proper training and experience, are uniquely positioned to develop such centers of excellence.
- ,,,.The prevalence and correlates of eating disorders in the national comorbidity survey replication.Biol Psychiatry.2007;61:348–358.
- .The outcome of anorexia nervosa in the 20th century.Am J Psychiatry.2002;159:1284–1293.
- ,.Anorexia nervosa medical issues.J Womens Health.2003;12:331–340.
- .Diagnosis and care of patients with anorexia nervosa in primary care settings.Ann Intern Med.2001;134:1048–1059.
- ,,, et al.Mortality in eating disorders: a descriptive study.Int J Eat Disord.2000;28:20–26.
- ,,,,.Long‐term prognosis in anorexia nervosa: lessons from a 21‐year follow‐up study.Lancet.2000;355:721–722.
- ,,,,.Variations in admissions practices for adolescents with anorexia nervosa: a North American sample.J Adolesc Health.2008;43:425–431.
- American Psychiatric Association.Treatment of patients with eating disorders, third edition.Am J Psychiatry.2006;163(suppl 7):4–54.
- American Dietetic Association.Position of the American Dietetic Association: nutrition intervention in the treatment of anorexia nervosa, bulimia nervosa, and other eating disorders (ADA reports).J Am Diet Assoc.2006;106:2073–2082.
- ,.Clinical practice guidelines for treating restrictive eating disorder patients during medical hospitalization.Curr Opin Pediatr.2008;20:390–397.
- .Practice makes perfect: a volume‐outcome study of hospital patients with HIV disease.J Acquir Immune Defic Syndr.2008;47:226–233.
- ,,,.Association between physician caseload and patient outcome for sepsis treatment.Infect Control Hosp Epidemiol.2009;30:556–562.
- .Reflections: the hospitalist movement ten years later.J Hosp Med.2006;1:248–252.
- What will board certification be‐and mean‐for hospitalists?.Palliative care in hospitals.J Hosp Med.2006;1:21–28.
- .Palliative care and hospitalists: a partnership for hope.J Hosp Med.2006;1:5–6.
- ,,, et al.Impact of a bedside procedure service on general medicine inpatients: a firm‐based trial.J Hosp Med.2007;2:143–149.
- ,,,.Growth in the care of older patients by hospitalists in the United States.N Engl J Med.2009;360:1102–1112.
- ,,, et al.A hospitalist run short stay unit: features that predict length of stay and eventual admission to traditional inpatient services.J Hosp Med.2009;4:276–284.
- ,,.Serum albumin levels may not correlate with weight status in severe anorexia nervosa.Eat Disord.2009;17:322–326.
- ,,,,.The use of thrombelastography to determine coagulation status in severe anorexia nervosa: a case series.Int J Eat Disord.2010;43(4):382–385.
- ,,,.Liver function test abnormalities in anorexia nervosa—cause or effect.Int J Eat Disord.2010;43(4):378–381.
- .Eating disorders: a new front in insurance fight.New York Times. October 13, 2011. Available at: http://www.nytimes.com/2011/10/14/business/ruling‐offers‐hope‐to‐eating‐disorder‐sufferers. html?ref=business.
- ,.Long‐term outcome of residential treatment for anorexia nervosa and bulimia nervosa.Eat Disord.2011;19:132–144.
Anorexia nervosa occurs in 0.9% of women and 0.3% of men in the United States1 and is associated with a prolonged course,2 extensive medical complications that can affect almost every organ system,3, 4 and a 5% mean crude mortality rate9.6 times expected for age‐matched women in the United States.2, 5 Those with anorexia nervosa die as a complication of their illness more frequently than any other mental illness.3 Anorexia nervosa is commonly diagnosed during the adolescent years,2 with almost 25% going on to develop chronic anorexia nervosa.2, 6 Consequently, many patients with severe anorexia nervosa will receive treatment by adult medicine practitioners.
Patients with anorexia nervosa frequently require hospitalization. Published guidelines suggest that those who are 70% or less than ideal body weight, bradycardic, hypotensive, or those with severe electrolyte disturbances warrant admission for medical stabilization.79 Once admitted, however, there are no published guidelines for best practices to medically stabilize patients.7, 10 Although most experts advocate a multidisciplinary approach with weight restoration and medical stability as the goals of hospital admission,8, 9 controversy exists in the literature about how best to achieve these goals.7, 10
It is known, however, that for patients with complicated medical illnesses, such as human immunodeficiency virus (HIV) and sepsis, higher volumes of patient caseloads treated by physicians with disease‐specific expertise has been found to lead to improved outcomes in patients.11, 12 The adult patient with severe anorexia nervosa who requires inpatient medical stabilization may also benefit from a multidisciplinary trained staff familiar with the medical management of anorexia nervosa. Accordingly, we have developed the Acute Comprehensive Urgent Treatment for Eating Disorders (ACUTE) Center.
PROGRAM DESCRIPTION
The ACUTE Center at Denver Health is a 5‐bed unit dedicated to the medical stabilization of patients with severe malnutrition due to anorexia nervosa or severe electrolyte disorders due to bulimia nervosa. ACUTE accepts patients 17 years and older with medical complications related to chronic malnutrition and refeeding.
ACUTE uses a multidisciplinary approach to patient care. The physician team is composed of a hospital medicine attending physician, consultative expertise by an internal medicine specialist in the management of the medical complications of eating disorders, and a psychiatrist specializing in eating disorders. There is a dedicated team of nurses, two dieticians, physical therapists, certified nursing assistants, speech therapists, a psychotherapist, and a chaplain.
ACUTE patients are on continuous telemetry monitoring for the duration of their hospitalization to monitor for arrhythmias as well as signs of covert exercise. As part of the initial intake, a full set of vital signs is obtained, including height and weight. Patients are weighed daily with their back to the scale. There is no discussion of weight fluctuations. Patients may walk at a slow pace around the unit. No exercise is allowed.
Each patient at the ACUTE Center has an individualized meal plan and are started on an oral caloric intake 200 kcal below their basal energy expenditure (BEE). Indirect calorimetry is performed on the first hospital day. Each patient meets on a daily basis with the registered dietician to choose meals that meet their caloric goals.
All patients have a sitter continuously for their first week, and thereafter sitter time may be reduced to supervision surrounding each meal. Patients who fail to finish their prescribed meal are required to drink a liquid supplement to meet caloric goals. Calories are increased weekly until the patient's weight shows a clear pattern of weight increase. 0
Patients are discharged from the ACUTE Center when they have achieved several basic goals: They are consuming greater than 2000 kcal per day, they are consistently gaining 23 pounds per week, their laboratory values have stabilized without electrolyte supplementation, and they are strong enough for an inpatient eating disorder program.
METHODS
Patients admitted to the ACUTE Center between October 2008 and December 2010 for medical stabilization and monitored refeeding were included. Patients with a diagnosis of bulimia nervosa were excluded. Demographic data and laboratory results were obtained electronically from our data repository, whereas weight, height, and other clinical characteristics were obtained by manual chart abstraction. The statistical analysis was conducted in SAS Enterprise Guide v4.1 (SAS Institute, Cary, NC).
RESULTS
In its first 27 months, the ACUTE Center had 76 total admissions, comprising 59 patients. Of the 76 admissions, the 62 admissions for medical stabilization and monitored refeeding of 54 patients with anorexia nervosa were included. Forty‐eight of the 54 (89%) included patients were female. Six patients were hospitalized twice, and 1 patient 3 times. There were 3 transfers to the intensive care unit, and no inpatient mortality. Of the 62 admissions, 11 (18%) discharges were to home, and 51 (82%) were to inpatient psychiatric eating disorder units.
The mean age at admission was 27 years (range 1765 years). The mean percent of ideal body weight (IBW) on admission was 62.2% 10.2%. The mean body mass index (BMI) was 12.9 2.0 kg/m2 on admission, and 13.1 1.9 kg/m2 upon discharge. The median length of stay was 16 days (interquartile range [IQR] 929 days). Median calculated BEE (1119 [10671184 IQR]) was higher than measured BEE by indirect calorimetry (792 [6341094]), (Table 1).
| Median (Interquartile Range)* | Range | |
|---|---|---|
| ||
| Age, yr | 27 (2135) | 1765 |
| Female | 56 | 90% |
| Length of hospitalization, days | 16 (929) | 570 |
| Calculated BEE | 1119 (10671184) | 9061491 |
| Measured BEE | 792 (6341094) | 5001742 |
| DEXA Z‐score | 2.2 1.1 | 4.40.7 |
| Height, in | 65 (6167) | 5774 |
| Weight on admission, lb | 76.1 14.4 | 50.8110.0 |
| % Ideal body weight on admission | 62.2 10.2 | 42.4101.0 |
| % Ideal body weight on discharge | 63.2 9.1 | 42.3 82.7 |
| BMI on admission | 12.9 2.0 | 8.719.7 |
| BMI nadir | 12.4 1.9 | 8.415.7 |
| BMI on discharge | 13.1 1.9 | 8.717.0 |
The majority of admission laboratory values, including serum albumin, blood urea nitrogen (BUN), creatinine, potassium, magnesium, and phosphate levels, were within normal limits. Fifty‐six percent were hyponatremic at admission, with a mean serum sodium level of 133 6 mmol/L (Table 2).
| Median (Interquartile Range)* | Range | |
|---|---|---|
| ||
| Sodium (135143 mmol/L) | 133 6 | 117145 |
| Potassium (3.65.1 mmol/L) | 3.8 (3.0 4.0) | 1.85.5 |
| Carbon dioxide (1827 mmol/L) | 28 (2531) | 1845 |
| Glucose (60199 mg/dL) | 85 (76105) | 41166 |
| BUN (622 mg/dL) | 16 (923) | 344 |
| Creatinine (0.61.2 mg/dL) | 0.7 (0.61.0) | 0.31.6 |
| Calcium (8.110.5 mg/dL) | 8.9 0.6 | 7.610.1 |
| Phosphorus (2.74.8 mg/dL) | 3.2 (2.83.7) | 2.15.7 |
| Magnesium (1.32.1 mEq/L) | 1.8 0.3 | 1.22.5 |
| AST (1040 U/L) | 38 (2391) | 122402 |
| ALT (745 U/L) | 45 (2498) | 152436 |
| Total bilirubin (0.01.2 mg/dL) | 0.5 (0.30.7) | 0.12.2 |
| Pre‐albumin (2052 mg/dL) | 21 7 | 842 |
| Albumin (3.05.3 g/dL) | 3.7 0.7 | 1.64.8 |
| WBC (4.510.0 k/L) | 4.0 (3.25.7) | 1.120.3 |
| Neutrophils (%) (48.069.0%) | 55.5 13.1 | 17.082.0 |
| Lymphocytes (%) (21.043.0%) | 34.9 13.0 | 10.864.0 |
| Platelet count (150450 k/L) | 266 (193371) | 40819 |
| Hematocrit (37.047.0%) | 36.1 5.4 | 19.145.7 |
| MCV (80100 fL) | 91 7 | 73105 |
| TSH (0.346.00 IU/mL) | 1.52 (0.962.84) | 0.1864.1 |
| INR (0.821.17) | 1.09 (1.001.22) | 0.812.05 |
| 1,25 Hydroxy vitamin D (3080 ng/mL) | 41 (3058) | 8171 |
DISCUSSION
Hospital Medicine is currently the fastest growing area of specialization in medicine.13 Palliative care, inpatient geriatrics, short stay units, and bedside procedures have evolved into hospitalist‐led services.1418 The management of the medical complications of severe eating disorders is another potential niche for hospitalists.
The ACUTE Center at Denver Health represents a center in which highly specialized, multidisciplinary care is provided for a rare and extremely ill population of patients. Prior to entering the ACUTE Center, the patients described in our program had each experienced prolonged and unsuccessful stays for medical stabilization in acute care hospitals across the country, after being denied treatment in eating disorder programs due to medical instability.
Patients transferred to ACUTE often received medical care reflecting a lack of specific expertise, training, and exposure. The most common management discrepancy we noted was over‐aggressive provision of intravenous fluids. Consequently, we often diurese 1020 pounds of edema weight, gained during a prior medical hospitalization, before beginning the process of weight restoration. This edema weight artificially increases admission weight and results in less than expected weight gain from admission to discharge.
Even without substantial weight gain, medical stabilization is evidenced by consistent caloric oral intake, and fluid and electrolyte stabilization after initial refeeding. Accordingly, patients who have been treated at the ACUTE Center often become eligible for admission to eating disorder programs at body weights below the typical 70% of ideal body weight that most programs use as a threshold for admission.
From a clinical research perspective, centers such as ACUTE allow for opportunities to better understand and investigate the nuances of patient care in the setting of severe malnutrition. From our cohort of patients to date, we have noted unique issues in albumin levels,19 coagulopathy,20 and liver function,21 among others. As an example, the cohort of patients with anorexia nervosa described here had profoundly low body weight, but relatively normal admission labs. Even the serum albumin, a parameter often used to reflect nutrition in an adult internal medicine setting, is usually normal, reflecting, in an otherwise generally healthy young population, the absence of a malignant, inflammatory, or infectious etiology of weight loss.19
Hospitalists also advocate for their patients by helping to maximize the benefits of their health care coverage. Many health care plans place limits on inpatient psychiatric care benefits. Patients who are severely malnourished from their eating disorder may waste valuable psychiatric care benefits undergoing medical stabilization in psychiatric units while physically unable to undergo psychotherapy. This has become increasingly important as health insurance plans continue to decrease coverage for residential care of patients with anorexia.22
In contrast, the medical benefits of most health plans are more robust. Accordingly, from the patient perspective, medical stabilization in an acute medical unit before admission to a psychiatry unit maximizes their ability to participate in the intensive psychiatric therapy which is still needed after medical stabilization. A recent study from a residential eating disorder program confirmed that a higher discharge BMI was the single best predictor of full recovery from anorexia nervosa.23
In the future, we believe that a continuing concentration of care and experience may also lend itself to the development of protocols and management guidelines which may benefit patients beyond our own unit. Severely malnourished patients with anorexia nervosa, or bulimic patients with complicated electrolyte disorders, are likely to benefit both medically and financially from centers of excellence. Inpatient or residential psychiatric eating disorder programs may act in synergy with medical eating disorders units, like ACUTE, to most efficiently care for the severely malnourished patient. Hospitalists, with the proper training and experience, are uniquely positioned to develop such centers of excellence.
- ,,,.The prevalence and correlates of eating disorders in the national comorbidity survey replication.Biol Psychiatry.2007;61:348–358.
- .The outcome of anorexia nervosa in the 20th century.Am J Psychiatry.2002;159:1284–1293.
- ,.Anorexia nervosa medical issues.J Womens Health.2003;12:331–340.
- .Diagnosis and care of patients with anorexia nervosa in primary care settings.Ann Intern Med.2001;134:1048–1059.
- ,,, et al.Mortality in eating disorders: a descriptive study.Int J Eat Disord.2000;28:20–26.
- ,,,,.Long‐term prognosis in anorexia nervosa: lessons from a 21‐year follow‐up study.Lancet.2000;355:721–722.
- ,,,,.Variations in admissions practices for adolescents with anorexia nervosa: a North American sample.J Adolesc Health.2008;43:425–431.
- American Psychiatric Association.Treatment of patients with eating disorders, third edition.Am J Psychiatry.2006;163(suppl 7):4–54.
- American Dietetic Association.Position of the American Dietetic Association: nutrition intervention in the treatment of anorexia nervosa, bulimia nervosa, and other eating disorders (ADA reports).J Am Diet Assoc.2006;106:2073–2082.
- ,.Clinical practice guidelines for treating restrictive eating disorder patients during medical hospitalization.Curr Opin Pediatr.2008;20:390–397.
- .Practice makes perfect: a volume‐outcome study of hospital patients with HIV disease.J Acquir Immune Defic Syndr.2008;47:226–233.
- ,,,.Association between physician caseload and patient outcome for sepsis treatment.Infect Control Hosp Epidemiol.2009;30:556–562.
- .Reflections: the hospitalist movement ten years later.J Hosp Med.2006;1:248–252.
- What will board certification be‐and mean‐for hospitalists?.Palliative care in hospitals.J Hosp Med.2006;1:21–28.
- .Palliative care and hospitalists: a partnership for hope.J Hosp Med.2006;1:5–6.
- ,,, et al.Impact of a bedside procedure service on general medicine inpatients: a firm‐based trial.J Hosp Med.2007;2:143–149.
- ,,,.Growth in the care of older patients by hospitalists in the United States.N Engl J Med.2009;360:1102–1112.
- ,,, et al.A hospitalist run short stay unit: features that predict length of stay and eventual admission to traditional inpatient services.J Hosp Med.2009;4:276–284.
- ,,.Serum albumin levels may not correlate with weight status in severe anorexia nervosa.Eat Disord.2009;17:322–326.
- ,,,,.The use of thrombelastography to determine coagulation status in severe anorexia nervosa: a case series.Int J Eat Disord.2010;43(4):382–385.
- ,,,.Liver function test abnormalities in anorexia nervosa—cause or effect.Int J Eat Disord.2010;43(4):378–381.
- .Eating disorders: a new front in insurance fight.New York Times. October 13, 2011. Available at: http://www.nytimes.com/2011/10/14/business/ruling‐offers‐hope‐to‐eating‐disorder‐sufferers. html?ref=business.
- ,.Long‐term outcome of residential treatment for anorexia nervosa and bulimia nervosa.Eat Disord.2011;19:132–144.

Modified RASS for Identifying Delirium
Vital signs constitute a fundamental component of the physical examination and serve key diagnostic and monitoring purposes. The brain is as vital to life as the cardiovascular, respiratory, and immune/thermoregulatory systems, yet currently no vital sign exists that would allow rapid, reliable, and easily reproducible assessment of cognition.1 As a result, acute mental status changes frequently go undetected and untreated.24 Delirium is defined as an acute change in attention with fluctuations in cognition, thought, and/or consciousness throughout the course of the day.5 Because delirium in older patients is common and is associated with increased morbidity, mortality, functional decline, and costs,69 development and validation of a rapid, objective screening assessment could be used by nursing staff to identify patients at high risk for delirium.
Current recommendations for inpatient delirium monitoring usually involve daily cognitive screening with a standardized screening instrument.6 Because this process is often time‐consuming (8‐12 minutes), most patients do not undergo routine screening. To facilitate clinical implementation, we focused on developing a brief (30‐second) inpatient screening measure of a feature of mental status that could be administered serially. The purpose of this study was to (1) develop a brief screening tool for a core feature of mental status and (2) validate this screening tool for delirium in an older inpatient population.
METHODS
Consensus Panel
In June 2009, the Veterans Administration sponsored an interdisciplinary conference that solicited input on identifying the most targetable components of delirium and discussing potential clinical instruments. Following this, a consensus panel of 8 representatives from medicine, geriatrics, nursing, psychiatry, and psychology used a modified Delphi method to target characteristic features of delirium and identify instruments that could best capture mental status change. While inattention was agreed upon as the core cognitive feature of delirium, the group came to consensus that capturing the acute onset and fluctuating nature of delirium was better suited as a vital sign. To meet these criteria, the group modified the Richmond Agitation Sedation Scale (RASS).10
The RASS is an observational instrument that has been validated in the intesive care unit setting for objectively determining level of sedation. It has been shown to be highly reliable and associated with delirium.11 The RASS is a quick, objective scale of consciousness with a scoring system that captures both hyperactive and hypoactive levels of consciousness. A disadvantage of using the RASS includes its limited attention assessment. The Consensus panel modified the RASS to improve its assessment of attention, using a brief open‐ended question that was asked before scoring (Figure 1).

Participants
For this prospective validation study, we recruited 95 medical patients 65 years of age who had been admitted to a VA hospital. The study was approved by the institutional review board, and participants provided written informed consent. Patients were excluded if they refused (n = 64), anticipated leaving the hospital within 1 day (n = 42), or had vision or cognition impairments that would prevent their ability to complete informed consent forms and cognitive screening tools (n = 19). Five participants were discharged between enrollment and expert assessment.
Mental Status Assessments
After enrollment, 3 study staff members visited each participant independently. First, the trained research assistant obtained informed consent and demographic, cognitive, and functional assessments. The mini‐mental state examination was then administered to provide a baseline measure of cognitive function at the time of admission.12 A nurse‐interviewer later administered the modified RASS (mRASS) separately. Finally, a delirium expert performed an independent comprehensive mental status interview including assessments of attention, executive function, memory, and mood. Delirium was diagnosed by the delirium expert according to DSM‐IV criteria.5 Each investigator was blinded to the others' ratings. After the initial assessments, each participant was visited daily throughout the hospitalization by an mRASS assessor and, independently, by the delirium expert.
To determine inter‐rater reliability, 60 participants were evaluated with the mRASS by the trained research assistant and the nurse‐interviewer simultaneously. The mRASS was scored independently and the assessors were blinded to each others' ratings.
Statistics
The paired mRASS‐delirium assessments were analyzed in 3 ways: (1) as single‐day independent assessments; (2) longitudinally as a change from baseline including prevalent delirium; and (3) longitudinally as a change from baseline, excluding prevalent delirium cases. We examined 1‐point and 2‐point changes on the mRASS from baseline, which allowed determination of the most appropriate cut‐point for clinical use. Sensitivity, specificity, and likelihood ratios were calculated. The C‐statistic was calculated using absolute mRASS score for the single‐time assessments, and as a difference between minimum and maximum mRASS for the longitudinal analyses.
RESULTS
Characteristics of the study population are presented in Table 1. Because this was a VA population, the vast majority (94%) of participants were men, with a mean age of 81 years (range, 66‐96 years), and 89% were white. This population had a high Charlson Comorbidity Index (mean SD, 4.0 2.4), which was reflected in functional assessments, with 37% reporting difficulty with activities of daily living and 58% reporting difficulty with instrumental activities of daily living. Despite the age and comorbidity, delirium prevalence was 11% (n = 10) and incidence was 14% (n = 13). Interrater reliability of the mRASS yielded 98% agreement with a weighted kappa of 0.48 (P 0.001).
| Characteristics | Values |
|---|---|
| |
| Age, years, mean (SD) | 81.0 (7.3) |
| Gender, male, no. (%) | 89 (94) |
| Race, white, no. (%) | 85 (89) |
| Charlson Comorbidity Index, mean (SD) | 4.0 (2.4) |
| BMI, kg/m2, mean (SD) | 27.2 (6.3) |
| Mini‐mental state examination, mean (SD) | 24.4 (4.1) |
| AUDIT, mean (SD) | 2.4 (2.9) |
| Tobacco use, pack‐years, no. (%) | 54 (56) |
| Current | 8 (8) |
| Never | 16 (17) |
| Prior | 68 (72) |
| Functional impairment, no. (%) | |
| Difficulty with 1 ADL | 35 (37) |
| Difficulty with 1 IADL | 55 (58) |
| Length of hospital stay | |
| Mean (SD), days | 6.3 (5.4) |
| Median, days | 5 |
| mRASS per patient, mean (SD) | 3.8 (3.3) |
When the mRASS was analyzed as a single‐day independent assessment, any abnormal score (ie, a score 0) had a sensitivity of 64% and a specificity of 93% for delirium relative to the expert evaluation (Table 2). With an abnormal mRASS as 2 or 2, the sensitivity fell to 34%, while the specificity increased to 99.6%.
| Criteria | mRASS | Sensitivity* (95% CI) | Specificity* (95% CI) | LR+ | LR |
|---|---|---|---|---|---|
| |||||
| Single‐day independent assessments | |||||
| Any abnormal | 63.9% (51.976.0) | 93.2% (90.396.4) | 9.4 | 0.4 | |
| RASS 2 or 2 | 34.4% (22.546.3) | 99.6% (98.8100) | 86 | 0.7 | |
| Longitudinal assessments | |||||
| Any delirium | Any change | 73.9% (56.091.9) | 91.7% (85.398.1) | 8.9 | 0.3 |
| Change in 2 points | 21.7% | 100% | 0.8 | ||
| Incident delirium | Any change | 84.6% (65.0100.0) | 91.7% (85.398.1) | 10.2 | 0.2 |
| Change in 2 points | 23.1% | 100% | 0.8 | ||
When the mRASS was used longitudinally to detect change in delirium during the hospital stay among all participants, it had a sensitivity of 74% and specificity of 92% for any change. Increasing the stringency of the criteria by looking at a change of 2 mRASS points decreased the sensitivity (22%) and increased the specificity (100%).
To capture the potential of the mRASS administered on a longitudinal basis as a diagnostic aid, the prevalent cases of delirium were excluded. In this analysis, any change in the mRASS had a sensitivity of 85% and a specificity of 92% for incident delirium. With more stringent criteria of a change of 2 points, the sensitivity was 23% and the specificity was 100%.
DISCUSSION
In this study, we developed a modified RASS (mRASS) for serial mental status assessment. Whereas a single measurement of the mRASS had modest sensitivity and good specificity for delirium, longitudinal measurement increased the sensitivity with no loss in specificity. Importantly, the 30 seconds required for the mRASS could be incorporated into daily workflow and provides an objective measure of consciousness. As such, we believe the mRASS can potentially serve as a longitudinal measure of consciousnessmuch like a vital sign for mental status.
Altered consciousness is a clinical and diagnostic feature of delirium,5, 13 and fluctuation in mental status is a diagnostic feature of delirium. As such, a screening instrument able to quantify the level of consciousness longitudinally and allow comparison to prior and subsequent determinations has face validity as a delirium screening instrument.
The mRASS has other features that make it appropriate for serial measurement in a manner similar to a vital sign. First, it objectively described consciousness on a scale, which is an improvement relative to many of the subjective descriptions clinically used. Consistent with other studies of the RASS,10, 11 the mRASS has good interrater reliability, allowing a common language to be used to describe level of consciousness across health care settings that can become the basis for a systematic and standardized monitor of cognitive change, improving continuity of care and communication between providers. It can be further used to objectively establish a patient's baseline and monitor change longitudinally.
The current study is limited by the lack of diversity and small size of the study population, which limits external validity (generalizability). Additional studies evaluating the utility of the mRASS by a variety of health care team members in a larger, more ethnically/racially diverse and heterogeneous population should be completed before we can determine if it can perform as a mental status vital sign, and if it is associated with better patient outcomes. Additionally, this study selected patients who were physically and cognitively capable of enrolling and excluded patients with severe cognitive and sensory impairment who were unable to provide consent to participate. Thus, some of the sickest, frailest, and most cognitively impaired patients were excluded. Unfortunately, this study therefore excluded a population significantly more vulnerable to the development of delirium.
Because a change in mental status (such as delirium) is common, morbid, and costly, a brief tool that can reliably and effectively assess mental status is needed. The mRASS used in this study provided an objective measurement of consciousness, a key component of mental status, and was demonstrated to reliably screen for presence or absence of delirium when administered longitudinally. Further study in diverse populations with administration by a variety of health care team members is needed to determine whether the mRASS can accurately serve as a mental status vital sign. If adopted widely, the mRASS could be used alongside the traditional vital signs to establish patient baselines, monitor change, improve provider communication, and potentially improve patient outcomes.
Acknowledgements
The authors are indebted to all of the veterans who willingly participated in this project. The VA Delirium Working Group Consensus Panel Consisted of Kenneth Boockvar, Joseph Flaherty, Sharon Gordon, Barbara Kamholz, James Rudolph, Marianne Shaughnessy, Kenneth Shay, and Joan Stein.
The authors maintained independence in the development, execution, and reporting of this study.
This article was presented in abstract form at the American Geriatrics Society Annual Meeting, May 12, 2011.
Funding: Jennifer G. Chester was funded by an Einstein Research Fellowship. James L. Rudolph is supported by a VA Rehabilitation Research Career Development Award. Additional support was provided by the American Federation for Aging Research, the Boston MSTAR, and National Institutes of Health grants AG 026781‐05 and AG 038027. James L. Rudolph and Mary Beth Harrington and the VA Delirium Working Group Consensus Panel are VA employees. The authors have no additional disclosures to report.
- ,.Vital signs in older patients: age‐related changes.J Am Med Dir Assoc.2011;12:337–343.
- ,,.Acute confusional states (delirium) in the hospitalized elderly.Annu Rev Gerontol Geriatr.1986;6:1–26.
- ,,,,.Underdiagnosis and poor documentation of acute confusional states in elderly hip fracture patients.J Am Geriatr Soc.1991;39:760–765.
- ,,,,.Nurses' recognition of delirium and its symptoms: comparison of nurse and researcher ratings.Arch Intern Med.2001;161:2467–2473.
- Diagnostic and Statistical Manual of Mental Disorders.4th ed.Washington, DC:American Psychiatric Association;1994.
- .Delirium in older persons.N Engl J Med.2006;354:1157–1165.
- ,,,,.One‐year health care costs associated with delirium in the elderly population.Arch Intern Med.2008;168:27–32.
- ,,,,.Delirium predicts 12‐month mortality.Arch Intern Med.2002;162:457–463.
- ,,, et al.Delirium: an independent predictor of functional decline after cardiac surgery.J Am Geriatr Soc.2010;58:643–649.
- ,,, et al.The Richmond Agitation‐Sedation Scale: validity and reliability in adult intensive care unit patients.Am J Respir Crit Care Med.2002;166:1338–1344.
- ,,, et al.Monitoring sedation status over time in ICU patients: reliability and validity of the Richmond Agitation‐Sedation Scale (RASS).JAMA.2003;289:2983–2991.
- ,,.“Mini‐mental state”. A practical method for grading the cognitive state of patients for the clinician.J Psychiatr Res.1975;12:189–198.
- ,,,,,.Clarifying confusion: the confusion assessment method. A new method for detection of delirium.Ann Intern Med.1990;113:941–948.
Vital signs constitute a fundamental component of the physical examination and serve key diagnostic and monitoring purposes. The brain is as vital to life as the cardiovascular, respiratory, and immune/thermoregulatory systems, yet currently no vital sign exists that would allow rapid, reliable, and easily reproducible assessment of cognition.1 As a result, acute mental status changes frequently go undetected and untreated.24 Delirium is defined as an acute change in attention with fluctuations in cognition, thought, and/or consciousness throughout the course of the day.5 Because delirium in older patients is common and is associated with increased morbidity, mortality, functional decline, and costs,69 development and validation of a rapid, objective screening assessment could be used by nursing staff to identify patients at high risk for delirium.
Current recommendations for inpatient delirium monitoring usually involve daily cognitive screening with a standardized screening instrument.6 Because this process is often time‐consuming (8‐12 minutes), most patients do not undergo routine screening. To facilitate clinical implementation, we focused on developing a brief (30‐second) inpatient screening measure of a feature of mental status that could be administered serially. The purpose of this study was to (1) develop a brief screening tool for a core feature of mental status and (2) validate this screening tool for delirium in an older inpatient population.
METHODS
Consensus Panel
In June 2009, the Veterans Administration sponsored an interdisciplinary conference that solicited input on identifying the most targetable components of delirium and discussing potential clinical instruments. Following this, a consensus panel of 8 representatives from medicine, geriatrics, nursing, psychiatry, and psychology used a modified Delphi method to target characteristic features of delirium and identify instruments that could best capture mental status change. While inattention was agreed upon as the core cognitive feature of delirium, the group came to consensus that capturing the acute onset and fluctuating nature of delirium was better suited as a vital sign. To meet these criteria, the group modified the Richmond Agitation Sedation Scale (RASS).10
The RASS is an observational instrument that has been validated in the intesive care unit setting for objectively determining level of sedation. It has been shown to be highly reliable and associated with delirium.11 The RASS is a quick, objective scale of consciousness with a scoring system that captures both hyperactive and hypoactive levels of consciousness. A disadvantage of using the RASS includes its limited attention assessment. The Consensus panel modified the RASS to improve its assessment of attention, using a brief open‐ended question that was asked before scoring (Figure 1).
Participants
For this prospective validation study, we recruited 95 medical patients 65 years of age who had been admitted to a VA hospital. The study was approved by the institutional review board, and participants provided written informed consent. Patients were excluded if they refused (n = 64), anticipated leaving the hospital within 1 day (n = 42), or had vision or cognition impairments that would prevent their ability to complete informed consent forms and cognitive screening tools (n = 19). Five participants were discharged between enrollment and expert assessment.
Mental Status Assessments
After enrollment, 3 study staff members visited each participant independently. First, the trained research assistant obtained informed consent and demographic, cognitive, and functional assessments. The mini‐mental state examination was then administered to provide a baseline measure of cognitive function at the time of admission.12 A nurse‐interviewer later administered the modified RASS (mRASS) separately. Finally, a delirium expert performed an independent comprehensive mental status interview including assessments of attention, executive function, memory, and mood. Delirium was diagnosed by the delirium expert according to DSM‐IV criteria.5 Each investigator was blinded to the others' ratings. After the initial assessments, each participant was visited daily throughout the hospitalization by an mRASS assessor and, independently, by the delirium expert.
To determine inter‐rater reliability, 60 participants were evaluated with the mRASS by the trained research assistant and the nurse‐interviewer simultaneously. The mRASS was scored independently and the assessors were blinded to each others' ratings.
Statistics
The paired mRASS‐delirium assessments were analyzed in 3 ways: (1) as single‐day independent assessments; (2) longitudinally as a change from baseline including prevalent delirium; and (3) longitudinally as a change from baseline, excluding prevalent delirium cases. We examined 1‐point and 2‐point changes on the mRASS from baseline, which allowed determination of the most appropriate cut‐point for clinical use. Sensitivity, specificity, and likelihood ratios were calculated. The C‐statistic was calculated using absolute mRASS score for the single‐time assessments, and as a difference between minimum and maximum mRASS for the longitudinal analyses.
RESULTS
Characteristics of the study population are presented in Table 1. Because this was a VA population, the vast majority (94%) of participants were men, with a mean age of 81 years (range, 66‐96 years), and 89% were white. This population had a high Charlson Comorbidity Index (mean SD, 4.0 2.4), which was reflected in functional assessments, with 37% reporting difficulty with activities of daily living and 58% reporting difficulty with instrumental activities of daily living. Despite the age and comorbidity, delirium prevalence was 11% (n = 10) and incidence was 14% (n = 13). Interrater reliability of the mRASS yielded 98% agreement with a weighted kappa of 0.48 (P 0.001).
| Characteristics | Values |
|---|---|
| |
| Age, years, mean (SD) | 81.0 (7.3) |
| Gender, male, no. (%) | 89 (94) |
| Race, white, no. (%) | 85 (89) |
| Charlson Comorbidity Index, mean (SD) | 4.0 (2.4) |
| BMI, kg/m2, mean (SD) | 27.2 (6.3) |
| Mini‐mental state examination, mean (SD) | 24.4 (4.1) |
| AUDIT, mean (SD) | 2.4 (2.9) |
| Tobacco use, pack‐years, no. (%) | 54 (56) |
| Current | 8 (8) |
| Never | 16 (17) |
| Prior | 68 (72) |
| Functional impairment, no. (%) | |
| Difficulty with 1 ADL | 35 (37) |
| Difficulty with 1 IADL | 55 (58) |
| Length of hospital stay | |
| Mean (SD), days | 6.3 (5.4) |
| Median, days | 5 |
| mRASS per patient, mean (SD) | 3.8 (3.3) |
When the mRASS was analyzed as a single‐day independent assessment, any abnormal score (ie, a score 0) had a sensitivity of 64% and a specificity of 93% for delirium relative to the expert evaluation (Table 2). With an abnormal mRASS as 2 or 2, the sensitivity fell to 34%, while the specificity increased to 99.6%.
| Criteria | mRASS | Sensitivity* (95% CI) | Specificity* (95% CI) | LR+ | LR |
|---|---|---|---|---|---|
| |||||
| Single‐day independent assessments | |||||
| Any abnormal | 63.9% (51.976.0) | 93.2% (90.396.4) | 9.4 | 0.4 | |
| RASS 2 or 2 | 34.4% (22.546.3) | 99.6% (98.8100) | 86 | 0.7 | |
| Longitudinal assessments | |||||
| Any delirium | Any change | 73.9% (56.091.9) | 91.7% (85.398.1) | 8.9 | 0.3 |
| Change in 2 points | 21.7% | 100% | 0.8 | ||
| Incident delirium | Any change | 84.6% (65.0100.0) | 91.7% (85.398.1) | 10.2 | 0.2 |
| Change in 2 points | 23.1% | 100% | 0.8 | ||
When the mRASS was used longitudinally to detect change in delirium during the hospital stay among all participants, it had a sensitivity of 74% and specificity of 92% for any change. Increasing the stringency of the criteria by looking at a change of 2 mRASS points decreased the sensitivity (22%) and increased the specificity (100%).
To capture the potential of the mRASS administered on a longitudinal basis as a diagnostic aid, the prevalent cases of delirium were excluded. In this analysis, any change in the mRASS had a sensitivity of 85% and a specificity of 92% for incident delirium. With more stringent criteria of a change of 2 points, the sensitivity was 23% and the specificity was 100%.
DISCUSSION
In this study, we developed a modified RASS (mRASS) for serial mental status assessment. Whereas a single measurement of the mRASS had modest sensitivity and good specificity for delirium, longitudinal measurement increased the sensitivity with no loss in specificity. Importantly, the 30 seconds required for the mRASS could be incorporated into daily workflow and provides an objective measure of consciousness. As such, we believe the mRASS can potentially serve as a longitudinal measure of consciousnessmuch like a vital sign for mental status.
Altered consciousness is a clinical and diagnostic feature of delirium,5, 13 and fluctuation in mental status is a diagnostic feature of delirium. As such, a screening instrument able to quantify the level of consciousness longitudinally and allow comparison to prior and subsequent determinations has face validity as a delirium screening instrument.
The mRASS has other features that make it appropriate for serial measurement in a manner similar to a vital sign. First, it objectively described consciousness on a scale, which is an improvement relative to many of the subjective descriptions clinically used. Consistent with other studies of the RASS,10, 11 the mRASS has good interrater reliability, allowing a common language to be used to describe level of consciousness across health care settings that can become the basis for a systematic and standardized monitor of cognitive change, improving continuity of care and communication between providers. It can be further used to objectively establish a patient's baseline and monitor change longitudinally.
The current study is limited by the lack of diversity and small size of the study population, which limits external validity (generalizability). Additional studies evaluating the utility of the mRASS by a variety of health care team members in a larger, more ethnically/racially diverse and heterogeneous population should be completed before we can determine if it can perform as a mental status vital sign, and if it is associated with better patient outcomes. Additionally, this study selected patients who were physically and cognitively capable of enrolling and excluded patients with severe cognitive and sensory impairment who were unable to provide consent to participate. Thus, some of the sickest, frailest, and most cognitively impaired patients were excluded. Unfortunately, this study therefore excluded a population significantly more vulnerable to the development of delirium.
Because a change in mental status (such as delirium) is common, morbid, and costly, a brief tool that can reliably and effectively assess mental status is needed. The mRASS used in this study provided an objective measurement of consciousness, a key component of mental status, and was demonstrated to reliably screen for presence or absence of delirium when administered longitudinally. Further study in diverse populations with administration by a variety of health care team members is needed to determine whether the mRASS can accurately serve as a mental status vital sign. If adopted widely, the mRASS could be used alongside the traditional vital signs to establish patient baselines, monitor change, improve provider communication, and potentially improve patient outcomes.
Acknowledgements
The authors are indebted to all of the veterans who willingly participated in this project. The VA Delirium Working Group Consensus Panel Consisted of Kenneth Boockvar, Joseph Flaherty, Sharon Gordon, Barbara Kamholz, James Rudolph, Marianne Shaughnessy, Kenneth Shay, and Joan Stein.
The authors maintained independence in the development, execution, and reporting of this study.
This article was presented in abstract form at the American Geriatrics Society Annual Meeting, May 12, 2011.
Funding: Jennifer G. Chester was funded by an Einstein Research Fellowship. James L. Rudolph is supported by a VA Rehabilitation Research Career Development Award. Additional support was provided by the American Federation for Aging Research, the Boston MSTAR, and National Institutes of Health grants AG 026781‐05 and AG 038027. James L. Rudolph and Mary Beth Harrington and the VA Delirium Working Group Consensus Panel are VA employees. The authors have no additional disclosures to report.
- ,.Vital signs in older patients: age‐related changes.J Am Med Dir Assoc.2011;12:337–343.
- ,,.Acute confusional states (delirium) in the hospitalized elderly.Annu Rev Gerontol Geriatr.1986;6:1–26.
- ,,,,.Underdiagnosis and poor documentation of acute confusional states in elderly hip fracture patients.J Am Geriatr Soc.1991;39:760–765.
- ,,,,.Nurses' recognition of delirium and its symptoms: comparison of nurse and researcher ratings.Arch Intern Med.2001;161:2467–2473.
- Diagnostic and Statistical Manual of Mental Disorders.4th ed.Washington, DC:American Psychiatric Association;1994.
- .Delirium in older persons.N Engl J Med.2006;354:1157–1165.
- ,,,,.One‐year health care costs associated with delirium in the elderly population.Arch Intern Med.2008;168:27–32.
- ,,,,.Delirium predicts 12‐month mortality.Arch Intern Med.2002;162:457–463.
- ,,, et al.Delirium: an independent predictor of functional decline after cardiac surgery.J Am Geriatr Soc.2010;58:643–649.
- ,,, et al.The Richmond Agitation‐Sedation Scale: validity and reliability in adult intensive care unit patients.Am J Respir Crit Care Med.2002;166:1338–1344.
- ,,, et al.Monitoring sedation status over time in ICU patients: reliability and validity of the Richmond Agitation‐Sedation Scale (RASS).JAMA.2003;289:2983–2991.
- ,,.“Mini‐mental state”. A practical method for grading the cognitive state of patients for the clinician.J Psychiatr Res.1975;12:189–198.
- ,,,,,.Clarifying confusion: the confusion assessment method. A new method for detection of delirium.Ann Intern Med.1990;113:941–948.
Pediatric Deterioration Risk Score
Thousands of hospitals have implemented rapid response systems in recent years in attempts to reduce mortality outside the intensive care unit (ICU).1 These systems have 2 components, a response arm and an identification arm. The response arm is usually comprised of a multidisciplinary critical care team that responds to calls for urgent assistance outside the ICU; this team is often called a rapid response team or a medical emergency team. The identification arm comes in 2 forms, predictive and detective. Predictive tools estimate a patient's risk of deterioration over time based on factors that are not rapidly changing, such as elements of the patient's history. In contrast, detective tools include highly time‐varying signs of active deterioration, such as vital sign abnormalities.2 To date, most pediatric studies have focused on developing detective tools, including several early warning scores.38
In this study, we sought to identify the characteristics that increase the probability that a hospitalized child will deteriorate, and combine these characteristics into a predictive score. Tools like this may be helpful in identifying and triaging the subset of high‐risk children who should be intensively monitored for early signs of deterioration at the time of admission, as well as in identifying very low‐risk children who, in the absence of other clinical concerns, may be monitored less intensively.
METHODS
Detailed methods, including the inclusion/exclusion criteria, the matching procedures, and a full description of the statistical analysis are provided as an appendix (see Supporting Online Appendix: Supplement to Methods Section in the online version of this article). An abbreviated version follows.
Design
We performed a case‐control study among children, younger than 18 years old, hospitalized for >24 hours between January 1, 2005 and December 31, 2008. The case group consisted of children who experienced clinical deterioration, a composite outcome defined as cardiopulmonary arrest (CPA), acute respiratory compromise (ARC), or urgent ICU transfer, while on a non‐ICU unit. ICU transfers were considered urgent if they included at least one of the following outcomes in the 12 hours after transfer: death, CPA, intubation, initiation of noninvasive ventilation, or administration of a vasoactive medication infusion used for the treatment of shock. The control group consisted of a random sample of patients matched 3:1 to cases if they met the criteria of being on a non‐ICU unit at the same time as their matched case.
Variables and Measurements
We collected data on demographics, complex chronic conditions (CCCs), other patient characteristics, and laboratory studies. CCCs were specific diagnoses divided into the following 9 categories according to an established framework: neuromuscular, cardiovascular, respiratory, renal, gastrointestinal, hematologic/emmmunologic, metabolic, malignancy, and genetic/congenital defects.9 Other patient characteristics evaluated included age, weight‐for‐age, gestational age, history of transplant, time from hospital admission to event, recent ICU stays, administration of total parenteral nutrition, use of a patient‐controlled analgesia pump, and presence of medical devices including central venous lines and enteral tubes (naso‐gastric, gastrostomy, or jejunostomy).
Laboratory studies evaluated included hemoglobin value, white blood cell count, and blood culture drawn in the preceding 72 hours. We included these laboratory studies in this predictive score because we hypothesized that they represented factors that increased a child's risk of deterioration over time, as opposed to signs of acute deterioration that would be more appropriate for a detective score.
Statistical Analysis
We used conditional logistic regression for the bivariable and multivariable analyses to account for the matching. We derived the predictive score using an established method10 in which the regression coefficients for each covariate were divided by the smallest coefficient, and then rounded to the nearest integer, to establish each variable's sub‐score. We grouped the total scores into very low, low, intermediate, and high‐risk groups, calculated overall stratum‐specific likelihood ratios (SSLRs), and estimated stratum‐specific probabilities of deterioration for each group.
RESULTS
Patient Characteristics
We identified 12 CPAs, 41 ARCs, and 699 urgent ICU transfers during the study period. A total of 141 cases met our strict criteria for inclusion (see Figure in Supporting Online Appendix: Supplement to Methods Section in the online version of this article) among approximately 96,000 admissions during the study period, making the baseline incidence of events (pre‐test probability) approximately 0.15%. The case and control groups were similar in age, sex, and family‐reported race/ethnicity. Cases had been hospitalized longer than controls at the time of their event, were less likely to have been on a surgical service, and were less likely to survive to hospital discharge (Table 1). There was a high prevalence of CCCs among both cases and controls; 78% of cases and 52% of controls had at least 1 CCC.
| Cases (n = 141) | Controls (n = 423) | ||
|---|---|---|---|
| n (%) | n (%) | P Value | |
| |||
| Type of event | |||
| Cardiopulmonary arrest | 4 (3) | 0 | NA |
| Acute respiratory compromise | 29 (20) | 0 | NA |
| Urgent ICU transfer | 108 (77) | 0 | NA |
| Demographics | |||
| Age | 0.34 | ||
| 0‐6 mo | 17 (12) | 62 (15) | |
| 6‐12 mo | 22 (16) | 41 (10) | |
| 1‐4 yr | 34 (24) | 97 (23) | |
| 4‐10 yr | 26 (18) | 78 (18) | |
| 10‐18 yr | 42 (30) | 145 (34) | |
| Sex | 0.70 | ||
| Female | 60 (43) | 188 (44) | |
| Male | 81 (57) | 235 (56) | |
| Race | 0.40 | ||
| White | 69 (49) | 189 (45) | |
| Black/African‐American | 49 (35) | 163 (38) | |
| Asian/Pacific Islander | 0 (0) | 7 (2) | |
| Other | 23 (16) | 62 (15) | |
| Not reported | 0 (0) | 2 (1) | |
| Ethnicity | 0.53 | ||
| Non‐Hispanic | 127 (90) | 388 (92) | |
| Hispanic | 14 (10) | 33 (8) | |
| Unknown/not reported | 0 (0) | 2 (1) | |
| Hospitalization | |||
| Length of stay in days, median (interquartile range) | 7.8 (2.6‐18.2) | 3.9 (1.9‐11.2) | 0.001 |
| Surgical service | 4 (3) | 67 (16) | 0.001 |
| Survived to hospital discharge | 107 (76) | 421 (99.5) | 0.001 |
Unadjusted (Bivariable) Analysis
Results of bivariable analysis are shown in Table 2.
| Variable | Cases n (%) | Controls n (%) | OR* | 95% CI | P Value |
|---|---|---|---|---|---|
| |||||
| Complex chronic conditions categories | |||||
| Congenital/genetic | 19 (13) | 21 (5) | 3.0 | 1.6‐5.8 | 0.001 |
| Neuromuscular | 31 (22) | 48 (11) | 2.2 | 1.3‐3.7 | 0.002 |
| Respiratory | 18 (13) | 27 (6) | 2.0 | 1.1‐3.7 | 0.02 |
| Cardiovascular | 15 (10) | 24 (6) | 2.0 | 1.0‐3.9 | 0.05 |
| Metabolic | 5 (3) | 6 (1) | 2.5 | 0.8‐8.2 | 0.13 |
| Gastrointestinal | 10 (7) | 24 (6) | 1.3 | 0.6‐2.7 | 0.54 |
| Renal | 3 (2) | 8 (2) | 1.1 | 0.3‐4.2 | 0.86 |
| Hematology/emmmunodeficiency | 6 (4) | 19 (4) | 0.9 | 0.4‐2.4 | 0.91 |
| Specific conditions | |||||
| Mental retardation | 21 (15) | 25 (6) | 2.7 | 1.5‐4.9 | 0.001 |
| Malignancy | 49 (35) | 90 (21) | 1.9 | 1.3‐2.8 | 0.002 |
| Epilepsy | 22 (15) | 30 (7) | 2.4 | 1.3‐4.3 | 0.004 |
| Cardiac malformations | 14 (10) | 19 (4) | 2.2 | 1.1‐4.4 | 0.02 |
| Chronic respiratory disease arising in the perinatal period | 11 (8) | 15 (4) | 2.2 | 1.0‐4.8 | 0.05 |
| Cerebral palsy | 7 (5) | 13 (3) | 1.7 | 0.6‐4.2 | 0.30 |
| Cystic fibrosis | 1 (1) | 9 (2) | 0.3 | 0.1‐2.6 | 0.30 |
| Other patient characteristics | |||||
| Time from hospital admission to event 7 days | 74 (52) | 146 (35) | 2.1 | 1.4‐3.1 | 0.001 |
| History of any transplant | 27 (19) | 17 (4) | 5.7 | 2.9‐11.1 | 0.001 |
| Enteral tube | 65 (46) | 102 (24) | 2.6 | 1.8‐3.9 | 0.001 |
| Hospitalized in an intensive care unit during the same admission | 43 (31) | 77 (18) | 2.0 | 1.3‐3.1 | 0.002 |
| Administration of TPN in preceding 24 hr | 26 (18) | 36 (9) | 2.3 | 1.4‐3.9 | 0.002 |
| Administration of an opioid via a patient‐controlled analgesia pump in the preceding 24 hr | 14 (9) | 14 (3) | 3.6 | 1.6‐8.3 | 0.002 |
| Weight‐for‐age 5th percentile | 49 (35) | 94 (22) | 1.9 | 1.2‐2.9 | 0.003 |
| Central venous line | 55 (39) | 113 (27) | 1.8 | 1.2‐2.7 | 0.005 |
| Age 1 yr | 39 (28) | 103 (24) | 1.2 | 0.8‐1.9 | 0.42 |
| Gestational age 37 wk or documentation of prematurity | 21 (15) | 60 (14) | 1.1 | 0.6‐1.8 | 0.84 |
| Laboratory studies | |||||
| Hemoglobin in preceding 72 hr | |||||
| Not tested | 28 (20) | 190 (45) | 1.0 | [reference] | |
| 10 g/dL | 42 (30) | 144 (34) | 2.0 | 1.2‐3.5 | 0.01 |
| 10 g/dL | 71 (50) | 89 (21) | 5.6 | 3.3‐9.5 | 0.001 |
| White blood cell count in preceding 72 hr | |||||
| Not tested | 28 (20) | 190 (45) | 1.0 | [reference] | |
| 5000 to 15,000/l | 45 (32) | 131 (31) | 2.4 | 1.4‐4.1 | 0.001 |
| 15,000/l | 19 (13) | 25 (6) | 5.7 | 2.7‐12.0 | 0.001 |
| 5000/l | 49 (35) | 77 (18) | 4.5 | 2.6‐7.8 | 0.001 |
| Blood culture drawn in preceding 72 hr | 78 (55) | 85 (20) | 5.2 | 3.3‐8.1 | 0.001 |
Adjusted (Multivariable) Analysis
The multivariable conditional logistic regression model included 7 independent risk factors for deterioration (Table 3): age 1 year, epilepsy, congenital/genetic defects, history of transplant, enteral tubes, hemoglobin 10 g/dL, and blood culture drawn in the preceding 72 hours.
| Predictor | Adjusted OR (95% CI) | P Value | Regression Coefficient (95% CI) | Score* |
|---|---|---|---|---|
| ||||
| Age 1 yr | 1.9 (1.0‐3.4) | 0.038 | 0.6 (0.1‐1.2) | 1 |
| Epilepsy | 4.4 (1.9‐9.8) | 0.001 | 1.5 (0.7‐2.3) | 2 |
| Congenital/genetic defects | 2.1 (0.9‐4.9) | 0.075 | 0.8 (0.1‐1.6) | 1 |
| History of any transplant | 3.0 (1.3‐6.9) | 0.010 | 1.1 (0.3‐1.9) | 2 |
| Enteral tube | 2.1 (1.3‐3.6) | 0.003 | 0.8 (0.3‐1.3) | 1 |
| Hemoglobin 10 g/dL in preceding 72 hr | 3.0 (1.8‐5.1) | 0.001 | 1.1 (0.6‐1.6) | 2 |
| Blood culture drawn in preceding 72 hr | 5.8 (3.3‐10.3) | 0.001 | 1.8 (1.2‐2.3) | 3 |
Predictive Score
The range of the resulting predictive score was 0 to 12. The median score among cases was 4, and the median score among controls was 1 (P 0.001). The area under the receiver operating characteristic curve was 0.78 (95% confidence interval 0.74‐0.83).
We grouped the scores by SSLRs into 4 risk strata and calculated each group's estimated post‐test probability of deterioration based on the pre‐test probability of deterioration of 0.15% (Table 4). The very low‐risk group had a probability of deterioration of 0.06%, less than one‐half the pre‐test probability. The low‐risk group had a probability of deterioration of 0.18%, similar to the pre‐test probability. The intermediate‐risk group had a probability of deterioration of 0.39%, 2.6 times higher than the pre‐test probability. The high‐risk group had a probability of deterioration of 12.60%, 84 times higher than the pre‐test probability.
| Risk stratum | Score range | Cases in stratumn (%) | Controls in stratumn (%) | SSLR (95% CI) | Probability of deterioration (%)* |
|---|---|---|---|---|---|
| |||||
| Very low | 0‐2 | 37 (26) | 288 (68) | 0.4 (0.3‐0.5) | 0.06 |
| Low | 3‐4 | 37 (26) | 94 (22) | 1.2 (0.9‐1.6) | 0.2 |
| Intermediate | 5‐6 | 35 (25) | 40 (9) | 2.6 (1.7‐4.0) | 0.4 |
| High | 7‐12 | 32 (23) | 1 (1) | 96.0 (13.2‐696.2) | 12.6 |
DISCUSSION
Despite the widespread adoption of rapid response systems, we know little about the optimal methods to identify patients whose clinical characteristics alone put them at increased risk of deterioration, and triage the care they receive based on this risk. Pediatric case series have suggested that younger children and those with chronic illnesses are more likely to require assistance from a medical emergency team,1112 but this is the first study to measure their association with this outcome in children.
Most studies with the objective of identifying patients at risk have focused on tools designed to detect symptoms of deterioration that have already begun, using single‐parameter medical emergency team calling criteria1316 or multi‐parameter early warning scores.38 Rather than create a tool to detect deterioration that has already begun, we developed a predictive score that incorporates patient characteristics independently associated with deterioration in hospitalized children, including age 1 year, epilepsy, congenital/genetic defects, history of transplant, enteral tube, hemoglobin 10 g/dL, and blood culture drawn in the preceding 72 hours. The score has the potential to help clinicians identify the children at highest risk of deterioration who might benefit most from the use of vital sign‐based methods to detect deterioration, as well as the children at lowest risk for whom monitoring may be unnecessary. For example, this score could be performed at the time of admission, and those at very low risk of deterioration and without other clinically concerning findings might be considered for a low‐intensity schedule of vital signs and monitoring (such as vital signs every 8 hours, no continuous cardiorespiratory monitoring or pulse oximetry, and early warning score calculation daily), while patients in the intermediate and high‐risk groups might be considered for a more intensive schedule of vital signs and monitoring (such as vital signs every 4 hours, continuous cardiorespiratory monitoring and pulse oximetry, and early warning score calculation every 4 hours). It should be noted, however, that 37 cases (26%) fell into the very low‐risk category, raising the importance of external validation at the point of admission from the emergency department, before the score can be implemented for the potential clinical use described above. If the score performs well in validation studies, then its use in tailoring monitoring parameters has the potential to reduce the amount of time nurses spend responding to false monitor alarms and calculating early warning scores on patients at very low risk of deterioration.
Of note, we excluded children hospitalized for fewer than 24 hours, resulting in the exclusion of 31% of the potentially eligible events. We also excluded 40% of the potentially eligible ICU transfers because they did not meet urgent criteria. These may be limitations because: (1) the first 24 hours of hospitalization may be a high‐risk period; and (2) patients who were on trajectories toward severe deterioration and received interventions that prevented further deterioration, but did not meet urgent criteria, were excluded. It may be that the children we included as cases were at increased risk of deterioration that is either more difficult to recognize early, or more difficult to treat effectively without ICU interventions. In addition, the population of patients meeting urgent criteria may vary across hospitals, limiting generalizability of this score.
In summary, we developed a predictive score and risk stratification tool that may be useful in triaging the intensity of monitoring and surveillance for deterioration that children receive when hospitalized on non‐ICU units. External validation using the setting and frequency of score measurement that would be most valuable clinically (for example, in the emergency department at the time of admission) is needed before clinical use can be recommended.
Acknowledgements
The authors thank Annie Chung, BA, Emily Huang, and Susan Lipsett, MD, for their assistance with data collection.
- Institute for Healthcare Improvement. About IHI. Available at: http://www.ihi.org/ihi/about. Accessed July 18,2010.
- ,,, et al.“Identifying the hospitalised patient in crisis”—a consensus conference on the afferent limb of Rapid Response Systems.Resuscitation.2010;81(4):375–382.
- ,,.The Pediatric Early Warning System score: a severity of illness score to predict urgent medical need in hospitalized children.J Crit Care.2006;21(3):271–278.
- ,,.Development and initial validation of the Bedside Paediatric Early Warning System score.Crit Care.2009;13(4):R135.
- .Detecting and managing deterioration in children.Paediatr Nurs.2005;17(1):32–35.
- ,,.Promoting care for acutely ill children—development and evaluation of a Paediatric Early Warning Tool.Intensive Crit Care Nurs.2006;22(2):73–81.
- ,,,,.Prospective evaluation of a pediatric inpatient early warning scoring system.J Spec Pediatr Nurs.2009;14(2):79–85.
- ,,,.Prospective cohort study to test the predictability of the Cardiff and Vale paediatric early warning system.Arch Dis Child.2009;94(8):602–606.
- ,,,,,.Deaths attributed to pediatric complex chronic conditions: national trends and implications for supportive care services.Pediatrics.2001;107(6):e99.
- ,,,,.Early prediction of neurological sequelae or death after bacterial meningitis.Acta Paediatr.2002;91(4):391–398.
- ,,,,.Retrospective review of emergency response activations during a 13‐year period at a tertiary care children's hospital.J Hosp Med.2011;6(3):131–135.
- ,,,.Clinical profile of hospitalized children provided with urgent assistance from a medical emergency team.Pediatrics.2008;121(6):e1577–e1584.
- ,,, et al.Implementation of a medical emergency team in a large pediatric teaching hospital prevents respiratory and cardiopulmonary arrests outside the intensive care unit.Pediatr Crit Care Med.2007;8(3):236–246.
- ,,, et al.Effect of a rapid response team on hospital‐wide mortality and code rates outside the ICU in a children's hospital.JAMA.2007;298(19):2267–2274.
- ,,, et al.Transition from a traditional code team to a medical emergency team and categorization of cardiopulmonary arrests in a children's center.Arch Pediatr Adolesc Med.2008;162(2):117–122.
- ,.Reduction of hospital mortality and of preventable cardiac arrest and death on introduction of a pediatric medical emergency team.Pediatr Crit Care Med.2009;10(3):306–312.
Thousands of hospitals have implemented rapid response systems in recent years in attempts to reduce mortality outside the intensive care unit (ICU).1 These systems have 2 components, a response arm and an identification arm. The response arm is usually comprised of a multidisciplinary critical care team that responds to calls for urgent assistance outside the ICU; this team is often called a rapid response team or a medical emergency team. The identification arm comes in 2 forms, predictive and detective. Predictive tools estimate a patient's risk of deterioration over time based on factors that are not rapidly changing, such as elements of the patient's history. In contrast, detective tools include highly time‐varying signs of active deterioration, such as vital sign abnormalities.2 To date, most pediatric studies have focused on developing detective tools, including several early warning scores.38
In this study, we sought to identify the characteristics that increase the probability that a hospitalized child will deteriorate, and combine these characteristics into a predictive score. Tools like this may be helpful in identifying and triaging the subset of high‐risk children who should be intensively monitored for early signs of deterioration at the time of admission, as well as in identifying very low‐risk children who, in the absence of other clinical concerns, may be monitored less intensively.
METHODS
Detailed methods, including the inclusion/exclusion criteria, the matching procedures, and a full description of the statistical analysis are provided as an appendix (see Supporting Online Appendix: Supplement to Methods Section in the online version of this article). An abbreviated version follows.
Design
We performed a case‐control study among children, younger than 18 years old, hospitalized for >24 hours between January 1, 2005 and December 31, 2008. The case group consisted of children who experienced clinical deterioration, a composite outcome defined as cardiopulmonary arrest (CPA), acute respiratory compromise (ARC), or urgent ICU transfer, while on a non‐ICU unit. ICU transfers were considered urgent if they included at least one of the following outcomes in the 12 hours after transfer: death, CPA, intubation, initiation of noninvasive ventilation, or administration of a vasoactive medication infusion used for the treatment of shock. The control group consisted of a random sample of patients matched 3:1 to cases if they met the criteria of being on a non‐ICU unit at the same time as their matched case.
Variables and Measurements
We collected data on demographics, complex chronic conditions (CCCs), other patient characteristics, and laboratory studies. CCCs were specific diagnoses divided into the following 9 categories according to an established framework: neuromuscular, cardiovascular, respiratory, renal, gastrointestinal, hematologic/emmmunologic, metabolic, malignancy, and genetic/congenital defects.9 Other patient characteristics evaluated included age, weight‐for‐age, gestational age, history of transplant, time from hospital admission to event, recent ICU stays, administration of total parenteral nutrition, use of a patient‐controlled analgesia pump, and presence of medical devices including central venous lines and enteral tubes (naso‐gastric, gastrostomy, or jejunostomy).
Laboratory studies evaluated included hemoglobin value, white blood cell count, and blood culture drawn in the preceding 72 hours. We included these laboratory studies in this predictive score because we hypothesized that they represented factors that increased a child's risk of deterioration over time, as opposed to signs of acute deterioration that would be more appropriate for a detective score.
Statistical Analysis
We used conditional logistic regression for the bivariable and multivariable analyses to account for the matching. We derived the predictive score using an established method10 in which the regression coefficients for each covariate were divided by the smallest coefficient, and then rounded to the nearest integer, to establish each variable's sub‐score. We grouped the total scores into very low, low, intermediate, and high‐risk groups, calculated overall stratum‐specific likelihood ratios (SSLRs), and estimated stratum‐specific probabilities of deterioration for each group.
RESULTS
Patient Characteristics
We identified 12 CPAs, 41 ARCs, and 699 urgent ICU transfers during the study period. A total of 141 cases met our strict criteria for inclusion (see Figure in Supporting Online Appendix: Supplement to Methods Section in the online version of this article) among approximately 96,000 admissions during the study period, making the baseline incidence of events (pre‐test probability) approximately 0.15%. The case and control groups were similar in age, sex, and family‐reported race/ethnicity. Cases had been hospitalized longer than controls at the time of their event, were less likely to have been on a surgical service, and were less likely to survive to hospital discharge (Table 1). There was a high prevalence of CCCs among both cases and controls; 78% of cases and 52% of controls had at least 1 CCC.
| Cases (n = 141) | Controls (n = 423) | ||
|---|---|---|---|
| n (%) | n (%) | P Value | |
| |||
| Type of event | |||
| Cardiopulmonary arrest | 4 (3) | 0 | NA |
| Acute respiratory compromise | 29 (20) | 0 | NA |
| Urgent ICU transfer | 108 (77) | 0 | NA |
| Demographics | |||
| Age | 0.34 | ||
| 0‐6 mo | 17 (12) | 62 (15) | |
| 6‐12 mo | 22 (16) | 41 (10) | |
| 1‐4 yr | 34 (24) | 97 (23) | |
| 4‐10 yr | 26 (18) | 78 (18) | |
| 10‐18 yr | 42 (30) | 145 (34) | |
| Sex | 0.70 | ||
| Female | 60 (43) | 188 (44) | |
| Male | 81 (57) | 235 (56) | |
| Race | 0.40 | ||
| White | 69 (49) | 189 (45) | |
| Black/African‐American | 49 (35) | 163 (38) | |
| Asian/Pacific Islander | 0 (0) | 7 (2) | |
| Other | 23 (16) | 62 (15) | |
| Not reported | 0 (0) | 2 (1) | |
| Ethnicity | 0.53 | ||
| Non‐Hispanic | 127 (90) | 388 (92) | |
| Hispanic | 14 (10) | 33 (8) | |
| Unknown/not reported | 0 (0) | 2 (1) | |
| Hospitalization | |||
| Length of stay in days, median (interquartile range) | 7.8 (2.6‐18.2) | 3.9 (1.9‐11.2) | 0.001 |
| Surgical service | 4 (3) | 67 (16) | 0.001 |
| Survived to hospital discharge | 107 (76) | 421 (99.5) | 0.001 |
Unadjusted (Bivariable) Analysis
Results of bivariable analysis are shown in Table 2.
| Variable | Cases n (%) | Controls n (%) | OR* | 95% CI | P Value |
|---|---|---|---|---|---|
| |||||
| Complex chronic conditions categories | |||||
| Congenital/genetic | 19 (13) | 21 (5) | 3.0 | 1.6‐5.8 | 0.001 |
| Neuromuscular | 31 (22) | 48 (11) | 2.2 | 1.3‐3.7 | 0.002 |
| Respiratory | 18 (13) | 27 (6) | 2.0 | 1.1‐3.7 | 0.02 |
| Cardiovascular | 15 (10) | 24 (6) | 2.0 | 1.0‐3.9 | 0.05 |
| Metabolic | 5 (3) | 6 (1) | 2.5 | 0.8‐8.2 | 0.13 |
| Gastrointestinal | 10 (7) | 24 (6) | 1.3 | 0.6‐2.7 | 0.54 |
| Renal | 3 (2) | 8 (2) | 1.1 | 0.3‐4.2 | 0.86 |
| Hematology/emmmunodeficiency | 6 (4) | 19 (4) | 0.9 | 0.4‐2.4 | 0.91 |
| Specific conditions | |||||
| Mental retardation | 21 (15) | 25 (6) | 2.7 | 1.5‐4.9 | 0.001 |
| Malignancy | 49 (35) | 90 (21) | 1.9 | 1.3‐2.8 | 0.002 |
| Epilepsy | 22 (15) | 30 (7) | 2.4 | 1.3‐4.3 | 0.004 |
| Cardiac malformations | 14 (10) | 19 (4) | 2.2 | 1.1‐4.4 | 0.02 |
| Chronic respiratory disease arising in the perinatal period | 11 (8) | 15 (4) | 2.2 | 1.0‐4.8 | 0.05 |
| Cerebral palsy | 7 (5) | 13 (3) | 1.7 | 0.6‐4.2 | 0.30 |
| Cystic fibrosis | 1 (1) | 9 (2) | 0.3 | 0.1‐2.6 | 0.30 |
| Other patient characteristics | |||||
| Time from hospital admission to event 7 days | 74 (52) | 146 (35) | 2.1 | 1.4‐3.1 | 0.001 |
| History of any transplant | 27 (19) | 17 (4) | 5.7 | 2.9‐11.1 | 0.001 |
| Enteral tube | 65 (46) | 102 (24) | 2.6 | 1.8‐3.9 | 0.001 |
| Hospitalized in an intensive care unit during the same admission | 43 (31) | 77 (18) | 2.0 | 1.3‐3.1 | 0.002 |
| Administration of TPN in preceding 24 hr | 26 (18) | 36 (9) | 2.3 | 1.4‐3.9 | 0.002 |
| Administration of an opioid via a patient‐controlled analgesia pump in the preceding 24 hr | 14 (9) | 14 (3) | 3.6 | 1.6‐8.3 | 0.002 |
| Weight‐for‐age 5th percentile | 49 (35) | 94 (22) | 1.9 | 1.2‐2.9 | 0.003 |
| Central venous line | 55 (39) | 113 (27) | 1.8 | 1.2‐2.7 | 0.005 |
| Age 1 yr | 39 (28) | 103 (24) | 1.2 | 0.8‐1.9 | 0.42 |
| Gestational age 37 wk or documentation of prematurity | 21 (15) | 60 (14) | 1.1 | 0.6‐1.8 | 0.84 |
| Laboratory studies | |||||
| Hemoglobin in preceding 72 hr | |||||
| Not tested | 28 (20) | 190 (45) | 1.0 | [reference] | |
| 10 g/dL | 42 (30) | 144 (34) | 2.0 | 1.2‐3.5 | 0.01 |
| 10 g/dL | 71 (50) | 89 (21) | 5.6 | 3.3‐9.5 | 0.001 |
| White blood cell count in preceding 72 hr | |||||
| Not tested | 28 (20) | 190 (45) | 1.0 | [reference] | |
| 5000 to 15,000/l | 45 (32) | 131 (31) | 2.4 | 1.4‐4.1 | 0.001 |
| 15,000/l | 19 (13) | 25 (6) | 5.7 | 2.7‐12.0 | 0.001 |
| 5000/l | 49 (35) | 77 (18) | 4.5 | 2.6‐7.8 | 0.001 |
| Blood culture drawn in preceding 72 hr | 78 (55) | 85 (20) | 5.2 | 3.3‐8.1 | 0.001 |
Adjusted (Multivariable) Analysis
The multivariable conditional logistic regression model included 7 independent risk factors for deterioration (Table 3): age 1 year, epilepsy, congenital/genetic defects, history of transplant, enteral tubes, hemoglobin 10 g/dL, and blood culture drawn in the preceding 72 hours.
| Predictor | Adjusted OR (95% CI) | P Value | Regression Coefficient (95% CI) | Score* |
|---|---|---|---|---|
| ||||
| Age 1 yr | 1.9 (1.0‐3.4) | 0.038 | 0.6 (0.1‐1.2) | 1 |
| Epilepsy | 4.4 (1.9‐9.8) | 0.001 | 1.5 (0.7‐2.3) | 2 |
| Congenital/genetic defects | 2.1 (0.9‐4.9) | 0.075 | 0.8 (0.1‐1.6) | 1 |
| History of any transplant | 3.0 (1.3‐6.9) | 0.010 | 1.1 (0.3‐1.9) | 2 |
| Enteral tube | 2.1 (1.3‐3.6) | 0.003 | 0.8 (0.3‐1.3) | 1 |
| Hemoglobin 10 g/dL in preceding 72 hr | 3.0 (1.8‐5.1) | 0.001 | 1.1 (0.6‐1.6) | 2 |
| Blood culture drawn in preceding 72 hr | 5.8 (3.3‐10.3) | 0.001 | 1.8 (1.2‐2.3) | 3 |
Predictive Score
The range of the resulting predictive score was 0 to 12. The median score among cases was 4, and the median score among controls was 1 (P 0.001). The area under the receiver operating characteristic curve was 0.78 (95% confidence interval 0.74‐0.83).
We grouped the scores by SSLRs into 4 risk strata and calculated each group's estimated post‐test probability of deterioration based on the pre‐test probability of deterioration of 0.15% (Table 4). The very low‐risk group had a probability of deterioration of 0.06%, less than one‐half the pre‐test probability. The low‐risk group had a probability of deterioration of 0.18%, similar to the pre‐test probability. The intermediate‐risk group had a probability of deterioration of 0.39%, 2.6 times higher than the pre‐test probability. The high‐risk group had a probability of deterioration of 12.60%, 84 times higher than the pre‐test probability.
| Risk stratum | Score range | Cases in stratumn (%) | Controls in stratumn (%) | SSLR (95% CI) | Probability of deterioration (%)* |
|---|---|---|---|---|---|
| |||||
| Very low | 0‐2 | 37 (26) | 288 (68) | 0.4 (0.3‐0.5) | 0.06 |
| Low | 3‐4 | 37 (26) | 94 (22) | 1.2 (0.9‐1.6) | 0.2 |
| Intermediate | 5‐6 | 35 (25) | 40 (9) | 2.6 (1.7‐4.0) | 0.4 |
| High | 7‐12 | 32 (23) | 1 (1) | 96.0 (13.2‐696.2) | 12.6 |
DISCUSSION
Despite the widespread adoption of rapid response systems, we know little about the optimal methods to identify patients whose clinical characteristics alone put them at increased risk of deterioration, and triage the care they receive based on this risk. Pediatric case series have suggested that younger children and those with chronic illnesses are more likely to require assistance from a medical emergency team,1112 but this is the first study to measure their association with this outcome in children.
Most studies with the objective of identifying patients at risk have focused on tools designed to detect symptoms of deterioration that have already begun, using single‐parameter medical emergency team calling criteria1316 or multi‐parameter early warning scores.38 Rather than create a tool to detect deterioration that has already begun, we developed a predictive score that incorporates patient characteristics independently associated with deterioration in hospitalized children, including age 1 year, epilepsy, congenital/genetic defects, history of transplant, enteral tube, hemoglobin 10 g/dL, and blood culture drawn in the preceding 72 hours. The score has the potential to help clinicians identify the children at highest risk of deterioration who might benefit most from the use of vital sign‐based methods to detect deterioration, as well as the children at lowest risk for whom monitoring may be unnecessary. For example, this score could be performed at the time of admission, and those at very low risk of deterioration and without other clinically concerning findings might be considered for a low‐intensity schedule of vital signs and monitoring (such as vital signs every 8 hours, no continuous cardiorespiratory monitoring or pulse oximetry, and early warning score calculation daily), while patients in the intermediate and high‐risk groups might be considered for a more intensive schedule of vital signs and monitoring (such as vital signs every 4 hours, continuous cardiorespiratory monitoring and pulse oximetry, and early warning score calculation every 4 hours). It should be noted, however, that 37 cases (26%) fell into the very low‐risk category, raising the importance of external validation at the point of admission from the emergency department, before the score can be implemented for the potential clinical use described above. If the score performs well in validation studies, then its use in tailoring monitoring parameters has the potential to reduce the amount of time nurses spend responding to false monitor alarms and calculating early warning scores on patients at very low risk of deterioration.
Of note, we excluded children hospitalized for fewer than 24 hours, resulting in the exclusion of 31% of the potentially eligible events. We also excluded 40% of the potentially eligible ICU transfers because they did not meet urgent criteria. These may be limitations because: (1) the first 24 hours of hospitalization may be a high‐risk period; and (2) patients who were on trajectories toward severe deterioration and received interventions that prevented further deterioration, but did not meet urgent criteria, were excluded. It may be that the children we included as cases were at increased risk of deterioration that is either more difficult to recognize early, or more difficult to treat effectively without ICU interventions. In addition, the population of patients meeting urgent criteria may vary across hospitals, limiting generalizability of this score.
In summary, we developed a predictive score and risk stratification tool that may be useful in triaging the intensity of monitoring and surveillance for deterioration that children receive when hospitalized on non‐ICU units. External validation using the setting and frequency of score measurement that would be most valuable clinically (for example, in the emergency department at the time of admission) is needed before clinical use can be recommended.
Acknowledgements
The authors thank Annie Chung, BA, Emily Huang, and Susan Lipsett, MD, for their assistance with data collection.
- Institute for Healthcare Improvement. About IHI. Available at: http://www.ihi.org/ihi/about. Accessed July 18,2010.
- ,,, et al.“Identifying the hospitalised patient in crisis”—a consensus conference on the afferent limb of Rapid Response Systems.Resuscitation.2010;81(4):375–382.
- ,,.The Pediatric Early Warning System score: a severity of illness score to predict urgent medical need in hospitalized children.J Crit Care.2006;21(3):271–278.
- ,,.Development and initial validation of the Bedside Paediatric Early Warning System score.Crit Care.2009;13(4):R135.
- .Detecting and managing deterioration in children.Paediatr Nurs.2005;17(1):32–35.
- ,,.Promoting care for acutely ill children—development and evaluation of a Paediatric Early Warning Tool.Intensive Crit Care Nurs.2006;22(2):73–81.
- ,,,,.Prospective evaluation of a pediatric inpatient early warning scoring system.J Spec Pediatr Nurs.2009;14(2):79–85.
- ,,,.Prospective cohort study to test the predictability of the Cardiff and Vale paediatric early warning system.Arch Dis Child.2009;94(8):602–606.
- ,,,,,.Deaths attributed to pediatric complex chronic conditions: national trends and implications for supportive care services.Pediatrics.2001;107(6):e99.
- ,,,,.Early prediction of neurological sequelae or death after bacterial meningitis.Acta Paediatr.2002;91(4):391–398.
- ,,,,.Retrospective review of emergency response activations during a 13‐year period at a tertiary care children's hospital.J Hosp Med.2011;6(3):131–135.
- ,,,.Clinical profile of hospitalized children provided with urgent assistance from a medical emergency team.Pediatrics.2008;121(6):e1577–e1584.
- ,,, et al.Implementation of a medical emergency team in a large pediatric teaching hospital prevents respiratory and cardiopulmonary arrests outside the intensive care unit.Pediatr Crit Care Med.2007;8(3):236–246.
- ,,, et al.Effect of a rapid response team on hospital‐wide mortality and code rates outside the ICU in a children's hospital.JAMA.2007;298(19):2267–2274.
- ,,, et al.Transition from a traditional code team to a medical emergency team and categorization of cardiopulmonary arrests in a children's center.Arch Pediatr Adolesc Med.2008;162(2):117–122.
- ,.Reduction of hospital mortality and of preventable cardiac arrest and death on introduction of a pediatric medical emergency team.Pediatr Crit Care Med.2009;10(3):306–312.