User login
Clinical Approach and Treatment of the Hyponatremic Patient
Hyponatremia is one of the most common electrolyte abnormalities encountered in clinical practice. The frequency of the disorder varies according to definition and clinical setting but has been reported to be present in 28% of patients upon hospital admission and in 7% of patients attending an ambulatory community clinic.1 Increasing age, medications, various disease states, and administration of hypotonic fluids are among the known risk factors for the disorder.
The mortality rate in hyponatremic patients is approximately 3 times that of normonatremic hospitalized patients.25 Outcomes are particularly poor in those patients whose serum sodium (Na+) falls during a hospitalization. In 1 prospective study the mortality rate in patients with a normal serum Na+ concentration was 0.2% in comparison to a mortality rate of 11.2% and 25% in patients with a serum Na+ concentration 130 mEq/L and 120 mEq/L, respectively.2 In a recent retrospective cohort study of 10,899 hospitalized patients, the incidence of hyponatremia (135 mmol/L) at admission was 5.5%.5 As compared to those with normonatremia, these patients were more likely to require intensive care and mechanical ventilation within 48 hours of hospitalization. In addition, hospital mortality, mean length of stay, and costs were significantly greater among patients with hyponatremia than those without.
The association with hyponatremia and adverse outcomes could be the direct result of hyponatremia, the comormidities that lead to the electrolyte derangement, or both. Whatever the mechanism, hyponatremia should not be viewed as an innocuous condition. Rather, clinicians should view this disorder with urgency and institute measures to prevent any further decline in the serum Na+ concentration and initiate appropriate therapy for its correction. This review will first briefly summarize the pathogenesis of hyponatremia and then discuss various disease states encountered in the hospital setting in which hyponatremia is frequently present.
Pathogenesis of Hyponatremia
Hyponatremia is generally associated with a hypoosmolar state and is a marker for a disturbance in water balance. Stated differently, all hyponatremia is dilutional. The approach to the patient with hyponatremia is outlined in Figure 1.

Is the Hyponatremia Representative of a Hypoosmolar State?
There are 3 causes of hyponatremia in which it is not associated with a hypoosmolar state. The first of these is pseudohyponatremia which involves an abnormal measurement of the serum Na+. This occurs in patients with hyperglobulinemia or hypertriglyceridemia in whom plasma water relative to plasma solids is decreased in blood, leading to less Na+ in a given volume of blood. In general, this problem is becoming less prevalent as many laboratories are using Na+ electrodes without diluting the blood such that the Na+ measurement becomes independent of plasma water and nonaqueous contents.
A second cause of hyponatremia in the absence of a hypoosmolar state involves true hyponatremia but with elevations in the concentration of another osmole. Clinical examples include hyperglycemia as seen in uncontrolled diabetes or rarely hypertonic infusion of mannitol used in the treatment of cerebral edema. The accumulation of these effective osmoles creates an osmotic force causing water to move from the intracellular to the extracellular space thus diluting the serum Na+. For every 100 mg/dL rise in glucose or mannitol, the serum Na+ will quickly fall by 1.6 mEq/L. This increase in tonicity also stimulates thirst and arginine vasopressin (AVP) secretion, both of which contribute to further water retention. As a result the plasma osmolality and serum Na+ concentration will continue to fall. Once the plasma osmolality normalizes the serum Na+ will have decreased by 2.8 mEq/L for every 100 mg/dL rise in glucose.
The third cause of hyponatremia in the absence of a hypoosmolar state is the addition of an isosmotic (or near isosmotic) non‐Na+ containing fluid to the extracellular space. This situation typically occurs during a transurethral resection of the prostate or during laprascopic surgery when large amounts of a nonconducting flushing solution containing glycine or sorbitol are absorbed systemically.
Is the Kidney's Ability to Dilute the Urine Intact?
The presence of hypotonic hyponatremia implies that water intake exceeds the ability of the kidney to excrete water. In unusual circumstances, this can occur when the kidneys ability to excrete free water is intact. However, because a normal kidney can excrete 18 L of water per day, the presence of hyponatremia with normal renal water excretion implies the patient is drinking >20 L water/day. This condition is referred to as primary polydipsia. These patients should have a urine osmolality 100 mOsm/L. While primary polydipsia is a common condition which leads to polyuria and polydipsia, it is uncommon as a sole cause of hyponatremia.
Hyponatremia in association with a maximally dilute urine can also result from more moderate fluid intake combined with extremely limited solute intake, a condition often referred to as beer potomania syndrome. In normal subjects, daily solute excretion is usually in the range of 800 mOsm to 1000 mOsm per day. Since the limit of urinary dilution is approximately 50 mOsm/L, then maximum urine output can be calculated to be approximately 16 L to 20 L per day (1000 mOsm/L/50 mOsm/L = 20). Individuals who drink beer or who are ingesting a fad diet have very limited protein intake so that daily solute excretion may be as low as 200 mOsm per day. In this setting, water intake >4 L/day (200 mOsm/50 mOsm/L = 4 L) will exceed renal water excretion and cause hyponatremia. Urine osmolality will be maximally dilute in such a patient.
In the absence of primary polydipsia, hyponatremia is associated with decreased renal water excretion and a urine that is inappropriately concentrated. It is important to note that in the presence of hyponatremia urine should be maximally dilute and a urine osmolality higher than this (>100 mOsm/L) is inappropriate. An inappropriately concentrated urine implies a defect in renal water excretion.
Excretion of water by the kidney is dependent on three factors. First, there must be adequate delivery of filtrate to the tip of the loop of Henle. Second, solute absorption in the ascending limb and the distal nephron must be normal so that the tubular fluid will be diluted. Lastly, AVP levels must be low in the plasma. Of these 3 requirements for water excretion, the one which is probably most important in the genesis of hyponatremia is the failure to maximally suppress AVP levels. In many conditions, decreased delivery of filtrate to the tip of the loop of Henle also contributes.
What is the Volume Status of the Patient?
In patients with hypotonic hyponatremia with an inappropriately concentrated urine, one needs to define whether effective arterial volume is decreased. Most causes of hyponatremia result from a decrease in effective arterial volume which leads to both baroreceptor‐mediated stimulation of AVP secretion and decreased distal delivery of filtrate to the tip of the loop of Henle. If effective arterial volume is low, extracellular fluid (ECF) volume can be low in the volume‐depleted patient (hypovolemic hyponatremia) or can be high in the edematous patient (hypervolemic hyponatremia). If effective arterial volume is normal, one is dealing with the euvolemic causes of hyponatremia (isovolemic hyponatremia).
The clinical determination of effective arterial volume is usually straightforward. On physical examination the best index of effective arterial volume is the presence or absence of an orthostatic change in pulse and blood pressure. Urinary electrolytes are also extremely useful in the assessment of effective arterial volume. Patients with a low effective arterial volume will tend to have a low urinary Na+ and Cl concentration and low fractional excretions of Na+ and Cl in the urine. Patients with euvolemic hyponatremia will be in balance and will excrete Na+ and Cl at rates that reflect dietary intake of Na+ and Cl. Generally urinary Na+ and Cl is >20 mEq/L and fractional excretions of these electrolytes are >1%.
Plasma composition can also be used to assess effective arterial volume. The blood urea nitrogen (BUN) is particularly sensitive to effective arterial volume. In patients with a normal serum creatinine concentration, a high BUN suggests a low effective arterial volume and a low BUN suggests a high effective arterial volume. The plasma uric acid can also be used as a sensitive index of effective arterial volume. In comparing patients with the syndrome of inappropriate secretion of antidiuretic hormone (SIADH) and other causes of hyponatremia, patients with low effective arterial volume tend to have an elevated serum uric acid. The serum urate is low in patients with SIADH. This is due to the fact that these patients are volume expanded although it is clinically difficult to detect the degree of volume expansion.
Syndrome of Inappropriate Antidiuretic Hormone Secretion (SIADH)
In patients who are determined to be clinically euvolemic, a concentrated urine and high AVP levels are inappropriate. The most common cause of this condition is SIADH. This syndrome is generally associated with diseases of the central nervous system, pulmonary diseases, and neoplasms. These conditions lead to secretion of AVP which is inappropriate both from the standpoint of plasma osmolality and effective arterial volume. A number of other etiologies cause a condition of hypoosmolality associated with euvolemia and can mimic the syndrome of inappropriate AVP secretion. These include isolated glucocorticoid deficiency (normal mineralocorticoid activity), hypothyroidism, pain, nausea, acute psychosis, and a variety of drugs.
Clinical Conditions Associated With Hyponatremia in the Hospital Setting
Post‐Operative Hyponatremia
The postoperative patient is particularly prone to developing hyponatremia. AVP levels are increased for several days following surgical procedures due to baroreceptor and nonbaroreceptor‐mediated mechanisms. These patients typically have subtle or overt decreases in effective arterial blood volume due to prolonged preoperative fasting combined with intraoperative and postoperative blood loss and third spacing of fluid. In addition to these factors which unload baroreceptors, postoperative pain, stress, anxiety, nausea, and administration of morphine can further stimulate the release of AVP. In some instances nonsteroidal antiinflmmatory drugs are given which have the effect of augmenting the hydroosmotic actions of AVP.6 In this setting of compromised ability to excrete a water load, administration of hypotonic fluid can precipitate acute iatrogenic hyponatremia.
Postoperative hyponatremia has been a major problem in pediatric populations due to the widespread practice of using hypotonic fluids for maintenance therapy. This approach is based on guidelines developed 50 years ago which were based on calculations linking energy expenditures to water and electrolyte losses.7 More recently, several groups have argued that isotonic rather than hypotonic fluids should be the routine maintenance fluid in such patients.8, 9 The pediatric community has been slow to embrace this approach out of the concern that excessive administration of Na+ would increase the risk of hypernatremia. A systematic meta‐analysis of studies comparing isotonic and hypotonic fluids in hospitalized children found the odds of developing hyponatremia following hypotonic solutions was 17.2 times greater than with isotonic fluids.10 The concern that isotonic maintenance fluids carry a risk of hypernatremia was not supported in the review. Some studies actually reported a decrease in serum Na+ concentration, presumably due to the desalination phenomenon in which hypertonic urine is excreted in volume expanded subjects with persistent vasopressin secretion.
Endocrine Disorders
Glucocorticoid Deficiency
Patients with glucocorticoid deficiency develop hyponatremia. It is important to separate this condition from that of mineralocorticoid deficiency and combined mineralocorticoid‐glucocorticoid deficiency. In patients with mineralocorticoid deficiency, ECF volume and effective arterial volume are low. This leads to baroreceptor stimulation of AVP secretion and to decreased distal delivery of filtrate to the diluting segments of the nephron. In isolated glucocorticoid deficiency, the patients are euvolemic. In these patients, for any given level of low plasma osmolality, vasopressin levels are inappropriately elevated. The administration of hydrocortisone restores the relationship between vasopressin and plasma osmolality to normal.
While it is possible to develop isolated glucocorticoid deficiency with adrenal disease, most adrenal diseases cause loss of mineralocorticoid and glucocorticoid function. Glucocorticoid deficiency in the absence of mineralocorticoid deficiency is usually due to pituitary disease. In fact, severe hyponatremia may be the initial clue to the presence of previously unrecognized hypopituitarism. Insufficient adrenal secretion of glucocorticoids may also be a complication following the long term use of exogenous glucocorticoids.
In addition to high AVP levels, AVP‐independent mechanisms lead to increases in urinary osmolality in glucocorticoid deficiency. The nature of this AVP‐independent effect is likely multifactorial. First, glucocorticoid deficiency is associated with a diminished cardiac output and an impaired systemic vascular response to hypotension. These changes will lead to a slight decline in glomerular filtration rate and increased volume absorption in the proximal tubule and thin descending limb. As a result, distal delivery of filtrate to the diluting segment will be abnormally low in glucocorticoid deficiency. Second, mineralocorticoid and glucocorticoid deficiency have both been shown to result in increased expression of aquaporin 2 water channels in the collecting duct.11 This later effect will further limit maximal urinary dilution and contribute to net water retention.
These AVP‐independent mechanisms are consistent with the clinical observation that patients with diabetes insipidus appear to improve clinically when they develop coexistent anterior pituitary insufficiency, and treatment of these patients with glucocorticoids appears to worsen the diabetes insipidus. Thus, in the patient with diabetes, insipidus‐free water excretion will be extremely large. When simultaneous glucocorticoid deficiency develops, free‐water excretion decreases.
Hypothyroidism
Myxedema coma is the most severe form of hypothyroidism and is commonly associated with hyponatremia.12 In this setting, blood pressure can be low because of decreased intravascular volume and cardiovascular collapse. The hypotension can be refractory to vasopressor therapy in the absence of thyroid hormone therapy. Cardiac output and stroke volume are low. A defect in renal water excretion develops as a result of baroreceptor mediated increases in AVP along with decreased delivery of filtrate to the distal nephron. In hypothyroid rats, there is upregulation of aquaporin 2 water channels. In these animals, administration of a V2 receptor antagonist reverses the increased water channel expression and corrects the impaired response to an acute water load.11
While reduced cardiac output and blood pressure associated with severe hypothyroidism can provide a stimulatory effect for AVP release through a baroreceptor mediated mechanism, milder forms of hypothyroidism can be considered in the differential diagnosis of euvolemic hyponatremia. In this setting, impaired renal excretion of water is presumably due to increased release of AVP due to the absence of a tonic inhibitory effect of thyroid hormone in the central nervous system. The degree of hyponatremia in this setting is typically mild.
Heart Failure
Hyponatremia is a common complication of left‐sided heart failure and several studies have shown that it is an independent predictor of mortality.13, 14 A similar association between reduced survival and hyponatremia is present in advanced right‐sided heart failure in patients with pulmonary arterial hypertension.15 Patients with heart failure who are hyponatremic have higher circulating levels of neurohormones (catecholamines, renin, angiotensin II, aldosterone, and AVP) than normonatremic subjects and are more likely to have prerenal azotemia. In addition to being a marker for the extent of neurohumoral activation, hyponatremia may play a more direct role in adverse outcomes through maladaptive volume regulatory responses of cardiac myocytes and by direct effects of AVP on cardiac and coronary V1a receptors.
Heart failure is associated with arterial underfilling leading to arterial baroreceptor‐mediated activation of the neurohumoral axis. This underfilling is due to decreased cardiac output in low‐output heart failure and decreased systemic vascular resistance in high‐output heart failure. Activation of the sympathetic nervous system along with the renin‐angiotensin‐aldosterone system leads to renal salt retention while the increase in AVP is associated with water retention and hyponatremia.
Cirrhosis
Hyponatremia is a common electrolyte abnormality in patients with cirrhosis and occurs with a frequency that tends to parallel the severity of liver disease.16 Patients with a serum Na+ 130 mEq/L are more likely to have refractory ascites and require therapeutic paracentesis. Hepatic encephalopathy, hepatorenal syndrome, and spontaneous bacterial peritonitis are also more common in patients with a serum Na+ 130 mmol/L than in patients with a normal serum Na+ concentration. Hyponatremia increases morbidity and mortality from hepatic transplantation and is associated with osmotic demyelination in the postoperative period because of the large increase in Na+ concentration associated with the procedure.17
Hepatic cirrhosis is characterized by a decreased effective arterial blood volume and activation of neurohumoral effectors. Reduced effective circulating volume due to generalized and specifically to arterial splanchnic vasodilation leads to baroreceptor‐mediated nonosmotic stimulation of AVP release and an impaired ability to excrete electrolyte‐free water.18 Reduced Na+ delivery to the distal tubule because of a low glomerular filtration rate and increased proximal Na+ reabsorption adds to the susceptibility of cirrhotic patients to hyponatremia.
Hyponatremic‐Hypertensive Syndrome
The development of hyponatremia in patients with severe hypertension associated with renal artery stenosis has been called the hyponatremic‐hypertensive syndrome.19, 20 Patients with this syndrome present with a variety of signs and symptoms that include headache, confusion, postural dizziness, polyuria, polydipsia, and salt craving. In a retrospective review of 32 patients with this syndrome, most of the subjects were thin, elderly, women smokers who had atherosclerotic renal vascular disease.19 Biochemical abnormalities included not only hyponatremia, but hypokalemia and increased plasma renin activity. The mean serum Na+ concentration was 129.7 mmol/L (range 120‐135).
The precise mechanism of this syndrome is not known. Given the available data, angiotensin‐mediated thirst coupled with nonosmotic release of AVP provoked by angiotensin II and/or hypertensive encephalopathy are likely. Na+ depletion due to pressure natriuresis, and K+ depletion due to hyperaldosteronism are also likely to play a role in the pathogenesis of hyponatremia.
Pneumonia
An association between pneumonia and hyponatremia has been known for quite some time but has been poorly defined. Of the various etiologic agents, legionella is more commonly associated with hyponatremia as compared to other types of community acquired disease. As has been true for many disorders, hyponatremia is associated with longer hospital stays and hospital mortality, most likely reflecting the severity of the pneumonia rather than morbidity from the usually mild and asymptomatic hyponatremia.
Central Nervous System Disease
Hyponatremia is a frequent complication of central nervous system disease to include bacterial meningitis and traumatic brain injury. Potential mechanisms include the development of SIADH, cerebral salt wasting (CSW), or hypotonic fluid administration in the setting of impaired renal water excretion as in patients with low effective volume. Of these various causes, hyponatremia is frequently attributed to SIADH. As previously mentioned, this syndrome is characterized by hyponatremia in the setting of an inappropriately concentrated urine, increased urine Na+ concentration, and evidence of normal or slightly increased intravascular volume.
However there are patients with intracranial disease who develop hyponatremia with similar characteristics but differ in that there is clinical evidence of a contracted ECF volume. This form of hyponatremia is due to excessive renal Na+ excretion resulting from a centrally mediated process and is termed CSW. The onset of this disorder is typically seen within the first ten days following a neurosurgical procedure or after a definable event, such as a subarachnoid hemorrhage or stroke. CSW has also been described in other intracranial disorders, such as carcinomatous or infectious meningitis and metastatic carcinoma.21 The distinction between SIADH and CSW is of considerable clinical importance given the divergent nature of the treatments. Fluid restriction is the treatment of choice in SIADH, whereas the treatment of CSW comprises vigorous Na+ and volume replacement.
Treatment of Hyponatremia
Symptoms of hyponatremia include nausea and malaise, which can be followed by headache, lethargy, muscle cramps, disorientation, restlessness and obtundation, and seizures. The principal danger of hyponatremia or hypernatremia relates to effects on central nervous system function due to changes in brain size (Figure 2).
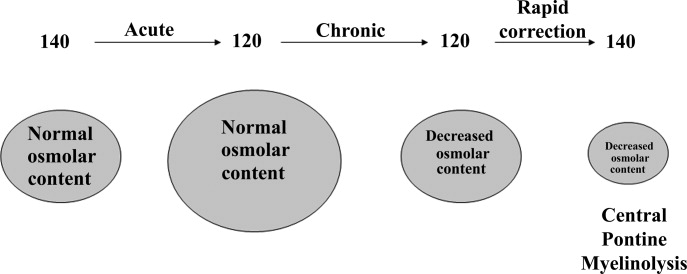
Hyponatremia initially leads to cell swelling driven by the higher intracellular osmolality. The net result is equilibration of intracellular and extracellular osmolality at the expense of increased brain volume. Cells in general, and brain cells in particular, then respond by decreasing the number of intracellular osmoles and as intracellular osmolality decreases, cell size returns toward normal despite the presence of hyponatremia. If the decrease in ECF osmolality is slow, there will be no measurable cell swelling. This pathophysiologic sequence correlates well with clinical observations. If hyponatremia is slow in onset, neurologic symptoms and permanent brain damage are unusual, even if the decreases in Na+ concentration and ECF osmolality are large. Conversely, if hyponatremia is rapid in onset, cerebral edema and significant CNS symptoms and signs can occur with lesser changes in serum Na+ concentration.
When treating a patient with hyponatremia, the Na+ concentration should be raised at the rate at which it fell. In a patient whose serum Na+ concentration has decreased rapidly (48 hours), neurologic symptoms are frequently present and there is cerebral edema. In this setting there has not been sufficient time to remove osmoles from the brain and rapid return to normal ECF osmolality merely returns brain size to normal. In general, the development of hyponatremia in the outpatient setting is more commonly chronic in duration and should be corrected slowly. By contrast, hyponatremia of short duration is more likely to be encountered in hospitalized patients receiving intravenous free water. Use of ecstasy, exercise‐induced hyponatremia, or patients with primary polydipsia can also develop acute hyponatremia and if symptomatic may similarly require rapid correction. Raising the serum Na+ concentration by 4 mEq/L to 6 mEq/L over a several hour period is both safe and effective in preventing untoward effects of acute hyponatremia.22 A reasonable strategy to accomplish this goal is the regimen recommended for the treatment of athletes with hyponatremia and encephalopathy.23 These guidelines suggest an immediate bolus of 100 mL 3% NaCl (513 mEq/L). If there is no neurologic improvement two additional 100 mL 3% NaCl bolus infusions separated by 10 minute intervals can be given.
In patients with chronic hyponatremia (>48 hours duration) the serum Na+ concentration has fallen slowly. Neurologic symptoms are generally minimal, brain size is normal, and the number of intracellular osmoles is decreased. Sudden return of ECF osmolality to normal values will lead to cell shrinkage and possibly precipitate osmotic demyelination. Experts in the field suggest this complication can be prevented by adhering to the following limits of correction: 10 mmol/L in 24 hours, 18 mmol/L in 48 hours, and 20 mmol/L in 72 hours.22 In order to maximize patient safety, the goals of therapy should be more modest: 6 to 8 mmol/L in 24 hours, 12 to 14 mmol/L in 48 hours, and 14 to 16 mmol/L in 72 hours.
A formula designed to predict the increase in serum Na+ concentration to be expected from the infusion of 1 L of a given infusion is given below:
- .Age and gender as risk factors for hyponatremia and hypernatremia.Clin Chem Acta.2003;337:169–172.
- ,,,.Hyponatremia: a prospective analysis of its epidemiology and the pathogenetic role of vasopressin.Ann Intern Med.1985;102(2):164–168.
- ,,, et al.Characteristics and mortality of severe hyponatraemia‐a hospital‐based study.Clin Endocrinol (Oxf).2006;65(2):246–249.
- ,,.Mortality after hospitalization with mild moderate and severe hyponatremia.Am J Med.2009;122:8857–8865.
- ,,, et al.Epidemiology, clinical and economic outcomes of admission hyponatremia among hospitalized patients.Curr Med Res Opin.2008;24:1601–1608.
- .Renal complications associated with use of nonsteroidal anti‐inflammatory agents.J Investig Med.1995;43(6):516–533.
- ,.Recent developments in the perioperative fluid management for the paediatric patient.Curr Opin Anaesthesiol.2006;19:268–277.
- ,.Prevention of hospital‐acquired hyponatremia: a case for using isotonic saline.Pediatrics.2003;111:227–230.
- ,,,,.Acute hyponatremia related to intravenous fluid administration in hospitalized children: an observational study.Pediatrics.2004;113(5):1279–1284.
- ,,,.Hypotonic versus isotonic saline in hospitalized children: a systematic review.Arch Dis Child.2006;91(10):828–835.
- .Vasopressin and Aquaporin 2 in clinical disorders of water homeostasis.Semin Nephrol.2008;28:289–296.
- .Myxedema coma.Edocrinol Metab Clin N Am.2006;35:687–698.
- ,,, et al.Relationship between admission serum sodium concentration and clinical outcomes in patients hospitalized for heart failure: an analysis from the OPTIMIZE‐HF registry.Eur Heart J.2007;28(8):920–921.
- ,.Pulmonary hypertension, right ventricular failure, and kidney: different from left ventricular failure.Clin J Am Soc Nephrol.2008;3:1232–1237.
- ,,, et al.Hyponatremia predicts right heart failure and poor survival in pulmonary arterial hypertension.Am J Respir Crit Care Med.2008;177(12):1364–1369.
- ,,,;CAPPS investigators. Hyponatremia in cirrhosis: results of a patient population survey.Hepatology.2006;44(6):1535–1542.
- ,,,,,.Possible causes of central pontine myelinolysis after liver transplantation.World J Gastroenterol.2004;10(17):2540–2543.
- .Pathogenesis of ascites and renal salt retention in cirrhosis.J Invest Med.1999;47:183–202.
- ,.The hyponatremic hypertensive syndrome in renal artery stenosis: An infrequent cause of hyponatremia.J Postgrad Med.2007;53:41–43.
- ,,,.Hyponatremic‐hypertensive syndrome with renal ischemia: an underrecognized disorder.Hypertension.1993;33:1020–1024.
- .Hyponatremia in patients with central nervous system disease: SIADH or CSW.Trends Endocrinol Metab.2003;14:182–187.
- ,,.The treatment of hyponatremia.Semin Nephrol.2009;29:282–299.
- ,,, et al.Statement of the second international exercise‐associated hyponatremia consensus development conference, New Zealand.Clin J Sport Med.2008;18:111–121.
- ,,,,,.Hypertonic saline for hyponatremia: risk of inadvertent overcorrection.Clin J Am Soc Nephrol.2007;2:1110–1117.
- ,,, et al.DDAVP is effective in preventing and reversing inadvertent overcorrection of hyponatremia.Clin J Am Soc Nephrol.2008;3:331–336.
- ,,,,.Assessment of the efficacy and safety of intravenous conivaptan in euvolemic and hypervolemic hyponatremia.Am J Nephrol2007;27:447–457.
- ,,, et al.,Tolvaptan, a selective oral vasopressin V2‐receptor antagonist, for hyponatremia.N Engl J Med.2006;355:2099–2112.
Hyponatremia is one of the most common electrolyte abnormalities encountered in clinical practice. The frequency of the disorder varies according to definition and clinical setting but has been reported to be present in 28% of patients upon hospital admission and in 7% of patients attending an ambulatory community clinic.1 Increasing age, medications, various disease states, and administration of hypotonic fluids are among the known risk factors for the disorder.
The mortality rate in hyponatremic patients is approximately 3 times that of normonatremic hospitalized patients.25 Outcomes are particularly poor in those patients whose serum sodium (Na+) falls during a hospitalization. In 1 prospective study the mortality rate in patients with a normal serum Na+ concentration was 0.2% in comparison to a mortality rate of 11.2% and 25% in patients with a serum Na+ concentration 130 mEq/L and 120 mEq/L, respectively.2 In a recent retrospective cohort study of 10,899 hospitalized patients, the incidence of hyponatremia (135 mmol/L) at admission was 5.5%.5 As compared to those with normonatremia, these patients were more likely to require intensive care and mechanical ventilation within 48 hours of hospitalization. In addition, hospital mortality, mean length of stay, and costs were significantly greater among patients with hyponatremia than those without.
The association with hyponatremia and adverse outcomes could be the direct result of hyponatremia, the comormidities that lead to the electrolyte derangement, or both. Whatever the mechanism, hyponatremia should not be viewed as an innocuous condition. Rather, clinicians should view this disorder with urgency and institute measures to prevent any further decline in the serum Na+ concentration and initiate appropriate therapy for its correction. This review will first briefly summarize the pathogenesis of hyponatremia and then discuss various disease states encountered in the hospital setting in which hyponatremia is frequently present.
Pathogenesis of Hyponatremia
Hyponatremia is generally associated with a hypoosmolar state and is a marker for a disturbance in water balance. Stated differently, all hyponatremia is dilutional. The approach to the patient with hyponatremia is outlined in Figure 1.
Is the Hyponatremia Representative of a Hypoosmolar State?
There are 3 causes of hyponatremia in which it is not associated with a hypoosmolar state. The first of these is pseudohyponatremia which involves an abnormal measurement of the serum Na+. This occurs in patients with hyperglobulinemia or hypertriglyceridemia in whom plasma water relative to plasma solids is decreased in blood, leading to less Na+ in a given volume of blood. In general, this problem is becoming less prevalent as many laboratories are using Na+ electrodes without diluting the blood such that the Na+ measurement becomes independent of plasma water and nonaqueous contents.
A second cause of hyponatremia in the absence of a hypoosmolar state involves true hyponatremia but with elevations in the concentration of another osmole. Clinical examples include hyperglycemia as seen in uncontrolled diabetes or rarely hypertonic infusion of mannitol used in the treatment of cerebral edema. The accumulation of these effective osmoles creates an osmotic force causing water to move from the intracellular to the extracellular space thus diluting the serum Na+. For every 100 mg/dL rise in glucose or mannitol, the serum Na+ will quickly fall by 1.6 mEq/L. This increase in tonicity also stimulates thirst and arginine vasopressin (AVP) secretion, both of which contribute to further water retention. As a result the plasma osmolality and serum Na+ concentration will continue to fall. Once the plasma osmolality normalizes the serum Na+ will have decreased by 2.8 mEq/L for every 100 mg/dL rise in glucose.
The third cause of hyponatremia in the absence of a hypoosmolar state is the addition of an isosmotic (or near isosmotic) non‐Na+ containing fluid to the extracellular space. This situation typically occurs during a transurethral resection of the prostate or during laprascopic surgery when large amounts of a nonconducting flushing solution containing glycine or sorbitol are absorbed systemically.
Is the Kidney's Ability to Dilute the Urine Intact?
The presence of hypotonic hyponatremia implies that water intake exceeds the ability of the kidney to excrete water. In unusual circumstances, this can occur when the kidneys ability to excrete free water is intact. However, because a normal kidney can excrete 18 L of water per day, the presence of hyponatremia with normal renal water excretion implies the patient is drinking >20 L water/day. This condition is referred to as primary polydipsia. These patients should have a urine osmolality 100 mOsm/L. While primary polydipsia is a common condition which leads to polyuria and polydipsia, it is uncommon as a sole cause of hyponatremia.
Hyponatremia in association with a maximally dilute urine can also result from more moderate fluid intake combined with extremely limited solute intake, a condition often referred to as beer potomania syndrome. In normal subjects, daily solute excretion is usually in the range of 800 mOsm to 1000 mOsm per day. Since the limit of urinary dilution is approximately 50 mOsm/L, then maximum urine output can be calculated to be approximately 16 L to 20 L per day (1000 mOsm/L/50 mOsm/L = 20). Individuals who drink beer or who are ingesting a fad diet have very limited protein intake so that daily solute excretion may be as low as 200 mOsm per day. In this setting, water intake >4 L/day (200 mOsm/50 mOsm/L = 4 L) will exceed renal water excretion and cause hyponatremia. Urine osmolality will be maximally dilute in such a patient.
In the absence of primary polydipsia, hyponatremia is associated with decreased renal water excretion and a urine that is inappropriately concentrated. It is important to note that in the presence of hyponatremia urine should be maximally dilute and a urine osmolality higher than this (>100 mOsm/L) is inappropriate. An inappropriately concentrated urine implies a defect in renal water excretion.
Excretion of water by the kidney is dependent on three factors. First, there must be adequate delivery of filtrate to the tip of the loop of Henle. Second, solute absorption in the ascending limb and the distal nephron must be normal so that the tubular fluid will be diluted. Lastly, AVP levels must be low in the plasma. Of these 3 requirements for water excretion, the one which is probably most important in the genesis of hyponatremia is the failure to maximally suppress AVP levels. In many conditions, decreased delivery of filtrate to the tip of the loop of Henle also contributes.
What is the Volume Status of the Patient?
In patients with hypotonic hyponatremia with an inappropriately concentrated urine, one needs to define whether effective arterial volume is decreased. Most causes of hyponatremia result from a decrease in effective arterial volume which leads to both baroreceptor‐mediated stimulation of AVP secretion and decreased distal delivery of filtrate to the tip of the loop of Henle. If effective arterial volume is low, extracellular fluid (ECF) volume can be low in the volume‐depleted patient (hypovolemic hyponatremia) or can be high in the edematous patient (hypervolemic hyponatremia). If effective arterial volume is normal, one is dealing with the euvolemic causes of hyponatremia (isovolemic hyponatremia).
The clinical determination of effective arterial volume is usually straightforward. On physical examination the best index of effective arterial volume is the presence or absence of an orthostatic change in pulse and blood pressure. Urinary electrolytes are also extremely useful in the assessment of effective arterial volume. Patients with a low effective arterial volume will tend to have a low urinary Na+ and Cl concentration and low fractional excretions of Na+ and Cl in the urine. Patients with euvolemic hyponatremia will be in balance and will excrete Na+ and Cl at rates that reflect dietary intake of Na+ and Cl. Generally urinary Na+ and Cl is >20 mEq/L and fractional excretions of these electrolytes are >1%.
Plasma composition can also be used to assess effective arterial volume. The blood urea nitrogen (BUN) is particularly sensitive to effective arterial volume. In patients with a normal serum creatinine concentration, a high BUN suggests a low effective arterial volume and a low BUN suggests a high effective arterial volume. The plasma uric acid can also be used as a sensitive index of effective arterial volume. In comparing patients with the syndrome of inappropriate secretion of antidiuretic hormone (SIADH) and other causes of hyponatremia, patients with low effective arterial volume tend to have an elevated serum uric acid. The serum urate is low in patients with SIADH. This is due to the fact that these patients are volume expanded although it is clinically difficult to detect the degree of volume expansion.
Syndrome of Inappropriate Antidiuretic Hormone Secretion (SIADH)
In patients who are determined to be clinically euvolemic, a concentrated urine and high AVP levels are inappropriate. The most common cause of this condition is SIADH. This syndrome is generally associated with diseases of the central nervous system, pulmonary diseases, and neoplasms. These conditions lead to secretion of AVP which is inappropriate both from the standpoint of plasma osmolality and effective arterial volume. A number of other etiologies cause a condition of hypoosmolality associated with euvolemia and can mimic the syndrome of inappropriate AVP secretion. These include isolated glucocorticoid deficiency (normal mineralocorticoid activity), hypothyroidism, pain, nausea, acute psychosis, and a variety of drugs.
Clinical Conditions Associated With Hyponatremia in the Hospital Setting
Post‐Operative Hyponatremia
The postoperative patient is particularly prone to developing hyponatremia. AVP levels are increased for several days following surgical procedures due to baroreceptor and nonbaroreceptor‐mediated mechanisms. These patients typically have subtle or overt decreases in effective arterial blood volume due to prolonged preoperative fasting combined with intraoperative and postoperative blood loss and third spacing of fluid. In addition to these factors which unload baroreceptors, postoperative pain, stress, anxiety, nausea, and administration of morphine can further stimulate the release of AVP. In some instances nonsteroidal antiinflmmatory drugs are given which have the effect of augmenting the hydroosmotic actions of AVP.6 In this setting of compromised ability to excrete a water load, administration of hypotonic fluid can precipitate acute iatrogenic hyponatremia.
Postoperative hyponatremia has been a major problem in pediatric populations due to the widespread practice of using hypotonic fluids for maintenance therapy. This approach is based on guidelines developed 50 years ago which were based on calculations linking energy expenditures to water and electrolyte losses.7 More recently, several groups have argued that isotonic rather than hypotonic fluids should be the routine maintenance fluid in such patients.8, 9 The pediatric community has been slow to embrace this approach out of the concern that excessive administration of Na+ would increase the risk of hypernatremia. A systematic meta‐analysis of studies comparing isotonic and hypotonic fluids in hospitalized children found the odds of developing hyponatremia following hypotonic solutions was 17.2 times greater than with isotonic fluids.10 The concern that isotonic maintenance fluids carry a risk of hypernatremia was not supported in the review. Some studies actually reported a decrease in serum Na+ concentration, presumably due to the desalination phenomenon in which hypertonic urine is excreted in volume expanded subjects with persistent vasopressin secretion.
Endocrine Disorders
Glucocorticoid Deficiency
Patients with glucocorticoid deficiency develop hyponatremia. It is important to separate this condition from that of mineralocorticoid deficiency and combined mineralocorticoid‐glucocorticoid deficiency. In patients with mineralocorticoid deficiency, ECF volume and effective arterial volume are low. This leads to baroreceptor stimulation of AVP secretion and to decreased distal delivery of filtrate to the diluting segments of the nephron. In isolated glucocorticoid deficiency, the patients are euvolemic. In these patients, for any given level of low plasma osmolality, vasopressin levels are inappropriately elevated. The administration of hydrocortisone restores the relationship between vasopressin and plasma osmolality to normal.
While it is possible to develop isolated glucocorticoid deficiency with adrenal disease, most adrenal diseases cause loss of mineralocorticoid and glucocorticoid function. Glucocorticoid deficiency in the absence of mineralocorticoid deficiency is usually due to pituitary disease. In fact, severe hyponatremia may be the initial clue to the presence of previously unrecognized hypopituitarism. Insufficient adrenal secretion of glucocorticoids may also be a complication following the long term use of exogenous glucocorticoids.
In addition to high AVP levels, AVP‐independent mechanisms lead to increases in urinary osmolality in glucocorticoid deficiency. The nature of this AVP‐independent effect is likely multifactorial. First, glucocorticoid deficiency is associated with a diminished cardiac output and an impaired systemic vascular response to hypotension. These changes will lead to a slight decline in glomerular filtration rate and increased volume absorption in the proximal tubule and thin descending limb. As a result, distal delivery of filtrate to the diluting segment will be abnormally low in glucocorticoid deficiency. Second, mineralocorticoid and glucocorticoid deficiency have both been shown to result in increased expression of aquaporin 2 water channels in the collecting duct.11 This later effect will further limit maximal urinary dilution and contribute to net water retention.
These AVP‐independent mechanisms are consistent with the clinical observation that patients with diabetes insipidus appear to improve clinically when they develop coexistent anterior pituitary insufficiency, and treatment of these patients with glucocorticoids appears to worsen the diabetes insipidus. Thus, in the patient with diabetes, insipidus‐free water excretion will be extremely large. When simultaneous glucocorticoid deficiency develops, free‐water excretion decreases.
Hypothyroidism
Myxedema coma is the most severe form of hypothyroidism and is commonly associated with hyponatremia.12 In this setting, blood pressure can be low because of decreased intravascular volume and cardiovascular collapse. The hypotension can be refractory to vasopressor therapy in the absence of thyroid hormone therapy. Cardiac output and stroke volume are low. A defect in renal water excretion develops as a result of baroreceptor mediated increases in AVP along with decreased delivery of filtrate to the distal nephron. In hypothyroid rats, there is upregulation of aquaporin 2 water channels. In these animals, administration of a V2 receptor antagonist reverses the increased water channel expression and corrects the impaired response to an acute water load.11
While reduced cardiac output and blood pressure associated with severe hypothyroidism can provide a stimulatory effect for AVP release through a baroreceptor mediated mechanism, milder forms of hypothyroidism can be considered in the differential diagnosis of euvolemic hyponatremia. In this setting, impaired renal excretion of water is presumably due to increased release of AVP due to the absence of a tonic inhibitory effect of thyroid hormone in the central nervous system. The degree of hyponatremia in this setting is typically mild.
Heart Failure
Hyponatremia is a common complication of left‐sided heart failure and several studies have shown that it is an independent predictor of mortality.13, 14 A similar association between reduced survival and hyponatremia is present in advanced right‐sided heart failure in patients with pulmonary arterial hypertension.15 Patients with heart failure who are hyponatremic have higher circulating levels of neurohormones (catecholamines, renin, angiotensin II, aldosterone, and AVP) than normonatremic subjects and are more likely to have prerenal azotemia. In addition to being a marker for the extent of neurohumoral activation, hyponatremia may play a more direct role in adverse outcomes through maladaptive volume regulatory responses of cardiac myocytes and by direct effects of AVP on cardiac and coronary V1a receptors.
Heart failure is associated with arterial underfilling leading to arterial baroreceptor‐mediated activation of the neurohumoral axis. This underfilling is due to decreased cardiac output in low‐output heart failure and decreased systemic vascular resistance in high‐output heart failure. Activation of the sympathetic nervous system along with the renin‐angiotensin‐aldosterone system leads to renal salt retention while the increase in AVP is associated with water retention and hyponatremia.
Cirrhosis
Hyponatremia is a common electrolyte abnormality in patients with cirrhosis and occurs with a frequency that tends to parallel the severity of liver disease.16 Patients with a serum Na+ 130 mEq/L are more likely to have refractory ascites and require therapeutic paracentesis. Hepatic encephalopathy, hepatorenal syndrome, and spontaneous bacterial peritonitis are also more common in patients with a serum Na+ 130 mmol/L than in patients with a normal serum Na+ concentration. Hyponatremia increases morbidity and mortality from hepatic transplantation and is associated with osmotic demyelination in the postoperative period because of the large increase in Na+ concentration associated with the procedure.17
Hepatic cirrhosis is characterized by a decreased effective arterial blood volume and activation of neurohumoral effectors. Reduced effective circulating volume due to generalized and specifically to arterial splanchnic vasodilation leads to baroreceptor‐mediated nonosmotic stimulation of AVP release and an impaired ability to excrete electrolyte‐free water.18 Reduced Na+ delivery to the distal tubule because of a low glomerular filtration rate and increased proximal Na+ reabsorption adds to the susceptibility of cirrhotic patients to hyponatremia.
Hyponatremic‐Hypertensive Syndrome
The development of hyponatremia in patients with severe hypertension associated with renal artery stenosis has been called the hyponatremic‐hypertensive syndrome.19, 20 Patients with this syndrome present with a variety of signs and symptoms that include headache, confusion, postural dizziness, polyuria, polydipsia, and salt craving. In a retrospective review of 32 patients with this syndrome, most of the subjects were thin, elderly, women smokers who had atherosclerotic renal vascular disease.19 Biochemical abnormalities included not only hyponatremia, but hypokalemia and increased plasma renin activity. The mean serum Na+ concentration was 129.7 mmol/L (range 120‐135).
The precise mechanism of this syndrome is not known. Given the available data, angiotensin‐mediated thirst coupled with nonosmotic release of AVP provoked by angiotensin II and/or hypertensive encephalopathy are likely. Na+ depletion due to pressure natriuresis, and K+ depletion due to hyperaldosteronism are also likely to play a role in the pathogenesis of hyponatremia.
Pneumonia
An association between pneumonia and hyponatremia has been known for quite some time but has been poorly defined. Of the various etiologic agents, legionella is more commonly associated with hyponatremia as compared to other types of community acquired disease. As has been true for many disorders, hyponatremia is associated with longer hospital stays and hospital mortality, most likely reflecting the severity of the pneumonia rather than morbidity from the usually mild and asymptomatic hyponatremia.
Central Nervous System Disease
Hyponatremia is a frequent complication of central nervous system disease to include bacterial meningitis and traumatic brain injury. Potential mechanisms include the development of SIADH, cerebral salt wasting (CSW), or hypotonic fluid administration in the setting of impaired renal water excretion as in patients with low effective volume. Of these various causes, hyponatremia is frequently attributed to SIADH. As previously mentioned, this syndrome is characterized by hyponatremia in the setting of an inappropriately concentrated urine, increased urine Na+ concentration, and evidence of normal or slightly increased intravascular volume.
However there are patients with intracranial disease who develop hyponatremia with similar characteristics but differ in that there is clinical evidence of a contracted ECF volume. This form of hyponatremia is due to excessive renal Na+ excretion resulting from a centrally mediated process and is termed CSW. The onset of this disorder is typically seen within the first ten days following a neurosurgical procedure or after a definable event, such as a subarachnoid hemorrhage or stroke. CSW has also been described in other intracranial disorders, such as carcinomatous or infectious meningitis and metastatic carcinoma.21 The distinction between SIADH and CSW is of considerable clinical importance given the divergent nature of the treatments. Fluid restriction is the treatment of choice in SIADH, whereas the treatment of CSW comprises vigorous Na+ and volume replacement.
Treatment of Hyponatremia
Symptoms of hyponatremia include nausea and malaise, which can be followed by headache, lethargy, muscle cramps, disorientation, restlessness and obtundation, and seizures. The principal danger of hyponatremia or hypernatremia relates to effects on central nervous system function due to changes in brain size (Figure 2).
Hyponatremia initially leads to cell swelling driven by the higher intracellular osmolality. The net result is equilibration of intracellular and extracellular osmolality at the expense of increased brain volume. Cells in general, and brain cells in particular, then respond by decreasing the number of intracellular osmoles and as intracellular osmolality decreases, cell size returns toward normal despite the presence of hyponatremia. If the decrease in ECF osmolality is slow, there will be no measurable cell swelling. This pathophysiologic sequence correlates well with clinical observations. If hyponatremia is slow in onset, neurologic symptoms and permanent brain damage are unusual, even if the decreases in Na+ concentration and ECF osmolality are large. Conversely, if hyponatremia is rapid in onset, cerebral edema and significant CNS symptoms and signs can occur with lesser changes in serum Na+ concentration.
When treating a patient with hyponatremia, the Na+ concentration should be raised at the rate at which it fell. In a patient whose serum Na+ concentration has decreased rapidly (48 hours), neurologic symptoms are frequently present and there is cerebral edema. In this setting there has not been sufficient time to remove osmoles from the brain and rapid return to normal ECF osmolality merely returns brain size to normal. In general, the development of hyponatremia in the outpatient setting is more commonly chronic in duration and should be corrected slowly. By contrast, hyponatremia of short duration is more likely to be encountered in hospitalized patients receiving intravenous free water. Use of ecstasy, exercise‐induced hyponatremia, or patients with primary polydipsia can also develop acute hyponatremia and if symptomatic may similarly require rapid correction. Raising the serum Na+ concentration by 4 mEq/L to 6 mEq/L over a several hour period is both safe and effective in preventing untoward effects of acute hyponatremia.22 A reasonable strategy to accomplish this goal is the regimen recommended for the treatment of athletes with hyponatremia and encephalopathy.23 These guidelines suggest an immediate bolus of 100 mL 3% NaCl (513 mEq/L). If there is no neurologic improvement two additional 100 mL 3% NaCl bolus infusions separated by 10 minute intervals can be given.
In patients with chronic hyponatremia (>48 hours duration) the serum Na+ concentration has fallen slowly. Neurologic symptoms are generally minimal, brain size is normal, and the number of intracellular osmoles is decreased. Sudden return of ECF osmolality to normal values will lead to cell shrinkage and possibly precipitate osmotic demyelination. Experts in the field suggest this complication can be prevented by adhering to the following limits of correction: 10 mmol/L in 24 hours, 18 mmol/L in 48 hours, and 20 mmol/L in 72 hours.22 In order to maximize patient safety, the goals of therapy should be more modest: 6 to 8 mmol/L in 24 hours, 12 to 14 mmol/L in 48 hours, and 14 to 16 mmol/L in 72 hours.
A formula designed to predict the increase in serum Na+ concentration to be expected from the infusion of 1 L of a given infusion is given below:
- .Age and gender as risk factors for hyponatremia and hypernatremia.Clin Chem Acta.2003;337:169–172.
- ,,,.Hyponatremia: a prospective analysis of its epidemiology and the pathogenetic role of vasopressin.Ann Intern Med.1985;102(2):164–168.
- ,,, et al.Characteristics and mortality of severe hyponatraemia‐a hospital‐based study.Clin Endocrinol (Oxf).2006;65(2):246–249.
- ,,.Mortality after hospitalization with mild moderate and severe hyponatremia.Am J Med.2009;122:8857–8865.
- ,,, et al.Epidemiology, clinical and economic outcomes of admission hyponatremia among hospitalized patients.Curr Med Res Opin.2008;24:1601–1608.
- .Renal complications associated with use of nonsteroidal anti‐inflammatory agents.J Investig Med.1995;43(6):516–533.
- ,.Recent developments in the perioperative fluid management for the paediatric patient.Curr Opin Anaesthesiol.2006;19:268–277.
- ,.Prevention of hospital‐acquired hyponatremia: a case for using isotonic saline.Pediatrics.2003;111:227–230.
- ,,,,.Acute hyponatremia related to intravenous fluid administration in hospitalized children: an observational study.Pediatrics.2004;113(5):1279–1284.
- ,,,.Hypotonic versus isotonic saline in hospitalized children: a systematic review.Arch Dis Child.2006;91(10):828–835.
- .Vasopressin and Aquaporin 2 in clinical disorders of water homeostasis.Semin Nephrol.2008;28:289–296.
- .Myxedema coma.Edocrinol Metab Clin N Am.2006;35:687–698.
- ,,, et al.Relationship between admission serum sodium concentration and clinical outcomes in patients hospitalized for heart failure: an analysis from the OPTIMIZE‐HF registry.Eur Heart J.2007;28(8):920–921.
- ,.Pulmonary hypertension, right ventricular failure, and kidney: different from left ventricular failure.Clin J Am Soc Nephrol.2008;3:1232–1237.
- ,,, et al.Hyponatremia predicts right heart failure and poor survival in pulmonary arterial hypertension.Am J Respir Crit Care Med.2008;177(12):1364–1369.
- ,,,;CAPPS investigators. Hyponatremia in cirrhosis: results of a patient population survey.Hepatology.2006;44(6):1535–1542.
- ,,,,,.Possible causes of central pontine myelinolysis after liver transplantation.World J Gastroenterol.2004;10(17):2540–2543.
- .Pathogenesis of ascites and renal salt retention in cirrhosis.J Invest Med.1999;47:183–202.
- ,.The hyponatremic hypertensive syndrome in renal artery stenosis: An infrequent cause of hyponatremia.J Postgrad Med.2007;53:41–43.
- ,,,.Hyponatremic‐hypertensive syndrome with renal ischemia: an underrecognized disorder.Hypertension.1993;33:1020–1024.
- .Hyponatremia in patients with central nervous system disease: SIADH or CSW.Trends Endocrinol Metab.2003;14:182–187.
- ,,.The treatment of hyponatremia.Semin Nephrol.2009;29:282–299.
- ,,, et al.Statement of the second international exercise‐associated hyponatremia consensus development conference, New Zealand.Clin J Sport Med.2008;18:111–121.
- ,,,,,.Hypertonic saline for hyponatremia: risk of inadvertent overcorrection.Clin J Am Soc Nephrol.2007;2:1110–1117.
- ,,, et al.DDAVP is effective in preventing and reversing inadvertent overcorrection of hyponatremia.Clin J Am Soc Nephrol.2008;3:331–336.
- ,,,,.Assessment of the efficacy and safety of intravenous conivaptan in euvolemic and hypervolemic hyponatremia.Am J Nephrol2007;27:447–457.
- ,,, et al.,Tolvaptan, a selective oral vasopressin V2‐receptor antagonist, for hyponatremia.N Engl J Med.2006;355:2099–2112.
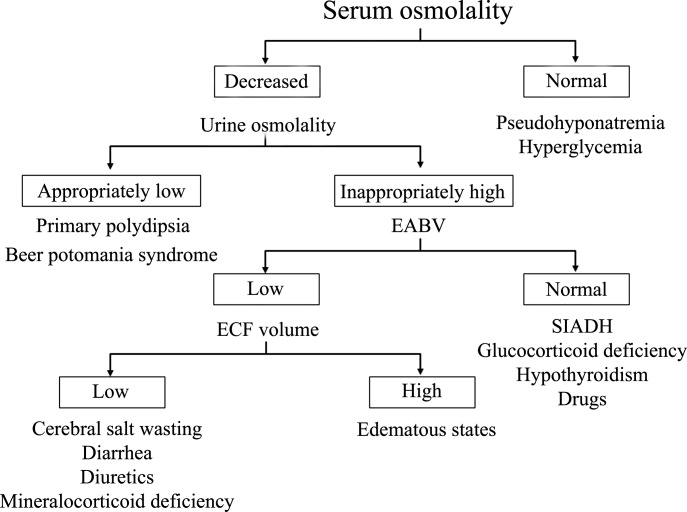
Treating Hyponatremia in Heart Failure
Heart failure is a common and growing problem in both industrialized and developing nations. In the U.S. alone there are estimated to be well over 5 million heart failure patients and that number is expected to double over the next few decades. There are several reasons for this pandemic, most notably the aging of the world's population, a rising incidence of heart failure risk factors including hypertension, diabetes and obesity, and improved survival post‐myocardial infarction (MI).1 Greater longevity of patients with existing heart failure as a result of treatment with drugs and devices that lower mortality and, in developing nations, a reduction in premature mortality from infectious diseases have also contributed to the increase in heart failure prevalence. Although there have been important advances in treating heart failure that have improved outcomes over the past several decades, morbidity and mortality remain unacceptably high and quality of life is substantially reduced. Thus, there is considerable need for finding new approaches for managing patients with this condition.
The Role of Neurohormonal Blockade in the Treatment of Heart Failure Patients
The pathophysiology of heart failure is complex. In patients who develop systolic dysfunction, the pathway initially involves injury to the heart and/or increases in wall stress which activates a variety of compensatory responses in an effort to reestablish homeostasis within the cardiovascular (CV) system. Many of these responses are mediated by neurohormonal systems that are stimulated both systemically and locally within the heart itself.2, 3 While this widespread neurohormonal activation has some short‐term benefits in maintaining cardiac performance, there is clear evidence that it has adverse effects when maintained over time. The deleterious effects of neurohormonal activation in heart failure include excess salt and water retention, constriction of arterial resistance and venous capacitance vessels, increased load on the heart, electrolyte abnormalities and maladaptive cardiac remodeling. The critical role of neurohormonal activation in the pathogenesis and progression of heart failure has been confirmed by the results of large scale clinical trials which show that neurohormonal blocking agents such as angiotensin converting enzyme inhibitors (ACEIs), angiotensin receptor blockers (ARBs), beta blockers (BBs), and aldosterone blockers greatly reduce morbidity and mortality and result in a variety of other favorable effects in heart failure patients.49 Based on their profound effects on outcomes, strategies that target neurohormonal activation have emerged over the past 2 decades as the cornerstone of medical management of heart failure.
Establishing Risk in Heart Failure
Although there have been impressive gains in reducing morbidity and mortality in heart failure patients over the past 3 decades, the overall clinical course remains unfavorable in a substantial portion of this population. A wide variety of risk factors which identify patients who are more likely to do poorly in the future have been identified. These include demographic variables (eg, age), functional and structural abnormalities, hemodynamic measurements, symptomatic status, exercise capacity, quality of life, presence of comorbidities and a myriad of blood tests and biomarkers. Amongst the plethora of risk factors for poor outcome, decompensation of heart failure which results in hospitalization has been recognized as 1 of the most important prognostic indicators. The Organized Program to Initiate Lifesaving Treatment in Hospitalized Patients With Heart Failure (OPTIMIZE‐HF) Registry which included a large fairly representative population of heart failure patients from throughout the U.S. followed a subset of patients for 60 days to 90 days immediately post‐discharge from a hospitalization that was associated with decompensated heart failure.10 Over this relatively short time period hospital readmission rate was over 30% and mortality over 9%. Thus, within 2 months to 3 months of discharge following an episode of decompensation 40% of heart failure patients had either died or were back in the hospital. Among the many risk factors that have been used to predict morbidity and mortality outcomes either during or following hospitalization, the ones that appear to be the most powerful in detecting patients who are likely to do poorly are impaired renal function,11, 12 low systolic blood pressure,13 persistence of congestion at the time of hospital discharge,14 elevation of various biomarkers such as B‐type natriuretic peptide (BNP)15 and the presence of hyponatremia.16
Hyponatremia in Heart Failure
Incidence of Hyponatremia in Heart Failure Patients
Determining the exact incidence of hyponatremia in heart failure patients has been challenging due to differences in the populations that have been studied and in the criteria used to define hyponatremia. The Acute and Chronic Therapeutic Impact of a Vasopressin Antagonist in Congestive Heart Failure (ACTIV in CHF) study reported that 21.3% of the cohort of hospitalized patients had a serum sodium below 136 mmol/L.17 Higher incidences were reported in the Prospective Trial of Intravenous Milrinone for Exacerbations of Chronic Heart Failure (OPTIME‐CHF) which found that 27% of patients had serum sodium concentrations between 132 mmol/L to 135 mmol/L.18 The Evaluation Study of CHF and Pulmonary Artery Catheter Effectiveness (ESCAPE) trial reported that 18% of patients had hyponatremia defined as serum sodium concentration below 134 mmol/L.19 Data from OPTIMIZE‐HF, a registry that captured data from a large cohort of representative patients who were hospitalized with decompensated heart failure indicate that such patients have a wide distribution of admission sodium values (Figure 1).16 Overall, 19.7% of the OPTIIMIZE‐HF patients had values below 135 mmol/L.
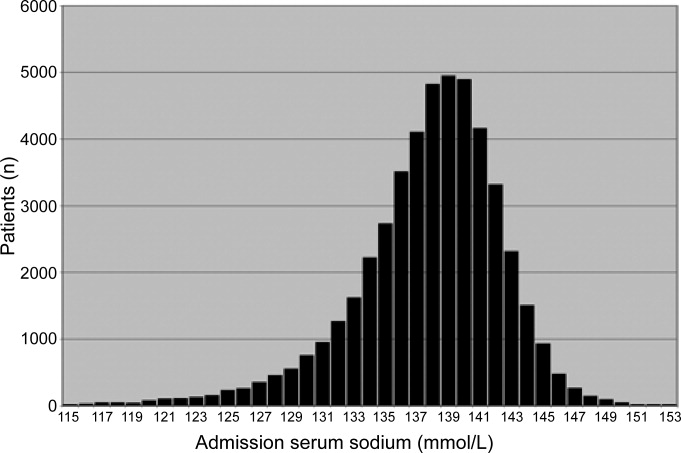
Risk Associated With Hyponatremia
There is considerable evidence that hyponatremia is associated with increased risk for poor outcomes in heart failure patients. One of the first reports that related hyponatremia to a poor prognosis came from Lee and Packer who analyzed 30 clinical, hemodynamic, and biochemical variables in outpatients with severe heart failure.20 Their results showed that serum sodium was the most powerful predictor of CV mortality. Similar findings have been reported by other investigators.21 In patients hospitalized for decompensated heart failure, the presence of hyponatremia has been shown to be an independent predictor of longer duration of stay.22 Results from the OPTIMIZE‐HF Registry confirmed the adverse impact of hyponatremia on length of stay during a heart failure hospitalization and also suggested that low serum sodium was associated with significantly higher in‐hospital and post‐discharge mortality rates.16 In this large cohort of hospitalized patients with decompensated heart failure, each 3 mmol/L decrease in serum sodium below 140 mmol/L increased the risk of in‐hospital and follow‐up mortality by 19.5% and 10%, respectively. This association is depicted in Figure 2. A similar adverse impact of hyponatremia on post‐discharge outcomes was seen in the results of the ACTIV in CHF study.17 Overall, 69 patients out of a total of 319 who were included in the study (21.6%) had a serum sodium that was 136 mmol/L. Mortality over a 60 day period of follow‐up was 14.5% in the hyponatremic patients compared to 4% in the 250 patients whose serum sodium was 136 mmol/L.
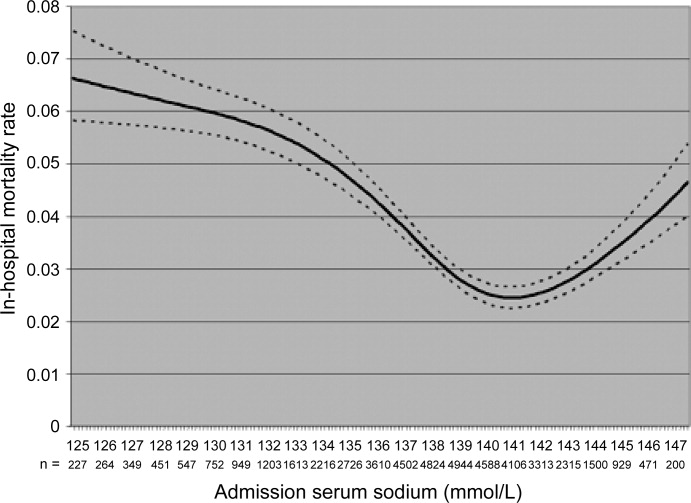
Although these data present a powerful argument that hyponatremia is a potent risk factor for poor outcomes in heart failure patients both during and following hospitalization, they do not determine whether or not the relationship is causal. It is possible that the poor outcomes that have been observed in hyponatremic patients are related to an association between low serum sodium levels and the more profound alterations in hemodynamics, neurohormonal activation and renal function that are seen in patients with advanced heart failure. Alternatively, increased edema in vital organs including the heart in hyponatremic patients could further impair already tenuous function and contribute to a downward spiral in the clinical course. The impact of hyponatremia in limiting the use of loop diuretics and spironolactone may also be associated with a less favorable long‐term outcome. The presence of hyponatremia may also contribute to a poor outcome as a result of effects on cognitive and neuromuscular function.23, 24 Impaired cognition could adversely affect compliance with the medical regimen while neuromuscular problems related to hyponatremia could contribute to an increased incidence of falls and other traumatic injuries that older patients with chronic diseases are already at high risk of experiencing.
Pathophysiology of Hyponatremia
The pathophysiology of hyponatremia in heart failure patients involves several different processes.25 Overall, heart failure is characterized by retention of excessive amounts of salt and water in the body. Sodium retention is related to decreased renal perfusion that is caused by the effects of reduced cardiac output, decreased renal perfusion pressure and increased afferent glomerular arteriolar resistance. A reduction in glomerular filtration and increased reabsorption of sodium and water in the proximal renal tubules leads to a reduction in the delivery of water and solute to the diluting segment of the nephron. In patients with heart failure the renin‐angiotensin system (RAS) is activated, an event that is further stimulated by the administration of loop diuretics.26 Angiotensin II (Ang II), a key effector molecule of the RAS, increases tone in renal efferent arterioles. This tends to enhance both sodium and water reabsorption both through an increase in the glomerular filtration fraction and by direct effects on the distal tubule.27 Ang II also stimulates the thirst center of the brain both directly and through stimulation of antidiuretic hormone to promote the ingestion of excessive amounts of hypotonic fluids.25 Water reabsorption in the distal portion of the nephron is governed by arginine vasopressin (AVP). High levels of AVP are seen in patients with heart failure26, 28 and there is a significant association between serum levels of this peptide and the symptomatic state of the patient. There is evidence that in heart failure patients AVP levels are elevated disproportionally to plasma osmolality and serum sodium concentrations.28, 29 Even when serum osmolality is increased in this setting by infusion of sodium, AVP levels fail to demonstrate an appropriate reduction suggesting that mechanisms other than activation of osmoreceptors are involved. The effects of AVP in the pathogenesis of hyponatremia are significant. This peptide binds to the vasopressin‐2 (V2) receptor in the collecting duct of the kidney stimulating an increase in the second messenger cyclic AMP.30 Downstream signaling initiated by cyclic AMP leads to an increase in the number and activation of aquaporin‐2 water channels on the luminal surface of epithelial cells in the collecting tubule.31 The presence of these activated pores is necessary for water permeability in the collecting duct and leads to an increase in the reabsorption of free water. Finally, the use of diuretics in the treatment of heart failure has been implicated in the development and worsening of the hyponatremic state.32
Treatment of Hyponatremia
Treatment options for dealing with hyponatremia in heart failure patients have been limited until recently. Since low cardiac output and/or diminished renal perfusion are involved, interventions which improve cardiac and renal function can reverse hyponatremia. While this can be accomplished by the use of inotropic agents, the use of drugs such as dobutamine, milrinone, and other inotropes in either stable or decompensated heart failure patients with adequate tissue perfusion is not routinely recommended due to a well‐documented increase in adverse effects, particularly in patients with coronary artery disease.33 The use of hypertonic saline is also not recommended since it may worsen the extent of volume overload in decompensated patients. Fluid restriction can be used to treat hyponatremia, particularly in hospitalized patients where stricter control on input is possible. Hyponatremic patients, however, often experience excessive thirst and restriction to less than 1000 cc to 1500 cc is rarely, if ever, successful for more than a brief period of time. The use of angiotensin converting enzyme (ACE) inhibitors has been associated with an improvement in serum sodium levels. Packer et al. treated a cohort of heart failure patients who were receiving a stable dose of diuretic with an ACE inhibitor captopril and found that over a 2‐week period the serum sodium increased from 131.2 0.5 to 135.9 0.5 mmol/L; P 0.001).34 These investigators concluded that the RAS was involved in the pathogenesis of hyponatremia and that ACEIs increased sodium levels in hyponatremic patients, though the mechanism through which this occurs has not been delineated.
The Use of Vaptans in Treating Hyponatremia
AVP actions are mediated by an interaction of the peptide with a series of receptors located on cells throughout the body. Vaptans are nonpeptidergic agents which block the interaction of AVP with these receptors; they are classified according to which receptor subtype they affect. As mentioned earlier, activation of the V2 receptor on renal tubular cells increases collecting duct permeability to water and leads to reabsorption of free water.35 The V1A receptor is located on vascular smooth muscle cells where it mediates an increase in vasomotor tone. V1A receptors are also found on platelets and in the myometrium where they mediate aggregation and uterine contraction, respectively. Some of the AVP antagonists (eg, conivaptan) block both the V1A and V2 receptors while others (eg, tolvaptan and lixivaptan) are selective for the V2 receptor.
Tolvaptan, a V2 selective agent, has been studied extensively in heart failure as well as in patients with hyponatremia due to a variety of causes. One of the initial studies was performed in a group of 254 heart failure patients who were randomized to receive tolvaptan in doses ranging from 30 mg to 60 mg daily or placebo.36 Tolvaptan at all doses studied was associated with significant reductions in body weight and improvement in the signs and symptoms of heart failure. All doses were also associated with an increase in serum sodium levels in this study. Patients who were hyponatremic made up 28% of the study population and these patients experienced the greatest increase in serum sodium. Of note was the fact that as early as day 1 in the study 80% of tolvaptan (as opposed to 40% of placebo) patients had normalization of their serum sodium levels. These effects occurred without significant changes in blood pressure or renal function and the major side effects that were seen were polyuria, dry mouth, and thirst. This study was followed by the ACTIV in CHF trial which included a slightly larger population of 319 patients (of whom 21.3% were hyponatremic at baseline) who were hospitalized due to decompensated heart failure.17 Mean body weight decreased significantly more in patients treated with tolvaptan compared to those who received placebo. Tolvaptan‐treated patients also experienced increases in serum sodium that were greatest in the patients who were hyponatremic at baseline. These changes persisted throughout the duration of the study. On post hoc analysis, event‐free survival tended to be longer for the combined group of patients treated with tolvaptan compared to placebo but there were no differences in the rate of rehospitalization or unscheduled visits for heart failure. As in the initial study, tolvaptan was well tolerated, with dry mouth being the main side effect. There were no significant hemodynamic or renal effects.
The efficacy of vasopressin antagonism in heart failure outcome study with tolvaptan (EVEREST) study randomized 4133 patients hospitalized for decompensated heart failure to receive either tolvaptan 30 mg daily or placebo in addition to their standard therapy. The short‐term goal of the study was to assess the effects of therapy on a composite end‐point of patient assessed global clinical features and weight loss on day 7 (or at the time of hospital discharge) after starting treatment.37 The results of EVEREST demonstrated that patients treated with tolvaptan had greater improvement in the composite primary end‐point. This effect was driven by a greater reduction in body weight with active drug. Although, changes in global clinical status did not differ between the study groups, tolvaptan‐treated patients reported significantly greater improvement in dyspnea at day 1. In 1 (but not the other of the 2 component trials of EVEREST) there was also an improvement in edema. At day 1 and at discharge, the tolvaptan group with hyponatremia (defined as a serum sodium below 134 mEq/L) demonstrated significantly greater increases in serum sodium than in the hyponatremic placebo treated patients. Tolvaptan was well tolerated and serious adverse event frequencies were similar between groups, without excess renal failure or hypotension.
Patients who were enrolled in EVEREST were then followed for an average of 9.9 months on tolvaptan or placebo in order to assess the effects of treatment on the dual primary endpoints of all‐cause mortality (both superiority and noninferiority) and CV death or heart failure hospitalization.38 The results demonstrated no significant differences in either primary or secondary morbidity and mortality outcomes between tolvaptan and placebo treated patients. In the EVEREST patients with baseline serum sodium levels less than 134 mEq/L, there was a significant increase of 5.49 mEq/L 5.77 mEq/L (mean SD) at day 7 or discharge, if earlier, with tolvaptan, compared with 1.85 mEq/L 5.10 mEq/L in the placebo group. This effect was observed as early as day 1 and was maintained throughout the 40 weeks of treatment. Side effects were minimal. Overall, tolvaptan increased thirst and dry mouth, but the frequencies of major adverse events were similar in the 2 groups.
Two parallel multicenter, randomized, double‐blind, placebo‐controlled trials, termed collectively the Study of Ascending Levels of Tolvaptan in Hyponatremia 1 and 2 (SALT‐1 and SALT‐2), examined the effect of tolvaptan on hypervolemic and euvolemic hyponatremia of diverse causes.39 The 448 patients included in the 2 studies were randomly assigned to either placebo or tolvaptan starting at a dose of 15 mg daily (increasing to 30 mg and then 60 mg if needed, depending on serum sodium concentrations) and followed over a 30 day period. The population included 138 patients (31%) with chronic heart failure as the cause of hyponatremia with the remainder of the population divided between patients with cirrhosis or syndrome of inappropriate antidiuretic hormone hypersecretion (SIADH) and other causes of hyponatremia. The 2 primary end points for all patients were the change in the average daily area under the curve for the serum sodium concentration from baseline to day 4 and the change from baseline to day 30. As shown in Figure 3, serum sodium concentrations increased significantly more in the tolvaptan group than in the placebo group during the first 4 days and after the full 30 days of therapy. A planned analysis of the SALT trials demonstrated that correction of hyponatremia with tolvaptan was associated with significant improvement in self‐reported mental status, particularly in patients with marked hyponatremia or SIADH. Improvements in mental health scores were positively correlated with changes in serum [Na+] in both the tolvaptan and placebo groups and reversed after cessation of therapy, suggeting that hyponatremia‐associated impairments in mental function can be significantly improved by raising the serum [Na+]. The major side effects with tolvaptan included increased thirst, dry mouth, and increased urination. Tolvaptan has been approved by the US Food and Drug Administration (FDA) for the treatment of euvolemic and hypervolemic hyponatremia.
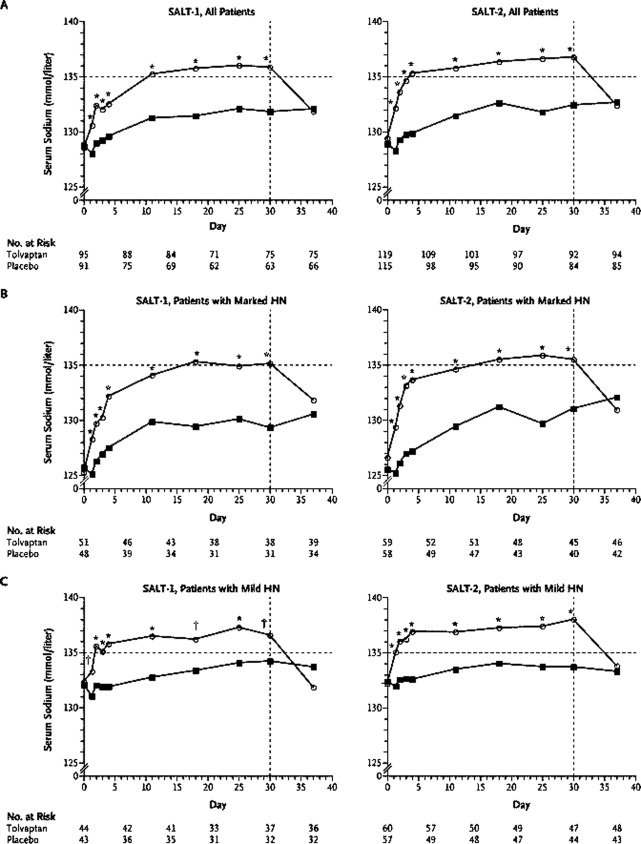
Lixivaptan is another selective V2 receptor antagonist that has been studied in heart failure patients.40 In a randomized, double‐blind, placebo‐controlled, ascending single‐dose study 42 diuretic‐requiring patients with mild‐to‐moderate heart failure patients received either placebo or doses of lixivaptan ranging from 10 mg to 400 mg. Except for patients who received the 10‐mg dose, lixivaptan produced a significant and dose‐related increase in urine volume over a 4‐hour period compared with placebo. Over 24 hours increases in urine volume were greater with lixivaptan than with placebo and these increases were accompanied by significant increases in solute‐free water excretion. At higher doses of lixivaptan, serum sodium levels increased significantly. The drug was tolerated in these patients and side effects tended to be mild. The Treatment of Hyponatremia Based on Lixivaptan in NYHA Class III/IV Cardiac Patient Evaluation (BALANCE Study) is an on‐going trial that is designed to evaluate whether lixivaptan is an effective and safe agent for increasing serum sodium in heart failure patients who are volume overloaded and have hyponatremia. The secondary end‐points of the BALANCE study include all‐cause mortality, CV effects, HF hospitalization and acute change in body weight.
The combined V1A and V2 receptor antagonist conivaptan has been approved by the FDA for the treatment of euvolemic and hypervolemic hyponatremia. The acute hemodynamic effects were studied in 142 NYHA class III and IV heart failure patients. Administration of 20 mg or 40 mg of conivaptan significantly reduced pulmonary artery wedge and right atrial pressures during the 3‐hour to 6‐hour interval after intravenous administration and significantly increased urine output in a dose‐dependent manner during the first 4 hours after the dose.41 In another study 170 patients hospitalized for worsening heart failure were randomly assigned to treatment with conivaptan (20‐mg loading dose followed by 2 successive 24‐hour continuous infusions of 40, 80, or 120 mg/day) or placebo in addition to their standard therapy.42 At 24 hours each dose of conivaptan had increased urine output significantly more than placebo with the difference averaging 1.0 to 1.5 L. The mean increase in serum sodium at 24, 48, and 72 hours was significantly higher in each of the conivaptan groups compared with the placebo group. At 48 hours, conivaptan increased serum sodium by 2.25 mmol/L to 3.27 mmol/L more than placebo. Conivaptan was well tolerated in these hospitalized heart failure patients. Infusion‐site reactions for this drug which is given intravenously were the most common adverse event and administration of the drug was not associated with clinically important changes in vital signs, electrolyte disturbances, or cardiac rhythm.
The effects of conivaptan on serum sodium levels were evaluated in 84 hospitalized patients with euvolemic or hypervolemic hyponatremia defined as a serum sodium between 115 mEq/ to 129 mEq/L.43 These patients received either intravenous placebo or conivaptan administered as a 30‐minute, 20‐mg loading dose followed by a 96‐hour infusion of either 40 mg/day or 80 mg/day. The results which are depicted in Figure 4 show that both conivaptan doses were associated with highly significant increases under the sodium‐time curve during the 4‐day treatment. From baseline to the end of treatment, serum sodium increased by 0.8 0.8 mEq/L with placebo as compared to 6.3 0.7 mEq/L and 9.4 0.8 mEq/L with the 40 mg and 80 mg doses of conivaptan. Conivaptan was generally well tolerated, although infusion‐site reactions led to the withdrawal of 1 (3%) and 4 (15%) of patients given conivaptan 40 mg/day and 80 mg/day, respectively.
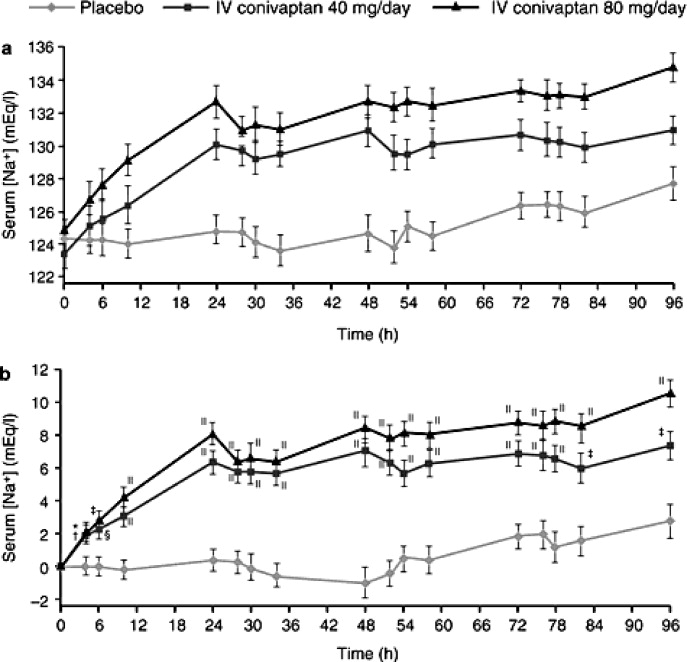
The overall safety profile of the vaptans has been good. Most of the adverse effects including thirst, dry mouth and others have been minor and these agents, in general, have only minimal effects on blood pressure and renal function. In addition, the long‐term safety and tolerability of tolvaptan was demonstrated in the EVEREST trial. One theoretical concern about the use of vaptans to treat hyponatremia is that rapid correction of hyponatremia at a rate of >12 mEq/L over 24 hours can cause osmotic demyelination of brain structures with severe neurologic consequences. It has been advised that in susceptible patients (including those with severe malnutrition, alcoholism, or advanced liver disease) that sodium levels be corrected at a lower rate. It is also recommended that the drugs be initiated in hospital and that serum sodium is monitored during treatment.
Conclusions
Hyponatremia is common in heart failure patients, particularly during periods of decompensation. The presence of hyponatremia has been associated with a substantial increase in risk for longer hospitalization stay and mortality both in the hospital and following discharge. Hyponatremia has also been associated with alterations in cognitive and neuromuscular function which could further impair heart failure patients, particularly those who are elderly. The use of AVP receptor antagonists to treat hyponatremia is based on evidence that this peptide which regulates the flow of free water in the distal portion of the nephron is inappropriately elevated in heart failure patients. Administration of AVP receptor antagonists has been shown to increase and improve free water excretion and increase serum sodium levels in both euvolemic and volume overloaded hyponatremic patients. In addition to their favorable effects on serum sodium levels, the AVP receptor blockers have been shown to improve hemodynamics acutely and to increase weight loss in heart failure patients. There is some evidence that they also improve symptoms in hospitalized patients and that correction of hyponatremia is associated with improved cognitive and neuromuscular function. Currently available evidence, however, does not support a beneficial effect on long‐term outcomes such as mortality or CV hospitalizations. Additional on‐going clinical trials will provide further insights into this critical question. The overall side effect profile of the vaptans is favorable and published studies document the long‐term safety of administration of tolvaptan in heart failure patients. Thus, these agents represent an important new approach for treating hyponatremia in heart failure patients. They deserve consideration for use when hyponatremia is present during an episode of decompensated heart failure.
- ,,, et al.Prevention of heart failure: a scientific statement from the American Heart Association Councils on Epidemiology and Prevention, Clinical Cardiology, Cardiovascular Nursing, and High Blood Pressure Research; Quality of Care and Outcomes Research Interdisciplinary Working Group; and Functional Genomics and Translational Biology Interdisciplinary Working Group.Circulation.2008;117:2544–2565.
- ,,, et al.Activation of neurohumoral systems following acute myocardial infarction.Am J Cardiol.1991;68:80D–86D.
- ,.The cardiac renin‐angiotensin system: conceptual, or a regulator of cardiac function?Circ Res.1999;85:643–650.
- Effect of enalapril on survival in patients with reduced left ventricular ejection fractions and congestive heart failure. The SOLVD Investigators.N Engl J Med.1991;325:293–302.
- ,,, et al.Effects of candesartan in patients with chronic heart failure and reduced left‐ventricular systolic function intolerant to angiotensin‐converting‐enzyme inhibitors: the CHARM‐Alternative trial.Lancet.2003;362:772–776.
- ,,, et al.Effect of captopril on mortality and morbidity in patients with left ventricular dysfunction after myocardial infarction. Results of the survival and ventricular enlargement trial. The SAVE Investigators [see comments].N Engl J Med.1992;327:669–677.
- ,,, et al.The effect of carvedilol on morbidity and mortality in patients with chronic heart failure. U.S. Carvedilol Heart Failure Study Group.N Engl J Med.1996;334:1349–1355.
- ,,, et al.The effect of spironolactone on morbidity and mortality in patients with severe heart failure. Randomized Aldactone Evaluation Study Investigators.N Engl J Med.1999;341:709–717.
- ,,, et al.Eplerenone, a selective aldosterone blocker, in patients with left ventricular dysfunction after myocardial infarction.N Engl J Med.2003;348:1309–1321.
- ,,, et al.Factors identified as precipitating hospital admissions for heart failure and clinical outcomes: findings from OPTIMIZE‐HF.Arch Intern Med.2008;168:847–854.
- ,,,,.Risk stratification for in‐hospital mortality in acutely decompensated heart failure: classification and regression tree analysis.JAMA.2005;293:572–580.
- ,,, et al.Incidence, predictors at admission, and impact of worsening renal function among patients hospitalized with heart failure.J Am Coll Cardiol.2004;43:61–67.
- ,,, et al.Systolic blood pressure at admission, clinical characteristics, and outcomes in patients hospitalized with acute heart failure.JAMA.2006;296:2217–2226.
- ,,, et al.Freedom from congestion predicts good survival despite previous class IV symptoms of heart failure.Am Heart J.2000;140:840–847.
- ,,, et al.State of the art: using natriuretic peptide levels in clinical practice.Eur J Heart Fail.2008;10:824–839.
- ,,, et al.Relationship between admission serum sodium concentration and clinical outcomes in patients hospitalized for heart failure: an analysis from the OPTIMIZE‐HF registry.Eur Heart J.2007;28:980–988.
- ,,, et al.Effects of tolvaptan, a vasopressin antagonist, in patients hospitalized with worsening heart failure: a randomized controlled trial.JAMA.2004;291:1963–1971.
- ,,, et al.Lower serum sodium is associated with increased short‐term mortality in hospitalized patients with worsening heart failure: results from the Outcomes of a Prospective Trial of Intravenous Milrinone for Exacerbations of Chronic Heart Failure (OPTIME‐CHF) study.Circulation.2005;111:2454–2460.
- ,,, et al.Characterization and prognostic value of persistent hyponatremia in patients with severe heart failure in the ESCAPE Trial.Arch Intern Med.2007;167:1998–2005.
- ,.Prognostic importance of serum sodium concentration and its modification by converting‐enzyme inhibition in patients with severe chronic heart failure.Circulation.1986;73:257–267.
- ,,, et al.Predicting death due to progressive heart failure in patients with mild‐to‐moderate chronic heart failure.J Am Coll Cardiol.2002;40:1801–1808.
- ,,,.Variations in and correlates of length of stay in academic hospitals among patients with heart failure resulting from systolic dysfunction.Am J Manag Care.1999;5:715–723.
- ,,.The use of laboratory tests in patients with mild cognitive impairment.J Alzheimers Dis.2006;10:53–58.
- ,,,,.Mild chronic hyponatremia is associated with falls, unsteadiness, and attention deficits.Am J Med.2006;119:71–78.
- .Hyponatremia and heart failure‐‐pathophysiology and implications.Congest Heart Fail.2005;11:274–277.
- ,, et al.Comparison of neuroendocrine activation in patients with left ventricular dysfunction with and without congestive heart failure. A substudy of the Studies of Left Ventricular Dysfunction (SOLVD).Circulation.1990;82:1724–1729.
- ,,.Angiotensin II directly stimulates sodium transport in rabbit proximal convoluted tubules.J Clin Invest.1984;73:507–515.
- ,,.Arginine vasopressin and the renal response to water loading in congestive heart failure.Am J Cardiol.1986;58:295–299.
- ,,.Osmotic and nonosmotic control of vasopressin release.Am J Physiol.1979;236:F321–F332.
- .Vasopressin V2 receptor antagonists.J Mol Endocrinol.2002;29:1–9.
- ,,,,,.Physiology and pathophysiology of renal aquaporins.J Am Soc Nephrol.1999;10:647–663.
- ,,.Diuretic‐induced severe hyponatremia. Review and analysis of 129 reported patients.Chest.1993;103:601–606.
- ,,, et al.Heart failure etiology and response to milrinone in decompensated heart failure: results from the OPTIME‐CHF study.J Am Coll Cardiol.2003;41:997–1003.
- ,,.Correction of dilutional hyponatremia in severe chronic heart failure by converting‐enzyme inhibition.Ann Intern Med.1984;100:782–789.
- .Vasopressin receptors.Trends Endocrinol Metab.2000;11:406–410.
- ,,, et al.Vasopressin V2‐receptor blockade with tolvaptan in patients with chronic heart failure: results from a double‐blind, randomized trial.Circulation.2003;107:2690–2696.
- ,,, et al.Short‐term clinical effects of tolvaptan, an oral vasopressin antagonist, in patients hospitalized for heart failure: the EVEREST Clinical Status Trials.JAMA.2007;297:1332–1343.
- ,,, et al.Effects of oral tolvaptan in patients hospitalized for worsening heart failure: the EVEREST Outcome Trial.JAMA.2007;297:1319–1331.
- ,,, et al.Tolvaptan, a selective oral vasopressin V2‐receptor antagonist, for hyponatremia.N Engl J Med.2006;355:2099–2112.
- ,,,,.Aquaretic effect of lixivaptan, an oral, non‐peptide, selective V2 receptor vasopressin antagonist, in New York Heart Association functional class II and III chronic heart failure patients.J Am Coll Cardiol.2006;47:1615–1621.
- ,,, et al.Acute hemodynamic effects of conivaptan, a dual V(1A) and V(2) vasopressin receptor antagonist, in patients with advanced heart failure.Circulation.2001;104:2417–2423.
- ,,,,.Efficacy and safety of the vasopressin V1A/V2‐receptor antagonist conivaptan in acute decompensated heart failure: a dose‐ranging pilot study.J Card Fail.2008;14:641–647.
- ,,,,.Assessment of the efficacy and safety of intravenous conivaptan in euvolemic and hypervolemic hyponatremia.Am J Nephrol.2007;27:447–457.
Heart failure is a common and growing problem in both industrialized and developing nations. In the U.S. alone there are estimated to be well over 5 million heart failure patients and that number is expected to double over the next few decades. There are several reasons for this pandemic, most notably the aging of the world's population, a rising incidence of heart failure risk factors including hypertension, diabetes and obesity, and improved survival post‐myocardial infarction (MI).1 Greater longevity of patients with existing heart failure as a result of treatment with drugs and devices that lower mortality and, in developing nations, a reduction in premature mortality from infectious diseases have also contributed to the increase in heart failure prevalence. Although there have been important advances in treating heart failure that have improved outcomes over the past several decades, morbidity and mortality remain unacceptably high and quality of life is substantially reduced. Thus, there is considerable need for finding new approaches for managing patients with this condition.
The Role of Neurohormonal Blockade in the Treatment of Heart Failure Patients
The pathophysiology of heart failure is complex. In patients who develop systolic dysfunction, the pathway initially involves injury to the heart and/or increases in wall stress which activates a variety of compensatory responses in an effort to reestablish homeostasis within the cardiovascular (CV) system. Many of these responses are mediated by neurohormonal systems that are stimulated both systemically and locally within the heart itself.2, 3 While this widespread neurohormonal activation has some short‐term benefits in maintaining cardiac performance, there is clear evidence that it has adverse effects when maintained over time. The deleterious effects of neurohormonal activation in heart failure include excess salt and water retention, constriction of arterial resistance and venous capacitance vessels, increased load on the heart, electrolyte abnormalities and maladaptive cardiac remodeling. The critical role of neurohormonal activation in the pathogenesis and progression of heart failure has been confirmed by the results of large scale clinical trials which show that neurohormonal blocking agents such as angiotensin converting enzyme inhibitors (ACEIs), angiotensin receptor blockers (ARBs), beta blockers (BBs), and aldosterone blockers greatly reduce morbidity and mortality and result in a variety of other favorable effects in heart failure patients.49 Based on their profound effects on outcomes, strategies that target neurohormonal activation have emerged over the past 2 decades as the cornerstone of medical management of heart failure.
Establishing Risk in Heart Failure
Although there have been impressive gains in reducing morbidity and mortality in heart failure patients over the past 3 decades, the overall clinical course remains unfavorable in a substantial portion of this population. A wide variety of risk factors which identify patients who are more likely to do poorly in the future have been identified. These include demographic variables (eg, age), functional and structural abnormalities, hemodynamic measurements, symptomatic status, exercise capacity, quality of life, presence of comorbidities and a myriad of blood tests and biomarkers. Amongst the plethora of risk factors for poor outcome, decompensation of heart failure which results in hospitalization has been recognized as 1 of the most important prognostic indicators. The Organized Program to Initiate Lifesaving Treatment in Hospitalized Patients With Heart Failure (OPTIMIZE‐HF) Registry which included a large fairly representative population of heart failure patients from throughout the U.S. followed a subset of patients for 60 days to 90 days immediately post‐discharge from a hospitalization that was associated with decompensated heart failure.10 Over this relatively short time period hospital readmission rate was over 30% and mortality over 9%. Thus, within 2 months to 3 months of discharge following an episode of decompensation 40% of heart failure patients had either died or were back in the hospital. Among the many risk factors that have been used to predict morbidity and mortality outcomes either during or following hospitalization, the ones that appear to be the most powerful in detecting patients who are likely to do poorly are impaired renal function,11, 12 low systolic blood pressure,13 persistence of congestion at the time of hospital discharge,14 elevation of various biomarkers such as B‐type natriuretic peptide (BNP)15 and the presence of hyponatremia.16
Hyponatremia in Heart Failure
Incidence of Hyponatremia in Heart Failure Patients
Determining the exact incidence of hyponatremia in heart failure patients has been challenging due to differences in the populations that have been studied and in the criteria used to define hyponatremia. The Acute and Chronic Therapeutic Impact of a Vasopressin Antagonist in Congestive Heart Failure (ACTIV in CHF) study reported that 21.3% of the cohort of hospitalized patients had a serum sodium below 136 mmol/L.17 Higher incidences were reported in the Prospective Trial of Intravenous Milrinone for Exacerbations of Chronic Heart Failure (OPTIME‐CHF) which found that 27% of patients had serum sodium concentrations between 132 mmol/L to 135 mmol/L.18 The Evaluation Study of CHF and Pulmonary Artery Catheter Effectiveness (ESCAPE) trial reported that 18% of patients had hyponatremia defined as serum sodium concentration below 134 mmol/L.19 Data from OPTIMIZE‐HF, a registry that captured data from a large cohort of representative patients who were hospitalized with decompensated heart failure indicate that such patients have a wide distribution of admission sodium values (Figure 1).16 Overall, 19.7% of the OPTIIMIZE‐HF patients had values below 135 mmol/L.
Risk Associated With Hyponatremia
There is considerable evidence that hyponatremia is associated with increased risk for poor outcomes in heart failure patients. One of the first reports that related hyponatremia to a poor prognosis came from Lee and Packer who analyzed 30 clinical, hemodynamic, and biochemical variables in outpatients with severe heart failure.20 Their results showed that serum sodium was the most powerful predictor of CV mortality. Similar findings have been reported by other investigators.21 In patients hospitalized for decompensated heart failure, the presence of hyponatremia has been shown to be an independent predictor of longer duration of stay.22 Results from the OPTIMIZE‐HF Registry confirmed the adverse impact of hyponatremia on length of stay during a heart failure hospitalization and also suggested that low serum sodium was associated with significantly higher in‐hospital and post‐discharge mortality rates.16 In this large cohort of hospitalized patients with decompensated heart failure, each 3 mmol/L decrease in serum sodium below 140 mmol/L increased the risk of in‐hospital and follow‐up mortality by 19.5% and 10%, respectively. This association is depicted in Figure 2. A similar adverse impact of hyponatremia on post‐discharge outcomes was seen in the results of the ACTIV in CHF study.17 Overall, 69 patients out of a total of 319 who were included in the study (21.6%) had a serum sodium that was 136 mmol/L. Mortality over a 60 day period of follow‐up was 14.5% in the hyponatremic patients compared to 4% in the 250 patients whose serum sodium was 136 mmol/L.
Although these data present a powerful argument that hyponatremia is a potent risk factor for poor outcomes in heart failure patients both during and following hospitalization, they do not determine whether or not the relationship is causal. It is possible that the poor outcomes that have been observed in hyponatremic patients are related to an association between low serum sodium levels and the more profound alterations in hemodynamics, neurohormonal activation and renal function that are seen in patients with advanced heart failure. Alternatively, increased edema in vital organs including the heart in hyponatremic patients could further impair already tenuous function and contribute to a downward spiral in the clinical course. The impact of hyponatremia in limiting the use of loop diuretics and spironolactone may also be associated with a less favorable long‐term outcome. The presence of hyponatremia may also contribute to a poor outcome as a result of effects on cognitive and neuromuscular function.23, 24 Impaired cognition could adversely affect compliance with the medical regimen while neuromuscular problems related to hyponatremia could contribute to an increased incidence of falls and other traumatic injuries that older patients with chronic diseases are already at high risk of experiencing.
Pathophysiology of Hyponatremia
The pathophysiology of hyponatremia in heart failure patients involves several different processes.25 Overall, heart failure is characterized by retention of excessive amounts of salt and water in the body. Sodium retention is related to decreased renal perfusion that is caused by the effects of reduced cardiac output, decreased renal perfusion pressure and increased afferent glomerular arteriolar resistance. A reduction in glomerular filtration and increased reabsorption of sodium and water in the proximal renal tubules leads to a reduction in the delivery of water and solute to the diluting segment of the nephron. In patients with heart failure the renin‐angiotensin system (RAS) is activated, an event that is further stimulated by the administration of loop diuretics.26 Angiotensin II (Ang II), a key effector molecule of the RAS, increases tone in renal efferent arterioles. This tends to enhance both sodium and water reabsorption both through an increase in the glomerular filtration fraction and by direct effects on the distal tubule.27 Ang II also stimulates the thirst center of the brain both directly and through stimulation of antidiuretic hormone to promote the ingestion of excessive amounts of hypotonic fluids.25 Water reabsorption in the distal portion of the nephron is governed by arginine vasopressin (AVP). High levels of AVP are seen in patients with heart failure26, 28 and there is a significant association between serum levels of this peptide and the symptomatic state of the patient. There is evidence that in heart failure patients AVP levels are elevated disproportionally to plasma osmolality and serum sodium concentrations.28, 29 Even when serum osmolality is increased in this setting by infusion of sodium, AVP levels fail to demonstrate an appropriate reduction suggesting that mechanisms other than activation of osmoreceptors are involved. The effects of AVP in the pathogenesis of hyponatremia are significant. This peptide binds to the vasopressin‐2 (V2) receptor in the collecting duct of the kidney stimulating an increase in the second messenger cyclic AMP.30 Downstream signaling initiated by cyclic AMP leads to an increase in the number and activation of aquaporin‐2 water channels on the luminal surface of epithelial cells in the collecting tubule.31 The presence of these activated pores is necessary for water permeability in the collecting duct and leads to an increase in the reabsorption of free water. Finally, the use of diuretics in the treatment of heart failure has been implicated in the development and worsening of the hyponatremic state.32
Treatment of Hyponatremia
Treatment options for dealing with hyponatremia in heart failure patients have been limited until recently. Since low cardiac output and/or diminished renal perfusion are involved, interventions which improve cardiac and renal function can reverse hyponatremia. While this can be accomplished by the use of inotropic agents, the use of drugs such as dobutamine, milrinone, and other inotropes in either stable or decompensated heart failure patients with adequate tissue perfusion is not routinely recommended due to a well‐documented increase in adverse effects, particularly in patients with coronary artery disease.33 The use of hypertonic saline is also not recommended since it may worsen the extent of volume overload in decompensated patients. Fluid restriction can be used to treat hyponatremia, particularly in hospitalized patients where stricter control on input is possible. Hyponatremic patients, however, often experience excessive thirst and restriction to less than 1000 cc to 1500 cc is rarely, if ever, successful for more than a brief period of time. The use of angiotensin converting enzyme (ACE) inhibitors has been associated with an improvement in serum sodium levels. Packer et al. treated a cohort of heart failure patients who were receiving a stable dose of diuretic with an ACE inhibitor captopril and found that over a 2‐week period the serum sodium increased from 131.2 0.5 to 135.9 0.5 mmol/L; P 0.001).34 These investigators concluded that the RAS was involved in the pathogenesis of hyponatremia and that ACEIs increased sodium levels in hyponatremic patients, though the mechanism through which this occurs has not been delineated.
The Use of Vaptans in Treating Hyponatremia
AVP actions are mediated by an interaction of the peptide with a series of receptors located on cells throughout the body. Vaptans are nonpeptidergic agents which block the interaction of AVP with these receptors; they are classified according to which receptor subtype they affect. As mentioned earlier, activation of the V2 receptor on renal tubular cells increases collecting duct permeability to water and leads to reabsorption of free water.35 The V1A receptor is located on vascular smooth muscle cells where it mediates an increase in vasomotor tone. V1A receptors are also found on platelets and in the myometrium where they mediate aggregation and uterine contraction, respectively. Some of the AVP antagonists (eg, conivaptan) block both the V1A and V2 receptors while others (eg, tolvaptan and lixivaptan) are selective for the V2 receptor.
Tolvaptan, a V2 selective agent, has been studied extensively in heart failure as well as in patients with hyponatremia due to a variety of causes. One of the initial studies was performed in a group of 254 heart failure patients who were randomized to receive tolvaptan in doses ranging from 30 mg to 60 mg daily or placebo.36 Tolvaptan at all doses studied was associated with significant reductions in body weight and improvement in the signs and symptoms of heart failure. All doses were also associated with an increase in serum sodium levels in this study. Patients who were hyponatremic made up 28% of the study population and these patients experienced the greatest increase in serum sodium. Of note was the fact that as early as day 1 in the study 80% of tolvaptan (as opposed to 40% of placebo) patients had normalization of their serum sodium levels. These effects occurred without significant changes in blood pressure or renal function and the major side effects that were seen were polyuria, dry mouth, and thirst. This study was followed by the ACTIV in CHF trial which included a slightly larger population of 319 patients (of whom 21.3% were hyponatremic at baseline) who were hospitalized due to decompensated heart failure.17 Mean body weight decreased significantly more in patients treated with tolvaptan compared to those who received placebo. Tolvaptan‐treated patients also experienced increases in serum sodium that were greatest in the patients who were hyponatremic at baseline. These changes persisted throughout the duration of the study. On post hoc analysis, event‐free survival tended to be longer for the combined group of patients treated with tolvaptan compared to placebo but there were no differences in the rate of rehospitalization or unscheduled visits for heart failure. As in the initial study, tolvaptan was well tolerated, with dry mouth being the main side effect. There were no significant hemodynamic or renal effects.
The efficacy of vasopressin antagonism in heart failure outcome study with tolvaptan (EVEREST) study randomized 4133 patients hospitalized for decompensated heart failure to receive either tolvaptan 30 mg daily or placebo in addition to their standard therapy. The short‐term goal of the study was to assess the effects of therapy on a composite end‐point of patient assessed global clinical features and weight loss on day 7 (or at the time of hospital discharge) after starting treatment.37 The results of EVEREST demonstrated that patients treated with tolvaptan had greater improvement in the composite primary end‐point. This effect was driven by a greater reduction in body weight with active drug. Although, changes in global clinical status did not differ between the study groups, tolvaptan‐treated patients reported significantly greater improvement in dyspnea at day 1. In 1 (but not the other of the 2 component trials of EVEREST) there was also an improvement in edema. At day 1 and at discharge, the tolvaptan group with hyponatremia (defined as a serum sodium below 134 mEq/L) demonstrated significantly greater increases in serum sodium than in the hyponatremic placebo treated patients. Tolvaptan was well tolerated and serious adverse event frequencies were similar between groups, without excess renal failure or hypotension.
Patients who were enrolled in EVEREST were then followed for an average of 9.9 months on tolvaptan or placebo in order to assess the effects of treatment on the dual primary endpoints of all‐cause mortality (both superiority and noninferiority) and CV death or heart failure hospitalization.38 The results demonstrated no significant differences in either primary or secondary morbidity and mortality outcomes between tolvaptan and placebo treated patients. In the EVEREST patients with baseline serum sodium levels less than 134 mEq/L, there was a significant increase of 5.49 mEq/L 5.77 mEq/L (mean SD) at day 7 or discharge, if earlier, with tolvaptan, compared with 1.85 mEq/L 5.10 mEq/L in the placebo group. This effect was observed as early as day 1 and was maintained throughout the 40 weeks of treatment. Side effects were minimal. Overall, tolvaptan increased thirst and dry mouth, but the frequencies of major adverse events were similar in the 2 groups.
Two parallel multicenter, randomized, double‐blind, placebo‐controlled trials, termed collectively the Study of Ascending Levels of Tolvaptan in Hyponatremia 1 and 2 (SALT‐1 and SALT‐2), examined the effect of tolvaptan on hypervolemic and euvolemic hyponatremia of diverse causes.39 The 448 patients included in the 2 studies were randomly assigned to either placebo or tolvaptan starting at a dose of 15 mg daily (increasing to 30 mg and then 60 mg if needed, depending on serum sodium concentrations) and followed over a 30 day period. The population included 138 patients (31%) with chronic heart failure as the cause of hyponatremia with the remainder of the population divided between patients with cirrhosis or syndrome of inappropriate antidiuretic hormone hypersecretion (SIADH) and other causes of hyponatremia. The 2 primary end points for all patients were the change in the average daily area under the curve for the serum sodium concentration from baseline to day 4 and the change from baseline to day 30. As shown in Figure 3, serum sodium concentrations increased significantly more in the tolvaptan group than in the placebo group during the first 4 days and after the full 30 days of therapy. A planned analysis of the SALT trials demonstrated that correction of hyponatremia with tolvaptan was associated with significant improvement in self‐reported mental status, particularly in patients with marked hyponatremia or SIADH. Improvements in mental health scores were positively correlated with changes in serum [Na+] in both the tolvaptan and placebo groups and reversed after cessation of therapy, suggeting that hyponatremia‐associated impairments in mental function can be significantly improved by raising the serum [Na+]. The major side effects with tolvaptan included increased thirst, dry mouth, and increased urination. Tolvaptan has been approved by the US Food and Drug Administration (FDA) for the treatment of euvolemic and hypervolemic hyponatremia.
Lixivaptan is another selective V2 receptor antagonist that has been studied in heart failure patients.40 In a randomized, double‐blind, placebo‐controlled, ascending single‐dose study 42 diuretic‐requiring patients with mild‐to‐moderate heart failure patients received either placebo or doses of lixivaptan ranging from 10 mg to 400 mg. Except for patients who received the 10‐mg dose, lixivaptan produced a significant and dose‐related increase in urine volume over a 4‐hour period compared with placebo. Over 24 hours increases in urine volume were greater with lixivaptan than with placebo and these increases were accompanied by significant increases in solute‐free water excretion. At higher doses of lixivaptan, serum sodium levels increased significantly. The drug was tolerated in these patients and side effects tended to be mild. The Treatment of Hyponatremia Based on Lixivaptan in NYHA Class III/IV Cardiac Patient Evaluation (BALANCE Study) is an on‐going trial that is designed to evaluate whether lixivaptan is an effective and safe agent for increasing serum sodium in heart failure patients who are volume overloaded and have hyponatremia. The secondary end‐points of the BALANCE study include all‐cause mortality, CV effects, HF hospitalization and acute change in body weight.
The combined V1A and V2 receptor antagonist conivaptan has been approved by the FDA for the treatment of euvolemic and hypervolemic hyponatremia. The acute hemodynamic effects were studied in 142 NYHA class III and IV heart failure patients. Administration of 20 mg or 40 mg of conivaptan significantly reduced pulmonary artery wedge and right atrial pressures during the 3‐hour to 6‐hour interval after intravenous administration and significantly increased urine output in a dose‐dependent manner during the first 4 hours after the dose.41 In another study 170 patients hospitalized for worsening heart failure were randomly assigned to treatment with conivaptan (20‐mg loading dose followed by 2 successive 24‐hour continuous infusions of 40, 80, or 120 mg/day) or placebo in addition to their standard therapy.42 At 24 hours each dose of conivaptan had increased urine output significantly more than placebo with the difference averaging 1.0 to 1.5 L. The mean increase in serum sodium at 24, 48, and 72 hours was significantly higher in each of the conivaptan groups compared with the placebo group. At 48 hours, conivaptan increased serum sodium by 2.25 mmol/L to 3.27 mmol/L more than placebo. Conivaptan was well tolerated in these hospitalized heart failure patients. Infusion‐site reactions for this drug which is given intravenously were the most common adverse event and administration of the drug was not associated with clinically important changes in vital signs, electrolyte disturbances, or cardiac rhythm.
The effects of conivaptan on serum sodium levels were evaluated in 84 hospitalized patients with euvolemic or hypervolemic hyponatremia defined as a serum sodium between 115 mEq/ to 129 mEq/L.43 These patients received either intravenous placebo or conivaptan administered as a 30‐minute, 20‐mg loading dose followed by a 96‐hour infusion of either 40 mg/day or 80 mg/day. The results which are depicted in Figure 4 show that both conivaptan doses were associated with highly significant increases under the sodium‐time curve during the 4‐day treatment. From baseline to the end of treatment, serum sodium increased by 0.8 0.8 mEq/L with placebo as compared to 6.3 0.7 mEq/L and 9.4 0.8 mEq/L with the 40 mg and 80 mg doses of conivaptan. Conivaptan was generally well tolerated, although infusion‐site reactions led to the withdrawal of 1 (3%) and 4 (15%) of patients given conivaptan 40 mg/day and 80 mg/day, respectively.
The overall safety profile of the vaptans has been good. Most of the adverse effects including thirst, dry mouth and others have been minor and these agents, in general, have only minimal effects on blood pressure and renal function. In addition, the long‐term safety and tolerability of tolvaptan was demonstrated in the EVEREST trial. One theoretical concern about the use of vaptans to treat hyponatremia is that rapid correction of hyponatremia at a rate of >12 mEq/L over 24 hours can cause osmotic demyelination of brain structures with severe neurologic consequences. It has been advised that in susceptible patients (including those with severe malnutrition, alcoholism, or advanced liver disease) that sodium levels be corrected at a lower rate. It is also recommended that the drugs be initiated in hospital and that serum sodium is monitored during treatment.
Conclusions
Hyponatremia is common in heart failure patients, particularly during periods of decompensation. The presence of hyponatremia has been associated with a substantial increase in risk for longer hospitalization stay and mortality both in the hospital and following discharge. Hyponatremia has also been associated with alterations in cognitive and neuromuscular function which could further impair heart failure patients, particularly those who are elderly. The use of AVP receptor antagonists to treat hyponatremia is based on evidence that this peptide which regulates the flow of free water in the distal portion of the nephron is inappropriately elevated in heart failure patients. Administration of AVP receptor antagonists has been shown to increase and improve free water excretion and increase serum sodium levels in both euvolemic and volume overloaded hyponatremic patients. In addition to their favorable effects on serum sodium levels, the AVP receptor blockers have been shown to improve hemodynamics acutely and to increase weight loss in heart failure patients. There is some evidence that they also improve symptoms in hospitalized patients and that correction of hyponatremia is associated with improved cognitive and neuromuscular function. Currently available evidence, however, does not support a beneficial effect on long‐term outcomes such as mortality or CV hospitalizations. Additional on‐going clinical trials will provide further insights into this critical question. The overall side effect profile of the vaptans is favorable and published studies document the long‐term safety of administration of tolvaptan in heart failure patients. Thus, these agents represent an important new approach for treating hyponatremia in heart failure patients. They deserve consideration for use when hyponatremia is present during an episode of decompensated heart failure.
- ,,, et al.Prevention of heart failure: a scientific statement from the American Heart Association Councils on Epidemiology and Prevention, Clinical Cardiology, Cardiovascular Nursing, and High Blood Pressure Research; Quality of Care and Outcomes Research Interdisciplinary Working Group; and Functional Genomics and Translational Biology Interdisciplinary Working Group.Circulation.2008;117:2544–2565.
- ,,, et al.Activation of neurohumoral systems following acute myocardial infarction.Am J Cardiol.1991;68:80D–86D.
- ,.The cardiac renin‐angiotensin system: conceptual, or a regulator of cardiac function?Circ Res.1999;85:643–650.
- Effect of enalapril on survival in patients with reduced left ventricular ejection fractions and congestive heart failure. The SOLVD Investigators.N Engl J Med.1991;325:293–302.
- ,,, et al.Effects of candesartan in patients with chronic heart failure and reduced left‐ventricular systolic function intolerant to angiotensin‐converting‐enzyme inhibitors: the CHARM‐Alternative trial.Lancet.2003;362:772–776.
- ,,, et al.Effect of captopril on mortality and morbidity in patients with left ventricular dysfunction after myocardial infarction. Results of the survival and ventricular enlargement trial. The SAVE Investigators [see comments].N Engl J Med.1992;327:669–677.
- ,,, et al.The effect of carvedilol on morbidity and mortality in patients with chronic heart failure. U.S. Carvedilol Heart Failure Study Group.N Engl J Med.1996;334:1349–1355.
- ,,, et al.The effect of spironolactone on morbidity and mortality in patients with severe heart failure. Randomized Aldactone Evaluation Study Investigators.N Engl J Med.1999;341:709–717.
- ,,, et al.Eplerenone, a selective aldosterone blocker, in patients with left ventricular dysfunction after myocardial infarction.N Engl J Med.2003;348:1309–1321.
- ,,, et al.Factors identified as precipitating hospital admissions for heart failure and clinical outcomes: findings from OPTIMIZE‐HF.Arch Intern Med.2008;168:847–854.
- ,,,,.Risk stratification for in‐hospital mortality in acutely decompensated heart failure: classification and regression tree analysis.JAMA.2005;293:572–580.
- ,,, et al.Incidence, predictors at admission, and impact of worsening renal function among patients hospitalized with heart failure.J Am Coll Cardiol.2004;43:61–67.
- ,,, et al.Systolic blood pressure at admission, clinical characteristics, and outcomes in patients hospitalized with acute heart failure.JAMA.2006;296:2217–2226.
- ,,, et al.Freedom from congestion predicts good survival despite previous class IV symptoms of heart failure.Am Heart J.2000;140:840–847.
- ,,, et al.State of the art: using natriuretic peptide levels in clinical practice.Eur J Heart Fail.2008;10:824–839.
- ,,, et al.Relationship between admission serum sodium concentration and clinical outcomes in patients hospitalized for heart failure: an analysis from the OPTIMIZE‐HF registry.Eur Heart J.2007;28:980–988.
- ,,, et al.Effects of tolvaptan, a vasopressin antagonist, in patients hospitalized with worsening heart failure: a randomized controlled trial.JAMA.2004;291:1963–1971.
- ,,, et al.Lower serum sodium is associated with increased short‐term mortality in hospitalized patients with worsening heart failure: results from the Outcomes of a Prospective Trial of Intravenous Milrinone for Exacerbations of Chronic Heart Failure (OPTIME‐CHF) study.Circulation.2005;111:2454–2460.
- ,,, et al.Characterization and prognostic value of persistent hyponatremia in patients with severe heart failure in the ESCAPE Trial.Arch Intern Med.2007;167:1998–2005.
- ,.Prognostic importance of serum sodium concentration and its modification by converting‐enzyme inhibition in patients with severe chronic heart failure.Circulation.1986;73:257–267.
- ,,, et al.Predicting death due to progressive heart failure in patients with mild‐to‐moderate chronic heart failure.J Am Coll Cardiol.2002;40:1801–1808.
- ,,,.Variations in and correlates of length of stay in academic hospitals among patients with heart failure resulting from systolic dysfunction.Am J Manag Care.1999;5:715–723.
- ,,.The use of laboratory tests in patients with mild cognitive impairment.J Alzheimers Dis.2006;10:53–58.
- ,,,,.Mild chronic hyponatremia is associated with falls, unsteadiness, and attention deficits.Am J Med.2006;119:71–78.
- .Hyponatremia and heart failure‐‐pathophysiology and implications.Congest Heart Fail.2005;11:274–277.
- ,, et al.Comparison of neuroendocrine activation in patients with left ventricular dysfunction with and without congestive heart failure. A substudy of the Studies of Left Ventricular Dysfunction (SOLVD).Circulation.1990;82:1724–1729.
- ,,.Angiotensin II directly stimulates sodium transport in rabbit proximal convoluted tubules.J Clin Invest.1984;73:507–515.
- ,,.Arginine vasopressin and the renal response to water loading in congestive heart failure.Am J Cardiol.1986;58:295–299.
- ,,.Osmotic and nonosmotic control of vasopressin release.Am J Physiol.1979;236:F321–F332.
- .Vasopressin V2 receptor antagonists.J Mol Endocrinol.2002;29:1–9.
- ,,,,,.Physiology and pathophysiology of renal aquaporins.J Am Soc Nephrol.1999;10:647–663.
- ,,.Diuretic‐induced severe hyponatremia. Review and analysis of 129 reported patients.Chest.1993;103:601–606.
- ,,, et al.Heart failure etiology and response to milrinone in decompensated heart failure: results from the OPTIME‐CHF study.J Am Coll Cardiol.2003;41:997–1003.
- ,,.Correction of dilutional hyponatremia in severe chronic heart failure by converting‐enzyme inhibition.Ann Intern Med.1984;100:782–789.
- .Vasopressin receptors.Trends Endocrinol Metab.2000;11:406–410.
- ,,, et al.Vasopressin V2‐receptor blockade with tolvaptan in patients with chronic heart failure: results from a double‐blind, randomized trial.Circulation.2003;107:2690–2696.
- ,,, et al.Short‐term clinical effects of tolvaptan, an oral vasopressin antagonist, in patients hospitalized for heart failure: the EVEREST Clinical Status Trials.JAMA.2007;297:1332–1343.
- ,,, et al.Effects of oral tolvaptan in patients hospitalized for worsening heart failure: the EVEREST Outcome Trial.JAMA.2007;297:1319–1331.
- ,,, et al.Tolvaptan, a selective oral vasopressin V2‐receptor antagonist, for hyponatremia.N Engl J Med.2006;355:2099–2112.
- ,,,,.Aquaretic effect of lixivaptan, an oral, non‐peptide, selective V2 receptor vasopressin antagonist, in New York Heart Association functional class II and III chronic heart failure patients.J Am Coll Cardiol.2006;47:1615–1621.
- ,,, et al.Acute hemodynamic effects of conivaptan, a dual V(1A) and V(2) vasopressin receptor antagonist, in patients with advanced heart failure.Circulation.2001;104:2417–2423.
- ,,,,.Efficacy and safety of the vasopressin V1A/V2‐receptor antagonist conivaptan in acute decompensated heart failure: a dose‐ranging pilot study.J Card Fail.2008;14:641–647.
- ,,,,.Assessment of the efficacy and safety of intravenous conivaptan in euvolemic and hypervolemic hyponatremia.Am J Nephrol.2007;27:447–457.

Smartphones for Clinical Communication
The scope and importance of communication between clinicians in the delivery of health care is increasingly being recognized.1, 2 Poor communication is known to be a source of inefficiency and errors within healthcare.36 The major issues with communication include the frequent use of interruptive communication mechanisms and the difficulty of knowing who to contact.2 Traditional paging remains the primary method to contact a physician despite being disruptive, inefficient, and predisposing to errors.710 The identification of the responsible physician for a patient can also be complicated with the numerous call schedules, different coverage rules, vacations, and protected academic time for residents. In 1 observational study, 25% of calls in a hospital were attempts to identify a responsible individual for a specific role.11 A recent study revealed that 14% of pages went to the wrong physician and that 47% of these errant pages warranted an urgent response.12 In our institution, the process for a nurse to identify which physician to contact regarding a patient care issue can be complex (Figure 1).

The use of email and mobile phone technology has been recommended as a method to improve communication.2 It can improve communication between clinicians by providing a method of triaging based on importance: instantly by telephone for urgent issues and less disruptively by email for nonurgent issues. There is limited literature on the use of email for improving communication between clinicians or on the use of smartphones. In a previous pilot study, we found that with minimal training, residents were able to use smartphones on general medical wards for clinical communication and that technical challenges were minimal.13 In an intensive care setting, the use of wireless emails using smartphones was perceived by staff to improve communication.14
Methods
Aim
To evaluate the use of smartphones to improve the communication processes on an academic general internal medicine service.
Setting
We conducted the study within the General Internal Medicine service at the Toronto General Hospital, an academic teaching hospital. The service is comprised of 4 teaching teams, each with 1 staff physician, 1 senior resident, 2 to 3 junior residents, and medical students. The environment is typically characterized by a high volume of medically complex patients and constant turnover of physicians with varying degrees of experience. Ethical review of the study was performed by the University Health Network Research Ethics Board.
Program Description
Recognizing the difficulty in implementing complex interventions within clinical care, we used a staged approach applying the standard Plan‐Do‐Study‐Act (PDSA) methodology for quality improvement.15 This involved developing a component of the system, releasing it to the users to learn from their experience, then taking this feedback to make changes and continuing with the next cycle. This allowed early identification and quicker resolution of issues.
Smartphones as Clinical Communication Tools
The first change implemented was to supplement the standard numeric pager with smartphones as the primary communication device for the residents. The BlackBerry device (Research in Motion, Ontario, Canada) was selected because it is an efficient, usable device with voice and secure email functionality that also happens to be the standard smartphone for our hospital administrators. Beginning in March 2008, all residents on the internal medicine service were equipped with a smartphone that they kept for their entire rotation. Contact lists of all devices were prepopulated with the hospital phone numbers that were important in coordinating patient care. These included numbers such as hospital flow coordinators, radiology reporting rooms, interventional radiology, and microbiology.
To facilitate reaching the most responsible resident for patients, we provided an additional smartphone, the Team BlackBerry, that was carried by the senior resident of each team during regular hours and then passed to the resident that was covering the team at night and on weekends. With the new process, a nurse would only require knowledge of which team the patient belonged to in order to contact the most responsible resident (Figure 2). The Team BlackBerry also received critical laboratory and medication alerts that contained clinical decision support. The laboratory and medication alerts were generated through the hospital rule‐based clinical decision support system (Misys Insight).
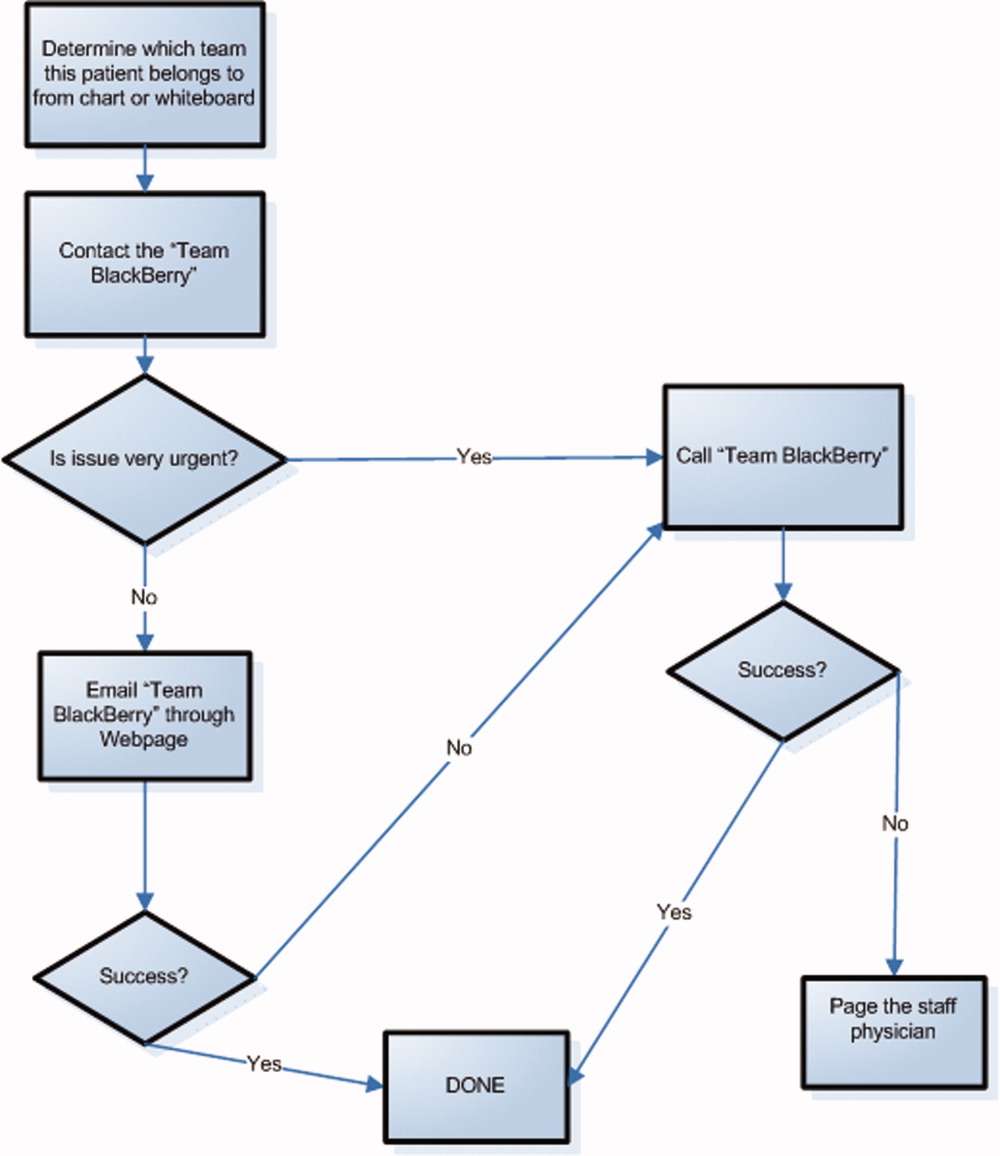
Web‐paging to Improve Nurse‐Physician Communication
In May 2008, we implemented a platform for text paging that we called web‐paging that allowed the nurses to efficiently send email messages securely through a hospital intranet page to the Team BlackBerry. A nurse would access the form from any computer on the wards, select the appropriate team, provide relevant information, and then send the message. Although the form would send an email, the term web‐paging was used to create familiarity with their previous process of contacting a resident, namely paging. This process reserved voice communication for urgent matters only while routing less urgent issues through the web‐paging form. Furthermore, emails were categorized into three priority levels:
-
Call back requested messages were for issues that were not life threatening but needed immediate action or required discussion with a physician.
-
E‐mail response requested messages were for issues that needed an action but could wait until the physician was available, such as cosigning an order.
-
Information only with no response necessary messages facilitated 1‐way communication, such as updating the team of recent vital signs for a patient.
Physicians would receive prompt notification of a new email on their smartphone, and they could reply to the email or call back using a link within the email. Nurses were able to view the physician's email responses from an email account that was shared amongst the nurses on each ward.
Program Evaluation
The outcome measures of the study were residents' use of smartphones and perceptions of residents and nurses on the new communication process. Resident use of the smartphones was measured by the volume and the frequency of phone calls and emails over a 3‐month period from September 2008 to November 2008. Residents' perceptions were measured by a survey administered prior to the start of their clinical rotation and at the end of their rotation (Table 1). Data collection for residents occurred between June 2008 and February 2009. Nurses' perceptions were measured by surveys administered to the nurses working on either day shifts or night shifts over a 1‐week period prior to the intervention in March 2008 and then 6 months after in September 2008 (Table 2).
| Pre‐Survey (n = 59) Median, (mode, mean) | Post‐Survey (n = 65) Median, (mode, mean) | P value | |
|---|---|---|---|
| Training level | |||
| Postgraduate Year 1 | 39 (66.1%) | 43 (66.2%) | |
| Postgraduate Year 2 | 17 (28.8%) | 19 (29.2%) | |
| Postgraduate Year 3 | 3 (5.1%) | 3 (4.6%) | |
| Currently own and use a personal digital assistant | 30 (55.6%) | 38 (62.3%) | |
| Currently own a BlackBerry | 6 (10.5%) | 5 (8.3%) | |
| The following questions used a Likert scale with 1 representing strongly disagree and 5 representing strongly agree | |||
| Q1. I never have issues accessing a phone to discuss patient care issues | 3 (2, 2.8) | 4 (5, 3.9) | 0.001 |
| Q2. I often waste a lot of time waiting for my pages to be answered | 4 (4, 4.1) | 4 (4, 3.3) | 0.004 |
| Q3. Communicating with my team often takes a lot of time | 4 (4, 3.5) | 2 (1, 2.5) | 0.001 |
| Q4. I have quick and easy access to contact information (eg, allied health, departments, consultants, etc) necessary for providing patient care | 3 (2, 2.6) | 4 (4, 3.7) | 0.001 |
| Q5. My primary communication device (pager/ BlackBerry) is non‐disruptive to my workflow | 3 (3, 2.7) | 4 (4, 3.4) | 0.002 |
| Q6. My primary communication device (pager/ BlackBerry) helps me prioritize my tasks | 3 (3, 2.9) | 4 (4, 3.7) | 0.001 |
| Q7. Email and/or text messaging is something I find useful for communication about patient care | 4 (3, 3.6) | 5 (5, 4.4) | 0.001 |
| Q8. Overall, I am satisfied with my primary communication device (pager/BlackBerry) | 3 (3, 2.9) | 4 (5, 4.2) | 0.001 |
| Q9. Overall, being phoned on the BlackBerry (instead of receiving a page) is disruptive to me | 3 (2, 3.0) | ||
| Q10. I consider Internet access on the BlackBerry useful for looking up information related to patient care. | 3 (3, 3.0) | ||
| Q11. I prefer not having a BlackBerry at all than having to deal with technical difficulties when I use it | 2 (1, 1.9) | ||
| Q12. I feel that overall a BlackBerry saves me time | 4 (5, 4.3) | ||
| Pre‐Survey (n = 27) Median, Mode | Post‐Survey (n = 35) Median, Mode | P Value | |
|---|---|---|---|
| Day shifts | 18 (66.7%) | 20 (57.1%) | |
| Total number of times you tried to page, email or telephone a resident or medical student in the shift just completed. | 3.70 | 2.51 | 0.16 |
| Did you need to repeatedly try to contact (page, email, or call) a resident at any time during the shift regarding the same issue? | 80% | 34.3% | 0.0012 |
| Total amount of time that you spent in the last shift trying to contact doctors or other health care providers (minutes). | 27.6 | 11.1 | 0.001 |
| The following questions used a Likert scale with 1 representing Strongly Disagree and 5 representing Strongly Agree: | |||
| Overall, it is straightforward to contact the resident taking care of my patients. | 4 (4) | 4 (4) | 0.27 |
| Overall, I am satisfied with physicians' response time when I need to contact them urgently. | 3 (4) | 4 (4) | 0.54 |
| I spend a lot of time away from the bedside just trying to contact physicians. | 3 (4) | 3 (3) | 0.17 |
| I like being able to call and reach the doctor directly. | 4 (5) | ||
| Overall I am satisfied with the BlackBerry/email communication system. | 4 (4) |
Data Analysis
We present utilization as the mean number of messages sent and received daily. We report survey responses as the mean scores on a 5‐point Likert scale. For ordinal data, we described the survey responses using median and mode, and the Mann Whitney U test was used to test for differences between before and after responses. For parametric data, unpaired t‐tests were used to look for differences in the perceptions before and after the intervention. All P values are 2‐sided.
Results
Smartphone Usage
Usage of emails and calls for the team devices over the three months is shown in Table 3. Most communications were through the Team BlackBerry devices with the individual devices showing less usage than the team device with 2.1 sent emails per day and 4.0 received emails per day. On the days with highest use, there were 7 calls received per hour and 6 emails received per hour at peak times through the day to a Team BlackBerry. Web‐paging was the largest source of emails sent to Team BlackBerrys (42%). Critical laboratory or medication alerts represented 17.1% and the remainder (40.9%) were other communications such as communication from residents, staff physicians, pharmacists, and allied health professionals. Of the web‐paging communications, 35.1% requested a call back, 22.6% requested email response, and 42.2% were informational items only that did not require a response.
| Phone Calls | Emails | |||
|---|---|---|---|---|
| Incoming | Outgoing | Received | Sent | |
| Average | 9.1 | 6.6 | 14.3 | 2.8 |
| Minimum | 0 | 0 | 0 | 0 |
| Maximum | 35 | 45 | 57 | 13 |
| Median | 8 | 4 | 13.5 | 2 |
Resident Perceptions
Of the 91 residents, 59 residents completed the presurveys (response rate 65%) and 65 completed the postsurveys (response rate 71%) (Table 1). There was a statistically significant improvement in all of the items measured. There were also 26 postsurvey comments with 22 describing positive aspects and 9 describing negative aspects. Specific positive attributes of the new communication system that were mentioned were: easier to communicate with other physicians within the team (n = 6), easier to communicate with other health care members of the team (nurses, allied health) (n = 3), and increased mobility (n = 2). The following are some examples:
-
Blackberrys are great for contacting team member, able to mobile in hospital instead of waiting by phone ‐ since we're so busy
-
Excellent for interpersonal communication. It definitely sped up patients care ie, consults, getting investigations done and discharges. Everyone should have one.
-
Text messaging, especially in group format so that all members participate in conversations is the primary communication tool of choice. Emailing is a necessity of the modern workforce.
The 2 predominant issues described were that the direct calling by nurses was disruptive (n = 6) and voice mail was not useful (n = 3):
-
I dislike the voicemail as it is like paging back but you also need to make a phone call to your phone list. Also we are always being interrupted which is disruptive to work but prefer BlackBerrys.
-
Helpful but often disruptive such as getting calls when seeing patients.
Nursing Perceptions
From the typical staff of 94 full‐time and part‐time nurses, 27 of 48 (56%) completed the preintervention survey, and 35 of 54 (65%) completed the postintervention survey. There was a perceived significant decrease in the need to repeatedly try to contact a physician for the same issue (80% vs. 34.3%, P = 0.001) and a significant decrease in the perceived amount of time spent trying to contact clinicians (27.6 minutes vs. 11.1 minutes, P 0.001) (Table 2). On 5 point Likert scales, there was no perceived improvement in communication areas such as finding out who to reach and resident response time. Nurses appreciated the ability to call the physicians directly for urgent issues (median response 4, mode of 5).
Discussion
Principal Results
In this pilot study of using smartphones and email, residents perceived that it significantly improved their efficiency. Nurses perceived a reduction in the time spent trying to communicate with clinicians.
There were significant lessons learned. First, we found that residents readily utilized smartphones and felt that it improved their efficiency. Staff physicians and residents have outlined multiple concerns over increased workload, increasing patient complexity, and longer work hours. Therefore, interventions that improve physician productivity are essential in maintaining and improving patient care.16 From residents' comments, it appears their improved efficiency is derived not only from improved communication within the medical team, but also within the interprofessional team. Efficiency was also perceived to improve from the greater mobility of being able to walk while returning a page or while waiting for a page to be returned.
Second, we found that changing the communication process was complicated. While the number of calls and emails per day appeared manageable, the peak times had very high volumes and may actually be unmanageable. By facilitating the process of reaching the responsible physician, we may have lowered the threshold for contacting the physician and thus actually increased communication volumes. It is unclear whether the end result is beneficial as improved management of patients is balanced by the increased interruptions. Further study is required to understand the effect of increasing communication on patient outcomes.
Finally, residents indicated quite strongly that they did not want telephone calls to be the primary mode of contact as they found the frequent telephone calls too disruptive. A direct call to a physician created significant disruption to workflow requiring interrupting a task to answer the call or deferring the call to later review of a voice mail message. Accessing voice mail would typically take at least a minute, much more time than the few seconds it takes to review a numeric page or a text page. Residents quickly provided feedback that this process was unacceptable and reduced their ability to deliver care effectively. Furthermore, nurses were frustrated by the added time required to leave voice messages and the poor response rate. As information within voice mails was not acted upon, nurses quickly learned to just keep calling.
Costs of implementation were significantly more than the numeric paging system. With a cost of $5/month for a numeric pager, the cost of numeric pagers for 4 medical teams with 4 physicians each was $80/month (all costs in Canadian dollars). From our implementation, the approximate cost of an individual smartphone was $80/month while team‐based devices were $160/month due to much higher usage. With 4 individual smartphones and one team‐based smartphone per team, costs with the new system were approximately $1,600/month. While implementing smartphones creates a significantly greater expense, it may be worthwhile if improved communication leads to more efficient and higher quality care. Our current system is funded through the hospital to allow for further evaluation, and whether other hospitals provide smartphones for clinical communications likely would depend on whether they provided a cost effective alternative to numeric pagers. This would likely require some more tangible benefit than perceived improved efficiency.
Comparison With Prior Work
Similar to the study of wireless email using smartphones in the Intensive Care Unit, physicians in our study perceived an improvement in efficiency.14 Our study adds further information to the literature since we implemented on general medical wards in an academic teaching hospital. Our study is consistent with the previous studies have documented physicians' perceptions of improved performance with mobile phones.7, 17
Limitations
There are limitations to this study. In order to improve communication, we implemented a complex intervention with several components: (1) smartphones for residents, (2) Web‐paging for nurses, and (3) a new process of identifying the most responsible physician using Team BlackBerrys. From our surveys, it is difficult to know the relative impact of each individual component. Other interventions such as team‐based alphanumeric pagers may achieve similar improvements to nurses' perceptions of improved communication.
As this was a pilot study assessing new communication methods, we informally assessed perceptions using surveys which had not been validated. While the use of formally validated surveys would be more useful, we were unable to find any that specifically addressed the innovation in communication seen with smartphones. Validity issues with the instruments and the low response rates may have contributed to the incongruent result seen with nurses' surveys in that there was a perceived improvement in time to contact physicians but not in the ease of contact of physicians or the satisfaction of the communication method. This incongruent result may also reflect that in spite of the fact that the nurses were accustomed to the new system and that things may have improved, communication issues still remain and likely would benefit from further study.
It would have also been useful to determine the effect of this intervention on numeric pages sent to traditional pagers, which was not captured. It is also important to realize that we did not replace the pagers but instead supplemented residents with smartphones. To replace pagers may involve significant costs to upgrade reception within hospital walls to reduce areas of little or no reception. Finally, this study was completed at 1 academic health science center, and the generalizability of the findings may be limited.
Future Study
There is great opportunity to improve communication between clinicians, and the use of smartphones, email and improved identification of the most responsible physician are some methods to achieving this. Further research would be useful to determine the relative importance of each component. With smartphones, it is would be useful to know whether the benefits seen were primarily due to the mobile email or having another phone available or other features. Finally, the use of web‐paging and email to communicate increases the documentation of communications, but a further improvement could be providing acknowledgement to nurses that web‐pages were received and read. This would close the loop on communications, ensuring that there are no lost communications and that escalation occurs promptly for urgent communications.
In summary, we implemented and evaluated a system to route and prioritize clinical communications combining the use of phone calls and secure email messaging to smartphones. Residents strongly perceived an improvement in communication with smartphones. Further objective clinical evaluation is necessary to determine if this intervention improves efficiency and more importantly, the quality of care.
Acknowledgements
The investigators retained all control over study design, data collection, analysis and interpretation, and preparation of reports.
- ,,.How hospitalists spend their time: insights on efficiency and safety.J Hosp Med.2006;1(2):88–93.
- .When conversation is better than computation.J Am Med Inform Assoc.2000;7(3):277–286.
- ,,, et al.Incidence of adverse events and negligence in hospitalized patients. Results of the Harvard Medical Practice Study I.N Engl J Med.1991;324(6):370–376.
- ,,, et al.Gaps in pediatric clinician communication and opportunities for improvement.J Healthc Qual.2008;30(5):43–54.
- ,,,,,.The quality in Australian Health Care Study.Med J Aust.1995;163(9):458–471.
- ,,,,.Quality in Australian Health Care Study.Med J Aust.1996;164(12):754.
- ,,,,.Communication in critical care environments: mobile telephones improve patient care.Anesth Analg.2006;102(2):535–541.
- ,.Interrupted care. The effects of paging on pediatric resident activities.Am J Dis Child.1992;146(7):806–808.
- ,,.Patterns of paging medical interns during night calls at two teaching hospitals.CMAJ.1994;151(3):307–311.
- ,.The sounds of the hospital. Paging patterns in three teaching hospitals.N Engl J Med.1988;319(24):1585–1589.
- ,.Communication behaviours in a hospital setting: an observational study.BMJ1998;316(7132):673–676.
- ,,, et al.Why isn't anyone returning my page? Frequency and clinical importance of pages sent to the wrong physician.Arch Intern Med.2009;169(11):1072–1073.
- ,,, et al.Demonstrating the BlackBerry as a clinical communication tool: a pilot study conducted through the centre for innovation in complex care.Healthc Q2008;11(4):94–98.
- ,,,.The use of wireless email to improve healthcare team communication.J Am Med Inform Assoc.2009;16(5):705–713.
- .A primer on leading the improvement of systems.BMJ.1996;312(7031):619–622.
- .An elusive balance—residents' work hours and the continuity of care.N Engl J Med.2007;356(26):2665–2667.
- ,,, et al.Use of mobile phones by medical staff at Queen Elizabeth Hospital, Barbados: evidence for both benefit and harm.J Hosp Infect.2008;70(2):160–165.
The scope and importance of communication between clinicians in the delivery of health care is increasingly being recognized.1, 2 Poor communication is known to be a source of inefficiency and errors within healthcare.36 The major issues with communication include the frequent use of interruptive communication mechanisms and the difficulty of knowing who to contact.2 Traditional paging remains the primary method to contact a physician despite being disruptive, inefficient, and predisposing to errors.710 The identification of the responsible physician for a patient can also be complicated with the numerous call schedules, different coverage rules, vacations, and protected academic time for residents. In 1 observational study, 25% of calls in a hospital were attempts to identify a responsible individual for a specific role.11 A recent study revealed that 14% of pages went to the wrong physician and that 47% of these errant pages warranted an urgent response.12 In our institution, the process for a nurse to identify which physician to contact regarding a patient care issue can be complex (Figure 1).
The use of email and mobile phone technology has been recommended as a method to improve communication.2 It can improve communication between clinicians by providing a method of triaging based on importance: instantly by telephone for urgent issues and less disruptively by email for nonurgent issues. There is limited literature on the use of email for improving communication between clinicians or on the use of smartphones. In a previous pilot study, we found that with minimal training, residents were able to use smartphones on general medical wards for clinical communication and that technical challenges were minimal.13 In an intensive care setting, the use of wireless emails using smartphones was perceived by staff to improve communication.14
Methods
Aim
To evaluate the use of smartphones to improve the communication processes on an academic general internal medicine service.
Setting
We conducted the study within the General Internal Medicine service at the Toronto General Hospital, an academic teaching hospital. The service is comprised of 4 teaching teams, each with 1 staff physician, 1 senior resident, 2 to 3 junior residents, and medical students. The environment is typically characterized by a high volume of medically complex patients and constant turnover of physicians with varying degrees of experience. Ethical review of the study was performed by the University Health Network Research Ethics Board.
Program Description
Recognizing the difficulty in implementing complex interventions within clinical care, we used a staged approach applying the standard Plan‐Do‐Study‐Act (PDSA) methodology for quality improvement.15 This involved developing a component of the system, releasing it to the users to learn from their experience, then taking this feedback to make changes and continuing with the next cycle. This allowed early identification and quicker resolution of issues.
Smartphones as Clinical Communication Tools
The first change implemented was to supplement the standard numeric pager with smartphones as the primary communication device for the residents. The BlackBerry device (Research in Motion, Ontario, Canada) was selected because it is an efficient, usable device with voice and secure email functionality that also happens to be the standard smartphone for our hospital administrators. Beginning in March 2008, all residents on the internal medicine service were equipped with a smartphone that they kept for their entire rotation. Contact lists of all devices were prepopulated with the hospital phone numbers that were important in coordinating patient care. These included numbers such as hospital flow coordinators, radiology reporting rooms, interventional radiology, and microbiology.
To facilitate reaching the most responsible resident for patients, we provided an additional smartphone, the Team BlackBerry, that was carried by the senior resident of each team during regular hours and then passed to the resident that was covering the team at night and on weekends. With the new process, a nurse would only require knowledge of which team the patient belonged to in order to contact the most responsible resident (Figure 2). The Team BlackBerry also received critical laboratory and medication alerts that contained clinical decision support. The laboratory and medication alerts were generated through the hospital rule‐based clinical decision support system (Misys Insight).
Web‐paging to Improve Nurse‐Physician Communication
In May 2008, we implemented a platform for text paging that we called web‐paging that allowed the nurses to efficiently send email messages securely through a hospital intranet page to the Team BlackBerry. A nurse would access the form from any computer on the wards, select the appropriate team, provide relevant information, and then send the message. Although the form would send an email, the term web‐paging was used to create familiarity with their previous process of contacting a resident, namely paging. This process reserved voice communication for urgent matters only while routing less urgent issues through the web‐paging form. Furthermore, emails were categorized into three priority levels:
-
Call back requested messages were for issues that were not life threatening but needed immediate action or required discussion with a physician.
-
E‐mail response requested messages were for issues that needed an action but could wait until the physician was available, such as cosigning an order.
-
Information only with no response necessary messages facilitated 1‐way communication, such as updating the team of recent vital signs for a patient.
Physicians would receive prompt notification of a new email on their smartphone, and they could reply to the email or call back using a link within the email. Nurses were able to view the physician's email responses from an email account that was shared amongst the nurses on each ward.
Program Evaluation
The outcome measures of the study were residents' use of smartphones and perceptions of residents and nurses on the new communication process. Resident use of the smartphones was measured by the volume and the frequency of phone calls and emails over a 3‐month period from September 2008 to November 2008. Residents' perceptions were measured by a survey administered prior to the start of their clinical rotation and at the end of their rotation (Table 1). Data collection for residents occurred between June 2008 and February 2009. Nurses' perceptions were measured by surveys administered to the nurses working on either day shifts or night shifts over a 1‐week period prior to the intervention in March 2008 and then 6 months after in September 2008 (Table 2).
| Pre‐Survey (n = 59) Median, (mode, mean) | Post‐Survey (n = 65) Median, (mode, mean) | P value | |
|---|---|---|---|
| Training level | |||
| Postgraduate Year 1 | 39 (66.1%) | 43 (66.2%) | |
| Postgraduate Year 2 | 17 (28.8%) | 19 (29.2%) | |
| Postgraduate Year 3 | 3 (5.1%) | 3 (4.6%) | |
| Currently own and use a personal digital assistant | 30 (55.6%) | 38 (62.3%) | |
| Currently own a BlackBerry | 6 (10.5%) | 5 (8.3%) | |
| The following questions used a Likert scale with 1 representing strongly disagree and 5 representing strongly agree | |||
| Q1. I never have issues accessing a phone to discuss patient care issues | 3 (2, 2.8) | 4 (5, 3.9) | 0.001 |
| Q2. I often waste a lot of time waiting for my pages to be answered | 4 (4, 4.1) | 4 (4, 3.3) | 0.004 |
| Q3. Communicating with my team often takes a lot of time | 4 (4, 3.5) | 2 (1, 2.5) | 0.001 |
| Q4. I have quick and easy access to contact information (eg, allied health, departments, consultants, etc) necessary for providing patient care | 3 (2, 2.6) | 4 (4, 3.7) | 0.001 |
| Q5. My primary communication device (pager/ BlackBerry) is non‐disruptive to my workflow | 3 (3, 2.7) | 4 (4, 3.4) | 0.002 |
| Q6. My primary communication device (pager/ BlackBerry) helps me prioritize my tasks | 3 (3, 2.9) | 4 (4, 3.7) | 0.001 |
| Q7. Email and/or text messaging is something I find useful for communication about patient care | 4 (3, 3.6) | 5 (5, 4.4) | 0.001 |
| Q8. Overall, I am satisfied with my primary communication device (pager/BlackBerry) | 3 (3, 2.9) | 4 (5, 4.2) | 0.001 |
| Q9. Overall, being phoned on the BlackBerry (instead of receiving a page) is disruptive to me | 3 (2, 3.0) | ||
| Q10. I consider Internet access on the BlackBerry useful for looking up information related to patient care. | 3 (3, 3.0) | ||
| Q11. I prefer not having a BlackBerry at all than having to deal with technical difficulties when I use it | 2 (1, 1.9) | ||
| Q12. I feel that overall a BlackBerry saves me time | 4 (5, 4.3) | ||
| Pre‐Survey (n = 27) Median, Mode | Post‐Survey (n = 35) Median, Mode | P Value | |
|---|---|---|---|
| Day shifts | 18 (66.7%) | 20 (57.1%) | |
| Total number of times you tried to page, email or telephone a resident or medical student in the shift just completed. | 3.70 | 2.51 | 0.16 |
| Did you need to repeatedly try to contact (page, email, or call) a resident at any time during the shift regarding the same issue? | 80% | 34.3% | 0.0012 |
| Total amount of time that you spent in the last shift trying to contact doctors or other health care providers (minutes). | 27.6 | 11.1 | 0.001 |
| The following questions used a Likert scale with 1 representing Strongly Disagree and 5 representing Strongly Agree: | |||
| Overall, it is straightforward to contact the resident taking care of my patients. | 4 (4) | 4 (4) | 0.27 |
| Overall, I am satisfied with physicians' response time when I need to contact them urgently. | 3 (4) | 4 (4) | 0.54 |
| I spend a lot of time away from the bedside just trying to contact physicians. | 3 (4) | 3 (3) | 0.17 |
| I like being able to call and reach the doctor directly. | 4 (5) | ||
| Overall I am satisfied with the BlackBerry/email communication system. | 4 (4) |
Data Analysis
We present utilization as the mean number of messages sent and received daily. We report survey responses as the mean scores on a 5‐point Likert scale. For ordinal data, we described the survey responses using median and mode, and the Mann Whitney U test was used to test for differences between before and after responses. For parametric data, unpaired t‐tests were used to look for differences in the perceptions before and after the intervention. All P values are 2‐sided.
Results
Smartphone Usage
Usage of emails and calls for the team devices over the three months is shown in Table 3. Most communications were through the Team BlackBerry devices with the individual devices showing less usage than the team device with 2.1 sent emails per day and 4.0 received emails per day. On the days with highest use, there were 7 calls received per hour and 6 emails received per hour at peak times through the day to a Team BlackBerry. Web‐paging was the largest source of emails sent to Team BlackBerrys (42%). Critical laboratory or medication alerts represented 17.1% and the remainder (40.9%) were other communications such as communication from residents, staff physicians, pharmacists, and allied health professionals. Of the web‐paging communications, 35.1% requested a call back, 22.6% requested email response, and 42.2% were informational items only that did not require a response.
| Phone Calls | Emails | |||
|---|---|---|---|---|
| Incoming | Outgoing | Received | Sent | |
| Average | 9.1 | 6.6 | 14.3 | 2.8 |
| Minimum | 0 | 0 | 0 | 0 |
| Maximum | 35 | 45 | 57 | 13 |
| Median | 8 | 4 | 13.5 | 2 |
Resident Perceptions
Of the 91 residents, 59 residents completed the presurveys (response rate 65%) and 65 completed the postsurveys (response rate 71%) (Table 1). There was a statistically significant improvement in all of the items measured. There were also 26 postsurvey comments with 22 describing positive aspects and 9 describing negative aspects. Specific positive attributes of the new communication system that were mentioned were: easier to communicate with other physicians within the team (n = 6), easier to communicate with other health care members of the team (nurses, allied health) (n = 3), and increased mobility (n = 2). The following are some examples:
-
Blackberrys are great for contacting team member, able to mobile in hospital instead of waiting by phone ‐ since we're so busy
-
Excellent for interpersonal communication. It definitely sped up patients care ie, consults, getting investigations done and discharges. Everyone should have one.
-
Text messaging, especially in group format so that all members participate in conversations is the primary communication tool of choice. Emailing is a necessity of the modern workforce.
The 2 predominant issues described were that the direct calling by nurses was disruptive (n = 6) and voice mail was not useful (n = 3):
-
I dislike the voicemail as it is like paging back but you also need to make a phone call to your phone list. Also we are always being interrupted which is disruptive to work but prefer BlackBerrys.
-
Helpful but often disruptive such as getting calls when seeing patients.
Nursing Perceptions
From the typical staff of 94 full‐time and part‐time nurses, 27 of 48 (56%) completed the preintervention survey, and 35 of 54 (65%) completed the postintervention survey. There was a perceived significant decrease in the need to repeatedly try to contact a physician for the same issue (80% vs. 34.3%, P = 0.001) and a significant decrease in the perceived amount of time spent trying to contact clinicians (27.6 minutes vs. 11.1 minutes, P 0.001) (Table 2). On 5 point Likert scales, there was no perceived improvement in communication areas such as finding out who to reach and resident response time. Nurses appreciated the ability to call the physicians directly for urgent issues (median response 4, mode of 5).
Discussion
Principal Results
In this pilot study of using smartphones and email, residents perceived that it significantly improved their efficiency. Nurses perceived a reduction in the time spent trying to communicate with clinicians.
There were significant lessons learned. First, we found that residents readily utilized smartphones and felt that it improved their efficiency. Staff physicians and residents have outlined multiple concerns over increased workload, increasing patient complexity, and longer work hours. Therefore, interventions that improve physician productivity are essential in maintaining and improving patient care.16 From residents' comments, it appears their improved efficiency is derived not only from improved communication within the medical team, but also within the interprofessional team. Efficiency was also perceived to improve from the greater mobility of being able to walk while returning a page or while waiting for a page to be returned.
Second, we found that changing the communication process was complicated. While the number of calls and emails per day appeared manageable, the peak times had very high volumes and may actually be unmanageable. By facilitating the process of reaching the responsible physician, we may have lowered the threshold for contacting the physician and thus actually increased communication volumes. It is unclear whether the end result is beneficial as improved management of patients is balanced by the increased interruptions. Further study is required to understand the effect of increasing communication on patient outcomes.
Finally, residents indicated quite strongly that they did not want telephone calls to be the primary mode of contact as they found the frequent telephone calls too disruptive. A direct call to a physician created significant disruption to workflow requiring interrupting a task to answer the call or deferring the call to later review of a voice mail message. Accessing voice mail would typically take at least a minute, much more time than the few seconds it takes to review a numeric page or a text page. Residents quickly provided feedback that this process was unacceptable and reduced their ability to deliver care effectively. Furthermore, nurses were frustrated by the added time required to leave voice messages and the poor response rate. As information within voice mails was not acted upon, nurses quickly learned to just keep calling.
Costs of implementation were significantly more than the numeric paging system. With a cost of $5/month for a numeric pager, the cost of numeric pagers for 4 medical teams with 4 physicians each was $80/month (all costs in Canadian dollars). From our implementation, the approximate cost of an individual smartphone was $80/month while team‐based devices were $160/month due to much higher usage. With 4 individual smartphones and one team‐based smartphone per team, costs with the new system were approximately $1,600/month. While implementing smartphones creates a significantly greater expense, it may be worthwhile if improved communication leads to more efficient and higher quality care. Our current system is funded through the hospital to allow for further evaluation, and whether other hospitals provide smartphones for clinical communications likely would depend on whether they provided a cost effective alternative to numeric pagers. This would likely require some more tangible benefit than perceived improved efficiency.
Comparison With Prior Work
Similar to the study of wireless email using smartphones in the Intensive Care Unit, physicians in our study perceived an improvement in efficiency.14 Our study adds further information to the literature since we implemented on general medical wards in an academic teaching hospital. Our study is consistent with the previous studies have documented physicians' perceptions of improved performance with mobile phones.7, 17
Limitations
There are limitations to this study. In order to improve communication, we implemented a complex intervention with several components: (1) smartphones for residents, (2) Web‐paging for nurses, and (3) a new process of identifying the most responsible physician using Team BlackBerrys. From our surveys, it is difficult to know the relative impact of each individual component. Other interventions such as team‐based alphanumeric pagers may achieve similar improvements to nurses' perceptions of improved communication.
As this was a pilot study assessing new communication methods, we informally assessed perceptions using surveys which had not been validated. While the use of formally validated surveys would be more useful, we were unable to find any that specifically addressed the innovation in communication seen with smartphones. Validity issues with the instruments and the low response rates may have contributed to the incongruent result seen with nurses' surveys in that there was a perceived improvement in time to contact physicians but not in the ease of contact of physicians or the satisfaction of the communication method. This incongruent result may also reflect that in spite of the fact that the nurses were accustomed to the new system and that things may have improved, communication issues still remain and likely would benefit from further study.
It would have also been useful to determine the effect of this intervention on numeric pages sent to traditional pagers, which was not captured. It is also important to realize that we did not replace the pagers but instead supplemented residents with smartphones. To replace pagers may involve significant costs to upgrade reception within hospital walls to reduce areas of little or no reception. Finally, this study was completed at 1 academic health science center, and the generalizability of the findings may be limited.
Future Study
There is great opportunity to improve communication between clinicians, and the use of smartphones, email and improved identification of the most responsible physician are some methods to achieving this. Further research would be useful to determine the relative importance of each component. With smartphones, it is would be useful to know whether the benefits seen were primarily due to the mobile email or having another phone available or other features. Finally, the use of web‐paging and email to communicate increases the documentation of communications, but a further improvement could be providing acknowledgement to nurses that web‐pages were received and read. This would close the loop on communications, ensuring that there are no lost communications and that escalation occurs promptly for urgent communications.
In summary, we implemented and evaluated a system to route and prioritize clinical communications combining the use of phone calls and secure email messaging to smartphones. Residents strongly perceived an improvement in communication with smartphones. Further objective clinical evaluation is necessary to determine if this intervention improves efficiency and more importantly, the quality of care.
Acknowledgements
The investigators retained all control over study design, data collection, analysis and interpretation, and preparation of reports.
- ,,.How hospitalists spend their time: insights on efficiency and safety.J Hosp Med.2006;1(2):88–93.
- .When conversation is better than computation.J Am Med Inform Assoc.2000;7(3):277–286.
- ,,, et al.Incidence of adverse events and negligence in hospitalized patients. Results of the Harvard Medical Practice Study I.N Engl J Med.1991;324(6):370–376.
- ,,, et al.Gaps in pediatric clinician communication and opportunities for improvement.J Healthc Qual.2008;30(5):43–54.
- ,,,,,.The quality in Australian Health Care Study.Med J Aust.1995;163(9):458–471.
- ,,,,.Quality in Australian Health Care Study.Med J Aust.1996;164(12):754.
- ,,,,.Communication in critical care environments: mobile telephones improve patient care.Anesth Analg.2006;102(2):535–541.
- ,.Interrupted care. The effects of paging on pediatric resident activities.Am J Dis Child.1992;146(7):806–808.
- ,,.Patterns of paging medical interns during night calls at two teaching hospitals.CMAJ.1994;151(3):307–311.
- ,.The sounds of the hospital. Paging patterns in three teaching hospitals.N Engl J Med.1988;319(24):1585–1589.
- ,.Communication behaviours in a hospital setting: an observational study.BMJ1998;316(7132):673–676.
- ,,, et al.Why isn't anyone returning my page? Frequency and clinical importance of pages sent to the wrong physician.Arch Intern Med.2009;169(11):1072–1073.
- ,,, et al.Demonstrating the BlackBerry as a clinical communication tool: a pilot study conducted through the centre for innovation in complex care.Healthc Q2008;11(4):94–98.
- ,,,.The use of wireless email to improve healthcare team communication.J Am Med Inform Assoc.2009;16(5):705–713.
- .A primer on leading the improvement of systems.BMJ.1996;312(7031):619–622.
- .An elusive balance—residents' work hours and the continuity of care.N Engl J Med.2007;356(26):2665–2667.
- ,,, et al.Use of mobile phones by medical staff at Queen Elizabeth Hospital, Barbados: evidence for both benefit and harm.J Hosp Infect.2008;70(2):160–165.
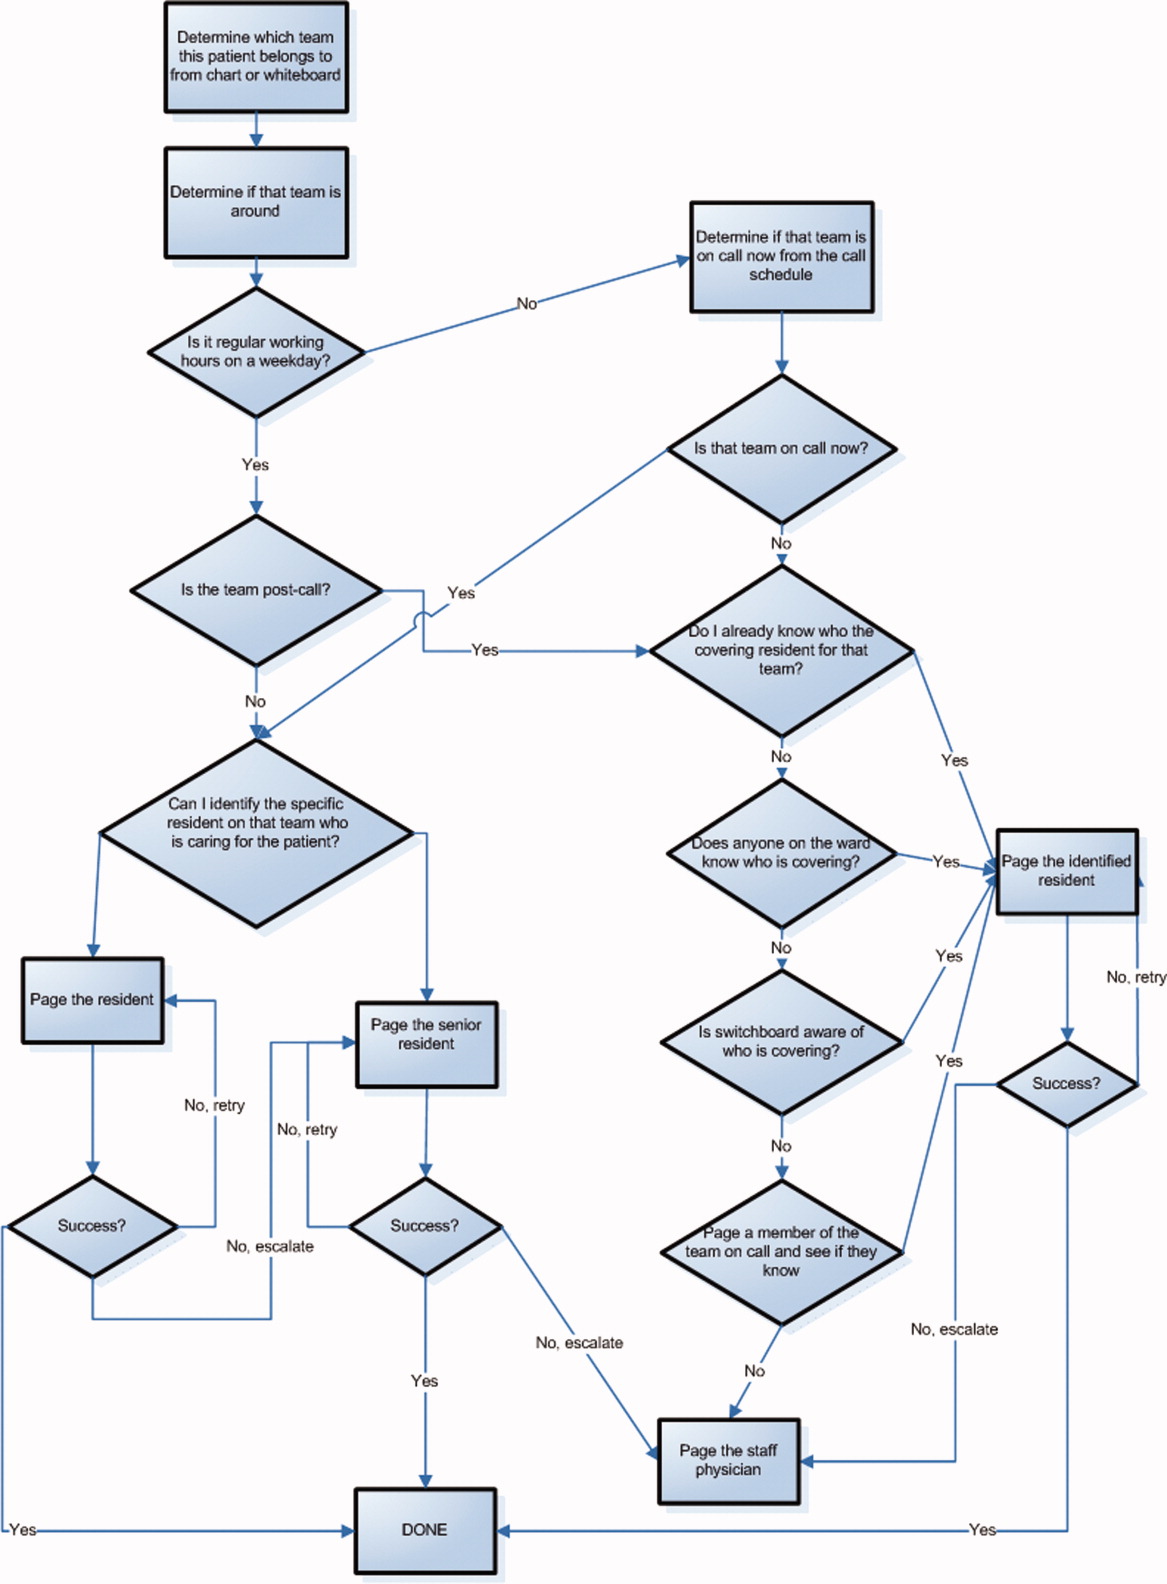
Glycemic Control in the Hospital
Hyperglycemia is common in hospitalized patients, and hyperglycemia has been associated with poor hospital outcomes. The adverse physiologic effects of acute hyperglycemia are well established1 and several clinical studies have linked hyperglycemia with poor clinical outcomes in certain patient populations.28 Although the optimal target range for inpatient glycemic control has not yet been defined, these studies support the goal of metabolic control for hospital patients. However, there are many barriers to achieving adequate glycemic control in the hospital, and blood glucoses in the hospital are often far from recommended targets.9, 10 One barrier appears to be the low priority given to glycemic control in the hospital. Hyperglycemia in the hospital is often ignored,11 and insulin regimens are often chosen for simplicity as opposed to effectiveness.12 Other barriers to glycemic control in the hospital include the physiologic effects (stress) of acute illness, and the frequent nutritional changes and interruptions that occur.
Most hyperglycemic patients on a general medicine unit are treated with subcutaneous insulin, but the optimal strategy for prescribing insulin in the hospital remains uncertain. A technical review of the literature on the management of diabetes in the hospital setting from 2004 recommends prescribing insulin in a way that mimics physiologic insulin secretion (ie, physiologic or basal‐bolus insulin).1 This approach has been promulgated by experts, but there has been very little research to support these recommendations. One small, randomized trial concluded that a basal‐bolus approach achieved better glycemic control than the use of sliding‐scale insulin alone,13 and 2 quality improvement studies using a before/after design have demonstrated improvements in glycemic control after the implementation of interventions designed to encourage physiologic insulin use.14, 15
In this study we hypothesized that a few simple interventions (education for physicians and nurses, and a standardized insulin order form) would lead to a higher rate of basal‐bolus insulin use and simultaneously improve glycemic control and patient safety.
Methods
Study Design
This study was performed at the University of Michigan Hospital over a 6‐month period, and the protocol was approved by the Institutional Review Board. We performed a quasi‐experimental study comparing 3 patient groups. The intervention group (IG) was subject to all of the interventions discussed below (physician education, nurse education, and the standardized order form). The concurrent control group (CCG) was hospitalized during the same time period as the IG, but was only subject to 1 of the interventions (physician education). These patients were cared for by the same physicians as the IG, but on a different unit where the nurses had not received the education and where the standardized insulin order form was not available. Patients were admitted to the IG unit or the CCG unit via the institution's usual admission process. In addition, we examined an historic control group (HCG) which was hospitalized during the same months of the year, but 2 years prior. The HCG was not subject to any of the interventions.
Interventions
Standardized Subcutaneous Insulin Order Form
This form (Supporting Information Appendix 1) was designed to encourage physicians to prescribe insulin in a physiologic way, providing basal, nutritional, and correctional insulin. The form is based on best practice guidelines,1 and is in agreement with the principles of the inpatient management of diabetes and hyperglycemia endorsed by several professional organizations.16, 17 The form was engineered by a multidisciplinary team, including an endocrinologist, several hospitalists, several nurses, a certified diabetes educator, a pharmacist, and others. It is derived from the extensive experience of the University of Michigan Hospital Intensive Insulin Program (HIIP) in the Division of Endocrinology, and on work done by the Society of Hospital Medicine (SHM) Glycemic Control Task Force.1719 This form was only used in the care of patients in the IG. The form, which was not approved for use on other floors, did not creep to other units. The standardized order form was the only way to order insulin or to modify the insulin regimen on the IG unit. The frequency of review or revision of the insulin orders was left to the discretion of the inpatient physicians.
Physician/Midlevel Provider Education
Physicians and midlevel providers caring for patients in the IG and the CCG were given specific education about the best practice recommendations for the management of diabetes and hyperglycemia in hospitalized patients. This education was based on the principles of anticipatory, physiologic insulin use. On nonhouse staff services, the education was provided to the attending physicians and midlevel providers, and on house staff services, the education was provided to the residents. All physician education was provided by the physician authors (D.W. and R.G.). A summary of the content of the physician education is provided in Supporting Information Appendix 2.
Nurse Education
Nurses caring for patients in the IG were given education similar to that which was provided to the physicians (see above), with an emphasis on practical issues related to delivering physiologic insulin. It included topics such as blood glucose monitoring, and the real‐time manipulation of nutritional insulin doses in accordance with the clinical situation (decision‐making that was specifically delegated to the nursing staff by the order set).
Patients
Patients were eligible for inclusion in the analysis if they met the following inclusion criteria: they were admitted to the inpatient General Internal Medicine Services; subcutaneous insulin was provided to the patient during the hospitalization; they had at least 2 blood glucose values >180 mg/dL; they were discharged from the hospital on a pharmacologic glucose lowering agent (insulin or oral); and their total length‐of‐stay was 3 days to 14 days. Patients were excluded from the analysis if they were admitted with a primary diagnosis of diabetic ketoacidosis, diabetic hyperosmolar state, or hypoglycemia. Up to 10 consecutive days of glucose data were recorded for each patient, and the first day on which blood glucose information was available from the admitting floor was excluded from the analysis. Also, specific patient‐days were not analyzed if there were no bedside glucoses recorded, or if the patient was treated with an IV insulin infusion on that day.
Outcomes
The primary outcome was glycemic control. The primary unit of measure was the patient‐day (ie, all of the information for 1 patient on a single qualifying day). This was done to correct for the phenomenon of frequent repeat testing in response to abnormal values. It also allows for a more clinically relevant description of the actual glycemic control on a given day. Specifically, each patient‐day was categorized as in‐range (70‐180 mg/dL), hyperglycemic (>180 mg/dL), severely hyperglycemic (>250 mg/dL), hypoglycemic (<70 mg/dL), and/or severely hypoglycemic (<50 mg/dL). The primary endpoint was glycemic control in‐range. For a patient‐day to be in‐range, all readings for that particular day were within 70 mg/dL to180 mg/dL. For the readings that were not in the desired range, a minimum of 1 deviant reading in a particular day constituted classification into that category, and a single out‐of‐range patient‐day could be included in 1 or more of the out‐of‐range categories (eg, a patient‐day could be categorized as both severely hyperglycemic and hypoglycemic if it contained glucose readings in both of those ranges).
The day‐weighted mean blood glucose value was also calculated for each of the groups. This calculation utilized the mean blood glucose for each patient‐day, and then averaged these values for each group. These metrics have been endorsed as appropriate measures of glycemic control by the SHM Glycemic Control Task Force.20
Other Data
Several other clinical features were also examined, including the following: primary diagnoses listed in the hospital discharge summary for each patient (3 maximum); possible confounders including patient weight, length‐of‐stay, days receiving tube feeds, days receiving parenteral nutrition, and days during which patients were treated with high‐dose glucocorticoids (>10 mg/day of prednisone, or its equivalent) or oral diabetes medications; and the composition of the insulin regimen on each hospital day. Definitions of insulin regimens are provided in Table 1.
| |
| Any basal insulin day | Any day in which intermediate‐acting or long‐acting, scheduled insulin was given. |
| Basal insulin alone day | A day in which intermediate‐acting or long‐acting insulin was the only scheduled insulin given. |
| Any nutritional insulin day | Any day in which rapid‐acting or short‐acting, scheduled insulin was given. |
| Nutritional insulin alone day | A day in which rapid‐acting or short‐acting insulin was the only scheduled insulin given. |
| Basal plus nutritional day | A day in which both scheduled, intermediate‐acting or long‐acting insulin and scheduled, rapid‐acting or short‐acting insulin were given. |
| Pre‐mixed insulin day | Any day in which a pre‐mixed combination insulin was given. |
| Basal plus nutritional or pre‐mixed insulin day | A composite of the basal plus nutritional day category and the mixed insulin day category described above. This group includes any day in which either a pre‐mixed combination insulin was given OR a day in which both: (a) scheduled, intermediate‐acting or long‐acting and (b) scheduled, rapid‐acting or short‐acting insulin were given. |
| Sliding scale insulin alone day* | Any day when only correctional (as needed) insulin was given. |
Statistical Analysis
Bivariate analyses (chi‐square, and t‐tests) were carried out to compare demographic characteristics of the intervention and control populations. Since there were multiple glucose readings nested within individuals, multilevel mixed‐effects logistic regression was used to evaluate the association between the intervention and outcomes. A 2‐level hierarchical model was developed in which patient‐days were nested within patients; this accounted for the correlation between glycemic control across days for a given patient. Patient‐day was modeled as a random intercept and the log likelihood was estimated using adaptive Gaussian quadrature with 7 integration points. Alpha was set at 0.05, 2‐tailed. The final model was adjusted for gender, age, weight, length‐of‐stay, use of oral diabetes agents, use of sulfonylureas, and use of high‐dose corticosteroids. The use of a nonoral feeding route (eg, tube feeding or parenteral nutrition) was too infrequent to be considered in the adjusted analysis. All analyses were conducted in Stata/IC 10.0 (College Station, TX).
Results
A total of 245 patients provided 1315 patient‐days. Patient demographics are shown in Table 2. The patients' weight, length‐of‐stay, and primary diagnoses were similar across the 3 groups. There was a higher percentage of males in the IG as compared to the HCG.
| IG | CCG | P Value IG vs. CCG | HCG | P Value IG vs. HCG | |
|---|---|---|---|---|---|
| |||||
| Number of patients | 84 | 86 | 75 | ||
| Age, years, mean (SD) | 59.3 (15.3) | 60.4 (15.9) | 0.68 | 59.2 (17.2) | 0.96 |
| Range (n = 245) | 18‐94 | 20‐87 | 24‐92 | ||
| Weight in kg, mean (SD) | 92.2 (29.5) | 89.5 (27.2) | 0.57 | 94.2 (35.4) | 0.69 |
| Range (n = 237) | 40‐198 | 40‐188 | 42‐235 | ||
| Sex, n (%) (n = 245) | 0.17 | 0.04 | |||
| Male | 45 (53.6) | 37 (43.0) | 28 (37.3) | ||
| Female | 39(46.4) | 49 (57.0) | 47 (62.7) | ||
| Length of stay, mean (SD) | 7.6 (3.3) | 7.4 (3.0) | 0.62 | 7.0 (2.5) | 0.14 |
| Range (n = 245) | 4‐15 | 4‐15 | 4‐14 | ||
| Number of diagnoses | 169 | 158 | 160 | ||
| Primary diagnoses, n (%) | 0.56 | 0.10 | |||
| Infections | 40 (23.7) | 45 (28.5) | 49 (30.6) | ||
| Gastrointestinal | 33 (19.5) | 19 (12.0) | 14 (8.8) | ||
| Rheumatologic | 13 (7.7) | 12 (7.6) | 18 (11.2) | ||
| Renal | 14 (8.3) | 10 (6.3) | 16 (10.0) | ||
| Diabetes‐related | 11 (6.5) | 11 (7.0) | 10 (6.2) | ||
| Neurologic | 8 (4.7) | 11 (7.0) | 11 (6.9) | ||
| *Misc/other | 50 (29.6) | 50 (31.6) | 42 (26.3) | ||
Table 3 shows the insulin regimens used in the different groups. The use of basal insulin was similar between groups. Congruent with the goals of the education session and the order set, patients in the IG were more likely to be treated with a combination of basal and nutritional insulin than patients in the other groups. Patients in the HCG were more likely to be treated with a premixed insulin than patients in the other groups. However, even when premixed insulin was categorized as a form of basal plus nutritional insulin and combined into a composite group with the combined basal and nutritional days, this type of regimen remained more common in the IG than in the HCG. The rate of sliding scale insulin use alone (ie, without any scheduled insulin) was similar in the 3 groups.
| Patient‐days on the following | IG (n = 453) | CCG (n = 471) | P Value IG vs. CCG | HCG (n = 391) | P Value IG vs. HCG |
|---|---|---|---|---|---|
| |||||
| Sliding scale alone, n (%) | 105 (23.2) | 130 (27.6) | 0.12 | 89 (22.8) | 0.89 |
| Basal alone, n (%) | 132 (29.1) | 231 (49.0) | <0.01 | 199 (50.9) | <0.01 |
| Nutritional alone, n (%) | 22 (4.9) | 5 (1.1) | <0.01 | 8 (2.0) | 0.03 |
| Basal plus nutritional, n (%) | 166 (36.6) | 71 (15.1) | <0.01 | 14 (3.6) | <0.01 |
| Pre‐mixed insulin included, n (%) | 27 (6.0) | 32 (6.8) | 0.60 | 78 (20.0) | <0.01 |
| No insulin, n (%) | 1 (<1) | 2 (<1) | 0.59 | 3 (<1) | 0.28 |
| Any basal, n (%) | 325 (71.7) | 334 (70.9) | 0.78 | 291 (74.4) | 0.38 |
| Any nutritional, n (%) | 215 (47.5) | 108 (22.9) | <0.01 | 100 (25.6) | <0.01 |
| Basal plus nutritional or pre‐mixed, n (%) | 193 (42.6) | 103 (21.9) | <0.01 | 92 (23.5) | <0.01 |
| Oral diabetes agents, n (%) | 79 (17.4) | 83 (17.6) | 0.94 | 74 (18.9) | 0.58 |
| Sulfonylureas, n (%) | 40 (8.8) | 63 (13.4) | 0.03 | 37 (9.5) | 0.75 |
| Parenteral nutrition/tube feeds, n (%) | 0 (0) | 18 (3.8) | 8 (2.0) | ||
| High dose corticosteroids, n (%) | 66 (14.6) | 93 (19.8) | 0.04 | 51 (13.0) | 0.52 |
Other relevant measures are also shown in Table 3. The use of oral diabetes agents was similar in the 3 groups. The use of a nonoral feeding route (eg, tube feeding or parenteral nutrition) was infrequent.
A comparison of glycemic control in the three groups is shown in Table 4. In contrast to the CCG, patients in the IG experienced more days within the target glucose range (17% vs. 10.6%, P < 0.01), fewer days with severe hyperglycemia (48.3% vs. 59.2%, P < 0.01), and had a lower day‐weighted average blood glucose (195.9 vs. 212.6, P < 0.01). Compared to the HCG, patients in the IG experienced similar rates of hyperglycemia, but fewer hypoglycemic days (5.1% vs. 9.2%, P = 0.02).
| IG (n = 453) | CCG (n = 471) | P Value IG vs. CCG | HCG (n = 391) | P Value IG vs. HCG | |
|---|---|---|---|---|---|
| |||||
| Patient‐days | |||||
| In range, n (%) | 77 (17.0) | 50 (10.6) | <0.01 | 66 (16.9) | 0.98 |
| Out of range, n (%) | 376 (83.0) | 421 (89.4) | <0.01 | 325 (83.1) | 0.98 |
| Hyperglycemic, n (%) | 289 (63.8) | 310 (65.8) | 0.52 | 248 (63.4) | 0.91 |
| Severely hyperglycemic, n (%) | 219 (48.3) | 279 (59.2) | <0.01 | 176 (45.0) | 0.32 |
| Hypoglycemic, n (%) | 23 (5.1) | 36 (7.6) | 0.11 | 36 (9.2) | 0.02 |
| Severely hypoglycemic, n (%) | 13 (2.9) | 10 (2.1) | 0.47 | 15 (3.8) | 0.44 |
| Day weighted average blood glucose (SD) | 195.9 (66.8) | 212.6 (73.4) | <0.01 | 190.5 (63.1) | 0.25 |
The percentages of patients with severe hyperglycemia in each group are shown in Figure 1 by hospital day. Severe hyperglycemia was common, but there was a trend towards a decrease in the prevalence of severe hyperglycemia with increasing hospital days for all study groups, although it was consistently higher in the CCG than in the IG. Figure 2 shows the types of insulin regimens used by hospital day (composite for all groups). The use of basal plus nutritional insulin (the recommended regimen) increased gradually with increasing hospital days. When taken together, the information in both figures support the hypothesis that the use of the recommended insulin regimen may have contributed to the modest improvements in glycemic control seen in the IG.
In the final adjusted regression model, the intervention had a positive impact on glycemic control (Table 5). Subjects in the IG had a 72% increase in the odds of being in the target glucose range when compared to subjects in the CCG (P = 0.01). In addition, subjects in the IG had a 35% reduction in the odds of being severely hyperglycemic when compared to those in the CCG (P < 0.01). Finally, the odds ratio (OR) for being hypoglycemic among intervention subjects was 0.59 (P = 0.06) when compared to subjects in the CCG and 0.48 (P = 0.01) when compared to subjects in the HCG.
| Adjusted OR* IG vs. CCG | 95% CI | P value IG vs. CCG | Adjusted OR* IG vs. HCG | 95% CI | P Value IG vs. HCG | |
|---|---|---|---|---|---|---|
| ||||||
| In range | 1.72 | 1.16,2.55 | 0.01 | 1.08 | 0.74,1.58 | 0.68 |
| Hyperglycemic | 0.93 | 0.70,1.22 | 0.58 | 0.95 | 0.71,1.28 | 0.74 |
| Severely Hyperglycemic | 0.65 | 0.49,0.85 | <0.01 | 1.10 | 0.82,1.47 | 0.52 |
| Hypoglycemic | 0.59 | 0.34,1.02 | 0.06 | 0.48 | 0.27,0.85 | 0.01 |
| Severely Hypoglycemic | 1.36 | 0.59,3.14 | 0.47 | 0.97 | 0.29,1.44 | 0.28 |
Discussion
In this study, we investigated the effects of a standardized insulin order set, coupled with physician and nurse education, on glycemic control in hyperglycemic hospitalized patients. These interventions were designed to encourage a standardized approach to the treatment of hyperglycemia in hospitalized patients, based on the principles of physiologic insulin use, as described above. Our data suggest that the interventions did, indeed, alter the way insulin was prescribed, as more patients in the IG received a combination of basal plus nutritional insulin (the recommended regimen) than in the other groups. These interventions were associated with improved glycemic outcomes in the IG as compared to the CCG. The IG experienced a higher percentage of days in the target range and a trend toward fewer hypoglycemic days than the CCG. Although the IG experienced a similar percentage of days in the target range, it had significantly fewer hypoglycemic days than the HCG.
It is useful to consider the results of our study in the context of 2 other similar studies performed by Schnipper et al.14 and Maynard et al.15 Although each of these 3 studies have different study designs, they are similar in intent (to test the effects of simple quality improvement interventions on glycemic control in the hospital) and results (all showed significant improvements in some aspect of glycemic control). In our study, and the study by Maynard et al.,15 the interventions also led to decreases in the rates of hypoglycemia, whereas Schnipper et al.14 observed no difference in hypoglycemia. Of interest, in each of the three studies the interventions were associated with an increase in the use of some type of scheduled insulin. In our study and the study from Schnipper et al.14 the baseline use of basal insulin was quite high, and the interventions were associated with a significant increase in the addition of nutritional insulin. In the Maynard et al.15 study, the baseline use of sliding scale insulin alone was prevalent, and the interventions resulted in an increase in the use of basal insulin. The results of these studies, taken together, prompt us to conclude that the interventions employed in these studies are likely to lead to more frequent prescription of scheduled (anticipatory) insulin, and a modest improvement in glycemic control, without an increase (and perhaps with a decrease) in hypoglycemia.
A few of our study results are unexpected, or difficult to explain. In contrast to the other studies discussed above, our interventions did not affect the frequency of the use of sliding‐scale insulin alone (without any scheduled insulin), which was similar in the 3 groups. Although the reason for this is uncertain, we hypothesize that the high baseline use of basal insulin in our institution, and the lack of a hard stop preventing the use of sliding scale insulin alone explain this finding. Also, it is difficult to explain why measures of hyperglycemia were similar between the IG and the HCG despite the fact that the HCG was less often treated with a combination of basal and nutritional insulin and more often treated with mixed insulin.
There are several different mechanisms by which the interventions might have resulted in improved glycemic control in the IG compared to CCG. Our data clearly shows that insulin was prescribed differently in the IG, and the more frequent use of a combination of scheduled basal and nutritional insulin might have contributed to the differences between the groups. However, the effects of our interventions clearly went beyond physician education into the realm of true process improvement and standardization. The standardized order form was designed to prompt physicians to use a basal‐bolus insulin regimen. The order form also created nursing expectations of how insulin should be ordered, and clarified the roles of the different insulins that were prescribed.
On the medication administration record, each insulin was labeled as basal insulin (to be given even when fasting) or nutritional insulin (to be given along with the meal). The nurses caring for the IG also attended an education program that reinforced the role of the nurse in the bedside management of insulin administration. Specifically, nurses were taught to assess the premeal blood glucose and the patient's nutritional situation before giving the nutritional insulin (ie, Does the patient have food available? Will he tolerate eating the food?). In situations where is was not clear if the patient would be able to tolerate the ordered nutrition, the order set empowered the nurse to give the nutritional insulin after the meal, and to reduce the dose to match the patient's actual intake. These interventions resulted in some fundamental improvements in the nursing process of delivering insulin to the patient, and these changes might have resulted in improvements via mechanisms that are difficult to directly measure. Since the same physicians cared for both the IG and the CCG, interventions other than physician education clearly contributed to the observed improvements in the IG.
This study was not a randomized study, and there could be important undetected differences between the groups. However, all of the patients were admitted to the General Medicine Inpatient Services and the comparison of the general patient demographics and primary diagnoses between the groups do not suggest major differences.
Although the improvements in glycemic control seen in this study were statistically significant, they were quantitatively modest. The rates of hyperglycemia seen in this study, on the other hand, are quite remarkable. Both the American Diabetes Association and the American College of Endocrinology have recommended that blood glucoses in hospitalized patients not exceed a maximum value of 180 mg/dL, but the day‐weighted average blood glucose in this study was above that for each group. Even in the IG, over 80% of all patient‐days included at least 1 blood glucose value outside of the target range. These data suggest that better strategies for achieving metabolic control in hospitalized patients are needed.
It is worth mentioning that our interventions were not aggressively enforced. While the use of the order set was mandatory for the IG, it was flexible enough to allow for substantial practice variation, especially with respect to the dose of insulin prescribed. Although the education sessions discussed the specifics of insulin dosing in hospitalized patients, the order form did not offer dosing guidelines. It is possible that our interventions may have had a larger impact if a starting dose of insulin had been specified on the form. Although the insulin order form prompted physicians to act, there were no forced functions. Also, not all house staff attended the education sessions for physicians, and there was no feedback provided to physicians related to how they might improve their adherence to the recommendations presented in the educational module. Therefore, it is likely that more aggressive interventions could have led to greater changes in physician practice.
In conclusion, this study demonstrates that interventions including physician and nurse education and a standardized insulin order set can lead to improvement in glycemic control and patient safety in hospitalized patients treated with subcutaneous insulin. However, the observed improvements are modest, and poor metabolic control remains common, despite these interventions. These data suggest that standardization of the process of ordering and delivering subcutaneous insulin in the hospital may lead to a reduction in both hyperglycemia and hypoglycemia. However, it is clear that the interventions used in this study were not potent enough to achieve the recommended glycemic targets for the majority of patients. Additional research is needed to determine the best strategy for achieving safe and effective metabolic control in hospitalized, hyperglycemic, noncritically ill patients.
Acknowledgements
The authors thank David Conway for his work in data collection and management.
- ,,, et al.Management of diabetes and hyperglycemia in hospitals.Diabetes Care.2004;27:553–591.
- ,,, et al.Intensive insulin therapy in the critically ill patients.N Engl J Med.2001;345:1359–1367.
- ,,, et al.Intensive insulin therapy in the medical ICU.N Engl J Med.2006;354:449–461.
- ,,,.Continuous intravenous insulin infusion reduces the incidence of deep sternal wound infection in diabetic patients after cardiac surgical procedures.Ann Thorac Surg.1999;67:352–360; discussion360–352.
- ,,, et al.Continuous insulin infusion reduces mortality in patients with diabetes undergoing coronary artery bypass grafting.J Thorac Cardiovasc Surg.2003;125:1007–1021.
- ,,,,,.Hyperglycemia: an independent marker of in‐hospital mortality in patients with undiagnosed diabetes.J Clin Endocrinol Metab.2002;87:978–982.
- ,,, et al.Early postoperative glucose control predicts nosocomial infection rate in diabetic patients.JPEN J Parenter Enteral Nutr.1998;22:77–81.
- ,,,,,.The relation between hyperglycemia and outcomes in 2,471 patients admitted to the hospital with community‐acquired pneumonia.Diabetes Care.2005;28:810–815.
- ,.Glycemic chaos (not glycemic control) still the rule for inpatient care: how do we stop the insanity?J Hosp Med.2006;1:141–144.
- ,,, et al.Evaluation of hospital glycemic control at US Academic Medical Centers.J Hosp Med.2009;4:35–44.
- ,,, et al.Diabetes care in the hospital: is there clinical inertia?J Hosp Med.2006;1:151–160.
- ,,,,.Inpatient management of diabetes and hyperglycemia among general medicine patients at a large teaching hospital.J Hosp Med.2006;1:145–150.
- ,,, et al.Randomized study of basal‐bolus insulin therapy in the inpatient management of patients with type 2 diabetes (RABBIT 2 trial).Diabetes Care.2007;30:2181–2186.
- ,,,.Effects of a subcutaneous insulin protocol, clinical education, and computerized order set on the quality of inpatient management of hyperglycemia: results of a clinical trial.J Hosp Med.2009;4:16–27.
- ,,,,.Improved inpatient use of basal insulin, reduced hypoglycemia, and improved glycemic control: effect of structured subcutaneous insulin orders and an insulin management algorithm.J Hosp Med.2009;4:3–15.
- ,,, et al.American College of Endocrinology position statement on inpatient diabetes and metabolic control.Endocr Pract.2004;10:77–82.
- Society of Hospital Medicine. Glycemic Control Resource Room. Available at: http://www.hospitalmedicine.org/AM/Template.cfm?Section= Quality_Improvement_Resource_Rooms3(5 Suppl):17–28.
- ,,,.Subcutaneous insulin order sets and protocols: effective design and implementation strategies.J Hosp Med.2008;3(5 Suppl):29–41.
- ,,,,.Society of Hospital Medicine Glycemic Control Task Force summary: practical recommendations for assessing the impact of glycemic control efforts.J Hosp Med.2008;3(5 Suppl):66–75.
Hyperglycemia is common in hospitalized patients, and hyperglycemia has been associated with poor hospital outcomes. The adverse physiologic effects of acute hyperglycemia are well established1 and several clinical studies have linked hyperglycemia with poor clinical outcomes in certain patient populations.28 Although the optimal target range for inpatient glycemic control has not yet been defined, these studies support the goal of metabolic control for hospital patients. However, there are many barriers to achieving adequate glycemic control in the hospital, and blood glucoses in the hospital are often far from recommended targets.9, 10 One barrier appears to be the low priority given to glycemic control in the hospital. Hyperglycemia in the hospital is often ignored,11 and insulin regimens are often chosen for simplicity as opposed to effectiveness.12 Other barriers to glycemic control in the hospital include the physiologic effects (stress) of acute illness, and the frequent nutritional changes and interruptions that occur.
Most hyperglycemic patients on a general medicine unit are treated with subcutaneous insulin, but the optimal strategy for prescribing insulin in the hospital remains uncertain. A technical review of the literature on the management of diabetes in the hospital setting from 2004 recommends prescribing insulin in a way that mimics physiologic insulin secretion (ie, physiologic or basal‐bolus insulin).1 This approach has been promulgated by experts, but there has been very little research to support these recommendations. One small, randomized trial concluded that a basal‐bolus approach achieved better glycemic control than the use of sliding‐scale insulin alone,13 and 2 quality improvement studies using a before/after design have demonstrated improvements in glycemic control after the implementation of interventions designed to encourage physiologic insulin use.14, 15
In this study we hypothesized that a few simple interventions (education for physicians and nurses, and a standardized insulin order form) would lead to a higher rate of basal‐bolus insulin use and simultaneously improve glycemic control and patient safety.
Methods
Study Design
This study was performed at the University of Michigan Hospital over a 6‐month period, and the protocol was approved by the Institutional Review Board. We performed a quasi‐experimental study comparing 3 patient groups. The intervention group (IG) was subject to all of the interventions discussed below (physician education, nurse education, and the standardized order form). The concurrent control group (CCG) was hospitalized during the same time period as the IG, but was only subject to 1 of the interventions (physician education). These patients were cared for by the same physicians as the IG, but on a different unit where the nurses had not received the education and where the standardized insulin order form was not available. Patients were admitted to the IG unit or the CCG unit via the institution's usual admission process. In addition, we examined an historic control group (HCG) which was hospitalized during the same months of the year, but 2 years prior. The HCG was not subject to any of the interventions.
Interventions
Standardized Subcutaneous Insulin Order Form
This form (Supporting Information Appendix 1) was designed to encourage physicians to prescribe insulin in a physiologic way, providing basal, nutritional, and correctional insulin. The form is based on best practice guidelines,1 and is in agreement with the principles of the inpatient management of diabetes and hyperglycemia endorsed by several professional organizations.16, 17 The form was engineered by a multidisciplinary team, including an endocrinologist, several hospitalists, several nurses, a certified diabetes educator, a pharmacist, and others. It is derived from the extensive experience of the University of Michigan Hospital Intensive Insulin Program (HIIP) in the Division of Endocrinology, and on work done by the Society of Hospital Medicine (SHM) Glycemic Control Task Force.1719 This form was only used in the care of patients in the IG. The form, which was not approved for use on other floors, did not creep to other units. The standardized order form was the only way to order insulin or to modify the insulin regimen on the IG unit. The frequency of review or revision of the insulin orders was left to the discretion of the inpatient physicians.
Physician/Midlevel Provider Education
Physicians and midlevel providers caring for patients in the IG and the CCG were given specific education about the best practice recommendations for the management of diabetes and hyperglycemia in hospitalized patients. This education was based on the principles of anticipatory, physiologic insulin use. On nonhouse staff services, the education was provided to the attending physicians and midlevel providers, and on house staff services, the education was provided to the residents. All physician education was provided by the physician authors (D.W. and R.G.). A summary of the content of the physician education is provided in Supporting Information Appendix 2.
Nurse Education
Nurses caring for patients in the IG were given education similar to that which was provided to the physicians (see above), with an emphasis on practical issues related to delivering physiologic insulin. It included topics such as blood glucose monitoring, and the real‐time manipulation of nutritional insulin doses in accordance with the clinical situation (decision‐making that was specifically delegated to the nursing staff by the order set).
Patients
Patients were eligible for inclusion in the analysis if they met the following inclusion criteria: they were admitted to the inpatient General Internal Medicine Services; subcutaneous insulin was provided to the patient during the hospitalization; they had at least 2 blood glucose values >180 mg/dL; they were discharged from the hospital on a pharmacologic glucose lowering agent (insulin or oral); and their total length‐of‐stay was 3 days to 14 days. Patients were excluded from the analysis if they were admitted with a primary diagnosis of diabetic ketoacidosis, diabetic hyperosmolar state, or hypoglycemia. Up to 10 consecutive days of glucose data were recorded for each patient, and the first day on which blood glucose information was available from the admitting floor was excluded from the analysis. Also, specific patient‐days were not analyzed if there were no bedside glucoses recorded, or if the patient was treated with an IV insulin infusion on that day.
Outcomes
The primary outcome was glycemic control. The primary unit of measure was the patient‐day (ie, all of the information for 1 patient on a single qualifying day). This was done to correct for the phenomenon of frequent repeat testing in response to abnormal values. It also allows for a more clinically relevant description of the actual glycemic control on a given day. Specifically, each patient‐day was categorized as in‐range (70‐180 mg/dL), hyperglycemic (>180 mg/dL), severely hyperglycemic (>250 mg/dL), hypoglycemic (<70 mg/dL), and/or severely hypoglycemic (<50 mg/dL). The primary endpoint was glycemic control in‐range. For a patient‐day to be in‐range, all readings for that particular day were within 70 mg/dL to180 mg/dL. For the readings that were not in the desired range, a minimum of 1 deviant reading in a particular day constituted classification into that category, and a single out‐of‐range patient‐day could be included in 1 or more of the out‐of‐range categories (eg, a patient‐day could be categorized as both severely hyperglycemic and hypoglycemic if it contained glucose readings in both of those ranges).
The day‐weighted mean blood glucose value was also calculated for each of the groups. This calculation utilized the mean blood glucose for each patient‐day, and then averaged these values for each group. These metrics have been endorsed as appropriate measures of glycemic control by the SHM Glycemic Control Task Force.20
Other Data
Several other clinical features were also examined, including the following: primary diagnoses listed in the hospital discharge summary for each patient (3 maximum); possible confounders including patient weight, length‐of‐stay, days receiving tube feeds, days receiving parenteral nutrition, and days during which patients were treated with high‐dose glucocorticoids (>10 mg/day of prednisone, or its equivalent) or oral diabetes medications; and the composition of the insulin regimen on each hospital day. Definitions of insulin regimens are provided in Table 1.
| |
| Any basal insulin day | Any day in which intermediate‐acting or long‐acting, scheduled insulin was given. |
| Basal insulin alone day | A day in which intermediate‐acting or long‐acting insulin was the only scheduled insulin given. |
| Any nutritional insulin day | Any day in which rapid‐acting or short‐acting, scheduled insulin was given. |
| Nutritional insulin alone day | A day in which rapid‐acting or short‐acting insulin was the only scheduled insulin given. |
| Basal plus nutritional day | A day in which both scheduled, intermediate‐acting or long‐acting insulin and scheduled, rapid‐acting or short‐acting insulin were given. |
| Pre‐mixed insulin day | Any day in which a pre‐mixed combination insulin was given. |
| Basal plus nutritional or pre‐mixed insulin day | A composite of the basal plus nutritional day category and the mixed insulin day category described above. This group includes any day in which either a pre‐mixed combination insulin was given OR a day in which both: (a) scheduled, intermediate‐acting or long‐acting and (b) scheduled, rapid‐acting or short‐acting insulin were given. |
| Sliding scale insulin alone day* | Any day when only correctional (as needed) insulin was given. |
Statistical Analysis
Bivariate analyses (chi‐square, and t‐tests) were carried out to compare demographic characteristics of the intervention and control populations. Since there were multiple glucose readings nested within individuals, multilevel mixed‐effects logistic regression was used to evaluate the association between the intervention and outcomes. A 2‐level hierarchical model was developed in which patient‐days were nested within patients; this accounted for the correlation between glycemic control across days for a given patient. Patient‐day was modeled as a random intercept and the log likelihood was estimated using adaptive Gaussian quadrature with 7 integration points. Alpha was set at 0.05, 2‐tailed. The final model was adjusted for gender, age, weight, length‐of‐stay, use of oral diabetes agents, use of sulfonylureas, and use of high‐dose corticosteroids. The use of a nonoral feeding route (eg, tube feeding or parenteral nutrition) was too infrequent to be considered in the adjusted analysis. All analyses were conducted in Stata/IC 10.0 (College Station, TX).
Results
A total of 245 patients provided 1315 patient‐days. Patient demographics are shown in Table 2. The patients' weight, length‐of‐stay, and primary diagnoses were similar across the 3 groups. There was a higher percentage of males in the IG as compared to the HCG.
| IG | CCG | P Value IG vs. CCG | HCG | P Value IG vs. HCG | |
|---|---|---|---|---|---|
| |||||
| Number of patients | 84 | 86 | 75 | ||
| Age, years, mean (SD) | 59.3 (15.3) | 60.4 (15.9) | 0.68 | 59.2 (17.2) | 0.96 |
| Range (n = 245) | 18‐94 | 20‐87 | 24‐92 | ||
| Weight in kg, mean (SD) | 92.2 (29.5) | 89.5 (27.2) | 0.57 | 94.2 (35.4) | 0.69 |
| Range (n = 237) | 40‐198 | 40‐188 | 42‐235 | ||
| Sex, n (%) (n = 245) | 0.17 | 0.04 | |||
| Male | 45 (53.6) | 37 (43.0) | 28 (37.3) | ||
| Female | 39(46.4) | 49 (57.0) | 47 (62.7) | ||
| Length of stay, mean (SD) | 7.6 (3.3) | 7.4 (3.0) | 0.62 | 7.0 (2.5) | 0.14 |
| Range (n = 245) | 4‐15 | 4‐15 | 4‐14 | ||
| Number of diagnoses | 169 | 158 | 160 | ||
| Primary diagnoses, n (%) | 0.56 | 0.10 | |||
| Infections | 40 (23.7) | 45 (28.5) | 49 (30.6) | ||
| Gastrointestinal | 33 (19.5) | 19 (12.0) | 14 (8.8) | ||
| Rheumatologic | 13 (7.7) | 12 (7.6) | 18 (11.2) | ||
| Renal | 14 (8.3) | 10 (6.3) | 16 (10.0) | ||
| Diabetes‐related | 11 (6.5) | 11 (7.0) | 10 (6.2) | ||
| Neurologic | 8 (4.7) | 11 (7.0) | 11 (6.9) | ||
| *Misc/other | 50 (29.6) | 50 (31.6) | 42 (26.3) | ||
Table 3 shows the insulin regimens used in the different groups. The use of basal insulin was similar between groups. Congruent with the goals of the education session and the order set, patients in the IG were more likely to be treated with a combination of basal and nutritional insulin than patients in the other groups. Patients in the HCG were more likely to be treated with a premixed insulin than patients in the other groups. However, even when premixed insulin was categorized as a form of basal plus nutritional insulin and combined into a composite group with the combined basal and nutritional days, this type of regimen remained more common in the IG than in the HCG. The rate of sliding scale insulin use alone (ie, without any scheduled insulin) was similar in the 3 groups.
| Patient‐days on the following | IG (n = 453) | CCG (n = 471) | P Value IG vs. CCG | HCG (n = 391) | P Value IG vs. HCG |
|---|---|---|---|---|---|
| |||||
| Sliding scale alone, n (%) | 105 (23.2) | 130 (27.6) | 0.12 | 89 (22.8) | 0.89 |
| Basal alone, n (%) | 132 (29.1) | 231 (49.0) | <0.01 | 199 (50.9) | <0.01 |
| Nutritional alone, n (%) | 22 (4.9) | 5 (1.1) | <0.01 | 8 (2.0) | 0.03 |
| Basal plus nutritional, n (%) | 166 (36.6) | 71 (15.1) | <0.01 | 14 (3.6) | <0.01 |
| Pre‐mixed insulin included, n (%) | 27 (6.0) | 32 (6.8) | 0.60 | 78 (20.0) | <0.01 |
| No insulin, n (%) | 1 (<1) | 2 (<1) | 0.59 | 3 (<1) | 0.28 |
| Any basal, n (%) | 325 (71.7) | 334 (70.9) | 0.78 | 291 (74.4) | 0.38 |
| Any nutritional, n (%) | 215 (47.5) | 108 (22.9) | <0.01 | 100 (25.6) | <0.01 |
| Basal plus nutritional or pre‐mixed, n (%) | 193 (42.6) | 103 (21.9) | <0.01 | 92 (23.5) | <0.01 |
| Oral diabetes agents, n (%) | 79 (17.4) | 83 (17.6) | 0.94 | 74 (18.9) | 0.58 |
| Sulfonylureas, n (%) | 40 (8.8) | 63 (13.4) | 0.03 | 37 (9.5) | 0.75 |
| Parenteral nutrition/tube feeds, n (%) | 0 (0) | 18 (3.8) | 8 (2.0) | ||
| High dose corticosteroids, n (%) | 66 (14.6) | 93 (19.8) | 0.04 | 51 (13.0) | 0.52 |
Other relevant measures are also shown in Table 3. The use of oral diabetes agents was similar in the 3 groups. The use of a nonoral feeding route (eg, tube feeding or parenteral nutrition) was infrequent.
A comparison of glycemic control in the three groups is shown in Table 4. In contrast to the CCG, patients in the IG experienced more days within the target glucose range (17% vs. 10.6%, P < 0.01), fewer days with severe hyperglycemia (48.3% vs. 59.2%, P < 0.01), and had a lower day‐weighted average blood glucose (195.9 vs. 212.6, P < 0.01). Compared to the HCG, patients in the IG experienced similar rates of hyperglycemia, but fewer hypoglycemic days (5.1% vs. 9.2%, P = 0.02).
| IG (n = 453) | CCG (n = 471) | P Value IG vs. CCG | HCG (n = 391) | P Value IG vs. HCG | |
|---|---|---|---|---|---|
| |||||
| Patient‐days | |||||
| In range, n (%) | 77 (17.0) | 50 (10.6) | <0.01 | 66 (16.9) | 0.98 |
| Out of range, n (%) | 376 (83.0) | 421 (89.4) | <0.01 | 325 (83.1) | 0.98 |
| Hyperglycemic, n (%) | 289 (63.8) | 310 (65.8) | 0.52 | 248 (63.4) | 0.91 |
| Severely hyperglycemic, n (%) | 219 (48.3) | 279 (59.2) | <0.01 | 176 (45.0) | 0.32 |
| Hypoglycemic, n (%) | 23 (5.1) | 36 (7.6) | 0.11 | 36 (9.2) | 0.02 |
| Severely hypoglycemic, n (%) | 13 (2.9) | 10 (2.1) | 0.47 | 15 (3.8) | 0.44 |
| Day weighted average blood glucose (SD) | 195.9 (66.8) | 212.6 (73.4) | <0.01 | 190.5 (63.1) | 0.25 |
The percentages of patients with severe hyperglycemia in each group are shown in Figure 1 by hospital day. Severe hyperglycemia was common, but there was a trend towards a decrease in the prevalence of severe hyperglycemia with increasing hospital days for all study groups, although it was consistently higher in the CCG than in the IG. Figure 2 shows the types of insulin regimens used by hospital day (composite for all groups). The use of basal plus nutritional insulin (the recommended regimen) increased gradually with increasing hospital days. When taken together, the information in both figures support the hypothesis that the use of the recommended insulin regimen may have contributed to the modest improvements in glycemic control seen in the IG.
In the final adjusted regression model, the intervention had a positive impact on glycemic control (Table 5). Subjects in the IG had a 72% increase in the odds of being in the target glucose range when compared to subjects in the CCG (P = 0.01). In addition, subjects in the IG had a 35% reduction in the odds of being severely hyperglycemic when compared to those in the CCG (P < 0.01). Finally, the odds ratio (OR) for being hypoglycemic among intervention subjects was 0.59 (P = 0.06) when compared to subjects in the CCG and 0.48 (P = 0.01) when compared to subjects in the HCG.
| Adjusted OR* IG vs. CCG | 95% CI | P value IG vs. CCG | Adjusted OR* IG vs. HCG | 95% CI | P Value IG vs. HCG | |
|---|---|---|---|---|---|---|
| ||||||
| In range | 1.72 | 1.16,2.55 | 0.01 | 1.08 | 0.74,1.58 | 0.68 |
| Hyperglycemic | 0.93 | 0.70,1.22 | 0.58 | 0.95 | 0.71,1.28 | 0.74 |
| Severely Hyperglycemic | 0.65 | 0.49,0.85 | <0.01 | 1.10 | 0.82,1.47 | 0.52 |
| Hypoglycemic | 0.59 | 0.34,1.02 | 0.06 | 0.48 | 0.27,0.85 | 0.01 |
| Severely Hypoglycemic | 1.36 | 0.59,3.14 | 0.47 | 0.97 | 0.29,1.44 | 0.28 |
Discussion
In this study, we investigated the effects of a standardized insulin order set, coupled with physician and nurse education, on glycemic control in hyperglycemic hospitalized patients. These interventions were designed to encourage a standardized approach to the treatment of hyperglycemia in hospitalized patients, based on the principles of physiologic insulin use, as described above. Our data suggest that the interventions did, indeed, alter the way insulin was prescribed, as more patients in the IG received a combination of basal plus nutritional insulin (the recommended regimen) than in the other groups. These interventions were associated with improved glycemic outcomes in the IG as compared to the CCG. The IG experienced a higher percentage of days in the target range and a trend toward fewer hypoglycemic days than the CCG. Although the IG experienced a similar percentage of days in the target range, it had significantly fewer hypoglycemic days than the HCG.
It is useful to consider the results of our study in the context of 2 other similar studies performed by Schnipper et al.14 and Maynard et al.15 Although each of these 3 studies have different study designs, they are similar in intent (to test the effects of simple quality improvement interventions on glycemic control in the hospital) and results (all showed significant improvements in some aspect of glycemic control). In our study, and the study by Maynard et al.,15 the interventions also led to decreases in the rates of hypoglycemia, whereas Schnipper et al.14 observed no difference in hypoglycemia. Of interest, in each of the three studies the interventions were associated with an increase in the use of some type of scheduled insulin. In our study and the study from Schnipper et al.14 the baseline use of basal insulin was quite high, and the interventions were associated with a significant increase in the addition of nutritional insulin. In the Maynard et al.15 study, the baseline use of sliding scale insulin alone was prevalent, and the interventions resulted in an increase in the use of basal insulin. The results of these studies, taken together, prompt us to conclude that the interventions employed in these studies are likely to lead to more frequent prescription of scheduled (anticipatory) insulin, and a modest improvement in glycemic control, without an increase (and perhaps with a decrease) in hypoglycemia.
A few of our study results are unexpected, or difficult to explain. In contrast to the other studies discussed above, our interventions did not affect the frequency of the use of sliding‐scale insulin alone (without any scheduled insulin), which was similar in the 3 groups. Although the reason for this is uncertain, we hypothesize that the high baseline use of basal insulin in our institution, and the lack of a hard stop preventing the use of sliding scale insulin alone explain this finding. Also, it is difficult to explain why measures of hyperglycemia were similar between the IG and the HCG despite the fact that the HCG was less often treated with a combination of basal and nutritional insulin and more often treated with mixed insulin.
There are several different mechanisms by which the interventions might have resulted in improved glycemic control in the IG compared to CCG. Our data clearly shows that insulin was prescribed differently in the IG, and the more frequent use of a combination of scheduled basal and nutritional insulin might have contributed to the differences between the groups. However, the effects of our interventions clearly went beyond physician education into the realm of true process improvement and standardization. The standardized order form was designed to prompt physicians to use a basal‐bolus insulin regimen. The order form also created nursing expectations of how insulin should be ordered, and clarified the roles of the different insulins that were prescribed.
On the medication administration record, each insulin was labeled as basal insulin (to be given even when fasting) or nutritional insulin (to be given along with the meal). The nurses caring for the IG also attended an education program that reinforced the role of the nurse in the bedside management of insulin administration. Specifically, nurses were taught to assess the premeal blood glucose and the patient's nutritional situation before giving the nutritional insulin (ie, Does the patient have food available? Will he tolerate eating the food?). In situations where is was not clear if the patient would be able to tolerate the ordered nutrition, the order set empowered the nurse to give the nutritional insulin after the meal, and to reduce the dose to match the patient's actual intake. These interventions resulted in some fundamental improvements in the nursing process of delivering insulin to the patient, and these changes might have resulted in improvements via mechanisms that are difficult to directly measure. Since the same physicians cared for both the IG and the CCG, interventions other than physician education clearly contributed to the observed improvements in the IG.
This study was not a randomized study, and there could be important undetected differences between the groups. However, all of the patients were admitted to the General Medicine Inpatient Services and the comparison of the general patient demographics and primary diagnoses between the groups do not suggest major differences.
Although the improvements in glycemic control seen in this study were statistically significant, they were quantitatively modest. The rates of hyperglycemia seen in this study, on the other hand, are quite remarkable. Both the American Diabetes Association and the American College of Endocrinology have recommended that blood glucoses in hospitalized patients not exceed a maximum value of 180 mg/dL, but the day‐weighted average blood glucose in this study was above that for each group. Even in the IG, over 80% of all patient‐days included at least 1 blood glucose value outside of the target range. These data suggest that better strategies for achieving metabolic control in hospitalized patients are needed.
It is worth mentioning that our interventions were not aggressively enforced. While the use of the order set was mandatory for the IG, it was flexible enough to allow for substantial practice variation, especially with respect to the dose of insulin prescribed. Although the education sessions discussed the specifics of insulin dosing in hospitalized patients, the order form did not offer dosing guidelines. It is possible that our interventions may have had a larger impact if a starting dose of insulin had been specified on the form. Although the insulin order form prompted physicians to act, there were no forced functions. Also, not all house staff attended the education sessions for physicians, and there was no feedback provided to physicians related to how they might improve their adherence to the recommendations presented in the educational module. Therefore, it is likely that more aggressive interventions could have led to greater changes in physician practice.
In conclusion, this study demonstrates that interventions including physician and nurse education and a standardized insulin order set can lead to improvement in glycemic control and patient safety in hospitalized patients treated with subcutaneous insulin. However, the observed improvements are modest, and poor metabolic control remains common, despite these interventions. These data suggest that standardization of the process of ordering and delivering subcutaneous insulin in the hospital may lead to a reduction in both hyperglycemia and hypoglycemia. However, it is clear that the interventions used in this study were not potent enough to achieve the recommended glycemic targets for the majority of patients. Additional research is needed to determine the best strategy for achieving safe and effective metabolic control in hospitalized, hyperglycemic, noncritically ill patients.
Acknowledgements
The authors thank David Conway for his work in data collection and management.
- ,,, et al.Management of diabetes and hyperglycemia in hospitals.Diabetes Care.2004;27:553–591.
- ,,, et al.Intensive insulin therapy in the critically ill patients.N Engl J Med.2001;345:1359–1367.
- ,,, et al.Intensive insulin therapy in the medical ICU.N Engl J Med.2006;354:449–461.
- ,,,.Continuous intravenous insulin infusion reduces the incidence of deep sternal wound infection in diabetic patients after cardiac surgical procedures.Ann Thorac Surg.1999;67:352–360; discussion360–352.
- ,,, et al.Continuous insulin infusion reduces mortality in patients with diabetes undergoing coronary artery bypass grafting.J Thorac Cardiovasc Surg.2003;125:1007–1021.
- ,,,,,.Hyperglycemia: an independent marker of in‐hospital mortality in patients with undiagnosed diabetes.J Clin Endocrinol Metab.2002;87:978–982.
- ,,, et al.Early postoperative glucose control predicts nosocomial infection rate in diabetic patients.JPEN J Parenter Enteral Nutr.1998;22:77–81.
- ,,,,,.The relation between hyperglycemia and outcomes in 2,471 patients admitted to the hospital with community‐acquired pneumonia.Diabetes Care.2005;28:810–815.
- ,.Glycemic chaos (not glycemic control) still the rule for inpatient care: how do we stop the insanity?J Hosp Med.2006;1:141–144.
- ,,, et al.Evaluation of hospital glycemic control at US Academic Medical Centers.J Hosp Med.2009;4:35–44.
- ,,, et al.Diabetes care in the hospital: is there clinical inertia?J Hosp Med.2006;1:151–160.
- ,,,,.Inpatient management of diabetes and hyperglycemia among general medicine patients at a large teaching hospital.J Hosp Med.2006;1:145–150.
- ,,, et al.Randomized study of basal‐bolus insulin therapy in the inpatient management of patients with type 2 diabetes (RABBIT 2 trial).Diabetes Care.2007;30:2181–2186.
- ,,,.Effects of a subcutaneous insulin protocol, clinical education, and computerized order set on the quality of inpatient management of hyperglycemia: results of a clinical trial.J Hosp Med.2009;4:16–27.
- ,,,,.Improved inpatient use of basal insulin, reduced hypoglycemia, and improved glycemic control: effect of structured subcutaneous insulin orders and an insulin management algorithm.J Hosp Med.2009;4:3–15.
- ,,, et al.American College of Endocrinology position statement on inpatient diabetes and metabolic control.Endocr Pract.2004;10:77–82.
- Society of Hospital Medicine. Glycemic Control Resource Room. Available at: http://www.hospitalmedicine.org/AM/Template.cfm?Section= Quality_Improvement_Resource_Rooms3(5 Suppl):17–28.
- ,,,.Subcutaneous insulin order sets and protocols: effective design and implementation strategies.J Hosp Med.2008;3(5 Suppl):29–41.
- ,,,,.Society of Hospital Medicine Glycemic Control Task Force summary: practical recommendations for assessing the impact of glycemic control efforts.J Hosp Med.2008;3(5 Suppl):66–75.
Copyright © 2010 Society of Hospital Medicine

A Resting Place
When his hospital’s board of trustees was considering a palliative-care program seven years ago, hospitalist Stephen Bekanich, MD, wasn’t sure what to expect. What he did know was that his hospitalist group could provide the University of Utah Health System in Salt Lake City answers to staffing and financial issues surrounding the addition of a palliative-care service.

“They looked around and decided the hospitalist group would be the best place to house [the service], based on our experience with a range of medical management issues and the fact that we’re around 24 hours, seven days a week,” says Dr. Bekanich, who in 2006 became the first medical director of the palliative-care service at University of Utah Hospital.
The hospital board eventually selected palliative care as one of its annual projects, Dr. Bekanich says, not just because it was the right thing to do, but also because palliative care increasingly is used as a quality marker for hospitals. Dr. Bekanich says he took the assignment because it provides a nice buffer and change of pace from the stress of full-time HM service. Several colleagues joined him in rotating through palliative care coverage, although he continued to carry a pager most days and nights to support the physicians, advanced practice nurses, social worker, and chaplain with challenging cases.
After six months of operation, Dr. Bekanich went before his hospital board to discuss the program. He presented hospital data that showed the service had helped save the hospital $600,000, along with “thank-you letters” from grateful families and mentions in obituaries.
—Steven Pantilat, MD, SFHM, director, Univ, of California at San Francisco palliative care service, SHM past president
“A couple of months later, I realized that we needed another nurse practitioner to staff the growing caseload,” he explains. “I went to the chief medical officer and he said to me, ‘I don’t need to see the numbers. I know you’re doing a great job. Just tell me what you need.’ ”
Widely extolled for relieving the physical suffering and emotional distress of seriously ill patients, palliative care has seen rapid advancement in recent years, not only as a humanitarian impulse, but also as a legitimate and recognized medical subspecialty and career choice. Palliative care has its own board certification, fellowships, and training opportunities. For working hospitalists, this subspecialty can complement a career path and enhance job satisfaction. For HM groups, it represents diversification and an additional, albeit modest, income stream, as well as opportunities to improve the quality of hospital care.
“Palliative medicine is recognized by the American Board of Medical Specialties [ABMS] and nine of its medical specialty boards, which is very significant,” says Steven Pantilat, MD, SFHM, a hospitalist at the University of California at San Francisco (UCSF) Medical Center, medical director of UCSF’s palliative-care service. “Along with that come fellowships.”
The Basics
Palliative care’s focus is managing patients’ symptoms, maximizing quality of life, and clarifying treatment goals—regardless of diagnosis or other treatments they might be receiving. It is not hospice care, which is defined by Medicare as treatment for patients with a terminal prognosis of six months or less (see “Hospice and Palliative: End-of-Life Care Siblings,” p. 21). Palliative care and hospice care utilize many of the same techniques, and are combined in the ABMS program for certifying subspecialist physicians.
The interdisciplinary consultation service, where a palliative care consultant rounds with a team that might include physicians, nurses, social workers, pharmacists, and chaplains, is the most common palliative-care model in the hospital setting, but other approaches include dedicated units and community-based programs.
The latest data from the American Hospital Association (AHA) and the Center to Advance Palliative Care (CAPC) count 1,486 operational palliative-care programs in U.S. acute-care hospitals, more than twice as many as a decade before.1 Currently, the demand for physicians certified in hospice and palliative medicine outstrips the supply, which poses challenges to those trying to hire as well as bona fide opportunities for qualified physicians hoping to pursue their dream jobs in the field, says Dr. Pantilat, a past president of SHM.
“A few years ago, it was cutting-edge for hospitals to just have a palliative care program,” Dr. Pantilat says, “but now the focus is on quality and the qualifications of the palliative care physicians and other professionals. Expectations for what palliative care will deliver will only go up.”
UCSF’s palliative care service “lives” within its HM division. Five of the six palliative care attending physicians are hospitalists. They divide weeklong assignments on the service into seven-day commitments at the hospital; each shift includes an on-call pager for night coverage.
A palliative-care shift can be just as emotionally demanding as an HM shift, although usually with fewer patients. One big difference: More time is needed for each palliative care consult, Dr. Pantilat says. A typical consult consists of an intense conversation with the patient and family to explore the patient’s prognosis, family values, and goals for treatment and pain relief.
Additionally, palliative care physicians routinely discuss the psychosocial and spiritual distress that the patient and family normally encounter.
Know When to Call for Help
Hospitalist involvement in palliative care varies by service, individual experience, and institution guidelines. Generally, though, it starts with an understanding of what the service provides and determining when is the right time to call a palliative-care consultant for help (see “Your Page Is Welcomed,” p. 22).
Hospitalists can obtain basic training and incorporate palliative-care principles and practices into the care of all hospitalized patients (see “Training Opportunities,” p. 22). If your hospital has a palliative-care service, hospitalists could join an advisory committee or provide backup coverage. If no such service exists, hospitalists could advocate with other physicians and hospital administrators to start one, Dr. Pantilat says.
Some hospitalists go deeper, developing subspecialty expertise and board certification in palliative medicine.
For HM groups, integration with a palliative-care service could mean taking on medical management of the service. If your group chooses to go this route, experts suggest you research how busy the service could be and gauge the interest of physicians in your group. Also check on the willingness of hospitalists in the group who are not interested in working on the palliative care service; they could help free up time for those who want to do it.
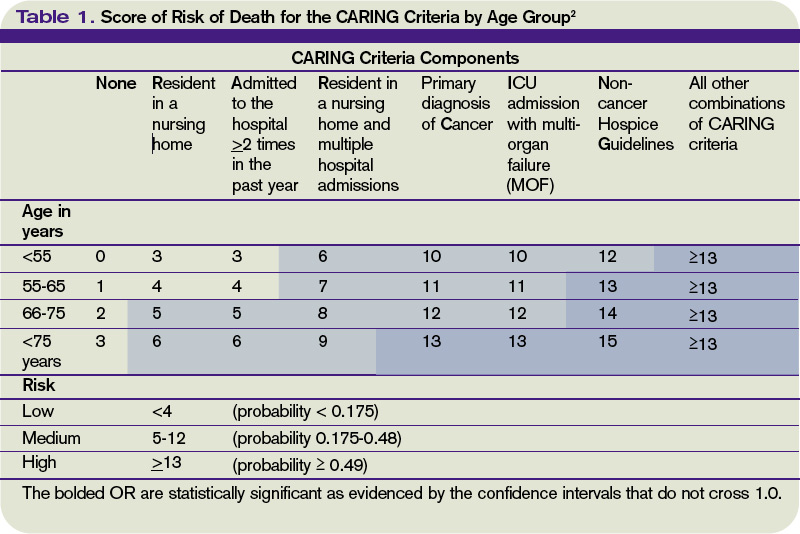
What Every Hospitalist Should Know
The basic clinical skills needed to perform palliative medicine include:
- Titrating opioid analgesics;
- Using adjuvant pain medications;
- Managing nonpain-related symptoms, including nausea, vomiting, constipation, dyspnea, seizures, and anorexia;
- Managing delirium, anxiety, and depression;
- Communicating sensitive information;
- Working with cultural issues and differences; and
- Bereavement support for families.
“Every hospitalist should know how to elicit a patient’s goals of care and incorporate them into routine treatment, be fluid and comfortable discussing advance-care planning, and possess basic skills in pain management,” says Jeanie Youngwerth, MD, hospitalist and director of the palliative-care service at the University of Colorado Denver. “Unfortunately, we’re not there yet as a field, given current residency training in internal medicine. Our center has a hospitalist residency training track, and those residents all get dedicated, palliative care experience.”
Knowing when to refer a patient to a palliative-care specialist is another important skill, Dr. Youngwerth explains. The CARING criteria, developed by Dr. Youngwerth’s colleagues at UC Denver, are a simple set of prognostic markers that identify patients with limited life expectancy at the time of hospital admission. The CARING criteria are a set of prognostic criteria that incorporate cancer diagnosis, repeated hospital admissions, ICU stays with multi-organ failure, residence in a nursing home, and meeting non-cancer hospice guidelines developed by the National Hospice Organization, which collectively correlate with the need for a palliative-care consultation (see Table 1, above).2
A simpler way to initially assess a patient’s need for palliative care is to ask yourself: Would you be surprised if you found out this patient had died within a year? “If physicians don’t think the patient is going to be alive in a year, then they should incorporate palliative care into the care plan,” Dr. Youngwerth says. “The next question is: Should I do it myself, or refer for a palliative-care consultation?”
Dr. Bekanich, who starting this month will head a new palliative care program at the University of Miami that features a 10-bed inpatient unit, encourages hospitalists to avoid focusing only on terminally ill patients when considering a palliative consult. Any seriously ill patient with unmet needs could benefit from a referral, he says.
“Lots of hospitalists are good at controlling nausea and vomiting, but if the symptoms are refractory or have uncommon presentations, I would like to get on board as the palliative care consultant,” Dr. Bekanich says. “I have also tried to emphasize to my group the importance of timely family meetings.
“If they don’t have the time or the skills, or if they expect a difficult meeting, for example, due to religious or cultural differences, send these patients our way. And when there are ethical issues that need to be addressed, or a particular need for educating patients and families about the disease process and what to expect, I like consultations like that.”
Bad Business or New Revenue Stream?
The traditional business model for palliative-care services has focused on the potential contributions to the hospital’s bottom line through reduced length of stay and cost avoidance for a group of patients who can be among the hospital’s most challenging and expensive. Palliative care saves time and money by working with patients and their families to clarify their values and treatment preferences, which routinely differ from standard treatment modes.
A recent multisite study of palliative care by Morrison et al found that the use of palliative care services saved from $1,700 to $4,900 per admission in direct costs, compared with similar patients who did not receive palliative care.3 The savings were realized primarily through reduced laboratory, pharmacy, and ICU costs.
Cost avoidance, combined with palliative care’s contributions to quality and patient satisfaction, is essential to the field’s growth. Even though physician consultation visits are billable, a palliative-care service rarely covers its staffing costs solely with billing revenue. A service requires nonbillable support from administration and midlevel providers, including nurses and social workers.
“Integrating palliative care into the work of hospitalists is a great idea,” says Jean Kutner, MD, head of the division of general internal medicine at the University of Colorado Denver. However, there are important issues related to scheduling, availability, and commitment that need to be explored before a group launches a new service. “I’d want to have discussions about how the palliative-care business model fits with our hospital medicine model and an agreement with the hospital on goals and metrics,” she says.
Hospitalists Fill a Need
Whether a full-fledged palliative-care service fits your group’s dynamic or not, hospitalists as a whole should be competent in basic palliative care. Community and rural hospitals need HM to bridge this gap and deliver quality care to seriously ill patients.

“I started at a community hospital, Eden Medical Center in Castro Valley, California. I had a personal interest in palliative care and realized there’s a tremendous need for it in community hospitals,” says Heather A. Harris, MD, a hospitalist at San Francisco General Hospital who previously worked with Dr. Pantilat’s palliative care service at UCSF. “We deal with end-of-life issues on a regular basis—whether recognized or not—based on our caseloads and requests for consultations.
“I got a little perspective about palliative care while a resident at UCSF. But as I’ve gotten further into this, I have come to realize that there is an actual skill set that needs to be learned to do it properly.”
Dr. Harris says there is a big difference between physicians helping patients with end-of-life issues the best they can and being part of a “dedicated, interdisciplinary team.”
“Palliative care is a wonderful opportunity for hospitalists,” she says. “It’s already part of your practice. Why not do it in a more organized fashion?” TH
Larry Beresford is a freelance medical writer based in Oakland, Calif.
References
- Palliative care programs continue rapid growth in U.S. hospitals. Center to Advance Palliative Care website. Available at: www.capc.org/news-and-events/releases/04-05-10. Accessed July 15, 2010.
- Fischer SM, Gozansky WS, Sauaia A, Min SJ, Kutner JS, Kramer A. A practical tool to identify patients who may benefit from a palliative approach: the CARING criteria. J Pain Symptom Manage. 2006;31(4):285-292.
- Morrison RS, Penrod JD, Cassel JB, et al. Cost savings associated with US hospital palliative care consultation programs. Arch Intern Med. 2008;168(16):1783-1790.
When his hospital’s board of trustees was considering a palliative-care program seven years ago, hospitalist Stephen Bekanich, MD, wasn’t sure what to expect. What he did know was that his hospitalist group could provide the University of Utah Health System in Salt Lake City answers to staffing and financial issues surrounding the addition of a palliative-care service.
“They looked around and decided the hospitalist group would be the best place to house [the service], based on our experience with a range of medical management issues and the fact that we’re around 24 hours, seven days a week,” says Dr. Bekanich, who in 2006 became the first medical director of the palliative-care service at University of Utah Hospital.
The hospital board eventually selected palliative care as one of its annual projects, Dr. Bekanich says, not just because it was the right thing to do, but also because palliative care increasingly is used as a quality marker for hospitals. Dr. Bekanich says he took the assignment because it provides a nice buffer and change of pace from the stress of full-time HM service. Several colleagues joined him in rotating through palliative care coverage, although he continued to carry a pager most days and nights to support the physicians, advanced practice nurses, social worker, and chaplain with challenging cases.
After six months of operation, Dr. Bekanich went before his hospital board to discuss the program. He presented hospital data that showed the service had helped save the hospital $600,000, along with “thank-you letters” from grateful families and mentions in obituaries.
—Steven Pantilat, MD, SFHM, director, Univ, of California at San Francisco palliative care service, SHM past president
“A couple of months later, I realized that we needed another nurse practitioner to staff the growing caseload,” he explains. “I went to the chief medical officer and he said to me, ‘I don’t need to see the numbers. I know you’re doing a great job. Just tell me what you need.’ ”
Widely extolled for relieving the physical suffering and emotional distress of seriously ill patients, palliative care has seen rapid advancement in recent years, not only as a humanitarian impulse, but also as a legitimate and recognized medical subspecialty and career choice. Palliative care has its own board certification, fellowships, and training opportunities. For working hospitalists, this subspecialty can complement a career path and enhance job satisfaction. For HM groups, it represents diversification and an additional, albeit modest, income stream, as well as opportunities to improve the quality of hospital care.
“Palliative medicine is recognized by the American Board of Medical Specialties [ABMS] and nine of its medical specialty boards, which is very significant,” says Steven Pantilat, MD, SFHM, a hospitalist at the University of California at San Francisco (UCSF) Medical Center, medical director of UCSF’s palliative-care service. “Along with that come fellowships.”
The Basics
Palliative care’s focus is managing patients’ symptoms, maximizing quality of life, and clarifying treatment goals—regardless of diagnosis or other treatments they might be receiving. It is not hospice care, which is defined by Medicare as treatment for patients with a terminal prognosis of six months or less (see “Hospice and Palliative: End-of-Life Care Siblings,” p. 21). Palliative care and hospice care utilize many of the same techniques, and are combined in the ABMS program for certifying subspecialist physicians.
The interdisciplinary consultation service, where a palliative care consultant rounds with a team that might include physicians, nurses, social workers, pharmacists, and chaplains, is the most common palliative-care model in the hospital setting, but other approaches include dedicated units and community-based programs.
The latest data from the American Hospital Association (AHA) and the Center to Advance Palliative Care (CAPC) count 1,486 operational palliative-care programs in U.S. acute-care hospitals, more than twice as many as a decade before.1 Currently, the demand for physicians certified in hospice and palliative medicine outstrips the supply, which poses challenges to those trying to hire as well as bona fide opportunities for qualified physicians hoping to pursue their dream jobs in the field, says Dr. Pantilat, a past president of SHM.
“A few years ago, it was cutting-edge for hospitals to just have a palliative care program,” Dr. Pantilat says, “but now the focus is on quality and the qualifications of the palliative care physicians and other professionals. Expectations for what palliative care will deliver will only go up.”
UCSF’s palliative care service “lives” within its HM division. Five of the six palliative care attending physicians are hospitalists. They divide weeklong assignments on the service into seven-day commitments at the hospital; each shift includes an on-call pager for night coverage.
A palliative-care shift can be just as emotionally demanding as an HM shift, although usually with fewer patients. One big difference: More time is needed for each palliative care consult, Dr. Pantilat says. A typical consult consists of an intense conversation with the patient and family to explore the patient’s prognosis, family values, and goals for treatment and pain relief.
Additionally, palliative care physicians routinely discuss the psychosocial and spiritual distress that the patient and family normally encounter.
Know When to Call for Help
Hospitalist involvement in palliative care varies by service, individual experience, and institution guidelines. Generally, though, it starts with an understanding of what the service provides and determining when is the right time to call a palliative-care consultant for help (see “Your Page Is Welcomed,” p. 22).
Hospitalists can obtain basic training and incorporate palliative-care principles and practices into the care of all hospitalized patients (see “Training Opportunities,” p. 22). If your hospital has a palliative-care service, hospitalists could join an advisory committee or provide backup coverage. If no such service exists, hospitalists could advocate with other physicians and hospital administrators to start one, Dr. Pantilat says.
Some hospitalists go deeper, developing subspecialty expertise and board certification in palliative medicine.
For HM groups, integration with a palliative-care service could mean taking on medical management of the service. If your group chooses to go this route, experts suggest you research how busy the service could be and gauge the interest of physicians in your group. Also check on the willingness of hospitalists in the group who are not interested in working on the palliative care service; they could help free up time for those who want to do it.
What Every Hospitalist Should Know
The basic clinical skills needed to perform palliative medicine include:
- Titrating opioid analgesics;
- Using adjuvant pain medications;
- Managing nonpain-related symptoms, including nausea, vomiting, constipation, dyspnea, seizures, and anorexia;
- Managing delirium, anxiety, and depression;
- Communicating sensitive information;
- Working with cultural issues and differences; and
- Bereavement support for families.
“Every hospitalist should know how to elicit a patient’s goals of care and incorporate them into routine treatment, be fluid and comfortable discussing advance-care planning, and possess basic skills in pain management,” says Jeanie Youngwerth, MD, hospitalist and director of the palliative-care service at the University of Colorado Denver. “Unfortunately, we’re not there yet as a field, given current residency training in internal medicine. Our center has a hospitalist residency training track, and those residents all get dedicated, palliative care experience.”
Knowing when to refer a patient to a palliative-care specialist is another important skill, Dr. Youngwerth explains. The CARING criteria, developed by Dr. Youngwerth’s colleagues at UC Denver, are a simple set of prognostic markers that identify patients with limited life expectancy at the time of hospital admission. The CARING criteria are a set of prognostic criteria that incorporate cancer diagnosis, repeated hospital admissions, ICU stays with multi-organ failure, residence in a nursing home, and meeting non-cancer hospice guidelines developed by the National Hospice Organization, which collectively correlate with the need for a palliative-care consultation (see Table 1, above).2
A simpler way to initially assess a patient’s need for palliative care is to ask yourself: Would you be surprised if you found out this patient had died within a year? “If physicians don’t think the patient is going to be alive in a year, then they should incorporate palliative care into the care plan,” Dr. Youngwerth says. “The next question is: Should I do it myself, or refer for a palliative-care consultation?”
Dr. Bekanich, who starting this month will head a new palliative care program at the University of Miami that features a 10-bed inpatient unit, encourages hospitalists to avoid focusing only on terminally ill patients when considering a palliative consult. Any seriously ill patient with unmet needs could benefit from a referral, he says.
“Lots of hospitalists are good at controlling nausea and vomiting, but if the symptoms are refractory or have uncommon presentations, I would like to get on board as the palliative care consultant,” Dr. Bekanich says. “I have also tried to emphasize to my group the importance of timely family meetings.
“If they don’t have the time or the skills, or if they expect a difficult meeting, for example, due to religious or cultural differences, send these patients our way. And when there are ethical issues that need to be addressed, or a particular need for educating patients and families about the disease process and what to expect, I like consultations like that.”
Bad Business or New Revenue Stream?
The traditional business model for palliative-care services has focused on the potential contributions to the hospital’s bottom line through reduced length of stay and cost avoidance for a group of patients who can be among the hospital’s most challenging and expensive. Palliative care saves time and money by working with patients and their families to clarify their values and treatment preferences, which routinely differ from standard treatment modes.
A recent multisite study of palliative care by Morrison et al found that the use of palliative care services saved from $1,700 to $4,900 per admission in direct costs, compared with similar patients who did not receive palliative care.3 The savings were realized primarily through reduced laboratory, pharmacy, and ICU costs.
Cost avoidance, combined with palliative care’s contributions to quality and patient satisfaction, is essential to the field’s growth. Even though physician consultation visits are billable, a palliative-care service rarely covers its staffing costs solely with billing revenue. A service requires nonbillable support from administration and midlevel providers, including nurses and social workers.
“Integrating palliative care into the work of hospitalists is a great idea,” says Jean Kutner, MD, head of the division of general internal medicine at the University of Colorado Denver. However, there are important issues related to scheduling, availability, and commitment that need to be explored before a group launches a new service. “I’d want to have discussions about how the palliative-care business model fits with our hospital medicine model and an agreement with the hospital on goals and metrics,” she says.
Hospitalists Fill a Need
Whether a full-fledged palliative-care service fits your group’s dynamic or not, hospitalists as a whole should be competent in basic palliative care. Community and rural hospitals need HM to bridge this gap and deliver quality care to seriously ill patients.
“I started at a community hospital, Eden Medical Center in Castro Valley, California. I had a personal interest in palliative care and realized there’s a tremendous need for it in community hospitals,” says Heather A. Harris, MD, a hospitalist at San Francisco General Hospital who previously worked with Dr. Pantilat’s palliative care service at UCSF. “We deal with end-of-life issues on a regular basis—whether recognized or not—based on our caseloads and requests for consultations.
“I got a little perspective about palliative care while a resident at UCSF. But as I’ve gotten further into this, I have come to realize that there is an actual skill set that needs to be learned to do it properly.”
Dr. Harris says there is a big difference between physicians helping patients with end-of-life issues the best they can and being part of a “dedicated, interdisciplinary team.”
“Palliative care is a wonderful opportunity for hospitalists,” she says. “It’s already part of your practice. Why not do it in a more organized fashion?” TH
Larry Beresford is a freelance medical writer based in Oakland, Calif.
References
- Palliative care programs continue rapid growth in U.S. hospitals. Center to Advance Palliative Care website. Available at: www.capc.org/news-and-events/releases/04-05-10. Accessed July 15, 2010.
- Fischer SM, Gozansky WS, Sauaia A, Min SJ, Kutner JS, Kramer A. A practical tool to identify patients who may benefit from a palliative approach: the CARING criteria. J Pain Symptom Manage. 2006;31(4):285-292.
- Morrison RS, Penrod JD, Cassel JB, et al. Cost savings associated with US hospital palliative care consultation programs. Arch Intern Med. 2008;168(16):1783-1790.
ONLINE EXCLUSIVE: Audio interviews with Project BOOST Michigan principals
Warm Welcome
Advocates for SHM’s Project BOOST (Better Outcomes for Older Adults through Safe Transitions) presented a standing-room-only policy briefing June 8 on Capitol Hill to explain an innovative quality-improvement (QI) initiative and new collaboration with Blue Cross Blue Shield of Michigan (BCBSM) to increase patient safety and reduce preventable hospital readmissions.
“The room was packed,” says David Share, MD, BCBSM’s executive medical director for healthcare quality. About 60 people were in attendance, mostly House and Senate legislative aides, along with a few representatives of third-party health organizations. Dr. Share, one of the presenters, says many of the staffers were well aware of the challenges of hospital-based practice. “I would say the crowd was remarkably attentive during our presentation,” he says.

SHM developed BOOST in 2008 to help hospitals and hospitalists systematically improve discharge processes through evidence-based interventions, management tools and resources, and expert mentoring. In January, BOOST was implemented in 15 Michigan hospitals with financial support from BCBSM. A 20-hospital partnership with the California HealthCare Foundation was announced in April, and more than 60 hospitals in 24 states now participate.
“These legislative staffers, who are responsible for crafting health-reform legislation, were given an in-depth understanding of how the provider community can take ownership of the challenges of transforming systems of care,” Dr. Share says. “I hope what they learned was that when payors … establish incentives for providers to transform healthcare systems, providers can do that very creatively and effectively in ways that affect patient care, patient well-being, and patient outcomes—both in terms of quality and cost.”
Hospitalist Scott Flanders, MD, SFHM, professor of medicine and director of the inpatient program at the University of Michigan in Ann Arbor, also spoke at the briefing. “I think our Michigan collaborative is a nice example of a local, provider-based, payor-supported quality initiative that will tackle an important problem and lead to a lot of collaboration and learning,” says Dr. Flanders, SHM’s immediate past president.
Also speaking at the briefing were Project BOOST principal investigator Mark Williams, MD, FHM, chief of the division of hospital medicine at Northwestern University’s Feinberg School of Medicine in Chicago, and representatives of the national Blue Cross/Blue Shield Association and the American Hospital Association, who discussed other initiatives that have successfully targeted the hospital readmission problem. “Not all readmissions are preventable. Some are necessary and important,” Dr. Flanders says, adding that the challenge is to distinguish between the necessary and the avoidable.
While there are no current legislative proposals involving Project BOOST, the initiative is aligned with a number of provisions aimed at reducing readmissions and improving care transitions, which are contained in the Patient Protection and Affordable Care Act passed in March. “Given the costs of readmissions, directly supporting demonstration projects like this would be a wise investment in improving healthcare quality,” says Dr. Flanders, adding that he heard suggestions at the briefing that the Centers for Medicare & Medicaid Services’ (CMS) Center for Innovation should consider supporting initiatives like BOOST.
Dr. Share, who calls payor support for the BOOST collaboration an example of its incentive programs with physician groups, says hospitalists are essential to partnerships with other providers, including PCPs, and the systems improvements necessary in the hospital setting.
“We’re actually bridging the gap between the hospital and the medical office,” he says. TH
Advocates for SHM’s Project BOOST (Better Outcomes for Older Adults through Safe Transitions) presented a standing-room-only policy briefing June 8 on Capitol Hill to explain an innovative quality-improvement (QI) initiative and new collaboration with Blue Cross Blue Shield of Michigan (BCBSM) to increase patient safety and reduce preventable hospital readmissions.
“The room was packed,” says David Share, MD, BCBSM’s executive medical director for healthcare quality. About 60 people were in attendance, mostly House and Senate legislative aides, along with a few representatives of third-party health organizations. Dr. Share, one of the presenters, says many of the staffers were well aware of the challenges of hospital-based practice. “I would say the crowd was remarkably attentive during our presentation,” he says.
SHM developed BOOST in 2008 to help hospitals and hospitalists systematically improve discharge processes through evidence-based interventions, management tools and resources, and expert mentoring. In January, BOOST was implemented in 15 Michigan hospitals with financial support from BCBSM. A 20-hospital partnership with the California HealthCare Foundation was announced in April, and more than 60 hospitals in 24 states now participate.
“These legislative staffers, who are responsible for crafting health-reform legislation, were given an in-depth understanding of how the provider community can take ownership of the challenges of transforming systems of care,” Dr. Share says. “I hope what they learned was that when payors … establish incentives for providers to transform healthcare systems, providers can do that very creatively and effectively in ways that affect patient care, patient well-being, and patient outcomes—both in terms of quality and cost.”
Hospitalist Scott Flanders, MD, SFHM, professor of medicine and director of the inpatient program at the University of Michigan in Ann Arbor, also spoke at the briefing. “I think our Michigan collaborative is a nice example of a local, provider-based, payor-supported quality initiative that will tackle an important problem and lead to a lot of collaboration and learning,” says Dr. Flanders, SHM’s immediate past president.
Also speaking at the briefing were Project BOOST principal investigator Mark Williams, MD, FHM, chief of the division of hospital medicine at Northwestern University’s Feinberg School of Medicine in Chicago, and representatives of the national Blue Cross/Blue Shield Association and the American Hospital Association, who discussed other initiatives that have successfully targeted the hospital readmission problem. “Not all readmissions are preventable. Some are necessary and important,” Dr. Flanders says, adding that the challenge is to distinguish between the necessary and the avoidable.
While there are no current legislative proposals involving Project BOOST, the initiative is aligned with a number of provisions aimed at reducing readmissions and improving care transitions, which are contained in the Patient Protection and Affordable Care Act passed in March. “Given the costs of readmissions, directly supporting demonstration projects like this would be a wise investment in improving healthcare quality,” says Dr. Flanders, adding that he heard suggestions at the briefing that the Centers for Medicare & Medicaid Services’ (CMS) Center for Innovation should consider supporting initiatives like BOOST.
Dr. Share, who calls payor support for the BOOST collaboration an example of its incentive programs with physician groups, says hospitalists are essential to partnerships with other providers, including PCPs, and the systems improvements necessary in the hospital setting.
“We’re actually bridging the gap between the hospital and the medical office,” he says. TH
The Coming Challenges—and Opportunities—of Value-Based Purchasing
The Coming Challenges—and Opportunities—of Value-Based Purchasing
The Patient Protection and Affordable Care Act was signed into law in March, furthering the federal government’s commitment to increasing the efficiency of the U.S. healthcare system by decreasing cost and improving quality. An expansion of the “value-based purchasing” model, this law mandates that ratings and reimbursements to physicians and hospitals be increasingly tied to measured quality of care.
In this system, a physician’s quality profile will be determined by a variety of factors, including reported quality data, severity-adjusted clinical outcome measures, patient-safety indicators, and hospital-acquired conditions (HACs). Since all of these are, to a large extent, documentation issues, physicians are now forced to pay close attention to how they identify and describe diagnoses and procedures.
Medicare will, in effect, attempt to determine: “Did the clinical team correctly identify and appropriately treat all relevant patient conditions—without causing any adverse conditions—and do so safely, efficiently, and with good outcomes?”
The patient chart must “tell the story” of the episode of care in the hospital. It must accurately describe all of the patient’s conditions and demonstrate the complexity of medical decision-making and establishment of risk. Upon discharge, this risk must “match up” with the diagnoses that are being coded and the Medicare Severity Diagnostic Related Group (MS-DRGs) being assigned. Often, the information is present in the chart but is inconsistent from provider to provider, or documented in a way that is misunderstood by hospital coders.
If successful in improving our documentation skills, the reward will be a higher rating and increased reimbursement.
Medicare also is ramping up its claims denial and recovery business to help “clean up” the system. This includes the national rollout of the Recovery Audit Contactor (RAC) initiative (see “Attention to Detail,” April 2010, p. 1), as well as the new Medicare administrative contractors (MACs). Both rely on accurate documentation. The RACs will penalize hospitals and physicians financially for documentation lacking in specificity and accuracy; the MACs will deny payment for claims erroneously submitted (technical errors) or lacking documentation of medical necessity.
What makes many physicians even more uncomfortable in this new environment is that Medicare is striving to better align the priorities and financial incentives of hospitals and physicians. Alliances between the two are strongly encouraged through such programs as the Acute Care Episode (ACE) Demonstration Project (the precursor to hospital-physician bundled payments), and the establishment of accountable care organizations (ACOs).
This emerging environment presents a unique set of challenges and opportunities to HM groups. Hospitalists are historically more aligned with hospital administrations, as compared with most other specialties. Hospitalists also are asked to participate in the care of an increasingly large percentage of patients across all specialties. This could well be an opportunity to be rewarded for embracing both of these trends.
Hospitalists are uniquely positioned to function as the documentation improvement clinical team leaders, working closely with other physicians across all specialties and the administration to fulfill all documentation requirements—and to be rewarded for doing so. Though hospitalists should have a general understanding of the language and rules of documentation, a system must be in place that helps them identify and capture all the pertinent aspects of the medical record without the need to become coders themselves. To this end, a clinical documentation improvement (CDI) program is critical.
But it might not be enough.
What is needed is a clinical integration program, an enhancement of traditional CDI. This approach requires participation from ED physicians, along with clinical integration specialists, to document accurately and completely from the start. The clinical integration specialist ensures that medical necessity for inpatient admission and patient risk is being addressed and established, conditions are appropriately identified as being present on admission (POA), and all diagnoses are properly recognized and documented thoroughly and accurately. Clinical integration through collaborative documentation then continues throughout the hospitalization, with diagnostic authority and oversight from the hospitalist, all the way through discharge.
Hospitalists should welcome and champion this type of program. As documentation becomes the key to survival, a complete medical record will stand up to any and all scrutiny by Medicare or others.
As for the negatives, there are none.
Andrew H. Dombro, MD, national medical director, and Paul Weygandt, MD, JD, vice president of physician services, J.A. Thomas & Associates, Atlanta
Join the Club
Every year, hospitalists across the country receive SHM membership renewal notices in the mail. For the vast majority of them, the decision to renew is an easy one.
For the others, hospitalist Mike Hawkins, MD, FACP, FHM, recommends a tried-and-true approach in the field: Evaluate the risk-to-benefit ratio.
“As they say in medicine, the risk-to-benefit ratio is a no-brainer,” says Dr. Hawkins, the Southeast region medical director for Brentwood, Tenn.-based Cogent Healthcare.
Dr. Hawkins should know about membership benefits; he’s been an SHM member since 1996. In fact, he was one of the first 200 members of SHM’s original incarnation, the National Association of Inpatient Physicians. He joined for the resources that helped his new hospitalist program grow and for the access to people who were doing the same thing he was in his hospital. He also recognized the potential for networking and the sharing of ideas from such industry leaders as Bob Wachter, MD, MHM, and John Nelson, MD, MHM.
Since then, the membership benefits that Dr. Hawkins and more than 10,000 other hospitalists receive have evolved along with their careers and the specialty as a whole.
SHM membership and the HM specialty have become nearly synonymous to most hospitalists. “I can’t imagine a true hospitalist that wouldn’t be an SHM member,” Dr. Hawkins says. “Most of the hospitalists on my teams are members. As a company, we strongly encourage our physicians to be SHM members.”
Membership: The Basics
Hawkins’ enthusiasm for becoming an SHM member is no surprise to Todd Von Deak, MBA, CAE, vice president of operations and general manager for SHM.
“Thousands of hospitalists join SHM for the many tangible benefits like discounts or subscriptions to the Journal of Hospital Medicine and The Hospitalist,” Von Deak says.
As SHM has evolved, so have the benefits it offers to members. The original society publication sent to members was only four pages; today, members receive both The Hospitalist and the Journal of Hospital Medicine, one of the top peer-reviewed journals in healthcare—and the only peer-reviewed journal for HM.
A Hospitalist Voice on Capitol Hill

With the critical role that hospitals play in healthcare reform, members of Congress and others in Washington are eager to hear from experts like hospitalists. In May, members of SHM’s Public Policy Committee took their message directly to members of Congress. Hospitalists engaged in a series of one-on-one meetings with legislators, relating their personal experiences in patient care and QI to the continued public dialogue over healthcare reform.
In early June, SHM past president Scott Flanders, MD, SFHM, along with representatives of Blue Cross Blue Shield Michigan and the American Hospital Association, conducted a briefing with about 50 legislative aides. The briefing was intended to educate members of Congress and their staffs about Project BOOST and the need to reduce unplanned readmissions.
“Hospitalists bring a very important perspective to the policy conversation about improving healthcare in America,” says Eric Siegal, MD, SFHM, an SHM board member and former chair of the Public Policy Committee. “SHM helps to facilitate that conversation.”
Even if they can’t make it to Washington, SHM members can stay on top of the issues affecting them and make their opinions known, Dr. Siegal says. Members can use SHM’s Legislative Action Center in the advocacy section of www.hospitalmedicine.org to learn more about current legislation and activities by the members of Congress in their area. The Legislative Action Center also makes contacting members of Congress easy by supplying contact information and tips for effective outreach.
“This is an important time to be a hospitalist,” Siegal says. “As a unified society, we can influence decisions that will shape healthcare for decades to come.”
The evolution of services to members has helped members establish credibility with their peers. Last year, SHM introduced the Fellow in Hospital Medicine designation to its members. This year, it expanded the fellowship program to include the new Senior Fellow in Hospital Medicine and the Master in Hospital Medicine programs.
“Many of our members are younger than the average physician, and in an emerging specialty,” Von Deak says. “That’s why so many of SHM’s benefits help members to establish themselves within healthcare. Our fellowship program has only been around for two years and we’ve already inducted nearly 1,000 members.”
The products and events—all offered to members at reduced rates—have all grown with SHM and its members. This year’s annual meeting attracted more than 2,500 of the most dedicated hospitalists from around the world.
Eugene Chu, MD, FHM, hospitalist and director of hospital medicine at the Denver Health Medical Center, remembers when he first joined SHM eight years ago. At the time, he says the member discount for the annual meeting was one of the deciding factors. “Financially, it made a lot of sense. The meeting discount and the member fee were close,” he says. “I’m glad it did, as SHM has offered a lot of additional benefits since then.”
Join the Movement
Over time, Dr. Chu found that the discounts for events and products were just the beginning. He now sees value in the energy that SHM brings to its members.
“Being a member brings you into the community of hospitalists,” he says. “It’s hard to quantify, but every time I come back from the spring meeting, I come back really charged up and enthusiastic about where hospital medicine is going.”
Dr. Chu isn’t alone. Many hospitalists become SHM members for financial reasons but end up renewing for the intangibles, Von Deak says.
“As members, they discover a lot more: the ability to network with peers in a growing specialty, a unified voice on critical issues, and, above all, the feeling that they are part of a real movement made up of dedicated professionals just like them,” Von Deak says.
The movement is equal parts human capital and mission. In recent years, SHM members and leadership have created new quality-improvement (QI) programs that have benefited hospitals and patients alike. The Project BOOST (Better Outcomes for Older Adults through Safer Transitions) initiative, for example, is helping more than 60 hospitals improve their discharge processes. Programs like Project BOOST, which was created in 2008, have raised the profiles of both SHM and its members within hospitals and all of healthcare.
SHM members also have ample opportunities for leadership development; like the movement, those opportunities go beyond HM. SHM’s online resource centers and mentored QI programs bring the very best of the specialty to aspiring hospitalist leaders in hospitals across the country.
For Aziz Ansari, DO, an assistant professor in hospital medicine and associate director for Loyola University Medical Center’s hospital medicine practice in Chicago, joining SHM was part of the natural progression in his career. He became an SHM member near the end of his first year as a hospitalist. Since then, Ansari’s appreciation of SHM membership has changed.
“As I progressed into leadership positions in hospital medicine, I found that the society brings credibility to the specialty,” Dr. Ansari explains. “To be established, the society needs members.”
Dr. Ansari can’t imagine not being an active member. “In fact, I haven’t met a nonmember who is as invested in their career and the specialty as SHM’s members are,” he says. TH
Brendon Shank is a freelance writer based in Philadelphia.
Every year, hospitalists across the country receive SHM membership renewal notices in the mail. For the vast majority of them, the decision to renew is an easy one.
For the others, hospitalist Mike Hawkins, MD, FACP, FHM, recommends a tried-and-true approach in the field: Evaluate the risk-to-benefit ratio.
“As they say in medicine, the risk-to-benefit ratio is a no-brainer,” says Dr. Hawkins, the Southeast region medical director for Brentwood, Tenn.-based Cogent Healthcare.
Dr. Hawkins should know about membership benefits; he’s been an SHM member since 1996. In fact, he was one of the first 200 members of SHM’s original incarnation, the National Association of Inpatient Physicians. He joined for the resources that helped his new hospitalist program grow and for the access to people who were doing the same thing he was in his hospital. He also recognized the potential for networking and the sharing of ideas from such industry leaders as Bob Wachter, MD, MHM, and John Nelson, MD, MHM.
Since then, the membership benefits that Dr. Hawkins and more than 10,000 other hospitalists receive have evolved along with their careers and the specialty as a whole.
SHM membership and the HM specialty have become nearly synonymous to most hospitalists. “I can’t imagine a true hospitalist that wouldn’t be an SHM member,” Dr. Hawkins says. “Most of the hospitalists on my teams are members. As a company, we strongly encourage our physicians to be SHM members.”
Membership: The Basics
Hawkins’ enthusiasm for becoming an SHM member is no surprise to Todd Von Deak, MBA, CAE, vice president of operations and general manager for SHM.
“Thousands of hospitalists join SHM for the many tangible benefits like discounts or subscriptions to the Journal of Hospital Medicine and The Hospitalist,” Von Deak says.
As SHM has evolved, so have the benefits it offers to members. The original society publication sent to members was only four pages; today, members receive both The Hospitalist and the Journal of Hospital Medicine, one of the top peer-reviewed journals in healthcare—and the only peer-reviewed journal for HM.
A Hospitalist Voice on Capitol Hill
With the critical role that hospitals play in healthcare reform, members of Congress and others in Washington are eager to hear from experts like hospitalists. In May, members of SHM’s Public Policy Committee took their message directly to members of Congress. Hospitalists engaged in a series of one-on-one meetings with legislators, relating their personal experiences in patient care and QI to the continued public dialogue over healthcare reform.
In early June, SHM past president Scott Flanders, MD, SFHM, along with representatives of Blue Cross Blue Shield Michigan and the American Hospital Association, conducted a briefing with about 50 legislative aides. The briefing was intended to educate members of Congress and their staffs about Project BOOST and the need to reduce unplanned readmissions.
“Hospitalists bring a very important perspective to the policy conversation about improving healthcare in America,” says Eric Siegal, MD, SFHM, an SHM board member and former chair of the Public Policy Committee. “SHM helps to facilitate that conversation.”
Even if they can’t make it to Washington, SHM members can stay on top of the issues affecting them and make their opinions known, Dr. Siegal says. Members can use SHM’s Legislative Action Center in the advocacy section of www.hospitalmedicine.org to learn more about current legislation and activities by the members of Congress in their area. The Legislative Action Center also makes contacting members of Congress easy by supplying contact information and tips for effective outreach.
“This is an important time to be a hospitalist,” Siegal says. “As a unified society, we can influence decisions that will shape healthcare for decades to come.”
The evolution of services to members has helped members establish credibility with their peers. Last year, SHM introduced the Fellow in Hospital Medicine designation to its members. This year, it expanded the fellowship program to include the new Senior Fellow in Hospital Medicine and the Master in Hospital Medicine programs.
“Many of our members are younger than the average physician, and in an emerging specialty,” Von Deak says. “That’s why so many of SHM’s benefits help members to establish themselves within healthcare. Our fellowship program has only been around for two years and we’ve already inducted nearly 1,000 members.”
The products and events—all offered to members at reduced rates—have all grown with SHM and its members. This year’s annual meeting attracted more than 2,500 of the most dedicated hospitalists from around the world.
Eugene Chu, MD, FHM, hospitalist and director of hospital medicine at the Denver Health Medical Center, remembers when he first joined SHM eight years ago. At the time, he says the member discount for the annual meeting was one of the deciding factors. “Financially, it made a lot of sense. The meeting discount and the member fee were close,” he says. “I’m glad it did, as SHM has offered a lot of additional benefits since then.”
Join the Movement
Over time, Dr. Chu found that the discounts for events and products were just the beginning. He now sees value in the energy that SHM brings to its members.
“Being a member brings you into the community of hospitalists,” he says. “It’s hard to quantify, but every time I come back from the spring meeting, I come back really charged up and enthusiastic about where hospital medicine is going.”
Dr. Chu isn’t alone. Many hospitalists become SHM members for financial reasons but end up renewing for the intangibles, Von Deak says.
“As members, they discover a lot more: the ability to network with peers in a growing specialty, a unified voice on critical issues, and, above all, the feeling that they are part of a real movement made up of dedicated professionals just like them,” Von Deak says.
The movement is equal parts human capital and mission. In recent years, SHM members and leadership have created new quality-improvement (QI) programs that have benefited hospitals and patients alike. The Project BOOST (Better Outcomes for Older Adults through Safer Transitions) initiative, for example, is helping more than 60 hospitals improve their discharge processes. Programs like Project BOOST, which was created in 2008, have raised the profiles of both SHM and its members within hospitals and all of healthcare.
SHM members also have ample opportunities for leadership development; like the movement, those opportunities go beyond HM. SHM’s online resource centers and mentored QI programs bring the very best of the specialty to aspiring hospitalist leaders in hospitals across the country.
For Aziz Ansari, DO, an assistant professor in hospital medicine and associate director for Loyola University Medical Center’s hospital medicine practice in Chicago, joining SHM was part of the natural progression in his career. He became an SHM member near the end of his first year as a hospitalist. Since then, Ansari’s appreciation of SHM membership has changed.
“As I progressed into leadership positions in hospital medicine, I found that the society brings credibility to the specialty,” Dr. Ansari explains. “To be established, the society needs members.”
Dr. Ansari can’t imagine not being an active member. “In fact, I haven’t met a nonmember who is as invested in their career and the specialty as SHM’s members are,” he says. TH
Brendon Shank is a freelance writer based in Philadelphia.
In the Literature
In This Edition
Literature at a Glance
A guide to this month’s studies
- Risk factors for iatrogenic pneumothorax
- Residency acceptance and use of pharmaceutical industry funding
- Early cholecystectomy outcomes for gallstone pancreatitis
- Use of microbial DNA in sepsis
- Adding rifampicin to vancomycin in MRSA pneumonia
- Rate and outcomes of culture-negative severe sepsis
- Rates of surgical comanagement in U.S. hospitals
- Probiotics and rates of ventilator-associated pneumonia
Ultrasound Guidance and Operator Experience Decrease Risk of Pneumothorax Following Thoracentesis
Clinical question: How often does pneumothorax happen following thoracentesis, and what factors are associated with increased risk of this complication?
Background: Procedural complications are an important source of adverse events in the hospital. Iatrogenic pneumothorax after thoracentesis results in increased hospital length of stay, morbidity, and mortality. Large variation exists in reported pneumothorax rates, and little is known about procedure- and patient-specific factors associated with development of this complication.
Study design: Systematic review and meta-analysis.
Setting: Review of 24 MEDLINE-indexed studies from January 1966 to April 2009.
Synopsis: A total of 349 pneumothoraces were reported after 6,605 thoracenteses (overall incidence 6.0%). Chest-tube insertion was required in 34.1% of the cases. Risk for pneumothorax was significantly higher when larger needles or catheters were used compared with needles smaller than 20-gauge (odds ratio 2.5, 95% confidence interval [CI], 1.1-6.0) and after therapeutic thoracentesis compared with diagnostic procedures (OR 2.6, 95% CI, 1.8-3.8).
Procedures requiring two or more needle passes did not significantly increase pneumothorax risk (OR 2.5, 95% CI, 0.3-20.1). In contrast, pneumothorax rates were significantly lower when using ultrasound guidance (OR 0.3, 95% CI, 0.2-0.7) and with experienced operators (3.9% vs. 8.5%, P=0.04).
Examining patient risk factors, pneumothorax rates were similar regardless of effusion size and patient gender. Additionally, rates were similar among non-ICU inpatients, ICU inpatients, and outpatients. Data did show a trend toward increased risk of pneumothorax with mechanical ventilation (OR 4.0, 95% CI, 0.95-16.8), although no study directly compared rates in ICU patients with and without mechanical ventilation.
Bottom line: Ultrasound guidance is a modifiable factor that decreases the risk of post-thoracentesis pneumothorax. Pneumothorax rates are lower when performed by experienced clinicians, providing an important opportunity to reduce procedure-related complications by increasing direct trainee supervision.
Citation: Gordon CE, Feller-Kopman D, Balk EM, Smetana GW. Pneumothorax following thoracentesis: a systematic review and meta-analysis. Arch Intern Med. 2010;170(4):332-339.
Pharmaceutical Industry Support Is Common in U.S. Internal-Medicine Residency Programs
Clinical question: What are the current attitudes of program directors regarding pharmaceutical industry support of internal-medicine residency activities? What are the potential associations between program characteristics and acceptance of industry support?
Background: Increasing evidence suggests that interactions with the pharmaceutical industry influence physician attitudes and practices. Recently, the Association of American Medical Colleges (AAMC) proposed that academic medical centers prohibit the acceptance of all gifts and restrict access by pharmaceutical industry representatives.
Study design: Survey of U.S. internal-medicine residency program directors.
Setting: Web-based survey of residency program directors in 388 U.S. internal-medicine residency programs.
Synopsis: Of the 236 program directors responding to the survey, 132 (55.9%) reported accepting some kind of support from the pharmaceutical industry. Support was most commonly provided in the form of food for conferences (90.9%), educational materials (83.3%), office supplies (68.9%), and drug samples (57.6%).
When programs reported accepting pharmaceutical industry support, 67.9% cited a lack of other funding sources as the reason for acceptance. Only 22.7% of programs with a program director who thinks pharmaceutical support is unacceptable actually accepted industry support. The likelihood of accepting support was associated with location in the Southern U.S. and was inversely associated with the three-year rolling American Board of Internal Medicine (ABIM) pass rates (each 1% decrease in the pass rate was associated with a 21% increase in the odds of accepting pharmaceutical industry support).
Bottom line: While most program directors did not find pharmaceutical industry support desirable, more than half reported acceptance of such support, with most citing lack of other funding resources as the reason for acceptance.
Citation: Loertscher LL, Halvorsen AJ, Beasley BW, Holmboe ES, Kolars JC, McDonald FS. Pharmaceutical industry support and residency education: a survey of internal medicine program directors. Arch Intern Med. 2010;170(4):356-362.
Early Cholecystectomy Safely Decreases Hospital Stay in Patients with Mild Gallstone Pancreatitis
Clinical question: Can laparoscopic cholecystectomy performed within 48 hours of admission for mild gallstone pancreatitis reduce hospital length of stay without increasing perioperative complications?
Background: Although there is a clear consensus that patients who present with gallstone pancreatitis should undergo cholecystectomy to prevent recurrence, precise timing of surgery remains controversial.
Study design: Randomized prospective trial.
Setting: Harbor-UCLA Medical Center, a Los Angeles County public teaching hospital and Level I trauma center.
Synopsis: Patients were prospectively randomized to an early group and a control group. Inclusion criteria consisted of adults from the ages of 18 to 100 with mild gallstone pancreatitis and three or fewer Ranson criteria. The primary endpoint was length of hospital stay. The secondary endpoint was a composite of complications, including the need for conversion to open cholecystectomy, readmission within 30 days, bleeding requiring transfusion, bile duct injury, or wound infection.
The study was terminated after 50 patients, as there was a difference in the length of hospital stay with a predefined alpha level of 0.005. Patients in the early group were taken to the operating room at a mean of 35.1 hours after admission, compared with 77.8 hours in the control group. The overall length of hospital stay was shorter in the early group (mean 3.5 days, 95% CI, 2.7-4.3), compared with the control group (mean 5.8, 95% CI, 3.8-7.9). All cholecystectomies were completed laparoscopically, without conversion to open. No statistically significant difference existed in secondary endpoints (P=0.48, OR 1.66, 95% CI, 0.41-6.78).
Bottom line: Laparoscopic cholecystectomy performed within 48 hours of admission, irrespective of normalization of laboratory values or clinical progress, safely decreases the overall length of stay, compared with delaying laparoscopic cholecystectomy until laboratory values and clinical condition normalize.
Citation: Aboulian A, Chan T, Yaghoubian A, et al. Early cholecystectomy safely decreases hospital stay in patients with mild gallstone pancreatitis: a randomized prospective study. Ann Surg. 2010;251(4): 615-619.
Presence of Microbial DNA in Blood Correlates with Disease Severity
Clinical question: Is the presence of microbial DNA in the blood associated with disease severity in severe sepsis, and how does detection of this microbial DNA by polymerase chain reaction (PCR) compare with blood cultures (BC)?
Background: Inadequate antibiotic therapy is a strong and independent predictor of poor outcomes in sepsis. Diagnostic uncertainty regarding the causative micro-organism is compensated for by liberal use of broad-spectrum antibiotics. As a result, resistance to antibiotics is an increasing public-health problem.
Study design: Prospective multicenter controlled observational study.
Setting: Three ICUs in Germany and France.
Synopsis: From 2005 to 2007, 63 patients were enrolled in the control group and 142 patients were enrolled in the sepsis group. In control patients, blood cultures and specimens were drawn daily at a maximum of three days after admission. In the sepsis group, blood samples were obtained on the day severe sepsis was suspected. Consecutive samples for the next two days after study inclusion were taken.
Taking BC as the laboratory comparison method, the sensitivity of PCR to detect culture-positive bacteremia in sepsis was 0.80 with a specificity of 0.77. PCR detected 29 of 41 microorganisms (70.3%) found in the BC. The highest recovery rate was observed for gram-negative bacteria (78.6%), fungi (50.0%), and gram-positive bacteria (47.6%). PCR from septic patients correlated well with markers of host response (IL-6 and PCT) and disease severity (SOFA score), even when the BC remained negative.
The appropriateness of antimicrobial therapy based on culture-based methods was not recorded, so it’s impossible to conclude whether or not the PCR would have contributed to a more effective therapy.
Bottom line: Concordance between BC and PCR is moderate in septic patients. PCR-based pathogen detection correlated with disease severity even if the BC remained negative, suggesting that the presence of microbial DNA in the bloodstream is a clinically significant event.
Citation: Bloos F, Hinder F, Becker K, et al. A multicenter trial to compare blood culture with polymerase chain reaction in severe human sepsis. Intensive Care Med. 2010;36(2):241-247.
Adding Rifampicin to Vancomycin Improves Outcomes in MRSA Pneumonia
Clinical question: Does adding rifampicin to vancomycin improve outcomes in patients with hospital-acquired MRSA pneumonia?
Background: Hospital-acquired MRSA pneumonia has a mortality of more than 20%. Vancomycin penetrates the lung tissue poorly. The value of adding rifampicin, an antibiotic with broad-spectrum coverage and good tissue penetration, was investigated.
Study design: Randomized open-label trial.
Setting: Medical ICU patients at Ulsan College of Medicine, Asan Medical Center, South Korea.
Synopsis: Patients older than 18 years of age with clinical symptoms suggestive of nosocomial pneumonia were randomized to receive vancomycin alone (V) or vancomycin plus rifampicin (VR). Clinicians could add additional antibiotics for gram-negative coverage as needed.
Of the 183 patients screened, 93 met the inclusion criteria and were randomized in a 1:1 ratio. MRSA infection was microbiologically confirmed. Clinical cure rate in VR patients was significantly greater at day 14 compared with the V group (53.7% vs. 31.0%, P=0.047) based on a modified intention-to-treat model. The overall mortality at day 28 did not significantly differ between the groups (22.0% vs. 38.1%, P=0.15), although the 60-day mortality was lower in the VR group (26.8% vs. 50.0%, P=0.042). Mortality from MRSA pneumonia had a trend toward a decrease in the VR group (14.7% vs. 28.6%, P=0.18).
The trial was limited because it was a single-site study and lacked statistical power to assess certain outcomes. Additionally, treatment protocols were not compared with other antimicrobial therapies.
Bottom line: Vancomycin plus rifampicin improves MRSA pneumonia outcomes in ICU patients.
Citation: Jung YJ, Koh Y, Hong SB, et al. Effect of vancomycin plus rifampicin in the treatment of nosocomial MRSA pneumonia. Crit Care Med. 2010;38(1):175-180.
Severe Sepsis Syndromes Are Not Always Caused by Bacteremia
Clinical question: What are the common causes of clinical sepsis?
Background: When sepsis is defined by systemic inflammatory response syndrome (SIRS) criteria, the etiology is not always infectious. Rapid initiation of antimicrobial therapy for infectious SIRS is a priority, but it could result in treating a significant number of patients who are not bacteremic.
Study design: Prospective secondary analysis of a registry of patients created to evaluate an institutional standard-of-care protocol.
Setting: Urban, 850-bed, tertiary-care teaching institution in North Carolina.
Synopsis: ED cases meeting the criteria for severe sepsis underwent a secondary review that looked at the cause of the sepsis. Only 45% of patients identified as having severe sepsis were blood-culture-positive during that episode of care. The culture-positive group was more likely to have central lines, malignancies, or reside in a nursing home.
Of the subgroup of culture-negative patients, 52% had another infectious etiology, most commonly pneumonia. Other “noninfectious mimics,” including inflammatory colitis, myocardial infarction, and pulmonary embolism, were noted in 32% of patients in the subgroup, and the cause was not identified in 16% of the patients.
In-hospital mortality was higher in the culture-positive group than in the culture-negative group (25% vs. 4%, P=0.05). There was no evidence of harm in patients with culture-negative sepsis treated for a systemic infection.
Bottom line: Many patients with a clinical picture of severe sepsis will not have positive blood cultures or an infectious etiology.
Citation: Heffner AC, Horton JM, Marchick MR, Jones AE. Etiology of illness in patients with severe sepsis admitted to the hospital from the emergency department. Clin Infect Dis. 2010;50(6):814-820.
Comanagement of Surgical Inpatients by Hospitalists Is Rapidly Expanding
Clinical question: What is the prevalence and nature of comanagement of surgical patients by medicine physicians?
Background: Comanagement of surgical patients is a common clinical role for hospitalists, but the relationship is not well characterized in the literature in terms of numbers of patients or types of physicians involved in this practice.
Study design: Retrospective cohort.
Setting: Cross-section of hospitals from a Medicare database.
Synopsis: During the study period, 35.2% of patients were comanaged by a medicine physician—23.7% by a generalist and 14% by a subspecialist. Cardiothoracic surgery patients were more likely to be comanaged by a subspecialist, whereas all other patients were more likely to be comanaged by a generalist.
Although subspecialist comanagement actually declined during the study period, overall comanagement increased from 33.3% in 1996 to 40.8% in 2006. This increase is entirely attributable to the increase in comanagement by hospitalists. Most of this growth occurred with orthopedic patients.
Patient factors associated with comanagement include advanced age, emergency admissions, and increasing comorbidities. Teaching hospitals had less comanagement, while midsize, nonteaching, and for-profit hospitals had more comanagement.
Bottom line: Comanagement of surgical patients by medicine physicians is a common and growing clinical relationship. Hospitalists are responsible for increasing numbers of comanaged surgical patients.
Citation: Sharma G, Kuo YF, Freeman J, Zhang DD, Goodwin JS. Comanagement of hospitalized surgical patients by medicine physicians in the United States. Arch Intern Med. 2010;170(4):363-368.
Probiotics Might Decrease Risk of Ventilator-Associated Pneumonia
Clinical question: Does the administration of probiotics decrease the incidence of ventilator-associated pneumonia in critically ill patients?
Background: Ventilator-associated pneumonia (VAP) is a major nosocomial infection in ICUs. Probiotics are thought to decrease colonization and, therefore, infection with serious hospital-acquired pathogens.
Study design: Meta-analysis of five randomized controlled trials.
Setting: ICU patients on mechanical ventilation for at least 24 hours.
Synopsis: Five trials met the inclusion criteria of comparing probiotics to placebo in critically ill patients on mechanical ventilation and reporting the outcome of VAP. Administration of probiotics decreased the incidence of VAP (odds ratio 0.61, 95% CI, 0.41-0.91) and colonization of the respiratory tract with Pseudomonas aeruginosa (OR 0.35, 95% CI, 0.13-0.93).
Length of ICU stay was decreased in the probiotic arm, although this effect was not statistically significant in all analyses. Probiotics had no effect on such outcomes as ICU mortality, in-hospital mortality, or duration of mechanical ventilation.
Bottom line: Probiotics might be an effective strategy to reduce the risk of VAP, even if they do not appear to impact such outcomes as mortality.
Citation: Siempos II, Ntaidou TK, Falagas ME. Impact of the administration of probiotics on the incidence of ventilator-associated pneumonia: a meta-analysis of randomized controlled trials. Crit Care Med. 2010;38(3):954-962. TH
PEDIATRIC HM LITERATURE
By Mark Shen, MD
Renal Ultrasound Identifies Children with High-Grade Vesicoureteral Reflux

Clinical question: What is the diagnostic accuracy of specific renal ultrasound (US) criterion for detection of vesicoureteral reflux (VUR)?
Background: Based on the paradigm that undetected and untreated VUR might lead to long-term complications, voiding cystography traditionally has been recommended for all young children with a first urinary tract infection (UTI). An increasing base of evidence suggests that antibiotic prophylaxis for low-grade VUR might be unnecessary. However, less-invasive methods of screening for high-grade reflux have not yet been identified.
Study design: Secondary analysis of data from a prior prospective study.
Setting: Nephrology department of a French teaching hospital.
Synopsis: One hundred seventeen children (0-16 years) with a UTI were included and underwent renal US and voiding cystography. Patients with a known uropathy or those who had received antibiotics within the past 48 hours were excluded. A generalized linear multilevel model was used to analyze the relationship between standardized renal US criterion and VUR.
Twenty-seven percent of children had VUR and 8% had high-grade VUR (grade ≥3). Pelvic, ureteral, and urinary tract dilatation were significantly associated with high-grade VUR. Ureteral dilatation offered the best combination of standardized criterion, sensitivity (75%), and specificity (88%).
Significant limitations of this study include the use of bag urine cultures and the lack of consensus-based US criterion for ureteral and pelvic dilatation. The authors appropriately caution that these renal US criteria do not identify all children with high-grade VUR and are merely one step toward an intermediate screening strategy for high-grade VUR in order to mitigate adverse effects of universal voiding cystography. Further validation of this work in a clinically representative population will be needed.
Bottom line: Ureteral dilatation accurately identifies children with high-grade VUR.
Citation: Leroy S, Vantalon S, Larakeb A, Ducou-Le-Pointe H, Bensman A. Vesicoureteral reflux in children with urinary tract infection: comparison of diagnostic accuracy of renal US criteria. Radiology. 2010;255(3):890-898.
In This Edition
Literature at a Glance
A guide to this month’s studies
- Risk factors for iatrogenic pneumothorax
- Residency acceptance and use of pharmaceutical industry funding
- Early cholecystectomy outcomes for gallstone pancreatitis
- Use of microbial DNA in sepsis
- Adding rifampicin to vancomycin in MRSA pneumonia
- Rate and outcomes of culture-negative severe sepsis
- Rates of surgical comanagement in U.S. hospitals
- Probiotics and rates of ventilator-associated pneumonia
Ultrasound Guidance and Operator Experience Decrease Risk of Pneumothorax Following Thoracentesis
Clinical question: How often does pneumothorax happen following thoracentesis, and what factors are associated with increased risk of this complication?
Background: Procedural complications are an important source of adverse events in the hospital. Iatrogenic pneumothorax after thoracentesis results in increased hospital length of stay, morbidity, and mortality. Large variation exists in reported pneumothorax rates, and little is known about procedure- and patient-specific factors associated with development of this complication.
Study design: Systematic review and meta-analysis.
Setting: Review of 24 MEDLINE-indexed studies from January 1966 to April 2009.
Synopsis: A total of 349 pneumothoraces were reported after 6,605 thoracenteses (overall incidence 6.0%). Chest-tube insertion was required in 34.1% of the cases. Risk for pneumothorax was significantly higher when larger needles or catheters were used compared with needles smaller than 20-gauge (odds ratio 2.5, 95% confidence interval [CI], 1.1-6.0) and after therapeutic thoracentesis compared with diagnostic procedures (OR 2.6, 95% CI, 1.8-3.8).
Procedures requiring two or more needle passes did not significantly increase pneumothorax risk (OR 2.5, 95% CI, 0.3-20.1). In contrast, pneumothorax rates were significantly lower when using ultrasound guidance (OR 0.3, 95% CI, 0.2-0.7) and with experienced operators (3.9% vs. 8.5%, P=0.04).
Examining patient risk factors, pneumothorax rates were similar regardless of effusion size and patient gender. Additionally, rates were similar among non-ICU inpatients, ICU inpatients, and outpatients. Data did show a trend toward increased risk of pneumothorax with mechanical ventilation (OR 4.0, 95% CI, 0.95-16.8), although no study directly compared rates in ICU patients with and without mechanical ventilation.
Bottom line: Ultrasound guidance is a modifiable factor that decreases the risk of post-thoracentesis pneumothorax. Pneumothorax rates are lower when performed by experienced clinicians, providing an important opportunity to reduce procedure-related complications by increasing direct trainee supervision.
Citation: Gordon CE, Feller-Kopman D, Balk EM, Smetana GW. Pneumothorax following thoracentesis: a systematic review and meta-analysis. Arch Intern Med. 2010;170(4):332-339.
Pharmaceutical Industry Support Is Common in U.S. Internal-Medicine Residency Programs
Clinical question: What are the current attitudes of program directors regarding pharmaceutical industry support of internal-medicine residency activities? What are the potential associations between program characteristics and acceptance of industry support?
Background: Increasing evidence suggests that interactions with the pharmaceutical industry influence physician attitudes and practices. Recently, the Association of American Medical Colleges (AAMC) proposed that academic medical centers prohibit the acceptance of all gifts and restrict access by pharmaceutical industry representatives.
Study design: Survey of U.S. internal-medicine residency program directors.
Setting: Web-based survey of residency program directors in 388 U.S. internal-medicine residency programs.
Synopsis: Of the 236 program directors responding to the survey, 132 (55.9%) reported accepting some kind of support from the pharmaceutical industry. Support was most commonly provided in the form of food for conferences (90.9%), educational materials (83.3%), office supplies (68.9%), and drug samples (57.6%).
When programs reported accepting pharmaceutical industry support, 67.9% cited a lack of other funding sources as the reason for acceptance. Only 22.7% of programs with a program director who thinks pharmaceutical support is unacceptable actually accepted industry support. The likelihood of accepting support was associated with location in the Southern U.S. and was inversely associated with the three-year rolling American Board of Internal Medicine (ABIM) pass rates (each 1% decrease in the pass rate was associated with a 21% increase in the odds of accepting pharmaceutical industry support).
Bottom line: While most program directors did not find pharmaceutical industry support desirable, more than half reported acceptance of such support, with most citing lack of other funding resources as the reason for acceptance.
Citation: Loertscher LL, Halvorsen AJ, Beasley BW, Holmboe ES, Kolars JC, McDonald FS. Pharmaceutical industry support and residency education: a survey of internal medicine program directors. Arch Intern Med. 2010;170(4):356-362.
Early Cholecystectomy Safely Decreases Hospital Stay in Patients with Mild Gallstone Pancreatitis
Clinical question: Can laparoscopic cholecystectomy performed within 48 hours of admission for mild gallstone pancreatitis reduce hospital length of stay without increasing perioperative complications?
Background: Although there is a clear consensus that patients who present with gallstone pancreatitis should undergo cholecystectomy to prevent recurrence, precise timing of surgery remains controversial.
Study design: Randomized prospective trial.
Setting: Harbor-UCLA Medical Center, a Los Angeles County public teaching hospital and Level I trauma center.
Synopsis: Patients were prospectively randomized to an early group and a control group. Inclusion criteria consisted of adults from the ages of 18 to 100 with mild gallstone pancreatitis and three or fewer Ranson criteria. The primary endpoint was length of hospital stay. The secondary endpoint was a composite of complications, including the need for conversion to open cholecystectomy, readmission within 30 days, bleeding requiring transfusion, bile duct injury, or wound infection.
The study was terminated after 50 patients, as there was a difference in the length of hospital stay with a predefined alpha level of 0.005. Patients in the early group were taken to the operating room at a mean of 35.1 hours after admission, compared with 77.8 hours in the control group. The overall length of hospital stay was shorter in the early group (mean 3.5 days, 95% CI, 2.7-4.3), compared with the control group (mean 5.8, 95% CI, 3.8-7.9). All cholecystectomies were completed laparoscopically, without conversion to open. No statistically significant difference existed in secondary endpoints (P=0.48, OR 1.66, 95% CI, 0.41-6.78).
Bottom line: Laparoscopic cholecystectomy performed within 48 hours of admission, irrespective of normalization of laboratory values or clinical progress, safely decreases the overall length of stay, compared with delaying laparoscopic cholecystectomy until laboratory values and clinical condition normalize.
Citation: Aboulian A, Chan T, Yaghoubian A, et al. Early cholecystectomy safely decreases hospital stay in patients with mild gallstone pancreatitis: a randomized prospective study. Ann Surg. 2010;251(4): 615-619.
Presence of Microbial DNA in Blood Correlates with Disease Severity
Clinical question: Is the presence of microbial DNA in the blood associated with disease severity in severe sepsis, and how does detection of this microbial DNA by polymerase chain reaction (PCR) compare with blood cultures (BC)?
Background: Inadequate antibiotic therapy is a strong and independent predictor of poor outcomes in sepsis. Diagnostic uncertainty regarding the causative micro-organism is compensated for by liberal use of broad-spectrum antibiotics. As a result, resistance to antibiotics is an increasing public-health problem.
Study design: Prospective multicenter controlled observational study.
Setting: Three ICUs in Germany and France.
Synopsis: From 2005 to 2007, 63 patients were enrolled in the control group and 142 patients were enrolled in the sepsis group. In control patients, blood cultures and specimens were drawn daily at a maximum of three days after admission. In the sepsis group, blood samples were obtained on the day severe sepsis was suspected. Consecutive samples for the next two days after study inclusion were taken.
Taking BC as the laboratory comparison method, the sensitivity of PCR to detect culture-positive bacteremia in sepsis was 0.80 with a specificity of 0.77. PCR detected 29 of 41 microorganisms (70.3%) found in the BC. The highest recovery rate was observed for gram-negative bacteria (78.6%), fungi (50.0%), and gram-positive bacteria (47.6%). PCR from septic patients correlated well with markers of host response (IL-6 and PCT) and disease severity (SOFA score), even when the BC remained negative.
The appropriateness of antimicrobial therapy based on culture-based methods was not recorded, so it’s impossible to conclude whether or not the PCR would have contributed to a more effective therapy.
Bottom line: Concordance between BC and PCR is moderate in septic patients. PCR-based pathogen detection correlated with disease severity even if the BC remained negative, suggesting that the presence of microbial DNA in the bloodstream is a clinically significant event.
Citation: Bloos F, Hinder F, Becker K, et al. A multicenter trial to compare blood culture with polymerase chain reaction in severe human sepsis. Intensive Care Med. 2010;36(2):241-247.
Adding Rifampicin to Vancomycin Improves Outcomes in MRSA Pneumonia
Clinical question: Does adding rifampicin to vancomycin improve outcomes in patients with hospital-acquired MRSA pneumonia?
Background: Hospital-acquired MRSA pneumonia has a mortality of more than 20%. Vancomycin penetrates the lung tissue poorly. The value of adding rifampicin, an antibiotic with broad-spectrum coverage and good tissue penetration, was investigated.
Study design: Randomized open-label trial.
Setting: Medical ICU patients at Ulsan College of Medicine, Asan Medical Center, South Korea.
Synopsis: Patients older than 18 years of age with clinical symptoms suggestive of nosocomial pneumonia were randomized to receive vancomycin alone (V) or vancomycin plus rifampicin (VR). Clinicians could add additional antibiotics for gram-negative coverage as needed.
Of the 183 patients screened, 93 met the inclusion criteria and were randomized in a 1:1 ratio. MRSA infection was microbiologically confirmed. Clinical cure rate in VR patients was significantly greater at day 14 compared with the V group (53.7% vs. 31.0%, P=0.047) based on a modified intention-to-treat model. The overall mortality at day 28 did not significantly differ between the groups (22.0% vs. 38.1%, P=0.15), although the 60-day mortality was lower in the VR group (26.8% vs. 50.0%, P=0.042). Mortality from MRSA pneumonia had a trend toward a decrease in the VR group (14.7% vs. 28.6%, P=0.18).
The trial was limited because it was a single-site study and lacked statistical power to assess certain outcomes. Additionally, treatment protocols were not compared with other antimicrobial therapies.
Bottom line: Vancomycin plus rifampicin improves MRSA pneumonia outcomes in ICU patients.
Citation: Jung YJ, Koh Y, Hong SB, et al. Effect of vancomycin plus rifampicin in the treatment of nosocomial MRSA pneumonia. Crit Care Med. 2010;38(1):175-180.
Severe Sepsis Syndromes Are Not Always Caused by Bacteremia
Clinical question: What are the common causes of clinical sepsis?
Background: When sepsis is defined by systemic inflammatory response syndrome (SIRS) criteria, the etiology is not always infectious. Rapid initiation of antimicrobial therapy for infectious SIRS is a priority, but it could result in treating a significant number of patients who are not bacteremic.
Study design: Prospective secondary analysis of a registry of patients created to evaluate an institutional standard-of-care protocol.
Setting: Urban, 850-bed, tertiary-care teaching institution in North Carolina.
Synopsis: ED cases meeting the criteria for severe sepsis underwent a secondary review that looked at the cause of the sepsis. Only 45% of patients identified as having severe sepsis were blood-culture-positive during that episode of care. The culture-positive group was more likely to have central lines, malignancies, or reside in a nursing home.
Of the subgroup of culture-negative patients, 52% had another infectious etiology, most commonly pneumonia. Other “noninfectious mimics,” including inflammatory colitis, myocardial infarction, and pulmonary embolism, were noted in 32% of patients in the subgroup, and the cause was not identified in 16% of the patients.
In-hospital mortality was higher in the culture-positive group than in the culture-negative group (25% vs. 4%, P=0.05). There was no evidence of harm in patients with culture-negative sepsis treated for a systemic infection.
Bottom line: Many patients with a clinical picture of severe sepsis will not have positive blood cultures or an infectious etiology.
Citation: Heffner AC, Horton JM, Marchick MR, Jones AE. Etiology of illness in patients with severe sepsis admitted to the hospital from the emergency department. Clin Infect Dis. 2010;50(6):814-820.
Comanagement of Surgical Inpatients by Hospitalists Is Rapidly Expanding
Clinical question: What is the prevalence and nature of comanagement of surgical patients by medicine physicians?
Background: Comanagement of surgical patients is a common clinical role for hospitalists, but the relationship is not well characterized in the literature in terms of numbers of patients or types of physicians involved in this practice.
Study design: Retrospective cohort.
Setting: Cross-section of hospitals from a Medicare database.
Synopsis: During the study period, 35.2% of patients were comanaged by a medicine physician—23.7% by a generalist and 14% by a subspecialist. Cardiothoracic surgery patients were more likely to be comanaged by a subspecialist, whereas all other patients were more likely to be comanaged by a generalist.
Although subspecialist comanagement actually declined during the study period, overall comanagement increased from 33.3% in 1996 to 40.8% in 2006. This increase is entirely attributable to the increase in comanagement by hospitalists. Most of this growth occurred with orthopedic patients.
Patient factors associated with comanagement include advanced age, emergency admissions, and increasing comorbidities. Teaching hospitals had less comanagement, while midsize, nonteaching, and for-profit hospitals had more comanagement.
Bottom line: Comanagement of surgical patients by medicine physicians is a common and growing clinical relationship. Hospitalists are responsible for increasing numbers of comanaged surgical patients.
Citation: Sharma G, Kuo YF, Freeman J, Zhang DD, Goodwin JS. Comanagement of hospitalized surgical patients by medicine physicians in the United States. Arch Intern Med. 2010;170(4):363-368.
Probiotics Might Decrease Risk of Ventilator-Associated Pneumonia
Clinical question: Does the administration of probiotics decrease the incidence of ventilator-associated pneumonia in critically ill patients?
Background: Ventilator-associated pneumonia (VAP) is a major nosocomial infection in ICUs. Probiotics are thought to decrease colonization and, therefore, infection with serious hospital-acquired pathogens.
Study design: Meta-analysis of five randomized controlled trials.
Setting: ICU patients on mechanical ventilation for at least 24 hours.
Synopsis: Five trials met the inclusion criteria of comparing probiotics to placebo in critically ill patients on mechanical ventilation and reporting the outcome of VAP. Administration of probiotics decreased the incidence of VAP (odds ratio 0.61, 95% CI, 0.41-0.91) and colonization of the respiratory tract with Pseudomonas aeruginosa (OR 0.35, 95% CI, 0.13-0.93).
Length of ICU stay was decreased in the probiotic arm, although this effect was not statistically significant in all analyses. Probiotics had no effect on such outcomes as ICU mortality, in-hospital mortality, or duration of mechanical ventilation.
Bottom line: Probiotics might be an effective strategy to reduce the risk of VAP, even if they do not appear to impact such outcomes as mortality.
Citation: Siempos II, Ntaidou TK, Falagas ME. Impact of the administration of probiotics on the incidence of ventilator-associated pneumonia: a meta-analysis of randomized controlled trials. Crit Care Med. 2010;38(3):954-962. TH
PEDIATRIC HM LITERATURE
By Mark Shen, MD
Renal Ultrasound Identifies Children with High-Grade Vesicoureteral Reflux
Clinical question: What is the diagnostic accuracy of specific renal ultrasound (US) criterion for detection of vesicoureteral reflux (VUR)?
Background: Based on the paradigm that undetected and untreated VUR might lead to long-term complications, voiding cystography traditionally has been recommended for all young children with a first urinary tract infection (UTI). An increasing base of evidence suggests that antibiotic prophylaxis for low-grade VUR might be unnecessary. However, less-invasive methods of screening for high-grade reflux have not yet been identified.
Study design: Secondary analysis of data from a prior prospective study.
Setting: Nephrology department of a French teaching hospital.
Synopsis: One hundred seventeen children (0-16 years) with a UTI were included and underwent renal US and voiding cystography. Patients with a known uropathy or those who had received antibiotics within the past 48 hours were excluded. A generalized linear multilevel model was used to analyze the relationship between standardized renal US criterion and VUR.
Twenty-seven percent of children had VUR and 8% had high-grade VUR (grade ≥3). Pelvic, ureteral, and urinary tract dilatation were significantly associated with high-grade VUR. Ureteral dilatation offered the best combination of standardized criterion, sensitivity (75%), and specificity (88%).
Significant limitations of this study include the use of bag urine cultures and the lack of consensus-based US criterion for ureteral and pelvic dilatation. The authors appropriately caution that these renal US criteria do not identify all children with high-grade VUR and are merely one step toward an intermediate screening strategy for high-grade VUR in order to mitigate adverse effects of universal voiding cystography. Further validation of this work in a clinically representative population will be needed.
Bottom line: Ureteral dilatation accurately identifies children with high-grade VUR.
Citation: Leroy S, Vantalon S, Larakeb A, Ducou-Le-Pointe H, Bensman A. Vesicoureteral reflux in children with urinary tract infection: comparison of diagnostic accuracy of renal US criteria. Radiology. 2010;255(3):890-898.