User login
Face Sheet and Provider Identification
Acute illness requiring hospitalization can be overwhelming for children and their families who are coping with illness and the synthesis of information from a variety of healthcare providers.[1] Patient and family centeredness is endorsed by the Institute of Medicine and the American Academy of Pediatrics[2, 3] as central to quality healthcare. In academic institutions, the presence of medical students and residents adds to the number of providers families encounter. In July 2011, the Accreditation Council for Graduate Medical Education implemented new duty hour restrictions, limiting first year residents to a maximum of 16 hour shifts.[4] Consequently, caregivers and patients may be in contact with more healthcare providers; this fractured care may confuse patients and caregivers, and increase dissatisfaction with care.[5]
The primary objective of our study was to determine the effect of a face sheet tool on the percentage of medical team members correctly identified by caregivers. The secondary objective was to determine the effect of a face sheet tool on the evaluation and satisfaction rating of the medical team by caregivers. We hypothesized that caregivers who receive the face sheet tool will correctly identify a greater percentage of team members by name and role and have higher overall satisfaction with their hospital stay.
METHODS
We performed a prospective controlled study on 2 general pediatric units at Cincinnati Children's Hospital Medical Center (CCHMC). Patients on the intervention unit received the face sheet tool, whereas the concurrent control unit maintained usual procedures. Both units have 24 beds and care for general pediatric patients primarily covered by 4 resident teams and the hospital medicine faculty. Two paired resident teams composed of 2 senior residents, 3 to 4 interns, and 4 medical students primarily admit to each general pediatric unit. Team members rotate through day and night shifts. All employees and rotating students are required to wear the hospital issued identification badge that includes their names, photos, credentials, and role. The study was conducted from November 1, 2011 to November 30, 2011.
Included patients were admitted to the study units by the usual protocol at our hospital, in which nurse patient‐flow coordinators determine bed assignments. We excluded families whose children had an inpatient hospital stay of 12 hours and families who did not speak English. All patient families scheduled to be discharged later in the day on weekday mornings from the 2 study units were approached for study participation. Families were not compensated for their participation.
A face sheet tool, which is a sheet of paper with pictures and names of the intervention team attendings, senior residents, interns, and medical students as well as a description of team member roles, was distributed to patients and their caregivers. The face sheet tools were created using Microsoft Publisher (Microsoft Corp., Redmond, WA). Neither families nor providers were blinded to the intervention, and the residents assumed responsibility for introducing the face sheet tool to families.
For our primary outcome measure, the research coordinator asked participating caregivers to match provider photographs with names and roles by placing laminated pictures backed with Velcro tape in the appropriate position on a laminated poster sheet. Initially, we collected overall accuracy of identification by name and role. In the second week, we began collecting specific data on the attending physician.
The satisfaction survey consisted of the American Board of Internal Medicine (ABIM) patient satisfaction questionnaire, composed of 10, 5‐point Likert scale questions,[6, 7] and an overall rating of hospital question, On a scale from 1 to 10, with 1 being the worst possible hospital and 10 being the best possible hospital, what number would you rate this hospital? from the Hospital Consumer Assessment of Health Plans Survey.[8] Questions were asked aloud and families responded to the questions orally. A written list was also provided to families. We collected data on length of stay (LOS) at the time of outcome assessment as well as previous hospitalizations.
Data Analysis
Differences between the intervention and control groups for relationship of survey respondent to child, prior hospitalization, and LOS were evaluated using the Fisher exact, 2, and 2‐sample t test, respectively. Hospital LOS was log‐transformed prior to analysis. The effect of the face sheet tool was evaluated by analyzing the differences between the intervention and control groups in the proportion of correctly identified names and roles using the Wilcoxon rank sum test and using the Fisher exact test for attending identification. Skewed Likert scale satisfaction ratings and overall hospital ratings were dichotomized at the highest score possible and analyzed using the 2 test. An analysis adjusting for prior hospitalization and LOS was done using generalized linear models, with a Poisson link for the number of correctly identified names/roles and an offset for the number of names/roles given.
Our research was reviewed by the CCHMC institutional review board and deemed exempt.
RESULTS
A total of 96 families were approached for enrollment (50 in the intervention and 46 in the control). Of these, 86 families agreed to participate. Three families in the intervention group did not receive the face sheet tool and were excluded from analysis, leaving an analytic cohort of 83 (41 in intervention and 42 in control). Attending recognition by role was collected from 54 families (28 in intervention group and 26 in control group) and by name from 34 families (15 in intervention group and 19 in control group). Table 1 displays characteristics of each group. Among the 83 study participants, LOS at time of outcome assessment ranged from 0.4 to 12.0 days, and the number of medical team members that cared for these patients ranged from 3 to 14.
| Intervention, n=41 | Control, n=42 | P Valuea | |
|---|---|---|---|
| |||
| Relationship to patient | 0.67 | ||
| Mother | 33 (80%) | 35 (83%) | |
| Father | 5 (12%) | 6 (14%) | |
| Grandmother/legal guardian | 3 (7%) | 1 (2%) | |
| Prior hospitalization, yes | 12 (29%) | 24 (57%) | 0.01 |
| Length of stay (days) | 1.07 (0.861.34) | 1.32 (1.051.67) | 0.20 |
Families in the intervention group had a higher percentage of correctly identified members of the medical team by name and role as compared to the control group (Table 2). These findings remained significant after adjusting for LOS and prior hospitalization. In addition, in a subset of families with attending data available, more families accurately identified attending name and attending role in the intervention as compared to control group.
| Intervention | Control | P Valuea | |
|---|---|---|---|
| |||
| Medical team, proportion correctly identified: | N=41 | N=41 | |
| Medical team names | 25% (14, 58) | 11% (0, 25) | 0.01b |
| Medical team roles | 50% (37, 67) | 25% (12, 44) | 0.01b |
| Attending, correctly identified: | |||
| Attending's name | N=15 | N=19 | |
| 14 (93%), | 10 (53%), | 0.02c | |
| Attending's role | N=28 | N=26 | |
| 26 (93%) | 16 (62%) | 0.01 | |
| Patient satisfaction, best possible score for: | N=41 | N=42 | |
| Q1: Telling you everything, being truthful | 21 (51%) | 21 (50%) | 0.91 |
| Q2: Greeting you warmly, being friendly | 26 (63%) | 25 (60%) | 0.72 |
| Q3: Treating you like you're on the same level | 29 (71%) | 25 (60%) | 0.28 |
| Q4: Letting you tell your story, listening | 27 (66%) | 23 (55%) | 0.30 |
| Q5: Showing interest in you as a person | 26 (63%) | 23 (55%) | 0.42 |
| Q6: Warning your child during the physical exam | 21 (51%) | 21 (50%) | 0.91 |
| Q7: Discussing options, asking your opinion | 20 (49%) | 17 (40%) | 0.45 |
| Q8: Encouraging questions, answering clearly | 23 (56%) | 19 (45%) | 0.32 |
| Q9: Explaining what you need to know | 22 (54%) | 18 (43%) | 0.32 |
| Q10: Using words you can understand | 26 (63%) | 18 (43%) | 0.06 |
| Overall hospital rating | 27 (66%) | 26 (62%) | 0.71 |
No significant differences were noted between the groups when comparing all individual ABIM survey question scores or the overall hospital satisfaction rating (Table 2). Scores in both intervention and control groups were high in all categories.
DISCUSSION
Caregivers given the face sheet tool were better able to identify medical team members by name and role than caregivers in the control group. Previous studies have shown similar results.[9, 10] Families encountered a large number of providers (median of 8) during stays that were on average quite brief (median LOS of 23.6 hours). Despite the significant increase in caregivers' ability to identify providers, the effect was modest.
Our findings add to prior work on face sheet tools in pediatrics and internal medicine.[9, 10, 11] Our study occurred after the residency duty hour restrictions. We described the high number of providers that families encounter in this context. It is the first study to our knowledge to quantify the number of providers that families encounter after these changes and to report on how well families can identify these clinicians by name and role. Unlike other studies, satisfaction scores were not improved.[9] Potential reasons for this include: (1) caregiver knowledge of 2 to 4 key members of the team and not the whole team may be the primary driver of satisfaction, (2) caregiver activation or empowerment may be a more responsive measure than overall satisfaction, and (3) our satisfaction measures may have ceiling effects and/or be elevated in both groups by social desirability bias.
Our study highlights the need for further investigation of quality outcomes associated with residency work hour changes.[12, 13, 14] Specifically, exposure to large numbers of providers may hinder families from accurately identifying those entrusted with the care of their loved one. Of note, our research coordinator needed to present as many as 14 provider pictures to 1 family with a hospital stay of 24 hours. Large numbers of providers may create challenges in building rapport, ensuring effective communication and developing trust with families. We chose to evaluate identification of each team member by caregivers; our findings are suggestive of the need for alternative strategies. A more valuable intervention might target identification of key team members (eg, attending, primary intern, primary senior resident). A policy statement regarding transitions of care recommended the establishment of mechanisms to ensure patients and their families know who is responsible for their care.[15] Efforts toward achieving this goal are essential.
This study has several limitations. The study was completed at a single institution, and thus generalizability may be limited. Although the intervention and control units have similar characteristics, randomization did not occur at the patient level. The control group had significantly more patients who had greater than 1 admission compared to the intervention group. Patients enrolled in the study were from a weekday convenience sample; therefore, potential differences in results based on weekend admissions were unable to be assessed. The exclusion of nonEnglish‐speaking families could limit generalizability to this population. Social desirability bias may have elevated the scores in both groups. Providers tasked with the responsibility of introducing the face sheet tool to families did so in a nonstandardized way and may have interacted differently with families compared to the control team. Finally, our project's aim was focused on the effect of a face sheet tool on the identification and satisfaction rating of the medical team by caregivers. Truly family‐centered care would include efforts to improve families' knowledge of and satisfaction with all members of the healthcare team.
A photo‐based face sheet tool helped caregivers better identify their child's care providers by name and role in the hospital. Satisfaction scores were similar in both groups.
Acknowledgements
The authors thank the Pediatric Research in Inpatient Settings network, and specifically Drs. Karen Wilson and Samir Shah, for their assistance during a workshop at the Pediatric Hospital Medicine 2012 meeting in July 2012, during which a first draft of this manuscript was produced.
Disclosure: Nothing to report.
- , , , , . A child's admission to hospital: a qualitative study examining the experiences of parents. Intensive Care Med. 2005;31(9):1248–1254.
- Committee on Quality of Health Care in America. Institute of Medicine. Crossing the Quality Chasm: A New Health System for the 21st Century. Washington, DC: National Academy Press; 2001.
- Committee on Hospital Care and Institute for Patient‐ and Family‐Centered Care. Patient‐ and family‐centered care and the pediatrician's role. Pediatrics. 2012;129(2):394–404.
- , , . The new recommendations on duty hours from the ACGME Task Force. N Engl J Med. 2010;363(2):e3.
- , , , . Parental responses to involvement in rounds on a pediatric inpatient unit at a teaching hospital: a qualitative study. Acad Med. 2008;83(3):292–297.
- PSQ Project Co‐Investigators. Final Report on the Patient Satisfaction Questionnaire Project. Philadelphia, PA: American Board of Internal Medicine; 1989.
- , , , et al. Effect of multisource feedback on resident communication skills and professionalism: a randomized controlled trial. Arch Pediatr Adolesc Med. 2007;161(1):44–49.
- , , , , . Development, implementation, and public reporting of the HCAHPS survey. Med Care Res Rev. 2010;67(1):27–37.
- , , , . PHACES (Photographs of Academic Clinicians and Their Educational Status): a tool to improve delivery of family‐centered care. Acad Pediatr. 2010;10(2):138–145.
- , , , et al. Improving inpatients' identification of their doctors: use of FACE cards. Jt Comm J Qual Patient Saf. 2009;35(12):613–619.
- , . “Don't call me ‘mom’: how parents want to be greeted by their pediatrician. Clin Pediatr. 2009;48(7):720–722.
- , , , , , . Better rested, but more stressed? Evidence of the effects of resident work hour restrictions. Acad Pediatr. 2012;12(4):335–343.
- , , , et al. Pediatric residents' perspectives on reducing work hours and lengthening residency: a national survey. Pediatrics. 2012;130(1):99–107.
- , , , . Inpatient staffing within pediatric residency programs: work hour restrictions and the evolving role of the pediatric hospitalist. J Hosp Med. 2012;7(4):299–303.
- , , , et al. Transitions of Care Consensus policy statement: American College of Physicians, Society of General Internal Medicine, Society of Hospital Medicine, American Geriatrics Society, American College of Emergency Physicians, and Society for Academic Emergency Medicine. J Hosp Med. 2009;4(6):364–370.
Acute illness requiring hospitalization can be overwhelming for children and their families who are coping with illness and the synthesis of information from a variety of healthcare providers.[1] Patient and family centeredness is endorsed by the Institute of Medicine and the American Academy of Pediatrics[2, 3] as central to quality healthcare. In academic institutions, the presence of medical students and residents adds to the number of providers families encounter. In July 2011, the Accreditation Council for Graduate Medical Education implemented new duty hour restrictions, limiting first year residents to a maximum of 16 hour shifts.[4] Consequently, caregivers and patients may be in contact with more healthcare providers; this fractured care may confuse patients and caregivers, and increase dissatisfaction with care.[5]
The primary objective of our study was to determine the effect of a face sheet tool on the percentage of medical team members correctly identified by caregivers. The secondary objective was to determine the effect of a face sheet tool on the evaluation and satisfaction rating of the medical team by caregivers. We hypothesized that caregivers who receive the face sheet tool will correctly identify a greater percentage of team members by name and role and have higher overall satisfaction with their hospital stay.
METHODS
We performed a prospective controlled study on 2 general pediatric units at Cincinnati Children's Hospital Medical Center (CCHMC). Patients on the intervention unit received the face sheet tool, whereas the concurrent control unit maintained usual procedures. Both units have 24 beds and care for general pediatric patients primarily covered by 4 resident teams and the hospital medicine faculty. Two paired resident teams composed of 2 senior residents, 3 to 4 interns, and 4 medical students primarily admit to each general pediatric unit. Team members rotate through day and night shifts. All employees and rotating students are required to wear the hospital issued identification badge that includes their names, photos, credentials, and role. The study was conducted from November 1, 2011 to November 30, 2011.
Included patients were admitted to the study units by the usual protocol at our hospital, in which nurse patient‐flow coordinators determine bed assignments. We excluded families whose children had an inpatient hospital stay of 12 hours and families who did not speak English. All patient families scheduled to be discharged later in the day on weekday mornings from the 2 study units were approached for study participation. Families were not compensated for their participation.
A face sheet tool, which is a sheet of paper with pictures and names of the intervention team attendings, senior residents, interns, and medical students as well as a description of team member roles, was distributed to patients and their caregivers. The face sheet tools were created using Microsoft Publisher (Microsoft Corp., Redmond, WA). Neither families nor providers were blinded to the intervention, and the residents assumed responsibility for introducing the face sheet tool to families.
For our primary outcome measure, the research coordinator asked participating caregivers to match provider photographs with names and roles by placing laminated pictures backed with Velcro tape in the appropriate position on a laminated poster sheet. Initially, we collected overall accuracy of identification by name and role. In the second week, we began collecting specific data on the attending physician.
The satisfaction survey consisted of the American Board of Internal Medicine (ABIM) patient satisfaction questionnaire, composed of 10, 5‐point Likert scale questions,[6, 7] and an overall rating of hospital question, On a scale from 1 to 10, with 1 being the worst possible hospital and 10 being the best possible hospital, what number would you rate this hospital? from the Hospital Consumer Assessment of Health Plans Survey.[8] Questions were asked aloud and families responded to the questions orally. A written list was also provided to families. We collected data on length of stay (LOS) at the time of outcome assessment as well as previous hospitalizations.
Data Analysis
Differences between the intervention and control groups for relationship of survey respondent to child, prior hospitalization, and LOS were evaluated using the Fisher exact, 2, and 2‐sample t test, respectively. Hospital LOS was log‐transformed prior to analysis. The effect of the face sheet tool was evaluated by analyzing the differences between the intervention and control groups in the proportion of correctly identified names and roles using the Wilcoxon rank sum test and using the Fisher exact test for attending identification. Skewed Likert scale satisfaction ratings and overall hospital ratings were dichotomized at the highest score possible and analyzed using the 2 test. An analysis adjusting for prior hospitalization and LOS was done using generalized linear models, with a Poisson link for the number of correctly identified names/roles and an offset for the number of names/roles given.
Our research was reviewed by the CCHMC institutional review board and deemed exempt.
RESULTS
A total of 96 families were approached for enrollment (50 in the intervention and 46 in the control). Of these, 86 families agreed to participate. Three families in the intervention group did not receive the face sheet tool and were excluded from analysis, leaving an analytic cohort of 83 (41 in intervention and 42 in control). Attending recognition by role was collected from 54 families (28 in intervention group and 26 in control group) and by name from 34 families (15 in intervention group and 19 in control group). Table 1 displays characteristics of each group. Among the 83 study participants, LOS at time of outcome assessment ranged from 0.4 to 12.0 days, and the number of medical team members that cared for these patients ranged from 3 to 14.
| Intervention, n=41 | Control, n=42 | P Valuea | |
|---|---|---|---|
| |||
| Relationship to patient | 0.67 | ||
| Mother | 33 (80%) | 35 (83%) | |
| Father | 5 (12%) | 6 (14%) | |
| Grandmother/legal guardian | 3 (7%) | 1 (2%) | |
| Prior hospitalization, yes | 12 (29%) | 24 (57%) | 0.01 |
| Length of stay (days) | 1.07 (0.861.34) | 1.32 (1.051.67) | 0.20 |
Families in the intervention group had a higher percentage of correctly identified members of the medical team by name and role as compared to the control group (Table 2). These findings remained significant after adjusting for LOS and prior hospitalization. In addition, in a subset of families with attending data available, more families accurately identified attending name and attending role in the intervention as compared to control group.
| Intervention | Control | P Valuea | |
|---|---|---|---|
| |||
| Medical team, proportion correctly identified: | N=41 | N=41 | |
| Medical team names | 25% (14, 58) | 11% (0, 25) | 0.01b |
| Medical team roles | 50% (37, 67) | 25% (12, 44) | 0.01b |
| Attending, correctly identified: | |||
| Attending's name | N=15 | N=19 | |
| 14 (93%), | 10 (53%), | 0.02c | |
| Attending's role | N=28 | N=26 | |
| 26 (93%) | 16 (62%) | 0.01 | |
| Patient satisfaction, best possible score for: | N=41 | N=42 | |
| Q1: Telling you everything, being truthful | 21 (51%) | 21 (50%) | 0.91 |
| Q2: Greeting you warmly, being friendly | 26 (63%) | 25 (60%) | 0.72 |
| Q3: Treating you like you're on the same level | 29 (71%) | 25 (60%) | 0.28 |
| Q4: Letting you tell your story, listening | 27 (66%) | 23 (55%) | 0.30 |
| Q5: Showing interest in you as a person | 26 (63%) | 23 (55%) | 0.42 |
| Q6: Warning your child during the physical exam | 21 (51%) | 21 (50%) | 0.91 |
| Q7: Discussing options, asking your opinion | 20 (49%) | 17 (40%) | 0.45 |
| Q8: Encouraging questions, answering clearly | 23 (56%) | 19 (45%) | 0.32 |
| Q9: Explaining what you need to know | 22 (54%) | 18 (43%) | 0.32 |
| Q10: Using words you can understand | 26 (63%) | 18 (43%) | 0.06 |
| Overall hospital rating | 27 (66%) | 26 (62%) | 0.71 |
No significant differences were noted between the groups when comparing all individual ABIM survey question scores or the overall hospital satisfaction rating (Table 2). Scores in both intervention and control groups were high in all categories.
DISCUSSION
Caregivers given the face sheet tool were better able to identify medical team members by name and role than caregivers in the control group. Previous studies have shown similar results.[9, 10] Families encountered a large number of providers (median of 8) during stays that were on average quite brief (median LOS of 23.6 hours). Despite the significant increase in caregivers' ability to identify providers, the effect was modest.
Our findings add to prior work on face sheet tools in pediatrics and internal medicine.[9, 10, 11] Our study occurred after the residency duty hour restrictions. We described the high number of providers that families encounter in this context. It is the first study to our knowledge to quantify the number of providers that families encounter after these changes and to report on how well families can identify these clinicians by name and role. Unlike other studies, satisfaction scores were not improved.[9] Potential reasons for this include: (1) caregiver knowledge of 2 to 4 key members of the team and not the whole team may be the primary driver of satisfaction, (2) caregiver activation or empowerment may be a more responsive measure than overall satisfaction, and (3) our satisfaction measures may have ceiling effects and/or be elevated in both groups by social desirability bias.
Our study highlights the need for further investigation of quality outcomes associated with residency work hour changes.[12, 13, 14] Specifically, exposure to large numbers of providers may hinder families from accurately identifying those entrusted with the care of their loved one. Of note, our research coordinator needed to present as many as 14 provider pictures to 1 family with a hospital stay of 24 hours. Large numbers of providers may create challenges in building rapport, ensuring effective communication and developing trust with families. We chose to evaluate identification of each team member by caregivers; our findings are suggestive of the need for alternative strategies. A more valuable intervention might target identification of key team members (eg, attending, primary intern, primary senior resident). A policy statement regarding transitions of care recommended the establishment of mechanisms to ensure patients and their families know who is responsible for their care.[15] Efforts toward achieving this goal are essential.
This study has several limitations. The study was completed at a single institution, and thus generalizability may be limited. Although the intervention and control units have similar characteristics, randomization did not occur at the patient level. The control group had significantly more patients who had greater than 1 admission compared to the intervention group. Patients enrolled in the study were from a weekday convenience sample; therefore, potential differences in results based on weekend admissions were unable to be assessed. The exclusion of nonEnglish‐speaking families could limit generalizability to this population. Social desirability bias may have elevated the scores in both groups. Providers tasked with the responsibility of introducing the face sheet tool to families did so in a nonstandardized way and may have interacted differently with families compared to the control team. Finally, our project's aim was focused on the effect of a face sheet tool on the identification and satisfaction rating of the medical team by caregivers. Truly family‐centered care would include efforts to improve families' knowledge of and satisfaction with all members of the healthcare team.
A photo‐based face sheet tool helped caregivers better identify their child's care providers by name and role in the hospital. Satisfaction scores were similar in both groups.
Acknowledgements
The authors thank the Pediatric Research in Inpatient Settings network, and specifically Drs. Karen Wilson and Samir Shah, for their assistance during a workshop at the Pediatric Hospital Medicine 2012 meeting in July 2012, during which a first draft of this manuscript was produced.
Disclosure: Nothing to report.
- , , , , . A child's admission to hospital: a qualitative study examining the experiences of parents. Intensive Care Med. 2005;31(9):1248–1254.
- Committee on Quality of Health Care in America. Institute of Medicine. Crossing the Quality Chasm: A New Health System for the 21st Century. Washington, DC: National Academy Press; 2001.
- Committee on Hospital Care and Institute for Patient‐ and Family‐Centered Care. Patient‐ and family‐centered care and the pediatrician's role. Pediatrics. 2012;129(2):394–404.
- , , . The new recommendations on duty hours from the ACGME Task Force. N Engl J Med. 2010;363(2):e3.
- , , , . Parental responses to involvement in rounds on a pediatric inpatient unit at a teaching hospital: a qualitative study. Acad Med. 2008;83(3):292–297.
- PSQ Project Co‐Investigators. Final Report on the Patient Satisfaction Questionnaire Project. Philadelphia, PA: American Board of Internal Medicine; 1989.
- , , , et al. Effect of multisource feedback on resident communication skills and professionalism: a randomized controlled trial. Arch Pediatr Adolesc Med. 2007;161(1):44–49.
- , , , , . Development, implementation, and public reporting of the HCAHPS survey. Med Care Res Rev. 2010;67(1):27–37.
- , , , . PHACES (Photographs of Academic Clinicians and Their Educational Status): a tool to improve delivery of family‐centered care. Acad Pediatr. 2010;10(2):138–145.
- , , , et al. Improving inpatients' identification of their doctors: use of FACE cards. Jt Comm J Qual Patient Saf. 2009;35(12):613–619.
- , . “Don't call me ‘mom’: how parents want to be greeted by their pediatrician. Clin Pediatr. 2009;48(7):720–722.
- , , , , , . Better rested, but more stressed? Evidence of the effects of resident work hour restrictions. Acad Pediatr. 2012;12(4):335–343.
- , , , et al. Pediatric residents' perspectives on reducing work hours and lengthening residency: a national survey. Pediatrics. 2012;130(1):99–107.
- , , , . Inpatient staffing within pediatric residency programs: work hour restrictions and the evolving role of the pediatric hospitalist. J Hosp Med. 2012;7(4):299–303.
- , , , et al. Transitions of Care Consensus policy statement: American College of Physicians, Society of General Internal Medicine, Society of Hospital Medicine, American Geriatrics Society, American College of Emergency Physicians, and Society for Academic Emergency Medicine. J Hosp Med. 2009;4(6):364–370.
IVC Ultrasound Imaging Training
The use of hand‐carried ultrasound by nonspecialists is increasing. Of particular interest to hospitalists is bedside ultrasound assessment of the inferior vena cava (IVC), which more accurately estimates left atrial pressure than does assessment of jugular venous pressure by physical examination.[1] Invasively measured central venous pressure (CVP) also correlates closely with estimates from IVC imaging.[1, 2, 3, 4] Although quick, accurate bedside determination of CVP may have broad potential applications in hospital medicine,[5, 6, 7, 8] of particular interest to patients and their advocates is whether hospitalists are sufficiently skilled to perform this procedure. Lucas et al. found that 8 hospitalists trained to perform 6 cardiac assessments by hand‐carried ultrasound could identify an enlarged IVC with moderate accuracy (sensitivity 56%, specificity 86%).[9] To our knowledge, no other study has examined whether hospitalists can readily develop the skills to accurately assess the IVC by ultrasound. We therefore studied whether the skills needed to acquire and interpret IVC images by ultrasound could be acquired by hospitalists after a brief training program.
METHODS
Study Populations
Hospitalists and volunteer subjects both provided informed consent to participate in this study, which was approved by the Johns Hopkins University School of Medicine Institutional Review Board. Nonpregnant volunteer subjects at least 18 years of age who agreed to attend training sessions were solicited from the investigators' ambulatory clinic patient population (see Supporting Information, Appendix A, in the online version of this article) and were compensated for their time. Volunteer subjects were solicited to represent a range of cardiac pathology. Hospitalists were solicited from among 28 members of the Johns Hopkins Bayview Medical Center's Division of Hospital Medicine, a nationally renowned academic hospitalist program comprising tenure‐track faculty who dedicate at least 30% of their time to academic endeavors.
Image Acquisition and Interpretation
A pocket‐sized portable hand‐carried ultrasound device was used for all IVC images (Vscan; GE Healthcare, Milwaukee, WI). All IVC images were acquired using the conventional methods with a subcostal view while the patient is supine. Cine loops of the IVC with respiration were captured in the longitudinal axis. Diameters were obtained approximately and by convention, approximately 2 cm from the IVC and right atrial junction. The IVC minimum diameter was measured during a cine loop of a patient performing a nasal sniff. The IVC collapsibility was determined by the formula: IVC Collapsibility Index=(IVCmaxIVCmin/IVCmax), where IVCmax and IVCmin represent the maximum and minimum IVC diameters respectively.[2] The IVC maximum diameters and collapsibility measurements that were used to estimate CVP are shown in the Supporting Information, Appendix B, in the online version of this article.
Educational Intervention and Skills Performance Assessment
One to 2 days prior to the in‐person training session, hospitalists were provided a brief introductory online curriculum (see Supporting Information, Appendix B, in the online version of this article). Groups of 3 to 4 hospitalists then completed an in‐person training and testing session (7 hours total time), which consisted of a precourse survey, a didactic session, and up to 4 hours of practice time with 10 volunteer subjects supervised by an experienced board‐certified cardiologist (G.A.H.) and a research echocardiography technician (C.M.). The survey included details on medical training, years in practice, prior ultrasound experience, and confidence in obtaining and interpreting IVC images. Confidence was rated on a Likert scale from 1=strongly confident to 5=not confident (3=neutral).
Next, each hospitalist's skills were assessed on 5 volunteer subjects selected by the cardiologist to represent a range of IVC appearance and body mass index (BMI). After appropriately identifying the IVC, they were first asked to make a visual qualitative judgement whether the IVC collapsed more than 50% during rapid inspiration or a sniff maneuver. Then hospitalists measured IVC diameter in a longitudinal view and calculated IVC collapsibility. Performance was evaluated by an experienced cardiologist (G.A.H.), who directly observed each hospitalist acquire and interpret IVC images and judged them relative to his own hand‐carried ultrasound assessments on the same subjects performed just before the hospitalists' scans. For each volunteer imaged, hospitalists had to acquire a technically adequate image of the IVC and correctly measure the inspiratory and expiratory IVC diameters. Hospitalists then had to estimate CVP by interpreting IVC diameters and collapsibility in 10 previously acquired sets of IVC video and still images. First, the hospitalists performed visual IVC collapsibility assessments (IVC collapse more than 50%) of video clips showing IVC appearance at baseline and during a rapid inspiration or sniff, without any measurements provided. Then, using still images showing premeasured maximum and minimum IVC diameters, they estimated CVP based on calculating IVC collapsibility (see Supporting Information, Appendix B, in the online version of this article for correlation of CVP to IVC maximum diameter and collapsibility). At the end of initial training hospitalists were again surveyed on confidence and also rated level of agreement (Likert scale, 1=strongly agree to 5=strongly disagree) regarding their ability to adequately obtain and accurately interpret IVC images and measurements. The post‐training survey also reviewed the training curriculum and asked hospitalists to identify potential barriers to clinical use of IVC ultrasound.
Following initial training, hospitalists were provided with a hand‐carried ultrasound device and allowed to use the device for IVC imaging on their general medical inpatients; the hospitalists could access the research echocardiography technician (C.M.) for assistance if desired. The number of additional patients imaged and whether scans were assisted was recorded for the study. At least 6 weeks after initial training, the hospitalists' IVC image acquisition and interpretation skills were again assessed on 5 volunteer subjects. At the follow‐up assessment, 4 of the 5 volunteers were new volunteers compared to the hospitalists' initial skills testing.
Statistics
The mean and standard deviations were used to describe continuous variables and percentages to describe proportions, and survey responses were described using medians and the interquartile ranges (25th percentile, 75th percentile). Wilcoxon rank sum tests were used to measure the pre‐ and post‐training differences in the individual survey responses (Stata Statistical Software: Release 12; StataCorp, College Station, TX).
RESULTS
From among 18 hospitalist volunteers, the 10 board‐certified hospitalists who could attend 1 of the scheduled training sessions were enrolled and completed the study. Hospitalists' demographic information and performance are summarized in Table 1. Hospitalists completed the initial online curriculum in an average of 18.37 minutes. After the in‐person training session, 8 of 10 hospitalists acquired adequate IVC images on all 5 volunteer subjects. One hospitalist obtained adequate images in 4 of 5 patients. Another hospitalist only obtained adequate images in 3 of 5 patients; a hepatic vein and the abdominal aorta were erroneously measured instead of the IVC in 1 subject each. This hospitalist later performed supervised IVC imaging on 7 additional hospital inpatients and was the only hospitalist to request additional direct supervision by the research echocardiography technician. All hospitalists were able to accurately quantify the IVC collapsibility index and estimate the CVP from all 10 prerecorded cases showing still images and video clips of the IVC. Based on IVC images, 1 of the 5 volunteers used in testing each day had a very elevated CVP, and the other 4 had CVPs ranging from low to normal. The volunteer's average BMI was overweight at 27.4, with a range from 15.4 to 37.1.
| Hospitalist | Years in Practice | Previous Ultrasound Training (Hours)a | No. of Subjects Adequately Imaged and Correctly Interpreted After First Session (5 Maximum) | No. of Subjects Adequately Imaged and Correctly Interpreted at Follow‐up (5 Maximum) | After Study Completion Felt Training Was Adequate to Perform IVC Imagingb |
|---|---|---|---|---|---|
| |||||
| 1 | 5.5 | 10 | 5 | 5 | 4 |
| 2 | 0.8 | 0 | 5 | 5 | 5 |
| 3 | 1.8 | 4.5 | 3 | 4 | 2 |
| 4 | 1.8 | 0 | 5 | 5 | 5 |
| 5 | 10.5 | 6 | 5 | 5 | 5 |
| 6 | 1.7 | 1 | 5 | 5 | 5 |
| 7 | 0.6 | 0 | 5 | 5 | 5 |
| 8 | 2.6 | 0 | 4 | 5 | 4 |
| 9 | 1.7 | 0 | 5 | 5 | 5 |
| 10 | 5.5 | 10 | 5 | 5 | 5 |
At 7.40.7 weeks (range, 6.98.6 weeks) follow‐up, 9 of 10 hospitalists obtained adequate IVC images in all 5 volunteer subjects and interpreted them correctly for estimating CVP. The hospitalist who performed most poorly at the initial assessment acquired adequate images and interpreted them correctly in 4 of 5 patients at follow‐up. Overall, hospitalists' visual assessment of IVC collapsibility index agreed with the quantitative collapsibility index calculation in 180 of 198 (91%) of the interpretable encounters. By the time of the follow‐up assessment, hospitalists had performed IVC imaging on 3.93.0 additional hospital inpatients (range, 011 inpatients). Lack of time assigned to the clinical service was the main barrier limiting further IVC imaging during that interval. Hospitalists also identified time constraints and need for secure yet accessible device storage as other barriers.
None of the hospitalists had previous experience imaging the IVC, and prior to training they rated their average confidence to acquire an IVC image and interpret it by the hand‐carried ultrasound device at 3 (3, 4) and 3 (3, 4), respectively. After the initial training session, 9 of 10 hospitalists believed they had received adequate online and in‐person training and were confident in their ability to acquire and interpret IVC images. After all training sessions the hospitalists on average rated their confidence statistically significantly better for acquiring and interpreting IVC images at 2 (1, 2) (P=0.005) and 2 (1, 2) (P=0.004), respectively compared to baseline.
DISCUSSION
This study shows that after a relatively brief training intervention, hospitalists can develop and over a short term retain important skills in the acquisition and interpretation of IVC images to estimate CVP. Estimating CVP is key to the care of many patients, but cannot be done accurately by most physicians.[10] Although our study has a number of limitations, the ability to estimate CVP acquired after only a brief training intervention could have important effects on patient care. Given that a dilated IVC with reduced respiratory collapsibility was found to be a statistically significant predictor of 30‐day readmission for heart failure,11 key clinical outcomes to measure in future work include whether IVC ultrasound assessment can help guide diuresis, limit complications, and ultimately reduce rehospitalizations for heart failure, the most expensive diagnosis for Medicare.[12]
Because hand‐carried ultrasound is a point‐of‐care diagnostic tool, we also examined the ability of hospitalists to visually approximate the IVC collapsibility index. Hospitalists' qualitative performance (IVC collapsibility judged correctly 91% of the time without performing formal measurements) is consistent with studies involving emergency medicine physicians and suggests that CVP may be rapidly and accurately estimated in most instances.[13] There may be, however, value to formally measuring the IVC maximum diameter, because it may be inaccurately visually estimated due to changes in scale when the imaging depth is adjusted. Accurately measuring the IVC maximum diameter is important because a maximum diameter of more than 2.0 cm is evidence of an elevated right atrial pressure (82% sensitivity and 84% specificity for predicting right atrial pressure of 10 mm Hg or above) and an elevated pulmonary capillary wedge pressure (75% sensitivity and 83% specificity for pulmonary capillary wedge pressure of 15 mm Hg or more).[14]
Limitations
Our findings should be interpreted cautiously given the relatively small number of hospitalists and subjects used for hand‐carried ultrasound imaging. Although our direct observations of hospitalist performance in IVC imaging were based on objective measurements performed and interpreted accurately, we did not record the images, which would have allowed separate analyses of inter‐rater reliability measures. The majority of volunteer subjects were chronically ill, but they were nonetheless stable outpatients and may have been easier to position and image relative to acutely ill inpatients. Hospitalist self‐selected participation may introduce a bias favoring hospitalists interested in learning hand‐carried ultrasound skills; however, nearly half of the hospitalist group volunteered and enrollments in the study were based only on their availability for the previously scheduled study dates.
IMPLICATIONS FOR TRAINING
Our study, especially the assessment of the hospitalists' ability to retain their skills, adds to what is known about training hospitalists in hand‐carried ultrasound and may help inform deliberations among hospitalists as to whether to join other professional societies in defining specialty‐specific bedside ultrasound indications and training protocols.[9, 15] As individuals acquire new skills at variable rates, training cannot be defined by the number of procedures performed, but rather by the need to provide objective evidence of acquired procedural skills. Thus, going forward there is also a need to develop and validate tools for assessment of competence in IVC imaging skills.
Disclosures
This project was funded as an investigator‐sponsored research project by General Electric (GE) Medical Systems Ultrasound and Primary Care Diagnostics, LLC. The devices used in this training were supplied by GE. All authors had access to the data and contributed to the preparation of the manuscript. GE was not involved in the study design, analysis, or preparation of the manuscript. All authors received research support to perform this study from the funding source.
- , , , et al. A comparison by medicine residents of physical examination versus hand‐carried ultrasound for estimation of right atrial pressure. Am J Cardiol. 2007;99(11):1614–1616.
- , , . Noninvasive estimation of right atrial pressure from the inspiratory collapse of the inferior vena cava. Am J Cardiol. 1990;66:493–496.
- , , , et al. Reappraisal of the use of inferior vena cava for estimating right atrial pressure. J Am Soc Echocardiogr. 2007;20:857–861.
- , , , et al. Use of hand‐carried ultrasound, B‐type natriuretic peptide, and clinical assessment in identifying abnormal left ventricular filling pressures in patients referred for right heart catheterization. J Cardiac Fail. 2010;16:69–75.
- , , . Identification of congestive heart failure via respiratory variation of inferior vena cava diameter. Am J Emerg Med. 2009;27:71–75.
- , , , . Role of inferior vena cava diameter in assessment of volume status: a meta‐analysis. Am J Emerg Med. 2012;30(8):1414–1419.e1.
- , , , et al. Qualitative assessment of the inferior vena cava: useful tool for the evaluation of fluid status in critically ill patients. Am Surg. 2012;78(4):468–470.
- , , , et al. Inferior vena cava collapsibility to guide fluid removal in slow continuous ultrafiltration: a pilot study. Intensive Care Med 2010;36:692–696.
- , , , et al. Diagnostic accuracy of hospitalist‐performed hand‐carried ultrasound echocardiography after a brief training program. J Hosp Med. 2009;4(6):340–349.
- , , . Can the clinical examination diagnose left‐sided heart failure in adults? JAMA. 1997;277:1712–1719.
- , , , et al. Comparison of hand‐carried ultrasound assessment of the inferior vena cava and N‐terminal pro‐brain natriuretic peptide for predicting readmission after hospitalization for acute decompensated heart failure. JACC Cardiovasc Imaging. 2008;1:595–601.
- , , . Rehospitalizations among patients in the Medicare Fee‐for‐Service Program. N Engl J Med. 2009;360:1418–1428.
- , , , et al. The interrater reliability of inferior vena cava ultrasound by bedside clinician sonographers in emergency department patients. Acad Emerg Med. 2011;18:98–101.
- , , , et al. Usefulness of hand‐carried ultrasound to predict elevated left ventricular filling pressure. Am J Cardiol. 2009;103:246–247.
- , , , et al. Hospitalist performance of cardiac hand‐carried ultrasound after focused training. Am J Med. 2007;120(11):1000–1004.
The use of hand‐carried ultrasound by nonspecialists is increasing. Of particular interest to hospitalists is bedside ultrasound assessment of the inferior vena cava (IVC), which more accurately estimates left atrial pressure than does assessment of jugular venous pressure by physical examination.[1] Invasively measured central venous pressure (CVP) also correlates closely with estimates from IVC imaging.[1, 2, 3, 4] Although quick, accurate bedside determination of CVP may have broad potential applications in hospital medicine,[5, 6, 7, 8] of particular interest to patients and their advocates is whether hospitalists are sufficiently skilled to perform this procedure. Lucas et al. found that 8 hospitalists trained to perform 6 cardiac assessments by hand‐carried ultrasound could identify an enlarged IVC with moderate accuracy (sensitivity 56%, specificity 86%).[9] To our knowledge, no other study has examined whether hospitalists can readily develop the skills to accurately assess the IVC by ultrasound. We therefore studied whether the skills needed to acquire and interpret IVC images by ultrasound could be acquired by hospitalists after a brief training program.
METHODS
Study Populations
Hospitalists and volunteer subjects both provided informed consent to participate in this study, which was approved by the Johns Hopkins University School of Medicine Institutional Review Board. Nonpregnant volunteer subjects at least 18 years of age who agreed to attend training sessions were solicited from the investigators' ambulatory clinic patient population (see Supporting Information, Appendix A, in the online version of this article) and were compensated for their time. Volunteer subjects were solicited to represent a range of cardiac pathology. Hospitalists were solicited from among 28 members of the Johns Hopkins Bayview Medical Center's Division of Hospital Medicine, a nationally renowned academic hospitalist program comprising tenure‐track faculty who dedicate at least 30% of their time to academic endeavors.
Image Acquisition and Interpretation
A pocket‐sized portable hand‐carried ultrasound device was used for all IVC images (Vscan; GE Healthcare, Milwaukee, WI). All IVC images were acquired using the conventional methods with a subcostal view while the patient is supine. Cine loops of the IVC with respiration were captured in the longitudinal axis. Diameters were obtained approximately and by convention, approximately 2 cm from the IVC and right atrial junction. The IVC minimum diameter was measured during a cine loop of a patient performing a nasal sniff. The IVC collapsibility was determined by the formula: IVC Collapsibility Index=(IVCmaxIVCmin/IVCmax), where IVCmax and IVCmin represent the maximum and minimum IVC diameters respectively.[2] The IVC maximum diameters and collapsibility measurements that were used to estimate CVP are shown in the Supporting Information, Appendix B, in the online version of this article.
Educational Intervention and Skills Performance Assessment
One to 2 days prior to the in‐person training session, hospitalists were provided a brief introductory online curriculum (see Supporting Information, Appendix B, in the online version of this article). Groups of 3 to 4 hospitalists then completed an in‐person training and testing session (7 hours total time), which consisted of a precourse survey, a didactic session, and up to 4 hours of practice time with 10 volunteer subjects supervised by an experienced board‐certified cardiologist (G.A.H.) and a research echocardiography technician (C.M.). The survey included details on medical training, years in practice, prior ultrasound experience, and confidence in obtaining and interpreting IVC images. Confidence was rated on a Likert scale from 1=strongly confident to 5=not confident (3=neutral).
Next, each hospitalist's skills were assessed on 5 volunteer subjects selected by the cardiologist to represent a range of IVC appearance and body mass index (BMI). After appropriately identifying the IVC, they were first asked to make a visual qualitative judgement whether the IVC collapsed more than 50% during rapid inspiration or a sniff maneuver. Then hospitalists measured IVC diameter in a longitudinal view and calculated IVC collapsibility. Performance was evaluated by an experienced cardiologist (G.A.H.), who directly observed each hospitalist acquire and interpret IVC images and judged them relative to his own hand‐carried ultrasound assessments on the same subjects performed just before the hospitalists' scans. For each volunteer imaged, hospitalists had to acquire a technically adequate image of the IVC and correctly measure the inspiratory and expiratory IVC diameters. Hospitalists then had to estimate CVP by interpreting IVC diameters and collapsibility in 10 previously acquired sets of IVC video and still images. First, the hospitalists performed visual IVC collapsibility assessments (IVC collapse more than 50%) of video clips showing IVC appearance at baseline and during a rapid inspiration or sniff, without any measurements provided. Then, using still images showing premeasured maximum and minimum IVC diameters, they estimated CVP based on calculating IVC collapsibility (see Supporting Information, Appendix B, in the online version of this article for correlation of CVP to IVC maximum diameter and collapsibility). At the end of initial training hospitalists were again surveyed on confidence and also rated level of agreement (Likert scale, 1=strongly agree to 5=strongly disagree) regarding their ability to adequately obtain and accurately interpret IVC images and measurements. The post‐training survey also reviewed the training curriculum and asked hospitalists to identify potential barriers to clinical use of IVC ultrasound.
Following initial training, hospitalists were provided with a hand‐carried ultrasound device and allowed to use the device for IVC imaging on their general medical inpatients; the hospitalists could access the research echocardiography technician (C.M.) for assistance if desired. The number of additional patients imaged and whether scans were assisted was recorded for the study. At least 6 weeks after initial training, the hospitalists' IVC image acquisition and interpretation skills were again assessed on 5 volunteer subjects. At the follow‐up assessment, 4 of the 5 volunteers were new volunteers compared to the hospitalists' initial skills testing.
Statistics
The mean and standard deviations were used to describe continuous variables and percentages to describe proportions, and survey responses were described using medians and the interquartile ranges (25th percentile, 75th percentile). Wilcoxon rank sum tests were used to measure the pre‐ and post‐training differences in the individual survey responses (Stata Statistical Software: Release 12; StataCorp, College Station, TX).
RESULTS
From among 18 hospitalist volunteers, the 10 board‐certified hospitalists who could attend 1 of the scheduled training sessions were enrolled and completed the study. Hospitalists' demographic information and performance are summarized in Table 1. Hospitalists completed the initial online curriculum in an average of 18.37 minutes. After the in‐person training session, 8 of 10 hospitalists acquired adequate IVC images on all 5 volunteer subjects. One hospitalist obtained adequate images in 4 of 5 patients. Another hospitalist only obtained adequate images in 3 of 5 patients; a hepatic vein and the abdominal aorta were erroneously measured instead of the IVC in 1 subject each. This hospitalist later performed supervised IVC imaging on 7 additional hospital inpatients and was the only hospitalist to request additional direct supervision by the research echocardiography technician. All hospitalists were able to accurately quantify the IVC collapsibility index and estimate the CVP from all 10 prerecorded cases showing still images and video clips of the IVC. Based on IVC images, 1 of the 5 volunteers used in testing each day had a very elevated CVP, and the other 4 had CVPs ranging from low to normal. The volunteer's average BMI was overweight at 27.4, with a range from 15.4 to 37.1.
| Hospitalist | Years in Practice | Previous Ultrasound Training (Hours)a | No. of Subjects Adequately Imaged and Correctly Interpreted After First Session (5 Maximum) | No. of Subjects Adequately Imaged and Correctly Interpreted at Follow‐up (5 Maximum) | After Study Completion Felt Training Was Adequate to Perform IVC Imagingb |
|---|---|---|---|---|---|
| |||||
| 1 | 5.5 | 10 | 5 | 5 | 4 |
| 2 | 0.8 | 0 | 5 | 5 | 5 |
| 3 | 1.8 | 4.5 | 3 | 4 | 2 |
| 4 | 1.8 | 0 | 5 | 5 | 5 |
| 5 | 10.5 | 6 | 5 | 5 | 5 |
| 6 | 1.7 | 1 | 5 | 5 | 5 |
| 7 | 0.6 | 0 | 5 | 5 | 5 |
| 8 | 2.6 | 0 | 4 | 5 | 4 |
| 9 | 1.7 | 0 | 5 | 5 | 5 |
| 10 | 5.5 | 10 | 5 | 5 | 5 |
At 7.40.7 weeks (range, 6.98.6 weeks) follow‐up, 9 of 10 hospitalists obtained adequate IVC images in all 5 volunteer subjects and interpreted them correctly for estimating CVP. The hospitalist who performed most poorly at the initial assessment acquired adequate images and interpreted them correctly in 4 of 5 patients at follow‐up. Overall, hospitalists' visual assessment of IVC collapsibility index agreed with the quantitative collapsibility index calculation in 180 of 198 (91%) of the interpretable encounters. By the time of the follow‐up assessment, hospitalists had performed IVC imaging on 3.93.0 additional hospital inpatients (range, 011 inpatients). Lack of time assigned to the clinical service was the main barrier limiting further IVC imaging during that interval. Hospitalists also identified time constraints and need for secure yet accessible device storage as other barriers.
None of the hospitalists had previous experience imaging the IVC, and prior to training they rated their average confidence to acquire an IVC image and interpret it by the hand‐carried ultrasound device at 3 (3, 4) and 3 (3, 4), respectively. After the initial training session, 9 of 10 hospitalists believed they had received adequate online and in‐person training and were confident in their ability to acquire and interpret IVC images. After all training sessions the hospitalists on average rated their confidence statistically significantly better for acquiring and interpreting IVC images at 2 (1, 2) (P=0.005) and 2 (1, 2) (P=0.004), respectively compared to baseline.
DISCUSSION
This study shows that after a relatively brief training intervention, hospitalists can develop and over a short term retain important skills in the acquisition and interpretation of IVC images to estimate CVP. Estimating CVP is key to the care of many patients, but cannot be done accurately by most physicians.[10] Although our study has a number of limitations, the ability to estimate CVP acquired after only a brief training intervention could have important effects on patient care. Given that a dilated IVC with reduced respiratory collapsibility was found to be a statistically significant predictor of 30‐day readmission for heart failure,11 key clinical outcomes to measure in future work include whether IVC ultrasound assessment can help guide diuresis, limit complications, and ultimately reduce rehospitalizations for heart failure, the most expensive diagnosis for Medicare.[12]
Because hand‐carried ultrasound is a point‐of‐care diagnostic tool, we also examined the ability of hospitalists to visually approximate the IVC collapsibility index. Hospitalists' qualitative performance (IVC collapsibility judged correctly 91% of the time without performing formal measurements) is consistent with studies involving emergency medicine physicians and suggests that CVP may be rapidly and accurately estimated in most instances.[13] There may be, however, value to formally measuring the IVC maximum diameter, because it may be inaccurately visually estimated due to changes in scale when the imaging depth is adjusted. Accurately measuring the IVC maximum diameter is important because a maximum diameter of more than 2.0 cm is evidence of an elevated right atrial pressure (82% sensitivity and 84% specificity for predicting right atrial pressure of 10 mm Hg or above) and an elevated pulmonary capillary wedge pressure (75% sensitivity and 83% specificity for pulmonary capillary wedge pressure of 15 mm Hg or more).[14]
Limitations
Our findings should be interpreted cautiously given the relatively small number of hospitalists and subjects used for hand‐carried ultrasound imaging. Although our direct observations of hospitalist performance in IVC imaging were based on objective measurements performed and interpreted accurately, we did not record the images, which would have allowed separate analyses of inter‐rater reliability measures. The majority of volunteer subjects were chronically ill, but they were nonetheless stable outpatients and may have been easier to position and image relative to acutely ill inpatients. Hospitalist self‐selected participation may introduce a bias favoring hospitalists interested in learning hand‐carried ultrasound skills; however, nearly half of the hospitalist group volunteered and enrollments in the study were based only on their availability for the previously scheduled study dates.
IMPLICATIONS FOR TRAINING
Our study, especially the assessment of the hospitalists' ability to retain their skills, adds to what is known about training hospitalists in hand‐carried ultrasound and may help inform deliberations among hospitalists as to whether to join other professional societies in defining specialty‐specific bedside ultrasound indications and training protocols.[9, 15] As individuals acquire new skills at variable rates, training cannot be defined by the number of procedures performed, but rather by the need to provide objective evidence of acquired procedural skills. Thus, going forward there is also a need to develop and validate tools for assessment of competence in IVC imaging skills.
Disclosures
This project was funded as an investigator‐sponsored research project by General Electric (GE) Medical Systems Ultrasound and Primary Care Diagnostics, LLC. The devices used in this training were supplied by GE. All authors had access to the data and contributed to the preparation of the manuscript. GE was not involved in the study design, analysis, or preparation of the manuscript. All authors received research support to perform this study from the funding source.
- , , , et al. A comparison by medicine residents of physical examination versus hand‐carried ultrasound for estimation of right atrial pressure. Am J Cardiol. 2007;99(11):1614–1616.
- , , . Noninvasive estimation of right atrial pressure from the inspiratory collapse of the inferior vena cava. Am J Cardiol. 1990;66:493–496.
- , , , et al. Reappraisal of the use of inferior vena cava for estimating right atrial pressure. J Am Soc Echocardiogr. 2007;20:857–861.
- , , , et al. Use of hand‐carried ultrasound, B‐type natriuretic peptide, and clinical assessment in identifying abnormal left ventricular filling pressures in patients referred for right heart catheterization. J Cardiac Fail. 2010;16:69–75.
- , , . Identification of congestive heart failure via respiratory variation of inferior vena cava diameter. Am J Emerg Med. 2009;27:71–75.
- , , , . Role of inferior vena cava diameter in assessment of volume status: a meta‐analysis. Am J Emerg Med. 2012;30(8):1414–1419.e1.
- , , , et al. Qualitative assessment of the inferior vena cava: useful tool for the evaluation of fluid status in critically ill patients. Am Surg. 2012;78(4):468–470.
- , , , et al. Inferior vena cava collapsibility to guide fluid removal in slow continuous ultrafiltration: a pilot study. Intensive Care Med 2010;36:692–696.
- , , , et al. Diagnostic accuracy of hospitalist‐performed hand‐carried ultrasound echocardiography after a brief training program. J Hosp Med. 2009;4(6):340–349.
- , , . Can the clinical examination diagnose left‐sided heart failure in adults? JAMA. 1997;277:1712–1719.
- , , , et al. Comparison of hand‐carried ultrasound assessment of the inferior vena cava and N‐terminal pro‐brain natriuretic peptide for predicting readmission after hospitalization for acute decompensated heart failure. JACC Cardiovasc Imaging. 2008;1:595–601.
- , , . Rehospitalizations among patients in the Medicare Fee‐for‐Service Program. N Engl J Med. 2009;360:1418–1428.
- , , , et al. The interrater reliability of inferior vena cava ultrasound by bedside clinician sonographers in emergency department patients. Acad Emerg Med. 2011;18:98–101.
- , , , et al. Usefulness of hand‐carried ultrasound to predict elevated left ventricular filling pressure. Am J Cardiol. 2009;103:246–247.
- , , , et al. Hospitalist performance of cardiac hand‐carried ultrasound after focused training. Am J Med. 2007;120(11):1000–1004.
Spectral gradient acoustic reflectometry aids diagnosis of acute otitis media and otitis media with effusion
Spectral gradient acoustic reflectometer (SGAR) is a technology to assist in the detection of middle ear fluid occurring in the context of diagnosing acute otitis media (AOM) and otitis media with effusion (OME). The technology involves sending a harmless, inaudible sonar-like sound wave from the emitter that goes through the tympanic membrane, hits the posterior wall of the middle ear space, and bounces back to the sound detector in the device. If there is only air in the middle ear space, the sound wave bounces back quickly, and you get a high reading. If the sound wave bounces back more slowly, there is middle ear effusion. The thicker the effusion, the more likely it is pus and an AOM or a chronic OME (depending on the clinical situation), causing the sound wave to bounce back more slowly and giving a low reading.
The specificity of a high reading is remarkable at around 95%, so a high reading is a big reassurance that middle ear effusion is absent. A lower reading suggests effusion and the lower it is, the greater the sensitivity. When I get an unexpected higher or lower reading, I go back and reexamine the patient.

I asked our nurses to compare the handheld tympanometer to the SGAR. They actually perform the testing, and I interpret it. The nurses said:
• The SGAR is easier to use because of how quickly a readout is obtained.
• If a child is crying or moving, they can still get a readout.
• You don’t have to change the tip of the SGAR for the size of the external ear canal.
• The SGAR is easier to read than the tympanometer.
• The SGAR is easier to interpret for the parents.
• You don’t have to get a seal with the ear canal with SGAR, as you do with a tympanometer.
• The SGAR uses a disposable tip.
I asked our office manager to look up our use of the SGAR and tympanometer during our everyday practice. We found that SGAR or tympanometry was used in 12% of patient encounters in which the diagnosis of AOM or OME was part of the chief complaint. The ratio of use was 3:1, favoring SGAR. The most frequent use was in 30% of patient encounters tied to the diagnosis of "otalgia" (388.70) because with that diagnosis, we are stating to parents and patients that there is no middle ear pathology seen on exam, and it is confirmed by a test using sonar waves with the SGAR device. Our nurse practitioners and physician assistants particularly find the use of the SGAR beneficial in helping to reassure the parents and patients that they have not missed an AOM or OME.
The billing code is the same for SGAR and tympanometry (92567), so the fee payment is the same for both tests. Our second most common use is in association with possible AOM (382.9) at 12% of visits. Third is OME (381.02) used in a follow-up visit to determine the presence and thickness of persisting effusion.
About one-quarter of children seen in our practice with a chief complaint of "earache" receive the diagnosis of otalgia, often confirmed by SGAR, and do not receive an antibiotic. Thus, they are offsetting the charge for the procedure by saving on the costs of antibiotics and the accumulation of excessive diagnoses of AOM and OME leading to ear tube surgeries and tonsillectomy/adenoidectomy. The diagnosis of AOM and OME requires a middle ear effusion to be accurate, and only SGAR measures detection of middle ear effusion. SGAR is a must own device for clinicians who exam ears. SGAR can help in conjunction with otoscopy for a difficult diagnosis of AOM. If I am having troubleremoving wax, or if the external ear canal is particularly curved, or if I’m on the fence or the parent seems to need further evidence of my diagnosis, I turn to the SGAR. If I can get a reading, then it can really help, and my nurses are successful in getting a reading about 90% of the time. The main issue is ear canal wax, because occlusion by wax of more than 50% of the external ear canal opening causes invalid readings.
We should prescribe antibiotics for AOM in my opinion, but not for otalgia and not if the diagnosis is uncertain. The SGAR device when properly used can help to reduce unnecessary use of antibiotics and their complications. In prior "ID Consult" columns, I have discussed improving the diagnostic accuracy of AOM and OME. Performing a good otoscopic exam with the best tools available and combining that exam with SGAR or tympanometry, in selected cases, is the best practice in my opinion, and what I do in my own practice.
Dr. Pichichero, a specialist in pediatric infectious diseases, is director of the Research Institute, Rochester General Hospital, N.Y. He is also a pediatrician at Legacy Pediatrics in Rochester. E-mail him at pdnews@frontlinemedcom.com. Innovia Medical, the company that is bringing the SGAR EarCheck Pro back to market in 2014 after improvement and the addition of a USB port to allow the import of the data readout into the electronic medical record, asked Dr. Pichichero to assess the SGAR device.
Spectral gradient acoustic reflectometer (SGAR) is a technology to assist in the detection of middle ear fluid occurring in the context of diagnosing acute otitis media (AOM) and otitis media with effusion (OME). The technology involves sending a harmless, inaudible sonar-like sound wave from the emitter that goes through the tympanic membrane, hits the posterior wall of the middle ear space, and bounces back to the sound detector in the device. If there is only air in the middle ear space, the sound wave bounces back quickly, and you get a high reading. If the sound wave bounces back more slowly, there is middle ear effusion. The thicker the effusion, the more likely it is pus and an AOM or a chronic OME (depending on the clinical situation), causing the sound wave to bounce back more slowly and giving a low reading.
The specificity of a high reading is remarkable at around 95%, so a high reading is a big reassurance that middle ear effusion is absent. A lower reading suggests effusion and the lower it is, the greater the sensitivity. When I get an unexpected higher or lower reading, I go back and reexamine the patient.
I asked our nurses to compare the handheld tympanometer to the SGAR. They actually perform the testing, and I interpret it. The nurses said:
• The SGAR is easier to use because of how quickly a readout is obtained.
• If a child is crying or moving, they can still get a readout.
• You don’t have to change the tip of the SGAR for the size of the external ear canal.
• The SGAR is easier to read than the tympanometer.
• The SGAR is easier to interpret for the parents.
• You don’t have to get a seal with the ear canal with SGAR, as you do with a tympanometer.
• The SGAR uses a disposable tip.
I asked our office manager to look up our use of the SGAR and tympanometer during our everyday practice. We found that SGAR or tympanometry was used in 12% of patient encounters in which the diagnosis of AOM or OME was part of the chief complaint. The ratio of use was 3:1, favoring SGAR. The most frequent use was in 30% of patient encounters tied to the diagnosis of "otalgia" (388.70) because with that diagnosis, we are stating to parents and patients that there is no middle ear pathology seen on exam, and it is confirmed by a test using sonar waves with the SGAR device. Our nurse practitioners and physician assistants particularly find the use of the SGAR beneficial in helping to reassure the parents and patients that they have not missed an AOM or OME.
The billing code is the same for SGAR and tympanometry (92567), so the fee payment is the same for both tests. Our second most common use is in association with possible AOM (382.9) at 12% of visits. Third is OME (381.02) used in a follow-up visit to determine the presence and thickness of persisting effusion.
About one-quarter of children seen in our practice with a chief complaint of "earache" receive the diagnosis of otalgia, often confirmed by SGAR, and do not receive an antibiotic. Thus, they are offsetting the charge for the procedure by saving on the costs of antibiotics and the accumulation of excessive diagnoses of AOM and OME leading to ear tube surgeries and tonsillectomy/adenoidectomy. The diagnosis of AOM and OME requires a middle ear effusion to be accurate, and only SGAR measures detection of middle ear effusion. SGAR is a must own device for clinicians who exam ears. SGAR can help in conjunction with otoscopy for a difficult diagnosis of AOM. If I am having troubleremoving wax, or if the external ear canal is particularly curved, or if I’m on the fence or the parent seems to need further evidence of my diagnosis, I turn to the SGAR. If I can get a reading, then it can really help, and my nurses are successful in getting a reading about 90% of the time. The main issue is ear canal wax, because occlusion by wax of more than 50% of the external ear canal opening causes invalid readings.
We should prescribe antibiotics for AOM in my opinion, but not for otalgia and not if the diagnosis is uncertain. The SGAR device when properly used can help to reduce unnecessary use of antibiotics and their complications. In prior "ID Consult" columns, I have discussed improving the diagnostic accuracy of AOM and OME. Performing a good otoscopic exam with the best tools available and combining that exam with SGAR or tympanometry, in selected cases, is the best practice in my opinion, and what I do in my own practice.
Dr. Pichichero, a specialist in pediatric infectious diseases, is director of the Research Institute, Rochester General Hospital, N.Y. He is also a pediatrician at Legacy Pediatrics in Rochester. E-mail him at pdnews@frontlinemedcom.com. Innovia Medical, the company that is bringing the SGAR EarCheck Pro back to market in 2014 after improvement and the addition of a USB port to allow the import of the data readout into the electronic medical record, asked Dr. Pichichero to assess the SGAR device.

Low serum uric acid levels protect against progressions of renal disease
SAN DIEGO – Patients who achieve a serum uric acid level of less than 6 mg/dL based on current gout management guidelines demonstrated a 37% reduction in progression of renal disease, a large retrospective study showed.
"There are numerous studies showing that people with renal disease can develop hyperuricemia," Dr. Gerald D. Levy said during a press briefing at the annual meeting of the American College of Rheumatology. "Some of them will also develop gout. There are a few small studies showing that in humans, you can reverse hyperuricemia with urate lowering therapy and make an impact in renal disease. We wanted to see if this is true."
Dr. Levy of the division of rheumatology in the department of internal medicine at Kaiser Permanente Medical Group, Downey, Calif., was the lead investigators in a study of 111,992 Kaiser Permanente Southern California patients with a serum uric acid (SUA) level of 7 mg/dL or greater from Jan. 1, 2002, to Dec. 31, 2010. Patients with at least 12 months of health plan membership, including drug benefit prior to the index date, were studied. All patients had at least one SUA and glomerular filtration rate (GFR) level measurement in the 6-month period prior to the index date and at least one SUA and one GFR in the follow-up period following the index date. Primary outcome events were at least a 30% worsening of renal function, initiation of dialysis, having a GFR of less than 15 mL/min, and undergoing a kidney transplant.
Patients with a new diagnosis of cancer were excluded from the analysis, as were those with HIV, glomerulonephritis, and/or organ transplant other than a kidney transplant.
Dr. Levy reported results from 16,186 patients who were divided into three groups: those who were never treated with urate-lowering therapy (ULT; 11,192); those who were treated with ULT less than 80% of the time from the index date to the end of follow-up period (3,902); and those who were treated with ULT 80% of the time or more from the index date to the end of the follow-up period (1,092). Of the three treatment groups, those who were treated with ULT 80% of the time or more during the study tended to be older and have more comorbid conditions, compared with the other two groups. They also began their ULT therapy earlier.
Among all patients combined, factors significantly associated with renal disease progression included having diabetes (hazard ratio, 1.96), hypertension (HR, 1.50), heart failure (HR, 1.39), previous hospitalizations (HR, 1.33), and being female (HR, 1.49) and older (HR, 1.03). The researchers found that time on ULT was not significantly associated with a reduction in renal disease progression outcome events (HR, 1.27, among those on ULT less than 80% of the time during the study vs. HR, 1.08, among those on ULT 80% of the time or more during the study). However, patients who achieved an SUA level below 6 mg/dL – a treatment goal in the 2012 ACR guidelines for management of gout – demonstrated a 37% reduction in renal disease progression (HR, 0.63; P less than .0001).
Dr. Levy acknowledged certain limitations of the study, including its retrospective design and the fact that patients with stage 4 and 5 chronic kidney disease were not included. "This is an important area, because if we can delay the worsening of renal disease in these folks, perhaps we’re abetting dialysis, which is growing by leaps and bounds in this country," he said. "Each dialysis patient now costs about $80,000 per year to take care of. If we could push that back even for a few years it would have a tremendous impact."
Dr. Levy had no relevant financial conflicts to disclose.
AT THE ACR ANNUAL MEETING
Major finding: Patients who achieved a serum uric acid level below 6 mg/dL – a treatment goal in the 2012 ACR guidelines for management of gout – demonstrated a 37% reduction in renal disease progression (HR, 0.63; P less than .0001).
Data source: A study of 16,186 patients who were divided into three groups: those who were never treated with urate-lowering therapy (ULT; 11,192), those who were treated with ULT less than 80% of the time from the index date to the end of follow-up period (3,902), and those who were treated with ULT 80% of the time or more from the index date to the end of the follow-up period (1,092).
Disclosures: Dr. Levy said that he had no relevant financial conflicts to disclose.

Factor can prevent bleeding in hemophilia A
Results of a phase 3 trial suggest a recombinant factor VIII Fc fusion protein (rFVIIIFc/efmoroctocog alfa, Eloctate/Elocta) can be used to prevent or reduce bleeding episodes in patients with severe hemophilia A.
Researchers found that prophylaxis with rFVIIIFc resulted in low annualized bleeding rates, and patients did not develop neutralizing antibodies.
Furthermore, the product was generally well-tolerated and had a prolonged half-life when compared with recombinant factor VIII.
Data from this study, called A-LONG, have been published in Blood.
Researchers tested rFVIIIFc in 165 male patients with severe hemophilia A who were 12 years of age and older.
Patients were divided into 3 treatment arms. Arm 1 received individualized prophylaxis, or 25 to 65 IU/kg every 3 to 5 days (n=118). Patients in arm 2 received a weekly prophylactic dose of 65 IU/kg (n=24). And patients in arm 3 received episodic treatment at doses of 10 to 50 IU/kg (n=23).
A total of 153 patients completed the study, and 757 bleeding episodes were treated with rFVIIIFc. Across the treatment arms, 87.3% of bleeding episodes were resolved with 1 injection of rFVIIIFc.
The annualized bleeding rate was significantly reduced with prophylaxis—by 92% for patients in arm 1 and 76% for those in arm 2—when compared with episodic treatment.
This was based on annualized bleeding rate estimates from a negative binomial regression model—2.91 for arm 1, 8.92 for arm 2, and 37.25 for arm 3.
The median annualized bleeding rates were 1.6 in arm 1, 3.6 in arm 2, and 33.6 in arm 3.
In arm 3, there were 9 patients who received rFVIIIFc to control bleeding during major surgery. In these cases, physicians rated the hemostatic response as “excellent” (n=8) or “good” (n=1).
There were no serious adverse events related to rFVIIIFc, and none of the patients developed neutralizing antibodies.
The most common adverse events (with an incidence of 5% or more) that occurred outside the perioperative period included nasopharyngitis, arthralgia, headache, and upper respiratory infection.
The researchers also compared the pharmacokinetics of rFVIIIFc and recombinant factor VIII. And they found the terminal half-life of rFVIIIFc was extended 1.5-fold compared to recombinant factor VIII—19.0 hours and 12.4 hours, respectively.
rFVIIIFc was developed using Fc fusion technology, which takes advantage of a naturally occurring pathway that delays the breakdown of IgG1 protein in the body by recycling it back into the bloodstream. This technology prolongs the time rFVIIIFc circulates in the body.
“There is an unmet medical need in the hemophilia community for longer intervals between prophylactic infusions while maintaining good control of bleeding episodes,” said study author Johnny Mahlangu, MD, director of the Haemophilia Comprehensive Care Centre at the University of the Witwatersrand and National Health Laboratory Service in Johannesburg, South Africa.
“A-LONG is the first clinical study to show that effective control over breakthrough bleeding may be achieved with once- or twice-weekly prophylactic infusions in people with severe hemophilia A.”
This study was funded by Biogen Idec, makers of rFVIIIFc. ![]()
FDA approves ibrutinib for previously treated MCL

The US Food and Drug Administration (FDA) has has granted accelerated approval for
ibrutinib (Imbruvica) to treat patients with mantle cell lymphoma (MCL) who have received at least 1 prior therapy.
Ibrutinib works by inhibiting the function of Bruton’s tyrosine kinase, a molecule that plays an important role in the survival of malignant B cells.
The drug showed promising results in the phase 2 PCYC-1104 trial, which was presented at ASH 2012 and published in NEJM in August.
The FDA granted ibrutinib breakthrough therapy designation because of these results and the life-threatening nature of MCL. Ibrutinib is the second drug with breakthrough therapy designation to receive FDA approval.
The FDA granted ibrutinib accelerated approval, rather than traditional approval, because the drug has not yet shown a clinical benefit. Accelerated approval of a drug is based
on a surrogate or intermediate endpoint—in this case, overall response rate—that is reasonably likely to
predict clinical benefit.
PCYC-1104 trial
The data published in NEJM included 111 patients who received ibrutinib at 560 mg daily in continuous, 28-day cycles until disease progression.
The
overall response rate was 68%, with a complete response rate of 21% and
a partial response rate of 47%. With an estimated median follow-up of
15.3 months, the estimated median response duration was 17.5 months.
The
estimated progression-free survival was 13.9 months, and the overall
survival was not reached. The estimated rate of overall survival was 58%
at 18 months.
Common nonhematologic adverse events included
diarrhea (50%), fatigue (41%), nausea (31%), peripheral edema (28%),
dyspnea (27%), constipation (25%), upper respiratory tract infection
(23%), vomiting (23%), and decreased appetite (21%). The most common
grade 3, 4, or 5 infection was pneumonia (6%).
Grade 3 and 4
hematologic adverse events included neutropenia (16%), thrombocytopenia
(11%), and anemia (10%). Grade 3 bleeding events occurred in 5 patients.
The “Warnings and Precautions” section of ibrutinib’s prescribing information notes that patients taking ibrutinib have experienced hemorrhage, fatal and non-fatal infections, myelosuppression, renal toxicity, second primary malignancies, and embryo-fetal toxicity.
For the full prescribing information, visit http://www.imbruvica.com/downloads/Prescribing_Information.pdf.
Ibrutinib is now commercially available. It is co-marketed by Pharmacyclics (based in Sunnyvale, California) and Janssen Biotech, Inc. (based in Raritan, New Jersey). ![]()
Ibrutinib approved for mantle cell lymphoma
Ibrutinib is now approved for the treatment of patients with mantle cell lymphoma who have received at least one prior therapy, the Food and Drug Administration announced Nov. 13.
The once-daily, oral therapy, marketed as Imbruvica, is the second drug to receive FDA approval under the breakthrough therapy designation established to speed the development and review of treatments for serious or life-threatening diseases.
"Imbruvica’s approval demonstrates the FDA’s commitment to making treatments available to patients with rare diseases," Dr. Richard Pazdur, director of hematology and oncology products in the FDA’s Center for Drug Evaluation and Research, said in a statement.

Mantle cell lymphoma is an orphan disease, with only about 2,900 new cases of MCL diagnosed each year. MCL comprises only about 6% of all non-Hodgkin’s lymphoma cases in the United States.
Ibrutinib’s approval comes a little more than 4 months after the new drug application was filed in June 2013 and is based on a phase II study reporting an investigator-assessed overall response rate of 66% at a daily dose of 560 mg ibrutinib in 111 patients with relapsed or refractory MCL after a median of three prior therapies. The median duration of response was 17.5 months. An improvement in survival and disease-related symptoms has not been established.
Ibrutinib works by blocking Bruton’s tyrosine kinase, a mediator of the B-cell receptor signaling pathway that has been shown in nonclinical studies to inhibit malignant B-cell survival.
The FDA also granted ibrutinib priority review and orphan-product designation, because the drug demonstrated "the potential to be a significant improvement in safety or effectiveness in the treatment of a serious condition and is intended to treat a rare disease," according to the FDA statement.
Ibrutinib is the third drug approved to treat MCL. In June 2013, the FDA approved the oral thalidomide analogue lenalidomide (Revlimid) for the treatment of MCL that had relapsed or progressed after two prior therapies including bortezomib (Velcade), a subcutaneous therapy that has been available for MCL since 2006.
"It is gratifying to see an early example of the new breakthrough therapy designation pathway meeting its intention – getting promising treatments to patients who are waiting for new options," Dr. Ellen V. Sigal, chairperson and founder of the Washington-based Friends of Cancer Research advocacy organization, said in a statement issued by Janssen Biotech, which is comarketing the drug with Pharmacyclics.
The two companies are expected to continue with phase III studies of ibrutinib and have also submitted the drug to the FDA for the treatment of previously treated chronic lymphocytic leukemia/small lymphocytic lymphoma.
In the pivotal MCL trial, the most common treatment-related adverse events with single-agent ibrutinib were mild or moderate diarrhea, fatigue, and nausea (N. Engl. J. Med. 2013;369:507-16). Grade 3 or higher hematologic events were neutropenia (16%), thrombocytopenia (11%), and anemia (10%).
Ibrutinib is now approved for the treatment of patients with mantle cell lymphoma who have received at least one prior therapy, the Food and Drug Administration announced Nov. 13.
The once-daily, oral therapy, marketed as Imbruvica, is the second drug to receive FDA approval under the breakthrough therapy designation established to speed the development and review of treatments for serious or life-threatening diseases.
"Imbruvica’s approval demonstrates the FDA’s commitment to making treatments available to patients with rare diseases," Dr. Richard Pazdur, director of hematology and oncology products in the FDA’s Center for Drug Evaluation and Research, said in a statement.
Mantle cell lymphoma is an orphan disease, with only about 2,900 new cases of MCL diagnosed each year. MCL comprises only about 6% of all non-Hodgkin’s lymphoma cases in the United States.
Ibrutinib’s approval comes a little more than 4 months after the new drug application was filed in June 2013 and is based on a phase II study reporting an investigator-assessed overall response rate of 66% at a daily dose of 560 mg ibrutinib in 111 patients with relapsed or refractory MCL after a median of three prior therapies. The median duration of response was 17.5 months. An improvement in survival and disease-related symptoms has not been established.
Ibrutinib works by blocking Bruton’s tyrosine kinase, a mediator of the B-cell receptor signaling pathway that has been shown in nonclinical studies to inhibit malignant B-cell survival.
The FDA also granted ibrutinib priority review and orphan-product designation, because the drug demonstrated "the potential to be a significant improvement in safety or effectiveness in the treatment of a serious condition and is intended to treat a rare disease," according to the FDA statement.
Ibrutinib is the third drug approved to treat MCL. In June 2013, the FDA approved the oral thalidomide analogue lenalidomide (Revlimid) for the treatment of MCL that had relapsed or progressed after two prior therapies including bortezomib (Velcade), a subcutaneous therapy that has been available for MCL since 2006.
"It is gratifying to see an early example of the new breakthrough therapy designation pathway meeting its intention – getting promising treatments to patients who are waiting for new options," Dr. Ellen V. Sigal, chairperson and founder of the Washington-based Friends of Cancer Research advocacy organization, said in a statement issued by Janssen Biotech, which is comarketing the drug with Pharmacyclics.
The two companies are expected to continue with phase III studies of ibrutinib and have also submitted the drug to the FDA for the treatment of previously treated chronic lymphocytic leukemia/small lymphocytic lymphoma.
In the pivotal MCL trial, the most common treatment-related adverse events with single-agent ibrutinib were mild or moderate diarrhea, fatigue, and nausea (N. Engl. J. Med. 2013;369:507-16). Grade 3 or higher hematologic events were neutropenia (16%), thrombocytopenia (11%), and anemia (10%).

Opioids and Opioid‐Related Adverse Events
Recent reports have drawn attention to the high and increasing rates of opioid prescribing and overdose‐related deaths in the United States.[1, 2, 3, 4, 5, 6, 7, 8, 9] These studies have focused on community‐based and emergency department prescribing, leaving prescribing practices in the inpatient setting unexamined. Given that pain is a frequent complaint in hospitalized patients, and that the Joint Commission mandates assessing pain as a vital sign, hospitalization is potentially a time of heightened use of such medications and could significantly contribute to nosocomial complications and subsequent outpatient use.[10] Variation in prescribing practices, unrelated to patient characteristics, could be a marker of inappropriate prescribing practices and poor quality of care.
Using a large, nationally representative cohort of admissions from July 2009 to June 2010, we sought to determine patterns and predictors of opioid utilization in nonsurgical admissions to US medical centers, hospital variation in use, and the association between hospital‐level use and the risk of opioid‐related adverse events. We hypothesized that hospitals with higher rates of opioid use would have an increased risk of an opioid‐related adverse event per patient exposed.
METHODS
Setting and Patients
We conducted a retrospective cohort study using data from 286 US nonfederal acute‐care facilities contributing to the database maintained by Premier (Premier Healthcare Solutions, Inc., Charlotte, NC). This database, created to measure healthcare utilization and quality of care, is drawn from voluntarily participating hospitals and contains data on approximately 1 in every 4 discharges nationwide.[11] Participating hospitals are similar in geographic distribution and metropolitan (urban/rural) status to hospitals nationwide, although large, nonteaching hospitals are slightly overrepresented in Premier. The database contains patient demographics, International Classification of Diseases, Ninth Revision, Clinical Modification (ICD‐9‐CM) codes, hospital demographics, and a date‐stamped log of all charges during the course of each hospitalization, including diagnostic tests, therapeutic treatments, and medications with dose and route of administration. The study was approved by the institutional review board at Beth Israel Deaconess Medical Center and granted a waiver of informed consent.
We studied a cohort of all adult nonsurgical admissions to participating hospitals from July 1, 2009, through June 30, 2010. We chose to study nonsurgical admissions, as patients undergoing surgical procedures have a clear indication for, and almost always receive, opioid pain medications. We defined a nonsurgical admission as an admission in which there were no charges for operating‐room procedures (including labor and delivery) and the attending of record was not a surgeon. We excluded admissions with unknown gender, since this is a key demographic variable, and admissions with a length of stay greater than 365 days, as these admissions are not representative of the typical admission to an acute‐care hospital. At the hospital level, we excluded hospitals contributing <100 admissions owing to resultant lack of precision in corresponding hospital prescribing rates, and hospitals that did not prescribe the full range of opioid medications (these hospitals had charges for codeine only), as these facilities seemed likely to have unusual limitations on prescribing or incomplete data capture.
Opioid Exposure
We defined opioid exposure as presence of 1 charge for an opioid medication during the admission. Opioid medications included morphine, hydrocodone, hydromorphone, oxycodone, fentanyl, meperidine, methadone, codeine, tramadol, buprenorphine, levorphanol, oxymorphone, pentazocine, propoxyphene, tapentadol, butorphanol, dezocine, and nalbuphine. We grouped the last 9 into an other category owing to infrequent use and/or differing characteristics from the main opioid drug types, such as synthetic, semisynthetic, and partial agonist qualities.
Severe Opioid‐Related Adverse Events
We defined severe opioid‐related adverse events as either naloxone exposure or an opioid‐related adverse drug event diagnosis code. Naloxone use in an adult patient exposed to opioids is one of the Institute for Healthcare Improvement's Trigger Tools for identifying adverse drug events[12] and previously has been demonstrated to have high positive predictive value for a confirmed adverse drug event.[13] We defined naloxone exposure as presence of 1 charge for naloxone. We excluded charges on hospital day 1 to focus on nosocomial events. We defined opioid‐related adverse drug events using ICD‐9‐CM diagnosis codes for poisoning by opioids (overdose, wrong substance given, or taken in error; ICD‐9‐CM 965.02, 965.09, E850.1, E850.2) and drugs causing adverse effects in therapeutic use (ICD‐9‐CM E935.1, E935.2), as specified in prior analyses by the Agency for Healthcare Research and Quality (AHRQ).[14, 15] To avoid capturing adverse events associated with outpatient use, we required the ICD‐9‐CM code to be qualified as not present on admission using the present on admission indicator required by the Centers for Medicare and Medicaid Services for all discharge diagnosis codes since 2008.[16]
Covariates of Interest
We were interested in the relationship between both patient and hospital characteristics and opioid exposure. Patient characteristics of interest included (1) demographic variables, such as age, sex, race (self‐reported by patients at the time of admission), marital status, and payer; (2) whether or not the patient spent any time in the intensive care unit (ICU); (3) comorbidities, identified via ICD‐9‐CM secondary diagnosis codes and diagnosis‐related groups using Healthcare Cost and Utilization Project Comorbidity Software, version 3.7, based on the work of Elixhauser et al[17, 18]; (4) primary ICD‐9‐CM discharge diagnosis groupings, selected based on hypothesized associations with receipt of opioids, and based on the Clinical Classifications Software (CCS)a diagnosis and procedure categorization scheme maintained by the AHRQ, and defined in the Appendix[19]; (5) and nonoperating‐room‐based procedures potentially necessitating opioids during the admission, selected from the 50 most common ICD‐9‐CM procedure codes in our cohort and grouped as cardiovascular procedures (catheterization and insertion of vascular stents), gastrointestinal procedures (upper and lower endoscopy), and mechanical ventilation, further defined in the Appendix. Hospital characteristics of interest included number of beds, population served (urban vs rural), teaching status, and US census region (Northeast, Midwest, South, West).
Statistical Analysis
We calculated the percent of admissions with exposure to any opioid and the percent exposed to each opioid, along with the total number of different opioid medications used during each admission. We also calculated the percent of admissions with parenteral administration and the percent of admissions with oral administration, among those exposed to the individual categories, and in aggregate. Because medications after discharge were unavailable in Premier's dataset, we report the percent of patients with a charge for opioids on the day of discharge.
We determined the daily dose of an opioid by taking the sum of the doses for that opioid charged on a given day. The average daily dose of an opioid was determined by taking the sum of the daily doses and dividing by the number of days on which 1 dose was charged. To facilitate comparison, all opioids, with the exception of those for which standard equivalences are unavailable (tramadol, other opioid category, oral fentanyl, epidural route for all), were converted to oral morphine equivalents using a standard equivalence conversion table.[20, 21] We excluded from our dosage calculations those charges for which standard morphine equivalence was unavailable, or for which dosage was missing. We also excluded from our dosage calculations any dose that was >3 standard deviations (SD) above the mean dose for that opioid, as such extreme values seemed physiologically implausible and more likely to be a data entry error that could lead to significant overestimation of the mean for that opioid.
All multivariable models used a generalized estimating equation (GEE) via the genmod procedure in SAS, with a Poisson distribution error term and a log link, controlling for repeated patient admissions with an autoregressive correlation structure.
To identify independent predictors of opioid receipt, we used a GEE model of opioid receipt where all patient and hospital characteristics listed in Table 1 were included as independent variables.
| Patient characteristics, N=1,139,419 | N | % |
|---|---|---|
| ||
| Age group, y | ||
| 1824 | 37,464 | 3 |
| 2534 | 66,541 | 6 |
| 3544 | 102,701 | 9 |
| 4554 | 174,830 | 15 |
| 5564 | 192,570 | 17 |
| 6574 | 196,407 | 17 |
| 75+ | 368,906 | 32 |
| Sex | ||
| Male | 527,062 | 46 |
| Female | 612,357 | 54 |
| Race | ||
| White | 711,993 | 62 |
| Black | 176,993 | 16 |
| Hispanic | 54,406 | 5 |
| Other | 196,027 | 17 |
| Marital status | ||
| Married | 427,648 | 38 |
| Single | 586,343 | 51 |
| Unknown/other | 125,428 | 11 |
| Primary insurance | ||
| Private/commercial | 269,725 | 24 |
| Medicare traditional | 502,301 | 44 |
| Medicare managed care | 126,344 | 11 |
| Medicaid | 125,025 | 11 |
| Self‐pay/other | 116,024 | 10 |
| ICU care | ||
| No | 1,023,027 | 90 |
| Yes | 116,392 | 10 |
| Comorbidities | ||
| AIDS | 5724 | 1 |
| Alcohol abuse | 79,633 | 7 |
| Deficiency anemias | 213,437 | 19 |
| RA/collagen vascular disease | 35,210 | 3 |
| Chronic blood‐loss anemia | 10,860 | 1 |
| CHF | 190,085 | 17 |
| Chronic pulmonary disease | 285,954 | 25 |
| Coagulopathy | 48,513 | 4 |
| Depression | 145,553 | 13 |
| DM without chronic complications | 270,087 | 24 |
| DM with chronic complications | 70,732 | 6 |
| Drug abuse | 66,886 | 6 |
| Hypertension | 696,299 | 61 |
| Hypothyroidism | 146,136 | 13 |
| Liver disease | 38,130 | 3 |
| Lymphoma | 14,032 | 1 |
| Fluid and electrolyte disorders | 326,576 | 29 |
| Metastatic cancer | 33,435 | 3 |
| Other neurological disorders | 124,195 | 11 |
| Obesity | 118,915 | 10 |
| Paralysis | 38,584 | 3 |
| PVD | 77,334 | 7 |
| Psychoses | 101,856 | 9 |
| Pulmonary circulation disease | 52,106 | 5 |
| Renal failure | 175,398 | 15 |
| Solid tumor without metastasis | 29,594 | 3 |
| Peptic ulcer disease excluding bleeding | 536 | 0 |
| Valvular disease | 86,616 | 8 |
| Weight loss | 45,132 | 4 |
| Primary discharge diagnoses | ||
| Cancer | 19,168 | 2 |
| Musculoskeletal injuries | 16,798 | 1 |
| Pain‐related diagnosesb | 101,533 | 9 |
| Alcohol‐related disorders | 16,777 | 1 |
| Substance‐related disorders | 13,697 | 1 |
| Psychiatric disorders | 41,153 | 4 |
| Mood disorders | 28,761 | 3 |
| Schizophrenia and other psychotic disorders | 12,392 | 1 |
| Procedures | ||
| Cardiovascular procedures | 59,901 | 5 |
| GI procedures | 31,224 | 3 |
| Mechanical ventilation | 7853 | 1 |
| Hospital characteristics, N=286 | ||
| Number of beds | ||
| <200 | 103 | 36 |
| 201300 | 63 | 22 |
| 301500 | 81 | 28 |
| >500 | 39 | 14 |
| Population served | ||
| Urban | 225 | 79 |
| Rural | 61 | 21 |
| Teaching status | ||
| Nonteaching | 207 | 72 |
| Teaching | 79 | 28 |
| US Census region | ||
| Northeast | 47 | 16 |
| Midwest | 63 | 22 |
| South | 115 | 40 |
| West | 61 | 21 |
To assess hospital variation in opioid prescribing after adjusting for patient characteristics, we used a GEE model of opioid receipt, controlling for all patient characteristics listed in Table 1. We then took the mean of the predicted probabilities of opioid receipt for the patients within each hospital in our cohort to derive the hospital prescribing rate adjusted for patient characteristics. We report the mean, SD, and range of the prescribing rates for the hospitals in our cohort before and after adjustment for patient characteristics.
To assess whether patients admitted to hospitals with higher rates of opioid prescribing have higher relative risk of severe opioid‐related adverse events, we stratified hospitals into opioid‐prescribing rate quartiles and compared the rates of opioid‐related adverse eventsboth overall and among opioid exposedbetween quartiles. To adjust for patient characteristics, we used a GEE model in which severe opioid‐related adverse event (yes/no) was the dependent variable and hospital‐prescribing rate quartile and all patient characteristics in Table 1 were independent variables. We also performed a sensitivity analysis in which we assessed the association between hospital prescribing‐rate quartile and the individual components of our composite outcome. Our results were qualitatively unchanged using this approach, and only the results of our main analysis are presented.
All analyses were carried out using SAS software, version 9.2 (SAS Institute Inc., Cary, NC).
RESULTS
Patient Admission Characteristics
There were 3,190,934 adult admissions to 300 acute‐care hospitals during our study period. After excluding admissions with a length of stay >365 days (n=25), missing patient sex (n=17), and charges for operating‐room procedures or a surgical attending of record (n=2,018,553), 1,172,339 admissions were available for analysis. There were 12 hospitals with incomplete opioid‐prescribing data (n=32,794) and 2 hospitals that contributed <100 admissions each (n=126), leaving 1,139,419 admissions in 286 hospitals in our analytic cohort. The median age of the cohort was 64 years (interquartile range, 4979 years), and 527,062 (46%) were men. Table 1 shows the characteristics of the admissions in the cohort.
Rate, Route, and Dose of Opioid Exposures
Overall, there were 576,373 (51%) admissions with charges for opioid medications. Among those exposed, 244,760 (43%) had charges for multiple opioids during the admission; 172,090 (30%) had charges for 2 different opioids; and 72,670 (13%) had charges for 3 different opioids. Table 2 shows the percent exposed to each opioid, the percent of exposed with parenteral and oral routes of administration, and the mean daily dose received in oral morphine equivalents.
| Exposed | Parenteral Administration | Oral Administration | Dose Received, in Oral Morphine Equivalents | |||||
|---|---|---|---|---|---|---|---|---|
| N | %a | N | %b | N | %b | Mean | SDc | |
| ||||||||
| All opioids | 576,373 | 51 | 378,771 | 66 | 371,796 | 65 | 68 | 185 |
| Morphine | 224,811 | 20 | 209,040 | 93 | 21,645 | 10 | 40 | 121 |
| Hydrocodone | 162,558 | 14 | 0 | 0 | 160,941 | 99 | 14 | 12 |
| Hydromorphone | 146,236 | 13 | 137,936 | 94 | 16,052 | 11 | 113 | 274 |
| Oxycodone | 126,733 | 11 | 0 | 0 | 125,033 | 99 | 26 | 37 |
| Fentanyl | 105,052 | 9 | 103,113 | 98 | 641 | 1 | 64 | 75 |
| Tramadol | 35,570 | 3 | 0 | 0 | 35,570 | 100 | ||
| Meperidine | 24,850 | 2 | 24,398 | 98 | 515 | 2 | 36 | 34 |
| Methadone | 15,302 | 1 | 370 | 2 | 14,781 | 97 | 337 | 384 |
| Codeine | 22,818 | 2 | 178 | 1 | 22,183 | 97 | 9 | 15 |
| Other | 45,469 | 4 | 5821 | 13 | 39,618 | 87 | ||
Among the medications/routes for which conversion to morphine equivalents was possible, dosage was missing in 39,728 out of 2,294,673 opioid charges (2%). The average daily dose received in oral morphine equivalents was 68 mg. A total dose of 50 mg per day was received in 39% of exposed, and a total dose of 100 mg per day was received in 23% of exposed. Among those exposed, 52% (26% of overall admissions) had charges for opioids on the day of discharge.
Rates of Opioid Use by Patient and Hospital Characteristics
Table 3 reports the association between admission characteristics and opioid use. Use was highest in patients between the ages of 25 and 54 years. Although use declined with age, 44% of admissions age 65 years had charges for opioid medication. After adjustment for patient demographics, comorbidities, and hospital characteristics, opioid use was more common in females than males, those age 2554 years compared with those older and younger, those of Caucasian race compared with non‐Caucasian race, and those with Medicare or Medicaid primary insurance. Among the primary discharge diagnoses, patients with musculoskeletal injuries, various specific and nonspecific pain‐related diagnoses, and cancer were significantly more likely to receive opioids than patients without these diagnoses, whereas patients with alcohol‐related disorders and psychiatric disorders were significantly less likely to receive opioids than patients without these diagnoses. Patients admitted to hospitals in the Midwest, South, and West were significantly more likely to receive opioid medications than patients in the Northeast.
| Exposed, N=576,373 | Unexposed, N=563,046 | % Exposed | Adjusted RRa | 95% CI | |
|---|---|---|---|---|---|
| |||||
| Patient characteristics | |||||
| Age group, y | |||||
| 1824 | 17,360 | 20,104 | 46 | (ref) | |
| 2534 | 37,793 | 28,748 | 57 | 1.17 | 1.16‐1.19 |
| 3544 | 60,712 | 41,989 | 59 | 1.16 | 1.15‐1.17 |
| 4554 | 103,798 | 71,032 | 59 | 1.11 | 1.09‐1.12 |
| 5564 | 108,256 | 84,314 | 56 | 1.00 | 0.98‐1.01 |
| 6574 | 98,110 | 98,297 | 50 | 0.84 | 0.83‐0.85 |
| 75+ | 150,344 | 218,562 | 41 | 0.71 | 0.70‐0.72 |
| Sex | |||||
| Male | 255,315 | 271,747 | 48 | (ref) | |
| Female | 321,058 | 291,299 | 52 | 1.11 | 1.10‐1.11 |
| Race | |||||
| White | 365,107 | 346,886 | 51 | (ref) | |
| Black | 92,013 | 84,980 | 52 | 0.93 | 0.92‐0.93 |
| Hispanic | 27,592 | 26,814 | 51 | 0.94 | 0.93‐0.94 |
| Other | 91,661 | 104,366 | 47 | 0.93 | 0.92‐0.93 |
| Marital status | |||||
| Married | 222,912 | 204,736 | 52 | (ref) | |
| Single | 297,742 | 288,601 | 51 | 1.00 | 0.99‐1.01 |
| Unknown/other | 55,719 | 69,709 | 44 | 0.94 | 0.93‐0.95 |
| Primary insurance | |||||
| Private/commercial | 143,954 | 125,771 | 53 | (ref) | |
| Medicare traditional | 236,114 | 266,187 | 47 | 1.10 | 1.09‐1.10 |
| Medicare managed care | 59,104 | 67,240 | 47 | 1.11 | 1.11‐1.12 |
| Medicaid | 73,583 | 51,442 | 59 | 1.13 | 1.12‐1.13 |
| Self‐pay/other | 63,618 | 52,406 | 55 | 1.03 | 1.02‐1.04 |
| ICU care | |||||
| No | 510,654 | 512,373 | 50 | (ref) | |
| Yes | 65,719 | 50,673 | 56 | 1.02 | 1.01‐1.03 |
| Comorbiditiesb | |||||
| AIDS | 3655 | 2069 | 64 | 1.09 | 1.07‐1.12 |
| Alcohol abuse | 35,112 | 44,521 | 44 | 0.92 | 0.91‐0.93 |
| Deficiency anemias | 115,842 | 97,595 | 54 | 1.08 | 1.08‐1.09 |
| RA/collagen vascular disease | 22,519 | 12,691 | 64 | 1.22 | 1.21‐1.23 |
| Chronic blood‐loss anemia | 6444 | 4416 | 59 | 1.04 | 1.02‐1.05 |
| CHF | 88,895 | 101,190 | 47 | 0.99 | 0.98‐0.99 |
| Chronic pulmonary disease | 153,667 | 132,287 | 54 | 1.08 | 1.08‐1.08 |
| Coagulopathy | 25,802 | 22,711 | 53 | 1.03 | 1.02‐1.04 |
| Depression | 83,051 | 62,502 | 57 | 1.08 | 1.08‐1.09 |
| DM without chronic complications | 136,184 | 133,903 | 50 | 0.99 | 0.99‐0.99 |
| DM with chronic complications | 38,696 | 32,036 | 55 | 1.04 | 1.03‐1.05 |
| Drug abuse | 37,202 | 29,684 | 56 | 1.14 | 1.13‐1.15 |
| Hypertension | 344,718 | 351,581 | 50 | 0.98 | 0.97‐0.98 |
| Hypothyroidism | 70,786 | 75,350 | 48 | 0.99 | 0.99‐0.99 |
| Liver disease | 24,067 | 14,063 | 63 | 1.15 | 1.14‐1.16 |
| Lymphoma | 7727 | 6305 | 55 | 1.16 | 1.14‐1.17 |
| Fluid and electrolyte disorders | 168,814 | 157,762 | 52 | 1.04 | 1.03‐1.04 |
| Metastatic cancer | 23,920 | 9515 | 72 | 1.40 | 1.39‐1.42 |
| Other neurological disorders | 51,091 | 73,104 | 41 | 0.87 | 0.86‐0.87 |
| Obesity | 69,584 | 49,331 | 59 | 1.05 | 1.04‐1.05 |
| Paralysis | 17,497 | 21,087 | 45 | 0.97 | 0.96‐0.98 |
| PVD | 42,176 | 35,158 | 55 | 1.11 | 1.11‐1.12 |
| Psychoses | 38,638 | 63,218 | 38 | 0.91 | 0.90‐0.92 |
| Pulmonary circulation disease | 26,656 | 25,450 | 51 | 1.05 | 1.04‐1.06 |
| Renal failure | 86,565 | 88,833 | 49 | 1.01 | 1.01‐1.02 |
| Solid tumor without metastasis | 16,258 | 13,336 | 55 | 1.14 | 1.13‐1.15 |
| Peptic ulcer disease excluding bleeding | 376 | 160 | 70 | 1.12 | 1.07‐1.18 |
| Valvular disease | 38,396 | 48,220 | 44 | 0.93 | 0.92‐0.94 |
| Weight loss | 25,724 | 19,408 | 57 | 1.09 | 1.08‐1.10 |
| Primary discharge diagnosesb | |||||
| Cancer | 13,986 | 5182 | 73 | 1.20 | 1.19‐1.21 |
| Musculoskeletal injuries | 14,638 | 2160 | 87 | 2.02 | 2.002.04 |
| Pain‐related diagnosesc | 64,656 | 36,877 | 64 | 1.20 | 1.20‐1.21 |
| Alcohol‐related disorders | 3425 | 13,352 | 20 | 0.46 | 0.44‐0.47 |
| Substance‐related disorders | 8680 | 5017 | 63 | 1.03 | 1.01‐1.04 |
| Psychiatric disorders | 7253 | 33,900 | 18 | 0.37 | 0.36‐0.38 |
| Mood disorders | 5943 | 22,818 | 21 | ||
| Schizophrenia and other psychotic disorders | 1310 | 11,082 | 11 | ||
| Proceduresb | |||||
| Cardiovascular procedures | 50,997 | 8904 | 85 | 1.80 | 1.79‐1.81 |
| GI procedures | 27,206 | 4018 | 87 | 1.70 | 1.69‐1.71 |
| Mechanical ventilation | 5341 | 2512 | 68 | 1.37 | 1.34‐1.39 |
| Hospital characteristics | |||||
| Number of beds | |||||
| <200 | 100,900 | 88,439 | 53 | (ref) | |
| 201300 | 104,213 | 99,995 | 51 | 0.95 | 0.95‐0.96 |
| 301500 | 215,340 | 209,104 | 51 | 0.94 | 0.94‐0.95 |
| >500 | 155,920 | 165,508 | 49 | 0.96 | 0.95‐0.96 |
| Population served | |||||
| Urban | 511,727 | 506,803 | 50 | (ref) | |
| Rural | 64,646 | 56,243 | 53 | 0.98 | 0.97‐0.99 |
| Teaching status | |||||
| Nonteaching | 366,623 | 343,581 | 52 | (ref) | |
| Teaching | 209,750 | 219,465 | 49 | 1.00 | 0.99‐1.01 |
| US Census region | |||||
| Northeast | 99,377 | 149,446 | 40 | (ref) | |
| Midwest | 123,194 | 120,322 | 51 | 1.26 | (1.25‐1.27) |
| South | 251,624 | 213,029 | 54 | 1.33 | (1.33‐1.34) |
| West | 102,178 | 80,249 | 56 | 1.37 | (1.36‐1.38) |
Variation in Opioid Prescribing
Figure 1 shows the histograms of hospital opioid prescribing rate for the 286 hospitals in our cohort (A) before and (B) after adjustment for patient characteristics. The observed rates ranged from 5% in the lowest‐prescribing hospital to 72% in the highest‐prescribing hospital, with a mean (SD) of 51% (10%). After adjusting for patient characteristics, the adjusted opioid‐prescribing rates ranged from 33% to 64%, with a mean (SD) of 50% (4%).

Severe Opioid‐Related Adverse Events
Among admissions with opioid exposure (n=576,373), naloxone use occurred in 2345 (0.41%) and opioid‐related adverse drug events in 1174 (0.20%), for a total of 3441 (0.60%) severe opioid‐related adverse events (some patients experienced both). Table 4 reports the opioid exposure and severe opioid‐related adverse‐event rates within hospital opioid‐prescribing rate quartiles, along with the adjusted association between the hospital opioid‐prescribing rate quartile and severe opioid‐related adverse events. After adjusting for patient characteristics, the relative risk of a severe opioid‐related adverse event was significantly greater in hospitals with higher opioid‐prescribing rates, both overall and among opioid exposed.
| Quartile | No. of Patients | Opioid Exposed, n (%) | Opioid‐Related Adverse Events, n (%) | Adjusted RR in All Patients, RR (95% CI), N=1,139,419a | Adjusted RR in Opioid Exposed, RR (95% CI), N=576,373a |
|---|---|---|---|---|---|
| |||||
| 1 | 349,747 | 132,824 (38) | 719 (0.21) | (ref) | (ref) |
| 2 | 266,652 | 134,590 (50) | 729 (0.27) | 1.31 (1.17‐1.45) | 1.07 (0.96‐1.18) |
| 3 | 251,042 | 139,770 (56) | 922 (0.37) | 1.72 (1.56‐1.90) | 1.31 (1.19‐1.44) |
| 4 | 271,978 | 169,189 (62) | 1071 (0.39) | 1.73 (1.57‐1.90) | 1.23 (1.12‐1.35) |
DISCUSSION
In this analysis of a large cohort of hospitalized nonsurgical patients, we found that more than half of all patients received opioids, with 43% of those exposed receiving multiple opioids during their admission and 52% receiving opioids on the day of discharge. Considerable hospital variation in opioid use was evident, and this was not fully explained by patient characteristics. Severe opioid‐related adverse events occurred more frequently at hospitals with higher opioid‐prescribing rates, and the relative risk of a severe adverse event per patient prescribed opioids was also higher in these hospitals. To our knowledge, this is the first study to describe the scope of opioid utilization and the relationship between utilization and severe opioid‐related adverse events in a sample of nonsurgical patients in US acute‐care facilities.
Our use of naloxone charges and opioid‐specific ICD‐9‐CM coding to define an opioid‐related adverse event was intended to capture only the most severe opioid‐related adverse events. We chose to focus on these events in our analysis to maximize the specificity of our outcome definition and thereby minimize confounding in our observed associations. The rate of less‐severe opioid‐related adverse events, such as nausea, constipation, and pruritis, is likely much higher and not captured in our outcome definition. Prior analyses have found variable rates of opioid‐related adverse events of approximately 1.8% to 13.6% of exposed patients.[22, 23, 24] However, these analyses focused on surgical patients and included less‐severe events. To our knowledge, ours is the first analysis of severe opioid‐related adverse events in nonsurgical patients.
Our finding that severe opioid‐related adverse events increase as opioid prescribing increases is consistent with that which has been demonstrated in the community setting, where rates of opioid‐related adverse events and mortality are higher in communities with higher levels of opioid prescribing.[2, 8, 25] This finding is expected, as greater use of a class of medications with known side effects would be expected to result in a higher overall rate of adverse events. More concerning, however, is the fact that this relationship persists when focusing exclusively on opioid‐exposed patients. Among similar patients receiving opioids at different hospitals, those hospitalized in facilities with higher opioid‐prescribing rates have higher rates of severe opioid‐related adverse events. This suggests that hospitals that use opioids more frequently do not do so more safely. Rather, the increased overall prescribing rates are associated with heightened risk for a serious adverse event per patient exposed and may reflect unsafe prescribing practices.
Furthermore, our results demonstrate both regional and hospital variation in use of opioids not fully explained by patient characteristics, similar to that which has been demonstrated for other drugs and heathcare services.[26, 27, 28, 29, 30] The implications of these findings are limited by our lack of information on pain severity or prior outpatient treatment, and our resultant inability to evaluate the appropriateness of opioid use in this analysis. Additionally, although we controlled for a large number of patient and hospital characteristics, there could be other significant predictors of use not accounted for in our analysis. However, it seems unlikely that differential pain severity or patient characteristics between patients in different regions of the country could fully explain a 37% relative difference in prescribing between the lowest‐ and highest‐prescribing regions, after accounting for the 44 patient‐level variables in our models. Whereas variation in use unrelated to patient factors could represent inappropriate prescribing practices, it could also be a marker of uncertainty regarding what constitutes appropriate prescribing and high‐quality care in this realm. Although guidelines advocate for standard pain assessments and a step‐up approach to treatment,[31, 32, 33] the lack of objective measures of pain severity and lack of evidence‐based recommendations on the use of opioids for noncancer pain[34] will almost certainly lead to persistent variation in opioid prescribing despite guideline‐driven care.
Nonetheless, our findings suggest that opportunities exist to make opioid prescribing safer in hospitalized patients. Studies aimed at elucidating the source of regional and hospital variation are necessary. Additionally, efforts should focus on identifying patient and prescribing characteristics associated with heightened risk of opioid‐related adverse events. Prior studies have demonstrated that the risks of opioid medications increase with increasing age of the patient.[35, 36] Although opioid use in our cohort declined with age, 44% of admissions age 65 years had charges for opioid medications. Studies in outpatients have also demonstrated that the risks of opioid overdose and overdose‐related death increase with dose.[5, 7] One study demonstrated a 3.7‐fold increased risk of overdose at doses of 5099 mg/day in oral morphine equivalents, and an 8.9‐fold increased risk at doses of 100 mg/day, compared with doses of 20 mg/day.[7] The prevalence of high dose exposure observed in our cohort, coupled with the older age of hospitalized patients, suggests potential targets for promoting safer use in hospitalized patients through interventions such as computerized decision support and enhanced monitoring in those at highest risk.
Because medications after discharge were unavailable in our dataset, the percentage of patients given a prescription for opioid medication on discharge is unknown. However, given that opioids are often tapered rather than abruptly discontinued, our finding that 26% of hospitalized nonsurgical patients received opioids on the day of discharge suggests that a substantial proportion of patients may be discharged with a prescription for opioid medication. Given the possibility of coexistent outpatient opioid prescriptions, these findings draw attention to the importance of assuring development and streamlined accessibility of data from state prescription drug monitoring programs and suggest that increased attention should be paid to the role that inpatient opioid prescribing plays in the increased rates of chronic opioid use and overdose‐related deaths in the United States.
There are additional limitations to our analysis. First, although the database used for this analysis captures a large proportion of admissions to US acute‐care facilities and is similar in composition, it is possible that participating medical centers differ from nonparticipating medical centers in ways that could be associated with opioid prescribing. Additionally, although Premier performs extensive validation and correction processes to assure the quality of their data, there is still likely to be a small amount of random error in the database, which could particularly impact dosage calculations. The lack of preadmission medications in our database precluded identification of the proportion of patients newly started on opioid medications. Lastly, it is possible that the hospital prescribing‐rate quartile is associated with patient characteristics unaccounted for in our analysis, and, therefore, the possibility of residual confounding still exists.
In conclusion, the majority of hospitalized nonsurgical patients are exposed to opioid medications during the course of their hospitalizations, often at high doses. More than half of those exposed are still receiving these medications on the day of discharge. We found hospital and regional variation in opioid use that was not fully explained by patient characteristics, and higher levels of hospital use were associated with higher risk of severe opioid‐related adverse events in opioid‐exposed patients. Further research is necessary to investigate the appropriateness of opioid use in this patient population, the sources of variation in use, and the predictors of opioid‐related adverse events in hospitalized patients to allow development of interventions to make hospital use safer.
Disclosures
Disclosures: Dr. Herzig had full access to all of the data in the study and takes responsibility for the integrity of the data and the accuracy of the data analysis. Dr. Herzig was funded by grant no. K23AG042459 from the National Institute on Aging. Dr. Marcantonio was funded by grant nos. P01AG031720, R01AG030618, R03AG028189, and K24AG035075 from the National Institute on Aging. The funding organization had no involvement in any aspect of the study, including design, conduct, and reporting of the study. None of the authors have any conflicts of interest to disclose.
- . A flood of opioids, a rising tide of deaths. N Engl J Med. 2010;363(21):1981–1985.
- , , . Increasing deaths from opioid analgesics in the United States. Pharmacoepidemiol Drug Saf. 2006;15(9):618–627.
- , , , . Trends in opioid prescribing by race/ethnicity for patients seeking care in US emergency departments. JAMA. 2008;299(1):70–78.
- , , , . Trends in medical use and abuse of opioid analgesics. JAMA. 2000;283(13):1710–1714.
- , , , et al. Association between opioid prescribing patterns and opioid overdose‐related deaths. JAMA. 2011;305(13):1315–1321.
- , , , et al. Prescription opioid mortality trends in New York City, 1990–2006: examining the emergence of an epidemic. Drug Alcohol Depend. 2013;132(1‐2):53–62.
- , , , et al. Opioid prescriptions for chronic pain and overdose: a cohort study. Ann Intern Med. 2010;152(2):85–92.
- , , , et al. Relationship of opioid prescription sales and overdoses, North Carolina. Drug Alcohol Depend. 2013;132(1‐2):81–86.
- Deaths from prescription opioids soar in New York. BMJ. 2013;346:f921.
- , , . Mortality in elderly dementia patients treated with risperidone. J Clin Psychopharmacol. 2006;26(6):566–570.
- , , , et al. Medication reconciliation: a practical tool to reduce the risk of medication errors. J Crit Care. 2003;18(4):201–205.
- , , . Adverse drug event trigger tool: a practical methodology for measuring medication related harm. Qual Saf Health Care. 2003;12(3):194–200.
- , , , , . Improvement in the detection of adverse drug events by the use of electronic health and prescription records: an evaluation of two trigger tools. Eur J Clin Pharmacol. 2013;69(2):255–259.
- , . Adverse Drug Events in U.S. Hospitals, 2004. Rockville, MD: Agency for Healthcare Research and Quality; April 2007. Statistical Brief 29.
- , , . Medication‐Related Adverse Outcomes in U.S. Hospitals and Emergency Departments, 2008. Rockville, MD: Agency for Healthcare Research and Quality; April 2011. Statistical Brief 109.
- US Centers for Medicare and Medicaid Services. Hospital‐Acquired Conditions (Present on Admission Indicator). Available at: http://www.cms.hhs.gov/HospitalAcqCond/. Accessed August 16, 2011. Updated September 20, 2012.
- , , . Fracture risk associated with the use of morphine and opiates. J Intern Med. 2006;260(1):76–87.
- , , , . Comorbidity measures for use with administrative data. Med Care. 1998;36(1):8–27.
- Clinical Classifications Software, Healthcare Cost and Utilization Project (HCUP). Rockville, MD; Agency for Healthcare Research and Quality; December 2009.
- , , , , . Clinical application of opioid equianalgesic data. Clin J Pain. 2003;19(5)286–297.
- , , , , , . Choosing the unit of measurement counts: the use of oral morphine equivalents in studies of opioid consumption is a useful addition to defined daily doses. Palliat Med. 2011;25(7):725–732.
- , , , . Cost and quality implications of opioid‐based postsurgical pain control using administrative claims data from a large health system: opioid‐related adverse events and their impact on clinical and economic outcomes. Pharmacotherapy. 2013;33(4):383–391.
- , , , et al. Opioid‐related adverse drug events in surgical hospitalizations: impact on costs and length of stay. Ann Pharmacother. 2007;41(3):400–406.
- , , , et al. Cost of opioid‐related adverse drug events in surgical patients. J Pain Symptom Manage. 2003;25(3):276–283.
- , . Opioid analgesics and rates of fatal drug poisoning in the United States. Am J Prev Med. 2006;31(6):506–511.
- , , , et al. Geographic variation in the treatment of acute myocardial infarction: the Cooperative Cardiovascular Project. JAMA. 1999;281(7):627–633.
- , , , et al; GUSTO‐1 Investigators. Regional variation across the United States in the management of acute myocardial infarction. Global Utilization of Streptokinase and Tissue Plasminogen Activator for Occluded Coronary Arteries. N Engl J Med. 1995;333(9):565–572.
- , , . Predictors of broad‐spectrum antibiotic prescribing for acute respiratory tract infections in adult primary care. JAMA. 2003;289(6):719–725.
- , , . Geographic variation in Medicare drug spending. N Engl J Med. 2010;363(5):405–409.
- , , . Geographic variation in outpatient antibiotic prescribing among older adults. Arch Intern Med. 2012;172(19):1465–1471.
- , , , et al. Clinical policy: critical issues in the prescribing of opioids for adult patients in the emergency department. Ann Emerg Med. 2012;60(4):499–525.
- The Joint Commission. Facts About Pain Management. Available at: http://www.jointcommission.org/pain_management/. Accessed July 23, 2012.
- The Joint Commission. Sentinel Event Alert: Safe Use of Opioids in Hospitals. Published August 8, 2012. Available at: http://www.jointcommission.org/assets/1/18/SEA_49_opioids_8_2_12_final.pdf. Accessed March 4, 2013.
- , , , , . Research gaps on use of opioids for chronic noncancer pain: findings from a review of the evidence for an American Pain Society and American Academy of Pain Medicine clinical practice guideline. J Pain. 2009;10(2):147–159.
- , , , , , . Side effects of opioids during short‐term administration: effect of age, gender, and race. Clin Pharmacol Ther. 2003;74(2):102–112.
- , , , . Postoperative day one: a high‐risk period for respiratory events. Am J Surg. 2005;190(5):752–756.
Recent reports have drawn attention to the high and increasing rates of opioid prescribing and overdose‐related deaths in the United States.[1, 2, 3, 4, 5, 6, 7, 8, 9] These studies have focused on community‐based and emergency department prescribing, leaving prescribing practices in the inpatient setting unexamined. Given that pain is a frequent complaint in hospitalized patients, and that the Joint Commission mandates assessing pain as a vital sign, hospitalization is potentially a time of heightened use of such medications and could significantly contribute to nosocomial complications and subsequent outpatient use.[10] Variation in prescribing practices, unrelated to patient characteristics, could be a marker of inappropriate prescribing practices and poor quality of care.
Using a large, nationally representative cohort of admissions from July 2009 to June 2010, we sought to determine patterns and predictors of opioid utilization in nonsurgical admissions to US medical centers, hospital variation in use, and the association between hospital‐level use and the risk of opioid‐related adverse events. We hypothesized that hospitals with higher rates of opioid use would have an increased risk of an opioid‐related adverse event per patient exposed.
METHODS
Setting and Patients
We conducted a retrospective cohort study using data from 286 US nonfederal acute‐care facilities contributing to the database maintained by Premier (Premier Healthcare Solutions, Inc., Charlotte, NC). This database, created to measure healthcare utilization and quality of care, is drawn from voluntarily participating hospitals and contains data on approximately 1 in every 4 discharges nationwide.[11] Participating hospitals are similar in geographic distribution and metropolitan (urban/rural) status to hospitals nationwide, although large, nonteaching hospitals are slightly overrepresented in Premier. The database contains patient demographics, International Classification of Diseases, Ninth Revision, Clinical Modification (ICD‐9‐CM) codes, hospital demographics, and a date‐stamped log of all charges during the course of each hospitalization, including diagnostic tests, therapeutic treatments, and medications with dose and route of administration. The study was approved by the institutional review board at Beth Israel Deaconess Medical Center and granted a waiver of informed consent.
We studied a cohort of all adult nonsurgical admissions to participating hospitals from July 1, 2009, through June 30, 2010. We chose to study nonsurgical admissions, as patients undergoing surgical procedures have a clear indication for, and almost always receive, opioid pain medications. We defined a nonsurgical admission as an admission in which there were no charges for operating‐room procedures (including labor and delivery) and the attending of record was not a surgeon. We excluded admissions with unknown gender, since this is a key demographic variable, and admissions with a length of stay greater than 365 days, as these admissions are not representative of the typical admission to an acute‐care hospital. At the hospital level, we excluded hospitals contributing <100 admissions owing to resultant lack of precision in corresponding hospital prescribing rates, and hospitals that did not prescribe the full range of opioid medications (these hospitals had charges for codeine only), as these facilities seemed likely to have unusual limitations on prescribing or incomplete data capture.
Opioid Exposure
We defined opioid exposure as presence of 1 charge for an opioid medication during the admission. Opioid medications included morphine, hydrocodone, hydromorphone, oxycodone, fentanyl, meperidine, methadone, codeine, tramadol, buprenorphine, levorphanol, oxymorphone, pentazocine, propoxyphene, tapentadol, butorphanol, dezocine, and nalbuphine. We grouped the last 9 into an other category owing to infrequent use and/or differing characteristics from the main opioid drug types, such as synthetic, semisynthetic, and partial agonist qualities.
Severe Opioid‐Related Adverse Events
We defined severe opioid‐related adverse events as either naloxone exposure or an opioid‐related adverse drug event diagnosis code. Naloxone use in an adult patient exposed to opioids is one of the Institute for Healthcare Improvement's Trigger Tools for identifying adverse drug events[12] and previously has been demonstrated to have high positive predictive value for a confirmed adverse drug event.[13] We defined naloxone exposure as presence of 1 charge for naloxone. We excluded charges on hospital day 1 to focus on nosocomial events. We defined opioid‐related adverse drug events using ICD‐9‐CM diagnosis codes for poisoning by opioids (overdose, wrong substance given, or taken in error; ICD‐9‐CM 965.02, 965.09, E850.1, E850.2) and drugs causing adverse effects in therapeutic use (ICD‐9‐CM E935.1, E935.2), as specified in prior analyses by the Agency for Healthcare Research and Quality (AHRQ).[14, 15] To avoid capturing adverse events associated with outpatient use, we required the ICD‐9‐CM code to be qualified as not present on admission using the present on admission indicator required by the Centers for Medicare and Medicaid Services for all discharge diagnosis codes since 2008.[16]
Covariates of Interest
We were interested in the relationship between both patient and hospital characteristics and opioid exposure. Patient characteristics of interest included (1) demographic variables, such as age, sex, race (self‐reported by patients at the time of admission), marital status, and payer; (2) whether or not the patient spent any time in the intensive care unit (ICU); (3) comorbidities, identified via ICD‐9‐CM secondary diagnosis codes and diagnosis‐related groups using Healthcare Cost and Utilization Project Comorbidity Software, version 3.7, based on the work of Elixhauser et al[17, 18]; (4) primary ICD‐9‐CM discharge diagnosis groupings, selected based on hypothesized associations with receipt of opioids, and based on the Clinical Classifications Software (CCS)a diagnosis and procedure categorization scheme maintained by the AHRQ, and defined in the Appendix[19]; (5) and nonoperating‐room‐based procedures potentially necessitating opioids during the admission, selected from the 50 most common ICD‐9‐CM procedure codes in our cohort and grouped as cardiovascular procedures (catheterization and insertion of vascular stents), gastrointestinal procedures (upper and lower endoscopy), and mechanical ventilation, further defined in the Appendix. Hospital characteristics of interest included number of beds, population served (urban vs rural), teaching status, and US census region (Northeast, Midwest, South, West).
Statistical Analysis
We calculated the percent of admissions with exposure to any opioid and the percent exposed to each opioid, along with the total number of different opioid medications used during each admission. We also calculated the percent of admissions with parenteral administration and the percent of admissions with oral administration, among those exposed to the individual categories, and in aggregate. Because medications after discharge were unavailable in Premier's dataset, we report the percent of patients with a charge for opioids on the day of discharge.
We determined the daily dose of an opioid by taking the sum of the doses for that opioid charged on a given day. The average daily dose of an opioid was determined by taking the sum of the daily doses and dividing by the number of days on which 1 dose was charged. To facilitate comparison, all opioids, with the exception of those for which standard equivalences are unavailable (tramadol, other opioid category, oral fentanyl, epidural route for all), were converted to oral morphine equivalents using a standard equivalence conversion table.[20, 21] We excluded from our dosage calculations those charges for which standard morphine equivalence was unavailable, or for which dosage was missing. We also excluded from our dosage calculations any dose that was >3 standard deviations (SD) above the mean dose for that opioid, as such extreme values seemed physiologically implausible and more likely to be a data entry error that could lead to significant overestimation of the mean for that opioid.
All multivariable models used a generalized estimating equation (GEE) via the genmod procedure in SAS, with a Poisson distribution error term and a log link, controlling for repeated patient admissions with an autoregressive correlation structure.
To identify independent predictors of opioid receipt, we used a GEE model of opioid receipt where all patient and hospital characteristics listed in Table 1 were included as independent variables.
| Patient characteristics, N=1,139,419 | N | % |
|---|---|---|
| ||
| Age group, y | ||
| 1824 | 37,464 | 3 |
| 2534 | 66,541 | 6 |
| 3544 | 102,701 | 9 |
| 4554 | 174,830 | 15 |
| 5564 | 192,570 | 17 |
| 6574 | 196,407 | 17 |
| 75+ | 368,906 | 32 |
| Sex | ||
| Male | 527,062 | 46 |
| Female | 612,357 | 54 |
| Race | ||
| White | 711,993 | 62 |
| Black | 176,993 | 16 |
| Hispanic | 54,406 | 5 |
| Other | 196,027 | 17 |
| Marital status | ||
| Married | 427,648 | 38 |
| Single | 586,343 | 51 |
| Unknown/other | 125,428 | 11 |
| Primary insurance | ||
| Private/commercial | 269,725 | 24 |
| Medicare traditional | 502,301 | 44 |
| Medicare managed care | 126,344 | 11 |
| Medicaid | 125,025 | 11 |
| Self‐pay/other | 116,024 | 10 |
| ICU care | ||
| No | 1,023,027 | 90 |
| Yes | 116,392 | 10 |
| Comorbidities | ||
| AIDS | 5724 | 1 |
| Alcohol abuse | 79,633 | 7 |
| Deficiency anemias | 213,437 | 19 |
| RA/collagen vascular disease | 35,210 | 3 |
| Chronic blood‐loss anemia | 10,860 | 1 |
| CHF | 190,085 | 17 |
| Chronic pulmonary disease | 285,954 | 25 |
| Coagulopathy | 48,513 | 4 |
| Depression | 145,553 | 13 |
| DM without chronic complications | 270,087 | 24 |
| DM with chronic complications | 70,732 | 6 |
| Drug abuse | 66,886 | 6 |
| Hypertension | 696,299 | 61 |
| Hypothyroidism | 146,136 | 13 |
| Liver disease | 38,130 | 3 |
| Lymphoma | 14,032 | 1 |
| Fluid and electrolyte disorders | 326,576 | 29 |
| Metastatic cancer | 33,435 | 3 |
| Other neurological disorders | 124,195 | 11 |
| Obesity | 118,915 | 10 |
| Paralysis | 38,584 | 3 |
| PVD | 77,334 | 7 |
| Psychoses | 101,856 | 9 |
| Pulmonary circulation disease | 52,106 | 5 |
| Renal failure | 175,398 | 15 |
| Solid tumor without metastasis | 29,594 | 3 |
| Peptic ulcer disease excluding bleeding | 536 | 0 |
| Valvular disease | 86,616 | 8 |
| Weight loss | 45,132 | 4 |
| Primary discharge diagnoses | ||
| Cancer | 19,168 | 2 |
| Musculoskeletal injuries | 16,798 | 1 |
| Pain‐related diagnosesb | 101,533 | 9 |
| Alcohol‐related disorders | 16,777 | 1 |
| Substance‐related disorders | 13,697 | 1 |
| Psychiatric disorders | 41,153 | 4 |
| Mood disorders | 28,761 | 3 |
| Schizophrenia and other psychotic disorders | 12,392 | 1 |
| Procedures | ||
| Cardiovascular procedures | 59,901 | 5 |
| GI procedures | 31,224 | 3 |
| Mechanical ventilation | 7853 | 1 |
| Hospital characteristics, N=286 | ||
| Number of beds | ||
| <200 | 103 | 36 |
| 201300 | 63 | 22 |
| 301500 | 81 | 28 |
| >500 | 39 | 14 |
| Population served | ||
| Urban | 225 | 79 |
| Rural | 61 | 21 |
| Teaching status | ||
| Nonteaching | 207 | 72 |
| Teaching | 79 | 28 |
| US Census region | ||
| Northeast | 47 | 16 |
| Midwest | 63 | 22 |
| South | 115 | 40 |
| West | 61 | 21 |
To assess hospital variation in opioid prescribing after adjusting for patient characteristics, we used a GEE model of opioid receipt, controlling for all patient characteristics listed in Table 1. We then took the mean of the predicted probabilities of opioid receipt for the patients within each hospital in our cohort to derive the hospital prescribing rate adjusted for patient characteristics. We report the mean, SD, and range of the prescribing rates for the hospitals in our cohort before and after adjustment for patient characteristics.
To assess whether patients admitted to hospitals with higher rates of opioid prescribing have higher relative risk of severe opioid‐related adverse events, we stratified hospitals into opioid‐prescribing rate quartiles and compared the rates of opioid‐related adverse eventsboth overall and among opioid exposedbetween quartiles. To adjust for patient characteristics, we used a GEE model in which severe opioid‐related adverse event (yes/no) was the dependent variable and hospital‐prescribing rate quartile and all patient characteristics in Table 1 were independent variables. We also performed a sensitivity analysis in which we assessed the association between hospital prescribing‐rate quartile and the individual components of our composite outcome. Our results were qualitatively unchanged using this approach, and only the results of our main analysis are presented.
All analyses were carried out using SAS software, version 9.2 (SAS Institute Inc., Cary, NC).
RESULTS
Patient Admission Characteristics
There were 3,190,934 adult admissions to 300 acute‐care hospitals during our study period. After excluding admissions with a length of stay >365 days (n=25), missing patient sex (n=17), and charges for operating‐room procedures or a surgical attending of record (n=2,018,553), 1,172,339 admissions were available for analysis. There were 12 hospitals with incomplete opioid‐prescribing data (n=32,794) and 2 hospitals that contributed <100 admissions each (n=126), leaving 1,139,419 admissions in 286 hospitals in our analytic cohort. The median age of the cohort was 64 years (interquartile range, 4979 years), and 527,062 (46%) were men. Table 1 shows the characteristics of the admissions in the cohort.
Rate, Route, and Dose of Opioid Exposures
Overall, there were 576,373 (51%) admissions with charges for opioid medications. Among those exposed, 244,760 (43%) had charges for multiple opioids during the admission; 172,090 (30%) had charges for 2 different opioids; and 72,670 (13%) had charges for 3 different opioids. Table 2 shows the percent exposed to each opioid, the percent of exposed with parenteral and oral routes of administration, and the mean daily dose received in oral morphine equivalents.
| Exposed | Parenteral Administration | Oral Administration | Dose Received, in Oral Morphine Equivalents | |||||
|---|---|---|---|---|---|---|---|---|
| N | %a | N | %b | N | %b | Mean | SDc | |
| ||||||||
| All opioids | 576,373 | 51 | 378,771 | 66 | 371,796 | 65 | 68 | 185 |
| Morphine | 224,811 | 20 | 209,040 | 93 | 21,645 | 10 | 40 | 121 |
| Hydrocodone | 162,558 | 14 | 0 | 0 | 160,941 | 99 | 14 | 12 |
| Hydromorphone | 146,236 | 13 | 137,936 | 94 | 16,052 | 11 | 113 | 274 |
| Oxycodone | 126,733 | 11 | 0 | 0 | 125,033 | 99 | 26 | 37 |
| Fentanyl | 105,052 | 9 | 103,113 | 98 | 641 | 1 | 64 | 75 |
| Tramadol | 35,570 | 3 | 0 | 0 | 35,570 | 100 | ||
| Meperidine | 24,850 | 2 | 24,398 | 98 | 515 | 2 | 36 | 34 |
| Methadone | 15,302 | 1 | 370 | 2 | 14,781 | 97 | 337 | 384 |
| Codeine | 22,818 | 2 | 178 | 1 | 22,183 | 97 | 9 | 15 |
| Other | 45,469 | 4 | 5821 | 13 | 39,618 | 87 | ||
Among the medications/routes for which conversion to morphine equivalents was possible, dosage was missing in 39,728 out of 2,294,673 opioid charges (2%). The average daily dose received in oral morphine equivalents was 68 mg. A total dose of 50 mg per day was received in 39% of exposed, and a total dose of 100 mg per day was received in 23% of exposed. Among those exposed, 52% (26% of overall admissions) had charges for opioids on the day of discharge.
Rates of Opioid Use by Patient and Hospital Characteristics
Table 3 reports the association between admission characteristics and opioid use. Use was highest in patients between the ages of 25 and 54 years. Although use declined with age, 44% of admissions age 65 years had charges for opioid medication. After adjustment for patient demographics, comorbidities, and hospital characteristics, opioid use was more common in females than males, those age 2554 years compared with those older and younger, those of Caucasian race compared with non‐Caucasian race, and those with Medicare or Medicaid primary insurance. Among the primary discharge diagnoses, patients with musculoskeletal injuries, various specific and nonspecific pain‐related diagnoses, and cancer were significantly more likely to receive opioids than patients without these diagnoses, whereas patients with alcohol‐related disorders and psychiatric disorders were significantly less likely to receive opioids than patients without these diagnoses. Patients admitted to hospitals in the Midwest, South, and West were significantly more likely to receive opioid medications than patients in the Northeast.
| Exposed, N=576,373 | Unexposed, N=563,046 | % Exposed | Adjusted RRa | 95% CI | |
|---|---|---|---|---|---|
| |||||
| Patient characteristics | |||||
| Age group, y | |||||
| 1824 | 17,360 | 20,104 | 46 | (ref) | |
| 2534 | 37,793 | 28,748 | 57 | 1.17 | 1.16‐1.19 |
| 3544 | 60,712 | 41,989 | 59 | 1.16 | 1.15‐1.17 |
| 4554 | 103,798 | 71,032 | 59 | 1.11 | 1.09‐1.12 |
| 5564 | 108,256 | 84,314 | 56 | 1.00 | 0.98‐1.01 |
| 6574 | 98,110 | 98,297 | 50 | 0.84 | 0.83‐0.85 |
| 75+ | 150,344 | 218,562 | 41 | 0.71 | 0.70‐0.72 |
| Sex | |||||
| Male | 255,315 | 271,747 | 48 | (ref) | |
| Female | 321,058 | 291,299 | 52 | 1.11 | 1.10‐1.11 |
| Race | |||||
| White | 365,107 | 346,886 | 51 | (ref) | |
| Black | 92,013 | 84,980 | 52 | 0.93 | 0.92‐0.93 |
| Hispanic | 27,592 | 26,814 | 51 | 0.94 | 0.93‐0.94 |
| Other | 91,661 | 104,366 | 47 | 0.93 | 0.92‐0.93 |
| Marital status | |||||
| Married | 222,912 | 204,736 | 52 | (ref) | |
| Single | 297,742 | 288,601 | 51 | 1.00 | 0.99‐1.01 |
| Unknown/other | 55,719 | 69,709 | 44 | 0.94 | 0.93‐0.95 |
| Primary insurance | |||||
| Private/commercial | 143,954 | 125,771 | 53 | (ref) | |
| Medicare traditional | 236,114 | 266,187 | 47 | 1.10 | 1.09‐1.10 |
| Medicare managed care | 59,104 | 67,240 | 47 | 1.11 | 1.11‐1.12 |
| Medicaid | 73,583 | 51,442 | 59 | 1.13 | 1.12‐1.13 |
| Self‐pay/other | 63,618 | 52,406 | 55 | 1.03 | 1.02‐1.04 |
| ICU care | |||||
| No | 510,654 | 512,373 | 50 | (ref) | |
| Yes | 65,719 | 50,673 | 56 | 1.02 | 1.01‐1.03 |
| Comorbiditiesb | |||||
| AIDS | 3655 | 2069 | 64 | 1.09 | 1.07‐1.12 |
| Alcohol abuse | 35,112 | 44,521 | 44 | 0.92 | 0.91‐0.93 |
| Deficiency anemias | 115,842 | 97,595 | 54 | 1.08 | 1.08‐1.09 |
| RA/collagen vascular disease | 22,519 | 12,691 | 64 | 1.22 | 1.21‐1.23 |
| Chronic blood‐loss anemia | 6444 | 4416 | 59 | 1.04 | 1.02‐1.05 |
| CHF | 88,895 | 101,190 | 47 | 0.99 | 0.98‐0.99 |
| Chronic pulmonary disease | 153,667 | 132,287 | 54 | 1.08 | 1.08‐1.08 |
| Coagulopathy | 25,802 | 22,711 | 53 | 1.03 | 1.02‐1.04 |
| Depression | 83,051 | 62,502 | 57 | 1.08 | 1.08‐1.09 |
| DM without chronic complications | 136,184 | 133,903 | 50 | 0.99 | 0.99‐0.99 |
| DM with chronic complications | 38,696 | 32,036 | 55 | 1.04 | 1.03‐1.05 |
| Drug abuse | 37,202 | 29,684 | 56 | 1.14 | 1.13‐1.15 |
| Hypertension | 344,718 | 351,581 | 50 | 0.98 | 0.97‐0.98 |
| Hypothyroidism | 70,786 | 75,350 | 48 | 0.99 | 0.99‐0.99 |
| Liver disease | 24,067 | 14,063 | 63 | 1.15 | 1.14‐1.16 |
| Lymphoma | 7727 | 6305 | 55 | 1.16 | 1.14‐1.17 |
| Fluid and electrolyte disorders | 168,814 | 157,762 | 52 | 1.04 | 1.03‐1.04 |
| Metastatic cancer | 23,920 | 9515 | 72 | 1.40 | 1.39‐1.42 |
| Other neurological disorders | 51,091 | 73,104 | 41 | 0.87 | 0.86‐0.87 |
| Obesity | 69,584 | 49,331 | 59 | 1.05 | 1.04‐1.05 |
| Paralysis | 17,497 | 21,087 | 45 | 0.97 | 0.96‐0.98 |
| PVD | 42,176 | 35,158 | 55 | 1.11 | 1.11‐1.12 |
| Psychoses | 38,638 | 63,218 | 38 | 0.91 | 0.90‐0.92 |
| Pulmonary circulation disease | 26,656 | 25,450 | 51 | 1.05 | 1.04‐1.06 |
| Renal failure | 86,565 | 88,833 | 49 | 1.01 | 1.01‐1.02 |
| Solid tumor without metastasis | 16,258 | 13,336 | 55 | 1.14 | 1.13‐1.15 |
| Peptic ulcer disease excluding bleeding | 376 | 160 | 70 | 1.12 | 1.07‐1.18 |
| Valvular disease | 38,396 | 48,220 | 44 | 0.93 | 0.92‐0.94 |
| Weight loss | 25,724 | 19,408 | 57 | 1.09 | 1.08‐1.10 |
| Primary discharge diagnosesb | |||||
| Cancer | 13,986 | 5182 | 73 | 1.20 | 1.19‐1.21 |
| Musculoskeletal injuries | 14,638 | 2160 | 87 | 2.02 | 2.002.04 |
| Pain‐related diagnosesc | 64,656 | 36,877 | 64 | 1.20 | 1.20‐1.21 |
| Alcohol‐related disorders | 3425 | 13,352 | 20 | 0.46 | 0.44‐0.47 |
| Substance‐related disorders | 8680 | 5017 | 63 | 1.03 | 1.01‐1.04 |
| Psychiatric disorders | 7253 | 33,900 | 18 | 0.37 | 0.36‐0.38 |
| Mood disorders | 5943 | 22,818 | 21 | ||
| Schizophrenia and other psychotic disorders | 1310 | 11,082 | 11 | ||
| Proceduresb | |||||
| Cardiovascular procedures | 50,997 | 8904 | 85 | 1.80 | 1.79‐1.81 |
| GI procedures | 27,206 | 4018 | 87 | 1.70 | 1.69‐1.71 |
| Mechanical ventilation | 5341 | 2512 | 68 | 1.37 | 1.34‐1.39 |
| Hospital characteristics | |||||
| Number of beds | |||||
| <200 | 100,900 | 88,439 | 53 | (ref) | |
| 201300 | 104,213 | 99,995 | 51 | 0.95 | 0.95‐0.96 |
| 301500 | 215,340 | 209,104 | 51 | 0.94 | 0.94‐0.95 |
| >500 | 155,920 | 165,508 | 49 | 0.96 | 0.95‐0.96 |
| Population served | |||||
| Urban | 511,727 | 506,803 | 50 | (ref) | |
| Rural | 64,646 | 56,243 | 53 | 0.98 | 0.97‐0.99 |
| Teaching status | |||||
| Nonteaching | 366,623 | 343,581 | 52 | (ref) | |
| Teaching | 209,750 | 219,465 | 49 | 1.00 | 0.99‐1.01 |
| US Census region | |||||
| Northeast | 99,377 | 149,446 | 40 | (ref) | |
| Midwest | 123,194 | 120,322 | 51 | 1.26 | (1.25‐1.27) |
| South | 251,624 | 213,029 | 54 | 1.33 | (1.33‐1.34) |
| West | 102,178 | 80,249 | 56 | 1.37 | (1.36‐1.38) |
Variation in Opioid Prescribing
Figure 1 shows the histograms of hospital opioid prescribing rate for the 286 hospitals in our cohort (A) before and (B) after adjustment for patient characteristics. The observed rates ranged from 5% in the lowest‐prescribing hospital to 72% in the highest‐prescribing hospital, with a mean (SD) of 51% (10%). After adjusting for patient characteristics, the adjusted opioid‐prescribing rates ranged from 33% to 64%, with a mean (SD) of 50% (4%).
Severe Opioid‐Related Adverse Events
Among admissions with opioid exposure (n=576,373), naloxone use occurred in 2345 (0.41%) and opioid‐related adverse drug events in 1174 (0.20%), for a total of 3441 (0.60%) severe opioid‐related adverse events (some patients experienced both). Table 4 reports the opioid exposure and severe opioid‐related adverse‐event rates within hospital opioid‐prescribing rate quartiles, along with the adjusted association between the hospital opioid‐prescribing rate quartile and severe opioid‐related adverse events. After adjusting for patient characteristics, the relative risk of a severe opioid‐related adverse event was significantly greater in hospitals with higher opioid‐prescribing rates, both overall and among opioid exposed.
| Quartile | No. of Patients | Opioid Exposed, n (%) | Opioid‐Related Adverse Events, n (%) | Adjusted RR in All Patients, RR (95% CI), N=1,139,419a | Adjusted RR in Opioid Exposed, RR (95% CI), N=576,373a |
|---|---|---|---|---|---|
| |||||
| 1 | 349,747 | 132,824 (38) | 719 (0.21) | (ref) | (ref) |
| 2 | 266,652 | 134,590 (50) | 729 (0.27) | 1.31 (1.17‐1.45) | 1.07 (0.96‐1.18) |
| 3 | 251,042 | 139,770 (56) | 922 (0.37) | 1.72 (1.56‐1.90) | 1.31 (1.19‐1.44) |
| 4 | 271,978 | 169,189 (62) | 1071 (0.39) | 1.73 (1.57‐1.90) | 1.23 (1.12‐1.35) |
DISCUSSION
In this analysis of a large cohort of hospitalized nonsurgical patients, we found that more than half of all patients received opioids, with 43% of those exposed receiving multiple opioids during their admission and 52% receiving opioids on the day of discharge. Considerable hospital variation in opioid use was evident, and this was not fully explained by patient characteristics. Severe opioid‐related adverse events occurred more frequently at hospitals with higher opioid‐prescribing rates, and the relative risk of a severe adverse event per patient prescribed opioids was also higher in these hospitals. To our knowledge, this is the first study to describe the scope of opioid utilization and the relationship between utilization and severe opioid‐related adverse events in a sample of nonsurgical patients in US acute‐care facilities.
Our use of naloxone charges and opioid‐specific ICD‐9‐CM coding to define an opioid‐related adverse event was intended to capture only the most severe opioid‐related adverse events. We chose to focus on these events in our analysis to maximize the specificity of our outcome definition and thereby minimize confounding in our observed associations. The rate of less‐severe opioid‐related adverse events, such as nausea, constipation, and pruritis, is likely much higher and not captured in our outcome definition. Prior analyses have found variable rates of opioid‐related adverse events of approximately 1.8% to 13.6% of exposed patients.[22, 23, 24] However, these analyses focused on surgical patients and included less‐severe events. To our knowledge, ours is the first analysis of severe opioid‐related adverse events in nonsurgical patients.
Our finding that severe opioid‐related adverse events increase as opioid prescribing increases is consistent with that which has been demonstrated in the community setting, where rates of opioid‐related adverse events and mortality are higher in communities with higher levels of opioid prescribing.[2, 8, 25] This finding is expected, as greater use of a class of medications with known side effects would be expected to result in a higher overall rate of adverse events. More concerning, however, is the fact that this relationship persists when focusing exclusively on opioid‐exposed patients. Among similar patients receiving opioids at different hospitals, those hospitalized in facilities with higher opioid‐prescribing rates have higher rates of severe opioid‐related adverse events. This suggests that hospitals that use opioids more frequently do not do so more safely. Rather, the increased overall prescribing rates are associated with heightened risk for a serious adverse event per patient exposed and may reflect unsafe prescribing practices.
Furthermore, our results demonstrate both regional and hospital variation in use of opioids not fully explained by patient characteristics, similar to that which has been demonstrated for other drugs and heathcare services.[26, 27, 28, 29, 30] The implications of these findings are limited by our lack of information on pain severity or prior outpatient treatment, and our resultant inability to evaluate the appropriateness of opioid use in this analysis. Additionally, although we controlled for a large number of patient and hospital characteristics, there could be other significant predictors of use not accounted for in our analysis. However, it seems unlikely that differential pain severity or patient characteristics between patients in different regions of the country could fully explain a 37% relative difference in prescribing between the lowest‐ and highest‐prescribing regions, after accounting for the 44 patient‐level variables in our models. Whereas variation in use unrelated to patient factors could represent inappropriate prescribing practices, it could also be a marker of uncertainty regarding what constitutes appropriate prescribing and high‐quality care in this realm. Although guidelines advocate for standard pain assessments and a step‐up approach to treatment,[31, 32, 33] the lack of objective measures of pain severity and lack of evidence‐based recommendations on the use of opioids for noncancer pain[34] will almost certainly lead to persistent variation in opioid prescribing despite guideline‐driven care.
Nonetheless, our findings suggest that opportunities exist to make opioid prescribing safer in hospitalized patients. Studies aimed at elucidating the source of regional and hospital variation are necessary. Additionally, efforts should focus on identifying patient and prescribing characteristics associated with heightened risk of opioid‐related adverse events. Prior studies have demonstrated that the risks of opioid medications increase with increasing age of the patient.[35, 36] Although opioid use in our cohort declined with age, 44% of admissions age 65 years had charges for opioid medications. Studies in outpatients have also demonstrated that the risks of opioid overdose and overdose‐related death increase with dose.[5, 7] One study demonstrated a 3.7‐fold increased risk of overdose at doses of 5099 mg/day in oral morphine equivalents, and an 8.9‐fold increased risk at doses of 100 mg/day, compared with doses of 20 mg/day.[7] The prevalence of high dose exposure observed in our cohort, coupled with the older age of hospitalized patients, suggests potential targets for promoting safer use in hospitalized patients through interventions such as computerized decision support and enhanced monitoring in those at highest risk.
Because medications after discharge were unavailable in our dataset, the percentage of patients given a prescription for opioid medication on discharge is unknown. However, given that opioids are often tapered rather than abruptly discontinued, our finding that 26% of hospitalized nonsurgical patients received opioids on the day of discharge suggests that a substantial proportion of patients may be discharged with a prescription for opioid medication. Given the possibility of coexistent outpatient opioid prescriptions, these findings draw attention to the importance of assuring development and streamlined accessibility of data from state prescription drug monitoring programs and suggest that increased attention should be paid to the role that inpatient opioid prescribing plays in the increased rates of chronic opioid use and overdose‐related deaths in the United States.
There are additional limitations to our analysis. First, although the database used for this analysis captures a large proportion of admissions to US acute‐care facilities and is similar in composition, it is possible that participating medical centers differ from nonparticipating medical centers in ways that could be associated with opioid prescribing. Additionally, although Premier performs extensive validation and correction processes to assure the quality of their data, there is still likely to be a small amount of random error in the database, which could particularly impact dosage calculations. The lack of preadmission medications in our database precluded identification of the proportion of patients newly started on opioid medications. Lastly, it is possible that the hospital prescribing‐rate quartile is associated with patient characteristics unaccounted for in our analysis, and, therefore, the possibility of residual confounding still exists.
In conclusion, the majority of hospitalized nonsurgical patients are exposed to opioid medications during the course of their hospitalizations, often at high doses. More than half of those exposed are still receiving these medications on the day of discharge. We found hospital and regional variation in opioid use that was not fully explained by patient characteristics, and higher levels of hospital use were associated with higher risk of severe opioid‐related adverse events in opioid‐exposed patients. Further research is necessary to investigate the appropriateness of opioid use in this patient population, the sources of variation in use, and the predictors of opioid‐related adverse events in hospitalized patients to allow development of interventions to make hospital use safer.
Disclosures
Disclosures: Dr. Herzig had full access to all of the data in the study and takes responsibility for the integrity of the data and the accuracy of the data analysis. Dr. Herzig was funded by grant no. K23AG042459 from the National Institute on Aging. Dr. Marcantonio was funded by grant nos. P01AG031720, R01AG030618, R03AG028189, and K24AG035075 from the National Institute on Aging. The funding organization had no involvement in any aspect of the study, including design, conduct, and reporting of the study. None of the authors have any conflicts of interest to disclose.
- . A flood of opioids, a rising tide of deaths. N Engl J Med. 2010;363(21):1981–1985.
- , , . Increasing deaths from opioid analgesics in the United States. Pharmacoepidemiol Drug Saf. 2006;15(9):618–627.
- , , , . Trends in opioid prescribing by race/ethnicity for patients seeking care in US emergency departments. JAMA. 2008;299(1):70–78.
- , , , . Trends in medical use and abuse of opioid analgesics. JAMA. 2000;283(13):1710–1714.
- , , , et al. Association between opioid prescribing patterns and opioid overdose‐related deaths. JAMA. 2011;305(13):1315–1321.
- , , , et al. Prescription opioid mortality trends in New York City, 1990–2006: examining the emergence of an epidemic. Drug Alcohol Depend. 2013;132(1‐2):53–62.
- , , , et al. Opioid prescriptions for chronic pain and overdose: a cohort study. Ann Intern Med. 2010;152(2):85–92.
- , , , et al. Relationship of opioid prescription sales and overdoses, North Carolina. Drug Alcohol Depend. 2013;132(1‐2):81–86.
- Deaths from prescription opioids soar in New York. BMJ. 2013;346:f921.
- , , . Mortality in elderly dementia patients treated with risperidone. J Clin Psychopharmacol. 2006;26(6):566–570.
- , , , et al. Medication reconciliation: a practical tool to reduce the risk of medication errors. J Crit Care. 2003;18(4):201–205.
- , , . Adverse drug event trigger tool: a practical methodology for measuring medication related harm. Qual Saf Health Care. 2003;12(3):194–200.
- , , , , . Improvement in the detection of adverse drug events by the use of electronic health and prescription records: an evaluation of two trigger tools. Eur J Clin Pharmacol. 2013;69(2):255–259.
- , . Adverse Drug Events in U.S. Hospitals, 2004. Rockville, MD: Agency for Healthcare Research and Quality; April 2007. Statistical Brief 29.
- , , . Medication‐Related Adverse Outcomes in U.S. Hospitals and Emergency Departments, 2008. Rockville, MD: Agency for Healthcare Research and Quality; April 2011. Statistical Brief 109.
- US Centers for Medicare and Medicaid Services. Hospital‐Acquired Conditions (Present on Admission Indicator). Available at: http://www.cms.hhs.gov/HospitalAcqCond/. Accessed August 16, 2011. Updated September 20, 2012.
- , , . Fracture risk associated with the use of morphine and opiates. J Intern Med. 2006;260(1):76–87.
- , , , . Comorbidity measures for use with administrative data. Med Care. 1998;36(1):8–27.
- Clinical Classifications Software, Healthcare Cost and Utilization Project (HCUP). Rockville, MD; Agency for Healthcare Research and Quality; December 2009.
- , , , , . Clinical application of opioid equianalgesic data. Clin J Pain. 2003;19(5)286–297.
- , , , , , . Choosing the unit of measurement counts: the use of oral morphine equivalents in studies of opioid consumption is a useful addition to defined daily doses. Palliat Med. 2011;25(7):725–732.
- , , , . Cost and quality implications of opioid‐based postsurgical pain control using administrative claims data from a large health system: opioid‐related adverse events and their impact on clinical and economic outcomes. Pharmacotherapy. 2013;33(4):383–391.
- , , , et al. Opioid‐related adverse drug events in surgical hospitalizations: impact on costs and length of stay. Ann Pharmacother. 2007;41(3):400–406.
- , , , et al. Cost of opioid‐related adverse drug events in surgical patients. J Pain Symptom Manage. 2003;25(3):276–283.
- , . Opioid analgesics and rates of fatal drug poisoning in the United States. Am J Prev Med. 2006;31(6):506–511.
- , , , et al. Geographic variation in the treatment of acute myocardial infarction: the Cooperative Cardiovascular Project. JAMA. 1999;281(7):627–633.
- , , , et al; GUSTO‐1 Investigators. Regional variation across the United States in the management of acute myocardial infarction. Global Utilization of Streptokinase and Tissue Plasminogen Activator for Occluded Coronary Arteries. N Engl J Med. 1995;333(9):565–572.
- , , . Predictors of broad‐spectrum antibiotic prescribing for acute respiratory tract infections in adult primary care. JAMA. 2003;289(6):719–725.
- , , . Geographic variation in Medicare drug spending. N Engl J Med. 2010;363(5):405–409.
- , , . Geographic variation in outpatient antibiotic prescribing among older adults. Arch Intern Med. 2012;172(19):1465–1471.
- , , , et al. Clinical policy: critical issues in the prescribing of opioids for adult patients in the emergency department. Ann Emerg Med. 2012;60(4):499–525.
- The Joint Commission. Facts About Pain Management. Available at: http://www.jointcommission.org/pain_management/. Accessed July 23, 2012.
- The Joint Commission. Sentinel Event Alert: Safe Use of Opioids in Hospitals. Published August 8, 2012. Available at: http://www.jointcommission.org/assets/1/18/SEA_49_opioids_8_2_12_final.pdf. Accessed March 4, 2013.
- , , , , . Research gaps on use of opioids for chronic noncancer pain: findings from a review of the evidence for an American Pain Society and American Academy of Pain Medicine clinical practice guideline. J Pain. 2009;10(2):147–159.
- , , , , , . Side effects of opioids during short‐term administration: effect of age, gender, and race. Clin Pharmacol Ther. 2003;74(2):102–112.
- , , , . Postoperative day one: a high‐risk period for respiratory events. Am J Surg. 2005;190(5):752–756.
© 2013 Society of Hospital Medicine
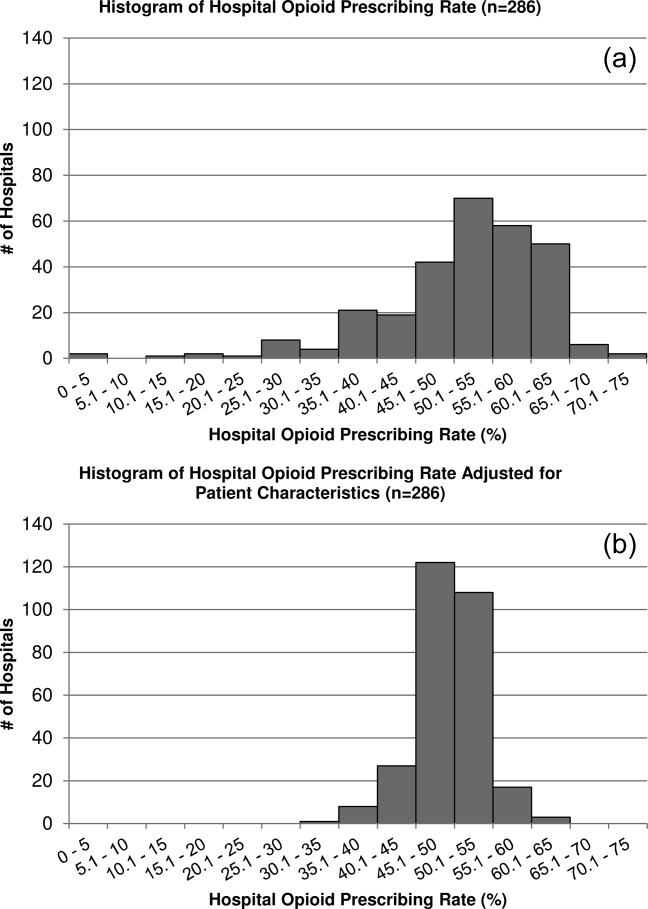
Caring About Prognosis
Prognostication continues to be a challenge to the clinician despite over 100 prognostic indices that have been developed during the past few decades to inform clinical practice and medical decision making.[1] Physicians are not accurate in prognostication of patients' risk of death and tend to overestimate survival.[2, 3] In addition, many physicians do not feel comfortable offering a prognosis to patients, despite patients' wishes to be informed.[4, 5] Regardless of the prevalence in the literature and value in improving physicians' prognostic accuracy, prognostic indices of survival are not regularly utilized in the hospital setting. Prognostic tools available for providers are often complicated and may require data about patients that are not readily available.[6, 7, 8] Prognostic indices may be too specific to a patient population, too difficult to remember, or too time consuming to use. A simple, rapid, and practical prognostic index is important in the hospital setting to assist in identifying patients at high risk of death so that primary palliative interventions can be incorporated into the plan of care early in the hospital stay. Patient and family education, advance care planning, formulating the plan of care based on patientfamily goals, and improved resource utilization could be better executed by more accurate risk of death prediction on hospital admission.
The CARING criteria are the only prognostic index to our knowledge that evaluates a patient's risk of death in the next year, with information readily available at the time of hospital admission (Table 1).[9] The CARING criteria are a unique prognostic tool: (1) CARING is a mnemonic acronym, making it more user friendly to the clinician. (2) The 5 prognostic indicators are readily available from the patient's chart on admission; gathering further data by patient or caretaker interviews or by obtaining laboratory data is not needed. (3) The timing for application of the tool on admission to the hospital is an ideal opportunity to intervene and introduce palliative interventions early on the hospital stay. The CARING criteria were developed and validated in a Veteran's Administration hospital setting by Fischer et al.[9] We sought to validate the CARING criteria in a broader patient populationmedical and surgical patients from a tertiary referral university hospital setting and a safety‐net hospital setting.
METHODS
Study Design
This study was a retrospective observational cohort study. The study was approved by the Colorado Multiple Institutional Review Board and the University of Colorado Hospital Research Review Committee.
Study Purpose
To validate the CARING criteria in a tertiary referral university hospital (University of Colorado Hospital [UCH]) and safety‐net hospital (Denver Health and Hospitals [DHH]) setting using similar methodology to that employed by the original CARING criteria study.[9]
Study Setting/Population
All adults (18 years of age) admitted as inpatients to the medical and surgical services of internal medicine, hospitalist, pulmonary, cardiology, hematology/oncology, hepatology, surgery, intensive care unit, and intermediary care unit at UCH and DHH during the study period of July 2005 through August 2005. The only exclusion criteria were those patients who were prisoners or pregnant. Administrative admission data from July 2005 to August 2005 were used to identify names of all persons admitted to the medicine and surgical services of the study hospitals during the specified time period.
The 2 study hospitals, UCH and DHH, provide a range of patients who vary in ethnicity, socioeconomic status, and medical illness. This variability allows for greater generalizability of the results. Both hospitals are affiliated with the University of Colorado School of Medicine internal medicine residency training program and are located in Denver, Colorado.
At the time of the study, UCH was a licensed 550‐bed tertiary referral, academic hospital serving the Denver metropolitan area and the Rocky Mountain region as a specialty care and referral center. DHH was a 398‐bed, academic, safety‐net hospital serving primarily the Denver metropolitan area. DHH provides 42% of the care for the uninsured in Denver and 26% of the uninsured care for the state of Colorado.
Measures
The CARING criteria were developed and validated in a Veteran's Administration (VA) hospital setting by Fischer et al.[9] The purpose of the CARING criteria is to identify patients, at the time of hospital admission, who are at higher risk of death in the following year. The prognostic index uses 5 predictors that can be abstracted from the chart at time of admission. The CARING criteria were developed a priori, and patients were evaluated using only the medical data available at the time of admission. The criteria include items that are already part of the routine physician admission notes and do not require additional data collection or assessments. The criteria include: C=primary diagnosis of cancer, A=2 admissions to the hospital for a chronic illness within the last year; R=resident in a nursing home; I=intensive care unit (ICU) admission with multiorgan failure (MOF), NG=noncancer hospice guidelines (meeting 2 of the National Hospice and Palliative Care Organization's [NHPCO] guidelines).
Patients were identified using name, date of birth, social security number, address, and phone number. This identifying information was then used for tracing death records 1 year after hospital admission.
Mortality at 1 year following the index hospitalization was the primary end point. To minimize missing data and the number of subjects lost to follow‐up, 3 determinants of mortality were used. First, electronic medical records of the 2 participating hospitals and their outpatient clinics were reviewed to determine if a follow‐up appointment had occurred past the study's end point of 1 year (August 2006). For those without a confirmed follow‐up visit, death records from the Colorado Department of Public Health and Vital Records were obtained. For those patients residing outside of Colorado or whose mortality status was still unclear, the National Death Index was accessed.
Medical Record Review
Medical records for all study participants were reviewed by J.Y. (UCH) and B.C. (DHH). Data collection was completed using direct data entry into a Microsoft Access (Microsoft Corp., Redmond, WA) database utilizing a data entry form linked with the database table. This form utilized skip patterns and input masks to ensure quality of data entry and minimize missing or invalid data. Inter‐rater reliability was assessed by an independent rereview (S.F.) of 5% of the total charts. Demographic variables were collected using hospital administrative data. These included personal identifiers of the participants for purposes of mortality follow‐up. Clinical data including the 5 CARING variables and additional descriptive variables were abstracted from the paper hospital chart and the electronic record of the chart (together these constitute the medical record).
Death Follow‐up
A search of Colorado death records was conducted in February 2011 for all subjects. Death records were used to determine mortality and time to death from the index hospitalization. The National Death Index was then searched for any subjects without or record of death in Colorado.
Analysis
All analyses were conducted using the statistical application software SAS for Windows version 9.3 (SAS Institute, Cary, NC). Simple frequencies and means ( standard deviation) were used to describe the baseline characteristics. Multiple logistic regression models were used to model 1‐year mortality. The models were fitted using all of the CARING variables and age. As the aim of the study was to validate the CARING criteria, the variables for the models were selected a priori based on the original index. Two hospital cohorts (DHH and UCH) were modeled separately and as a combined sample. Kaplan‐Meier survival analysis was conducted to compare those subjects who met 1 of the CARING criteria with those who did not through the entire period of mortality follow‐up (20052011). Finally, using the probabilities from the logistic regression models, we again developed a scoring rule appropriate for a non‐VA setting to allow clinicians to easily identify patient risk for 1‐year mortality at the time of hospital admission.
RESULTS
There were a total of 1064 patients admitted to the medical and surgical services during the study period568 patients at DHH and 496 patients at UCH. Sample characteristics of each individual hospital cohort and the entire combined study cohort are detailed in Table 2. Overall, slightly over half the population were male, with a mean age of 50 years, and the ethnic breakdown roughly reflects the population in Denver. A total of 36.5% (n=388) of the study population met 1 of the CARING criteria, and 12.6% (n=134 among 1063 excluding 1 without an admit date) died within 1 year of the index hospitalization. These were younger and healthier patients compared to the VA sample used in developing the CARING criteria.
| |
| Renal | Dementia |
| Stop/decline dialysis | Unable to ambulate independently |
| Not candidate for transplant | Urinary or fecal incontinence |
| Urine output < 40cc/24 hours | Unable to speak with more than single words |
| Creatinine > 8.0 (>6.0 for diabetics) | Unable to bathe independently |
| Creatinine clearance 10cc/min | Unable to dress independently |
| Uremia | Co‐morbid conditions: |
| Persistent serum K + > 7.0 | Aspiration pneumonia |
| Co‐morbid conditions: | Pyelonephritis |
| Cancer CHF | Decubitus ulcer |
| Chronic lung disease AIDS/HIV | Difficulty swallowing or refusal to eat |
| Sepsis Cirrhosis | |
| Cardiac | Pulmonary |
| Ejection fraction < 20% | Dyspnea at rest |
| Symptomatic with diuretics and vasodilators | FEV1 < 30% |
| Not candidate for transplant | Frequent ER or hospital admits for pulmonary infections or respiratory distress |
| History of cardiac arrest | Cor pulmonale or right heart failure |
| History of syncope | 02 sat < 88% on 02 |
| Systolic BP < 120mmHG | PC02 > 50 |
| CVA cardiac origin | Resting tachycardia > 100/min |
| Co‐morbid conditions as listed in Renal | Co‐morbid conditions as listed in Renal |
| Liver | Stroke/CVA |
| End stage cirrhosis | Coma at onset |
| Not candidate for transplant | Coma >3 days |
| Protime > 5sec and albumin <2.5 | Limb paralysis |
| Ascites unresponsive to treatment | Urinary/fecal incontinence |
| Hepatorenal syndrome | Impaired sitting balance |
| Hepatic encephalopathy | Karnofsky < 50% |
| Spontaneous bacterial peritonitis | Recurrent aspiration |
| Recurrent variceal bleed | Age > 70 |
| Co‐morbid conditions as listed in Renal | Co‐morbid conditions as listed in Renal |
| HIV/AIDS | Neuromuscular |
| Persistent decline in function | Diminished respiratory function |
| Chronic diarrhea 1 year | Chosen not to receive BiPAP/vent |
| Decision to stop treatment | Difficulty swallowing |
| CNS lymphoma | Diminished functional status |
| MAC‐untreated | Incontinence |
| Systemic lymphoma | Co‐morbid conditions as listed in Renal |
| Dilated cardiomyopathy | |
| CD4 < 25 with disease progression | |
| Viral load > 100,000 | |
| Safety‐Net Hospital Cohort, N=568 | Academic Center Cohort, N=496 | Study Cohort,N=1064 | Original CARING Cohort, N=8739 | |
|---|---|---|---|---|
| ||||
| Mean age ( SD), y | 47.8 (16.5) | 54.4 (17.5) | 50.9 (17.3) | 63 (13) |
| Male gender | 59.5% (338) | 50.1% (248) | 55.1% (586) | 98% (856) |
| Ethnicity | ||||
| African American | 14.1% (80) | 13.5% (65) | 13.8% (145) | 13% (114) |
| Asian | 0.4% (2) | 1.5% (7) | 0.9% (9) | Not reported |
| Caucasian | 41.7% (237) | 66.3% (318) | 53.0 % (555) | 69% (602) |
| Latino | 41.9% (238) | 9.6% (46) | 27.1% (284) | 8% (70) |
| Native American | 0.5% (3) | 0.4% (2) | 0.5% (5) | Not reported |
| Other | 0.5% (3) | 0.6% (3) | 0.6% (6) | 10% (87) |
| Unknown | 0.9% (5) | 8.1% (39) | 4.2% (44) | Not reported |
| CARING criteria | ||||
| Cancer | 6.2% (35) | 19.4% (96) | 12.3% (131) | 23% (201) |
| Admissions to the hospital 2 in past year | 13.6% (77) | 42.7% (212) | 27.2% (289) | 36% (314) |
| Resident in a nursing home | 1.8% (10) | 3.4% (17) | 2.5% (27) | 3% (26) |
| ICU with MOF | 3.7% (21) | 1.2% (6) | 2.5% (27) | 2% (17) |
| NHPCO (2) noncancer guidelines | 1.6% (9) | 5.9% (29) | 3.6% (38) | 8% (70) |
Reliability testing demonstrated excellent inter‐rater reliability. Kappa for each criterion is as follows: (1) primary diagnosis of cancer=1.0, (2) 2 admissions to the hospital in the past year=0.91, (3) resident in a nursing home=1.0, (4) ICU admission with MOF=1.0, and (5) 2 noncancer hospice guidelines=0.78.
This study aimed to validate the CARING criteria9; therefore, all original individual CARING criterion were included in the validation logistic regression models. The 1 exception to this was in the university hospital study cohort, where the ICU criterion was excluded from the model due to small sample size and quasiseparation in the model. The model results are presented in Table 3 for the individual hospitals and combined study cohort.
| Safety Net Hospital Cohort, C Index=0.76 | Academic Center Cohort, C Index=0.76 | Combined Hospital Cohort, C Index=0.79 | ||||
|---|---|---|---|---|---|---|
| Estimate | Odds Ratio (95% CI) | Estimate | Odds Ratio (95% CI) | Estimate | Odds Ratio (95% CI) | |
| ||||||
| Cancer | 1.92 | 6.85 (2.83‐16.59)a | 1.85 | 6.36 (3.54‐11.41)a | 1.98 | 7.23 (4.45‐11.75)a |
| Admissions to the hospital 2 in past year | 0.55 | 1.74 (0.76‐3.97) | 0.14 | 0.87 (0.51‐1.49) | 0.20 | 1.22 (0.78‐1.91) |
| Resident in a nursing home | 0.49 | 0.61 (0.06‐6.56) | 0.27 | 1.31 (0.37‐4.66) | 0.09 | 1.09 (0.36‐3.32) |
| ICU with MOF | 1.85 | 6.34 (2.0219.90)a | 1.94 | 6.97 (2.75‐17.68)a | ||
| NHPCO (2) noncancer guidelines | 3.04 | 20.86 (4.25102.32)a | 2.62 | 13.73 (5.86‐32.15)a | 2.74 | 15.55 (7.2833.23)a |
| Ageb | 0.38 | 1.46 (1.05‐2.03)a | 0.45 | 1.56 (1.23‐1.98)a | 0.47 | 1.60 (1.32‐1.93)a |
In the safety‐net hospital, admission to the hospital with a primary diagnosis related to cancer, 2 noncancer hospice guidelines, ICU admission with MOF, and age by category all were significant predictors of 1‐year mortality. In the university hospital cohort, primary diagnosis of cancer, 2 noncancer hospice guidelines, and age by category were predictive of 1‐year mortality. Finally, in the entire study cohort, primary diagnosis of cancer, ICU with MOF, 2 noncancer hospice guidelines, and age were all predictive of 1‐year mortality. Parameter estimates were similar in 3 of the criteria compared to the VA setting. Differences in patient characteristics may have caused the differences in the estimates. Gender was additionally tested but not significant in any model. One‐year survival was significantly lower for those who met 1 of the CARING criteria versus those who did not (Figure 1).

Based on the framework from the original CARING criteria analysis, a scoring rule was developed using the regression results of this validation cohort. To predict a high probability of 1‐year mortality, sensitivity was set to 58% and specificity was set at 86% (error rate=17%). Medium to high probability was set with a sensitivity of 73% and specificity of 72% (error rate=28%). The coefficients from the regression model of the entire study cohort were converted to scores for each of the CARING criteria. The scores are as follows: 0.5 points for admission from a nursing home, 1 point for 2 hospital admissions in the past year for a chronic illness, 10 points for primary diagnosis of cancer, 10 points for ICU admission with MOF, and 14 points for 2 noncancer hospice guidelines. For every age category increase, 2 points are assigned so that 0 points for age <55 years, 2 points for ages 56 to 65 years, 4 points for ages 66 to 75 years, and 6 points for >75 years. Points for individual risk factors were proportional to s (ie, log odds) in the logistic regression model for death at 1 year. Although no linear transformation exists between s and probabilities (of death at 1 year), the aggregated points for combinations of risk factors shown in Table 4 follow the probabilities in an approximately linear fashion, so that different degrees of risk of death can be represented contiguously (as highlighted by differently shaded regions in the scoring matrix) (Table 4). The scoring matrix allows for quick identification for patients at high risk for 1‐year mortality. In this non‐VA setting with healthier patients, low risk is defined at a lower probability threshold (0.1) compared to the VA setting (0.175).
| CARING Criteria Components | |||||||
|---|---|---|---|---|---|---|---|
| None | Resident in a Nursing Home | Admitted to the Hospital 2 Times in the Past Year | Resident in a Nursing Home Admitted to the Hospital 2 Times in the Past Year | Primary Diagnosis of Cancer | ICU Admission With MOF | Noncancer Hospice Guidelines | |
| |||||||
| Age | |||||||
| 55 years | 0 | 0.5 | 1 | 1.5 | 10 | ||
| 5565 years | 2 | 2.5 | 3 | 3.5 | 10 | ||
| 6675 years | 4 | 4.5 | 5 | 5.5 | 10 | ||
| >75 years | 6 | 6.5 | 7 | 7.5 | 10 | ||
| Risk | |||||||
| Low | 3.5 | Probability<0.1 | |||||
| Medium | 46.5 | 0.1probability <0.175 | |||||
| High | 7 | Probability0.175 | |||||
DISCUSSION
The CARING criteria are a practical prognostic tool that can be easily and rapidly applied to patients admitted to the hospital to estimate risk of death in 1 year, with the goal of identifying patients who may benefit most from incorporating palliative interventions into their plan of care. This study validated the CARING criteria in a tertiary referral university hospital and safety‐net hospital setting, demonstrating applicability in a much broader population than the VA hospital of the original CARING criteria study. The population studied represented a younger population by over 10 years, a more equitable proportion of males to females, a broader ethnic diversity, and lower 1‐year deaths rates than the original study. Despite the broader representation of the population, the significance of each of the individual CARING criterion was maintained except for 2 hospital admissions in the past year for a chronic illness (admission from a nursing home did not meet significance in either study as a sole criterion). As with the original study, meeting 2 of the NHPCO noncancer hospice guidelines demonstrated the highest risk of 1‐year mortality following index hospitalization, followed by primary diagnosis of cancer and ICU admission with MOF. Advancing age, also similar to the original study, conferred increased risk across the criterion.
Hospitalists could be an effective target for utilizing the CARING criteria because they are frequently the first‐line providers in the hospital setting. With the national shortage of palliative care specialists, hospitalists need to be able to identify when a patient has a limited life expectancy so they will be better equipped to make clinical decisions that are aligned with their patients' values, preferences, and goals of care. With the realization that not addressing advance care planning and patient goals of care may be considered medical errors, primary palliative care skills become alarmingly more important as priorities for hospitalists to obtain and feel comfortable using in daily practice.
The CARING criteria are directly applicable to patients who are seen by hospitalists. Other prognostic indices have focused on select patient populations, such as the elderly,[10, 11, 12] require collection of data that are not readily available on admission or would not otherwise be obtained,[10, 13] or apply to patients post‐hospital discharge, thereby missing the opportunity to make an impact earlier in the disease trajectory and incorporate palliative care into the hospital plan of care when key discussions about goals of care and preferences should be encouraged.
Additionally, the CARING criteria could easily be incorporated as a trigger for palliative care consults on hospital admission. Palliative care consults tend to happen late in a hospital stay, limiting the effectiveness of the palliative care team. A trigger system for hospitalists and other primary providers on hospital admission would lend to more effective timing of palliative measures being incorporated into the plan of care. Palliative care consults would not only be initiated earlier, but could be targeted for the more complex and sick patients with the highest risk of death in the next year.
In the time‐pressured environment, the presence of any 1 of the CARING criteria can act as a trigger to begin incorporating primary palliative care measures into the plan of care. The admitting hospitalist provider (ie, physician, nurse practitioner, physician assistant) could access the CARING criteria through an electronic health record prompt when admitting patients. When a more detailed assessment of mortality risk is helpful, the hospitalist can use the scoring matrix, which combines age with the individual criterion to calculate patients at medium or high risk of death within 1 year. Limited resources can then be directed to the patients with the greatest need. Patients with a focused care need, such as advance care planning or hospice referral, can be directed to the social worker or case manager. More complicated patients may be referred to a specialty palliative care team.
Several limitations to this study are recognized, including the small sample size of patients meeting criterion for ICU with MOF in the academic center study cohort. The patient data were collected during a transition time when the university hospital moved to a new campus, resulting in an ICU at each campus that housed patients with differing levels of illness severity, which may have contributed to the lower acuity ICU patient observed. Although we advocate the simplicity of the CARING criteria, the NHPCO noncancer hospice guidelines are more complicated, as they incorporates 8 broad categories of chronic illness. The hospice guidelines may not be general knowledge to the hospitalist or other primary providers. ePrognosis (
CONCLUSION
The CARING criteria are a simple, practical prognostic tool predictive of death within 1 year that has been validated in a broad population of hospitalized patients. The criteria hold up in a younger, healthier population that is more diverse by age, gender, and ethnicity than the VA population. With ready access to critical prognostic information on hospital admission, clinicians will be better informed to make decisions that are aligned with their patients' values, preferences, and goals of care.
Disclosure
Nothing to report.
- , , . Predicting death: an empirical evaluation of predictive tools for mortality. Arch Intern Med. 2011;171:1721–1726.
- , . Extent and determinants of error in physicians' prognoses in terminally ill patients: prospective cohort study. West J Med. 2000;172:310–313.
- , , , et al. A systematic review of physicians' survival predictions in terminally ill cancer patients. BMJ. 2003;327:195–198.
- , . Attitude and self‐reported practice regarding prognostication in a national sample of internists. Arch Intern Med. 1998;158:2389–2395.
- , , , et al. Discussing prognosis: balancing hope and realism. Cancer J. 2010;16:461–466.
- , , , . Acute Physiology and Chronic Health Evaluation (APACHE) IV: hospital mortality assessment for today's critically ill patients. Crit Care Med. 2006;34:1297–1310.
- , , , , . SAPS 3 admission score: an external validation in a general intensive care population. Intensive Care Med. 2008;34:1873–1877.
- , , , , , . Prospective validation of the intensive care unit admission Mortality Probability Model (MPM0‐III). Crit Care Med. 2009;37:1619–1623.
- , , , , , . A practical tool to identify patients who may benefit from a palliative approach: the CARING criteria. J Pain Symptom Manage. 2006;31:285–292.
- , , , et al. Prediction of survival for older hospitalized patients: the HELP survival model. J Am Geriatr Soc. 2000;48:S16–S24.
- , , , et al. Development and validation of a multidimensional prognostic index for one‐year mortality from comprehensive geriatric assessment in hospitalized older patients. Rejuvenation Res. 2008;11:151–161.
- , , , et al. Burden of illness score for elderly persons: risk adjustment incorporating the cumulative impact of diseases, physiologic abnormalities, and functional impairments. Med Care. 2003;41:70–83.
- , , , et al. The SUPPORT prognostic model. Objective estimates of survival for seriously ill hospitalized adults. Study to understand prognoses and preferences for outcomes and risks of treatments. Ann Intern Med. 1995;122:191–203.
Prognostication continues to be a challenge to the clinician despite over 100 prognostic indices that have been developed during the past few decades to inform clinical practice and medical decision making.[1] Physicians are not accurate in prognostication of patients' risk of death and tend to overestimate survival.[2, 3] In addition, many physicians do not feel comfortable offering a prognosis to patients, despite patients' wishes to be informed.[4, 5] Regardless of the prevalence in the literature and value in improving physicians' prognostic accuracy, prognostic indices of survival are not regularly utilized in the hospital setting. Prognostic tools available for providers are often complicated and may require data about patients that are not readily available.[6, 7, 8] Prognostic indices may be too specific to a patient population, too difficult to remember, or too time consuming to use. A simple, rapid, and practical prognostic index is important in the hospital setting to assist in identifying patients at high risk of death so that primary palliative interventions can be incorporated into the plan of care early in the hospital stay. Patient and family education, advance care planning, formulating the plan of care based on patientfamily goals, and improved resource utilization could be better executed by more accurate risk of death prediction on hospital admission.
The CARING criteria are the only prognostic index to our knowledge that evaluates a patient's risk of death in the next year, with information readily available at the time of hospital admission (Table 1).[9] The CARING criteria are a unique prognostic tool: (1) CARING is a mnemonic acronym, making it more user friendly to the clinician. (2) The 5 prognostic indicators are readily available from the patient's chart on admission; gathering further data by patient or caretaker interviews or by obtaining laboratory data is not needed. (3) The timing for application of the tool on admission to the hospital is an ideal opportunity to intervene and introduce palliative interventions early on the hospital stay. The CARING criteria were developed and validated in a Veteran's Administration hospital setting by Fischer et al.[9] We sought to validate the CARING criteria in a broader patient populationmedical and surgical patients from a tertiary referral university hospital setting and a safety‐net hospital setting.
METHODS
Study Design
This study was a retrospective observational cohort study. The study was approved by the Colorado Multiple Institutional Review Board and the University of Colorado Hospital Research Review Committee.
Study Purpose
To validate the CARING criteria in a tertiary referral university hospital (University of Colorado Hospital [UCH]) and safety‐net hospital (Denver Health and Hospitals [DHH]) setting using similar methodology to that employed by the original CARING criteria study.[9]
Study Setting/Population
All adults (18 years of age) admitted as inpatients to the medical and surgical services of internal medicine, hospitalist, pulmonary, cardiology, hematology/oncology, hepatology, surgery, intensive care unit, and intermediary care unit at UCH and DHH during the study period of July 2005 through August 2005. The only exclusion criteria were those patients who were prisoners or pregnant. Administrative admission data from July 2005 to August 2005 were used to identify names of all persons admitted to the medicine and surgical services of the study hospitals during the specified time period.
The 2 study hospitals, UCH and DHH, provide a range of patients who vary in ethnicity, socioeconomic status, and medical illness. This variability allows for greater generalizability of the results. Both hospitals are affiliated with the University of Colorado School of Medicine internal medicine residency training program and are located in Denver, Colorado.
At the time of the study, UCH was a licensed 550‐bed tertiary referral, academic hospital serving the Denver metropolitan area and the Rocky Mountain region as a specialty care and referral center. DHH was a 398‐bed, academic, safety‐net hospital serving primarily the Denver metropolitan area. DHH provides 42% of the care for the uninsured in Denver and 26% of the uninsured care for the state of Colorado.
Measures
The CARING criteria were developed and validated in a Veteran's Administration (VA) hospital setting by Fischer et al.[9] The purpose of the CARING criteria is to identify patients, at the time of hospital admission, who are at higher risk of death in the following year. The prognostic index uses 5 predictors that can be abstracted from the chart at time of admission. The CARING criteria were developed a priori, and patients were evaluated using only the medical data available at the time of admission. The criteria include items that are already part of the routine physician admission notes and do not require additional data collection or assessments. The criteria include: C=primary diagnosis of cancer, A=2 admissions to the hospital for a chronic illness within the last year; R=resident in a nursing home; I=intensive care unit (ICU) admission with multiorgan failure (MOF), NG=noncancer hospice guidelines (meeting 2 of the National Hospice and Palliative Care Organization's [NHPCO] guidelines).
Patients were identified using name, date of birth, social security number, address, and phone number. This identifying information was then used for tracing death records 1 year after hospital admission.
Mortality at 1 year following the index hospitalization was the primary end point. To minimize missing data and the number of subjects lost to follow‐up, 3 determinants of mortality were used. First, electronic medical records of the 2 participating hospitals and their outpatient clinics were reviewed to determine if a follow‐up appointment had occurred past the study's end point of 1 year (August 2006). For those without a confirmed follow‐up visit, death records from the Colorado Department of Public Health and Vital Records were obtained. For those patients residing outside of Colorado or whose mortality status was still unclear, the National Death Index was accessed.
Medical Record Review
Medical records for all study participants were reviewed by J.Y. (UCH) and B.C. (DHH). Data collection was completed using direct data entry into a Microsoft Access (Microsoft Corp., Redmond, WA) database utilizing a data entry form linked with the database table. This form utilized skip patterns and input masks to ensure quality of data entry and minimize missing or invalid data. Inter‐rater reliability was assessed by an independent rereview (S.F.) of 5% of the total charts. Demographic variables were collected using hospital administrative data. These included personal identifiers of the participants for purposes of mortality follow‐up. Clinical data including the 5 CARING variables and additional descriptive variables were abstracted from the paper hospital chart and the electronic record of the chart (together these constitute the medical record).
Death Follow‐up
A search of Colorado death records was conducted in February 2011 for all subjects. Death records were used to determine mortality and time to death from the index hospitalization. The National Death Index was then searched for any subjects without or record of death in Colorado.
Analysis
All analyses were conducted using the statistical application software SAS for Windows version 9.3 (SAS Institute, Cary, NC). Simple frequencies and means ( standard deviation) were used to describe the baseline characteristics. Multiple logistic regression models were used to model 1‐year mortality. The models were fitted using all of the CARING variables and age. As the aim of the study was to validate the CARING criteria, the variables for the models were selected a priori based on the original index. Two hospital cohorts (DHH and UCH) were modeled separately and as a combined sample. Kaplan‐Meier survival analysis was conducted to compare those subjects who met 1 of the CARING criteria with those who did not through the entire period of mortality follow‐up (20052011). Finally, using the probabilities from the logistic regression models, we again developed a scoring rule appropriate for a non‐VA setting to allow clinicians to easily identify patient risk for 1‐year mortality at the time of hospital admission.
RESULTS
There were a total of 1064 patients admitted to the medical and surgical services during the study period568 patients at DHH and 496 patients at UCH. Sample characteristics of each individual hospital cohort and the entire combined study cohort are detailed in Table 2. Overall, slightly over half the population were male, with a mean age of 50 years, and the ethnic breakdown roughly reflects the population in Denver. A total of 36.5% (n=388) of the study population met 1 of the CARING criteria, and 12.6% (n=134 among 1063 excluding 1 without an admit date) died within 1 year of the index hospitalization. These were younger and healthier patients compared to the VA sample used in developing the CARING criteria.
| |
| Renal | Dementia |
| Stop/decline dialysis | Unable to ambulate independently |
| Not candidate for transplant | Urinary or fecal incontinence |
| Urine output < 40cc/24 hours | Unable to speak with more than single words |
| Creatinine > 8.0 (>6.0 for diabetics) | Unable to bathe independently |
| Creatinine clearance 10cc/min | Unable to dress independently |
| Uremia | Co‐morbid conditions: |
| Persistent serum K + > 7.0 | Aspiration pneumonia |
| Co‐morbid conditions: | Pyelonephritis |
| Cancer CHF | Decubitus ulcer |
| Chronic lung disease AIDS/HIV | Difficulty swallowing or refusal to eat |
| Sepsis Cirrhosis | |
| Cardiac | Pulmonary |
| Ejection fraction < 20% | Dyspnea at rest |
| Symptomatic with diuretics and vasodilators | FEV1 < 30% |
| Not candidate for transplant | Frequent ER or hospital admits for pulmonary infections or respiratory distress |
| History of cardiac arrest | Cor pulmonale or right heart failure |
| History of syncope | 02 sat < 88% on 02 |
| Systolic BP < 120mmHG | PC02 > 50 |
| CVA cardiac origin | Resting tachycardia > 100/min |
| Co‐morbid conditions as listed in Renal | Co‐morbid conditions as listed in Renal |
| Liver | Stroke/CVA |
| End stage cirrhosis | Coma at onset |
| Not candidate for transplant | Coma >3 days |
| Protime > 5sec and albumin <2.5 | Limb paralysis |
| Ascites unresponsive to treatment | Urinary/fecal incontinence |
| Hepatorenal syndrome | Impaired sitting balance |
| Hepatic encephalopathy | Karnofsky < 50% |
| Spontaneous bacterial peritonitis | Recurrent aspiration |
| Recurrent variceal bleed | Age > 70 |
| Co‐morbid conditions as listed in Renal | Co‐morbid conditions as listed in Renal |
| HIV/AIDS | Neuromuscular |
| Persistent decline in function | Diminished respiratory function |
| Chronic diarrhea 1 year | Chosen not to receive BiPAP/vent |
| Decision to stop treatment | Difficulty swallowing |
| CNS lymphoma | Diminished functional status |
| MAC‐untreated | Incontinence |
| Systemic lymphoma | Co‐morbid conditions as listed in Renal |
| Dilated cardiomyopathy | |
| CD4 < 25 with disease progression | |
| Viral load > 100,000 | |
| Safety‐Net Hospital Cohort, N=568 | Academic Center Cohort, N=496 | Study Cohort,N=1064 | Original CARING Cohort, N=8739 | |
|---|---|---|---|---|
| ||||
| Mean age ( SD), y | 47.8 (16.5) | 54.4 (17.5) | 50.9 (17.3) | 63 (13) |
| Male gender | 59.5% (338) | 50.1% (248) | 55.1% (586) | 98% (856) |
| Ethnicity | ||||
| African American | 14.1% (80) | 13.5% (65) | 13.8% (145) | 13% (114) |
| Asian | 0.4% (2) | 1.5% (7) | 0.9% (9) | Not reported |
| Caucasian | 41.7% (237) | 66.3% (318) | 53.0 % (555) | 69% (602) |
| Latino | 41.9% (238) | 9.6% (46) | 27.1% (284) | 8% (70) |
| Native American | 0.5% (3) | 0.4% (2) | 0.5% (5) | Not reported |
| Other | 0.5% (3) | 0.6% (3) | 0.6% (6) | 10% (87) |
| Unknown | 0.9% (5) | 8.1% (39) | 4.2% (44) | Not reported |
| CARING criteria | ||||
| Cancer | 6.2% (35) | 19.4% (96) | 12.3% (131) | 23% (201) |
| Admissions to the hospital 2 in past year | 13.6% (77) | 42.7% (212) | 27.2% (289) | 36% (314) |
| Resident in a nursing home | 1.8% (10) | 3.4% (17) | 2.5% (27) | 3% (26) |
| ICU with MOF | 3.7% (21) | 1.2% (6) | 2.5% (27) | 2% (17) |
| NHPCO (2) noncancer guidelines | 1.6% (9) | 5.9% (29) | 3.6% (38) | 8% (70) |
Reliability testing demonstrated excellent inter‐rater reliability. Kappa for each criterion is as follows: (1) primary diagnosis of cancer=1.0, (2) 2 admissions to the hospital in the past year=0.91, (3) resident in a nursing home=1.0, (4) ICU admission with MOF=1.0, and (5) 2 noncancer hospice guidelines=0.78.
This study aimed to validate the CARING criteria9; therefore, all original individual CARING criterion were included in the validation logistic regression models. The 1 exception to this was in the university hospital study cohort, where the ICU criterion was excluded from the model due to small sample size and quasiseparation in the model. The model results are presented in Table 3 for the individual hospitals and combined study cohort.
| Safety Net Hospital Cohort, C Index=0.76 | Academic Center Cohort, C Index=0.76 | Combined Hospital Cohort, C Index=0.79 | ||||
|---|---|---|---|---|---|---|
| Estimate | Odds Ratio (95% CI) | Estimate | Odds Ratio (95% CI) | Estimate | Odds Ratio (95% CI) | |
| ||||||
| Cancer | 1.92 | 6.85 (2.83‐16.59)a | 1.85 | 6.36 (3.54‐11.41)a | 1.98 | 7.23 (4.45‐11.75)a |
| Admissions to the hospital 2 in past year | 0.55 | 1.74 (0.76‐3.97) | 0.14 | 0.87 (0.51‐1.49) | 0.20 | 1.22 (0.78‐1.91) |
| Resident in a nursing home | 0.49 | 0.61 (0.06‐6.56) | 0.27 | 1.31 (0.37‐4.66) | 0.09 | 1.09 (0.36‐3.32) |
| ICU with MOF | 1.85 | 6.34 (2.0219.90)a | 1.94 | 6.97 (2.75‐17.68)a | ||
| NHPCO (2) noncancer guidelines | 3.04 | 20.86 (4.25102.32)a | 2.62 | 13.73 (5.86‐32.15)a | 2.74 | 15.55 (7.2833.23)a |
| Ageb | 0.38 | 1.46 (1.05‐2.03)a | 0.45 | 1.56 (1.23‐1.98)a | 0.47 | 1.60 (1.32‐1.93)a |
In the safety‐net hospital, admission to the hospital with a primary diagnosis related to cancer, 2 noncancer hospice guidelines, ICU admission with MOF, and age by category all were significant predictors of 1‐year mortality. In the university hospital cohort, primary diagnosis of cancer, 2 noncancer hospice guidelines, and age by category were predictive of 1‐year mortality. Finally, in the entire study cohort, primary diagnosis of cancer, ICU with MOF, 2 noncancer hospice guidelines, and age were all predictive of 1‐year mortality. Parameter estimates were similar in 3 of the criteria compared to the VA setting. Differences in patient characteristics may have caused the differences in the estimates. Gender was additionally tested but not significant in any model. One‐year survival was significantly lower for those who met 1 of the CARING criteria versus those who did not (Figure 1).
Based on the framework from the original CARING criteria analysis, a scoring rule was developed using the regression results of this validation cohort. To predict a high probability of 1‐year mortality, sensitivity was set to 58% and specificity was set at 86% (error rate=17%). Medium to high probability was set with a sensitivity of 73% and specificity of 72% (error rate=28%). The coefficients from the regression model of the entire study cohort were converted to scores for each of the CARING criteria. The scores are as follows: 0.5 points for admission from a nursing home, 1 point for 2 hospital admissions in the past year for a chronic illness, 10 points for primary diagnosis of cancer, 10 points for ICU admission with MOF, and 14 points for 2 noncancer hospice guidelines. For every age category increase, 2 points are assigned so that 0 points for age <55 years, 2 points for ages 56 to 65 years, 4 points for ages 66 to 75 years, and 6 points for >75 years. Points for individual risk factors were proportional to s (ie, log odds) in the logistic regression model for death at 1 year. Although no linear transformation exists between s and probabilities (of death at 1 year), the aggregated points for combinations of risk factors shown in Table 4 follow the probabilities in an approximately linear fashion, so that different degrees of risk of death can be represented contiguously (as highlighted by differently shaded regions in the scoring matrix) (Table 4). The scoring matrix allows for quick identification for patients at high risk for 1‐year mortality. In this non‐VA setting with healthier patients, low risk is defined at a lower probability threshold (0.1) compared to the VA setting (0.175).
| CARING Criteria Components | |||||||
|---|---|---|---|---|---|---|---|
| None | Resident in a Nursing Home | Admitted to the Hospital 2 Times in the Past Year | Resident in a Nursing Home Admitted to the Hospital 2 Times in the Past Year | Primary Diagnosis of Cancer | ICU Admission With MOF | Noncancer Hospice Guidelines | |
| |||||||
| Age | |||||||
| 55 years | 0 | 0.5 | 1 | 1.5 | 10 | ||
| 5565 years | 2 | 2.5 | 3 | 3.5 | 10 | ||
| 6675 years | 4 | 4.5 | 5 | 5.5 | 10 | ||
| >75 years | 6 | 6.5 | 7 | 7.5 | 10 | ||
| Risk | |||||||
| Low | 3.5 | Probability<0.1 | |||||
| Medium | 46.5 | 0.1probability <0.175 | |||||
| High | 7 | Probability0.175 | |||||
DISCUSSION
The CARING criteria are a practical prognostic tool that can be easily and rapidly applied to patients admitted to the hospital to estimate risk of death in 1 year, with the goal of identifying patients who may benefit most from incorporating palliative interventions into their plan of care. This study validated the CARING criteria in a tertiary referral university hospital and safety‐net hospital setting, demonstrating applicability in a much broader population than the VA hospital of the original CARING criteria study. The population studied represented a younger population by over 10 years, a more equitable proportion of males to females, a broader ethnic diversity, and lower 1‐year deaths rates than the original study. Despite the broader representation of the population, the significance of each of the individual CARING criterion was maintained except for 2 hospital admissions in the past year for a chronic illness (admission from a nursing home did not meet significance in either study as a sole criterion). As with the original study, meeting 2 of the NHPCO noncancer hospice guidelines demonstrated the highest risk of 1‐year mortality following index hospitalization, followed by primary diagnosis of cancer and ICU admission with MOF. Advancing age, also similar to the original study, conferred increased risk across the criterion.
Hospitalists could be an effective target for utilizing the CARING criteria because they are frequently the first‐line providers in the hospital setting. With the national shortage of palliative care specialists, hospitalists need to be able to identify when a patient has a limited life expectancy so they will be better equipped to make clinical decisions that are aligned with their patients' values, preferences, and goals of care. With the realization that not addressing advance care planning and patient goals of care may be considered medical errors, primary palliative care skills become alarmingly more important as priorities for hospitalists to obtain and feel comfortable using in daily practice.
The CARING criteria are directly applicable to patients who are seen by hospitalists. Other prognostic indices have focused on select patient populations, such as the elderly,[10, 11, 12] require collection of data that are not readily available on admission or would not otherwise be obtained,[10, 13] or apply to patients post‐hospital discharge, thereby missing the opportunity to make an impact earlier in the disease trajectory and incorporate palliative care into the hospital plan of care when key discussions about goals of care and preferences should be encouraged.
Additionally, the CARING criteria could easily be incorporated as a trigger for palliative care consults on hospital admission. Palliative care consults tend to happen late in a hospital stay, limiting the effectiveness of the palliative care team. A trigger system for hospitalists and other primary providers on hospital admission would lend to more effective timing of palliative measures being incorporated into the plan of care. Palliative care consults would not only be initiated earlier, but could be targeted for the more complex and sick patients with the highest risk of death in the next year.
In the time‐pressured environment, the presence of any 1 of the CARING criteria can act as a trigger to begin incorporating primary palliative care measures into the plan of care. The admitting hospitalist provider (ie, physician, nurse practitioner, physician assistant) could access the CARING criteria through an electronic health record prompt when admitting patients. When a more detailed assessment of mortality risk is helpful, the hospitalist can use the scoring matrix, which combines age with the individual criterion to calculate patients at medium or high risk of death within 1 year. Limited resources can then be directed to the patients with the greatest need. Patients with a focused care need, such as advance care planning or hospice referral, can be directed to the social worker or case manager. More complicated patients may be referred to a specialty palliative care team.
Several limitations to this study are recognized, including the small sample size of patients meeting criterion for ICU with MOF in the academic center study cohort. The patient data were collected during a transition time when the university hospital moved to a new campus, resulting in an ICU at each campus that housed patients with differing levels of illness severity, which may have contributed to the lower acuity ICU patient observed. Although we advocate the simplicity of the CARING criteria, the NHPCO noncancer hospice guidelines are more complicated, as they incorporates 8 broad categories of chronic illness. The hospice guidelines may not be general knowledge to the hospitalist or other primary providers. ePrognosis (
CONCLUSION
The CARING criteria are a simple, practical prognostic tool predictive of death within 1 year that has been validated in a broad population of hospitalized patients. The criteria hold up in a younger, healthier population that is more diverse by age, gender, and ethnicity than the VA population. With ready access to critical prognostic information on hospital admission, clinicians will be better informed to make decisions that are aligned with their patients' values, preferences, and goals of care.
Disclosure
Nothing to report.
- , , . Predicting death: an empirical evaluation of predictive tools for mortality. Arch Intern Med. 2011;171:1721–1726.
- , . Extent and determinants of error in physicians' prognoses in terminally ill patients: prospective cohort study. West J Med. 2000;172:310–313.
- , , , et al. A systematic review of physicians' survival predictions in terminally ill cancer patients. BMJ. 2003;327:195–198.
- , . Attitude and self‐reported practice regarding prognostication in a national sample of internists. Arch Intern Med. 1998;158:2389–2395.
- , , , et al. Discussing prognosis: balancing hope and realism. Cancer J. 2010;16:461–466.
- , , , . Acute Physiology and Chronic Health Evaluation (APACHE) IV: hospital mortality assessment for today's critically ill patients. Crit Care Med. 2006;34:1297–1310.
- , , , , . SAPS 3 admission score: an external validation in a general intensive care population. Intensive Care Med. 2008;34:1873–1877.
- , , , , , . Prospective validation of the intensive care unit admission Mortality Probability Model (MPM0‐III). Crit Care Med. 2009;37:1619–1623.
- , , , , , . A practical tool to identify patients who may benefit from a palliative approach: the CARING criteria. J Pain Symptom Manage. 2006;31:285–292.
- , , , et al. Prediction of survival for older hospitalized patients: the HELP survival model. J Am Geriatr Soc. 2000;48:S16–S24.
- , , , et al. Development and validation of a multidimensional prognostic index for one‐year mortality from comprehensive geriatric assessment in hospitalized older patients. Rejuvenation Res. 2008;11:151–161.
- , , , et al. Burden of illness score for elderly persons: risk adjustment incorporating the cumulative impact of diseases, physiologic abnormalities, and functional impairments. Med Care. 2003;41:70–83.
- , , , et al. The SUPPORT prognostic model. Objective estimates of survival for seriously ill hospitalized adults. Study to understand prognoses and preferences for outcomes and risks of treatments. Ann Intern Med. 1995;122:191–203.
© 2013 Society of Hospital Medicine
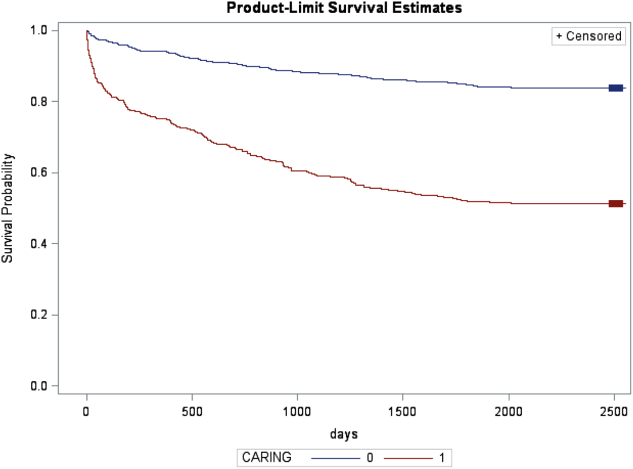
Patients at Risk for Readmission
Unplanned hospital readmissions are common, costly, and potentially avoidable. Approximately 20% of Medicare patients are readmitted within 30 days of discharge.[1] Readmission rates are estimated to be similarly high in other population subgroups,[2, 3, 4] with approximately 80% of patients[1, 5, 6] readmitted to the original discharging hospital. A recent systematic review suggested that 27% of readmissions may be preventable.[7]
Hospital readmissions have increasingly been viewed as a correctable marker of poor quality care and have been adopted by a number of organizations as quality indicators.[8, 9, 10] As a result, hospitals have important internal and external motivations to address readmissions. Identification of patients at high risk for readmissions may be an important first step toward preventing them. In particular, readmission risk assessment could be used to help providers target the delivery of resource‐intensive transitional care interventions[11, 12, 13, 14] to patients with the greatest needs. Such an approach is appealing because it allows hospitals to focus scarce resources where the impact may be greatest and provides a starting point for organizations struggling to develop robust models of transitional care delivery.
Electronic health records (EHRs) may prove to be an important component of strategies designed to risk stratify patients at the point of care. Algorithms integrated into the EHR that automatically generate risk predictions have the potential to (1) improve provider time efficiency by automating the prediction process, (2) improve consistency of data collection and risk score calculation, (3) increase adoption through improved usability, and (4) provide clinically important information in real‐time to all healthcare team members caring for a hospitalized patient.
We thus sought to derive a predictive model for 30‐day readmissions using data reliably present in our EHR at the time of admission, and integrate this predictive model into our hospital's EHR to create an automated prediction tool that identifies on admission patients at high risk for readmission within 30 days of discharge. In addition, we prospectively validated this model using the 12‐month period after implementation and examined the impact on readmissions.
METHODS
Setting
The University of Pennsylvania Health System (UPHS) includes 3 hospitals, with a combined capacity of over 1500 beds and 70,000 annual admissions. All hospitals currently utilize Sunrise Clinical Manager version 5.5 (Allscripts, Chicago, IL) as their EHR. The study sample included all adult admissions to any of the 3 UPHS hospitals during the study period. Admissions to short procedure, rehabilitation, and hospice units were excluded. The study received expedited approval and a HIPAA waiver from the University of Pennsylvania institutional review board.
Development of Predictive Model
The UPHS Center for Evidence‐based Practice[15, 16] performed a systematic review to identify factors associated with hospital readmission within 30 days of discharge. We then examined the data available from our hospital EHR at the time of admission for those factors identified in the review. Using different threshold values and look‐back periods, we developed and tested 30 candidate prediction models using these variables alone and in combination (Table 1). Prediction models were evaluated using 24 months of historical data between August 1, 2009 and August 1, 2011.
Implementation
An automated readmission risk flag was then integrated into the EHR. Patients classified as being at high risk for readmission with the automated prediction model were flagged in the EHR on admission (Figure 1A). The flag can be double‐clicked to display a separate screen with information relevant to discharge planning including inpatient and emergency department (ED) visits in the prior 12 months, as well as information about the primary team, length of stay, and admitting problem associated with those admissions (Figure 1B). The prediction model was integrated into our EHR using Arden Syntax for Medical Logic Modules.[17] The readmission risk screen involved presenting the provider with a new screen and was thus developed in Microsoft .NET using C# and Windows Forms (Microsoft Corp., Redmond, WA).

The flag was visible on the patient lists of all providers who utilized the EHR. This included but was not limited to nurses, social workers, unit pharmacists, and physicians. At the time of implementation, educational events regarding the readmission risk flag were provided in forums targeting administrators, pharmacists, social workers, and housestaff. Information about the flag and recommendations for use were distributed through emails and broadcast screensaver messages disseminated throughout the inpatient units of the health system. Providers were asked to pay special attention to discharge planning for patients triggering the readmission risk flag, including medication reconciliation by pharmacists for these patients prior to discharge, and arrangement of available home services by social workers.
The risk flag was 1 of 4 classes of interventions developed and endorsed by the health system in its efforts to reduce readmissions. Besides risk stratification, the other classes were: interdisciplinary rounding, patient education, and discharge communication. None of the interventions alone were expected to decrease readmissions, but as all 4 classes of interventions were implemented and performed routinely, the expectation was that they would work in concert to reduce readmissions.
Analysis
The primary outcome was all‐cause hospital readmissions in the healthcare system within 30 days of discharge. Although this outcome is commonly used both in the literature and as a quality metric, significant debate persists as to the appropriateness of this metric.[18] Many of the factors driving 30‐day readmissions may be dependent on factors outside of the discharging hospital's control and it has been argued that nearer‐term, nonelective readmission rates may provide a more meaningful quality metric.[18] Seven‐day unplanned readmissions were thus used as a secondary outcome measure for this study.
Sensitivity, specificity, predictive value, C statistic, F score (the harmonic mean of positive predictive value and sensitivity),[19] and screen‐positive rate were calculated for each of the 30 prediction models evaluated using the historical data. The prediction model with the best balance of F score and screen‐positive rate was selected as the prediction model to be integrated into the EHR. Prospective validation of the selected prediction model was performed using the 12‐month period following implementation of the risk flag (September 2011September 2012).
To assess the impact of the automated prediction model on monthly readmission rate, we used the 24‐month period immediately before and the 12‐month period immediately after implementation of the readmission risk flag. Segmented regression analysis was performed testing for changes in level and slope of readmission rates between preimplementation and postimplementation time periods. This quasiexperimental interrupted time series methodology[20] allows us to control for secular trends in readmission rates and to assess the preimplementation trend (secular trend), the difference in rates immediately before and after the implementation (immediate effect), and the postimplementation change over time (sustained effect). We used Cochrane‐Orcutt estimation[21] to correct for serial autocorrelation.
All analyses were performed using Stata 12.1 software (Stata Corp, College Station, TX).
RESULTS
Predictors of Readmission
Our systematic review of the literature identified several patient and healthcare utilization patterns predictive of 30‐day readmission risk. Utilization factors included length of stay, number of prior admissions, previous 30‐day readmissions, and previous ED visits. Patient characteristics included number of comorbidities, living alone, and payor. Evidence was inconsistent regarding threshold values for these variables.
Many variables readily available in our EHR were either found by the systematic review not to be reliably predictive of 30‐day readmission (including age and gender) or were not readily or reliably available on admission (including length of stay and payor). At the time of implementation, our EHR did not include vital sign or nursing assessment variables, so these were not considered for inclusion in our model.
Of the available variables, 3 were consistently accurate and available in the EHR at the time of patient admission: prior hospital admission, emergency department visit, and 30‐day readmission within UPHS. We then developed 30 candidate prediction models using a combination of these variables, including 1 and 2 prior admissions, ED visits, and 30‐day readmissions in the 6 and 12 months preceding the index visit (Table 1).
Development and Validation
We used 24 months of retrospective data, which included 120,396 discharges with 17,337 thirty‐day readmissions (14.4% 30‐day all‐cause readmission rate) to test the candidate prediction models. A single risk factor, 2 inpatient admissions in the past 12 months, was found to have the best balance of sensitivity (40%), positive predictive value (31%), and proportion of patients flagged (18%) (Table 1).
| Sensitivity | Specificity | C Statistic | PPV | NPV | Screen Positive | F Score | |
|---|---|---|---|---|---|---|---|
| |||||||
| Retrospective Evaluation of Prediction Rules Lookback period: 6 months | |||||||
| Prior Admissions | |||||||
| 1 | 53% | 74% | 0.640 | 26% | 91% | 30% | 0.350 |
| 2 | 32% | 90% | 0.610 | 35% | 89% | 13% | 0.333 |
| 3 | 20% | 96% | 0.578 | 44% | 88% | 7% | 0.274 |
| Prior ED Visits | |||||||
| 1 | 31% | 81% | 0.558 | 21% | 87% | 21% | 0.252 |
| 2 | 13% | 93% | 0.532 | 25% | 87% | 8% | 0.172 |
| 3 | 7% | 97% | 0.519 | 27% | 86% | 4% | 0.111 |
| Prior 30‐day Readmissions | |||||||
| 1 | 39% | 85% | 0.623 | 31% | 89% | 18% | 0.347 |
| 2 | 21% | 95% | 0.582 | 43% | 88% | 7% | 0.284 |
| 3 | 13% | 98% | 0.555 | 53% | 87% | 4% | 0.208 |
| Combined Rules | |||||||
| Admit1 & ED1 | 22% | 92% | 0.568 | 31% | 88% | 10% | 0.255 |
| Admit2 & ED1 | 15% | 96% | 0.556 | 40% | 87% | 5% | 0.217 |
| Admit1 & 30‐day1 | 39% | 85% | 0.623 | 31% | 89% | 18% | 0.346 |
| Admit2 & 30‐day1 | 29% | 92% | 0.603 | 37% | 89% | 11% | 0.324 |
| 30‐day1 & ED1 | 17% | 95% | 0.559 | 37% | 87% | 6% | 0.229 |
| 30‐day1 & ED2 | 8% | 98% | 0.527 | 40% | 86% | 3% | 0.132 |
| Lookback period: 12 months | |||||||
| Prior Admission | |||||||
| 1 | 60% | 68% | 0.593 | 24% | 91% | 36% | 0.340 |
| 2a | 40% | 85% | 0.624 | 31% | 89% | 18% | 0.354 |
| 3 | 28% | 92% | 0.600 | 37% | 88% | 11% | 0.318 |
| Prior ED Visit | |||||||
| 1 | 38% | 74% | 0.560 | 20% | 88% | 28% | 0.260 |
| 2 | 20% | 88% | 0.544 | 23% | 87% | 13% | 0.215 |
| 3 | 8% | 96% | 0.523 | 27% | 86% | 4% | 0.126 |
| Prior 30‐day Readmission | |||||||
| 1 | 43% | 84% | 0.630 | 30% | 90% | 20% | 0.353 |
| 2 | 24% | 94% | 0.592 | 41% | 88% | 9% | 0.305 |
| 3 | 11% | 98% | 0.548 | 54% | 87% | 3% | 0.186 |
| Combined Rules | |||||||
| Admit1 & ED1 | 29% | 87% | 0.580 | 27% | 88% | 15% | 0.281 |
| Admit2 & ED1 | 22% | 93% | 0.574 | 34% | 88% | 9% | 0.266 |
| Admit1 & 30‐day1 | 42% | 84% | 0.630 | 30% | 90% | 14% | 0.353 |
| Admit2 & 30‐day1 | 34% | 89% | 0.615 | 34% | 89% | 14% | 0.341 |
| 30‐day1 & ED1 | 21% | 93% | 0.569 | 35% | 88% | 9% | 0.261 |
| 30‐day1 & ED2 | 13% | 96% | 0.545 | 37% | 87% | 5% | 0.187 |
| Prospective Evaluation of Prediction Rule | |||||||
| 30‐Day All‐Cause | 39% | 84% | 0.614 | 30% | 89% | 18% | 0.339 |
Prospective validation of the prediction model was performed using the 12‐month period directly following readmission risk flag implementation. During this period, the 30‐day all‐cause readmission rate was 15.1%. Sensitivity (39%), positive predictive value (30%), and proportion of patients flagged (18%) were consistent with the values derived from the retrospective data, supporting the reproducibility and predictive stability of the chosen risk prediction model (Table 1). The C statistic of the model was also consistent between the retrospective and prospective datasets (0.62 and 0.61, respectively).
Readmission Rates
The mean 30‐day all‐cause readmission rate for the 24‐month period prior to the intervention was 14.4%, whereas the mean for the 12‐month period after the implementation was 15.1%. Thirty‐day all‐cause and 7‐day unplanned monthly readmission rates do not appear to have been impacted by the intervention (Figure 2). There was no evidence for either an immediate or sustained effect (Table 2).
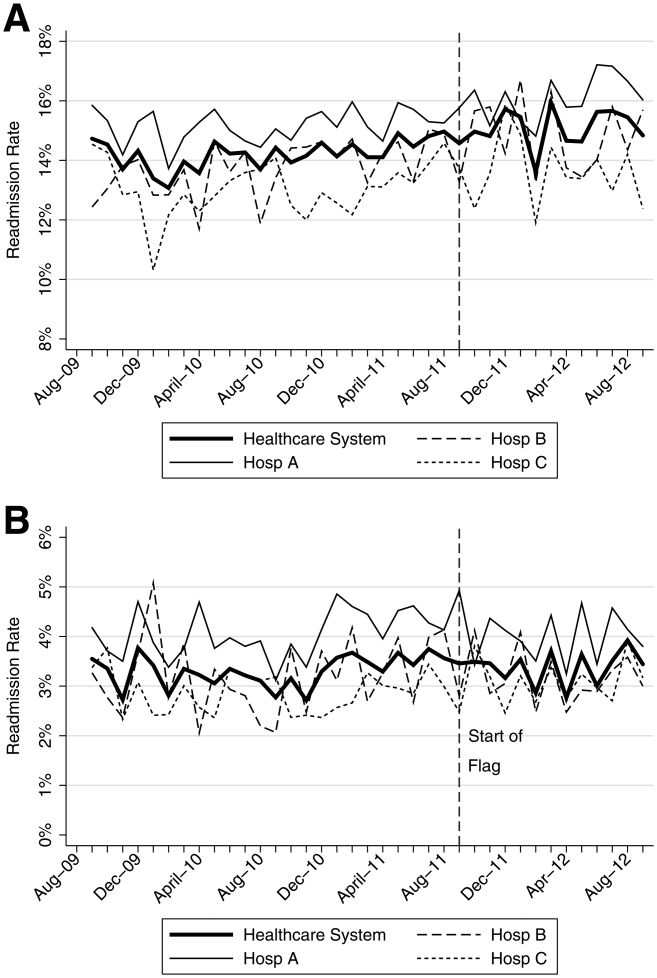
| Hospital | Preimplementation Period | Immediate Effect | Postimplementation Period | P Value Change in Trenda | |||||
|---|---|---|---|---|---|---|---|---|---|
| Monthly % Change in Readmission Rates | P Value | Immediate % Change | P Value | Monthly % Change in Readmission Rates | P Value | ||||
| |||||||||
| 30‐Day All‐Cause Readmission Rates | |||||||||
| Hosp A | 0.023 | Stable | 0.153 | 0.480 | 0.991 | 0.100 | Increasing | 0.044 | 0.134 |
| Hosp B | 0.061 | Increasing | 0.002 | 0.492 | 0.125 | 0.060 | Stable | 0.296 | 0.048 |
| Hosp C | 0.026 | Stable | 0.413 | 0.447 | 0.585 | 0.046 | Stable | 0.629 | 0.476 |
| Health System | 0.032 | Increasing | 0.014 | 0.344 | 0.302 | 0.026 | Stable | 0.499 | 0.881 |
| 7‐Day Unplanned Readmission Rates | |||||||||
| Hosp A | 0.004 | Stable | 0.642 | 0.271 | 0.417 | 0.005 | Stable | 0.891 | 0.967 |
| Hosp B | 0.012 | Stable | 0.201 | 0.298 | 0.489 | 0.038 | Stable | 0.429 | 0.602 |
| Hosp C | 0.008 | Stable | 0.213 | 0.353 | 0.204 | 0.004 | Stable | 0.895 | 0.899 |
| Health System | 0.005 | Stable | 0.358 | 0.003 | 0.990 | 0.010 | Stable | 0.712 | 0.583 |
DISCUSSION
In this proof‐of‐concept study, we demonstrated the feasibility of an automated readmission risk prediction model integrated into a health system's EHR for a mixed population of hospitalized medical and surgical patients. To our knowledge, this is the first study in a general population of hospitalized patients to examine the impact of providing readmission risk assessment on readmission rates. We used a simple prediction model potentially generalizable to EHRs and healthcare populations beyond our own.
Existing risk prediction models for hospital readmission have important limitations and are difficult to implement in clinical practice.[22] Prediction models for hospital readmission are often dependent on retrospective claims data, developed for specific patient populations, and not designed for use early in the course of hospitalization when transitional care interventions can be initiated.[22] In addition, the time required to gather the necessary data and calculate the risk score remains a barrier to the adoption of prediction models in practice. By automating the process of readmission risk prediction, we were able to help integrate risk assessment into the healthcare process across many providers in a large multihospital healthcare organization. This has allowed us to consistently share risk assessment in real time with all members of the inpatient team, facilitating a team‐based approach to discharge planning.[23]
Two prior studies have developed readmission risk prediction models designed to be implemented into the EHR. Amarasingham et al.[24] developed and implemented[25] a heart failure‐specific prediction model based on the 18‐item Tabak mortality score.[26] Bradley et al.[27] studied in a broader population of medicine and surgery patients the predictive ability of a 26‐item score that utilized vital sign, cardiac rhythm, and nursing assessment data. Although EHRs are developing rapidly, currently the majority of EHRs do not support the use of many of the variables used in these models. In addition, both models were complex, raising concerns about generalizability to other healthcare settings and populations.
A distinctive characteristic of our model is its simplicity. We were cognizant of the realities of running a prediction model in a high‐volume production environment and the diminishing returns of adding more variables. We thus favored simplicity at all stages of model development, with the associated belief that complexity could be added with future iterations once feasibility had been established. Finally, we were aware that we were constructing a medical decision support tool rather than a simple classifier.[26] As such, the optimal model was not purely driven by discriminative ability, but also by our subjective assessment of the optimal trade‐off between sensitivity and specificity (the test‐treatment threshold) for such a model.[26] To facilitate model assessment, we thus categorized the potential predictor variables and evaluated the test characteristics of each combination of categorized variables. Although the C statistic of a model using continuous variables will be higher than a model using categorical values, model performance at the chosen trade‐off point is unlikely to be different.
Although the overall predictive ability of our model was fair, we found that it was associated with clinically meaningful differences in readmission rates between those triggering and not triggering the flag. The 30‐day all‐cause readmission rate in the 12‐month prospective sample was 15.1%, yet among those flagged as being at high risk for readmission the readmission rate was 30.4%. Given resource constraints and the need to selectively apply potentially costly care transition interventions, this may in practice translate into a meaningful discriminative ability.
Readmission rates did not change significantly during the study period. A number of plausible reasons for this exist, including: (1) the current model may not exhibit sufficient predictive ability to classify those at high risk or impact the behavior of providers appropriately, (2) those patients classified as high risk of readmission may not be at high risk of readmissions that are preventable, (3) information provided by the model may not yet routinely be used such that it can affect care, or (4) providing readmission risk assessment alone is not sufficient to influence readmission rates, and the other interventions or organizational changes necessary to impact care of those defined as high risk have not yet been implemented or are not yet being performed routinely. If the primary reasons for our results are those outlined in numbers 3 or 4, then readmission rates should improve over time as the risk flag becomes more routinely used, and those interventions necessary to impact readmission rates of those defined as high risk are implemented and performed.
Limitations
There are several limitations of this intervention. First, the prediction model was developed using 30‐day all‐cause readmissions, rather than attempting to identify potentially preventable readmissions. Thirty‐day readmission rates may not be a good proxy for preventable readmissions,[18] and as a consequence, the ability to predict 30‐day readmissions may not ensure that a prediction model is able to predict preventable readmissions. Nonetheless, 30‐day readmission rates remain the most commonly used quality metric.
Second, the impact of the risk flag on provider behavior is uncertain. We did not formally assess how the readmission risk flag was used by healthcare team members. Informal assessment has, however, revealed that the readmission risk flag is gradually being adopted by different members of the care team including unit‐based pharmacists who are using the flag to prioritize the delivery of medication education, social workers who are using the flag to prompt providers to consider higher level services for patients at high risk of readmission, and patient navigators who are using the flag to prioritize follow‐up phone calls. As a result, we hope that the flag will ultimately improve the processes of care for high‐risk patients.
Third, we did not capture readmissions to hospitals outside of our healthcare system and have therefore underestimated the readmission rate in our population. However, our assessment of the effect of the risk flag on readmissions focused on relative readmission rates over time, and the use of the interrupted time series methodology should protect against secular changes in outside hospital readmission rates that were not associated with the intervention.
Fourth, it is possible that the prediction model implemented could be significantly improved by including additional variables or data available during the hospital stay. However, simple classification models using a single variable have repeatedly been shown to have the ability to compete favorably with state‐of‐the‐art multivariable classification models.[28]
Fifth, our study was limited to a single academic health system, and our experience may not be generalizable to smaller healthcare systems with limited EHR systems. However, the simplicity of our prediction model and the integration into a commercial EHR may improve the generalizability of our experience to other healthcare settings. Additionally, partly due to recent policy initiatives, the adoption of integrated EHR systems by hospitals is expected to continue at a rapid rate and become the standard of care within the near future.[29]
CONCLUSION
An automated prediction model was effectively integrated into an existing EHR and was able to identify patients on admission who are at risk for readmission within 30 days of discharge. Future work will aim to further examine the impact of the flag on readmission rates, further refine the prediction model, and gather data on how providers and care teams use the information provided by the flag.
Disclosure
Dr. Umscheid‐s contribution to this project was supported in part by the National Center for Research Resources, Grant UL1RR024134, which is now at the National Center for Advancing Translational Sciences, Grant UL1TR000003. The content of this paper is solely the responsibility of the authors and does not necessarily represent the official views of the NIH.
- , , . Rehospitalizations among patients in the Medicare fee‐for‐service program. N Engl J Med. 2009;360(14):1418–1428.
- , . Hospital readmissions as a measure of quality of health care: advantages and limitations. Arch Intern Med. 2000;160(8):1074–1081.
- , , , , . Do older rural and urban veterans experience different rates of unplanned readmission to VA and non‐VA hospitals? J Rural Health. 2009;25(1):62–69.
- , , . Cost, causes and rates of rehospitalization of preterm infants. J Perinatol. 2007;27(10):614–619.
- , , , . Redefining readmission risk factors for general medicine patients. J Hosp Med. 2011;6(2):54–60.
- , , , et al. Incidence and main factors associated with early unplanned hospital readmission among French medical inpatients aged 75 and over admitted through emergency units. Age Ageing. 2008;37(4):416–422.
- , , , , . Proportion of hospital readmissions deemed avoidable: a systematic review. CMAJ. 2011;183(7):E391–E402.
- Hospital Quality Alliance. Available at: http://www.hospitalqualityalliance.org/hospitalqualityalliance/qualitymeasures/qualitymeasures.html. Accessed March 6, 2013.
- Institute for Healthcare Improvement. Available at: http://www.ihi.org/explore/Readmissions/Pages/default.aspx. Accessed March 6, 2013.
- Centers for Medicare and Medicaid Services. Available at: http://www.cms.gov/Medicare/Quality‐Initiatives‐Patient‐Assessment‐Instruments/HospitalQualityInits/OutcomeMeasures.html. Accessed March 6, 2013.
- , , , et al. Comprehensive discharge planning and home follow‐up of hospitalized elders: a randomized clinical trial. JAMA. 1999;281(7):613–620.
- , , , , , . Preparing patients and caregivers to participate in care delivered across settings: the Care Transitions Intervention. J Am Geriatr Soc. 2004;52(11):1817–1825.
- , , , , . The importance of transitional care in achieving health reform. Health Aff (Millwood). 2011;30(4):746–754.
- , , , , . Interventions to reduce 30‐day rehospitalization: a systematic review. Ann Intern Med. 2011;155(8):520–528.
- University of Pennsylvania Health System Center for Evidence‐based Practice. Available at: http://www.uphs.upenn.edu/cep/. Accessed March 6, 2013.
- , , . Hospital‐based comparative effectiveness centers: translating research into practice to improve the quality, safety and value of patient care. J Gen Intern Med. 2010;25(12):1352–1355.
- . Writing Arden Syntax Medical Logic Modules. Comput Biol Med. 1994;24(5):331–363.
- , . Thirty‐day readmissions—truth and consequences. N Engl J Med. 2012;366(15):1366–1369.
- . Information Retrieval. 2nd ed. Oxford, UK: Butterworth‐Heinemann; 1979.
- , , , . Segmented regression analysis of interrupted time series studies in medication use research. J Clin Pharm Ther. 2002;27(4):299–309.
- , . Application of least squares regression to relationships containing auto‐correlated error terms. J Am Stat Assoc. 1949; 44:32–61.
- , , , et al. Risk prediction models for hospital readmission: a systematic review. JAMA. 2011;306(15):1688–1698.
- , , , et al. Core Principles and values of effective team‐based health care. Available at: https://www.nationalahec.org/pdfs/VSRT‐Team‐Based‐Care‐Principles‐Values.pdf. Accessed March 19, 2013.
- , , , et al. An automated model to identify heart failure patients at risk for 30‐day readmission or death using electronic medical record data. Med Care. 2010;48(11):981–988.
- , , , et al. Allocating scarce resources in real‐time to reduce heart failure readmissions: a prospective, controlled study [published online ahead of print July 31, 2013]. BMJ Qual Saf. doi:10.1136/bmjqs‐2013‐001901.
- , . The threshold approach to clinical decision making. N Engl J Med. 1980;302(20):1109–1117.
- , , , , . Identifying patients at increased risk for unplanned readmission. Med Care. 2013;51(9):761–766.
- . Very simple classification rules perform well on most commonly used datasets. Mach Learn. 1993;11(1):63–91.
- . Stimulating the adoption of health information technology. N Engl J Med. 2009;360(15):1477–1479.
Unplanned hospital readmissions are common, costly, and potentially avoidable. Approximately 20% of Medicare patients are readmitted within 30 days of discharge.[1] Readmission rates are estimated to be similarly high in other population subgroups,[2, 3, 4] with approximately 80% of patients[1, 5, 6] readmitted to the original discharging hospital. A recent systematic review suggested that 27% of readmissions may be preventable.[7]
Hospital readmissions have increasingly been viewed as a correctable marker of poor quality care and have been adopted by a number of organizations as quality indicators.[8, 9, 10] As a result, hospitals have important internal and external motivations to address readmissions. Identification of patients at high risk for readmissions may be an important first step toward preventing them. In particular, readmission risk assessment could be used to help providers target the delivery of resource‐intensive transitional care interventions[11, 12, 13, 14] to patients with the greatest needs. Such an approach is appealing because it allows hospitals to focus scarce resources where the impact may be greatest and provides a starting point for organizations struggling to develop robust models of transitional care delivery.
Electronic health records (EHRs) may prove to be an important component of strategies designed to risk stratify patients at the point of care. Algorithms integrated into the EHR that automatically generate risk predictions have the potential to (1) improve provider time efficiency by automating the prediction process, (2) improve consistency of data collection and risk score calculation, (3) increase adoption through improved usability, and (4) provide clinically important information in real‐time to all healthcare team members caring for a hospitalized patient.
We thus sought to derive a predictive model for 30‐day readmissions using data reliably present in our EHR at the time of admission, and integrate this predictive model into our hospital's EHR to create an automated prediction tool that identifies on admission patients at high risk for readmission within 30 days of discharge. In addition, we prospectively validated this model using the 12‐month period after implementation and examined the impact on readmissions.
METHODS
Setting
The University of Pennsylvania Health System (UPHS) includes 3 hospitals, with a combined capacity of over 1500 beds and 70,000 annual admissions. All hospitals currently utilize Sunrise Clinical Manager version 5.5 (Allscripts, Chicago, IL) as their EHR. The study sample included all adult admissions to any of the 3 UPHS hospitals during the study period. Admissions to short procedure, rehabilitation, and hospice units were excluded. The study received expedited approval and a HIPAA waiver from the University of Pennsylvania institutional review board.
Development of Predictive Model
The UPHS Center for Evidence‐based Practice[15, 16] performed a systematic review to identify factors associated with hospital readmission within 30 days of discharge. We then examined the data available from our hospital EHR at the time of admission for those factors identified in the review. Using different threshold values and look‐back periods, we developed and tested 30 candidate prediction models using these variables alone and in combination (Table 1). Prediction models were evaluated using 24 months of historical data between August 1, 2009 and August 1, 2011.
Implementation
An automated readmission risk flag was then integrated into the EHR. Patients classified as being at high risk for readmission with the automated prediction model were flagged in the EHR on admission (Figure 1A). The flag can be double‐clicked to display a separate screen with information relevant to discharge planning including inpatient and emergency department (ED) visits in the prior 12 months, as well as information about the primary team, length of stay, and admitting problem associated with those admissions (Figure 1B). The prediction model was integrated into our EHR using Arden Syntax for Medical Logic Modules.[17] The readmission risk screen involved presenting the provider with a new screen and was thus developed in Microsoft .NET using C# and Windows Forms (Microsoft Corp., Redmond, WA).
The flag was visible on the patient lists of all providers who utilized the EHR. This included but was not limited to nurses, social workers, unit pharmacists, and physicians. At the time of implementation, educational events regarding the readmission risk flag were provided in forums targeting administrators, pharmacists, social workers, and housestaff. Information about the flag and recommendations for use were distributed through emails and broadcast screensaver messages disseminated throughout the inpatient units of the health system. Providers were asked to pay special attention to discharge planning for patients triggering the readmission risk flag, including medication reconciliation by pharmacists for these patients prior to discharge, and arrangement of available home services by social workers.
The risk flag was 1 of 4 classes of interventions developed and endorsed by the health system in its efforts to reduce readmissions. Besides risk stratification, the other classes were: interdisciplinary rounding, patient education, and discharge communication. None of the interventions alone were expected to decrease readmissions, but as all 4 classes of interventions were implemented and performed routinely, the expectation was that they would work in concert to reduce readmissions.
Analysis
The primary outcome was all‐cause hospital readmissions in the healthcare system within 30 days of discharge. Although this outcome is commonly used both in the literature and as a quality metric, significant debate persists as to the appropriateness of this metric.[18] Many of the factors driving 30‐day readmissions may be dependent on factors outside of the discharging hospital's control and it has been argued that nearer‐term, nonelective readmission rates may provide a more meaningful quality metric.[18] Seven‐day unplanned readmissions were thus used as a secondary outcome measure for this study.
Sensitivity, specificity, predictive value, C statistic, F score (the harmonic mean of positive predictive value and sensitivity),[19] and screen‐positive rate were calculated for each of the 30 prediction models evaluated using the historical data. The prediction model with the best balance of F score and screen‐positive rate was selected as the prediction model to be integrated into the EHR. Prospective validation of the selected prediction model was performed using the 12‐month period following implementation of the risk flag (September 2011September 2012).
To assess the impact of the automated prediction model on monthly readmission rate, we used the 24‐month period immediately before and the 12‐month period immediately after implementation of the readmission risk flag. Segmented regression analysis was performed testing for changes in level and slope of readmission rates between preimplementation and postimplementation time periods. This quasiexperimental interrupted time series methodology[20] allows us to control for secular trends in readmission rates and to assess the preimplementation trend (secular trend), the difference in rates immediately before and after the implementation (immediate effect), and the postimplementation change over time (sustained effect). We used Cochrane‐Orcutt estimation[21] to correct for serial autocorrelation.
All analyses were performed using Stata 12.1 software (Stata Corp, College Station, TX).
RESULTS
Predictors of Readmission
Our systematic review of the literature identified several patient and healthcare utilization patterns predictive of 30‐day readmission risk. Utilization factors included length of stay, number of prior admissions, previous 30‐day readmissions, and previous ED visits. Patient characteristics included number of comorbidities, living alone, and payor. Evidence was inconsistent regarding threshold values for these variables.
Many variables readily available in our EHR were either found by the systematic review not to be reliably predictive of 30‐day readmission (including age and gender) or were not readily or reliably available on admission (including length of stay and payor). At the time of implementation, our EHR did not include vital sign or nursing assessment variables, so these were not considered for inclusion in our model.
Of the available variables, 3 were consistently accurate and available in the EHR at the time of patient admission: prior hospital admission, emergency department visit, and 30‐day readmission within UPHS. We then developed 30 candidate prediction models using a combination of these variables, including 1 and 2 prior admissions, ED visits, and 30‐day readmissions in the 6 and 12 months preceding the index visit (Table 1).
Development and Validation
We used 24 months of retrospective data, which included 120,396 discharges with 17,337 thirty‐day readmissions (14.4% 30‐day all‐cause readmission rate) to test the candidate prediction models. A single risk factor, 2 inpatient admissions in the past 12 months, was found to have the best balance of sensitivity (40%), positive predictive value (31%), and proportion of patients flagged (18%) (Table 1).
| Sensitivity | Specificity | C Statistic | PPV | NPV | Screen Positive | F Score | |
|---|---|---|---|---|---|---|---|
| |||||||
| Retrospective Evaluation of Prediction Rules Lookback period: 6 months | |||||||
| Prior Admissions | |||||||
| 1 | 53% | 74% | 0.640 | 26% | 91% | 30% | 0.350 |
| 2 | 32% | 90% | 0.610 | 35% | 89% | 13% | 0.333 |
| 3 | 20% | 96% | 0.578 | 44% | 88% | 7% | 0.274 |
| Prior ED Visits | |||||||
| 1 | 31% | 81% | 0.558 | 21% | 87% | 21% | 0.252 |
| 2 | 13% | 93% | 0.532 | 25% | 87% | 8% | 0.172 |
| 3 | 7% | 97% | 0.519 | 27% | 86% | 4% | 0.111 |
| Prior 30‐day Readmissions | |||||||
| 1 | 39% | 85% | 0.623 | 31% | 89% | 18% | 0.347 |
| 2 | 21% | 95% | 0.582 | 43% | 88% | 7% | 0.284 |
| 3 | 13% | 98% | 0.555 | 53% | 87% | 4% | 0.208 |
| Combined Rules | |||||||
| Admit1 & ED1 | 22% | 92% | 0.568 | 31% | 88% | 10% | 0.255 |
| Admit2 & ED1 | 15% | 96% | 0.556 | 40% | 87% | 5% | 0.217 |
| Admit1 & 30‐day1 | 39% | 85% | 0.623 | 31% | 89% | 18% | 0.346 |
| Admit2 & 30‐day1 | 29% | 92% | 0.603 | 37% | 89% | 11% | 0.324 |
| 30‐day1 & ED1 | 17% | 95% | 0.559 | 37% | 87% | 6% | 0.229 |
| 30‐day1 & ED2 | 8% | 98% | 0.527 | 40% | 86% | 3% | 0.132 |
| Lookback period: 12 months | |||||||
| Prior Admission | |||||||
| 1 | 60% | 68% | 0.593 | 24% | 91% | 36% | 0.340 |
| 2a | 40% | 85% | 0.624 | 31% | 89% | 18% | 0.354 |
| 3 | 28% | 92% | 0.600 | 37% | 88% | 11% | 0.318 |
| Prior ED Visit | |||||||
| 1 | 38% | 74% | 0.560 | 20% | 88% | 28% | 0.260 |
| 2 | 20% | 88% | 0.544 | 23% | 87% | 13% | 0.215 |
| 3 | 8% | 96% | 0.523 | 27% | 86% | 4% | 0.126 |
| Prior 30‐day Readmission | |||||||
| 1 | 43% | 84% | 0.630 | 30% | 90% | 20% | 0.353 |
| 2 | 24% | 94% | 0.592 | 41% | 88% | 9% | 0.305 |
| 3 | 11% | 98% | 0.548 | 54% | 87% | 3% | 0.186 |
| Combined Rules | |||||||
| Admit1 & ED1 | 29% | 87% | 0.580 | 27% | 88% | 15% | 0.281 |
| Admit2 & ED1 | 22% | 93% | 0.574 | 34% | 88% | 9% | 0.266 |
| Admit1 & 30‐day1 | 42% | 84% | 0.630 | 30% | 90% | 14% | 0.353 |
| Admit2 & 30‐day1 | 34% | 89% | 0.615 | 34% | 89% | 14% | 0.341 |
| 30‐day1 & ED1 | 21% | 93% | 0.569 | 35% | 88% | 9% | 0.261 |
| 30‐day1 & ED2 | 13% | 96% | 0.545 | 37% | 87% | 5% | 0.187 |
| Prospective Evaluation of Prediction Rule | |||||||
| 30‐Day All‐Cause | 39% | 84% | 0.614 | 30% | 89% | 18% | 0.339 |
Prospective validation of the prediction model was performed using the 12‐month period directly following readmission risk flag implementation. During this period, the 30‐day all‐cause readmission rate was 15.1%. Sensitivity (39%), positive predictive value (30%), and proportion of patients flagged (18%) were consistent with the values derived from the retrospective data, supporting the reproducibility and predictive stability of the chosen risk prediction model (Table 1). The C statistic of the model was also consistent between the retrospective and prospective datasets (0.62 and 0.61, respectively).
Readmission Rates
The mean 30‐day all‐cause readmission rate for the 24‐month period prior to the intervention was 14.4%, whereas the mean for the 12‐month period after the implementation was 15.1%. Thirty‐day all‐cause and 7‐day unplanned monthly readmission rates do not appear to have been impacted by the intervention (Figure 2). There was no evidence for either an immediate or sustained effect (Table 2).
| Hospital | Preimplementation Period | Immediate Effect | Postimplementation Period | P Value Change in Trenda | |||||
|---|---|---|---|---|---|---|---|---|---|
| Monthly % Change in Readmission Rates | P Value | Immediate % Change | P Value | Monthly % Change in Readmission Rates | P Value | ||||
| |||||||||
| 30‐Day All‐Cause Readmission Rates | |||||||||
| Hosp A | 0.023 | Stable | 0.153 | 0.480 | 0.991 | 0.100 | Increasing | 0.044 | 0.134 |
| Hosp B | 0.061 | Increasing | 0.002 | 0.492 | 0.125 | 0.060 | Stable | 0.296 | 0.048 |
| Hosp C | 0.026 | Stable | 0.413 | 0.447 | 0.585 | 0.046 | Stable | 0.629 | 0.476 |
| Health System | 0.032 | Increasing | 0.014 | 0.344 | 0.302 | 0.026 | Stable | 0.499 | 0.881 |
| 7‐Day Unplanned Readmission Rates | |||||||||
| Hosp A | 0.004 | Stable | 0.642 | 0.271 | 0.417 | 0.005 | Stable | 0.891 | 0.967 |
| Hosp B | 0.012 | Stable | 0.201 | 0.298 | 0.489 | 0.038 | Stable | 0.429 | 0.602 |
| Hosp C | 0.008 | Stable | 0.213 | 0.353 | 0.204 | 0.004 | Stable | 0.895 | 0.899 |
| Health System | 0.005 | Stable | 0.358 | 0.003 | 0.990 | 0.010 | Stable | 0.712 | 0.583 |
DISCUSSION
In this proof‐of‐concept study, we demonstrated the feasibility of an automated readmission risk prediction model integrated into a health system's EHR for a mixed population of hospitalized medical and surgical patients. To our knowledge, this is the first study in a general population of hospitalized patients to examine the impact of providing readmission risk assessment on readmission rates. We used a simple prediction model potentially generalizable to EHRs and healthcare populations beyond our own.
Existing risk prediction models for hospital readmission have important limitations and are difficult to implement in clinical practice.[22] Prediction models for hospital readmission are often dependent on retrospective claims data, developed for specific patient populations, and not designed for use early in the course of hospitalization when transitional care interventions can be initiated.[22] In addition, the time required to gather the necessary data and calculate the risk score remains a barrier to the adoption of prediction models in practice. By automating the process of readmission risk prediction, we were able to help integrate risk assessment into the healthcare process across many providers in a large multihospital healthcare organization. This has allowed us to consistently share risk assessment in real time with all members of the inpatient team, facilitating a team‐based approach to discharge planning.[23]
Two prior studies have developed readmission risk prediction models designed to be implemented into the EHR. Amarasingham et al.[24] developed and implemented[25] a heart failure‐specific prediction model based on the 18‐item Tabak mortality score.[26] Bradley et al.[27] studied in a broader population of medicine and surgery patients the predictive ability of a 26‐item score that utilized vital sign, cardiac rhythm, and nursing assessment data. Although EHRs are developing rapidly, currently the majority of EHRs do not support the use of many of the variables used in these models. In addition, both models were complex, raising concerns about generalizability to other healthcare settings and populations.
A distinctive characteristic of our model is its simplicity. We were cognizant of the realities of running a prediction model in a high‐volume production environment and the diminishing returns of adding more variables. We thus favored simplicity at all stages of model development, with the associated belief that complexity could be added with future iterations once feasibility had been established. Finally, we were aware that we were constructing a medical decision support tool rather than a simple classifier.[26] As such, the optimal model was not purely driven by discriminative ability, but also by our subjective assessment of the optimal trade‐off between sensitivity and specificity (the test‐treatment threshold) for such a model.[26] To facilitate model assessment, we thus categorized the potential predictor variables and evaluated the test characteristics of each combination of categorized variables. Although the C statistic of a model using continuous variables will be higher than a model using categorical values, model performance at the chosen trade‐off point is unlikely to be different.
Although the overall predictive ability of our model was fair, we found that it was associated with clinically meaningful differences in readmission rates between those triggering and not triggering the flag. The 30‐day all‐cause readmission rate in the 12‐month prospective sample was 15.1%, yet among those flagged as being at high risk for readmission the readmission rate was 30.4%. Given resource constraints and the need to selectively apply potentially costly care transition interventions, this may in practice translate into a meaningful discriminative ability.
Readmission rates did not change significantly during the study period. A number of plausible reasons for this exist, including: (1) the current model may not exhibit sufficient predictive ability to classify those at high risk or impact the behavior of providers appropriately, (2) those patients classified as high risk of readmission may not be at high risk of readmissions that are preventable, (3) information provided by the model may not yet routinely be used such that it can affect care, or (4) providing readmission risk assessment alone is not sufficient to influence readmission rates, and the other interventions or organizational changes necessary to impact care of those defined as high risk have not yet been implemented or are not yet being performed routinely. If the primary reasons for our results are those outlined in numbers 3 or 4, then readmission rates should improve over time as the risk flag becomes more routinely used, and those interventions necessary to impact readmission rates of those defined as high risk are implemented and performed.
Limitations
There are several limitations of this intervention. First, the prediction model was developed using 30‐day all‐cause readmissions, rather than attempting to identify potentially preventable readmissions. Thirty‐day readmission rates may not be a good proxy for preventable readmissions,[18] and as a consequence, the ability to predict 30‐day readmissions may not ensure that a prediction model is able to predict preventable readmissions. Nonetheless, 30‐day readmission rates remain the most commonly used quality metric.
Second, the impact of the risk flag on provider behavior is uncertain. We did not formally assess how the readmission risk flag was used by healthcare team members. Informal assessment has, however, revealed that the readmission risk flag is gradually being adopted by different members of the care team including unit‐based pharmacists who are using the flag to prioritize the delivery of medication education, social workers who are using the flag to prompt providers to consider higher level services for patients at high risk of readmission, and patient navigators who are using the flag to prioritize follow‐up phone calls. As a result, we hope that the flag will ultimately improve the processes of care for high‐risk patients.
Third, we did not capture readmissions to hospitals outside of our healthcare system and have therefore underestimated the readmission rate in our population. However, our assessment of the effect of the risk flag on readmissions focused on relative readmission rates over time, and the use of the interrupted time series methodology should protect against secular changes in outside hospital readmission rates that were not associated with the intervention.
Fourth, it is possible that the prediction model implemented could be significantly improved by including additional variables or data available during the hospital stay. However, simple classification models using a single variable have repeatedly been shown to have the ability to compete favorably with state‐of‐the‐art multivariable classification models.[28]
Fifth, our study was limited to a single academic health system, and our experience may not be generalizable to smaller healthcare systems with limited EHR systems. However, the simplicity of our prediction model and the integration into a commercial EHR may improve the generalizability of our experience to other healthcare settings. Additionally, partly due to recent policy initiatives, the adoption of integrated EHR systems by hospitals is expected to continue at a rapid rate and become the standard of care within the near future.[29]
CONCLUSION
An automated prediction model was effectively integrated into an existing EHR and was able to identify patients on admission who are at risk for readmission within 30 days of discharge. Future work will aim to further examine the impact of the flag on readmission rates, further refine the prediction model, and gather data on how providers and care teams use the information provided by the flag.
Disclosure
Dr. Umscheid‐s contribution to this project was supported in part by the National Center for Research Resources, Grant UL1RR024134, which is now at the National Center for Advancing Translational Sciences, Grant UL1TR000003. The content of this paper is solely the responsibility of the authors and does not necessarily represent the official views of the NIH.
- , , . Rehospitalizations among patients in the Medicare fee‐for‐service program. N Engl J Med. 2009;360(14):1418–1428.
- , . Hospital readmissions as a measure of quality of health care: advantages and limitations. Arch Intern Med. 2000;160(8):1074–1081.
- , , , , . Do older rural and urban veterans experience different rates of unplanned readmission to VA and non‐VA hospitals? J Rural Health. 2009;25(1):62–69.
- , , . Cost, causes and rates of rehospitalization of preterm infants. J Perinatol. 2007;27(10):614–619.
- , , , . Redefining readmission risk factors for general medicine patients. J Hosp Med. 2011;6(2):54–60.
- , , , et al. Incidence and main factors associated with early unplanned hospital readmission among French medical inpatients aged 75 and over admitted through emergency units. Age Ageing. 2008;37(4):416–422.
- , , , , . Proportion of hospital readmissions deemed avoidable: a systematic review. CMAJ. 2011;183(7):E391–E402.
- Hospital Quality Alliance. Available at: http://www.hospitalqualityalliance.org/hospitalqualityalliance/qualitymeasures/qualitymeasures.html. Accessed March 6, 2013.
- Institute for Healthcare Improvement. Available at: http://www.ihi.org/explore/Readmissions/Pages/default.aspx. Accessed March 6, 2013.
- Centers for Medicare and Medicaid Services. Available at: http://www.cms.gov/Medicare/Quality‐Initiatives‐Patient‐Assessment‐Instruments/HospitalQualityInits/OutcomeMeasures.html. Accessed March 6, 2013.
- , , , et al. Comprehensive discharge planning and home follow‐up of hospitalized elders: a randomized clinical trial. JAMA. 1999;281(7):613–620.
- , , , , , . Preparing patients and caregivers to participate in care delivered across settings: the Care Transitions Intervention. J Am Geriatr Soc. 2004;52(11):1817–1825.
- , , , , . The importance of transitional care in achieving health reform. Health Aff (Millwood). 2011;30(4):746–754.
- , , , , . Interventions to reduce 30‐day rehospitalization: a systematic review. Ann Intern Med. 2011;155(8):520–528.
- University of Pennsylvania Health System Center for Evidence‐based Practice. Available at: http://www.uphs.upenn.edu/cep/. Accessed March 6, 2013.
- , , . Hospital‐based comparative effectiveness centers: translating research into practice to improve the quality, safety and value of patient care. J Gen Intern Med. 2010;25(12):1352–1355.
- . Writing Arden Syntax Medical Logic Modules. Comput Biol Med. 1994;24(5):331–363.
- , . Thirty‐day readmissions—truth and consequences. N Engl J Med. 2012;366(15):1366–1369.
- . Information Retrieval. 2nd ed. Oxford, UK: Butterworth‐Heinemann; 1979.
- , , , . Segmented regression analysis of interrupted time series studies in medication use research. J Clin Pharm Ther. 2002;27(4):299–309.
- , . Application of least squares regression to relationships containing auto‐correlated error terms. J Am Stat Assoc. 1949; 44:32–61.
- , , , et al. Risk prediction models for hospital readmission: a systematic review. JAMA. 2011;306(15):1688–1698.
- , , , et al. Core Principles and values of effective team‐based health care. Available at: https://www.nationalahec.org/pdfs/VSRT‐Team‐Based‐Care‐Principles‐Values.pdf. Accessed March 19, 2013.
- , , , et al. An automated model to identify heart failure patients at risk for 30‐day readmission or death using electronic medical record data. Med Care. 2010;48(11):981–988.
- , , , et al. Allocating scarce resources in real‐time to reduce heart failure readmissions: a prospective, controlled study [published online ahead of print July 31, 2013]. BMJ Qual Saf. doi:10.1136/bmjqs‐2013‐001901.
- , . The threshold approach to clinical decision making. N Engl J Med. 1980;302(20):1109–1117.
- , , , , . Identifying patients at increased risk for unplanned readmission. Med Care. 2013;51(9):761–766.
- . Very simple classification rules perform well on most commonly used datasets. Mach Learn. 1993;11(1):63–91.
- . Stimulating the adoption of health information technology. N Engl J Med. 2009;360(15):1477–1479.
© 2013 Society of Hospital Medicine