User login
Drug combats complications of SCD

SAN FRANCISCO—Pharmaceutical-grade L-glutamine can reduce the risk of complications in patients with sickle cell disease (SCD), according to new research.
In a phase 3 study of more than 200 patients, those who received L-glutamine saw a reduction in sickle cell crises, hospitalizations, and the incidence of acute chest syndrome (ACS) when compared to patients who received placebo.
In addition, L-glutamine appeared to have a synergistic effect with hydroxyurea.
Yutaka Niihara, MD, of Emmaus Medical, Inc., in Torrance, California, presented these results at the 2014 ASH Annual Meeting (abstract 86*). Emmaus Medical produced the pharmaceutical-grade L-glutamine used in the study.
Dr Niihara noted that nicotinamide adenine dinucleotide (NAD) is an important physiological antioxidant in red blood cells. But in sickled red blood cells, NAD redox potential is significantly compromised.
So he and his colleagues hypothesized that glutamine, a precursor for NAD, can improve NAD redox potential and modify the destructive effect of increased oxidation and the pathophysiology of SCD. They also theorized that glutamine will decrease the frequency of vaso-occlusive crises.
To test their theories, the researchers enrolled 230 patients from 31 different sites on a phase 3 trial. Patients had sickle cell anemia (SS) or sickle B0 thalassemia. They were 5 years of age or older, and some were receiving hydroxyurea.
Patients were randomized 2:1 to receive L-glutamine at 0.3 g/kg twice daily (maximum 30 g/day) or placebo (maltodextrin) at 0.3 g/kg twice daily for 48 weeks. The researchers had discovered high variation in the quality of over-the-counter L-glutamine, so they used pharmaceutical-grade L-glutamine only.
In all, 152 patients received L-glutamine, and 78 received placebo. Demographics and baseline characteristics were similar between the two treatment arms.
The median age was 19 (range, 5-57) in the L-glutamine arm and 17 (range, 5-58) in the placebo arm. There were more females than males in both arms—52% and 57.7%, respectively. And most patients in both arms had sickle cell anemia—89.5% and 91%, respectively.
Safety and efficacy
Dr Niihara said there were no serious adverse events attributable to L-glutamine and no dose modifications due to toxicity.
There were more gastrointestinal events (such as constipation and flatulence) in the L-glutamine arm (8.6%) than in the placebo arm (5.2%). But there was no difference in other adverse events between the two arms.
The study’s primary endpoint was the frequency of painful sickle cell crises. Patients in the L-glutamine arm had 25% fewer crises than patients in the placebo arm (P=0.008).
In patients aged 18 and younger, the median number of sickle cell crises was 3 in the L-glutamine arm and 4 in the placebo arm (P<0.001). The numbers were the same in patients older than 18 (P<0.001) and among patients receiving hydroxyurea (P<0.001).
“Those patients, even though they were on hydroxyurea, they have shown improvements [with L-glutamine],” Dr Niihara said. “And it appears there is some synergistic effect . . ., certainly more than just an additive effect.”
Dr Niihara also noted that patients who received placebo took less than 2 months to experience a first sickle cell crisis, but, for patients on L-glutamine, it took almost 3 months before they had a first crisis. The time to a first crisis was a median of 87 days in the L-glutamine arm and 54 days in the placebo arm (P=0.010).
The study’s secondary endpoint was the frequency of hospitalizations. Compared to patients in the placebo arm, those in the L-glutamine arm had a 33% reduction in hospitalizations (P=0.005) and a 41% reduction in the length of hospital stay (P=0.022).
The researchers also looked at the incidence of ACS and found that L-glutamine was associated with a 58% reduction in ACS. The incidence was 26.9% in the placebo arm and 11.9% in the L-glutamine arm (P=0.006).
“We observed this cascade improvement [with L-glutamine],” Dr Niihara noted. “And what we mean [by that] is that, with glutamine, there is less chance of having painful crises, but if patients have to have crises, they have less chance of being hospitalized. And if they have to be hospitalized, their stays in the hospital are shorter. And, again, if they have to be hospitalized, there’s less chance of them going to the ICU with acute chest syndrome.”
Dr Niihara said the researchers’ next steps are to investigate L-glutamine in a clinical setting, in patients younger than 5 years old, in pregnant women, and as part of combination therapy. 
*Information in the abstract differs from that presented at the meeting.
SAN FRANCISCO—Pharmaceutical-grade L-glutamine can reduce the risk of complications in patients with sickle cell disease (SCD), according to new research.
In a phase 3 study of more than 200 patients, those who received L-glutamine saw a reduction in sickle cell crises, hospitalizations, and the incidence of acute chest syndrome (ACS) when compared to patients who received placebo.
In addition, L-glutamine appeared to have a synergistic effect with hydroxyurea.
Yutaka Niihara, MD, of Emmaus Medical, Inc., in Torrance, California, presented these results at the 2014 ASH Annual Meeting (abstract 86*). Emmaus Medical produced the pharmaceutical-grade L-glutamine used in the study.
Dr Niihara noted that nicotinamide adenine dinucleotide (NAD) is an important physiological antioxidant in red blood cells. But in sickled red blood cells, NAD redox potential is significantly compromised.
So he and his colleagues hypothesized that glutamine, a precursor for NAD, can improve NAD redox potential and modify the destructive effect of increased oxidation and the pathophysiology of SCD. They also theorized that glutamine will decrease the frequency of vaso-occlusive crises.
To test their theories, the researchers enrolled 230 patients from 31 different sites on a phase 3 trial. Patients had sickle cell anemia (SS) or sickle B0 thalassemia. They were 5 years of age or older, and some were receiving hydroxyurea.
Patients were randomized 2:1 to receive L-glutamine at 0.3 g/kg twice daily (maximum 30 g/day) or placebo (maltodextrin) at 0.3 g/kg twice daily for 48 weeks. The researchers had discovered high variation in the quality of over-the-counter L-glutamine, so they used pharmaceutical-grade L-glutamine only.
In all, 152 patients received L-glutamine, and 78 received placebo. Demographics and baseline characteristics were similar between the two treatment arms.
The median age was 19 (range, 5-57) in the L-glutamine arm and 17 (range, 5-58) in the placebo arm. There were more females than males in both arms—52% and 57.7%, respectively. And most patients in both arms had sickle cell anemia—89.5% and 91%, respectively.
Safety and efficacy
Dr Niihara said there were no serious adverse events attributable to L-glutamine and no dose modifications due to toxicity.
There were more gastrointestinal events (such as constipation and flatulence) in the L-glutamine arm (8.6%) than in the placebo arm (5.2%). But there was no difference in other adverse events between the two arms.
The study’s primary endpoint was the frequency of painful sickle cell crises. Patients in the L-glutamine arm had 25% fewer crises than patients in the placebo arm (P=0.008).
In patients aged 18 and younger, the median number of sickle cell crises was 3 in the L-glutamine arm and 4 in the placebo arm (P<0.001). The numbers were the same in patients older than 18 (P<0.001) and among patients receiving hydroxyurea (P<0.001).
“Those patients, even though they were on hydroxyurea, they have shown improvements [with L-glutamine],” Dr Niihara said. “And it appears there is some synergistic effect . . ., certainly more than just an additive effect.”
Dr Niihara also noted that patients who received placebo took less than 2 months to experience a first sickle cell crisis, but, for patients on L-glutamine, it took almost 3 months before they had a first crisis. The time to a first crisis was a median of 87 days in the L-glutamine arm and 54 days in the placebo arm (P=0.010).
The study’s secondary endpoint was the frequency of hospitalizations. Compared to patients in the placebo arm, those in the L-glutamine arm had a 33% reduction in hospitalizations (P=0.005) and a 41% reduction in the length of hospital stay (P=0.022).
The researchers also looked at the incidence of ACS and found that L-glutamine was associated with a 58% reduction in ACS. The incidence was 26.9% in the placebo arm and 11.9% in the L-glutamine arm (P=0.006).
“We observed this cascade improvement [with L-glutamine],” Dr Niihara noted. “And what we mean [by that] is that, with glutamine, there is less chance of having painful crises, but if patients have to have crises, they have less chance of being hospitalized. And if they have to be hospitalized, their stays in the hospital are shorter. And, again, if they have to be hospitalized, there’s less chance of them going to the ICU with acute chest syndrome.”
Dr Niihara said the researchers’ next steps are to investigate L-glutamine in a clinical setting, in patients younger than 5 years old, in pregnant women, and as part of combination therapy.
*Information in the abstract differs from that presented at the meeting.
SAN FRANCISCO—Pharmaceutical-grade L-glutamine can reduce the risk of complications in patients with sickle cell disease (SCD), according to new research.
In a phase 3 study of more than 200 patients, those who received L-glutamine saw a reduction in sickle cell crises, hospitalizations, and the incidence of acute chest syndrome (ACS) when compared to patients who received placebo.
In addition, L-glutamine appeared to have a synergistic effect with hydroxyurea.
Yutaka Niihara, MD, of Emmaus Medical, Inc., in Torrance, California, presented these results at the 2014 ASH Annual Meeting (abstract 86*). Emmaus Medical produced the pharmaceutical-grade L-glutamine used in the study.
Dr Niihara noted that nicotinamide adenine dinucleotide (NAD) is an important physiological antioxidant in red blood cells. But in sickled red blood cells, NAD redox potential is significantly compromised.
So he and his colleagues hypothesized that glutamine, a precursor for NAD, can improve NAD redox potential and modify the destructive effect of increased oxidation and the pathophysiology of SCD. They also theorized that glutamine will decrease the frequency of vaso-occlusive crises.
To test their theories, the researchers enrolled 230 patients from 31 different sites on a phase 3 trial. Patients had sickle cell anemia (SS) or sickle B0 thalassemia. They were 5 years of age or older, and some were receiving hydroxyurea.
Patients were randomized 2:1 to receive L-glutamine at 0.3 g/kg twice daily (maximum 30 g/day) or placebo (maltodextrin) at 0.3 g/kg twice daily for 48 weeks. The researchers had discovered high variation in the quality of over-the-counter L-glutamine, so they used pharmaceutical-grade L-glutamine only.
In all, 152 patients received L-glutamine, and 78 received placebo. Demographics and baseline characteristics were similar between the two treatment arms.
The median age was 19 (range, 5-57) in the L-glutamine arm and 17 (range, 5-58) in the placebo arm. There were more females than males in both arms—52% and 57.7%, respectively. And most patients in both arms had sickle cell anemia—89.5% and 91%, respectively.
Safety and efficacy
Dr Niihara said there were no serious adverse events attributable to L-glutamine and no dose modifications due to toxicity.
There were more gastrointestinal events (such as constipation and flatulence) in the L-glutamine arm (8.6%) than in the placebo arm (5.2%). But there was no difference in other adverse events between the two arms.
The study’s primary endpoint was the frequency of painful sickle cell crises. Patients in the L-glutamine arm had 25% fewer crises than patients in the placebo arm (P=0.008).
In patients aged 18 and younger, the median number of sickle cell crises was 3 in the L-glutamine arm and 4 in the placebo arm (P<0.001). The numbers were the same in patients older than 18 (P<0.001) and among patients receiving hydroxyurea (P<0.001).
“Those patients, even though they were on hydroxyurea, they have shown improvements [with L-glutamine],” Dr Niihara said. “And it appears there is some synergistic effect . . ., certainly more than just an additive effect.”
Dr Niihara also noted that patients who received placebo took less than 2 months to experience a first sickle cell crisis, but, for patients on L-glutamine, it took almost 3 months before they had a first crisis. The time to a first crisis was a median of 87 days in the L-glutamine arm and 54 days in the placebo arm (P=0.010).
The study’s secondary endpoint was the frequency of hospitalizations. Compared to patients in the placebo arm, those in the L-glutamine arm had a 33% reduction in hospitalizations (P=0.005) and a 41% reduction in the length of hospital stay (P=0.022).
The researchers also looked at the incidence of ACS and found that L-glutamine was associated with a 58% reduction in ACS. The incidence was 26.9% in the placebo arm and 11.9% in the L-glutamine arm (P=0.006).
“We observed this cascade improvement [with L-glutamine],” Dr Niihara noted. “And what we mean [by that] is that, with glutamine, there is less chance of having painful crises, but if patients have to have crises, they have less chance of being hospitalized. And if they have to be hospitalized, their stays in the hospital are shorter. And, again, if they have to be hospitalized, there’s less chance of them going to the ICU with acute chest syndrome.”
Dr Niihara said the researchers’ next steps are to investigate L-glutamine in a clinical setting, in patients younger than 5 years old, in pregnant women, and as part of combination therapy.
*Information in the abstract differs from that presented at the meeting.

Introducing Choosing Wisely®
In this issue of the Journal of Hospital Medicine, we introduce a new recurring feature, Choosing Wisely: Next Steps in Improving Healthcare Value, sponsored by the American Board of Internal Medicine Foundation. The Choosing Wisely campaign is a collaborative initiative led by the American Board of Internal Medicine Foundation, in which specialty societies develop priority lists of activities that physicians should question doing routinely. The program has been broadly embraced by both patient and provider stakeholder groups. More than 35 specialty societies have contributed 26 published lists, including the Society of Hospital Medicine, which published 2 lists, 1 for adults and 1 for pediatrics. These included suggestions such as avoiding urinary catheters for convenience or monitoring of output, avoiding stress ulcer prophylaxis for low‐ to medium‐risk patients, and avoiding routine daily laboratory testing in clinically stable patients. A recent study estimated that up to $5 billion might be saved if just the primary care‐related recommendations were implemented.[1]
THE NEED FOR CHANGE
The Choosing Wisely campaign has so far focused primarily on identifying individual treatments that are not beneficial and potentially harmful to patients. At the Journal of Hospital Medicine, we believe the discipline of hospital medicine is well‐positioned to advance the broader discussion about achieving the triple aim: better healthcare, better health, and better value. Inpatient care represents only 7% of US healthcare encounters but 29% of healthcare expenditures (over $375 billion annually).[2] Patients aged 65 years and over account for 41% of all hospital costs and 34% of all hospital stays. Accordingly, without a change in current utilization patterns, the aging of the baby boomer generation will have a marked impact on expenditures for hospital care. Healthcare costs are increasingly edging out discretionary federal and municipal spending on critical services such as education and scientific research. Historically, federal discretionary spending has averaged 8.3% of gross domestic product (GDP). In 2014, it dropped to 7.2% and is projected to decline to 5.1% in 2024. By comparison, federal spending for Medicare, Medicaid, and health insurance subsidies was 2.1% in 1990[3] but in 2014 is estimated at 4.8% of GDP, rising to 5.7% by 2024.[4]
In conjunction with the deleterious consequences of unchecked growth in healthcare costs on national fiscal health, hospitals are feeling intense and increasing pressure to improve quality and value. In fiscal year 2015, hospitals will be at risk for up to 5.5% of Medicare payments under the parameters of the Hospital Readmission Reduction Program (maximum penalty 3% of base diagnosis‐related group [DRG] payments), Value‐Based Purchasing (maximum withholding 1.5% of base DRG payments), and the Hospital Acquired Conditions Program (maximum penalty 1% of all payments). Simultaneously, long‐standing subsidies are being phased out, including payments to teaching hospitals or for disproportionate share of care delivered to uninsured populations. The challenge for hospital medicine will be to take a leadership role in defining national priorities for change, organizing and guiding a pivot toward lower‐intensity care settings and services, and most importantly, promoting innovation in hospital‐based healthcare delivery.
EXISTING INNOVATIONS
The passage of the Affordable Care Act gave the Centers for Medicare & Medicaid Services (CMS) a platform for spurring innovation in healthcare delivery. In addition to deploying the payment penalty programs described above, the CMS Center for Medicare & Medicaid Innovation has a $10 billion budget to test alternate models of care. Demonstration projects to date include Accountable Care Organization pilots (ACOs, encouraging hospitals to join with community clinicians to provide integrated and coordinated care), the Bundled Payment program (paying providers a lump fee for an extended episode of care rather than service volume), a Comprehensive End Stage Renal Disease Care Initiative, and a variety of other tests of novel delivery and payment models that directly involve hospital medicine.[5] Private insurers are following suit, with an increasing proportion of hospital contracts involving shared savings or risk.
Hospitals are already responding to this new era of cost sharing and cross‐continuum accountability in a variety of creative ways. The University of Utah has developed an award‐winning cost accounting system that integrates highly detailed patient‐level cost data with clinical information to create a value‐driven outcomes tool that enables the hospital to consider costs as they relate to the results of care delivery. In this way, the hospital can justify maintaining high cost/better outcome activities, while targeting high cost/worse outcome practices for improvement.[6] Boston Children's Hospital is leading a group of healthcare systems in the development and application of a series of Standardized Clinical Assessment and Management Plans (SCAMPs), designed to improve patient care while decreasing unnecessary utilization (particularly in cases where existing evidence or guidelines are insufficient or outdated). Unlike traditional clinical care pathways or clinical guidelines, SCAMPs are developed iteratively based on actual internal practices, especially deviations from the standard plan, and their relationship to outcomes.[7, 8]
Local innovations, however, are of limited national importance in bending the cost curve unless broadly disseminated. The last decade has brought a new degree of cross‐institution collaboration to hospital care. Regional consortiums to improve care have existed for years, often prompted by CMS‐funded quality improvement organizations and demonstration projects.[9, 10] CMS's Partnership for Patients program has aimed to reduce hospital‐acquired conditions and readmissions by enrolling hospitals in 26 regional Hospital Engagement Networks.[11] Increasingly, however, hospitals are voluntarily engaging in collaboratives to improve the quality and value of their care. Over 500 US hospitals participate in the American College of Surgeons National Surgical Quality Improvement Program to improve surgical outcomes, nearly 1000 joined the Door‐to‐Balloon Alliance to improve percutaneous catheterization outcomes, and over 1000 joined the Hospital2Home collaborative to improve care transitions.[12, 13, 14] In 2008, the Premier hospital alliance formed QUEST (Quality, Efficiency, Safety and Transparency), a collaborative of approximately 350 members committed to improving a wide range of outcomes, from cost and efficiency to safety and mortality. Most recently, the High Value Healthcare Collaborative was formed, encompassing 19 large healthcare delivery organizations and over 70 million patients, with the central objective of creating a true learning healthcare system. In principle, these boundary‐spanning collaboratives should accelerate change nationally and serve as transformational agents. In practice, outcomes from these efforts have been variable, largely depending on the degree to which hospitals are able to share data, evaluate outcomes, and identify generalizable improvement interventions that can be reliably adopted.
Last, the focus of hospital care has already begun to extend beyond inpatient care. Hospitals already care for more outpatients than they do inpatients, and that trend is expected to continue. In 2012, hospitals treated 34.4 million inpatient admissions, but cared for nearly 675 million outpatient visits, only a fraction of which were emergency department visits or observation stays. From 2011 to 2012, outpatient visits to hospitals increased 2.9%, whereas inpatient admissions declined 1.2%.[15] Hospitals are buying up outpatient practices, creating infusion centers to provide intravenous‐based therapy to outpatients, establishing postdischarge clinics to transition their discharged patients, chartering their own visiting nurse agencies, and testing a host of other outpatient‐focused activities. Combined with an enhanced focus on postacute transitions following an inpatient admission as part of the care continuum, this broadening reach of hospital medicine brings a host of new opportunities for innovation in care delivery and payment models.
CHOOSING WISELY: NEXT STEPS IN IMPROVING HEALTHCARE VALUE
This series will consider a wide range of ways in which hospital medicine can help drive improvements in healthcare value, both from a conceptual standpoint (what to do and why?), as well as demonstration of practical application of these principles (how?). A companion series, Choosing Wisely: Things We Do For No Reason, will focus more explicitly on services such as blood transfusions or diagnostic tests such as creatinine kinase that are commonly overutilized. Example topics of interest for Next Steps include:
- Best methodologies for improvement science in hospital settings, including Lean healthcare, behavioral economics, human factors engineering
- Strategies for reconciling system‐level standardization with the delivery of personalized, patient‐centered care
- Impacts of national policies on hospital‐based improvement efforts: how do ACOs, bundled payments, and medical homes alter hospital practice?
- Reports on creative new ideas to help achieve value: changes in clinical workflow or care pathways, radical physical plant redesign, electronic medical record innovations, payment incentives, provider accountability and more
- Results of models that move the reach of hospital medicine beyond the walls as an integrated part of the care continuum.
We welcome unsolicited proposals for series topics submitted as a 500‐word precis to: nextsteps@hospitalmedicine.org.
Disclosures
Choosing Wisely: Next Steps in Improving Healthcare Value is sponsored by the American Board of Internal Medicine Foundation. Dr. Horwitz is supported by the National Institute on Aging (K08 AG038336) and by the American Federation for Aging Research through the Paul B. Beeson Career Development Award Program. The authors report no conflicts of interest.
- , , , . “Top 5” lists top $5 billion. Arch Intern Med. 2011;171(20):1858–1859.
- Healthcare Cost and Utilization Project. Statistical brief #146. Available at: http://www.hcup‐us.ahrq.gov/reports/statbriefs/sb146.pdf. Published January 2013. Accessed October 18, 2014.
- Centers for Medicare 32(5):911–920.
- Institute for Relevant Clinical Data Analytics, Inc. Relevant clinical data analytics I. SCAMPs mission statement. 2014. Available at: http://www.scamps.org/index.htm. Accessed October 18, 2014.
- , , , . The long‐term effect of premier pay for performance on patient outcomes. N Engl J Med. 2012;366(17):1606–1615.
- . Effects of the Premier Hospital Quality Incentive Demonstration on Medicare patient mortality and cost. Health Serv Res. 2009;44(3):821–842.
- Centers for Medicare 1(1):97–104.
- American College of Cardiology. Quality Improvement for Institutions. Hospital to home. 2014. Available at: http://cvquality.acc.org/Initiatives/H2H.aspx. Accessed October 19, 2014.
- American College of Surgeons. National Surgical Quality Improvement Program. 2014. Available at: http://site.acsnsqip.org/. Accessed October 19, 2014.
- . Hospitals on the rebound, show stronger operating margins. Modern Healthcare website. Available at: http://www. modernhealthcare.com/article/20140103/NEWS/301039973. Published January 3, 2014. Accessed October 18, 2014.
In this issue of the Journal of Hospital Medicine, we introduce a new recurring feature, Choosing Wisely: Next Steps in Improving Healthcare Value, sponsored by the American Board of Internal Medicine Foundation. The Choosing Wisely campaign is a collaborative initiative led by the American Board of Internal Medicine Foundation, in which specialty societies develop priority lists of activities that physicians should question doing routinely. The program has been broadly embraced by both patient and provider stakeholder groups. More than 35 specialty societies have contributed 26 published lists, including the Society of Hospital Medicine, which published 2 lists, 1 for adults and 1 for pediatrics. These included suggestions such as avoiding urinary catheters for convenience or monitoring of output, avoiding stress ulcer prophylaxis for low‐ to medium‐risk patients, and avoiding routine daily laboratory testing in clinically stable patients. A recent study estimated that up to $5 billion might be saved if just the primary care‐related recommendations were implemented.[1]
THE NEED FOR CHANGE
The Choosing Wisely campaign has so far focused primarily on identifying individual treatments that are not beneficial and potentially harmful to patients. At the Journal of Hospital Medicine, we believe the discipline of hospital medicine is well‐positioned to advance the broader discussion about achieving the triple aim: better healthcare, better health, and better value. Inpatient care represents only 7% of US healthcare encounters but 29% of healthcare expenditures (over $375 billion annually).[2] Patients aged 65 years and over account for 41% of all hospital costs and 34% of all hospital stays. Accordingly, without a change in current utilization patterns, the aging of the baby boomer generation will have a marked impact on expenditures for hospital care. Healthcare costs are increasingly edging out discretionary federal and municipal spending on critical services such as education and scientific research. Historically, federal discretionary spending has averaged 8.3% of gross domestic product (GDP). In 2014, it dropped to 7.2% and is projected to decline to 5.1% in 2024. By comparison, federal spending for Medicare, Medicaid, and health insurance subsidies was 2.1% in 1990[3] but in 2014 is estimated at 4.8% of GDP, rising to 5.7% by 2024.[4]
In conjunction with the deleterious consequences of unchecked growth in healthcare costs on national fiscal health, hospitals are feeling intense and increasing pressure to improve quality and value. In fiscal year 2015, hospitals will be at risk for up to 5.5% of Medicare payments under the parameters of the Hospital Readmission Reduction Program (maximum penalty 3% of base diagnosis‐related group [DRG] payments), Value‐Based Purchasing (maximum withholding 1.5% of base DRG payments), and the Hospital Acquired Conditions Program (maximum penalty 1% of all payments). Simultaneously, long‐standing subsidies are being phased out, including payments to teaching hospitals or for disproportionate share of care delivered to uninsured populations. The challenge for hospital medicine will be to take a leadership role in defining national priorities for change, organizing and guiding a pivot toward lower‐intensity care settings and services, and most importantly, promoting innovation in hospital‐based healthcare delivery.
EXISTING INNOVATIONS
The passage of the Affordable Care Act gave the Centers for Medicare & Medicaid Services (CMS) a platform for spurring innovation in healthcare delivery. In addition to deploying the payment penalty programs described above, the CMS Center for Medicare & Medicaid Innovation has a $10 billion budget to test alternate models of care. Demonstration projects to date include Accountable Care Organization pilots (ACOs, encouraging hospitals to join with community clinicians to provide integrated and coordinated care), the Bundled Payment program (paying providers a lump fee for an extended episode of care rather than service volume), a Comprehensive End Stage Renal Disease Care Initiative, and a variety of other tests of novel delivery and payment models that directly involve hospital medicine.[5] Private insurers are following suit, with an increasing proportion of hospital contracts involving shared savings or risk.
Hospitals are already responding to this new era of cost sharing and cross‐continuum accountability in a variety of creative ways. The University of Utah has developed an award‐winning cost accounting system that integrates highly detailed patient‐level cost data with clinical information to create a value‐driven outcomes tool that enables the hospital to consider costs as they relate to the results of care delivery. In this way, the hospital can justify maintaining high cost/better outcome activities, while targeting high cost/worse outcome practices for improvement.[6] Boston Children's Hospital is leading a group of healthcare systems in the development and application of a series of Standardized Clinical Assessment and Management Plans (SCAMPs), designed to improve patient care while decreasing unnecessary utilization (particularly in cases where existing evidence or guidelines are insufficient or outdated). Unlike traditional clinical care pathways or clinical guidelines, SCAMPs are developed iteratively based on actual internal practices, especially deviations from the standard plan, and their relationship to outcomes.[7, 8]
Local innovations, however, are of limited national importance in bending the cost curve unless broadly disseminated. The last decade has brought a new degree of cross‐institution collaboration to hospital care. Regional consortiums to improve care have existed for years, often prompted by CMS‐funded quality improvement organizations and demonstration projects.[9, 10] CMS's Partnership for Patients program has aimed to reduce hospital‐acquired conditions and readmissions by enrolling hospitals in 26 regional Hospital Engagement Networks.[11] Increasingly, however, hospitals are voluntarily engaging in collaboratives to improve the quality and value of their care. Over 500 US hospitals participate in the American College of Surgeons National Surgical Quality Improvement Program to improve surgical outcomes, nearly 1000 joined the Door‐to‐Balloon Alliance to improve percutaneous catheterization outcomes, and over 1000 joined the Hospital2Home collaborative to improve care transitions.[12, 13, 14] In 2008, the Premier hospital alliance formed QUEST (Quality, Efficiency, Safety and Transparency), a collaborative of approximately 350 members committed to improving a wide range of outcomes, from cost and efficiency to safety and mortality. Most recently, the High Value Healthcare Collaborative was formed, encompassing 19 large healthcare delivery organizations and over 70 million patients, with the central objective of creating a true learning healthcare system. In principle, these boundary‐spanning collaboratives should accelerate change nationally and serve as transformational agents. In practice, outcomes from these efforts have been variable, largely depending on the degree to which hospitals are able to share data, evaluate outcomes, and identify generalizable improvement interventions that can be reliably adopted.
Last, the focus of hospital care has already begun to extend beyond inpatient care. Hospitals already care for more outpatients than they do inpatients, and that trend is expected to continue. In 2012, hospitals treated 34.4 million inpatient admissions, but cared for nearly 675 million outpatient visits, only a fraction of which were emergency department visits or observation stays. From 2011 to 2012, outpatient visits to hospitals increased 2.9%, whereas inpatient admissions declined 1.2%.[15] Hospitals are buying up outpatient practices, creating infusion centers to provide intravenous‐based therapy to outpatients, establishing postdischarge clinics to transition their discharged patients, chartering their own visiting nurse agencies, and testing a host of other outpatient‐focused activities. Combined with an enhanced focus on postacute transitions following an inpatient admission as part of the care continuum, this broadening reach of hospital medicine brings a host of new opportunities for innovation in care delivery and payment models.
CHOOSING WISELY: NEXT STEPS IN IMPROVING HEALTHCARE VALUE
This series will consider a wide range of ways in which hospital medicine can help drive improvements in healthcare value, both from a conceptual standpoint (what to do and why?), as well as demonstration of practical application of these principles (how?). A companion series, Choosing Wisely: Things We Do For No Reason, will focus more explicitly on services such as blood transfusions or diagnostic tests such as creatinine kinase that are commonly overutilized. Example topics of interest for Next Steps include:
- Best methodologies for improvement science in hospital settings, including Lean healthcare, behavioral economics, human factors engineering
- Strategies for reconciling system‐level standardization with the delivery of personalized, patient‐centered care
- Impacts of national policies on hospital‐based improvement efforts: how do ACOs, bundled payments, and medical homes alter hospital practice?
- Reports on creative new ideas to help achieve value: changes in clinical workflow or care pathways, radical physical plant redesign, electronic medical record innovations, payment incentives, provider accountability and more
- Results of models that move the reach of hospital medicine beyond the walls as an integrated part of the care continuum.
We welcome unsolicited proposals for series topics submitted as a 500‐word precis to: nextsteps@hospitalmedicine.org.
Disclosures
Choosing Wisely: Next Steps in Improving Healthcare Value is sponsored by the American Board of Internal Medicine Foundation. Dr. Horwitz is supported by the National Institute on Aging (K08 AG038336) and by the American Federation for Aging Research through the Paul B. Beeson Career Development Award Program. The authors report no conflicts of interest.
In this issue of the Journal of Hospital Medicine, we introduce a new recurring feature, Choosing Wisely: Next Steps in Improving Healthcare Value, sponsored by the American Board of Internal Medicine Foundation. The Choosing Wisely campaign is a collaborative initiative led by the American Board of Internal Medicine Foundation, in which specialty societies develop priority lists of activities that physicians should question doing routinely. The program has been broadly embraced by both patient and provider stakeholder groups. More than 35 specialty societies have contributed 26 published lists, including the Society of Hospital Medicine, which published 2 lists, 1 for adults and 1 for pediatrics. These included suggestions such as avoiding urinary catheters for convenience or monitoring of output, avoiding stress ulcer prophylaxis for low‐ to medium‐risk patients, and avoiding routine daily laboratory testing in clinically stable patients. A recent study estimated that up to $5 billion might be saved if just the primary care‐related recommendations were implemented.[1]
THE NEED FOR CHANGE
The Choosing Wisely campaign has so far focused primarily on identifying individual treatments that are not beneficial and potentially harmful to patients. At the Journal of Hospital Medicine, we believe the discipline of hospital medicine is well‐positioned to advance the broader discussion about achieving the triple aim: better healthcare, better health, and better value. Inpatient care represents only 7% of US healthcare encounters but 29% of healthcare expenditures (over $375 billion annually).[2] Patients aged 65 years and over account for 41% of all hospital costs and 34% of all hospital stays. Accordingly, without a change in current utilization patterns, the aging of the baby boomer generation will have a marked impact on expenditures for hospital care. Healthcare costs are increasingly edging out discretionary federal and municipal spending on critical services such as education and scientific research. Historically, federal discretionary spending has averaged 8.3% of gross domestic product (GDP). In 2014, it dropped to 7.2% and is projected to decline to 5.1% in 2024. By comparison, federal spending for Medicare, Medicaid, and health insurance subsidies was 2.1% in 1990[3] but in 2014 is estimated at 4.8% of GDP, rising to 5.7% by 2024.[4]
In conjunction with the deleterious consequences of unchecked growth in healthcare costs on national fiscal health, hospitals are feeling intense and increasing pressure to improve quality and value. In fiscal year 2015, hospitals will be at risk for up to 5.5% of Medicare payments under the parameters of the Hospital Readmission Reduction Program (maximum penalty 3% of base diagnosis‐related group [DRG] payments), Value‐Based Purchasing (maximum withholding 1.5% of base DRG payments), and the Hospital Acquired Conditions Program (maximum penalty 1% of all payments). Simultaneously, long‐standing subsidies are being phased out, including payments to teaching hospitals or for disproportionate share of care delivered to uninsured populations. The challenge for hospital medicine will be to take a leadership role in defining national priorities for change, organizing and guiding a pivot toward lower‐intensity care settings and services, and most importantly, promoting innovation in hospital‐based healthcare delivery.
EXISTING INNOVATIONS
The passage of the Affordable Care Act gave the Centers for Medicare & Medicaid Services (CMS) a platform for spurring innovation in healthcare delivery. In addition to deploying the payment penalty programs described above, the CMS Center for Medicare & Medicaid Innovation has a $10 billion budget to test alternate models of care. Demonstration projects to date include Accountable Care Organization pilots (ACOs, encouraging hospitals to join with community clinicians to provide integrated and coordinated care), the Bundled Payment program (paying providers a lump fee for an extended episode of care rather than service volume), a Comprehensive End Stage Renal Disease Care Initiative, and a variety of other tests of novel delivery and payment models that directly involve hospital medicine.[5] Private insurers are following suit, with an increasing proportion of hospital contracts involving shared savings or risk.
Hospitals are already responding to this new era of cost sharing and cross‐continuum accountability in a variety of creative ways. The University of Utah has developed an award‐winning cost accounting system that integrates highly detailed patient‐level cost data with clinical information to create a value‐driven outcomes tool that enables the hospital to consider costs as they relate to the results of care delivery. In this way, the hospital can justify maintaining high cost/better outcome activities, while targeting high cost/worse outcome practices for improvement.[6] Boston Children's Hospital is leading a group of healthcare systems in the development and application of a series of Standardized Clinical Assessment and Management Plans (SCAMPs), designed to improve patient care while decreasing unnecessary utilization (particularly in cases where existing evidence or guidelines are insufficient or outdated). Unlike traditional clinical care pathways or clinical guidelines, SCAMPs are developed iteratively based on actual internal practices, especially deviations from the standard plan, and their relationship to outcomes.[7, 8]
Local innovations, however, are of limited national importance in bending the cost curve unless broadly disseminated. The last decade has brought a new degree of cross‐institution collaboration to hospital care. Regional consortiums to improve care have existed for years, often prompted by CMS‐funded quality improvement organizations and demonstration projects.[9, 10] CMS's Partnership for Patients program has aimed to reduce hospital‐acquired conditions and readmissions by enrolling hospitals in 26 regional Hospital Engagement Networks.[11] Increasingly, however, hospitals are voluntarily engaging in collaboratives to improve the quality and value of their care. Over 500 US hospitals participate in the American College of Surgeons National Surgical Quality Improvement Program to improve surgical outcomes, nearly 1000 joined the Door‐to‐Balloon Alliance to improve percutaneous catheterization outcomes, and over 1000 joined the Hospital2Home collaborative to improve care transitions.[12, 13, 14] In 2008, the Premier hospital alliance formed QUEST (Quality, Efficiency, Safety and Transparency), a collaborative of approximately 350 members committed to improving a wide range of outcomes, from cost and efficiency to safety and mortality. Most recently, the High Value Healthcare Collaborative was formed, encompassing 19 large healthcare delivery organizations and over 70 million patients, with the central objective of creating a true learning healthcare system. In principle, these boundary‐spanning collaboratives should accelerate change nationally and serve as transformational agents. In practice, outcomes from these efforts have been variable, largely depending on the degree to which hospitals are able to share data, evaluate outcomes, and identify generalizable improvement interventions that can be reliably adopted.
Last, the focus of hospital care has already begun to extend beyond inpatient care. Hospitals already care for more outpatients than they do inpatients, and that trend is expected to continue. In 2012, hospitals treated 34.4 million inpatient admissions, but cared for nearly 675 million outpatient visits, only a fraction of which were emergency department visits or observation stays. From 2011 to 2012, outpatient visits to hospitals increased 2.9%, whereas inpatient admissions declined 1.2%.[15] Hospitals are buying up outpatient practices, creating infusion centers to provide intravenous‐based therapy to outpatients, establishing postdischarge clinics to transition their discharged patients, chartering their own visiting nurse agencies, and testing a host of other outpatient‐focused activities. Combined with an enhanced focus on postacute transitions following an inpatient admission as part of the care continuum, this broadening reach of hospital medicine brings a host of new opportunities for innovation in care delivery and payment models.
CHOOSING WISELY: NEXT STEPS IN IMPROVING HEALTHCARE VALUE
This series will consider a wide range of ways in which hospital medicine can help drive improvements in healthcare value, both from a conceptual standpoint (what to do and why?), as well as demonstration of practical application of these principles (how?). A companion series, Choosing Wisely: Things We Do For No Reason, will focus more explicitly on services such as blood transfusions or diagnostic tests such as creatinine kinase that are commonly overutilized. Example topics of interest for Next Steps include:
- Best methodologies for improvement science in hospital settings, including Lean healthcare, behavioral economics, human factors engineering
- Strategies for reconciling system‐level standardization with the delivery of personalized, patient‐centered care
- Impacts of national policies on hospital‐based improvement efforts: how do ACOs, bundled payments, and medical homes alter hospital practice?
- Reports on creative new ideas to help achieve value: changes in clinical workflow or care pathways, radical physical plant redesign, electronic medical record innovations, payment incentives, provider accountability and more
- Results of models that move the reach of hospital medicine beyond the walls as an integrated part of the care continuum.
We welcome unsolicited proposals for series topics submitted as a 500‐word precis to: nextsteps@hospitalmedicine.org.
Disclosures
Choosing Wisely: Next Steps in Improving Healthcare Value is sponsored by the American Board of Internal Medicine Foundation. Dr. Horwitz is supported by the National Institute on Aging (K08 AG038336) and by the American Federation for Aging Research through the Paul B. Beeson Career Development Award Program. The authors report no conflicts of interest.
- , , , . “Top 5” lists top $5 billion. Arch Intern Med. 2011;171(20):1858–1859.
- Healthcare Cost and Utilization Project. Statistical brief #146. Available at: http://www.hcup‐us.ahrq.gov/reports/statbriefs/sb146.pdf. Published January 2013. Accessed October 18, 2014.
- Centers for Medicare 32(5):911–920.
- Institute for Relevant Clinical Data Analytics, Inc. Relevant clinical data analytics I. SCAMPs mission statement. 2014. Available at: http://www.scamps.org/index.htm. Accessed October 18, 2014.
- , , , . The long‐term effect of premier pay for performance on patient outcomes. N Engl J Med. 2012;366(17):1606–1615.
- . Effects of the Premier Hospital Quality Incentive Demonstration on Medicare patient mortality and cost. Health Serv Res. 2009;44(3):821–842.
- Centers for Medicare 1(1):97–104.
- American College of Cardiology. Quality Improvement for Institutions. Hospital to home. 2014. Available at: http://cvquality.acc.org/Initiatives/H2H.aspx. Accessed October 19, 2014.
- American College of Surgeons. National Surgical Quality Improvement Program. 2014. Available at: http://site.acsnsqip.org/. Accessed October 19, 2014.
- . Hospitals on the rebound, show stronger operating margins. Modern Healthcare website. Available at: http://www. modernhealthcare.com/article/20140103/NEWS/301039973. Published January 3, 2014. Accessed October 18, 2014.
- , , , . “Top 5” lists top $5 billion. Arch Intern Med. 2011;171(20):1858–1859.
- Healthcare Cost and Utilization Project. Statistical brief #146. Available at: http://www.hcup‐us.ahrq.gov/reports/statbriefs/sb146.pdf. Published January 2013. Accessed October 18, 2014.
- Centers for Medicare 32(5):911–920.
- Institute for Relevant Clinical Data Analytics, Inc. Relevant clinical data analytics I. SCAMPs mission statement. 2014. Available at: http://www.scamps.org/index.htm. Accessed October 18, 2014.
- , , , . The long‐term effect of premier pay for performance on patient outcomes. N Engl J Med. 2012;366(17):1606–1615.
- . Effects of the Premier Hospital Quality Incentive Demonstration on Medicare patient mortality and cost. Health Serv Res. 2009;44(3):821–842.
- Centers for Medicare 1(1):97–104.
- American College of Cardiology. Quality Improvement for Institutions. Hospital to home. 2014. Available at: http://cvquality.acc.org/Initiatives/H2H.aspx. Accessed October 19, 2014.
- American College of Surgeons. National Surgical Quality Improvement Program. 2014. Available at: http://site.acsnsqip.org/. Accessed October 19, 2014.
- . Hospitals on the rebound, show stronger operating margins. Modern Healthcare website. Available at: http://www. modernhealthcare.com/article/20140103/NEWS/301039973. Published January 3, 2014. Accessed October 18, 2014.
Impact of MC Intervention on QIs
Decompensated cirrhosis (DC) is defined as cirrhosis with at least 1 of the following complications: ascites, hepatocellular carcinoma, bleeding from portal hypertension, or hepatic encephalopathy. Patients with DC have a median survival estimated at 2 years compared to the 12‐year median survival of compensated cirrhotics.[1] In an era where quality of hospital care is being measured, and where progress is being made in the management of several conditions including congestive heart failure and nosocomial infections, little attention has been paid to DC. The burden of chronic liver failure is clear in the United States, where DC leads to more than 150,000 annual admissions to the hospital and accounts for 40,000 deaths annually.[2]
This burden of disease spurred quality improvement efforts in 2010, when a team of experts identified a set of literature‐based parameters or quality indicators (QI) for patients with cirrhosis.[3] We have demonstrated that adherence to these indicators fell far short of desired targets.[4] A year before their publication, an overall compliance of <50% with these metrics was measured at a single medical center.
We sought to improve the quality of care for patients with DC through implementation of mandatory consultation (MC) with a gastroenterologist for all patients admitted with DC. We assessed whether MC was associated with better care and improved outcomes (hospitalization length of stay [LOS], 30‐day readmission, and inpatient mortality) when compared to usual care (UC).[4]
MATERIALS AND METHODS
Design, Setting, and Patients
We conducted a cohort study comparing adherence to QI and outcomes of patients admitted with DC after the institution of an MC to a historical cohort of patients managed with UC (ie, before MC, adherence to QI for this group has been reported elsewhere).[4] Both cohorts included all patients aged >18 years with DC admitted to Baystate Medical Center, a tertiary care medical center in western Massachusetts. The UC cohort was collected between January 1, 2009 and December 31, 2009, and the MC cohort was assembled between June 1, 2011 and June 30, 2012.
As previously reported,[4] patients were considered for inclusion in the historical cohort if their International Classification of DiseasesNinth Revision discharge code pertained to chronic liver disease (see Supporting Information, Appendix 1, in the online version of this article). This list was broad by design to identify all patients with decompensated cirrhosis. A gastroenterologist (R.G.) then manually extracted charts from electronic medical records (EMRs) using a set of predefined clinical criteria, the same in both cohorts, to identify the patients with DC: cirrhosis with concomitant ascites, hepatic encephalopathy, or gastrointestinal (GI) bleeding secondary to portal hypertension. Other types of decompensated states, such as hepatocellular carcinoma, were not included as their management was not detailed in the QI.[3]
We included patients with suspected or established cirrhosis who had ascites confirmed radiographically or by exam, noting shifting dullness or fluid wave. However, patients were excluded if they lacked sufficient peritoneal fluid for bedside or image‐guided paracentesis. Cirrhotic patients were defined as having hepatic encephalopathy if the patient had altered mental status not secondary to seizures, cerebrovascular accident, or alcohol withdrawal. Finally, gastrointestinal bleeding in cirrhotic patients was defined as any upper or lower bleeding prompting hospital admission, or identified in the medical record as clinically significant by the attending physician.
The same QIs were measured in both cohorts. From the QI set,[3] we selected the 16 QIs that would apply to the management of inpatients (see Supporting Information, Appendix 2, in the online version of this article). Indicators developed for outpatient settings were not included. A quality score was calculated for each admission, defined as the proportion of QIs met divided by the number of QIs for which the patient was eligible. For example, a patient with hepatic encephalopathy but without GI bleeding or ascites would have a score calculated as the number of QIs met for hepatic encephalopathy and documentation of transplant evaluation divided by 3 (2 QIs for hepatic encephalopathy and 1 QI for transplant evaluation). If the patient met both QIs for hepatic encephalopathy, but the consultant failed to address liver transplant eligibility, the score would be 2/3=0.666.
After the institution of the MC, all inpatients with DC were identified within 24 hours of admission by a gastroenterologist (R.G., D.D.), who manually reviewed on a daily basis all admissions from EMRs. An author (R.G.) would then contact the admitting team (hospitalist or resident) to make sure that a gastroenterology consult was called and would then obtain the QI by manual extraction from the EMRs.
Of the 16 gastroenterologists who work at the hospital, 12 of them belong to several private practice groups, whereas 4 are employed by the hospital. As part of the intervention, all gastroenterologists were made aware of the intervention 1 month before the starting date, were provided with a checklist of the QIs of interest, and were encouraged to work with the hospitalist attendings to achieve compliance with the QIs. We reminded the gastroenterologists of the ongoing study during routine division meetings and regularly sought feedback from the hospitalists
The MC consisted of a systematic consultation by a gastroenterologist: any identified patient with DC would generate a mandatory GI consultation and would be assigned to a specialist depending on the roster coverage for that day. A close monitoring of the process allowed us to confirm that all patients admitted with DC were seen by a gastroenterologist. Patients were followed until their discharge, death, or readmission to our institution during the study period.
Outcomes
The primary outcome was defined as the rate of adherence to the QIs and overall QI score expressed as a proportion as noted above. Secondary outcomes included in‐hospital mortality, LOS, and 30‐day readmission rate. These parameters were abstracted from the medical record.
Covariates
The hospital EMR (Cerner Corporation, North Kansas City, MO) was used to extract patient demographic parameters such as gender, race, language, and age at time of admission. Other admission‐level details were extracted from the EMR including Model for End‐Stage Liver Disease (MELD) scores, documented comorbidities (including substance abuse, psychiatric diagnosis, diabetes mellitus, renal failure, congestive heart failure, coronary artery disease, and cancer), underlying etiology for cirrhosis, and reason for admission.
The study was approved by Baystate Medical Center's institutional review board.
Statistical Analysis
Summary statistics for outcomes and covariates were calculated as means/standard deviations (SDs), medians/emnterquartile range, and proportions. Univariable statistics (unpaired t tests, 1‐way analysis of variance, Fisher exact test, Spearman correlation) were used to identify possible demographic (eg, age, race) and clinical (eg, admission complaint) predictors of quality score and with 30‐day outcomes. For each admission, a composite quality score, also known as an opportunity model score,[5, 6] was calculated as a fraction (ie, the number of QIs met divided by the total number of possible QIs indicated by the patient's presentation). This fraction was then multiplied by 100 so as to express the QI score as a percent. Possible scores, therefore, ranged from 0 to 100%.
Calculation of the 30‐day incidence proportion of readmission after the first admission was restricted to patients whose readmission occurred in this hospital, and occurring up to 30‐days before study closure (June 1, 2012). In‐hospital death was examined as a function of QI score during that admission. To derive an unbiased, risk‐adjusted estimate of the association between quality score and outcomes, multiple linear regression (opportunity model score [OMS], LOS) or multiple Poisson regression models (30‐day readmission, in‐hospital death) were built. These included a dummy variable for the study period, as well as any potential confounder that was associated at P0.10, with both study period and the outcome in univariable analyses. Robust standard errors were specified to account for multiple admissions within patients. Marginal means or proportions were then estimated with 95% confidence intervals derived using the delta method. All analyses were performed using Stata 12.1 for Windows (StataCorp, College Station, TX).
RESULTS
A total of 303 patients were observed in 695 hospitalizations;149 patients in 379 admissions were observed in the UC cohort, and 154 patients in 316 admissions were observed in the MC cohort. Baseline demographics of all study admissions appear in Table 1. Patients seen in the MC cohort were younger, more likely to speak English, and less likely to be male or have comorbid diabetes mellitus. Most admissions (n=217, 57.2%; 95% confidence interval: 52.3%‐62.3%) were not evaluated by a gastroenterologist in the UC cohort but all were in the MC cohort.
| UC, N=379, N (%) or Mean/SD | MC, N=316, N (%) or Mean/SD | P Value* | |
|---|---|---|---|
| |||
| Age, y | 55.3/12.1 | 53.3/13.6 | 0.05 |
| English speaking | 261 (68.9%) | 261 (82.6%) | <0.001 |
| Male | 251 (66.2%) | 163 (53.5%) | 0.001 |
| Race | <0.001 | ||
| White | 301 (79.4%) | 262 (82.9%) | |
| Black | 31 (8.2%) | 40 (12.7%) | |
| Asian | 16 (4.2%) | 0 (0.0%) | |
| Other | 31 (8.2%) | 14 (4.4%) | |
| Comorbidities | |||
| Substance | 75 (19.8%) | 58 (18.4%) | 0.70 |
| abuse | |||
| Psychiatric | 123 (32.5%) | 103 (32.9%) | 0.94 |
| Diabetes mellitus | 175 (45.4%) | 115 (36.5%) | 0.02 |
| Renal failure | 74 (19.3%) | 55 (17.4%) | 0.50 |
| CHF | 38 (10.0%) | 24 (7.6%) | 0.35 |
| CAD | 26 (6.9%) | 17 (5.4%) | 0.43 |
| Cancer | 48 (12.7%) | 40 (12.7%) | 1.00 |
| Admission MELD | 15.6/6.9 | 17.0/7.0 | 0.006 |
| Serum creatinine | 1.43/1.94 | 1.42/1.30 | 0.91 |
| Reason for admission | |||
| Hepatology/GI | 318 (83.9%) | 257 (81.3%) | 0.42 |
| Renal failure | 85 (22.4%) | 90 (28.5%) | 0.08 |
| Encephalopathy | 151 (39.3%) | 113 (34.9%) | 0.24 |
| GI bleed | 78 (20.5%) | 57 (18.0%) | 1.00 |
| Abdominal pain | 116 (30.7%) | 114 (36.2%) | 0.15 |
| Ascites | 246 (64.9%) | 185 (58.5%) | 0.10 |
Admission Characteristics
The baseline clinical measures of all study admissions appear in Table 1. The UC and MC cohorts had similar characteristics, with the majority of patients with DC admitted for a gastrointestinal/hepatology‐related reason specifically for the management of ascites and hepatic encephalopathy. The patients in the MC cohort had a statistically higher MELD score on admission, which was not clinically relevant.
Quality Measures
Adherence to individual quality indices is shown in Table 2.
| Condition (Denominator) | Quality Indicator (Numerator) | UC (n=379), Met/Indicated | MC (n=316), Met/Indicated | P Value | |
|---|---|---|---|---|---|
| |||||
| Admissions with ascites | |||||
| 1 | Admissions to the hospital because of ascites or encephalopathy. | Diagnostic paracentesis during admission. | 77/193, 39.9%, (32.9%, 46.9%) | 111/135, 82.2% (75.7%, 88.8%) | <0.001 |
| 2 | No fibrinolysis or disseminated intravascular coagulation before paracentesis INR <2.5, >100,000 platelets. | No fresh frozen plasma or platelet replacement given. | 36/37, 97.3% (91.8%, 103.0%) | 41/42, 97.6% (92.8%, 102.4%) | 1.00 |
| 3 | All admissions with diagnostic paracentesis (not limited to admissions for ascites or hepatic encephalopathy). | Cell count differential, total protein, albumin, and culture/sensitivity all performed. | 31/49, 63.3% (49.3%‐77.3%) | 46/72 63.9% (52.7%, 75.0%) | 1.00 |
| 4 | Admissions with known portal hypertension‐related ascites receiving a paracentesis. | Ascitic fluid cell count and differential performed. | 15/104, 14.4% (7.6%‐ 21.3%) | 47/62, 75.8% (63.2%, 88.4%) | <0.001 |
| 5 | Serum sodium 110 mEq/L. | Fluid restriction and discontinuation of diuretics. | NA | NA | NA |
| 6 | Polymorphonuclear count of 250/mm3 in ascites. | Empiric antibiotics, 6 hours of results. | 10/13, 76.9% (50.4%‐ 103.4%) | 16/20, 80.0% (60.8%, 99.2%) | 1.00 |
| 7 | Ascitic fluid, total protein 1.1 gm/dL, serum bilirubin 2.5 mg/dL. | Prophylactic antibiotics. | 4/12, 33.3% (2.0%‐ 64.6%) | 18/30, 60.0%, (41.4%, 78.6%) | 0.18 |
| 8 | Normal renal function. | Salt restriction and diuretics (spironolactone and loop diuretics). | 57/186, 30.6%, (24.0%‐ 37.3%) | 81/122, 66.4%, (57.9%, 74.9%) | <0.001 |
| Total ascites subscore, mean/SD | 30%/36% | 67%/34% | <0.001 | ||
| GI bleeding | |||||
| 9 | Admissions with GI bleeding: variceal and nonvariceal, hematemesis and melena. | Upper endoscopy 24 hours of presentation. | 60/78, 76.9% (67.4%, 86.4%) | 52/57, 91.2% (83.7%, 98.8%) | 0.04 |
| 10 | Esophageal varices (active, stigmata of recent bleeding, or no other causes to explain bleeding). | Endoscopic variceal ligation/sublerotherapy. | 40/46, 87.0% (76.8%‐97.1%) | 30/32, 93.8% (84.9%, 100.0%) | 0.46 |
| 11 | Admissions with established/suspected upper GI bleeding. | Antibiotics within 24 hours of admission. | 27/69, 39.1% (27.3%‐ 50.9%) | 26/58, 44.8% (31.6%, 58.0%) | 0.59 |
| 12 | Admissions with established/suspected variceal bleeding. | Somatostatin/octreotide given within 12 hours of presentation. | 53/69, 76.8%, (66.6%‐ 87.0%) | 49/58, 84.5% (73.8%, 95.2%) | 0.37 |
| 13 | Recurrent bleeding within 72 hours of initial endoscopic hemostasis. | Repeat endoscopy or transjugular intrahepatic portosystemic shunt. | 5/5 100% | 2/3, 66.7% (76.8%, 210.0%) | 0.38 |
| Total GI subscore, mean/SD | 61%/38% | 74%/28% | 0.04 | ||
| Liver transplantation | |||||
| 14 | Admissions with MELD 15 or MELD 15 and decompensated status (ie, all admissions in our study). | Documented evaluation for liver transplantation. | 112/379, 29.6% (24.9%‐ 34.2%) | 231/316, 73.6% (68.7%, 78.5%) | <0.001 |
| Hepatic encephalopathy | |||||
| 15 | Admissions with hepatic encephalopathy. | Search for reversible factors documented. | 81/151, 53.6% (45.6%‐ 61.7 %) | 97/113, 85.8% (79.4%, 92.3%) | <0.001 |
| 16 | Admissions with hepatic encephalopathy. | Oral disaccharides/ rifaximin. | 144/151, 95.3% (91.9 %‐ 98.7 %) | 107/113, 94.7% (90.7%. 98.69%) | 1.00 |
| Total encephalopathy subscore, mean/SD | 75%/28% | 90%/24% | <0.001 | ||
Ascites
The management of ascites yielded 3 main differences between the 2 cohorts. Following the implementation of the MC, 82.2 % (111/135) of ascites‐related admissions led to a diagnostic paracentesis as compared to 39.9% (77/193) in the UC group (P<0.001).
In the MC cohort, 75.8% (47/62) of admissions with known portal hypertensionrelated ascites who received a paracentesis had an ascites cell count checked. In contrast, only 14.4% (15/104) in the UC group receiving paracentesis had a fluid cell count (P<0.001). The management of ascites in patients with normal renal function was optimal, with sodium restriction and diuretics combination in 66.4% (81/122) of the MC cohort, whereas this parameter in the UC cohort was only 30.6% (57/186) (P<0.001). There were no significant differences between the groups for the other QIs.
Variceal Bleeding
The MC group had a higher frequency of endoscopy within 24 hours of admissions than the UC group (91.2% [52/57] vs 76.9% [60/78], respectively; P<0.04). The rest had endoscopy later in the admission. Among admissions with bleeding from varices, banding was done 93.8% of the time for patients in the MC group (30/32), which was not statistically different than 87.0% (40/46) for patients seen in the UC group. In the remaining admissions, endoscopy only revealed nonbleeding large esophageal varices, and the endoscopist opted not to proceed with therapy. There were no statistically significant differences in the rest of the management.
Hepatic Encephalopathy
For hepatic encephalopathy, an empirical treatment was given to 95.3 % (144/151) patients in the UC group and 94.7% (107/113) of the patients in the MC group. We found better documentation of a search for underlying etiologies leading to hepatic encephalopathy in the MC cohort 85.8% (97/113) versus the UC cohort, which was only 53.6% (81/151) (P<0.001).
Evaluation for Liver Transplantation
Better documentation of evaluation for liver transplantation was seen in the MC group 73.6% (231/316) in comparison to the UC group 29.4% (111/379) (P<0.001).
Opportunity Score and Clinical Outcomes
As detailed above, care provided during the MC achieved a higher compliance with the QI shown with the QI score or OMS (Table 3). These improvements were not associated with statistically significant differences in in‐hospital death, LOS, or 30‐day readmission. To explore this further we also examined the direct association between the OMS and outcomes in the MC group by dividing patients into 2 groups: patients whose OMS was 80% and those whose OMS was <80% (see Supporting Information, Appendix 4, in the online version of this article). Although there were trends toward decreased in‐hospital death (6.4% vs 8.6%, P=0.26), increased 30‐day readmission (33.8% vs 23.0%, P=0.27), and decreased LOS (6.2 days vs 6.6 days, P=0.77), none of these differences achieved statistical significance.
| Unadjusted | Adjusted* | |||||
|---|---|---|---|---|---|---|
| UC | MC | Difference | UC | MC | Difference | |
| ||||||
| Opportunity model score | 0.46 | 0.77 | +0.31 (0.24, 0.39) | 0.46 | 0.77 | +0.30(0.23, 0.37) |
| In‐hospital death | 7.1% | 8.5% | +1.4 (0.3, +5.6) | 7.5% | 7.9% | +0.4% (4.0%, +4.5%) |
| Readmission within 30 days | 39.6% | 32.6% | 7.0% (16.4%, +2.5%) | 40.0% | 31.8% | 8.2%(18.0%, +1.5%) |
| Length of stay | 6.1d | 6.2d | +0.1d (1.0 d, +1.2 d) | 6.1d | 6.2d | +0.1d (1.0 d, +1.2d) |
Mandatory Consultation Subgroups: Employed Versus Private Physicians
The type of employment of the gastroenterologist on consultation (employed by the hospital vs private practice) affected the management of the patients admitted with DC (see Supporting Information, Appendix 3, in the online version of this article). Patients seen by a hospital‐employed gastroenterologist were more likely to have a better documentation in regard to evaluation for liver transplantation and better management of ascites. Except for the prescription of antibiotics in patients presenting with GI bleeding, which were more often given by the employed physician (63% vs 23%, P=0.004), the management of hepatic encephalopathy and GI bleeding was similar between employed and private‐practice physicians.
DISCUSSION
In this evaluation of an MC intervention for patients with DC cared for at a large tertiary academic medical center, we found that the implementation of a routine consultation by a gastroenterologist led to greater adherence to recommended care processes when compared to UC. Overall, the management of ascites and the documentation of evaluation for liver transplantation were statistically superior in the intervention (MC) group. UC and MC were similar with respect to treatment of variceal bleeding and hepatic encephalopathy. Although we did not demonstrate changes in mortality, readmission, or LOS as a result of the MC intervention, our study was underpowered to detect clinically meaningful effects.
The gaps in care of patients with cirrhosis were reported before and after the publication of the formal QIs.[7, 8, 9, 10] These gaps remain relevant in the face of an increasing prevalence of DC along with a recent publication suggesting an underestimation of the burden of liver disease in the United States.[11] Ours is the first study to evaluate the impact on inpatients with DC of a liver service with a systematic, mandatory, specialist consultation. A previous study[12] had shown that a GI consultation would improve the care of patients with DC, but excluded patients with variceal bleeding, did not specifically measure the compliance with QIs, and more important, the GI consult was not mandatory.
Our study has several limitations that must be considered while weighing its findings. The patients were not randomly assigned but followed a pre‐established distribution depending on the call schedule. Some of the improvement we noted might be the result of secular trends; however, this remains unlikely given the lack of national initiatives or pay for performance programs. In the UC cohort, patients who were nonEnglish‐speaking were associated with a lower QI score, which could account for part of the improvement seen in the MC group that has a more prominent English‐speaking cohort. Readmissions could have occurred at other hospitals, and patients were not monitored in an outpatient setting. We did not observe a change in the secondary outcomes (30‐day readmission, LOS, in‐hospital death); however, our study was underpowered for that purpose. Given the complexity of the billing process we did not collect the costs of the MC, which is another limitation of our work. Future studies are needed to determine the cost‐effectiveness of the intervention.
This study shows that a dedicated team of physicians focused on compliance with QIs can achieve a rapid improvement, over a year, in providing higher‐quality care. This may be relevant at other institutions. The strength of our study is that our large tertiary academic medical center serves a large catchment area, with a mix of patients from both rural and urban communities. It is located in Massachusetts, where most of the population has had access to healthcare since 2006. Therefore, although this is a single‐center study, we expect our findings to be more generalizable and less subject to selection bias than other single‐center studies.
Importantly, the compliance with QIs was often far from being perfect in the MC group and was different across type of employment of providers, reflecting the challenges in changing practice among physicians.[13] In fact the QI scores of the private practice group did not change, and mirror the compliance observed at our institution in the previous study, before the implementation of the MC.[4] The difference in performance according to the type of employment of providers stems from 2 factors. First, a better documentation of the need of formal evaluation for liver transplantation by the employed gastroenterologists resulted in better compliance with this QI. Second, and more important, among the employed physicians, there was a readiness to assist the hospitalist with diagnostic/therapeutic paracentesis without relying on, for example, an interventional radiologist. This is reflected by the higher score in the management of ascites. Although our study was not designed to answer this directly, employed physicians may have been more engaged in the project and showed a greater willingness to change practice. In the future, linking reimbursement to quality of care will lead to improved accountability of consultants.
In this study we show that a direct involvement of a gastroenterologist improves the care of inpatients as measured by QIs. We theorize that a better coordination of the transition to outpatient care involving the specialist should lead to better outcomes, specifically a reduction in the 22% observed readmission rate within 30 days of patients with DC.[14, 15] As we move forward, a broader definition of outcomes should be addressed, taking into account patient‐related outcomes and preferences.[16] Future studies should define the relationship between the gastroenterologist and the hospitalist service, the role of physician assistants and nurse practitioners in implementing and monitoring compliance with QIs, and define how physicians and patients can be made accountable in the transition to the outpatient setting.
Disclosures
R.G.: Conception, data collection and interpretation, manuscript. J.F.: Data management, data analysis, manuscript. P.V.: Conception, data analysis, manuscript. P.L.: Conception, data interpretation, manuscript. T.L.: Dr. Lagu is supported by the National Heart, Lung, and Blood Institute of the National Institutes of Health under award number K01HL114745. Conception, data interpretation, manuscript. D.D.: Conception, data collection and interpretation, manuscript. A.B.: Data collection. J.S.: Data collection. Source of funding: internal. The authors report no conflicts of interest.
- , , . Natural history and prognostic indicators of survival in cirrhosis: a systematic review of 118 studies. J Hepatol. 2006;44:217–231.
- , , , . Efficacy of a chronic disease management model for patients with chronic liver failure. Clin Gastroenterol Hepatol. 2013;11:850–858.
- , , , et al. An Explicit Quality Indicator Set for Measurement of Quality of Care in Patients with Cirrhosis. Clin Gastroenterol Hepatol. 2010;8:709–717.
- , , , , , Desilets D. Measurement of the quality of care of patients admitted with decompensated cirrhosis. Liver Int. 2014:34:204–210.
- , . All‐or‐none measurement raises the bar on performance. JAMA. 2006;295:1168–1170.
- Joint Commission on Accreditation of Healthcare Organizations. Quality report user guide. Available at: http://www.jointcommission.org. Accessed May 30, 2011.
- , , , et al. Management of patients with cirrhosis in Southern California: results of a practitioner survey. J Clin Gastroenterol. 2006;40:156–161.
- , , , et al. Spanish Collaborative Study Group on Therapeutic Management In Liver Disease. Multicenter hospital study on prescribing patterns for prophylaxis and treatment of complications of cirrhosis. Eur J Clin Pharmacol. 2002;58:435–440.
- , , , et al. The quality of care provided to patients with cirrhosis and ascites in the Department of Veterans Affairs. Gastroenterology. 2012 143(1):70–77.
- , , , et al. Improved patient survival after acute variceal bleeding: a multicenter, cohort study. Am J Gastroenterol. 2003;98:653–659.
- , , , , . Underestimation of liver‐related mortality in the United States. Gastroenterology. 2013;145:375–382.
- , , , et al. Impact of gastroenterology consultation on the outcomes of patients admitted to the hospital with decompensated cirrhosis. Hepatology. 2001;34:1089–1095.
- , , , et al. Why don't physicians follow clinical practice guidelines? A framework for improvement. JAMA. 1999;282:1458–1465.
- , , , et al. Incidence and predictors of 30‐day readmission among patients hospitalized with advanced liver disease. Clin Gastroenterol Hepatol. 2011;9:254–259.
- , , , et al. Hospital Readmissions among patients with decompensated cirrhosis. Am J Gastroenterol. 2012;107:247–252.
- . Patient‐reported outcomes of cirrhosis. Clin Gastroenterol Hepatol. 2013;11:1043–1045.
Decompensated cirrhosis (DC) is defined as cirrhosis with at least 1 of the following complications: ascites, hepatocellular carcinoma, bleeding from portal hypertension, or hepatic encephalopathy. Patients with DC have a median survival estimated at 2 years compared to the 12‐year median survival of compensated cirrhotics.[1] In an era where quality of hospital care is being measured, and where progress is being made in the management of several conditions including congestive heart failure and nosocomial infections, little attention has been paid to DC. The burden of chronic liver failure is clear in the United States, where DC leads to more than 150,000 annual admissions to the hospital and accounts for 40,000 deaths annually.[2]
This burden of disease spurred quality improvement efforts in 2010, when a team of experts identified a set of literature‐based parameters or quality indicators (QI) for patients with cirrhosis.[3] We have demonstrated that adherence to these indicators fell far short of desired targets.[4] A year before their publication, an overall compliance of <50% with these metrics was measured at a single medical center.
We sought to improve the quality of care for patients with DC through implementation of mandatory consultation (MC) with a gastroenterologist for all patients admitted with DC. We assessed whether MC was associated with better care and improved outcomes (hospitalization length of stay [LOS], 30‐day readmission, and inpatient mortality) when compared to usual care (UC).[4]
MATERIALS AND METHODS
Design, Setting, and Patients
We conducted a cohort study comparing adherence to QI and outcomes of patients admitted with DC after the institution of an MC to a historical cohort of patients managed with UC (ie, before MC, adherence to QI for this group has been reported elsewhere).[4] Both cohorts included all patients aged >18 years with DC admitted to Baystate Medical Center, a tertiary care medical center in western Massachusetts. The UC cohort was collected between January 1, 2009 and December 31, 2009, and the MC cohort was assembled between June 1, 2011 and June 30, 2012.
As previously reported,[4] patients were considered for inclusion in the historical cohort if their International Classification of DiseasesNinth Revision discharge code pertained to chronic liver disease (see Supporting Information, Appendix 1, in the online version of this article). This list was broad by design to identify all patients with decompensated cirrhosis. A gastroenterologist (R.G.) then manually extracted charts from electronic medical records (EMRs) using a set of predefined clinical criteria, the same in both cohorts, to identify the patients with DC: cirrhosis with concomitant ascites, hepatic encephalopathy, or gastrointestinal (GI) bleeding secondary to portal hypertension. Other types of decompensated states, such as hepatocellular carcinoma, were not included as their management was not detailed in the QI.[3]
We included patients with suspected or established cirrhosis who had ascites confirmed radiographically or by exam, noting shifting dullness or fluid wave. However, patients were excluded if they lacked sufficient peritoneal fluid for bedside or image‐guided paracentesis. Cirrhotic patients were defined as having hepatic encephalopathy if the patient had altered mental status not secondary to seizures, cerebrovascular accident, or alcohol withdrawal. Finally, gastrointestinal bleeding in cirrhotic patients was defined as any upper or lower bleeding prompting hospital admission, or identified in the medical record as clinically significant by the attending physician.
The same QIs were measured in both cohorts. From the QI set,[3] we selected the 16 QIs that would apply to the management of inpatients (see Supporting Information, Appendix 2, in the online version of this article). Indicators developed for outpatient settings were not included. A quality score was calculated for each admission, defined as the proportion of QIs met divided by the number of QIs for which the patient was eligible. For example, a patient with hepatic encephalopathy but without GI bleeding or ascites would have a score calculated as the number of QIs met for hepatic encephalopathy and documentation of transplant evaluation divided by 3 (2 QIs for hepatic encephalopathy and 1 QI for transplant evaluation). If the patient met both QIs for hepatic encephalopathy, but the consultant failed to address liver transplant eligibility, the score would be 2/3=0.666.
After the institution of the MC, all inpatients with DC were identified within 24 hours of admission by a gastroenterologist (R.G., D.D.), who manually reviewed on a daily basis all admissions from EMRs. An author (R.G.) would then contact the admitting team (hospitalist or resident) to make sure that a gastroenterology consult was called and would then obtain the QI by manual extraction from the EMRs.
Of the 16 gastroenterologists who work at the hospital, 12 of them belong to several private practice groups, whereas 4 are employed by the hospital. As part of the intervention, all gastroenterologists were made aware of the intervention 1 month before the starting date, were provided with a checklist of the QIs of interest, and were encouraged to work with the hospitalist attendings to achieve compliance with the QIs. We reminded the gastroenterologists of the ongoing study during routine division meetings and regularly sought feedback from the hospitalists
The MC consisted of a systematic consultation by a gastroenterologist: any identified patient with DC would generate a mandatory GI consultation and would be assigned to a specialist depending on the roster coverage for that day. A close monitoring of the process allowed us to confirm that all patients admitted with DC were seen by a gastroenterologist. Patients were followed until their discharge, death, or readmission to our institution during the study period.
Outcomes
The primary outcome was defined as the rate of adherence to the QIs and overall QI score expressed as a proportion as noted above. Secondary outcomes included in‐hospital mortality, LOS, and 30‐day readmission rate. These parameters were abstracted from the medical record.
Covariates
The hospital EMR (Cerner Corporation, North Kansas City, MO) was used to extract patient demographic parameters such as gender, race, language, and age at time of admission. Other admission‐level details were extracted from the EMR including Model for End‐Stage Liver Disease (MELD) scores, documented comorbidities (including substance abuse, psychiatric diagnosis, diabetes mellitus, renal failure, congestive heart failure, coronary artery disease, and cancer), underlying etiology for cirrhosis, and reason for admission.
The study was approved by Baystate Medical Center's institutional review board.
Statistical Analysis
Summary statistics for outcomes and covariates were calculated as means/standard deviations (SDs), medians/emnterquartile range, and proportions. Univariable statistics (unpaired t tests, 1‐way analysis of variance, Fisher exact test, Spearman correlation) were used to identify possible demographic (eg, age, race) and clinical (eg, admission complaint) predictors of quality score and with 30‐day outcomes. For each admission, a composite quality score, also known as an opportunity model score,[5, 6] was calculated as a fraction (ie, the number of QIs met divided by the total number of possible QIs indicated by the patient's presentation). This fraction was then multiplied by 100 so as to express the QI score as a percent. Possible scores, therefore, ranged from 0 to 100%.
Calculation of the 30‐day incidence proportion of readmission after the first admission was restricted to patients whose readmission occurred in this hospital, and occurring up to 30‐days before study closure (June 1, 2012). In‐hospital death was examined as a function of QI score during that admission. To derive an unbiased, risk‐adjusted estimate of the association between quality score and outcomes, multiple linear regression (opportunity model score [OMS], LOS) or multiple Poisson regression models (30‐day readmission, in‐hospital death) were built. These included a dummy variable for the study period, as well as any potential confounder that was associated at P0.10, with both study period and the outcome in univariable analyses. Robust standard errors were specified to account for multiple admissions within patients. Marginal means or proportions were then estimated with 95% confidence intervals derived using the delta method. All analyses were performed using Stata 12.1 for Windows (StataCorp, College Station, TX).
RESULTS
A total of 303 patients were observed in 695 hospitalizations;149 patients in 379 admissions were observed in the UC cohort, and 154 patients in 316 admissions were observed in the MC cohort. Baseline demographics of all study admissions appear in Table 1. Patients seen in the MC cohort were younger, more likely to speak English, and less likely to be male or have comorbid diabetes mellitus. Most admissions (n=217, 57.2%; 95% confidence interval: 52.3%‐62.3%) were not evaluated by a gastroenterologist in the UC cohort but all were in the MC cohort.
| UC, N=379, N (%) or Mean/SD | MC, N=316, N (%) or Mean/SD | P Value* | |
|---|---|---|---|
| |||
| Age, y | 55.3/12.1 | 53.3/13.6 | 0.05 |
| English speaking | 261 (68.9%) | 261 (82.6%) | <0.001 |
| Male | 251 (66.2%) | 163 (53.5%) | 0.001 |
| Race | <0.001 | ||
| White | 301 (79.4%) | 262 (82.9%) | |
| Black | 31 (8.2%) | 40 (12.7%) | |
| Asian | 16 (4.2%) | 0 (0.0%) | |
| Other | 31 (8.2%) | 14 (4.4%) | |
| Comorbidities | |||
| Substance | 75 (19.8%) | 58 (18.4%) | 0.70 |
| abuse | |||
| Psychiatric | 123 (32.5%) | 103 (32.9%) | 0.94 |
| Diabetes mellitus | 175 (45.4%) | 115 (36.5%) | 0.02 |
| Renal failure | 74 (19.3%) | 55 (17.4%) | 0.50 |
| CHF | 38 (10.0%) | 24 (7.6%) | 0.35 |
| CAD | 26 (6.9%) | 17 (5.4%) | 0.43 |
| Cancer | 48 (12.7%) | 40 (12.7%) | 1.00 |
| Admission MELD | 15.6/6.9 | 17.0/7.0 | 0.006 |
| Serum creatinine | 1.43/1.94 | 1.42/1.30 | 0.91 |
| Reason for admission | |||
| Hepatology/GI | 318 (83.9%) | 257 (81.3%) | 0.42 |
| Renal failure | 85 (22.4%) | 90 (28.5%) | 0.08 |
| Encephalopathy | 151 (39.3%) | 113 (34.9%) | 0.24 |
| GI bleed | 78 (20.5%) | 57 (18.0%) | 1.00 |
| Abdominal pain | 116 (30.7%) | 114 (36.2%) | 0.15 |
| Ascites | 246 (64.9%) | 185 (58.5%) | 0.10 |
Admission Characteristics
The baseline clinical measures of all study admissions appear in Table 1. The UC and MC cohorts had similar characteristics, with the majority of patients with DC admitted for a gastrointestinal/hepatology‐related reason specifically for the management of ascites and hepatic encephalopathy. The patients in the MC cohort had a statistically higher MELD score on admission, which was not clinically relevant.
Quality Measures
Adherence to individual quality indices is shown in Table 2.
| Condition (Denominator) | Quality Indicator (Numerator) | UC (n=379), Met/Indicated | MC (n=316), Met/Indicated | P Value | |
|---|---|---|---|---|---|
| |||||
| Admissions with ascites | |||||
| 1 | Admissions to the hospital because of ascites or encephalopathy. | Diagnostic paracentesis during admission. | 77/193, 39.9%, (32.9%, 46.9%) | 111/135, 82.2% (75.7%, 88.8%) | <0.001 |
| 2 | No fibrinolysis or disseminated intravascular coagulation before paracentesis INR <2.5, >100,000 platelets. | No fresh frozen plasma or platelet replacement given. | 36/37, 97.3% (91.8%, 103.0%) | 41/42, 97.6% (92.8%, 102.4%) | 1.00 |
| 3 | All admissions with diagnostic paracentesis (not limited to admissions for ascites or hepatic encephalopathy). | Cell count differential, total protein, albumin, and culture/sensitivity all performed. | 31/49, 63.3% (49.3%‐77.3%) | 46/72 63.9% (52.7%, 75.0%) | 1.00 |
| 4 | Admissions with known portal hypertension‐related ascites receiving a paracentesis. | Ascitic fluid cell count and differential performed. | 15/104, 14.4% (7.6%‐ 21.3%) | 47/62, 75.8% (63.2%, 88.4%) | <0.001 |
| 5 | Serum sodium 110 mEq/L. | Fluid restriction and discontinuation of diuretics. | NA | NA | NA |
| 6 | Polymorphonuclear count of 250/mm3 in ascites. | Empiric antibiotics, 6 hours of results. | 10/13, 76.9% (50.4%‐ 103.4%) | 16/20, 80.0% (60.8%, 99.2%) | 1.00 |
| 7 | Ascitic fluid, total protein 1.1 gm/dL, serum bilirubin 2.5 mg/dL. | Prophylactic antibiotics. | 4/12, 33.3% (2.0%‐ 64.6%) | 18/30, 60.0%, (41.4%, 78.6%) | 0.18 |
| 8 | Normal renal function. | Salt restriction and diuretics (spironolactone and loop diuretics). | 57/186, 30.6%, (24.0%‐ 37.3%) | 81/122, 66.4%, (57.9%, 74.9%) | <0.001 |
| Total ascites subscore, mean/SD | 30%/36% | 67%/34% | <0.001 | ||
| GI bleeding | |||||
| 9 | Admissions with GI bleeding: variceal and nonvariceal, hematemesis and melena. | Upper endoscopy 24 hours of presentation. | 60/78, 76.9% (67.4%, 86.4%) | 52/57, 91.2% (83.7%, 98.8%) | 0.04 |
| 10 | Esophageal varices (active, stigmata of recent bleeding, or no other causes to explain bleeding). | Endoscopic variceal ligation/sublerotherapy. | 40/46, 87.0% (76.8%‐97.1%) | 30/32, 93.8% (84.9%, 100.0%) | 0.46 |
| 11 | Admissions with established/suspected upper GI bleeding. | Antibiotics within 24 hours of admission. | 27/69, 39.1% (27.3%‐ 50.9%) | 26/58, 44.8% (31.6%, 58.0%) | 0.59 |
| 12 | Admissions with established/suspected variceal bleeding. | Somatostatin/octreotide given within 12 hours of presentation. | 53/69, 76.8%, (66.6%‐ 87.0%) | 49/58, 84.5% (73.8%, 95.2%) | 0.37 |
| 13 | Recurrent bleeding within 72 hours of initial endoscopic hemostasis. | Repeat endoscopy or transjugular intrahepatic portosystemic shunt. | 5/5 100% | 2/3, 66.7% (76.8%, 210.0%) | 0.38 |
| Total GI subscore, mean/SD | 61%/38% | 74%/28% | 0.04 | ||
| Liver transplantation | |||||
| 14 | Admissions with MELD 15 or MELD 15 and decompensated status (ie, all admissions in our study). | Documented evaluation for liver transplantation. | 112/379, 29.6% (24.9%‐ 34.2%) | 231/316, 73.6% (68.7%, 78.5%) | <0.001 |
| Hepatic encephalopathy | |||||
| 15 | Admissions with hepatic encephalopathy. | Search for reversible factors documented. | 81/151, 53.6% (45.6%‐ 61.7 %) | 97/113, 85.8% (79.4%, 92.3%) | <0.001 |
| 16 | Admissions with hepatic encephalopathy. | Oral disaccharides/ rifaximin. | 144/151, 95.3% (91.9 %‐ 98.7 %) | 107/113, 94.7% (90.7%. 98.69%) | 1.00 |
| Total encephalopathy subscore, mean/SD | 75%/28% | 90%/24% | <0.001 | ||
Ascites
The management of ascites yielded 3 main differences between the 2 cohorts. Following the implementation of the MC, 82.2 % (111/135) of ascites‐related admissions led to a diagnostic paracentesis as compared to 39.9% (77/193) in the UC group (P<0.001).
In the MC cohort, 75.8% (47/62) of admissions with known portal hypertensionrelated ascites who received a paracentesis had an ascites cell count checked. In contrast, only 14.4% (15/104) in the UC group receiving paracentesis had a fluid cell count (P<0.001). The management of ascites in patients with normal renal function was optimal, with sodium restriction and diuretics combination in 66.4% (81/122) of the MC cohort, whereas this parameter in the UC cohort was only 30.6% (57/186) (P<0.001). There were no significant differences between the groups for the other QIs.
Variceal Bleeding
The MC group had a higher frequency of endoscopy within 24 hours of admissions than the UC group (91.2% [52/57] vs 76.9% [60/78], respectively; P<0.04). The rest had endoscopy later in the admission. Among admissions with bleeding from varices, banding was done 93.8% of the time for patients in the MC group (30/32), which was not statistically different than 87.0% (40/46) for patients seen in the UC group. In the remaining admissions, endoscopy only revealed nonbleeding large esophageal varices, and the endoscopist opted not to proceed with therapy. There were no statistically significant differences in the rest of the management.
Hepatic Encephalopathy
For hepatic encephalopathy, an empirical treatment was given to 95.3 % (144/151) patients in the UC group and 94.7% (107/113) of the patients in the MC group. We found better documentation of a search for underlying etiologies leading to hepatic encephalopathy in the MC cohort 85.8% (97/113) versus the UC cohort, which was only 53.6% (81/151) (P<0.001).
Evaluation for Liver Transplantation
Better documentation of evaluation for liver transplantation was seen in the MC group 73.6% (231/316) in comparison to the UC group 29.4% (111/379) (P<0.001).
Opportunity Score and Clinical Outcomes
As detailed above, care provided during the MC achieved a higher compliance with the QI shown with the QI score or OMS (Table 3). These improvements were not associated with statistically significant differences in in‐hospital death, LOS, or 30‐day readmission. To explore this further we also examined the direct association between the OMS and outcomes in the MC group by dividing patients into 2 groups: patients whose OMS was 80% and those whose OMS was <80% (see Supporting Information, Appendix 4, in the online version of this article). Although there were trends toward decreased in‐hospital death (6.4% vs 8.6%, P=0.26), increased 30‐day readmission (33.8% vs 23.0%, P=0.27), and decreased LOS (6.2 days vs 6.6 days, P=0.77), none of these differences achieved statistical significance.
| Unadjusted | Adjusted* | |||||
|---|---|---|---|---|---|---|
| UC | MC | Difference | UC | MC | Difference | |
| ||||||
| Opportunity model score | 0.46 | 0.77 | +0.31 (0.24, 0.39) | 0.46 | 0.77 | +0.30(0.23, 0.37) |
| In‐hospital death | 7.1% | 8.5% | +1.4 (0.3, +5.6) | 7.5% | 7.9% | +0.4% (4.0%, +4.5%) |
| Readmission within 30 days | 39.6% | 32.6% | 7.0% (16.4%, +2.5%) | 40.0% | 31.8% | 8.2%(18.0%, +1.5%) |
| Length of stay | 6.1d | 6.2d | +0.1d (1.0 d, +1.2 d) | 6.1d | 6.2d | +0.1d (1.0 d, +1.2d) |
Mandatory Consultation Subgroups: Employed Versus Private Physicians
The type of employment of the gastroenterologist on consultation (employed by the hospital vs private practice) affected the management of the patients admitted with DC (see Supporting Information, Appendix 3, in the online version of this article). Patients seen by a hospital‐employed gastroenterologist were more likely to have a better documentation in regard to evaluation for liver transplantation and better management of ascites. Except for the prescription of antibiotics in patients presenting with GI bleeding, which were more often given by the employed physician (63% vs 23%, P=0.004), the management of hepatic encephalopathy and GI bleeding was similar between employed and private‐practice physicians.
DISCUSSION
In this evaluation of an MC intervention for patients with DC cared for at a large tertiary academic medical center, we found that the implementation of a routine consultation by a gastroenterologist led to greater adherence to recommended care processes when compared to UC. Overall, the management of ascites and the documentation of evaluation for liver transplantation were statistically superior in the intervention (MC) group. UC and MC were similar with respect to treatment of variceal bleeding and hepatic encephalopathy. Although we did not demonstrate changes in mortality, readmission, or LOS as a result of the MC intervention, our study was underpowered to detect clinically meaningful effects.
The gaps in care of patients with cirrhosis were reported before and after the publication of the formal QIs.[7, 8, 9, 10] These gaps remain relevant in the face of an increasing prevalence of DC along with a recent publication suggesting an underestimation of the burden of liver disease in the United States.[11] Ours is the first study to evaluate the impact on inpatients with DC of a liver service with a systematic, mandatory, specialist consultation. A previous study[12] had shown that a GI consultation would improve the care of patients with DC, but excluded patients with variceal bleeding, did not specifically measure the compliance with QIs, and more important, the GI consult was not mandatory.
Our study has several limitations that must be considered while weighing its findings. The patients were not randomly assigned but followed a pre‐established distribution depending on the call schedule. Some of the improvement we noted might be the result of secular trends; however, this remains unlikely given the lack of national initiatives or pay for performance programs. In the UC cohort, patients who were nonEnglish‐speaking were associated with a lower QI score, which could account for part of the improvement seen in the MC group that has a more prominent English‐speaking cohort. Readmissions could have occurred at other hospitals, and patients were not monitored in an outpatient setting. We did not observe a change in the secondary outcomes (30‐day readmission, LOS, in‐hospital death); however, our study was underpowered for that purpose. Given the complexity of the billing process we did not collect the costs of the MC, which is another limitation of our work. Future studies are needed to determine the cost‐effectiveness of the intervention.
This study shows that a dedicated team of physicians focused on compliance with QIs can achieve a rapid improvement, over a year, in providing higher‐quality care. This may be relevant at other institutions. The strength of our study is that our large tertiary academic medical center serves a large catchment area, with a mix of patients from both rural and urban communities. It is located in Massachusetts, where most of the population has had access to healthcare since 2006. Therefore, although this is a single‐center study, we expect our findings to be more generalizable and less subject to selection bias than other single‐center studies.
Importantly, the compliance with QIs was often far from being perfect in the MC group and was different across type of employment of providers, reflecting the challenges in changing practice among physicians.[13] In fact the QI scores of the private practice group did not change, and mirror the compliance observed at our institution in the previous study, before the implementation of the MC.[4] The difference in performance according to the type of employment of providers stems from 2 factors. First, a better documentation of the need of formal evaluation for liver transplantation by the employed gastroenterologists resulted in better compliance with this QI. Second, and more important, among the employed physicians, there was a readiness to assist the hospitalist with diagnostic/therapeutic paracentesis without relying on, for example, an interventional radiologist. This is reflected by the higher score in the management of ascites. Although our study was not designed to answer this directly, employed physicians may have been more engaged in the project and showed a greater willingness to change practice. In the future, linking reimbursement to quality of care will lead to improved accountability of consultants.
In this study we show that a direct involvement of a gastroenterologist improves the care of inpatients as measured by QIs. We theorize that a better coordination of the transition to outpatient care involving the specialist should lead to better outcomes, specifically a reduction in the 22% observed readmission rate within 30 days of patients with DC.[14, 15] As we move forward, a broader definition of outcomes should be addressed, taking into account patient‐related outcomes and preferences.[16] Future studies should define the relationship between the gastroenterologist and the hospitalist service, the role of physician assistants and nurse practitioners in implementing and monitoring compliance with QIs, and define how physicians and patients can be made accountable in the transition to the outpatient setting.
Disclosures
R.G.: Conception, data collection and interpretation, manuscript. J.F.: Data management, data analysis, manuscript. P.V.: Conception, data analysis, manuscript. P.L.: Conception, data interpretation, manuscript. T.L.: Dr. Lagu is supported by the National Heart, Lung, and Blood Institute of the National Institutes of Health under award number K01HL114745. Conception, data interpretation, manuscript. D.D.: Conception, data collection and interpretation, manuscript. A.B.: Data collection. J.S.: Data collection. Source of funding: internal. The authors report no conflicts of interest.
Decompensated cirrhosis (DC) is defined as cirrhosis with at least 1 of the following complications: ascites, hepatocellular carcinoma, bleeding from portal hypertension, or hepatic encephalopathy. Patients with DC have a median survival estimated at 2 years compared to the 12‐year median survival of compensated cirrhotics.[1] In an era where quality of hospital care is being measured, and where progress is being made in the management of several conditions including congestive heart failure and nosocomial infections, little attention has been paid to DC. The burden of chronic liver failure is clear in the United States, where DC leads to more than 150,000 annual admissions to the hospital and accounts for 40,000 deaths annually.[2]
This burden of disease spurred quality improvement efforts in 2010, when a team of experts identified a set of literature‐based parameters or quality indicators (QI) for patients with cirrhosis.[3] We have demonstrated that adherence to these indicators fell far short of desired targets.[4] A year before their publication, an overall compliance of <50% with these metrics was measured at a single medical center.
We sought to improve the quality of care for patients with DC through implementation of mandatory consultation (MC) with a gastroenterologist for all patients admitted with DC. We assessed whether MC was associated with better care and improved outcomes (hospitalization length of stay [LOS], 30‐day readmission, and inpatient mortality) when compared to usual care (UC).[4]
MATERIALS AND METHODS
Design, Setting, and Patients
We conducted a cohort study comparing adherence to QI and outcomes of patients admitted with DC after the institution of an MC to a historical cohort of patients managed with UC (ie, before MC, adherence to QI for this group has been reported elsewhere).[4] Both cohorts included all patients aged >18 years with DC admitted to Baystate Medical Center, a tertiary care medical center in western Massachusetts. The UC cohort was collected between January 1, 2009 and December 31, 2009, and the MC cohort was assembled between June 1, 2011 and June 30, 2012.
As previously reported,[4] patients were considered for inclusion in the historical cohort if their International Classification of DiseasesNinth Revision discharge code pertained to chronic liver disease (see Supporting Information, Appendix 1, in the online version of this article). This list was broad by design to identify all patients with decompensated cirrhosis. A gastroenterologist (R.G.) then manually extracted charts from electronic medical records (EMRs) using a set of predefined clinical criteria, the same in both cohorts, to identify the patients with DC: cirrhosis with concomitant ascites, hepatic encephalopathy, or gastrointestinal (GI) bleeding secondary to portal hypertension. Other types of decompensated states, such as hepatocellular carcinoma, were not included as their management was not detailed in the QI.[3]
We included patients with suspected or established cirrhosis who had ascites confirmed radiographically or by exam, noting shifting dullness or fluid wave. However, patients were excluded if they lacked sufficient peritoneal fluid for bedside or image‐guided paracentesis. Cirrhotic patients were defined as having hepatic encephalopathy if the patient had altered mental status not secondary to seizures, cerebrovascular accident, or alcohol withdrawal. Finally, gastrointestinal bleeding in cirrhotic patients was defined as any upper or lower bleeding prompting hospital admission, or identified in the medical record as clinically significant by the attending physician.
The same QIs were measured in both cohorts. From the QI set,[3] we selected the 16 QIs that would apply to the management of inpatients (see Supporting Information, Appendix 2, in the online version of this article). Indicators developed for outpatient settings were not included. A quality score was calculated for each admission, defined as the proportion of QIs met divided by the number of QIs for which the patient was eligible. For example, a patient with hepatic encephalopathy but without GI bleeding or ascites would have a score calculated as the number of QIs met for hepatic encephalopathy and documentation of transplant evaluation divided by 3 (2 QIs for hepatic encephalopathy and 1 QI for transplant evaluation). If the patient met both QIs for hepatic encephalopathy, but the consultant failed to address liver transplant eligibility, the score would be 2/3=0.666.
After the institution of the MC, all inpatients with DC were identified within 24 hours of admission by a gastroenterologist (R.G., D.D.), who manually reviewed on a daily basis all admissions from EMRs. An author (R.G.) would then contact the admitting team (hospitalist or resident) to make sure that a gastroenterology consult was called and would then obtain the QI by manual extraction from the EMRs.
Of the 16 gastroenterologists who work at the hospital, 12 of them belong to several private practice groups, whereas 4 are employed by the hospital. As part of the intervention, all gastroenterologists were made aware of the intervention 1 month before the starting date, were provided with a checklist of the QIs of interest, and were encouraged to work with the hospitalist attendings to achieve compliance with the QIs. We reminded the gastroenterologists of the ongoing study during routine division meetings and regularly sought feedback from the hospitalists
The MC consisted of a systematic consultation by a gastroenterologist: any identified patient with DC would generate a mandatory GI consultation and would be assigned to a specialist depending on the roster coverage for that day. A close monitoring of the process allowed us to confirm that all patients admitted with DC were seen by a gastroenterologist. Patients were followed until their discharge, death, or readmission to our institution during the study period.
Outcomes
The primary outcome was defined as the rate of adherence to the QIs and overall QI score expressed as a proportion as noted above. Secondary outcomes included in‐hospital mortality, LOS, and 30‐day readmission rate. These parameters were abstracted from the medical record.
Covariates
The hospital EMR (Cerner Corporation, North Kansas City, MO) was used to extract patient demographic parameters such as gender, race, language, and age at time of admission. Other admission‐level details were extracted from the EMR including Model for End‐Stage Liver Disease (MELD) scores, documented comorbidities (including substance abuse, psychiatric diagnosis, diabetes mellitus, renal failure, congestive heart failure, coronary artery disease, and cancer), underlying etiology for cirrhosis, and reason for admission.
The study was approved by Baystate Medical Center's institutional review board.
Statistical Analysis
Summary statistics for outcomes and covariates were calculated as means/standard deviations (SDs), medians/emnterquartile range, and proportions. Univariable statistics (unpaired t tests, 1‐way analysis of variance, Fisher exact test, Spearman correlation) were used to identify possible demographic (eg, age, race) and clinical (eg, admission complaint) predictors of quality score and with 30‐day outcomes. For each admission, a composite quality score, also known as an opportunity model score,[5, 6] was calculated as a fraction (ie, the number of QIs met divided by the total number of possible QIs indicated by the patient's presentation). This fraction was then multiplied by 100 so as to express the QI score as a percent. Possible scores, therefore, ranged from 0 to 100%.
Calculation of the 30‐day incidence proportion of readmission after the first admission was restricted to patients whose readmission occurred in this hospital, and occurring up to 30‐days before study closure (June 1, 2012). In‐hospital death was examined as a function of QI score during that admission. To derive an unbiased, risk‐adjusted estimate of the association between quality score and outcomes, multiple linear regression (opportunity model score [OMS], LOS) or multiple Poisson regression models (30‐day readmission, in‐hospital death) were built. These included a dummy variable for the study period, as well as any potential confounder that was associated at P0.10, with both study period and the outcome in univariable analyses. Robust standard errors were specified to account for multiple admissions within patients. Marginal means or proportions were then estimated with 95% confidence intervals derived using the delta method. All analyses were performed using Stata 12.1 for Windows (StataCorp, College Station, TX).
RESULTS
A total of 303 patients were observed in 695 hospitalizations;149 patients in 379 admissions were observed in the UC cohort, and 154 patients in 316 admissions were observed in the MC cohort. Baseline demographics of all study admissions appear in Table 1. Patients seen in the MC cohort were younger, more likely to speak English, and less likely to be male or have comorbid diabetes mellitus. Most admissions (n=217, 57.2%; 95% confidence interval: 52.3%‐62.3%) were not evaluated by a gastroenterologist in the UC cohort but all were in the MC cohort.
| UC, N=379, N (%) or Mean/SD | MC, N=316, N (%) or Mean/SD | P Value* | |
|---|---|---|---|
| |||
| Age, y | 55.3/12.1 | 53.3/13.6 | 0.05 |
| English speaking | 261 (68.9%) | 261 (82.6%) | <0.001 |
| Male | 251 (66.2%) | 163 (53.5%) | 0.001 |
| Race | <0.001 | ||
| White | 301 (79.4%) | 262 (82.9%) | |
| Black | 31 (8.2%) | 40 (12.7%) | |
| Asian | 16 (4.2%) | 0 (0.0%) | |
| Other | 31 (8.2%) | 14 (4.4%) | |
| Comorbidities | |||
| Substance | 75 (19.8%) | 58 (18.4%) | 0.70 |
| abuse | |||
| Psychiatric | 123 (32.5%) | 103 (32.9%) | 0.94 |
| Diabetes mellitus | 175 (45.4%) | 115 (36.5%) | 0.02 |
| Renal failure | 74 (19.3%) | 55 (17.4%) | 0.50 |
| CHF | 38 (10.0%) | 24 (7.6%) | 0.35 |
| CAD | 26 (6.9%) | 17 (5.4%) | 0.43 |
| Cancer | 48 (12.7%) | 40 (12.7%) | 1.00 |
| Admission MELD | 15.6/6.9 | 17.0/7.0 | 0.006 |
| Serum creatinine | 1.43/1.94 | 1.42/1.30 | 0.91 |
| Reason for admission | |||
| Hepatology/GI | 318 (83.9%) | 257 (81.3%) | 0.42 |
| Renal failure | 85 (22.4%) | 90 (28.5%) | 0.08 |
| Encephalopathy | 151 (39.3%) | 113 (34.9%) | 0.24 |
| GI bleed | 78 (20.5%) | 57 (18.0%) | 1.00 |
| Abdominal pain | 116 (30.7%) | 114 (36.2%) | 0.15 |
| Ascites | 246 (64.9%) | 185 (58.5%) | 0.10 |
Admission Characteristics
The baseline clinical measures of all study admissions appear in Table 1. The UC and MC cohorts had similar characteristics, with the majority of patients with DC admitted for a gastrointestinal/hepatology‐related reason specifically for the management of ascites and hepatic encephalopathy. The patients in the MC cohort had a statistically higher MELD score on admission, which was not clinically relevant.
Quality Measures
Adherence to individual quality indices is shown in Table 2.
| Condition (Denominator) | Quality Indicator (Numerator) | UC (n=379), Met/Indicated | MC (n=316), Met/Indicated | P Value | |
|---|---|---|---|---|---|
| |||||
| Admissions with ascites | |||||
| 1 | Admissions to the hospital because of ascites or encephalopathy. | Diagnostic paracentesis during admission. | 77/193, 39.9%, (32.9%, 46.9%) | 111/135, 82.2% (75.7%, 88.8%) | <0.001 |
| 2 | No fibrinolysis or disseminated intravascular coagulation before paracentesis INR <2.5, >100,000 platelets. | No fresh frozen plasma or platelet replacement given. | 36/37, 97.3% (91.8%, 103.0%) | 41/42, 97.6% (92.8%, 102.4%) | 1.00 |
| 3 | All admissions with diagnostic paracentesis (not limited to admissions for ascites or hepatic encephalopathy). | Cell count differential, total protein, albumin, and culture/sensitivity all performed. | 31/49, 63.3% (49.3%‐77.3%) | 46/72 63.9% (52.7%, 75.0%) | 1.00 |
| 4 | Admissions with known portal hypertension‐related ascites receiving a paracentesis. | Ascitic fluid cell count and differential performed. | 15/104, 14.4% (7.6%‐ 21.3%) | 47/62, 75.8% (63.2%, 88.4%) | <0.001 |
| 5 | Serum sodium 110 mEq/L. | Fluid restriction and discontinuation of diuretics. | NA | NA | NA |
| 6 | Polymorphonuclear count of 250/mm3 in ascites. | Empiric antibiotics, 6 hours of results. | 10/13, 76.9% (50.4%‐ 103.4%) | 16/20, 80.0% (60.8%, 99.2%) | 1.00 |
| 7 | Ascitic fluid, total protein 1.1 gm/dL, serum bilirubin 2.5 mg/dL. | Prophylactic antibiotics. | 4/12, 33.3% (2.0%‐ 64.6%) | 18/30, 60.0%, (41.4%, 78.6%) | 0.18 |
| 8 | Normal renal function. | Salt restriction and diuretics (spironolactone and loop diuretics). | 57/186, 30.6%, (24.0%‐ 37.3%) | 81/122, 66.4%, (57.9%, 74.9%) | <0.001 |
| Total ascites subscore, mean/SD | 30%/36% | 67%/34% | <0.001 | ||
| GI bleeding | |||||
| 9 | Admissions with GI bleeding: variceal and nonvariceal, hematemesis and melena. | Upper endoscopy 24 hours of presentation. | 60/78, 76.9% (67.4%, 86.4%) | 52/57, 91.2% (83.7%, 98.8%) | 0.04 |
| 10 | Esophageal varices (active, stigmata of recent bleeding, or no other causes to explain bleeding). | Endoscopic variceal ligation/sublerotherapy. | 40/46, 87.0% (76.8%‐97.1%) | 30/32, 93.8% (84.9%, 100.0%) | 0.46 |
| 11 | Admissions with established/suspected upper GI bleeding. | Antibiotics within 24 hours of admission. | 27/69, 39.1% (27.3%‐ 50.9%) | 26/58, 44.8% (31.6%, 58.0%) | 0.59 |
| 12 | Admissions with established/suspected variceal bleeding. | Somatostatin/octreotide given within 12 hours of presentation. | 53/69, 76.8%, (66.6%‐ 87.0%) | 49/58, 84.5% (73.8%, 95.2%) | 0.37 |
| 13 | Recurrent bleeding within 72 hours of initial endoscopic hemostasis. | Repeat endoscopy or transjugular intrahepatic portosystemic shunt. | 5/5 100% | 2/3, 66.7% (76.8%, 210.0%) | 0.38 |
| Total GI subscore, mean/SD | 61%/38% | 74%/28% | 0.04 | ||
| Liver transplantation | |||||
| 14 | Admissions with MELD 15 or MELD 15 and decompensated status (ie, all admissions in our study). | Documented evaluation for liver transplantation. | 112/379, 29.6% (24.9%‐ 34.2%) | 231/316, 73.6% (68.7%, 78.5%) | <0.001 |
| Hepatic encephalopathy | |||||
| 15 | Admissions with hepatic encephalopathy. | Search for reversible factors documented. | 81/151, 53.6% (45.6%‐ 61.7 %) | 97/113, 85.8% (79.4%, 92.3%) | <0.001 |
| 16 | Admissions with hepatic encephalopathy. | Oral disaccharides/ rifaximin. | 144/151, 95.3% (91.9 %‐ 98.7 %) | 107/113, 94.7% (90.7%. 98.69%) | 1.00 |
| Total encephalopathy subscore, mean/SD | 75%/28% | 90%/24% | <0.001 | ||
Ascites
The management of ascites yielded 3 main differences between the 2 cohorts. Following the implementation of the MC, 82.2 % (111/135) of ascites‐related admissions led to a diagnostic paracentesis as compared to 39.9% (77/193) in the UC group (P<0.001).
In the MC cohort, 75.8% (47/62) of admissions with known portal hypertensionrelated ascites who received a paracentesis had an ascites cell count checked. In contrast, only 14.4% (15/104) in the UC group receiving paracentesis had a fluid cell count (P<0.001). The management of ascites in patients with normal renal function was optimal, with sodium restriction and diuretics combination in 66.4% (81/122) of the MC cohort, whereas this parameter in the UC cohort was only 30.6% (57/186) (P<0.001). There were no significant differences between the groups for the other QIs.
Variceal Bleeding
The MC group had a higher frequency of endoscopy within 24 hours of admissions than the UC group (91.2% [52/57] vs 76.9% [60/78], respectively; P<0.04). The rest had endoscopy later in the admission. Among admissions with bleeding from varices, banding was done 93.8% of the time for patients in the MC group (30/32), which was not statistically different than 87.0% (40/46) for patients seen in the UC group. In the remaining admissions, endoscopy only revealed nonbleeding large esophageal varices, and the endoscopist opted not to proceed with therapy. There were no statistically significant differences in the rest of the management.
Hepatic Encephalopathy
For hepatic encephalopathy, an empirical treatment was given to 95.3 % (144/151) patients in the UC group and 94.7% (107/113) of the patients in the MC group. We found better documentation of a search for underlying etiologies leading to hepatic encephalopathy in the MC cohort 85.8% (97/113) versus the UC cohort, which was only 53.6% (81/151) (P<0.001).
Evaluation for Liver Transplantation
Better documentation of evaluation for liver transplantation was seen in the MC group 73.6% (231/316) in comparison to the UC group 29.4% (111/379) (P<0.001).
Opportunity Score and Clinical Outcomes
As detailed above, care provided during the MC achieved a higher compliance with the QI shown with the QI score or OMS (Table 3). These improvements were not associated with statistically significant differences in in‐hospital death, LOS, or 30‐day readmission. To explore this further we also examined the direct association between the OMS and outcomes in the MC group by dividing patients into 2 groups: patients whose OMS was 80% and those whose OMS was <80% (see Supporting Information, Appendix 4, in the online version of this article). Although there were trends toward decreased in‐hospital death (6.4% vs 8.6%, P=0.26), increased 30‐day readmission (33.8% vs 23.0%, P=0.27), and decreased LOS (6.2 days vs 6.6 days, P=0.77), none of these differences achieved statistical significance.
| Unadjusted | Adjusted* | |||||
|---|---|---|---|---|---|---|
| UC | MC | Difference | UC | MC | Difference | |
| ||||||
| Opportunity model score | 0.46 | 0.77 | +0.31 (0.24, 0.39) | 0.46 | 0.77 | +0.30(0.23, 0.37) |
| In‐hospital death | 7.1% | 8.5% | +1.4 (0.3, +5.6) | 7.5% | 7.9% | +0.4% (4.0%, +4.5%) |
| Readmission within 30 days | 39.6% | 32.6% | 7.0% (16.4%, +2.5%) | 40.0% | 31.8% | 8.2%(18.0%, +1.5%) |
| Length of stay | 6.1d | 6.2d | +0.1d (1.0 d, +1.2 d) | 6.1d | 6.2d | +0.1d (1.0 d, +1.2d) |
Mandatory Consultation Subgroups: Employed Versus Private Physicians
The type of employment of the gastroenterologist on consultation (employed by the hospital vs private practice) affected the management of the patients admitted with DC (see Supporting Information, Appendix 3, in the online version of this article). Patients seen by a hospital‐employed gastroenterologist were more likely to have a better documentation in regard to evaluation for liver transplantation and better management of ascites. Except for the prescription of antibiotics in patients presenting with GI bleeding, which were more often given by the employed physician (63% vs 23%, P=0.004), the management of hepatic encephalopathy and GI bleeding was similar between employed and private‐practice physicians.
DISCUSSION
In this evaluation of an MC intervention for patients with DC cared for at a large tertiary academic medical center, we found that the implementation of a routine consultation by a gastroenterologist led to greater adherence to recommended care processes when compared to UC. Overall, the management of ascites and the documentation of evaluation for liver transplantation were statistically superior in the intervention (MC) group. UC and MC were similar with respect to treatment of variceal bleeding and hepatic encephalopathy. Although we did not demonstrate changes in mortality, readmission, or LOS as a result of the MC intervention, our study was underpowered to detect clinically meaningful effects.
The gaps in care of patients with cirrhosis were reported before and after the publication of the formal QIs.[7, 8, 9, 10] These gaps remain relevant in the face of an increasing prevalence of DC along with a recent publication suggesting an underestimation of the burden of liver disease in the United States.[11] Ours is the first study to evaluate the impact on inpatients with DC of a liver service with a systematic, mandatory, specialist consultation. A previous study[12] had shown that a GI consultation would improve the care of patients with DC, but excluded patients with variceal bleeding, did not specifically measure the compliance with QIs, and more important, the GI consult was not mandatory.
Our study has several limitations that must be considered while weighing its findings. The patients were not randomly assigned but followed a pre‐established distribution depending on the call schedule. Some of the improvement we noted might be the result of secular trends; however, this remains unlikely given the lack of national initiatives or pay for performance programs. In the UC cohort, patients who were nonEnglish‐speaking were associated with a lower QI score, which could account for part of the improvement seen in the MC group that has a more prominent English‐speaking cohort. Readmissions could have occurred at other hospitals, and patients were not monitored in an outpatient setting. We did not observe a change in the secondary outcomes (30‐day readmission, LOS, in‐hospital death); however, our study was underpowered for that purpose. Given the complexity of the billing process we did not collect the costs of the MC, which is another limitation of our work. Future studies are needed to determine the cost‐effectiveness of the intervention.
This study shows that a dedicated team of physicians focused on compliance with QIs can achieve a rapid improvement, over a year, in providing higher‐quality care. This may be relevant at other institutions. The strength of our study is that our large tertiary academic medical center serves a large catchment area, with a mix of patients from both rural and urban communities. It is located in Massachusetts, where most of the population has had access to healthcare since 2006. Therefore, although this is a single‐center study, we expect our findings to be more generalizable and less subject to selection bias than other single‐center studies.
Importantly, the compliance with QIs was often far from being perfect in the MC group and was different across type of employment of providers, reflecting the challenges in changing practice among physicians.[13] In fact the QI scores of the private practice group did not change, and mirror the compliance observed at our institution in the previous study, before the implementation of the MC.[4] The difference in performance according to the type of employment of providers stems from 2 factors. First, a better documentation of the need of formal evaluation for liver transplantation by the employed gastroenterologists resulted in better compliance with this QI. Second, and more important, among the employed physicians, there was a readiness to assist the hospitalist with diagnostic/therapeutic paracentesis without relying on, for example, an interventional radiologist. This is reflected by the higher score in the management of ascites. Although our study was not designed to answer this directly, employed physicians may have been more engaged in the project and showed a greater willingness to change practice. In the future, linking reimbursement to quality of care will lead to improved accountability of consultants.
In this study we show that a direct involvement of a gastroenterologist improves the care of inpatients as measured by QIs. We theorize that a better coordination of the transition to outpatient care involving the specialist should lead to better outcomes, specifically a reduction in the 22% observed readmission rate within 30 days of patients with DC.[14, 15] As we move forward, a broader definition of outcomes should be addressed, taking into account patient‐related outcomes and preferences.[16] Future studies should define the relationship between the gastroenterologist and the hospitalist service, the role of physician assistants and nurse practitioners in implementing and monitoring compliance with QIs, and define how physicians and patients can be made accountable in the transition to the outpatient setting.
Disclosures
R.G.: Conception, data collection and interpretation, manuscript. J.F.: Data management, data analysis, manuscript. P.V.: Conception, data analysis, manuscript. P.L.: Conception, data interpretation, manuscript. T.L.: Dr. Lagu is supported by the National Heart, Lung, and Blood Institute of the National Institutes of Health under award number K01HL114745. Conception, data interpretation, manuscript. D.D.: Conception, data collection and interpretation, manuscript. A.B.: Data collection. J.S.: Data collection. Source of funding: internal. The authors report no conflicts of interest.
- , , . Natural history and prognostic indicators of survival in cirrhosis: a systematic review of 118 studies. J Hepatol. 2006;44:217–231.
- , , , . Efficacy of a chronic disease management model for patients with chronic liver failure. Clin Gastroenterol Hepatol. 2013;11:850–858.
- , , , et al. An Explicit Quality Indicator Set for Measurement of Quality of Care in Patients with Cirrhosis. Clin Gastroenterol Hepatol. 2010;8:709–717.
- , , , , , Desilets D. Measurement of the quality of care of patients admitted with decompensated cirrhosis. Liver Int. 2014:34:204–210.
- , . All‐or‐none measurement raises the bar on performance. JAMA. 2006;295:1168–1170.
- Joint Commission on Accreditation of Healthcare Organizations. Quality report user guide. Available at: http://www.jointcommission.org. Accessed May 30, 2011.
- , , , et al. Management of patients with cirrhosis in Southern California: results of a practitioner survey. J Clin Gastroenterol. 2006;40:156–161.
- , , , et al. Spanish Collaborative Study Group on Therapeutic Management In Liver Disease. Multicenter hospital study on prescribing patterns for prophylaxis and treatment of complications of cirrhosis. Eur J Clin Pharmacol. 2002;58:435–440.
- , , , et al. The quality of care provided to patients with cirrhosis and ascites in the Department of Veterans Affairs. Gastroenterology. 2012 143(1):70–77.
- , , , et al. Improved patient survival after acute variceal bleeding: a multicenter, cohort study. Am J Gastroenterol. 2003;98:653–659.
- , , , , . Underestimation of liver‐related mortality in the United States. Gastroenterology. 2013;145:375–382.
- , , , et al. Impact of gastroenterology consultation on the outcomes of patients admitted to the hospital with decompensated cirrhosis. Hepatology. 2001;34:1089–1095.
- , , , et al. Why don't physicians follow clinical practice guidelines? A framework for improvement. JAMA. 1999;282:1458–1465.
- , , , et al. Incidence and predictors of 30‐day readmission among patients hospitalized with advanced liver disease. Clin Gastroenterol Hepatol. 2011;9:254–259.
- , , , et al. Hospital Readmissions among patients with decompensated cirrhosis. Am J Gastroenterol. 2012;107:247–252.
- . Patient‐reported outcomes of cirrhosis. Clin Gastroenterol Hepatol. 2013;11:1043–1045.
- , , . Natural history and prognostic indicators of survival in cirrhosis: a systematic review of 118 studies. J Hepatol. 2006;44:217–231.
- , , , . Efficacy of a chronic disease management model for patients with chronic liver failure. Clin Gastroenterol Hepatol. 2013;11:850–858.
- , , , et al. An Explicit Quality Indicator Set for Measurement of Quality of Care in Patients with Cirrhosis. Clin Gastroenterol Hepatol. 2010;8:709–717.
- , , , , , Desilets D. Measurement of the quality of care of patients admitted with decompensated cirrhosis. Liver Int. 2014:34:204–210.
- , . All‐or‐none measurement raises the bar on performance. JAMA. 2006;295:1168–1170.
- Joint Commission on Accreditation of Healthcare Organizations. Quality report user guide. Available at: http://www.jointcommission.org. Accessed May 30, 2011.
- , , , et al. Management of patients with cirrhosis in Southern California: results of a practitioner survey. J Clin Gastroenterol. 2006;40:156–161.
- , , , et al. Spanish Collaborative Study Group on Therapeutic Management In Liver Disease. Multicenter hospital study on prescribing patterns for prophylaxis and treatment of complications of cirrhosis. Eur J Clin Pharmacol. 2002;58:435–440.
- , , , et al. The quality of care provided to patients with cirrhosis and ascites in the Department of Veterans Affairs. Gastroenterology. 2012 143(1):70–77.
- , , , et al. Improved patient survival after acute variceal bleeding: a multicenter, cohort study. Am J Gastroenterol. 2003;98:653–659.
- , , , , . Underestimation of liver‐related mortality in the United States. Gastroenterology. 2013;145:375–382.
- , , , et al. Impact of gastroenterology consultation on the outcomes of patients admitted to the hospital with decompensated cirrhosis. Hepatology. 2001;34:1089–1095.
- , , , et al. Why don't physicians follow clinical practice guidelines? A framework for improvement. JAMA. 1999;282:1458–1465.
- , , , et al. Incidence and predictors of 30‐day readmission among patients hospitalized with advanced liver disease. Clin Gastroenterol Hepatol. 2011;9:254–259.
- , , , et al. Hospital Readmissions among patients with decompensated cirrhosis. Am J Gastroenterol. 2012;107:247–252.
- . Patient‐reported outcomes of cirrhosis. Clin Gastroenterol Hepatol. 2013;11:1043–1045.
© 2014 Society of Hospital Medicine
‘Acting out’ or pathological?

Test predicts response to GVHD treatment
A newly developed algorithm could enable risk-adapted therapy for graft-vs-host disease (GVHD), researchers have reported in Lancet Haematology.
The problem with treating GVHD, the team said, is that the severity of symptoms at disease onset does not accurately define risk.
Patients with low-risk GVHD are often overtreated and experience significant side effects, while patients with high-risk GVHD can be undertreated and see their GVHD progress.
“Our goal is to provide the right treatment for each patient,” said study author James L. M. Ferrara, MD, DSc, of the Icahn School of Medicine at Mount Sinai.
“We hope to identify those patients at higher risk and design an aggressive intervention while tailoring a less-aggressive approach for those with low-risk.”
With that goal in mind, Dr Ferrara and his colleagues developed and tested a scoring system for GVHD. They collected plasma from 492 patients newly diagnosed with varying grades of GVHD and randomly assigned them to training (n=328) and test (n=164) sets.
The team used the concentrations of 3 validated biomarkers—TNFR1, ST2, and Reg3α—to create an algorithm that calculated the probability of non-relapse mortality (NRM) 6 months after GVHD onset for patients in the training set.
The researchers ranked the probabilities and identified thresholds that created 3 NRM scores. They then tested the algorithm in the test set of patients and a validation cohort of 300 additional patients who were enrolled on trials of GVHD treatment.
Results showed the algorithm works. The cumulative incidence of 6-month NRM significantly increased as the Ann Arbor GVHD score increased, and the response to primary GVHD treatment within 28 days decreased as the GVHD score increased.
In the validation set, the incidence of NRM was 8% for score 1, 27% for score 2, and 46% for score 3 (P<0.0001). Treatment response measured 86% for score 1, 67% for score 2, and 46% for score 3 (P<0.0001).
“This new scoring system will help identify patient who may not respond to standard treatments and may require an experimental and more aggressive approach,” Dr Ferrara said. “And it will also help guide treatment for patients with lower-risk GVHD who may be overtreated. This will allow us to personalize treatment at the onset of the disease. Future algorithms will prove increasingly useful to develop precision medicine for all [stem cell transplant] patients.”
To capitalize on this discovery, Dr Ferrara created the Mount Sinai Acute GVHD International Consortium (MAGIC), which consists of a group of 10 stem cell transplant centers in the US and Europe that will collaborate to use this new scoring system to test new treatments for acute GVHD.
Dr Ferrara and his colleagues have also written a protocol to treat high-risk GVHD that has been approved by the US Food and Drug Administration.
A newly developed algorithm could enable risk-adapted therapy for graft-vs-host disease (GVHD), researchers have reported in Lancet Haematology.
The problem with treating GVHD, the team said, is that the severity of symptoms at disease onset does not accurately define risk.
Patients with low-risk GVHD are often overtreated and experience significant side effects, while patients with high-risk GVHD can be undertreated and see their GVHD progress.
“Our goal is to provide the right treatment for each patient,” said study author James L. M. Ferrara, MD, DSc, of the Icahn School of Medicine at Mount Sinai.
“We hope to identify those patients at higher risk and design an aggressive intervention while tailoring a less-aggressive approach for those with low-risk.”
With that goal in mind, Dr Ferrara and his colleagues developed and tested a scoring system for GVHD. They collected plasma from 492 patients newly diagnosed with varying grades of GVHD and randomly assigned them to training (n=328) and test (n=164) sets.
The team used the concentrations of 3 validated biomarkers—TNFR1, ST2, and Reg3α—to create an algorithm that calculated the probability of non-relapse mortality (NRM) 6 months after GVHD onset for patients in the training set.
The researchers ranked the probabilities and identified thresholds that created 3 NRM scores. They then tested the algorithm in the test set of patients and a validation cohort of 300 additional patients who were enrolled on trials of GVHD treatment.
Results showed the algorithm works. The cumulative incidence of 6-month NRM significantly increased as the Ann Arbor GVHD score increased, and the response to primary GVHD treatment within 28 days decreased as the GVHD score increased.
In the validation set, the incidence of NRM was 8% for score 1, 27% for score 2, and 46% for score 3 (P<0.0001). Treatment response measured 86% for score 1, 67% for score 2, and 46% for score 3 (P<0.0001).
“This new scoring system will help identify patient who may not respond to standard treatments and may require an experimental and more aggressive approach,” Dr Ferrara said. “And it will also help guide treatment for patients with lower-risk GVHD who may be overtreated. This will allow us to personalize treatment at the onset of the disease. Future algorithms will prove increasingly useful to develop precision medicine for all [stem cell transplant] patients.”
To capitalize on this discovery, Dr Ferrara created the Mount Sinai Acute GVHD International Consortium (MAGIC), which consists of a group of 10 stem cell transplant centers in the US and Europe that will collaborate to use this new scoring system to test new treatments for acute GVHD.
Dr Ferrara and his colleagues have also written a protocol to treat high-risk GVHD that has been approved by the US Food and Drug Administration.
A newly developed algorithm could enable risk-adapted therapy for graft-vs-host disease (GVHD), researchers have reported in Lancet Haematology.
The problem with treating GVHD, the team said, is that the severity of symptoms at disease onset does not accurately define risk.
Patients with low-risk GVHD are often overtreated and experience significant side effects, while patients with high-risk GVHD can be undertreated and see their GVHD progress.
“Our goal is to provide the right treatment for each patient,” said study author James L. M. Ferrara, MD, DSc, of the Icahn School of Medicine at Mount Sinai.
“We hope to identify those patients at higher risk and design an aggressive intervention while tailoring a less-aggressive approach for those with low-risk.”
With that goal in mind, Dr Ferrara and his colleagues developed and tested a scoring system for GVHD. They collected plasma from 492 patients newly diagnosed with varying grades of GVHD and randomly assigned them to training (n=328) and test (n=164) sets.
The team used the concentrations of 3 validated biomarkers—TNFR1, ST2, and Reg3α—to create an algorithm that calculated the probability of non-relapse mortality (NRM) 6 months after GVHD onset for patients in the training set.
The researchers ranked the probabilities and identified thresholds that created 3 NRM scores. They then tested the algorithm in the test set of patients and a validation cohort of 300 additional patients who were enrolled on trials of GVHD treatment.
Results showed the algorithm works. The cumulative incidence of 6-month NRM significantly increased as the Ann Arbor GVHD score increased, and the response to primary GVHD treatment within 28 days decreased as the GVHD score increased.
In the validation set, the incidence of NRM was 8% for score 1, 27% for score 2, and 46% for score 3 (P<0.0001). Treatment response measured 86% for score 1, 67% for score 2, and 46% for score 3 (P<0.0001).
“This new scoring system will help identify patient who may not respond to standard treatments and may require an experimental and more aggressive approach,” Dr Ferrara said. “And it will also help guide treatment for patients with lower-risk GVHD who may be overtreated. This will allow us to personalize treatment at the onset of the disease. Future algorithms will prove increasingly useful to develop precision medicine for all [stem cell transplant] patients.”
To capitalize on this discovery, Dr Ferrara created the Mount Sinai Acute GVHD International Consortium (MAGIC), which consists of a group of 10 stem cell transplant centers in the US and Europe that will collaborate to use this new scoring system to test new treatments for acute GVHD.
Dr Ferrara and his colleagues have also written a protocol to treat high-risk GVHD that has been approved by the US Food and Drug Administration.

FDA extends approved use of neutropenia drug

The US Food and Drug Administration (FDA) has approved tbo-filgrastim (Granix) injection for administration by patients and caregivers, allowing physicians to prescribe the drug for in-office or at-home use.
Tbo-filgrastim is a leukocyte growth factor used to reduce the duration of severe neutropenia in patients with non-myeloid malignancies who are receiving myelosuppressive anticancer drugs associated with a clinically significant incidence of febrile neutropenia.
The drug has been commercially available in the US since November 2013, but, at present, it can only be administered by a healthcare professional.
Teva Pharmaceutical Industries, Ltd., the company developing tbo-filgrastim, plans to launch the new syringe for administration by patients and caregivers in early 2015.
Clinical trials
Researchers evaluated tbo-filgrastim in 3 phase 3 trials of patients receiving myelosuppressive chemotherapy for breast cancer, lung cancer, and non-Hodgkin lymphoma (NHL).
In the NHL study, investigators compared tbo-filgrastim to filgrastim for the prevention of chemotherapy-induced neutropenia in 92 patients.
For cycle 1, patients were randomized to daily injections (subcutaneous 5 µg/kg/day) of tbo-filgrastim (n=63) or filgrastim (n=29) for at least 5 days and a maximum of 14 days. In subsequent cycles, all patients received tbo-filgrastim.
In cycle 1, the mean duration of severe neutropenia was 0.5 days in the tbo-filgrastim arm and 0.9 days in the filgrastim arm (P=0.1055). The incidence of febrile neutropenia was 11.1% and 20.7%, respectively (P=0.1232).
In the lung cancer trial, researchers compared tbo-filgrastim to filgrastim in 240 patients receiving platinum-based chemotherapy. In cycle 1, patients were randomized to daily injections (subcutaneous 5 µg/kg/d) of tbo-filgrastim (n=160) or filgrastim (n=80) for at least 5 days and a maximum of 14 days. In subsequent cycles, all patients received tbo-filgrastim.
In cycle 1, the mean duration of severe neutropenia was 0.5 days in the tbo-filgrastim arm and 0.3 days in the filgrastim arm. There was no significant difference in the incidence of febrile neutropenia in cycle 1 between the two arms (P=0.2347).
In the breast cancer trial, investigators compared tbo-filgrastim to filgrastim or placebo in 348 patients receiving chemotherapy. Patients were randomized to daily injections (subcutaneous 5 µg/kg/day) for at least 5 days and a maximum of 14 days in each cycle of tbo-filgrastim (n=140), filgrastim (n=136), or placebo (n=72).
The mean duration of severe neutropenia in cycle 1 was 1.1 days in the tbo-filgrastim arm, 1.1 days in the filgrastim arm, and 3.9 days in the placebo arm.
In all the trials, bone pain was the most frequent treatment-emergent adverse event, occurring in at least 1% of patients treated with tbo-filgrastim at the recommended dose. The overall incidence of bone pain in cycle 1 was 3.4% for tbo-filgrastim, 1.4% for placebo, and 7.5% for filgrastim.
According to the drug’s prescribing information, tbo-filgrastim may pose a risk of splenic rupture, acute respiratory distress syndrome, serious allergic reactions, severe and sometimes fatal sickle cell crises, and capillary leak syndrome. The possibility that the drug acts as a growth factor for tumors cannot be excluded.
The US Food and Drug Administration (FDA) has approved tbo-filgrastim (Granix) injection for administration by patients and caregivers, allowing physicians to prescribe the drug for in-office or at-home use.
Tbo-filgrastim is a leukocyte growth factor used to reduce the duration of severe neutropenia in patients with non-myeloid malignancies who are receiving myelosuppressive anticancer drugs associated with a clinically significant incidence of febrile neutropenia.
The drug has been commercially available in the US since November 2013, but, at present, it can only be administered by a healthcare professional.
Teva Pharmaceutical Industries, Ltd., the company developing tbo-filgrastim, plans to launch the new syringe for administration by patients and caregivers in early 2015.
Clinical trials
Researchers evaluated tbo-filgrastim in 3 phase 3 trials of patients receiving myelosuppressive chemotherapy for breast cancer, lung cancer, and non-Hodgkin lymphoma (NHL).
In the NHL study, investigators compared tbo-filgrastim to filgrastim for the prevention of chemotherapy-induced neutropenia in 92 patients.
For cycle 1, patients were randomized to daily injections (subcutaneous 5 µg/kg/day) of tbo-filgrastim (n=63) or filgrastim (n=29) for at least 5 days and a maximum of 14 days. In subsequent cycles, all patients received tbo-filgrastim.
In cycle 1, the mean duration of severe neutropenia was 0.5 days in the tbo-filgrastim arm and 0.9 days in the filgrastim arm (P=0.1055). The incidence of febrile neutropenia was 11.1% and 20.7%, respectively (P=0.1232).
In the lung cancer trial, researchers compared tbo-filgrastim to filgrastim in 240 patients receiving platinum-based chemotherapy. In cycle 1, patients were randomized to daily injections (subcutaneous 5 µg/kg/d) of tbo-filgrastim (n=160) or filgrastim (n=80) for at least 5 days and a maximum of 14 days. In subsequent cycles, all patients received tbo-filgrastim.
In cycle 1, the mean duration of severe neutropenia was 0.5 days in the tbo-filgrastim arm and 0.3 days in the filgrastim arm. There was no significant difference in the incidence of febrile neutropenia in cycle 1 between the two arms (P=0.2347).
In the breast cancer trial, investigators compared tbo-filgrastim to filgrastim or placebo in 348 patients receiving chemotherapy. Patients were randomized to daily injections (subcutaneous 5 µg/kg/day) for at least 5 days and a maximum of 14 days in each cycle of tbo-filgrastim (n=140), filgrastim (n=136), or placebo (n=72).
The mean duration of severe neutropenia in cycle 1 was 1.1 days in the tbo-filgrastim arm, 1.1 days in the filgrastim arm, and 3.9 days in the placebo arm.
In all the trials, bone pain was the most frequent treatment-emergent adverse event, occurring in at least 1% of patients treated with tbo-filgrastim at the recommended dose. The overall incidence of bone pain in cycle 1 was 3.4% for tbo-filgrastim, 1.4% for placebo, and 7.5% for filgrastim.
According to the drug’s prescribing information, tbo-filgrastim may pose a risk of splenic rupture, acute respiratory distress syndrome, serious allergic reactions, severe and sometimes fatal sickle cell crises, and capillary leak syndrome. The possibility that the drug acts as a growth factor for tumors cannot be excluded.
The US Food and Drug Administration (FDA) has approved tbo-filgrastim (Granix) injection for administration by patients and caregivers, allowing physicians to prescribe the drug for in-office or at-home use.
Tbo-filgrastim is a leukocyte growth factor used to reduce the duration of severe neutropenia in patients with non-myeloid malignancies who are receiving myelosuppressive anticancer drugs associated with a clinically significant incidence of febrile neutropenia.
The drug has been commercially available in the US since November 2013, but, at present, it can only be administered by a healthcare professional.
Teva Pharmaceutical Industries, Ltd., the company developing tbo-filgrastim, plans to launch the new syringe for administration by patients and caregivers in early 2015.
Clinical trials
Researchers evaluated tbo-filgrastim in 3 phase 3 trials of patients receiving myelosuppressive chemotherapy for breast cancer, lung cancer, and non-Hodgkin lymphoma (NHL).
In the NHL study, investigators compared tbo-filgrastim to filgrastim for the prevention of chemotherapy-induced neutropenia in 92 patients.
For cycle 1, patients were randomized to daily injections (subcutaneous 5 µg/kg/day) of tbo-filgrastim (n=63) or filgrastim (n=29) for at least 5 days and a maximum of 14 days. In subsequent cycles, all patients received tbo-filgrastim.
In cycle 1, the mean duration of severe neutropenia was 0.5 days in the tbo-filgrastim arm and 0.9 days in the filgrastim arm (P=0.1055). The incidence of febrile neutropenia was 11.1% and 20.7%, respectively (P=0.1232).
In the lung cancer trial, researchers compared tbo-filgrastim to filgrastim in 240 patients receiving platinum-based chemotherapy. In cycle 1, patients were randomized to daily injections (subcutaneous 5 µg/kg/d) of tbo-filgrastim (n=160) or filgrastim (n=80) for at least 5 days and a maximum of 14 days. In subsequent cycles, all patients received tbo-filgrastim.
In cycle 1, the mean duration of severe neutropenia was 0.5 days in the tbo-filgrastim arm and 0.3 days in the filgrastim arm. There was no significant difference in the incidence of febrile neutropenia in cycle 1 between the two arms (P=0.2347).
In the breast cancer trial, investigators compared tbo-filgrastim to filgrastim or placebo in 348 patients receiving chemotherapy. Patients were randomized to daily injections (subcutaneous 5 µg/kg/day) for at least 5 days and a maximum of 14 days in each cycle of tbo-filgrastim (n=140), filgrastim (n=136), or placebo (n=72).
The mean duration of severe neutropenia in cycle 1 was 1.1 days in the tbo-filgrastim arm, 1.1 days in the filgrastim arm, and 3.9 days in the placebo arm.
In all the trials, bone pain was the most frequent treatment-emergent adverse event, occurring in at least 1% of patients treated with tbo-filgrastim at the recommended dose. The overall incidence of bone pain in cycle 1 was 3.4% for tbo-filgrastim, 1.4% for placebo, and 7.5% for filgrastim.
According to the drug’s prescribing information, tbo-filgrastim may pose a risk of splenic rupture, acute respiratory distress syndrome, serious allergic reactions, severe and sometimes fatal sickle cell crises, and capillary leak syndrome. The possibility that the drug acts as a growth factor for tumors cannot be excluded.

Lens-free microscope a ‘milestone’

Credit: Максим Кукушкин
Researchers say they’ve developed a lens-free microscope that can detect the presence of cell-level abnormalities with the same accuracy as larger and more expensive optical microscopes.
The invention could lead to less expensive, more portable technology for performing examinations of tissue, blood, and other biomedical specimens, according to the researchers.
It may prove especially useful in remote areas and when large numbers of samples need to be examined quickly.
Aydogan Ozcan, PhD, of the University of California, Los Angeles, and his colleagues described their work with the microscope in Science Translational Medicine.
“This is a milestone in the work we’ve been doing,” Dr Ozcan said. “This is the first time tissue samples have been imaged in 3D using a lens-free, on-chip microscope.”
The device works by using a laser or light-emitting-diode to illuminate a tissue or blood sample that has been placed on a slide and inserted into the device. A sensor array on a microchip captures and records the pattern of shadows created by the sample.
The device processes these patterns as a series of holograms, forming 3-D images of the specimen and giving medical personnel a virtual depth-of-field view. An algorithm color codes the reconstructed images, making the contrasts in the samples more apparent than they would be in the holograms and making any abnormalities easier to detect.
Dr Ozcan’s team tested the device using blood samples containing sickle cell anemia, Pap smears that indicated cervical cancer, and tissue specimens containing cancerous breast cells.
In a blind test, a board-certified pathologist analyzed sets of specimen images that had been created by the lens-free technology and by conventional microscopes. The pathologist’s diagnoses using the lens-free microscopic images proved accurate 99% of the time.
Another benefit of the lens-free device, according to the researchers, is that it produces images that are several hundred times larger in area, or field of view, than those captured by conventional bright-field optical microscopes. This makes it possible to process specimens more quickly.
“While mobile healthcare has expanded rapidly with the growth of consumer electronics—cellphones in particular—pathology is still, by and large, constrained to advanced clinical laboratory settings,” Dr Ozcan said. “Accompanied by advances in its graphical user interface, this platform could scale up for use in clinical, biomedical, scientific, educational, and citizen-science applications, among others.” 
Credit: Максим Кукушкин
Researchers say they’ve developed a lens-free microscope that can detect the presence of cell-level abnormalities with the same accuracy as larger and more expensive optical microscopes.
The invention could lead to less expensive, more portable technology for performing examinations of tissue, blood, and other biomedical specimens, according to the researchers.
It may prove especially useful in remote areas and when large numbers of samples need to be examined quickly.
Aydogan Ozcan, PhD, of the University of California, Los Angeles, and his colleagues described their work with the microscope in Science Translational Medicine.
“This is a milestone in the work we’ve been doing,” Dr Ozcan said. “This is the first time tissue samples have been imaged in 3D using a lens-free, on-chip microscope.”
The device works by using a laser or light-emitting-diode to illuminate a tissue or blood sample that has been placed on a slide and inserted into the device. A sensor array on a microchip captures and records the pattern of shadows created by the sample.
The device processes these patterns as a series of holograms, forming 3-D images of the specimen and giving medical personnel a virtual depth-of-field view. An algorithm color codes the reconstructed images, making the contrasts in the samples more apparent than they would be in the holograms and making any abnormalities easier to detect.
Dr Ozcan’s team tested the device using blood samples containing sickle cell anemia, Pap smears that indicated cervical cancer, and tissue specimens containing cancerous breast cells.
In a blind test, a board-certified pathologist analyzed sets of specimen images that had been created by the lens-free technology and by conventional microscopes. The pathologist’s diagnoses using the lens-free microscopic images proved accurate 99% of the time.
Another benefit of the lens-free device, according to the researchers, is that it produces images that are several hundred times larger in area, or field of view, than those captured by conventional bright-field optical microscopes. This makes it possible to process specimens more quickly.
“While mobile healthcare has expanded rapidly with the growth of consumer electronics—cellphones in particular—pathology is still, by and large, constrained to advanced clinical laboratory settings,” Dr Ozcan said. “Accompanied by advances in its graphical user interface, this platform could scale up for use in clinical, biomedical, scientific, educational, and citizen-science applications, among others.”
Credit: Максим Кукушкин
Researchers say they’ve developed a lens-free microscope that can detect the presence of cell-level abnormalities with the same accuracy as larger and more expensive optical microscopes.
The invention could lead to less expensive, more portable technology for performing examinations of tissue, blood, and other biomedical specimens, according to the researchers.
It may prove especially useful in remote areas and when large numbers of samples need to be examined quickly.
Aydogan Ozcan, PhD, of the University of California, Los Angeles, and his colleagues described their work with the microscope in Science Translational Medicine.
“This is a milestone in the work we’ve been doing,” Dr Ozcan said. “This is the first time tissue samples have been imaged in 3D using a lens-free, on-chip microscope.”
The device works by using a laser or light-emitting-diode to illuminate a tissue or blood sample that has been placed on a slide and inserted into the device. A sensor array on a microchip captures and records the pattern of shadows created by the sample.
The device processes these patterns as a series of holograms, forming 3-D images of the specimen and giving medical personnel a virtual depth-of-field view. An algorithm color codes the reconstructed images, making the contrasts in the samples more apparent than they would be in the holograms and making any abnormalities easier to detect.
Dr Ozcan’s team tested the device using blood samples containing sickle cell anemia, Pap smears that indicated cervical cancer, and tissue specimens containing cancerous breast cells.
In a blind test, a board-certified pathologist analyzed sets of specimen images that had been created by the lens-free technology and by conventional microscopes. The pathologist’s diagnoses using the lens-free microscopic images proved accurate 99% of the time.
Another benefit of the lens-free device, according to the researchers, is that it produces images that are several hundred times larger in area, or field of view, than those captured by conventional bright-field optical microscopes. This makes it possible to process specimens more quickly.
“While mobile healthcare has expanded rapidly with the growth of consumer electronics—cellphones in particular—pathology is still, by and large, constrained to advanced clinical laboratory settings,” Dr Ozcan said. “Accompanied by advances in its graphical user interface, this platform could scale up for use in clinical, biomedical, scientific, educational, and citizen-science applications, among others.”

Study shows higher risk of MDS, leukemia after breast cancer

chemotherapy
Credit: Rhoda Baer
The risk of developing myelodysplastic syndromes (MDS) or leukemias after treatment for early stage breast cancer is higher than previously reported, according to a study published in the Journal of Clinical Oncology.
Data from earlier studies showed that about 0.25% of breast cancer patients develop MDS or leukemia as a late effect of chemotherapy, said Judith Karp, MD, of the Johns Hopkins University School of Medicine in Baltimore, Maryland.
But Dr Karp and her colleagues found the 10-year incidence of MDS and leukemia among breast cancer patients to be about 0.5%.
“[T]he cumulative risk over a decade is now shown to be twice as high as we thought it was, and that risk doesn’t seem to slow down 5 years after treatment,” Dr Karp said. “Most medical oncologists have come to think that the risk is early and short-lived. So this was a little bit of a wake-up call that we are not seeing any plateau of that risk, and it is higher.”
Dr Karp and her colleagues reviewed data on 20,063 breast cancer patients treated at 8 US cancer centers between 1998 and 2007 whose cancer recurrence and secondary cancer rates were recorded in a database kept by the National Comprehensive Cancer Network.
At a median follow-up of 5.1 years, 50 patients had developed a marrow neoplasm, including acute myeloid leukemia (n=24), MDS/acute myeloid leukemia (n=15), chronic lymphocytic leukemia/small lymphocytic lymphoma (n=5), chronic myeloid leukemia (n=3), or acute lymphoblastic leukemia (n=3).
The risk of developing MDS/leukemia was about 7 times higher for patients who underwent surgery and received chemotherapy, compared to patients who did not receive chemotherapy. For patients who underwent surgery and received both chemotherapy and radiation, the risk was about 8 times higher.
The MDS/leukemia rates per 1000 person-years were 0.16 for surgery, 0.43 for surgery plus radiation, 0.46 for surgery plus chemotherapy, and 0.54 for all 3 modalities.
The cumulative incidence of MDS/leukemia doubled between years 5 and 10, rising from 0.24% to 0.48%. And only 9% of patients were alive at 10 years.
Antonio Wolff, MD, of the Johns Hopkins University School of Medicine, said this study could help early stage breast cancer patients and their physicians think more carefully about the use of preventive or adjuvant chemotherapy, especially when patients have a low risk of cancer recurrence.
“Our study provides useful information for physicians and patients to consider a potential downside of preventive or adjuvant chemotherapy in patients with very low risk of breast cancer recurrence,” he said.
“It could be a false and dangerous security blanket to some patients by exposing them to a small risk of serious late effects with little or no real benefit from the treatment.”
The researchers included a hypothetical case to put the risks of early stage breast cancer and its treatment in perspective. They described a 60-year-old woman in average health who was diagnosed with stage 1 breast cancer that was rapidly growing and estrogen receptor-positive.
The patient had an estimated 12.3% risk of dying of breast cancer after 10 years. She could improve her 10-year survival rate by 1.8% with 4 cycles of chemotherapy, but she would also increase her risk of MDS/leukemia over that same time by 0.5%.
Dr Wolff noted that it’s unclear whether the increased risk of MDS/leukemia after postsurgical chemotherapy applies to patients with other kinds of solid tumors, as the drug regimens used in breast cancer differ from those used for other cancers.
chemotherapy
Credit: Rhoda Baer
The risk of developing myelodysplastic syndromes (MDS) or leukemias after treatment for early stage breast cancer is higher than previously reported, according to a study published in the Journal of Clinical Oncology.
Data from earlier studies showed that about 0.25% of breast cancer patients develop MDS or leukemia as a late effect of chemotherapy, said Judith Karp, MD, of the Johns Hopkins University School of Medicine in Baltimore, Maryland.
But Dr Karp and her colleagues found the 10-year incidence of MDS and leukemia among breast cancer patients to be about 0.5%.
“[T]he cumulative risk over a decade is now shown to be twice as high as we thought it was, and that risk doesn’t seem to slow down 5 years after treatment,” Dr Karp said. “Most medical oncologists have come to think that the risk is early and short-lived. So this was a little bit of a wake-up call that we are not seeing any plateau of that risk, and it is higher.”
Dr Karp and her colleagues reviewed data on 20,063 breast cancer patients treated at 8 US cancer centers between 1998 and 2007 whose cancer recurrence and secondary cancer rates were recorded in a database kept by the National Comprehensive Cancer Network.
At a median follow-up of 5.1 years, 50 patients had developed a marrow neoplasm, including acute myeloid leukemia (n=24), MDS/acute myeloid leukemia (n=15), chronic lymphocytic leukemia/small lymphocytic lymphoma (n=5), chronic myeloid leukemia (n=3), or acute lymphoblastic leukemia (n=3).
The risk of developing MDS/leukemia was about 7 times higher for patients who underwent surgery and received chemotherapy, compared to patients who did not receive chemotherapy. For patients who underwent surgery and received both chemotherapy and radiation, the risk was about 8 times higher.
The MDS/leukemia rates per 1000 person-years were 0.16 for surgery, 0.43 for surgery plus radiation, 0.46 for surgery plus chemotherapy, and 0.54 for all 3 modalities.
The cumulative incidence of MDS/leukemia doubled between years 5 and 10, rising from 0.24% to 0.48%. And only 9% of patients were alive at 10 years.
Antonio Wolff, MD, of the Johns Hopkins University School of Medicine, said this study could help early stage breast cancer patients and their physicians think more carefully about the use of preventive or adjuvant chemotherapy, especially when patients have a low risk of cancer recurrence.
“Our study provides useful information for physicians and patients to consider a potential downside of preventive or adjuvant chemotherapy in patients with very low risk of breast cancer recurrence,” he said.
“It could be a false and dangerous security blanket to some patients by exposing them to a small risk of serious late effects with little or no real benefit from the treatment.”
The researchers included a hypothetical case to put the risks of early stage breast cancer and its treatment in perspective. They described a 60-year-old woman in average health who was diagnosed with stage 1 breast cancer that was rapidly growing and estrogen receptor-positive.
The patient had an estimated 12.3% risk of dying of breast cancer after 10 years. She could improve her 10-year survival rate by 1.8% with 4 cycles of chemotherapy, but she would also increase her risk of MDS/leukemia over that same time by 0.5%.
Dr Wolff noted that it’s unclear whether the increased risk of MDS/leukemia after postsurgical chemotherapy applies to patients with other kinds of solid tumors, as the drug regimens used in breast cancer differ from those used for other cancers.
chemotherapy
Credit: Rhoda Baer
The risk of developing myelodysplastic syndromes (MDS) or leukemias after treatment for early stage breast cancer is higher than previously reported, according to a study published in the Journal of Clinical Oncology.
Data from earlier studies showed that about 0.25% of breast cancer patients develop MDS or leukemia as a late effect of chemotherapy, said Judith Karp, MD, of the Johns Hopkins University School of Medicine in Baltimore, Maryland.
But Dr Karp and her colleagues found the 10-year incidence of MDS and leukemia among breast cancer patients to be about 0.5%.
“[T]he cumulative risk over a decade is now shown to be twice as high as we thought it was, and that risk doesn’t seem to slow down 5 years after treatment,” Dr Karp said. “Most medical oncologists have come to think that the risk is early and short-lived. So this was a little bit of a wake-up call that we are not seeing any plateau of that risk, and it is higher.”
Dr Karp and her colleagues reviewed data on 20,063 breast cancer patients treated at 8 US cancer centers between 1998 and 2007 whose cancer recurrence and secondary cancer rates were recorded in a database kept by the National Comprehensive Cancer Network.
At a median follow-up of 5.1 years, 50 patients had developed a marrow neoplasm, including acute myeloid leukemia (n=24), MDS/acute myeloid leukemia (n=15), chronic lymphocytic leukemia/small lymphocytic lymphoma (n=5), chronic myeloid leukemia (n=3), or acute lymphoblastic leukemia (n=3).
The risk of developing MDS/leukemia was about 7 times higher for patients who underwent surgery and received chemotherapy, compared to patients who did not receive chemotherapy. For patients who underwent surgery and received both chemotherapy and radiation, the risk was about 8 times higher.
The MDS/leukemia rates per 1000 person-years were 0.16 for surgery, 0.43 for surgery plus radiation, 0.46 for surgery plus chemotherapy, and 0.54 for all 3 modalities.
The cumulative incidence of MDS/leukemia doubled between years 5 and 10, rising from 0.24% to 0.48%. And only 9% of patients were alive at 10 years.
Antonio Wolff, MD, of the Johns Hopkins University School of Medicine, said this study could help early stage breast cancer patients and their physicians think more carefully about the use of preventive or adjuvant chemotherapy, especially when patients have a low risk of cancer recurrence.
“Our study provides useful information for physicians and patients to consider a potential downside of preventive or adjuvant chemotherapy in patients with very low risk of breast cancer recurrence,” he said.
“It could be a false and dangerous security blanket to some patients by exposing them to a small risk of serious late effects with little or no real benefit from the treatment.”
The researchers included a hypothetical case to put the risks of early stage breast cancer and its treatment in perspective. They described a 60-year-old woman in average health who was diagnosed with stage 1 breast cancer that was rapidly growing and estrogen receptor-positive.
The patient had an estimated 12.3% risk of dying of breast cancer after 10 years. She could improve her 10-year survival rate by 1.8% with 4 cycles of chemotherapy, but she would also increase her risk of MDS/leukemia over that same time by 0.5%.
Dr Wolff noted that it’s unclear whether the increased risk of MDS/leukemia after postsurgical chemotherapy applies to patients with other kinds of solid tumors, as the drug regimens used in breast cancer differ from those used for other cancers.
Care as a Continuum
Patients who are hospitalized for an acute event often have a range of prior outpatient experiences within the healthcare system, both before and after a hospitalization. In particular, continuity with a primary care provider can influence health outcomes.[1] In this issue of the Journal of Hospital Medicine, Boonyasai et al. found several characteristics of primary care physicians that were associated with whether their hospitalized patients were cared for by hospitalists.[2] Using Medicare claims data from the state of Texas during years 2001 to 2009, the authors calculated the percent of primary care physicians' hospitalized patients who were cared for by hospitalists. Hospitalist use increased overall during the time period, but primary care physicians differed in the rate and extent of hospitalist use. A minority of physicians were early adopters, with the majority of their hospitalized patients cared for by hospitalists during the entire time period. A sizeable group of primary care physicians mostly avoided using hospitalists. Moreover, there was a significant cluster of primary care physicians who, at some point during the study period, rapidly began using hospitalists within a relatively short time.
Several physician characteristics were associated with a greater adoption of the hospitalist model, including being female, in a family practice specialty, or in a rural practice setting. What this study lacks is the ability to explain why some physicians used hospitalists and others did not. It is probable that adoption (or not) of hospitalists is less an individual physician decision and instead reflects a choice of their clinical practice group. If an outpatient practice group or provider can influence whether or not their patients are cared for by hospitalists, it is also conceivable that they can affect hospital‐based outcomes as well. This finding reinforces the importance of examining the care and outcomes of patient care across the continuum of care, rather than focusing on the inpatient or outpatient setting.
As a result of the Affordable Care Act and rising healthcare costs, provider groups are beginning to form accountable care organizations (ACOs). An ACO is partnership between payers and providers to care for a population of patients across the continuum of care. In these arrangements, the providers often take on financial risk for the total cost of care for a population as well as for providing high‐quality care as monitored by specific metrics.[3] The population of patients for which ACOs take risks often include predominantly patients who receive primary care from the group.[4] For overall cost management, given that acute hospitalizations are disproportionately high cost, a primary focus of a majority of ACOs is to reduce unnecessary hospital days. Overall, ACOs that have been successful in the short term in managing costs have done so primarily by reducing overall hospital days.[5] ACOs have started to do so by creating intensive outpatient care management programs for high‐risk patients, by focusing on transitions of care to help decrease readmissions, by working with primary care clinics to transform into patient‐centered medical homes, where same‐day access to care is a priority, and developing other disease‐management tools to keep patients healthy.
To manage hospital utilization, many ACOs have developed plans to transform primary care and shift hospital care to outpatient care through enhanced outpatient case management for complex cases. As the way primary care is delivered changes, it will be very important to understand how this will modify the utilization and impact of hospitalist care on patients. The hope is that these modifications will work synergistically with hospitalist programs.
As the lines between outpatient and inpatient care become increasingly blurred, it may not be fair to attribute hospitalization outcome measures to hospitalists alone, particularly as ACOs are likely to move only the sickest or most difficult to manage patients to the inpatient setting. This may affect hospital‐based quality metrics such as readmissions and mortality. Seamless communication and transfer of information between outpatient and inpatient care will be vital to the success of ACOs.[6] In addition to improved communication, however, some systems may look to hospitalists to staff postdischarge clinics or act as extensivists or ambulatory intensivists to help manage the sickest in the population.[7]
Boonyasi et al. show that primary care physician characteristics as associated with whether or not patients' receive care from hospitalists.[2] As such, it reinforces the concept that providers in part of the continuum of care are integrally tied to care received by patients in different treatment settings. As our healthcare system rapidly transforms over the next few years, it will become more important to understand how outpatient and inpatient providers influence one another's care patterns and how these relationships influence care and cost‐related outcomes for patients.
ACKNOWLEDGMENTS
Disclosure: Nothing to report.
- , . Does continuity of care improve patient outcomes? J Fam Pract. 2004;53(12):974–980.
- et al. Characteristics of primary care providers who adopted the hospitalist model 2001–2009. J Hosp Med.
- . Understanding the new vocabulary of healthcare reform. J Hosp Med. 2010;5:197–199.
- Centers for Medicare 8:472–477.
- Agency for Healthcare Research and Quality. Medical “extensivists” care for high‐acuity patients across settings, leading to reduced hospital use. AHRQ Service Delivery Innovation Profile. Available at: https://innovations.ahrq.gov/profiles/medical‐extensivists‐care‐high‐acuity‐patients‐across‐settings‐leading‐reduced‐hospital‐use. Accessed December 17, 2014.
Patients who are hospitalized for an acute event often have a range of prior outpatient experiences within the healthcare system, both before and after a hospitalization. In particular, continuity with a primary care provider can influence health outcomes.[1] In this issue of the Journal of Hospital Medicine, Boonyasai et al. found several characteristics of primary care physicians that were associated with whether their hospitalized patients were cared for by hospitalists.[2] Using Medicare claims data from the state of Texas during years 2001 to 2009, the authors calculated the percent of primary care physicians' hospitalized patients who were cared for by hospitalists. Hospitalist use increased overall during the time period, but primary care physicians differed in the rate and extent of hospitalist use. A minority of physicians were early adopters, with the majority of their hospitalized patients cared for by hospitalists during the entire time period. A sizeable group of primary care physicians mostly avoided using hospitalists. Moreover, there was a significant cluster of primary care physicians who, at some point during the study period, rapidly began using hospitalists within a relatively short time.
Several physician characteristics were associated with a greater adoption of the hospitalist model, including being female, in a family practice specialty, or in a rural practice setting. What this study lacks is the ability to explain why some physicians used hospitalists and others did not. It is probable that adoption (or not) of hospitalists is less an individual physician decision and instead reflects a choice of their clinical practice group. If an outpatient practice group or provider can influence whether or not their patients are cared for by hospitalists, it is also conceivable that they can affect hospital‐based outcomes as well. This finding reinforces the importance of examining the care and outcomes of patient care across the continuum of care, rather than focusing on the inpatient or outpatient setting.
As a result of the Affordable Care Act and rising healthcare costs, provider groups are beginning to form accountable care organizations (ACOs). An ACO is partnership between payers and providers to care for a population of patients across the continuum of care. In these arrangements, the providers often take on financial risk for the total cost of care for a population as well as for providing high‐quality care as monitored by specific metrics.[3] The population of patients for which ACOs take risks often include predominantly patients who receive primary care from the group.[4] For overall cost management, given that acute hospitalizations are disproportionately high cost, a primary focus of a majority of ACOs is to reduce unnecessary hospital days. Overall, ACOs that have been successful in the short term in managing costs have done so primarily by reducing overall hospital days.[5] ACOs have started to do so by creating intensive outpatient care management programs for high‐risk patients, by focusing on transitions of care to help decrease readmissions, by working with primary care clinics to transform into patient‐centered medical homes, where same‐day access to care is a priority, and developing other disease‐management tools to keep patients healthy.
To manage hospital utilization, many ACOs have developed plans to transform primary care and shift hospital care to outpatient care through enhanced outpatient case management for complex cases. As the way primary care is delivered changes, it will be very important to understand how this will modify the utilization and impact of hospitalist care on patients. The hope is that these modifications will work synergistically with hospitalist programs.
As the lines between outpatient and inpatient care become increasingly blurred, it may not be fair to attribute hospitalization outcome measures to hospitalists alone, particularly as ACOs are likely to move only the sickest or most difficult to manage patients to the inpatient setting. This may affect hospital‐based quality metrics such as readmissions and mortality. Seamless communication and transfer of information between outpatient and inpatient care will be vital to the success of ACOs.[6] In addition to improved communication, however, some systems may look to hospitalists to staff postdischarge clinics or act as extensivists or ambulatory intensivists to help manage the sickest in the population.[7]
Boonyasi et al. show that primary care physician characteristics as associated with whether or not patients' receive care from hospitalists.[2] As such, it reinforces the concept that providers in part of the continuum of care are integrally tied to care received by patients in different treatment settings. As our healthcare system rapidly transforms over the next few years, it will become more important to understand how outpatient and inpatient providers influence one another's care patterns and how these relationships influence care and cost‐related outcomes for patients.
ACKNOWLEDGMENTS
Disclosure: Nothing to report.
Patients who are hospitalized for an acute event often have a range of prior outpatient experiences within the healthcare system, both before and after a hospitalization. In particular, continuity with a primary care provider can influence health outcomes.[1] In this issue of the Journal of Hospital Medicine, Boonyasai et al. found several characteristics of primary care physicians that were associated with whether their hospitalized patients were cared for by hospitalists.[2] Using Medicare claims data from the state of Texas during years 2001 to 2009, the authors calculated the percent of primary care physicians' hospitalized patients who were cared for by hospitalists. Hospitalist use increased overall during the time period, but primary care physicians differed in the rate and extent of hospitalist use. A minority of physicians were early adopters, with the majority of their hospitalized patients cared for by hospitalists during the entire time period. A sizeable group of primary care physicians mostly avoided using hospitalists. Moreover, there was a significant cluster of primary care physicians who, at some point during the study period, rapidly began using hospitalists within a relatively short time.
Several physician characteristics were associated with a greater adoption of the hospitalist model, including being female, in a family practice specialty, or in a rural practice setting. What this study lacks is the ability to explain why some physicians used hospitalists and others did not. It is probable that adoption (or not) of hospitalists is less an individual physician decision and instead reflects a choice of their clinical practice group. If an outpatient practice group or provider can influence whether or not their patients are cared for by hospitalists, it is also conceivable that they can affect hospital‐based outcomes as well. This finding reinforces the importance of examining the care and outcomes of patient care across the continuum of care, rather than focusing on the inpatient or outpatient setting.
As a result of the Affordable Care Act and rising healthcare costs, provider groups are beginning to form accountable care organizations (ACOs). An ACO is partnership between payers and providers to care for a population of patients across the continuum of care. In these arrangements, the providers often take on financial risk for the total cost of care for a population as well as for providing high‐quality care as monitored by specific metrics.[3] The population of patients for which ACOs take risks often include predominantly patients who receive primary care from the group.[4] For overall cost management, given that acute hospitalizations are disproportionately high cost, a primary focus of a majority of ACOs is to reduce unnecessary hospital days. Overall, ACOs that have been successful in the short term in managing costs have done so primarily by reducing overall hospital days.[5] ACOs have started to do so by creating intensive outpatient care management programs for high‐risk patients, by focusing on transitions of care to help decrease readmissions, by working with primary care clinics to transform into patient‐centered medical homes, where same‐day access to care is a priority, and developing other disease‐management tools to keep patients healthy.
To manage hospital utilization, many ACOs have developed plans to transform primary care and shift hospital care to outpatient care through enhanced outpatient case management for complex cases. As the way primary care is delivered changes, it will be very important to understand how this will modify the utilization and impact of hospitalist care on patients. The hope is that these modifications will work synergistically with hospitalist programs.
As the lines between outpatient and inpatient care become increasingly blurred, it may not be fair to attribute hospitalization outcome measures to hospitalists alone, particularly as ACOs are likely to move only the sickest or most difficult to manage patients to the inpatient setting. This may affect hospital‐based quality metrics such as readmissions and mortality. Seamless communication and transfer of information between outpatient and inpatient care will be vital to the success of ACOs.[6] In addition to improved communication, however, some systems may look to hospitalists to staff postdischarge clinics or act as extensivists or ambulatory intensivists to help manage the sickest in the population.[7]
Boonyasi et al. show that primary care physician characteristics as associated with whether or not patients' receive care from hospitalists.[2] As such, it reinforces the concept that providers in part of the continuum of care are integrally tied to care received by patients in different treatment settings. As our healthcare system rapidly transforms over the next few years, it will become more important to understand how outpatient and inpatient providers influence one another's care patterns and how these relationships influence care and cost‐related outcomes for patients.
ACKNOWLEDGMENTS
Disclosure: Nothing to report.
- , . Does continuity of care improve patient outcomes? J Fam Pract. 2004;53(12):974–980.
- et al. Characteristics of primary care providers who adopted the hospitalist model 2001–2009. J Hosp Med.
- . Understanding the new vocabulary of healthcare reform. J Hosp Med. 2010;5:197–199.
- Centers for Medicare 8:472–477.
- Agency for Healthcare Research and Quality. Medical “extensivists” care for high‐acuity patients across settings, leading to reduced hospital use. AHRQ Service Delivery Innovation Profile. Available at: https://innovations.ahrq.gov/profiles/medical‐extensivists‐care‐high‐acuity‐patients‐across‐settings‐leading‐reduced‐hospital‐use. Accessed December 17, 2014.
- , . Does continuity of care improve patient outcomes? J Fam Pract. 2004;53(12):974–980.
- et al. Characteristics of primary care providers who adopted the hospitalist model 2001–2009. J Hosp Med.
- . Understanding the new vocabulary of healthcare reform. J Hosp Med. 2010;5:197–199.
- Centers for Medicare 8:472–477.
- Agency for Healthcare Research and Quality. Medical “extensivists” care for high‐acuity patients across settings, leading to reduced hospital use. AHRQ Service Delivery Innovation Profile. Available at: https://innovations.ahrq.gov/profiles/medical‐extensivists‐care‐high‐acuity‐patients‐across‐settings‐leading‐reduced‐hospital‐use. Accessed December 17, 2014.
Dashboards and P4P in VTE Prophylaxis
The Affordable Care Act explicitly outlines improving the value of healthcare by increasing quality and decreasing costs. It emphasizes value‐based purchasing, the transparency of performance metrics, and the use of payment incentives to reward quality.[1, 2] Venous thromboembolism (VTE) prophylaxis is one of these publicly reported performance measures. The National Quality Forum recommends that each patient be evaluated on hospital admission and during their hospitalization for VTE risk level and for appropriate thromboprophylaxis to be used, if required.[3] Similarly, the Joint Commission includes appropriate VTE prophylaxis in its Core Measures.[4] Patient experience and performance metrics, including VTE prophylaxis, constitute the hospital value‐based purchasing (VBP) component of healthcare reform.[5] For a hypothetical 327‐bed hospital, an estimated $1.7 million of a hospital's inpatient payments from Medicare will be at risk from VBP alone.[2]
VTE prophylaxis is a common target of quality improvement projects. Effective, safe, and cost‐effective measures to prevent VTE exist, including pharmacologic and mechanical prophylaxis.[6, 7] Despite these measures, compliance rates are often below 50%.[8] Different interventions have been pursued to ensure appropriate VTE prophylaxis, including computerized provider order entry (CPOE), electronic alerts, mandatory VTE risk assessment and prophylaxis, and provider education campaigns.[9] Recent studies show that CPOE systems with mandatory fields can increase VTE prophylaxis rates to above 80%, yet the goal of a high reliability health system is for 100% of patients to receive recommended therapy.[10, 11, 12, 13, 14, 15] Interventions to improve prophylaxis rates that have included multiple strategies, such as computerized order sets, feedback, and education, have been the most effective, increasing compliance to above 90%.[9, 11, 16] These systems can be enhanced with additional interventions such as providing individualized provider education and feedback, understanding of work flow, and ensuring patients receive the prescribed therapies.[12] For example, a physician dashboard could be employed to provide a snapshot and historical trend of key performance indicators using graphical displays and indicators.[17]
Dashboards and pay‐for‐performance programs have been increasingly used to increase the visibility of these metrics, provide feedback, visually display benchmarks and goals, and proactively monitor for achievements and setbacks.[18] Although these strategies are often addressed at departmental (or greater) levels, applying them at the level of the individual provider may assist hospitals in reducing preventable harm and achieving safety and quality goals, especially at higher benchmarks. With their expanding role, hospitalists provide a key opportunity to lead improvement efforts and to study the impact of dashboards and pay‐for performance at the provider level to achieve VTE prophylaxis performance targets. Hospitalists are often the front‐line provider for inpatients and deliver up to 70% of inpatient general medical services.[19] The objective of our study was to evaluate the impact of providing individual provider feedback and employing a pay‐for‐performance program on baseline performance of VTE prophylaxis among hospitalists. We hypothesized that performance feedback through the use of a dashboard would increase appropriate VTE prophylaxis, and this effect would be further augmented by incorporation of a pay‐for‐performance program.
METHODS
Hospitalist Dashboard
In 2010, hospitalist program leaders met with hospital administrators to create a hospitalist dashboard that would provide regularly updated summaries of performance measures for individual hospitalists. The final set of metrics identified included appropriate VTE prophylaxis, length of stay, patients discharged per day, discharges before 3 pm, depth of coding, patient satisfaction, readmissions, communication with the primary care provider, and time to signature for discharge summaries (Figure 1A). The dashboard was introduced at a general hospitalist meeting during which its purpose, methodology, and accessibility were described; it was subsequently implemented in January 2011.
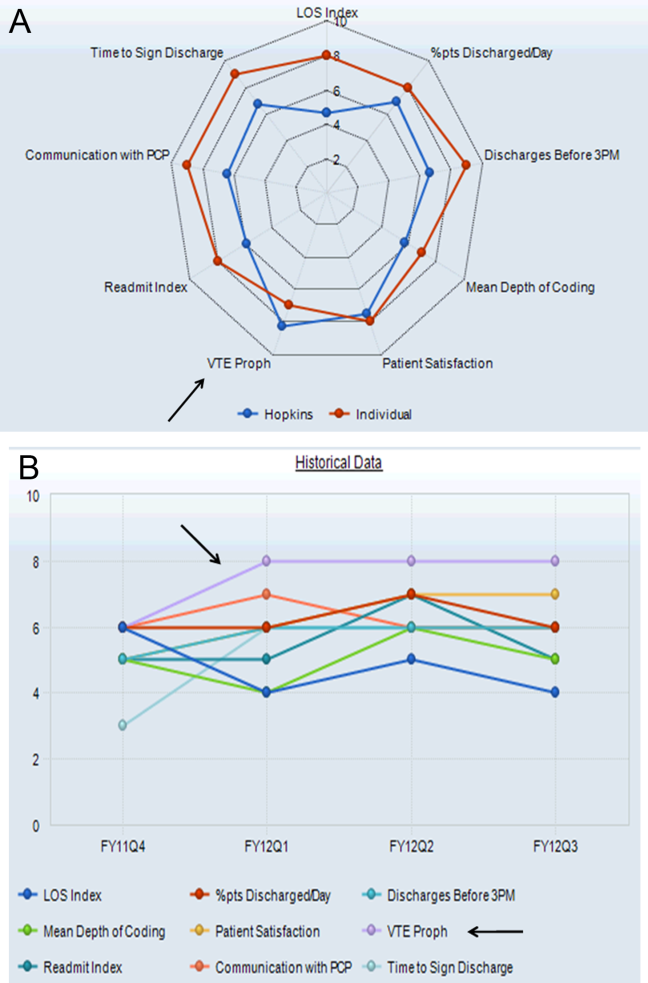
Benchmarks were established for each metric, standardized to establish a scale ranging from 1 through 9, and incorporated into the dashboard (Figure 1A). Higher scores (creating a larger geometric shape) were desirable. For the VTE prophylaxis measure, scores of 1 through 9 corresponded to <60%, 60% to 64.9%, 65% to 69.9%, 70% to 74.9%, 75% to 79.9%, 80% to 84.9%, 85% to 89.9%, 90% to 94.9%, and 95% American College of Chest Physicians (ACCP)‐compliant VTE prophylaxis, respectively.[12, 20] Each provider was able to access the aggregated dashboard (showing the group mean) and his/her individualized dashboard using an individualized login and password for the institutional portal. This portal is used during the provider's workflow, including medical record review and order entry. Both a polygonal summary graphic (Figure 1A) and trend (Figure 1B) view of the dashboard were available to the provider. A comparison of the individual provider to the hospitalist group average was displayed (Figure 1A). At monthly program meetings, the dashboard, group results, and trends were discussed.
Venous Thromboembolism Prophylaxis Compliance
Our study was performed in a tertiary academic medical center with an approximately 20‐member hospitalist group (the precise membership varied over time), whose responsibilities include, among other clinical duties, staffing a 17‐bed general medicine unit with telemetry. The scope of diagnoses and acuity of patients admitted to the hospitalist service is similar to the housestaff services. Some hospitalist faculty serve both as hospitalist and nonhospitalist general medicine service team attendings, but the comparison groups were staffed by hospitalists for <20% of the time. For admissions, all hospitalists use a standardized general medicine admission order set that is integrated into the CPOE system (Sunrise Clinical Manager; Allscripts, Chicago, IL) and completed for all admitted patients. A mandatory VTE risk screen, which includes an assessment of VTE risk factors and pharmacological prophylaxis contraindications, must be completed by the ordering physician as part of this order set (Figure 2A). The system then prompts the provider with a risk‐appropriate VTE prophylaxis recommendation that the provider may subsequently order, including mechanical prophylaxis (Figure 2B). Based on ACCP VTE prevention guidelines, risk‐appropriate prophylaxis was determined using an electronic algorithm that categorized patients into risk categories based on the presence of major VTE risk factors (Figure 2A).[12, 15, 20] If none of these were present, the provider selected No major risk factors known. Both an assessment of current use of anticoagulation and a clinically high risk of bleeding were also included (Figure 2A). If none of these were present, the provider selected No contraindications known. This algorithm is published in detail elsewhere and has been shown to not increase major bleeding episodes.[12, 15] The VTE risk assessment, but not the VTE order itself, was a mandatory field. This allowed the physician discretion to choose among various pharmacological agents and mechanical mechanisms based on patient and physician preferences.
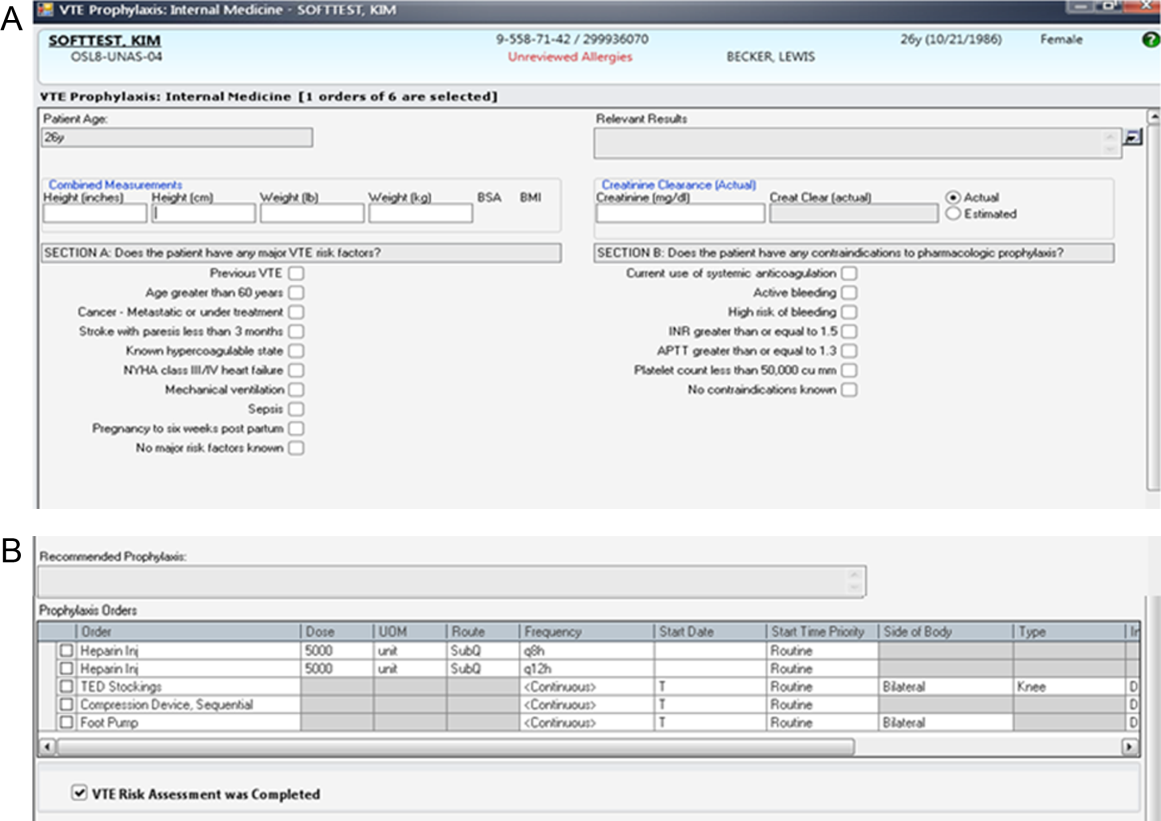
Compliance of risk‐appropriate VTE prophylaxis was determined 24 hours after the admission order set was completed using an automated electronic query of the CPOE system. Low molecular‐weight heparin prescription was included in the compliance algorithm as acceptable prophylaxis. Prescription of pharmacological VTE prophylaxis when a contraindication was present was considered noncompliant. The metric was assigned to the attending physician who billed for the first inpatient encounter.
Pay‐for‐Performance Program
In July 2011, a pay‐for‐performance program was added to the dashboard. All full‐time and part‐time hospitalists were eligible. The financial incentive was determined according to hospital priority and funds available. The VTE prophylaxis metric was prorated by clinical effort, with a maximum of $0.50 per work relative value unit (RVU). To optimize performance, a threshold of 80% compliance had to be surpassed before any payment was made. Progressively increasing percentages of the incentive were earned as compliance increased from 80% to 100%, corresponding to dashboard scores of 6, 7, 8, and 9: <80% (scores 1 to 5)=no payment; 80% to 84.9% (score 6)=$0.125 per RVU; 85% to 89.9% (score 7)=$0.25 per RVU; 90% to 94.9% (score 8)=$0.375 per RVU; and 95% (score 9)=$0.50 per RVU (maximum incentive). Payments were accrued quarterly and paid at the end of the fiscal year as a cumulative, separate performance supplement.
Individualized physician feedback through the dashboard was continued during the pay‐for‐performance period. Average hospitalist group compliance continued to be displayed on the electronic dashboard and was explicitly reviewed at monthly hospitalist meetings.
The VTE prophylaxis order set and data collection and analyses were approved by the Johns Hopkins Medicine Institutional Review Board. The dashboard and pay‐for‐performance program were initiated by the institution as part of a proof of concept quality improvement project.
Analysis
We examined all inpatient admissions to the hospitalist unit from 2008 to 2012. We included patients admitted to and discharged from the hospitalist unit and excluded patients transferred into/out of the unit and encounters with a length of stay <24 hours. VTE prophylaxis orders were queried from the CPOE system 24 hours after the patient was admitted to determine compliance.
After allowing for a run‐in period (2008), we analyzed the change in percent compliance for 3 periods: (1) CPOE‐based VTE order set alone (baseline [BASE], January 2009 to December 2010); (2) group and individual physician feedback using the dashboard (dashboard only [DASH], January to June 2011); and (3) dashboard tied to the pay‐for‐performance program (dashboard with pay‐for‐performance [P4P], July 2011 to December 2012). The CPOE‐based VTE order set was used during all 3 periods. We used the other medical services as a control to ensure that there were no temporal trends toward improved prophylaxis on a service without the intervention. VTE prophylaxis compliance was examined by calculating percent compliance using the same algorithm for the 4 resident‐staffed general medicine service teams at our institution, which utilized the same CPOE system but did not receive the dashboard or pay‐for‐performance interventions. We used locally weighted scatterplot smoothing, a locally weighted regression of percent compliance over time, to graphically display changes in group compliance over time.[21, 22]
We also performed linear regression to assess the rate of change in group compliance and included spline terms that allowed slope to vary for each of the 3 time periods.[23, 24] Clustered analysis accounted for potentially correlated serial measurements of compliance for an individual provider. A separate analysis examined the effect of provider turnover and individual provider improvement during each of the 3 periods. Tests of significance were 2‐sided, with an level of 0.05. Statistical analysis was performed using Stata 12.1 (StataCorp LP, College Station, TX).
RESULTS
Venous Thromboembolism Prophylaxis Compliance
We analyzed 3144 inpatient admissions by 38 hospitalists from 2009 to 2012. The 5 most frequent coded diagnoses were heart failure, acute kidney failure, syncope, pneumonia, and chest pain. Patients had a median length of stay of 3 days [interquartile range: 26]. During the dashboard‐only period, on average, providers improved in compliance by 4% (95% confidence interval [CI]: 35; P<0.001). With the addition of the pay‐for‐performance program, providers improved by an additional 4% (95% CI: 35; P<0.001). Group compliance significantly improved from 86% (95% CI: 8588) during the BASE period of the CPOE‐based VTE order set to 90% (95% CI: 8893) during the DASH period (P=0.01) and 94% (95% CI: 9396) during the subsequent P4P program (P=0.01) (Figure 3). Both inappropriate prophylaxis and lack of prophylaxis, when indicated, resulted in a non‐compliance rating. During the 3 periods, inappropriate prophylaxis decreased from 7.9% to 6.2% to 2.6% during the BASE, DASH, and subsequent P4P periods, respectively. Similarly, lack of prophylaxis when indicated decreased from 6.1% to 3.2% to 3.1% during the BASE, DASH, and subsequent P4P periods, respectively.
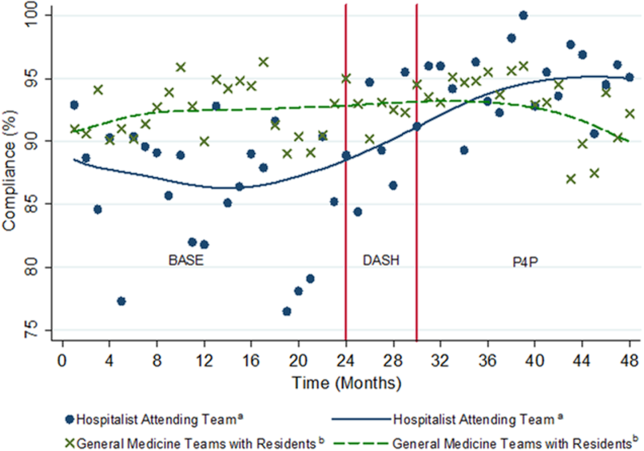
The average compliance of the 4 non‐hospitalist general medicine service teams was initially higher than that of the hospitalist service during the CPOE‐based VTE order set (90%) and DASH (92%) periods, but subsequently plateaued and was exceeded by the hospitalist service during the combined P4P (92%) period (Figure 3). However, there was no statistically significant difference between the general medicine service teams and hospitalist service during the DASH (P=0.15) and subsequent P4P (P=0.76) periods.
We also analyzed the rate of VTE prophylaxis compliance improvement (slope) with cut points at each time period transition (Figure 3). Risk‐appropriate VTE prophylaxis during the BASE period did not exhibit significant improvement as indicated by the slope (P=0.23) (Figure 3). In contrast, during the DASH period, VTE prophylaxis compliance significantly increased by 1.58% per month (95% CI: 0.41‐2.76; P=0.01). The addition of the P4P program, however, did not further significantly increase the rate of compliance (P=0.78).
A subgroup analysis restricted to the 19 providers present during all 3 periods was performed to assess for potential confounding from physician turnover. The percent compliance increased in a similar fashion: BASE period of CPOE‐based VTE order set, 85% (95% CI: 8386); DASH, 90% (95% CI: 8893); and P4P, 94% (95% CI: 9296).
Pay‐for‐Performance Program
Nineteen providers met the threshold for pay‐for‐performance (80% appropriate VTE prophylaxis), with 9 providers in the intermediate categories (80%94.9%) and 10 in the full incentive category (95%). The mean individual payout for the incentive was $633 (standard deviation 350), with a total disbursement of $12,029. The majority of payments (17 of 19) were under $1000.
DISCUSSION
A key component of healthcare reform has been value‐based purchasing, which emphasizes extrinsic motivation through the transparency of performance metrics and use of payment incentives to reward quality. Our study evaluates the impact of both extrinsic (payments) and intrinsic (professionalism and peer norms) motivation. It specifically attributed an individual performance metric, VTE prophylaxis, to an attending physician, provided both individualized and group feedback using an electronic dashboard, and incorporated a pay‐for‐performance program. Prescription of risk‐appropriate VTE prophylaxis significantly increased with the implementation of the dashboard and subsequent pay‐for performance program. The fastest rate of improvement occurred after the addition of the dashboard. Sensitivity analyses for provider turnover and comparisons to the general medicine services showed our results to be independent of a general trend of improvement, both at the provider and institutional levels.
Our prior studies demonstrated that order sets significantly improve performance, from a baseline compliance of risk‐appropriate VTE prophylaxis of 66% to 84%.[13, 15, 25] In the current study, compliance was relatively flat during the BASE period, which included these order sets. The greatest rate of continued improvement in compliance occurred during the DASH period, emphasizing both the importance of provider feedback and receptivity and adaptability in the prescribing behavior of hospitalists. Because the goal of a high‐reliability health system is for 100% of patients to receive recommended therapy, multiple approaches are necessary for success.
Nationally, benchmarks for performance measures continue to be raised, with the highest performers achieving above 95%.[26] Additional interventions, such as dashboards and pay‐for‐performance programs, supplement CPOE systems to achieve high reliability. In our study, the compliance rate during the baseline period, which included a CPOE‐based, clinical support‐enabled VTE order set, was 86%. Initially the compliance of the general medicine teams with residents exceeded that of the hospitalist attending teams, which may reflect a greater willingness of resident teams to comply with order sets and automated recommendations. This emphasizes the importance of continuous individual feedback and provider education at the attending physician level to enhance both guideline compliance and decrease provider care variation. Ultimately, with the addition of the dashboard and subsequent pay‐for‐performance program, compliance was increased to 90% and 94%, respectively. Although the major mechanism used by policymakers to improve quality of care is extrinsic motivation, this study demonstrates that intrinsic motivation through peer norms can enhance extrinsic efforts and may be more influential. Both of these programs, dashboards and pay‐for‐performance, may ultimately assist institutions in changing provider behavior and achieving these harder‐to‐achieve higher benchmarks.
We recognize that there are several limitations to our study. First, this is a single‐site program limited to an attending‐physician‐only service. There was strong data support and a defined CPOE algorithm for this initiative. Multi‐site studies will need to overcome the additional challenges of varying service structures and electronic medical record and provider order entry systems. Second, it is difficult to show actual changes in VTE events over time with appropriate prophylaxis. Although VTE prophylaxis is recommended for patients with VTE risk factors, there are conflicting findings about whether prophylaxis prevents VTE events in lower‐risk patients, and current studies suggest that most patients with VTE events are severely ill and develop VTE despite receiving prophylaxis.[27, 28, 29] Our study was underpowered to detect these potential differences in VTE rates, and although the algorithm has been shown to not increase bleeding rates, we did not measure bleeding rates during this study.[12, 15] Our institutional experience suggests that the majority of VTE events occur despite appropriate prophylaxis.[30] Also, VTE prophylaxis may be ordered, but intervening events, such as procedures and changes in risk status or patient refusal, may prevent patients from receiving appropriate prophylaxis.[31, 32] Similarly, hospitals with higher quality scores have higher VTE prophylaxis rates but worse risk‐adjusted VTE rates, which may result from increased surveillance for VTE, suggesting surveillance bias limits the usefulness of the VTE quality measure.[33, 34] Nevertheless, VTE prophylaxis remains a publicly reported Core Measure tied to financial incentives.[4, 5] Third, there may be an unmeasured factor specific to the hospitalist program, which could potentially account for an overall improvement in quality of care. Although the rate of increase in appropriate prophylaxis was not statistically significant during the baseline period, there did appear to be some improvement in prophylaxis toward the end of the period. However, there were no other VTE‐related provider feedback programs being simultaneously pursued during this study. VTE prophylaxis for the non‐hospitalist services showed a relatively stable, non‐increasing compliance rate for the general medical services. Although it was possible for successful residents to age into the hospitalist service, thereby improving rates of prophylaxis based on changes in group makeup, our subgroup analysis of the providers present throughout all phases of the study showed our results to be robust. Similarly, there may have been a cross‐contamination effect of hospitalist faculty who attended on both hospitalist and non‐hospitalist general medicine service teams. This, however, would attenuate any impact of the programs, and thus the effects may in fact be greater than reported. Fourth, establishment of both the dashboard and pay‐for‐performance program required significant institutional and program leadership and resources. To be successful, the dashboard must be in the provider's workflow, transparent, minimize reporter burden, use existing systems, and be actively fed back to providers, ideally those directly entering orders. Our greatest rate of improvement occurred during the feedback‐only phase of this study, emphasizing the importance of physician feedback, provider‐level accountability, and engagement. We suspect that the relatively modest pay‐for‐performance incentive served mainly as a means of engaging providers in self‐monitoring, rather than as a means to change behavior through true incentivization. Although we did not track individual physician views of the dashboard, we reinforced trends, deviations, and expectations at regularly scheduled meetings and provided feedback and patient‐level data to individual providers. Fifth, the design of the pay‐for‐performance program may have also influenced its effectiveness. These types of programs may be more effective when they provide frequent visible, small payments rather than one large payment, and when the payment is framed as a loss rather than a gain.[35] Finally, physician champions and consistent feedback through departmental meetings or visual displays may be required for program success. The initial resources to create the dashboard, continued maintenance and monitoring of performance, and payment of financial incentives all require institutional commitment. A partnership of physicians, program leaders, and institutional administrators is necessary for both initial and continued success.
To achieve performance goals and benchmarks, multiple strategies that combine extrinsic and intrinsic motivation are necessary. As shown by our study, the use of a dashboard and pay‐for‐performance can be tailored to an institution's goals, in line with national standards. The specific goal (risk‐appropriate VTE prophylaxis) and benchmarks (80%, 85%, 90%, 95%) can be individualized to a particular institution. For example, if readmission rates are above target, readmissions could be added as a dashboard metric. The specific benchmark would be determined by historical trends and administrative targets. Similarly, the overall financial incentives could be adjusted based on the financial resources available. Other process measures, such as influenza vaccination screening and administration, could also be targeted. For all of these objectives, continued provider feedback and engagement are critical for progressive success, especially to decrease variability in care at the attending physician level. Incorporating the value‐based purchasing philosophy from the Affordable Care Act, our study suggests that the combination of standardized order sets, real‐time dashboards, and physician‐level incentives may assist hospitals in achieving quality and safety benchmarks, especially at higher targets.
Acknowledgements
The authors thank Meir Gottlieb, BS, from Salar Inc. for data support; Murali Padmanaban, BS, from Johns Hopkins University for his assistance in linking the administrative billing data with real‐time physician orders; and Hsin‐Chieh Yeh, PhD, from the Bloomberg School of Public Health for her statistical advice and additional review. We also thank Mr. Ronald R. Peterson, President, Johns Hopkins Health System and Johns Hopkins Hospital, for providing funding support for the physician incentive payments.
Disclosures: Drs. Michtalik and Brotman had full access to all of the data in the study and take responsibility for the integrity of the data and accuracy of the data analysis. Study concept and design: Drs. Michtalik, Streiff, Finkelstein, Pronovost, and Brotman. Acquisition of data: Drs. Michtalik, Streiff, Brotman and Mr. Carolan, Mr. Lau, Mrs. Durkin. Analysis and interpretation of data: Drs. Michtalik, Haut, Streiff, Brotman and Mr. Carolan, Mr. Lau. Drafting of the manuscript: Drs. Michtalik and Brotman. Critical revision of the manuscript for important intellectual content: Drs. Michtalik, Haut, Streiff, Finkelstein, Pronovost, Brotman and Mr. Carolan, Mr. Lau, Mrs. Durkin. Statistical analysis and supervision: Drs. Michtalik and Brotman. Obtaining funding: Drs. Streiff and Brotman. Technical support: Dr. Streiff and Mr. Carolan, Mr. Lau, Mrs. Durkin
This study was supported by a National Institutes of Health grant T32 HP10025‐17‐00 (Dr. Michtalik), the National Institutes of Health/Johns Hopkins Institute for Clinical and Translational Research KL2 Award 5KL2RR025006 (Dr. Michtalik), the Agency for Healthcare Research and Quality Mentored Clinical Scientist Development K08 Awards 1K08HS017952‐01 (Dr. Haut) and 1K08HS022331‐01A1 (Dr. Michtalik), and the Johns Hopkins Hospitalist Scholars Fund. The funders had no role in the design and conduct of the study; collection, management, analysis, and interpretation of the data; preparation, review, or approval of the manuscript; and decision to submit the manuscript for publication.
Dr. Haut receives royalties from Lippincott, Williams & Wilkins. Dr. Streiff has received research funding from Portola and Bristol Myers Squibb, honoraria for CME lectures from Sanofi‐Aventis and Ortho‐McNeil, consulted for Eisai, Daiichi‐Sankyo, Boerhinger‐Ingelheim, Janssen Healthcare, and Pfizer. Mr. Lau, Drs. Haut, Streiff, and Pronovost are supported by a contract from the Patient‐Centered Outcomes Research Institute (PCORI) titled Preventing Venous Thromboembolism: Empowering Patients and Enabling Patient‐Centered Care via Health Information Technology (CE‐12‐11‐4489). Dr. Brotman has received research support from Siemens Healthcare Diagnostics, Bristol‐Myers Squibb, the Agency for Healthcare Research and Quality, Centers for Medicare & Medicaid Services, the Amerigroup Corporation, and the Guerrieri Family Foundation. He has received honoraria from the Gerson Lehrman Group, the Dunn Group, and from Quantia Communications, and received royalties from McGraw‐Hill.
- Medicare Program, Centers for Medicare 76(88):26490–26547.
- . Quality meets finance: payments at risk with value‐based purchasing, readmission, and hospital‐acquired conditions force hospitalists to focus. Hospitalist. 2013;17(1):31.
- National Quality Forum. March 2009. Safe practices for better healthcare—2009 update. Available at: http://www.qualityforum.org/Publications/2009/03/Safe_Practices_for_Better_Healthcare%E2%80%932009_Update.aspx. Accessed November 1, 2014.
- Joint Commission on Accreditation of Healthcare Organizations. Approved: more options for hospital core measures. Jt Comm Perspect. 2009;29(4):1–6.
- Centers for Medicare 208(2):227–240.
- , . Thromboprophylaxis in nonsurgical patients. Hematology Am Soc Hematol Educ Program. 2012;2012:631–637.
- , , , et al. Venous thromboembolism risk and prophylaxis in the acute hospital care setting (ENDORSE study): a multinational cross‐sectional study. Lancet. 2008;371(9610):387–394.
- , . Practices to prevent venous thromboembolism: a brief review. BMJ Qual Saf. 2014;23(3):187–195.
- , , , et al. Improving hospital venous thromboembolism prophylaxis with electronic decision support. J Hosp Med. 2013;8(3):115–120.
- , , . Innovative approaches to increase deep vein thrombosis prophylaxis rate resulting in a decrease in hospital‐acquired deep vein thrombosis at a tertiary‐care teaching hospital. J Hosp Med. 2008;3(2):148–155.
- , , , et al. Lessons from the Johns Hopkins Multi‐Disciplinary Venous Thromboembolism (VTE) Prevention Collaborative. BMJ. 2012;344:e3935.
- , , , et al. Improved prophylaxis and decreased rates of preventable harm with the use of a mandatory computerized clinical decision support tool for prophylaxis for venous thromboembolism in trauma. Arch Surg. 2012;147(10):901–907.
- , . Designing and implementing effective venous thromboembolism prevention protocols: lessons from collaborative efforts. J Thromb Thrombolysis. 2010;29(2):159–166.
- , , , et al. Impact of a venous thromboembolism prophylaxis "smart order set": improved compliance, fewer events. Am J Hematol. 2013;88(7):545–549.
- , . Improving adherence to venous thromoembolism prophylaxis using multiple interventions. BMJ. 2012;344:e3935.
- Health Resources and Services Administration of the U.S. Department of Health and Human Services. Managing data for performance improvement. Available at: http://www.hrsa.gov/quality/toolbox/methodology/performanceimprovement/part2.html. Accessed December 18, 2014.
- , . Improving patient safety by taking systems seriously. JAMA. 2008;299(4):445–447.
- , , , . Growth in the care of older patients by hospitalists in the United States. N Engl J Med. 2009;360(11):1102–1112.
- , , , et al. Prevention of venous thromboembolism: American College of Chest Physicians evidence‐based clinical practice guidelines (8th edition). Chest. 2008;133(6 suppl):381S–453S.
- . Robust locally weighted regression and smoothing scatterplots. J Am Stat Assoc. 1979;74(368):829–836.
- , . Locally weighted regression: An approach to regression analysis by local fitting. J Am Stat Assoc. 1988;83(403):596–610.
- , , , . Regression Methods in Biostatistics: Linear, Logistic, Survival, and Repeated Measures Models. 2nd ed. New York, NY: Springer; 2012.
- . Regression Modeling Strategies: With Applications to Linear Models, Logistic Regression, and Survival Analysis. New York, NY: Springer‐Verlag; 2001.
- , , , et al. Eliminating healthcare disparities via mandatory clinical decision support: the venous thromboembolism (VTE) example [published online ahead of print November 4, 2014]. Med Care. doi: 10.1097/MLR.0000000000000251.
- Joint Commission. Improving America's hospitals: the Joint Commission's annual report on quality and safety. 2012. Available at: http://www.jointcommission.org/assets/1/18/TJC_Annual_Report_2012.pdf. Accessed September 8, 2013.
- , , , et al. Hospital performance for pharmacologic venous thromboembolism prophylaxis and rate of venous thromboembolism: a cohort study. JAMA Intern Med. 2014;174(10):1577–1584.
- , , , et al. Incidence of hospital‐acquired venous thromboembolic codes in medical patients hospitalized in academic medical centers. J Hosp Med. 2014;9(4):221–225.
- , , , , . No association between hospital‐reported perioperative venous thromboembolism prophylaxis and outcome rates in publicly reported data. JAMA Surg. 2014;149(4):400–401.
- , , , , . Linking processes and outcomes: a key strategy to prevent and report harm from venous thromboembolism in surgical patients. JAMA Surg. 2013;148(3):299–300.
- , , , et al. Patterns of non‐administration of ordered doses of venous thromboembolism prophylaxis: implications for novel intervention strategies. PLoS One. 2013;8(6):e66311.
- , , , et al. Nonadministration of thromboprophylaxis in hospitalized patients with HIV: a missed opportunity for prevention? J Hosp Med. 2014;9(4):215–220.
- , , , et al. Evaluation of surveillance bias and the validity of the venous thromboembolism quality measure. JAMA. 2013;310(14):1482–1489.
- , . Surveillance bias in outcomes reporting. JAMA. 2011;305(23):2462–2463.
- . Pay for performance in health care: an international overview of initiatives. Med Care Res Rev. 2012;69(3):251–276.
The Affordable Care Act explicitly outlines improving the value of healthcare by increasing quality and decreasing costs. It emphasizes value‐based purchasing, the transparency of performance metrics, and the use of payment incentives to reward quality.[1, 2] Venous thromboembolism (VTE) prophylaxis is one of these publicly reported performance measures. The National Quality Forum recommends that each patient be evaluated on hospital admission and during their hospitalization for VTE risk level and for appropriate thromboprophylaxis to be used, if required.[3] Similarly, the Joint Commission includes appropriate VTE prophylaxis in its Core Measures.[4] Patient experience and performance metrics, including VTE prophylaxis, constitute the hospital value‐based purchasing (VBP) component of healthcare reform.[5] For a hypothetical 327‐bed hospital, an estimated $1.7 million of a hospital's inpatient payments from Medicare will be at risk from VBP alone.[2]
VTE prophylaxis is a common target of quality improvement projects. Effective, safe, and cost‐effective measures to prevent VTE exist, including pharmacologic and mechanical prophylaxis.[6, 7] Despite these measures, compliance rates are often below 50%.[8] Different interventions have been pursued to ensure appropriate VTE prophylaxis, including computerized provider order entry (CPOE), electronic alerts, mandatory VTE risk assessment and prophylaxis, and provider education campaigns.[9] Recent studies show that CPOE systems with mandatory fields can increase VTE prophylaxis rates to above 80%, yet the goal of a high reliability health system is for 100% of patients to receive recommended therapy.[10, 11, 12, 13, 14, 15] Interventions to improve prophylaxis rates that have included multiple strategies, such as computerized order sets, feedback, and education, have been the most effective, increasing compliance to above 90%.[9, 11, 16] These systems can be enhanced with additional interventions such as providing individualized provider education and feedback, understanding of work flow, and ensuring patients receive the prescribed therapies.[12] For example, a physician dashboard could be employed to provide a snapshot and historical trend of key performance indicators using graphical displays and indicators.[17]
Dashboards and pay‐for‐performance programs have been increasingly used to increase the visibility of these metrics, provide feedback, visually display benchmarks and goals, and proactively monitor for achievements and setbacks.[18] Although these strategies are often addressed at departmental (or greater) levels, applying them at the level of the individual provider may assist hospitals in reducing preventable harm and achieving safety and quality goals, especially at higher benchmarks. With their expanding role, hospitalists provide a key opportunity to lead improvement efforts and to study the impact of dashboards and pay‐for performance at the provider level to achieve VTE prophylaxis performance targets. Hospitalists are often the front‐line provider for inpatients and deliver up to 70% of inpatient general medical services.[19] The objective of our study was to evaluate the impact of providing individual provider feedback and employing a pay‐for‐performance program on baseline performance of VTE prophylaxis among hospitalists. We hypothesized that performance feedback through the use of a dashboard would increase appropriate VTE prophylaxis, and this effect would be further augmented by incorporation of a pay‐for‐performance program.
METHODS
Hospitalist Dashboard
In 2010, hospitalist program leaders met with hospital administrators to create a hospitalist dashboard that would provide regularly updated summaries of performance measures for individual hospitalists. The final set of metrics identified included appropriate VTE prophylaxis, length of stay, patients discharged per day, discharges before 3 pm, depth of coding, patient satisfaction, readmissions, communication with the primary care provider, and time to signature for discharge summaries (Figure 1A). The dashboard was introduced at a general hospitalist meeting during which its purpose, methodology, and accessibility were described; it was subsequently implemented in January 2011.
Benchmarks were established for each metric, standardized to establish a scale ranging from 1 through 9, and incorporated into the dashboard (Figure 1A). Higher scores (creating a larger geometric shape) were desirable. For the VTE prophylaxis measure, scores of 1 through 9 corresponded to <60%, 60% to 64.9%, 65% to 69.9%, 70% to 74.9%, 75% to 79.9%, 80% to 84.9%, 85% to 89.9%, 90% to 94.9%, and 95% American College of Chest Physicians (ACCP)‐compliant VTE prophylaxis, respectively.[12, 20] Each provider was able to access the aggregated dashboard (showing the group mean) and his/her individualized dashboard using an individualized login and password for the institutional portal. This portal is used during the provider's workflow, including medical record review and order entry. Both a polygonal summary graphic (Figure 1A) and trend (Figure 1B) view of the dashboard were available to the provider. A comparison of the individual provider to the hospitalist group average was displayed (Figure 1A). At monthly program meetings, the dashboard, group results, and trends were discussed.
Venous Thromboembolism Prophylaxis Compliance
Our study was performed in a tertiary academic medical center with an approximately 20‐member hospitalist group (the precise membership varied over time), whose responsibilities include, among other clinical duties, staffing a 17‐bed general medicine unit with telemetry. The scope of diagnoses and acuity of patients admitted to the hospitalist service is similar to the housestaff services. Some hospitalist faculty serve both as hospitalist and nonhospitalist general medicine service team attendings, but the comparison groups were staffed by hospitalists for <20% of the time. For admissions, all hospitalists use a standardized general medicine admission order set that is integrated into the CPOE system (Sunrise Clinical Manager; Allscripts, Chicago, IL) and completed for all admitted patients. A mandatory VTE risk screen, which includes an assessment of VTE risk factors and pharmacological prophylaxis contraindications, must be completed by the ordering physician as part of this order set (Figure 2A). The system then prompts the provider with a risk‐appropriate VTE prophylaxis recommendation that the provider may subsequently order, including mechanical prophylaxis (Figure 2B). Based on ACCP VTE prevention guidelines, risk‐appropriate prophylaxis was determined using an electronic algorithm that categorized patients into risk categories based on the presence of major VTE risk factors (Figure 2A).[12, 15, 20] If none of these were present, the provider selected No major risk factors known. Both an assessment of current use of anticoagulation and a clinically high risk of bleeding were also included (Figure 2A). If none of these were present, the provider selected No contraindications known. This algorithm is published in detail elsewhere and has been shown to not increase major bleeding episodes.[12, 15] The VTE risk assessment, but not the VTE order itself, was a mandatory field. This allowed the physician discretion to choose among various pharmacological agents and mechanical mechanisms based on patient and physician preferences.
Compliance of risk‐appropriate VTE prophylaxis was determined 24 hours after the admission order set was completed using an automated electronic query of the CPOE system. Low molecular‐weight heparin prescription was included in the compliance algorithm as acceptable prophylaxis. Prescription of pharmacological VTE prophylaxis when a contraindication was present was considered noncompliant. The metric was assigned to the attending physician who billed for the first inpatient encounter.
Pay‐for‐Performance Program
In July 2011, a pay‐for‐performance program was added to the dashboard. All full‐time and part‐time hospitalists were eligible. The financial incentive was determined according to hospital priority and funds available. The VTE prophylaxis metric was prorated by clinical effort, with a maximum of $0.50 per work relative value unit (RVU). To optimize performance, a threshold of 80% compliance had to be surpassed before any payment was made. Progressively increasing percentages of the incentive were earned as compliance increased from 80% to 100%, corresponding to dashboard scores of 6, 7, 8, and 9: <80% (scores 1 to 5)=no payment; 80% to 84.9% (score 6)=$0.125 per RVU; 85% to 89.9% (score 7)=$0.25 per RVU; 90% to 94.9% (score 8)=$0.375 per RVU; and 95% (score 9)=$0.50 per RVU (maximum incentive). Payments were accrued quarterly and paid at the end of the fiscal year as a cumulative, separate performance supplement.
Individualized physician feedback through the dashboard was continued during the pay‐for‐performance period. Average hospitalist group compliance continued to be displayed on the electronic dashboard and was explicitly reviewed at monthly hospitalist meetings.
The VTE prophylaxis order set and data collection and analyses were approved by the Johns Hopkins Medicine Institutional Review Board. The dashboard and pay‐for‐performance program were initiated by the institution as part of a proof of concept quality improvement project.
Analysis
We examined all inpatient admissions to the hospitalist unit from 2008 to 2012. We included patients admitted to and discharged from the hospitalist unit and excluded patients transferred into/out of the unit and encounters with a length of stay <24 hours. VTE prophylaxis orders were queried from the CPOE system 24 hours after the patient was admitted to determine compliance.
After allowing for a run‐in period (2008), we analyzed the change in percent compliance for 3 periods: (1) CPOE‐based VTE order set alone (baseline [BASE], January 2009 to December 2010); (2) group and individual physician feedback using the dashboard (dashboard only [DASH], January to June 2011); and (3) dashboard tied to the pay‐for‐performance program (dashboard with pay‐for‐performance [P4P], July 2011 to December 2012). The CPOE‐based VTE order set was used during all 3 periods. We used the other medical services as a control to ensure that there were no temporal trends toward improved prophylaxis on a service without the intervention. VTE prophylaxis compliance was examined by calculating percent compliance using the same algorithm for the 4 resident‐staffed general medicine service teams at our institution, which utilized the same CPOE system but did not receive the dashboard or pay‐for‐performance interventions. We used locally weighted scatterplot smoothing, a locally weighted regression of percent compliance over time, to graphically display changes in group compliance over time.[21, 22]
We also performed linear regression to assess the rate of change in group compliance and included spline terms that allowed slope to vary for each of the 3 time periods.[23, 24] Clustered analysis accounted for potentially correlated serial measurements of compliance for an individual provider. A separate analysis examined the effect of provider turnover and individual provider improvement during each of the 3 periods. Tests of significance were 2‐sided, with an level of 0.05. Statistical analysis was performed using Stata 12.1 (StataCorp LP, College Station, TX).
RESULTS
Venous Thromboembolism Prophylaxis Compliance
We analyzed 3144 inpatient admissions by 38 hospitalists from 2009 to 2012. The 5 most frequent coded diagnoses were heart failure, acute kidney failure, syncope, pneumonia, and chest pain. Patients had a median length of stay of 3 days [interquartile range: 26]. During the dashboard‐only period, on average, providers improved in compliance by 4% (95% confidence interval [CI]: 35; P<0.001). With the addition of the pay‐for‐performance program, providers improved by an additional 4% (95% CI: 35; P<0.001). Group compliance significantly improved from 86% (95% CI: 8588) during the BASE period of the CPOE‐based VTE order set to 90% (95% CI: 8893) during the DASH period (P=0.01) and 94% (95% CI: 9396) during the subsequent P4P program (P=0.01) (Figure 3). Both inappropriate prophylaxis and lack of prophylaxis, when indicated, resulted in a non‐compliance rating. During the 3 periods, inappropriate prophylaxis decreased from 7.9% to 6.2% to 2.6% during the BASE, DASH, and subsequent P4P periods, respectively. Similarly, lack of prophylaxis when indicated decreased from 6.1% to 3.2% to 3.1% during the BASE, DASH, and subsequent P4P periods, respectively.
The average compliance of the 4 non‐hospitalist general medicine service teams was initially higher than that of the hospitalist service during the CPOE‐based VTE order set (90%) and DASH (92%) periods, but subsequently plateaued and was exceeded by the hospitalist service during the combined P4P (92%) period (Figure 3). However, there was no statistically significant difference between the general medicine service teams and hospitalist service during the DASH (P=0.15) and subsequent P4P (P=0.76) periods.
We also analyzed the rate of VTE prophylaxis compliance improvement (slope) with cut points at each time period transition (Figure 3). Risk‐appropriate VTE prophylaxis during the BASE period did not exhibit significant improvement as indicated by the slope (P=0.23) (Figure 3). In contrast, during the DASH period, VTE prophylaxis compliance significantly increased by 1.58% per month (95% CI: 0.41‐2.76; P=0.01). The addition of the P4P program, however, did not further significantly increase the rate of compliance (P=0.78).
A subgroup analysis restricted to the 19 providers present during all 3 periods was performed to assess for potential confounding from physician turnover. The percent compliance increased in a similar fashion: BASE period of CPOE‐based VTE order set, 85% (95% CI: 8386); DASH, 90% (95% CI: 8893); and P4P, 94% (95% CI: 9296).
Pay‐for‐Performance Program
Nineteen providers met the threshold for pay‐for‐performance (80% appropriate VTE prophylaxis), with 9 providers in the intermediate categories (80%94.9%) and 10 in the full incentive category (95%). The mean individual payout for the incentive was $633 (standard deviation 350), with a total disbursement of $12,029. The majority of payments (17 of 19) were under $1000.
DISCUSSION
A key component of healthcare reform has been value‐based purchasing, which emphasizes extrinsic motivation through the transparency of performance metrics and use of payment incentives to reward quality. Our study evaluates the impact of both extrinsic (payments) and intrinsic (professionalism and peer norms) motivation. It specifically attributed an individual performance metric, VTE prophylaxis, to an attending physician, provided both individualized and group feedback using an electronic dashboard, and incorporated a pay‐for‐performance program. Prescription of risk‐appropriate VTE prophylaxis significantly increased with the implementation of the dashboard and subsequent pay‐for performance program. The fastest rate of improvement occurred after the addition of the dashboard. Sensitivity analyses for provider turnover and comparisons to the general medicine services showed our results to be independent of a general trend of improvement, both at the provider and institutional levels.
Our prior studies demonstrated that order sets significantly improve performance, from a baseline compliance of risk‐appropriate VTE prophylaxis of 66% to 84%.[13, 15, 25] In the current study, compliance was relatively flat during the BASE period, which included these order sets. The greatest rate of continued improvement in compliance occurred during the DASH period, emphasizing both the importance of provider feedback and receptivity and adaptability in the prescribing behavior of hospitalists. Because the goal of a high‐reliability health system is for 100% of patients to receive recommended therapy, multiple approaches are necessary for success.
Nationally, benchmarks for performance measures continue to be raised, with the highest performers achieving above 95%.[26] Additional interventions, such as dashboards and pay‐for‐performance programs, supplement CPOE systems to achieve high reliability. In our study, the compliance rate during the baseline period, which included a CPOE‐based, clinical support‐enabled VTE order set, was 86%. Initially the compliance of the general medicine teams with residents exceeded that of the hospitalist attending teams, which may reflect a greater willingness of resident teams to comply with order sets and automated recommendations. This emphasizes the importance of continuous individual feedback and provider education at the attending physician level to enhance both guideline compliance and decrease provider care variation. Ultimately, with the addition of the dashboard and subsequent pay‐for‐performance program, compliance was increased to 90% and 94%, respectively. Although the major mechanism used by policymakers to improve quality of care is extrinsic motivation, this study demonstrates that intrinsic motivation through peer norms can enhance extrinsic efforts and may be more influential. Both of these programs, dashboards and pay‐for‐performance, may ultimately assist institutions in changing provider behavior and achieving these harder‐to‐achieve higher benchmarks.
We recognize that there are several limitations to our study. First, this is a single‐site program limited to an attending‐physician‐only service. There was strong data support and a defined CPOE algorithm for this initiative. Multi‐site studies will need to overcome the additional challenges of varying service structures and electronic medical record and provider order entry systems. Second, it is difficult to show actual changes in VTE events over time with appropriate prophylaxis. Although VTE prophylaxis is recommended for patients with VTE risk factors, there are conflicting findings about whether prophylaxis prevents VTE events in lower‐risk patients, and current studies suggest that most patients with VTE events are severely ill and develop VTE despite receiving prophylaxis.[27, 28, 29] Our study was underpowered to detect these potential differences in VTE rates, and although the algorithm has been shown to not increase bleeding rates, we did not measure bleeding rates during this study.[12, 15] Our institutional experience suggests that the majority of VTE events occur despite appropriate prophylaxis.[30] Also, VTE prophylaxis may be ordered, but intervening events, such as procedures and changes in risk status or patient refusal, may prevent patients from receiving appropriate prophylaxis.[31, 32] Similarly, hospitals with higher quality scores have higher VTE prophylaxis rates but worse risk‐adjusted VTE rates, which may result from increased surveillance for VTE, suggesting surveillance bias limits the usefulness of the VTE quality measure.[33, 34] Nevertheless, VTE prophylaxis remains a publicly reported Core Measure tied to financial incentives.[4, 5] Third, there may be an unmeasured factor specific to the hospitalist program, which could potentially account for an overall improvement in quality of care. Although the rate of increase in appropriate prophylaxis was not statistically significant during the baseline period, there did appear to be some improvement in prophylaxis toward the end of the period. However, there were no other VTE‐related provider feedback programs being simultaneously pursued during this study. VTE prophylaxis for the non‐hospitalist services showed a relatively stable, non‐increasing compliance rate for the general medical services. Although it was possible for successful residents to age into the hospitalist service, thereby improving rates of prophylaxis based on changes in group makeup, our subgroup analysis of the providers present throughout all phases of the study showed our results to be robust. Similarly, there may have been a cross‐contamination effect of hospitalist faculty who attended on both hospitalist and non‐hospitalist general medicine service teams. This, however, would attenuate any impact of the programs, and thus the effects may in fact be greater than reported. Fourth, establishment of both the dashboard and pay‐for‐performance program required significant institutional and program leadership and resources. To be successful, the dashboard must be in the provider's workflow, transparent, minimize reporter burden, use existing systems, and be actively fed back to providers, ideally those directly entering orders. Our greatest rate of improvement occurred during the feedback‐only phase of this study, emphasizing the importance of physician feedback, provider‐level accountability, and engagement. We suspect that the relatively modest pay‐for‐performance incentive served mainly as a means of engaging providers in self‐monitoring, rather than as a means to change behavior through true incentivization. Although we did not track individual physician views of the dashboard, we reinforced trends, deviations, and expectations at regularly scheduled meetings and provided feedback and patient‐level data to individual providers. Fifth, the design of the pay‐for‐performance program may have also influenced its effectiveness. These types of programs may be more effective when they provide frequent visible, small payments rather than one large payment, and when the payment is framed as a loss rather than a gain.[35] Finally, physician champions and consistent feedback through departmental meetings or visual displays may be required for program success. The initial resources to create the dashboard, continued maintenance and monitoring of performance, and payment of financial incentives all require institutional commitment. A partnership of physicians, program leaders, and institutional administrators is necessary for both initial and continued success.
To achieve performance goals and benchmarks, multiple strategies that combine extrinsic and intrinsic motivation are necessary. As shown by our study, the use of a dashboard and pay‐for‐performance can be tailored to an institution's goals, in line with national standards. The specific goal (risk‐appropriate VTE prophylaxis) and benchmarks (80%, 85%, 90%, 95%) can be individualized to a particular institution. For example, if readmission rates are above target, readmissions could be added as a dashboard metric. The specific benchmark would be determined by historical trends and administrative targets. Similarly, the overall financial incentives could be adjusted based on the financial resources available. Other process measures, such as influenza vaccination screening and administration, could also be targeted. For all of these objectives, continued provider feedback and engagement are critical for progressive success, especially to decrease variability in care at the attending physician level. Incorporating the value‐based purchasing philosophy from the Affordable Care Act, our study suggests that the combination of standardized order sets, real‐time dashboards, and physician‐level incentives may assist hospitals in achieving quality and safety benchmarks, especially at higher targets.
Acknowledgements
The authors thank Meir Gottlieb, BS, from Salar Inc. for data support; Murali Padmanaban, BS, from Johns Hopkins University for his assistance in linking the administrative billing data with real‐time physician orders; and Hsin‐Chieh Yeh, PhD, from the Bloomberg School of Public Health for her statistical advice and additional review. We also thank Mr. Ronald R. Peterson, President, Johns Hopkins Health System and Johns Hopkins Hospital, for providing funding support for the physician incentive payments.
Disclosures: Drs. Michtalik and Brotman had full access to all of the data in the study and take responsibility for the integrity of the data and accuracy of the data analysis. Study concept and design: Drs. Michtalik, Streiff, Finkelstein, Pronovost, and Brotman. Acquisition of data: Drs. Michtalik, Streiff, Brotman and Mr. Carolan, Mr. Lau, Mrs. Durkin. Analysis and interpretation of data: Drs. Michtalik, Haut, Streiff, Brotman and Mr. Carolan, Mr. Lau. Drafting of the manuscript: Drs. Michtalik and Brotman. Critical revision of the manuscript for important intellectual content: Drs. Michtalik, Haut, Streiff, Finkelstein, Pronovost, Brotman and Mr. Carolan, Mr. Lau, Mrs. Durkin. Statistical analysis and supervision: Drs. Michtalik and Brotman. Obtaining funding: Drs. Streiff and Brotman. Technical support: Dr. Streiff and Mr. Carolan, Mr. Lau, Mrs. Durkin
This study was supported by a National Institutes of Health grant T32 HP10025‐17‐00 (Dr. Michtalik), the National Institutes of Health/Johns Hopkins Institute for Clinical and Translational Research KL2 Award 5KL2RR025006 (Dr. Michtalik), the Agency for Healthcare Research and Quality Mentored Clinical Scientist Development K08 Awards 1K08HS017952‐01 (Dr. Haut) and 1K08HS022331‐01A1 (Dr. Michtalik), and the Johns Hopkins Hospitalist Scholars Fund. The funders had no role in the design and conduct of the study; collection, management, analysis, and interpretation of the data; preparation, review, or approval of the manuscript; and decision to submit the manuscript for publication.
Dr. Haut receives royalties from Lippincott, Williams & Wilkins. Dr. Streiff has received research funding from Portola and Bristol Myers Squibb, honoraria for CME lectures from Sanofi‐Aventis and Ortho‐McNeil, consulted for Eisai, Daiichi‐Sankyo, Boerhinger‐Ingelheim, Janssen Healthcare, and Pfizer. Mr. Lau, Drs. Haut, Streiff, and Pronovost are supported by a contract from the Patient‐Centered Outcomes Research Institute (PCORI) titled Preventing Venous Thromboembolism: Empowering Patients and Enabling Patient‐Centered Care via Health Information Technology (CE‐12‐11‐4489). Dr. Brotman has received research support from Siemens Healthcare Diagnostics, Bristol‐Myers Squibb, the Agency for Healthcare Research and Quality, Centers for Medicare & Medicaid Services, the Amerigroup Corporation, and the Guerrieri Family Foundation. He has received honoraria from the Gerson Lehrman Group, the Dunn Group, and from Quantia Communications, and received royalties from McGraw‐Hill.
The Affordable Care Act explicitly outlines improving the value of healthcare by increasing quality and decreasing costs. It emphasizes value‐based purchasing, the transparency of performance metrics, and the use of payment incentives to reward quality.[1, 2] Venous thromboembolism (VTE) prophylaxis is one of these publicly reported performance measures. The National Quality Forum recommends that each patient be evaluated on hospital admission and during their hospitalization for VTE risk level and for appropriate thromboprophylaxis to be used, if required.[3] Similarly, the Joint Commission includes appropriate VTE prophylaxis in its Core Measures.[4] Patient experience and performance metrics, including VTE prophylaxis, constitute the hospital value‐based purchasing (VBP) component of healthcare reform.[5] For a hypothetical 327‐bed hospital, an estimated $1.7 million of a hospital's inpatient payments from Medicare will be at risk from VBP alone.[2]
VTE prophylaxis is a common target of quality improvement projects. Effective, safe, and cost‐effective measures to prevent VTE exist, including pharmacologic and mechanical prophylaxis.[6, 7] Despite these measures, compliance rates are often below 50%.[8] Different interventions have been pursued to ensure appropriate VTE prophylaxis, including computerized provider order entry (CPOE), electronic alerts, mandatory VTE risk assessment and prophylaxis, and provider education campaigns.[9] Recent studies show that CPOE systems with mandatory fields can increase VTE prophylaxis rates to above 80%, yet the goal of a high reliability health system is for 100% of patients to receive recommended therapy.[10, 11, 12, 13, 14, 15] Interventions to improve prophylaxis rates that have included multiple strategies, such as computerized order sets, feedback, and education, have been the most effective, increasing compliance to above 90%.[9, 11, 16] These systems can be enhanced with additional interventions such as providing individualized provider education and feedback, understanding of work flow, and ensuring patients receive the prescribed therapies.[12] For example, a physician dashboard could be employed to provide a snapshot and historical trend of key performance indicators using graphical displays and indicators.[17]
Dashboards and pay‐for‐performance programs have been increasingly used to increase the visibility of these metrics, provide feedback, visually display benchmarks and goals, and proactively monitor for achievements and setbacks.[18] Although these strategies are often addressed at departmental (or greater) levels, applying them at the level of the individual provider may assist hospitals in reducing preventable harm and achieving safety and quality goals, especially at higher benchmarks. With their expanding role, hospitalists provide a key opportunity to lead improvement efforts and to study the impact of dashboards and pay‐for performance at the provider level to achieve VTE prophylaxis performance targets. Hospitalists are often the front‐line provider for inpatients and deliver up to 70% of inpatient general medical services.[19] The objective of our study was to evaluate the impact of providing individual provider feedback and employing a pay‐for‐performance program on baseline performance of VTE prophylaxis among hospitalists. We hypothesized that performance feedback through the use of a dashboard would increase appropriate VTE prophylaxis, and this effect would be further augmented by incorporation of a pay‐for‐performance program.
METHODS
Hospitalist Dashboard
In 2010, hospitalist program leaders met with hospital administrators to create a hospitalist dashboard that would provide regularly updated summaries of performance measures for individual hospitalists. The final set of metrics identified included appropriate VTE prophylaxis, length of stay, patients discharged per day, discharges before 3 pm, depth of coding, patient satisfaction, readmissions, communication with the primary care provider, and time to signature for discharge summaries (Figure 1A). The dashboard was introduced at a general hospitalist meeting during which its purpose, methodology, and accessibility were described; it was subsequently implemented in January 2011.
Benchmarks were established for each metric, standardized to establish a scale ranging from 1 through 9, and incorporated into the dashboard (Figure 1A). Higher scores (creating a larger geometric shape) were desirable. For the VTE prophylaxis measure, scores of 1 through 9 corresponded to <60%, 60% to 64.9%, 65% to 69.9%, 70% to 74.9%, 75% to 79.9%, 80% to 84.9%, 85% to 89.9%, 90% to 94.9%, and 95% American College of Chest Physicians (ACCP)‐compliant VTE prophylaxis, respectively.[12, 20] Each provider was able to access the aggregated dashboard (showing the group mean) and his/her individualized dashboard using an individualized login and password for the institutional portal. This portal is used during the provider's workflow, including medical record review and order entry. Both a polygonal summary graphic (Figure 1A) and trend (Figure 1B) view of the dashboard were available to the provider. A comparison of the individual provider to the hospitalist group average was displayed (Figure 1A). At monthly program meetings, the dashboard, group results, and trends were discussed.
Venous Thromboembolism Prophylaxis Compliance
Our study was performed in a tertiary academic medical center with an approximately 20‐member hospitalist group (the precise membership varied over time), whose responsibilities include, among other clinical duties, staffing a 17‐bed general medicine unit with telemetry. The scope of diagnoses and acuity of patients admitted to the hospitalist service is similar to the housestaff services. Some hospitalist faculty serve both as hospitalist and nonhospitalist general medicine service team attendings, but the comparison groups were staffed by hospitalists for <20% of the time. For admissions, all hospitalists use a standardized general medicine admission order set that is integrated into the CPOE system (Sunrise Clinical Manager; Allscripts, Chicago, IL) and completed for all admitted patients. A mandatory VTE risk screen, which includes an assessment of VTE risk factors and pharmacological prophylaxis contraindications, must be completed by the ordering physician as part of this order set (Figure 2A). The system then prompts the provider with a risk‐appropriate VTE prophylaxis recommendation that the provider may subsequently order, including mechanical prophylaxis (Figure 2B). Based on ACCP VTE prevention guidelines, risk‐appropriate prophylaxis was determined using an electronic algorithm that categorized patients into risk categories based on the presence of major VTE risk factors (Figure 2A).[12, 15, 20] If none of these were present, the provider selected No major risk factors known. Both an assessment of current use of anticoagulation and a clinically high risk of bleeding were also included (Figure 2A). If none of these were present, the provider selected No contraindications known. This algorithm is published in detail elsewhere and has been shown to not increase major bleeding episodes.[12, 15] The VTE risk assessment, but not the VTE order itself, was a mandatory field. This allowed the physician discretion to choose among various pharmacological agents and mechanical mechanisms based on patient and physician preferences.
Compliance of risk‐appropriate VTE prophylaxis was determined 24 hours after the admission order set was completed using an automated electronic query of the CPOE system. Low molecular‐weight heparin prescription was included in the compliance algorithm as acceptable prophylaxis. Prescription of pharmacological VTE prophylaxis when a contraindication was present was considered noncompliant. The metric was assigned to the attending physician who billed for the first inpatient encounter.
Pay‐for‐Performance Program
In July 2011, a pay‐for‐performance program was added to the dashboard. All full‐time and part‐time hospitalists were eligible. The financial incentive was determined according to hospital priority and funds available. The VTE prophylaxis metric was prorated by clinical effort, with a maximum of $0.50 per work relative value unit (RVU). To optimize performance, a threshold of 80% compliance had to be surpassed before any payment was made. Progressively increasing percentages of the incentive were earned as compliance increased from 80% to 100%, corresponding to dashboard scores of 6, 7, 8, and 9: <80% (scores 1 to 5)=no payment; 80% to 84.9% (score 6)=$0.125 per RVU; 85% to 89.9% (score 7)=$0.25 per RVU; 90% to 94.9% (score 8)=$0.375 per RVU; and 95% (score 9)=$0.50 per RVU (maximum incentive). Payments were accrued quarterly and paid at the end of the fiscal year as a cumulative, separate performance supplement.
Individualized physician feedback through the dashboard was continued during the pay‐for‐performance period. Average hospitalist group compliance continued to be displayed on the electronic dashboard and was explicitly reviewed at monthly hospitalist meetings.
The VTE prophylaxis order set and data collection and analyses were approved by the Johns Hopkins Medicine Institutional Review Board. The dashboard and pay‐for‐performance program were initiated by the institution as part of a proof of concept quality improvement project.
Analysis
We examined all inpatient admissions to the hospitalist unit from 2008 to 2012. We included patients admitted to and discharged from the hospitalist unit and excluded patients transferred into/out of the unit and encounters with a length of stay <24 hours. VTE prophylaxis orders were queried from the CPOE system 24 hours after the patient was admitted to determine compliance.
After allowing for a run‐in period (2008), we analyzed the change in percent compliance for 3 periods: (1) CPOE‐based VTE order set alone (baseline [BASE], January 2009 to December 2010); (2) group and individual physician feedback using the dashboard (dashboard only [DASH], January to June 2011); and (3) dashboard tied to the pay‐for‐performance program (dashboard with pay‐for‐performance [P4P], July 2011 to December 2012). The CPOE‐based VTE order set was used during all 3 periods. We used the other medical services as a control to ensure that there were no temporal trends toward improved prophylaxis on a service without the intervention. VTE prophylaxis compliance was examined by calculating percent compliance using the same algorithm for the 4 resident‐staffed general medicine service teams at our institution, which utilized the same CPOE system but did not receive the dashboard or pay‐for‐performance interventions. We used locally weighted scatterplot smoothing, a locally weighted regression of percent compliance over time, to graphically display changes in group compliance over time.[21, 22]
We also performed linear regression to assess the rate of change in group compliance and included spline terms that allowed slope to vary for each of the 3 time periods.[23, 24] Clustered analysis accounted for potentially correlated serial measurements of compliance for an individual provider. A separate analysis examined the effect of provider turnover and individual provider improvement during each of the 3 periods. Tests of significance were 2‐sided, with an level of 0.05. Statistical analysis was performed using Stata 12.1 (StataCorp LP, College Station, TX).
RESULTS
Venous Thromboembolism Prophylaxis Compliance
We analyzed 3144 inpatient admissions by 38 hospitalists from 2009 to 2012. The 5 most frequent coded diagnoses were heart failure, acute kidney failure, syncope, pneumonia, and chest pain. Patients had a median length of stay of 3 days [interquartile range: 26]. During the dashboard‐only period, on average, providers improved in compliance by 4% (95% confidence interval [CI]: 35; P<0.001). With the addition of the pay‐for‐performance program, providers improved by an additional 4% (95% CI: 35; P<0.001). Group compliance significantly improved from 86% (95% CI: 8588) during the BASE period of the CPOE‐based VTE order set to 90% (95% CI: 8893) during the DASH period (P=0.01) and 94% (95% CI: 9396) during the subsequent P4P program (P=0.01) (Figure 3). Both inappropriate prophylaxis and lack of prophylaxis, when indicated, resulted in a non‐compliance rating. During the 3 periods, inappropriate prophylaxis decreased from 7.9% to 6.2% to 2.6% during the BASE, DASH, and subsequent P4P periods, respectively. Similarly, lack of prophylaxis when indicated decreased from 6.1% to 3.2% to 3.1% during the BASE, DASH, and subsequent P4P periods, respectively.
The average compliance of the 4 non‐hospitalist general medicine service teams was initially higher than that of the hospitalist service during the CPOE‐based VTE order set (90%) and DASH (92%) periods, but subsequently plateaued and was exceeded by the hospitalist service during the combined P4P (92%) period (Figure 3). However, there was no statistically significant difference between the general medicine service teams and hospitalist service during the DASH (P=0.15) and subsequent P4P (P=0.76) periods.
We also analyzed the rate of VTE prophylaxis compliance improvement (slope) with cut points at each time period transition (Figure 3). Risk‐appropriate VTE prophylaxis during the BASE period did not exhibit significant improvement as indicated by the slope (P=0.23) (Figure 3). In contrast, during the DASH period, VTE prophylaxis compliance significantly increased by 1.58% per month (95% CI: 0.41‐2.76; P=0.01). The addition of the P4P program, however, did not further significantly increase the rate of compliance (P=0.78).
A subgroup analysis restricted to the 19 providers present during all 3 periods was performed to assess for potential confounding from physician turnover. The percent compliance increased in a similar fashion: BASE period of CPOE‐based VTE order set, 85% (95% CI: 8386); DASH, 90% (95% CI: 8893); and P4P, 94% (95% CI: 9296).
Pay‐for‐Performance Program
Nineteen providers met the threshold for pay‐for‐performance (80% appropriate VTE prophylaxis), with 9 providers in the intermediate categories (80%94.9%) and 10 in the full incentive category (95%). The mean individual payout for the incentive was $633 (standard deviation 350), with a total disbursement of $12,029. The majority of payments (17 of 19) were under $1000.
DISCUSSION
A key component of healthcare reform has been value‐based purchasing, which emphasizes extrinsic motivation through the transparency of performance metrics and use of payment incentives to reward quality. Our study evaluates the impact of both extrinsic (payments) and intrinsic (professionalism and peer norms) motivation. It specifically attributed an individual performance metric, VTE prophylaxis, to an attending physician, provided both individualized and group feedback using an electronic dashboard, and incorporated a pay‐for‐performance program. Prescription of risk‐appropriate VTE prophylaxis significantly increased with the implementation of the dashboard and subsequent pay‐for performance program. The fastest rate of improvement occurred after the addition of the dashboard. Sensitivity analyses for provider turnover and comparisons to the general medicine services showed our results to be independent of a general trend of improvement, both at the provider and institutional levels.
Our prior studies demonstrated that order sets significantly improve performance, from a baseline compliance of risk‐appropriate VTE prophylaxis of 66% to 84%.[13, 15, 25] In the current study, compliance was relatively flat during the BASE period, which included these order sets. The greatest rate of continued improvement in compliance occurred during the DASH period, emphasizing both the importance of provider feedback and receptivity and adaptability in the prescribing behavior of hospitalists. Because the goal of a high‐reliability health system is for 100% of patients to receive recommended therapy, multiple approaches are necessary for success.
Nationally, benchmarks for performance measures continue to be raised, with the highest performers achieving above 95%.[26] Additional interventions, such as dashboards and pay‐for‐performance programs, supplement CPOE systems to achieve high reliability. In our study, the compliance rate during the baseline period, which included a CPOE‐based, clinical support‐enabled VTE order set, was 86%. Initially the compliance of the general medicine teams with residents exceeded that of the hospitalist attending teams, which may reflect a greater willingness of resident teams to comply with order sets and automated recommendations. This emphasizes the importance of continuous individual feedback and provider education at the attending physician level to enhance both guideline compliance and decrease provider care variation. Ultimately, with the addition of the dashboard and subsequent pay‐for‐performance program, compliance was increased to 90% and 94%, respectively. Although the major mechanism used by policymakers to improve quality of care is extrinsic motivation, this study demonstrates that intrinsic motivation through peer norms can enhance extrinsic efforts and may be more influential. Both of these programs, dashboards and pay‐for‐performance, may ultimately assist institutions in changing provider behavior and achieving these harder‐to‐achieve higher benchmarks.
We recognize that there are several limitations to our study. First, this is a single‐site program limited to an attending‐physician‐only service. There was strong data support and a defined CPOE algorithm for this initiative. Multi‐site studies will need to overcome the additional challenges of varying service structures and electronic medical record and provider order entry systems. Second, it is difficult to show actual changes in VTE events over time with appropriate prophylaxis. Although VTE prophylaxis is recommended for patients with VTE risk factors, there are conflicting findings about whether prophylaxis prevents VTE events in lower‐risk patients, and current studies suggest that most patients with VTE events are severely ill and develop VTE despite receiving prophylaxis.[27, 28, 29] Our study was underpowered to detect these potential differences in VTE rates, and although the algorithm has been shown to not increase bleeding rates, we did not measure bleeding rates during this study.[12, 15] Our institutional experience suggests that the majority of VTE events occur despite appropriate prophylaxis.[30] Also, VTE prophylaxis may be ordered, but intervening events, such as procedures and changes in risk status or patient refusal, may prevent patients from receiving appropriate prophylaxis.[31, 32] Similarly, hospitals with higher quality scores have higher VTE prophylaxis rates but worse risk‐adjusted VTE rates, which may result from increased surveillance for VTE, suggesting surveillance bias limits the usefulness of the VTE quality measure.[33, 34] Nevertheless, VTE prophylaxis remains a publicly reported Core Measure tied to financial incentives.[4, 5] Third, there may be an unmeasured factor specific to the hospitalist program, which could potentially account for an overall improvement in quality of care. Although the rate of increase in appropriate prophylaxis was not statistically significant during the baseline period, there did appear to be some improvement in prophylaxis toward the end of the period. However, there were no other VTE‐related provider feedback programs being simultaneously pursued during this study. VTE prophylaxis for the non‐hospitalist services showed a relatively stable, non‐increasing compliance rate for the general medical services. Although it was possible for successful residents to age into the hospitalist service, thereby improving rates of prophylaxis based on changes in group makeup, our subgroup analysis of the providers present throughout all phases of the study showed our results to be robust. Similarly, there may have been a cross‐contamination effect of hospitalist faculty who attended on both hospitalist and non‐hospitalist general medicine service teams. This, however, would attenuate any impact of the programs, and thus the effects may in fact be greater than reported. Fourth, establishment of both the dashboard and pay‐for‐performance program required significant institutional and program leadership and resources. To be successful, the dashboard must be in the provider's workflow, transparent, minimize reporter burden, use existing systems, and be actively fed back to providers, ideally those directly entering orders. Our greatest rate of improvement occurred during the feedback‐only phase of this study, emphasizing the importance of physician feedback, provider‐level accountability, and engagement. We suspect that the relatively modest pay‐for‐performance incentive served mainly as a means of engaging providers in self‐monitoring, rather than as a means to change behavior through true incentivization. Although we did not track individual physician views of the dashboard, we reinforced trends, deviations, and expectations at regularly scheduled meetings and provided feedback and patient‐level data to individual providers. Fifth, the design of the pay‐for‐performance program may have also influenced its effectiveness. These types of programs may be more effective when they provide frequent visible, small payments rather than one large payment, and when the payment is framed as a loss rather than a gain.[35] Finally, physician champions and consistent feedback through departmental meetings or visual displays may be required for program success. The initial resources to create the dashboard, continued maintenance and monitoring of performance, and payment of financial incentives all require institutional commitment. A partnership of physicians, program leaders, and institutional administrators is necessary for both initial and continued success.
To achieve performance goals and benchmarks, multiple strategies that combine extrinsic and intrinsic motivation are necessary. As shown by our study, the use of a dashboard and pay‐for‐performance can be tailored to an institution's goals, in line with national standards. The specific goal (risk‐appropriate VTE prophylaxis) and benchmarks (80%, 85%, 90%, 95%) can be individualized to a particular institution. For example, if readmission rates are above target, readmissions could be added as a dashboard metric. The specific benchmark would be determined by historical trends and administrative targets. Similarly, the overall financial incentives could be adjusted based on the financial resources available. Other process measures, such as influenza vaccination screening and administration, could also be targeted. For all of these objectives, continued provider feedback and engagement are critical for progressive success, especially to decrease variability in care at the attending physician level. Incorporating the value‐based purchasing philosophy from the Affordable Care Act, our study suggests that the combination of standardized order sets, real‐time dashboards, and physician‐level incentives may assist hospitals in achieving quality and safety benchmarks, especially at higher targets.
Acknowledgements
The authors thank Meir Gottlieb, BS, from Salar Inc. for data support; Murali Padmanaban, BS, from Johns Hopkins University for his assistance in linking the administrative billing data with real‐time physician orders; and Hsin‐Chieh Yeh, PhD, from the Bloomberg School of Public Health for her statistical advice and additional review. We also thank Mr. Ronald R. Peterson, President, Johns Hopkins Health System and Johns Hopkins Hospital, for providing funding support for the physician incentive payments.
Disclosures: Drs. Michtalik and Brotman had full access to all of the data in the study and take responsibility for the integrity of the data and accuracy of the data analysis. Study concept and design: Drs. Michtalik, Streiff, Finkelstein, Pronovost, and Brotman. Acquisition of data: Drs. Michtalik, Streiff, Brotman and Mr. Carolan, Mr. Lau, Mrs. Durkin. Analysis and interpretation of data: Drs. Michtalik, Haut, Streiff, Brotman and Mr. Carolan, Mr. Lau. Drafting of the manuscript: Drs. Michtalik and Brotman. Critical revision of the manuscript for important intellectual content: Drs. Michtalik, Haut, Streiff, Finkelstein, Pronovost, Brotman and Mr. Carolan, Mr. Lau, Mrs. Durkin. Statistical analysis and supervision: Drs. Michtalik and Brotman. Obtaining funding: Drs. Streiff and Brotman. Technical support: Dr. Streiff and Mr. Carolan, Mr. Lau, Mrs. Durkin
This study was supported by a National Institutes of Health grant T32 HP10025‐17‐00 (Dr. Michtalik), the National Institutes of Health/Johns Hopkins Institute for Clinical and Translational Research KL2 Award 5KL2RR025006 (Dr. Michtalik), the Agency for Healthcare Research and Quality Mentored Clinical Scientist Development K08 Awards 1K08HS017952‐01 (Dr. Haut) and 1K08HS022331‐01A1 (Dr. Michtalik), and the Johns Hopkins Hospitalist Scholars Fund. The funders had no role in the design and conduct of the study; collection, management, analysis, and interpretation of the data; preparation, review, or approval of the manuscript; and decision to submit the manuscript for publication.
Dr. Haut receives royalties from Lippincott, Williams & Wilkins. Dr. Streiff has received research funding from Portola and Bristol Myers Squibb, honoraria for CME lectures from Sanofi‐Aventis and Ortho‐McNeil, consulted for Eisai, Daiichi‐Sankyo, Boerhinger‐Ingelheim, Janssen Healthcare, and Pfizer. Mr. Lau, Drs. Haut, Streiff, and Pronovost are supported by a contract from the Patient‐Centered Outcomes Research Institute (PCORI) titled Preventing Venous Thromboembolism: Empowering Patients and Enabling Patient‐Centered Care via Health Information Technology (CE‐12‐11‐4489). Dr. Brotman has received research support from Siemens Healthcare Diagnostics, Bristol‐Myers Squibb, the Agency for Healthcare Research and Quality, Centers for Medicare & Medicaid Services, the Amerigroup Corporation, and the Guerrieri Family Foundation. He has received honoraria from the Gerson Lehrman Group, the Dunn Group, and from Quantia Communications, and received royalties from McGraw‐Hill.
- Medicare Program, Centers for Medicare 76(88):26490–26547.
- . Quality meets finance: payments at risk with value‐based purchasing, readmission, and hospital‐acquired conditions force hospitalists to focus. Hospitalist. 2013;17(1):31.
- National Quality Forum. March 2009. Safe practices for better healthcare—2009 update. Available at: http://www.qualityforum.org/Publications/2009/03/Safe_Practices_for_Better_Healthcare%E2%80%932009_Update.aspx. Accessed November 1, 2014.
- Joint Commission on Accreditation of Healthcare Organizations. Approved: more options for hospital core measures. Jt Comm Perspect. 2009;29(4):1–6.
- Centers for Medicare 208(2):227–240.
- , . Thromboprophylaxis in nonsurgical patients. Hematology Am Soc Hematol Educ Program. 2012;2012:631–637.
- , , , et al. Venous thromboembolism risk and prophylaxis in the acute hospital care setting (ENDORSE study): a multinational cross‐sectional study. Lancet. 2008;371(9610):387–394.
- , . Practices to prevent venous thromboembolism: a brief review. BMJ Qual Saf. 2014;23(3):187–195.
- , , , et al. Improving hospital venous thromboembolism prophylaxis with electronic decision support. J Hosp Med. 2013;8(3):115–120.
- , , . Innovative approaches to increase deep vein thrombosis prophylaxis rate resulting in a decrease in hospital‐acquired deep vein thrombosis at a tertiary‐care teaching hospital. J Hosp Med. 2008;3(2):148–155.
- , , , et al. Lessons from the Johns Hopkins Multi‐Disciplinary Venous Thromboembolism (VTE) Prevention Collaborative. BMJ. 2012;344:e3935.
- , , , et al. Improved prophylaxis and decreased rates of preventable harm with the use of a mandatory computerized clinical decision support tool for prophylaxis for venous thromboembolism in trauma. Arch Surg. 2012;147(10):901–907.
- , . Designing and implementing effective venous thromboembolism prevention protocols: lessons from collaborative efforts. J Thromb Thrombolysis. 2010;29(2):159–166.
- , , , et al. Impact of a venous thromboembolism prophylaxis "smart order set": improved compliance, fewer events. Am J Hematol. 2013;88(7):545–549.
- , . Improving adherence to venous thromoembolism prophylaxis using multiple interventions. BMJ. 2012;344:e3935.
- Health Resources and Services Administration of the U.S. Department of Health and Human Services. Managing data for performance improvement. Available at: http://www.hrsa.gov/quality/toolbox/methodology/performanceimprovement/part2.html. Accessed December 18, 2014.
- , . Improving patient safety by taking systems seriously. JAMA. 2008;299(4):445–447.
- , , , . Growth in the care of older patients by hospitalists in the United States. N Engl J Med. 2009;360(11):1102–1112.
- , , , et al. Prevention of venous thromboembolism: American College of Chest Physicians evidence‐based clinical practice guidelines (8th edition). Chest. 2008;133(6 suppl):381S–453S.
- . Robust locally weighted regression and smoothing scatterplots. J Am Stat Assoc. 1979;74(368):829–836.
- , . Locally weighted regression: An approach to regression analysis by local fitting. J Am Stat Assoc. 1988;83(403):596–610.
- , , , . Regression Methods in Biostatistics: Linear, Logistic, Survival, and Repeated Measures Models. 2nd ed. New York, NY: Springer; 2012.
- . Regression Modeling Strategies: With Applications to Linear Models, Logistic Regression, and Survival Analysis. New York, NY: Springer‐Verlag; 2001.
- , , , et al. Eliminating healthcare disparities via mandatory clinical decision support: the venous thromboembolism (VTE) example [published online ahead of print November 4, 2014]. Med Care. doi: 10.1097/MLR.0000000000000251.
- Joint Commission. Improving America's hospitals: the Joint Commission's annual report on quality and safety. 2012. Available at: http://www.jointcommission.org/assets/1/18/TJC_Annual_Report_2012.pdf. Accessed September 8, 2013.
- , , , et al. Hospital performance for pharmacologic venous thromboembolism prophylaxis and rate of venous thromboembolism: a cohort study. JAMA Intern Med. 2014;174(10):1577–1584.
- , , , et al. Incidence of hospital‐acquired venous thromboembolic codes in medical patients hospitalized in academic medical centers. J Hosp Med. 2014;9(4):221–225.
- , , , , . No association between hospital‐reported perioperative venous thromboembolism prophylaxis and outcome rates in publicly reported data. JAMA Surg. 2014;149(4):400–401.
- , , , , . Linking processes and outcomes: a key strategy to prevent and report harm from venous thromboembolism in surgical patients. JAMA Surg. 2013;148(3):299–300.
- , , , et al. Patterns of non‐administration of ordered doses of venous thromboembolism prophylaxis: implications for novel intervention strategies. PLoS One. 2013;8(6):e66311.
- , , , et al. Nonadministration of thromboprophylaxis in hospitalized patients with HIV: a missed opportunity for prevention? J Hosp Med. 2014;9(4):215–220.
- , , , et al. Evaluation of surveillance bias and the validity of the venous thromboembolism quality measure. JAMA. 2013;310(14):1482–1489.
- , . Surveillance bias in outcomes reporting. JAMA. 2011;305(23):2462–2463.
- . Pay for performance in health care: an international overview of initiatives. Med Care Res Rev. 2012;69(3):251–276.
- Medicare Program, Centers for Medicare 76(88):26490–26547.
- . Quality meets finance: payments at risk with value‐based purchasing, readmission, and hospital‐acquired conditions force hospitalists to focus. Hospitalist. 2013;17(1):31.
- National Quality Forum. March 2009. Safe practices for better healthcare—2009 update. Available at: http://www.qualityforum.org/Publications/2009/03/Safe_Practices_for_Better_Healthcare%E2%80%932009_Update.aspx. Accessed November 1, 2014.
- Joint Commission on Accreditation of Healthcare Organizations. Approved: more options for hospital core measures. Jt Comm Perspect. 2009;29(4):1–6.
- Centers for Medicare 208(2):227–240.
- , . Thromboprophylaxis in nonsurgical patients. Hematology Am Soc Hematol Educ Program. 2012;2012:631–637.
- , , , et al. Venous thromboembolism risk and prophylaxis in the acute hospital care setting (ENDORSE study): a multinational cross‐sectional study. Lancet. 2008;371(9610):387–394.
- , . Practices to prevent venous thromboembolism: a brief review. BMJ Qual Saf. 2014;23(3):187–195.
- , , , et al. Improving hospital venous thromboembolism prophylaxis with electronic decision support. J Hosp Med. 2013;8(3):115–120.
- , , . Innovative approaches to increase deep vein thrombosis prophylaxis rate resulting in a decrease in hospital‐acquired deep vein thrombosis at a tertiary‐care teaching hospital. J Hosp Med. 2008;3(2):148–155.
- , , , et al. Lessons from the Johns Hopkins Multi‐Disciplinary Venous Thromboembolism (VTE) Prevention Collaborative. BMJ. 2012;344:e3935.
- , , , et al. Improved prophylaxis and decreased rates of preventable harm with the use of a mandatory computerized clinical decision support tool for prophylaxis for venous thromboembolism in trauma. Arch Surg. 2012;147(10):901–907.
- , . Designing and implementing effective venous thromboembolism prevention protocols: lessons from collaborative efforts. J Thromb Thrombolysis. 2010;29(2):159–166.
- , , , et al. Impact of a venous thromboembolism prophylaxis "smart order set": improved compliance, fewer events. Am J Hematol. 2013;88(7):545–549.
- , . Improving adherence to venous thromoembolism prophylaxis using multiple interventions. BMJ. 2012;344:e3935.
- Health Resources and Services Administration of the U.S. Department of Health and Human Services. Managing data for performance improvement. Available at: http://www.hrsa.gov/quality/toolbox/methodology/performanceimprovement/part2.html. Accessed December 18, 2014.
- , . Improving patient safety by taking systems seriously. JAMA. 2008;299(4):445–447.
- , , , . Growth in the care of older patients by hospitalists in the United States. N Engl J Med. 2009;360(11):1102–1112.
- , , , et al. Prevention of venous thromboembolism: American College of Chest Physicians evidence‐based clinical practice guidelines (8th edition). Chest. 2008;133(6 suppl):381S–453S.
- . Robust locally weighted regression and smoothing scatterplots. J Am Stat Assoc. 1979;74(368):829–836.
- , . Locally weighted regression: An approach to regression analysis by local fitting. J Am Stat Assoc. 1988;83(403):596–610.
- , , , . Regression Methods in Biostatistics: Linear, Logistic, Survival, and Repeated Measures Models. 2nd ed. New York, NY: Springer; 2012.
- . Regression Modeling Strategies: With Applications to Linear Models, Logistic Regression, and Survival Analysis. New York, NY: Springer‐Verlag; 2001.
- , , , et al. Eliminating healthcare disparities via mandatory clinical decision support: the venous thromboembolism (VTE) example [published online ahead of print November 4, 2014]. Med Care. doi: 10.1097/MLR.0000000000000251.
- Joint Commission. Improving America's hospitals: the Joint Commission's annual report on quality and safety. 2012. Available at: http://www.jointcommission.org/assets/1/18/TJC_Annual_Report_2012.pdf. Accessed September 8, 2013.
- , , , et al. Hospital performance for pharmacologic venous thromboembolism prophylaxis and rate of venous thromboembolism: a cohort study. JAMA Intern Med. 2014;174(10):1577–1584.
- , , , et al. Incidence of hospital‐acquired venous thromboembolic codes in medical patients hospitalized in academic medical centers. J Hosp Med. 2014;9(4):221–225.
- , , , , . No association between hospital‐reported perioperative venous thromboembolism prophylaxis and outcome rates in publicly reported data. JAMA Surg. 2014;149(4):400–401.
- , , , , . Linking processes and outcomes: a key strategy to prevent and report harm from venous thromboembolism in surgical patients. JAMA Surg. 2013;148(3):299–300.
- , , , et al. Patterns of non‐administration of ordered doses of venous thromboembolism prophylaxis: implications for novel intervention strategies. PLoS One. 2013;8(6):e66311.
- , , , et al. Nonadministration of thromboprophylaxis in hospitalized patients with HIV: a missed opportunity for prevention? J Hosp Med. 2014;9(4):215–220.
- , , , et al. Evaluation of surveillance bias and the validity of the venous thromboembolism quality measure. JAMA. 2013;310(14):1482–1489.
- , . Surveillance bias in outcomes reporting. JAMA. 2011;305(23):2462–2463.
- . Pay for performance in health care: an international overview of initiatives. Med Care Res Rev. 2012;69(3):251–276.
© 2014 Society of Hospital Medicine