User login
Researchers win Nobel Prize for developing cryo-EM

Three researchers have received the Nobel Prize in Chemistry 2017 for the development of cryo-electron microscopy (EM), which has simplified and improved the imaging of biomolecules.
Cryo-EM is a method used to image frozen biological molecules without the use of structure-altering dyes or fixatives or the need to coax the molecules into crystalline form.
This provides a simpler way to generate images of molecules in their normal states and greater understanding of biological function. It also aids the development of pharmaceuticals.
For developing cryo-EM, this year’s Nobel Prize in Chemistry* was awarded to:
- Jacques Dubochet, PhD, of University of Lausanne in Switzerland
- Joachim Frank, PhD, of Columbia University in New York, New York
- Richard Henderson, PhD, of MRC Laboratory of Molecular Biology in Cambridge, UK.
About the work
Electron microscopes were long believed to be suitable only for imaging dead matter because the electron beam destroys biological material.
However, in 1990, Dr Henderson succeeded in using an electron microscope to generate a 3-dimensional image of a protein at atomic resolution. This breakthrough proved the technology’s potential.
Dr Frank made the technology generally applicable. Between 1975 and 1986, he developed an image processing method in which the electron microscope’s fuzzy, 2-dimensional images are analyzed and merged to reveal a sharp, 3-dimensional structure.
Dr Dubochet added water to the mix. Liquid water evaporates in the electron microscope’s vacuum, which makes the biomolecules collapse.
In the early 1980s, Dr Dubochet succeeded in vitrifying water. He cooled water so rapidly that it solidified in its liquid form around a biological sample, allowing the biomolecules to retain their natural shape even in a vacuum.
Following these discoveries, the electron microscope’s every nut and bolt have been optimized. The desired atomic resolution was reached in 2013, and researchers can now routinely produce 3-dimensional structures of biomolecules.
In the past few years, the scientific literature has been filled with images of everything from proteins that cause antibiotic resistance to the surface of the Zika virus. ![]()
*The prize amount is 9 million Swedish krona to be shared equally among the Laureates.
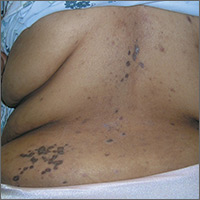
Rash on back and wrists
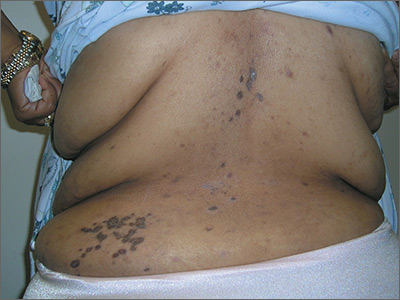
The FP was aware that HCTZ might precipitate lichen planus or create a lichenoid drug reaction, so he performed a 4-mm punch biopsy and asked the patient to stop taking her HCTZ while the biopsy results were pending. (The patient also had several of the 5 Ps of lichen planus: planar, polygonal, pruritic, papular, and purple lesions. She didn’t have any papular lesions and the lesions she did have were more brown than purple because of her dark skin color.)
The FP prescribed topical fluocinonide 0.05% ointment to be applied twice daily to the affected areas until the biopsy results were available. The FP also increased her lisinopril dose, hoping to keep her BP under control.
Biopsy results came back as probable lichen planus and possible lichenoid drug reaction. As treatment for each condition would be the same, it didn’t matter that the pathologist couldn’t be more specific.
On the patient’s second visit for suture removal and discussion of the biopsy results, she said she was feeling better. Her BP was still under control, so the FP decided to continue the treatment plan. At follow-up one month later, the pruritus had resolved completely and the skin lesions were no longer palpable. There was postinflammatory hyperpigmentation at the sites of the lesions, but the patient was not concerned about this because most of it was on her back.
Photos and text for Photo Rounds Friday courtesy of Richard P. Usatine, MD. This case was adapted from: Kraft RL, Usatine R. Lichen planus. In: Usatine R, Smith M, Mayeaux EJ, et al, eds. Color Atlas of Family Medicine. 2nd ed. New York, NY: McGraw-Hill; 2013: 901-909.
To learn more about the Color Atlas of Family Medicine, see: www.amazon.com/Color-Family-Medicine-Richard-Usatine/dp/0071769641/
You can now get the second edition of the Color Atlas of Family Medicine as an app by clicking on this link: usatinemedia.com
Cosmetic Corner: Dermatologists Weigh in on Postprocedural Makeup
To improve patient care and outcomes, leading dermatologists offered their recommendations on postprocedural makeup. Consideration must be given to:
- Dual Action Redness Relief
PCA Skin
“This product is great immediately after laser treatment or filler/botulinum toxin injections to reduce postprocedural redness.”— Gary Goldenberg, MD, New York, New York
- Isdinceutics Skin Drops
ISDIN
“This product is great to reduce or camouflage postprocedural bruising or redness.”—Gary Goldenberg, MD, New York, New York
- Oxygenating Foundation
Oxygenetix
“This is my favorite postprocedural makeup. Originally designed for burn victims, this makeup has botanicals, SPF, and is water resistant and soothing.”—Jeannette Graf, MD, Great Neck, New York
- Quick-Fix Concealer Stick
Dermablend
“This product is customized to match your patient’s skin type. It’s great at covering up purpura postprocedure.”—Shari Lipner, MD, PhD, New York, New York
“I love Dermablend because it can essentially camouflage anything postprocedure, getting patients back to work or their social activities.”— Jerome Potozkin, MD, Danville, California
Cutis invites readers to send us their recommendations. Pigment corrector, lip plumper, moisturizers for men, and wet skin moisturizers will be featured in upcoming editions of Cosmetic Corner. Please e-mail your recommendation(s) to the Editorial Office.
Disclaimer: Opinions expressed herein do not necessarily reflect those of Cutis or Frontline Medical Communications Inc. and shall not be used for product endorsement purposes. Any reference made to a specific commercial product does not indicate or imply that Cutis or Frontline Medical Communications Inc. endorses, recommends, or favors the product mentioned. No guarantee is given to the effects of recommended products.

When Epilepsy Does Not Respond to Treatment

How to apply SPRINT findings to elderly patients
SAN FRANCISCO – The benefit of lowering blood pressure exceeded the potential for harm, even among the most frail elderly, in SPRINT, but it’s important to remember who was excluded from the trial when using the findings in the clinic, according to Mark Supiano, MD.
SPRINT (Systolic Blood Pressure Intervention Trial) excluded people with histories of stroke, diabetes, heart failure, and chronic kidney disease with a markedly reduced glomerular filtration rate. People living in nursing homes, assisted living centers, and those with prevalent dementia were also excluded, as were individuals with a standing systolic pressure below 110 mm Hg (N Engl J Med. 2015 Nov 26;373:2103-16).
Even with those exclusions, however, the 2,636 patients in SPRINT who were 75 years and older “were not a super healthy group of older people,” Dr. Supiano said at the joint scientific sessions of the American Heart Association Council on Hypertension, AHA Council on Kidney in Cardiovascular Disease, and American Society of Hypertension.
They were at high risk for cardiovascular disease (CVD), with a median 10-year Framingham risk score of almost 25%. More than a quarter had gait speeds below 0.8 m/sec, and almost a third were classified as frail. Many had mild cognitive impairment at baseline.
In the United States, Dr. Supiano and his colleagues estimate that there are almost 6 million similar people 75 years or older with hypertension who would likely achieve the same benefits from hypertension control as elderly subjects in the trial. “As a geriatrician, there are very few things that I can offer patients 75 years and older that will have a profound improvement in their overall mortality.” Blood pressure control is one of them, said Dr. Supiano, chief of geriatrics at the University of Utah, Salt Lake City, and a SPRINT investigator.
In SPRINT, intensive treatment to systolic pressure below 120 mm Hg showed greater benefit for patients 75 years and older than it did for younger patients, even among the frail, with a 34% reduction in fatal and nonfatal CVD events versus patients treated to below 140 mm Hg, and a 33% lower rate of death from any cause.
It should be no surprise that older patients had greater benefit from tighter control, because elderly patients have “a greater CVD risk. There’s more bang for the buck” with blood pressure lowering in an older population. “Overall, benefits exceed the potential for harm, even among the frailest older patients,” Dr. Supiano said.
“A systemic target of less than 140 mm Hg is, I believe, appropriate for most healthy people age 60 and older. A benefit-based systemic target of less than 120 mm Hg may be appropriate for those at higher CVD risk.” Among patients 60-75 years old, that would include those with a Framingham score above 15%. Among patients older than age 75 with an elevated CVD risk, treatment to below 120 mm Hg makes sense if it aligns with patient’s goals of care, Dr. Supiano said.
The 120–mm Hg target in SPRINT was associated with a greater incidence of some transient side effects in the elderly, including hypotension, syncope, acute kidney injury, and electrolyte imbalance, but not a higher risk of serious adverse events or injurious falls.
There were concerns raised at the joint sessions about the effect of blood pressure lowering on the cognitive function of older people. Dr. Supiano noted that the cognitive outcomes in SPRINT, as well as outcomes in patients with chronic kidney disease, have not yet been released, but are expected soon.
Dr. Supiano had no relevant disclosures.
EXPERT ANALYSIS FROM JOINT HYPERTENSION 2017
Prehospital tourniquets in civilian settings significantly decreased mortality
BALTIMORE – Prehospital tourniquet use on injured civilians in trauma situations was associated with a nearly sixfold decrease in mortality, according to a study presented at the annual meeting of the American Association for Surgery of Trauma.
While tourniquets have been an effective tool in military settings, data on successful applications in civilian settings have been scarce.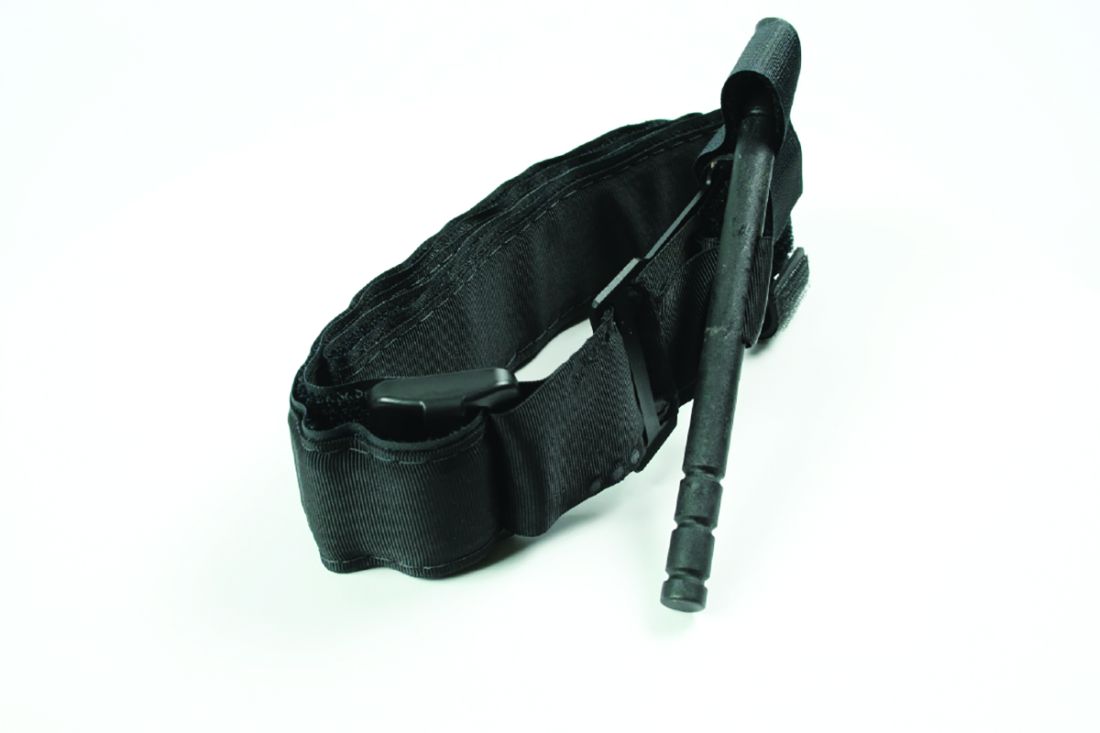
Dr. Teixeira and his coinvestigators conducted a multicenter, retrospective study of 1,026 peripheral–vascular injury patients admitted to level I trauma centers between January 2011 and December 2016. Among the patients studied, 181 (17.6%) received a tourniquet prior to hospital admission.
A majority of tourniquets were applied to the limbs, with the most common application sites on the arm (49%) and the thigh (29%).Tourniquets were held in place for an average 77 minutes.
Of the patients in the study, 98 (9.6%) underwent an amputation; 35 of these patients had received a tourniquet.
After adjusting for confounding factors, such as age and mechanism of injury, investigators found patients who received tourniquets were nearly six times more likely to survive than were their nontourniquet counterparts (odds ratio, 5.86; 95% confidence interval, 1.41-24.47; P = .015).
While the overall mortality rate among those with a tourniquet – compared with those without a tourniquet – was significantly lower, the comparative mortality rate among amputee patients was not significant, which investigators hypothesized could be because of the smaller number of patients in this subgroup.
Additionally, patients who did not receive a tourniquet had lower injury severity scores, had better vital signs, and needed less blood, according to investigators.
The findings of this study mirror what many military medical professionals have historically, and adamantly, supported, according to discussant Jay J. Doucet, MD, FACS, medical director for the surgical intensive care unit at the University of California San Diego Medical Center and a former combat surgeon.
“The medical lessons on our battlefields that hold such great promise have to be carefully relearned, brought home, and fearlessly applied here,” said Dr. Doucet. “I have yet to meet an employed military surgeon who does not believe the tourniquet is an indispensable tool.” While Dr. Doucet did acknowledge the benefit of tourniquets outside military use and addressed the need for increased implementation among civilian hospitals, he did pose a query about the mortality rate that investigators had found.
“The no-tourniquet group has an adjusted odds of death at a rate that is 5.86 times higher, yet they had better vitals, needed less blood, had lower [injury severity scores], had less head injury, fewer traumatic amputations, and fewer complications,” said Dr. Doucet. “So why do they die?”
Investigators were not able to pinpoint the cause of death among patients because of the limitations of their study; however, Dr. Teixeira and his colleagues were able to determine the presence of cardiac complications, pulmonary complications, and acute kidney injury, none of which had a significantly different presence between the two study groups.
The data gathered from this study are strong enough to support the use of tourniquets in civilian situations, asserted Dr. Teixeira, which means the next hurdle is to integrate it into the health system.
“What’s important from our perspective as leaders of this issue is what we are doing to increase the rate [of tourniquet use],” said Dr. Teixeira. “I think one of the important things is the Stop the Bleed program, [in which] we are actually teaching the Austin police department, and we are trying to increase the use of the tourniquet and demonstrate its importance.”
Investigators reported no relevant financial disclosures.
ezimmerman@frontlinemedcom.com
On Twitter @eaztweets
At the AAST Annual Meeting
Key clinical point:
Major finding: Patients who were given a prehospital tourniquet were associated with a survival odds ratio nearly sixfold higher than those without (odds ratio, 5.86; 95% confidence interval, 1.41-24.47; P = .015).
Data source: Multicenter retrospective study of 1,026 patients with peripheral vascular injuries admitted to a level I trauma facility between January 2011 and December 2016.
Disclosures: Investigators reported no relevant financial disclosures.
Five takeaways from Congress’ failure to extend funding for children’s coverage
Congress finally seems ready to take action on the Children’s Health Insurance Program after funding lapsed Sept. 30.
Before the deadline, lawmakers were busy grappling with the failed repeal of the Affordable Care Act.
CHIP covers 9 million children nationwide. But until Congress renews CHIP, states are cut off from additional federal funding that helps lower- and middle-income families.
CHIP, which has enjoyed broad bipartisan support, helps lower- and middle-income families that otherwise earn too much to be eligible for Medicaid. Besides children, it covers 370,000 pregnant women a year. Like Medicaid, CHIP is traditionally paid for with state and federal funds, but the federal government covers most of the cost.
Though current authorization for spending has expired, states can use some of their unspent federal CHIP money. Still, several states are expected to run out of money before the end of 2017, and most of the rest will run out by next summer. CHIP has been in this fix only one other time since it was established in 1997. In 2007, CHIP went weeks without funding authorization from Congress.
Here’s a quick look at what may lie ahead for the program.
1. Will children lose coverage because Congress missed the deadline?
They could eventually, but not immediately. A few states facing the most immediate threat – including California and Arizona – have enough funding to last only until the end of the year.
No states have yet announced plans to freeze enrollment or alert families about any potential end in coverage. But if Congress fails to renew funding quickly, some states may begin taking steps to unwind the program in the next few weeks.
2. What are states doing in reaction to Congress missing the deadline?
Most states are doing little except reaching into their unspent federal funds.
However, Minnesota was among those most imperiled because it had spent all its funds. State officials said Tuesday that the federal Centers for Medicare & Medicaid Services (CMS) was giving Minnesota $3.6 million from unspent national funds to cover CHIP this month.
Emily Piper, commissioner of the Minnesota Department of Human Services, reported in a newspaper commentary in September that her state’s funds would be exhausted by the end of that month.
Even without the last-minute infusion of funding from CMS, most of the children covered by CHIP would have continued to receive care under the state’s Medicaid program, but Minnesota would get fewer federal dollars for each child, according to Piper’s commentary. However, she added, those most at risk are the 1,700 pregnant women covered by CHIP, because they wouldn’t be eligible for Medicaid.
Utah has notified CMS that it plans to discontinue its CHIP program by the end of the year unless it receives more federal money. About 19,000 children are in the state’s CHIP program, state officials say. So far, though, the state said it is not moving to suspend service or enrollment or alert enrollees about any possible changes.
Nevada officials said if funding is not extended it might have to freeze enrollment on Nov. 1 and end coverage by Nov. 30.
California, which has 1.3 million children covered by CHIP, has the highest enrollment of any state running out of funding this year. But, so far, it’s continuing business as usual.
“We estimate that we have available CHIP funding at least through December 2017,” said Tony Cava, spokesman for California Department of Health Services. “Our CHIP program is open for enrollment and continues to operate normally.”
Oregon said it has enough CHIP funding to last through October for its program that covers 98,000 children.
3. When is Congress likely to act?
The Senate Finance and the House Energy and Commerce committees have scheduled votes Wednesday on legislation to extend CHIP funding. If both approve their individual bills, floor votes could come quickly, and then both houses would need to resolve any differences.
Senate Finance Committee Chairman Orrin Hatch (R-Utah) and the committee’s ranking Democrat, Sen. Ron Wyden of Oregon, announced an agreement in mid-September to renew CHIP funding. Under the proposed deal, federal CHIP funding would drop by 23 percentage points starting in by 2020, returning to its pre-Affordable Care Act levels. The agreement would extend the life of the CHIP program through 2022.
Hatch and Wyden did not provide any details on how they would pay for the CHIP extension.
The House Energy and Commerce Committee posted its bill just before midnight Monday. It mirrors the Senate Finance plan by extending funding for CHIP for five years and gradually phasing down the 23-percentage-point funding increase provided under Affordable Care Act over the next two years.
4. If CHIP is so popular among Republicans and Democrats, why hasn’t Congress renewed the program yet?
The funding renewal was not a priority among Republican leaders, who have spent most of this year trying to replace the Affordable Care Act and dramatically overhaul the Medicaid program. Some in Congress also thought the Sept. 30 deadline was squishy since states could extend their existing funds beyond that.
5. Who benefits from CHIP?
While CHIP income eligibility levels vary by state, about 90 percent of children covered are in families earning 200 percent of poverty or less ($40,840 for a family of three). CHIP covers children up to age 19. States have the option to cover pregnant women, and 18 plus the District of Columbia do so.
The program is known by different names in different states such as Hoosier Healthwise in Indiana and PeachCare for Kids in Georgia.
For families that move out of Medicaid as their incomes rise, CHIP is an affordable option that ensures continued coverage for their children. Many states operate their CHIP programs as part of Medicaid.
KHN’s coverage of children’s health care issues is supported in part by a grant from The Heising-Simons Foundation.
Kaiser Health News is a national health policy news service that is part of the nonpartisan Henry J. Kaiser Family Foundation.
Flat-fee primary care helps fill niche for Texas’ uninsured
JARRELL, Texas – Darrell Kenyon had been punting for years on various medical issues – fatigue, headaches, mood swings. The 43-year-old uninsured carpenter was particularly worried about his blood pressure, which ran high when he checked it at the grocery store. Then he heard about a different type of physician practice, one that provided regular primary care for a monthly fee.
“Insurance for the self-employed is through the roof,” Mr. Kenyon told Loy Graham, MD, as she examined him one morning in August. Two years ago, Dr. Graham had hung out her shingle in this central Texas town of nearly 1,400, about 40 miles north of Austin.
Under the practice model, called direct primary care, patients are charged monthly – typically $20-$75, depending on age, in Dr. Graham’s practice – for basic, office-based medical care and frequently cell phone and other after-hours physician access. Proponents of the model, which is also supported as a practice option by the American Academy of Family Physicians, say it can provide a safety net for those with limited treatment options, including the uninsured and people in the country illegally. The alternative is particularly helpful in states like Texas that haven’t expanded Medicaid access, the advocates add.
But there’s a sizable catch: Direct primary care is not insurance.
Carolyn Engelhard worries that strapped individuals will decide the easier access to primary care is “good enough” and won’t investigate insurance options. “It can be a false security,” said Ms. Engelhard, who directs the health policy program at the University of Virginia, Charlottesville. “There’s sort of the illusion that it’s kind of like insurance.”
Lower-income Texans would be better off with coverage on the Affordable Care Act’s insurance exchange, where they could get a subsidy to reduce the cost of their premiums, Ms. Engelhard said. The policy would have a deductible, “which they might feel that they can’t afford,” she said. “But they would be protected if they got cancer or if they had an automobile accident.”
Dr. Graham estimates that at least three-quarters of her roughly 450 patients lack insurance, even though she advises them to carry some kind of catastrophic coverage for major health expenses. But the cost for such policies can be daunting. Like Mr. Kenyon, some of Dr. Graham’s patients are self-employed with fluctuating incomes or work for businesses that don’t offer coverage. Even if their employer offers affordable coverage for the employee, premiums for dependents might make coverage financially out of reach. Roughly 1 in 5 of her patients speak primarily Spanish. Some are undocumented, working in construction and other labor-intensive jobs in the region.
Despite her concerns, Ms. Engelhard said, such flat-fee practices might offer “one of the few viable options” for those living here under the radar, given they’re not eligible for ACA-related coverage. “So they are completely dependent on paying out-of-pocket for medical care,” she said.
‘Better than nothing’?
Nationally, direct primary care is relatively new and very much a niche option. Nearly 3% of family physicians practice it, according to a 2017 survey by the American Academy of Family Physicians. Some critics have questioned whether the model’s growth is already stalling, after one of its earliest providers, Seattle-based Qliance, closed its clinics this year.
Dr. Graham, who practiced traditional medicine in Central Texas for decades, said she was drawn to the option after growing weary of packing too many patients into each day. She was considering leaving medicine and had started developing a lavender farm as an alternative source of income when she heard about direct primary care.
In 2015, she opened her practice in a small strip mall in Jarrell, figuring that nearby residents – with limited access to primary care – might take a chance on the different style of medicine.
John Bender, MD, an academy board member who is part of a larger practice that’s transitioning to direct primary care, said that the low monthly fees are attracting patients who view insurance as out of reach. “I think something [in terms of medical care] is better than nothing,” said the Fort Collins, Colo., family physician, who estimates that roughly half of the practice’s 800-plus direct primary care patients are uninsured.
“I can spare them quite a few urgent care and emergency room bills,” Dr. Bender said, noting that his office handles anything from strep throat to stitches for minor gashes. Moreover, the cost is within reach of people on tight budgets, he said. “In fact, a carton of cigarettes runs $49, which just happens to be the price of my monthly subscription fee [for adults].”
In Texas, 16.6% of the state’s residents were uninsured as of 2016, the highest rate nationally, according to the most recent Census Bureau data. The Lone Star State didn’t expand Medicaid access and has one of the nation’s lowest income-eligibility cutoffs. A single mother with two children can’t earn more than $3,781 annually to qualify for coverage herself, according to a 2017 Medicaid report by the Center for Public Policy Priorities, an Austin-based nonprofit research and advocacy organization.
Felicia Macik, DO, who launched her direct care practice in 2014 in Waco, estimates that 10%-15% of her patients are uninsured, including some who drop coverage because they can’t afford the premiums. “I’m frightened for them,” she said. “It could decimate a family if something happened and they didn’t have any coverage.”
But Dr. Macik pointed out that getting regular primary care, rather than avoiding the doctor entirely due to lack of insurance, might avert costlier complications like an asthma attack or a diabetic crisis.
Uninsured individuals who sign up for these practices are rolling the dice, said Mohan Nadkarni, MD, an internist who cofounded the Charlottesville (Va.) Free Clinic, which treats lower-income individuals. “For routine regular care, it may work out,” he said. “But it’s gambling that you’re not going to get sicker and need further care.”
For instance, a patient can develop severe heartburn and require further tests and referrals to specialists to look for the underlying cause – potentially anything from an ulcer to esophageal cancer – that could quickly run up a hefty bill, Dr. Nadkarni said. Another patient with chest pain might need a similarly costly work-up to rule out heart problems, including a potentially life-threatening blockage, he said.
Dr. Graham said that her monthly fees cover anything that she can handle in the office. During Mr. Kenyon’s visit, she froze a small growth off one ear. Shortly afterward, she gave a steroid injection to an older woman with a painful, swollen wrist.
She has negotiated low fees with a local laboratory; the battery of blood tests and urinalysis she ordered for Mr. Kenyon cost him just under $40. “This is concierge medicine for normal people,” said the 61-year-old family physician.
Physician enthusiasts maintain that jettisoning the paperwork and other overhead costs associated with insurance enables them to take on fewer patients – roughly 600-800 for direct care practices compared with 2,000-2,500 typically, according to the family physicians academy – and thus spend more time with each one.
As a safety net, it’s a stretch
Erika Miller first came to see Dr. Graham 2 years ago for severe headaches. The 30-year-old mother of three, who is working on her college degree and has a full-time job, doesn’t have insurance.
Dr. Graham diagnosed high blood pressure. Getting that under control helped alleviate her headaches, Ms. Miller said. She also has shed 50 pounds under Dr. Graham’s guidance.
But Dr. Graham can’t handle everything for her patients. Last year, Ms. Miller went to the emergency room at Scott & White Medical Center in nearby Temple with severe abdominal pain. It was her appendix, which had to be removed. The safety-net hospital started Ms. Miller on a payment plan based on her income, totaling roughly $500.
“If the question is: ‘Is [direct primary care] better than nothing?’ Then I would say, ‘Yes,’ ” Ms. Engelhard said. But along with leaving uninsured patients financially vulnerable to a medical curveball, she said, these smaller practices – by seeing fewer patients per doctor – risk aggravating the nation’s primary care shortage if they become more common.
Dr. Graham countered that she nearly left medicine, but these days – as she continues to build her practice – she’s reaching some patients who had previously fallen through the health system’s cracks. On that summer morning, Mr. Kenyon left Dr. Graham’s office with a prescription for a blood pressure medication and an appointment to return in several weeks to discuss his lab results.
Mr. Kenyon and his wife, Denise, later described how they had signed up last year for a family policy through the Affordable Care Act. But the monthly premium was $750 and the deductibles were $3,500 per person, Denise Kenyon said.
She called around and couldn’t find a family doctor who would take the coverage. After several months, they stopped paying the premiums, figuring that the money they saved would pay for a lot of medical care.
Both are now patients of Dr. Graham’s; their combined monthly bill totals $125, which they can budget for, Darrell Kenyon said. “I do have good months and bad months, as far as pay is concerned,” he said. “If I have a bad month, it’s still affordable.”
Kaiser Health News is a national health policy news service that is part of the nonpartisan Henry J. Kaiser Family Foundation.
Sweet Syndrome Induced by Oral Acetaminophen-Codeine Following Repair of a Facial Fracture
In 1964, Sweet1 described 8 women with acute onset of fever and erythematous plaques associated with a nonspecific infection of the respiratory or gastrointestinal tract. The lesions were histologically characterized by a neutrophilic infiltrate, and the author named the constellation of findings acute febrile neutrophilic dermatosis.1 In 1968, Whittle et al2 reported on similar cases and coined the term Sweet syndrome (SS).
Although the etiology and pathogenesis of SS remain unknown, several theories have been proposed. Because SS often is preceded by a respiratory or gastrointestinal tract infection, it has been postulated that it may represent a hypersensitivity reaction or may be related to local or systemic dysregulation of cytokine secretion.3,4 In addition to respiratory or gastrointestinal tract infections, SS has been reported in association with malignancies, autoimmune diseases, drugs, vaccines, pregnancy, inflammatory bowel disease, and chemotherapy. It also may be idiopathic.5
The eruption of SS manifests as erythematous, indurated, and sharply demarcated plaques or nodules that typically favor the head, neck, and arms, with a particularly strong predilection for the dorsal aspects of the hands.6 Plaques and nodules are histologically characterized by a diffuse dermal neutrophilic infiltrate, papillary dermal edema, neutrophilic spongiosis, subcorneal pustules, and leukocytoclasia. Vasculitic features are not seen.7 The eruption typically resolves spontaneously in 5 to 12 weeks but recurs in approximately 30% of cases.8 Relatively common extracutaneous findings include ocular involvement, arthralgia, myalgia, and arthritis.4,9 Both cutaneous and extracutaneous findings typically are responsive to prednisone at a dosage of 0.5 to 1 mg/kg daily for 4 to 6 weeks. Prolonged low-dose prednisone for 2 to 3 additional months may be necessary to suppress recurrence.8 Potassium iodide at 900 mg daily may be used as an alternative regimen.3,8
Sweet syndrome is divided into 5 subcategories based on the underlying etiology: (1) classic or idiopathic, (2) paraneoplastic, (3) inflammatory and/or autoimmune disease related, (4) pregnancy related, and (5) drug induced.3 Although drug-induced SS comprises the minority of total cases (<5%), its reported incidence has been rising in recent years and has been associated with an escalating number of medications.10 We report a rare case of SS induced by administration of oral acetaminophen-codeine.
Case Report
A 32-year-old man with a history of diabetes mellitus underwent postoperative repair of a facial fracture. The patient was administered an oral acetaminophen-codeine suspension for postoperative pain control. One week later, he developed a painful eruption on the forehead and presented to the emergency department. He was prescribed acetaminophen-codeine 300/30-mg tablets every 6 hours in addition to hydrocortisone cream 1% applied every 6 hours. After this reintroduction of oral acetaminophen-codeine, he experienced intermittent fevers and an exacerbation of the initial cutaneous eruption. The patient presented for a second time 2 days after being seen in the emergency department and a dermatology consultation was obtained.
At the time of consultation, the patient was noted to have injected conjunctiva and erythematous, well-demarcated, and indurated plaques on the forehead with associated pain and burning (Figures 1A and 1B). Additional erythematous annular plaques were found on the palms, arms, and right knee. Laboratory workup revealed only mild anemia on complete blood cell count with a white blood cell count of 10.1×10⁹/L (reference range, 4.5–11.0×10⁹/L), hemoglobin of 12.9 g/dL (reference range, 14.0–17.4 g/dL), and hematocrit of 37.3% (reference range, 41%–50%). The platelet count was 284×103/µL (reference range, 150–350×103/µL). Basic metabolic panel was notable for an elevated glucose level of 418 mg/dL (reference range, 70–110 mg/dL). The most recent hemoglobin A1C (several months prior) was notable at 14.7% of total hemoglobin (reference range, 4%–7% of total hemoglobin). A 4-mm punch biopsy of the right side of the forehead demonstrated minimal to mild papillary dermal edema and a diffuse dermal neutrophilic infiltrate spanning the upper, middle, and lower dermis with evidence of mild leukocytoclasia and no evidence of leukocytoclastic vasculitis (Figure 2). These histologic features together with the clinical presentation were consistent with a diagnosis of SS.
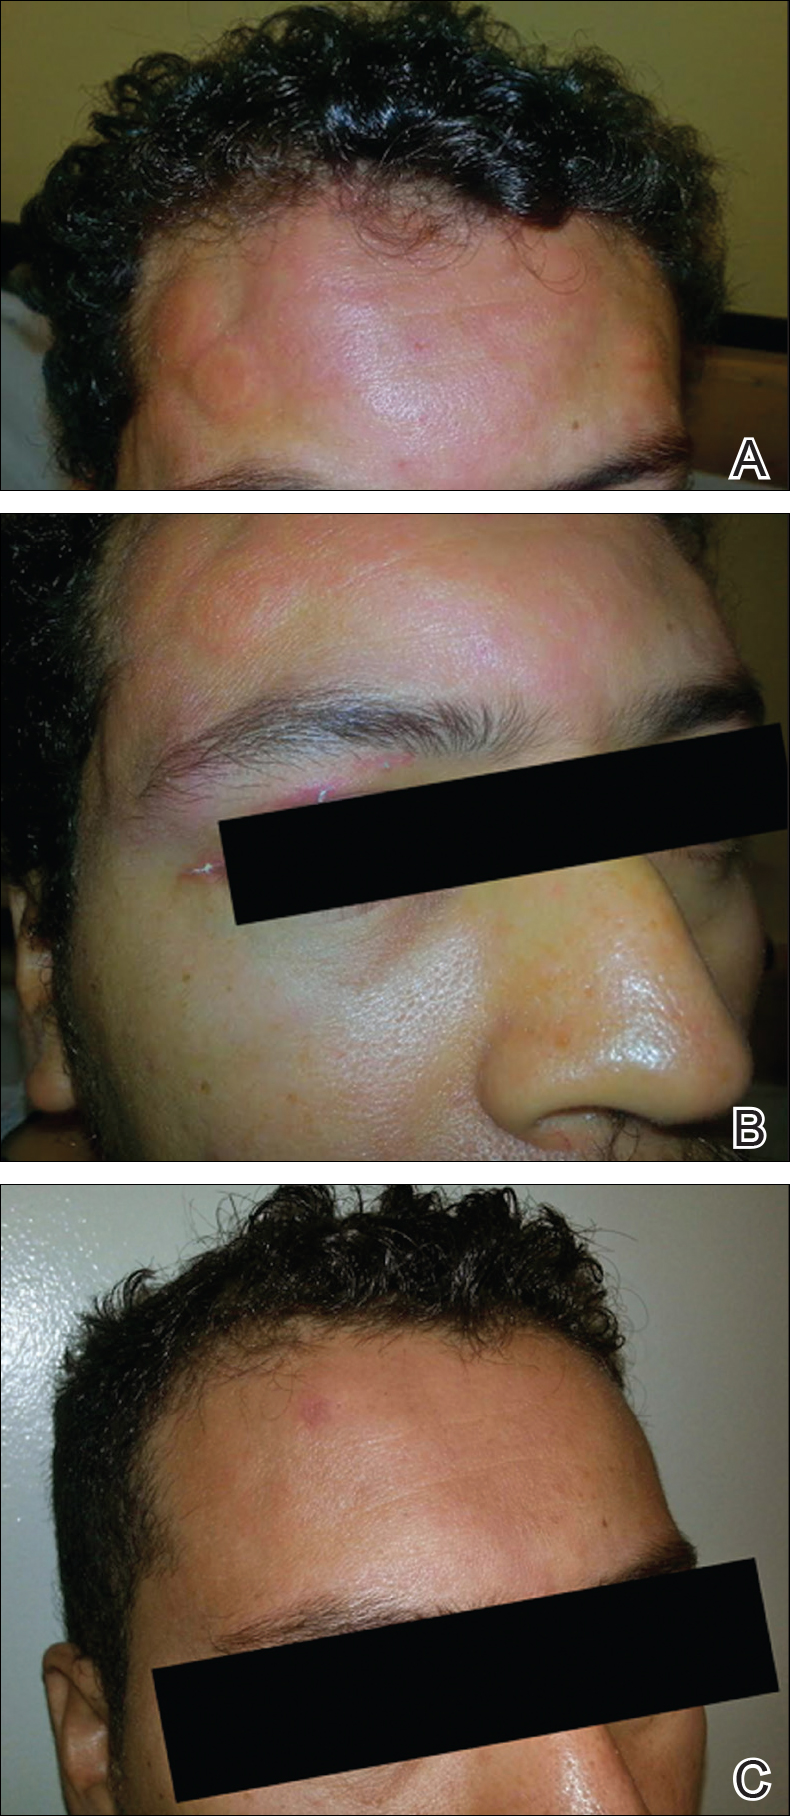
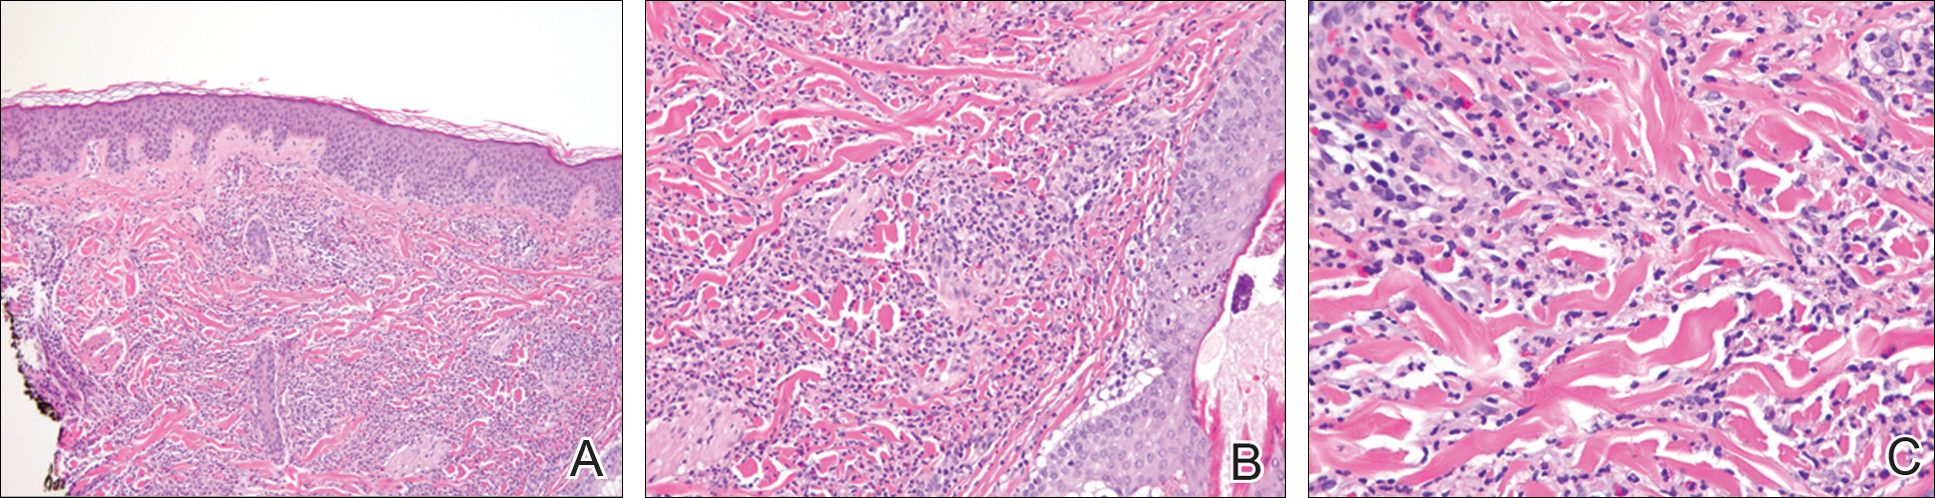
After an initial dose of intravenous methylprednisolone sodium succinate 125 mg in the emergency department, the patient was admitted for additional intravenous steroid administration in the context of uncontrolled hyperglycemia and history of poor glucose control. Upon admission, acetaminophen-codeine was discontinued and the patient was transitioned to intravenous methylprednisolone sodium succinate 60 mg every 8 hours. The patient also was given intravenous diphenhydramine 25 mg every 6 hours and desonide ointment 0.05% was applied to facial lesions. The inpatient medication regimen resulted in notable improvement of
Comment
Although SS itself is relatively rare, there has been an increasing incidence of the drug-induced subtype, most often in association with use of granulocyte colony-stimulating factor and granulocyte monocyte-stimulating factor. There also have been reported associations with a growing number of medications that include antibiotics, antiepileptic drugs, furosemide, hydralazine, and all-trans retinoic acid.11-19 Moghim
Several therapies for advanced melanoma also have been reviewed in the literature, including ipilimumab and vemurafenib,27-30 as have several medications for the treatment of myelodysplastic syndrome including azacitidine.31,32 A seve
Additional medications more recently involved in the pathogenesis of drug-induced SS include the chemotherapeutic agents topetecan, mitoxantrone, gemcitabine, and vorinostat.34-37 The antimalarial medication chloroquine also has been implicated, as have selective cyclooxygenase-2 inhibitors, hypomethylating agents, the tumor necrosis factor inhibitor adalimumab, IL-2 therapies, aripiprazole, and several other medications.38-49
Despite drug-induced SS being reported in association with an increasing number of medications, there had been a lack of appropriate diagnostic criteria. To tha
Conclusion
The number of cases of drug-induced SS in the literature continues to climb; however, the association with acetaminophen-codeine is unique. The importance of this case lies in educating both physicians and pharmacists alike regarding a newly recognized adverse effect of acetaminophen-codeine. Because acetaminophen-codeine often is used for its analgesic properties, and the predominant symptom of the cutaneous eruption of SS is pain, the therapeutic value of acetaminophen-codeine is substantially diminished in acetaminophen-codeine–induced SS. Accordingly, in these cases, the medication may be discontinued or substituted upon recognition of this adverse reaction to reduce patient morbidity.
- Sweet RD. An acute febrile neutrophilic dermatosis. Br J Dermatol. 1964;76:349-356.
- Whittle CH, Back GA, Champion RH. Recurrent neutrophilic dermatosis of the face—a variant of Sweet’s syndrome. Br J Dermatol. 1968;80:806-810.
- Von den Driesch P. Sweet’s syndrome (acute febrile neutrophilic dermatosis). J Am Acad Dermatol. 1994;31:535-536.
- Honigsmann H, Cohen PR, Wolff K. Acute febrile neutrophilic dermatosis (Sweet’s syndrome). Wien Klin Wochenschr. 1979;91:842-847.
- Limdiwala PG, Parikh SJ, Shah JS. Sweet’s Syndrome. Indian J Dent Res. 2014;25:401-405.
- Walling HW, Snipes CJ, Gerami P, et al. The relationship between neutrophilic dermatosis of the dorsal hands and sweet syndrome: report of 9 cases and comparison to atypical pyoderma gangrenosum. Arch Dermatol. 2006;142:57-63.
- Ratzinger G, Burgdorf W, Zelger BG, et al. Acute febrile neutrophilic dermatosis: a histopathologic study of 31 cases with review of literature. Am J Dermatopathol. 2007;29:125-133.
- Moschella SL, Davis MDP. Neutrophilic dermatoses. In: Bolognia J, Jorizzo J, Rapini R, eds. Dermatology. 2nd ed. Philadelphia, PA: Elsevier; 2012:423-428.
- Fett DL, Gibson LE, Su WP. Sweet’s syndrome: signs and symptoms and associated disorders. Mayo Clinic Proc. 1995;70:234-240.
- Carvalho R, Fernandes C, Afonso A, et al. Drug-induced Sweet’s syndrome by alclofenac. Cutan Ocul Toxicol. 2011;30:315-316.
- Moghimi J, Pahlevan D, Azizzadeh M, et al. Isotretinoin-associated Sweet’s syndrome: a case report. Daru. 2014;22:69.
- Cholongitas E, Pipili C, Dasenaki M, et al. Piperacillin/tazobactam-induced Sweet syndrome in a patient with chronic lymphocytic leukemia and autoimmune cholangitis. Am J Dermatopathol. 2008;30:203-204.
- Kandula S, Burke WS, Goldfarb JN. Clindamycin-induced Sweet syndrome. J Am Acad Dermatol. 2010;62:898-900.
- Jamet A, Lagarce L, Le Clec’h C, et al. Doxycycline-induced Sweet’s syndrome. Eur J Dermatol. 2008;18:595-596.
- Cartee TV, Chen SC. Sweet syndrome associated with hydralazine-induced lupus erythematosus. Cutis. 2012;89:121-124.
- Baybay H, Elhatimi A, Idrissi R, et al. Sweet’s syndrome following oral ciprofloxacin therapy. Ann Dermatol Venereol. 2011;138:606-607.
- Khaled A, Kharfi M, Fazaa B, et al. A first case of trimethoprim-sulfamethoxazole induced Sweet’s syndrome in a child. Pediatr Dermatol. 2009;26:744-746.
- Calixto R, Menezes Y, Ostronoff M, et al. Favorable outcome of severe, extensive, granulocyte colony-stimulating factor-induced, corticosteroid-resistant Sweet’s syndrome treated with high-dose intravenous immunoglobulin. J Clin Oncol. 2014;32:E1-E2.
- Margaretten ME, Ruben BS, Fye K. Systemic sulfa-induced Sweet’s syndrome. Arthritis Rheum. 2008;59:1044-1046.
- Tanguy-Schmidt A, Avenel-Audran M, Croué A, et al. Bortezomib-induced acute neutrophilic dermatosis. Ann Dermatol Venereol. 2009;136:443-446.
- Choonhakarn C, Chaowattanapanit S. Azathioprine-induced Sweet’s syndrome and published work review. J Dermatol. 2013;40:267-271.
- Cyrus N, Stavert R, Mason AR, et al. Neutrophilic dermatosis after azathioprine exposure. JAMA Dermatol. 2013;149:592-597.
- Hurtado-Garcia R, Escribano-Stablé JC, Pascual JC, et al. Neutrophilic dermatosis caused by azathioprine hypersensitivity. Int J Dermatol. 2012;51:1522-1525.
- Valentine MC, Walsh JS. Neutrophilic dermatosis caused by azathioprine. Skinmed. 2011;9:386-388.
- Kim JS, Roh HS, Lee JW, et al. Distinct variant of Sweet’s syndrome: bortezomib-induced histiocytoid Sweet’s syndrome in a patient with multiple myeloma. Int J Dermatol. 2012;51:1491-1493.
- Ozlem C, Deram B, Mustafa S, et al. Propylthiouracil-induced anti-neutrophil cytoplasmic antibodies and agranulocytosis together with granulocyte colony-stimulating factor induced Sweet’s syndrome in a patient with Graves’ disease. Intern Med. 2011;50:1973-1976.
- Kyllo RL, Parker MK, Rosman I, et al. Ipilimumab-associated Sweet syndrome in a patient with high-risk melanoma. J Am Acad Dermatol. 2014;70:E85-E86.
- Pintova S, Sidhu H, Friedlander PA, et al. Sweet’s syndrome in a patient with metastatic melanoma after ipilimumab therapy. Melanoma Res. 2013;23:498-501.
- Yorio JT, Mays SR, Ciurea AM, et al. Case of vemurafenib-induced Sweet’s syndrome. J Dermatol. 2014;41:817-820.
- Pattanaprichakul P, Tetzlaff MT, Lapolla WJ, et al. Sweet syndrome following vemurafenib therapy for recurrent cholangiocarcinoma. J Cutan Pathol. 2014;41:326-328.
- Trickett HB, Cumpston A, Craig M. Azacitidine-associated Sweet’s syndrome. Am J Health Syst Pharm. 2012;69:869-871.
- Tintle S, Patel V, Ruskin A, et al. Azacitidine: a new medication associated with Sweet syndrome. J Am Acad Dermatol. 2011;64:E77-E79.
- Thieu KP, Rosenbach M, Xu X, et al. Neutrophilic dermatosis complicating lenalidomide therapy. J Am Acad Dermatol. 2009;61:709-710.
- Dickson EL, Bakhru A, Chan MP. Topotecan-induced Sweet’s syndrome: a case report. Gynecol Oncol Case Rep. 2013;4:50-52.
- Kümpfel T, Gerdes LA, Flaig M, et al. Drug-induced Sweet’s syndrome after mitoxantrone therapy in a patient with multiple sclerosis. Mult Scler. 2011;17:495-497.
- Martorell-Calatayud A, Requena C, Sanmartin O, et al. Gemcitabine-associated sweet syndrome-like eruption. J Am Acad Dermatol. 2011;65:1236-1238.
- Pang A, Tan KB, Aw D, et al. A case of Sweet’s syndrome due to 5-azacytidine and vorinostat in a patient with NK/T cell lymphoma. Cutan Ocul Toxicol. 2012;31:64-66.
- El Moutaoui L, Zouhair K, Benchikhi H. Sweet syndrome induced by chloroquine. Ann Dermatol Venereol. 2009;136:56-57.
- Rosmaninho A, Lobo I, Selores M. Sweet’s syndrome associated with the intake of a selective cyclooxygenase-2 (COX-2) inhibitor. Cutan Ocul Toxicol. 2011;30:298-301.
- Alencar C, Abramowtiz M, Parekh S, et al. Atypical presentations of Sweet’s syndrome in patients with MDS/AML receiving combinations of hypomethylating agents with histone deacetylase inhibitors. Am J Hematol. 2009;84:688-689.
- Keidel S, McColl A, Edmonds S. Sweet’s syndrome after adalimumab therapy for refractory relapsing polychondritis. BMJ Case Rep. 2011;2011.
- Rondina A, Watson AC. Bullous Sweet’s syndrome and pseudolymphoma precipitated by IL-2 therapy. Cutis. 2010;85:206-213.
- Gheorghe L, Cotruta B, Trifu V, et al. Drug-induced Sweet’s syndrome secondary to hepatitis C antiviral therapy. Int J Dermatol. 2008;47:957-959.
- Zobniw CM, Saad SA, Kostoff D, et al. Bortezomib-induced Sweet’s syndrome confirmed by rechallenge. Pharmacotherapy. 2014;34:E18-E21.
- Kolb-Mäurer A, Kneitz H, Goebeler M. Sweet-like syndrome induced by bortezomib. J Dtsch Dermatol Ges. 2013;11:1200-1202.
- Thuillier D, Lenglet A, Chaby G, et al. Bortezomib-induced eruption: Sweet syndrome? two case reports [in French]. Ann Dermatol Venereol. 2009;136:427-430.
- Kim MJ, Jang KT, Choe YH. Azathioprine hypersensitivity presenting as sweet syndrome in a child with ulcerative colitis. Indian Pediatr. 2011;48:969-971.
- Truchuelo M, Bagazgoitia L, Alcántara J, et al. Sweet-like lesions induced by bortezomib: a review of the literature and a report of 2 cases. Actas Dermosifiliogr. 2012;103:829-831.
- Hoelt P, Fattouh K, Villani AP. Dermpath & clinic: drug-induced Sweet syndrome. Eur J Dermatol. 2016;26:641-642.
- Walker DC, Cohen PR. Trimethoprim-sulfamethoxazole-associated acute febrile neutrophilic dermatosis: case report and review of drug-induced Sweet’s syndrome. J Am Acad Dermatol. 1996;34:918-923.
- Thompson DF, Montarella KE. Drug-induced Sweet’s syndrome. Ann Pharmacother. 2007;41:802-811.
In 1964, Sweet1 described 8 women with acute onset of fever and erythematous plaques associated with a nonspecific infection of the respiratory or gastrointestinal tract. The lesions were histologically characterized by a neutrophilic infiltrate, and the author named the constellation of findings acute febrile neutrophilic dermatosis.1 In 1968, Whittle et al2 reported on similar cases and coined the term Sweet syndrome (SS).
Although the etiology and pathogenesis of SS remain unknown, several theories have been proposed. Because SS often is preceded by a respiratory or gastrointestinal tract infection, it has been postulated that it may represent a hypersensitivity reaction or may be related to local or systemic dysregulation of cytokine secretion.3,4 In addition to respiratory or gastrointestinal tract infections, SS has been reported in association with malignancies, autoimmune diseases, drugs, vaccines, pregnancy, inflammatory bowel disease, and chemotherapy. It also may be idiopathic.5
The eruption of SS manifests as erythematous, indurated, and sharply demarcated plaques or nodules that typically favor the head, neck, and arms, with a particularly strong predilection for the dorsal aspects of the hands.6 Plaques and nodules are histologically characterized by a diffuse dermal neutrophilic infiltrate, papillary dermal edema, neutrophilic spongiosis, subcorneal pustules, and leukocytoclasia. Vasculitic features are not seen.7 The eruption typically resolves spontaneously in 5 to 12 weeks but recurs in approximately 30% of cases.8 Relatively common extracutaneous findings include ocular involvement, arthralgia, myalgia, and arthritis.4,9 Both cutaneous and extracutaneous findings typically are responsive to prednisone at a dosage of 0.5 to 1 mg/kg daily for 4 to 6 weeks. Prolonged low-dose prednisone for 2 to 3 additional months may be necessary to suppress recurrence.8 Potassium iodide at 900 mg daily may be used as an alternative regimen.3,8
Sweet syndrome is divided into 5 subcategories based on the underlying etiology: (1) classic or idiopathic, (2) paraneoplastic, (3) inflammatory and/or autoimmune disease related, (4) pregnancy related, and (5) drug induced.3 Although drug-induced SS comprises the minority of total cases (<5%), its reported incidence has been rising in recent years and has been associated with an escalating number of medications.10 We report a rare case of SS induced by administration of oral acetaminophen-codeine.
Case Report
A 32-year-old man with a history of diabetes mellitus underwent postoperative repair of a facial fracture. The patient was administered an oral acetaminophen-codeine suspension for postoperative pain control. One week later, he developed a painful eruption on the forehead and presented to the emergency department. He was prescribed acetaminophen-codeine 300/30-mg tablets every 6 hours in addition to hydrocortisone cream 1% applied every 6 hours. After this reintroduction of oral acetaminophen-codeine, he experienced intermittent fevers and an exacerbation of the initial cutaneous eruption. The patient presented for a second time 2 days after being seen in the emergency department and a dermatology consultation was obtained.
At the time of consultation, the patient was noted to have injected conjunctiva and erythematous, well-demarcated, and indurated plaques on the forehead with associated pain and burning (Figures 1A and 1B). Additional erythematous annular plaques were found on the palms, arms, and right knee. Laboratory workup revealed only mild anemia on complete blood cell count with a white blood cell count of 10.1×10⁹/L (reference range, 4.5–11.0×10⁹/L), hemoglobin of 12.9 g/dL (reference range, 14.0–17.4 g/dL), and hematocrit of 37.3% (reference range, 41%–50%). The platelet count was 284×103/µL (reference range, 150–350×103/µL). Basic metabolic panel was notable for an elevated glucose level of 418 mg/dL (reference range, 70–110 mg/dL). The most recent hemoglobin A1C (several months prior) was notable at 14.7% of total hemoglobin (reference range, 4%–7% of total hemoglobin). A 4-mm punch biopsy of the right side of the forehead demonstrated minimal to mild papillary dermal edema and a diffuse dermal neutrophilic infiltrate spanning the upper, middle, and lower dermis with evidence of mild leukocytoclasia and no evidence of leukocytoclastic vasculitis (Figure 2). These histologic features together with the clinical presentation were consistent with a diagnosis of SS.
After an initial dose of intravenous methylprednisolone sodium succinate 125 mg in the emergency department, the patient was admitted for additional intravenous steroid administration in the context of uncontrolled hyperglycemia and history of poor glucose control. Upon admission, acetaminophen-codeine was discontinued and the patient was transitioned to intravenous methylprednisolone sodium succinate 60 mg every 8 hours. The patient also was given intravenous diphenhydramine 25 mg every 6 hours and desonide ointment 0.05% was applied to facial lesions. The inpatient medication regimen resulted in notable improvement of
Comment
Although SS itself is relatively rare, there has been an increasing incidence of the drug-induced subtype, most often in association with use of granulocyte colony-stimulating factor and granulocyte monocyte-stimulating factor. There also have been reported associations with a growing number of medications that include antibiotics, antiepileptic drugs, furosemide, hydralazine, and all-trans retinoic acid.11-19 Moghim
Several therapies for advanced melanoma also have been reviewed in the literature, including ipilimumab and vemurafenib,27-30 as have several medications for the treatment of myelodysplastic syndrome including azacitidine.31,32 A seve
Additional medications more recently involved in the pathogenesis of drug-induced SS include the chemotherapeutic agents topetecan, mitoxantrone, gemcitabine, and vorinostat.34-37 The antimalarial medication chloroquine also has been implicated, as have selective cyclooxygenase-2 inhibitors, hypomethylating agents, the tumor necrosis factor inhibitor adalimumab, IL-2 therapies, aripiprazole, and several other medications.38-49
Despite drug-induced SS being reported in association with an increasing number of medications, there had been a lack of appropriate diagnostic criteria. To tha
Conclusion
The number of cases of drug-induced SS in the literature continues to climb; however, the association with acetaminophen-codeine is unique. The importance of this case lies in educating both physicians and pharmacists alike regarding a newly recognized adverse effect of acetaminophen-codeine. Because acetaminophen-codeine often is used for its analgesic properties, and the predominant symptom of the cutaneous eruption of SS is pain, the therapeutic value of acetaminophen-codeine is substantially diminished in acetaminophen-codeine–induced SS. Accordingly, in these cases, the medication may be discontinued or substituted upon recognition of this adverse reaction to reduce patient morbidity.
- Sweet RD. An acute febrile neutrophilic dermatosis. Br J Dermatol. 1964;76:349-356.
- Whittle CH, Back GA, Champion RH. Recurrent neutrophilic dermatosis of the face—a variant of Sweet’s syndrome. Br J Dermatol. 1968;80:806-810.
- Von den Driesch P. Sweet’s syndrome (acute febrile neutrophilic dermatosis). J Am Acad Dermatol. 1994;31:535-536.
- Honigsmann H, Cohen PR, Wolff K. Acute febrile neutrophilic dermatosis (Sweet’s syndrome). Wien Klin Wochenschr. 1979;91:842-847.
- Limdiwala PG, Parikh SJ, Shah JS. Sweet’s Syndrome. Indian J Dent Res. 2014;25:401-405.
- Walling HW, Snipes CJ, Gerami P, et al. The relationship between neutrophilic dermatosis of the dorsal hands and sweet syndrome: report of 9 cases and comparison to atypical pyoderma gangrenosum. Arch Dermatol. 2006;142:57-63.
- Ratzinger G, Burgdorf W, Zelger BG, et al. Acute febrile neutrophilic dermatosis: a histopathologic study of 31 cases with review of literature. Am J Dermatopathol. 2007;29:125-133.
- Moschella SL, Davis MDP. Neutrophilic dermatoses. In: Bolognia J, Jorizzo J, Rapini R, eds. Dermatology. 2nd ed. Philadelphia, PA: Elsevier; 2012:423-428.
- Fett DL, Gibson LE, Su WP. Sweet’s syndrome: signs and symptoms and associated disorders. Mayo Clinic Proc. 1995;70:234-240.
- Carvalho R, Fernandes C, Afonso A, et al. Drug-induced Sweet’s syndrome by alclofenac. Cutan Ocul Toxicol. 2011;30:315-316.
- Moghimi J, Pahlevan D, Azizzadeh M, et al. Isotretinoin-associated Sweet’s syndrome: a case report. Daru. 2014;22:69.
- Cholongitas E, Pipili C, Dasenaki M, et al. Piperacillin/tazobactam-induced Sweet syndrome in a patient with chronic lymphocytic leukemia and autoimmune cholangitis. Am J Dermatopathol. 2008;30:203-204.
- Kandula S, Burke WS, Goldfarb JN. Clindamycin-induced Sweet syndrome. J Am Acad Dermatol. 2010;62:898-900.
- Jamet A, Lagarce L, Le Clec’h C, et al. Doxycycline-induced Sweet’s syndrome. Eur J Dermatol. 2008;18:595-596.
- Cartee TV, Chen SC. Sweet syndrome associated with hydralazine-induced lupus erythematosus. Cutis. 2012;89:121-124.
- Baybay H, Elhatimi A, Idrissi R, et al. Sweet’s syndrome following oral ciprofloxacin therapy. Ann Dermatol Venereol. 2011;138:606-607.
- Khaled A, Kharfi M, Fazaa B, et al. A first case of trimethoprim-sulfamethoxazole induced Sweet’s syndrome in a child. Pediatr Dermatol. 2009;26:744-746.
- Calixto R, Menezes Y, Ostronoff M, et al. Favorable outcome of severe, extensive, granulocyte colony-stimulating factor-induced, corticosteroid-resistant Sweet’s syndrome treated with high-dose intravenous immunoglobulin. J Clin Oncol. 2014;32:E1-E2.
- Margaretten ME, Ruben BS, Fye K. Systemic sulfa-induced Sweet’s syndrome. Arthritis Rheum. 2008;59:1044-1046.
- Tanguy-Schmidt A, Avenel-Audran M, Croué A, et al. Bortezomib-induced acute neutrophilic dermatosis. Ann Dermatol Venereol. 2009;136:443-446.
- Choonhakarn C, Chaowattanapanit S. Azathioprine-induced Sweet’s syndrome and published work review. J Dermatol. 2013;40:267-271.
- Cyrus N, Stavert R, Mason AR, et al. Neutrophilic dermatosis after azathioprine exposure. JAMA Dermatol. 2013;149:592-597.
- Hurtado-Garcia R, Escribano-Stablé JC, Pascual JC, et al. Neutrophilic dermatosis caused by azathioprine hypersensitivity. Int J Dermatol. 2012;51:1522-1525.
- Valentine MC, Walsh JS. Neutrophilic dermatosis caused by azathioprine. Skinmed. 2011;9:386-388.
- Kim JS, Roh HS, Lee JW, et al. Distinct variant of Sweet’s syndrome: bortezomib-induced histiocytoid Sweet’s syndrome in a patient with multiple myeloma. Int J Dermatol. 2012;51:1491-1493.
- Ozlem C, Deram B, Mustafa S, et al. Propylthiouracil-induced anti-neutrophil cytoplasmic antibodies and agranulocytosis together with granulocyte colony-stimulating factor induced Sweet’s syndrome in a patient with Graves’ disease. Intern Med. 2011;50:1973-1976.
- Kyllo RL, Parker MK, Rosman I, et al. Ipilimumab-associated Sweet syndrome in a patient with high-risk melanoma. J Am Acad Dermatol. 2014;70:E85-E86.
- Pintova S, Sidhu H, Friedlander PA, et al. Sweet’s syndrome in a patient with metastatic melanoma after ipilimumab therapy. Melanoma Res. 2013;23:498-501.
- Yorio JT, Mays SR, Ciurea AM, et al. Case of vemurafenib-induced Sweet’s syndrome. J Dermatol. 2014;41:817-820.
- Pattanaprichakul P, Tetzlaff MT, Lapolla WJ, et al. Sweet syndrome following vemurafenib therapy for recurrent cholangiocarcinoma. J Cutan Pathol. 2014;41:326-328.
- Trickett HB, Cumpston A, Craig M. Azacitidine-associated Sweet’s syndrome. Am J Health Syst Pharm. 2012;69:869-871.
- Tintle S, Patel V, Ruskin A, et al. Azacitidine: a new medication associated with Sweet syndrome. J Am Acad Dermatol. 2011;64:E77-E79.
- Thieu KP, Rosenbach M, Xu X, et al. Neutrophilic dermatosis complicating lenalidomide therapy. J Am Acad Dermatol. 2009;61:709-710.
- Dickson EL, Bakhru A, Chan MP. Topotecan-induced Sweet’s syndrome: a case report. Gynecol Oncol Case Rep. 2013;4:50-52.
- Kümpfel T, Gerdes LA, Flaig M, et al. Drug-induced Sweet’s syndrome after mitoxantrone therapy in a patient with multiple sclerosis. Mult Scler. 2011;17:495-497.
- Martorell-Calatayud A, Requena C, Sanmartin O, et al. Gemcitabine-associated sweet syndrome-like eruption. J Am Acad Dermatol. 2011;65:1236-1238.
- Pang A, Tan KB, Aw D, et al. A case of Sweet’s syndrome due to 5-azacytidine and vorinostat in a patient with NK/T cell lymphoma. Cutan Ocul Toxicol. 2012;31:64-66.
- El Moutaoui L, Zouhair K, Benchikhi H. Sweet syndrome induced by chloroquine. Ann Dermatol Venereol. 2009;136:56-57.
- Rosmaninho A, Lobo I, Selores M. Sweet’s syndrome associated with the intake of a selective cyclooxygenase-2 (COX-2) inhibitor. Cutan Ocul Toxicol. 2011;30:298-301.
- Alencar C, Abramowtiz M, Parekh S, et al. Atypical presentations of Sweet’s syndrome in patients with MDS/AML receiving combinations of hypomethylating agents with histone deacetylase inhibitors. Am J Hematol. 2009;84:688-689.
- Keidel S, McColl A, Edmonds S. Sweet’s syndrome after adalimumab therapy for refractory relapsing polychondritis. BMJ Case Rep. 2011;2011.
- Rondina A, Watson AC. Bullous Sweet’s syndrome and pseudolymphoma precipitated by IL-2 therapy. Cutis. 2010;85:206-213.
- Gheorghe L, Cotruta B, Trifu V, et al. Drug-induced Sweet’s syndrome secondary to hepatitis C antiviral therapy. Int J Dermatol. 2008;47:957-959.
- Zobniw CM, Saad SA, Kostoff D, et al. Bortezomib-induced Sweet’s syndrome confirmed by rechallenge. Pharmacotherapy. 2014;34:E18-E21.
- Kolb-Mäurer A, Kneitz H, Goebeler M. Sweet-like syndrome induced by bortezomib. J Dtsch Dermatol Ges. 2013;11:1200-1202.
- Thuillier D, Lenglet A, Chaby G, et al. Bortezomib-induced eruption: Sweet syndrome? two case reports [in French]. Ann Dermatol Venereol. 2009;136:427-430.
- Kim MJ, Jang KT, Choe YH. Azathioprine hypersensitivity presenting as sweet syndrome in a child with ulcerative colitis. Indian Pediatr. 2011;48:969-971.
- Truchuelo M, Bagazgoitia L, Alcántara J, et al. Sweet-like lesions induced by bortezomib: a review of the literature and a report of 2 cases. Actas Dermosifiliogr. 2012;103:829-831.
- Hoelt P, Fattouh K, Villani AP. Dermpath & clinic: drug-induced Sweet syndrome. Eur J Dermatol. 2016;26:641-642.
- Walker DC, Cohen PR. Trimethoprim-sulfamethoxazole-associated acute febrile neutrophilic dermatosis: case report and review of drug-induced Sweet’s syndrome. J Am Acad Dermatol. 1996;34:918-923.
- Thompson DF, Montarella KE. Drug-induced Sweet’s syndrome. Ann Pharmacother. 2007;41:802-811.
Practice Points
- The rate of medication-induced Sweet syndrome is on the rise.
- Oral acetaminophen-codeine may induce Sweet syndrome.

Thinking may be shifting about first-line AOM treatment
CHICAGO – Treating even uncomplicated acute otitis media (AOM) in 2017 may not be as simple as writing an amoxicillin prescription. Changes in pathogens may mean a shift in prescribing practices, Ellen Wald, MD, said at the annual meeting of the American Academy of Pediatrics.
Dr. Wald, speaking to an audience that filled the lecture hall and an overflow room, said that there has long been good reason to turn to amoxicillin for AOM. “The reason that pediatricians and others like to reserve the use of amoxicillin as first-line therapy for children with AOM is that it is generally effective, it’s safe, it’s narrow in spectrum, and it’s relatively inexpensive. Those are all very desirable characteristics.”
However, the high-dose amoxicillin strategy is predicated on S. pneumoniae being the most likely cause of bacterial AOM. Since the seven-valent pneumococcal conjugate vaccine (PCV7), and then its successor PCV13, became part of the standard series of childhood immunizations, said Dr. Wald, the microbiology of AOM has shifted.
In 1990, S. pneumoniae was estimated to cause 35%-45% of AOM cases, with Haemophilus influenzae responsible for 25%-30% of cases. Moraxella catarrhalis was thought to cause 12%-15% of cases, with Streptococcus pyogenes–related AOM falling into the single digits.
In 2017, the balance has shifted, with S. pneumoniae only responsible for about a quarter of cases of AOM, and H. influenzae causing about half. The prevalence of M. catarrhalis and S. pyogenes cases hasn’t changed. This, said Dr. Wald, should prompt a shift in thinking about antibiotic strategy for AOM.
“The real problem with amoxicillin is that it’s not active against beta-lactamase–producing H. influenzae and M. catarrhalis. So my recommendation would be, rather than using amoxicillin, to use amoxicillin potassium clavulanate.”
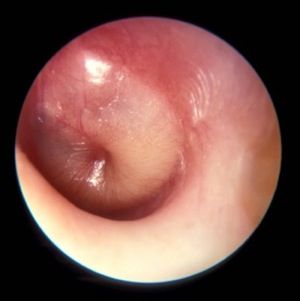
Dr. Wald said she can’t currently recommend using azithromycin to treat AOM. “Azithromycin and the other macrolides have almost no activity against H. influenzae,” she said. “So given the current situation with the high prevalence of H. influenzae, azithromycin really should be avoided in the management of AOM.”
For children with non–type 1 penicillin hypersensitivity or mild type 1 hypersensitivity, a second- or third-generation cephalosporin, such as cefuroxime, cefpodoxime, or cefdinir, can be considered, she said.
“For life-threatening type 1 hypersensitivity reactions, we like to choose a drug of an entirely different class. For that reason, levofloxacin might be something you’d consider,” in those cases, said Dr. Wald, making clear that this is not a Food and Drug Administration–approved indication. Levofloxacin does have the antimicrobial spectrum to cover AOM pathogens, she said.
When parenteral therapy is indicated, as when a child isn’t tolerating oral medications or when nonadherence is likely, a single dose of ceftriaxone IM or IV, dosed at 50 mg/kg, remains a good option. “It’s a suitable agent because all middle ear pathogens are susceptible to ceftriaxone,” said Dr. Wald.
When oral antibiotics are used, how long should they be given? Some experts, she said, recommend a 5-day course for older children who have had infrequent previous episodes of AOM. In this age group, the shorter course can still yield an excellent response, she said.
However, a 2016 study that tried a shortened course of amoxicillin/clavulanate for children 6-23 months of age found that clinical failure occurred in 34% of the patients who received 5 days of antibiotics, compared with 16% of those who got the full 10-day course. “The recommendation is pretty clear that, for children under 2 years of age, a 10-day course of therapy is best,” said Dr. Wald.
Dr. Wald reported that she had no conflicts of interest.
koakes@frontlinemedcom.com
On Twitter @karioakes
CHICAGO – Treating even uncomplicated acute otitis media (AOM) in 2017 may not be as simple as writing an amoxicillin prescription. Changes in pathogens may mean a shift in prescribing practices, Ellen Wald, MD, said at the annual meeting of the American Academy of Pediatrics.
Dr. Wald, speaking to an audience that filled the lecture hall and an overflow room, said that there has long been good reason to turn to amoxicillin for AOM. “The reason that pediatricians and others like to reserve the use of amoxicillin as first-line therapy for children with AOM is that it is generally effective, it’s safe, it’s narrow in spectrum, and it’s relatively inexpensive. Those are all very desirable characteristics.”
However, the high-dose amoxicillin strategy is predicated on S. pneumoniae being the most likely cause of bacterial AOM. Since the seven-valent pneumococcal conjugate vaccine (PCV7), and then its successor PCV13, became part of the standard series of childhood immunizations, said Dr. Wald, the microbiology of AOM has shifted.
In 1990, S. pneumoniae was estimated to cause 35%-45% of AOM cases, with Haemophilus influenzae responsible for 25%-30% of cases. Moraxella catarrhalis was thought to cause 12%-15% of cases, with Streptococcus pyogenes–related AOM falling into the single digits.
In 2017, the balance has shifted, with S. pneumoniae only responsible for about a quarter of cases of AOM, and H. influenzae causing about half. The prevalence of M. catarrhalis and S. pyogenes cases hasn’t changed. This, said Dr. Wald, should prompt a shift in thinking about antibiotic strategy for AOM.
“The real problem with amoxicillin is that it’s not active against beta-lactamase–producing H. influenzae and M. catarrhalis. So my recommendation would be, rather than using amoxicillin, to use amoxicillin potassium clavulanate.”
Dr. Wald said she can’t currently recommend using azithromycin to treat AOM. “Azithromycin and the other macrolides have almost no activity against H. influenzae,” she said. “So given the current situation with the high prevalence of H. influenzae, azithromycin really should be avoided in the management of AOM.”
For children with non–type 1 penicillin hypersensitivity or mild type 1 hypersensitivity, a second- or third-generation cephalosporin, such as cefuroxime, cefpodoxime, or cefdinir, can be considered, she said.
“For life-threatening type 1 hypersensitivity reactions, we like to choose a drug of an entirely different class. For that reason, levofloxacin might be something you’d consider,” in those cases, said Dr. Wald, making clear that this is not a Food and Drug Administration–approved indication. Levofloxacin does have the antimicrobial spectrum to cover AOM pathogens, she said.
When parenteral therapy is indicated, as when a child isn’t tolerating oral medications or when nonadherence is likely, a single dose of ceftriaxone IM or IV, dosed at 50 mg/kg, remains a good option. “It’s a suitable agent because all middle ear pathogens are susceptible to ceftriaxone,” said Dr. Wald.
When oral antibiotics are used, how long should they be given? Some experts, she said, recommend a 5-day course for older children who have had infrequent previous episodes of AOM. In this age group, the shorter course can still yield an excellent response, she said.
However, a 2016 study that tried a shortened course of amoxicillin/clavulanate for children 6-23 months of age found that clinical failure occurred in 34% of the patients who received 5 days of antibiotics, compared with 16% of those who got the full 10-day course. “The recommendation is pretty clear that, for children under 2 years of age, a 10-day course of therapy is best,” said Dr. Wald.
Dr. Wald reported that she had no conflicts of interest.
koakes@frontlinemedcom.com
On Twitter @karioakes
EXPERT ANALYSIS FROM AAP 2017