User login
How Does Fear of Falling Affect People in Middle Age?
Fear of falling may have less of an effect on gait and balance in adults younger than 65.
MIAMI—Healthy, middle-aged adults may have a fear of falling, but unlike in older adults, this fear does not appear to affect gait and balance, according to a study presented at the Second Pan American Parkinson’s Disease and Movement Disorders Congress.

Since ptophobia, the fear of standing or walking, was described in the 1980s, “fear of falling has gained recognition as a health problem of older adults,” said Maria Sheila G. Rocha, MD, PhD, a researcher at Hospital Santa Marcelina in São Paulo, Brazil, and colleagues. In adults older than 65, fear of falling increases the likelihood of falls and injury and limits daily activities. The incidence and impact of fear of falling in younger adults is not known, however.
Dr. Rocha and colleagues aimed to evaluate the prevalence of fear of falling among urban, middle-aged, healthy adults, as well as associated risk factors and fear of falling’s impact on gait and balance in this population.
Their study included 111 healthy participants ages 18 to 95 who lived in São Paulo. The investigators assessed fear of falling using the following four variables from the Brazilian version of the Falls Efficacy Scale-International: history of falls, functional dependency in activities of daily living, cognitive screening test, and activity level. The researchers assessed gait and balance using the Berg Balance Scale, Dynamic Gait Index, Short Physical Performance Battery, and the Performance Oriented Mobility Assessment.
Of the 111 participants, 52.2% were female, mean age was 51.8, and mean Mini-Mental State Examination score was 29.5. Fear of falling was present in 25.2%, and prevalence increased with age. Fear of falling was present in 18.4% of adults younger than 65 and in 48% of those 65 and older.
Fear of walking on an uneven surface and fear of going up or down a slope were the most common fear of falling variables. Being female and older were the main risk factors associated with fear of falling.
Participants with fear of falling performed worse on the Berg Balance Scale and Short Physical Performance Battery than those without. Those younger than 65, however, “had similar gait and balance performance despite the presence of fear of falling,” Dr. Rocha and colleagues said. In addition, physically active participants had less fear of falling.
“Fear of falling creates a psychologic barrier to performing activities for many older adults,” Dr. Rocha and colleagues said. The results suggest that physical activity is a protective factor against fear offalling, the researchers concluded.
Fear of falling may have less of an effect on gait and balance in adults younger than 65.
Fear of falling may have less of an effect on gait and balance in adults younger than 65.
MIAMI—Healthy, middle-aged adults may have a fear of falling, but unlike in older adults, this fear does not appear to affect gait and balance, according to a study presented at the Second Pan American Parkinson’s Disease and Movement Disorders Congress.
Since ptophobia, the fear of standing or walking, was described in the 1980s, “fear of falling has gained recognition as a health problem of older adults,” said Maria Sheila G. Rocha, MD, PhD, a researcher at Hospital Santa Marcelina in São Paulo, Brazil, and colleagues. In adults older than 65, fear of falling increases the likelihood of falls and injury and limits daily activities. The incidence and impact of fear of falling in younger adults is not known, however.
Dr. Rocha and colleagues aimed to evaluate the prevalence of fear of falling among urban, middle-aged, healthy adults, as well as associated risk factors and fear of falling’s impact on gait and balance in this population.
Their study included 111 healthy participants ages 18 to 95 who lived in São Paulo. The investigators assessed fear of falling using the following four variables from the Brazilian version of the Falls Efficacy Scale-International: history of falls, functional dependency in activities of daily living, cognitive screening test, and activity level. The researchers assessed gait and balance using the Berg Balance Scale, Dynamic Gait Index, Short Physical Performance Battery, and the Performance Oriented Mobility Assessment.
Of the 111 participants, 52.2% were female, mean age was 51.8, and mean Mini-Mental State Examination score was 29.5. Fear of falling was present in 25.2%, and prevalence increased with age. Fear of falling was present in 18.4% of adults younger than 65 and in 48% of those 65 and older.
Fear of walking on an uneven surface and fear of going up or down a slope were the most common fear of falling variables. Being female and older were the main risk factors associated with fear of falling.
Participants with fear of falling performed worse on the Berg Balance Scale and Short Physical Performance Battery than those without. Those younger than 65, however, “had similar gait and balance performance despite the presence of fear of falling,” Dr. Rocha and colleagues said. In addition, physically active participants had less fear of falling.
“Fear of falling creates a psychologic barrier to performing activities for many older adults,” Dr. Rocha and colleagues said. The results suggest that physical activity is a protective factor against fear offalling, the researchers concluded.
MIAMI—Healthy, middle-aged adults may have a fear of falling, but unlike in older adults, this fear does not appear to affect gait and balance, according to a study presented at the Second Pan American Parkinson’s Disease and Movement Disorders Congress.
Since ptophobia, the fear of standing or walking, was described in the 1980s, “fear of falling has gained recognition as a health problem of older adults,” said Maria Sheila G. Rocha, MD, PhD, a researcher at Hospital Santa Marcelina in São Paulo, Brazil, and colleagues. In adults older than 65, fear of falling increases the likelihood of falls and injury and limits daily activities. The incidence and impact of fear of falling in younger adults is not known, however.
Dr. Rocha and colleagues aimed to evaluate the prevalence of fear of falling among urban, middle-aged, healthy adults, as well as associated risk factors and fear of falling’s impact on gait and balance in this population.
Their study included 111 healthy participants ages 18 to 95 who lived in São Paulo. The investigators assessed fear of falling using the following four variables from the Brazilian version of the Falls Efficacy Scale-International: history of falls, functional dependency in activities of daily living, cognitive screening test, and activity level. The researchers assessed gait and balance using the Berg Balance Scale, Dynamic Gait Index, Short Physical Performance Battery, and the Performance Oriented Mobility Assessment.
Of the 111 participants, 52.2% were female, mean age was 51.8, and mean Mini-Mental State Examination score was 29.5. Fear of falling was present in 25.2%, and prevalence increased with age. Fear of falling was present in 18.4% of adults younger than 65 and in 48% of those 65 and older.
Fear of walking on an uneven surface and fear of going up or down a slope were the most common fear of falling variables. Being female and older were the main risk factors associated with fear of falling.
Participants with fear of falling performed worse on the Berg Balance Scale and Short Physical Performance Battery than those without. Those younger than 65, however, “had similar gait and balance performance despite the presence of fear of falling,” Dr. Rocha and colleagues said. In addition, physically active participants had less fear of falling.
“Fear of falling creates a psychologic barrier to performing activities for many older adults,” Dr. Rocha and colleagues said. The results suggest that physical activity is a protective factor against fear offalling, the researchers concluded.

Buprenorphine to treat opioid use disorder: A practical guide
Opioids were involved in 42,249 deaths in the United States in 2016, and opioid overdoses have quintupled since 1999.1 Among the causes behind these statistics is increased opiate prescribing by physicians—with primary care providers accounting for about one half of opiate prescriptions.2 As a result, the Centers for Disease Control and Prevention has issued a 4-part response for physicians,3 which includes careful opiate prescribing, expanded access to naloxone, prevention of opioid use disorder (OUD), and expanded use of medication-assisted treatment (MAT) of addiction—with the goal of preventing and managing OUD.
CASE
Fred R, a 55-year-old man who has been taking oxycodone, 70 mg/d, for chronic pain for longer than 10 years, visits your clinic for a prescription refill. His prescription monitoring program confirms the long history of regular oxycodone use, with the dosage escalating over the past 6 months. He recently was discharged from the hospital after an overdose of opiates.
Mr. R admits to using heroin after running out of oxycodone. He is in mild withdrawal, with a score of 8 (of a possible 48) on the Clinical Opioid Withdrawal Scale4 (COWS, which assigns point values to 11 common symptoms to gauge the severity of opioid withdrawal and, by inference, the patient’s degree of physical dependence). You determine that Mr. R is frightened about his use of oxycodone and would like to stop; he has tried to stop several times on his own but always relapses when withdrawal becomes severe.
How would you proceed with the care of this patient?
What is OUD? How is the diagnosis made?
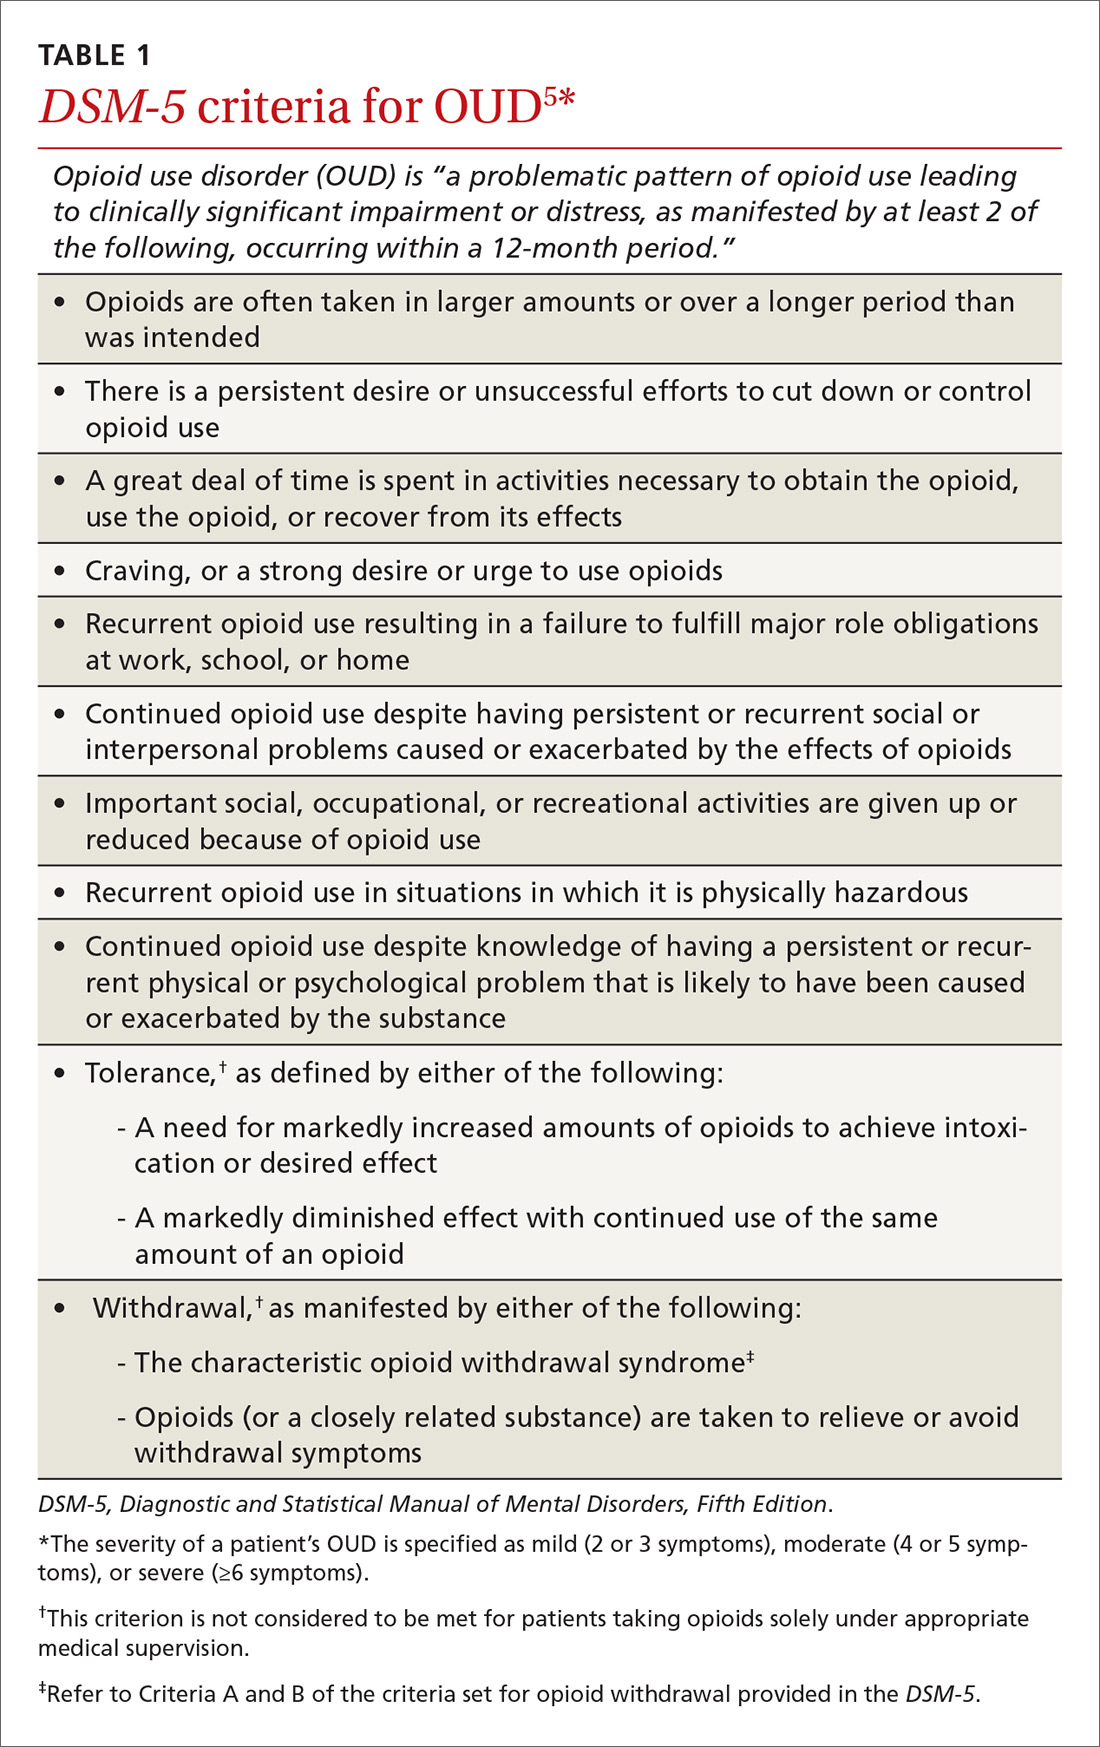
OUD is a combination of cognitive, behavioral, and physiologic symptoms arising from continued use of opioids despite significant health, legal, or relationship problems related to their use. The disorder is diagnosed based on specific criteria provided in the Diagnostic and Statistical Manual of Mental Disorders, Fifth Edition (DSM-5)(TABLE 1)5 and is revealed by 1) a careful history that delineates a problematic pattern of opioid use, 2) physical examination, and 3) urine toxicology screen.
Identification of acute opioid intoxication can also be useful when working up a patient in whom OUD is suspected; findings of acute opioid intoxication on physical examination include constricted pupils, head-nodding, excessive sleepiness, and drooping eyelids. Other physical signs of illicit opioid use include track marks around veins of the arm, evidence of repeated trauma, and stigmata of liver dysfunction. Withdrawal can present as agitation, rhinorrhea, dilated pupils, nausea, diarrhea, yawning, and gooseflesh. The COWS, which, as noted in the case, assigns point values to withdrawal symptoms, can be helpful in determining the severity of withdrawal.4
What is the differential Dx of OUD?
When OUD is likely, but not clearly diagnosable, on the basis of findings, consider a mental health disorder: depressive disorder, bipolar disorder, attention deficit–hyperactivity disorder, personality disorder, and polysubstance use disorder. Concurrent diagnosis of substance abuse and a mental health disorder is common; treatment requires that both disorders be addressed simultaneously.6 Assessing for use or abuse of, and addiction to, other substances is vital to ensure proper diagnosis and effective therapy. Polysubstance dependence can be more difficult to treat than single-substance abuse or addiction alone.
Continue to: How is OUD treated?
How is OUD treated?
This article reviews MAT with buprenorphine; other MAT options include methadone and naltrexone. Regardless of the indicated agent chosen, MAT has been shown to be superior to abstinence alone or abstinence with counseling interventions in maintaining sobriety.7
Evidence of efficacy. In a longitudinal cohort study of patients who received MAT with buprenorphine initiated in general practice, patients in whom buprenorphine therapy was interrupted had a greatly increased risk of all-cause mortality (hazard ratio=29.04; 95% confidence interval, 10.04-83.99).8 The study highlights the harm-reduction treatment philosophy of MAT with buprenorphine: The regimen can be used to keep a patient alive while working toward sobriety.
We encourage physicians to treat addiction as they would any chronic disease. The strategy includes anticipating relapse, engaging support systems (eg, family, counselors, social groups, Alcoholics Anonymous, Narcotics Anonymous [NA]), and working with the patient to obtain a higher level of care, as indicated.
Pharmacology and induction. Alone or in combination with naloxone, buprenorphine can be used as in-office-based MAT. Buprenorphine is a partial opiate agonist that binds tightly to opioid receptors and can block the effects of other opiates. An advantage of buprenorphine is its low likelihood of overdose, due to the drug’s so-called ceiling effect at a dosage of 24 mg/d;9 dosages above this amount have little increased medication effect.
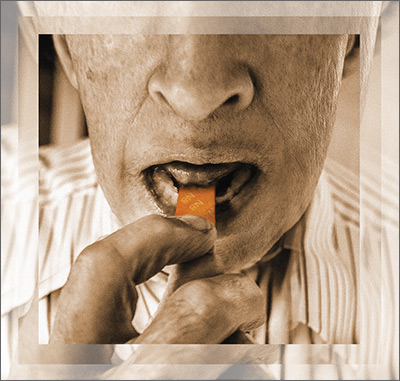
Dosing of buprenorphine is variable from patient to patient, with a maximum dosage of 24 mg/d. Therapy can be initiated safely at home, although some physicians prefer in-office induction. It is important that the patient be in moderate withdrawal (as determined by the score on the COWS) before initiation, because buprenorphine, as a partial agonist, can precipitate withdrawal by displacing full opiate agonists from opioid receptors.
Continue to: In our experience...
In our experience, a common induction method is to give 2 to 4 mg buprenorphine, followed by a 1-hour assessment of withdrawal symptoms. This can be repeated for multiple doses until withdrawal is relieved, usually with a maximum dosage of 6 to 8 mg in the initial 1 or 2 days of treatment. Rapid reassessment is required after induction, preferably in 1 to 3 days. Dosing should be gradually increased in 2- to 4-mg increments until 1) the patient has no withdrawal symptoms in a 24-hour period and 2) craving for opiates is adequately controlled.
Note: Primary care physicians must complete an 8-hour online training course to obtain a US Drug Enforcement Administration waiver to prescribe buprenorphine.
How should coordination of care be approached?
Actual prescribing and monitoring of buprenorphine is not complex, but many physicians are intimidated by the perceived difficulty of coordination of care. The American Society of Addiction Medicine's national practice guideline recommends that buprenorphine and other MAT protocols be offered as a part of a comprehensive treatment plan that includes psychosocial treatment.7 This combination leads to the greatest potential for ongoing remission of OUD. Although many primary care clinics do not have chemical dependency counseling available at their primary location, partnering with community organizations and other mental health resources can meet this need. Coordination of care with home services, behavioral health, and psychiatry is common in primary care, and is no different for OUD.
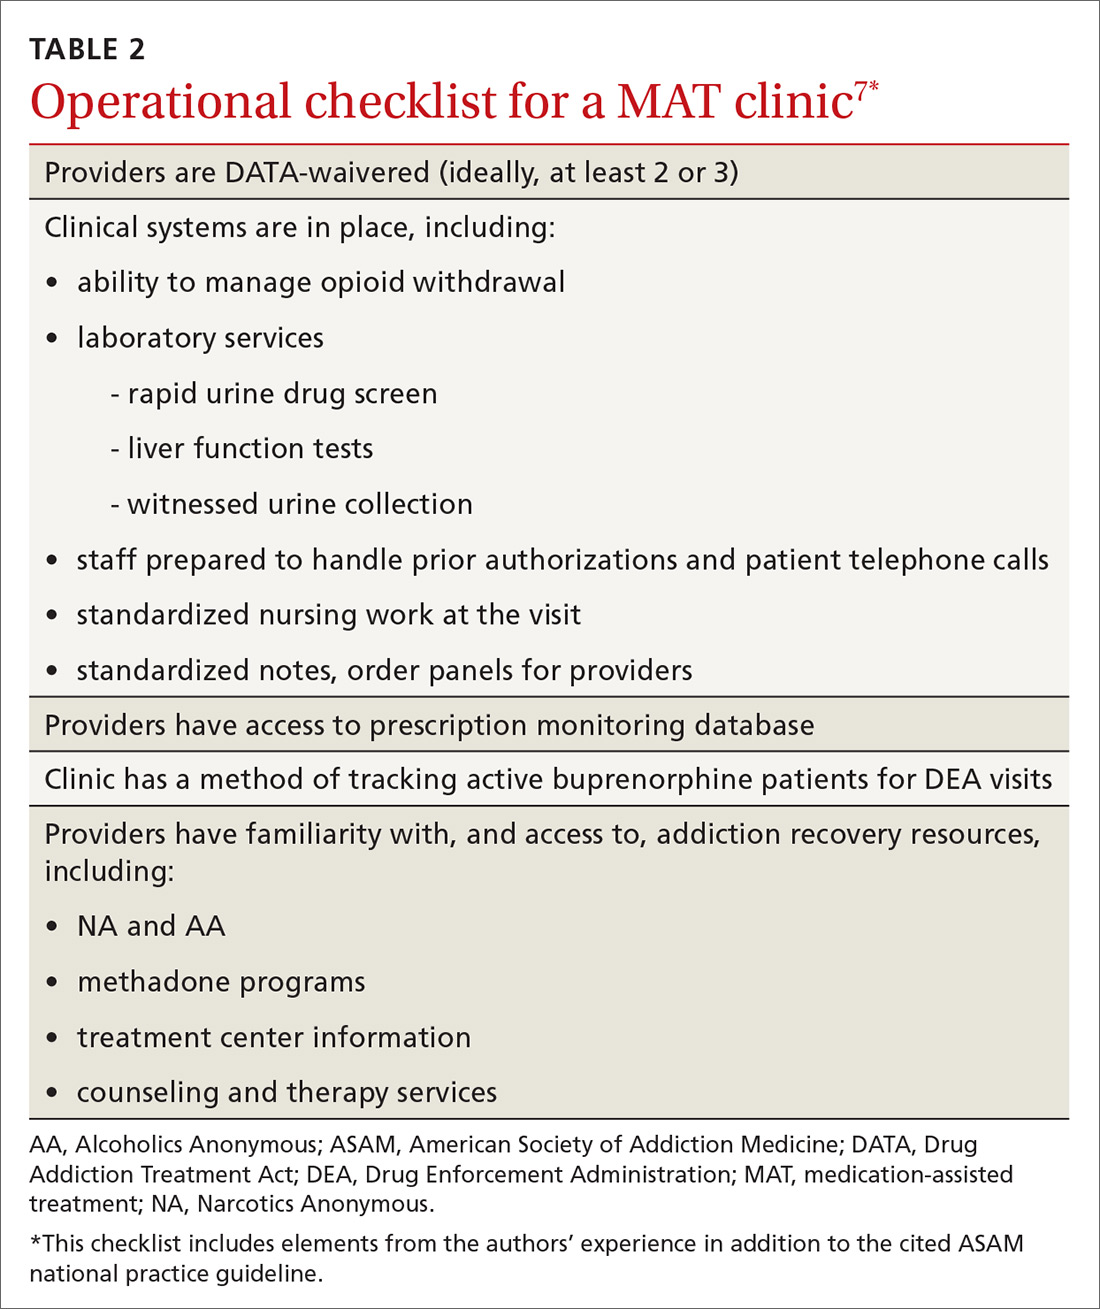
There are administrative requirements for a clinic that offers MAT (TABLE 2),7 including tracking of numbers of patients who are taking buprenorphine. During the first year of prescribing buprenorphine, a physician or other provider is permitted to care for only 30 patients; once the first year has passed, that provider can apply to care for as many as 100 patients. In addition, the Drug Enforcement Administration might conduct site visits to ensure that proper documentation and tracking of patients is being undertaken. These requirements can seem daunting, but careful monitoring of patient panels can alleviate concerns. For clinics that use an electronic medical record, we recommend developing the capability to pull lists by either buprenorphine prescriptions or diagnosis codes.
Continue to: CASE
CASE
After you and Mr. R discuss his addiction, you decide to initiate treatment that includes buprenorphine. You have a specimen collected for a urine toxicology screen and blood drawn for a baseline liver function panel, hepatitis panel, and human immunodeficiency virus screen, and provide him with resources (nearby treatment center, an NA meeting location) for treating OUD. You write a prescription for #8 buprenorphine and naloxone, 2 mg/0.5 mg films, and instruct Mr. R to: take 1 film when withdrawal symptoms become worse; wait 1 hour; and take another film if he is still experiencing withdrawal symptoms. He can repeat this dosing regimen until he reaches 8 mg/d of buprenorphine (4 films). You schedule follow-up in 2 days.
At follow-up, the patient reports that taking 3 films alleviated withdrawal symptoms, but that symptoms returned approximately 12 hours later, at which time he took the fourth film. This helped him through until the next day, when he again took 3 films in the morning and 1 film in the late evening. He feels that this regimen is helping relieve withdrawal symptoms and cravings. You provide a prescription for buprenorphine and naloxone, 8 mg/2 mg daily, and request a follow-up visit in 5 days.
At the next visit, Mr. R reports that he still has cravings for oxycodone. You increase the dosage of buprenorphine and naloxone to 12 mg/3 mg daily.
At the next visit, he reports no longer having cravings.
You continue to monitor Mr. R with urine drug screening and discussion of his recovery with the help of his family and support network. After 3 months of consistent visits, he fails to show up for his every-2-or-3-week appointment.
Continue to: Four days later...
Four days later, Mr. R shows up at the clinic, apologizing for missing the appointment and assuring you that this won’t happen again. Rapid urine drug screening is positive for morphine. When confronted, he admits using heroin. He reports that his cravings had increased, for which he took buprenorphine and naloxone above the prescribed dosage, and ran out of films early. He then used heroin 3 times to prevent withdrawal.
Mr. R admits that he has been having cravings for oxycodone since the start of treatment for addiction, but thought he was strong enough to overcome the cravings. He feels disappointed and embarrassed about this; he wants to continue with buprenorphine, he tells you, but worries that you will refuse to continue seeing him now.
Using shared decision-making, you opt to increase the buprenorphine dosage by 4 mg (to 16 mg/d—ie, 2 films of buprenorphine and naloxone, 8 mg/2 mg) to alleviate cravings. You instruct him to engage his support network, including his family and NA sponsor, and to start outpatient group therapy. He tells you that he is willing to go back to weekly clinic visits until he is stabilized.
CORRESPONDENCE
Tanner Nissly, DO, University of Minnesota Medical School Twin Cities, Department of Family Medicine and Community Health, 1020 West Broadway Avenue, Minneapolis, MN 55411; nissl003@umn.edu.
1. Centers for Disease Control and Prevention. Opioid overdose. December 19, 2017. Available at: www.cdc.gov/drugoverdose/data/statedeaths.html. Accessed June 22, 2018.
2. Daubresse M, Chang H, Yu Y, et al. Ambulatory diagnosis and treatment of nonmalignant pain in the United States, 2000-2010. Med Care. 2013;51:870-878.
3. Centers for Disease Control and Prevention. Overdose prevention. August 31, 2017. Available at: www.cdc.gov/drugoverdose/prevention/index.html. Accessed June 29, 2018.
4. Wesson DR, Ling W. The Clinical Opiate Withdrawal Scale (COWS). J Psychoactive Drugs. 2003;35:253-259. Available at: www.drugabuse.gov/sites/default/files/files/ClinicalOpiateWithdrawalScale.pdf. Accessed June 22, 2018.
5. Opioid use disorder: Diagnostic criteria. In: Diagnostic and Statistical Manual of Mental Disorders, Fifth Edition (DSM-5). Washington, DC: American Psychiatric Association; 2013. Available at: http://pcssnow.org/wp-content/uploads/2014/02/5B-DSM-5-Opioid-Use-Disorder-Diagnostic-Criteria.pdf. Accessed June 23, 2018.
6. Brunette MF, Mueser KT. Psychosocial interventions for the long-term management of patients with severe mental illness and co-occurring substance use disorder. J Clin Psychiatry. 2006;67(Suppl 7):10-17.
7. Kampman K, Abraham A, Dugosh K, et al; ASAM Quality Improvement Council. The ASAM National Practice Guideline for the Use of Medications in the Treatment of Addiction Involving Opioid Use. Chevy Chase, MD: American Society of Addiction Medicine; 2015. Available at: www.asam.org/docs/default-source/practice-support/guidelines-and-consensus-docs/asam-national-practice-guideline-supplement.pdf. Accessed June 22, 2018.
8. Depouy J, Palmaro A, Fatséas M, et al. Mortality associated with time in and out of buprenorphine treatment in French office-based general practice: A 7-year cohort study. Ann Fam Med. 2017;15:355-358.
9. Walsh SL, Preston KL, Stitzer ML, et al. Clinical pharmacology of buprenorphine: ceiling effects at high doses. Clin Pharmacol Ther. 1994;55:569-580.
Opioids were involved in 42,249 deaths in the United States in 2016, and opioid overdoses have quintupled since 1999.1 Among the causes behind these statistics is increased opiate prescribing by physicians—with primary care providers accounting for about one half of opiate prescriptions.2 As a result, the Centers for Disease Control and Prevention has issued a 4-part response for physicians,3 which includes careful opiate prescribing, expanded access to naloxone, prevention of opioid use disorder (OUD), and expanded use of medication-assisted treatment (MAT) of addiction—with the goal of preventing and managing OUD.
CASE
Fred R, a 55-year-old man who has been taking oxycodone, 70 mg/d, for chronic pain for longer than 10 years, visits your clinic for a prescription refill. His prescription monitoring program confirms the long history of regular oxycodone use, with the dosage escalating over the past 6 months. He recently was discharged from the hospital after an overdose of opiates.
Mr. R admits to using heroin after running out of oxycodone. He is in mild withdrawal, with a score of 8 (of a possible 48) on the Clinical Opioid Withdrawal Scale4 (COWS, which assigns point values to 11 common symptoms to gauge the severity of opioid withdrawal and, by inference, the patient’s degree of physical dependence). You determine that Mr. R is frightened about his use of oxycodone and would like to stop; he has tried to stop several times on his own but always relapses when withdrawal becomes severe.
How would you proceed with the care of this patient?
What is OUD? How is the diagnosis made?
OUD is a combination of cognitive, behavioral, and physiologic symptoms arising from continued use of opioids despite significant health, legal, or relationship problems related to their use. The disorder is diagnosed based on specific criteria provided in the Diagnostic and Statistical Manual of Mental Disorders, Fifth Edition (DSM-5)(TABLE 1)5 and is revealed by 1) a careful history that delineates a problematic pattern of opioid use, 2) physical examination, and 3) urine toxicology screen.
Identification of acute opioid intoxication can also be useful when working up a patient in whom OUD is suspected; findings of acute opioid intoxication on physical examination include constricted pupils, head-nodding, excessive sleepiness, and drooping eyelids. Other physical signs of illicit opioid use include track marks around veins of the arm, evidence of repeated trauma, and stigmata of liver dysfunction. Withdrawal can present as agitation, rhinorrhea, dilated pupils, nausea, diarrhea, yawning, and gooseflesh. The COWS, which, as noted in the case, assigns point values to withdrawal symptoms, can be helpful in determining the severity of withdrawal.4
What is the differential Dx of OUD?
When OUD is likely, but not clearly diagnosable, on the basis of findings, consider a mental health disorder: depressive disorder, bipolar disorder, attention deficit–hyperactivity disorder, personality disorder, and polysubstance use disorder. Concurrent diagnosis of substance abuse and a mental health disorder is common; treatment requires that both disorders be addressed simultaneously.6 Assessing for use or abuse of, and addiction to, other substances is vital to ensure proper diagnosis and effective therapy. Polysubstance dependence can be more difficult to treat than single-substance abuse or addiction alone.
Continue to: How is OUD treated?
How is OUD treated?
This article reviews MAT with buprenorphine; other MAT options include methadone and naltrexone. Regardless of the indicated agent chosen, MAT has been shown to be superior to abstinence alone or abstinence with counseling interventions in maintaining sobriety.7
Evidence of efficacy. In a longitudinal cohort study of patients who received MAT with buprenorphine initiated in general practice, patients in whom buprenorphine therapy was interrupted had a greatly increased risk of all-cause mortality (hazard ratio=29.04; 95% confidence interval, 10.04-83.99).8 The study highlights the harm-reduction treatment philosophy of MAT with buprenorphine: The regimen can be used to keep a patient alive while working toward sobriety.
We encourage physicians to treat addiction as they would any chronic disease. The strategy includes anticipating relapse, engaging support systems (eg, family, counselors, social groups, Alcoholics Anonymous, Narcotics Anonymous [NA]), and working with the patient to obtain a higher level of care, as indicated.
Pharmacology and induction. Alone or in combination with naloxone, buprenorphine can be used as in-office-based MAT. Buprenorphine is a partial opiate agonist that binds tightly to opioid receptors and can block the effects of other opiates. An advantage of buprenorphine is its low likelihood of overdose, due to the drug’s so-called ceiling effect at a dosage of 24 mg/d;9 dosages above this amount have little increased medication effect.
Dosing of buprenorphine is variable from patient to patient, with a maximum dosage of 24 mg/d. Therapy can be initiated safely at home, although some physicians prefer in-office induction. It is important that the patient be in moderate withdrawal (as determined by the score on the COWS) before initiation, because buprenorphine, as a partial agonist, can precipitate withdrawal by displacing full opiate agonists from opioid receptors.
Continue to: In our experience...
In our experience, a common induction method is to give 2 to 4 mg buprenorphine, followed by a 1-hour assessment of withdrawal symptoms. This can be repeated for multiple doses until withdrawal is relieved, usually with a maximum dosage of 6 to 8 mg in the initial 1 or 2 days of treatment. Rapid reassessment is required after induction, preferably in 1 to 3 days. Dosing should be gradually increased in 2- to 4-mg increments until 1) the patient has no withdrawal symptoms in a 24-hour period and 2) craving for opiates is adequately controlled.
Note: Primary care physicians must complete an 8-hour online training course to obtain a US Drug Enforcement Administration waiver to prescribe buprenorphine.
How should coordination of care be approached?
Actual prescribing and monitoring of buprenorphine is not complex, but many physicians are intimidated by the perceived difficulty of coordination of care. The American Society of Addiction Medicine's national practice guideline recommends that buprenorphine and other MAT protocols be offered as a part of a comprehensive treatment plan that includes psychosocial treatment.7 This combination leads to the greatest potential for ongoing remission of OUD. Although many primary care clinics do not have chemical dependency counseling available at their primary location, partnering with community organizations and other mental health resources can meet this need. Coordination of care with home services, behavioral health, and psychiatry is common in primary care, and is no different for OUD.
There are administrative requirements for a clinic that offers MAT (TABLE 2),7 including tracking of numbers of patients who are taking buprenorphine. During the first year of prescribing buprenorphine, a physician or other provider is permitted to care for only 30 patients; once the first year has passed, that provider can apply to care for as many as 100 patients. In addition, the Drug Enforcement Administration might conduct site visits to ensure that proper documentation and tracking of patients is being undertaken. These requirements can seem daunting, but careful monitoring of patient panels can alleviate concerns. For clinics that use an electronic medical record, we recommend developing the capability to pull lists by either buprenorphine prescriptions or diagnosis codes.
Continue to: CASE
CASE
After you and Mr. R discuss his addiction, you decide to initiate treatment that includes buprenorphine. You have a specimen collected for a urine toxicology screen and blood drawn for a baseline liver function panel, hepatitis panel, and human immunodeficiency virus screen, and provide him with resources (nearby treatment center, an NA meeting location) for treating OUD. You write a prescription for #8 buprenorphine and naloxone, 2 mg/0.5 mg films, and instruct Mr. R to: take 1 film when withdrawal symptoms become worse; wait 1 hour; and take another film if he is still experiencing withdrawal symptoms. He can repeat this dosing regimen until he reaches 8 mg/d of buprenorphine (4 films). You schedule follow-up in 2 days.
At follow-up, the patient reports that taking 3 films alleviated withdrawal symptoms, but that symptoms returned approximately 12 hours later, at which time he took the fourth film. This helped him through until the next day, when he again took 3 films in the morning and 1 film in the late evening. He feels that this regimen is helping relieve withdrawal symptoms and cravings. You provide a prescription for buprenorphine and naloxone, 8 mg/2 mg daily, and request a follow-up visit in 5 days.
At the next visit, Mr. R reports that he still has cravings for oxycodone. You increase the dosage of buprenorphine and naloxone to 12 mg/3 mg daily.
At the next visit, he reports no longer having cravings.
You continue to monitor Mr. R with urine drug screening and discussion of his recovery with the help of his family and support network. After 3 months of consistent visits, he fails to show up for his every-2-or-3-week appointment.
Continue to: Four days later...
Four days later, Mr. R shows up at the clinic, apologizing for missing the appointment and assuring you that this won’t happen again. Rapid urine drug screening is positive for morphine. When confronted, he admits using heroin. He reports that his cravings had increased, for which he took buprenorphine and naloxone above the prescribed dosage, and ran out of films early. He then used heroin 3 times to prevent withdrawal.
Mr. R admits that he has been having cravings for oxycodone since the start of treatment for addiction, but thought he was strong enough to overcome the cravings. He feels disappointed and embarrassed about this; he wants to continue with buprenorphine, he tells you, but worries that you will refuse to continue seeing him now.
Using shared decision-making, you opt to increase the buprenorphine dosage by 4 mg (to 16 mg/d—ie, 2 films of buprenorphine and naloxone, 8 mg/2 mg) to alleviate cravings. You instruct him to engage his support network, including his family and NA sponsor, and to start outpatient group therapy. He tells you that he is willing to go back to weekly clinic visits until he is stabilized.
CORRESPONDENCE
Tanner Nissly, DO, University of Minnesota Medical School Twin Cities, Department of Family Medicine and Community Health, 1020 West Broadway Avenue, Minneapolis, MN 55411; nissl003@umn.edu.
Opioids were involved in 42,249 deaths in the United States in 2016, and opioid overdoses have quintupled since 1999.1 Among the causes behind these statistics is increased opiate prescribing by physicians—with primary care providers accounting for about one half of opiate prescriptions.2 As a result, the Centers for Disease Control and Prevention has issued a 4-part response for physicians,3 which includes careful opiate prescribing, expanded access to naloxone, prevention of opioid use disorder (OUD), and expanded use of medication-assisted treatment (MAT) of addiction—with the goal of preventing and managing OUD.
CASE
Fred R, a 55-year-old man who has been taking oxycodone, 70 mg/d, for chronic pain for longer than 10 years, visits your clinic for a prescription refill. His prescription monitoring program confirms the long history of regular oxycodone use, with the dosage escalating over the past 6 months. He recently was discharged from the hospital after an overdose of opiates.
Mr. R admits to using heroin after running out of oxycodone. He is in mild withdrawal, with a score of 8 (of a possible 48) on the Clinical Opioid Withdrawal Scale4 (COWS, which assigns point values to 11 common symptoms to gauge the severity of opioid withdrawal and, by inference, the patient’s degree of physical dependence). You determine that Mr. R is frightened about his use of oxycodone and would like to stop; he has tried to stop several times on his own but always relapses when withdrawal becomes severe.
How would you proceed with the care of this patient?
What is OUD? How is the diagnosis made?
OUD is a combination of cognitive, behavioral, and physiologic symptoms arising from continued use of opioids despite significant health, legal, or relationship problems related to their use. The disorder is diagnosed based on specific criteria provided in the Diagnostic and Statistical Manual of Mental Disorders, Fifth Edition (DSM-5)(TABLE 1)5 and is revealed by 1) a careful history that delineates a problematic pattern of opioid use, 2) physical examination, and 3) urine toxicology screen.
Identification of acute opioid intoxication can also be useful when working up a patient in whom OUD is suspected; findings of acute opioid intoxication on physical examination include constricted pupils, head-nodding, excessive sleepiness, and drooping eyelids. Other physical signs of illicit opioid use include track marks around veins of the arm, evidence of repeated trauma, and stigmata of liver dysfunction. Withdrawal can present as agitation, rhinorrhea, dilated pupils, nausea, diarrhea, yawning, and gooseflesh. The COWS, which, as noted in the case, assigns point values to withdrawal symptoms, can be helpful in determining the severity of withdrawal.4
What is the differential Dx of OUD?
When OUD is likely, but not clearly diagnosable, on the basis of findings, consider a mental health disorder: depressive disorder, bipolar disorder, attention deficit–hyperactivity disorder, personality disorder, and polysubstance use disorder. Concurrent diagnosis of substance abuse and a mental health disorder is common; treatment requires that both disorders be addressed simultaneously.6 Assessing for use or abuse of, and addiction to, other substances is vital to ensure proper diagnosis and effective therapy. Polysubstance dependence can be more difficult to treat than single-substance abuse or addiction alone.
Continue to: How is OUD treated?
How is OUD treated?
This article reviews MAT with buprenorphine; other MAT options include methadone and naltrexone. Regardless of the indicated agent chosen, MAT has been shown to be superior to abstinence alone or abstinence with counseling interventions in maintaining sobriety.7
Evidence of efficacy. In a longitudinal cohort study of patients who received MAT with buprenorphine initiated in general practice, patients in whom buprenorphine therapy was interrupted had a greatly increased risk of all-cause mortality (hazard ratio=29.04; 95% confidence interval, 10.04-83.99).8 The study highlights the harm-reduction treatment philosophy of MAT with buprenorphine: The regimen can be used to keep a patient alive while working toward sobriety.
We encourage physicians to treat addiction as they would any chronic disease. The strategy includes anticipating relapse, engaging support systems (eg, family, counselors, social groups, Alcoholics Anonymous, Narcotics Anonymous [NA]), and working with the patient to obtain a higher level of care, as indicated.
Pharmacology and induction. Alone or in combination with naloxone, buprenorphine can be used as in-office-based MAT. Buprenorphine is a partial opiate agonist that binds tightly to opioid receptors and can block the effects of other opiates. An advantage of buprenorphine is its low likelihood of overdose, due to the drug’s so-called ceiling effect at a dosage of 24 mg/d;9 dosages above this amount have little increased medication effect.
Dosing of buprenorphine is variable from patient to patient, with a maximum dosage of 24 mg/d. Therapy can be initiated safely at home, although some physicians prefer in-office induction. It is important that the patient be in moderate withdrawal (as determined by the score on the COWS) before initiation, because buprenorphine, as a partial agonist, can precipitate withdrawal by displacing full opiate agonists from opioid receptors.
Continue to: In our experience...
In our experience, a common induction method is to give 2 to 4 mg buprenorphine, followed by a 1-hour assessment of withdrawal symptoms. This can be repeated for multiple doses until withdrawal is relieved, usually with a maximum dosage of 6 to 8 mg in the initial 1 or 2 days of treatment. Rapid reassessment is required after induction, preferably in 1 to 3 days. Dosing should be gradually increased in 2- to 4-mg increments until 1) the patient has no withdrawal symptoms in a 24-hour period and 2) craving for opiates is adequately controlled.
Note: Primary care physicians must complete an 8-hour online training course to obtain a US Drug Enforcement Administration waiver to prescribe buprenorphine.
How should coordination of care be approached?
Actual prescribing and monitoring of buprenorphine is not complex, but many physicians are intimidated by the perceived difficulty of coordination of care. The American Society of Addiction Medicine's national practice guideline recommends that buprenorphine and other MAT protocols be offered as a part of a comprehensive treatment plan that includes psychosocial treatment.7 This combination leads to the greatest potential for ongoing remission of OUD. Although many primary care clinics do not have chemical dependency counseling available at their primary location, partnering with community organizations and other mental health resources can meet this need. Coordination of care with home services, behavioral health, and psychiatry is common in primary care, and is no different for OUD.
There are administrative requirements for a clinic that offers MAT (TABLE 2),7 including tracking of numbers of patients who are taking buprenorphine. During the first year of prescribing buprenorphine, a physician or other provider is permitted to care for only 30 patients; once the first year has passed, that provider can apply to care for as many as 100 patients. In addition, the Drug Enforcement Administration might conduct site visits to ensure that proper documentation and tracking of patients is being undertaken. These requirements can seem daunting, but careful monitoring of patient panels can alleviate concerns. For clinics that use an electronic medical record, we recommend developing the capability to pull lists by either buprenorphine prescriptions or diagnosis codes.
Continue to: CASE
CASE
After you and Mr. R discuss his addiction, you decide to initiate treatment that includes buprenorphine. You have a specimen collected for a urine toxicology screen and blood drawn for a baseline liver function panel, hepatitis panel, and human immunodeficiency virus screen, and provide him with resources (nearby treatment center, an NA meeting location) for treating OUD. You write a prescription for #8 buprenorphine and naloxone, 2 mg/0.5 mg films, and instruct Mr. R to: take 1 film when withdrawal symptoms become worse; wait 1 hour; and take another film if he is still experiencing withdrawal symptoms. He can repeat this dosing regimen until he reaches 8 mg/d of buprenorphine (4 films). You schedule follow-up in 2 days.
At follow-up, the patient reports that taking 3 films alleviated withdrawal symptoms, but that symptoms returned approximately 12 hours later, at which time he took the fourth film. This helped him through until the next day, when he again took 3 films in the morning and 1 film in the late evening. He feels that this regimen is helping relieve withdrawal symptoms and cravings. You provide a prescription for buprenorphine and naloxone, 8 mg/2 mg daily, and request a follow-up visit in 5 days.
At the next visit, Mr. R reports that he still has cravings for oxycodone. You increase the dosage of buprenorphine and naloxone to 12 mg/3 mg daily.
At the next visit, he reports no longer having cravings.
You continue to monitor Mr. R with urine drug screening and discussion of his recovery with the help of his family and support network. After 3 months of consistent visits, he fails to show up for his every-2-or-3-week appointment.
Continue to: Four days later...
Four days later, Mr. R shows up at the clinic, apologizing for missing the appointment and assuring you that this won’t happen again. Rapid urine drug screening is positive for morphine. When confronted, he admits using heroin. He reports that his cravings had increased, for which he took buprenorphine and naloxone above the prescribed dosage, and ran out of films early. He then used heroin 3 times to prevent withdrawal.
Mr. R admits that he has been having cravings for oxycodone since the start of treatment for addiction, but thought he was strong enough to overcome the cravings. He feels disappointed and embarrassed about this; he wants to continue with buprenorphine, he tells you, but worries that you will refuse to continue seeing him now.
Using shared decision-making, you opt to increase the buprenorphine dosage by 4 mg (to 16 mg/d—ie, 2 films of buprenorphine and naloxone, 8 mg/2 mg) to alleviate cravings. You instruct him to engage his support network, including his family and NA sponsor, and to start outpatient group therapy. He tells you that he is willing to go back to weekly clinic visits until he is stabilized.
CORRESPONDENCE
Tanner Nissly, DO, University of Minnesota Medical School Twin Cities, Department of Family Medicine and Community Health, 1020 West Broadway Avenue, Minneapolis, MN 55411; nissl003@umn.edu.
1. Centers for Disease Control and Prevention. Opioid overdose. December 19, 2017. Available at: www.cdc.gov/drugoverdose/data/statedeaths.html. Accessed June 22, 2018.
2. Daubresse M, Chang H, Yu Y, et al. Ambulatory diagnosis and treatment of nonmalignant pain in the United States, 2000-2010. Med Care. 2013;51:870-878.
3. Centers for Disease Control and Prevention. Overdose prevention. August 31, 2017. Available at: www.cdc.gov/drugoverdose/prevention/index.html. Accessed June 29, 2018.
4. Wesson DR, Ling W. The Clinical Opiate Withdrawal Scale (COWS). J Psychoactive Drugs. 2003;35:253-259. Available at: www.drugabuse.gov/sites/default/files/files/ClinicalOpiateWithdrawalScale.pdf. Accessed June 22, 2018.
5. Opioid use disorder: Diagnostic criteria. In: Diagnostic and Statistical Manual of Mental Disorders, Fifth Edition (DSM-5). Washington, DC: American Psychiatric Association; 2013. Available at: http://pcssnow.org/wp-content/uploads/2014/02/5B-DSM-5-Opioid-Use-Disorder-Diagnostic-Criteria.pdf. Accessed June 23, 2018.
6. Brunette MF, Mueser KT. Psychosocial interventions for the long-term management of patients with severe mental illness and co-occurring substance use disorder. J Clin Psychiatry. 2006;67(Suppl 7):10-17.
7. Kampman K, Abraham A, Dugosh K, et al; ASAM Quality Improvement Council. The ASAM National Practice Guideline for the Use of Medications in the Treatment of Addiction Involving Opioid Use. Chevy Chase, MD: American Society of Addiction Medicine; 2015. Available at: www.asam.org/docs/default-source/practice-support/guidelines-and-consensus-docs/asam-national-practice-guideline-supplement.pdf. Accessed June 22, 2018.
8. Depouy J, Palmaro A, Fatséas M, et al. Mortality associated with time in and out of buprenorphine treatment in French office-based general practice: A 7-year cohort study. Ann Fam Med. 2017;15:355-358.
9. Walsh SL, Preston KL, Stitzer ML, et al. Clinical pharmacology of buprenorphine: ceiling effects at high doses. Clin Pharmacol Ther. 1994;55:569-580.
1. Centers for Disease Control and Prevention. Opioid overdose. December 19, 2017. Available at: www.cdc.gov/drugoverdose/data/statedeaths.html. Accessed June 22, 2018.
2. Daubresse M, Chang H, Yu Y, et al. Ambulatory diagnosis and treatment of nonmalignant pain in the United States, 2000-2010. Med Care. 2013;51:870-878.
3. Centers for Disease Control and Prevention. Overdose prevention. August 31, 2017. Available at: www.cdc.gov/drugoverdose/prevention/index.html. Accessed June 29, 2018.
4. Wesson DR, Ling W. The Clinical Opiate Withdrawal Scale (COWS). J Psychoactive Drugs. 2003;35:253-259. Available at: www.drugabuse.gov/sites/default/files/files/ClinicalOpiateWithdrawalScale.pdf. Accessed June 22, 2018.
5. Opioid use disorder: Diagnostic criteria. In: Diagnostic and Statistical Manual of Mental Disorders, Fifth Edition (DSM-5). Washington, DC: American Psychiatric Association; 2013. Available at: http://pcssnow.org/wp-content/uploads/2014/02/5B-DSM-5-Opioid-Use-Disorder-Diagnostic-Criteria.pdf. Accessed June 23, 2018.
6. Brunette MF, Mueser KT. Psychosocial interventions for the long-term management of patients with severe mental illness and co-occurring substance use disorder. J Clin Psychiatry. 2006;67(Suppl 7):10-17.
7. Kampman K, Abraham A, Dugosh K, et al; ASAM Quality Improvement Council. The ASAM National Practice Guideline for the Use of Medications in the Treatment of Addiction Involving Opioid Use. Chevy Chase, MD: American Society of Addiction Medicine; 2015. Available at: www.asam.org/docs/default-source/practice-support/guidelines-and-consensus-docs/asam-national-practice-guideline-supplement.pdf. Accessed June 22, 2018.
8. Depouy J, Palmaro A, Fatséas M, et al. Mortality associated with time in and out of buprenorphine treatment in French office-based general practice: A 7-year cohort study. Ann Fam Med. 2017;15:355-358.
9. Walsh SL, Preston KL, Stitzer ML, et al. Clinical pharmacology of buprenorphine: ceiling effects at high doses. Clin Pharmacol Ther. 1994;55:569-580.
PRACTICE RECOMMENDATIONS
› Use signs of intoxication, signs of withdrawal, urine drug screening, and diagnostic criteria from the Diagnostic and Statistical Manual of Mental Disorders, Fifth Edition, to screen for, and diagnose, opioid use disorder. C
› Offer and institute medication-assisted treatment when appropriate to reduce the risk of opioid-related and overall mortality in patients with opioid use disorder. A
› Identify and treat comorbid psychiatric disorders in patients with opioid use disorder, which provides benefit during treatment of the disorder. A
Strength of recommendation (SOR)
A Good-quality patient-oriented evidence
B Inconsistent or limited-quality patient-oriented evidence
C Consensus, usual practice, opinion, disease-oriented evidence, case series

36% of soldiers who attempt suicide have no mental health diagnosis
About one-third of enlisted soldiers who attempt suicide do not have a history of mental illness, say the authors of a retrospective longitudinal study among U.S. Army personnel.
However, health care use, exposure to violent crime, and first year of service all were significantly associated with suicide attempts.
The study, published online Aug. 29 in JAMA Psychiatry, analyzed administrative data from the Army Study to Assess Risk and Resilience in Servicemembers (Army STARRS) for 9,650 enlisted soldiers (74.8% male) who had a documented suicide attempt.
Overall, 36.3% of the soldiers studied who attempted suicide did not have a previous diagnosis of a mental health disorder. Having a history of mental illness was associated with sixfold higher odds of suicide attempt after adjusting for sociodemographic and service-related variables.
Among those without a history of mental health disorders, the first year of service was associated with sixfold higher odds of a suicide attempt (95% confidence interval, 4.7-7.7), and nearly 60% of those without a previous diagnosis who attempted suicide did so in their first year of service.
“This factor is noteworthy, because, as in the general population, most transitions from ideation to attempt among soldiers occur within 1 year of ideation onset,” wrote Robert J. Ursano, MD, professor of psychiatry and neurosciences at the Center for the Study of Traumatic Stress at the Uniformed Services University of the Health Sciences, Bethesda, Md., and his coauthors.
Among individuals without a history of mental health disorders, women had 2.6-fold higher odds (95% CI, 2.4-2.8) of a suicide attempt. The authors suggested that these
“Given the large proportion of first-year soldiers in the group without previous [mental health diagnosis], it is possible that women face additional stressors and challenges in the initial months of service,” they wrote.
Previous deployment was associated with 2.4-fold higher odds of suicide attempt; a 2-month delay in promotion was associated with 2.1-fold higher odds. In addition, a demotion in the past year was associated with 60% higher odds of a suicide attempt.
Health care use also showed associations with suicide attempts. Individuals who had visited outpatient services eight or more times in the past 2 months had more than threefold higher odds of suicide attempt. Those with an injury-related visit to outpatient services in the previous month had threefold higher odds, and those who had an injury-related visit to inpatient services had a 3.8-fold higher odds.
Exposure to minor violent crime and perpetration of major violent crime or family violence also were associated with higher odds of suicide attempt.
The authors cited several limitations. One is that the study did not capture unreported suicide attempts, mental disorders, or crimes.
The Army STARRS was supported by the Department of the Army, the U.S. Department of Health & Human Services, the National Institutes of Health, the National Institute of Mental Health and the Department of Defense. Two authors were employed by the NIMH, and two were Army liaisons or consultants.
SOURCE: Ursano RJ et al. JAMA Psychiatry. 2018 Aug 29. doi: 10.1001/jamapsychiatry.2018.2069.
An increase in suicide rates in the Army during the 2000s led to an increased focus on suicide prevention. However, at the time these study data were being collected, treatment for suicide ideation outside deployment largely occurred in the context of mental health clinics, wrote Mark A. Reger, PhD, Derek J. Smolenski, PhD, and Sarah P. Carter.
Therefore, individuals without mental health symptoms might have been less likely to be identified as being at risk, and therefore, less likely to receive evidence-based treatment. This suggests that greater focus is needed on suicide prevention in other settings, and particularly on combating the stigma associated with a mental health diagnosis – which is often around concerns of career effects from such a diagnosis.
To the Army’s credit, it has shifted toward integrating mental health services into new locations and services – including embedded behavioral health teams – with the aim of increasing access, decreasing stigma, and improving consultation with command.
Dr. Reger and Ms. Carter are affiliated with the Veterans Affairs Puget Sound Health Care System in Seattle, and Dr. Smolenski is with the Psychological Health Center of Excellence at the Defense Health Agency in Tacoma, Wash. These comments are taken from an accompanying editorial (JAMA Psychiatry. 2018 Aug 29. doi: 10.1001/jamapsychiatry.2018.2042). No conflicts of interest were declared.
An increase in suicide rates in the Army during the 2000s led to an increased focus on suicide prevention. However, at the time these study data were being collected, treatment for suicide ideation outside deployment largely occurred in the context of mental health clinics, wrote Mark A. Reger, PhD, Derek J. Smolenski, PhD, and Sarah P. Carter.
Therefore, individuals without mental health symptoms might have been less likely to be identified as being at risk, and therefore, less likely to receive evidence-based treatment. This suggests that greater focus is needed on suicide prevention in other settings, and particularly on combating the stigma associated with a mental health diagnosis – which is often around concerns of career effects from such a diagnosis.
To the Army’s credit, it has shifted toward integrating mental health services into new locations and services – including embedded behavioral health teams – with the aim of increasing access, decreasing stigma, and improving consultation with command.
Dr. Reger and Ms. Carter are affiliated with the Veterans Affairs Puget Sound Health Care System in Seattle, and Dr. Smolenski is with the Psychological Health Center of Excellence at the Defense Health Agency in Tacoma, Wash. These comments are taken from an accompanying editorial (JAMA Psychiatry. 2018 Aug 29. doi: 10.1001/jamapsychiatry.2018.2042). No conflicts of interest were declared.
An increase in suicide rates in the Army during the 2000s led to an increased focus on suicide prevention. However, at the time these study data were being collected, treatment for suicide ideation outside deployment largely occurred in the context of mental health clinics, wrote Mark A. Reger, PhD, Derek J. Smolenski, PhD, and Sarah P. Carter.
Therefore, individuals without mental health symptoms might have been less likely to be identified as being at risk, and therefore, less likely to receive evidence-based treatment. This suggests that greater focus is needed on suicide prevention in other settings, and particularly on combating the stigma associated with a mental health diagnosis – which is often around concerns of career effects from such a diagnosis.
To the Army’s credit, it has shifted toward integrating mental health services into new locations and services – including embedded behavioral health teams – with the aim of increasing access, decreasing stigma, and improving consultation with command.
Dr. Reger and Ms. Carter are affiliated with the Veterans Affairs Puget Sound Health Care System in Seattle, and Dr. Smolenski is with the Psychological Health Center of Excellence at the Defense Health Agency in Tacoma, Wash. These comments are taken from an accompanying editorial (JAMA Psychiatry. 2018 Aug 29. doi: 10.1001/jamapsychiatry.2018.2042). No conflicts of interest were declared.
About one-third of enlisted soldiers who attempt suicide do not have a history of mental illness, say the authors of a retrospective longitudinal study among U.S. Army personnel.
However, health care use, exposure to violent crime, and first year of service all were significantly associated with suicide attempts.
The study, published online Aug. 29 in JAMA Psychiatry, analyzed administrative data from the Army Study to Assess Risk and Resilience in Servicemembers (Army STARRS) for 9,650 enlisted soldiers (74.8% male) who had a documented suicide attempt.
Overall, 36.3% of the soldiers studied who attempted suicide did not have a previous diagnosis of a mental health disorder. Having a history of mental illness was associated with sixfold higher odds of suicide attempt after adjusting for sociodemographic and service-related variables.
Among those without a history of mental health disorders, the first year of service was associated with sixfold higher odds of a suicide attempt (95% confidence interval, 4.7-7.7), and nearly 60% of those without a previous diagnosis who attempted suicide did so in their first year of service.
“This factor is noteworthy, because, as in the general population, most transitions from ideation to attempt among soldiers occur within 1 year of ideation onset,” wrote Robert J. Ursano, MD, professor of psychiatry and neurosciences at the Center for the Study of Traumatic Stress at the Uniformed Services University of the Health Sciences, Bethesda, Md., and his coauthors.
Among individuals without a history of mental health disorders, women had 2.6-fold higher odds (95% CI, 2.4-2.8) of a suicide attempt. The authors suggested that these
“Given the large proportion of first-year soldiers in the group without previous [mental health diagnosis], it is possible that women face additional stressors and challenges in the initial months of service,” they wrote.
Previous deployment was associated with 2.4-fold higher odds of suicide attempt; a 2-month delay in promotion was associated with 2.1-fold higher odds. In addition, a demotion in the past year was associated with 60% higher odds of a suicide attempt.
Health care use also showed associations with suicide attempts. Individuals who had visited outpatient services eight or more times in the past 2 months had more than threefold higher odds of suicide attempt. Those with an injury-related visit to outpatient services in the previous month had threefold higher odds, and those who had an injury-related visit to inpatient services had a 3.8-fold higher odds.
Exposure to minor violent crime and perpetration of major violent crime or family violence also were associated with higher odds of suicide attempt.
The authors cited several limitations. One is that the study did not capture unreported suicide attempts, mental disorders, or crimes.
The Army STARRS was supported by the Department of the Army, the U.S. Department of Health & Human Services, the National Institutes of Health, the National Institute of Mental Health and the Department of Defense. Two authors were employed by the NIMH, and two were Army liaisons or consultants.
SOURCE: Ursano RJ et al. JAMA Psychiatry. 2018 Aug 29. doi: 10.1001/jamapsychiatry.2018.2069.
About one-third of enlisted soldiers who attempt suicide do not have a history of mental illness, say the authors of a retrospective longitudinal study among U.S. Army personnel.
However, health care use, exposure to violent crime, and first year of service all were significantly associated with suicide attempts.
The study, published online Aug. 29 in JAMA Psychiatry, analyzed administrative data from the Army Study to Assess Risk and Resilience in Servicemembers (Army STARRS) for 9,650 enlisted soldiers (74.8% male) who had a documented suicide attempt.
Overall, 36.3% of the soldiers studied who attempted suicide did not have a previous diagnosis of a mental health disorder. Having a history of mental illness was associated with sixfold higher odds of suicide attempt after adjusting for sociodemographic and service-related variables.
Among those without a history of mental health disorders, the first year of service was associated with sixfold higher odds of a suicide attempt (95% confidence interval, 4.7-7.7), and nearly 60% of those without a previous diagnosis who attempted suicide did so in their first year of service.
“This factor is noteworthy, because, as in the general population, most transitions from ideation to attempt among soldiers occur within 1 year of ideation onset,” wrote Robert J. Ursano, MD, professor of psychiatry and neurosciences at the Center for the Study of Traumatic Stress at the Uniformed Services University of the Health Sciences, Bethesda, Md., and his coauthors.
Among individuals without a history of mental health disorders, women had 2.6-fold higher odds (95% CI, 2.4-2.8) of a suicide attempt. The authors suggested that these
“Given the large proportion of first-year soldiers in the group without previous [mental health diagnosis], it is possible that women face additional stressors and challenges in the initial months of service,” they wrote.
Previous deployment was associated with 2.4-fold higher odds of suicide attempt; a 2-month delay in promotion was associated with 2.1-fold higher odds. In addition, a demotion in the past year was associated with 60% higher odds of a suicide attempt.
Health care use also showed associations with suicide attempts. Individuals who had visited outpatient services eight or more times in the past 2 months had more than threefold higher odds of suicide attempt. Those with an injury-related visit to outpatient services in the previous month had threefold higher odds, and those who had an injury-related visit to inpatient services had a 3.8-fold higher odds.
Exposure to minor violent crime and perpetration of major violent crime or family violence also were associated with higher odds of suicide attempt.
The authors cited several limitations. One is that the study did not capture unreported suicide attempts, mental disorders, or crimes.
The Army STARRS was supported by the Department of the Army, the U.S. Department of Health & Human Services, the National Institutes of Health, the National Institute of Mental Health and the Department of Defense. Two authors were employed by the NIMH, and two were Army liaisons or consultants.
SOURCE: Ursano RJ et al. JAMA Psychiatry. 2018 Aug 29. doi: 10.1001/jamapsychiatry.2018.2069.
FROM JAMA PSYCHIATRY
Key clinical point: Many U.S. Army soldiers who attempt suicide and have no mental health diagnosis probably have undetected mental health disorders.
Major finding: More than one-third of soldiers who have attempted suicide do not have a history of mental health diagnosis.
Study details: Retrospective cohort study in 9,650 enlisted soldiers who had a documented suicide attempt.
Disclosures: The Army STARRS was supported by the Department of the Army, the U.S. Department of Health & Human Services, the National Institutes of Health, the National Institute of Mental Health, and the Department of Defense. Two authors were employed by the NIMH, and two were Army liaisons or consultants.
Source: Ursano RJ et al. JAMA Psychiatry. 2018 Aug 29. doi: 10.1001/jamapsychiatry.2018.2069.
How Can Neurologists Diagnose Spontaneous Intracranial Hypotension?
Imaging results may be negative, but risk factors and symptoms can make the diagnosis more certain.
SAN FRANCISCO—Spontaneous intracranial hypotension (SIH) sometimes may go undiagnosed, partly because the disorder is uncommon. But patients will receive the care that they need if neurologists, particularly headache specialists, understand how to identify the disorder.
Misconceptions About SIH
The name of the disorder can be misleading, said Deborah I. Friedman, MD, at the 60th Annual Scientific Meeting of the American Headache Society. SIH is not always spontaneous; it often has an antecedent cause. Furthermore, the main problem is not intracranial, it is a leak in the spinal column, most often in the low cervical or thoracic zone. Finally, CSF pressure is usually normal in these patients, said Dr. Friedman, Chief of the Division of Headache Medicine, Professor of Neurology, and Professor of Ophthalmology at the University of Texas Southwestern Medical Center in Dallas.

SIH is considered a rare disorder, and its published annual incidence is five cases per 100,000 people. But this prevalence may be a gross underestimate that results from the absence of an ICD-9 or ICD-10 code for the condition, according to Dr. Friedman.
SIH is “much more common than we think,” she asserted. “These people are out there. They are in your offices. I can guarantee you, there are patients you have been seeing for years in your practice that have [SIH]. I have missed it. I bet you have, too.”
Guidelines for Identifying SIH
Dr. Friedman offered advice from the perspective of a headache specialist to guide the diagnosis of SIH. “Most of the literature that is out there, and it is good literature, was not written by headache medicine specialists, it was written by famous and prominent neurosurgeons and neuroradiologists. But the people we see are not necessarily the people they see,” Dr. Friedman explained.
SIH can be challenging to diagnose because of its myriad presentations. “You need to be a detective,” said Dr. Friedman. The questions to ask center around whether the headache has postural, end-of-the-day, and Valsalva components. Joint hypermobility may provide another clue.
Headache is the most common symptom of SIH and the reason that patients with the disorder seek a headache specialist. A neurologist should consider the diagnosis in a patient with a new daily persistent headache or in a patient with a diagnosis of chronic migraine for whom no medication has worked. “The people who come in with a huge list of medications they have tried, and nothing works? That is unusual for migraine. Usually something works for migraine,” said Dr. Friedman.
SIH can result in a headache with an onset as sudden as that of thunderclap headache, but this characteristic is not necessary. The most common location of pain is posterior, but the pain can be centered anywhere in the head or face. Bilateral pain is more common than unilateral pain.
The most typical headache is orthostatic or worsens at the end of the day. The longer a patient has SIH, the less likely that it will have a postural component. Most patients are awakened by their headache in the middle of the night. The headache is often exertional and usually worsens with Valsalva maneuvers, including coughing, sneezing, lifting, bending forward, straining, singing, or sexual activity. Caffeine often works well for people with SIH. A neurologist should ask the patient about these issues, said Dr. Friedman.
Besides headache, other common symptoms of SIH include tinnitus, abnormal hearing (eg, hearing things as though one is underwater), neck pain, imbalance, pain between the shoulder blades, and blurred or double vision.
Typical risk factors include joint hypermobility; previous lumbar puncture, epidural, or spinal anesthesia; known disc disease or a personal or family history of retinal detachment at a young age; aneurysm; dissection; and valvular heart disease. Joint hypermobility is widespread among patients with SIH. These patients often enjoy yoga and were exceptionally flexible as children. Many participated in gymnastics, ballet, or cheerleading as children.
Examining and Treating the Patient
On physical examination, a neurologist can look for joint hypermobility. He or she should examine the eyes for spontaneous retinal venous pulsations indicative of normal CSF pressure. A neurologist also can put the patient in 5° of the Trendelenburg position for five to 10 minutes to see whether it improves the headache and other symptoms.
One of the first things that Dr. Friedman does when she suspects SIH is to refer the patient to the website of the Spinal CSF Leak Foundation (spinalcsfleak.org). She asks him or her to review the site and tell her whether the descriptions sound familiar.
The medical consensus is that the first-line diagnostic test is brain MRI with gadolinium enhancement. The diagnostic challenge, however, is that 30% of patients with SIH have normal results.
There is no consensus about the next step when the brain MRI is negative. CT with or without MR myelography is one possibility, and a T2-weighted spine MRI is another. Despite a thorough search, however, neurologists find no leak in about half of individuals with SIH.
Conservative treatment measures do not work well, according to Dr. Friedman. A reasonable strategy, even if a leak site has not been identified, is to treat with a high-volume epidural CT-guided targeted blood patch with fibrin sealant. “It gives relief about a third of the time,” according to Dr. Friedman.
—Bruce Jancin
Imaging results may be negative, but risk factors and symptoms can make the diagnosis more certain.
Imaging results may be negative, but risk factors and symptoms can make the diagnosis more certain.
SAN FRANCISCO—Spontaneous intracranial hypotension (SIH) sometimes may go undiagnosed, partly because the disorder is uncommon. But patients will receive the care that they need if neurologists, particularly headache specialists, understand how to identify the disorder.
Misconceptions About SIH
The name of the disorder can be misleading, said Deborah I. Friedman, MD, at the 60th Annual Scientific Meeting of the American Headache Society. SIH is not always spontaneous; it often has an antecedent cause. Furthermore, the main problem is not intracranial, it is a leak in the spinal column, most often in the low cervical or thoracic zone. Finally, CSF pressure is usually normal in these patients, said Dr. Friedman, Chief of the Division of Headache Medicine, Professor of Neurology, and Professor of Ophthalmology at the University of Texas Southwestern Medical Center in Dallas.
SIH is considered a rare disorder, and its published annual incidence is five cases per 100,000 people. But this prevalence may be a gross underestimate that results from the absence of an ICD-9 or ICD-10 code for the condition, according to Dr. Friedman.
SIH is “much more common than we think,” she asserted. “These people are out there. They are in your offices. I can guarantee you, there are patients you have been seeing for years in your practice that have [SIH]. I have missed it. I bet you have, too.”
Guidelines for Identifying SIH
Dr. Friedman offered advice from the perspective of a headache specialist to guide the diagnosis of SIH. “Most of the literature that is out there, and it is good literature, was not written by headache medicine specialists, it was written by famous and prominent neurosurgeons and neuroradiologists. But the people we see are not necessarily the people they see,” Dr. Friedman explained.
SIH can be challenging to diagnose because of its myriad presentations. “You need to be a detective,” said Dr. Friedman. The questions to ask center around whether the headache has postural, end-of-the-day, and Valsalva components. Joint hypermobility may provide another clue.
Headache is the most common symptom of SIH and the reason that patients with the disorder seek a headache specialist. A neurologist should consider the diagnosis in a patient with a new daily persistent headache or in a patient with a diagnosis of chronic migraine for whom no medication has worked. “The people who come in with a huge list of medications they have tried, and nothing works? That is unusual for migraine. Usually something works for migraine,” said Dr. Friedman.
SIH can result in a headache with an onset as sudden as that of thunderclap headache, but this characteristic is not necessary. The most common location of pain is posterior, but the pain can be centered anywhere in the head or face. Bilateral pain is more common than unilateral pain.
The most typical headache is orthostatic or worsens at the end of the day. The longer a patient has SIH, the less likely that it will have a postural component. Most patients are awakened by their headache in the middle of the night. The headache is often exertional and usually worsens with Valsalva maneuvers, including coughing, sneezing, lifting, bending forward, straining, singing, or sexual activity. Caffeine often works well for people with SIH. A neurologist should ask the patient about these issues, said Dr. Friedman.
Besides headache, other common symptoms of SIH include tinnitus, abnormal hearing (eg, hearing things as though one is underwater), neck pain, imbalance, pain between the shoulder blades, and blurred or double vision.
Typical risk factors include joint hypermobility; previous lumbar puncture, epidural, or spinal anesthesia; known disc disease or a personal or family history of retinal detachment at a young age; aneurysm; dissection; and valvular heart disease. Joint hypermobility is widespread among patients with SIH. These patients often enjoy yoga and were exceptionally flexible as children. Many participated in gymnastics, ballet, or cheerleading as children.
Examining and Treating the Patient
On physical examination, a neurologist can look for joint hypermobility. He or she should examine the eyes for spontaneous retinal venous pulsations indicative of normal CSF pressure. A neurologist also can put the patient in 5° of the Trendelenburg position for five to 10 minutes to see whether it improves the headache and other symptoms.
One of the first things that Dr. Friedman does when she suspects SIH is to refer the patient to the website of the Spinal CSF Leak Foundation (spinalcsfleak.org). She asks him or her to review the site and tell her whether the descriptions sound familiar.
The medical consensus is that the first-line diagnostic test is brain MRI with gadolinium enhancement. The diagnostic challenge, however, is that 30% of patients with SIH have normal results.
There is no consensus about the next step when the brain MRI is negative. CT with or without MR myelography is one possibility, and a T2-weighted spine MRI is another. Despite a thorough search, however, neurologists find no leak in about half of individuals with SIH.
Conservative treatment measures do not work well, according to Dr. Friedman. A reasonable strategy, even if a leak site has not been identified, is to treat with a high-volume epidural CT-guided targeted blood patch with fibrin sealant. “It gives relief about a third of the time,” according to Dr. Friedman.
—Bruce Jancin
SAN FRANCISCO—Spontaneous intracranial hypotension (SIH) sometimes may go undiagnosed, partly because the disorder is uncommon. But patients will receive the care that they need if neurologists, particularly headache specialists, understand how to identify the disorder.
Misconceptions About SIH
The name of the disorder can be misleading, said Deborah I. Friedman, MD, at the 60th Annual Scientific Meeting of the American Headache Society. SIH is not always spontaneous; it often has an antecedent cause. Furthermore, the main problem is not intracranial, it is a leak in the spinal column, most often in the low cervical or thoracic zone. Finally, CSF pressure is usually normal in these patients, said Dr. Friedman, Chief of the Division of Headache Medicine, Professor of Neurology, and Professor of Ophthalmology at the University of Texas Southwestern Medical Center in Dallas.
SIH is considered a rare disorder, and its published annual incidence is five cases per 100,000 people. But this prevalence may be a gross underestimate that results from the absence of an ICD-9 or ICD-10 code for the condition, according to Dr. Friedman.
SIH is “much more common than we think,” she asserted. “These people are out there. They are in your offices. I can guarantee you, there are patients you have been seeing for years in your practice that have [SIH]. I have missed it. I bet you have, too.”
Guidelines for Identifying SIH
Dr. Friedman offered advice from the perspective of a headache specialist to guide the diagnosis of SIH. “Most of the literature that is out there, and it is good literature, was not written by headache medicine specialists, it was written by famous and prominent neurosurgeons and neuroradiologists. But the people we see are not necessarily the people they see,” Dr. Friedman explained.
SIH can be challenging to diagnose because of its myriad presentations. “You need to be a detective,” said Dr. Friedman. The questions to ask center around whether the headache has postural, end-of-the-day, and Valsalva components. Joint hypermobility may provide another clue.
Headache is the most common symptom of SIH and the reason that patients with the disorder seek a headache specialist. A neurologist should consider the diagnosis in a patient with a new daily persistent headache or in a patient with a diagnosis of chronic migraine for whom no medication has worked. “The people who come in with a huge list of medications they have tried, and nothing works? That is unusual for migraine. Usually something works for migraine,” said Dr. Friedman.
SIH can result in a headache with an onset as sudden as that of thunderclap headache, but this characteristic is not necessary. The most common location of pain is posterior, but the pain can be centered anywhere in the head or face. Bilateral pain is more common than unilateral pain.
The most typical headache is orthostatic or worsens at the end of the day. The longer a patient has SIH, the less likely that it will have a postural component. Most patients are awakened by their headache in the middle of the night. The headache is often exertional and usually worsens with Valsalva maneuvers, including coughing, sneezing, lifting, bending forward, straining, singing, or sexual activity. Caffeine often works well for people with SIH. A neurologist should ask the patient about these issues, said Dr. Friedman.
Besides headache, other common symptoms of SIH include tinnitus, abnormal hearing (eg, hearing things as though one is underwater), neck pain, imbalance, pain between the shoulder blades, and blurred or double vision.
Typical risk factors include joint hypermobility; previous lumbar puncture, epidural, or spinal anesthesia; known disc disease or a personal or family history of retinal detachment at a young age; aneurysm; dissection; and valvular heart disease. Joint hypermobility is widespread among patients with SIH. These patients often enjoy yoga and were exceptionally flexible as children. Many participated in gymnastics, ballet, or cheerleading as children.
Examining and Treating the Patient
On physical examination, a neurologist can look for joint hypermobility. He or she should examine the eyes for spontaneous retinal venous pulsations indicative of normal CSF pressure. A neurologist also can put the patient in 5° of the Trendelenburg position for five to 10 minutes to see whether it improves the headache and other symptoms.
One of the first things that Dr. Friedman does when she suspects SIH is to refer the patient to the website of the Spinal CSF Leak Foundation (spinalcsfleak.org). She asks him or her to review the site and tell her whether the descriptions sound familiar.
The medical consensus is that the first-line diagnostic test is brain MRI with gadolinium enhancement. The diagnostic challenge, however, is that 30% of patients with SIH have normal results.
There is no consensus about the next step when the brain MRI is negative. CT with or without MR myelography is one possibility, and a T2-weighted spine MRI is another. Despite a thorough search, however, neurologists find no leak in about half of individuals with SIH.
Conservative treatment measures do not work well, according to Dr. Friedman. A reasonable strategy, even if a leak site has not been identified, is to treat with a high-volume epidural CT-guided targeted blood patch with fibrin sealant. “It gives relief about a third of the time,” according to Dr. Friedman.
—Bruce Jancin

Lesion Network Mapping May Untangle Neuroanatomic Areas Mediating Delusions
Lesion network mapping in neurologic disorders may offer clues to locating the pathology in psychiatric diseases.
HILTON HEAD, SC—Delusions of a common type, whether associated with neurologic or psychiatric disease, appear likely to involve common pathways in the brain, according to new studies using lesion network mapping. This type of mapping appears to reveal the pathways that explain why single focal neurologic lesions in different brain locations cause similar delusional symptoms.
Lesion network mapping “is an approach to look at neurologic and psychiatric symptoms at the level of networks to understand brain behavior relationships,” explained Ryan Darby, MD, Assistant Professor of Neurology and Director of the Frontotemporal Dementia Clinic at Vanderbilt University Medical Center in Nashville. From the neurologic perspective, this work may provide insight into brain function, but Dr. Darby, speaking at the 41st Annual Contemporary Clinical Neurology Symposium, sees broader implications.

“This [technique] might provide insight into psychiatric symptoms that we have had trouble truly understanding in relation to neuroanatomy,” Dr. Darby said. Some of the delusions associated with focal neurologic lesions have parallels with those associated with schizoaffective disorders, and this work may explain what areas of the brain are affected, even in the absence of visible lesions on imaging.
Lesion network mapping is a technique developed to identify functionally related regions of the brain. This goal is important because focal neurologic lesions associated with specific delusions are not necessarily located in the same brain region. The concept of networks connecting brain activity and network mapping recognizes that dysfunction in one brain area can lead to dysfunction in others. Lesion network mapping provides a strategy to identify these relationships.
Capgras Syndrome
Dr. Darby provided insight into lesion network mapping based on work he performed and published on Capgras syndrome, which describes an irrational belief that a familiar person or place is an impostor or a facsimile. As examples, he described a woman who thought her home, although familiar, was a replica. In another case, a man believed that his son-in-law, whom he recognized, was an impersonator. This type of delusion is complex, because it appears to involve a disruption of processes that mediate familiarity, as well as the cognitive processes employed to recognize and reject false beliefs.
One hypothesis about Capgras syndrome is that it involves “a two-hit phenomenon” in which dysfunction occurs simultaneously in distinct areas of the brain, according to Dr. Darby. His work with network lesion mapping in Capgras syndrome supports that hypothesis.
Lesion network mapping, a technique first described in a 2015 study, has established functional connectivity between regions of the brain in normal individuals in a resting state. A 2017 study tested the potential value of lesion network mapping in 17 cases of Capgras syndrome.
Most of the cases, including the imaging data, were retrieved from previously published studies, although several contemporary cases were included. In the investigation, Dr. Darby and his coinvestigators first demonstrated the heterogeneity in lesion location. Captured on MRI scans and traced onto a brain atlas, all but one of the lesions in patients with Capgras syndrome were found in the right hemisphere, but many of the lesions had nonoverlapping areas of involvement.
Despite the heterogeneity in lesion location, lesion network mapping demonstrated that all 17 lesions were functionally connected to the retrosplenial cortex. In addition, 16 of the 17 lesions were functionally connected to the right frontal cortex.
According to Dr. Darby, both associations are potentially important. On the basis of previously published studies with functional MRI (fMRI), the left retrosplenial cortex has been implicated in mediating familiarity. The right frontal cortex has been associated with belief evaluation. Moreover, in a control evaluation of published cases in which delusions did not involve misidentification, no functional connections to either the left retrosplenial cortex or the right frontal cortex were observed, according to Dr. Darby. In contrast, patients with disorders consistent with an impaired belief evaluation, such as paranoia or pathologic jealousy, did have lesions in the right frontal cortex as predicted.
Insights Into Other Neuropsychiatric Disorders
Lesion network mapping is now being applied to other types of delusions. Dr. Darby described work with neurologic and psychiatric disorders associated with a perception that free will has been lost. These include neuropsychiatric conditions such as akinetic mutism, alien limb syndrome, catatonia, and psychogenic nonepileptic seizures. According to Dr. Darby, there are two potential components involved in a delusion involving an impaired sense of free will. There is a change in the volitional component that captures the motivation and desire to move, as well as an impaired sense of agency, which refers to the feeling of responsibility for movement.
Describing ongoing work with these types of delusions, Dr. Darby reported that neurologic lesion locations, like those in Capgras syndrome, were heterogeneous. Again, most of these lesions could be connected to a network functional map that was not shared by those without these symptoms.
“For many of these complex disorders, what we are seeing is that pathology in different areas causes the same behavior syndrome by affecting different parts of the same network,” Dr. Darby said. He believes neurologic and psychiatric diseases producing the same delusions are likely to be mediated by dysfunction in the same areas of the brain.
In patients with psychiatric diseases who have delusions associated with loss of a sense of free will, lesions are not readily observed, but Dr. Darby reported that there is evidence of modest changes, such as atrophy or diminished metabolism, that can be “linked up to those areas of the brain involved in agency and volition, and not to areas that are associated with other comorbid symptoms.”
Broader Implications
The fact that the same or similar delusions are shared by neurologic and psychiatric disorders provides the basis for speculating that this work may lead to a more detailed understanding of brain function. According to Dr. Darby, the work with lesion network mapping in neurologic disorders “may tell us where to look for the pathology in psychiatric diseases.”
The lesion network testing may be an important tool for understanding the relationship of brain pathology to behavior, according to Dr. Darby. Prior to lesion network mapping, the heterogeneity of lesion location for patients with shared types of delusion has been difficult to understand, but Dr. Darby indicated that lesion network mapping shows potential for placing specific symptom expression into a context of neuroanatomy.
—Theodore Bosworth
Suggested Reading
Boes AD, Prasad S, Liu Q, et al. Network localization of neurological symptoms from focal brain lesions. Brain. 2015;138(Pt 10):3061-3075.
Darby RR, Laganiere S, Pascual-Leone A, et al. Finding the imposter: brain connectivity of lesions causing delusional misidentifications. Brain. 2017;140(2):497-507.
Lesion network mapping in neurologic disorders may offer clues to locating the pathology in psychiatric diseases.
Lesion network mapping in neurologic disorders may offer clues to locating the pathology in psychiatric diseases.
HILTON HEAD, SC—Delusions of a common type, whether associated with neurologic or psychiatric disease, appear likely to involve common pathways in the brain, according to new studies using lesion network mapping. This type of mapping appears to reveal the pathways that explain why single focal neurologic lesions in different brain locations cause similar delusional symptoms.
Lesion network mapping “is an approach to look at neurologic and psychiatric symptoms at the level of networks to understand brain behavior relationships,” explained Ryan Darby, MD, Assistant Professor of Neurology and Director of the Frontotemporal Dementia Clinic at Vanderbilt University Medical Center in Nashville. From the neurologic perspective, this work may provide insight into brain function, but Dr. Darby, speaking at the 41st Annual Contemporary Clinical Neurology Symposium, sees broader implications.
“This [technique] might provide insight into psychiatric symptoms that we have had trouble truly understanding in relation to neuroanatomy,” Dr. Darby said. Some of the delusions associated with focal neurologic lesions have parallels with those associated with schizoaffective disorders, and this work may explain what areas of the brain are affected, even in the absence of visible lesions on imaging.
Lesion network mapping is a technique developed to identify functionally related regions of the brain. This goal is important because focal neurologic lesions associated with specific delusions are not necessarily located in the same brain region. The concept of networks connecting brain activity and network mapping recognizes that dysfunction in one brain area can lead to dysfunction in others. Lesion network mapping provides a strategy to identify these relationships.
Capgras Syndrome
Dr. Darby provided insight into lesion network mapping based on work he performed and published on Capgras syndrome, which describes an irrational belief that a familiar person or place is an impostor or a facsimile. As examples, he described a woman who thought her home, although familiar, was a replica. In another case, a man believed that his son-in-law, whom he recognized, was an impersonator. This type of delusion is complex, because it appears to involve a disruption of processes that mediate familiarity, as well as the cognitive processes employed to recognize and reject false beliefs.
One hypothesis about Capgras syndrome is that it involves “a two-hit phenomenon” in which dysfunction occurs simultaneously in distinct areas of the brain, according to Dr. Darby. His work with network lesion mapping in Capgras syndrome supports that hypothesis.
Lesion network mapping, a technique first described in a 2015 study, has established functional connectivity between regions of the brain in normal individuals in a resting state. A 2017 study tested the potential value of lesion network mapping in 17 cases of Capgras syndrome.
Most of the cases, including the imaging data, were retrieved from previously published studies, although several contemporary cases were included. In the investigation, Dr. Darby and his coinvestigators first demonstrated the heterogeneity in lesion location. Captured on MRI scans and traced onto a brain atlas, all but one of the lesions in patients with Capgras syndrome were found in the right hemisphere, but many of the lesions had nonoverlapping areas of involvement.
Despite the heterogeneity in lesion location, lesion network mapping demonstrated that all 17 lesions were functionally connected to the retrosplenial cortex. In addition, 16 of the 17 lesions were functionally connected to the right frontal cortex.
According to Dr. Darby, both associations are potentially important. On the basis of previously published studies with functional MRI (fMRI), the left retrosplenial cortex has been implicated in mediating familiarity. The right frontal cortex has been associated with belief evaluation. Moreover, in a control evaluation of published cases in which delusions did not involve misidentification, no functional connections to either the left retrosplenial cortex or the right frontal cortex were observed, according to Dr. Darby. In contrast, patients with disorders consistent with an impaired belief evaluation, such as paranoia or pathologic jealousy, did have lesions in the right frontal cortex as predicted.
Insights Into Other Neuropsychiatric Disorders
Lesion network mapping is now being applied to other types of delusions. Dr. Darby described work with neurologic and psychiatric disorders associated with a perception that free will has been lost. These include neuropsychiatric conditions such as akinetic mutism, alien limb syndrome, catatonia, and psychogenic nonepileptic seizures. According to Dr. Darby, there are two potential components involved in a delusion involving an impaired sense of free will. There is a change in the volitional component that captures the motivation and desire to move, as well as an impaired sense of agency, which refers to the feeling of responsibility for movement.
Describing ongoing work with these types of delusions, Dr. Darby reported that neurologic lesion locations, like those in Capgras syndrome, were heterogeneous. Again, most of these lesions could be connected to a network functional map that was not shared by those without these symptoms.
“For many of these complex disorders, what we are seeing is that pathology in different areas causes the same behavior syndrome by affecting different parts of the same network,” Dr. Darby said. He believes neurologic and psychiatric diseases producing the same delusions are likely to be mediated by dysfunction in the same areas of the brain.
In patients with psychiatric diseases who have delusions associated with loss of a sense of free will, lesions are not readily observed, but Dr. Darby reported that there is evidence of modest changes, such as atrophy or diminished metabolism, that can be “linked up to those areas of the brain involved in agency and volition, and not to areas that are associated with other comorbid symptoms.”
Broader Implications
The fact that the same or similar delusions are shared by neurologic and psychiatric disorders provides the basis for speculating that this work may lead to a more detailed understanding of brain function. According to Dr. Darby, the work with lesion network mapping in neurologic disorders “may tell us where to look for the pathology in psychiatric diseases.”
The lesion network testing may be an important tool for understanding the relationship of brain pathology to behavior, according to Dr. Darby. Prior to lesion network mapping, the heterogeneity of lesion location for patients with shared types of delusion has been difficult to understand, but Dr. Darby indicated that lesion network mapping shows potential for placing specific symptom expression into a context of neuroanatomy.
—Theodore Bosworth
Suggested Reading
Boes AD, Prasad S, Liu Q, et al. Network localization of neurological symptoms from focal brain lesions. Brain. 2015;138(Pt 10):3061-3075.
Darby RR, Laganiere S, Pascual-Leone A, et al. Finding the imposter: brain connectivity of lesions causing delusional misidentifications. Brain. 2017;140(2):497-507.
HILTON HEAD, SC—Delusions of a common type, whether associated with neurologic or psychiatric disease, appear likely to involve common pathways in the brain, according to new studies using lesion network mapping. This type of mapping appears to reveal the pathways that explain why single focal neurologic lesions in different brain locations cause similar delusional symptoms.
Lesion network mapping “is an approach to look at neurologic and psychiatric symptoms at the level of networks to understand brain behavior relationships,” explained Ryan Darby, MD, Assistant Professor of Neurology and Director of the Frontotemporal Dementia Clinic at Vanderbilt University Medical Center in Nashville. From the neurologic perspective, this work may provide insight into brain function, but Dr. Darby, speaking at the 41st Annual Contemporary Clinical Neurology Symposium, sees broader implications.
“This [technique] might provide insight into psychiatric symptoms that we have had trouble truly understanding in relation to neuroanatomy,” Dr. Darby said. Some of the delusions associated with focal neurologic lesions have parallels with those associated with schizoaffective disorders, and this work may explain what areas of the brain are affected, even in the absence of visible lesions on imaging.
Lesion network mapping is a technique developed to identify functionally related regions of the brain. This goal is important because focal neurologic lesions associated with specific delusions are not necessarily located in the same brain region. The concept of networks connecting brain activity and network mapping recognizes that dysfunction in one brain area can lead to dysfunction in others. Lesion network mapping provides a strategy to identify these relationships.
Capgras Syndrome
Dr. Darby provided insight into lesion network mapping based on work he performed and published on Capgras syndrome, which describes an irrational belief that a familiar person or place is an impostor or a facsimile. As examples, he described a woman who thought her home, although familiar, was a replica. In another case, a man believed that his son-in-law, whom he recognized, was an impersonator. This type of delusion is complex, because it appears to involve a disruption of processes that mediate familiarity, as well as the cognitive processes employed to recognize and reject false beliefs.
One hypothesis about Capgras syndrome is that it involves “a two-hit phenomenon” in which dysfunction occurs simultaneously in distinct areas of the brain, according to Dr. Darby. His work with network lesion mapping in Capgras syndrome supports that hypothesis.
Lesion network mapping, a technique first described in a 2015 study, has established functional connectivity between regions of the brain in normal individuals in a resting state. A 2017 study tested the potential value of lesion network mapping in 17 cases of Capgras syndrome.
Most of the cases, including the imaging data, were retrieved from previously published studies, although several contemporary cases were included. In the investigation, Dr. Darby and his coinvestigators first demonstrated the heterogeneity in lesion location. Captured on MRI scans and traced onto a brain atlas, all but one of the lesions in patients with Capgras syndrome were found in the right hemisphere, but many of the lesions had nonoverlapping areas of involvement.
Despite the heterogeneity in lesion location, lesion network mapping demonstrated that all 17 lesions were functionally connected to the retrosplenial cortex. In addition, 16 of the 17 lesions were functionally connected to the right frontal cortex.
According to Dr. Darby, both associations are potentially important. On the basis of previously published studies with functional MRI (fMRI), the left retrosplenial cortex has been implicated in mediating familiarity. The right frontal cortex has been associated with belief evaluation. Moreover, in a control evaluation of published cases in which delusions did not involve misidentification, no functional connections to either the left retrosplenial cortex or the right frontal cortex were observed, according to Dr. Darby. In contrast, patients with disorders consistent with an impaired belief evaluation, such as paranoia or pathologic jealousy, did have lesions in the right frontal cortex as predicted.
Insights Into Other Neuropsychiatric Disorders
Lesion network mapping is now being applied to other types of delusions. Dr. Darby described work with neurologic and psychiatric disorders associated with a perception that free will has been lost. These include neuropsychiatric conditions such as akinetic mutism, alien limb syndrome, catatonia, and psychogenic nonepileptic seizures. According to Dr. Darby, there are two potential components involved in a delusion involving an impaired sense of free will. There is a change in the volitional component that captures the motivation and desire to move, as well as an impaired sense of agency, which refers to the feeling of responsibility for movement.
Describing ongoing work with these types of delusions, Dr. Darby reported that neurologic lesion locations, like those in Capgras syndrome, were heterogeneous. Again, most of these lesions could be connected to a network functional map that was not shared by those without these symptoms.
“For many of these complex disorders, what we are seeing is that pathology in different areas causes the same behavior syndrome by affecting different parts of the same network,” Dr. Darby said. He believes neurologic and psychiatric diseases producing the same delusions are likely to be mediated by dysfunction in the same areas of the brain.
In patients with psychiatric diseases who have delusions associated with loss of a sense of free will, lesions are not readily observed, but Dr. Darby reported that there is evidence of modest changes, such as atrophy or diminished metabolism, that can be “linked up to those areas of the brain involved in agency and volition, and not to areas that are associated with other comorbid symptoms.”
Broader Implications
The fact that the same or similar delusions are shared by neurologic and psychiatric disorders provides the basis for speculating that this work may lead to a more detailed understanding of brain function. According to Dr. Darby, the work with lesion network mapping in neurologic disorders “may tell us where to look for the pathology in psychiatric diseases.”
The lesion network testing may be an important tool for understanding the relationship of brain pathology to behavior, according to Dr. Darby. Prior to lesion network mapping, the heterogeneity of lesion location for patients with shared types of delusion has been difficult to understand, but Dr. Darby indicated that lesion network mapping shows potential for placing specific symptom expression into a context of neuroanatomy.
—Theodore Bosworth
Suggested Reading
Boes AD, Prasad S, Liu Q, et al. Network localization of neurological symptoms from focal brain lesions. Brain. 2015;138(Pt 10):3061-3075.
Darby RR, Laganiere S, Pascual-Leone A, et al. Finding the imposter: brain connectivity of lesions causing delusional misidentifications. Brain. 2017;140(2):497-507.

Solriamfetol Reduces Excessive Sleepiness in Patients With Narcolepsy and OSA
The therapy remains effective during long-term treatment and improves functioning and work productivity.
BALTIMORE—Solriamfetol effectively reduces excessive sleepiness in patients with narcolepsy, regardless of whether they also have cataplexy, according to research described at the 32nd Annual Meeting of the Associated Professional Sleep Societies. The drug also improves work productivity and reduces activity impairment outside of work in this population. The molecule’s efficacy is maintained during one year of treatment in patients with narcolepsy or obstructive sleep apnea (OSA), and solriamfetol generally is safe and well tolerated, said the researchers.
A Reanalysis of Phase III Data
Solriamfetol is a selective dopamine and norepinephrine reuptake inhibitor that promoted wakefulness in patients with narcolepsy in a large phase III trial. Investigators presented the results of three new studies of solriamfetol during the meeting. In the first study, Yves Dauvilliers, MD, PhD, a neurologist at Gui-de-Chauliac Hospital in Montpellier, France, and colleagues reanalyzed the data from the phase III trial to assess the drug’s efficacy in subgroups of patients with and without cataplexy.

Eligible patients were adults with type 1 or type 2 narcolepsy, a baseline Maintenance of Wakefulness Test (MWT) result of less than 25 minutes, and an Epworth Sleepiness Scale (ESS) score of 10 or greater. Patients were randomized in equal groups to placebo or a 75-mg, 150-mg, or 300-mg dose of solriamfetol for 12 weeks. The primary end points were the change from baseline to week 12 in sleep latency on the MWT, the ESS, and the Patient Global Impression of Change (PGI-C) scale.
Of the 231 patients included in the analysis, 117 had cataplexy. The investigators observed no key baseline differences i
Among participants with cataplexy, the mean change in sleep latency at Week 12 was 1.8 minutes in the placebo group, 3.4 minutes in the 75-mg group, 7.9 minutes in the 150-mg group, and 10.7 minutes in the 300-mg group. Among participants without cataplexy, the mean change was 2.6 minutes in the placebo group, 6.0 minutes in the 75-mg group, 11.6 minutes in the 150-mg group, and 13.8 minutes in the 300-mg group.
The mean decrease in ESS score among patients with cataplexy at Week 12 was 1.8 points among controls, 3.1 points in the 75-mg group, 5.6 points in the 150-mg group, and 6.3 points in the 300-mg group. Among patients without cataplexy, the mean decrease was 1.5 points in controls, 4.5 points in the 75-mg group, 5.2 points in the 150-mg group, and 6.4 points in the 300-mg group.
A significantly greater percentage of patients in the 150-mg and 300-mg groups had improvement in PGI-C at Week 12, compared with controls, regardless of whether they had cataplexy. Among patients without cataplexy, a significantly greater percentage of those who received 75 mg of solriamfetol also had improvement in PGI-C at Week 12, compared with controls.
Solriamfetol Improves Work Productivity
Helene Emsellem, MD, Medical Director of the Center for Sleep and Wake Disorders in Chevy Chase, Maryland, and colleagues analyzed data from the same phase III study to examine solriamfetol’s effects on health-related quality of life and work productivity. These outcomes had been measured using the Functional Outcomes of Sleep Questionnaire, short version (FOSQ-10); the Work Productivity and Activity Impairment questionnaire for Specific Health Problem, which measures absenteeism, presenteeism (ie, working while impaired), and activity impairment outside of work; and the 36-Item Short Form Health Survey version 2 (the SF-36 v2), which includes physical and mental components. Dr. Emsellem and colleagues calculated the least-squares mean change in these measures from baseline to Week 12.
At baseline, mean FOSQ-10 total score was 12.2 among controls, 11.4 in the 75-mg group, 11.7 in the 150-mg group, and 11.4 in the 300-mg group. A normal value is approximately 18. At Week 12, FOSQ-10 score improved by 3.01 points in the 300-mg group, compared with 1.56 among controls. The difference between these groups was statistically significant. FOSQ-10 score improved by 2.39 in the 75-mg group and by 2.57 in the 150-mg group, but these results were not statistically significant.
At Week 12, the 150-mg and 300-mg doses of solriamfetol significantly reduced activity impairment outside of work, compared with placebo. In addition, the 150-mg dose significantly reduced presenteeism and a composite of absenteeism and presenteeism, compared with placebo. Solriamfetol had little effect on absenteeism, perhaps because absenteeism was uncommon at baseline, said Dr. Emsellem.
In addition, the 300-mg dose of solriamfetol significantly increased by 3.29 points the physical component summary score of the SF-36 v2, compared with placebo, which yielded a 1.06-point increase. The other doses did not significantly improve the physical component summary score. Solriamfetol did not significantly improve the mental component summary score.
Data Suggest Long-Term Efficacy
Pharmacologic treatment for narcolepsy often lasts for a long period of time, but the treatment periods in many clinical trials are comparatively short. Atul Malhotra, MD, Professor of Medicine at the University of California, San Diego, and colleagues conducted a study to examine the long-term safety and efficacy of solriamfetol.
Eligible participants had narcolepsy or OSA and had previously completed six- or 12-week trials of solriamfetol. Patients in Group A were enrolled into the long-term study immediately after having completed an earlier study, and patients in Group B were enrolled later after their completion of the earlier study.
Participants received open-label solriamfetol during a two-week titration phase. The subsequent maintenance phase lasted for 38 weeks for Group A and 50 weeks for Group B. After about six months of treatment, investigators randomized blinded patients to placebo or their assigned dose of solriamfetol for two weeks. After this randomized-withdrawal phase, all participants received solriamfetol.
The primary end point was the change in ESS score at the end of the randomized-withdrawal phase. Secondary end points were the changes in PGI-C and the Clinical Global Impression of Change (CGI-C) at the end of the randomized-withdrawal phase. The analysis was performed using a modified intention-to-treat population.
The investigators enrolled 643 participants into the study. Mean age was 49, 52% of the population was male, and mean BMI was 31.7. About 35% of participants had narcolepsy, and 65% had OSA. In all, 282 participants were assigned to the randomized-withdrawal phase, and 361 continued solriamfetol.
By the end of the randomized-withdrawal phase, ESS score had risen from 7.8 to 12.6 in the placebo group, compared with an increase from 7.3 to 8.5 in the solriamfetol group. The least-squares mean difference between the arms was –3.7.
About 65% of patients randomized to placebo reported worsening on PGI-C at the end of the randomized-withdrawal phase, compared with 28% of the solriamfetol group. Similarly, approximately 64% of patients randomized to placebo were rated as worse on the CGI-C at the end of the randomized-withdrawal phase, compared with 29% of the solriamfetol group.
At Week 40, Group A had sustained reductions in ESS score, which indicated long-term efficacy of solriamfetol. Group B had similar results during approximately one year of treatment. “There is no hint of tachyphylaxis,” said Dr. Malhotra. Improvements in PGI-C and CGI-C were stable over time.
No New Safety Concerns Emerge
The safety profile of solriamfetol in these studies was similar in participants with and without cataplexy and was consistent with that indicated by previous trials. The most common treatment-emergent adverse events in the phase III trial that Drs. Dauvilliers and Emsellem analyzed were headache, nausea, decreased appetite, nasopharyngitis, dry mouth, diarrhea, and anxiety. The rate of adverse events increased with increasing dose. More participants in the solriamfetol group discontinued the trial, compared with the placebo group. Solriamfetol did not affect BMI. Safety results were similar in Dr. Malhotra’s trial. Solriamfetol had “a durable effect without major side effects,” he said.
Jazz Pharmaceuticals, which is headquartered in Dublin, is developing solriamfetol and sponsored all three studies. The company filed a new drug application for solriamfetol with the FDA in March and expects a regulatory decision in late December.
—Erik Greb
Suggested Reading
Bogan RK, Feldman N, Emsellem HA, et al. Effect of oral JZP-110 (ADX-N05) treatment on wakefulness and sleepiness in adults with narcolepsy. Sleep Med. 2015;16(9):1102-1108.
Scrima L, Emsellem HA, Becker PM, et al. Identifying clinically important difference on the Epworth Sleepiness Scale: results from a narcolepsy clinical trial of JZP-110. Sleep Med. 2017;38:108-112.
The therapy remains effective during long-term treatment and improves functioning and work productivity.
The therapy remains effective during long-term treatment and improves functioning and work productivity.
BALTIMORE—Solriamfetol effectively reduces excessive sleepiness in patients with narcolepsy, regardless of whether they also have cataplexy, according to research described at the 32nd Annual Meeting of the Associated Professional Sleep Societies. The drug also improves work productivity and reduces activity impairment outside of work in this population. The molecule’s efficacy is maintained during one year of treatment in patients with narcolepsy or obstructive sleep apnea (OSA), and solriamfetol generally is safe and well tolerated, said the researchers.
A Reanalysis of Phase III Data
Solriamfetol is a selective dopamine and norepinephrine reuptake inhibitor that promoted wakefulness in patients with narcolepsy in a large phase III trial. Investigators presented the results of three new studies of solriamfetol during the meeting. In the first study, Yves Dauvilliers, MD, PhD, a neurologist at Gui-de-Chauliac Hospital in Montpellier, France, and colleagues reanalyzed the data from the phase III trial to assess the drug’s efficacy in subgroups of patients with and without cataplexy.
Eligible patients were adults with type 1 or type 2 narcolepsy, a baseline Maintenance of Wakefulness Test (MWT) result of less than 25 minutes, and an Epworth Sleepiness Scale (ESS) score of 10 or greater. Patients were randomized in equal groups to placebo or a 75-mg, 150-mg, or 300-mg dose of solriamfetol for 12 weeks. The primary end points were the change from baseline to week 12 in sleep latency on the MWT, the ESS, and the Patient Global Impression of Change (PGI-C) scale.
Of the 231 patients included in the analysis, 117 had cataplexy. The investigators observed no key baseline differences i
Among participants with cataplexy, the mean change in sleep latency at Week 12 was 1.8 minutes in the placebo group, 3.4 minutes in the 75-mg group, 7.9 minutes in the 150-mg group, and 10.7 minutes in the 300-mg group. Among participants without cataplexy, the mean change was 2.6 minutes in the placebo group, 6.0 minutes in the 75-mg group, 11.6 minutes in the 150-mg group, and 13.8 minutes in the 300-mg group.
The mean decrease in ESS score among patients with cataplexy at Week 12 was 1.8 points among controls, 3.1 points in the 75-mg group, 5.6 points in the 150-mg group, and 6.3 points in the 300-mg group. Among patients without cataplexy, the mean decrease was 1.5 points in controls, 4.5 points in the 75-mg group, 5.2 points in the 150-mg group, and 6.4 points in the 300-mg group.
A significantly greater percentage of patients in the 150-mg and 300-mg groups had improvement in PGI-C at Week 12, compared with controls, regardless of whether they had cataplexy. Among patients without cataplexy, a significantly greater percentage of those who received 75 mg of solriamfetol also had improvement in PGI-C at Week 12, compared with controls.
Solriamfetol Improves Work Productivity
Helene Emsellem, MD, Medical Director of the Center for Sleep and Wake Disorders in Chevy Chase, Maryland, and colleagues analyzed data from the same phase III study to examine solriamfetol’s effects on health-related quality of life and work productivity. These outcomes had been measured using the Functional Outcomes of Sleep Questionnaire, short version (FOSQ-10); the Work Productivity and Activity Impairment questionnaire for Specific Health Problem, which measures absenteeism, presenteeism (ie, working while impaired), and activity impairment outside of work; and the 36-Item Short Form Health Survey version 2 (the SF-36 v2), which includes physical and mental components. Dr. Emsellem and colleagues calculated the least-squares mean change in these measures from baseline to Week 12.
At baseline, mean FOSQ-10 total score was 12.2 among controls, 11.4 in the 75-mg group, 11.7 in the 150-mg group, and 11.4 in the 300-mg group. A normal value is approximately 18. At Week 12, FOSQ-10 score improved by 3.01 points in the 300-mg group, compared with 1.56 among controls. The difference between these groups was statistically significant. FOSQ-10 score improved by 2.39 in the 75-mg group and by 2.57 in the 150-mg group, but these results were not statistically significant.
At Week 12, the 150-mg and 300-mg doses of solriamfetol significantly reduced activity impairment outside of work, compared with placebo. In addition, the 150-mg dose significantly reduced presenteeism and a composite of absenteeism and presenteeism, compared with placebo. Solriamfetol had little effect on absenteeism, perhaps because absenteeism was uncommon at baseline, said Dr. Emsellem.
In addition, the 300-mg dose of solriamfetol significantly increased by 3.29 points the physical component summary score of the SF-36 v2, compared with placebo, which yielded a 1.06-point increase. The other doses did not significantly improve the physical component summary score. Solriamfetol did not significantly improve the mental component summary score.
Data Suggest Long-Term Efficacy
Pharmacologic treatment for narcolepsy often lasts for a long period of time, but the treatment periods in many clinical trials are comparatively short. Atul Malhotra, MD, Professor of Medicine at the University of California, San Diego, and colleagues conducted a study to examine the long-term safety and efficacy of solriamfetol.
Eligible participants had narcolepsy or OSA and had previously completed six- or 12-week trials of solriamfetol. Patients in Group A were enrolled into the long-term study immediately after having completed an earlier study, and patients in Group B were enrolled later after their completion of the earlier study.
Participants received open-label solriamfetol during a two-week titration phase. The subsequent maintenance phase lasted for 38 weeks for Group A and 50 weeks for Group B. After about six months of treatment, investigators randomized blinded patients to placebo or their assigned dose of solriamfetol for two weeks. After this randomized-withdrawal phase, all participants received solriamfetol.
The primary end point was the change in ESS score at the end of the randomized-withdrawal phase. Secondary end points were the changes in PGI-C and the Clinical Global Impression of Change (CGI-C) at the end of the randomized-withdrawal phase. The analysis was performed using a modified intention-to-treat population.
The investigators enrolled 643 participants into the study. Mean age was 49, 52% of the population was male, and mean BMI was 31.7. About 35% of participants had narcolepsy, and 65% had OSA. In all, 282 participants were assigned to the randomized-withdrawal phase, and 361 continued solriamfetol.
By the end of the randomized-withdrawal phase, ESS score had risen from 7.8 to 12.6 in the placebo group, compared with an increase from 7.3 to 8.5 in the solriamfetol group. The least-squares mean difference between the arms was –3.7.
About 65% of patients randomized to placebo reported worsening on PGI-C at the end of the randomized-withdrawal phase, compared with 28% of the solriamfetol group. Similarly, approximately 64% of patients randomized to placebo were rated as worse on the CGI-C at the end of the randomized-withdrawal phase, compared with 29% of the solriamfetol group.
At Week 40, Group A had sustained reductions in ESS score, which indicated long-term efficacy of solriamfetol. Group B had similar results during approximately one year of treatment. “There is no hint of tachyphylaxis,” said Dr. Malhotra. Improvements in PGI-C and CGI-C were stable over time.
No New Safety Concerns Emerge
The safety profile of solriamfetol in these studies was similar in participants with and without cataplexy and was consistent with that indicated by previous trials. The most common treatment-emergent adverse events in the phase III trial that Drs. Dauvilliers and Emsellem analyzed were headache, nausea, decreased appetite, nasopharyngitis, dry mouth, diarrhea, and anxiety. The rate of adverse events increased with increasing dose. More participants in the solriamfetol group discontinued the trial, compared with the placebo group. Solriamfetol did not affect BMI. Safety results were similar in Dr. Malhotra’s trial. Solriamfetol had “a durable effect without major side effects,” he said.
Jazz Pharmaceuticals, which is headquartered in Dublin, is developing solriamfetol and sponsored all three studies. The company filed a new drug application for solriamfetol with the FDA in March and expects a regulatory decision in late December.
—Erik Greb
Suggested Reading
Bogan RK, Feldman N, Emsellem HA, et al. Effect of oral JZP-110 (ADX-N05) treatment on wakefulness and sleepiness in adults with narcolepsy. Sleep Med. 2015;16(9):1102-1108.
Scrima L, Emsellem HA, Becker PM, et al. Identifying clinically important difference on the Epworth Sleepiness Scale: results from a narcolepsy clinical trial of JZP-110. Sleep Med. 2017;38:108-112.
BALTIMORE—Solriamfetol effectively reduces excessive sleepiness in patients with narcolepsy, regardless of whether they also have cataplexy, according to research described at the 32nd Annual Meeting of the Associated Professional Sleep Societies. The drug also improves work productivity and reduces activity impairment outside of work in this population. The molecule’s efficacy is maintained during one year of treatment in patients with narcolepsy or obstructive sleep apnea (OSA), and solriamfetol generally is safe and well tolerated, said the researchers.
A Reanalysis of Phase III Data
Solriamfetol is a selective dopamine and norepinephrine reuptake inhibitor that promoted wakefulness in patients with narcolepsy in a large phase III trial. Investigators presented the results of three new studies of solriamfetol during the meeting. In the first study, Yves Dauvilliers, MD, PhD, a neurologist at Gui-de-Chauliac Hospital in Montpellier, France, and colleagues reanalyzed the data from the phase III trial to assess the drug’s efficacy in subgroups of patients with and without cataplexy.
Eligible patients were adults with type 1 or type 2 narcolepsy, a baseline Maintenance of Wakefulness Test (MWT) result of less than 25 minutes, and an Epworth Sleepiness Scale (ESS) score of 10 or greater. Patients were randomized in equal groups to placebo or a 75-mg, 150-mg, or 300-mg dose of solriamfetol for 12 weeks. The primary end points were the change from baseline to week 12 in sleep latency on the MWT, the ESS, and the Patient Global Impression of Change (PGI-C) scale.
Of the 231 patients included in the analysis, 117 had cataplexy. The investigators observed no key baseline differences i
Among participants with cataplexy, the mean change in sleep latency at Week 12 was 1.8 minutes in the placebo group, 3.4 minutes in the 75-mg group, 7.9 minutes in the 150-mg group, and 10.7 minutes in the 300-mg group. Among participants without cataplexy, the mean change was 2.6 minutes in the placebo group, 6.0 minutes in the 75-mg group, 11.6 minutes in the 150-mg group, and 13.8 minutes in the 300-mg group.
The mean decrease in ESS score among patients with cataplexy at Week 12 was 1.8 points among controls, 3.1 points in the 75-mg group, 5.6 points in the 150-mg group, and 6.3 points in the 300-mg group. Among patients without cataplexy, the mean decrease was 1.5 points in controls, 4.5 points in the 75-mg group, 5.2 points in the 150-mg group, and 6.4 points in the 300-mg group.
A significantly greater percentage of patients in the 150-mg and 300-mg groups had improvement in PGI-C at Week 12, compared with controls, regardless of whether they had cataplexy. Among patients without cataplexy, a significantly greater percentage of those who received 75 mg of solriamfetol also had improvement in PGI-C at Week 12, compared with controls.
Solriamfetol Improves Work Productivity
Helene Emsellem, MD, Medical Director of the Center for Sleep and Wake Disorders in Chevy Chase, Maryland, and colleagues analyzed data from the same phase III study to examine solriamfetol’s effects on health-related quality of life and work productivity. These outcomes had been measured using the Functional Outcomes of Sleep Questionnaire, short version (FOSQ-10); the Work Productivity and Activity Impairment questionnaire for Specific Health Problem, which measures absenteeism, presenteeism (ie, working while impaired), and activity impairment outside of work; and the 36-Item Short Form Health Survey version 2 (the SF-36 v2), which includes physical and mental components. Dr. Emsellem and colleagues calculated the least-squares mean change in these measures from baseline to Week 12.
At baseline, mean FOSQ-10 total score was 12.2 among controls, 11.4 in the 75-mg group, 11.7 in the 150-mg group, and 11.4 in the 300-mg group. A normal value is approximately 18. At Week 12, FOSQ-10 score improved by 3.01 points in the 300-mg group, compared with 1.56 among controls. The difference between these groups was statistically significant. FOSQ-10 score improved by 2.39 in the 75-mg group and by 2.57 in the 150-mg group, but these results were not statistically significant.
At Week 12, the 150-mg and 300-mg doses of solriamfetol significantly reduced activity impairment outside of work, compared with placebo. In addition, the 150-mg dose significantly reduced presenteeism and a composite of absenteeism and presenteeism, compared with placebo. Solriamfetol had little effect on absenteeism, perhaps because absenteeism was uncommon at baseline, said Dr. Emsellem.
In addition, the 300-mg dose of solriamfetol significantly increased by 3.29 points the physical component summary score of the SF-36 v2, compared with placebo, which yielded a 1.06-point increase. The other doses did not significantly improve the physical component summary score. Solriamfetol did not significantly improve the mental component summary score.
Data Suggest Long-Term Efficacy
Pharmacologic treatment for narcolepsy often lasts for a long period of time, but the treatment periods in many clinical trials are comparatively short. Atul Malhotra, MD, Professor of Medicine at the University of California, San Diego, and colleagues conducted a study to examine the long-term safety and efficacy of solriamfetol.
Eligible participants had narcolepsy or OSA and had previously completed six- or 12-week trials of solriamfetol. Patients in Group A were enrolled into the long-term study immediately after having completed an earlier study, and patients in Group B were enrolled later after their completion of the earlier study.
Participants received open-label solriamfetol during a two-week titration phase. The subsequent maintenance phase lasted for 38 weeks for Group A and 50 weeks for Group B. After about six months of treatment, investigators randomized blinded patients to placebo or their assigned dose of solriamfetol for two weeks. After this randomized-withdrawal phase, all participants received solriamfetol.
The primary end point was the change in ESS score at the end of the randomized-withdrawal phase. Secondary end points were the changes in PGI-C and the Clinical Global Impression of Change (CGI-C) at the end of the randomized-withdrawal phase. The analysis was performed using a modified intention-to-treat population.
The investigators enrolled 643 participants into the study. Mean age was 49, 52% of the population was male, and mean BMI was 31.7. About 35% of participants had narcolepsy, and 65% had OSA. In all, 282 participants were assigned to the randomized-withdrawal phase, and 361 continued solriamfetol.
By the end of the randomized-withdrawal phase, ESS score had risen from 7.8 to 12.6 in the placebo group, compared with an increase from 7.3 to 8.5 in the solriamfetol group. The least-squares mean difference between the arms was –3.7.
About 65% of patients randomized to placebo reported worsening on PGI-C at the end of the randomized-withdrawal phase, compared with 28% of the solriamfetol group. Similarly, approximately 64% of patients randomized to placebo were rated as worse on the CGI-C at the end of the randomized-withdrawal phase, compared with 29% of the solriamfetol group.
At Week 40, Group A had sustained reductions in ESS score, which indicated long-term efficacy of solriamfetol. Group B had similar results during approximately one year of treatment. “There is no hint of tachyphylaxis,” said Dr. Malhotra. Improvements in PGI-C and CGI-C were stable over time.
No New Safety Concerns Emerge
The safety profile of solriamfetol in these studies was similar in participants with and without cataplexy and was consistent with that indicated by previous trials. The most common treatment-emergent adverse events in the phase III trial that Drs. Dauvilliers and Emsellem analyzed were headache, nausea, decreased appetite, nasopharyngitis, dry mouth, diarrhea, and anxiety. The rate of adverse events increased with increasing dose. More participants in the solriamfetol group discontinued the trial, compared with the placebo group. Solriamfetol did not affect BMI. Safety results were similar in Dr. Malhotra’s trial. Solriamfetol had “a durable effect without major side effects,” he said.
Jazz Pharmaceuticals, which is headquartered in Dublin, is developing solriamfetol and sponsored all three studies. The company filed a new drug application for solriamfetol with the FDA in March and expects a regulatory decision in late December.
—Erik Greb
Suggested Reading
Bogan RK, Feldman N, Emsellem HA, et al. Effect of oral JZP-110 (ADX-N05) treatment on wakefulness and sleepiness in adults with narcolepsy. Sleep Med. 2015;16(9):1102-1108.
Scrima L, Emsellem HA, Becker PM, et al. Identifying clinically important difference on the Epworth Sleepiness Scale: results from a narcolepsy clinical trial of JZP-110. Sleep Med. 2017;38:108-112.

MicroRNAs Predict Cognitive Performance Following Sleep Deprivation
The molecules may identify people who will need interventions to maintain cognitive performance following sleep loss.
BALTIMORE—Levels of peripheral microRNAs (miRNAs) change in response to total sleep deprivation (TSD) and psychologic stress, according to a study described at the 32nd Annual Meeting of the Associated Professional Sleep Societies. The molecules also predict individual differences in cognitive performance following these conditions. The results suggest that miRNAs can “identify individuals ahead of time who are in need of countermeasures or interventions such as caffeine or naps to mitigate or prevent impairments associated with insufficient sleep,” said Namni Goel, PhD, Research Associate Professor of Psychology in Psychiatry at the University of Pennsylvania in Philadelphia.

Sleep loss is associated with Alzheimer’s disease and psychiatric disorders and impairs cognitive performance. Deficits in cognitive performance following sleep loss vary between individuals, however. Predicting and detecting individual deficits arising from sleep loss has been difficult.
One set of molecules that regulate gene expression is miRNAs, which are small, noncoding RNAs that typically repress the expression of their target messenger RNAs. Dr. Goel and colleagues investigated whether sleep deprivation or the combination of sleep deprivation and psychologic stress affects miRNA responses in humans. They also examined whether these miRNA responses predict cognitive performance during sleep deprivation.
The investigators enrolled 32 healthy adults (mean age, 35.1; 14 women) in a five-day experiment. Participants underwent two baseline nights with eight hours in bed, followed by 39 hours of TSD and two recovery nights with eight to 10 hours in bed. On the day after TSD, participants underwent a modified Trier Social Stress Test intended to induce psychologic stress. The researchers administered the Psychomotor Vigilance Test (PVT), Digit Symbol Substitution Task (DSST), and Digit Span Task (DS) throughout the experiment. They took blood samples at six time points and analyzed miRNAs in plasma using microarrays.
At the end of the study, levels of 10 miRNAs changed after TSD alone, and levels of 18 miRNAs changed after TSD and psychologic stress, compared with baseline. The former miRNAs target 2,309 genes, and the latter target 2,823 genes. The two groups of miRNAs have 700 targets in common. The researchers also observed that at baseline, 14 miRNAs predicted lapses and errors on PVT during TSD, seven miRNAs predicted DSST performance, and 10 miRNAs predicted DS performance.
“These findings show for the first time that miRNAs can track responses to TSD and its detrimental combination with psychologic stress and predict robust individual differences in various types of cognitive performance,” said Dr. Goel.
—Erik Greb
The molecules may identify people who will need interventions to maintain cognitive performance following sleep loss.
The molecules may identify people who will need interventions to maintain cognitive performance following sleep loss.
BALTIMORE—Levels of peripheral microRNAs (miRNAs) change in response to total sleep deprivation (TSD) and psychologic stress, according to a study described at the 32nd Annual Meeting of the Associated Professional Sleep Societies. The molecules also predict individual differences in cognitive performance following these conditions. The results suggest that miRNAs can “identify individuals ahead of time who are in need of countermeasures or interventions such as caffeine or naps to mitigate or prevent impairments associated with insufficient sleep,” said Namni Goel, PhD, Research Associate Professor of Psychology in Psychiatry at the University of Pennsylvania in Philadelphia.
Sleep loss is associated with Alzheimer’s disease and psychiatric disorders and impairs cognitive performance. Deficits in cognitive performance following sleep loss vary between individuals, however. Predicting and detecting individual deficits arising from sleep loss has been difficult.
One set of molecules that regulate gene expression is miRNAs, which are small, noncoding RNAs that typically repress the expression of their target messenger RNAs. Dr. Goel and colleagues investigated whether sleep deprivation or the combination of sleep deprivation and psychologic stress affects miRNA responses in humans. They also examined whether these miRNA responses predict cognitive performance during sleep deprivation.
The investigators enrolled 32 healthy adults (mean age, 35.1; 14 women) in a five-day experiment. Participants underwent two baseline nights with eight hours in bed, followed by 39 hours of TSD and two recovery nights with eight to 10 hours in bed. On the day after TSD, participants underwent a modified Trier Social Stress Test intended to induce psychologic stress. The researchers administered the Psychomotor Vigilance Test (PVT), Digit Symbol Substitution Task (DSST), and Digit Span Task (DS) throughout the experiment. They took blood samples at six time points and analyzed miRNAs in plasma using microarrays.
At the end of the study, levels of 10 miRNAs changed after TSD alone, and levels of 18 miRNAs changed after TSD and psychologic stress, compared with baseline. The former miRNAs target 2,309 genes, and the latter target 2,823 genes. The two groups of miRNAs have 700 targets in common. The researchers also observed that at baseline, 14 miRNAs predicted lapses and errors on PVT during TSD, seven miRNAs predicted DSST performance, and 10 miRNAs predicted DS performance.
“These findings show for the first time that miRNAs can track responses to TSD and its detrimental combination with psychologic stress and predict robust individual differences in various types of cognitive performance,” said Dr. Goel.
—Erik Greb
BALTIMORE—Levels of peripheral microRNAs (miRNAs) change in response to total sleep deprivation (TSD) and psychologic stress, according to a study described at the 32nd Annual Meeting of the Associated Professional Sleep Societies. The molecules also predict individual differences in cognitive performance following these conditions. The results suggest that miRNAs can “identify individuals ahead of time who are in need of countermeasures or interventions such as caffeine or naps to mitigate or prevent impairments associated with insufficient sleep,” said Namni Goel, PhD, Research Associate Professor of Psychology in Psychiatry at the University of Pennsylvania in Philadelphia.
Sleep loss is associated with Alzheimer’s disease and psychiatric disorders and impairs cognitive performance. Deficits in cognitive performance following sleep loss vary between individuals, however. Predicting and detecting individual deficits arising from sleep loss has been difficult.
One set of molecules that regulate gene expression is miRNAs, which are small, noncoding RNAs that typically repress the expression of their target messenger RNAs. Dr. Goel and colleagues investigated whether sleep deprivation or the combination of sleep deprivation and psychologic stress affects miRNA responses in humans. They also examined whether these miRNA responses predict cognitive performance during sleep deprivation.
The investigators enrolled 32 healthy adults (mean age, 35.1; 14 women) in a five-day experiment. Participants underwent two baseline nights with eight hours in bed, followed by 39 hours of TSD and two recovery nights with eight to 10 hours in bed. On the day after TSD, participants underwent a modified Trier Social Stress Test intended to induce psychologic stress. The researchers administered the Psychomotor Vigilance Test (PVT), Digit Symbol Substitution Task (DSST), and Digit Span Task (DS) throughout the experiment. They took blood samples at six time points and analyzed miRNAs in plasma using microarrays.
At the end of the study, levels of 10 miRNAs changed after TSD alone, and levels of 18 miRNAs changed after TSD and psychologic stress, compared with baseline. The former miRNAs target 2,309 genes, and the latter target 2,823 genes. The two groups of miRNAs have 700 targets in common. The researchers also observed that at baseline, 14 miRNAs predicted lapses and errors on PVT during TSD, seven miRNAs predicted DSST performance, and 10 miRNAs predicted DS performance.
“These findings show for the first time that miRNAs can track responses to TSD and its detrimental combination with psychologic stress and predict robust individual differences in various types of cognitive performance,” said Dr. Goel.
—Erik Greb

Patient transfers between hospitals contribute substantially to CDI burden
ATLANTA – Patient sharing among hospital facilities contributed substantially to the overall Clostridium difficile infection rate, an analysis of interhospital contamination effects showed.
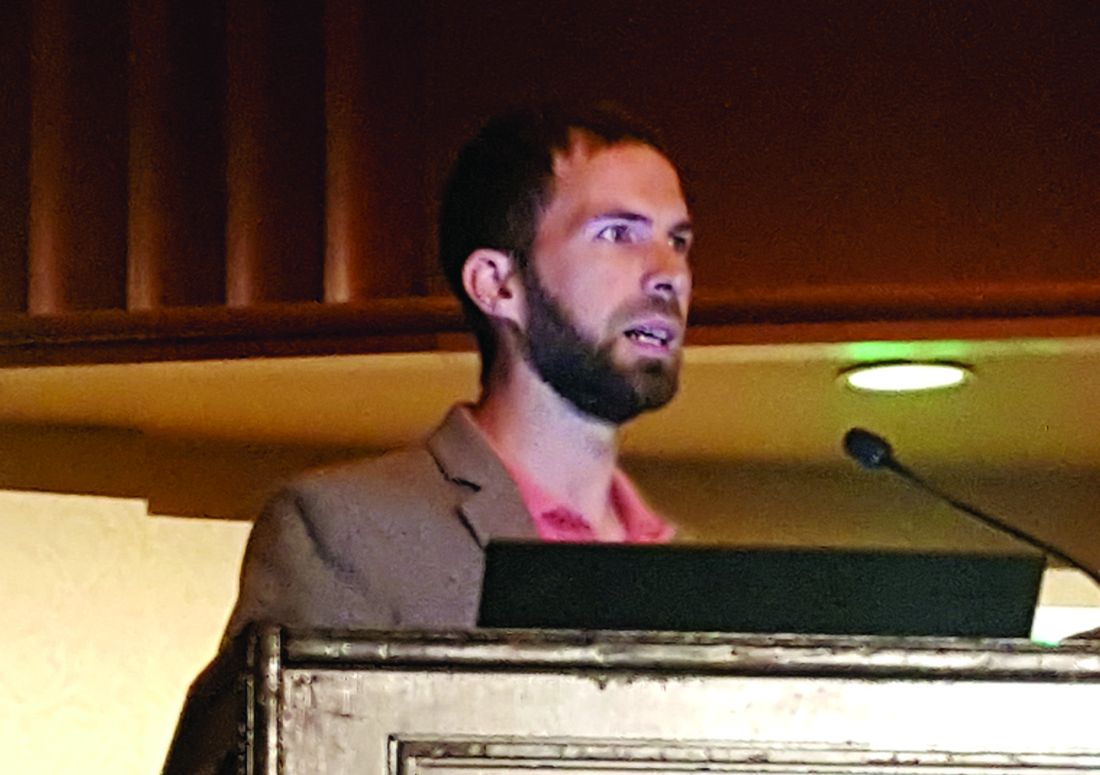
In fact, 7.6% of all Clostridium difficile infection (CDI) cases at the nearly 400 California hospitals included in the study were directly attributable to the patient-sharing network, Daniel Sewell, PhD, reported at the International Conference on Emerging Infectious Diseases.
“The methods that we employed allowed us to estimate the expected increase in CDI cases due to transfers as a function of the CDI rate at the hospital from which those patients were brought. These transfer patients were responsible for about 3.06 times the number of CDI cases as a normal patient,” said Dr. Sewell, a biostatistician at the University of Iowa, Iowa City.
The findings, which underscored the importance of regional (rather than local) efforts to minimize the spread of health care–associated infections, are based on an analysis of 27,200,873 hospital admissions and 532,320 same-day patient transfers identified from the Healthcare Cost and Utilization Project California State Inpatient Database for 2005-2011.
Transfer networks based on the monthly average number of patients discharged from one hospital and admitted to another on the same day were constructed, and the monthly average number of CDI cases per hospital were considered, along with hospital-level characteristics such as patient length of stay, age, and number of diagnoses. Network autocorrelation models that help eliminate bias were then used to assess the contamination effects between hospitals, he explained.
This led to development of an equation that can be used to determine the expected number of CDI cases in a hospital as a function of the number of transfers coming in and the contamination level of the source hospitals. The ability to calculate the expected number of CDI cases in this fashion is an important factor for the success of regional versus local intervention efforts, which are increasingly thought to be important for reducing health care–associated infections.
“If we want to design a coordinated or regional approach, we’ve got to have a much better understanding of the role that patient transfers have in these diseases,” Dr. Sewell said.
As most hospitals included in the study had a low CDI rate and a low transfer rate, the CDIs attributable to transfers represent a minority of cases, but they are a substantial minority, he said, noting that the main concern is with the “perfect storm” of high CDI rate plus high transfer rate.
The methodological approach used in this study to estimate CDI rates can be used for any health care–associated infection of interest, he added.
Dr. Sewell reported that he had no disclosures.
ATLANTA – Patient sharing among hospital facilities contributed substantially to the overall Clostridium difficile infection rate, an analysis of interhospital contamination effects showed.
In fact, 7.6% of all Clostridium difficile infection (CDI) cases at the nearly 400 California hospitals included in the study were directly attributable to the patient-sharing network, Daniel Sewell, PhD, reported at the International Conference on Emerging Infectious Diseases.
“The methods that we employed allowed us to estimate the expected increase in CDI cases due to transfers as a function of the CDI rate at the hospital from which those patients were brought. These transfer patients were responsible for about 3.06 times the number of CDI cases as a normal patient,” said Dr. Sewell, a biostatistician at the University of Iowa, Iowa City.
The findings, which underscored the importance of regional (rather than local) efforts to minimize the spread of health care–associated infections, are based on an analysis of 27,200,873 hospital admissions and 532,320 same-day patient transfers identified from the Healthcare Cost and Utilization Project California State Inpatient Database for 2005-2011.
Transfer networks based on the monthly average number of patients discharged from one hospital and admitted to another on the same day were constructed, and the monthly average number of CDI cases per hospital were considered, along with hospital-level characteristics such as patient length of stay, age, and number of diagnoses. Network autocorrelation models that help eliminate bias were then used to assess the contamination effects between hospitals, he explained.
This led to development of an equation that can be used to determine the expected number of CDI cases in a hospital as a function of the number of transfers coming in and the contamination level of the source hospitals. The ability to calculate the expected number of CDI cases in this fashion is an important factor for the success of regional versus local intervention efforts, which are increasingly thought to be important for reducing health care–associated infections.
“If we want to design a coordinated or regional approach, we’ve got to have a much better understanding of the role that patient transfers have in these diseases,” Dr. Sewell said.
As most hospitals included in the study had a low CDI rate and a low transfer rate, the CDIs attributable to transfers represent a minority of cases, but they are a substantial minority, he said, noting that the main concern is with the “perfect storm” of high CDI rate plus high transfer rate.
The methodological approach used in this study to estimate CDI rates can be used for any health care–associated infection of interest, he added.
Dr. Sewell reported that he had no disclosures.
ATLANTA – Patient sharing among hospital facilities contributed substantially to the overall Clostridium difficile infection rate, an analysis of interhospital contamination effects showed.
In fact, 7.6% of all Clostridium difficile infection (CDI) cases at the nearly 400 California hospitals included in the study were directly attributable to the patient-sharing network, Daniel Sewell, PhD, reported at the International Conference on Emerging Infectious Diseases.
“The methods that we employed allowed us to estimate the expected increase in CDI cases due to transfers as a function of the CDI rate at the hospital from which those patients were brought. These transfer patients were responsible for about 3.06 times the number of CDI cases as a normal patient,” said Dr. Sewell, a biostatistician at the University of Iowa, Iowa City.
The findings, which underscored the importance of regional (rather than local) efforts to minimize the spread of health care–associated infections, are based on an analysis of 27,200,873 hospital admissions and 532,320 same-day patient transfers identified from the Healthcare Cost and Utilization Project California State Inpatient Database for 2005-2011.
Transfer networks based on the monthly average number of patients discharged from one hospital and admitted to another on the same day were constructed, and the monthly average number of CDI cases per hospital were considered, along with hospital-level characteristics such as patient length of stay, age, and number of diagnoses. Network autocorrelation models that help eliminate bias were then used to assess the contamination effects between hospitals, he explained.
This led to development of an equation that can be used to determine the expected number of CDI cases in a hospital as a function of the number of transfers coming in and the contamination level of the source hospitals. The ability to calculate the expected number of CDI cases in this fashion is an important factor for the success of regional versus local intervention efforts, which are increasingly thought to be important for reducing health care–associated infections.
“If we want to design a coordinated or regional approach, we’ve got to have a much better understanding of the role that patient transfers have in these diseases,” Dr. Sewell said.
As most hospitals included in the study had a low CDI rate and a low transfer rate, the CDIs attributable to transfers represent a minority of cases, but they are a substantial minority, he said, noting that the main concern is with the “perfect storm” of high CDI rate plus high transfer rate.
The methodological approach used in this study to estimate CDI rates can be used for any health care–associated infection of interest, he added.
Dr. Sewell reported that he had no disclosures.
REPORTING FROM ICEID 2018
Key clinical point: Patient sharing among hospitals contributes substantially to Clostridium difficile infection (CDI) rates.
Major finding: Patient transfers account for 7.6% of the overall CDI burden.
Study details: A statistical analysis to estimate interhospital CDI transmissions.
Disclosures: Dr. Sewell reported that he had no disclosures.
Eosinophils could be a marker for nonceliac gluten or wheat sensitivity
. 
NCGWS could be considered an inflammatory condition of the entire intestinal track and the eosinophil infiltration “may represent a key candidate player” in its pathogenesis, wrote the authors, led by Antonio Carroccio, MD, of Giovanni Paolo II Hospital, Sciacca, and DiBiMIS University of Palermo, Italy. The report is in Clinical Gastroenterology and Hepatology.
The research team noted that duodenal histology, a lack of villous atrophy, and evaluation of intraepithelial infiltration of the duodenal mucosa were the usual steps involved in the diagnostic work-up of NCGWS.
Many people with NCGWS had symptoms that overlapped with irritable bowel syndrome but no studies had evaluated histologic features of duodenal and rectal biopsies from these patients.
“Alterations of the mucosal immune system are believed to play a role in IBS and some patients may indeed have inflammation of the colonic mucosa. Consequently, it would be logical to study the colon of NCGWS patients for possible inflammation in this site,” they wrote.
The current study involved 78 consecutive adult patients attending two tertiary referral centers in Italy. The average age of the patients was 36.4 years and they were diagnosed with NCGWS through a double-blind wheat challenge. A non-NCGWS control group of 55 patients had either celiac disease (n = 16) or self-reported NCGWS but with negative results from the wheat challenge (n = 39).
Both duodenal and rectal biopsies were performed in both groups of patients after they had consumed a wheat-containing diet (a minimum of 100 g) for at least 4 weeks.
The researchers then analyzed intraepithelial CD3+T cells, lamina propria CD45+ cells, CD4+ and CD8+ T cells, mast cells, and eosinophils as well as the presence and size of lymphoid nodules.
Histologic evaluation of the duodenal mucosa showed that none of the NCGWS patients or non-NCGWS controls had a villus/crypt ratio less than 3, whereas all the controls with celiac disease (CD) had villous atrophy.
Mucosal inflammation both in the duodenum and the rectal mucosa was common in patients with NCGWS. For example, intraepithelial CD3+ lymphocytes progressively increased from the non-NCGWS controls (14.3 ± 4.2) to NCGWS patients (19.6 ± 10.7; P less than .03) and CD controls (47.7 ± 23.3; P less than .001 vs. NCGWS patients).
Lamina propria CD45+ cells, which the authors said represented the “total immunocyte” infiltration were significantly higher in NCGWS patients than in the non-NCGWS controls at both sites.
In patients with NCGWS, the mean eosinophil infiltration was more than 2.5-fold the upper normal limit in the rectum and nearly twice the upper normal limit in the duodenum (P less than .0001).
Eosinophil numbers in the duodenal mucosa were also higher in the NCGWS patients with dyspepsia than in the NCGWS patients without upper digestive tract symptoms.
For example, in 33 patients who reported upper digestive tract symptoms, the number of lamina propria eosinophils was significantly higher than in the remaining NCGWS patients who did not report symptoms (8.6 ± 2.6 vs. 6.8 ± 3.6; P less than .01).
“Functional dyspepsia is frequently associated with IBS [irritable bowel syndrome], suggesting that these two diseases have a shared pathogenesis,” the researchers speculated.
The researchers suggested that in the absence of endoscopic findings, eosinophil infiltration of the rectal mucosa could be a marker of NCGWS, noting that it could not be considered a specific marker as eosinophils were found in the colon and rectal mucosa in several clinical conditions, such as inflammatory bowel diseases and celiac disease.
“However, these clinical conditions have clinical, endoscopic, serologic, and histologic aspects markedly different from NCGWS. ... We would suggest that in clinical practice, subjects showing an IBS clinical presentation and mucosa eosinophil infiltration should be recommended to commence an elimination diet with a subsequent wheat challenge,” they said.
The authors said another noteworthy finding from their study was that about 95% of patients had lymphoid follicles that were significantly larger than those of the control group. Although this can be considered a “normal” finding in rectal mucosa, they said in their experience the presence of large follicles was associated with non-IgE mediated food allergy.
“It can be hypothesized that not only eosinophils could play a pathogenetic role in NCGWS, and that a complex immunologic response involving both innate and acquired immunity may be responsible for this disease,” they said.
A study limitation was selection bias stemming from the fact that the cohort included patients referred to tertiary centers, they noted. “Our results must not be extended to all self-treated or diagnosed NCGWS patients,” they cautioned.
SOURCE: Clin Gastroenterol Hepatol. 2018 Aug 20. doi: 10.1016/j.cgh.2018.08.043.
.
NCGWS could be considered an inflammatory condition of the entire intestinal track and the eosinophil infiltration “may represent a key candidate player” in its pathogenesis, wrote the authors, led by Antonio Carroccio, MD, of Giovanni Paolo II Hospital, Sciacca, and DiBiMIS University of Palermo, Italy. The report is in Clinical Gastroenterology and Hepatology.
The research team noted that duodenal histology, a lack of villous atrophy, and evaluation of intraepithelial infiltration of the duodenal mucosa were the usual steps involved in the diagnostic work-up of NCGWS.
Many people with NCGWS had symptoms that overlapped with irritable bowel syndrome but no studies had evaluated histologic features of duodenal and rectal biopsies from these patients.
“Alterations of the mucosal immune system are believed to play a role in IBS and some patients may indeed have inflammation of the colonic mucosa. Consequently, it would be logical to study the colon of NCGWS patients for possible inflammation in this site,” they wrote.
The current study involved 78 consecutive adult patients attending two tertiary referral centers in Italy. The average age of the patients was 36.4 years and they were diagnosed with NCGWS through a double-blind wheat challenge. A non-NCGWS control group of 55 patients had either celiac disease (n = 16) or self-reported NCGWS but with negative results from the wheat challenge (n = 39).
Both duodenal and rectal biopsies were performed in both groups of patients after they had consumed a wheat-containing diet (a minimum of 100 g) for at least 4 weeks.
The researchers then analyzed intraepithelial CD3+T cells, lamina propria CD45+ cells, CD4+ and CD8+ T cells, mast cells, and eosinophils as well as the presence and size of lymphoid nodules.
Histologic evaluation of the duodenal mucosa showed that none of the NCGWS patients or non-NCGWS controls had a villus/crypt ratio less than 3, whereas all the controls with celiac disease (CD) had villous atrophy.
Mucosal inflammation both in the duodenum and the rectal mucosa was common in patients with NCGWS. For example, intraepithelial CD3+ lymphocytes progressively increased from the non-NCGWS controls (14.3 ± 4.2) to NCGWS patients (19.6 ± 10.7; P less than .03) and CD controls (47.7 ± 23.3; P less than .001 vs. NCGWS patients).
Lamina propria CD45+ cells, which the authors said represented the “total immunocyte” infiltration were significantly higher in NCGWS patients than in the non-NCGWS controls at both sites.
In patients with NCGWS, the mean eosinophil infiltration was more than 2.5-fold the upper normal limit in the rectum and nearly twice the upper normal limit in the duodenum (P less than .0001).
Eosinophil numbers in the duodenal mucosa were also higher in the NCGWS patients with dyspepsia than in the NCGWS patients without upper digestive tract symptoms.
For example, in 33 patients who reported upper digestive tract symptoms, the number of lamina propria eosinophils was significantly higher than in the remaining NCGWS patients who did not report symptoms (8.6 ± 2.6 vs. 6.8 ± 3.6; P less than .01).
“Functional dyspepsia is frequently associated with IBS [irritable bowel syndrome], suggesting that these two diseases have a shared pathogenesis,” the researchers speculated.
The researchers suggested that in the absence of endoscopic findings, eosinophil infiltration of the rectal mucosa could be a marker of NCGWS, noting that it could not be considered a specific marker as eosinophils were found in the colon and rectal mucosa in several clinical conditions, such as inflammatory bowel diseases and celiac disease.
“However, these clinical conditions have clinical, endoscopic, serologic, and histologic aspects markedly different from NCGWS. ... We would suggest that in clinical practice, subjects showing an IBS clinical presentation and mucosa eosinophil infiltration should be recommended to commence an elimination diet with a subsequent wheat challenge,” they said.
The authors said another noteworthy finding from their study was that about 95% of patients had lymphoid follicles that were significantly larger than those of the control group. Although this can be considered a “normal” finding in rectal mucosa, they said in their experience the presence of large follicles was associated with non-IgE mediated food allergy.
“It can be hypothesized that not only eosinophils could play a pathogenetic role in NCGWS, and that a complex immunologic response involving both innate and acquired immunity may be responsible for this disease,” they said.
A study limitation was selection bias stemming from the fact that the cohort included patients referred to tertiary centers, they noted. “Our results must not be extended to all self-treated or diagnosed NCGWS patients,” they cautioned.
SOURCE: Clin Gastroenterol Hepatol. 2018 Aug 20. doi: 10.1016/j.cgh.2018.08.043.
.
NCGWS could be considered an inflammatory condition of the entire intestinal track and the eosinophil infiltration “may represent a key candidate player” in its pathogenesis, wrote the authors, led by Antonio Carroccio, MD, of Giovanni Paolo II Hospital, Sciacca, and DiBiMIS University of Palermo, Italy. The report is in Clinical Gastroenterology and Hepatology.
The research team noted that duodenal histology, a lack of villous atrophy, and evaluation of intraepithelial infiltration of the duodenal mucosa were the usual steps involved in the diagnostic work-up of NCGWS.
Many people with NCGWS had symptoms that overlapped with irritable bowel syndrome but no studies had evaluated histologic features of duodenal and rectal biopsies from these patients.
“Alterations of the mucosal immune system are believed to play a role in IBS and some patients may indeed have inflammation of the colonic mucosa. Consequently, it would be logical to study the colon of NCGWS patients for possible inflammation in this site,” they wrote.
The current study involved 78 consecutive adult patients attending two tertiary referral centers in Italy. The average age of the patients was 36.4 years and they were diagnosed with NCGWS through a double-blind wheat challenge. A non-NCGWS control group of 55 patients had either celiac disease (n = 16) or self-reported NCGWS but with negative results from the wheat challenge (n = 39).
Both duodenal and rectal biopsies were performed in both groups of patients after they had consumed a wheat-containing diet (a minimum of 100 g) for at least 4 weeks.
The researchers then analyzed intraepithelial CD3+T cells, lamina propria CD45+ cells, CD4+ and CD8+ T cells, mast cells, and eosinophils as well as the presence and size of lymphoid nodules.
Histologic evaluation of the duodenal mucosa showed that none of the NCGWS patients or non-NCGWS controls had a villus/crypt ratio less than 3, whereas all the controls with celiac disease (CD) had villous atrophy.
Mucosal inflammation both in the duodenum and the rectal mucosa was common in patients with NCGWS. For example, intraepithelial CD3+ lymphocytes progressively increased from the non-NCGWS controls (14.3 ± 4.2) to NCGWS patients (19.6 ± 10.7; P less than .03) and CD controls (47.7 ± 23.3; P less than .001 vs. NCGWS patients).
Lamina propria CD45+ cells, which the authors said represented the “total immunocyte” infiltration were significantly higher in NCGWS patients than in the non-NCGWS controls at both sites.
In patients with NCGWS, the mean eosinophil infiltration was more than 2.5-fold the upper normal limit in the rectum and nearly twice the upper normal limit in the duodenum (P less than .0001).
Eosinophil numbers in the duodenal mucosa were also higher in the NCGWS patients with dyspepsia than in the NCGWS patients without upper digestive tract symptoms.
For example, in 33 patients who reported upper digestive tract symptoms, the number of lamina propria eosinophils was significantly higher than in the remaining NCGWS patients who did not report symptoms (8.6 ± 2.6 vs. 6.8 ± 3.6; P less than .01).
“Functional dyspepsia is frequently associated with IBS [irritable bowel syndrome], suggesting that these two diseases have a shared pathogenesis,” the researchers speculated.
The researchers suggested that in the absence of endoscopic findings, eosinophil infiltration of the rectal mucosa could be a marker of NCGWS, noting that it could not be considered a specific marker as eosinophils were found in the colon and rectal mucosa in several clinical conditions, such as inflammatory bowel diseases and celiac disease.
“However, these clinical conditions have clinical, endoscopic, serologic, and histologic aspects markedly different from NCGWS. ... We would suggest that in clinical practice, subjects showing an IBS clinical presentation and mucosa eosinophil infiltration should be recommended to commence an elimination diet with a subsequent wheat challenge,” they said.
The authors said another noteworthy finding from their study was that about 95% of patients had lymphoid follicles that were significantly larger than those of the control group. Although this can be considered a “normal” finding in rectal mucosa, they said in their experience the presence of large follicles was associated with non-IgE mediated food allergy.
“It can be hypothesized that not only eosinophils could play a pathogenetic role in NCGWS, and that a complex immunologic response involving both innate and acquired immunity may be responsible for this disease,” they said.
A study limitation was selection bias stemming from the fact that the cohort included patients referred to tertiary centers, they noted. “Our results must not be extended to all self-treated or diagnosed NCGWS patients,” they cautioned.
SOURCE: Clin Gastroenterol Hepatol. 2018 Aug 20. doi: 10.1016/j.cgh.2018.08.043.
FROM CLINICAL GASTROENTEROLOGY AND HEPATOLOGY
Key clinical point: The evaluation of patients for nonceliac gluten or wheat sensitivity should include histologic analysis of rectal biopsies.
Major finding: Mucosal inflammation in the duodenum and in the rectal mucosa was common in patients with NCGWS. In these patients the mean eosinophil infiltration was more than 2.5-fold the upper normal limit in the rectum and nearly twice the upper normal limit in the duodenum (P less than .0001).
Study details: A prospective study of 78 patients with NCGWS and 55 controls with either celiac disease or self-reported NCGWS but negative wheat challenge results.
Disclosures: The Italian Foundation for Celiac Disease funded the study. The authors declared no conflicts of interest.
Source: Clin Gastroenterol Hepatol. 2018 Aug 20. doi: 10.1016/j.cgh.2018.08.043.

Fracture risk linked to mortality in women with myeloma
Preexisting osteoporosis is an important risk factor for mortality risk in cancer-free postmenopausal women who go on to develop multiple myeloma, results of a recent analysis suggest.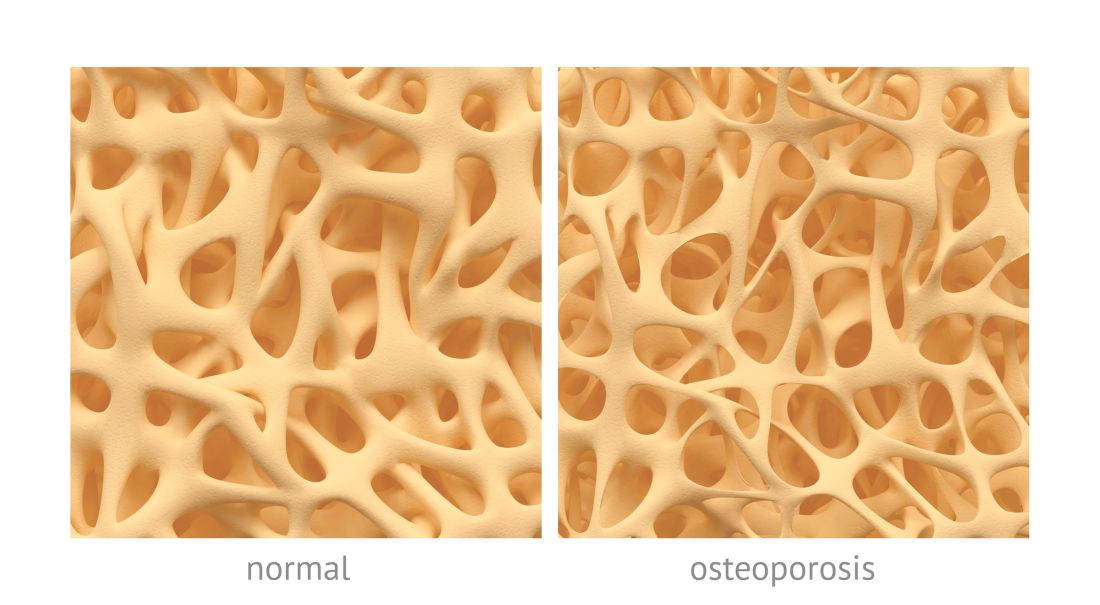
High fracture risk was associated with an increased risk of death, independent of other clinical risk factors, in this analysis of postmenopausal women in the Women’s Health Initiative (WHI) data set.
The findings help define osteoporosis as an important prognostic factor associated with mortality in postmenopausal women who develop myeloma, according to study author Ashley E. Rosko, MD, of Ohio State University, Columbus, and her colleagues.
“Osteoporosis is highly prevalent in aging adults, and very little is known on how this comorbid condition contributes to outcomes in individuals who develop myeloma,” wrote Dr. Rosko and her coauthors. Their report is in the journal Clinical Lymphoma, Myeloma and Leukemia.
The analysis involved 362 women in the WHI data set who developed myeloma and had no history of any cancer at baseline. Women in the WHI were between 50 and 79 years of age and postmenopausal at baseline when originally recruited at 40 U.S. centers between 1993 and 1998.
Dr. Rosko and her colleagues calculated bone health for women in the data set using the Fracture Risk Assessment Tool (FRAX), a web-based tool that calculates 10-year probability of hip and other major osteoporotic fractures.
Of the 362 women who developed myeloma, 98 were classified as having high FRAX scores, defined as a 10-year probability of 3% or greater for hip fracture, or 20% or greater for other major osteoporosis-related fractures.
With a median follow-up of 10.5 years, the adjusted risk of death was elevated in women with high FRAX scores, according to investigators, with a covariate-adjusted hazard ratio of 1.51 (95% confidence interval, 1.01-2.25; P = .044) versus women with low FRAX scores.
Of the 362 patients who developed myeloma, 226 died during the follow-up period. That included 71 women with high FRAX scores, or 72% of that subset; and 155 women with low FRAX scores, or 59% of that subset, investigators reported.
These findings suggest osteoporosis is an “important comorbidity” in women who develop multiple myeloma, Dr. Rosko and her coauthors said in a discussion of the study results.
“Recognizing osteoporosis as a risk factor associated with multiple myeloma mortality is an important prognostic factor in postmenopausal women,” they said.
This investigation was supported in part by the National Cancer Institute. The researchers reported having no relevant financial disclosures.
SOURCE: Rosko AE et al. Clin Lymphoma Myeloma Leuk. 2018 Sep;18(9):597-602.e1.
Preexisting osteoporosis is an important risk factor for mortality risk in cancer-free postmenopausal women who go on to develop multiple myeloma, results of a recent analysis suggest.
High fracture risk was associated with an increased risk of death, independent of other clinical risk factors, in this analysis of postmenopausal women in the Women’s Health Initiative (WHI) data set.
The findings help define osteoporosis as an important prognostic factor associated with mortality in postmenopausal women who develop myeloma, according to study author Ashley E. Rosko, MD, of Ohio State University, Columbus, and her colleagues.
“Osteoporosis is highly prevalent in aging adults, and very little is known on how this comorbid condition contributes to outcomes in individuals who develop myeloma,” wrote Dr. Rosko and her coauthors. Their report is in the journal Clinical Lymphoma, Myeloma and Leukemia.
The analysis involved 362 women in the WHI data set who developed myeloma and had no history of any cancer at baseline. Women in the WHI were between 50 and 79 years of age and postmenopausal at baseline when originally recruited at 40 U.S. centers between 1993 and 1998.
Dr. Rosko and her colleagues calculated bone health for women in the data set using the Fracture Risk Assessment Tool (FRAX), a web-based tool that calculates 10-year probability of hip and other major osteoporotic fractures.
Of the 362 women who developed myeloma, 98 were classified as having high FRAX scores, defined as a 10-year probability of 3% or greater for hip fracture, or 20% or greater for other major osteoporosis-related fractures.
With a median follow-up of 10.5 years, the adjusted risk of death was elevated in women with high FRAX scores, according to investigators, with a covariate-adjusted hazard ratio of 1.51 (95% confidence interval, 1.01-2.25; P = .044) versus women with low FRAX scores.
Of the 362 patients who developed myeloma, 226 died during the follow-up period. That included 71 women with high FRAX scores, or 72% of that subset; and 155 women with low FRAX scores, or 59% of that subset, investigators reported.
These findings suggest osteoporosis is an “important comorbidity” in women who develop multiple myeloma, Dr. Rosko and her coauthors said in a discussion of the study results.
“Recognizing osteoporosis as a risk factor associated with multiple myeloma mortality is an important prognostic factor in postmenopausal women,” they said.
This investigation was supported in part by the National Cancer Institute. The researchers reported having no relevant financial disclosures.
SOURCE: Rosko AE et al. Clin Lymphoma Myeloma Leuk. 2018 Sep;18(9):597-602.e1.
Preexisting osteoporosis is an important risk factor for mortality risk in cancer-free postmenopausal women who go on to develop multiple myeloma, results of a recent analysis suggest.
High fracture risk was associated with an increased risk of death, independent of other clinical risk factors, in this analysis of postmenopausal women in the Women’s Health Initiative (WHI) data set.
The findings help define osteoporosis as an important prognostic factor associated with mortality in postmenopausal women who develop myeloma, according to study author Ashley E. Rosko, MD, of Ohio State University, Columbus, and her colleagues.
“Osteoporosis is highly prevalent in aging adults, and very little is known on how this comorbid condition contributes to outcomes in individuals who develop myeloma,” wrote Dr. Rosko and her coauthors. Their report is in the journal Clinical Lymphoma, Myeloma and Leukemia.
The analysis involved 362 women in the WHI data set who developed myeloma and had no history of any cancer at baseline. Women in the WHI were between 50 and 79 years of age and postmenopausal at baseline when originally recruited at 40 U.S. centers between 1993 and 1998.
Dr. Rosko and her colleagues calculated bone health for women in the data set using the Fracture Risk Assessment Tool (FRAX), a web-based tool that calculates 10-year probability of hip and other major osteoporotic fractures.
Of the 362 women who developed myeloma, 98 were classified as having high FRAX scores, defined as a 10-year probability of 3% or greater for hip fracture, or 20% or greater for other major osteoporosis-related fractures.
With a median follow-up of 10.5 years, the adjusted risk of death was elevated in women with high FRAX scores, according to investigators, with a covariate-adjusted hazard ratio of 1.51 (95% confidence interval, 1.01-2.25; P = .044) versus women with low FRAX scores.
Of the 362 patients who developed myeloma, 226 died during the follow-up period. That included 71 women with high FRAX scores, or 72% of that subset; and 155 women with low FRAX scores, or 59% of that subset, investigators reported.
These findings suggest osteoporosis is an “important comorbidity” in women who develop multiple myeloma, Dr. Rosko and her coauthors said in a discussion of the study results.
“Recognizing osteoporosis as a risk factor associated with multiple myeloma mortality is an important prognostic factor in postmenopausal women,” they said.
This investigation was supported in part by the National Cancer Institute. The researchers reported having no relevant financial disclosures.
SOURCE: Rosko AE et al. Clin Lymphoma Myeloma Leuk. 2018 Sep;18(9):597-602.e1.
FROM CLINICAL LYMPHOMA, MYELOMA AND LEUKEMIA
Key clinical point:
Major finding: Risk of death was elevated in women at high risk of fracture (covariate-adjusted hazard ratio, 1.51; 95% confidence interval, 1.01-2.25; P = .044) versus women with low fracture risk.
Study details: Retrospective analysis of the Women’s Health Initiative data set including 362 postmenopausal women who were cancer free at baseline and developed myeloma over the course of study follow-up.
Disclosures: The analysis was supported in part by the National Cancer Institute. The researchers reported having no relevant financial disclosures.
Source: Rosko AE et al. Clin Lymphoma Myeloma Leuk. 2018 Sep;18(9):597-602.e1.