User login
Fat attenuation index boosts coronary CT prognostication
MUNICH – The perivascular fat attenuation index, a new measure of coronary plaque inflammation using data collected by a conventional coronary CT scan, identified an elevated risk for future cardiovascular death that was independent of standard risk factors in both derivation and validation studies with prospective data from more than 3,900 patients.

Patients with a high fat attenuation index (FAI) in the perivascular fat surrounding their right coronary artery had a five- to ninefold higher risk of cardiac mortality during 4-6 years of follow-up than did those with lower scores, after adjustment for conventional risk factors and standard findings from the coronary CT, Charalambos Antoniades, MD, said at the annual congress of the European Society of Cardiology.
The FAI is a “powerful, novel technology for cardiovascular disease risk stratification. It has striking prognostic value for cardiac death and nonfatal MI over and above other risk scores and state-of-the-art interpretation of coronary CT angiography,” said Dr. Antoniades, professor of cardiovascular medicine at the University of Oxford (England). He also highlighted that the data he reported suggested a protective effect in patients with a high FAI who received treatment with aspirin or a statin, and he suggested that FAI might be a way to better target an anti-inflammatory agent such as canakinumab (Ilaris), which showed cardiovascular protective effects in the CANTOS trial (N Engl J Med. 2017 Sep 21;377[12]:1119-31).
Another key feature of the FAI analysis is that it uses data collected by “any standard” coronary CT angiogram, Dr. Antoniades said. He is a founder of, shareholder in, and chief scientific officer of Caristo Diagnostics, the company developing the software that uses coronary CT data to calculate the FAI.
Dr. Antoniades and his associates derived the FAI using data collected from 1,872 patients who underwent planned coronary CT angiography at a clinic in Erlangen, Germany, during 2005-2009. The researchers correlated FAI scores with cardiovascular disease outcomes during a median follow-up of 72 months. They then validated the FAI using data collected from 2,040 patients who underwent a planned coronary CT exam at the Cleveland Clinic during 2008-2016 and then had a median follow-up of 54 months. The researchers called this overall post-hoc analysis of prospectively collected CT and outcomes data the Cardiovascular Risk Prediction using Computed Tomography (CRISP-CT) study.
Using the derivation data, FAI measurements taken from fat around the proximal right coronary artery that met or exceeded the specified cutoff value of –70.1 Hounsfield units were tied to a 9.04-fold greater rate of cardiac death during follow-up, compared with patients with a lower FAI, and after adjustment for several demographic, clinical, and CT-angiography variables. When the researchers ran this analysis using data from the validation patients and the same cutoff value they found that an elevated FAI linked with a 5.6-fold higher rate of cardiac death. Concurrently with Dr. Antoniades’ talk the results appeared in an online article that was later published (Lancet. 2018 Sep 15;392[10151]:929-39).
Calculating a patient’s FAI offers the prospect for “better use of CT information,” Dr. Antoniades said during the discussion of his report. After a coronary CT scan and conventional data processing, about half the patients have no finding that warrants intervention, but about 10% of these patients actually have an inflamed coronary plaque that is at high risk for rupture that could trigger a cardiac event. The FAI provides a way to use coronary CT angiography to identify these at-risk patients, he explained.
MUNICH – The perivascular fat attenuation index, a new measure of coronary plaque inflammation using data collected by a conventional coronary CT scan, identified an elevated risk for future cardiovascular death that was independent of standard risk factors in both derivation and validation studies with prospective data from more than 3,900 patients.
Patients with a high fat attenuation index (FAI) in the perivascular fat surrounding their right coronary artery had a five- to ninefold higher risk of cardiac mortality during 4-6 years of follow-up than did those with lower scores, after adjustment for conventional risk factors and standard findings from the coronary CT, Charalambos Antoniades, MD, said at the annual congress of the European Society of Cardiology.
The FAI is a “powerful, novel technology for cardiovascular disease risk stratification. It has striking prognostic value for cardiac death and nonfatal MI over and above other risk scores and state-of-the-art interpretation of coronary CT angiography,” said Dr. Antoniades, professor of cardiovascular medicine at the University of Oxford (England). He also highlighted that the data he reported suggested a protective effect in patients with a high FAI who received treatment with aspirin or a statin, and he suggested that FAI might be a way to better target an anti-inflammatory agent such as canakinumab (Ilaris), which showed cardiovascular protective effects in the CANTOS trial (N Engl J Med. 2017 Sep 21;377[12]:1119-31).
Another key feature of the FAI analysis is that it uses data collected by “any standard” coronary CT angiogram, Dr. Antoniades said. He is a founder of, shareholder in, and chief scientific officer of Caristo Diagnostics, the company developing the software that uses coronary CT data to calculate the FAI.
Dr. Antoniades and his associates derived the FAI using data collected from 1,872 patients who underwent planned coronary CT angiography at a clinic in Erlangen, Germany, during 2005-2009. The researchers correlated FAI scores with cardiovascular disease outcomes during a median follow-up of 72 months. They then validated the FAI using data collected from 2,040 patients who underwent a planned coronary CT exam at the Cleveland Clinic during 2008-2016 and then had a median follow-up of 54 months. The researchers called this overall post-hoc analysis of prospectively collected CT and outcomes data the Cardiovascular Risk Prediction using Computed Tomography (CRISP-CT) study.
Using the derivation data, FAI measurements taken from fat around the proximal right coronary artery that met or exceeded the specified cutoff value of –70.1 Hounsfield units were tied to a 9.04-fold greater rate of cardiac death during follow-up, compared with patients with a lower FAI, and after adjustment for several demographic, clinical, and CT-angiography variables. When the researchers ran this analysis using data from the validation patients and the same cutoff value they found that an elevated FAI linked with a 5.6-fold higher rate of cardiac death. Concurrently with Dr. Antoniades’ talk the results appeared in an online article that was later published (Lancet. 2018 Sep 15;392[10151]:929-39).
Calculating a patient’s FAI offers the prospect for “better use of CT information,” Dr. Antoniades said during the discussion of his report. After a coronary CT scan and conventional data processing, about half the patients have no finding that warrants intervention, but about 10% of these patients actually have an inflamed coronary plaque that is at high risk for rupture that could trigger a cardiac event. The FAI provides a way to use coronary CT angiography to identify these at-risk patients, he explained.
REPORTING FROM THE ESC CONGRESS 2018
Key clinical point:
Major finding: Patients with a fat attenuation index at or above the selected cutoff had a five- to ninefold increased rate of cardiac death.
Study details: The CRISP-CT study, which ran a post-hoc analysis of CT angiography data from 3,912 patients.
Disclosures: Dr. Antoniades is a founder of, shareholder in, and chief scientific officer of Caristo Diagnostics, the company developing fat attenuation index software.
Protocol violations, missed transfusions among blood delivery errors
BOSTON – Even the most vigilant hospitals experience problems with blood storage and delivery on the patient floor, particularly in pediatric units, investigators cautioned.

A review of patient safety incidents that occurred surrounding more than 1 million transfusions in U.S. hospitals showed that pediatric transfusions were associated with a higher rate of safety problems compared with adult transfusions, with errors differing by age group.
“We just looked at units transfused [and] incidents that occurred during product administration and we found that the highest incident in the pediatric population is that the protocol is not being followed, and the highest incident in the adult population is that the transfusion is not performed, in error, at all,” said Sarah Vossoughi, MD, of Columbia University and New York–Presbyterian Hospital, New York.
In both settings, the investigators observed problems with product storage on the patient floor. “It’s very common for blood banks to find platelets in the refrigerator. It doesn’t matter how old you are or what type of hospital you’re at – everyone’s putting platelets in the fridge,” she said in an interview at AABB 2018, the annual meeting of the organization formerly known as the American Association of Blood Banks.
Dr. Vossoughi and her colleagues in New York and at the University of Vermont in Burlington noted that the National Patient Safety Foundation, now a part of the Institute for Healthcare Improvement, declared preventable medical harm to be a public health crisis. In a paper published in the BMJ in 2016, researchers estimated that medical errors were the third leading cause of death in the United States, accounting for more than 250,000 fatalities annually.
Dr. Vossoughi also pointed to a study suggesting that the incidence of nonlethal medical errors may be 10- to 20-fold higher than the number of fatal errors (J Patient Saf. 2013 Sep;9[3]:122-8).
To evaluate patient safety events related to blood transfusions, Dr. Vossoughi and her colleagues drew data on events reported by three children’s hospitals and 29 adult hospitals to either the AABB Center for Patient Safety or the medical center’s own adverse event reporting system from January 2010 through September 2017.
They identified a total of 1,806 reports associated with approximately 1,088.884 transfusions. Of these reports, 249 were associated with 99,064 pediatric transfusions, and 1,577 were reported in association with 989,820 adult transfusions.
In all, 31% of the pediatric events were failure to follow the transfusion protocol.
“In a lot of the pediatric hospitals, it’s kind of like the Wild West. People say, ‘well I know it’s the hospital policy, but this child is special, so I’m going to do it this way, this time.’ That seems to be a culture in pediatrics, whereas on the adult side [clinicians] seem to be much less likely to just deviate from the protocol,” Dr. Vossoughi said.
Among adults, 43% of the errors were “transfusion not performed,” which may occur because of a bungled patient hand-off during a shift change, or when a patient is being moved from one unit to another.
“The next day, they’ll check the patient’s CBC and realize that the patient didn’t respond to the infusion that it turned out they never got, and then the product will be found on the floor, expired,” Dr. Vossoughi said.
In all, 20% of pediatric errors and 24% of adult errors were associated with incorrect storage of blood products on the patient floor.
The information they presented could help inpatient blood management programs target education and interventions to providers who commit similar errors.
“If you know that a particular provider group has problems following the protocol, maybe you can make the protocol a little simpler to follow, or make the checklist less cumbersome, and then maybe they’ll follow them more often,” she said.
The study was supported by the AABB Center for Patient Safety and University of Vermont Medical Center. The authors reported no conflicts of interest.
SOURCE: Vossoughi S et al. AABB 2018, Abstract QT4.
BOSTON – Even the most vigilant hospitals experience problems with blood storage and delivery on the patient floor, particularly in pediatric units, investigators cautioned.
A review of patient safety incidents that occurred surrounding more than 1 million transfusions in U.S. hospitals showed that pediatric transfusions were associated with a higher rate of safety problems compared with adult transfusions, with errors differing by age group.
“We just looked at units transfused [and] incidents that occurred during product administration and we found that the highest incident in the pediatric population is that the protocol is not being followed, and the highest incident in the adult population is that the transfusion is not performed, in error, at all,” said Sarah Vossoughi, MD, of Columbia University and New York–Presbyterian Hospital, New York.
In both settings, the investigators observed problems with product storage on the patient floor. “It’s very common for blood banks to find platelets in the refrigerator. It doesn’t matter how old you are or what type of hospital you’re at – everyone’s putting platelets in the fridge,” she said in an interview at AABB 2018, the annual meeting of the organization formerly known as the American Association of Blood Banks.
Dr. Vossoughi and her colleagues in New York and at the University of Vermont in Burlington noted that the National Patient Safety Foundation, now a part of the Institute for Healthcare Improvement, declared preventable medical harm to be a public health crisis. In a paper published in the BMJ in 2016, researchers estimated that medical errors were the third leading cause of death in the United States, accounting for more than 250,000 fatalities annually.
Dr. Vossoughi also pointed to a study suggesting that the incidence of nonlethal medical errors may be 10- to 20-fold higher than the number of fatal errors (J Patient Saf. 2013 Sep;9[3]:122-8).
To evaluate patient safety events related to blood transfusions, Dr. Vossoughi and her colleagues drew data on events reported by three children’s hospitals and 29 adult hospitals to either the AABB Center for Patient Safety or the medical center’s own adverse event reporting system from January 2010 through September 2017.
They identified a total of 1,806 reports associated with approximately 1,088.884 transfusions. Of these reports, 249 were associated with 99,064 pediatric transfusions, and 1,577 were reported in association with 989,820 adult transfusions.
In all, 31% of the pediatric events were failure to follow the transfusion protocol.
“In a lot of the pediatric hospitals, it’s kind of like the Wild West. People say, ‘well I know it’s the hospital policy, but this child is special, so I’m going to do it this way, this time.’ That seems to be a culture in pediatrics, whereas on the adult side [clinicians] seem to be much less likely to just deviate from the protocol,” Dr. Vossoughi said.
Among adults, 43% of the errors were “transfusion not performed,” which may occur because of a bungled patient hand-off during a shift change, or when a patient is being moved from one unit to another.
“The next day, they’ll check the patient’s CBC and realize that the patient didn’t respond to the infusion that it turned out they never got, and then the product will be found on the floor, expired,” Dr. Vossoughi said.
In all, 20% of pediatric errors and 24% of adult errors were associated with incorrect storage of blood products on the patient floor.
The information they presented could help inpatient blood management programs target education and interventions to providers who commit similar errors.
“If you know that a particular provider group has problems following the protocol, maybe you can make the protocol a little simpler to follow, or make the checklist less cumbersome, and then maybe they’ll follow them more often,” she said.
The study was supported by the AABB Center for Patient Safety and University of Vermont Medical Center. The authors reported no conflicts of interest.
SOURCE: Vossoughi S et al. AABB 2018, Abstract QT4.
REPORTING FROM AABB 2018
Key clinical point:
Major finding: In all, 31% of pediatric errors were due to protocol violation, and 43% of adult errors were due to an ordered transfusion not being performed.
Study details: Descriptive study of data from 32 U.S. hospitals that reported transfusion safety events.
Disclosures: The study was supported by the AABB Center for Patient Safety and University of Vermont. The authors reported no conflicts of interest.
Source: Vossoughi S et al. AABB 2018, Abstract QT4.
Talazoparib approved for HER2-negative advanced breast cancer
The for patients with deleterious or suspected deleterious germline BRCA-mutated (gBRCAm), HER2-negative locally advanced or metastatic breast cancer.

The FDA also approved BRACAnalysis CDx from Myriad Genetic Laboratories as the companion diagnostic to identify patients with deleterious or suspected deleterious gBRCAm who are eligible for talazoparib, the agency announced.
Approval was based on improved progression-free survival in EMBRACA, a phase 3, open-label trial of 431 patients with gBRCAm HER2-negative locally advanced or metastatic breast cancer. Patients in the trial were randomized 2:1 to receive either talazoparib (1 mg) or a physician’s choice of chemotherapy (capecitabine, eribulin, gemcitabine, or vinorelbine). All patients had received treatment with an anthracycline and/or a taxane previously.
Median progression-free survival was 8.6 months in the talazoparib arm, compared with 5.6 months in the chemotherapy arm (HR, 0.54; 95% CI, 0.41-0.71; P less than .0001).
Anemia was the most common hematologic adverse event, with grade 3 or greater occurring in 39.2% of patients on the PARP inhibitor, compared with 4.8% of patients treated with other agents, according to results of the trial presented at the 2017 San Antonio Breast Cancer Symposium.
Warnings and precautions for myelodysplastic syndrome/acute myeloid leukemia, myelosuppression, and embryo-fetal toxicity are included in the drug’s prescribing information. The PARP inhibitor’s most common adverse reactions of any grade are fatigue, anemia, nausea, neutropenia, headache, thrombocytopenia, vomiting, alopecia, diarrhea, and decreased appetite, the FDA said.
The recommended dose for talazoparib, marketed as Talzenna by Pfizer, is 1 mg taken as a single oral daily dose, with or without food.
The for patients with deleterious or suspected deleterious germline BRCA-mutated (gBRCAm), HER2-negative locally advanced or metastatic breast cancer.
The FDA also approved BRACAnalysis CDx from Myriad Genetic Laboratories as the companion diagnostic to identify patients with deleterious or suspected deleterious gBRCAm who are eligible for talazoparib, the agency announced.
Approval was based on improved progression-free survival in EMBRACA, a phase 3, open-label trial of 431 patients with gBRCAm HER2-negative locally advanced or metastatic breast cancer. Patients in the trial were randomized 2:1 to receive either talazoparib (1 mg) or a physician’s choice of chemotherapy (capecitabine, eribulin, gemcitabine, or vinorelbine). All patients had received treatment with an anthracycline and/or a taxane previously.
Median progression-free survival was 8.6 months in the talazoparib arm, compared with 5.6 months in the chemotherapy arm (HR, 0.54; 95% CI, 0.41-0.71; P less than .0001).
Anemia was the most common hematologic adverse event, with grade 3 or greater occurring in 39.2% of patients on the PARP inhibitor, compared with 4.8% of patients treated with other agents, according to results of the trial presented at the 2017 San Antonio Breast Cancer Symposium.
Warnings and precautions for myelodysplastic syndrome/acute myeloid leukemia, myelosuppression, and embryo-fetal toxicity are included in the drug’s prescribing information. The PARP inhibitor’s most common adverse reactions of any grade are fatigue, anemia, nausea, neutropenia, headache, thrombocytopenia, vomiting, alopecia, diarrhea, and decreased appetite, the FDA said.
The recommended dose for talazoparib, marketed as Talzenna by Pfizer, is 1 mg taken as a single oral daily dose, with or without food.
Lower-limb atherosclerosis predicts long-term mortality in patients with PAD
The location and extent of lower limb atherosclerosis predicts long-term mortality in patients with peripheral arterial disease (PAD), according to the results of a retrospective cohort study performed in England.

Comprehensive infrainguinal arterial imaging that used duplex ultrasound to determine the overall and site-specific burden of atherosclerotic disease predicted long-term outcomes in this patient group, according to a report published online in the European Journal of Vascular and Endovascular Surgery.
“Not only does such imaging provide anatomical information to guide intervention, but it may also provide information to further risk-stratify patients with regard to long-term cardiovascular risk,” wrote Paul J.W. Tern, MD, of Addenbrooke’s Hospital, Cambridge, England, and his colleagues.
A retrospective cohort study was performed on a consecutive series of 678 patients undergoing a lower limb arterial duplex scan during October 2009–June 2011 at Addenbrooke’s Hospital. Patients had a median age of 74 years and were followed for a median of 70 months.
A total of 307 patients died, which was the primary end point. Independent predictors of all-cause mortality included total Bollinger score (odds ratio, 1.11; P less than .001), femoropopliteal Bollinger score (OR, 1.34; P = .05); and crural Bollinger score (OR, 1.03; P = .03). The Bollinger score has been found to be a validated tool when used to determine overall lower limb atherosclerotic burden, the authors stated.
Dr. Tern and his colleagues also found that mortality was significantly associated with age, a history of ischemic heart disease, a history of congestive cardiac failure, and chronic renal failure (chronic kidney disease), although statin and antiplatelet therapy were found to be protective.
“This study has shown that infrainguinal atherosclerotic site and burden are independent predictors of poor outcome in patients; it is straightforward to determine and as such could be used to further risk stratify patients and influence the intensity of cardiovascular risk modification,” the researchers concluded.
The authors reported that they had no conflicts of interest.
SOURCE: Tern PJW et al. Eur J Vasc Endovasc Surg. 2018 Oct 1. doi: 10.1016/j.ejvs.2018.07.020.
The location and extent of lower limb atherosclerosis predicts long-term mortality in patients with peripheral arterial disease (PAD), according to the results of a retrospective cohort study performed in England.
Comprehensive infrainguinal arterial imaging that used duplex ultrasound to determine the overall and site-specific burden of atherosclerotic disease predicted long-term outcomes in this patient group, according to a report published online in the European Journal of Vascular and Endovascular Surgery.
“Not only does such imaging provide anatomical information to guide intervention, but it may also provide information to further risk-stratify patients with regard to long-term cardiovascular risk,” wrote Paul J.W. Tern, MD, of Addenbrooke’s Hospital, Cambridge, England, and his colleagues.
A retrospective cohort study was performed on a consecutive series of 678 patients undergoing a lower limb arterial duplex scan during October 2009–June 2011 at Addenbrooke’s Hospital. Patients had a median age of 74 years and were followed for a median of 70 months.
A total of 307 patients died, which was the primary end point. Independent predictors of all-cause mortality included total Bollinger score (odds ratio, 1.11; P less than .001), femoropopliteal Bollinger score (OR, 1.34; P = .05); and crural Bollinger score (OR, 1.03; P = .03). The Bollinger score has been found to be a validated tool when used to determine overall lower limb atherosclerotic burden, the authors stated.
Dr. Tern and his colleagues also found that mortality was significantly associated with age, a history of ischemic heart disease, a history of congestive cardiac failure, and chronic renal failure (chronic kidney disease), although statin and antiplatelet therapy were found to be protective.
“This study has shown that infrainguinal atherosclerotic site and burden are independent predictors of poor outcome in patients; it is straightforward to determine and as such could be used to further risk stratify patients and influence the intensity of cardiovascular risk modification,” the researchers concluded.
The authors reported that they had no conflicts of interest.
SOURCE: Tern PJW et al. Eur J Vasc Endovasc Surg. 2018 Oct 1. doi: 10.1016/j.ejvs.2018.07.020.
FROM THE EUROPEAN JOURNAL OF VASCULAR AND ENDOVASCULAR SURGERY
Key clinical point: Duplex utrasound imaging can predict long-term PAD mortality.
Major finding: Mortality risk was predicted by total (odds ratio, 1.11), femoropopliteal (OR, 1.34), and crural (OR, 1.03) Bollinger scores.
Study details: A retrospective cohort study of 678 patients.
Disclosures: The authors reported that they had no conflicts of interest.
Source: Tern PJW et al. Eur J Vasc Endovasc Surg. 2018 Oct 1. doi: 10.1016/j.ejvs.2018.07.020.
TV ads must trumpet drug prices, Trump administration says. Pharma tries a Plan B.
effectively setting the stage for months or possibly years of battle with the powerful industry.

The proposal, released late in the day, would require pharmaceutical companies to include in its television advertising the price of any drug that cost more than $35 a month. The price should be listed at the end of the advertisement in “a legible manner,” the rule states. It goes on to explain that the price should be presented against a contrasting background in a way that is easy to read.
Health and Human Services Secretary Alex M. Azar II, nodding to an industry proposal announced earlier in the day, said voluntary moves are not enough.
“We will not wait for an industry with so many conflicting and perverse incentives to reform itself,” Azar told the audience gathered at the National Academy of Sciences in Washington.
If approved, the proposed rule has no government enforcement mechanism that would force the companies to comply. Rather, it depends on shaming, noting that federal regulators would post a list of companies violating the rule. It would depend on the private sector to police itself with litigation.
“It is noteworthy that the government is unwilling to take enforcement action,” said Rachel Sachs, an associate professor of law at Washington University, St. Louis, and expert in drug-pricing regulation. The rule might never be finalized, she added.
“It will take many months if not years for this regulation to be implemented and free from the cloud of litigation that will follow it. And the administration knows that,” Ms. Sachs said.
Earlier on Oct. 15, the pharmaceutical industry trade group went on the offensive in anticipation of Mr. Azar’s speech by announcing its own plans.
“Putting list prices in isolation in the advertisements themselves would be misleading or confusing,” argued Stephen J. Ubl, CEO of the Pharmaceutical Researchers and Manufacturers of America, or PhRMA, the major trade group for branded drugs.
Instead, Mr. Ubl, whose trade group represents the largest pharmaceutical manufacturers on the globe, promised that pharma companies would direct consumers to websites that include a drug’s list price and estimates of what people can expect to pay, which can vary widely depending on coverage.
Drug manufacturers would voluntarily opt in to this disclosure starting next spring, he said. Mr. Ubl remained strongly critical of the White House proposal.
The Trump administration’s proposal comes weeks before midterm elections in which health care is a top voter concern. Polling from the Kaiser Family Foundation suggests most voters support forcing price transparency in drug advertisements. (Kaiser Health News is an editorially independent program of the foundation.)
The White House’s plan, which was teased in President Trump’s blueprint this summer, has won praise from insurance groups and the American Medical Association.
Sen. Chuck Grassley (R-Iowa) and Sen. Dick Durbin (D-Ill.) also proposed the plan in the Senate last month, but it failed to garner enough support.
Experts pointed out a host of complications, suggesting that neither PhRMA’s approach nor the White House’s would fully explain to consumers what they’ll actually pay for drugs.
On Oct. 15, Sen. Grassley applauded Mr. Azar’s announcement, saying it was a “common-sense way to lower prices.”
But Dale Cooke, a consultant who works with drug companies trying to meet Food and Drug Administration requirements for advertising, warned there is no reason to believe posting prices would help drive down prices.
“No one has ever explained to me why this would work,” Mr. Cooke said. “What’s the mechanism by which this results in lower drug prices?”
Even more, it could be confusing for patients, Mr. Cooke said. The proposed rule seemed to acknowledge this danger, he said, noting, “On the other hand, consumers, intimidated and confused by high list prices, may be deterred from contacting their physicians about drugs or medical conditions.”
A drug’s list price – the metric HHS wants to emphasize – often bears little relationship to what a patient pays at the drugstore. Insurance plans and pharmacy benefit managers often negotiate cheaper prices than the list price. Some patients qualify for other discounts. And often patients pay only what their copay or deductible requires at any given time.
Other consumers could be stuck paying the full cost, depending on how their insurance plan is designed, or if they don’t have coverage.
“The system is very opaque, very complicated, and importantly, there isn’t a huge relationship between list prices for drugs and what patients will expect to pay out-of-pocket,” said Adrienne Faerber, PhD, a lecturer at the Dartmouth Institute for Health Policy and Clinical Practice who researches drug marketing.
But the industry’s strategy, she said, also appeared lacking.
Under PhRMA’s plan, drugmakers would not standardize how they display their information. Where consumers go could vary on Pfizer’s website versus Merck’s to learn about the list price and the range of out-of-pocket costs. That, Ms. Faerber argued, would make it difficult for people to unearth relevant information.
PhRMA also announced it is partnering with patient advocacy groups to create a “patient affordability platform,” which could help patients search for costs and insurance coverage options.
Mr. Ubl cast PhRMA’s proposal as a way to address more effectively the government and public concern about drug price transparency.
Pharmaceutical manufacturers rely heavily on national advertising and together represent the third-highest spender in national television advertising, according to Michael Leszega, a manager of market intelligence at consulting firm Magna.
At certain times of day, pharmaceutical ads make up more than 40 percent of TV advertisements. And those commercials stand out because they are generally longer, with a long list of side effects and warnings the pharmaceutical industry must tag on at the end.
Those disclaimers highlight another challenge for the administration: legal action.
The rule notes its legal justification was based on the responsibility of the Centers for Medicare & Medicaid Services to ensure the health coverage programs that it administers – Medicare and Medicaid – must be operated in a manner that “minimizes reasonable expenditures.”
Sachs noted that the argument may be weak because most drugs are marketed to a wider audience than Medicare and Medicaid beneficiaries.
A body of Supreme Court decisions dictate how disclaimers and disclosures can be required, said constitutional law expert Robert Corn-Revere. He filed a “friend of the court” brief in a 2011 U.S. Supreme Court case related to commercial speech and the pharmaceutical industry.
Generally, the administration’s requirement must meet the standards of being purely factual, noncontroversial, and not burdensome, Mr. Corn-Revere said.
On the question of whether requiring drug prices be listed in advertising violates the First Amendment’s free-speech guarantee, Corn-Revere said it “all comes down to the specifics.”
Mr. Ubl, when asked earlier about legal action, didn’t rule out the possibility. “We believe there are substantial statutory and constitutional principles that arise” from requiring list-price disclosure, Mr. Ubl said, adding: “We do have concerns about that approach.”
KHN’s coverage of prescription drug development, costs and pricing is supported in part by the Laura and John Arnold Foundation. Kaiser Health News is a nonprofit national health policy news service. It is an editorially independent program of the Henry J. Kaiser Family Foundation that is not affiliated with Kaiser Permanente.
effectively setting the stage for months or possibly years of battle with the powerful industry.
The proposal, released late in the day, would require pharmaceutical companies to include in its television advertising the price of any drug that cost more than $35 a month. The price should be listed at the end of the advertisement in “a legible manner,” the rule states. It goes on to explain that the price should be presented against a contrasting background in a way that is easy to read.
Health and Human Services Secretary Alex M. Azar II, nodding to an industry proposal announced earlier in the day, said voluntary moves are not enough.
“We will not wait for an industry with so many conflicting and perverse incentives to reform itself,” Azar told the audience gathered at the National Academy of Sciences in Washington.
If approved, the proposed rule has no government enforcement mechanism that would force the companies to comply. Rather, it depends on shaming, noting that federal regulators would post a list of companies violating the rule. It would depend on the private sector to police itself with litigation.
“It is noteworthy that the government is unwilling to take enforcement action,” said Rachel Sachs, an associate professor of law at Washington University, St. Louis, and expert in drug-pricing regulation. The rule might never be finalized, she added.
“It will take many months if not years for this regulation to be implemented and free from the cloud of litigation that will follow it. And the administration knows that,” Ms. Sachs said.
Earlier on Oct. 15, the pharmaceutical industry trade group went on the offensive in anticipation of Mr. Azar’s speech by announcing its own plans.
“Putting list prices in isolation in the advertisements themselves would be misleading or confusing,” argued Stephen J. Ubl, CEO of the Pharmaceutical Researchers and Manufacturers of America, or PhRMA, the major trade group for branded drugs.
Instead, Mr. Ubl, whose trade group represents the largest pharmaceutical manufacturers on the globe, promised that pharma companies would direct consumers to websites that include a drug’s list price and estimates of what people can expect to pay, which can vary widely depending on coverage.
Drug manufacturers would voluntarily opt in to this disclosure starting next spring, he said. Mr. Ubl remained strongly critical of the White House proposal.
The Trump administration’s proposal comes weeks before midterm elections in which health care is a top voter concern. Polling from the Kaiser Family Foundation suggests most voters support forcing price transparency in drug advertisements. (Kaiser Health News is an editorially independent program of the foundation.)
The White House’s plan, which was teased in President Trump’s blueprint this summer, has won praise from insurance groups and the American Medical Association.
Sen. Chuck Grassley (R-Iowa) and Sen. Dick Durbin (D-Ill.) also proposed the plan in the Senate last month, but it failed to garner enough support.
Experts pointed out a host of complications, suggesting that neither PhRMA’s approach nor the White House’s would fully explain to consumers what they’ll actually pay for drugs.
On Oct. 15, Sen. Grassley applauded Mr. Azar’s announcement, saying it was a “common-sense way to lower prices.”
But Dale Cooke, a consultant who works with drug companies trying to meet Food and Drug Administration requirements for advertising, warned there is no reason to believe posting prices would help drive down prices.
“No one has ever explained to me why this would work,” Mr. Cooke said. “What’s the mechanism by which this results in lower drug prices?”
Even more, it could be confusing for patients, Mr. Cooke said. The proposed rule seemed to acknowledge this danger, he said, noting, “On the other hand, consumers, intimidated and confused by high list prices, may be deterred from contacting their physicians about drugs or medical conditions.”
A drug’s list price – the metric HHS wants to emphasize – often bears little relationship to what a patient pays at the drugstore. Insurance plans and pharmacy benefit managers often negotiate cheaper prices than the list price. Some patients qualify for other discounts. And often patients pay only what their copay or deductible requires at any given time.
Other consumers could be stuck paying the full cost, depending on how their insurance plan is designed, or if they don’t have coverage.
“The system is very opaque, very complicated, and importantly, there isn’t a huge relationship between list prices for drugs and what patients will expect to pay out-of-pocket,” said Adrienne Faerber, PhD, a lecturer at the Dartmouth Institute for Health Policy and Clinical Practice who researches drug marketing.
But the industry’s strategy, she said, also appeared lacking.
Under PhRMA’s plan, drugmakers would not standardize how they display their information. Where consumers go could vary on Pfizer’s website versus Merck’s to learn about the list price and the range of out-of-pocket costs. That, Ms. Faerber argued, would make it difficult for people to unearth relevant information.
PhRMA also announced it is partnering with patient advocacy groups to create a “patient affordability platform,” which could help patients search for costs and insurance coverage options.
Mr. Ubl cast PhRMA’s proposal as a way to address more effectively the government and public concern about drug price transparency.
Pharmaceutical manufacturers rely heavily on national advertising and together represent the third-highest spender in national television advertising, according to Michael Leszega, a manager of market intelligence at consulting firm Magna.
At certain times of day, pharmaceutical ads make up more than 40 percent of TV advertisements. And those commercials stand out because they are generally longer, with a long list of side effects and warnings the pharmaceutical industry must tag on at the end.
Those disclaimers highlight another challenge for the administration: legal action.
The rule notes its legal justification was based on the responsibility of the Centers for Medicare & Medicaid Services to ensure the health coverage programs that it administers – Medicare and Medicaid – must be operated in a manner that “minimizes reasonable expenditures.”
Sachs noted that the argument may be weak because most drugs are marketed to a wider audience than Medicare and Medicaid beneficiaries.
A body of Supreme Court decisions dictate how disclaimers and disclosures can be required, said constitutional law expert Robert Corn-Revere. He filed a “friend of the court” brief in a 2011 U.S. Supreme Court case related to commercial speech and the pharmaceutical industry.
Generally, the administration’s requirement must meet the standards of being purely factual, noncontroversial, and not burdensome, Mr. Corn-Revere said.
On the question of whether requiring drug prices be listed in advertising violates the First Amendment’s free-speech guarantee, Corn-Revere said it “all comes down to the specifics.”
Mr. Ubl, when asked earlier about legal action, didn’t rule out the possibility. “We believe there are substantial statutory and constitutional principles that arise” from requiring list-price disclosure, Mr. Ubl said, adding: “We do have concerns about that approach.”
KHN’s coverage of prescription drug development, costs and pricing is supported in part by the Laura and John Arnold Foundation. Kaiser Health News is a nonprofit national health policy news service. It is an editorially independent program of the Henry J. Kaiser Family Foundation that is not affiliated with Kaiser Permanente.
mRCC: Pazopanib appears safe in renal failure
with comorbid renal dysfunction.
In a multicenter, retrospective study that included 229 patients with or without renal insufficiency being treated for metastatic renal cell carcinoma with pazopanib, no significant differences were found in the incidence of adverse events between groups. Similar results were demonstrated for both efficacy parameters, progression-free survival, and overall survival (P = .6), Cristina Masini, MD, of AUSL-IRCCS in Reggio Emilia, Italy, and colleagues reported in Clinical Genitourinary Cancer.
The researchers also determined that dose reductions occurred more often in patients with renal insufficiency, compared with those that were renal competent (52% vs. 36%; P = .04).
The majority of study participants received a starting dose of 800 mg daily of pazopanib, which was reduced to a minimum of 200 mg daily in 19% of participants from the renal impairment group, compared with less than 1% in the nonrenally impaired group.
“The similar efficacy and safety displayed by pazopanib in patients with poor renal function, compared with those with normal function may have a major relevance for therapy individualization in clinical practice,” the investigators concluded, adding that, because of the retrospective study design, further research is needed to fully establish any causal links between pazopanib and renal insufficiency.
The authors reported that editorial assistance was supported by Novartis. No other conflict of interests were reported
SOURCE: Masini C et al. Clin Genitourin Cancer. 2018 Oct 1. doi: 10.1016/j.clgc.2018.10.001.
FROM CLINICAL GENITOURINARY CANCER
Key clinical point: Pazopanib may be safe and effective for metastatic renal cell carcinoma in patients with renal failure.
Major finding: No difference was reported in the incidence of adverse events in patients with or without renal dysfunction.
Study details: A retrospective analysis of 229 metastatic renal cell carcinoma patients treated with pazopanib.
Disclosures: Editorial assistance was supported by Novartis. The authors reported no conflict of interests related to the work.
Source: Masini C et al. Clin Genitourin Cancer. 2018 Oct 1. doi: 10.1016/j.clgc.2018.10.001.
New and promising GSM treatments, more clinical takeaways from NAMS 2018
Learn more about NAMS: http://www.menopause.org/home

Dr. Richard-Davis is Professor, Obstetrics and Gynecology, and Division Director, Reproductive Endocrinology and Infertility at the University of Arkansas for Medical Sciences, Little Rock, Arkansas.
The author reports no financial relationships related to this audio.
Dr. Richard-Davis is Professor, Obstetrics and Gynecology, and Division Director, Reproductive Endocrinology and Infertility at the University of Arkansas for Medical Sciences, Little Rock, Arkansas.
The author reports no financial relationships related to this audio.
Dr. Richard-Davis is Professor, Obstetrics and Gynecology, and Division Director, Reproductive Endocrinology and Infertility at the University of Arkansas for Medical Sciences, Little Rock, Arkansas.
The author reports no financial relationships related to this audio.
Learn more about NAMS: http://www.menopause.org/home
Learn more about NAMS: http://www.menopause.org/home
Improve cognitive symptoms of depression to boost work productivity
BARCELONA – (Assessment in Work Productivity and the Relationship with Cognitive Symptoms).

“We found that as patients rated themselves as improved in terms of cognition – ‘I can think better,’ ‘I can focus,’ ‘I’m concentrating better’ – there was a strong correlation at 12 weeks and later extended to 1 year with improved work productivity by as much as 75%. It’s pretty dramatic,” lead investigator Pratap Chokka, MD, said in an interview at the annual congress of the European College of Neuropsychopharmacology.
AtWoRK was a multicenter, open-label, naturalistic intervention study in which 219 gainfully employed Canadian adults with major depressive disorder (MDD) who had presented to primary care physicians or psychiatrists were placed on vortioxetine (Trintellex) flexibly dosed at 10-20 mg/day and scheduled for routine follow-up visits every 4 weeks for 52 weeks.
This was a patient population with severe depression, severe cognitive dysfunction, severe anxiety, and substantial functional impairment as reflected in their baseline scores on a variety of validated measures (see graphic). The study was designed to emulate real-world clinical practice.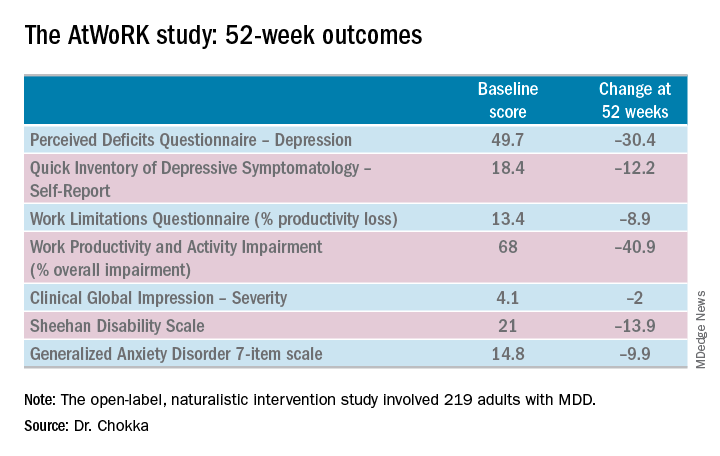
“We know that patients with depression are very impaired in terms of work productivity. Depressed patients really suffer from absenteeism and presenteeism [reduced productivity at work caused by depression]. And very few naturalistic studies have been done in working patients with depression,” according to Dr. Chokka. “The randomized trials are really important. They show us that a drug is working. But in terms of the real world that I work in, I need to have effectiveness: Does the drug work in patients with comorbid conditions, problems in their home lives, who are maybe drinking alcohol? Those are cases we’d rule out from participation in the RCTs.”
“The patients in our study walked into our clinics saying, ‘You know what, doctor, my mind isn’t working very good. I’m depressed, I can’t think, I can’t focus, I’m missing work, my boss is on my case, I’m making errors. I need help.’ These are the kinds of practicalities we wanted to address,” explained Dr. Chokka, a psychiatrist at Grey Nuns Community Hospital in Edmonton, Can.
The primary endpoint in AtWoRK was the correlation between changes in patients’ self-reported cognitive symptoms on the 20-item Perceived Deficits Questionnaire–Depression (PDQ-D-20) and changes in work productivity loss measured on the Work Limitations Questionnaire (WLQ) at week 12. Those 12-week results were recently published (CNS Spectr. 2018 May 24:1-10). At the ECNP congress, Dr. Chokka presented the expanded 52-week outcomes.
The correlation between change from baseline to week 12 in PDQ-D-20 and change in WLQ was strong (r = 0.606), and it remained strong at week 52 (r = 0.731; P less than .001).
At 52 weeks on vortioxetine, 77% of patients fulfilled criteria for MDD response, which required at least a 50% reduction in Quick Inventory of Depressive Symptomatology – Self-Report (QIDS-SR) score from baseline, and 56% for disease remission, which meant the QIDS-SR score was 5 or less. The response and remission rates were 71% and 45%, respectively, in the 107 subjects for whom the drug was the first treatment for their current MDD episode and 83% and 67% for the 112 switched to vortioxetine at study outset because the antidepressant they’d been on was ineffective.
Subjects also displayed significant improvement at 12 and 52 weeks in mood as assessed using QIDS-SR and global functioning as measured using the Sheehan Disability Scale (SDS). Of note, however, improvement in cognitive symptoms was independent of and not predictive of improvement in overall depressive symptoms on the QIDS-SR. Nor did improvement in depressive symptoms predict functional outcomes as assessed by the WLQ or SDS.
In Dr. Chokka’s view, these findings have clear implications for clinical practice: “In the past we thought that, if we can get the mood better, things will all get better. We now we know that treating depression is about more than just getting the mood better.”
Vortioxetine is an antidepressant with multiple agonist and antagonist effects on various 5-HT serotonin receptors.
The AtWoRK study was supported by Lundbeck Canada. Dr. Chokka reported receiving research grants from and serving on advisory boards and as a speaker for that company and others.
SOURCE: Chokka P. ECNP, P.022.
BARCELONA – (Assessment in Work Productivity and the Relationship with Cognitive Symptoms).
“We found that as patients rated themselves as improved in terms of cognition – ‘I can think better,’ ‘I can focus,’ ‘I’m concentrating better’ – there was a strong correlation at 12 weeks and later extended to 1 year with improved work productivity by as much as 75%. It’s pretty dramatic,” lead investigator Pratap Chokka, MD, said in an interview at the annual congress of the European College of Neuropsychopharmacology.
AtWoRK was a multicenter, open-label, naturalistic intervention study in which 219 gainfully employed Canadian adults with major depressive disorder (MDD) who had presented to primary care physicians or psychiatrists were placed on vortioxetine (Trintellex) flexibly dosed at 10-20 mg/day and scheduled for routine follow-up visits every 4 weeks for 52 weeks.
This was a patient population with severe depression, severe cognitive dysfunction, severe anxiety, and substantial functional impairment as reflected in their baseline scores on a variety of validated measures (see graphic). The study was designed to emulate real-world clinical practice.
“We know that patients with depression are very impaired in terms of work productivity. Depressed patients really suffer from absenteeism and presenteeism [reduced productivity at work caused by depression]. And very few naturalistic studies have been done in working patients with depression,” according to Dr. Chokka. “The randomized trials are really important. They show us that a drug is working. But in terms of the real world that I work in, I need to have effectiveness: Does the drug work in patients with comorbid conditions, problems in their home lives, who are maybe drinking alcohol? Those are cases we’d rule out from participation in the RCTs.”
“The patients in our study walked into our clinics saying, ‘You know what, doctor, my mind isn’t working very good. I’m depressed, I can’t think, I can’t focus, I’m missing work, my boss is on my case, I’m making errors. I need help.’ These are the kinds of practicalities we wanted to address,” explained Dr. Chokka, a psychiatrist at Grey Nuns Community Hospital in Edmonton, Can.
The primary endpoint in AtWoRK was the correlation between changes in patients’ self-reported cognitive symptoms on the 20-item Perceived Deficits Questionnaire–Depression (PDQ-D-20) and changes in work productivity loss measured on the Work Limitations Questionnaire (WLQ) at week 12. Those 12-week results were recently published (CNS Spectr. 2018 May 24:1-10). At the ECNP congress, Dr. Chokka presented the expanded 52-week outcomes.
The correlation between change from baseline to week 12 in PDQ-D-20 and change in WLQ was strong (r = 0.606), and it remained strong at week 52 (r = 0.731; P less than .001).
At 52 weeks on vortioxetine, 77% of patients fulfilled criteria for MDD response, which required at least a 50% reduction in Quick Inventory of Depressive Symptomatology – Self-Report (QIDS-SR) score from baseline, and 56% for disease remission, which meant the QIDS-SR score was 5 or less. The response and remission rates were 71% and 45%, respectively, in the 107 subjects for whom the drug was the first treatment for their current MDD episode and 83% and 67% for the 112 switched to vortioxetine at study outset because the antidepressant they’d been on was ineffective.
Subjects also displayed significant improvement at 12 and 52 weeks in mood as assessed using QIDS-SR and global functioning as measured using the Sheehan Disability Scale (SDS). Of note, however, improvement in cognitive symptoms was independent of and not predictive of improvement in overall depressive symptoms on the QIDS-SR. Nor did improvement in depressive symptoms predict functional outcomes as assessed by the WLQ or SDS.
In Dr. Chokka’s view, these findings have clear implications for clinical practice: “In the past we thought that, if we can get the mood better, things will all get better. We now we know that treating depression is about more than just getting the mood better.”
Vortioxetine is an antidepressant with multiple agonist and antagonist effects on various 5-HT serotonin receptors.
The AtWoRK study was supported by Lundbeck Canada. Dr. Chokka reported receiving research grants from and serving on advisory boards and as a speaker for that company and others.
SOURCE: Chokka P. ECNP, P.022.
REPORTING FROM THE ECNP CONGRESS
Key clinical point: Treat cognitive symptoms of depression to improve impaired work productivity.
Major finding: Impaired work productivity in depressed patients improved greatly in response to reduction in cognitive symptoms, but not with enhanced mood.
Study details: A 52-week, multicenter, open-label study in which 219 employed adults with major depression were placed on vortioxetine and serially assessed for changes in cognitive dysfunction, mood, and work productivity.
Disclosures: The AtWoRK study was supported by Lundbeck Canada. The presenter reported receiving research grants from and serving on advisory boards and as a speaker for that company and others.
Source: Chokka P. ECNP, P.022.
NAIP to SHM: The importance of a name
Defining the hospitalist ‘brand’
The National Association of Inpatient Physicians (NAIP) “opened its doors” in the spring of 1998, welcoming the first 300 hospitalists. The term “hospitalist” was first coined in Bob Wachter’s 1996 New England Journal of Medicine article,1 although hospitalists were relatively few at that time, and the term not infrequently evoked controversy.

Having full-time hospital-based physicians was highly disruptive to the traditional culture of medicine, where hospital rounds were an integral part of a primary care physicians’ practice, professional identity, and referral patterns. Additionally, many hospital-based specialists were beginning to fill the hospitalist role.
The decision to include “inpatient physician” rather than “hospitalist” in the name was carefully considered and was intended to be inclusive, without alienating potential allies. Virtually any doctor working in a hospital could identify themselves as an inpatient physician, and all who wanted to participate were welcomed. It also was evident early on that this young specialty was going to comprise many different disciplines, including internal medicine, family practice, and pediatrics to name a few, and reaching out to all potential stakeholders was an urgent priority.
During its’ first 5 years, the field of hospital medicine grew rapidly, with NAIP membership nearing 2,000 members. The bimonthly newsletter The Hospitalist provided a vehicle to reach out to members and other stakeholders, and the annual meeting gave hospitalists a forum to gather, learn from each other, and enjoy camaraderie. Early research efforts focused on patient safety and, just as importantly, in 2002, the publication of the first Productivity and Compensation Survey (which is now known as SHM’s State of Hospital Medicine Report) and the initial development of The Hospitalist Core Competencies (first published in 2006, and now in its’ 2017 revision) all helped define the young specialty and gain acceptance.2,3
The term hospitalist became mainstream and accepted, and the name of our field, hospital medicine, has now become widely recognized.
Though the term “inpatient physician” had focused on physicians as a primary constituency, the successful growth of hospital medicine now increasingly depended upon other important constituencies and their understanding of the hospital medicine specialty and the role of hospitalists. These stakeholders included virtually all health care professionals and administrators, government officials at the federal, state, and local levels, patients, and the American public.
As NAIP leadership, it was our belief and intent that having a name that accurately portrayed hospitalists and hospital medicine would define our “brand” in an understandable way. This was especially important given the breadth and depth of the responsibilities that NAIP and its’ members were increasingly taking on in a rapidly changing health care system. Additionally, it was a top priority to find a name that would inspire confidence and passion among our members, stir a sense of loyalty and pride, and continue to be inclusive.
With this in mind, the NAIP board undertook a process to search for a new name in the spring of 2002. As NAIP President-Elect, stewarding the name change process was my responsibility.
In approaching this challenge, we initially evaluated the components of other professional organizations’ names, including academy, college, and society among others, and whether the specialist name or professional field was included. We then held focus groups among regional hospitalists, invited feedback from all NAIP members, and solicited leadership feedback from other professional organizations. All of these data were taken into our fall 2002 board meeting in St. Louis.
Prior to the meeting, it was agreed that making a name change would require a supermajority of two-thirds of the 11 voting board members (though only 10 ultimately attended the meeting). Also participating in the discussion were the nonvoting four ex-officio board members and the NAIP CEO. The initial discussion included presentations arguing for Hospital Medicine versus Hospitalist as part of the name. We then discussed and voted on the primary professional component of the name, with “Society” finally being chosen. After further discussion and a series of ballots, we arrived at the name “Society of Hospital Medicine.” In the final ballot, 7 out of 10 cast their votes in favor of this finalist, and our organization became The Society of Hospital Medicine. Our abbreviation SHM was to become our logo, which was developed in advance of our 2003 annual meeting.
In the 15 years since, the Society of Hospital Medicine has become well known to our constituents and stakeholders. SHM is recognized for its staunch advocacy, particularly at the federal level, with recent establishment of a Medicare specialty code designation for hospitalists, and support for endeavors such as Project Boost, which focused on patient transitions from hospital discharge to home.4,5,6 Hospitalists throughout the United States routinely manage hospitalized patients, and now have their specialty expertise recognized via Focused Practice in Hospital Medicine (Internal Medicine and Family Practice), and future specialty training and certification for pediatric hospitalists.7,8,9
The Journal of Hospital Medicine now highlights accomplishments in hospital medicine research and knowledge.10 Hospitalist leaders frequently are developed through the SHM Leadership Academy,11 and hospitalists increasingly fill diverse health care responsibilities in education, research, informatics, palliative care, performance improvement, administration, among many others. Of note, SHM membership currently exceeds 17,000 members, and now offers membership that includes nurse practitioners, physician assistants, fellows, residents, students, and practice administrators, among others.12
These achievements and many more have been driven by the efforts of past and present Society of Hospital Medicine members and staff, and like-minded, invested professionals and organizations. The name Society of Hospital Medicine (SHM) is highly familiar and well regarded by virtually all our stakeholders and is recognized for its proven leadership in continuing to define our brand, hospital medicine.
Dr. Dichter is an intensivist and associate professor of medicine at the University of Minnesota Medical Center, Minneapolis.
References
1. Wachter RM et al. The emerging role of “hospitalists” in the American health care system. N Eng J Med. 1996 Aug 15;335(7):514-7.
2. SHM’s State of Hospital Medicine Report 2018. Fall 2018.
3. Satyen N et al. Core competencies in hospital medicine 2017 Revision. J Hosp Med. 2017 Apr;12:S1.
4. Society of Hospital Medicine website, Policy & Advocacy homepage (accessed July 26, 2018).
5. CMS manual system, Oct. 28, 2016 (accessed July 26, 2018).
6. Society of Hospital Medicine website, Clinical Topics: Advancing successful care transitions to improve outcomes (accessed July 26, 2018).
7. American Board of Internal Medicine website, MOC requirements: Focused practice in hospital medicine (accessed July 26, 2018).
8. American Board of Family Medicine website, Designation of practice in hospital medicine (accessed July 26, 2018).
9. The American Board of Pediatrics website, Pediatric hospital medicine certification (accessed July 26, 2018).
10. Journal of Hospital Medicine official website (accessed July 26, 2018).
11. SHM Leadership Academy website (accessed July 26, 2018).
12. Society of Hospital Medicine website, About SHM membership (accessed July 26, 2018).
Defining the hospitalist ‘brand’
Defining the hospitalist ‘brand’
The National Association of Inpatient Physicians (NAIP) “opened its doors” in the spring of 1998, welcoming the first 300 hospitalists. The term “hospitalist” was first coined in Bob Wachter’s 1996 New England Journal of Medicine article,1 although hospitalists were relatively few at that time, and the term not infrequently evoked controversy.
Having full-time hospital-based physicians was highly disruptive to the traditional culture of medicine, where hospital rounds were an integral part of a primary care physicians’ practice, professional identity, and referral patterns. Additionally, many hospital-based specialists were beginning to fill the hospitalist role.
The decision to include “inpatient physician” rather than “hospitalist” in the name was carefully considered and was intended to be inclusive, without alienating potential allies. Virtually any doctor working in a hospital could identify themselves as an inpatient physician, and all who wanted to participate were welcomed. It also was evident early on that this young specialty was going to comprise many different disciplines, including internal medicine, family practice, and pediatrics to name a few, and reaching out to all potential stakeholders was an urgent priority.
During its’ first 5 years, the field of hospital medicine grew rapidly, with NAIP membership nearing 2,000 members. The bimonthly newsletter The Hospitalist provided a vehicle to reach out to members and other stakeholders, and the annual meeting gave hospitalists a forum to gather, learn from each other, and enjoy camaraderie. Early research efforts focused on patient safety and, just as importantly, in 2002, the publication of the first Productivity and Compensation Survey (which is now known as SHM’s State of Hospital Medicine Report) and the initial development of The Hospitalist Core Competencies (first published in 2006, and now in its’ 2017 revision) all helped define the young specialty and gain acceptance.2,3
The term hospitalist became mainstream and accepted, and the name of our field, hospital medicine, has now become widely recognized.
Though the term “inpatient physician” had focused on physicians as a primary constituency, the successful growth of hospital medicine now increasingly depended upon other important constituencies and their understanding of the hospital medicine specialty and the role of hospitalists. These stakeholders included virtually all health care professionals and administrators, government officials at the federal, state, and local levels, patients, and the American public.
As NAIP leadership, it was our belief and intent that having a name that accurately portrayed hospitalists and hospital medicine would define our “brand” in an understandable way. This was especially important given the breadth and depth of the responsibilities that NAIP and its’ members were increasingly taking on in a rapidly changing health care system. Additionally, it was a top priority to find a name that would inspire confidence and passion among our members, stir a sense of loyalty and pride, and continue to be inclusive.
With this in mind, the NAIP board undertook a process to search for a new name in the spring of 2002. As NAIP President-Elect, stewarding the name change process was my responsibility.
In approaching this challenge, we initially evaluated the components of other professional organizations’ names, including academy, college, and society among others, and whether the specialist name or professional field was included. We then held focus groups among regional hospitalists, invited feedback from all NAIP members, and solicited leadership feedback from other professional organizations. All of these data were taken into our fall 2002 board meeting in St. Louis.
Prior to the meeting, it was agreed that making a name change would require a supermajority of two-thirds of the 11 voting board members (though only 10 ultimately attended the meeting). Also participating in the discussion were the nonvoting four ex-officio board members and the NAIP CEO. The initial discussion included presentations arguing for Hospital Medicine versus Hospitalist as part of the name. We then discussed and voted on the primary professional component of the name, with “Society” finally being chosen. After further discussion and a series of ballots, we arrived at the name “Society of Hospital Medicine.” In the final ballot, 7 out of 10 cast their votes in favor of this finalist, and our organization became The Society of Hospital Medicine. Our abbreviation SHM was to become our logo, which was developed in advance of our 2003 annual meeting.
In the 15 years since, the Society of Hospital Medicine has become well known to our constituents and stakeholders. SHM is recognized for its staunch advocacy, particularly at the federal level, with recent establishment of a Medicare specialty code designation for hospitalists, and support for endeavors such as Project Boost, which focused on patient transitions from hospital discharge to home.4,5,6 Hospitalists throughout the United States routinely manage hospitalized patients, and now have their specialty expertise recognized via Focused Practice in Hospital Medicine (Internal Medicine and Family Practice), and future specialty training and certification for pediatric hospitalists.7,8,9
The Journal of Hospital Medicine now highlights accomplishments in hospital medicine research and knowledge.10 Hospitalist leaders frequently are developed through the SHM Leadership Academy,11 and hospitalists increasingly fill diverse health care responsibilities in education, research, informatics, palliative care, performance improvement, administration, among many others. Of note, SHM membership currently exceeds 17,000 members, and now offers membership that includes nurse practitioners, physician assistants, fellows, residents, students, and practice administrators, among others.12
These achievements and many more have been driven by the efforts of past and present Society of Hospital Medicine members and staff, and like-minded, invested professionals and organizations. The name Society of Hospital Medicine (SHM) is highly familiar and well regarded by virtually all our stakeholders and is recognized for its proven leadership in continuing to define our brand, hospital medicine.
Dr. Dichter is an intensivist and associate professor of medicine at the University of Minnesota Medical Center, Minneapolis.
References
1. Wachter RM et al. The emerging role of “hospitalists” in the American health care system. N Eng J Med. 1996 Aug 15;335(7):514-7.
2. SHM’s State of Hospital Medicine Report 2018. Fall 2018.
3. Satyen N et al. Core competencies in hospital medicine 2017 Revision. J Hosp Med. 2017 Apr;12:S1.
4. Society of Hospital Medicine website, Policy & Advocacy homepage (accessed July 26, 2018).
5. CMS manual system, Oct. 28, 2016 (accessed July 26, 2018).
6. Society of Hospital Medicine website, Clinical Topics: Advancing successful care transitions to improve outcomes (accessed July 26, 2018).
7. American Board of Internal Medicine website, MOC requirements: Focused practice in hospital medicine (accessed July 26, 2018).
8. American Board of Family Medicine website, Designation of practice in hospital medicine (accessed July 26, 2018).
9. The American Board of Pediatrics website, Pediatric hospital medicine certification (accessed July 26, 2018).
10. Journal of Hospital Medicine official website (accessed July 26, 2018).
11. SHM Leadership Academy website (accessed July 26, 2018).
12. Society of Hospital Medicine website, About SHM membership (accessed July 26, 2018).
FDA offers guidance on MRD assessment in blood cancer trials
The of patients with hematologic malignancies.

The FDA said it developed the document to assist drug sponsors who are planning to use minimal residual disease (MRD) as a biomarker in clinical trials conducted under an investigational new drug application or to support FDA approval of products intended to treat hematologic malignancies.
“As a result of important workshops where we’ve heard from stakeholders and an analysis of marketing applications showing inconsistent quality of MRD data, the FDA identified a need to provide sponsors with guidance on the use of MRD as a biomarker in regulatory submissions,” FDA Commissioner Scott Gottlieb, MD, said in a statement.
The guidance explains how MRD might be used in clinical trials, highlights considerations for MRD assessment that are specific to certain hematologic malignancies, and lists requirements for regulatory submissions that utilize MRD.
MRD could potentially be used as a biomarker in clinical trials – specifically as a diagnostic, prognostic, predictive, efficacy-response, or monitoring biomarker, according to the draft guidance. Additionally, MRD could be used as a surrogate endpoint or “to select patients at high risk or to enrich the trial population.”
The draft guidance also provides specific considerations for MRD assessment in individual hematologic malignancies, including acute lymphoblastic leukemia, acute myeloid leukemia, acute promyelocytic leukemia, chronic lymphocytic leukemia, chronic myeloid leukemia, and multiple myeloma.
The full document is available on the FDA website.
The of patients with hematologic malignancies.
The FDA said it developed the document to assist drug sponsors who are planning to use minimal residual disease (MRD) as a biomarker in clinical trials conducted under an investigational new drug application or to support FDA approval of products intended to treat hematologic malignancies.
“As a result of important workshops where we’ve heard from stakeholders and an analysis of marketing applications showing inconsistent quality of MRD data, the FDA identified a need to provide sponsors with guidance on the use of MRD as a biomarker in regulatory submissions,” FDA Commissioner Scott Gottlieb, MD, said in a statement.
The guidance explains how MRD might be used in clinical trials, highlights considerations for MRD assessment that are specific to certain hematologic malignancies, and lists requirements for regulatory submissions that utilize MRD.
MRD could potentially be used as a biomarker in clinical trials – specifically as a diagnostic, prognostic, predictive, efficacy-response, or monitoring biomarker, according to the draft guidance. Additionally, MRD could be used as a surrogate endpoint or “to select patients at high risk or to enrich the trial population.”
The draft guidance also provides specific considerations for MRD assessment in individual hematologic malignancies, including acute lymphoblastic leukemia, acute myeloid leukemia, acute promyelocytic leukemia, chronic lymphocytic leukemia, chronic myeloid leukemia, and multiple myeloma.
The full document is available on the FDA website.