User login
AAP: Treating patients during disasters raises liability risks

In a 2019 technical report, the AAP outlines common claims that can arise when treating children during disasters and how certain circumstances can force you to deviate from routine medical practices. In an accompanying policy statement by the AAP committee on medical liability and risk management, recommendations are offered for how to prepare for and prevent such legal risks.
During disasters, liability dangers can increase when circumstances “devolve into an environment of limited choices for both patients and providers,” and you have fewer treatment options available to you, according to the guidance authored by New York pediatrician Dr. Robin L. Altman and her associates.
Common claims that stem from treating patients during disasters are negligence, abandonment, and lack of informed consent. The AAP technical report offers examples about how these accusations can occur, including:
- When during a disaster, you are forced to alter treatment because of scarce medical supplies or equipment, you may later be accused of negligence if the patient’s outcome is negatively affected by the modified treatment.
- When a disaster progresses to overwhelming conditions, and you must practice in an altered health care environment that demands atypical actions, such actions may later be questioned and be accused of providing suboptimal care. Documentation of medical decision making for instance, a primary defense for one’s actions, may be compromised because of an inoperable electronic medical record. Similarly, past medical history may be unavailable, which may impact the appropriateness of care provision.
- In chaotic conditions, you may have to stop treating some patients to focus their time and resources elsewhere, which may lead to an abandonment claim, defined as unilateral termination of a physician-patient relationship – without proper patient notice – when treatment is still required. An abandonment claim also may arise when you have to make decisions in extreme conditions about which patients to transfer or evacuate first and whom to leave behind.
- When providing medical care to children during disasters, a lack of informed consent claim can arise if adequate parental permission is unattainable. This may result from families that are separated or displaced children in need of medical care.
Other claims that can arise from providing care during disasters include HIPAA breaches, licensing violations, discrimination claims, and Emergency Medical Treatment and Labor Act (EMTALA) violations, among others.
To reduce liability risks, you should strive to understand liability risks and limitations during disasters and take steps to mitigate them by crafting a disaster readiness plan, according to the AAP policy statement. The plan should include provider and staff education on improving medical care during disasters and how best to document medical decisions made in disaster-affected health care environments. Proactively identifying obstacles to care during disasters also is key. You can use the AAP division of state government affairs as a resource; it can provide current information on disaster liability in the different states.
You also should understand potential limits to your medical malpractice insurance coverage during disasters and take steps to add coverage for identified gaps, according to the AAP guidelines.
AAP recommends that you advocate for your health center to have active disaster plans that cover children’s needs and for your hospital to conduct regular drills that test pediatric capabilities. Throughout the guidelines, the AAP calls on the U.S. Department of Health and Human Services to review current state and federal liability laws, and for the agency to recommend new laws that address disaster-response liability protections for doctors. HHS also should assess the liability coverage needs of physicians during crisis times and take action to reduce inconsistencies in state malpractice protections for volunteer physicians and nonvolunteer physicians, according to AAP.
The AAP policy statement is timely because of the number of recent disasters in the United States, said Dr. Altman, lead author of the two papers.
Citing the Federal Emergency Management Agency, Dr. Altman said there were 59 major disaster declarations and 16 emergency declarations in 2017, along with more than 300 mass shooting incidents and more than 110 other man-made disasters such as fires and industrial accidents.
“Disaster conditions can result in pediatric health care providers being faced with the need to address medical conditions outside of their scope of training and experience, without access to the usual fund of patient history and background information, without the usual input or consent from parents or guardians, without the usual assistance of data such as laboratory values or physiologic monitoring, and without knowledge of how long dire conditions will last,” Dr. Altman said in an AAP News statement. “In addition, this can occur within the backdrop of one’s own physical exhaustion, concerns for the safety of one’s own family members, and the risk of loss of valuable and expensive professional property and supplies.”
The AAP guidance can help pediatricians understand the unique professional liability risks that may occur when caring for pediatric patients and families during a disaster, she said.
“It is the hope that this will raise awareness, improve preparedness, and reduce potential deficiencies in professional liability protections for health care providers trying to do their best to care for patients during these infrequent, yet debilitating, events,” Dr. Altman said in the statement.
There was no external funding, and the authors indicated they had no relevant financial disclosures.
SOURCES: Pediatrics. 2019. doi: 10.1542/peds.2018-3892; Pediatrics. 2019. doi: 10.1542/peds.2018-3893.
In a 2019 technical report, the AAP outlines common claims that can arise when treating children during disasters and how certain circumstances can force you to deviate from routine medical practices. In an accompanying policy statement by the AAP committee on medical liability and risk management, recommendations are offered for how to prepare for and prevent such legal risks.
During disasters, liability dangers can increase when circumstances “devolve into an environment of limited choices for both patients and providers,” and you have fewer treatment options available to you, according to the guidance authored by New York pediatrician Dr. Robin L. Altman and her associates.
Common claims that stem from treating patients during disasters are negligence, abandonment, and lack of informed consent. The AAP technical report offers examples about how these accusations can occur, including:
- When during a disaster, you are forced to alter treatment because of scarce medical supplies or equipment, you may later be accused of negligence if the patient’s outcome is negatively affected by the modified treatment.
- When a disaster progresses to overwhelming conditions, and you must practice in an altered health care environment that demands atypical actions, such actions may later be questioned and be accused of providing suboptimal care. Documentation of medical decision making for instance, a primary defense for one’s actions, may be compromised because of an inoperable electronic medical record. Similarly, past medical history may be unavailable, which may impact the appropriateness of care provision.
- In chaotic conditions, you may have to stop treating some patients to focus their time and resources elsewhere, which may lead to an abandonment claim, defined as unilateral termination of a physician-patient relationship – without proper patient notice – when treatment is still required. An abandonment claim also may arise when you have to make decisions in extreme conditions about which patients to transfer or evacuate first and whom to leave behind.
- When providing medical care to children during disasters, a lack of informed consent claim can arise if adequate parental permission is unattainable. This may result from families that are separated or displaced children in need of medical care.
Other claims that can arise from providing care during disasters include HIPAA breaches, licensing violations, discrimination claims, and Emergency Medical Treatment and Labor Act (EMTALA) violations, among others.
To reduce liability risks, you should strive to understand liability risks and limitations during disasters and take steps to mitigate them by crafting a disaster readiness plan, according to the AAP policy statement. The plan should include provider and staff education on improving medical care during disasters and how best to document medical decisions made in disaster-affected health care environments. Proactively identifying obstacles to care during disasters also is key. You can use the AAP division of state government affairs as a resource; it can provide current information on disaster liability in the different states.
You also should understand potential limits to your medical malpractice insurance coverage during disasters and take steps to add coverage for identified gaps, according to the AAP guidelines.
AAP recommends that you advocate for your health center to have active disaster plans that cover children’s needs and for your hospital to conduct regular drills that test pediatric capabilities. Throughout the guidelines, the AAP calls on the U.S. Department of Health and Human Services to review current state and federal liability laws, and for the agency to recommend new laws that address disaster-response liability protections for doctors. HHS also should assess the liability coverage needs of physicians during crisis times and take action to reduce inconsistencies in state malpractice protections for volunteer physicians and nonvolunteer physicians, according to AAP.
The AAP policy statement is timely because of the number of recent disasters in the United States, said Dr. Altman, lead author of the two papers.
Citing the Federal Emergency Management Agency, Dr. Altman said there were 59 major disaster declarations and 16 emergency declarations in 2017, along with more than 300 mass shooting incidents and more than 110 other man-made disasters such as fires and industrial accidents.
“Disaster conditions can result in pediatric health care providers being faced with the need to address medical conditions outside of their scope of training and experience, without access to the usual fund of patient history and background information, without the usual input or consent from parents or guardians, without the usual assistance of data such as laboratory values or physiologic monitoring, and without knowledge of how long dire conditions will last,” Dr. Altman said in an AAP News statement. “In addition, this can occur within the backdrop of one’s own physical exhaustion, concerns for the safety of one’s own family members, and the risk of loss of valuable and expensive professional property and supplies.”
The AAP guidance can help pediatricians understand the unique professional liability risks that may occur when caring for pediatric patients and families during a disaster, she said.
“It is the hope that this will raise awareness, improve preparedness, and reduce potential deficiencies in professional liability protections for health care providers trying to do their best to care for patients during these infrequent, yet debilitating, events,” Dr. Altman said in the statement.
There was no external funding, and the authors indicated they had no relevant financial disclosures.
SOURCES: Pediatrics. 2019. doi: 10.1542/peds.2018-3892; Pediatrics. 2019. doi: 10.1542/peds.2018-3893.
In a 2019 technical report, the AAP outlines common claims that can arise when treating children during disasters and how certain circumstances can force you to deviate from routine medical practices. In an accompanying policy statement by the AAP committee on medical liability and risk management, recommendations are offered for how to prepare for and prevent such legal risks.
During disasters, liability dangers can increase when circumstances “devolve into an environment of limited choices for both patients and providers,” and you have fewer treatment options available to you, according to the guidance authored by New York pediatrician Dr. Robin L. Altman and her associates.
Common claims that stem from treating patients during disasters are negligence, abandonment, and lack of informed consent. The AAP technical report offers examples about how these accusations can occur, including:
- When during a disaster, you are forced to alter treatment because of scarce medical supplies or equipment, you may later be accused of negligence if the patient’s outcome is negatively affected by the modified treatment.
- When a disaster progresses to overwhelming conditions, and you must practice in an altered health care environment that demands atypical actions, such actions may later be questioned and be accused of providing suboptimal care. Documentation of medical decision making for instance, a primary defense for one’s actions, may be compromised because of an inoperable electronic medical record. Similarly, past medical history may be unavailable, which may impact the appropriateness of care provision.
- In chaotic conditions, you may have to stop treating some patients to focus their time and resources elsewhere, which may lead to an abandonment claim, defined as unilateral termination of a physician-patient relationship – without proper patient notice – when treatment is still required. An abandonment claim also may arise when you have to make decisions in extreme conditions about which patients to transfer or evacuate first and whom to leave behind.
- When providing medical care to children during disasters, a lack of informed consent claim can arise if adequate parental permission is unattainable. This may result from families that are separated or displaced children in need of medical care.
Other claims that can arise from providing care during disasters include HIPAA breaches, licensing violations, discrimination claims, and Emergency Medical Treatment and Labor Act (EMTALA) violations, among others.
To reduce liability risks, you should strive to understand liability risks and limitations during disasters and take steps to mitigate them by crafting a disaster readiness plan, according to the AAP policy statement. The plan should include provider and staff education on improving medical care during disasters and how best to document medical decisions made in disaster-affected health care environments. Proactively identifying obstacles to care during disasters also is key. You can use the AAP division of state government affairs as a resource; it can provide current information on disaster liability in the different states.
You also should understand potential limits to your medical malpractice insurance coverage during disasters and take steps to add coverage for identified gaps, according to the AAP guidelines.
AAP recommends that you advocate for your health center to have active disaster plans that cover children’s needs and for your hospital to conduct regular drills that test pediatric capabilities. Throughout the guidelines, the AAP calls on the U.S. Department of Health and Human Services to review current state and federal liability laws, and for the agency to recommend new laws that address disaster-response liability protections for doctors. HHS also should assess the liability coverage needs of physicians during crisis times and take action to reduce inconsistencies in state malpractice protections for volunteer physicians and nonvolunteer physicians, according to AAP.
The AAP policy statement is timely because of the number of recent disasters in the United States, said Dr. Altman, lead author of the two papers.
Citing the Federal Emergency Management Agency, Dr. Altman said there were 59 major disaster declarations and 16 emergency declarations in 2017, along with more than 300 mass shooting incidents and more than 110 other man-made disasters such as fires and industrial accidents.
“Disaster conditions can result in pediatric health care providers being faced with the need to address medical conditions outside of their scope of training and experience, without access to the usual fund of patient history and background information, without the usual input or consent from parents or guardians, without the usual assistance of data such as laboratory values or physiologic monitoring, and without knowledge of how long dire conditions will last,” Dr. Altman said in an AAP News statement. “In addition, this can occur within the backdrop of one’s own physical exhaustion, concerns for the safety of one’s own family members, and the risk of loss of valuable and expensive professional property and supplies.”
The AAP guidance can help pediatricians understand the unique professional liability risks that may occur when caring for pediatric patients and families during a disaster, she said.
“It is the hope that this will raise awareness, improve preparedness, and reduce potential deficiencies in professional liability protections for health care providers trying to do their best to care for patients during these infrequent, yet debilitating, events,” Dr. Altman said in the statement.
There was no external funding, and the authors indicated they had no relevant financial disclosures.
SOURCES: Pediatrics. 2019. doi: 10.1542/peds.2018-3892; Pediatrics. 2019. doi: 10.1542/peds.2018-3893.

Priority review granted to lenalidomide for FL, MZL
The Food and Drug Administration has granted priority review to a supplemental new drug application (sNDA) for lenalidomide (Revlimid).

Celgene is seeking approval for lenalidomide in combination with rituximab to treat patients with previously treated follicular lymphoma (FL) or marginal zone lymphoma (MZL).
The FDA plans to make a decision on the sNDA by June 27, 2019.
The FDA aims to take action on a priority review application within 6 months of receiving it rather than the standard 10 months. The FDA grants priority review to applications for products that are expected to provide significant improvements in the treatment, diagnosis, or prevention of serious conditions.
The sNDA for lenalidomide is supported by the phase 3 AUGMENT study (NCT01938001) in which researchers compared rituximab plus lenalidomide to rituximab plus placebo in patients with relapsed/refractory FL or MZL.
Results from AUGMENT were presented at the 2018 annual meeting of the American Society of Hematology (Blood 2018 Nov 29;132:445).
According to the ASH abstract, the trial included 358 patients who were randomized to receive rituximab plus lenalidomide (n = 178) or rituximab plus placebo (n = 180).
At a median follow-up of 28.3 months, the overall response rate was 78% in the lenalidomide arm and 53% in the placebo arm (P less than .0001). The complete response rate was 34% and 18%, respectively (P = .001).
The median progression-free survival was 39.4 months in the lenalidomide arm and 14.1 months in the placebo arm. Overall survival data were not mature, but there were 16 deaths reported in the lenalidomide arm and 26 deaths in the placebo arm.
Treatment-emergent adverse events that were more common in the lenalidomide arm than the placebo arm included infections, cutaneous reactions, constipation, thrombocytopenia, and tumor flare reaction.
The Food and Drug Administration has granted priority review to a supplemental new drug application (sNDA) for lenalidomide (Revlimid).
Celgene is seeking approval for lenalidomide in combination with rituximab to treat patients with previously treated follicular lymphoma (FL) or marginal zone lymphoma (MZL).
The FDA plans to make a decision on the sNDA by June 27, 2019.
The FDA aims to take action on a priority review application within 6 months of receiving it rather than the standard 10 months. The FDA grants priority review to applications for products that are expected to provide significant improvements in the treatment, diagnosis, or prevention of serious conditions.
The sNDA for lenalidomide is supported by the phase 3 AUGMENT study (NCT01938001) in which researchers compared rituximab plus lenalidomide to rituximab plus placebo in patients with relapsed/refractory FL or MZL.
Results from AUGMENT were presented at the 2018 annual meeting of the American Society of Hematology (Blood 2018 Nov 29;132:445).
According to the ASH abstract, the trial included 358 patients who were randomized to receive rituximab plus lenalidomide (n = 178) or rituximab plus placebo (n = 180).
At a median follow-up of 28.3 months, the overall response rate was 78% in the lenalidomide arm and 53% in the placebo arm (P less than .0001). The complete response rate was 34% and 18%, respectively (P = .001).
The median progression-free survival was 39.4 months in the lenalidomide arm and 14.1 months in the placebo arm. Overall survival data were not mature, but there were 16 deaths reported in the lenalidomide arm and 26 deaths in the placebo arm.
Treatment-emergent adverse events that were more common in the lenalidomide arm than the placebo arm included infections, cutaneous reactions, constipation, thrombocytopenia, and tumor flare reaction.
The Food and Drug Administration has granted priority review to a supplemental new drug application (sNDA) for lenalidomide (Revlimid).
Celgene is seeking approval for lenalidomide in combination with rituximab to treat patients with previously treated follicular lymphoma (FL) or marginal zone lymphoma (MZL).
The FDA plans to make a decision on the sNDA by June 27, 2019.
The FDA aims to take action on a priority review application within 6 months of receiving it rather than the standard 10 months. The FDA grants priority review to applications for products that are expected to provide significant improvements in the treatment, diagnosis, or prevention of serious conditions.
The sNDA for lenalidomide is supported by the phase 3 AUGMENT study (NCT01938001) in which researchers compared rituximab plus lenalidomide to rituximab plus placebo in patients with relapsed/refractory FL or MZL.
Results from AUGMENT were presented at the 2018 annual meeting of the American Society of Hematology (Blood 2018 Nov 29;132:445).
According to the ASH abstract, the trial included 358 patients who were randomized to receive rituximab plus lenalidomide (n = 178) or rituximab plus placebo (n = 180).
At a median follow-up of 28.3 months, the overall response rate was 78% in the lenalidomide arm and 53% in the placebo arm (P less than .0001). The complete response rate was 34% and 18%, respectively (P = .001).
The median progression-free survival was 39.4 months in the lenalidomide arm and 14.1 months in the placebo arm. Overall survival data were not mature, but there were 16 deaths reported in the lenalidomide arm and 26 deaths in the placebo arm.
Treatment-emergent adverse events that were more common in the lenalidomide arm than the placebo arm included infections, cutaneous reactions, constipation, thrombocytopenia, and tumor flare reaction.

Can technology automate assessments of patients with MS in the clinic?
DALLAS – according to research described at the meeting held by the Americas Committee for Treatment and Research in Multiple Sclerosis.
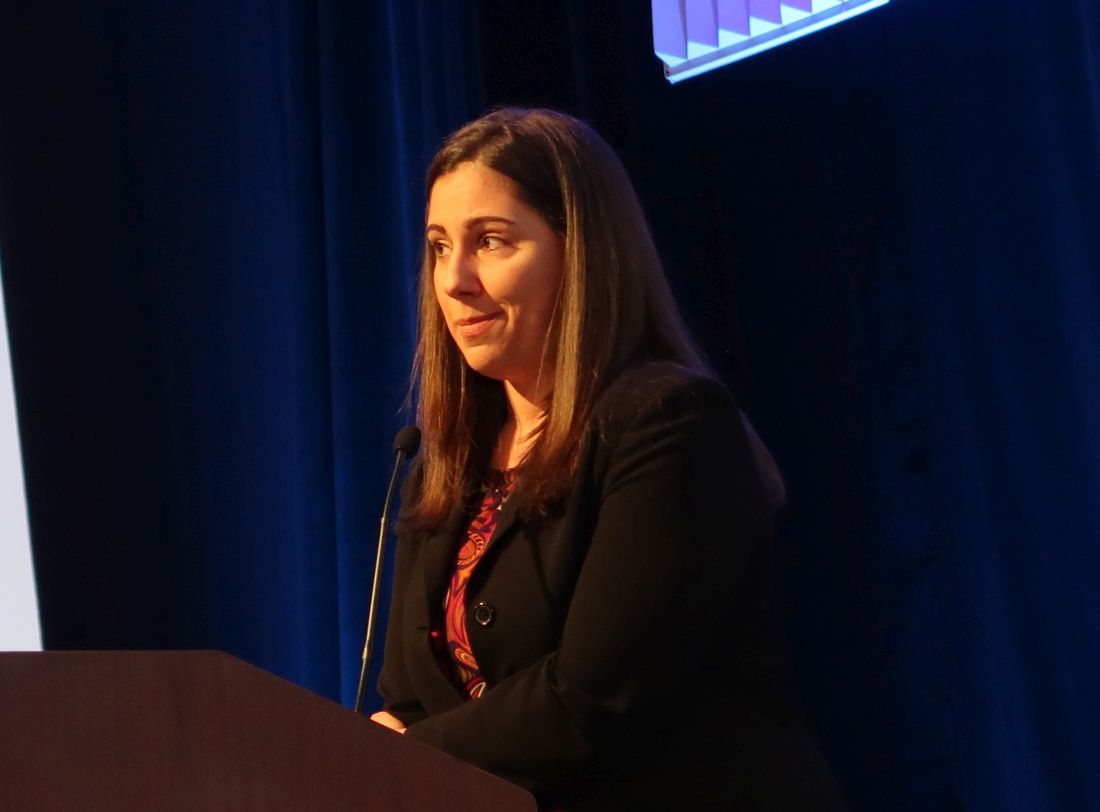
An analysis of data collected using these methods found that patient-reported outcomes and MRI measures correlate with neuroperformance test results, said Laura Baldassari, MD, a clinical neuroimmunology fellow at the Mellen Center for Multiple Sclerosis at the Cleveland Clinic. Such assessments “could potentially enable us to better tune in to disability worsening and treatment response in our patients.”
The Multiple Sclerosis Performance Test (MSPT) collects patient-reported outcomes and tests patients’ processing speed, contrast sensitivity, manual dexterity, and walking speed. The MSPT is designed for supervised or independent administration with an assistant and has been “incorporated into routine clinical care at the Mellen Center,” Dr. Baldassari said. Before seeing their provider, patients complete the MSPT with a biomedical assistant, which usually takes 30-40 minutes. The data are scored instantly and “integrated into the electronic medical record for use during the clinical encounter.”
Dr. Baldassari and her research colleagues analyzed associations between the neuroperformance metrics, patient-reported outcome measures, and quantitative MRI metrics. The analysis included 976 patients who completed the MSPT between December 2015 and December 2017 and had an MRI within 3 months of a clinical encounter. T2 lesion volume, normalized whole brain volume or whole brain fraction, thalamic volume, and cross-sectional upper cervical spinal cord area at the level of C2 on MRI were calculated using a fully automated method.
Patient-reported outcomes included Quality of Life in Neurological Disorders (Neuro-QoL) upper and lower extremity function, Patient-Reported Outcomes Measurement Information System (PROMIS) physical, and Patient Determined Disease Steps (PDDS).
The researchers used Spearman correlation coefficients to examine the relationships between each neuroperformance test, patient-reported outcome, and MRI measure. Linear regression models determined which clinical demographic, patient-reported outcome, or MRI characteristic predicted neuroperformance test results.
Patients had a mean age of about 48 years, and the population was predominantly female and white with relapsing remitting MS.
“There were significant correlations between all neuroperformance tests and all patient-reported outcomes except for the contrast sensitivity test and PROMIS physical,” Dr. Baldassari said. “The processing speed test was most strongly correlated with the PDDS as well as the Neuro-QoL lower extremity. The contrast sensitivity test was correlated with Neuro-QoL lower extremity as well.” The manual dexterity test correlated with PDDS and Neuro-QoL upper and lower extremity and the walking speed test correlated with PDDS and Neuro-QoL lower extremity.
“With worsening self-reported functions, these neuroperformance test results demonstrated impairment as well,” she said.
The neuroperformance tests and all MRI metrics had significant, moderate correlations. “The strongest correlations here are between the processing speed test and whole brain fraction and T2 lesion volume; contrast sensitivity and T2 lesion volume, whole brain fraction, and thalamic volume; manual dexterity test and T2 lesion volume and whole brain fraction; and walking speed test and whole brain fraction and cord area,” she said.
“The strongest predictors of each neuroperformance test varied, which highlights the unique complementary contribution of each patient-reported outcome measure and MRI metric to the complex domains of disability in MS,” Dr. Baldassari said.
Comprehensive, quantitative MS assessments may lead to detailed patient profiles, which could support more precise clinical care and observational studies. In future studies, the researchers plan to examine how these measures relate over time.
The MSPT was developed by the Cleveland Clinic in partnership with Biogen. Dr. Baldassari reported receiving funding through the National Multiple Sclerosis Society and personal fees for serving on a scientific advisory board for Teva. His coauthors’ disclosures included the contribution of intellectual property to the MSPT, for which they could receive royalties.
SOURCE: Baldassari L et al. ACTRIMS Forum 2019, Abstract 32.
DALLAS – according to research described at the meeting held by the Americas Committee for Treatment and Research in Multiple Sclerosis.
An analysis of data collected using these methods found that patient-reported outcomes and MRI measures correlate with neuroperformance test results, said Laura Baldassari, MD, a clinical neuroimmunology fellow at the Mellen Center for Multiple Sclerosis at the Cleveland Clinic. Such assessments “could potentially enable us to better tune in to disability worsening and treatment response in our patients.”
The Multiple Sclerosis Performance Test (MSPT) collects patient-reported outcomes and tests patients’ processing speed, contrast sensitivity, manual dexterity, and walking speed. The MSPT is designed for supervised or independent administration with an assistant and has been “incorporated into routine clinical care at the Mellen Center,” Dr. Baldassari said. Before seeing their provider, patients complete the MSPT with a biomedical assistant, which usually takes 30-40 minutes. The data are scored instantly and “integrated into the electronic medical record for use during the clinical encounter.”
Dr. Baldassari and her research colleagues analyzed associations between the neuroperformance metrics, patient-reported outcome measures, and quantitative MRI metrics. The analysis included 976 patients who completed the MSPT between December 2015 and December 2017 and had an MRI within 3 months of a clinical encounter. T2 lesion volume, normalized whole brain volume or whole brain fraction, thalamic volume, and cross-sectional upper cervical spinal cord area at the level of C2 on MRI were calculated using a fully automated method.
Patient-reported outcomes included Quality of Life in Neurological Disorders (Neuro-QoL) upper and lower extremity function, Patient-Reported Outcomes Measurement Information System (PROMIS) physical, and Patient Determined Disease Steps (PDDS).
The researchers used Spearman correlation coefficients to examine the relationships between each neuroperformance test, patient-reported outcome, and MRI measure. Linear regression models determined which clinical demographic, patient-reported outcome, or MRI characteristic predicted neuroperformance test results.
Patients had a mean age of about 48 years, and the population was predominantly female and white with relapsing remitting MS.
“There were significant correlations between all neuroperformance tests and all patient-reported outcomes except for the contrast sensitivity test and PROMIS physical,” Dr. Baldassari said. “The processing speed test was most strongly correlated with the PDDS as well as the Neuro-QoL lower extremity. The contrast sensitivity test was correlated with Neuro-QoL lower extremity as well.” The manual dexterity test correlated with PDDS and Neuro-QoL upper and lower extremity and the walking speed test correlated with PDDS and Neuro-QoL lower extremity.
“With worsening self-reported functions, these neuroperformance test results demonstrated impairment as well,” she said.
The neuroperformance tests and all MRI metrics had significant, moderate correlations. “The strongest correlations here are between the processing speed test and whole brain fraction and T2 lesion volume; contrast sensitivity and T2 lesion volume, whole brain fraction, and thalamic volume; manual dexterity test and T2 lesion volume and whole brain fraction; and walking speed test and whole brain fraction and cord area,” she said.
“The strongest predictors of each neuroperformance test varied, which highlights the unique complementary contribution of each patient-reported outcome measure and MRI metric to the complex domains of disability in MS,” Dr. Baldassari said.
Comprehensive, quantitative MS assessments may lead to detailed patient profiles, which could support more precise clinical care and observational studies. In future studies, the researchers plan to examine how these measures relate over time.
The MSPT was developed by the Cleveland Clinic in partnership with Biogen. Dr. Baldassari reported receiving funding through the National Multiple Sclerosis Society and personal fees for serving on a scientific advisory board for Teva. His coauthors’ disclosures included the contribution of intellectual property to the MSPT, for which they could receive royalties.
SOURCE: Baldassari L et al. ACTRIMS Forum 2019, Abstract 32.
DALLAS – according to research described at the meeting held by the Americas Committee for Treatment and Research in Multiple Sclerosis.
An analysis of data collected using these methods found that patient-reported outcomes and MRI measures correlate with neuroperformance test results, said Laura Baldassari, MD, a clinical neuroimmunology fellow at the Mellen Center for Multiple Sclerosis at the Cleveland Clinic. Such assessments “could potentially enable us to better tune in to disability worsening and treatment response in our patients.”
The Multiple Sclerosis Performance Test (MSPT) collects patient-reported outcomes and tests patients’ processing speed, contrast sensitivity, manual dexterity, and walking speed. The MSPT is designed for supervised or independent administration with an assistant and has been “incorporated into routine clinical care at the Mellen Center,” Dr. Baldassari said. Before seeing their provider, patients complete the MSPT with a biomedical assistant, which usually takes 30-40 minutes. The data are scored instantly and “integrated into the electronic medical record for use during the clinical encounter.”
Dr. Baldassari and her research colleagues analyzed associations between the neuroperformance metrics, patient-reported outcome measures, and quantitative MRI metrics. The analysis included 976 patients who completed the MSPT between December 2015 and December 2017 and had an MRI within 3 months of a clinical encounter. T2 lesion volume, normalized whole brain volume or whole brain fraction, thalamic volume, and cross-sectional upper cervical spinal cord area at the level of C2 on MRI were calculated using a fully automated method.
Patient-reported outcomes included Quality of Life in Neurological Disorders (Neuro-QoL) upper and lower extremity function, Patient-Reported Outcomes Measurement Information System (PROMIS) physical, and Patient Determined Disease Steps (PDDS).
The researchers used Spearman correlation coefficients to examine the relationships between each neuroperformance test, patient-reported outcome, and MRI measure. Linear regression models determined which clinical demographic, patient-reported outcome, or MRI characteristic predicted neuroperformance test results.
Patients had a mean age of about 48 years, and the population was predominantly female and white with relapsing remitting MS.
“There were significant correlations between all neuroperformance tests and all patient-reported outcomes except for the contrast sensitivity test and PROMIS physical,” Dr. Baldassari said. “The processing speed test was most strongly correlated with the PDDS as well as the Neuro-QoL lower extremity. The contrast sensitivity test was correlated with Neuro-QoL lower extremity as well.” The manual dexterity test correlated with PDDS and Neuro-QoL upper and lower extremity and the walking speed test correlated with PDDS and Neuro-QoL lower extremity.
“With worsening self-reported functions, these neuroperformance test results demonstrated impairment as well,” she said.
The neuroperformance tests and all MRI metrics had significant, moderate correlations. “The strongest correlations here are between the processing speed test and whole brain fraction and T2 lesion volume; contrast sensitivity and T2 lesion volume, whole brain fraction, and thalamic volume; manual dexterity test and T2 lesion volume and whole brain fraction; and walking speed test and whole brain fraction and cord area,” she said.
“The strongest predictors of each neuroperformance test varied, which highlights the unique complementary contribution of each patient-reported outcome measure and MRI metric to the complex domains of disability in MS,” Dr. Baldassari said.
Comprehensive, quantitative MS assessments may lead to detailed patient profiles, which could support more precise clinical care and observational studies. In future studies, the researchers plan to examine how these measures relate over time.
The MSPT was developed by the Cleveland Clinic in partnership with Biogen. Dr. Baldassari reported receiving funding through the National Multiple Sclerosis Society and personal fees for serving on a scientific advisory board for Teva. His coauthors’ disclosures included the contribution of intellectual property to the MSPT, for which they could receive royalties.
SOURCE: Baldassari L et al. ACTRIMS Forum 2019, Abstract 32.
REPORTING FROM ACTRIMS FORUM 2019
ACOG: Avoid inductions before 39 weeks unless medically necessary
Babies should not be delivered before 39 0/7 weeks’ gestation by means besides spontaneous vaginal delivery, in the absence of medical indications for an earlier delivery.

wrote the authors of the new opinion, developed by the American College of Obstetricians and Gynecologists committee on obstetric practice and the Society for Maternal-Fetal Medicine.
The opinion, which replaces a 2013 statement, clarifies that their recommendations include avoiding cesarean delivery, labor induction, and cervical ripening before 39 0/7 weeks of gestation, unless a medical indication exists for earlier delivery.
The new opinion statement relied, in part, on a recent systematic review finding that late-preterm and early-term children do not fare as well as do term-delivered children in a variety of cognitive and educational domains. The opinion statement acknowledges that it’s not clear why children delivered earlier are showing performance difficulties and that it is possible that medical indications for an earlier delivery contributed to the differences.
Immediate outcomes for neonates delivered in the late preterm and early term period also are worse, compared with those delivered at term, according to several studies cited in the opinion. For example, composite morbidity was higher for infants delivered at both 37 and 38 weeks gestation, compared with those delivered at 39 weeks, with adjusted odds ratios for the composite outcome of 2.1 and 1.5, respectively (N Engl J Med. 2009 Jan 8;360[2]:111-20).
And lung maturity alone should not guide delivery, wrote the authors of the opinion. “Because nonrespiratory morbidities also are increased in early-term deliveries, documentation of fetal pulmonary maturity does not justify an early nonmedically indicated delivery,” they said, adding that physicians should not perform amniocentesis to determine lung maturity in an effort to guide delivery timing.
Because intrapartum demise remains a risk as long as a woman is pregnant, the potential for adverse neonatal outcomes with early delivery has to be balanced against the risk of stillbirth with continued gestation, the opinion authors acknowledged. But, they said, this question has been addressed by “multiple studies using national population level data,” which show that “even as the gestational age at term has increased in response to efforts to reduce early elective delivery, these efforts have not adversely affected stillbirth rates nationally or even in states with the greatest reductions in early elective delivery.”
Formal programs to reduce nonmedically indicated early-term deliveries have been successful. For example, the state of South Carolina achieved a reduction of almost 50% in nonmedically indicated early-term deliveries over the course of just 1 year. The South Carolina Birth Outcomes Initiative led a collaborative effort to institute a “hard-stop” policy against nonmedically indicated early-term deliveries that resulted in an absolute 4.7% decrease in late-preterm birth during 2011-2012. Similar efforts in Oregon and Ohio have reported significant reductions as well, with no increases in adverse neonatal outcomes.
Various policy approaches have been tried to achieve a reduction in nonmedically indicated late-preterm and early-term birth. These range from awareness raising and education, to “soft-stop” policies in which health care providers agree not to deliver before 39 weeks without medical indication, to “hard-stop” policies in which hospitals prohibit the nonindicated deliveries. In one comparative outcomes study, the hard-stop policy was the most effective, with a drop from 8.2% to 1.7% in nonindicated early deliveries, but the soft-stop policy also produced a decrease from 8.4% to 3.3% (P = .007 and .025, respectively). The educational approach didn’t produce a significant drop in nonmedically indicated early deliveries (Am J Obstet Gynecol. 2010 Nov;203[5]:449.e1-6).
In a separate, preexisting statement (Obstet Gynecol. 2019;133:e151-5), ACOG has outlined the management of medically indicated late-preterm and early-term deliveries and has developed an app (www.acog.org/acogapp) as a decision tool for indicated deliveries.
Examples cited by the current opinion statement authors of medical indications for early delivery include maternal factors such as preeclampsia, gestational hypertension, and poorly controlled diabetes. Placentation problems, fetal growth restriction, and prior cesarean deliveries also may warrant earlier delivery, as may a host of other complications. If an earlier delivery is planned, the committee authors recommend full discussion with the patient and clear documentation of the indications and discussion.
Babies should not be delivered before 39 0/7 weeks’ gestation by means besides spontaneous vaginal delivery, in the absence of medical indications for an earlier delivery.
wrote the authors of the new opinion, developed by the American College of Obstetricians and Gynecologists committee on obstetric practice and the Society for Maternal-Fetal Medicine.
The opinion, which replaces a 2013 statement, clarifies that their recommendations include avoiding cesarean delivery, labor induction, and cervical ripening before 39 0/7 weeks of gestation, unless a medical indication exists for earlier delivery.
The new opinion statement relied, in part, on a recent systematic review finding that late-preterm and early-term children do not fare as well as do term-delivered children in a variety of cognitive and educational domains. The opinion statement acknowledges that it’s not clear why children delivered earlier are showing performance difficulties and that it is possible that medical indications for an earlier delivery contributed to the differences.
Immediate outcomes for neonates delivered in the late preterm and early term period also are worse, compared with those delivered at term, according to several studies cited in the opinion. For example, composite morbidity was higher for infants delivered at both 37 and 38 weeks gestation, compared with those delivered at 39 weeks, with adjusted odds ratios for the composite outcome of 2.1 and 1.5, respectively (N Engl J Med. 2009 Jan 8;360[2]:111-20).
And lung maturity alone should not guide delivery, wrote the authors of the opinion. “Because nonrespiratory morbidities also are increased in early-term deliveries, documentation of fetal pulmonary maturity does not justify an early nonmedically indicated delivery,” they said, adding that physicians should not perform amniocentesis to determine lung maturity in an effort to guide delivery timing.
Because intrapartum demise remains a risk as long as a woman is pregnant, the potential for adverse neonatal outcomes with early delivery has to be balanced against the risk of stillbirth with continued gestation, the opinion authors acknowledged. But, they said, this question has been addressed by “multiple studies using national population level data,” which show that “even as the gestational age at term has increased in response to efforts to reduce early elective delivery, these efforts have not adversely affected stillbirth rates nationally or even in states with the greatest reductions in early elective delivery.”
Formal programs to reduce nonmedically indicated early-term deliveries have been successful. For example, the state of South Carolina achieved a reduction of almost 50% in nonmedically indicated early-term deliveries over the course of just 1 year. The South Carolina Birth Outcomes Initiative led a collaborative effort to institute a “hard-stop” policy against nonmedically indicated early-term deliveries that resulted in an absolute 4.7% decrease in late-preterm birth during 2011-2012. Similar efforts in Oregon and Ohio have reported significant reductions as well, with no increases in adverse neonatal outcomes.
Various policy approaches have been tried to achieve a reduction in nonmedically indicated late-preterm and early-term birth. These range from awareness raising and education, to “soft-stop” policies in which health care providers agree not to deliver before 39 weeks without medical indication, to “hard-stop” policies in which hospitals prohibit the nonindicated deliveries. In one comparative outcomes study, the hard-stop policy was the most effective, with a drop from 8.2% to 1.7% in nonindicated early deliveries, but the soft-stop policy also produced a decrease from 8.4% to 3.3% (P = .007 and .025, respectively). The educational approach didn’t produce a significant drop in nonmedically indicated early deliveries (Am J Obstet Gynecol. 2010 Nov;203[5]:449.e1-6).
In a separate, preexisting statement (Obstet Gynecol. 2019;133:e151-5), ACOG has outlined the management of medically indicated late-preterm and early-term deliveries and has developed an app (www.acog.org/acogapp) as a decision tool for indicated deliveries.
Examples cited by the current opinion statement authors of medical indications for early delivery include maternal factors such as preeclampsia, gestational hypertension, and poorly controlled diabetes. Placentation problems, fetal growth restriction, and prior cesarean deliveries also may warrant earlier delivery, as may a host of other complications. If an earlier delivery is planned, the committee authors recommend full discussion with the patient and clear documentation of the indications and discussion.
Babies should not be delivered before 39 0/7 weeks’ gestation by means besides spontaneous vaginal delivery, in the absence of medical indications for an earlier delivery.
wrote the authors of the new opinion, developed by the American College of Obstetricians and Gynecologists committee on obstetric practice and the Society for Maternal-Fetal Medicine.
The opinion, which replaces a 2013 statement, clarifies that their recommendations include avoiding cesarean delivery, labor induction, and cervical ripening before 39 0/7 weeks of gestation, unless a medical indication exists for earlier delivery.
The new opinion statement relied, in part, on a recent systematic review finding that late-preterm and early-term children do not fare as well as do term-delivered children in a variety of cognitive and educational domains. The opinion statement acknowledges that it’s not clear why children delivered earlier are showing performance difficulties and that it is possible that medical indications for an earlier delivery contributed to the differences.
Immediate outcomes for neonates delivered in the late preterm and early term period also are worse, compared with those delivered at term, according to several studies cited in the opinion. For example, composite morbidity was higher for infants delivered at both 37 and 38 weeks gestation, compared with those delivered at 39 weeks, with adjusted odds ratios for the composite outcome of 2.1 and 1.5, respectively (N Engl J Med. 2009 Jan 8;360[2]:111-20).
And lung maturity alone should not guide delivery, wrote the authors of the opinion. “Because nonrespiratory morbidities also are increased in early-term deliveries, documentation of fetal pulmonary maturity does not justify an early nonmedically indicated delivery,” they said, adding that physicians should not perform amniocentesis to determine lung maturity in an effort to guide delivery timing.
Because intrapartum demise remains a risk as long as a woman is pregnant, the potential for adverse neonatal outcomes with early delivery has to be balanced against the risk of stillbirth with continued gestation, the opinion authors acknowledged. But, they said, this question has been addressed by “multiple studies using national population level data,” which show that “even as the gestational age at term has increased in response to efforts to reduce early elective delivery, these efforts have not adversely affected stillbirth rates nationally or even in states with the greatest reductions in early elective delivery.”
Formal programs to reduce nonmedically indicated early-term deliveries have been successful. For example, the state of South Carolina achieved a reduction of almost 50% in nonmedically indicated early-term deliveries over the course of just 1 year. The South Carolina Birth Outcomes Initiative led a collaborative effort to institute a “hard-stop” policy against nonmedically indicated early-term deliveries that resulted in an absolute 4.7% decrease in late-preterm birth during 2011-2012. Similar efforts in Oregon and Ohio have reported significant reductions as well, with no increases in adverse neonatal outcomes.
Various policy approaches have been tried to achieve a reduction in nonmedically indicated late-preterm and early-term birth. These range from awareness raising and education, to “soft-stop” policies in which health care providers agree not to deliver before 39 weeks without medical indication, to “hard-stop” policies in which hospitals prohibit the nonindicated deliveries. In one comparative outcomes study, the hard-stop policy was the most effective, with a drop from 8.2% to 1.7% in nonindicated early deliveries, but the soft-stop policy also produced a decrease from 8.4% to 3.3% (P = .007 and .025, respectively). The educational approach didn’t produce a significant drop in nonmedically indicated early deliveries (Am J Obstet Gynecol. 2010 Nov;203[5]:449.e1-6).
In a separate, preexisting statement (Obstet Gynecol. 2019;133:e151-5), ACOG has outlined the management of medically indicated late-preterm and early-term deliveries and has developed an app (www.acog.org/acogapp) as a decision tool for indicated deliveries.
Examples cited by the current opinion statement authors of medical indications for early delivery include maternal factors such as preeclampsia, gestational hypertension, and poorly controlled diabetes. Placentation problems, fetal growth restriction, and prior cesarean deliveries also may warrant earlier delivery, as may a host of other complications. If an earlier delivery is planned, the committee authors recommend full discussion with the patient and clear documentation of the indications and discussion.
FROM OBSTETRICS & GYNECOLOGY

Don’t forget social determinants of health in minority MS patients
DALLAS – The way Lilyana Amezcua, MD, sees it, clinicians should view race and ethnicity as health disparities when assessing individuals with multiple sclerosis.
Whites are predominately affected with MS, “but we have seen changing demographics,” said Dr. Amezcua, of the University of Southern California MS Comprehensive Care and Research Group. “Why are African Americans now at higher risk ... and why do African Americans appear to have more severe disease? Is it a biological difference ... or is it because of poor access” to health care?
At the meeting held by the Americas Committee for Treatment and Research in Multiple Sclerosis, Dr. Amezcua delivered a presentation entitled “Effect of Race and Ethnicity on MS Presentation and Disease Course.” She called on researchers in the field “to not just take race and ethnicity as any small variable. We need to be cognizant and use the correct methodology, depending on what [question] we want to answer. We need to better define how we ascertain race, how we ascertain ethnicity.”
Dr. Amezcua, who is also the MS fellowship program director at the Keck School of Medicine, disclosed that she receives funding from the National MS Society, the National Institutes of Health, the California Community Foundation, and Biogen.
DALLAS – The way Lilyana Amezcua, MD, sees it, clinicians should view race and ethnicity as health disparities when assessing individuals with multiple sclerosis.
Whites are predominately affected with MS, “but we have seen changing demographics,” said Dr. Amezcua, of the University of Southern California MS Comprehensive Care and Research Group. “Why are African Americans now at higher risk ... and why do African Americans appear to have more severe disease? Is it a biological difference ... or is it because of poor access” to health care?
At the meeting held by the Americas Committee for Treatment and Research in Multiple Sclerosis, Dr. Amezcua delivered a presentation entitled “Effect of Race and Ethnicity on MS Presentation and Disease Course.” She called on researchers in the field “to not just take race and ethnicity as any small variable. We need to be cognizant and use the correct methodology, depending on what [question] we want to answer. We need to better define how we ascertain race, how we ascertain ethnicity.”
Dr. Amezcua, who is also the MS fellowship program director at the Keck School of Medicine, disclosed that she receives funding from the National MS Society, the National Institutes of Health, the California Community Foundation, and Biogen.
DALLAS – The way Lilyana Amezcua, MD, sees it, clinicians should view race and ethnicity as health disparities when assessing individuals with multiple sclerosis.
Whites are predominately affected with MS, “but we have seen changing demographics,” said Dr. Amezcua, of the University of Southern California MS Comprehensive Care and Research Group. “Why are African Americans now at higher risk ... and why do African Americans appear to have more severe disease? Is it a biological difference ... or is it because of poor access” to health care?
At the meeting held by the Americas Committee for Treatment and Research in Multiple Sclerosis, Dr. Amezcua delivered a presentation entitled “Effect of Race and Ethnicity on MS Presentation and Disease Course.” She called on researchers in the field “to not just take race and ethnicity as any small variable. We need to be cognizant and use the correct methodology, depending on what [question] we want to answer. We need to better define how we ascertain race, how we ascertain ethnicity.”
Dr. Amezcua, who is also the MS fellowship program director at the Keck School of Medicine, disclosed that she receives funding from the National MS Society, the National Institutes of Health, the California Community Foundation, and Biogen.
REPORTING FROM ACTRIMS FORUM 2019

Second extubation attempts should be judged on their own merits
SAN DIEGO – When attempting a second extubation, improvements in weaning parameters, compared with the first extubation attempt, do not predict success. Instead, the best predictors were the values of the parameters immediately before the second attempt.
“We hypothesized that the change in parameter values was more important than the actual values right before we tried to re-extubate, and that didn’t turn out to be the case. Because it was a smaller study, we can’t say [change in values] is not useful at all, but we didn’t find a strong association. We showed that the magnitude of the effect with the number measured right before the re-extubation is probably your best bet, but you should obviously evaluate the whole clinical scenario,” commented senior author Michael David Maile, MD, assistant professor of anesthesiology at the University of Michigan, Ann Arbor.
The study was presented at the Critical Care Congress sponsored by the Society of Critical Care Medicine by Suraj Trivedi, MD, who is currently an anesthesiology fellow at Stanford (Calif.) Medicine.
Factors such as rapid shallow breathing index (RSBI), negative inspiratory force (NIF), vital capacity (VC), and partial pressure of arterial carbon dioxide (PaCO2) have been shown to predict success or failure of an initial extubation attempt.
There is currently little available guidance on how to proceed when a first extubation attempt fails. The researchers had anticipated that RSBI, NIF, VC, and PaCO2 levels matching the first attempt would be associated with success the second time around.
But their retrospective study of adult patients at the University of Michigan critical care units found that only the change in RSBI values predicted success on a univariate analysis, and that association became statistically insignificant once they corrected for baseline RSBI previous to the re-extubation attempt.
“I think the biggest take-home message is that we have to figure out each attempt to extubate on its own merits. If you’re trying to extubate a patient in the ICU who has potentially been intubated and extubated multiple times, the clinical gut feeling is always that [the patient has] to be better off than the previous attempt. What we are pointing out is that it really doesn’t matter. If the parameters are all within the overall guidelines, it’s still okay to extubate, even if the absolute change in the variables is not better [than the previous attempt],” Dr. Trivedi said in an interview.
“People put a lot of emphasis on the improvement from the first to the second attempt, and this should temper that enthusiasm to put a lot of weight on the change. But I don’t think our data support that the change means nothing,” added Dr. Maile.
The study included 525 patients (42% female). Comorbidities were common: 72% had cardiac arrhythmias, 58% had hypertension, 33% had renal failure, 39% had a pulmonary disorder, and 25% had liver disease.
Univariate analyses showed associations between values of parameters immediately before the second extubation attempt and success in the second extubation attempt, including RSBI (re-extubation success, mean 53.1 vs failure, mean 68.8; P =.0002) and NIF (success, mean –41.2 vs. failure, mean –38.4; P =.036), and VC (success, mean 1009.8 vs. failure, mean 906.8; P =.017).
When the researchers examined changes in parameters between the first and second attempt, only a change in RSBI predicted success (success, value change of 7.1 vs. failure, value change of 0.05; P less than .031). But when they corrected for the RSBI value immediately before the second attempt, the difference was not statistically significant (P = .892).
The study was not funded. Dr. Maile and Dr. Trivedi have no relevant financial disclosures.
SOURCE: Trivedi S et al. CCC48 2019, Abstract 27.
SAN DIEGO – When attempting a second extubation, improvements in weaning parameters, compared with the first extubation attempt, do not predict success. Instead, the best predictors were the values of the parameters immediately before the second attempt.
“We hypothesized that the change in parameter values was more important than the actual values right before we tried to re-extubate, and that didn’t turn out to be the case. Because it was a smaller study, we can’t say [change in values] is not useful at all, but we didn’t find a strong association. We showed that the magnitude of the effect with the number measured right before the re-extubation is probably your best bet, but you should obviously evaluate the whole clinical scenario,” commented senior author Michael David Maile, MD, assistant professor of anesthesiology at the University of Michigan, Ann Arbor.
The study was presented at the Critical Care Congress sponsored by the Society of Critical Care Medicine by Suraj Trivedi, MD, who is currently an anesthesiology fellow at Stanford (Calif.) Medicine.
Factors such as rapid shallow breathing index (RSBI), negative inspiratory force (NIF), vital capacity (VC), and partial pressure of arterial carbon dioxide (PaCO2) have been shown to predict success or failure of an initial extubation attempt.
There is currently little available guidance on how to proceed when a first extubation attempt fails. The researchers had anticipated that RSBI, NIF, VC, and PaCO2 levels matching the first attempt would be associated with success the second time around.
But their retrospective study of adult patients at the University of Michigan critical care units found that only the change in RSBI values predicted success on a univariate analysis, and that association became statistically insignificant once they corrected for baseline RSBI previous to the re-extubation attempt.
“I think the biggest take-home message is that we have to figure out each attempt to extubate on its own merits. If you’re trying to extubate a patient in the ICU who has potentially been intubated and extubated multiple times, the clinical gut feeling is always that [the patient has] to be better off than the previous attempt. What we are pointing out is that it really doesn’t matter. If the parameters are all within the overall guidelines, it’s still okay to extubate, even if the absolute change in the variables is not better [than the previous attempt],” Dr. Trivedi said in an interview.
“People put a lot of emphasis on the improvement from the first to the second attempt, and this should temper that enthusiasm to put a lot of weight on the change. But I don’t think our data support that the change means nothing,” added Dr. Maile.
The study included 525 patients (42% female). Comorbidities were common: 72% had cardiac arrhythmias, 58% had hypertension, 33% had renal failure, 39% had a pulmonary disorder, and 25% had liver disease.
Univariate analyses showed associations between values of parameters immediately before the second extubation attempt and success in the second extubation attempt, including RSBI (re-extubation success, mean 53.1 vs failure, mean 68.8; P =.0002) and NIF (success, mean –41.2 vs. failure, mean –38.4; P =.036), and VC (success, mean 1009.8 vs. failure, mean 906.8; P =.017).
When the researchers examined changes in parameters between the first and second attempt, only a change in RSBI predicted success (success, value change of 7.1 vs. failure, value change of 0.05; P less than .031). But when they corrected for the RSBI value immediately before the second attempt, the difference was not statistically significant (P = .892).
The study was not funded. Dr. Maile and Dr. Trivedi have no relevant financial disclosures.
SOURCE: Trivedi S et al. CCC48 2019, Abstract 27.
SAN DIEGO – When attempting a second extubation, improvements in weaning parameters, compared with the first extubation attempt, do not predict success. Instead, the best predictors were the values of the parameters immediately before the second attempt.
“We hypothesized that the change in parameter values was more important than the actual values right before we tried to re-extubate, and that didn’t turn out to be the case. Because it was a smaller study, we can’t say [change in values] is not useful at all, but we didn’t find a strong association. We showed that the magnitude of the effect with the number measured right before the re-extubation is probably your best bet, but you should obviously evaluate the whole clinical scenario,” commented senior author Michael David Maile, MD, assistant professor of anesthesiology at the University of Michigan, Ann Arbor.
The study was presented at the Critical Care Congress sponsored by the Society of Critical Care Medicine by Suraj Trivedi, MD, who is currently an anesthesiology fellow at Stanford (Calif.) Medicine.
Factors such as rapid shallow breathing index (RSBI), negative inspiratory force (NIF), vital capacity (VC), and partial pressure of arterial carbon dioxide (PaCO2) have been shown to predict success or failure of an initial extubation attempt.
There is currently little available guidance on how to proceed when a first extubation attempt fails. The researchers had anticipated that RSBI, NIF, VC, and PaCO2 levels matching the first attempt would be associated with success the second time around.
But their retrospective study of adult patients at the University of Michigan critical care units found that only the change in RSBI values predicted success on a univariate analysis, and that association became statistically insignificant once they corrected for baseline RSBI previous to the re-extubation attempt.
“I think the biggest take-home message is that we have to figure out each attempt to extubate on its own merits. If you’re trying to extubate a patient in the ICU who has potentially been intubated and extubated multiple times, the clinical gut feeling is always that [the patient has] to be better off than the previous attempt. What we are pointing out is that it really doesn’t matter. If the parameters are all within the overall guidelines, it’s still okay to extubate, even if the absolute change in the variables is not better [than the previous attempt],” Dr. Trivedi said in an interview.
“People put a lot of emphasis on the improvement from the first to the second attempt, and this should temper that enthusiasm to put a lot of weight on the change. But I don’t think our data support that the change means nothing,” added Dr. Maile.
The study included 525 patients (42% female). Comorbidities were common: 72% had cardiac arrhythmias, 58% had hypertension, 33% had renal failure, 39% had a pulmonary disorder, and 25% had liver disease.
Univariate analyses showed associations between values of parameters immediately before the second extubation attempt and success in the second extubation attempt, including RSBI (re-extubation success, mean 53.1 vs failure, mean 68.8; P =.0002) and NIF (success, mean –41.2 vs. failure, mean –38.4; P =.036), and VC (success, mean 1009.8 vs. failure, mean 906.8; P =.017).
When the researchers examined changes in parameters between the first and second attempt, only a change in RSBI predicted success (success, value change of 7.1 vs. failure, value change of 0.05; P less than .031). But when they corrected for the RSBI value immediately before the second attempt, the difference was not statistically significant (P = .892).
The study was not funded. Dr. Maile and Dr. Trivedi have no relevant financial disclosures.
SOURCE: Trivedi S et al. CCC48 2019, Abstract 27.
REPORTING FROM CCC48
Key clinical point: Patient readiness for a second extubation should be judged by current parameters alone.
Major finding: The change in parameter values between first and second extubation attempts was not predictive of success.
Study details: A retrospective analysis of 525 patients.
Disclosures: The study was not funded. Dr. Maile and Dr. Trivedi have no relevant financial disclosures.
Source: Trivedi S et al. CCC48 2019, Abstract 27.
Malpractice suits are less frequent – but more costly
Lawsuits against physicians declined across virtually all specialties by more than a quarter over a 10-year span, but the cost to manage legal challenges went up, a recent analysis finds.
From 2007 to 2016, the rate of claims dropped by 27% per 100 doctors from 5.1 to 3.7, according to a review of 124,000 cases by CRICO Strategies, a division of CRICO, the medical liability insurance provider for the Harvard medical community. CRICO’s database of claims contains about 30% of legal cases filed against health providers across the U.S.
For internists, the rate of lawsuits decreased by 35% between 2007 and 2016, according to CRICO data provided to MDedge News. Ob.gyns. saw a 44% drop in claims over the 10-year period, and surgeons experienced a 23% rate decrease. The analysis did not break down the rate of claims by other single subspecialists. Claims decreased by a combined 29% for cardiologists, dermatologists, endocrinologists, family physicians, gastroenterologists, hematologists/oncologists, hospitalists, infectious disease specialists, internists, nephrologists, neurologists, pulmonologists, and rheumatologists/immunologists, according to the report published in February 2019 on CRICO’s website.
The findings are consistent with prior research on claim trends, said Seth Seabury, PhD, a medical liability researcher and director of the Keck-Schaeffer Initiative for Population Health Policy at the University of Southern California, Los Angeles.
“Malpractice claim frequency has been falling pretty steadily for a while now, reflecting a number of factors including the widespread adoption of tort reform and other measures to shield physicians from malpractice risk,” Dr. Seabury said in an interview. “Interestingly, the decline seems greatest in the claims with lower potential stakes, as you see average indemnity holding flat or rising. Some of this likely reflects the unwillingness of attorneys to take cases with lower potential payouts, because of the high cost of litigating a malpractice case.”
While frequency went down, the cost to manage a legal claim went up, according to CRICO data. The price of defending a malpractice lawsuit rose an average of 3.5% annually over the 10-year period from $36,000 to $46,000. For cases that ended with no payment (indemnity) to plaintiffs, the cost to manage a case rose an average of 5% annually.

The upward trends in case management expenses are striking, particularly since the time to resolve cases has decreased, said Michelle Mello, PhD, a health research and policy professor at Stanford (Calif.) University. From 2007 to 2016, the average time to resolve a case dropped from 29 to 27 months, the CRICO report found.
“CRICO nods to disclosure and apology approaches as perhaps underlying the more encouraging trend in time to resolution, but it was surprising to me that such approaches have not translated into lower defense costs,” Dr. Mello said in an interview. “In particular, a lot is still being spent to manage cases that never result in a payment to the patient. My hope was that, as hospitals got better at communicating with patients about adverse events, including the fact that about three-quarters of them are not due to substandard care, there would be fewer claims involving such events and also less money spent dealing with such claims when they do arise.”
For cases that do end in payment, high payouts are on the rise. Cases that ended in payments of $1 million or more increased 4% over the 10-year time frame, while payments of $3 million to $11 million increased 7% annually, according to the CRICO report. Cases that ended in payment lower than $1 million dropped over the 10-year span.
The reasons behind increasing plaintiff payouts is uncertain, Dr. Seabury said.
“It’s hard to say exactly why high payouts are on the rise, as payout levels reflect a number of factors – [such as] economic damages, clinical severity, pain and suffering – that can be difficult to disentangle,” he said. “But it is probably concerning for doctors in the sense that, while claims are becoming less likely, when they do happen, it could be more catastrophic in the sense of having large damages that exceed the policy limit.”
Lawsuits against physicians declined across virtually all specialties by more than a quarter over a 10-year span, but the cost to manage legal challenges went up, a recent analysis finds.
From 2007 to 2016, the rate of claims dropped by 27% per 100 doctors from 5.1 to 3.7, according to a review of 124,000 cases by CRICO Strategies, a division of CRICO, the medical liability insurance provider for the Harvard medical community. CRICO’s database of claims contains about 30% of legal cases filed against health providers across the U.S.
For internists, the rate of lawsuits decreased by 35% between 2007 and 2016, according to CRICO data provided to MDedge News. Ob.gyns. saw a 44% drop in claims over the 10-year period, and surgeons experienced a 23% rate decrease. The analysis did not break down the rate of claims by other single subspecialists. Claims decreased by a combined 29% for cardiologists, dermatologists, endocrinologists, family physicians, gastroenterologists, hematologists/oncologists, hospitalists, infectious disease specialists, internists, nephrologists, neurologists, pulmonologists, and rheumatologists/immunologists, according to the report published in February 2019 on CRICO’s website.
The findings are consistent with prior research on claim trends, said Seth Seabury, PhD, a medical liability researcher and director of the Keck-Schaeffer Initiative for Population Health Policy at the University of Southern California, Los Angeles.
“Malpractice claim frequency has been falling pretty steadily for a while now, reflecting a number of factors including the widespread adoption of tort reform and other measures to shield physicians from malpractice risk,” Dr. Seabury said in an interview. “Interestingly, the decline seems greatest in the claims with lower potential stakes, as you see average indemnity holding flat or rising. Some of this likely reflects the unwillingness of attorneys to take cases with lower potential payouts, because of the high cost of litigating a malpractice case.”
While frequency went down, the cost to manage a legal claim went up, according to CRICO data. The price of defending a malpractice lawsuit rose an average of 3.5% annually over the 10-year period from $36,000 to $46,000. For cases that ended with no payment (indemnity) to plaintiffs, the cost to manage a case rose an average of 5% annually.
The upward trends in case management expenses are striking, particularly since the time to resolve cases has decreased, said Michelle Mello, PhD, a health research and policy professor at Stanford (Calif.) University. From 2007 to 2016, the average time to resolve a case dropped from 29 to 27 months, the CRICO report found.
“CRICO nods to disclosure and apology approaches as perhaps underlying the more encouraging trend in time to resolution, but it was surprising to me that such approaches have not translated into lower defense costs,” Dr. Mello said in an interview. “In particular, a lot is still being spent to manage cases that never result in a payment to the patient. My hope was that, as hospitals got better at communicating with patients about adverse events, including the fact that about three-quarters of them are not due to substandard care, there would be fewer claims involving such events and also less money spent dealing with such claims when they do arise.”
For cases that do end in payment, high payouts are on the rise. Cases that ended in payments of $1 million or more increased 4% over the 10-year time frame, while payments of $3 million to $11 million increased 7% annually, according to the CRICO report. Cases that ended in payment lower than $1 million dropped over the 10-year span.
The reasons behind increasing plaintiff payouts is uncertain, Dr. Seabury said.
“It’s hard to say exactly why high payouts are on the rise, as payout levels reflect a number of factors – [such as] economic damages, clinical severity, pain and suffering – that can be difficult to disentangle,” he said. “But it is probably concerning for doctors in the sense that, while claims are becoming less likely, when they do happen, it could be more catastrophic in the sense of having large damages that exceed the policy limit.”
Lawsuits against physicians declined across virtually all specialties by more than a quarter over a 10-year span, but the cost to manage legal challenges went up, a recent analysis finds.
From 2007 to 2016, the rate of claims dropped by 27% per 100 doctors from 5.1 to 3.7, according to a review of 124,000 cases by CRICO Strategies, a division of CRICO, the medical liability insurance provider for the Harvard medical community. CRICO’s database of claims contains about 30% of legal cases filed against health providers across the U.S.
For internists, the rate of lawsuits decreased by 35% between 2007 and 2016, according to CRICO data provided to MDedge News. Ob.gyns. saw a 44% drop in claims over the 10-year period, and surgeons experienced a 23% rate decrease. The analysis did not break down the rate of claims by other single subspecialists. Claims decreased by a combined 29% for cardiologists, dermatologists, endocrinologists, family physicians, gastroenterologists, hematologists/oncologists, hospitalists, infectious disease specialists, internists, nephrologists, neurologists, pulmonologists, and rheumatologists/immunologists, according to the report published in February 2019 on CRICO’s website.
The findings are consistent with prior research on claim trends, said Seth Seabury, PhD, a medical liability researcher and director of the Keck-Schaeffer Initiative for Population Health Policy at the University of Southern California, Los Angeles.
“Malpractice claim frequency has been falling pretty steadily for a while now, reflecting a number of factors including the widespread adoption of tort reform and other measures to shield physicians from malpractice risk,” Dr. Seabury said in an interview. “Interestingly, the decline seems greatest in the claims with lower potential stakes, as you see average indemnity holding flat or rising. Some of this likely reflects the unwillingness of attorneys to take cases with lower potential payouts, because of the high cost of litigating a malpractice case.”
While frequency went down, the cost to manage a legal claim went up, according to CRICO data. The price of defending a malpractice lawsuit rose an average of 3.5% annually over the 10-year period from $36,000 to $46,000. For cases that ended with no payment (indemnity) to plaintiffs, the cost to manage a case rose an average of 5% annually.
The upward trends in case management expenses are striking, particularly since the time to resolve cases has decreased, said Michelle Mello, PhD, a health research and policy professor at Stanford (Calif.) University. From 2007 to 2016, the average time to resolve a case dropped from 29 to 27 months, the CRICO report found.
“CRICO nods to disclosure and apology approaches as perhaps underlying the more encouraging trend in time to resolution, but it was surprising to me that such approaches have not translated into lower defense costs,” Dr. Mello said in an interview. “In particular, a lot is still being spent to manage cases that never result in a payment to the patient. My hope was that, as hospitals got better at communicating with patients about adverse events, including the fact that about three-quarters of them are not due to substandard care, there would be fewer claims involving such events and also less money spent dealing with such claims when they do arise.”
For cases that do end in payment, high payouts are on the rise. Cases that ended in payments of $1 million or more increased 4% over the 10-year time frame, while payments of $3 million to $11 million increased 7% annually, according to the CRICO report. Cases that ended in payment lower than $1 million dropped over the 10-year span.
The reasons behind increasing plaintiff payouts is uncertain, Dr. Seabury said.
“It’s hard to say exactly why high payouts are on the rise, as payout levels reflect a number of factors – [such as] economic damages, clinical severity, pain and suffering – that can be difficult to disentangle,” he said. “But it is probably concerning for doctors in the sense that, while claims are becoming less likely, when they do happen, it could be more catastrophic in the sense of having large damages that exceed the policy limit.”

March 2019 Combatting Public Pathogens
Click here to access March 2019 Combatting Public Pathogens
Table of Contents
Blistering Disease During the Treatment of Chronic Hepatitis C With Ledipasvir/Sofosbuvir
Contrasting qSOFA and SIRS Criteria for Early Sepsis Identification in a Veteran Population
Significant HbA1c Lowering in Patients Achieving a Hepatitis C Virus Cure

Click here to access March 2019 Combatting Public Pathogens
Table of Contents
Blistering Disease During the Treatment of Chronic Hepatitis C With Ledipasvir/Sofosbuvir
Contrasting qSOFA and SIRS Criteria for Early Sepsis Identification in a Veteran Population
Significant HbA1c Lowering in Patients Achieving a Hepatitis C Virus Cure
Click here to access March 2019 Combatting Public Pathogens
Table of Contents
Blistering Disease During the Treatment of Chronic Hepatitis C With Ledipasvir/Sofosbuvir
Contrasting qSOFA and SIRS Criteria for Early Sepsis Identification in a Veteran Population
Significant HbA1c Lowering in Patients Achieving a Hepatitis C Virus Cure

Ublituximab depletes B cells in phase 2 trial
DALLAS – (MS), according to phase 2 trial results presented at ACTRIMS Forum 2019. Patients treated with the investigational therapy had reduced MRI activity and relapse rates during the 48-week trial, and the treatment was well tolerated, researchers said.
The monoclonal antibody targets a unique epitope on the CD20 antigen and is glycoengineered for enhanced B-cell targeting through antibody-dependent cellular cytotoxicity, said presenting author Edward Fox, MD, PhD, director of the MS Clinic of Central Texas, Round Rock. Ublituximab’s potency “may offer a benefit over currently available anti-CD20s in terms of lower doses and shorter infusion times,” Dr. Fox and his research colleagues said.
To assess the optimal dose, infusion time, safety, and tolerability of ublituximab in relapsing MS, investigators conducted a phase 2, multicenter study. The trial included 48 patients with relapsing MS; 65% were female. Patients’ average age was 40 years and average disease duration was 7.7 years. The researchers included patients with one or more confirmed relapse in the past year, two relapses in the past 2 years, or at least one active gadolinium-enhancing T1 lesion. The primary endpoint was the percentage of patients with at least a 95% reduction in peripheral CD19+ B cells within 2 weeks after the second infusion on day 15.
For their first infusions, patients received 150 mg of ublituximab over an infusion time of 1, 2, 3, or 4 hours. On day 15, patients received 450 mg or 600 mg of ublituximab over an infusion time of 1, 1.5, or 3 hours. At week 24, patients received 450 mg or 650 mg of ublituximab infused over 1 hour or 1.5 hours.
All patients met the primary endpoint of greater than 95% B-cell depletion between baseline and week 4. Median B-cell depletion was 99% at week 4, and this effect was maintained at weeks 24 and 48.
The researchers detected no T1 gadolinium-enhancing lesions at week 24 or week 48, and total T2 lesion volume decreased by 10.6% between baseline and week 48.
The most frequent adverse events were infusion-related reactions, which occurred in 48% of patients and were more common with the first infusion, particularly when the infusion time was less than 4 hours. All of the infusion-related reactions were grade 1 or 2. One grade 3 serious adverse event of fatigue was considered possibly related to ublituximab. No patients withdrew from the study because of drug-related adverse events. At week 48, 93% of the patients were relapse free, 7% had 24-week confirmed disability progression, and 17% had confirmed disability improvement.
TG Therapeutics, the company developing ublituximab, is evaluating the therapy in phase 3 trials known as ULTIMATE I and 2. The phase 3 trials are using the 450-mg dose with a first dose of 150 mg delivered over 4 hours.
Dr. Fox has disclosed research support from TG Therapeutics and other pharmaceutical companies and working as a consultant and speaker for TG Therapeutics and other companies.
SOURCE: Fox E et al. ACTRIMS Forum 2019, Abstract 66.
DALLAS – (MS), according to phase 2 trial results presented at ACTRIMS Forum 2019. Patients treated with the investigational therapy had reduced MRI activity and relapse rates during the 48-week trial, and the treatment was well tolerated, researchers said.
The monoclonal antibody targets a unique epitope on the CD20 antigen and is glycoengineered for enhanced B-cell targeting through antibody-dependent cellular cytotoxicity, said presenting author Edward Fox, MD, PhD, director of the MS Clinic of Central Texas, Round Rock. Ublituximab’s potency “may offer a benefit over currently available anti-CD20s in terms of lower doses and shorter infusion times,” Dr. Fox and his research colleagues said.
To assess the optimal dose, infusion time, safety, and tolerability of ublituximab in relapsing MS, investigators conducted a phase 2, multicenter study. The trial included 48 patients with relapsing MS; 65% were female. Patients’ average age was 40 years and average disease duration was 7.7 years. The researchers included patients with one or more confirmed relapse in the past year, two relapses in the past 2 years, or at least one active gadolinium-enhancing T1 lesion. The primary endpoint was the percentage of patients with at least a 95% reduction in peripheral CD19+ B cells within 2 weeks after the second infusion on day 15.
For their first infusions, patients received 150 mg of ublituximab over an infusion time of 1, 2, 3, or 4 hours. On day 15, patients received 450 mg or 600 mg of ublituximab over an infusion time of 1, 1.5, or 3 hours. At week 24, patients received 450 mg or 650 mg of ublituximab infused over 1 hour or 1.5 hours.
All patients met the primary endpoint of greater than 95% B-cell depletion between baseline and week 4. Median B-cell depletion was 99% at week 4, and this effect was maintained at weeks 24 and 48.
The researchers detected no T1 gadolinium-enhancing lesions at week 24 or week 48, and total T2 lesion volume decreased by 10.6% between baseline and week 48.
The most frequent adverse events were infusion-related reactions, which occurred in 48% of patients and were more common with the first infusion, particularly when the infusion time was less than 4 hours. All of the infusion-related reactions were grade 1 or 2. One grade 3 serious adverse event of fatigue was considered possibly related to ublituximab. No patients withdrew from the study because of drug-related adverse events. At week 48, 93% of the patients were relapse free, 7% had 24-week confirmed disability progression, and 17% had confirmed disability improvement.
TG Therapeutics, the company developing ublituximab, is evaluating the therapy in phase 3 trials known as ULTIMATE I and 2. The phase 3 trials are using the 450-mg dose with a first dose of 150 mg delivered over 4 hours.
Dr. Fox has disclosed research support from TG Therapeutics and other pharmaceutical companies and working as a consultant and speaker for TG Therapeutics and other companies.
SOURCE: Fox E et al. ACTRIMS Forum 2019, Abstract 66.
DALLAS – (MS), according to phase 2 trial results presented at ACTRIMS Forum 2019. Patients treated with the investigational therapy had reduced MRI activity and relapse rates during the 48-week trial, and the treatment was well tolerated, researchers said.
The monoclonal antibody targets a unique epitope on the CD20 antigen and is glycoengineered for enhanced B-cell targeting through antibody-dependent cellular cytotoxicity, said presenting author Edward Fox, MD, PhD, director of the MS Clinic of Central Texas, Round Rock. Ublituximab’s potency “may offer a benefit over currently available anti-CD20s in terms of lower doses and shorter infusion times,” Dr. Fox and his research colleagues said.
To assess the optimal dose, infusion time, safety, and tolerability of ublituximab in relapsing MS, investigators conducted a phase 2, multicenter study. The trial included 48 patients with relapsing MS; 65% were female. Patients’ average age was 40 years and average disease duration was 7.7 years. The researchers included patients with one or more confirmed relapse in the past year, two relapses in the past 2 years, or at least one active gadolinium-enhancing T1 lesion. The primary endpoint was the percentage of patients with at least a 95% reduction in peripheral CD19+ B cells within 2 weeks after the second infusion on day 15.
For their first infusions, patients received 150 mg of ublituximab over an infusion time of 1, 2, 3, or 4 hours. On day 15, patients received 450 mg or 600 mg of ublituximab over an infusion time of 1, 1.5, or 3 hours. At week 24, patients received 450 mg or 650 mg of ublituximab infused over 1 hour or 1.5 hours.
All patients met the primary endpoint of greater than 95% B-cell depletion between baseline and week 4. Median B-cell depletion was 99% at week 4, and this effect was maintained at weeks 24 and 48.
The researchers detected no T1 gadolinium-enhancing lesions at week 24 or week 48, and total T2 lesion volume decreased by 10.6% between baseline and week 48.
The most frequent adverse events were infusion-related reactions, which occurred in 48% of patients and were more common with the first infusion, particularly when the infusion time was less than 4 hours. All of the infusion-related reactions were grade 1 or 2. One grade 3 serious adverse event of fatigue was considered possibly related to ublituximab. No patients withdrew from the study because of drug-related adverse events. At week 48, 93% of the patients were relapse free, 7% had 24-week confirmed disability progression, and 17% had confirmed disability improvement.
TG Therapeutics, the company developing ublituximab, is evaluating the therapy in phase 3 trials known as ULTIMATE I and 2. The phase 3 trials are using the 450-mg dose with a first dose of 150 mg delivered over 4 hours.
Dr. Fox has disclosed research support from TG Therapeutics and other pharmaceutical companies and working as a consultant and speaker for TG Therapeutics and other companies.
SOURCE: Fox E et al. ACTRIMS Forum 2019, Abstract 66.
REPORTING FROM ACTRIMS FORUM 2019
CSF biomarker clusters correlate with MS severity
DALLAS – Patients with multiple sclerosis (MS) have elevated levels of specific clusters of cerebrospinal fluid (CSF) biomarkers related to astrocytes and microglia that correlated with disease severity in a blinded analysis of more than 1,000 proteins from the CSF of more than 400 patients with neuroimmunologic disease and healthy volunteers.

Previous studies have indicated that aberrant activation of astrocytes and microglia underlies disability progression in older patients with MS, but researchers have lacked biomarkers of these processes in living subjects. In a presentation at a meeting held by the Americas Committee for Treatment and Research in Multiple Sclerosis, Ruturaj R. Masvekar, PhD, described developing biomarkers of CNS cell–specific processes and examining how they relate to MS disability progression. Dr. Masvekar, a researcher at the National Institute of Allergy and Infectious Diseases, and his coinvestigators used a modified DNA aptamer assay to measure proteins in the CSF of 431 patients with neuroimmunologic diseases and healthy volunteers, followed by variable cluster analysis and in vitro modeling to define 64 clusters of CSF biomarkers that relate to CNS cell types.
The study included 42 healthy donors, 20 patients with clinically isolated syndrome, 57 patients with noninflammatory neurologic disorders, 127 patients with relapsing-remitting MS, 72 patients with secondary progressive MS, and 113 patients with primary progressive MS. In a training cohort of 217 participants, the researchers assessed how biomarkers differed between the diagnostic categories. The researchers then validated the results in an independent cohort of 214 participants.
One astrocyte-related cluster (MMP7, SERPINA3, GZMA, and CLIC1) and one microglia-related cluster (DSG2 and TNFRSF25) was significantly elevated in all MS subgroups, compared with healthy controls and patients with noninflammatory neurologic disorders.
In addition, these clusters “significantly correlated with clinical measures of disability, CNS tissue destruction, and MS severity,” Dr. Masvekar said.
The microglial cluster was significantly elevated in all MS subgroups, whereas neuronal endothelial, astrocytic, and oligodendroglial biomarker clusters were elevated only in patients with progressive MS.
“Microglial activation is present in all stages of MS, while toxic astrogliosis increases with MS duration, concomitantly with neuronal and oligodendroglial degeneration,” Dr. Masvekar said. “Microglial activation and toxic astrogliosis likely partake in CNS tissue destruction and enhance MS severity.”
This study, which was recently published in Multiple Sclerosis and Related Disorders (2019 Feb;28:34-43), was supported by the intramural research program at NIAID.
jremaly@mdedge.com
SOURCE: Masvekar RR et al. ACTRIMS Forum 2019, Abstract 281.
DALLAS – Patients with multiple sclerosis (MS) have elevated levels of specific clusters of cerebrospinal fluid (CSF) biomarkers related to astrocytes and microglia that correlated with disease severity in a blinded analysis of more than 1,000 proteins from the CSF of more than 400 patients with neuroimmunologic disease and healthy volunteers.
Previous studies have indicated that aberrant activation of astrocytes and microglia underlies disability progression in older patients with MS, but researchers have lacked biomarkers of these processes in living subjects. In a presentation at a meeting held by the Americas Committee for Treatment and Research in Multiple Sclerosis, Ruturaj R. Masvekar, PhD, described developing biomarkers of CNS cell–specific processes and examining how they relate to MS disability progression. Dr. Masvekar, a researcher at the National Institute of Allergy and Infectious Diseases, and his coinvestigators used a modified DNA aptamer assay to measure proteins in the CSF of 431 patients with neuroimmunologic diseases and healthy volunteers, followed by variable cluster analysis and in vitro modeling to define 64 clusters of CSF biomarkers that relate to CNS cell types.
The study included 42 healthy donors, 20 patients with clinically isolated syndrome, 57 patients with noninflammatory neurologic disorders, 127 patients with relapsing-remitting MS, 72 patients with secondary progressive MS, and 113 patients with primary progressive MS. In a training cohort of 217 participants, the researchers assessed how biomarkers differed between the diagnostic categories. The researchers then validated the results in an independent cohort of 214 participants.
One astrocyte-related cluster (MMP7, SERPINA3, GZMA, and CLIC1) and one microglia-related cluster (DSG2 and TNFRSF25) was significantly elevated in all MS subgroups, compared with healthy controls and patients with noninflammatory neurologic disorders.
In addition, these clusters “significantly correlated with clinical measures of disability, CNS tissue destruction, and MS severity,” Dr. Masvekar said.
The microglial cluster was significantly elevated in all MS subgroups, whereas neuronal endothelial, astrocytic, and oligodendroglial biomarker clusters were elevated only in patients with progressive MS.
“Microglial activation is present in all stages of MS, while toxic astrogliosis increases with MS duration, concomitantly with neuronal and oligodendroglial degeneration,” Dr. Masvekar said. “Microglial activation and toxic astrogliosis likely partake in CNS tissue destruction and enhance MS severity.”
This study, which was recently published in Multiple Sclerosis and Related Disorders (2019 Feb;28:34-43), was supported by the intramural research program at NIAID.
jremaly@mdedge.com
SOURCE: Masvekar RR et al. ACTRIMS Forum 2019, Abstract 281.
DALLAS – Patients with multiple sclerosis (MS) have elevated levels of specific clusters of cerebrospinal fluid (CSF) biomarkers related to astrocytes and microglia that correlated with disease severity in a blinded analysis of more than 1,000 proteins from the CSF of more than 400 patients with neuroimmunologic disease and healthy volunteers.
Previous studies have indicated that aberrant activation of astrocytes and microglia underlies disability progression in older patients with MS, but researchers have lacked biomarkers of these processes in living subjects. In a presentation at a meeting held by the Americas Committee for Treatment and Research in Multiple Sclerosis, Ruturaj R. Masvekar, PhD, described developing biomarkers of CNS cell–specific processes and examining how they relate to MS disability progression. Dr. Masvekar, a researcher at the National Institute of Allergy and Infectious Diseases, and his coinvestigators used a modified DNA aptamer assay to measure proteins in the CSF of 431 patients with neuroimmunologic diseases and healthy volunteers, followed by variable cluster analysis and in vitro modeling to define 64 clusters of CSF biomarkers that relate to CNS cell types.
The study included 42 healthy donors, 20 patients with clinically isolated syndrome, 57 patients with noninflammatory neurologic disorders, 127 patients with relapsing-remitting MS, 72 patients with secondary progressive MS, and 113 patients with primary progressive MS. In a training cohort of 217 participants, the researchers assessed how biomarkers differed between the diagnostic categories. The researchers then validated the results in an independent cohort of 214 participants.
One astrocyte-related cluster (MMP7, SERPINA3, GZMA, and CLIC1) and one microglia-related cluster (DSG2 and TNFRSF25) was significantly elevated in all MS subgroups, compared with healthy controls and patients with noninflammatory neurologic disorders.
In addition, these clusters “significantly correlated with clinical measures of disability, CNS tissue destruction, and MS severity,” Dr. Masvekar said.
The microglial cluster was significantly elevated in all MS subgroups, whereas neuronal endothelial, astrocytic, and oligodendroglial biomarker clusters were elevated only in patients with progressive MS.
“Microglial activation is present in all stages of MS, while toxic astrogliosis increases with MS duration, concomitantly with neuronal and oligodendroglial degeneration,” Dr. Masvekar said. “Microglial activation and toxic astrogliosis likely partake in CNS tissue destruction and enhance MS severity.”
This study, which was recently published in Multiple Sclerosis and Related Disorders (2019 Feb;28:34-43), was supported by the intramural research program at NIAID.
jremaly@mdedge.com
SOURCE: Masvekar RR et al. ACTRIMS Forum 2019, Abstract 281.
REPORTING FROM ACTRIMS FORUM 2019