User login
Clinical Endocrinology News is an independent news source that provides endocrinologists with timely and relevant news and commentary about clinical developments and the impact of health care policy on the endocrinologist's practice. Specialty topics include Diabetes, Lipid & Metabolic Disorders Menopause, Obesity, Osteoporosis, Pediatric Endocrinology, Pituitary, Thyroid & Adrenal Disorders, and Reproductive Endocrinology. Featured content includes Commentaries, Implementin Health Reform, Law & Medicine, and In the Loop, the blog of Clinical Endocrinology News. Clinical Endocrinology News is owned by Frontline Medical Communications.
addict
addicted
addicting
addiction
adult sites
alcohol
antibody
ass
attorney
audit
auditor
babies
babpa
baby
ban
banned
banning
best
bisexual
bitch
bleach
blog
blow job
bondage
boobs
booty
buy
cannabis
certificate
certification
certified
cheap
cheapest
class action
cocaine
cock
counterfeit drug
crack
crap
crime
criminal
cunt
curable
cure
dangerous
dangers
dead
deadly
death
defend
defended
depedent
dependence
dependent
detergent
dick
die
dildo
drug abuse
drug recall
dying
fag
fake
fatal
fatalities
fatality
free
fuck
gangs
gingivitis
guns
hardcore
herbal
herbs
heroin
herpes
home remedies
homo
horny
hypersensitivity
hypoglycemia treatment
illegal drug use
illegal use of prescription
incest
infant
infants
job
ketoacidosis
kill
killer
killing
kinky
law suit
lawsuit
lawyer
lesbian
marijuana
medicine for hypoglycemia
murder
naked
natural
newborn
nigger
noise
nude
nudity
orgy
over the counter
overdosage
overdose
overdosed
overdosing
penis
pimp
pistol
porn
porno
pornographic
pornography
prison
profanity
purchase
purchasing
pussy
queer
rape
rapist
recall
recreational drug
rob
robberies
sale
sales
sex
sexual
shit
shoot
slut
slutty
stole
stolen
store
sue
suicidal
suicide
supplements
supply company
theft
thief
thieves
tit
toddler
toddlers
toxic
toxin
tragedy
treating dka
treating hypoglycemia
treatment for hypoglycemia
vagina
violence
whore
withdrawal
without prescription
section[contains(@class, 'nav-hidden')]
footer[@id='footer']
div[contains(@class, 'pane-pub-article-imn')]
div[contains(@class, 'pane-pub-home-imn')]
div[contains(@class, 'pane-pub-topic-imn')]
div[contains(@class, 'panel-panel-inner')]
div[contains(@class, 'pane-node-field-article-topics')]
section[contains(@class, 'footer-nav-section-wrapper')]
What’s my number? Do I really need $10 million to retire from my medical practice?
“What’s my number?” When I hear this from my financial planning clients, I know they mean: In my 20-year career, this “magic number” is by far the most common thing physicians want to know.

If you look online, articles may recommend having a portfolio valued at $2 million, $5 million, and not uncommonly $10 million or more to retire. Really? $10 million? You might be thinking that surely not everyone needs that amount. Luckily, that’s true.
There’s no magic number your portfolio should be – just your number.
It’s human nature to want a simple, clear target to shoot for. But unfortunately, there’s no generic answer when it comes to saving for retirement. Even after a comprehensive hour-long review of a client’s financial plan – including insurance, investments, estate planning, and other items – the most honest answer I can give is: “It depends.” Not satisfying, I know. But there are still too many holes to fill.
By far the most important factor in getting beyond “it depends” is having an accurate estimate of annual retirement expenses. I have clients who live comfortably on $50,000 a year in retirement and others who need $250,000 or more. Knowing how much you need – your personal number – depends on the individual’s unique dream for retirement and calculating what that dream will cost.
Form a guesstimate based on savings and anticipated expenses
The total portfolio value needed to sustain an annual expense of $50,000 a year in retirement spending versus the portfolio size needed for $250,000 or more, blows apart the fiction of a universal “magic number.” It’s just not that simple. While it’s hard to gauge exactly what you will need, the right information can lead to a logical guesstimate about what size portfolio will provide you with financial independence.
In the end, it’s up to you to determine your desired retirement lifestyle. Then, the only way to get there is to calculate how much it will cost and save up for it by following a well-informed financial plan. This plan will be based on strategy that shifts from the middle to the later stages of your medical career and into retirement.
Let’s see how it works.
Early to mid-career: Focus on building up retirement savings
We ultimately want to save enough to meet our retirement expenses. But figuring out how much to save when you’re in your 40s and 50s is difficult. A mid-career physician likely has significant family- and child-related expenses. When we become empty-nesters, those expenses will decline. In retirement they may disappear entirely, but new expenses may arise.
With large variations in expenses at different life stages, it’s hard to calculate exactly how much you will need to save. Early on, the most sensible thing is putting aside a “reasonable” percentage of gross income for retirement savings.
What is a ‘reasonable’ savings goal for retirement?
As is often the case with high-income earners, many of our clients don’t have a budget or a clear picture of their current expenses and spending habits. That’s alright as long as they are building up a reasonable nest egg for the future – which begs the question of what is reasonable.
For mid-career docs, a reasonable goal to aim for is putting aside 20% of gross income for retirement. What you spend the rest of your money on is less important than how much you’re saving.
This is quite different from how you’ll handle expenses during retirement, when you no longer have a steady stream of income; rather, you have a pot of money that needs to last you another 20, 30, or even 40 years. At that point, thinking about specific expenses becomes more important (more on this topic later). That said, if you’re a mid-career doctor who is not meeting this 20% savings goal, it’s time to make a plan that will free up cash for retirement savings and investments.
Later-career docs: Calculate your spending level in retirement
Financial success means having a portfolio that can support your retirement dreams – with the confidence that your money will last and you won’t need to watch every dollar you spend. As you near retirement, your focus will shift away from accumulating savings to calculating the annual expenses you will have to meet in retirement.
A good place to start is figuring out which expenses will be necessary and which will be more flexible. To do this, separate your anticipated spending into these two categories:
- Fixed expenses: You can confidently forecast your “must-have” fixed expenses – such as property taxes, property/casualty insurance, health care costs, utilities, and groceries – because they remain steady from month to month.
- Discretionary expenses: These “like-to-have” expenses vary from month to month. This makes them harder to predict but easier to control. They might include dining out, travel, and charitable contributions.
As a retiree, understanding your fixed and discretionary expenses can help you prepare for a bear market, when the stock market can decline by 20% or more. Your portfolio won’t consist entirely of stocks, so it shouldn’t drop to that degree. Still, it will decline significantly. You may need to cut back on spending for a year or 2 to allow your portfolio to recover, particularly if the portfolio declines early in retirement.
Are you ready for retirement?
During the long bull market preceding the great recession of 2007 and 2009, many physicians retired –only to return to their practices when their portfolio values plummeted. In the exuberance of the moment, many failed to heed the warnings of many economists and got caught flat-footed.
Right now it’s a bull market, but we’re seeing concerning signs, such as an out-of-control housing market and rumblings about inflation and rising consumer costs. Sound familiar? If you hope to retire soon, take the time to objectively look around the corner so you can plan appropriately – whether your goal is to retire completely, stay in practice part-time, or even take on a new opportunity.
In an “it-depends” world, don’t be lured by a fictitious magic number, no matter what comes up when you Google: “When can I retire?” Instead, save early, imagine your dream retirement, and calculate expenses later to see what’s possible.
Dr. Greenwald is a graduate of the Albert Einstein College of Medicine, New York. Dr. Greenwald completed his internal medicine residency at the University of Minnesota, Minneapolis. He practiced internal medicine in the Twin Cities for 11 years before making the transition to financial planning for physicians, beginning in 1998.
A version of this article first appeared on Medscape.com.
“What’s my number?” When I hear this from my financial planning clients, I know they mean: In my 20-year career, this “magic number” is by far the most common thing physicians want to know.
If you look online, articles may recommend having a portfolio valued at $2 million, $5 million, and not uncommonly $10 million or more to retire. Really? $10 million? You might be thinking that surely not everyone needs that amount. Luckily, that’s true.
There’s no magic number your portfolio should be – just your number.
It’s human nature to want a simple, clear target to shoot for. But unfortunately, there’s no generic answer when it comes to saving for retirement. Even after a comprehensive hour-long review of a client’s financial plan – including insurance, investments, estate planning, and other items – the most honest answer I can give is: “It depends.” Not satisfying, I know. But there are still too many holes to fill.
By far the most important factor in getting beyond “it depends” is having an accurate estimate of annual retirement expenses. I have clients who live comfortably on $50,000 a year in retirement and others who need $250,000 or more. Knowing how much you need – your personal number – depends on the individual’s unique dream for retirement and calculating what that dream will cost.
Form a guesstimate based on savings and anticipated expenses
The total portfolio value needed to sustain an annual expense of $50,000 a year in retirement spending versus the portfolio size needed for $250,000 or more, blows apart the fiction of a universal “magic number.” It’s just not that simple. While it’s hard to gauge exactly what you will need, the right information can lead to a logical guesstimate about what size portfolio will provide you with financial independence.
In the end, it’s up to you to determine your desired retirement lifestyle. Then, the only way to get there is to calculate how much it will cost and save up for it by following a well-informed financial plan. This plan will be based on strategy that shifts from the middle to the later stages of your medical career and into retirement.
Let’s see how it works.
Early to mid-career: Focus on building up retirement savings
We ultimately want to save enough to meet our retirement expenses. But figuring out how much to save when you’re in your 40s and 50s is difficult. A mid-career physician likely has significant family- and child-related expenses. When we become empty-nesters, those expenses will decline. In retirement they may disappear entirely, but new expenses may arise.
With large variations in expenses at different life stages, it’s hard to calculate exactly how much you will need to save. Early on, the most sensible thing is putting aside a “reasonable” percentage of gross income for retirement savings.
What is a ‘reasonable’ savings goal for retirement?
As is often the case with high-income earners, many of our clients don’t have a budget or a clear picture of their current expenses and spending habits. That’s alright as long as they are building up a reasonable nest egg for the future – which begs the question of what is reasonable.
For mid-career docs, a reasonable goal to aim for is putting aside 20% of gross income for retirement. What you spend the rest of your money on is less important than how much you’re saving.
This is quite different from how you’ll handle expenses during retirement, when you no longer have a steady stream of income; rather, you have a pot of money that needs to last you another 20, 30, or even 40 years. At that point, thinking about specific expenses becomes more important (more on this topic later). That said, if you’re a mid-career doctor who is not meeting this 20% savings goal, it’s time to make a plan that will free up cash for retirement savings and investments.
Later-career docs: Calculate your spending level in retirement
Financial success means having a portfolio that can support your retirement dreams – with the confidence that your money will last and you won’t need to watch every dollar you spend. As you near retirement, your focus will shift away from accumulating savings to calculating the annual expenses you will have to meet in retirement.
A good place to start is figuring out which expenses will be necessary and which will be more flexible. To do this, separate your anticipated spending into these two categories:
- Fixed expenses: You can confidently forecast your “must-have” fixed expenses – such as property taxes, property/casualty insurance, health care costs, utilities, and groceries – because they remain steady from month to month.
- Discretionary expenses: These “like-to-have” expenses vary from month to month. This makes them harder to predict but easier to control. They might include dining out, travel, and charitable contributions.
As a retiree, understanding your fixed and discretionary expenses can help you prepare for a bear market, when the stock market can decline by 20% or more. Your portfolio won’t consist entirely of stocks, so it shouldn’t drop to that degree. Still, it will decline significantly. You may need to cut back on spending for a year or 2 to allow your portfolio to recover, particularly if the portfolio declines early in retirement.
Are you ready for retirement?
During the long bull market preceding the great recession of 2007 and 2009, many physicians retired –only to return to their practices when their portfolio values plummeted. In the exuberance of the moment, many failed to heed the warnings of many economists and got caught flat-footed.
Right now it’s a bull market, but we’re seeing concerning signs, such as an out-of-control housing market and rumblings about inflation and rising consumer costs. Sound familiar? If you hope to retire soon, take the time to objectively look around the corner so you can plan appropriately – whether your goal is to retire completely, stay in practice part-time, or even take on a new opportunity.
In an “it-depends” world, don’t be lured by a fictitious magic number, no matter what comes up when you Google: “When can I retire?” Instead, save early, imagine your dream retirement, and calculate expenses later to see what’s possible.
Dr. Greenwald is a graduate of the Albert Einstein College of Medicine, New York. Dr. Greenwald completed his internal medicine residency at the University of Minnesota, Minneapolis. He practiced internal medicine in the Twin Cities for 11 years before making the transition to financial planning for physicians, beginning in 1998.
A version of this article first appeared on Medscape.com.
Female doctors of color say they feel pressure to change their look
It started when a Latina doctor tweeted that she lost points on a practical exam in medical school because of her hoop earrings, with the evaluator writing “earrings, unprofessional.”
That led other female doctors to cite their own experiences, reported The Lily, a Washington Post publication aimed at millennial women. Many women posted photos of themselves wearing hoops, which have long been associated with Latina and African American women, the outlet said.
“There’s a big movement to police women of color and how they present themselves in medical spaces,” said Briana Christophers, an MD-PhD student at the Tri-Institutional MD-PhD Program in New York. “I think in part it’s a way of trying to make people who don’t usually fit the mold, fit the mold.”
Ms. Christophers, who identifies as Latina, said she was urged to wear a black or navy suit when interviewing for doctorate programs. She wore a black suit with a lavender blouse and received comments about that – some positive, some not, she said.
“Sometimes you don’t know how to interpret those sorts of comments,” Ms. Christophers said. “Do you remember because you like the shirt, or because you don’t think I should have done that?”
Doctors of color still stand out in American medicine. The Lily cited the Association of American Medical Colleges as saying that in 2018, Hispanics made up 5.8% of active American doctors and African Americans made up 5%.
Studies show that medical professionals of color often don’t receive the same respect as their White counterparts, with some people questioning whether they’re actually doctors.
“At work, wearing my white coat that has my name pretty big on it with a badge that says doctor on it, I still get asked if I’m the environmental services staff,” Alexandra Sims, MD, a pediatrician in Cincinnati, told The Lily. “I think it just demonstrates how deeply ingrained bias, racism, and sexism are in society and that we have a lot of work to do to disrupt that.”
Dr. Sims said the tweet about hoop earrings led her to wonder about daily decisions she makes about dress.
“Am I too much? Is this too much? Is this earring too big? Is this nail polish color too loud? And how will that be received at work?” she said, noting that she may opt not to wear hoops in certain situations, such as when she’s dealing with a grabby baby.
Monica Verduzco-Gutierrez, MD, professor and chair of the department of rehabilitation medicine at University of Texas Health, San Antonio, said doctors should be judged on the care they provide, not their appearance.
“Judging someone based on their earrings or their jumpsuit or whatever else that they’re noticing about the student is not an appropriate way to judge the student’s ability to take care of a patient,” Dr. Verduzco-Gutierrez said, noting that she was not speaking on behalf of the school.
A version of this article was first published on WebMD.com .
New details of myocarditis linked to COVID vaccines
Further details from multiple cases of myocarditis linked to the Pfizer and Moderna mRNA COVID vaccines have been described in recent papers in the medical literature.
The cases appear to occur almost exclusively in males and most often in younger age groups. While symptoms and signs of myocarditis mostly resolved with a few days of supportive care, long-term effects are unknown at present.
The authors of all the reports and of two accompanying editorials in JAMA Cardiology are unanimous in their opinion that the benefits of vaccination still outweigh the risks.
The Centers for Disease Control and Prevention’s but committee members delivered a strong endorsement for continuing to vaccinate young people with the mRNA vaccines.
The current case reports are published in two papers in JAMA Cardiology and in three in Circulation.
U.S. military reports 23 cases
In one report in JAMA Cardiology, authors led by Jay Montgomery, MD, from Walter Reed National Military Medical Center in Bethesda, Md., described 23 cases from the U.S. Military Health System of individuals with acute myocarditis who presented within 4 days after mRNA-based COVID-19 vaccination (7 Pfizer and 16 Moderna).
All patients were male, 22 of 23 were on active duty, and the median age was 25 years (range, 20-51); 20 of the 23 cases occurred after receipt of a second dose of an mRNA COVID-19 vaccine.
The patients all presented with acute onset of marked chest pain. All patients had significantly elevated cardiac troponin levels. Among eight patients who underwent cardiac MRI (cMRI), all had findings consistent with the clinical diagnosis of myocarditis.
Additional testing did not identify other possible causes of myocarditis. All patients received brief supportive care and were recovered or recovering.
The authors reported that the military administered more than 2.8 million doses of mRNA COVID-19 vaccine in this period, and while the observed number of myocarditis cases was small, the number was “substantially higher” than expected among male military members after a second vaccine dose.
They noted that, based on historical data, among the 544,000 second doses to military members there may have been 0-10 expected myocarditis cases, but they observed 19 cases.
“All patients in this series reflect substantial similarities in demographic characteristics, proximate vaccine dose, onset interval, and character of vaccine-associated myocarditis. The consistent pattern of clinical presentation, rapid recovery, and absence of evidence of other causes support the diagnosis of hypersensitivity myocarditis,” they stated.
They added that presentation after a second vaccine dose or, in three patients, when vaccination followed SARS-CoV-2 infection, suggests that prior exposure was relevant in the hypersensitivity response.
“The spectrum of clinical presentation and reliance on patients seeking health care and on health care professionals recognizing a rare vaccine-associated adverse event limits determination of the true incidence of this condition,” the authors wrote.
They stressed that recognition of vaccine-associated myocarditis is clinically important because diagnosis impacts management, recommendations for exercise, and monitoring for cardiomyopathy.
But the authors also acknowledged that it is important to frame concerns about potential vaccine-associated myocarditis within the context of the current pandemic.
“Infection with SARS-CoV-2 is a clear cause of serious cardiac injury in many patients. ... Prevalence of cardiac injury may be as high as 60% in seriously ill patients. Notably, nearly 1% of highly fit athletes with mild COVID-19 infection have evidence of myocarditis on cMRI,” they wrote.
“Given that COVID-19 vaccines are remarkably effective at preventing infection, any risk of rare adverse events following immunization must be carefully weighed against the very substantial benefit of vaccination,” they concluded.
Four cases at Duke
In the second paper in JAMA Cardiology, a group led by Han W. Kim, MD, reported four patients with acute myocarditis occurring within days of mRNA COVID-19 vaccination (two Pfizer and two Moderna) in patients treated at Duke University Medical Center, Durham, N.C. The hospital courses of the four patients with myocarditis following COVID-19 vaccination were uneventful, and they were discharged within 2-4 days.
The authors said that, although a causal relationship cannot be established, none of the patients had a viral prodrome or had coincident testing that revealed an alternative explanation.
They stated that these four patients represent the majority of patients with acute myocarditis identified in the past 3 months at their institution, and this led to the highest total number of patients with acute myocarditis, compared with the same 3-month period for the past 5 years.
“Additionally, we identified only those patients with severe unremitting chest pain who sought medical attention. Those with mild or moderate chest pain might not seek medical attention, and it is possible that subclinical myocarditis may occur and could be detected by active surveillance, as has been described with smallpox vaccination,” they wrote.
Further case reports
In one of the papers in Circulation, a group led by Kathryn F. Larson, MD, from the Mayo Clinic in Rochester, Minn., described eight patients hospitalized with chest pain who were diagnosed with myocarditis within 2-4 days of receiving either the Pfizer or Moderna vaccine.
Two of the patients had previously been infected by SARS-CoV-2 without need for hospitalization. All individuals were otherwise healthy males between the ages of 21 and 56 years. All but one patient developed symptoms after their second dose, and the one patient who developed myocarditis after the first vaccine dose had previously been infected with SARS-CoV-2.
Systemic symptoms began within 24 hours after vaccine administration in five of eight patients, with chest pain presenting between 48 and 96 hours later. Troponin values were elevated in all individuals and appeared to peak the day after admission, whereas none had eosinophilia.
Cardiac MRI revealed findings consistent with myocarditis in all patients. All patients had resolution of their chest pain and were discharged from the hospital in stable condition.
“The patients presented here demonstrated typical signs, symptoms, and diagnostic features of acute myocarditis. The temporal association between receiving an mRNA-based COVID-19 vaccine and the development of myocarditis is notable,” the authors said.
They added that they would consider the use of corticosteroids in these patients but cautioned that this could reduce the specific immune response against SARS-COV-2 triggered by the vaccine. “Thus, the duration of corticosteroid administration should be limited to the resolution of the symptoms or ventricular arrhythmias or the recovery of the left ventricular ejection fraction.”
Pending publication of long-term outcome data after SARS-CoV-2 vaccine–related myocarditis, they suggest adherence to the current consensus recommendation to abstain from competitive sports for a period of 3-6 months with reevaluation prior to sports participation.
In another of the Circulation papers, a group led by Carolyn M. Rosner, MSN, presented a case series of seven patients hospitalized for acute myocarditis-like illness following COVID-19 vaccination, from two U.S. medical centers, in Falls Church, Va., and Dallas. All patients were males below the age of 40 years and of White or Hispanic race/ethnicity. Only one patient reported prior history of COVID-19 infection. Six patients received mRNA (Moderna or Pfizer) and one received the adenovirus (Johnson & Johnson) vaccine. All patients presented 3-7 days post vaccination with acute onset chest pain and biochemical evidence of myocardial injury.
Hospital length of stay was 3 days, and all patients’ symptoms resolved by hospital discharge.
And finally, the third paper in Circulation reported a detailed description of one patient – a 52-year-old, previously healthy male who presented with acute myocarditis 3 days after the administration of the second dose of Moderna’s COVID-19 vaccine. The symptoms resolved, and there was a gradual improvement in cMRI findings. Ischemic injury and other potential causes of acute myocardial injury were excluded, as were other potential infectious causes of myocarditis, and there was no evidence of systemic autoimmune disease.
“Clinicians should be aware that myocarditis may be present in patients exhibiting cardiac signs and symptoms 2-4 days after COVID-19 vaccination,” the authors said.
They added that additional surveillance of such adverse events post–COVID-19 vaccination will help identify subgroups at higher risk for this vaccine-related effect, and whether additional precautions are necessary.
‘Benefits outweigh risk’
In an accompanying editorial in JAMA Cardiology, three doctors from the CDC cite several other reports of myocarditis after mRNA COVID vaccination. These include a case report published in Pediatrics of seven male adolescents aged 14-19 years who presented with myocarditis or myopericarditis within 4 days after receipt of a second dose of the Pfizer vaccine.
But the editorialists noted that the most comprehensive data about the risk for myocarditis following immunization with mRNA vaccines comes from Israel.
The Israeli Ministry of Health recently posted data describing 121 myocarditis cases occurring within 30 days of a second dose of mRNA vaccine among 5,049,424 persons, suggesting a crude incidence rate of approximately 24 cases per million.
On the current case reports, the CDC doctors wrote: “The striking clinical similarities in the presentations of these patients, their recent vaccination with an mRNA-based COVID-19 vaccine, and the lack of any alternative etiologies for acute myocarditis suggest an association with immunization.”
They said that acute onset of chest pain 3-5 days after vaccine administration, usually after a second dose, is a typical feature of reported cases and suggests an immune-mediated mechanism.
But SARS-CoV-2 infection also causes cardiac injury which may result in severe outcomes, and based on currently available data, myocarditis following immunization with current mRNA-based vaccines is rare.
“At present, the benefits of immunization in preventing severe morbidity favors continued COVID-19 vaccination, particularly considering the increasing COVID-19 hospitalization rates among adolescents reported during spring 2021,” the editorialists stated.
But they added that many questions remain. These include whether modifications are needed to the vaccine schedule among persons with a history of possible or confirmed myocarditis after COVID vaccine, how should postvaccine myocarditis be managed, how often should follow-up assessments be performed, how might follow-up assessments affect recommendations to avoid vigorous physical activity following the diagnosis of myocarditis, and do all likely cases of acute myocarditis that appear to be uncomplicated require cardiac MRI for more definitive diagnosis?
“While the data needed to answer such questions are being collected, there is an opportunity for researchers with expertise in myocarditis to develop a comprehensive, national assessment of the natural history, pathogenesis, and treatment of acute myocarditis associated with receipt of mRNA-based COVID-19 vaccines,” they concluded.
In a second editorial in JAMA Cardiology, a group of editors from the journal acknowledged that publication of the current case reports may contribute to additional public concern regarding immunization. But they added that clinicians discussing immunization with patients should recognize that these case series suggest that the symptomatic events consistent with myocarditis are still very rare and appear to be self-limiting.
“Given the risks of COVID-19, including the risk of myocarditis from COVID-19 infection, the editors do not believe these case reports are sufficient to interrupt the march toward maximal vaccination against SARS-CoV-2 as expeditiously as possible,” they said.
A version of this article first appeared on Medscape.com.
What’s best for diabetes after metformin? GRADE outdated at outset
Liraglutide and insulin glargine outperformed glimepiride and sitagliptin as single add-on agents to metformin for treating patients with type 2 diabetes in a multicenter U.S. trial that randomized just over 5,000 patients.
. Results were reported at the virtual American Diabetes Association (ADA) 81st Scientific Sessions.
The comparison included two oral medications – the sulfonylurea glimepiride and dipeptidyl peptidase-4 (DPP-4) inhibitor sitagliptin – and two injectable medications – insulin glargine and glucagon-like peptide 1 (GLP-1) receptor agonist liraglutide.
The primary endpoint was change in A1c level and overall glycemic control. Secondary endpoints include changes in weight, as well as cardiovascular, renal, gastrointestinal, and other complications.
For the primary endpoint – keeping A1c levels below 7% – liraglutide and the basal insulin glargine both did this best and were almost equivalent.
During the average 5-year follow-up, the rates of patients progressing to a confirmed A1c of 7% or higher were 67% among patients randomized to insulin glargine, 68% maintained on liraglutide, 72% taking the sulfonylurea glimepiride, and 77% taking sitagliptin, reported John M. Lachin, ScD, a biostatistician at George Washington University, Washington.
Too soon for take-aways, or are the data already obsolete?
“The ultimate goal of GRADE is to help clinicians select the therapies that will work best for individual patients, as diabetes care is not a one-size-fits all approach,” noted David M. Nathan, MD, chair of the study and director of the Diabetes Center at Massachusetts General Hospital, in an ADA press release.
Dr. Nathan, as well as several other members of the GRADE trial steering committee who presented results, repeatedly cautioned that the findings were preliminary because they represent 90% of outcomes, with the remaining 10% still to be adjudicated.
“We undertook this study to fill a gap in the guidelines,” said investigator Deborah J. Wexler, MD, clinical director of the Diabetes Center at Massachusetts General Hospital in Boston. “I would like to have all the results in ... before I comment on how the guidelines should change.”
“The metabolic data are solid, but the cardiovascular disease data are preliminary,” warned Dr. Nathan.
But that didn’t stop some from drawing their own conclusions, with Julio Rosenstock, MD, who comoderated the session but was not involved with the study, giving his own opinion.
“A pleasant surprise was the performance of basal insulin,” he said, calling the findings “a vindication” for basal insulin as a treatment for the types of patients with type 2 diabetes that enrolled in the study.
Steven E. Kahn, MB, ChB, another GRADE co-investigator agreed. “Based on the results, guidelines should say that you add insulin early on,” he observed.
A generic basal insulin and a generic sulfonylurea are both reasonable options, after metformin, for patients with limited resources, added Dr. Kahn, an endocrinologist and professor at the University of Washington, Seattle.
Dr. Rosenstock, director of the Dallas Diabetes Research Center, also saw the results as an indictment of agents in the DDP-4 inhibitor class, such as sitagliptin.
The DPP-4 inhibitors generate $9 billion a year, he said, wondering whether it “is justifiable to put them on the same level as other agents?”
Meanwhile the assigned discussant, David R. Matthews, DPhil, a professor of diabetes medicine at the University of Oxford, England – while congratulating the investigators on certain aspects of the study – said it ultimately fell short because it didn’t include an arm with an SGLT2 inhibitor.
“We should kick the authors for missing out on SGLT2 inhibitors,” Dr. Matthews said. “The omission means that the GRADE data are already obsolescent.”
In reply, Dr. Nathan admitted “we feel bad we did not include” an SGLT2 inhibitor, but he vigorously defended the dilemma faced by the trial’s organizers.
Oral SGLT2 inhibitors were not “well-established drugs” for type 2 diabetes when enrollment launched in 2013, and the researchers were wary of including what could turn out to be a problematic agent soon after controversy over the safety of agents in the thiazolidinedione drug class (such as rosiglitazone), he explained.
They also realized that adding a fifth drug to the study would necessitate doubling enrollment size, which would have undercut the funding plans already in place.
Dr. Matthews also derided GRADE as being underpowered to adequately address the impact of the tested agents on major adverse cardiovascular events (MACE) and hospitalizations for heart failure and too U.S.-centric to be generalizable elsewhere.
A study with lots of data
The roughly 5,000 patients enrolled in GRADE were an average age of 57 years old, 64% were men, 66% were White, and 20% were Black. They had had type 2 diabetes, on average, for 4.2 years. Mean body mass index at entry was about 34 kg/m2, average A1c was 7.5%, and average estimated glomerular filtration rate was 95 mL/min/1.73m2. The trial included a 6-12 week run-in period during which background metformin treatment was optimized and led to average A1c levels less than 7%.
Patients were then randomized to one of the four agents as add-on treatment.
Both liraglutide and insulin glargine performed well on many of the numerous metrics in the data-rich trial, largely funded by two branches of the National Institutes of Health, with commercial involvement limited to free supplies of the study drugs.
The secondary metabolic outcome, of disease progressing to a confirmed A1c of 7.5%, was reached by 39% of patients taking insulin glargine, significantly lower than the rate of 46% among patients taking liraglutide, and that rate, in turn, was significantly below the 50% rate among patients taking glimepiride and the 55% rate of those taking sitagliptin.
Mean doses of the second-line agents after 4 years of treatment were 38.3 units/day for glargine, 3.5 mg/day for glimepiride, 1.3 mg/day for subcutaneous liraglutide, and 82.9 mg/day for sitagliptin.
A trio of cardiovascular outcomes showed one significant benefit of liraglutide over the other three drugs for the endpoint of any cardiovascular event, which included not only major adverse cardiovascular events (MACE; cardiovascular death, myocardial infarction, or stroke), but also several other event types, including heart failure requiring hospitalization, unstable angina requiring hospitalization, revascularization or any arterial repairs, stent thrombosis, or transient ischemic attack.
For the endpoint of any cardiovascular event, the rate was 5.8% for patients taking liraglutide, significantly less than the rate of 7.6% of those taking insulin glargine, 8.0% for glimepiride, and 8.6% for sitagliptin, reported John B. Buse, MD, PhD, professor, chief of endocrinology, and director of the Diabetes Center at the University of North Carolina at Chapel Hill.
For each of the other two main cardiovascular endpoints – MACE and hospitalization for heart failure – liraglutide had a numeric advantage over the other three drugs but failed to reach significance.
Patients taking liraglutide also had a smaller but not significantly different point estimate for all-cause death, at 2.1%, compared with 3.1%-3.4% in the other three groups.
And, Dr. Nathan emphasized, the cardiovascular disease data are still considered preliminary.
Liraglutide scored a pair of additional outcome victories. Its use resulted in a significantly lower rate of patients who progressed during follow-up to either needing antihypertensive medications or having their blood pressure rise above 140/90 mm Hg compared with the other three drugs. (At baseline, average blood pressure for all patients was 128/77 mm Hg.)
And after 4 years, patients taking liraglutide lost an average of about 4 kg (8.8 lb) from their baseline weight (which averaged about 100 kg [220 lb]), roughly the same as patients taking sitagliptin but significantly better than with glimepiride or insulin glargine. Patients taking glargine gained a small amount of weight on average during their first couple of years of treatment, roughly 1 kg, but returned to around their baseline weight by the end of 4 years.
Four drugs performed equally well for some outcomes
Finally, the four drugs had similar results for some outcomes. This included their effects on renal function, distal sensory polyneuropathy, and low-density lipoprotein (LDL) cholesterol.
The four agents also had roughly similar safety profiles, with rates of serious adverse events all falling within the tight range of 33%-37%.
But the rate of severe hypoglycemic episodes that required assistance to treat showed significant separation, ranging from 2.3% for glimepiride, 1.4% for glargine, 0.9% for liraglutide, and 0.7% for sitagliptin. Gastrointestinal symptoms occurred in about 50% of patients in three of the treatment groups but were significantly higher in those taking liraglutide, affecting 60%.
GRADE received no commercial funding. Dr. Wexler has reported serving on data monitoring committees for Novo Nordisk. Dr. Buse has reported being a consultant for and holding stock in numerous companies. Dr. Rosenstock has reported being an advisor or consultant to Applied Therapeutics, Boehringer Ingelheim, Hanmi Pharmaceutical, Intarcia Therapeutics, Lilly, Novo Nordisk, Oramed, and Sanofi and has received research support from numerous companies. Dr. Kahn has reported being an advisor to or speaker on behalf of Bayer, Boehringer Ingelheim, Casma Therapeutics, Intarcia Therapeutics, Lilly, Merck, Novo Nordisk, Pfizer, and Third Rock Ventures. Dr. Matthews has reported receiving lecture and advisor fees from Merck, Novartis, Novo Nordisk, Sanofi Aventis, and Servier. Dr. Lachin and Dr. Nathan have reported no relevant financial relationships.
A version of this article first appeared on Medscape.com.
Screen pregnant women for OSA, given known risks
Pregnant women who have even mild sleep apnea should be treated for their sleep-disordered breathing given what is known about associated risks for hypertensive disorders of pregnancy and gestational diabetes, Carolyn M. D’Ambrosio, MS, MD, FCCP, said at the virtual annual meeting of the Associated Professional Sleep Societies.
“This is the current standard of care,” Dr. D’Ambrosio said. “Although guidelines on this issue are not hard and fast, I’d say that knowing what we know about the risk of adverse [maternal] outcomes, we should all try to treat these problems as soon as they’re identified” and then repeat polysomnography or home sleep testing 3-6 months post partum to “be sure the sleep-disordered breathing has resolved.”
Estimates of obstructive sleep apnea (OSA) prevalence range from approximately 9% in the first trimester to 20% in the third trimester. Yet recognizing the significance of OSA in pregnant women and identifying women for testing remains a major challenge. “Most women won’t [report sleep problems] because it’s pretty much common folklore that you don’t sleep well when you’re pregnant,” said Dr. D’Ambrosio, associate professor of medicine at Harvard Medical School, Boston, and current past-chair of the Women’s Lung Health Network for CHEST.
Many obstetricians and obstetrics providers, meanwhile, do not adequately screen. Typical screening tools like the Epworth Sleepiness Scale have low sensitivity and specificity during pregnancy, which means that inquiries about sleepiness, snoring, and disruptions in sleep are important, as is attention to potential risks for OSA posed by obesity, chronic hypertension, and neck circumference.
Only about a quarter of women in the United States snore during pregnancy, she noted. Snoring prevalence does increase as pregnancy progresses, reaching up to almost 50% in during the third trimester in some studies.
A four-variable screening tool reported almost 10 years ago for pregnant women is reliable for gauging risk, Dr. D’Ambrosio said. The model considers self-reported frequent snoring (more than three times/week), chronic hypertension, advanced maternal age, and a pregestational body mass index of at least 30 kg/m2. “If these [factors] are present, the patient is at significant risk for OSA and should be strongly considered for testing,” she said.
Home sleep apnea testing (HSAT) is validated for pregnant women but “it can underestimate,” she said. “If you get a negative result and [have clinical suspicion], then don’t stop there.”
And considering that the prevalence of OSA – at all levels of severity – increases as pregnancy progresses, it’s important to continue talking about sleep with patients who have frequent snoring, for instance, but negative sleep test results early in pregnancy. “They could develop [OSA] as time goes on,” she said.
Associated risk factors
Independent associations between sleep-disordered breathing and adverse maternal outcomes were demonstrated in a prospective cohort study published several years ago of 3,705 women who underwent HSAT in early and mid-pregnancy. The adjusted odds ratios for preeclampsia when sleep-disordered breathing (an apnea-hypopnea index of ≥5) was present early in pregnancy and in mid-pregnancy were 1.94 and 1.95, respectively.
For hypertensive disorders of pregnancy more broadly, the ORs were 1.46 and 1.73, and for gestational diabetes, the ORs were 3.47 and 2.79.
“Faced with the question about why it’s important to diagnosis and treat OSA [during pregnancy] since the pregnancy will be over in a few months, I go to this study,” Dr. D’Ambrosio said. “Waiting until the end of pregnancy is not safe. There are increased risks of very serious conditions if sleep apnea is there and it’s not treated.”
Another study demonstrating a link between OSA and maternal outcomes looked over 1.5 million deliveries in the United States and found a significantly higher prevalence of gestational diabetes (OR, 2.08), gestational hypertension (OR, 1.77), preeclampsia (OR, 2.07), and eclampsia (OR, 2.70) in pregnant women with OSA than without, after adjusting for maternal obesity. Associations remained significant after adjusting for a more comprehensive list of covariates.
Multiple potential casual pathways are at play, Dr. D’Ambrosio said. Short sleep duration decreases leptin and increases ghrelin levels, for instance, and sleep fragmentation activates the HPA axis and increases cortisol. Intermittent hypoxemia affects sympathetic activity, and intrathoracic pressure swings cause increased oxidative stress and systemic inflammation.
The resulting endothelial dysfunction, glucose dysfunction, and dyslipidemia can drive the adverse maternal outcomes documented in these studies, she said, noting that the adverse outcomes can have long-term cardiovascular consequences.
Continuous positive airway pressure therapy is well tolerated in pregnancy, and given pregnancy’s continual weight change, auto-titrating CPAP may be the best option, she said.
There is “some limited data that treatment improves maternal outcomes, and we’re still working on trying to get better data and more solid recommendations,” Dr. D’Ambrosio said. There currently are no guidelines covering the diagnosis and management of OSA during pregnancy.
“We’ve come a long way ... but we still have more to do,” she said. “We have a long way to go to getting [OSA in pregnant women] well recognized, with screening techniques and diagnosis.”
Asked after the meeting about Dr. D’Ambrosio’s messages, Anita Rajagopal, MD, said that OSA screening during pregnancy needs to be improved through more collaboration “with our ob.gyn. and primary care colleagues.”
Too often, she said, “the signs and symptoms of OSA in pregnancy are written off as ‘just harmless snoring’ while in fact the patient has treatable sleep disordered breathing with potential adverse effects.” Dr. Rajagopal is department medical director for sleep medicine at Community Physician Network and medical director of the Community Health Network Sleep-Wake Disorders Center, both in Indianapolis.
Dr. D’Ambrosio reported that she has no potential conflicts of interest related to the material she presented, and Dr. Rajagopal stated she has no potential conflicts of interest.
FROM SLEEP 2021
Obesity hypoventilation: Moving the needle on underrecognition
Obesity hypoventilation syndrome (OHS) is bound to be increasing because of the rising obesity epidemic but is underrecognized and “frequently underdiagnosed,” Saiprakash B. Venkateshiah, MD, said at the virtual annual meeting of the Associated Professional Sleep Societies.
The condition, which can cause significant morbidity and mortality, is defined by the combination of obesity and awake alveolar hypoventilation (PaCO2 ≥45 mm Hg), with the exclusion of alternate causes of hypoventilation. Sleep-disordered breathing (SDB) is almost universally present, with approximately 90% of individuals with OHS also having obstructive sleep apnea (OSA), most often severe, and approximately 10% having sleep-related hypoventilation, or a “pure hypoventilation subtype, if you will,” said Dr. Venkateshiah, assistant professor of medicine at Emory University, Atlanta.
The prevalence of OHS in the general population is unknown, but its prevalence in patients who present for the evaluation of SDB has ranged from 8%-20% across multiple studies, he said. Up to 40% of patients with OHS present for the first time with acute hypercapnic respiratory failure, which has an in-hospital mortality of 18%.
Postmenopausal women appear to have a higher prevalence, compared with premenopausal women and men, he noted, and women appear to be more likely than men to present with the clinical phenotype of OHS without associated OSA.
The arterial blood gas measurement needed to document alveolar hypoventilation and definitively diagnosis OHA is a “simple and economical test,” he said, “but it is logistically very difficult to obtain [these measurements] routinely in all patients in the clinic ... and is one of the reasons why OSH is underdiagnosed.”
Guideline advice
A practice guideline published in 2019 by the American Thoracic Society suggests that, for obese patients with SDB and a low to moderate probability of having OSH, a serum bicarbonate level be measured first. “In patients with serum bicarbonate less than 27 mmol/L, clinicians might forgo measuring PaCO2, as the diagnosis in them is very unlikely,” Dr. Venkateshiah said, referring to the guideline. “In patients with a serum bicarbonate greater than 27, you might need to measure PaCO2 to confirm or rule out the diagnosis of OHS.”
(Patients strongly suspected of having OHS, with more than a low to moderate probability – those in whom arterial blood gases should be measured – are “usually severely obese with typical signs and symptoms such as dyspnea, nocturia, lower-extremity edema, excessive daytime sleepiness, fatigue, loud disruptive snoring, witnessed apneas, as well as mild hypoxemia during wake and/or significant hypoxemia during sleep,” the ATS guideline says.)
The guideline panel considered the use of oxygen saturation measured with pulse oximetry during wakefulness to screen for OHS and decided to advise against it because of the paucity of evidence-based literature, Dr. Venkateshiah noted. (In making its five conditional recommendations, the guideline panel cited an overall very low quality of evidence.)
Symptoms of OHS overlap with those of OSA (for example, daytime hypersomnolence, witnessed apneas, loud snoring, and morning headaches), so “symptoms alone cannot be used to discriminate between the two disorders,” he advised. Signs of OHS commonly seen in clinical exams, however, are low resting daytime oxygen saturations and lower-extremity edema. A sleep study, he added, is needed to document and characterize SDB in patients with OHS.
Positive airway pressure therapy is the first-line treatment for OHS, and long-term outcomes of patients with OHS on PAP treatment are significantly better, compared with untreated individuals. There is no strong evidence to recommend one form of PAP therapy over another for patients with OHS and concomitant severe OSA, he said, but “the bottom line” from both short- and long-term randomized clinical trials comparing CPAP with noninvasive ventilation “is that CPAP is equivalent to noninvasive ventilation as far as outcomes are concerned.”
The ATS guideline panel recommends continuous positive airway pressure therapy for patients with OHS and severe OSA. And for OHS with nonsevere OSA, bilevel PAP is traditionally used – including pure hypoventilators, Dr. Venkateshiah said.
Weight-loss interventions are paramount, since “the primary driver of OHS is obesity,” he said at the meeting. There are only a few studies that have looked at bariatric surgery in patients with OHS, he said, “but they did note significant improvements in gas exchange, sleep apnea, lung volumes and pulmonary hypertension.”
The ATS guideline suggests weight-loss interventions that produce sustained weight loss of 25%-30% of the actual body weight. Such interventions are “most likely required to achieve resolution of hypoventilation,” Dr. Venkateshiah said.
OHS vs. COPD
In a separate presentation on OHS, Michelle Cao, DO, clinical associate professor at Stanford (Calif.) University, emphasized the importance of distinguishing the patient with OHS from the patient with hypercapnic chronic obstructive pulmonary disease (COPD). Spirometry and the flow volume curve can help rule out hypercapnic COPD and other conditions that cause daytime hypoventilation.
A study published in 2016 of 600 hospitalized patients determined to have unequivocal OHS found that 43% had been misdiagnosed as having COPD and none had been previously diagnosed with OHS, Dr. Cao noted. Patients in the study had a mean age of 58 and a mean body mass index of 48.2 kg/m2; 64% were women.
Dr. Venkateshiah and Dr. Cao had no relevant disclosures.
FROM SLEEP 2021
Post–COVID-19 lung injury: What we know so far
With vaccination rates increasing and new infections declining, we all hope the worst of the COVID-19 pandemic is over (fingers crossed really tight). Regardless, the post–COVID-19 syndrome pandemic has already begun. What is post–COVID-19 syndrome (or long-haulers or long-COVID)? Is it standard postviral fatigue? Prolonged deconditioning following debilitating illness? Permanent lung or vascular injury? Common sense and past experience say it’s all of these.
In theory, the burden of actual lung injury post COVID-19 should be the easiest to quantify, so let’s discuss what we think we know. I’ve heard experts break post–COVID-19 lung injury into three broad categories:
- Preexisting lung disease that is exacerbated by acute COVID-19 infection.
- Acute COVID-19 infection that causes acute respiratory distress syndrome (ARDS) or other acute lung injury (ALI).
- Non–critically ill acute COVID-19 with residual lung damage and abnormal repair.
These categories are necessarily imprecise, making it challenging to fit some patients neatly into a single definition.
For patients in the first category, management will be dictated largely by the nature of the preexisting lung disease. For those in category two, we already know a lot about what their recovery from ARDS will look like. There’s no longer reason to believe that COVID-19–related ARDS is particularly unique, and all things being equal, lung recovery should mimic that seen with non–COVID-19 ARDS.
It’s going to take patience and time, and beyond targeted rehabilitation it’s not clear that we have anything available to expedite the process.
The third category of patients is the most intriguing. Is there a group of patients who have residual lung injury but didn’t have evident ARDS/ALI during their acute COVID-19 infection? Anecdotally we think so, but we know little about prevalence and less about management. A recent study published in Annals of the American Thoracic Society addresses both issues. In an observational report on patients recovering after being hospitalized with COVID-19 infection, the authors found that 3.6% of patients had residual lung injury that improved with 3 weeks of corticosteroid treatment.
The report is timely and helpful but hardly definitive. It’s observational, and patients required extensive screening and identification by a multidisciplinary committee of experts in interstitial lung disease. Patients were diagnosed as having organizing pneumonia (OP) as their “lung injury” if certain radiographic criteria were met. There were no biopsies. Last, there was no control group. Still, this report is critically important. It tells us that at 6 weeks post discharge, about 3.6% of patients who were hospitalized for COVID-19 will have persistent symptoms, radiographic abnormalities, and a plateau in their recovery.
Beyond that, it tells us little. Did these patients really have OP? It’s impossible to know. The CT findings used to establish the diagnosis are nonspecific. Response to steroids is consistent with OP, but the treatment course was quite short. If truly OP, one would expect a high relapse rate after steroid withdrawal. Patients weren’t followed long enough to monitor recurrence rates. Also, as appropriately discussed in the accompanying editorial, there’s no control group so we can’t know whether the patients treated with steroids would have recovered without treatment. There was objective improvement in lung function for the two to three patients they followed who did not receive steroids. However, it was of lesser magnitude than in the steroid group.
Post–COVID-19 symptoms will remain a challenge for the foreseeable future. More than 30 million patients have been diagnosed with COVID-19 in the United States and close to half will experience persistent dyspnea. Putting the numbers together, I conclude that the vast majority will not have identifiable lung injury that will benefit from steroids. I wish I could prescribe patience to both physicians and patients.
Dr. Holley is associate professor of medicine at Uniformed Services University and program director of pulmonary and critical care medicine at Walter Reed National Military Medical Center. He covers a wide range of topics in pulmonary, critical care, and sleep medicine.
A version of this article first appeared on Medscape.com.
‘Praise Diabetes’: Support programs in Black churches yield lasting A1c changes
A church-based diabetes self-management support intervention that incorporated parish nurses and peer leaders is feasible and may help improve diabetes-related outcomes in participants.

Sustained reductions in hemoglobin A1c and diabetes distress were seen in the Praise Diabetes Project, a 33-month study that piloted several different approaches to parish nurse and peer leader support at 21 urban churches in Michigan and Ohio, said Gretchen Piatt, MPH, PhD, associate professor in the department of learning health sciences at the University of Michigan, Ann Arbor, reported at the annual scientific sessions of the American Diabetes Association.
“Of the participants who achieved glycemic control following diabetes self-management education, a really large proportion – upward of 77% of participants across all the groups– achieved sustained glycemic control at 33 months,” Dr. Piatt said.
Findings from this study has helped diabetes educators better understand how to design effective support approaches that may have a long-term impact on glycemic control and diabetes distress, Dr. Piatt said.
The Praise Diabetes Project represents a “very smart strategy” of leveraging institutions that already exist in the African American community that are trusted and provide emotional support, said Tracey D. Brown, CEO of the ADA.
“This is about behavior change, really, at its crux,” Ms. Brown said in an interview. “To get there, you’ve got to have trust, and you have to have an emotional connection. If you don’t get either one of those things, then you really are not going to do anything in terms of changing behavior.”
Long-term solutions needed
Many studies show that diabetes self-management education can improve clinical and psychosocial outcomes, and reduce health care utilization and cost, at least in the short term, Dr. Piatt said. However, it’s less clear how those improvements can be sustained over longer periods of time.
“This then presents a critical need to develop and evaluate diabetes self-management support models that are ongoing, patient driven, and embedded within existing community infrastructures,” Dr. Piatt said in her presentation.
Working with churches is one approach to working within existing community infrastructures: “Churches are embedded in the community, they have the personnel oftentimes to facilitate these types of health programs, and most importantly, they have the established relationships with the community that brings about sustained changes,” Dr. Piatt said in her presentation.
Addressing diabetes education needs in urban, low-resource communities
The Praise Diabetes Project was a randomized, 33-month clinical trial conducted in 21 predominantly Black churches in Detroit; Flint, Mich.; and Toledo, Ohio, which are all urban, low-resource communities where diabetes is a significant public health problem, according to Dr. Piatt.
The study was designed to evaluate the relative effectiveness of three different approaches to diabetes self-management support at improving A1c and levels of diabetes distress, according to the investigators.
The churches were randomized to one of the support arms, including parish nurse plus peer leader support, parish nurse support by itself, or peer leader support by itself.
A total of 47 individuals were trained, including 31 peer leaders and 16 parish nurses.
All three interventions included an initial 6-month period of “enhanced usual care” during which biweekly newsletters that were distributed, according to Dr. Piatt. That was followed by 12 months of diabetes self-management support, and an additional 12 months of ongoing support facilitated by parish nurses and peer leaders on their own, without input from the research team or health care providers.
Participants in the program had to be at least 21 years old and under the care of a physician for their diabetes, according to Dr. Piatt. The parish nurses had to be registered nurses in Michigan or Ohio. Peer leaders had to be at least 21 years old, had at least an eighth-grade education, and had to commit to a 30-hour training program.
Peer leaders also had to be individuals living with diabetes: “Prior studies have found that, when peer leaders are actively working on their own self-management goals, they tend to be much more successful in helping others,” Dr. Piatt explained.
In addition to facilitating diabetes self-management education, the parish nurses and peer leaders in these interventions were responsible for recruitment, church announcements, room reservations, follow-up calls to participants, according to Dr. Piatt. Parish nurses also provided clinical content knowledge and supervised the peer leaders in the combined model.
Sustained reductions in A1c and diabetes distress
These diabetes self-management support approaches led to significant changes over time in A1c and diabetes distress, the primary outcomes of the study, Dr. Piatt said.
The peer leader support approach resulted in a statistically significant decline in A1c, from a mean of 8.0% at baseline to 7.7% at 33 months (P = .04), while nonsignificant declines were observed in the parish nurse and combined parish nurse–peer leader approach, according to the researcher.
Reductions in A1c persisted despite the COVID-19 pandemic, which began roughly 21 months into the study, she said.
Glycemic control remained steady over the course of the study, as illustrated by similar proportions of participants with A1c below 7% from baseline to 33 months, she added.
Sustained glycemic control was seen in all three groups, according to Dr. Piatt. For example, 42.7% of individuals in the parish nurse and peer leader support group achieved glycemic control following the intervention, and 88.5% of them sustained it at 33 months.
“I think this is one of the longest diabetes self-management education and diabetes self-management support interventions that’s out there right now, so we were so happy to see that sustained by glycemic control that far into the future,” she said.
Diabetes distress levels decreased steadily over time in all three groups, with declines that were statistically significant from baseline to 33 months in the parish nurse–only and peer leader–only groups, the investigator said.
The proportion of participants reporting moderate levels of diabetes distress dropped over time, especially in the peer leader support group, where there was a 50% reduction, she added.
Despite these findings, the study had limitations, according to Dr. Piatt, including some “burnout” that impacted participants, parish nurses, and peer leaders, especially after the pandemic started.
In addition, this type of intervention may have limited impact in the community at large: “We probably didn’t reach people who did not have good connection to the church,” Dr. Piatt said.
Dr. Piatt reported no conflicts of interest related to the research.
A church-based diabetes self-management support intervention that incorporated parish nurses and peer leaders is feasible and may help improve diabetes-related outcomes in participants.
Sustained reductions in hemoglobin A1c and diabetes distress were seen in the Praise Diabetes Project, a 33-month study that piloted several different approaches to parish nurse and peer leader support at 21 urban churches in Michigan and Ohio, said Gretchen Piatt, MPH, PhD, associate professor in the department of learning health sciences at the University of Michigan, Ann Arbor, reported at the annual scientific sessions of the American Diabetes Association.
“Of the participants who achieved glycemic control following diabetes self-management education, a really large proportion – upward of 77% of participants across all the groups– achieved sustained glycemic control at 33 months,” Dr. Piatt said.
Findings from this study has helped diabetes educators better understand how to design effective support approaches that may have a long-term impact on glycemic control and diabetes distress, Dr. Piatt said.
The Praise Diabetes Project represents a “very smart strategy” of leveraging institutions that already exist in the African American community that are trusted and provide emotional support, said Tracey D. Brown, CEO of the ADA.
“This is about behavior change, really, at its crux,” Ms. Brown said in an interview. “To get there, you’ve got to have trust, and you have to have an emotional connection. If you don’t get either one of those things, then you really are not going to do anything in terms of changing behavior.”
Long-term solutions needed
Many studies show that diabetes self-management education can improve clinical and psychosocial outcomes, and reduce health care utilization and cost, at least in the short term, Dr. Piatt said. However, it’s less clear how those improvements can be sustained over longer periods of time.
“This then presents a critical need to develop and evaluate diabetes self-management support models that are ongoing, patient driven, and embedded within existing community infrastructures,” Dr. Piatt said in her presentation.
Working with churches is one approach to working within existing community infrastructures: “Churches are embedded in the community, they have the personnel oftentimes to facilitate these types of health programs, and most importantly, they have the established relationships with the community that brings about sustained changes,” Dr. Piatt said in her presentation.
Addressing diabetes education needs in urban, low-resource communities
The Praise Diabetes Project was a randomized, 33-month clinical trial conducted in 21 predominantly Black churches in Detroit; Flint, Mich.; and Toledo, Ohio, which are all urban, low-resource communities where diabetes is a significant public health problem, according to Dr. Piatt.
The study was designed to evaluate the relative effectiveness of three different approaches to diabetes self-management support at improving A1c and levels of diabetes distress, according to the investigators.
The churches were randomized to one of the support arms, including parish nurse plus peer leader support, parish nurse support by itself, or peer leader support by itself.
A total of 47 individuals were trained, including 31 peer leaders and 16 parish nurses.
All three interventions included an initial 6-month period of “enhanced usual care” during which biweekly newsletters that were distributed, according to Dr. Piatt. That was followed by 12 months of diabetes self-management support, and an additional 12 months of ongoing support facilitated by parish nurses and peer leaders on their own, without input from the research team or health care providers.
Participants in the program had to be at least 21 years old and under the care of a physician for their diabetes, according to Dr. Piatt. The parish nurses had to be registered nurses in Michigan or Ohio. Peer leaders had to be at least 21 years old, had at least an eighth-grade education, and had to commit to a 30-hour training program.
Peer leaders also had to be individuals living with diabetes: “Prior studies have found that, when peer leaders are actively working on their own self-management goals, they tend to be much more successful in helping others,” Dr. Piatt explained.
In addition to facilitating diabetes self-management education, the parish nurses and peer leaders in these interventions were responsible for recruitment, church announcements, room reservations, follow-up calls to participants, according to Dr. Piatt. Parish nurses also provided clinical content knowledge and supervised the peer leaders in the combined model.
Sustained reductions in A1c and diabetes distress
These diabetes self-management support approaches led to significant changes over time in A1c and diabetes distress, the primary outcomes of the study, Dr. Piatt said.
The peer leader support approach resulted in a statistically significant decline in A1c, from a mean of 8.0% at baseline to 7.7% at 33 months (P = .04), while nonsignificant declines were observed in the parish nurse and combined parish nurse–peer leader approach, according to the researcher.
Reductions in A1c persisted despite the COVID-19 pandemic, which began roughly 21 months into the study, she said.
Glycemic control remained steady over the course of the study, as illustrated by similar proportions of participants with A1c below 7% from baseline to 33 months, she added.
Sustained glycemic control was seen in all three groups, according to Dr. Piatt. For example, 42.7% of individuals in the parish nurse and peer leader support group achieved glycemic control following the intervention, and 88.5% of them sustained it at 33 months.
“I think this is one of the longest diabetes self-management education and diabetes self-management support interventions that’s out there right now, so we were so happy to see that sustained by glycemic control that far into the future,” she said.
Diabetes distress levels decreased steadily over time in all three groups, with declines that were statistically significant from baseline to 33 months in the parish nurse–only and peer leader–only groups, the investigator said.
The proportion of participants reporting moderate levels of diabetes distress dropped over time, especially in the peer leader support group, where there was a 50% reduction, she added.
Despite these findings, the study had limitations, according to Dr. Piatt, including some “burnout” that impacted participants, parish nurses, and peer leaders, especially after the pandemic started.
In addition, this type of intervention may have limited impact in the community at large: “We probably didn’t reach people who did not have good connection to the church,” Dr. Piatt said.
Dr. Piatt reported no conflicts of interest related to the research.
FROM ADA 2020
Anti-VEGF injections for diabetic retinopathy linked to mortality risk
The use of anti–vascular endothelial growth factor injections has been linked to an increased risk of mortality in patients with diabetic retinopathy in a new study, sounding a note of caution regarding the cardiovascular safety of these agents in clinical practice, an investigator said.

There was no increased risk of MI or stroke risk associated with intravitreal anti-VEGF injections versus steroid injections or laser photocoagulation in the study, which was based on analysis of health records for more than 60,000 treated individuals.
However, a “signal” was observed for increased risk of death from any cause among patients receiving anti-VEGF injections, and especially so in those with a history of cardiovascular events, said investigator Miin Roh, MD, PhD, a retina surgeon and instructor in ophthalmology at Harvard Medical School, Boston.
“This study suggests that we would have to be very careful in giving anti-VEGF injections in patients for diabetic retinopathy, especially when you’re giving it for a long-term period,” Dr. Roh said in a virtual presentation at the annual scientific sessions of the American Diabetes Association.
Report of a mortality signal
The study by Dr. Roh and colleagues included patients with type 1 or 2 diabetes, identified in health claims databases who started intravitreal anti-VEGF injections, intravitreal steroid injections, or laser photocoagulation between 2009 and 2017.
Their analysis included 30,741 patients who received anti-VEGF injections and 30,741 matched controls who received laser or steroid treatment.
There were no differences in the primary composite outcome of MI or stroke, with 674 events in the anti-VEGF group and 708 events in the laser or steroid group over a 365-day treatment period, Dr. Roh reported.
By contrast, the investigator said she saw a signal for increased risk of all-cause mortality in analyses of secondary outcomes.
Over a 180-day treatment period, there was a “slight numerical increase” in all-cause mortality, with 144 deaths in the anti-VEGF group and 115 in the control group. That translated into a hazard ratio of 1.26 (95% confidence interval, 0.99-1.60).
Looking at a 365-day treatment period, there was an increase in all-cause mortality in the anti-VEGF group that this time was statistically significant, she said, with 311 and 236 events, respectively (HR, 1.32; 95% CI, 1.12-1.57).
The mortality signal was especially strong among individuals who had a prior history of a cardiovascular event, according to Dr. Roh.
In patients with cardiovascular disease history, there were 219 deaths from any cause in the anti-VEGF group and 153 in the laser or steroid group (HR, 1.44, 95% CI, 3.10-11.22) over a 365-day period, the investigator reported. By comparison, in patients with no cardiovascular disease history, there were 95 and 96 deaths (HR, 1.00; 95% CI, 0.75-1.33).
More research needed
Although these findings are “hypothesis generating,” exploration of other datasets would be warranted to measure mortality risk among patients receiving treatment for diabetic neuropathy, said Robert Gabbay, MD, PhD, chief scientific and medical officer of the ADA.
“It’s something that we need now to study more rigorously,” Dr. Gabbay said in an interview. “It doesn’t prove that there’s a connection, but it tells us that this is worth studying.”
The current study is not a randomized comparison, which means that the people chosen to receive anti-VEGF therapy, as opposed to steroid injections or laser treatment, may differ in other ways that are associated with mortality, he said.
“It’s always good to monitor these patients,” Dr. Gabbay added. “The good news is that these individuals typically are coming in, oftentimes monthly for repeated injections, and so there’s an opportunity to monitor any changes.”
Dr. Roh reported that she is a coinvestigator in a Boehringer Ingelheim–initiated study that is not directly related to the topic of this research.
The use of anti–vascular endothelial growth factor injections has been linked to an increased risk of mortality in patients with diabetic retinopathy in a new study, sounding a note of caution regarding the cardiovascular safety of these agents in clinical practice, an investigator said.
There was no increased risk of MI or stroke risk associated with intravitreal anti-VEGF injections versus steroid injections or laser photocoagulation in the study, which was based on analysis of health records for more than 60,000 treated individuals.
However, a “signal” was observed for increased risk of death from any cause among patients receiving anti-VEGF injections, and especially so in those with a history of cardiovascular events, said investigator Miin Roh, MD, PhD, a retina surgeon and instructor in ophthalmology at Harvard Medical School, Boston.
“This study suggests that we would have to be very careful in giving anti-VEGF injections in patients for diabetic retinopathy, especially when you’re giving it for a long-term period,” Dr. Roh said in a virtual presentation at the annual scientific sessions of the American Diabetes Association.
Report of a mortality signal
The study by Dr. Roh and colleagues included patients with type 1 or 2 diabetes, identified in health claims databases who started intravitreal anti-VEGF injections, intravitreal steroid injections, or laser photocoagulation between 2009 and 2017.
Their analysis included 30,741 patients who received anti-VEGF injections and 30,741 matched controls who received laser or steroid treatment.
There were no differences in the primary composite outcome of MI or stroke, with 674 events in the anti-VEGF group and 708 events in the laser or steroid group over a 365-day treatment period, Dr. Roh reported.
By contrast, the investigator said she saw a signal for increased risk of all-cause mortality in analyses of secondary outcomes.
Over a 180-day treatment period, there was a “slight numerical increase” in all-cause mortality, with 144 deaths in the anti-VEGF group and 115 in the control group. That translated into a hazard ratio of 1.26 (95% confidence interval, 0.99-1.60).
Looking at a 365-day treatment period, there was an increase in all-cause mortality in the anti-VEGF group that this time was statistically significant, she said, with 311 and 236 events, respectively (HR, 1.32; 95% CI, 1.12-1.57).
The mortality signal was especially strong among individuals who had a prior history of a cardiovascular event, according to Dr. Roh.
In patients with cardiovascular disease history, there were 219 deaths from any cause in the anti-VEGF group and 153 in the laser or steroid group (HR, 1.44, 95% CI, 3.10-11.22) over a 365-day period, the investigator reported. By comparison, in patients with no cardiovascular disease history, there were 95 and 96 deaths (HR, 1.00; 95% CI, 0.75-1.33).
More research needed
Although these findings are “hypothesis generating,” exploration of other datasets would be warranted to measure mortality risk among patients receiving treatment for diabetic neuropathy, said Robert Gabbay, MD, PhD, chief scientific and medical officer of the ADA.
“It’s something that we need now to study more rigorously,” Dr. Gabbay said in an interview. “It doesn’t prove that there’s a connection, but it tells us that this is worth studying.”
The current study is not a randomized comparison, which means that the people chosen to receive anti-VEGF therapy, as opposed to steroid injections or laser treatment, may differ in other ways that are associated with mortality, he said.
“It’s always good to monitor these patients,” Dr. Gabbay added. “The good news is that these individuals typically are coming in, oftentimes monthly for repeated injections, and so there’s an opportunity to monitor any changes.”
Dr. Roh reported that she is a coinvestigator in a Boehringer Ingelheim–initiated study that is not directly related to the topic of this research.
FROM ADA 2021
A pacemaker that 'just disappears' and a magnetic diet device
Ignore this pacemaker and it will go away
At some point – and now seems to be that point – we have to say enough is enough. The throwaway culture that produces phones, TVs, and computers that get tossed in the trash because they can’t be repaired has gone too far. That’s right, we’re looking at you, medical science!
This time, it’s a pacemaker that just disappears when it’s no longer needed. Some lazy heart surgeon decided that it was way too much trouble to do another surgery to remove the leads when a temporary pacemaker was no longer needed. You know the type: “It sure would be nice if the pacemaker components were biocompatible and were naturally absorbed by the body over the course of a few weeks and wouldn’t need to be surgically extracted.” Slacker.
Well, get a load of this. Researchers at Northwestern and George Washington universities say that they have come up with a transient pacemaker that “harvests energy from an external, remote antenna using near-field communication protocols – the same technology used in smartphones for electronic payments and in RFID tags.”
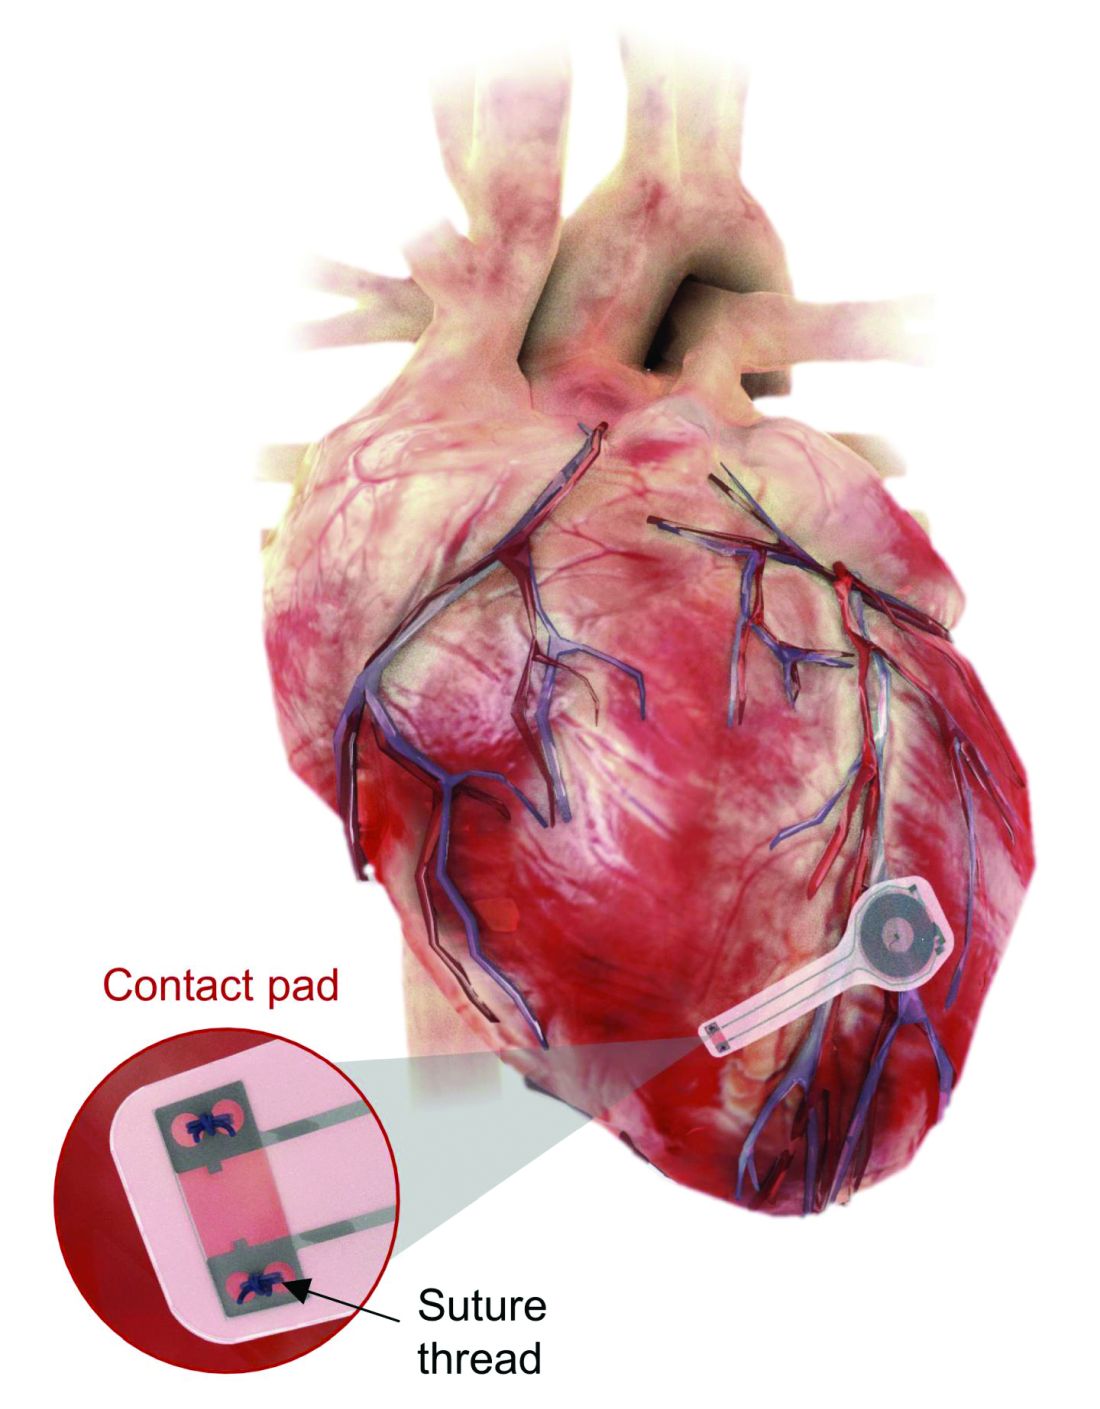
That means no batteries and no wires that have to be removed and can cause infections. Because the infectious disease docs also are too lazy to do their jobs, apparently.
The lack of onboard infrastructure means that the device can be very small – it weighs less than half a gram and is only 250 microns thick. And yes, it is bioresorbable and completely harmless. It fully degrades and disappears in 5-7 weeks through the body’s natural biologic processes, “thereby avoiding the need for physical removal of the pacemaker electrodes. This is potentially a major victory for postoperative patients,” said Dr. Rishi Arora, one of the investigators.
A victory for patients, he says. Not a word about the time and effort saved by the surgeons. Typical.
It’s a mask! No, it’s a COVID-19 test!
Mask wearing has gotten more lax as people get vaccinated for COVID-19, but as wearing masks for virus prevention is becoming more normalized in western society, some saw an opportunity to make them work for diagnosis.
Researchers from the Massachusetts Institute of Technology and the Wyss Institute for Biologically Inspired Engineering at Harvard University have found a way to do just that with their wearable freeze-dried cell-free (wFDCF) technology. A single push of a button releases water from a reservoir in the mask that sequentially activates three different freeze-dried biological reactions, which detect the SARS-CoV-2 virus in the wearer’s breath.
Initially meant as a tool for the Zika outbreak in 2015, the team made a quick pivot in May 2020. But this isn’t just some run-of-the-mill, at-home test. The data prove that the wFDCF mask is comparable to polymerase chain reactions tests, the standard in COVID-19 detection. Plus there aren’t any extra factors to deal with, like room or instrument temperature to ensure accuracy. In just 90 minutes, the mask gives results on a readout in a way similar to that of a pregnancy test. Voilà! To have COVID-19 or not to have COVID-19 is an easily answered question.

At LOTME, we think this is a big improvement from having dogs, or even three-foot rats, sniffing out coronavirus.
But wait, there’s more. “In addition to face masks, our programmable biosensors can be integrated into other garments to provide on-the-go detection of dangerous substances including viruses, bacteria, toxins, and chemical agents,” said Peter Nguyen, PhD, study coauthor and research scientist at the Wyss Institute. The technology can be used on lab coats, scrubs, military uniforms, and uniforms of first responders who may come in contact with hazardous pathogens and toxins. Think of all the lives saved and possible avoidances.
If only it could diagnose bad breath.
Finally, an excuse for the all-beer diet
Weight loss is hard work. Extremely hard work, and, as evidenced by the constant inundation and advertisement of quick fixes, crash diets, and expensive gym memberships, there’s not really a solid, 100% solution to the issue. Until now, thanks to a team of doctors from New Zealand, who’ve decided that the best way to combat obesity is to leave you in constant agony.
The DentalSlim Diet Control device is certainly a radical yet comically logical attempt to combat obesity. The creators say that the biggest problem with dieting is compliance, and, well, it’s difficult to eat too much if you can’t actually open your mouth. The metal contraption is mounted onto your teeth and uses magnetic locks to prevent the user from opening their mouths more than 2 mm. That’s less than a tenth of an inch. Which is not a lot. So not a lot that essentially all you can consume is liquid.
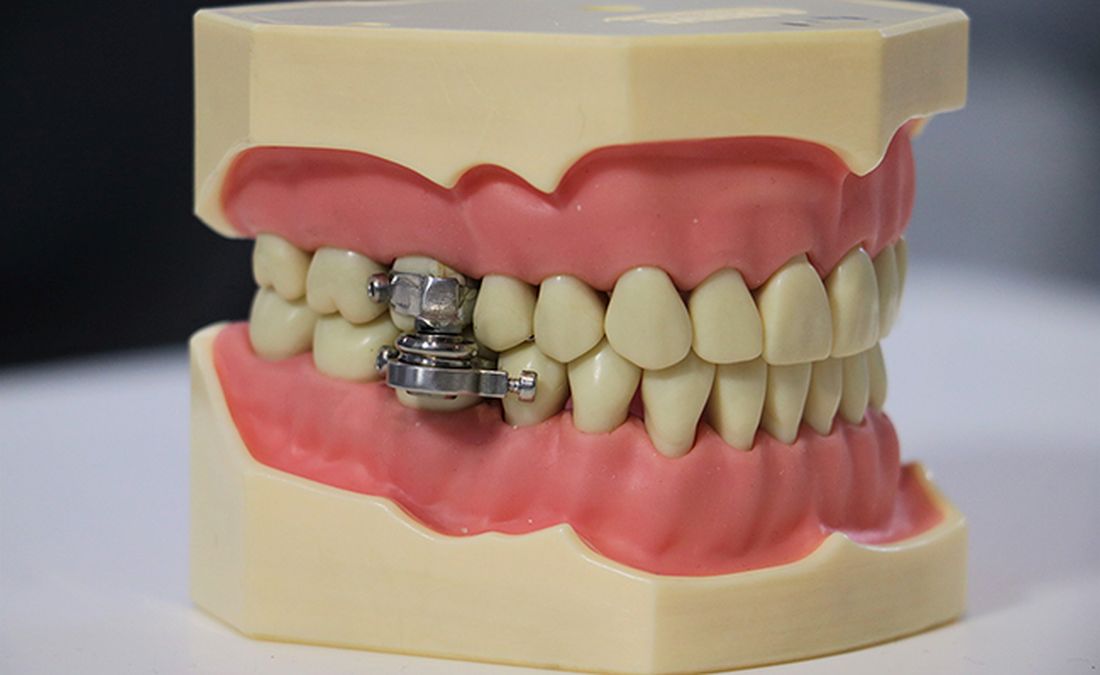
Oh, and they’ve got results to back up their madness. In a small study, seven otherwise healthy obese women lost an average of 5.1% of their body weight after using the DentalSlim for 2 weeks, though they did complain that the device was difficult to use, caused discomfort and difficulty speaking, made them more tense, and in general made life “less satisfying.” And one participant was able to cheat the system and consume nonhealthy food like chocolate by melting it.
So, there you are, if you want a weight-loss solution that tortures you and has far bigger holes than the one it leaves for your mouth, try the DentalSlim. Or, you know, don’t eat that eighth slice of pizza and maybe go for a walk later. Your choice.
Ignore this pacemaker and it will go away
At some point – and now seems to be that point – we have to say enough is enough. The throwaway culture that produces phones, TVs, and computers that get tossed in the trash because they can’t be repaired has gone too far. That’s right, we’re looking at you, medical science!
This time, it’s a pacemaker that just disappears when it’s no longer needed. Some lazy heart surgeon decided that it was way too much trouble to do another surgery to remove the leads when a temporary pacemaker was no longer needed. You know the type: “It sure would be nice if the pacemaker components were biocompatible and were naturally absorbed by the body over the course of a few weeks and wouldn’t need to be surgically extracted.” Slacker.
Well, get a load of this. Researchers at Northwestern and George Washington universities say that they have come up with a transient pacemaker that “harvests energy from an external, remote antenna using near-field communication protocols – the same technology used in smartphones for electronic payments and in RFID tags.”
That means no batteries and no wires that have to be removed and can cause infections. Because the infectious disease docs also are too lazy to do their jobs, apparently.
The lack of onboard infrastructure means that the device can be very small – it weighs less than half a gram and is only 250 microns thick. And yes, it is bioresorbable and completely harmless. It fully degrades and disappears in 5-7 weeks through the body’s natural biologic processes, “thereby avoiding the need for physical removal of the pacemaker electrodes. This is potentially a major victory for postoperative patients,” said Dr. Rishi Arora, one of the investigators.
A victory for patients, he says. Not a word about the time and effort saved by the surgeons. Typical.
It’s a mask! No, it’s a COVID-19 test!
Mask wearing has gotten more lax as people get vaccinated for COVID-19, but as wearing masks for virus prevention is becoming more normalized in western society, some saw an opportunity to make them work for diagnosis.
Researchers from the Massachusetts Institute of Technology and the Wyss Institute for Biologically Inspired Engineering at Harvard University have found a way to do just that with their wearable freeze-dried cell-free (wFDCF) technology. A single push of a button releases water from a reservoir in the mask that sequentially activates three different freeze-dried biological reactions, which detect the SARS-CoV-2 virus in the wearer’s breath.
Initially meant as a tool for the Zika outbreak in 2015, the team made a quick pivot in May 2020. But this isn’t just some run-of-the-mill, at-home test. The data prove that the wFDCF mask is comparable to polymerase chain reactions tests, the standard in COVID-19 detection. Plus there aren’t any extra factors to deal with, like room or instrument temperature to ensure accuracy. In just 90 minutes, the mask gives results on a readout in a way similar to that of a pregnancy test. Voilà! To have COVID-19 or not to have COVID-19 is an easily answered question.
At LOTME, we think this is a big improvement from having dogs, or even three-foot rats, sniffing out coronavirus.
But wait, there’s more. “In addition to face masks, our programmable biosensors can be integrated into other garments to provide on-the-go detection of dangerous substances including viruses, bacteria, toxins, and chemical agents,” said Peter Nguyen, PhD, study coauthor and research scientist at the Wyss Institute. The technology can be used on lab coats, scrubs, military uniforms, and uniforms of first responders who may come in contact with hazardous pathogens and toxins. Think of all the lives saved and possible avoidances.
If only it could diagnose bad breath.
Finally, an excuse for the all-beer diet
Weight loss is hard work. Extremely hard work, and, as evidenced by the constant inundation and advertisement of quick fixes, crash diets, and expensive gym memberships, there’s not really a solid, 100% solution to the issue. Until now, thanks to a team of doctors from New Zealand, who’ve decided that the best way to combat obesity is to leave you in constant agony.
The DentalSlim Diet Control device is certainly a radical yet comically logical attempt to combat obesity. The creators say that the biggest problem with dieting is compliance, and, well, it’s difficult to eat too much if you can’t actually open your mouth. The metal contraption is mounted onto your teeth and uses magnetic locks to prevent the user from opening their mouths more than 2 mm. That’s less than a tenth of an inch. Which is not a lot. So not a lot that essentially all you can consume is liquid.
Oh, and they’ve got results to back up their madness. In a small study, seven otherwise healthy obese women lost an average of 5.1% of their body weight after using the DentalSlim for 2 weeks, though they did complain that the device was difficult to use, caused discomfort and difficulty speaking, made them more tense, and in general made life “less satisfying.” And one participant was able to cheat the system and consume nonhealthy food like chocolate by melting it.
So, there you are, if you want a weight-loss solution that tortures you and has far bigger holes than the one it leaves for your mouth, try the DentalSlim. Or, you know, don’t eat that eighth slice of pizza and maybe go for a walk later. Your choice.