User login
Multiethnic Training in Residency: A Survey of Dermatology Residents
Dermatologic treatment of patients with skin of color offers specific challenges. Studies have reported structural, morphologic, and physiologic distinctions among different ethnic groups,1 which may account for distinct clinical presentations of skin disease seen in patients with skin of color. Patients with skin of color are at increased risk for specific dermatologic conditions, such as postinflammatory hyperpigmentation, keloid development, and central centrifugal cicatricial alopecia.2,3 Furthermore, although skin cancer is less prevalent in patients with skin of color, it often presents at a more advanced stage and with a worse prognosis compared to white patients.4
Prior studies have demonstrated the need for increased exposure, education, and training in diseases pertaining to skin of color in US dermatology residency programs.6-8 The aim of this study was to assess if dermatologists in-training feel that their residency curriculum sufficiently educates them on the needs of patients with skin of color.
Methods
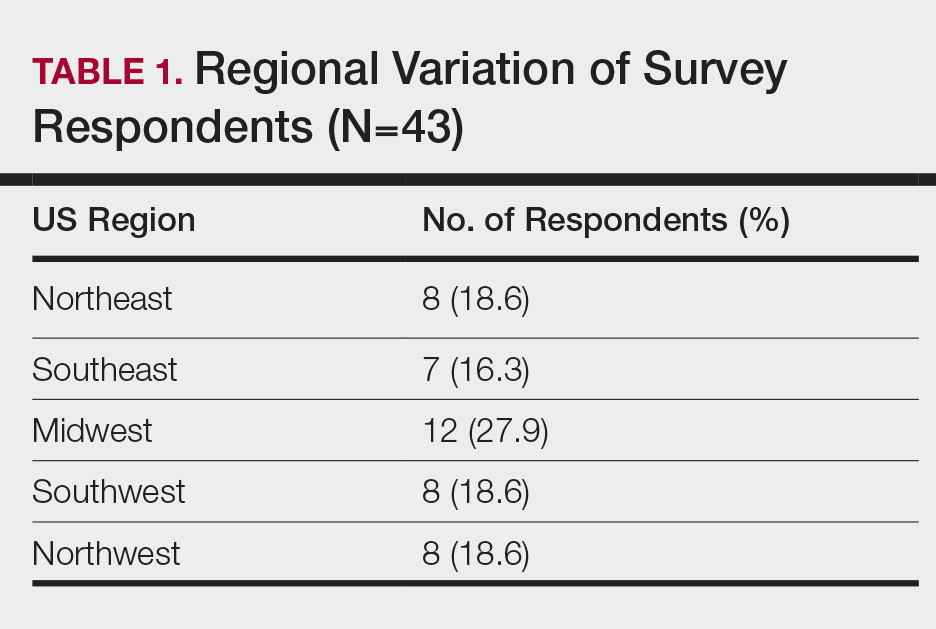
A 10-question anonymous survey was emailed to 109 dermatology residency programs to evaluate the attitudes of dermatology residents about their exposure to patients with skin of color and their skin-of-color curriculum. The study included individuals 18 years or older who were current residents in a dermatology program accredited by the Accreditation Council for Graduate Medical Education.
Results
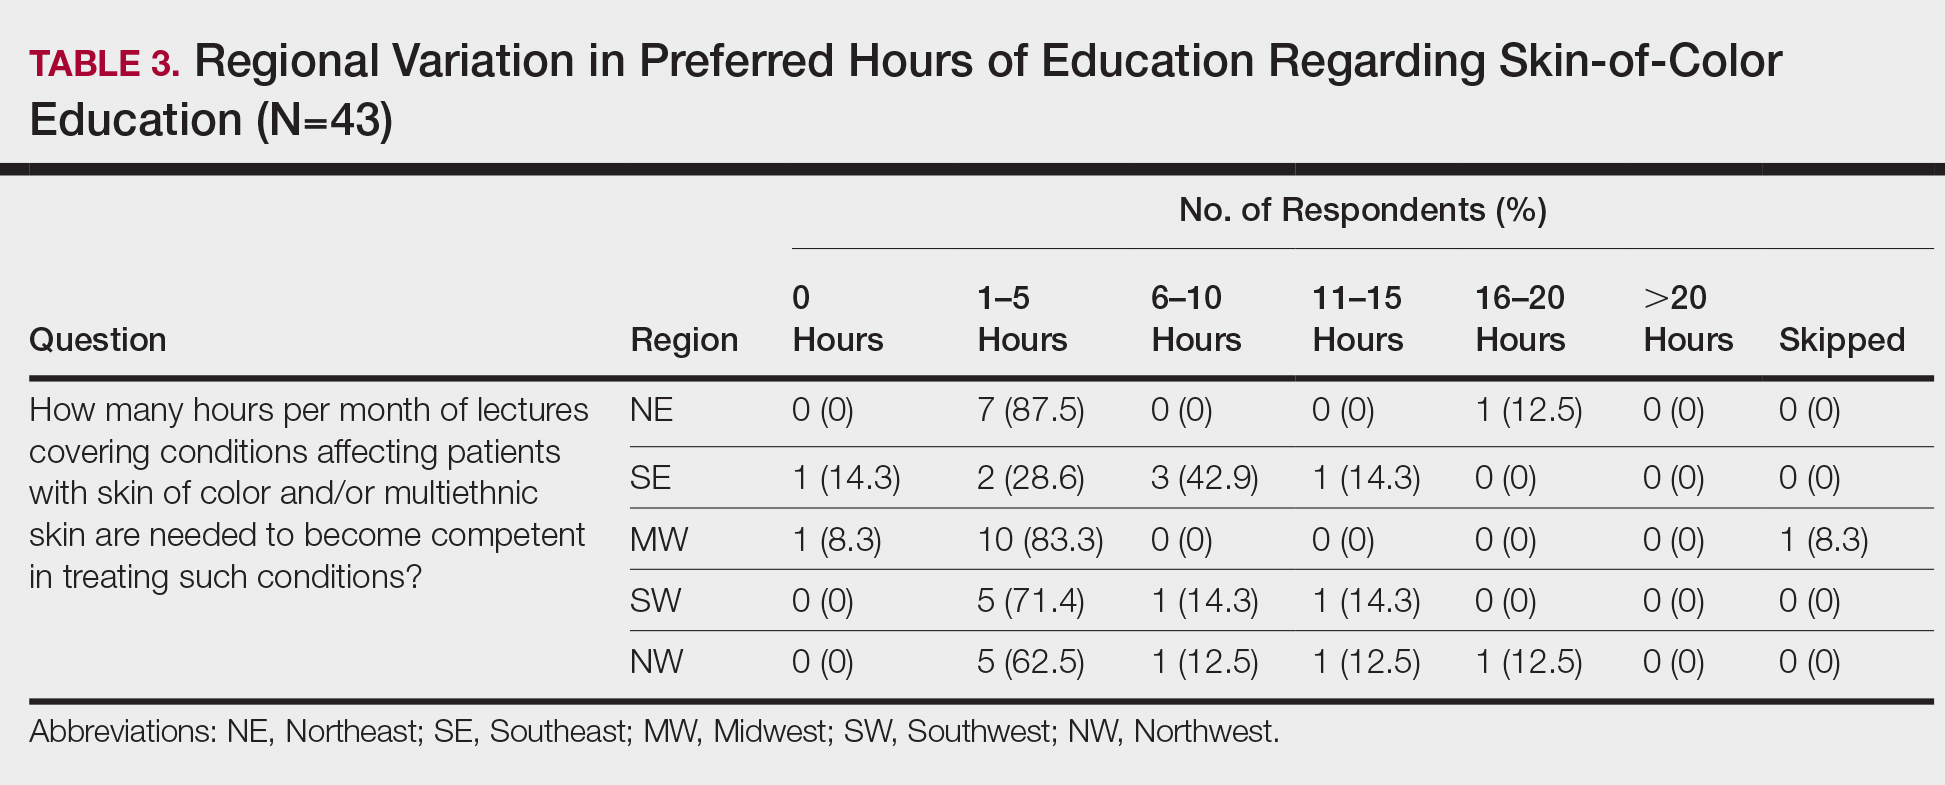
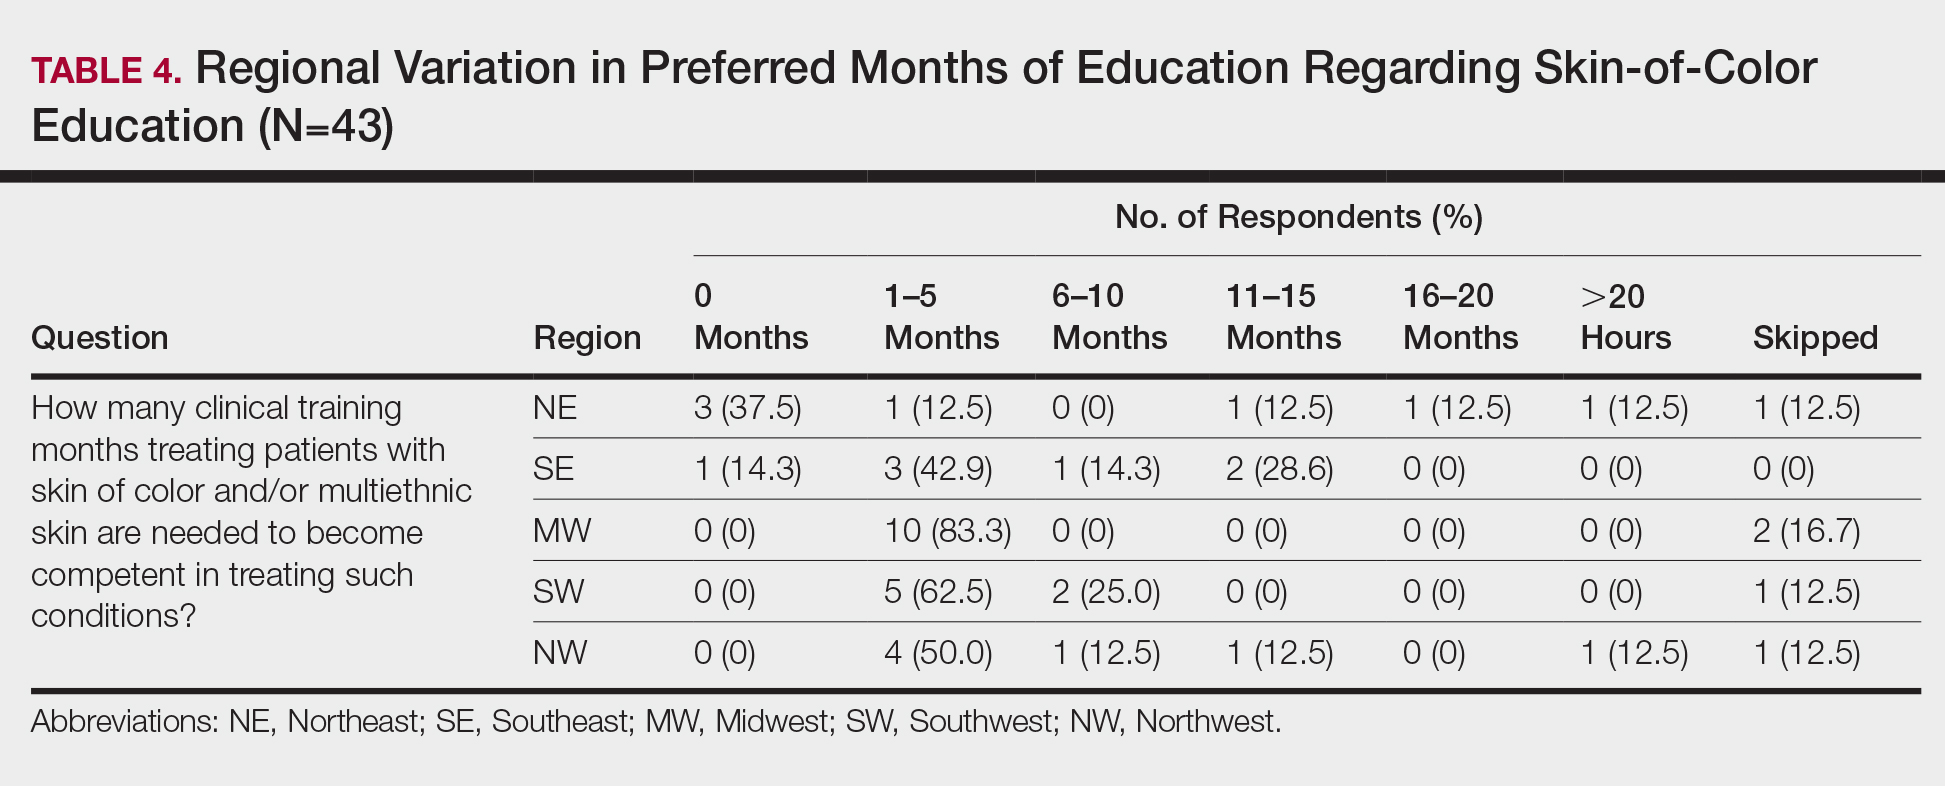
When asked the number of hours of lecture per month necessary to gain competence in conditions affecting patients with skin of color, 67% agreed that 1 to 5 hours was sufficient (Table 3). There were significant differences in the responses between the NE and SE (P=.024) and the SE and MW (P=.007). Of all respondents, 53% reported 1 to 5 months of clinical training are needed to gain competence in treating conditions affecting patients with skin of color, with significant differences in responses between the NE and MW (P<.001), the NE and SW (P=.019), and the SE and MW (P=.015)(Table 4).
Comment
Responses varied by practicing region
Although interactive lectures and textbook readings are important for obtaining a foundational understanding of dermatologic disease, they cannot substitute for clinical interactions and hands-on experience treating patients with skin of color.9 Not only do clinical interactions encourage independent reading and the study of encountered diagnoses, but intercommunication with patients may have a more profound and lasting impact on residents’ education.
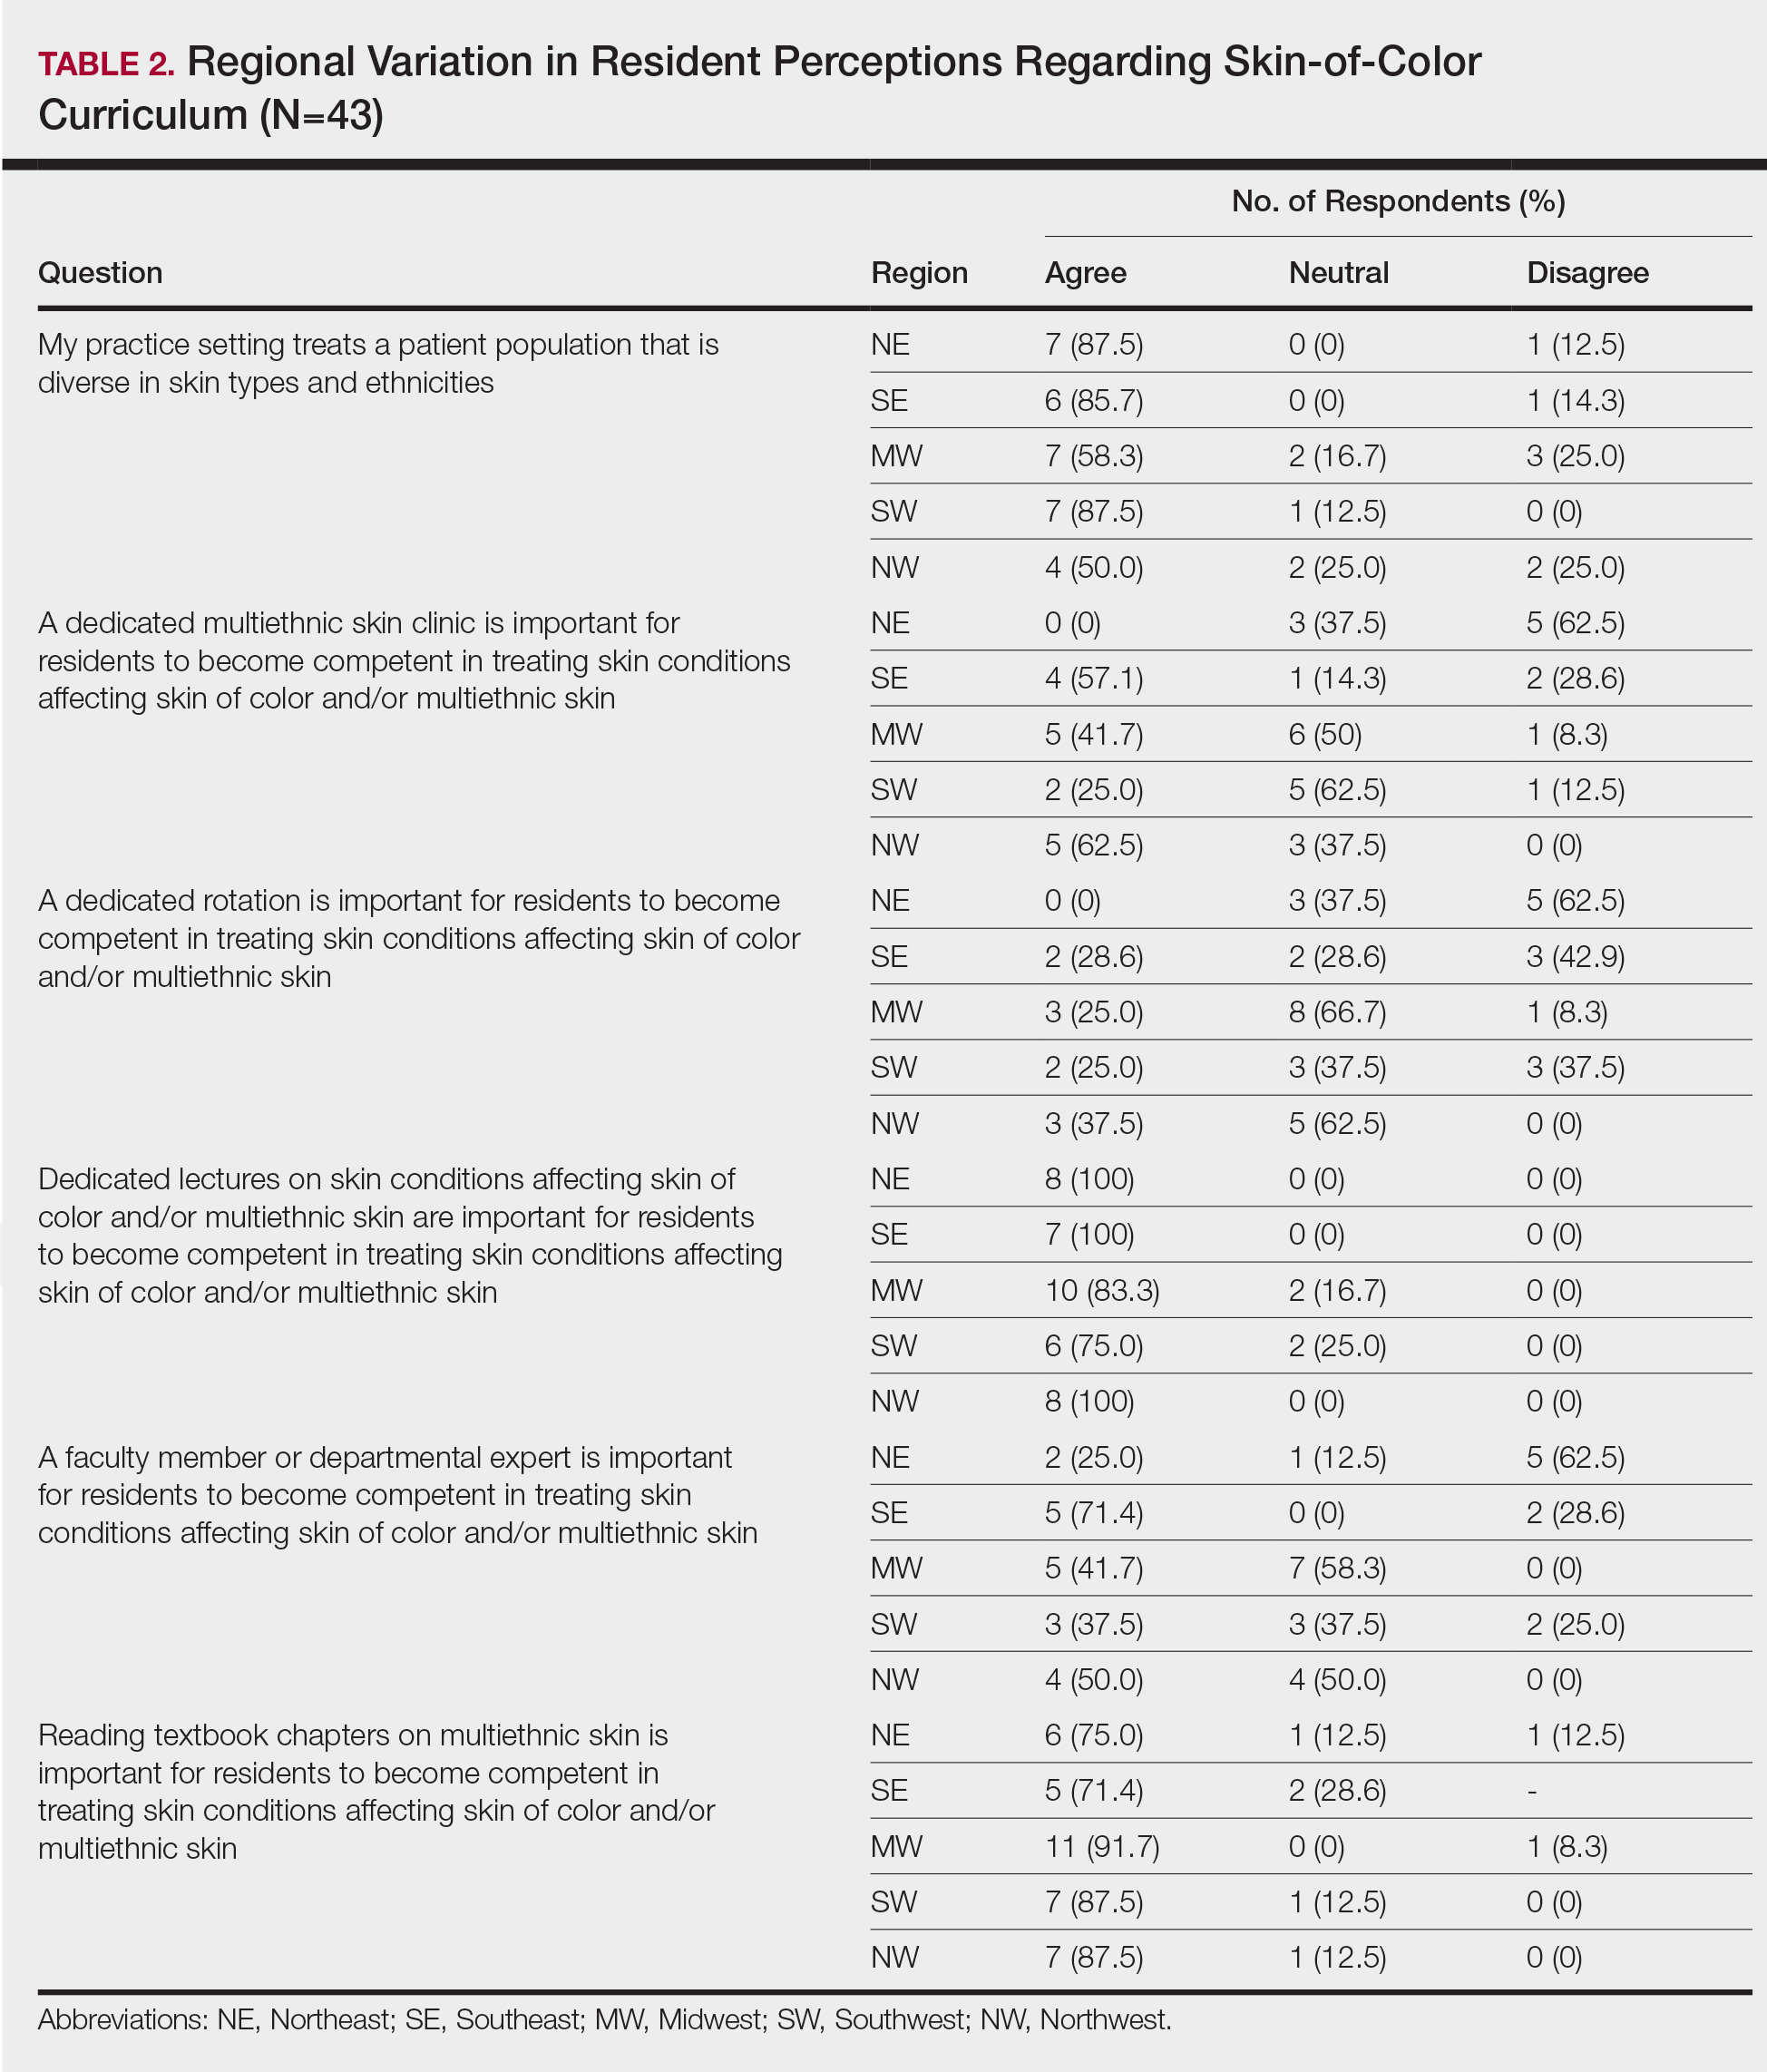
Different regions of the United States have varying distributions of patients with skin of color, and dermatology residency program training reflects these disparities.6 In areas of less diversity, dermatology residents examine, diagnose, and treat substantially fewer patients with skin of color. The desire for more diverse training supports the prior findings of Nijhawan et al6 and is reflected in the responses we received in our study, whereby residents from the less ethnically diversified regions of the MW and NW were more likely to agree that clinics and rotations were necessary for training in preparation to sufficiently address the needs of patients with skin of color.
One way to compensate for the lack of ethnic diversity encountered in areas such as the MW and NW would be to develop educational programs featuring experts on skin of color.6 These specialists would not only train dermatology residents in areas of the country currently lacking ethnic diversity but also expand the expertise for treating patients with skin of color. Additionally, dedicated multiethnic skin clinics and externships devoted solely to treating patients with skin of color could be encouraged for residency training.6 Finally, community outreach through volunteer clinics may provide residents exposure to patients with skin of color seeking dermatologic care.10
This study was limited by the small number of respondents, but we were able to extract important trends and data from the collected responses. It is possible that respondents felt strongly about topics involving patients with skin of color, and the results were skewed to reflect individual bias. Additional limitations included not asking respondents for program names and population density (eg, urban, suburban, rural). Future studies should be directed toward analyzing how the diversity of the local population influences training in patients with skin of color, comparing program directors’ perceptions with residents’ perceptions on training in skin of color, and assessing patient perception of residents’ training in skin of color.
Conclusion
In the last decade it has become increasingly apparent that the US population is diversifying and that patients with skin of color will comprise a substantial proportion of the future population,8,11 which emphasizes the need for dermatology residency programs to ensure that residents receive adequate training and exposure to patients with skin of color as well as the distinct skin diseases seen more commonly in these populations.12
- Luther N, Darvin ME, Sterry W, et al. Ethnic differences in skin physiology, hair follicle morphology and follicular penetration. Skin Pharmacol Physiol. 2012;25:182-191.
- Shokeen D. Postinflammatory hyperpigmentation in patients with skin of color. Cutis. 2016;97:E9-E11.
- Lawson CN, Hollinger J, Sethi S, et al. Updates in the understanding and treatments of skin & hair disorders in women of color. Int J Women’s Dermatol. 2017;3:S21-S37.
- Hu S, Parmet Y, Allen G, et al. Disparity in melanoma: a trend analysis of melanoma incidence and stage at diagnosis among whites, Hispanics, and blacks in Florida. Arch Dermatol. 2009;145:1369-1374.
- Colby SL, Ortman JM; US Census Bureau. Projections of the Size and Composition of the U.S. Population: 2014 to 2060. Washington, DC: US Census Bureau; 2014. Current Population Reports, P25-1143. https://census.gov/content/dam/Census/library/publications/2015/demo/p25-1143.pdf. Published March 2015. Accessed May 13, 2020.
- Nijhawan RI, Jacob SE, Woolery-Lloyd H. Skin of color education in dermatology residency programs: does residency training reflect the changing demographics of the United States? J Am Acad Dermatol. 2008;59:615-618.
- Pritchett EN, Pandya AG, Ferguson NN, et al. Diversity in dermatology: roadmap for improvement. J Am Acad Dermatol. 2018;79:337-341.
- Pandya AG, Alexis AF, Berger TG, et al. Increasing racial and ethnic diversity in dermatology: a call to action. J Am Acad Dermatol. 2016;74:584-587.
- Ernst H, Colthorpe K. The efficacy of interactive lecturing for students with diverse science backgrounds. Adv Physiol Educ. 2007;31:41-44.
- Allday E. UCSF opens ‘skin of color’ dermatology clinic to address disparity in care. San Francisco Chronicle. March 20, 2019. https://www.sfchronicle.com/health/article/UCSF-opens-skin-of-color-dermatology-clinic-13704387.php. Accessed May 13, 2020.
- Van Voorhees AS, Enos CW. Diversity in dermatology residency programs. J Investig Dermatol Symp Proc. 2017;18:S46-S49.
- Enos CW, Harvey VM. From bench to bedside: the Hampton University Skin of Color Research Institute 2015 Skin of Color Symposium. J Investig Dermatol Symp Proc. 2017;18:S29-S30.
Dermatologic treatment of patients with skin of color offers specific challenges. Studies have reported structural, morphologic, and physiologic distinctions among different ethnic groups,1 which may account for distinct clinical presentations of skin disease seen in patients with skin of color. Patients with skin of color are at increased risk for specific dermatologic conditions, such as postinflammatory hyperpigmentation, keloid development, and central centrifugal cicatricial alopecia.2,3 Furthermore, although skin cancer is less prevalent in patients with skin of color, it often presents at a more advanced stage and with a worse prognosis compared to white patients.4
Prior studies have demonstrated the need for increased exposure, education, and training in diseases pertaining to skin of color in US dermatology residency programs.6-8 The aim of this study was to assess if dermatologists in-training feel that their residency curriculum sufficiently educates them on the needs of patients with skin of color.
Methods
A 10-question anonymous survey was emailed to 109 dermatology residency programs to evaluate the attitudes of dermatology residents about their exposure to patients with skin of color and their skin-of-color curriculum. The study included individuals 18 years or older who were current residents in a dermatology program accredited by the Accreditation Council for Graduate Medical Education.
Results
When asked the number of hours of lecture per month necessary to gain competence in conditions affecting patients with skin of color, 67% agreed that 1 to 5 hours was sufficient (Table 3). There were significant differences in the responses between the NE and SE (P=.024) and the SE and MW (P=.007). Of all respondents, 53% reported 1 to 5 months of clinical training are needed to gain competence in treating conditions affecting patients with skin of color, with significant differences in responses between the NE and MW (P<.001), the NE and SW (P=.019), and the SE and MW (P=.015)(Table 4).
Comment
Responses varied by practicing region
Although interactive lectures and textbook readings are important for obtaining a foundational understanding of dermatologic disease, they cannot substitute for clinical interactions and hands-on experience treating patients with skin of color.9 Not only do clinical interactions encourage independent reading and the study of encountered diagnoses, but intercommunication with patients may have a more profound and lasting impact on residents’ education.
Different regions of the United States have varying distributions of patients with skin of color, and dermatology residency program training reflects these disparities.6 In areas of less diversity, dermatology residents examine, diagnose, and treat substantially fewer patients with skin of color. The desire for more diverse training supports the prior findings of Nijhawan et al6 and is reflected in the responses we received in our study, whereby residents from the less ethnically diversified regions of the MW and NW were more likely to agree that clinics and rotations were necessary for training in preparation to sufficiently address the needs of patients with skin of color.
One way to compensate for the lack of ethnic diversity encountered in areas such as the MW and NW would be to develop educational programs featuring experts on skin of color.6 These specialists would not only train dermatology residents in areas of the country currently lacking ethnic diversity but also expand the expertise for treating patients with skin of color. Additionally, dedicated multiethnic skin clinics and externships devoted solely to treating patients with skin of color could be encouraged for residency training.6 Finally, community outreach through volunteer clinics may provide residents exposure to patients with skin of color seeking dermatologic care.10
This study was limited by the small number of respondents, but we were able to extract important trends and data from the collected responses. It is possible that respondents felt strongly about topics involving patients with skin of color, and the results were skewed to reflect individual bias. Additional limitations included not asking respondents for program names and population density (eg, urban, suburban, rural). Future studies should be directed toward analyzing how the diversity of the local population influences training in patients with skin of color, comparing program directors’ perceptions with residents’ perceptions on training in skin of color, and assessing patient perception of residents’ training in skin of color.
Conclusion
In the last decade it has become increasingly apparent that the US population is diversifying and that patients with skin of color will comprise a substantial proportion of the future population,8,11 which emphasizes the need for dermatology residency programs to ensure that residents receive adequate training and exposure to patients with skin of color as well as the distinct skin diseases seen more commonly in these populations.12
- Luther N, Darvin ME, Sterry W, et al. Ethnic differences in skin physiology, hair follicle morphology and follicular penetration. Skin Pharmacol Physiol. 2012;25:182-191.
- Shokeen D. Postinflammatory hyperpigmentation in patients with skin of color. Cutis. 2016;97:E9-E11.
- Lawson CN, Hollinger J, Sethi S, et al. Updates in the understanding and treatments of skin & hair disorders in women of color. Int J Women’s Dermatol. 2017;3:S21-S37.
- Hu S, Parmet Y, Allen G, et al. Disparity in melanoma: a trend analysis of melanoma incidence and stage at diagnosis among whites, Hispanics, and blacks in Florida. Arch Dermatol. 2009;145:1369-1374.
- Colby SL, Ortman JM; US Census Bureau. Projections of the Size and Composition of the U.S. Population: 2014 to 2060. Washington, DC: US Census Bureau; 2014. Current Population Reports, P25-1143. https://census.gov/content/dam/Census/library/publications/2015/demo/p25-1143.pdf. Published March 2015. Accessed May 13, 2020.
- Nijhawan RI, Jacob SE, Woolery-Lloyd H. Skin of color education in dermatology residency programs: does residency training reflect the changing demographics of the United States? J Am Acad Dermatol. 2008;59:615-618.
- Pritchett EN, Pandya AG, Ferguson NN, et al. Diversity in dermatology: roadmap for improvement. J Am Acad Dermatol. 2018;79:337-341.
- Pandya AG, Alexis AF, Berger TG, et al. Increasing racial and ethnic diversity in dermatology: a call to action. J Am Acad Dermatol. 2016;74:584-587.
- Ernst H, Colthorpe K. The efficacy of interactive lecturing for students with diverse science backgrounds. Adv Physiol Educ. 2007;31:41-44.
- Allday E. UCSF opens ‘skin of color’ dermatology clinic to address disparity in care. San Francisco Chronicle. March 20, 2019. https://www.sfchronicle.com/health/article/UCSF-opens-skin-of-color-dermatology-clinic-13704387.php. Accessed May 13, 2020.
- Van Voorhees AS, Enos CW. Diversity in dermatology residency programs. J Investig Dermatol Symp Proc. 2017;18:S46-S49.
- Enos CW, Harvey VM. From bench to bedside: the Hampton University Skin of Color Research Institute 2015 Skin of Color Symposium. J Investig Dermatol Symp Proc. 2017;18:S29-S30.
Practice Points
- To treat the ever-changing demographics of patients in the United States, dermatologists must receive adequate exposure and education regarding dermatologic conditions in patients from various ethnic backgrounds.
- Dermatology residents from less diverse regions are more likely to agree that dedicated clinics and rotations are important to gain competence compared to those from more diverse regions.
- In areas with less diversity, dedicated multiethnic skin clinics and faculty may be more important for assuring an adequate residency experience.
Intensive Care Unit Utilization After Adoption of a Ward-Based High-Flow Nasal Cannula Protocol
Children hospitalized for bronchiolitis frequently require admission to the intensive care unit (ICU), with estimates as high as 18%1,2 and 35%3 in two prospective, multicenter studies. The indication for ICU admission is nearly always a need for advanced respiratory support, which historically consisted of continuous or bilevel positive airway pressure (CPAP and BiPAP, respectively) or mechanical ventilation. High-flow nasal cannula (HFNC) is a recent addition to the respiratory support armamentarium, delivering heated and humidified oxygen at rates of up to 60 L/min and allowing for clinicians to titrate both flow rate and fraction of inspired oxygen (FiO2).4
Several studies have demonstrated that HFNC is capable of decreasing a child’s work of breathing,5-8 and it has the potential advantage of being better tolerated than other forms of advanced respiratory support.9,10 These case-series physiologic studies informed early ward-based HFNC protocols for bronchiolitis, which were adopted to decrease ICU utilization. Since then, single center observational studies examining the association between ward-based HFNC protocols and subsequent ICU utilization have come to discordant conclusions.11-14 Studying the effect of employing HFNC outside of the ICU is challenging in the context of a randomized, controlled trial (RCT) because it is difficult to blind healthcare providers to the intervention and because crossover from the control group to HFNC is frequent. Two unblinded RCTs published in 2017 and 2018 found that children randomized to conventional nasal cannula were frequently escalated to HFNC (flow rates of 1-2 L/kg per minute), but neither trial found a difference in ICU admission.15,16 Sample sizes substantially larger than those present in currently published or registered RCTs would be required to evaluate the impact of ward-based HFNC protocols on the outcome that inspired the protocols in the first place, namely ICU utilization.17
Children’s hospitals have adopted ward-based HFNC protocols at different time points over the last decade, which allows for a natural experiment—a promising alternative study design that avoids the challenges of blinding, crossover, and modest sample sizes. In order to have sufficient postadoption data for analyses, the present study is limited to ward-based HFNC protocols adopted prior to 2016, which we have termed “early” ward-based HFNC protocols. Among children with bronchiolitis, our objective was to measure the association between hospital-level adoption of a ward-based HFNC protocol and subsequent ICU utilization, using a multicenter network of children’s hospitals.
METHODS
We conducted a multicenter retrospective cohort study using the Pediatric Health Information System (PHIS) database. The PHIS database is operated by the Children’s Hospital Association (Lenexa, Kansas) and provides deidentified patient-level information for children who receive hospital care at 55 US children’s hospitals. Available data elements include patient demographic data, discharge diagnosis and procedure codes, and detailed billing information, such as laboratory, imaging, pharmacy, and supply charges. At the patient level, the use of HFNC vs standard oxygen therapy circuits cannot be discriminated.
Exposure
The study exposure was a hospital’s first ward-based HFNC protocol, with adoption measured at the hospital level at each PHIS site via direct communication with leaders in hospital medicine. In most cases, first contact was made with the pediatric hospital medicine division chief or fellowship program director, who then, if necessary, connected study investigators to local HFNC champions aware of site-specific historical HFNC protocol details. Contact with a hospital was made only if the hospital had contributed at least 6 consecutive years of data to PHIS. Hospitals were classified as “adopting” hospitals if their HFNC protocol met all of the following criteria: (a) allows initiation of HFNC outside of the ICU (on the floor or in the ED), (b) allows continued care outside of the ICU (on the floor), (c) not limited to a small unit like an intermediate care unit, and (d) adopted during a specific, known respiratory season. Hospitals for which ward-based HFNC protocols were adopted but did not meet these criteria were excluded from further analysis. Our intent was to identify large scale, programmatic protocol launches and exclude hospitals with exceptions that might preclude a sizable portion of our cohort from being eligible for the protocol. Hospitals for which inpatient use of HFNC remains limited to the ICU were defined as “nonadopting” hospitals. Respondents at adopting hospitals were asked to share details about their protocol, including patient eligibility criteria and maximum HFNC rates of flow permitted outside of the ICU.
Patient Characteristics
Patients aged 3 to 24 months who were hospitalized at adopting and nonadopting hospitals were included if an International Classification of Diseases, Ninth Revision (ICD-9) discharge diagnosis code for bronchiolitis (466.XX) was present in any position (not limited to a primary diagnosis). The lower age limit of 3 months was chosen to match the most restrictive age eligibility criteria of provided HFNC protocols (Appendix 1). A crosswalk available from the Centers for Medicare & Medicaid Services18 was used to convert ICD-10 diagnosis and procedure codes from recent years to ICD-9 diagnosis and procedure codes. Patients were excluded if their encounter contained a diagnosis or procedure code signifying a complex chronic condition,19 if their hospitalization involved care in the neonatal ICU, or if their admission date occurred outside of the respiratory season. Respiratory season was defined as November 1 through April 30.
Outcomes
Outcomes were measured during three respiratory seasons leading up to adoption and during three respiratory seasons after adoption. The primary outcome was ICU utilization, including the proportion of patients admitted to the ICU and ICU length of stay, expressed as ICU days per 100 patients. Secondary outcomes included mean total length of stay and the proportion of patients who received mechanical ventilation. Lengths of stay were measured in days, the most granular unit of time provided in PHIS over the entire study period. As such, partial days of care are rounded up to 1 full day. A previously published strict definition for mechanical ventilation that limits false positives was used, requiring that patients have a procedure or supply code for mechanical ventilation and a pharmacy charge for a neuromuscular blocking agent.20
Primary Analysis
The primary analysis was restricted to adopting hospitals. An interrupted time series approach was used to measure two possible types of change associated with HFNC protocol adoption: an immediate intervention effect and a change in the slope of an outcome.21 The immediate intervention effect represents the change in the level of the outcome that occurs in the period immediately following the introduction of the protocol. The change in slope is the extent to which the outcome changes on a per season basis, attributable to the protocol. Interrupted time series estimates were adjusted for patient age, gender, race, ethnicity, and insurance type; linear regression was used for continuous outcomes and logistic regression for dichotomous outcomes. An ordinary least squares time series model was used to adjust for autocorrelation and Newey-West standard errors were employed.22 Analyses were performed using STATA version 14 (Stata-Corp, College Station, Texas).
Supplementary Analyses
Two preplanned supplementary analyses were conducted. Supplementary analysis 1 was identical to the primary analysis, with the exception that the first season after adoption was censored. The rationale for censoring the first adoption season was to account for a potential learning effect and/or delayed start to full protocol implementation. Supplementary analysis 2 used the nonadopting hospitals as a control group and subtracted the effects measured from an interrupted time series analysis among nonadopting hospitals from the effects measured among adopting hospitals. The rationale for this approach was to control for unmeasured secular (eg, availability of ICU beds) and temporal (eg, severity of a given bronchiolitis season) factors that may have coincidentally occurred with HFNC adoption seasons. The only modification to the interrupted time series approach for supplementary analysis 2 was to provide the nonadopting hospitals with an artificial interruption point because nonadopting hospitals, by definition, did not have an adoption season that could be used in an interrupted time series approach. The interruption point for nonadopting hospitals was set at the median adoption season for adopting hospitals.
RESULTS
Exposure
Leaders at 44 hospitals were contacted regarding their hospital’s use of HFNC outside of the ICU (Figure 1). Responses were obtained for 41 hospitals (93% response rate), 18 of which were classified as nonadopting hospitals. Of the 23 hospitals where the presence of ward-based HFNC protocols were reported, 12 met inclusion criteria and were classified as adopting hospitals. HFNC protocols were adopted at these hospitals in a staggered fashion between the 2010-2011 and 2015-2016 respiratory seasons (Figure 2). The median adoption season was the 2013-14 respiratory season.

Nine adopting hospitals were able to provide details about their first HFNC protocols (Appendix 1). No two protocols were identical, but they shared many similarities. Minimum age requirements ranged from birth to a few months of age. Exclusion criteria were particularly variable, with a history of chronic lung disease or apnea being the most common criteria. Maximum allowed rates of flow ranged from 4 to 10 liters per minute. Criteria for transfer to the ICU were consistently based on an elevated FiO2 and duration of HFNC exposure.

Patient Characteristics
A total of 32,809 bronchiolitis encounters occurred at adopting hospitals during qualifying respiratory seasons, of which 6,556 (20%) involved patients with a complex chronic condition and were excluded. Of the 26,253 included bronchiolitis encounters, 12,495 encounters occurred prior to ward-based HFNC protocol adoption and 13,758 encounters occurred after adoption. The median age of patients was 8 months (interquartile range, 5-14 months). Most patients were on government insurance (64%), male (58%), of white (56%) or black (18%) race, and of non-Hispanic ethnicity (72%). Pre- and postadoption patient demographics were similar (Appendix 2).
Primary Analysis
Shifts in the level of ICU use and ICU length of stay were observed at the time of adoption of a ward-based HFNC protocol (Figure 3). Specifically, ward-based HFNC protocol adoption was associated with an immediate 3.1% absolute increase (95% CI, 2.8%-3.4%) in the proportion of patients admitted to the ICU and a 9.1 days per 100 patients increase (95% CI, 5.1-13.2) in ICU length of stay (Table). The slope of ICU admissions per season was increasing after HFNC protocol adoption (1.0% increase per season; 95% CI, 0.8%-1.1%). When examined at the individual-hospital level (Appendix 3), seven hospitals were found to have significant increases in ICU admissions (immediate intervention effect or change in slope) after adoption, and one hospital was found to have a significant decrease in ICU admissions (change in slope only). Neither immediate intervention effects nor changes in the slopes of total length of stay and mechanical ventilation were observed, with mean total length of stay approximately 3 days and just over 1% of patients receiving mechanical ventilation (Figure 3).

Supplementary Analyses
Supplementary analyses were largely consistent with the primary analysis. Associations with increased ICU utilization were again observed, although the immediate change in ICU length of stay for supplementary analysis 1 was not significant and the slope for ICU length of stay in supplementary analysis 2 was down trending (Table). Changes in total length of stay and mechanical ventilation were not observed in either supplementary analysis, with the lone exception being an increase in the proportion of patients receiving mechanical ventilation per season (increase in slope) in supplementary analysis 1.

DISCUSSION
This is the largest multicenter study to date evaluating ICU utilization after adoption of a ward-based HFNC protocol for patients with bronchiolitis. While a principal goal of allowing HFNC use outside of the ICU is to reduce the time that patients with bronchiolitis spend in the ICU, we found that early protocols were, paradoxically, associated with increased ICU utilization. Ward-based HFNC protocols were not associated with changes in hospital length of stay or need for mechanical ventilation. Our findings are particularly relevant given that the majority of children’s hospitals in our sample have adopted ward-based HFNC protocols to care for patients with bronchiolitis.
The increase in ICU utilization measured in our study is a novel finding, seemingly in contradiction to existing literature. Early pilot studies inspired hope that employing HFNC on the general ward might prevent a portion of children from needing ICU care.11,12 Subsequent larger observational studies did not demonstrate decreases in ICU utilization after adoption of ward-based HFNC protocols.13,14 The two RCTs comparing low-flow and high-flow nasal cannula use outside of the ICU did not measure a statistically significant effect on ICU utilization, an exploratory outcome in both trials.15,16 However, the reported point estimates for absolute differences in ICU admission were 2% to 3% higher among patients randomized to HFNC, which is consistent with the 2% to 4% increase in ICU admission measured in the present study.
What might explain this surprising finding? While our observational study cannot speak to mechanism, the protocol details examined in the present study suggest that initial adoption of a ward-based HFNC protocol is often coupled with specific ICU transfer criteria that were unlikely in place prior to protocol initiation. For example, most protocols recommended consideration of ICU transfer for elevated FiO2 or prolonged duration of HFNC. Transfer to the ICU for prolonged HFNC duration is only possible in the setting of a ward-based HFNC protocol and transfer for elevated FiO2 was probably unnecessary prior to protocol adoption given that low-flow nasal cannula generally delivers 100% FiO2. It is also possible that with HFNC comes a perception of increased acuity. For example, medical providers may see patients on HFNC as sicker than patients with the same amount of work of breathing but off HFNC, which makes providers more likely to seek ICU admission for patients on HFNC. The combination of unchanged total length of stay and increased ICU utilization suggests that early ward-based HFNC protocols were an ineffective instrument to improve hospital bed availability during the peak census times that often occur in bronchiolitis season.
The large sample size afforded our study by its multicenter, retrospective design also allowed for a meaningful assessment of the association between a ward-based HFNC protocol and the need for mechanical ventilation. Early indications suggested a lack of substantial association between HFNC use outside of the ICU and rates of mechanical ventilation, but prior studies were limited by small numbers of patients receiving mechanical ventilation (<30 patients in each study).13,14,16 The present study, in which 783 patients received mechanical ventilation, supports the lack of association between early ward-based HFNC protocols and the need for mechanical ventilation. It should be noted that other studies have measured decreases in mechanical ventilation in association with ICU-based HFNC use.23-26 In addition to examining HFNC use in a different clinical context, decreases in mechanical ventilation measured after HFNC implementation in the ICU could be explained by preexisting practice trends to limit invasive ventilation and/or selection bias resulting from an increase in less severely ill patients being admitted to the ICU over time. The interrupted time series approach and the staggered adoption of HFNC protocols make the present study less susceptible to biases from preexisting trends and the inclusion of patients cared for both on the ward and within the ICU reduces selection bias.
Our study has several important limitations. First, all hospitals included in the analysis were US children’s hospitals and these findings may not generalize to other practice environments, including community hospitals and other countries. Second, our cohort and outcomes were defined using administrative billing data, which have been incompletely validated, making some degree of misclassification likely. Third, we measured HFNC exposure at the hospital level, but could not examine the extent to which individual patients were exposed to HFNC because such data are not present in PHIS. Even if we had access to patient-level HFNC exposure data, we would have still compared outcomes among all patients with bronchiolitis (not just those who received HFNC), to avoid selection bias. However, knowing HFNC exposure status at the patient level would have allowed for weighting of the effects measured at each hospital according to the extent of HFNC exposure. Fourth, there are likely other, unmeasured secular and temporal factors that could affect study outcomes. To some degree, the interrupted time series approach, observed staggered adoption of protocols, and nonadopting hospital supplementary analysis mitigate this risk of bias. Fifth, while the pre- and postadoption populations appeared demographically similar, it is possible that the populations might have differed by other unmeasured factors. Finally, early ward-based HFNC protocols have likely undergone iterative changes since adoption. We compared pre- and postadoption outcome slopes and censored the first adoption season in a supplementary analysis to attempt to account for this potential limitation.
In conclusion, our findings suggest that initial implementation of ward-based HFNC protocols were not successful at reducing ICU utilization for children with bronchiolitis. Future research should examine whether more evolved HFNC protocols that use higher flow rates, more generous ICU transfer criteria, and more rapid weaning criteria can reduce ICU utilization.
Acknowledgments
We thank Dr Vineeta Mittal (University of Texas Southwestern Medical Center) for providing feedback regarding the manuscript.
1. Mansbach JM, Piedra PA, Teach SJ, et al. Prospective multicenter study of viral etiology and hospital length of stay in children with severe bronchiolitis. Arch Pediatr Adolesc Med. 2012;166(8):700-706. https://doi.org/10.1001/archpediatrics.2011.1669.
2. Hasegawa K, Pate BM, Mansbach JM, et al. Risk factors for requiring intensive care among children admitted to ward with bronchiolitis. Acad Pediatr. 2015;15(1):77-81. https://doi.org/10.1016/j.acap.2014.06.008.
3. Schroeder AR, Destino LA, Brooks R, Wang CJ, Coon ER. Outcomes of follow-up visits after bronchiolitis hospitalizations. JAMA Pediatr. 2018;172(3):296-297. https://doi.org/10.1001/jamapediatrics.2017.4002.
4. Drake MG. High-flow nasal cannula oxygen in adults: an evidence-based assessment. Ann Am Thorac Soc. 2018;15(2):145-155. https://doi.org/10.1513/AnnalsATS.201707-548FR.
5. Rubin S, Ghuman A, Deakers T, Khemani R, Ross P, Newth CJ. Effort of breathing in children receiving high-flow nasal cannula. Pediatr Crit Care Med. 2014;15(1):1-6. https://doi.org/10.1097/PCC.0000000000000011.
6. Hough JL, Pham TM, Schibler A. Physiologic effect of high-flow nasal cannula in infants with bronchiolitis. Pediatr Crit Care Med. 2014;15(5):e214-e219. https://doi.org/10.1097/PCC.0000000000000112.
7. Pham TM, O’Malley L, Mayfield S, Martin S, Schibler A. The effect of high flow nasal cannula therapy on the work of breathing in infants with bronchiolitis. Pediatr Pulmonol. 2015;50(7):713-720. https://doi.org/10.1002/ppul.23060.
8. Weiler T, Kamerkar A, Hotz J, Ross PA, Newth CJL, Khemani RG. The relationship between high flow nasal cannula flow rate and effort of breathing in children. J Pediatr. 2017;189:66-71.e63. https://doi.org/10.1016/j.jpeds.2017.06.006.
9. Mayfield S, Jauncey-Cooke J, Hough JL, Schibler A, Gibbons K, Bogossian F. High-flow nasal cannula therapy for respiratory support in children. Cochrane Database Syst Rev. 2014(3):CD009850. https://doi.org/10.1002/14651858.CD009850.pub2.
10. Roca O, Riera J, Torres F, Masclans JR. High-flow oxygen therapy in acute respiratory failure. Respir Care. 2010;55(4):408-413.
11. Kallappa C, Hufton M, Millen G, Ninan TK. Use of high flow nasal cannula oxygen (HFNCO) in infants with bronchiolitis on a paediatric ward: a 3-year experience. Arch Dis Child. 2014;99(8):790-791. https://doi.org/10.1136/archdischild-2014-306637.
12. Mayfield S, Bogossian F, O’Malley L, Schibler A. High-flow nasal cannula oxygen therapy for infants with bronchiolitis: pilot study. J Paediatr Child Health. 2014;50(5):373-378. https://doi.org/10.1111/jpc.12509.
13. Riese J, Porter T, Fierce J, Riese A, Richardson T, Alverson BK. Clinical outcomes of bronchiolitis after implementation of a general ward high flow nasal cannula guideline. Hosp Pediatr. 2017;7(4):197-203. https://doi.org/10.1542/hpeds.2016-0195.
14. Mace AO, Gibbons J, Schultz A, Knight G, Martin AC. Humidified high-flow nasal cannula oxygen for bronchiolitis: should we go with the flow? Arch Dis Child. 2018;103(3):303. https://doi.org/10.1136/archdischild-2017-313950.
15. Kepreotes E, Whitehead B, Attia J, et al. High-flow warm humidified oxygen versus standard low-flow nasal cannula oxygen for moderate bronchiolitis (HFWHO RCT): an open, phase 4, randomised controlled trial. Lancet. 2017;389(10072):930-939. https://doi.org/10.1016/S0140-6736(17)30061-2.
16. Franklin D, Babl FE, Schlapbach LJ, et al. A randomized trial of high-flow oxygen therapy in infants with bronchiolitis. N Engl J Med. 2018;378(12):1121-1131. https://doi.org/10.1056/NEJMoa1714855.
17. Coon ER, Mittal V, Brady PW. High flow nasal cannula-just expensive paracetamol? Lancet Child Adolesc Health. 2019;3(9):593-595. https://doi.org/10.1016/S2352-4642(19)30235-4.
18. Roth J. CMS’ ICD-9-CM to and from ICD-10-CM and ICD-10-PCS Crosswalk or General Equivalence Mappings. 2012. http://www.nber.org/data/icd9-icd-10-cm-and-pcs-crosswalk-general-equivalence-mapping.html. Accessed November 19, 2016.
19. Feudtner C, Feinstein JA, Zhong W, Hall M, Dai D. Pediatric complex chronic conditions classification system version 2: updated for ICD-10 and complex medical technology dependence and transplantation. BMC Pediatr. 2014;14:199. https://doi.org/10.1186/1471-2431-14-199.
20. Shein SL, Slain K, Wilson-Costello D, McKee B, Rotta AT. Temporal changes in prescription of neuropharmacologic drugs and utilization of resources related to neurologic morbidity in mechanically ventilated children with bronchiolitis. Pediatr Crit Care Med. 2017;18(12):e606-e614. https://doi.org/10.1097/PCC.0000000000001351.
21. Penfold RB, Zhang F. Use of interrupted time series analysis in evaluating health care quality improvements. Acad Pediatr. 2013;13(6 Suppl):S38-S44. https://doi.org/10.1016/j.acap.2013.08.002.
22. Newey WK, West KD. A simple, positive semi-definite, heteroskedasticity and autocorrelation consistent covariance matrix. Econometrica. 1987;55(3):703-708.
23. McKiernan C, Chua LC, Visintainer PF, Allen H. High flow nasal cannulae therapy in infants with bronchiolitis. J Pediatr. 2010;156(4):634-638. https://doi.org/10.1016/j.jpeds.2009.10.039.
24. Schibler A, Pham TM, Dunster KR, et al. Reduced intubation rates for infants after introduction of high-flow nasal prong oxygen delivery. Intensive Care Med. 2011;37(5):847-852. https://doi.org/10.1007/s00134-011-2177-5.
25. Kawaguchi A, Yasui Y, deCaen A, Garros D. The clinical impact of heated humidified high-flow nasal cannula on pediatric respiratory distress. Pediatr Crit Care Med. 2017;18(2):112-119. https://doi.org/10.1097/PCC.0000000000000985.
26. Schlapbach LJ, Straney L, Gelbart B, et al. Burden of disease and change in practice in critically ill infants with bronchiolitis. Eur Respir J. 2017;49(6):1601648. https://doi.org/10.1183/13993003.01648-2016.
Children hospitalized for bronchiolitis frequently require admission to the intensive care unit (ICU), with estimates as high as 18%1,2 and 35%3 in two prospective, multicenter studies. The indication for ICU admission is nearly always a need for advanced respiratory support, which historically consisted of continuous or bilevel positive airway pressure (CPAP and BiPAP, respectively) or mechanical ventilation. High-flow nasal cannula (HFNC) is a recent addition to the respiratory support armamentarium, delivering heated and humidified oxygen at rates of up to 60 L/min and allowing for clinicians to titrate both flow rate and fraction of inspired oxygen (FiO2).4
Several studies have demonstrated that HFNC is capable of decreasing a child’s work of breathing,5-8 and it has the potential advantage of being better tolerated than other forms of advanced respiratory support.9,10 These case-series physiologic studies informed early ward-based HFNC protocols for bronchiolitis, which were adopted to decrease ICU utilization. Since then, single center observational studies examining the association between ward-based HFNC protocols and subsequent ICU utilization have come to discordant conclusions.11-14 Studying the effect of employing HFNC outside of the ICU is challenging in the context of a randomized, controlled trial (RCT) because it is difficult to blind healthcare providers to the intervention and because crossover from the control group to HFNC is frequent. Two unblinded RCTs published in 2017 and 2018 found that children randomized to conventional nasal cannula were frequently escalated to HFNC (flow rates of 1-2 L/kg per minute), but neither trial found a difference in ICU admission.15,16 Sample sizes substantially larger than those present in currently published or registered RCTs would be required to evaluate the impact of ward-based HFNC protocols on the outcome that inspired the protocols in the first place, namely ICU utilization.17
Children’s hospitals have adopted ward-based HFNC protocols at different time points over the last decade, which allows for a natural experiment—a promising alternative study design that avoids the challenges of blinding, crossover, and modest sample sizes. In order to have sufficient postadoption data for analyses, the present study is limited to ward-based HFNC protocols adopted prior to 2016, which we have termed “early” ward-based HFNC protocols. Among children with bronchiolitis, our objective was to measure the association between hospital-level adoption of a ward-based HFNC protocol and subsequent ICU utilization, using a multicenter network of children’s hospitals.
METHODS
We conducted a multicenter retrospective cohort study using the Pediatric Health Information System (PHIS) database. The PHIS database is operated by the Children’s Hospital Association (Lenexa, Kansas) and provides deidentified patient-level information for children who receive hospital care at 55 US children’s hospitals. Available data elements include patient demographic data, discharge diagnosis and procedure codes, and detailed billing information, such as laboratory, imaging, pharmacy, and supply charges. At the patient level, the use of HFNC vs standard oxygen therapy circuits cannot be discriminated.
Exposure
The study exposure was a hospital’s first ward-based HFNC protocol, with adoption measured at the hospital level at each PHIS site via direct communication with leaders in hospital medicine. In most cases, first contact was made with the pediatric hospital medicine division chief or fellowship program director, who then, if necessary, connected study investigators to local HFNC champions aware of site-specific historical HFNC protocol details. Contact with a hospital was made only if the hospital had contributed at least 6 consecutive years of data to PHIS. Hospitals were classified as “adopting” hospitals if their HFNC protocol met all of the following criteria: (a) allows initiation of HFNC outside of the ICU (on the floor or in the ED), (b) allows continued care outside of the ICU (on the floor), (c) not limited to a small unit like an intermediate care unit, and (d) adopted during a specific, known respiratory season. Hospitals for which ward-based HFNC protocols were adopted but did not meet these criteria were excluded from further analysis. Our intent was to identify large scale, programmatic protocol launches and exclude hospitals with exceptions that might preclude a sizable portion of our cohort from being eligible for the protocol. Hospitals for which inpatient use of HFNC remains limited to the ICU were defined as “nonadopting” hospitals. Respondents at adopting hospitals were asked to share details about their protocol, including patient eligibility criteria and maximum HFNC rates of flow permitted outside of the ICU.
Patient Characteristics
Patients aged 3 to 24 months who were hospitalized at adopting and nonadopting hospitals were included if an International Classification of Diseases, Ninth Revision (ICD-9) discharge diagnosis code for bronchiolitis (466.XX) was present in any position (not limited to a primary diagnosis). The lower age limit of 3 months was chosen to match the most restrictive age eligibility criteria of provided HFNC protocols (Appendix 1). A crosswalk available from the Centers for Medicare & Medicaid Services18 was used to convert ICD-10 diagnosis and procedure codes from recent years to ICD-9 diagnosis and procedure codes. Patients were excluded if their encounter contained a diagnosis or procedure code signifying a complex chronic condition,19 if their hospitalization involved care in the neonatal ICU, or if their admission date occurred outside of the respiratory season. Respiratory season was defined as November 1 through April 30.
Outcomes
Outcomes were measured during three respiratory seasons leading up to adoption and during three respiratory seasons after adoption. The primary outcome was ICU utilization, including the proportion of patients admitted to the ICU and ICU length of stay, expressed as ICU days per 100 patients. Secondary outcomes included mean total length of stay and the proportion of patients who received mechanical ventilation. Lengths of stay were measured in days, the most granular unit of time provided in PHIS over the entire study period. As such, partial days of care are rounded up to 1 full day. A previously published strict definition for mechanical ventilation that limits false positives was used, requiring that patients have a procedure or supply code for mechanical ventilation and a pharmacy charge for a neuromuscular blocking agent.20
Primary Analysis
The primary analysis was restricted to adopting hospitals. An interrupted time series approach was used to measure two possible types of change associated with HFNC protocol adoption: an immediate intervention effect and a change in the slope of an outcome.21 The immediate intervention effect represents the change in the level of the outcome that occurs in the period immediately following the introduction of the protocol. The change in slope is the extent to which the outcome changes on a per season basis, attributable to the protocol. Interrupted time series estimates were adjusted for patient age, gender, race, ethnicity, and insurance type; linear regression was used for continuous outcomes and logistic regression for dichotomous outcomes. An ordinary least squares time series model was used to adjust for autocorrelation and Newey-West standard errors were employed.22 Analyses were performed using STATA version 14 (Stata-Corp, College Station, Texas).
Supplementary Analyses
Two preplanned supplementary analyses were conducted. Supplementary analysis 1 was identical to the primary analysis, with the exception that the first season after adoption was censored. The rationale for censoring the first adoption season was to account for a potential learning effect and/or delayed start to full protocol implementation. Supplementary analysis 2 used the nonadopting hospitals as a control group and subtracted the effects measured from an interrupted time series analysis among nonadopting hospitals from the effects measured among adopting hospitals. The rationale for this approach was to control for unmeasured secular (eg, availability of ICU beds) and temporal (eg, severity of a given bronchiolitis season) factors that may have coincidentally occurred with HFNC adoption seasons. The only modification to the interrupted time series approach for supplementary analysis 2 was to provide the nonadopting hospitals with an artificial interruption point because nonadopting hospitals, by definition, did not have an adoption season that could be used in an interrupted time series approach. The interruption point for nonadopting hospitals was set at the median adoption season for adopting hospitals.
RESULTS
Exposure
Leaders at 44 hospitals were contacted regarding their hospital’s use of HFNC outside of the ICU (Figure 1). Responses were obtained for 41 hospitals (93% response rate), 18 of which were classified as nonadopting hospitals. Of the 23 hospitals where the presence of ward-based HFNC protocols were reported, 12 met inclusion criteria and were classified as adopting hospitals. HFNC protocols were adopted at these hospitals in a staggered fashion between the 2010-2011 and 2015-2016 respiratory seasons (Figure 2). The median adoption season was the 2013-14 respiratory season.
Nine adopting hospitals were able to provide details about their first HFNC protocols (Appendix 1). No two protocols were identical, but they shared many similarities. Minimum age requirements ranged from birth to a few months of age. Exclusion criteria were particularly variable, with a history of chronic lung disease or apnea being the most common criteria. Maximum allowed rates of flow ranged from 4 to 10 liters per minute. Criteria for transfer to the ICU were consistently based on an elevated FiO2 and duration of HFNC exposure.
Patient Characteristics
A total of 32,809 bronchiolitis encounters occurred at adopting hospitals during qualifying respiratory seasons, of which 6,556 (20%) involved patients with a complex chronic condition and were excluded. Of the 26,253 included bronchiolitis encounters, 12,495 encounters occurred prior to ward-based HFNC protocol adoption and 13,758 encounters occurred after adoption. The median age of patients was 8 months (interquartile range, 5-14 months). Most patients were on government insurance (64%), male (58%), of white (56%) or black (18%) race, and of non-Hispanic ethnicity (72%). Pre- and postadoption patient demographics were similar (Appendix 2).
Primary Analysis
Shifts in the level of ICU use and ICU length of stay were observed at the time of adoption of a ward-based HFNC protocol (Figure 3). Specifically, ward-based HFNC protocol adoption was associated with an immediate 3.1% absolute increase (95% CI, 2.8%-3.4%) in the proportion of patients admitted to the ICU and a 9.1 days per 100 patients increase (95% CI, 5.1-13.2) in ICU length of stay (Table). The slope of ICU admissions per season was increasing after HFNC protocol adoption (1.0% increase per season; 95% CI, 0.8%-1.1%). When examined at the individual-hospital level (Appendix 3), seven hospitals were found to have significant increases in ICU admissions (immediate intervention effect or change in slope) after adoption, and one hospital was found to have a significant decrease in ICU admissions (change in slope only). Neither immediate intervention effects nor changes in the slopes of total length of stay and mechanical ventilation were observed, with mean total length of stay approximately 3 days and just over 1% of patients receiving mechanical ventilation (Figure 3).
Supplementary Analyses
Supplementary analyses were largely consistent with the primary analysis. Associations with increased ICU utilization were again observed, although the immediate change in ICU length of stay for supplementary analysis 1 was not significant and the slope for ICU length of stay in supplementary analysis 2 was down trending (Table). Changes in total length of stay and mechanical ventilation were not observed in either supplementary analysis, with the lone exception being an increase in the proportion of patients receiving mechanical ventilation per season (increase in slope) in supplementary analysis 1.
DISCUSSION
This is the largest multicenter study to date evaluating ICU utilization after adoption of a ward-based HFNC protocol for patients with bronchiolitis. While a principal goal of allowing HFNC use outside of the ICU is to reduce the time that patients with bronchiolitis spend in the ICU, we found that early protocols were, paradoxically, associated with increased ICU utilization. Ward-based HFNC protocols were not associated with changes in hospital length of stay or need for mechanical ventilation. Our findings are particularly relevant given that the majority of children’s hospitals in our sample have adopted ward-based HFNC protocols to care for patients with bronchiolitis.
The increase in ICU utilization measured in our study is a novel finding, seemingly in contradiction to existing literature. Early pilot studies inspired hope that employing HFNC on the general ward might prevent a portion of children from needing ICU care.11,12 Subsequent larger observational studies did not demonstrate decreases in ICU utilization after adoption of ward-based HFNC protocols.13,14 The two RCTs comparing low-flow and high-flow nasal cannula use outside of the ICU did not measure a statistically significant effect on ICU utilization, an exploratory outcome in both trials.15,16 However, the reported point estimates for absolute differences in ICU admission were 2% to 3% higher among patients randomized to HFNC, which is consistent with the 2% to 4% increase in ICU admission measured in the present study.
What might explain this surprising finding? While our observational study cannot speak to mechanism, the protocol details examined in the present study suggest that initial adoption of a ward-based HFNC protocol is often coupled with specific ICU transfer criteria that were unlikely in place prior to protocol initiation. For example, most protocols recommended consideration of ICU transfer for elevated FiO2 or prolonged duration of HFNC. Transfer to the ICU for prolonged HFNC duration is only possible in the setting of a ward-based HFNC protocol and transfer for elevated FiO2 was probably unnecessary prior to protocol adoption given that low-flow nasal cannula generally delivers 100% FiO2. It is also possible that with HFNC comes a perception of increased acuity. For example, medical providers may see patients on HFNC as sicker than patients with the same amount of work of breathing but off HFNC, which makes providers more likely to seek ICU admission for patients on HFNC. The combination of unchanged total length of stay and increased ICU utilization suggests that early ward-based HFNC protocols were an ineffective instrument to improve hospital bed availability during the peak census times that often occur in bronchiolitis season.
The large sample size afforded our study by its multicenter, retrospective design also allowed for a meaningful assessment of the association between a ward-based HFNC protocol and the need for mechanical ventilation. Early indications suggested a lack of substantial association between HFNC use outside of the ICU and rates of mechanical ventilation, but prior studies were limited by small numbers of patients receiving mechanical ventilation (<30 patients in each study).13,14,16 The present study, in which 783 patients received mechanical ventilation, supports the lack of association between early ward-based HFNC protocols and the need for mechanical ventilation. It should be noted that other studies have measured decreases in mechanical ventilation in association with ICU-based HFNC use.23-26 In addition to examining HFNC use in a different clinical context, decreases in mechanical ventilation measured after HFNC implementation in the ICU could be explained by preexisting practice trends to limit invasive ventilation and/or selection bias resulting from an increase in less severely ill patients being admitted to the ICU over time. The interrupted time series approach and the staggered adoption of HFNC protocols make the present study less susceptible to biases from preexisting trends and the inclusion of patients cared for both on the ward and within the ICU reduces selection bias.
Our study has several important limitations. First, all hospitals included in the analysis were US children’s hospitals and these findings may not generalize to other practice environments, including community hospitals and other countries. Second, our cohort and outcomes were defined using administrative billing data, which have been incompletely validated, making some degree of misclassification likely. Third, we measured HFNC exposure at the hospital level, but could not examine the extent to which individual patients were exposed to HFNC because such data are not present in PHIS. Even if we had access to patient-level HFNC exposure data, we would have still compared outcomes among all patients with bronchiolitis (not just those who received HFNC), to avoid selection bias. However, knowing HFNC exposure status at the patient level would have allowed for weighting of the effects measured at each hospital according to the extent of HFNC exposure. Fourth, there are likely other, unmeasured secular and temporal factors that could affect study outcomes. To some degree, the interrupted time series approach, observed staggered adoption of protocols, and nonadopting hospital supplementary analysis mitigate this risk of bias. Fifth, while the pre- and postadoption populations appeared demographically similar, it is possible that the populations might have differed by other unmeasured factors. Finally, early ward-based HFNC protocols have likely undergone iterative changes since adoption. We compared pre- and postadoption outcome slopes and censored the first adoption season in a supplementary analysis to attempt to account for this potential limitation.
In conclusion, our findings suggest that initial implementation of ward-based HFNC protocols were not successful at reducing ICU utilization for children with bronchiolitis. Future research should examine whether more evolved HFNC protocols that use higher flow rates, more generous ICU transfer criteria, and more rapid weaning criteria can reduce ICU utilization.
Acknowledgments
We thank Dr Vineeta Mittal (University of Texas Southwestern Medical Center) for providing feedback regarding the manuscript.
1. Mansbach JM, Piedra PA, Teach SJ, et al. Prospective multicenter study of viral etiology and hospital length of stay in children with severe bronchiolitis. Arch Pediatr Adolesc Med. 2012;166(8):700-706. https://doi.org/10.1001/archpediatrics.2011.1669.
2. Hasegawa K, Pate BM, Mansbach JM, et al. Risk factors for requiring intensive care among children admitted to ward with bronchiolitis. Acad Pediatr. 2015;15(1):77-81. https://doi.org/10.1016/j.acap.2014.06.008.
3. Schroeder AR, Destino LA, Brooks R, Wang CJ, Coon ER. Outcomes of follow-up visits after bronchiolitis hospitalizations. JAMA Pediatr. 2018;172(3):296-297. https://doi.org/10.1001/jamapediatrics.2017.4002.
4. Drake MG. High-flow nasal cannula oxygen in adults: an evidence-based assessment. Ann Am Thorac Soc. 2018;15(2):145-155. https://doi.org/10.1513/AnnalsATS.201707-548FR.
5. Rubin S, Ghuman A, Deakers T, Khemani R, Ross P, Newth CJ. Effort of breathing in children receiving high-flow nasal cannula. Pediatr Crit Care Med. 2014;15(1):1-6. https://doi.org/10.1097/PCC.0000000000000011.
6. Hough JL, Pham TM, Schibler A. Physiologic effect of high-flow nasal cannula in infants with bronchiolitis. Pediatr Crit Care Med. 2014;15(5):e214-e219. https://doi.org/10.1097/PCC.0000000000000112.
7. Pham TM, O’Malley L, Mayfield S, Martin S, Schibler A. The effect of high flow nasal cannula therapy on the work of breathing in infants with bronchiolitis. Pediatr Pulmonol. 2015;50(7):713-720. https://doi.org/10.1002/ppul.23060.
8. Weiler T, Kamerkar A, Hotz J, Ross PA, Newth CJL, Khemani RG. The relationship between high flow nasal cannula flow rate and effort of breathing in children. J Pediatr. 2017;189:66-71.e63. https://doi.org/10.1016/j.jpeds.2017.06.006.
9. Mayfield S, Jauncey-Cooke J, Hough JL, Schibler A, Gibbons K, Bogossian F. High-flow nasal cannula therapy for respiratory support in children. Cochrane Database Syst Rev. 2014(3):CD009850. https://doi.org/10.1002/14651858.CD009850.pub2.
10. Roca O, Riera J, Torres F, Masclans JR. High-flow oxygen therapy in acute respiratory failure. Respir Care. 2010;55(4):408-413.
11. Kallappa C, Hufton M, Millen G, Ninan TK. Use of high flow nasal cannula oxygen (HFNCO) in infants with bronchiolitis on a paediatric ward: a 3-year experience. Arch Dis Child. 2014;99(8):790-791. https://doi.org/10.1136/archdischild-2014-306637.
12. Mayfield S, Bogossian F, O’Malley L, Schibler A. High-flow nasal cannula oxygen therapy for infants with bronchiolitis: pilot study. J Paediatr Child Health. 2014;50(5):373-378. https://doi.org/10.1111/jpc.12509.
13. Riese J, Porter T, Fierce J, Riese A, Richardson T, Alverson BK. Clinical outcomes of bronchiolitis after implementation of a general ward high flow nasal cannula guideline. Hosp Pediatr. 2017;7(4):197-203. https://doi.org/10.1542/hpeds.2016-0195.
14. Mace AO, Gibbons J, Schultz A, Knight G, Martin AC. Humidified high-flow nasal cannula oxygen for bronchiolitis: should we go with the flow? Arch Dis Child. 2018;103(3):303. https://doi.org/10.1136/archdischild-2017-313950.
15. Kepreotes E, Whitehead B, Attia J, et al. High-flow warm humidified oxygen versus standard low-flow nasal cannula oxygen for moderate bronchiolitis (HFWHO RCT): an open, phase 4, randomised controlled trial. Lancet. 2017;389(10072):930-939. https://doi.org/10.1016/S0140-6736(17)30061-2.
16. Franklin D, Babl FE, Schlapbach LJ, et al. A randomized trial of high-flow oxygen therapy in infants with bronchiolitis. N Engl J Med. 2018;378(12):1121-1131. https://doi.org/10.1056/NEJMoa1714855.
17. Coon ER, Mittal V, Brady PW. High flow nasal cannula-just expensive paracetamol? Lancet Child Adolesc Health. 2019;3(9):593-595. https://doi.org/10.1016/S2352-4642(19)30235-4.
18. Roth J. CMS’ ICD-9-CM to and from ICD-10-CM and ICD-10-PCS Crosswalk or General Equivalence Mappings. 2012. http://www.nber.org/data/icd9-icd-10-cm-and-pcs-crosswalk-general-equivalence-mapping.html. Accessed November 19, 2016.
19. Feudtner C, Feinstein JA, Zhong W, Hall M, Dai D. Pediatric complex chronic conditions classification system version 2: updated for ICD-10 and complex medical technology dependence and transplantation. BMC Pediatr. 2014;14:199. https://doi.org/10.1186/1471-2431-14-199.
20. Shein SL, Slain K, Wilson-Costello D, McKee B, Rotta AT. Temporal changes in prescription of neuropharmacologic drugs and utilization of resources related to neurologic morbidity in mechanically ventilated children with bronchiolitis. Pediatr Crit Care Med. 2017;18(12):e606-e614. https://doi.org/10.1097/PCC.0000000000001351.
21. Penfold RB, Zhang F. Use of interrupted time series analysis in evaluating health care quality improvements. Acad Pediatr. 2013;13(6 Suppl):S38-S44. https://doi.org/10.1016/j.acap.2013.08.002.
22. Newey WK, West KD. A simple, positive semi-definite, heteroskedasticity and autocorrelation consistent covariance matrix. Econometrica. 1987;55(3):703-708.
23. McKiernan C, Chua LC, Visintainer PF, Allen H. High flow nasal cannulae therapy in infants with bronchiolitis. J Pediatr. 2010;156(4):634-638. https://doi.org/10.1016/j.jpeds.2009.10.039.
24. Schibler A, Pham TM, Dunster KR, et al. Reduced intubation rates for infants after introduction of high-flow nasal prong oxygen delivery. Intensive Care Med. 2011;37(5):847-852. https://doi.org/10.1007/s00134-011-2177-5.
25. Kawaguchi A, Yasui Y, deCaen A, Garros D. The clinical impact of heated humidified high-flow nasal cannula on pediatric respiratory distress. Pediatr Crit Care Med. 2017;18(2):112-119. https://doi.org/10.1097/PCC.0000000000000985.
26. Schlapbach LJ, Straney L, Gelbart B, et al. Burden of disease and change in practice in critically ill infants with bronchiolitis. Eur Respir J. 2017;49(6):1601648. https://doi.org/10.1183/13993003.01648-2016.
© 2020 Society of Hospital Medicine
Developing a Patient- and Family-Centered Research Agenda for Hospital Medicine: The Improving Hospital Outcomes through Patient Engagement (i-HOPE) Study
Thirty-six million people are hospitalized annually in the United States,1 and a significant proportion of these patients are rehospitalized within 30 days.2 Gaps in hospital care are many and well documented, including high rates of adverse events, hospital-acquired conditions, and suboptimal care transitions.3-5 Despite significant efforts to improve the care of hospitalized patients and some incremental improvement in the safety of hospital care, hospital care remains suboptimal.6-9 Importantly, hospitalization remains a challenging and vulnerable time for patients and caregivers.
Despite research efforts to improve hospital care, there remains very little data regarding what patients, caregivers, and other stakeholders believe are the most important priorities for improving hospital care, experiences, and outcomes. Small studies described in brief reports provide limited insights into what aspects of hospital care are most important to patients and to their families.10-13 These small studies suggest that communication and the comfort of caregivers and of patient family members are important priorities, as are the provision of adequate sleeping arrangements, food choices, and psychosocial support. However, the limited nature of these studies precludes the possibility of larger conclusions regarding patient priorities.10-13

The evolution of patient-centered care has led to increasing efforts to engage, and partner, with patients, caregivers, and other stakeholders to obtain their input on healthcare, research, and improvement efforts.14 The guiding principle of this engagement is that patients and their caregivers are uniquely positioned to share their lived experiences of care and that their involvement ensures their voices are represented.15-17 Therefore to obtain greater insight into priority areas from the perspectives of patients, caregivers, and other healthcare stakeholders, we undertook a systematic engagement process to create a patient-partnered and stakeholder-partnered research agenda for improving the care of hospitalized adult patients.
METHODS
Guiding Frameworks for Study Methods
We used two established, validated methods to guide our collaborative, inclusive, and consultative approach to patient and stakeholder engagement and research prioritization:
- The Patient-Centered Outcomes Research Institute (PCORI) standards for formulating patient-centered research questions,18 which includes methods for stakeholder engagement that ensures the representativeness of engaged groups and dissemination of study results.18
- The James Lind Alliance (JLA) approach to “priority setting partnerships,” through which patients, caregivers, and clinicians partner to identify and prioritize unanswered questions.19
The Improving Hospital Outcomes through Patient Engagement (i-HOPE) study included eight stepwise phases to formulate and prioritize a set of patient-centered research questions to improve the care and experiences of hospitalized patients and their families.20 Our process is described below and summarized in Table 1.
Phases of Question Development
Phase 1: Steering Committee Formation
Nine clinical researchers, nine patients and/or caregivers, and two administrators from eight academic and community hospitals from across the United States formed a steering committee to participate in teleconferences every other week to manage all stages of the project including design, implementation, and dissemination. At the time of the project conceptualization, the researchers were a subgroup of the Society of Hospital Medicine Research Committee.21 Patient partners on the steering committee were identified from local patient and family advisory councils (PFACs) of the researchers’ institutions. Patients partners had previously participated in research or improvement initiatives with their hospitalist partners. Patient partners received stipends throughout the project in recognition of their participation and expertise. Included in the committee was a representative from the Society of Hospital Medicine (SHM)—our supporting and dissemination partner.
Phase 2: Stakeholder Identification
We created a list of potential stakeholder organizations to participate in the study based on the following:
- Organizations with which SHM has worked on initiatives related to the care of hospitalized adult patients
- Organizations with which steering committee members had worked
- Internet searches of organizations participating in similar PCORI-funded projects and of other professional societies that represented patients or providers who work in hospital or post-acute care settings
- Suggestions from stakeholders identified through the first two approaches as described above
We intended to have a broad representation of stakeholders to ensure diverse perspectives were included in the study. Stakeholder organizations included patient advocacy groups, providers, researchers, payers, policy makers and funding agencies.
Phase 3: Stakeholder Engagement and Awareness Training
Representatives from 39 stakeholder organizations who agreed to participate in the study were further orientated to the study rationale and methods via a series of interactive online webinars. This included reminding organziations that everyone’s input and perspective were valued and that we had a flat organization structure that ensured all stakeholders were equal.
Phase 4: Survey Development and Administration
We chose a survey approach to solicit input on identifying gaps in patient care and to generate research questions. The steering committee developed an online survey collaboratively with stakeholder organization representatives. We used survey pretesting with patient and researcher members from the steering committee. The goal of pretesting was to ensure accessibility and comprehension for all potential respondents, particularly patients and caregivers. The final survey asked respondents to record up to three questions that they thought would improve the care of hospitalized adult patients and their families. The specific wording of the survey is shown in the Figure and the entire survey in Appendix Document 1.

We chose three questions because that is the number of entries per participant that is recommended by JLA; it also minimizes responder burden.19 We asked respondents to identify the stakeholder group they represented (eg, patient, caregiver, healthcare provider, researcher) and for providers to identify where they primarily worked (eg, acute care hospital, post-acute care, advocacy group).
Survey Administration. We administered the survey electronically using Research Electronic Data Capture (REDCap), a secure web-based application used for collecting research data.22 Stakeholders were asked to disseminate the survey broadly using whatever methods that they felt was appropriate to their leadership or members.
Phase 5: Initial Question Categorization Using Qualitative Content Analysis
Six members of the steering committee independently performed qualitative content analysis to categorize all submitted questions.23,24 This analytic approach identifies, analyzes, and reports patterns within the data.23,24 We hypothesized that some of the submitted questions would relate to already-known problems with hospitalization. Therefore the steering committee developed an a priori codebook of 48 categories using common systems-based issues and diseases related to the care of hospitalized patients based on the hospitalist core competency topics developed by hospitalists and the SHM Education Committee,25 personal and clinical knowledge and experience related to the care of hospitalized adult patients, and published literature on the topic. These a priori categories and their definitions are shown in Appendix Document 2 and were the basis for our initial theory-driven (deductive) approach to data analysis.23
Once coding began, we identified 32 new and additional categories based on our review of the submitted questions, and these were the basis of our data-driven (inductive) approach to analysis.23 All proposed new codes and definitions were discussed with and approved by the entire steering committee prior to being added to the codebook (Appendix Document 2).
While coding categories were mutually exclusive, multiple codes could be attributed to a question depending on the content and meaning of a question. To ensure methodological rigor, reviewers met regularly via teleconference or communicated via email throughout the analysis to iteratively refine and define coding categories. All questions were reviewed independently, and then discussed, by at least two members of the analysis team. Any coding disparities were discussed and resolved by negotiated consensus.26 Analysis was conducted using Dedoose V8.0.35 (Sociocultural Research Consultants, Los Angeles, California).
Phase 6: Initial Question Identification Using Quantitative Content Analysis
Following thematic categorization, all steering committee members then reviewed each category to identify and quantify the most commonly submitted questions.27 A question was determined to be a commonly submitted question when it appeared at least 10 times.
Phase 7: Interim Priority Setting
We sent the list of the most commonly submitted questions (Appendix Document 3) to stakeholder organizations and patient partner networks for review and evaluation. Each organization was asked to engage with their constituents and leaders to collectively decide on which of these questions resonated and was most important. These preferences would then be used during the in-person meeting (Phase 8). We did not provide stakeholder organizations with information about how many times each question was submitted by respondents because we felt this could potentially bias their decision-making processes such that true importance and relevance would not obtained.
Phase 8: In-person Meeting for Final Question Prioritization and Refinement
Representatives from all 39 participating stakeholder organizations were invited to participate in a 2-day, in-person meeting to create a final prioritized list of questions to be used to guide patient-centered research seeking to improve the care of hospitalized adult patients and their caregivers. This meeting was attended by 43 stakeholders (26 stakeholder organization representatives and 17 steering committee members) from 37 unique stakeholder organizations. To facilitate the inclusiveness and to ensure a consensus-driven process, we used nominal group technique (NGT) to allow all of the meeting participants to discuss the list of prioritized questions in small groups.28 NGT allows participants to comprehend each other’s point of view to ensure no perpsectives are excluded.28 The NGT was followed by two rounds of individual voting. Stakeholders were then asked to frame their discussions and their votes based on the perspectives of their organizations or PFACs that they represent. The voting process required participants to make choices regarding the relative importance of all of the questions, which therefore makes the resulting list a true prioritized list. In the first round of voting, participants voted for up to five questions for inclusion on the prioritized list. Based on the distribution of votes, where one vote equals one point, each of the 36 questions was then ranked in order of the assigned points. The rank-ordering process resulted in a natural cut point or delineated point, resulting in the 11 questions considered to be the highest prioritized questions. Following this, a second round of voting took place with the same parameters as the first round and allowed us to rank order questions by order of importance and priority. Finally, during small and large group discussions, the original text of each question was edited, refined, and reformatted into questions that could drive a research agenda.
Ethical Oversight
This study was reviewed by the Institutional Review Board of the University of Texas Health Science Center at San Antonio and deemed not to be human subject research (UT Health San Antonio IRB Protocol Number: HSC20170058N).
RESULTS
In total, 499 respondents from 39 unique stakeholder organizations responded to our survey. Respondents self-identified into multiple categorizes resulting in 267 healthcare providers, 244 patients and caregivers, and 63 researchers. Characteristics of respondents to the survey are shown in Table 2.

An overview of study results is shown in Table 1. Respondents submitted a total of 782 questions related to improving the care of hospitalized patients. These questions were categorized during thematic analysis into 70 distinct categories—52 that were health system related and 18 that were disease specific (Appendix 2). The most frequently used health system–related categories were related to discharge care transitions, medications, patient understanding, and patient-family-care team communication (Appendix 2).
From these categories, 36 questions met our criteria for “commonly identified,” ie, submitted at least 10 times (Appendix Document 3). Notably, these 36 questions were derived from 67 different coding categories, of which 24 (36%) were a priori (theory-driven) categories23 created by the Steering Committee before analysis began and 43 (64%) categories were created as a result of this study’s stakeholder-engaged process and a data-driven approach23 to analysis (Appendix Document 3). These groups of questions were then presented during the 2-day, in-person meeting and reduced to a final 11 questions that were identified in rank order as top priorities (Table 3). The questions considered highest priority related to ensuring shared treatment and goals of care decision making, improving hospital discharge handoff to other care facilities and providers, and reducing the confusion related to education on medications, conditions, hospital care, and discharge.

DISCUSSION
Using a dynamic and collaborative stakeholder engagement process, we identified 11 questions prioritized in order of importance by patients, caregivers, and other healthcare stakeholders to improve the care of hospitalized adult patients. While some of the topics identified are already well-known topics in need of research and improvement, our findings frame these topics according to the perspectives of patients, caregivers, and stakeholders. This unique perspective adds a level of richness and nuance that provides insight into how to better address these topics and ultimately inform research and quality improvement efforts.
The question considered to be the highest priority area for future research and improvement surmised how it may be possible to implement interventions that engage patients in shared decision making. Shared decision making involves patients and their care team working together to make decisions about treatment, and other aspects of care based on sound clinical evidence that balances the risks and outcomes with patient preferences and values. Although considered critically important,29 a recent evaluation of shared decision making practices in over 250 inpatient encounters identified significant gaps in physicians’ abilities to perform key elements of a shared decision making approach and reinforced the need to identify what strategies can best promote widespread shared decision making.30 While there has been considerable effort to faciliate shared decision making in practice, there remains mixed evidence regarding the sustainability and impact of tools seeking to support shared decision making, such as decision aids, question prompt lists, and coaches.31 This suggests that new approaches to shared decision making may be required and likely explains why this question was rated as a top priority by stakeholders in the current study.
Respondents frequently framed their questions in terms of their lived experiences, providing stories and scenarios to illustrate the importance of the questions they submitted. This personal framing highlighted to us the need to think about improving care delivery from the end-user perspective. For example, respondents framed questions about care transitions not with regard to early appointments, instructions, or medication lists, but rather in terms of whom to call with questions or how best to reach their physician, nurse, or other identified provider. These perspectives suggest that strategies and approaches to improvement that start with patient and caregiver experiences, such as design thinking,32 may be important to continued efforts to improve hospital care. Additionally, the focus on the interpersonal aspects of care delivery highlights the need to focus on the patient-provider relationship and communication.
Questions submitted by respondents demonstrated a stark difference between “patient education” and “patient understanding,” which suggests that being provided with education or education materials regarding care did not necessarily lead to a clear patient understanding. The potential for lack of understanding was particularly prominent in the context of care plan development and during times of care transition—topics that were encompassed in 9 out of 11 of our prioritized research questions. This may suggest that approaches that improve the ability for healthcare providers to deliver information may not be sufficient to meet the needs of patients and caregivers. Rather, partnering to develop a shared understanding—whether about prognosis, medications, hospital, or discharge care plans—is critical. Improved communication practices are not an endpoint for information delivery, but rather a starting point leading to a shared understanding.
Several of the priority areas identified in our study reflect the immensely complex intersections among patients, caregivers, clinicians, and the healthcare delivery system. Addressing these gaps in order to reach the goal of ideal hospital care and an improved patient experience will likely require coordinated approaches and strong involvement and buy-in from multiple stakeholders including the voices of patients and caregivers. Creating patient-centered and stakeholder-driven research has been an increasing priority nationally.33 Yet to realize this, we must continue to understand the foundations and best practices of authentic stakeholder engagement so that it can be achieved in practice.34 We intend for this prioritized list of questions to galvanize funders, researchers, clinicians, professional societies, and patient and caregiver advocacy groups to work together to address these topics through the creation of new research evidence or the sustainable implementation of existing evidence.
Our findings provide a foundation for stakeholder groups to work in partnership to find research and improvement solutions to the problems identified. Our efforts demonstrate the value and importance of a systematic and broad engagement process to ensure that the voices of patients, caregivers, and other healthcare stakeholders are included in guiding hospital research and quality improvement efforts. This is highlighted by the fact our results of prioritized category areas for research were largely only uncovered following the creation of coding categories during the analysis process and were not captured using a priori catgeories that were expected by the steering committee.
The strengths of this study include our attempts to systematically identify and engage a wide range of perspectives in hospital medicine, including perspectives from patients and their caregivers. There are also acknowledged limitations in our study. While we included patients and PFACs from across the country, the opinions of the people we included may not be representative of all patients. Similarly, the perspectives of the other participants may not have completely represented their stakeholder organizations. While we attempted to include a broad range of organizations, there may be other relevant groups who were not represented in our sample.
In summary, our findings provide direction for the multiple stakeholders involved in improving hospital care. The results will allow the research community to focus on questions that are most important to patients, caregivers, and other stakeholders, reframing them in ways that are more relevant to patients’ lived experiences and that reflect the complexity of the issues. Our findings can also be used by healthcare providers and delivery organizations to target local improvement efforts. We hope that patients and caregivers will use our results to advocate for research and improvement in areas that matter the most to them. We hope that policy makers and funding agencies use our results to promote work in these areas and drive a national conversation about how to most effectively improve hospital care.
Acknowledgments
The authors would like to thank all patients, caregivers, and stakeholders who completed the survey. The authors also would like to acknowledge the organizations and individuals who participated in this study (see Appendix Document 4 for full list). At SHM, the authors would like to specifically thank Claudia Stahl, Jenna Goldstein, Kevin Vuernick, Dr Brad Sharpe, and Dr Larry Wellikson for their support.
Disclaimer
The statements presented in this publication are solely the responsibility of the authors and do not necessarily represent the views of the Department of Veterans Affairs, Patient-Centered Outcomes Research Institute (PCORI), its Board of Governors, or Methodology Committee.
1. American Hospital Association. 2019 American Hospital Association Hospital Statistics. Chicago, Illinois: American Hospital Association; 2019.
2. Alper E, O’Malley T, Greenwald J. UptoDate: Hospital discharge and readmission. https://www.uptodate.com/contents/hospital-discharge-and-readmission. Accessed August 8, 2019.
3. de Vries EN, Ramrattan MA, Smorenburg SM, Gouma DJ, Boermeester MA. The incidence and nature of in-hospital adverse events: a systematic review. Qual Saf Heal Care. 2008;17(3):216-223. https://doi.org/10.1136/qshc.2007.023622.
4. Agency for Healthcare Research and Quality. Readmissions and Adverse Events After Discharge. https://psnet.ahrq.gov/primers/primer/11/Readmissions-and-Adverse-Events-After-Discharge. Accessed August 8, 2019.
5. Institute of Medicine (US) Committee on Quality of Health Care in America. Crossing the Quality Chasm: A New Health System for the 21st Century. Washington, DC; National Academies Press; 2001. https://doi.org/10.17226/10027.
6. Trivedi AN, Nsa W, Hausmann LRM, et al. Quality and equity of care in U.S. hospitals. N Engl J Med. 2014;371(24):2298-2308. https://doi.org/10.1056/NEJMsa1405003.
7. National Patient Safety Foundation. Free from Harm: Accelerating Patient Safety Improvement Fifteen Years after To Err Is Human. Boston: National Patient Safety Foundation; 2015.
8. Agency for Healthcare Research and Quality. AHRQ National Scorecard on Hospital-Acquired Conditions Updated Baseline Rates and Preliminary Results 2014–2017. https://www.ahrq.gov/sites/default/files/wysiwyg/professionals/quality-patient-safety/pfp/hacreport-2019.pdf. Accessed August 8, 2019.
9. Hansen LO, Greenwald JL, Budnitz T, et al. Project BOOST: effectiveness of a multihospital effort to reduce rehospitalization. J Hosp Med. 2013;8(8):421-427. https://doi.org/10.1002/jhm.2054.
10. Snyder HJ, Fletcher KE. The hospital experience through the patients’ eyes. J Patient Exp. 2019. https://doi.org/10.1177/2374373519843056.
11. Kebede S, Shihab HM, Berger ZD, Shah NG, Yeh H-C, Brotman DJ. Patients’ understanding of their hospitalizations and association with satisfaction. JAMA Intern Med. 2014;174(10):1698-1700. https://doi.org/10.1001/jamainternmed.2014.3765.
12. Shoeb M, Merel SE, Jackson MB, Anawalt BD. “Can we just stop and talk?” patients value verbal communication about discharge care plans. J Hosp Med. 2012;7(6):504-507. https://doi.org/10.1002/jhm.1937.
13. Neeman N, Quinn K, Shoeb M, Mourad M, Sehgal NL, Sliwka D. Postdischarge focus groups to improve the hospital experience. Am J Med Qual. 2013;28(6):536-538. https://doi.org/10.1177/1062860613488623.
14. Duffett L. Patient engagement: what partnering with patients in research is all about. Thromb Res. 2017;150:113-120. https://doi.org/10.1016/j.thromres.2016.10.029.
15. Pomey M, Hihat H, Khalifa M, Lebel P, Neron A, Dumez V. Patient partnership in quality improvement of healthcare services: patients’ inputs and challenges faced. Patient Exp J. 2015;2:29-42. https://doi.org/10.35680/2372-0247.1064.
16. Robbins M, Tufte J, Hsu C. Learning to “swim” with the experts: experiences of two patient co-investigators for a project funded by the Patient-Centered Outcomes Research Institute. Perm J. 2016;20(2):85-88. https://doi.org/10.7812/TPP/15-162.
17. Tai-Seale M, Sullivan G, Cheney A, Thomas K, Frosch D. The language of engagement: “aha!” moments from engaging patients and community partners in two pilot projects of the Patient-Centered Outcomes Research Institute. Perm J. 2016;20(2):89-92. https://doi.org/10.7812/TPP/15-123.
18. Patient-Centered Outcomes Research Institute (PCORI). PCORI Methodology Standards: Standards for Formulating Research Questions. https://www.pcori.org/research-results/about-our-research/research-methodology/pcori-methodology-standards#Formulating Research Questions. Accessed August 8, 2019.
19. James Lind Alliance. The James Lind Alliance Guidebook. Version 8. Southampton, England: James Lind Alliance; 2018.
20. Society of Hospital Medicine (SHM). Improving Hospital Outcomes through Patient Engagement: The i-HOPE Study. https://www.hospitalmedicine.org/clinical-topics/i-hope-study/. Accessed August 8, 2019.
21. Society of Hospital Medicine (SHM). Committees. https://www.hospitalmedicine.org/membership/committees/. Accessed August 8, 2019.
22. Harris PA, Taylor R, Thielke R, Payne J, Gonzalez N, Conde JG. Research Electronic Data Capture (REDCap) - a metadata-driven methodology and workflow process for providing translational research informatics support. J Biomed Inform. 2009;42(2):377-381. https://doi.org/10.1016/j.jbi.2008.08.010.
23. Schreier M. Qualitative content analysis in practice. Los Angeles, CA: SAGE Publications; 2012.
24. Elo S, Kyngäs H. The qualitative content analysis process. J Adv Nurs. 2008;62(1):107-115. https://doi.org/10.1111/j.1365-2648.2007.04569.x.
25. Nichani S, Crocker J, Fitterman N, Lukela M. Updating the core competencies in hospital medicine—2017 revision: introduction and methodology. J Hosp Med. 2017;12(4):283-287. https://doi.org/10.12788/jhm.2715.
26. Bradley EH, Curry LA, Devers KJ. Qualitative data analysis for health services research: developing taxonomy, themes, and theory. Health Serv Res. 2007;42(4):1758-1772. https://doi.org/10.1111/j.1475-6773.2006.00684.x.
27. Coe K, Scacco JM. Content analysis, quantitative. Int Encycl Commun Res Methods. 2017:1-11. https://doi.org/10.1002/9781118901731.iecrm0045.
28. Centers for Disease Control and Prevention. Evaluation Briefs: Gaining Consensus Among Stakeholders Through the Nominal Group Technique. Atlanta, GA; 2018. https://www.cdc.gov/healthyyouth/evaluation/pdf/brief7.pdf. Accessed August 8, 2019.
29. Charles C, Gafni A, Whelan T. Shared decision-making in the medical encounter: what does it mean? (or it takes at least two to tango). Soc Sci Med. 1997;44(5):681-692. https://doi.org/10.1016/s0277-9536(96)00221-3.
30. Blankenburg R, Hilton JF, Yuan P, et al. Shared decision-making during inpatient rounds: opportunities for improvement in patient engagement and communication. J Hosp Med. 2018;13(7):453-461. https://doi.org/10.12788/jhm.2909.
31. Legare F, Adekpedjou R, Stacey D, et al. Interventions for increasing the use of shared decision making by healthcare professionals. Cochrane Database Syst Rev. 2018;7(7):CD006732. https://doi.org/10.1002/14651858.CD006732.pub4.
32. Roberts JP, Fisher TR, Trowbridge MJ, Bent C. A design thinking framework for healthcare management and innovation. Healthc (Amst). 2016;4(1):11-14. https://doi.org/10.1016/j.hjdsi.2015.12.002.
33. Selby JV, Beal AC, Frank L. The Patient-Centered Outcomes Research Institute (PCORI) national priorities for research and initial research agenda. JAMA. 2012;307(15):1583-1584. https://doi.org/10.1001/jama.2012.500.
34. Harrison J, Auerbach A, Anderson W, et al. Patient stakeholder engagement in research: a narrative review to describe foundational principles and best practice activities. Health Expect. 2019;22(3):307-316. https://doi.org/10.1111/hex.12873.
Thirty-six million people are hospitalized annually in the United States,1 and a significant proportion of these patients are rehospitalized within 30 days.2 Gaps in hospital care are many and well documented, including high rates of adverse events, hospital-acquired conditions, and suboptimal care transitions.3-5 Despite significant efforts to improve the care of hospitalized patients and some incremental improvement in the safety of hospital care, hospital care remains suboptimal.6-9 Importantly, hospitalization remains a challenging and vulnerable time for patients and caregivers.
Despite research efforts to improve hospital care, there remains very little data regarding what patients, caregivers, and other stakeholders believe are the most important priorities for improving hospital care, experiences, and outcomes. Small studies described in brief reports provide limited insights into what aspects of hospital care are most important to patients and to their families.10-13 These small studies suggest that communication and the comfort of caregivers and of patient family members are important priorities, as are the provision of adequate sleeping arrangements, food choices, and psychosocial support. However, the limited nature of these studies precludes the possibility of larger conclusions regarding patient priorities.10-13
The evolution of patient-centered care has led to increasing efforts to engage, and partner, with patients, caregivers, and other stakeholders to obtain their input on healthcare, research, and improvement efforts.14 The guiding principle of this engagement is that patients and their caregivers are uniquely positioned to share their lived experiences of care and that their involvement ensures their voices are represented.15-17 Therefore to obtain greater insight into priority areas from the perspectives of patients, caregivers, and other healthcare stakeholders, we undertook a systematic engagement process to create a patient-partnered and stakeholder-partnered research agenda for improving the care of hospitalized adult patients.
METHODS
Guiding Frameworks for Study Methods
We used two established, validated methods to guide our collaborative, inclusive, and consultative approach to patient and stakeholder engagement and research prioritization:
- The Patient-Centered Outcomes Research Institute (PCORI) standards for formulating patient-centered research questions,18 which includes methods for stakeholder engagement that ensures the representativeness of engaged groups and dissemination of study results.18
- The James Lind Alliance (JLA) approach to “priority setting partnerships,” through which patients, caregivers, and clinicians partner to identify and prioritize unanswered questions.19
The Improving Hospital Outcomes through Patient Engagement (i-HOPE) study included eight stepwise phases to formulate and prioritize a set of patient-centered research questions to improve the care and experiences of hospitalized patients and their families.20 Our process is described below and summarized in Table 1.
Phases of Question Development
Phase 1: Steering Committee Formation
Nine clinical researchers, nine patients and/or caregivers, and two administrators from eight academic and community hospitals from across the United States formed a steering committee to participate in teleconferences every other week to manage all stages of the project including design, implementation, and dissemination. At the time of the project conceptualization, the researchers were a subgroup of the Society of Hospital Medicine Research Committee.21 Patient partners on the steering committee were identified from local patient and family advisory councils (PFACs) of the researchers’ institutions. Patients partners had previously participated in research or improvement initiatives with their hospitalist partners. Patient partners received stipends throughout the project in recognition of their participation and expertise. Included in the committee was a representative from the Society of Hospital Medicine (SHM)—our supporting and dissemination partner.
Phase 2: Stakeholder Identification
We created a list of potential stakeholder organizations to participate in the study based on the following:
- Organizations with which SHM has worked on initiatives related to the care of hospitalized adult patients
- Organizations with which steering committee members had worked
- Internet searches of organizations participating in similar PCORI-funded projects and of other professional societies that represented patients or providers who work in hospital or post-acute care settings
- Suggestions from stakeholders identified through the first two approaches as described above
We intended to have a broad representation of stakeholders to ensure diverse perspectives were included in the study. Stakeholder organizations included patient advocacy groups, providers, researchers, payers, policy makers and funding agencies.
Phase 3: Stakeholder Engagement and Awareness Training
Representatives from 39 stakeholder organizations who agreed to participate in the study were further orientated to the study rationale and methods via a series of interactive online webinars. This included reminding organziations that everyone’s input and perspective were valued and that we had a flat organization structure that ensured all stakeholders were equal.
Phase 4: Survey Development and Administration
We chose a survey approach to solicit input on identifying gaps in patient care and to generate research questions. The steering committee developed an online survey collaboratively with stakeholder organization representatives. We used survey pretesting with patient and researcher members from the steering committee. The goal of pretesting was to ensure accessibility and comprehension for all potential respondents, particularly patients and caregivers. The final survey asked respondents to record up to three questions that they thought would improve the care of hospitalized adult patients and their families. The specific wording of the survey is shown in the Figure and the entire survey in Appendix Document 1.
We chose three questions because that is the number of entries per participant that is recommended by JLA; it also minimizes responder burden.19 We asked respondents to identify the stakeholder group they represented (eg, patient, caregiver, healthcare provider, researcher) and for providers to identify where they primarily worked (eg, acute care hospital, post-acute care, advocacy group).
Survey Administration. We administered the survey electronically using Research Electronic Data Capture (REDCap), a secure web-based application used for collecting research data.22 Stakeholders were asked to disseminate the survey broadly using whatever methods that they felt was appropriate to their leadership or members.
Phase 5: Initial Question Categorization Using Qualitative Content Analysis
Six members of the steering committee independently performed qualitative content analysis to categorize all submitted questions.23,24 This analytic approach identifies, analyzes, and reports patterns within the data.23,24 We hypothesized that some of the submitted questions would relate to already-known problems with hospitalization. Therefore the steering committee developed an a priori codebook of 48 categories using common systems-based issues and diseases related to the care of hospitalized patients based on the hospitalist core competency topics developed by hospitalists and the SHM Education Committee,25 personal and clinical knowledge and experience related to the care of hospitalized adult patients, and published literature on the topic. These a priori categories and their definitions are shown in Appendix Document 2 and were the basis for our initial theory-driven (deductive) approach to data analysis.23
Once coding began, we identified 32 new and additional categories based on our review of the submitted questions, and these were the basis of our data-driven (inductive) approach to analysis.23 All proposed new codes and definitions were discussed with and approved by the entire steering committee prior to being added to the codebook (Appendix Document 2).
While coding categories were mutually exclusive, multiple codes could be attributed to a question depending on the content and meaning of a question. To ensure methodological rigor, reviewers met regularly via teleconference or communicated via email throughout the analysis to iteratively refine and define coding categories. All questions were reviewed independently, and then discussed, by at least two members of the analysis team. Any coding disparities were discussed and resolved by negotiated consensus.26 Analysis was conducted using Dedoose V8.0.35 (Sociocultural Research Consultants, Los Angeles, California).
Phase 6: Initial Question Identification Using Quantitative Content Analysis
Following thematic categorization, all steering committee members then reviewed each category to identify and quantify the most commonly submitted questions.27 A question was determined to be a commonly submitted question when it appeared at least 10 times.
Phase 7: Interim Priority Setting
We sent the list of the most commonly submitted questions (Appendix Document 3) to stakeholder organizations and patient partner networks for review and evaluation. Each organization was asked to engage with their constituents and leaders to collectively decide on which of these questions resonated and was most important. These preferences would then be used during the in-person meeting (Phase 8). We did not provide stakeholder organizations with information about how many times each question was submitted by respondents because we felt this could potentially bias their decision-making processes such that true importance and relevance would not obtained.
Phase 8: In-person Meeting for Final Question Prioritization and Refinement
Representatives from all 39 participating stakeholder organizations were invited to participate in a 2-day, in-person meeting to create a final prioritized list of questions to be used to guide patient-centered research seeking to improve the care of hospitalized adult patients and their caregivers. This meeting was attended by 43 stakeholders (26 stakeholder organization representatives and 17 steering committee members) from 37 unique stakeholder organizations. To facilitate the inclusiveness and to ensure a consensus-driven process, we used nominal group technique (NGT) to allow all of the meeting participants to discuss the list of prioritized questions in small groups.28 NGT allows participants to comprehend each other’s point of view to ensure no perpsectives are excluded.28 The NGT was followed by two rounds of individual voting. Stakeholders were then asked to frame their discussions and their votes based on the perspectives of their organizations or PFACs that they represent. The voting process required participants to make choices regarding the relative importance of all of the questions, which therefore makes the resulting list a true prioritized list. In the first round of voting, participants voted for up to five questions for inclusion on the prioritized list. Based on the distribution of votes, where one vote equals one point, each of the 36 questions was then ranked in order of the assigned points. The rank-ordering process resulted in a natural cut point or delineated point, resulting in the 11 questions considered to be the highest prioritized questions. Following this, a second round of voting took place with the same parameters as the first round and allowed us to rank order questions by order of importance and priority. Finally, during small and large group discussions, the original text of each question was edited, refined, and reformatted into questions that could drive a research agenda.
Ethical Oversight
This study was reviewed by the Institutional Review Board of the University of Texas Health Science Center at San Antonio and deemed not to be human subject research (UT Health San Antonio IRB Protocol Number: HSC20170058N).
RESULTS
In total, 499 respondents from 39 unique stakeholder organizations responded to our survey. Respondents self-identified into multiple categorizes resulting in 267 healthcare providers, 244 patients and caregivers, and 63 researchers. Characteristics of respondents to the survey are shown in Table 2.
An overview of study results is shown in Table 1. Respondents submitted a total of 782 questions related to improving the care of hospitalized patients. These questions were categorized during thematic analysis into 70 distinct categories—52 that were health system related and 18 that were disease specific (Appendix 2). The most frequently used health system–related categories were related to discharge care transitions, medications, patient understanding, and patient-family-care team communication (Appendix 2).
From these categories, 36 questions met our criteria for “commonly identified,” ie, submitted at least 10 times (Appendix Document 3). Notably, these 36 questions were derived from 67 different coding categories, of which 24 (36%) were a priori (theory-driven) categories23 created by the Steering Committee before analysis began and 43 (64%) categories were created as a result of this study’s stakeholder-engaged process and a data-driven approach23 to analysis (Appendix Document 3). These groups of questions were then presented during the 2-day, in-person meeting and reduced to a final 11 questions that were identified in rank order as top priorities (Table 3). The questions considered highest priority related to ensuring shared treatment and goals of care decision making, improving hospital discharge handoff to other care facilities and providers, and reducing the confusion related to education on medications, conditions, hospital care, and discharge.
DISCUSSION
Using a dynamic and collaborative stakeholder engagement process, we identified 11 questions prioritized in order of importance by patients, caregivers, and other healthcare stakeholders to improve the care of hospitalized adult patients. While some of the topics identified are already well-known topics in need of research and improvement, our findings frame these topics according to the perspectives of patients, caregivers, and stakeholders. This unique perspective adds a level of richness and nuance that provides insight into how to better address these topics and ultimately inform research and quality improvement efforts.
The question considered to be the highest priority area for future research and improvement surmised how it may be possible to implement interventions that engage patients in shared decision making. Shared decision making involves patients and their care team working together to make decisions about treatment, and other aspects of care based on sound clinical evidence that balances the risks and outcomes with patient preferences and values. Although considered critically important,29 a recent evaluation of shared decision making practices in over 250 inpatient encounters identified significant gaps in physicians’ abilities to perform key elements of a shared decision making approach and reinforced the need to identify what strategies can best promote widespread shared decision making.30 While there has been considerable effort to faciliate shared decision making in practice, there remains mixed evidence regarding the sustainability and impact of tools seeking to support shared decision making, such as decision aids, question prompt lists, and coaches.31 This suggests that new approaches to shared decision making may be required and likely explains why this question was rated as a top priority by stakeholders in the current study.
Respondents frequently framed their questions in terms of their lived experiences, providing stories and scenarios to illustrate the importance of the questions they submitted. This personal framing highlighted to us the need to think about improving care delivery from the end-user perspective. For example, respondents framed questions about care transitions not with regard to early appointments, instructions, or medication lists, but rather in terms of whom to call with questions or how best to reach their physician, nurse, or other identified provider. These perspectives suggest that strategies and approaches to improvement that start with patient and caregiver experiences, such as design thinking,32 may be important to continued efforts to improve hospital care. Additionally, the focus on the interpersonal aspects of care delivery highlights the need to focus on the patient-provider relationship and communication.
Questions submitted by respondents demonstrated a stark difference between “patient education” and “patient understanding,” which suggests that being provided with education or education materials regarding care did not necessarily lead to a clear patient understanding. The potential for lack of understanding was particularly prominent in the context of care plan development and during times of care transition—topics that were encompassed in 9 out of 11 of our prioritized research questions. This may suggest that approaches that improve the ability for healthcare providers to deliver information may not be sufficient to meet the needs of patients and caregivers. Rather, partnering to develop a shared understanding—whether about prognosis, medications, hospital, or discharge care plans—is critical. Improved communication practices are not an endpoint for information delivery, but rather a starting point leading to a shared understanding.
Several of the priority areas identified in our study reflect the immensely complex intersections among patients, caregivers, clinicians, and the healthcare delivery system. Addressing these gaps in order to reach the goal of ideal hospital care and an improved patient experience will likely require coordinated approaches and strong involvement and buy-in from multiple stakeholders including the voices of patients and caregivers. Creating patient-centered and stakeholder-driven research has been an increasing priority nationally.33 Yet to realize this, we must continue to understand the foundations and best practices of authentic stakeholder engagement so that it can be achieved in practice.34 We intend for this prioritized list of questions to galvanize funders, researchers, clinicians, professional societies, and patient and caregiver advocacy groups to work together to address these topics through the creation of new research evidence or the sustainable implementation of existing evidence.
Our findings provide a foundation for stakeholder groups to work in partnership to find research and improvement solutions to the problems identified. Our efforts demonstrate the value and importance of a systematic and broad engagement process to ensure that the voices of patients, caregivers, and other healthcare stakeholders are included in guiding hospital research and quality improvement efforts. This is highlighted by the fact our results of prioritized category areas for research were largely only uncovered following the creation of coding categories during the analysis process and were not captured using a priori catgeories that were expected by the steering committee.
The strengths of this study include our attempts to systematically identify and engage a wide range of perspectives in hospital medicine, including perspectives from patients and their caregivers. There are also acknowledged limitations in our study. While we included patients and PFACs from across the country, the opinions of the people we included may not be representative of all patients. Similarly, the perspectives of the other participants may not have completely represented their stakeholder organizations. While we attempted to include a broad range of organizations, there may be other relevant groups who were not represented in our sample.
In summary, our findings provide direction for the multiple stakeholders involved in improving hospital care. The results will allow the research community to focus on questions that are most important to patients, caregivers, and other stakeholders, reframing them in ways that are more relevant to patients’ lived experiences and that reflect the complexity of the issues. Our findings can also be used by healthcare providers and delivery organizations to target local improvement efforts. We hope that patients and caregivers will use our results to advocate for research and improvement in areas that matter the most to them. We hope that policy makers and funding agencies use our results to promote work in these areas and drive a national conversation about how to most effectively improve hospital care.
Acknowledgments
The authors would like to thank all patients, caregivers, and stakeholders who completed the survey. The authors also would like to acknowledge the organizations and individuals who participated in this study (see Appendix Document 4 for full list). At SHM, the authors would like to specifically thank Claudia Stahl, Jenna Goldstein, Kevin Vuernick, Dr Brad Sharpe, and Dr Larry Wellikson for their support.
Disclaimer
The statements presented in this publication are solely the responsibility of the authors and do not necessarily represent the views of the Department of Veterans Affairs, Patient-Centered Outcomes Research Institute (PCORI), its Board of Governors, or Methodology Committee.
1. American Hospital Association. 2019 American Hospital Association Hospital Statistics. Chicago, Illinois: American Hospital Association; 2019.
2. Alper E, O’Malley T, Greenwald J. UptoDate: Hospital discharge and readmission. https://www.uptodate.com/contents/hospital-discharge-and-readmission. Accessed August 8, 2019.
3. de Vries EN, Ramrattan MA, Smorenburg SM, Gouma DJ, Boermeester MA. The incidence and nature of in-hospital adverse events: a systematic review. Qual Saf Heal Care. 2008;17(3):216-223. https://doi.org/10.1136/qshc.2007.023622.
4. Agency for Healthcare Research and Quality. Readmissions and Adverse Events After Discharge. https://psnet.ahrq.gov/primers/primer/11/Readmissions-and-Adverse-Events-After-Discharge. Accessed August 8, 2019.
5. Institute of Medicine (US) Committee on Quality of Health Care in America. Crossing the Quality Chasm: A New Health System for the 21st Century. Washington, DC; National Academies Press; 2001. https://doi.org/10.17226/10027.
6. Trivedi AN, Nsa W, Hausmann LRM, et al. Quality and equity of care in U.S. hospitals. N Engl J Med. 2014;371(24):2298-2308. https://doi.org/10.1056/NEJMsa1405003.
7. National Patient Safety Foundation. Free from Harm: Accelerating Patient Safety Improvement Fifteen Years after To Err Is Human. Boston: National Patient Safety Foundation; 2015.
8. Agency for Healthcare Research and Quality. AHRQ National Scorecard on Hospital-Acquired Conditions Updated Baseline Rates and Preliminary Results 2014–2017. https://www.ahrq.gov/sites/default/files/wysiwyg/professionals/quality-patient-safety/pfp/hacreport-2019.pdf. Accessed August 8, 2019.
9. Hansen LO, Greenwald JL, Budnitz T, et al. Project BOOST: effectiveness of a multihospital effort to reduce rehospitalization. J Hosp Med. 2013;8(8):421-427. https://doi.org/10.1002/jhm.2054.
10. Snyder HJ, Fletcher KE. The hospital experience through the patients’ eyes. J Patient Exp. 2019. https://doi.org/10.1177/2374373519843056.
11. Kebede S, Shihab HM, Berger ZD, Shah NG, Yeh H-C, Brotman DJ. Patients’ understanding of their hospitalizations and association with satisfaction. JAMA Intern Med. 2014;174(10):1698-1700. https://doi.org/10.1001/jamainternmed.2014.3765.
12. Shoeb M, Merel SE, Jackson MB, Anawalt BD. “Can we just stop and talk?” patients value verbal communication about discharge care plans. J Hosp Med. 2012;7(6):504-507. https://doi.org/10.1002/jhm.1937.
13. Neeman N, Quinn K, Shoeb M, Mourad M, Sehgal NL, Sliwka D. Postdischarge focus groups to improve the hospital experience. Am J Med Qual. 2013;28(6):536-538. https://doi.org/10.1177/1062860613488623.
14. Duffett L. Patient engagement: what partnering with patients in research is all about. Thromb Res. 2017;150:113-120. https://doi.org/10.1016/j.thromres.2016.10.029.
15. Pomey M, Hihat H, Khalifa M, Lebel P, Neron A, Dumez V. Patient partnership in quality improvement of healthcare services: patients’ inputs and challenges faced. Patient Exp J. 2015;2:29-42. https://doi.org/10.35680/2372-0247.1064.
16. Robbins M, Tufte J, Hsu C. Learning to “swim” with the experts: experiences of two patient co-investigators for a project funded by the Patient-Centered Outcomes Research Institute. Perm J. 2016;20(2):85-88. https://doi.org/10.7812/TPP/15-162.
17. Tai-Seale M, Sullivan G, Cheney A, Thomas K, Frosch D. The language of engagement: “aha!” moments from engaging patients and community partners in two pilot projects of the Patient-Centered Outcomes Research Institute. Perm J. 2016;20(2):89-92. https://doi.org/10.7812/TPP/15-123.
18. Patient-Centered Outcomes Research Institute (PCORI). PCORI Methodology Standards: Standards for Formulating Research Questions. https://www.pcori.org/research-results/about-our-research/research-methodology/pcori-methodology-standards#Formulating Research Questions. Accessed August 8, 2019.
19. James Lind Alliance. The James Lind Alliance Guidebook. Version 8. Southampton, England: James Lind Alliance; 2018.
20. Society of Hospital Medicine (SHM). Improving Hospital Outcomes through Patient Engagement: The i-HOPE Study. https://www.hospitalmedicine.org/clinical-topics/i-hope-study/. Accessed August 8, 2019.
21. Society of Hospital Medicine (SHM). Committees. https://www.hospitalmedicine.org/membership/committees/. Accessed August 8, 2019.
22. Harris PA, Taylor R, Thielke R, Payne J, Gonzalez N, Conde JG. Research Electronic Data Capture (REDCap) - a metadata-driven methodology and workflow process for providing translational research informatics support. J Biomed Inform. 2009;42(2):377-381. https://doi.org/10.1016/j.jbi.2008.08.010.
23. Schreier M. Qualitative content analysis in practice. Los Angeles, CA: SAGE Publications; 2012.
24. Elo S, Kyngäs H. The qualitative content analysis process. J Adv Nurs. 2008;62(1):107-115. https://doi.org/10.1111/j.1365-2648.2007.04569.x.
25. Nichani S, Crocker J, Fitterman N, Lukela M. Updating the core competencies in hospital medicine—2017 revision: introduction and methodology. J Hosp Med. 2017;12(4):283-287. https://doi.org/10.12788/jhm.2715.
26. Bradley EH, Curry LA, Devers KJ. Qualitative data analysis for health services research: developing taxonomy, themes, and theory. Health Serv Res. 2007;42(4):1758-1772. https://doi.org/10.1111/j.1475-6773.2006.00684.x.
27. Coe K, Scacco JM. Content analysis, quantitative. Int Encycl Commun Res Methods. 2017:1-11. https://doi.org/10.1002/9781118901731.iecrm0045.
28. Centers for Disease Control and Prevention. Evaluation Briefs: Gaining Consensus Among Stakeholders Through the Nominal Group Technique. Atlanta, GA; 2018. https://www.cdc.gov/healthyyouth/evaluation/pdf/brief7.pdf. Accessed August 8, 2019.
29. Charles C, Gafni A, Whelan T. Shared decision-making in the medical encounter: what does it mean? (or it takes at least two to tango). Soc Sci Med. 1997;44(5):681-692. https://doi.org/10.1016/s0277-9536(96)00221-3.
30. Blankenburg R, Hilton JF, Yuan P, et al. Shared decision-making during inpatient rounds: opportunities for improvement in patient engagement and communication. J Hosp Med. 2018;13(7):453-461. https://doi.org/10.12788/jhm.2909.
31. Legare F, Adekpedjou R, Stacey D, et al. Interventions for increasing the use of shared decision making by healthcare professionals. Cochrane Database Syst Rev. 2018;7(7):CD006732. https://doi.org/10.1002/14651858.CD006732.pub4.
32. Roberts JP, Fisher TR, Trowbridge MJ, Bent C. A design thinking framework for healthcare management and innovation. Healthc (Amst). 2016;4(1):11-14. https://doi.org/10.1016/j.hjdsi.2015.12.002.
33. Selby JV, Beal AC, Frank L. The Patient-Centered Outcomes Research Institute (PCORI) national priorities for research and initial research agenda. JAMA. 2012;307(15):1583-1584. https://doi.org/10.1001/jama.2012.500.
34. Harrison J, Auerbach A, Anderson W, et al. Patient stakeholder engagement in research: a narrative review to describe foundational principles and best practice activities. Health Expect. 2019;22(3):307-316. https://doi.org/10.1111/hex.12873.
© 2020 Society of Hospital Medicine
A Time Motion Study Evaluating the Impact of Geographic Cohorting of Hospitalists
Geographic cohorting (GCh, also known as “localization” or “regionalization”) refers to the practice wherein hospitalists are assigned to a single inpatient unit. Its adoption is increasing and in 2017, 30% of surveyed United States hospital medicine group leaders reported that their clinicians rounded on 1-2 units daily.1 As a component of intervention bundles, GCh is associated with reductions in mortality, length of stay, and costs.2,3
However, details on how GCh affects the hospitalist workday are unknown. Most time-motion studies of inpatient clinicians have reported the experiences of physicians in training with few specifically evaluating the workflow of attending hospitalists.4 Three studies of the attending hospitalist’s workday that were performed a decade ago excluded teams with learners, had patient loads as low as 9.4 per day, and did not differentiate between GCh and non-GCh models.5-7
The objective of this observational study was to describe and compare the workday of GCh and non-GCh hospitalists by using automated geographical-tracking methods supplemented by in-person observations.
METHODS
Setting and Participants
This work was conducted at a large academic center in the Midwestern US which adopted GCh in 2012. During the study, hospitalists staffed 11 GCh and four non-GCh teams. GCh teams aim to maintain ≥80% of their patients on their assigned unit and conduct interprofessional huddles on weekdays.3 Some units specialize in the care of specific populations (eg, patients with oncologic diagnoses), while others serve as general medical or surgical units. Non-GCh teams are assigned patients without regard to location. Resident housestaff are assigned only to GCh teams and residents and advanced practice providers (APPs) are never assigned to the same team. Based on team members, this yielded five distinct team types: GCh-hospitalist, GCh-hospitalist with APP, GCh-hospitalist with resident, non-GCh-hospitalist, and non-GCh-hospitalist with APP. Hospitalists provided verbal consent to participate. The protocol was reviewed and approved by the Indiana University Institutional Review Board. Two complementary observation modalities were used. Locator badges were used to quantify direct and indirect time unobtrusively over long periods. In-person observations were conducted to examine the workday in greater detail. Data were collected between October 2017 and May 2018.
Observations by Locator Badges
Our institution uses a system designed by Hill-Rom® (Cary, North Carolina) to facilitate staff communication. Staff wear the I-Badge® Locator Badge, which emits an infra-red signal.8 Centrally located receivers tabulate time spent by the badge wearer in each location (Appendix Figure 1). Each hospitalist was given a badge to wear at work for a minimum of six weeks, after which the I-Badge® data were downloaded.
Schedules detailing each team’s members and assigned units (if cohorted) were retrieved. For each observed day, the hospitalist was linked to his or her team type and unit. Team lists were retrieved to ascertain patient load at the start of the day. Data sources were merged to categorize observations.
Observation Categories for Locator Badge Data
The I-Badge® data provided details of how much time the hospitalist spent in each location (eg, nursing station, hallways, patient rooms). All observations in patient rooms were considered “direct care” while all other locations were categorized as “Indirect Care”. Observations were also categorized by the intensity of care provided on that unit, which included the Emergency Department (ED), Progressive Care Units (PCU), Medical-Surgical + PCU units (for units having a mixture of Medical-Surgical and PCU beds), and Medical-Surgical units.
In-person Observations
Four research assistants (RAs) were trained until interrater reliability using task times achieved an intraclass correlation coefficient of 0.98. Task categories included direct care (all time with patients), indirect care (computer interactions, communication), professional development, and travel and personal time. Interruptions were defined as “an unplanned and unscheduled task, causing a discontinuation, a noticeable break, or task switch behavior”.9 “Electronic interruptions” were caused by pagers or phones whereas in-person interruptions were “face-to-face” interruptions. When at least two tasks were performed simultaneously, it was considered multitasking. A data collection form created in REDCap was accessed on computer tablets or smartphones10 (Appendix Table 1). To limit each observation period to five hours, two RAs were scheduled each day. Observations were continued until the hospitalist reported that work activities were complete or until 5
Statistical Analysis
Due to the nested structure of the locator badge data, multilevel mode
Univariate three-level models predicting minutes spent in direct care were tested for each predictor. Predictors, described below, were selected due to their hypothesized relation to time spent in direct patient care, or to account statistically for differences among teams due to the observational nature of the study.12 Predictors were: Level 3, hospitalist characteristics (years since medical school, age, gender, international graduate, years at current hospital); Level 2, work day characteristics (number of units visited, number of patients visited, team type, weekday); and Level 1, individual observation characteristics (intensity of care on unit, number of visits to the same patient room per day
For total daily indirect care, a similar modeling process was used. A log normal distribution was used because the data was right-skewed and contained positive values. The restricted maximum likelihood method was used to calculate final estimates for models. Least square mean values for independent variables were subjected to backward transformation for interpretation. Post hoc pairwise comparisons between team types were conducted using Tukey–Kramer tests for direct and indirect care time. Analyses were conducted using SAS software version 9.4 (Cary, North Carolina).
The in-person observations were summarized using descriptive statistics. Exploratory analyses were performed using t-tests and Fisher’s exact tests to compare continuous and categorical variables respectively.
RESULTS
Locator Badge Observations
Participants
The 17 hospitalists had a mean (SD) age of 38 years (6.4); 10 (59%) were male, 7 (41%) were international medical graduates, and 10 (59%) had worked at the hospital ≥5 years. The duration of observation was <45 days for 7 hospitalists, 46-55 days for 4, and >55 days for 6, yielding observations for 666 hospitalist workdays. The mean time since medical school graduation was 13 years. Seven hospitalists were observed only in the GCh model, one was observed only in the non-GCh model, and nine were observed in both.
Team Characteristics
On average, non-GCh teams visited more units per day than GCh teams. Teams with APPs had higher patient loads (Table 1).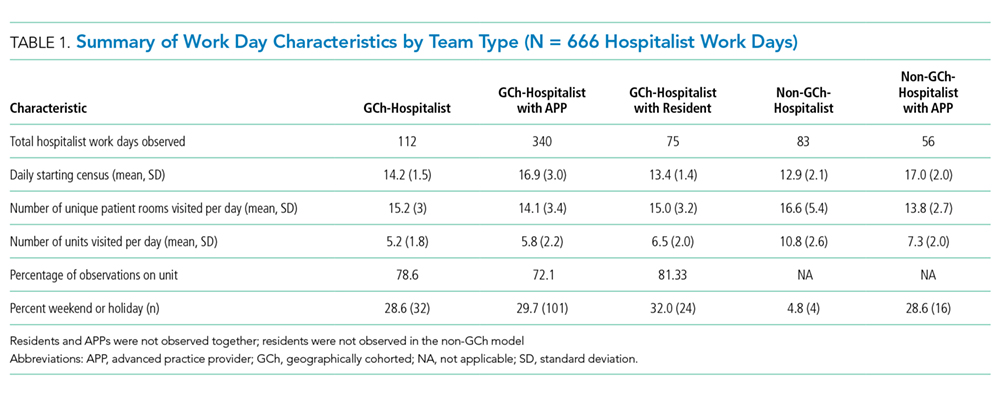
Time Observed in Direct and Indirect Care
In total, 10,522 observations were recorded in providing direct care. The average duration of a direct care encounter ranged from 4.1 to 5.8 minutes. The ratio of indirect to direct time ranged from 2.7 to 3.7 (Table 2).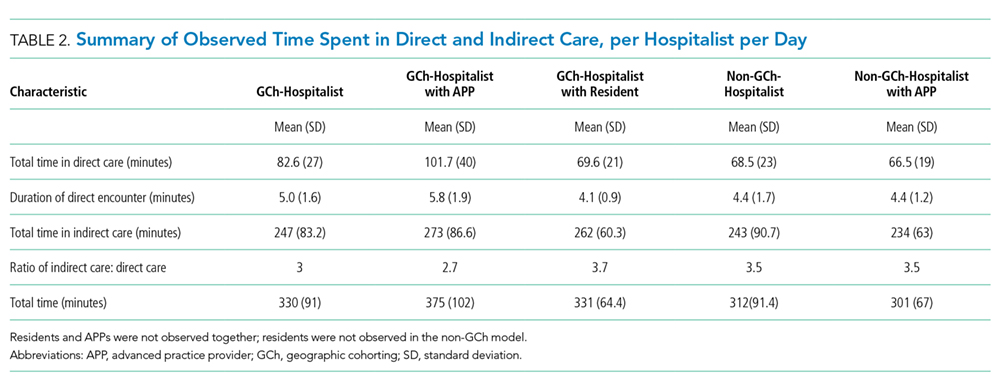
The number of times that a hospitalist visited the same patient room in one day ranged from 1 to 9. Most (84%) of the patient rooms were visited once per day. The odds that a GCh hospitalist would visit a patient more than once per day were 1.8 times higher (95% CI: 1.37, 2.34; P < .0001) than for a non-GCh hospitalist (data not shown).
Predictors Associated with Time Expenditure
Predictors significantly associated with both the duration of direct care encounters and total daily indirect care time included team type and patient count. Predicted time in direct care encounters was highest for the GCh-hospitalist team (9.5 minutes) and lowest for the GCh-hospitalist with residents team (7 minutes). Predicted total indirect care time was highest for the GCh-hospitalist with APP team (160 minutes) while the lowest expenditure in indirect care time was predicted for the non-GCh-hospitalist team (102 minutes). Increasing patient load from 10 to 20 was predicted to decrease the duration of a direct care encounter by one minute (14%) and increase the total indirect care time by a larger amount (39 min, 24%).
The duration of direct care encounters was also inversely related with years since medical school and number of visits made to same patient room. Finally, acuity of care was associated with the duration of direct care encounters with the longest predicted encounters in the ED (9.4 minutes). Physician gender and age, international graduation, years at current hospital, weekday, and the number of units visited in a day were neither associated with direct care time at P value < .05 nor improved model fit and therefore were not retained in the final model (Table 3).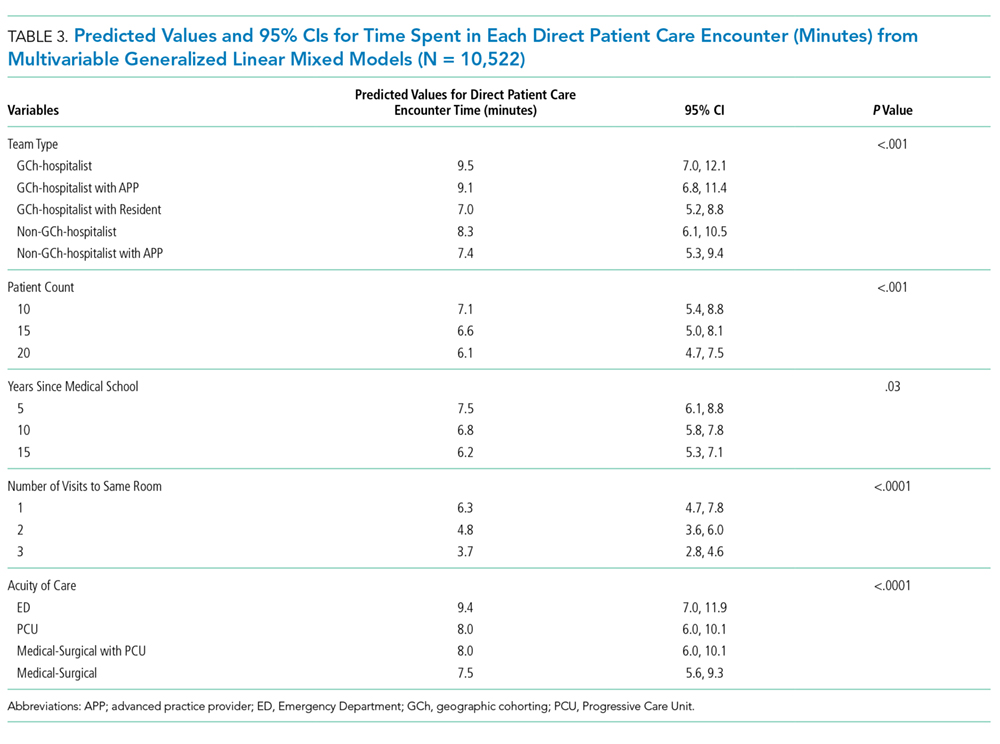
Additional predictors associated with total daily indirect care time included the number of units visited and working on a weekend or holiday. Total time spent in indirect care was predicted to increase as the number of units increased and decrease on weekends or holidays. Hospitalist characteristics were not associated with time in indirect care (Table 4).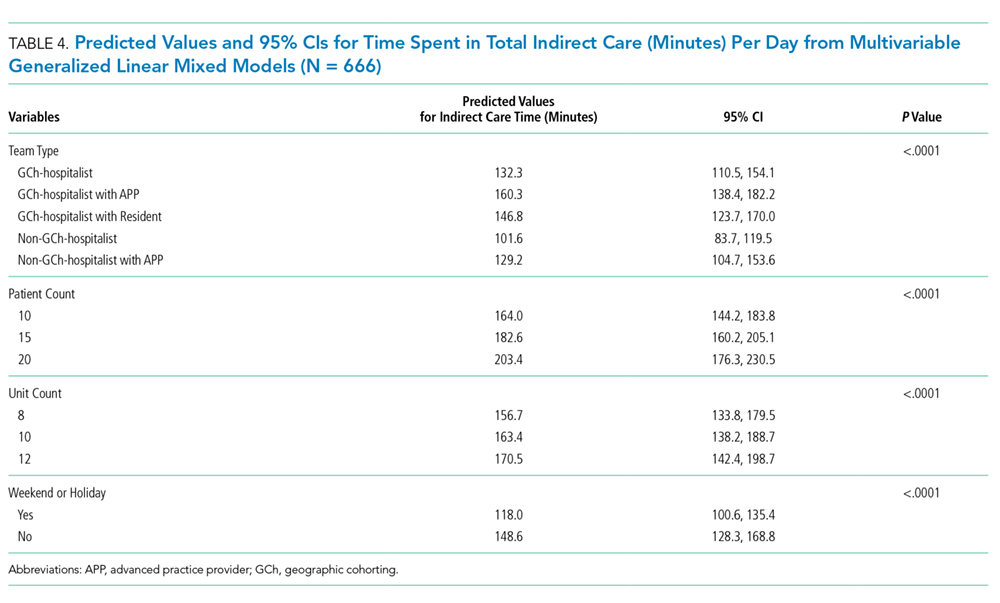
In-person Observations
Four hospitalists cohorted to general medical units and four non-GCh hospitalists were observed for one day each, yielding a total of 3,032 minutes of data. These hospitalists were on teams without residents or APPs. On average, GCh hospitalists had 78% of their patients on their assigned unit, rounded on fewer units (3 vs 6) and had two more patients at the start of the day than non-GCh hospitalists (14 vs 12). Age and gender distribution of the GCh and non-GCh hospitalists were similar.
As a percentage of total observed time, GCh hospitalists were noted to spend a larger proportion of the workday in computer interactions vs non-GCh hospitalists (56% vs 39%; P = .005). The proportion of time in other activities or locations was not statistically different between GCh and non-GCh hospitalists, including face-to-face communication (21% vs 15%), multitasking (18% vs 14%), time spent at the nursing station (58% vs 34%), direct care (15% vs 20%), and time traveling (4% vs 11%). The most frequently observed combination of multitasking was computer and phone use (59% of all multitasking) followed by computer use and face-to-face communication (17%; Appendix Figure 2).
The mean duration of an interruption was 1.3 minutes. More interruptions were observed in the GCh group than the non-GCh group (139 vs 102). Interruptions in the GCh group were face-to-face in 62% of instances and electronic in 25%. The remaining 13% were instances in which electronic and face-to-face interruptions occurred simultaneously. In the non-GCh group, 51% of interruptions were face-to-face; 47% were electronic; and 2% were simultaneous. GCh hospitalists were interrupted once every 14 minutes in the morning, with interruption frequency increasing to once every eight minutes in the afternoon. Non-GCh hospitalists were interrupted once every 13 minutes in the morning and saw interruption frequency decrease to once every 17 minutes in the afternoon. The task most frequently interrupted was computer use.
DISCUSSION
Previous investigations have studied the impact of cohorting on outcomes, including the facilitation of bedside rounding, adverse events, agreement between nurses and physicians on the plan of care, productivity, and the number of pages received.13-16 Cohorting’s benefits are theorized to include increased hospitalist time with patients, while its downsides are perceived to include increased interruptions.17,18 Neither has previously been evaluated by direct observation.
Our findings support cohorting’s association with increased hospitalist–patient time. While GCh hospitalists were observed spending 5% less time in direct care than non-GCh hospitalists by in-person observations, this difference did not achieve statistical significance and was unadjusted for hospitalist, patient load, team or patient characteristics. Using the larger badge dataset, the predicted values for time spent in direct care encounters were higher in cohorted teams. Pairwise comparisons consistently trended toward longer durations in cohorted vs noncohorted teams. The notable exception was in cohorted teams with residents, which had the shortest predicted patient visits; however, we did not have noncohorted teams with residents in our study, limiting interpretation. Additionally, the odds of repeat visits to a patient in a single day were almost twice as high in the cohorted vs noncohorted group. The magnitude of this gain, however, is estimated to be a modest 1.2 minutes for a hospitalist only team and 1.7 minutes for a hospitalist with APP team and may be insufficient to provide compassionate, patient-centered care.19
Furthermore, these gains may be eroded if patient loads are high: similar to a previous study, we found that the duration of each patient visit decreased by 14% when the load increased from 10 to 20 patients.6 The expected gains in efficiency from cohorting leads to an expectation that hospitalists can manage more patients, but such reflexive increases should be carefully considered.18
Similar to earlier investigations where hospitalists were found to spend 60 to 69% of the day in indirect care activities,5,6 hospitalists in both cohorted and noncohorted models spent approximately three times more time in indirect than direct care. Cohorting was associated with increased indirect care time. This association was expected as interdisciplinary huddles and increased nursing and physician communication are both related to cohorting.3,14 However, similar to previous reports, in-person observations revealed that the bulk of this indirect time was spent in computer interactions, rather than in interprofessional communication. Interactions with the electronic health record (EHR) consume between one-third to one-half of the day in inpatient settings.20,21 While EHRs are intended to enhance safety, they also fulfill multiple, nonclinical purposes and increase time spent on documentation.22,23 Nonclinical tasks may contribute to clinician burnout and detract from patient centeredness.22 Our findings suggest that cohorting may not offset the burden of these time-intensive EHR tasks. The larger expenditure of time spent in computer interactions observed in the GCh group may be partially explained both by the higher number of patients and the higher frequency of interruptions observed in this group; computer use was the task most frequently observed to be interrupted. While longer tasks are more likely to be interrupted, the interruption in turn further increases the time taken to complete the task.24
The interruption rates we observed are concerning. The hospitalist workday emerges as cognitively intense. GCh hospitalists were noted to be interrupted as frequently as once every eight minutes, a rate more than double that of an earlier investigation and approaching that of ED physicians.5,25,26 Interruptions and multitasking contribute to errors and a perception of increased workload and frustration for clinicians.9,27-29 Although interruptions were pervasive, GCh hospitalists were interrupted more frequently, corroborating a national survey in which hospitalists perceived that cohorting increased face-to-face interruptions.30 The prolonged availability of the cohorted hospitalist on the unit may require different strategies for promoting timely interactions while preserving uninterrupted work time. Our work, however, does not allow us to quantify appropriate and urgent interruptions that reflect improved teamwork and patient safety. Interruptions increase as patient loads increase.25 The contribution to interruptions by the higher patient census on the GCh teams cannot be quantified in this work, but without attention to these details, potential benefits from GCh may be attenuated.
Previous work has delineated variables important in determining hospitalist workload,31 and our work contributes additional considerations. Hospitalist experience and resident presence on cohorted teams was associated with shorter patient visits, while ED encounters were predicted to be the most time intensive. Increasing numbers of units visited in a day was associated with more indirect time, while weekends were associated with a lower burden of indirect care. As expected, APP presence was associated with more time in indirect care as the hospitalist spends time in providing oversight. As noted, cohorting was associated with increases in both direct and indirect care time. These findings may help inform hospital medicine groups. Additionally, attention should be paid to the fact that while support for cohorting stems from investigations in which it was used as part of a bundle of interventions,2,3 in practice, it is often implemented incompletely, with cohorted hospitalists dispersed over several units, or in isolation from other interventions.1
Our work has several limitations. As a single-center investigation, our findings may not be generalizable to other institutions. Second, we did not evaluate clinical outcomes, clinician, patient or nursing satisfaction to assess the effect of cohorting. Third, we cannot comment on whether the observed interruptions were beneficial or detrimental. Finally, while we used statistical control for the measured imbalanced variables between groups, unmeasured confounding factors between team types including differences in patient populations, pathologies and severity of illness, or the unit’s work environment and processes may have affected results.
Our work underscores the importance of paying careful attention to specific components and monitoring for unintended consequences in a complex intervention such as cohorting to allow subsequent refinement. Further studies to assess the interplay between models of care, their impact on interruptions, multitasking, errors and clinician burnout may be necessary. Such investigations will be critical to support the evolution of hospital medicine that enables it to be the driver of excellence in care.
Acknowledgments
The authors thank the participating hospitalists, research assistants, Shelly Harrison, Joni Godfrey, Mark Luetkemeyer, Deanne Kashiwagi, Tammy Kemlage, Dustin Hertel and Adeel Zaidi for their enthusiasm and support. The authors also thank Ann Cottingham, Rich Frankel and Greg Sachs from the ASPIRE program for their guidance and vision. Dr. Weiner is Chief of Health Services Research and Development at the Richard L. Roudebush Veterans Affairs Medical Center in Indianapolis, Indiana.
Disclaimer
The views expressed in this article are those of the authors and do not necessarily represent the views of the U.S. Department of Veterans Affairs.
1. O’Leary KJ, Johnson JK, Manojlovich M, Astik GJ, Williams MV. Use of unit-based interventions to improve the quality of care for hospitalized medical patients: a national survey. Jt Comm J Qual Patient Saf. 2017;43(11):573-579. https://doi.org/10.1016/j.jcjq.2017.05.008
2. Stein J, Payne C, Methvin A, et al. Reorganizing a hospital ward as an accountable care unit. J Hosp Med. 2015;10(1):36-40. https://doi.org/10.1002/jhm.2284.
3. Kara A, Johnson CS, Nicley A, Niemeier MR, Hui SL. Redesigning inpatient care: testing the effectiveness of an accountable care team model. J Hosp Med. 2015;10(12):773-779. https://doi.org/10.1002/jhm.2432.
4. Tipping MD, Forth VE, Magill DB, Englert K, Williams MV. Systematic review of time studies evaluating physicians in the hospital setting. J Hosp Med. 2010;5(6):353-359. https://doi.org/10.1002/jhm.647.
5. O’Leary KJ, Liebovitz DM, Baker DW. How hospitalists spend their time: Insights on efficiency and safety. J Hosp Med. 2006;1(2):88-93. https://doi.org/10.1002/jhm.88.
6. Tipping MD, Forth VE, O’Leary KJ, et al. Where did the day go? A time-motion study of hospitalists. J Hosp Med. 2010;5(6):323-328. https://doi.org/10.1002/jhm.790.
7. Rothberg MB, Steele JR, Wheeler J, Arora A, Priya A, Lindenauer PK. The relationship between time spent communicating and communication outcomes on a hospital medicine service. J Gen Intern Med. 2012;27(2):185-189. https://doi.org/10.1007/s11606-011-1857-8.
8. Hill-rom.com. (2019). Staff Locating | hill-rom.com. [online] Available at: https://www.hill-rom.com/ca/Products/Products-by-Category/Clinical-Workflow-Solutions/Hill-Rom-Staff-Locating/. Accessed July 7, 2019.
9. Weigl M, Müller A, Vincent C, Angerer P, Sevdalis N. The association of workflow interruptions and hospital doctors’ workload: a prospective observational study. BMJ Qual Saf. 2012;21(5):399-407. https://doi.org/10.1136/bmjqs-2011-000188.
10. Harris PA, Taylor R, Thielke R, Payne J, Gonzalez N, Conde JG. Research electronic data capture (REDCap)—A metadata-driven methodology and workflow process for providing translational research informatics support. J Biomed Inform. 2009;42(2):377-381. https://doi.org/10.1016/j.jbi.2008.08.010.
11. Snijders T, Bosker R. Multilevel Analysis. 2nd ed. London: Sage Publications; 2012.
12. Pourhoseingholi M, Baghestani A, Vahedi M. How to control confounding effects by statistical analysis. Gastroenterol Hepatol Bed Bench. 2012;5(2):79-83.
13. Huang KT, Minahan J, Brita-Rossi P, et al. All together now: impact of a regionalization and bedside rounding initiative on the efficiency and inclusiveness of clinical rounds. J Hosp Med. 2017;12(3):150-156. https://doi.org/10.12788/jhm.2696.
14. Mueller SK, Schnipper JL, Giannelli K, Roy CL, Boxer R. Impact of regionalized care on concordance of plan and preventable adverse events on general medicine services. J Hosp Med. 2016;11(9):620-627. https://doi.org/10.1002/jhm.2566.
15. O’Leary KJ, Wayne DB, Landler MP, et al. Impact of localizing physicians to hospital units on nurse—physician communication and agreement on the plan of care. J Gen Intern Med. 2009;24(11):1223-1227. https://doi.org/10.1007/s11606-009-1113-7.
16. Singh S, Tarima S, Rana V, et al. Impact of localizing general medical teams to a single nursing unit. J Hosp Med. 2012;7(7):551-556. https://doi.org/10.1002/jhm.1948.
17. Singh S, Fletcher KE. A qualitative evaluation of geographical localization of hospitalists: how unintended consequences may impact quality. J Gen Intern Med. 2014;29(7):1009-1016. https://doi.org/10.1007/s11606-014-2780-6.
18. Kara A, Johnson CS, Hui SL, Kashiwagi D. Hospital-based clinicians’ perceptions of geographic cohorting: identifying opportunities for improvement. Am J Med Qual. 2018;33(3):303-312. https://doi.org/10.1177/1062860617745123.
19. Lown BA. Seven guiding commitments: making the U.S. healthcare system more compassionate. J Patient Exp. 2014;1(2):6-15. https://doi.org/10.1177/237437431400100203.
20. Wenger N, Méan M, Castioni J, Marques-Vidal P, Waeber G, Garnier A. Allocation of internal medicine resident time in a swiss hospital: a time and motion study of day and evening shifts. Ann Intern Med. 2017;166(8):579-586. https://doi.org/10.7326/m16-2238.
21. Chen L, Guo U, Illipparambil LC, et al. Racing against the clock: internal medicine residents’ time spent on electronic health records. J Graduate Med Educ. 2015;8(1):39-44. https://doi.org/10.4300/jgme-d-15-00240.1.
22. Erickson SM, Rockwern B, Koltov M, McLean R. Putting patients first by reducing administrative tasks in health care: a position paper of the American College of Physicians. Ann Intern Med. 2017;166:659-661. https://doi.org/10.7326/m16-2697.
23. Poissant L, Pereira J, Tamblyn R, Kawasumi Y. The impact of electronic health records on time efficiency of physicians and nurses: a systematic review. J Am Med Inform Assn. 2005;12(5):505-516. https://doi.org/10.1197/jamia.m1700.
24. Coiera E. The science of interruption. Bmj Qual Saf. 2017;21(5):357-360. https://doi.org/10.1136/bmjqs-2012-00078.
25. Chisholm C, Collison E, Nelson D, Cordell W. Emergency department workplace interruptions: are emergency physicians “interrupt-driven” and “multitasking”? Academic Emerg Med. 2000;7(11):1239-1243. https://doi.org/10.1111/j.1553-2712.2000.tb00469.x.
26. Westbrook JI, Ampt A, Kearney L, Rob MI. All in a day’s work: an observational study to quantify how and with whom doctors on hospital wards spend their time. Med J Aust. 2008;188(9):506-509. https://doi.org/10.5694/j.1326-5377.2008.tb01762.x.
27. Westbrook JI, Woods A, Rob MI, Dunsmuir WT, Day RO. Association of interruptions with an increased risk and severity of medication administration errors. Arch Intern Med. 2010;170(8):683-690. https://doi.org/10.1001/archinternmed.2010.65.
28. Weigl M, Müller A, Angerer P, Hoffmann F. Workflow interruptions and mental workload in hospital pediatricians: an observational study. BMC Health Serv Res. 2014;14(1):433. https://doi.org/10.1186/1472-6963-14-433.
29. Shojania KG, Wald H, Gross R. Understanding medical error and improving patient safety in the inpatient setting. Med Clin N Am. 2002;86(4):847-867. https://doi.org/10.1016/s0025-7125(02)00016-0.
30. Kara A, Johnson CS, Hui SL, Kashiwagi D. Hospital-based clinicians’ perceptions of geographic cohorting: identifying opportunities for improvement. J Med Internet Res. 2017;6(3):106286061774512. https://doi.org/10.2196/jmir.6.3.e34.
31. Michtalik HJ, Pronovost PJ, Marsteller JA, Spetz J, Brotman DJ. Developing a model for attending physician workload and outcomes. Jama Intern Med. 2013;173(11):1026-1028. https://doi.org/10.1001/jamainternmed.2013.405.
Geographic cohorting (GCh, also known as “localization” or “regionalization”) refers to the practice wherein hospitalists are assigned to a single inpatient unit. Its adoption is increasing and in 2017, 30% of surveyed United States hospital medicine group leaders reported that their clinicians rounded on 1-2 units daily.1 As a component of intervention bundles, GCh is associated with reductions in mortality, length of stay, and costs.2,3
However, details on how GCh affects the hospitalist workday are unknown. Most time-motion studies of inpatient clinicians have reported the experiences of physicians in training with few specifically evaluating the workflow of attending hospitalists.4 Three studies of the attending hospitalist’s workday that were performed a decade ago excluded teams with learners, had patient loads as low as 9.4 per day, and did not differentiate between GCh and non-GCh models.5-7
The objective of this observational study was to describe and compare the workday of GCh and non-GCh hospitalists by using automated geographical-tracking methods supplemented by in-person observations.
METHODS
Setting and Participants
This work was conducted at a large academic center in the Midwestern US which adopted GCh in 2012. During the study, hospitalists staffed 11 GCh and four non-GCh teams. GCh teams aim to maintain ≥80% of their patients on their assigned unit and conduct interprofessional huddles on weekdays.3 Some units specialize in the care of specific populations (eg, patients with oncologic diagnoses), while others serve as general medical or surgical units. Non-GCh teams are assigned patients without regard to location. Resident housestaff are assigned only to GCh teams and residents and advanced practice providers (APPs) are never assigned to the same team. Based on team members, this yielded five distinct team types: GCh-hospitalist, GCh-hospitalist with APP, GCh-hospitalist with resident, non-GCh-hospitalist, and non-GCh-hospitalist with APP. Hospitalists provided verbal consent to participate. The protocol was reviewed and approved by the Indiana University Institutional Review Board. Two complementary observation modalities were used. Locator badges were used to quantify direct and indirect time unobtrusively over long periods. In-person observations were conducted to examine the workday in greater detail. Data were collected between October 2017 and May 2018.
Observations by Locator Badges
Our institution uses a system designed by Hill-Rom® (Cary, North Carolina) to facilitate staff communication. Staff wear the I-Badge® Locator Badge, which emits an infra-red signal.8 Centrally located receivers tabulate time spent by the badge wearer in each location (Appendix Figure 1). Each hospitalist was given a badge to wear at work for a minimum of six weeks, after which the I-Badge® data were downloaded.
Schedules detailing each team’s members and assigned units (if cohorted) were retrieved. For each observed day, the hospitalist was linked to his or her team type and unit. Team lists were retrieved to ascertain patient load at the start of the day. Data sources were merged to categorize observations.
Observation Categories for Locator Badge Data
The I-Badge® data provided details of how much time the hospitalist spent in each location (eg, nursing station, hallways, patient rooms). All observations in patient rooms were considered “direct care” while all other locations were categorized as “Indirect Care”. Observations were also categorized by the intensity of care provided on that unit, which included the Emergency Department (ED), Progressive Care Units (PCU), Medical-Surgical + PCU units (for units having a mixture of Medical-Surgical and PCU beds), and Medical-Surgical units.
In-person Observations
Four research assistants (RAs) were trained until interrater reliability using task times achieved an intraclass correlation coefficient of 0.98. Task categories included direct care (all time with patients), indirect care (computer interactions, communication), professional development, and travel and personal time. Interruptions were defined as “an unplanned and unscheduled task, causing a discontinuation, a noticeable break, or task switch behavior”.9 “Electronic interruptions” were caused by pagers or phones whereas in-person interruptions were “face-to-face” interruptions. When at least two tasks were performed simultaneously, it was considered multitasking. A data collection form created in REDCap was accessed on computer tablets or smartphones10 (Appendix Table 1). To limit each observation period to five hours, two RAs were scheduled each day. Observations were continued until the hospitalist reported that work activities were complete or until 5
Statistical Analysis
Due to the nested structure of the locator badge data, multilevel mode
Univariate three-level models predicting minutes spent in direct care were tested for each predictor. Predictors, described below, were selected due to their hypothesized relation to time spent in direct patient care, or to account statistically for differences among teams due to the observational nature of the study.12 Predictors were: Level 3, hospitalist characteristics (years since medical school, age, gender, international graduate, years at current hospital); Level 2, work day characteristics (number of units visited, number of patients visited, team type, weekday); and Level 1, individual observation characteristics (intensity of care on unit, number of visits to the same patient room per day
For total daily indirect care, a similar modeling process was used. A log normal distribution was used because the data was right-skewed and contained positive values. The restricted maximum likelihood method was used to calculate final estimates for models. Least square mean values for independent variables were subjected to backward transformation for interpretation. Post hoc pairwise comparisons between team types were conducted using Tukey–Kramer tests for direct and indirect care time. Analyses were conducted using SAS software version 9.4 (Cary, North Carolina).
The in-person observations were summarized using descriptive statistics. Exploratory analyses were performed using t-tests and Fisher’s exact tests to compare continuous and categorical variables respectively.
RESULTS
Locator Badge Observations
Participants
The 17 hospitalists had a mean (SD) age of 38 years (6.4); 10 (59%) were male, 7 (41%) were international medical graduates, and 10 (59%) had worked at the hospital ≥5 years. The duration of observation was <45 days for 7 hospitalists, 46-55 days for 4, and >55 days for 6, yielding observations for 666 hospitalist workdays. The mean time since medical school graduation was 13 years. Seven hospitalists were observed only in the GCh model, one was observed only in the non-GCh model, and nine were observed in both.
Team Characteristics
On average, non-GCh teams visited more units per day than GCh teams. Teams with APPs had higher patient loads (Table 1).
Time Observed in Direct and Indirect Care
In total, 10,522 observations were recorded in providing direct care. The average duration of a direct care encounter ranged from 4.1 to 5.8 minutes. The ratio of indirect to direct time ranged from 2.7 to 3.7 (Table 2).
The number of times that a hospitalist visited the same patient room in one day ranged from 1 to 9. Most (84%) of the patient rooms were visited once per day. The odds that a GCh hospitalist would visit a patient more than once per day were 1.8 times higher (95% CI: 1.37, 2.34; P < .0001) than for a non-GCh hospitalist (data not shown).
Predictors Associated with Time Expenditure
Predictors significantly associated with both the duration of direct care encounters and total daily indirect care time included team type and patient count. Predicted time in direct care encounters was highest for the GCh-hospitalist team (9.5 minutes) and lowest for the GCh-hospitalist with residents team (7 minutes). Predicted total indirect care time was highest for the GCh-hospitalist with APP team (160 minutes) while the lowest expenditure in indirect care time was predicted for the non-GCh-hospitalist team (102 minutes). Increasing patient load from 10 to 20 was predicted to decrease the duration of a direct care encounter by one minute (14%) and increase the total indirect care time by a larger amount (39 min, 24%).
The duration of direct care encounters was also inversely related with years since medical school and number of visits made to same patient room. Finally, acuity of care was associated with the duration of direct care encounters with the longest predicted encounters in the ED (9.4 minutes). Physician gender and age, international graduation, years at current hospital, weekday, and the number of units visited in a day were neither associated with direct care time at P value < .05 nor improved model fit and therefore were not retained in the final model (Table 3).
Additional predictors associated with total daily indirect care time included the number of units visited and working on a weekend or holiday. Total time spent in indirect care was predicted to increase as the number of units increased and decrease on weekends or holidays. Hospitalist characteristics were not associated with time in indirect care (Table 4).
In-person Observations
Four hospitalists cohorted to general medical units and four non-GCh hospitalists were observed for one day each, yielding a total of 3,032 minutes of data. These hospitalists were on teams without residents or APPs. On average, GCh hospitalists had 78% of their patients on their assigned unit, rounded on fewer units (3 vs 6) and had two more patients at the start of the day than non-GCh hospitalists (14 vs 12). Age and gender distribution of the GCh and non-GCh hospitalists were similar.
As a percentage of total observed time, GCh hospitalists were noted to spend a larger proportion of the workday in computer interactions vs non-GCh hospitalists (56% vs 39%; P = .005). The proportion of time in other activities or locations was not statistically different between GCh and non-GCh hospitalists, including face-to-face communication (21% vs 15%), multitasking (18% vs 14%), time spent at the nursing station (58% vs 34%), direct care (15% vs 20%), and time traveling (4% vs 11%). The most frequently observed combination of multitasking was computer and phone use (59% of all multitasking) followed by computer use and face-to-face communication (17%; Appendix Figure 2).
The mean duration of an interruption was 1.3 minutes. More interruptions were observed in the GCh group than the non-GCh group (139 vs 102). Interruptions in the GCh group were face-to-face in 62% of instances and electronic in 25%. The remaining 13% were instances in which electronic and face-to-face interruptions occurred simultaneously. In the non-GCh group, 51% of interruptions were face-to-face; 47% were electronic; and 2% were simultaneous. GCh hospitalists were interrupted once every 14 minutes in the morning, with interruption frequency increasing to once every eight minutes in the afternoon. Non-GCh hospitalists were interrupted once every 13 minutes in the morning and saw interruption frequency decrease to once every 17 minutes in the afternoon. The task most frequently interrupted was computer use.
DISCUSSION
Previous investigations have studied the impact of cohorting on outcomes, including the facilitation of bedside rounding, adverse events, agreement between nurses and physicians on the plan of care, productivity, and the number of pages received.13-16 Cohorting’s benefits are theorized to include increased hospitalist time with patients, while its downsides are perceived to include increased interruptions.17,18 Neither has previously been evaluated by direct observation.
Our findings support cohorting’s association with increased hospitalist–patient time. While GCh hospitalists were observed spending 5% less time in direct care than non-GCh hospitalists by in-person observations, this difference did not achieve statistical significance and was unadjusted for hospitalist, patient load, team or patient characteristics. Using the larger badge dataset, the predicted values for time spent in direct care encounters were higher in cohorted teams. Pairwise comparisons consistently trended toward longer durations in cohorted vs noncohorted teams. The notable exception was in cohorted teams with residents, which had the shortest predicted patient visits; however, we did not have noncohorted teams with residents in our study, limiting interpretation. Additionally, the odds of repeat visits to a patient in a single day were almost twice as high in the cohorted vs noncohorted group. The magnitude of this gain, however, is estimated to be a modest 1.2 minutes for a hospitalist only team and 1.7 minutes for a hospitalist with APP team and may be insufficient to provide compassionate, patient-centered care.19
Furthermore, these gains may be eroded if patient loads are high: similar to a previous study, we found that the duration of each patient visit decreased by 14% when the load increased from 10 to 20 patients.6 The expected gains in efficiency from cohorting leads to an expectation that hospitalists can manage more patients, but such reflexive increases should be carefully considered.18
Similar to earlier investigations where hospitalists were found to spend 60 to 69% of the day in indirect care activities,5,6 hospitalists in both cohorted and noncohorted models spent approximately three times more time in indirect than direct care. Cohorting was associated with increased indirect care time. This association was expected as interdisciplinary huddles and increased nursing and physician communication are both related to cohorting.3,14 However, similar to previous reports, in-person observations revealed that the bulk of this indirect time was spent in computer interactions, rather than in interprofessional communication. Interactions with the electronic health record (EHR) consume between one-third to one-half of the day in inpatient settings.20,21 While EHRs are intended to enhance safety, they also fulfill multiple, nonclinical purposes and increase time spent on documentation.22,23 Nonclinical tasks may contribute to clinician burnout and detract from patient centeredness.22 Our findings suggest that cohorting may not offset the burden of these time-intensive EHR tasks. The larger expenditure of time spent in computer interactions observed in the GCh group may be partially explained both by the higher number of patients and the higher frequency of interruptions observed in this group; computer use was the task most frequently observed to be interrupted. While longer tasks are more likely to be interrupted, the interruption in turn further increases the time taken to complete the task.24
The interruption rates we observed are concerning. The hospitalist workday emerges as cognitively intense. GCh hospitalists were noted to be interrupted as frequently as once every eight minutes, a rate more than double that of an earlier investigation and approaching that of ED physicians.5,25,26 Interruptions and multitasking contribute to errors and a perception of increased workload and frustration for clinicians.9,27-29 Although interruptions were pervasive, GCh hospitalists were interrupted more frequently, corroborating a national survey in which hospitalists perceived that cohorting increased face-to-face interruptions.30 The prolonged availability of the cohorted hospitalist on the unit may require different strategies for promoting timely interactions while preserving uninterrupted work time. Our work, however, does not allow us to quantify appropriate and urgent interruptions that reflect improved teamwork and patient safety. Interruptions increase as patient loads increase.25 The contribution to interruptions by the higher patient census on the GCh teams cannot be quantified in this work, but without attention to these details, potential benefits from GCh may be attenuated.
Previous work has delineated variables important in determining hospitalist workload,31 and our work contributes additional considerations. Hospitalist experience and resident presence on cohorted teams was associated with shorter patient visits, while ED encounters were predicted to be the most time intensive. Increasing numbers of units visited in a day was associated with more indirect time, while weekends were associated with a lower burden of indirect care. As expected, APP presence was associated with more time in indirect care as the hospitalist spends time in providing oversight. As noted, cohorting was associated with increases in both direct and indirect care time. These findings may help inform hospital medicine groups. Additionally, attention should be paid to the fact that while support for cohorting stems from investigations in which it was used as part of a bundle of interventions,2,3 in practice, it is often implemented incompletely, with cohorted hospitalists dispersed over several units, or in isolation from other interventions.1
Our work has several limitations. As a single-center investigation, our findings may not be generalizable to other institutions. Second, we did not evaluate clinical outcomes, clinician, patient or nursing satisfaction to assess the effect of cohorting. Third, we cannot comment on whether the observed interruptions were beneficial or detrimental. Finally, while we used statistical control for the measured imbalanced variables between groups, unmeasured confounding factors between team types including differences in patient populations, pathologies and severity of illness, or the unit’s work environment and processes may have affected results.
Our work underscores the importance of paying careful attention to specific components and monitoring for unintended consequences in a complex intervention such as cohorting to allow subsequent refinement. Further studies to assess the interplay between models of care, their impact on interruptions, multitasking, errors and clinician burnout may be necessary. Such investigations will be critical to support the evolution of hospital medicine that enables it to be the driver of excellence in care.
Acknowledgments
The authors thank the participating hospitalists, research assistants, Shelly Harrison, Joni Godfrey, Mark Luetkemeyer, Deanne Kashiwagi, Tammy Kemlage, Dustin Hertel and Adeel Zaidi for their enthusiasm and support. The authors also thank Ann Cottingham, Rich Frankel and Greg Sachs from the ASPIRE program for their guidance and vision. Dr. Weiner is Chief of Health Services Research and Development at the Richard L. Roudebush Veterans Affairs Medical Center in Indianapolis, Indiana.
Disclaimer
The views expressed in this article are those of the authors and do not necessarily represent the views of the U.S. Department of Veterans Affairs.
1. O’Leary KJ, Johnson JK, Manojlovich M, Astik GJ, Williams MV. Use of unit-based interventions to improve the quality of care for hospitalized medical patients: a national survey. Jt Comm J Qual Patient Saf. 2017;43(11):573-579. https://doi.org/10.1016/j.jcjq.2017.05.008
2. Stein J, Payne C, Methvin A, et al. Reorganizing a hospital ward as an accountable care unit. J Hosp Med. 2015;10(1):36-40. https://doi.org/10.1002/jhm.2284.
3. Kara A, Johnson CS, Nicley A, Niemeier MR, Hui SL. Redesigning inpatient care: testing the effectiveness of an accountable care team model. J Hosp Med. 2015;10(12):773-779. https://doi.org/10.1002/jhm.2432.
4. Tipping MD, Forth VE, Magill DB, Englert K, Williams MV. Systematic review of time studies evaluating physicians in the hospital setting. J Hosp Med. 2010;5(6):353-359. https://doi.org/10.1002/jhm.647.
5. O’Leary KJ, Liebovitz DM, Baker DW. How hospitalists spend their time: Insights on efficiency and safety. J Hosp Med. 2006;1(2):88-93. https://doi.org/10.1002/jhm.88.
6. Tipping MD, Forth VE, O’Leary KJ, et al. Where did the day go? A time-motion study of hospitalists. J Hosp Med. 2010;5(6):323-328. https://doi.org/10.1002/jhm.790.
7. Rothberg MB, Steele JR, Wheeler J, Arora A, Priya A, Lindenauer PK. The relationship between time spent communicating and communication outcomes on a hospital medicine service. J Gen Intern Med. 2012;27(2):185-189. https://doi.org/10.1007/s11606-011-1857-8.
8. Hill-rom.com. (2019). Staff Locating | hill-rom.com. [online] Available at: https://www.hill-rom.com/ca/Products/Products-by-Category/Clinical-Workflow-Solutions/Hill-Rom-Staff-Locating/. Accessed July 7, 2019.
9. Weigl M, Müller A, Vincent C, Angerer P, Sevdalis N. The association of workflow interruptions and hospital doctors’ workload: a prospective observational study. BMJ Qual Saf. 2012;21(5):399-407. https://doi.org/10.1136/bmjqs-2011-000188.
10. Harris PA, Taylor R, Thielke R, Payne J, Gonzalez N, Conde JG. Research electronic data capture (REDCap)—A metadata-driven methodology and workflow process for providing translational research informatics support. J Biomed Inform. 2009;42(2):377-381. https://doi.org/10.1016/j.jbi.2008.08.010.
11. Snijders T, Bosker R. Multilevel Analysis. 2nd ed. London: Sage Publications; 2012.
12. Pourhoseingholi M, Baghestani A, Vahedi M. How to control confounding effects by statistical analysis. Gastroenterol Hepatol Bed Bench. 2012;5(2):79-83.
13. Huang KT, Minahan J, Brita-Rossi P, et al. All together now: impact of a regionalization and bedside rounding initiative on the efficiency and inclusiveness of clinical rounds. J Hosp Med. 2017;12(3):150-156. https://doi.org/10.12788/jhm.2696.
14. Mueller SK, Schnipper JL, Giannelli K, Roy CL, Boxer R. Impact of regionalized care on concordance of plan and preventable adverse events on general medicine services. J Hosp Med. 2016;11(9):620-627. https://doi.org/10.1002/jhm.2566.
15. O’Leary KJ, Wayne DB, Landler MP, et al. Impact of localizing physicians to hospital units on nurse—physician communication and agreement on the plan of care. J Gen Intern Med. 2009;24(11):1223-1227. https://doi.org/10.1007/s11606-009-1113-7.
16. Singh S, Tarima S, Rana V, et al. Impact of localizing general medical teams to a single nursing unit. J Hosp Med. 2012;7(7):551-556. https://doi.org/10.1002/jhm.1948.
17. Singh S, Fletcher KE. A qualitative evaluation of geographical localization of hospitalists: how unintended consequences may impact quality. J Gen Intern Med. 2014;29(7):1009-1016. https://doi.org/10.1007/s11606-014-2780-6.
18. Kara A, Johnson CS, Hui SL, Kashiwagi D. Hospital-based clinicians’ perceptions of geographic cohorting: identifying opportunities for improvement. Am J Med Qual. 2018;33(3):303-312. https://doi.org/10.1177/1062860617745123.
19. Lown BA. Seven guiding commitments: making the U.S. healthcare system more compassionate. J Patient Exp. 2014;1(2):6-15. https://doi.org/10.1177/237437431400100203.
20. Wenger N, Méan M, Castioni J, Marques-Vidal P, Waeber G, Garnier A. Allocation of internal medicine resident time in a swiss hospital: a time and motion study of day and evening shifts. Ann Intern Med. 2017;166(8):579-586. https://doi.org/10.7326/m16-2238.
21. Chen L, Guo U, Illipparambil LC, et al. Racing against the clock: internal medicine residents’ time spent on electronic health records. J Graduate Med Educ. 2015;8(1):39-44. https://doi.org/10.4300/jgme-d-15-00240.1.
22. Erickson SM, Rockwern B, Koltov M, McLean R. Putting patients first by reducing administrative tasks in health care: a position paper of the American College of Physicians. Ann Intern Med. 2017;166:659-661. https://doi.org/10.7326/m16-2697.
23. Poissant L, Pereira J, Tamblyn R, Kawasumi Y. The impact of electronic health records on time efficiency of physicians and nurses: a systematic review. J Am Med Inform Assn. 2005;12(5):505-516. https://doi.org/10.1197/jamia.m1700.
24. Coiera E. The science of interruption. Bmj Qual Saf. 2017;21(5):357-360. https://doi.org/10.1136/bmjqs-2012-00078.
25. Chisholm C, Collison E, Nelson D, Cordell W. Emergency department workplace interruptions: are emergency physicians “interrupt-driven” and “multitasking”? Academic Emerg Med. 2000;7(11):1239-1243. https://doi.org/10.1111/j.1553-2712.2000.tb00469.x.
26. Westbrook JI, Ampt A, Kearney L, Rob MI. All in a day’s work: an observational study to quantify how and with whom doctors on hospital wards spend their time. Med J Aust. 2008;188(9):506-509. https://doi.org/10.5694/j.1326-5377.2008.tb01762.x.
27. Westbrook JI, Woods A, Rob MI, Dunsmuir WT, Day RO. Association of interruptions with an increased risk and severity of medication administration errors. Arch Intern Med. 2010;170(8):683-690. https://doi.org/10.1001/archinternmed.2010.65.
28. Weigl M, Müller A, Angerer P, Hoffmann F. Workflow interruptions and mental workload in hospital pediatricians: an observational study. BMC Health Serv Res. 2014;14(1):433. https://doi.org/10.1186/1472-6963-14-433.
29. Shojania KG, Wald H, Gross R. Understanding medical error and improving patient safety in the inpatient setting. Med Clin N Am. 2002;86(4):847-867. https://doi.org/10.1016/s0025-7125(02)00016-0.
30. Kara A, Johnson CS, Hui SL, Kashiwagi D. Hospital-based clinicians’ perceptions of geographic cohorting: identifying opportunities for improvement. J Med Internet Res. 2017;6(3):106286061774512. https://doi.org/10.2196/jmir.6.3.e34.
31. Michtalik HJ, Pronovost PJ, Marsteller JA, Spetz J, Brotman DJ. Developing a model for attending physician workload and outcomes. Jama Intern Med. 2013;173(11):1026-1028. https://doi.org/10.1001/jamainternmed.2013.405.
© 2019 Society of Hospital Medicine
Should the Pendulum Swing Back? More Transfers to the ICU After Implementing Ward-Based High-Flow Nasal Cannula Initiation Protocols for Bronchiolitis
As an appealing, physiologically plausible treatment, humidified oxygen delivery via high-flow nasal cannula (HFNC) has been rapidly adopted for the treatment of bronchiolitis despite weak evidence supporting its routine and early use in hypoxemic infants.1 Although HFNC use has been associated with decreased work of breathing and lower rates of progression to invasive ventilation in some studies, the one large trial published on the topic found no difference between early HFNC and standard oxygen therapy on length of stay in hospital, duration of oxygen therapy, or rates of intubation.2,3 No adequately powered studies have examined the effect of ward-based HFNC initiation on ICU transfer, an outcome that it is designed to prevent.
In this month’s issue of the Journal of Hospital Medicine, Coon et al examine the association between the implementation of ward-based HFNC initiation protocols and subsequent ICU transfer rates.4 Hospitals enrolled in the Pediatric Health Information System database were surveyed about their HFNC use and protocol implementation, with 41 (93% response rate) hospitals replying, 12 of which implemented ward-based HFNC initiation protocols during 2010 to 2016. Administrative data for bronchiolitis encounters were obtained with use of International Classification of Diseases, 9th and 10th Revisions, coding of children aged 3 to 24 months discharged during the respiratory seasons of the study period. The authors used an interrupted time series analysis to study the association between ward-based HFNC protocol initiation and several outcomes, revealing a small but significant increase in ICU transfers (absolute difference, 3.1%; 95% CI, 2.8%-3.4%) and ICU length of stay (absolute difference, 9.1 days per 100 patients; 95% CI 5.1-13.2), but not overall length of stay or use of mechanical ventilation. Modifications to the analysis that account for a learning period during the first season of implementation at each hospital, and for trends among nonadopting hospitals, did not substantially affect the findings.
The authors acknowledged many of the study’s limitations, including its retrospective design, presumption of bronchiolitis discharge code validity, restriction to tertiary care hospitals, and analysis of hospital-level rather than patient-level variables and outcomes. Because the data source does not capture patient-level HFNC use, the number and characteristics of patients receiving HFNC at the centers are unknown. It is also important to note that the 12 included protocols are quite heterogeneous, with differing exclusion criteria, maximum flow rates, and indications for ICU transfer. Given the rapid evolution of ward-based HFNC use for bronchiolitis, these protocols from 2010 to 2016 are already out of date. All of the protocols allowed much lower maximum flow rates (4-10 L/min) than would typically be expected today (usually 2 L/kg per minute, which translates to 10 L/min of flow for a 5-kg child or 20 L/min for a 10-kg child). Many also had time-based criteria prompting ICU transfer (eg, 24 hours without improvement) that are not typically included in more recent protocols. Few had instructions for weaning or discontinuation of HFNC.
In spite of the above limitations, the results of this large, multicenter study advance our understanding of the consequences of ward-based protocols for HFNC initiation. However, it is important to contextualize this work as an examination of the implementation of a technology to a broad population in a specific era, not necessarily a study of the effectiveness of the technology itself.
The pediatric hospital medicine community has long recognized the need for more evidence regarding HFNC use.5-7 Coon et al have highlighted possible unintended consequences, notably increased ICU use, that may be associated with ward-based HFNC implementation on a population basis. This finding mirrors evidence from a recent similarly designed study analyzing Canadian tertiary care centers implementing HFNC administration during 2009 to 2014, though not specifically limited to ward use.8
More recently there has been discussion of how we might deimplement ward-based HFNC protocols. Although it is increasingly clear that HFNC is not a panacea for bronchiolitis, there is not necessarily a problem with the technology; the problem that this study so clearly demonstrates is how we have applied it. We need pragmatic trials of HFNC protocols to understand what parameters should guide HFNC initiation as a rescue treatment; what oxygen and flow settings might prevent ICU transfer; how it should be used in populations that have been largely excluded from trials (ie, children with medical complexity); and how to optimally wean it. With that information we could construct evidence-based, utilitarian HFNC initiation and treatment protocols to maximize benefit and minimize harm and cost.
It is understandable that our desire to help patients has led us to hear the “siren’s call” for this therapy, and indeed we should work on putting some of the “horses back in the barn.”5,6 Until new evidence guides how to best use this technology, institutional practice guidelines for HFNC initiation in ward settings should target children for whom ICU transfer seems very likely (eg, having oxygen saturations not maintained on maximum low-flow oxygen therapy) so that HFNC is not used routinely and that we maximize its cost to benefit ratio. It is important to approach this shift in a thoughtful manner to prevent a pendulum swing to premature universal deimplementation.
1. Piper L, Stalets EL, Statile AM. Clinical practice update: high flow nasal cannula therapy for bronchiolitis outside the ICU in infants. J Hosp Med. 2019;14:E1-E3. https://doi.org/10.12788/jhm.3328.
2. Franklin D, Babl FE, Schlapbach LJ, et al. A randomized trial of high-flow oxygen therapy in infants with bronchiolitis. N Engl J Med. 2018;378(12):1121-1131. https://doi.org/10.1056/nejmoa1714855.
3. Lin J, Zhang Y, Xiong L, Liu S, Gong C, Dai J. High-flow nasal cannula therapy for children with bronchiolitis: a systematic review and meta-analysis. Arch Dis Child. 2019;104(6):564-576. https://doi.org/10.1136/archdischild-2018-315846.
4. Coon ER, G. S, Brady PW. Intensive care unit utilization after adoption of a ward-based high-flow nasal cannula protocol. J Hosp Med. 2020;15(6):325-330. https://doi.org/10.12788/jhm.3456.
5. de Benedictis FM. The Effectiveness of high-flow oxygen therapy and the fascinating song of the sirens. JAMA Pediatr. 2019;173(2):125-126. https://doi.org/10.1001/jamapediatrics.2018.3831.
6. Ralston SL. High-flow nasal cannula therapy for pediatric patients with bronchiolitis: time to put the horse back in the barn [online first]. JAMA Pediatr. 2020. https://doi.org/10.1001/jamapediatrics.2020.0040.
7. Ralston SL, Lieberthal AS, Meissner HC, et al. Clinical practice guideline: the diagnosis, management, and prevention of bronchiolitis. Pediatrics. 2014;134(5):e1474-e1502. https://doi.org/10.1542/peds.2015-2862.
8. Garland H, Miller MR, Gunz AC, Lim RK. High-flow nasal cannula implementation has not reduced intubation rates for bronchiolitis in Canada [online first]. Paediatr Child Health. 2020. https://doi.org/10.1093/pch/pxaa023.
As an appealing, physiologically plausible treatment, humidified oxygen delivery via high-flow nasal cannula (HFNC) has been rapidly adopted for the treatment of bronchiolitis despite weak evidence supporting its routine and early use in hypoxemic infants.1 Although HFNC use has been associated with decreased work of breathing and lower rates of progression to invasive ventilation in some studies, the one large trial published on the topic found no difference between early HFNC and standard oxygen therapy on length of stay in hospital, duration of oxygen therapy, or rates of intubation.2,3 No adequately powered studies have examined the effect of ward-based HFNC initiation on ICU transfer, an outcome that it is designed to prevent.
In this month’s issue of the Journal of Hospital Medicine, Coon et al examine the association between the implementation of ward-based HFNC initiation protocols and subsequent ICU transfer rates.4 Hospitals enrolled in the Pediatric Health Information System database were surveyed about their HFNC use and protocol implementation, with 41 (93% response rate) hospitals replying, 12 of which implemented ward-based HFNC initiation protocols during 2010 to 2016. Administrative data for bronchiolitis encounters were obtained with use of International Classification of Diseases, 9th and 10th Revisions, coding of children aged 3 to 24 months discharged during the respiratory seasons of the study period. The authors used an interrupted time series analysis to study the association between ward-based HFNC protocol initiation and several outcomes, revealing a small but significant increase in ICU transfers (absolute difference, 3.1%; 95% CI, 2.8%-3.4%) and ICU length of stay (absolute difference, 9.1 days per 100 patients; 95% CI 5.1-13.2), but not overall length of stay or use of mechanical ventilation. Modifications to the analysis that account for a learning period during the first season of implementation at each hospital, and for trends among nonadopting hospitals, did not substantially affect the findings.
The authors acknowledged many of the study’s limitations, including its retrospective design, presumption of bronchiolitis discharge code validity, restriction to tertiary care hospitals, and analysis of hospital-level rather than patient-level variables and outcomes. Because the data source does not capture patient-level HFNC use, the number and characteristics of patients receiving HFNC at the centers are unknown. It is also important to note that the 12 included protocols are quite heterogeneous, with differing exclusion criteria, maximum flow rates, and indications for ICU transfer. Given the rapid evolution of ward-based HFNC use for bronchiolitis, these protocols from 2010 to 2016 are already out of date. All of the protocols allowed much lower maximum flow rates (4-10 L/min) than would typically be expected today (usually 2 L/kg per minute, which translates to 10 L/min of flow for a 5-kg child or 20 L/min for a 10-kg child). Many also had time-based criteria prompting ICU transfer (eg, 24 hours without improvement) that are not typically included in more recent protocols. Few had instructions for weaning or discontinuation of HFNC.
In spite of the above limitations, the results of this large, multicenter study advance our understanding of the consequences of ward-based protocols for HFNC initiation. However, it is important to contextualize this work as an examination of the implementation of a technology to a broad population in a specific era, not necessarily a study of the effectiveness of the technology itself.
The pediatric hospital medicine community has long recognized the need for more evidence regarding HFNC use.5-7 Coon et al have highlighted possible unintended consequences, notably increased ICU use, that may be associated with ward-based HFNC implementation on a population basis. This finding mirrors evidence from a recent similarly designed study analyzing Canadian tertiary care centers implementing HFNC administration during 2009 to 2014, though not specifically limited to ward use.8
More recently there has been discussion of how we might deimplement ward-based HFNC protocols. Although it is increasingly clear that HFNC is not a panacea for bronchiolitis, there is not necessarily a problem with the technology; the problem that this study so clearly demonstrates is how we have applied it. We need pragmatic trials of HFNC protocols to understand what parameters should guide HFNC initiation as a rescue treatment; what oxygen and flow settings might prevent ICU transfer; how it should be used in populations that have been largely excluded from trials (ie, children with medical complexity); and how to optimally wean it. With that information we could construct evidence-based, utilitarian HFNC initiation and treatment protocols to maximize benefit and minimize harm and cost.
It is understandable that our desire to help patients has led us to hear the “siren’s call” for this therapy, and indeed we should work on putting some of the “horses back in the barn.”5,6 Until new evidence guides how to best use this technology, institutional practice guidelines for HFNC initiation in ward settings should target children for whom ICU transfer seems very likely (eg, having oxygen saturations not maintained on maximum low-flow oxygen therapy) so that HFNC is not used routinely and that we maximize its cost to benefit ratio. It is important to approach this shift in a thoughtful manner to prevent a pendulum swing to premature universal deimplementation.
1. Piper L, Stalets EL, Statile AM. Clinical practice update: high flow nasal cannula therapy for bronchiolitis outside the ICU in infants. J Hosp Med. 2019;14:E1-E3. https://doi.org/10.12788/jhm.3328.
2. Franklin D, Babl FE, Schlapbach LJ, et al. A randomized trial of high-flow oxygen therapy in infants with bronchiolitis. N Engl J Med. 2018;378(12):1121-1131. https://doi.org/10.1056/nejmoa1714855.
3. Lin J, Zhang Y, Xiong L, Liu S, Gong C, Dai J. High-flow nasal cannula therapy for children with bronchiolitis: a systematic review and meta-analysis. Arch Dis Child. 2019;104(6):564-576. https://doi.org/10.1136/archdischild-2018-315846.
4. Coon ER, G. S, Brady PW. Intensive care unit utilization after adoption of a ward-based high-flow nasal cannula protocol. J Hosp Med. 2020;15(6):325-330. https://doi.org/10.12788/jhm.3456.
5. de Benedictis FM. The Effectiveness of high-flow oxygen therapy and the fascinating song of the sirens. JAMA Pediatr. 2019;173(2):125-126. https://doi.org/10.1001/jamapediatrics.2018.3831.
6. Ralston SL. High-flow nasal cannula therapy for pediatric patients with bronchiolitis: time to put the horse back in the barn [online first]. JAMA Pediatr. 2020. https://doi.org/10.1001/jamapediatrics.2020.0040.
7. Ralston SL, Lieberthal AS, Meissner HC, et al. Clinical practice guideline: the diagnosis, management, and prevention of bronchiolitis. Pediatrics. 2014;134(5):e1474-e1502. https://doi.org/10.1542/peds.2015-2862.
8. Garland H, Miller MR, Gunz AC, Lim RK. High-flow nasal cannula implementation has not reduced intubation rates for bronchiolitis in Canada [online first]. Paediatr Child Health. 2020. https://doi.org/10.1093/pch/pxaa023.
© 2020 Society of Hospital Medicine
Proton Pump Inhibitor Use and Risk of Dementia in the Veteran Population (FULL)
Proton pump inhibitors (PPIs) have become the mainstay of therapy in the treatment of acid-related disorders since their introduction in 1989. Due to their high potency, excellent tolerability, and generic availability, PPIs have largely replaced histamine-2 receptor antagonists for gastric problems. Since they were first released on the market, the use of PPIs has continued to rise in both the hospital and primary care settings.1 However, this rapid growth has led to the concern of overutilization. A study conducted at the Department of Veterans Affairs (VA) Ann Arbor Health Care System found that out of 946 patients in the ambulatory care setting taking PPIs, only 35% were appropriately prescribed PPIs.2
Although the short-term adverse effects of PPI use seem minimal, chronic PPI use consequences are a growing concern. Chronic PPI use is associated with increased risks of osteoporosis, pneumonia, and Clostridium difficile infections.3 Another long-term risk that has been associated with chronic PPI use is dementia. Dementia is a cognitive syndrome that is characterized by a progressive decline beyond what is expected in normal aging in 1 or more of the cognitive domains of memory, language, orientation, learning capacity, executive function, or social cognition.4 Because it interferes with activities of daily living, dementia is a major cause of disability in the elderly and is an immense burden for caregivers. Currently, about 47 million people globally live with dementia.5 This number is projected to nearly triple by 2050 to 132 million.5 With no cure, identification of risk factors and creation of protective measures are critical in decreasing the prevalence of dementia.
Although the exact pathophysiology behind the link between PPIs and dementia is unknown, several theories exist. One such theory is that PPI-induced vitamin B12 deficiency leads to cognitive decline.6,7 Another theory suggests that PPIs can directly cause dementia by inhibiting enzymes that normally degrade β amyloid.8 This leads to increased levels of β-amyloid plaques, which is a known characteristic of dementia patients. This theory is derived from animal studies that have shown increased amyloid levels in the brains of mice given PPIs.8
Current studies are conflicting regarding the association between PPIs and dementia. Two German prospective, cohort studies found statistically significant increased risks of dementia in patients taking PPIs with hazard ratios (HR) of 1.38 (95% CI, 1.04-1.83) and 1.44 (95% CI, 1.36-1.52), respectively.9,10 A study conducted in Taiwan also found an increased risk of dementia among PPI users with a HR of 1.22 (95% CI, 1.05-1.42).11 On the contrary, other studies have failed to show an increased risk of dementia with PPI use. In fact, Goldstein and colleagues found a decreased risk of dementia in PPI users with a HR of 0.78 (95% CI, 0.76-0.93).12 This study was an observational study conducted in the US using data from the National Alzheimer’s Coordinating Center database.12 Another recent retrospective study conducted in Finland showed that PPI use was not associated with a significantly increased risk of Alzheimer disease.13
Much is unknown about the cause of dementia, and no curative treatment exists. Investigation into potential risk factors for dementia can lead to the development of preventative measures, which can lead to significant improvement in quality of life for both patients and caregivers. Current studies regarding the association between PPIs and dementia are conflicting, and to our knowledge, no study analyzing the effects of PPIs and dementia has been conducted within the veteran population specifically. The objective of the current study is to investigate the association between PPI use and dementia in the veteran population.
Methods
This study is a retrospective, cohort, single-center, chart review study conducted at the Sioux Falls Veteran Affairs Health Care System (SFVAHCS). Data were extracted from the VA electronic health record (EHR) from January 1, 2005 through December 31, 2015. The study included both currently living and deceased veterans who received ≥ 2 documented outpatient visits at the SFVAHCS during the study time frame. Patients also had to be aged ≥ 60 years at the start of the study period. Patients were excluded if they received only a ≤ 30-day PPI prescription. Patients with dementia related to head trauma, acute intoxication, or other known diseases were excluded.
To analyze the primary endpoint of association between PPI use and dementia, the study compared the rate of dementia in a cohort of veterans who had received an outpatient prescription for a PPI within the study time frame vs the rate of dementia in a random, equal number of veterans who had never been prescribed PPIs within the study time frame. In this study, veterans were classified as having dementia if they had a diagnosis of dementia based on ICD-9 or ICD-10 codes (Table 1), or if they had been prescribed medications used to treat dementia (donepezil, ergoloid mesylates, galantamine, memantine, and rivastigmine).
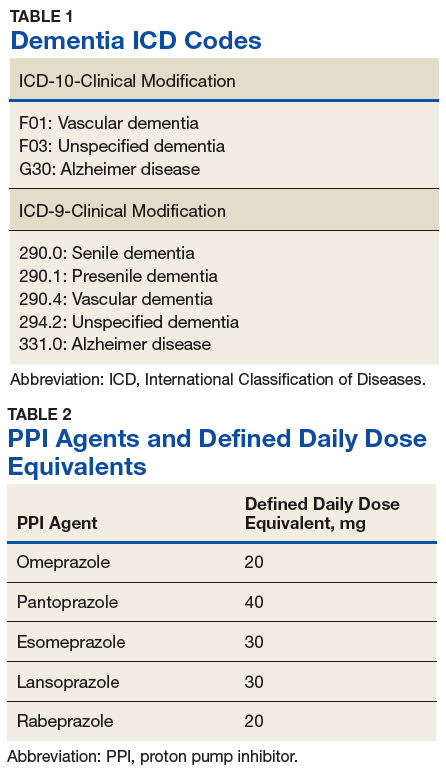
Secondary endpoints included analysis of the effects of PPI agent, PPI dose, and PPI duration on the risk of dementia. For the PPI dose analysis, cumulative doses were converted into defined daily doses (DDDs) using the World Health Organization calculation to equalize the different potencies of PPI agents (Table 2).14 In addition, the effect of PPI use on vitamin B12 levels was analyzed as an exploratory endpoint to investigate the hypothesis that PPI may be associated with vitamin B12 deficiency, which in turn may be associated with dementia.6,7
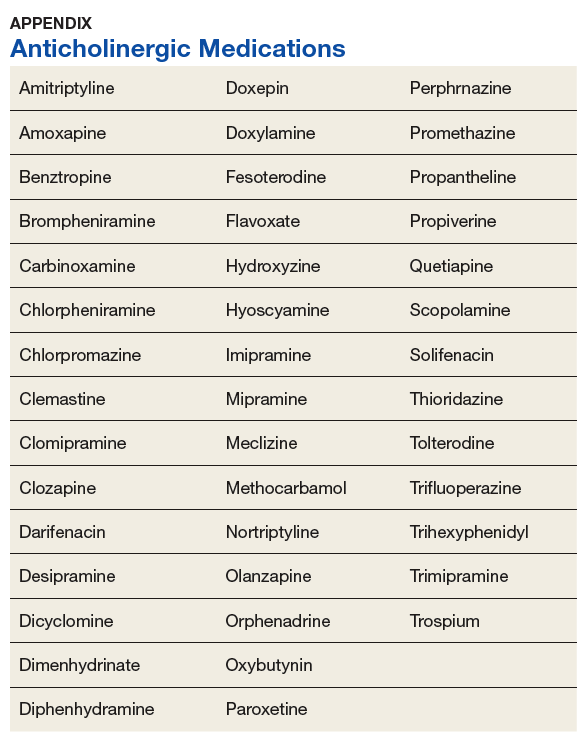
Baseline characteristics were collected to determine the variability between the treatment and control group. Data collected included age, gender, past medical history of diseases that may increase risk of dementia, and anticholinergic drug use. Anticholinergic drugs were included if they were classified as having “definite anticholinergic effects” based on the Aging Brain Care Anticholinergic Burden Scale (Appendix).15
Statistical Analysis
The primary endpoint was analyzed using a χ2 for association test. For the secondary endpoints, a χ2 for association test was used for endpoints with nominal data, and the Mood median test was used for endpoints with continuous data. The exploratory endpoint analyzing vitamin B12 levels was analyzed with the Mood median test. A P value of < .05 was defined as being statistically significant. Power analysis was not performed since all veterans who met the criteria were included in the study.
Results
Records of 23,656 veterans were included in the study with 11,828 veterans in both the PPI cohort and the non-PPI cohort (Table 3).
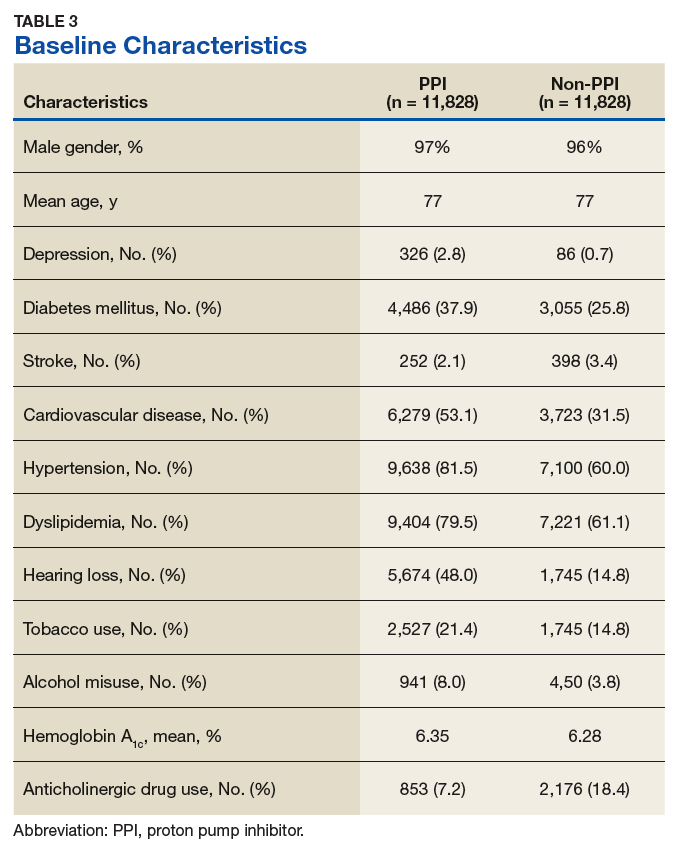
Primary Endpoint
Within the PPI group, 1,119 (9.5%) veterans had dementia compared with only 740 (6.3%) veterans in the non-PPI group. There was a statistically significant association between PPI use and dementia (P < .001). These results yielded an odds ratio of 1.55 for dementia risk in PPI users vs nonusers and a relative risk increase of 51.4% for dementia risk with PPI use compared with no PPI use.
Secondary Endpoints
Users of rabeprazole had the highest rate of dementia (12.8%), followed by lansoprazole (10.9%), omeprazole (9.7%), esomeprazole (7.7%), and pantoprazole (7.0%). The rate of dementia for non-PPI users was 6.3% (P < .001). The median cumulative doses of PPIs were not significant: 597 DDDs (95% CI, 540-630) in the dementia group vs 570 DDDs (95% CI, 540-624) in the nondementia group (P = .79). The median cumulative duration of PPI use in the dementia group was 4.6 years (95% CI, 4.25-4.92) vs 5.3 years (95% CI, 5.08-5.42) in the nondementia group (P < .001).
Exploratory Endpoint
The median B12 level in the PPI group was 521 pg/mL (95% CI, 509-533) compared with 480 pg/mL (95% CI, 465-496) in the non-PPI group (P < .001). However, both groups fell within the normal range for vitamin B12 (200-900 pg/mL).16
Discussion
The aim of this study was to determine whether an association existed between PPI use and dementia. This study showed a statistically significant association between PPI use and dementia within the veteran population. This study also showed a significant association between specific PPI agents and dementia. When analyzing the individual PPI agents, the rabeprazole group yielded the strongest relationship. However, this study was not powered to evaluate and compare risks of dementia between individual PPI agents. More data are needed to determine statistical and clinical significance of associations between individual PPI agents and risk of dementia.
The veterans with dementia had a higher median cumulative PPI dose than did the veterans without dementia; however, the results were not statistically significant. Therefore, the data cannot correlate higher doses of PPI use to increased risk of dementia.
The cumulative duration of PPI use was statistically significant but opposite of the expected outcome. The dementia group had a lower median lifetime duration of PPI use compared with that of the nondementia group. It is difficult to determine the reason for this outcome, but it seems that for this study population, a longer duration of PPI use was not associated with an increased risk of dementia.
Finally, the exploratory endpoint analyzed vitamin B12 levels, since it has been shown that PPI use can lead to vitamin B12 deficiency and that B12 deficiency can lead to dementia.6-8 This study found that the dementia group had significantly higher vitamin B12 levels than the nondementia group. These data suggest that PPI use may not be associated with vitamin B12 deficiency. However, it is important to note that this study was unable to collect data on the use of vitamin B12 supplementation due to the unreliability of over-the-counter (OTC) and non-VA medication use records. Therefore, it is possible that the PPI group had higher rates of B12 deficiency but were effectively treated with B12 supplementation. More research is needed to determine the exact relationship between PPI use, vitamin B12 deficiency, and dementia risk.
Strengths/Limitations
Strengths of this study that support its findings include the large population size. Additionally, the use of the VA EHR allowed for a complete drug dispensing history to be collected, which improves reliability of the data.
This study also had some limitations. First, the causal relationship of PPI use and dementia cannot be proven using a retrospective cohort design. This study’s design can show association, but it cannot prove causation. Also, due to the retrospective design, exposure to PPI use could not be randomized; thus, correlation between PPI use and dementia may be explained by confounding variables that are not captured within this study. This is especially true since the baseline characteristics were not equally distributed between the 2 groups. In fact, the PPI group had higher rates of many clinical comorbidities. This imbalance may have skewed the results of the primary endpoint. Lastly, OTC PPI use and non-VA PPI prescriptions were not available. Therefore, some of the patients included in the non-PPI group may have been PPI users if they received PPIs from OTC or non-VA sources, which could skew the results.
Conclusion
This study showed a significant association between PPI use and dementia within the veteran study population. The study also showed a significant association between PPI use and dementia within the secondary endpoint of individual PPI agent. Higher cumulative dose and duration of PPI use did not seem to increase risk of dementia. Finally, PPI use was not associated with significantly low vitamin B12 levels. More studies are needed to determine causation of dementia and its risk factors.
Acknowledgments
This material is the result of work supported with resources and the use of facilities at the Sioux Falls VA Health Care System.
1. Savarino V, Dulbecco P, de Bortoli N, Ottonello A, Savarino E. The appropriate use of proton pump inhibitors (PPIs): need for a reappraisal. Eur J Intern Med. 2017;37:19-24.
2. Heidelbaugh J, Goldberg K, Inadomi J. Magnitude and economic effect of overuse of antisecretory therapy in the ambulatory care setting. Am J Manag Care. 2010;16(9):e228-e234.
3. Heidelbaugh JJ, Kim AH, Chang R. Walker PC. Overutilization of proton-pump inhibitors: what the clinician needs to know. Therap Adv Gastroenterol. 2012;5(4):219-232.
4. American Psychiatric Association. Diagnostic and Statistical Manual of Mental Disorders, (DSM-5). American Psychiatric Association: Washington, DC; 2013.
5. World Health Organization. Dementia. http://www.who.int/mediacentre/factsheets/fs362/en/. Published December 12, 2017. Accessed March 10, 2019.
6. Vogiatzoglou A, Smith AD, Nurk E, et al. Cognitive function in an elderly population: interaction between vitamin B12 status, depression, and apolipoprotein E ε4: the Hordaland Homocysteine Study. Psychosom Med. 2013;75(1):20-29.
7. Lam JR, Schneider JL, Zhao W, Corley DA. Proton pump inhibitor and histamine 2 receptor antagonist use and vitamin B12 deficiency. JAMA. 2013;310(22):2435-2442.
8. Badiola N, Alcalde V, Pujol A, et al. The proton-pump inhibitor lansoprazole enhances amyloid beta production. PLoS One. 2013;8(3):e58837.
9. Haenisch B, von Holt K, Wiese B, et al. Risk of dementia in elderly patients with the use of proton pump inhibitors. Eur Arch Psychiatry Clin Neurosci. 2015;265(5):419-428.
10. Gomm W, von Holt K, Thomé F, et al. Association between proton pump inhibitors with risk of dementia. A pharmacoepidemiological claims data analysis. JAMA Neurol. 2016;73(4):410-416.
11. Tai SY, Chien CY, Wu DC, et al. Risk of dementia from proton pump inhibitor use in Asian population: a nationwide cohort study in Taiwan. PLoS One. 2017;12(2):e0171006.
12. Goldstein FC, Steenland K, Zhao L, Wharton W, Levey AI, Hajjar I. Proton pump inhibitors and risk of mild cognitive impairment and dementia. J Am Geriatr Soc. 2017;65(9):1969-1674.
13. Taipale H, Tolppanen AM, Tiihonen M. Tanskanen A, Tiihonen J, Hartikainen S. No association between proton pump inhibitor use and risk of Alzheimer’s disease. Am J Gastroenterol. 2017;112(12):1801-1808.
14. World Health Organization Collaborating Centre for Drug Statistics Methodology. Definition and general considerations. https://www.whocc.no/ddd/definition_and_general_considera/. Updated February 7, 2018. Accessed March 13, 2019.
15. Indiana University Center for Aging Research, Aging Brain Program. Anticholinergic cognitive burden scale. http://www.idhca.org/wp-content/uploads/2018/02/DESAI_ACB_scale_-_Legal_size_paper.pdf. Updated 2012. Accessed March 10, 2019.
16. US National Library of Medicine, MedlinePlus. Vitamin B12 level. https://medlineplus.gov/ency/article/003705.htm. Updated March 7, 2019. Accessed March 13, 2019.
Proton pump inhibitors (PPIs) have become the mainstay of therapy in the treatment of acid-related disorders since their introduction in 1989. Due to their high potency, excellent tolerability, and generic availability, PPIs have largely replaced histamine-2 receptor antagonists for gastric problems. Since they were first released on the market, the use of PPIs has continued to rise in both the hospital and primary care settings.1 However, this rapid growth has led to the concern of overutilization. A study conducted at the Department of Veterans Affairs (VA) Ann Arbor Health Care System found that out of 946 patients in the ambulatory care setting taking PPIs, only 35% were appropriately prescribed PPIs.2
Although the short-term adverse effects of PPI use seem minimal, chronic PPI use consequences are a growing concern. Chronic PPI use is associated with increased risks of osteoporosis, pneumonia, and Clostridium difficile infections.3 Another long-term risk that has been associated with chronic PPI use is dementia. Dementia is a cognitive syndrome that is characterized by a progressive decline beyond what is expected in normal aging in 1 or more of the cognitive domains of memory, language, orientation, learning capacity, executive function, or social cognition.4 Because it interferes with activities of daily living, dementia is a major cause of disability in the elderly and is an immense burden for caregivers. Currently, about 47 million people globally live with dementia.5 This number is projected to nearly triple by 2050 to 132 million.5 With no cure, identification of risk factors and creation of protective measures are critical in decreasing the prevalence of dementia.
Although the exact pathophysiology behind the link between PPIs and dementia is unknown, several theories exist. One such theory is that PPI-induced vitamin B12 deficiency leads to cognitive decline.6,7 Another theory suggests that PPIs can directly cause dementia by inhibiting enzymes that normally degrade β amyloid.8 This leads to increased levels of β-amyloid plaques, which is a known characteristic of dementia patients. This theory is derived from animal studies that have shown increased amyloid levels in the brains of mice given PPIs.8
Current studies are conflicting regarding the association between PPIs and dementia. Two German prospective, cohort studies found statistically significant increased risks of dementia in patients taking PPIs with hazard ratios (HR) of 1.38 (95% CI, 1.04-1.83) and 1.44 (95% CI, 1.36-1.52), respectively.9,10 A study conducted in Taiwan also found an increased risk of dementia among PPI users with a HR of 1.22 (95% CI, 1.05-1.42).11 On the contrary, other studies have failed to show an increased risk of dementia with PPI use. In fact, Goldstein and colleagues found a decreased risk of dementia in PPI users with a HR of 0.78 (95% CI, 0.76-0.93).12 This study was an observational study conducted in the US using data from the National Alzheimer’s Coordinating Center database.12 Another recent retrospective study conducted in Finland showed that PPI use was not associated with a significantly increased risk of Alzheimer disease.13
Much is unknown about the cause of dementia, and no curative treatment exists. Investigation into potential risk factors for dementia can lead to the development of preventative measures, which can lead to significant improvement in quality of life for both patients and caregivers. Current studies regarding the association between PPIs and dementia are conflicting, and to our knowledge, no study analyzing the effects of PPIs and dementia has been conducted within the veteran population specifically. The objective of the current study is to investigate the association between PPI use and dementia in the veteran population.
Methods
This study is a retrospective, cohort, single-center, chart review study conducted at the Sioux Falls Veteran Affairs Health Care System (SFVAHCS). Data were extracted from the VA electronic health record (EHR) from January 1, 2005 through December 31, 2015. The study included both currently living and deceased veterans who received ≥ 2 documented outpatient visits at the SFVAHCS during the study time frame. Patients also had to be aged ≥ 60 years at the start of the study period. Patients were excluded if they received only a ≤ 30-day PPI prescription. Patients with dementia related to head trauma, acute intoxication, or other known diseases were excluded.
To analyze the primary endpoint of association between PPI use and dementia, the study compared the rate of dementia in a cohort of veterans who had received an outpatient prescription for a PPI within the study time frame vs the rate of dementia in a random, equal number of veterans who had never been prescribed PPIs within the study time frame. In this study, veterans were classified as having dementia if they had a diagnosis of dementia based on ICD-9 or ICD-10 codes (Table 1), or if they had been prescribed medications used to treat dementia (donepezil, ergoloid mesylates, galantamine, memantine, and rivastigmine).
Secondary endpoints included analysis of the effects of PPI agent, PPI dose, and PPI duration on the risk of dementia. For the PPI dose analysis, cumulative doses were converted into defined daily doses (DDDs) using the World Health Organization calculation to equalize the different potencies of PPI agents (Table 2).14 In addition, the effect of PPI use on vitamin B12 levels was analyzed as an exploratory endpoint to investigate the hypothesis that PPI may be associated with vitamin B12 deficiency, which in turn may be associated with dementia.6,7
Baseline characteristics were collected to determine the variability between the treatment and control group. Data collected included age, gender, past medical history of diseases that may increase risk of dementia, and anticholinergic drug use. Anticholinergic drugs were included if they were classified as having “definite anticholinergic effects” based on the Aging Brain Care Anticholinergic Burden Scale (Appendix).15
Statistical Analysis
The primary endpoint was analyzed using a χ2 for association test. For the secondary endpoints, a χ2 for association test was used for endpoints with nominal data, and the Mood median test was used for endpoints with continuous data. The exploratory endpoint analyzing vitamin B12 levels was analyzed with the Mood median test. A P value of < .05 was defined as being statistically significant. Power analysis was not performed since all veterans who met the criteria were included in the study.
Results
Records of 23,656 veterans were included in the study with 11,828 veterans in both the PPI cohort and the non-PPI cohort (Table 3).
Primary Endpoint
Within the PPI group, 1,119 (9.5%) veterans had dementia compared with only 740 (6.3%) veterans in the non-PPI group. There was a statistically significant association between PPI use and dementia (P < .001). These results yielded an odds ratio of 1.55 for dementia risk in PPI users vs nonusers and a relative risk increase of 51.4% for dementia risk with PPI use compared with no PPI use.
Secondary Endpoints
Users of rabeprazole had the highest rate of dementia (12.8%), followed by lansoprazole (10.9%), omeprazole (9.7%), esomeprazole (7.7%), and pantoprazole (7.0%). The rate of dementia for non-PPI users was 6.3% (P < .001). The median cumulative doses of PPIs were not significant: 597 DDDs (95% CI, 540-630) in the dementia group vs 570 DDDs (95% CI, 540-624) in the nondementia group (P = .79). The median cumulative duration of PPI use in the dementia group was 4.6 years (95% CI, 4.25-4.92) vs 5.3 years (95% CI, 5.08-5.42) in the nondementia group (P < .001).
Exploratory Endpoint
The median B12 level in the PPI group was 521 pg/mL (95% CI, 509-533) compared with 480 pg/mL (95% CI, 465-496) in the non-PPI group (P < .001). However, both groups fell within the normal range for vitamin B12 (200-900 pg/mL).16
Discussion
The aim of this study was to determine whether an association existed between PPI use and dementia. This study showed a statistically significant association between PPI use and dementia within the veteran population. This study also showed a significant association between specific PPI agents and dementia. When analyzing the individual PPI agents, the rabeprazole group yielded the strongest relationship. However, this study was not powered to evaluate and compare risks of dementia between individual PPI agents. More data are needed to determine statistical and clinical significance of associations between individual PPI agents and risk of dementia.
The veterans with dementia had a higher median cumulative PPI dose than did the veterans without dementia; however, the results were not statistically significant. Therefore, the data cannot correlate higher doses of PPI use to increased risk of dementia.
The cumulative duration of PPI use was statistically significant but opposite of the expected outcome. The dementia group had a lower median lifetime duration of PPI use compared with that of the nondementia group. It is difficult to determine the reason for this outcome, but it seems that for this study population, a longer duration of PPI use was not associated with an increased risk of dementia.
Finally, the exploratory endpoint analyzed vitamin B12 levels, since it has been shown that PPI use can lead to vitamin B12 deficiency and that B12 deficiency can lead to dementia.6-8 This study found that the dementia group had significantly higher vitamin B12 levels than the nondementia group. These data suggest that PPI use may not be associated with vitamin B12 deficiency. However, it is important to note that this study was unable to collect data on the use of vitamin B12 supplementation due to the unreliability of over-the-counter (OTC) and non-VA medication use records. Therefore, it is possible that the PPI group had higher rates of B12 deficiency but were effectively treated with B12 supplementation. More research is needed to determine the exact relationship between PPI use, vitamin B12 deficiency, and dementia risk.
Strengths/Limitations
Strengths of this study that support its findings include the large population size. Additionally, the use of the VA EHR allowed for a complete drug dispensing history to be collected, which improves reliability of the data.
This study also had some limitations. First, the causal relationship of PPI use and dementia cannot be proven using a retrospective cohort design. This study’s design can show association, but it cannot prove causation. Also, due to the retrospective design, exposure to PPI use could not be randomized; thus, correlation between PPI use and dementia may be explained by confounding variables that are not captured within this study. This is especially true since the baseline characteristics were not equally distributed between the 2 groups. In fact, the PPI group had higher rates of many clinical comorbidities. This imbalance may have skewed the results of the primary endpoint. Lastly, OTC PPI use and non-VA PPI prescriptions were not available. Therefore, some of the patients included in the non-PPI group may have been PPI users if they received PPIs from OTC or non-VA sources, which could skew the results.
Conclusion
This study showed a significant association between PPI use and dementia within the veteran study population. The study also showed a significant association between PPI use and dementia within the secondary endpoint of individual PPI agent. Higher cumulative dose and duration of PPI use did not seem to increase risk of dementia. Finally, PPI use was not associated with significantly low vitamin B12 levels. More studies are needed to determine causation of dementia and its risk factors.
Acknowledgments
This material is the result of work supported with resources and the use of facilities at the Sioux Falls VA Health Care System.
1. Savarino V, Dulbecco P, de Bortoli N, Ottonello A, Savarino E. The appropriate use of proton pump inhibitors (PPIs): need for a reappraisal. Eur J Intern Med. 2017;37:19-24.
2. Heidelbaugh J, Goldberg K, Inadomi J. Magnitude and economic effect of overuse of antisecretory therapy in the ambulatory care setting. Am J Manag Care. 2010;16(9):e228-e234.
3. Heidelbaugh JJ, Kim AH, Chang R. Walker PC. Overutilization of proton-pump inhibitors: what the clinician needs to know. Therap Adv Gastroenterol. 2012;5(4):219-232.
4. American Psychiatric Association. Diagnostic and Statistical Manual of Mental Disorders, (DSM-5). American Psychiatric Association: Washington, DC; 2013.
5. World Health Organization. Dementia. http://www.who.int/mediacentre/factsheets/fs362/en/. Published December 12, 2017. Accessed March 10, 2019.
6. Vogiatzoglou A, Smith AD, Nurk E, et al. Cognitive function in an elderly population: interaction between vitamin B12 status, depression, and apolipoprotein E ε4: the Hordaland Homocysteine Study. Psychosom Med. 2013;75(1):20-29.
7. Lam JR, Schneider JL, Zhao W, Corley DA. Proton pump inhibitor and histamine 2 receptor antagonist use and vitamin B12 deficiency. JAMA. 2013;310(22):2435-2442.
8. Badiola N, Alcalde V, Pujol A, et al. The proton-pump inhibitor lansoprazole enhances amyloid beta production. PLoS One. 2013;8(3):e58837.
9. Haenisch B, von Holt K, Wiese B, et al. Risk of dementia in elderly patients with the use of proton pump inhibitors. Eur Arch Psychiatry Clin Neurosci. 2015;265(5):419-428.
10. Gomm W, von Holt K, Thomé F, et al. Association between proton pump inhibitors with risk of dementia. A pharmacoepidemiological claims data analysis. JAMA Neurol. 2016;73(4):410-416.
11. Tai SY, Chien CY, Wu DC, et al. Risk of dementia from proton pump inhibitor use in Asian population: a nationwide cohort study in Taiwan. PLoS One. 2017;12(2):e0171006.
12. Goldstein FC, Steenland K, Zhao L, Wharton W, Levey AI, Hajjar I. Proton pump inhibitors and risk of mild cognitive impairment and dementia. J Am Geriatr Soc. 2017;65(9):1969-1674.
13. Taipale H, Tolppanen AM, Tiihonen M. Tanskanen A, Tiihonen J, Hartikainen S. No association between proton pump inhibitor use and risk of Alzheimer’s disease. Am J Gastroenterol. 2017;112(12):1801-1808.
14. World Health Organization Collaborating Centre for Drug Statistics Methodology. Definition and general considerations. https://www.whocc.no/ddd/definition_and_general_considera/. Updated February 7, 2018. Accessed March 13, 2019.
15. Indiana University Center for Aging Research, Aging Brain Program. Anticholinergic cognitive burden scale. http://www.idhca.org/wp-content/uploads/2018/02/DESAI_ACB_scale_-_Legal_size_paper.pdf. Updated 2012. Accessed March 10, 2019.
16. US National Library of Medicine, MedlinePlus. Vitamin B12 level. https://medlineplus.gov/ency/article/003705.htm. Updated March 7, 2019. Accessed March 13, 2019.
Early and Accurate Identification of Parkinson Disease Among US Veterans (FULL)
Parkinson disease (PD) affects about 680,000 in the US, including > 110,000 veterans (Caroline Tanner, MD, PhD, unpublished data).1 In the next 10 years, this number is expected to double, in part because of the aging of the US population.1 Although the classic diagnostic criteria emphasize motor symptoms that include tremor, gait disturbance, and paucity of movement, there is increasing recognition that disease pathology begins decades before the development of motor impairment.2
Pathologic studies confirm that by the onset of motor symptoms, at least 30% of nigrostriatal neurons are lost or dysfunctional.3-5 Similarly, the Braak staging hypothesis posits initial deposition of Lewy bodies in the olfactory bulb and the dorsal motor nucleus of the vagus nerve, followed by prion-like spread through the brain stem into the midbrain/substantia nigra, and finally into the cortex (Figure 1).6
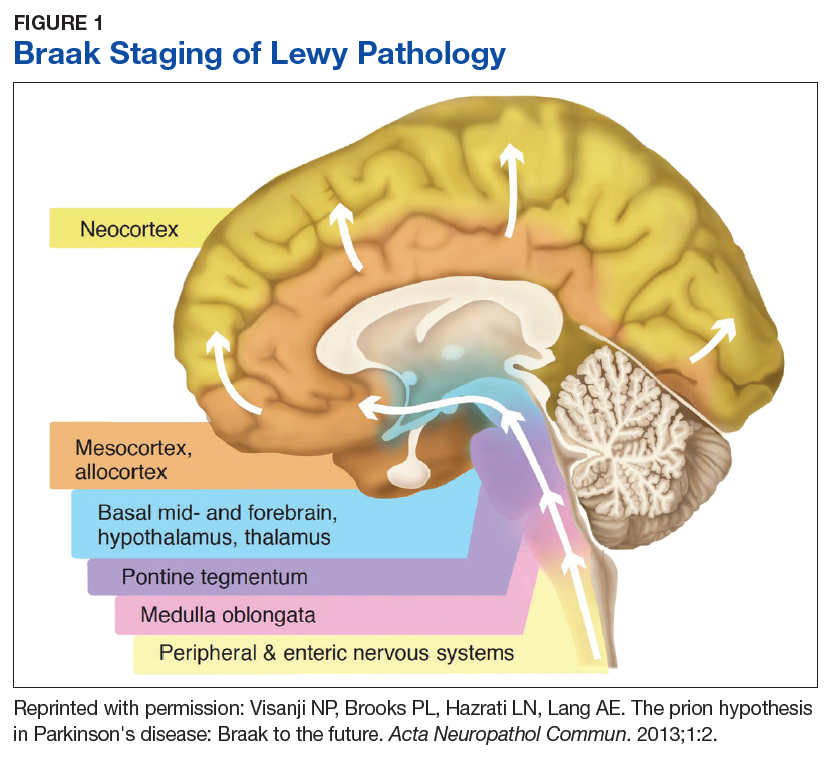
The decades-long prodromal or preclinical phase represents a unique opportunity for early identification of those at highest risk for developing the motor symptoms of Parkinson disease.7 Accurate identification, ideally before the onset of manifest motor disability, would not only improve prognostic counseling of veterans and families, but also could allow for early enrollment into trials of potentially disease-modifying therapeutic agents. Thus, early and accurate identification of PD is an important goal of the care of veterans with potential PD.
Prodromal Symptoms
Prodromal PD, as defined by the International Parkinson Disease and Movement Disorders Society (MDS), focuses on nonmotor symptoms that herald the onset of manifest motor PD.8 The most commonly assessed nonmotor features include olfaction, constipation, sleep disturbance, and mood disorders.
Olfaction is impaired in > 90% of patients with motor PD at the time of diagnosis; by contrast, the prevalence of hyposmia in the general population ranges from 20% to 50%, with higher rates in older adults and in smokers.9-11 Thus, olfaction appears to be a relatively sensitive, though nonspecific, prodromal feature. Importantly, subjective report of hyposmia is poorly reliable, so a number of different tests have been developed for objective assessment of olfactory dysfunction.12 The 12-item Brief Smell Identification Test (B-SIT), derived from the longer University of Pennsylvania Smell Identification Test, is a “scratch-and-sniff” forced multiple choice test that can be self-administered by cooperative patients.13,14 The B-SIT has been validated in multiple ethnic and cultural groups and shows high discrimination between PD subjects and controls.13,15 Of note, olfactory impairment appears to be associated with risk of cognitive decline in PD, further emphasizing the need for accurate assessment to guide prognosis.16
Like hyposmia, constipation can be noted long before the diagnosis of manifest motor PD.17 After adjustment for lifestyle factors, constipated individuals have up to 4.5-fold increased odds of developing PD, and those with constipation suffer worsened disease outcomes and health-related quality of life.17-20 Some groups have demonstrated alterations in gut microbiota of those with prodromal PD, which suggests local inflammatory processes and intestinal permeability may contribute to protein misfolding and disease development.21,22 This also raises the intriguing possibility that dietary alterations may be neuroprotective or neurorestorative, although this has yet to be tested in humans.23,24
Like constipation, mood changes can precede the appearance of manifest motor PD.25,26 Case control studies suggest a higher risk of developing PD among individuals who were previously diagnosed with depression or anxiety, particularly in the 1 to 2 years prior to PD diagnosis.27-29 Both apathy and anxiety are associated with striatal dopamine dysfunction, particularly in the right caudate nucleus, which suggests that mood changes are directly related to disease pathology.30,31
Of the prodromal features, rapid eye movement sleep behavior disorder (RBD) is associated with the highest risk of conversion to motor PD.8 Up to 80% of older men with socalled idiopathic RBD develop a parkinsonian syndrome within 20 years; risk is divided about equally between idiopathic PD and dementia with Lewy bodies (DLB).32 Collateral history from a bed-partner is usually sufficient to make the diagnosis, although, this is often confounded by the prevalence of nightmares in those with posttraumatic stress disorder in the veteran population.32 Thus, in suspected cases, obtaining a polysomnogram can aid in distinguishing between idiopathic PC and DLB.33 Given the specificity of RBD as a marker of synuclein deposition and the high risk of progression to a degenerative syndrome, accurate diagnosis and counseling is imperative.
Each of the prodromal nonmotor features of PD are at best moderately sensitive or specific in isolation, but in concert, they can be used to develop a Parkinson risk score. For instance, the MDS prodromal criteria combine individual likelihood ratios into Bayesian analysis to determine a combined probability of PD, which can be further stratified to probable or possible prodromal PD (probability > 80%, > 50%, respectively).8 These criteria have been applied to several independent cohorts and demonstrate high sensitivity and specificity, especially over time.34,35 Applicability in a veteran population has yet to be determined.
Use of Imaging in Diagnosis
Although clinical diagnostic criteria and prodromal features can improve diagnostic accuracy, it can be extremely challenging to distinguish idiopathic PD from nondegenerative parkinsonism or atypical syndromes (see below). Compared with the gold standard of pathologic assessment, the clinical diagnostic accuracy for PD ranges from 73% for nonexperts to 80% for fellowship-trained movement disorders specialists.36 Thus, objective biomarkers are sought to improve diagnostic accuracy both for clinical care as well as for research purposes, such as enrollment into clinical trials.
Multiple potential imaging biomarkers for preclinical PD can aid in early diagnosis and help differentiate PD from related but distinct disorders. While beyond the scope of this review, these techniques have recently been reviewed.7 Of these, the most widely available and accurate is dopamine transporter (DAT) imaging, which uses a radioiodinated ligand that binds to DAT on striatal dopaminergic terminals; binding is detected through single photon emission computed tomography (SPECT) scanning. Thus, a SPECT DaTscan (GE Healthcare Bio-Sciences, Little Chalfont, England) directly assesses the integrity of the presynaptic nigrostriatal system and is well correlated with severity of motor and nonmotor parkinsonism.37,38
In individuals with suspected prodromal PD, abnormal DaTscans are associated with faster progression to manifest motor PD.39 However, it should be noted that a number of medications, several of which are commonly utilized in the veteran population, can affect the outcome of a DaTscan.40 Some of these medications only mildly affect the outcome, so the physician interpreting the scan should be made aware of their use, while others need to be held for days to weeks so as not to invalidate the DaTscan. DaTscan also do not differentiate between PD and atypical degenerative parkinsonisms such as multiple system atrophy (MSA), DLB, progressive supranuclear palsy (PSP), or corticobasal syndrome (CBS). Nevertheless, these scans can be used to distinguish degenerative parkinsonisms from other conditions that can be difficult to distinguish clinically from PD, including essential tremor, normal pressure hydrocephalus, vascular parkinsonism, or druginduced parkinsonism (DIP).
DIP usually is caused by blockade of postsynaptic dopamine receptors by antipsychotic medications, which are prescribed to as many as 1 in 4 older veterans; antiemetic agents such as metoclopramide are also potential offenders if used chronically.41 The risk of DIP appears to be associated with the D2 binding affinity of the drug. Thus, of the newer atypical antipsychotics, clozapine and quetiapine appear to have the lowest risk, while ziprasidone and aripiprazole have the highest binding affinity and therefore the highest risk.42 In many patients, parkinsonism persists even after discontinuation of the offending agent, suggesting that in at least a subset of patients, DIP may be an “unmasking” of latent PD rather than a true adverse effect of the medication. The prodromal features discussed above can be used to distinguish isolated DIP from unmasked latent PD.43 In a study we conducted in veterans at the Michael J. Crescenz VA Medical Center in Philadelphia, Pennsylvania, hyposmia in particular was shown to be highly predictive of an underlying dopaminergic deficit with an odds ratio of 63.44
Other important considerations in the differential diagnosis of PD are the atypical degenerative parkinsonian syndromes, formerly called Parkinson plus syndromes. These may be further divided into the synucleinopathies (MSA, DLB) or the tauopathies (PSP, CBS), depending on the predominant amyloidogenic protein. Early in the disease, the atypical syndromes and idiopathic PD may be clinically indistinguishable, although the atypical syndromes tend to progress more rapidly and often have a less robust response to levodopa.
Radiologic and fluid biomarkers for the atypical syndromes are under active investigation; at present the most accessible study is magnetic resonance imaging (MRI), which may show characteristic features such as degeneration of the pontocerebellar fibers in MSA or midbrain atrophy in PSP.45,46 By contrast, standard MRI sequences in idiopathic PD are usually normal, although high-resolution (7 tesla) imaging can reveal loss of neuromelanin in the substantia nigra.47 MRI also can be useful in the workup of suspected normal pressure hydrocephalus or vascular parkinsonism, which would show disproportionate ventriculomegaly with transependymal flow, or white matter lesions in the basal ganglia, respectively.
Data-Based Identification of Preclinical PD
The integration of clinical motor or prodromal features with biomarker data has led to the development of several large-scale clinical and administrative databases to identify PD. The Parkinson Progression Markers Initiative initially enrolled only de novo clinically identified people with PD, but it expanded to include a prodromal cohort who are being assessed for rates of conversion to PD.48 Similarly, metabolic imaging can be combined with prodromal symptoms, such as hyposmia or RBD, to predict risk for phenoconversion into manifest motor PD.49
The PREDICT-PD study synthesizes mood symptoms, RBD, smell testing, genotyping, and keyboard-tapping tasks to divide individuals into high-, middle-, and low-risk groups; interim analysis at 3 years of follow-up (N = 842) demonstrated a hazard ratio of 4.39 (95% CI, 1.03-18.68) for the diagnosis of PD in the highrisk group compared with the low-risk group.50 Lastly, administrative claims data for prodromal features, such as constipation, RBD, and mood symptoms, is highly predictive of eventual PD diagnosis.51 VA databases accessed through the Corporate Data Warehouse are complementary sources of information to nonveteranspecific Medicare databases; to our knowledge there has not yet been a comprehensive search of VA databases to identify veterans with preclinical PD.
Risk Factors Associated With Military Service
A number of potential environmental risk factors may increase the risk of developing Parkinson disease for veterans. Perhaps the most commonly recognized is pesticide exposure, particularly given the presumptive service connections established by the VA for Parkinson disease and exposure to Agent Orange or contaminated water at Camp Lejeune.52,53 Both dioxin, the toxic ingredient in Agent Orange, and the solvents trichloroethylene and perchloroethylene, found in the water supply at Camp Lejeune, interfere with mitochondrial function leading to oxidative stress and apoptosis of nigrostriatal neurons.54,55 Other potential exposures, which are not necessarily limited to the veteran population, include rotenone, a phytochemical used to kill fish in reservoirs, and paraquat, an herbicide that may directly promote synuclein aggregation.56,57 Veterans who have reported exposure to these or other environmental chemicals in civilian life should be carefully assessed for the presence of motor PD or prodromal features.
Traumatic brain injury (TBI) also may be a risk factor for PD, which may be particularly relevant for veterans who had served in Iraq or Afghanistan. Retrospective claims data suggest a strong association between PD and recent TBI in the 5 to 10 years prior to motor PD diagnosis.58,59 A recent assessment of combat veterans with TBI found that even mild TBI was associated with a 56% increased risk of PD, while moderate-to-severe TBI was associated with an 83% higher risk of PD.60 The pathologic mechanism for this link is unclear, but post-TBI inflammatory processes may lead to the formation of reactive oxygen species and/or glutamatergic excitotoxicity, thus leading to secondary injury in the nigrostriatal pathway.61 As with prodromal symptoms, the risk of PD related to environmental risk factors may be synergistic; repetitive TBI may be more damaging than a single injury, and a combination of TBI and pesticide exposure markedly increases PD risk beyond the risk of TBI or the risk of pesticides alone.62 Recently, parkinsonism, including Parkinson disease, was recognized as a service connected condition for veterans with a servicerelated moderate or severe TBI.63
Conclusion
Because of the substantial impact on quality of life and disability-adjusted life years, early and accurate identification and management of veterans at risk for PD is an important priority area for the VA. The 10-year cost of PD-related benefits through the VA was estimated at $3.5 billion in fiscal year 2010, and that number is likely to rise in coming years, due to the aging population as well as synergistic effects of independent risk factors described above.64 In response, the VA has created a network of specialty care sites, known as Parkinson Disease Research, Education, and Clinical Centers (PADRECCs) located in Philadelphia, Pennsylvania; Richmond, Virginia; Houston, Texas; West Los Angeles and San Francisco, California; and Seattle, Washington/ Portland, Oregon (www.parkinsons.va.gov).
The PADRECCs are supplemented by a National VA PD Consortium network of VA physicians trained in PD management (Figure 2). Studies, including one investigating care of veterans with PD, have demonstrated that involvement of specialty care services early in the course of PD leads to improved patient outcomes.65,66 In addition to patient-facing resources such as support groups and specialized physical/occupational/speech therapy, PADRECCs and the consortium sites are national leaders in PD education and clinical trials and provide high-quality, multidisciplinary care for veterans with PD.67 Thus, veterans with significant risk factors or prodromal symptoms of PD should be referred into the PADRECC/Consortium network in order to maximize their quality of care and quality of life.
1. Marras C, Beck JC, Bower JH, et al; Parkinson’s Foundation P4 Group. Prevalence of Parkinson’s disease across North America. NPJ Parkinsons Dis. 2018;4:21.
2. Postuma RB, Berg D, Stern M, et al. MDS clinical diagnostic criteria for Parkinson’s disease. Mov Disord. 2015;30(12):1591-1601.
3. Fearnley JM, Lees AJ. Ageing and Parkinson’s disease: substantia nigra regional selectivity. Brain. 1991;114(pt 5):2283-2301.
4. Greffard S, Verny M, Bonnet A-M, et al. Motor score of the Unified Parkinson Disease Rating Scale as a good predictor of Lewy body-associated neuronal loss in the substantia nigra. Arch Neurol. 2006;63(4):584-588.
5. Hilker R, Schweitzer K, Coburger S, et al. Nonlinear progression of Parkinson disease as determined by serial positron emission tomographic imaging of striatal fluorodopa F 18 activity. Arch Neurol. 2005;62(3):378-382.
6. Braak H, Del Tredici K, Rüb U, de Vos RAI, Jansen Steur ENH, Braak E. Staging of brain pathology related to sporadic Parkinson’s disease. Neurobiol Aging. 2003;24(2):197-211.
7. Mantri S, Morley JF, Siderowf AD. The importance of preclinical diagnostics in Parkinson disease. Parkinsonism Relat Disord. 2018;pii:S1353-8020(18)30396-1. [Epub ahead of print]
8. Berg D, Postuma RB, Adler CH, et al. MDS research criteria for prodromal Parkinson’s disease. Mov Disord. 2015;30(12):1600-1611.
9. Haehner A, Boesveldt S, Berendse HW, et al. Prevalence of smell loss in Parkinson’s disease – a multicenter study. Parkinsonism Relat Disord. 2009;15(7):490-494.
10. Mullol J, Alobid I, Mariño-Sánchez F, et al. Furthering the understanding of olfaction, prevalence of loss of smell and risk factors: a population-based survey (OLFACAT study). BMJ Open. 2012;2(6).pii:e001256.
11. Doty RL, Shaman P, Applebaum SL, Giberson R, Siksorski L, Rosenberg L. Smell identification ability: changes with age. Science. 1984;226(4681):1441-1443.
12. Doty RL. Olfactory dysfunction in Parkinson disease. Nat Rev Neurol. 2012;8(6):329-339.
13. Double KL, Rowe DB, Hayes M, et al. Identifying the pattern of olfactory deficits in Parkinson disease using the brief smell identification test. Arch Neurol. 2003;60(4):545-549.
14. Doty RL, Shaman P, Dann M. Development of the University of Pennsylvania Smell Identification Test: a standardized microencapsulated test of olfactory function. Physiol Behav. 1984;32(3):489-502.
15. Morley JF, Cohen A, Silveira-Moriyama L, et al. Optimizing olfactory testing for the diagnosis of Parkinson’s disease: item analysis of the University of Pennsylvania smell identification test. NPJ Parkinsons Dis. 2018;4:2.
16. Fullard ME, Tran B, Xie SX, et al. Olfactory impairment predicts cognitive decline in early Parkinson’s disease. Parkinsonism Relat Disord. 2016;25:45-51.
17. Savica R, Carlin JM, Grossardt BR, et al. Medical records documentation of constipation preceding Parkinson disease: a case-control study. Neurology. 2009;73(21):1752-1758.
18. Abbott RD, Petrovitch H, White LR, et al. Frequency of bowel movements and the future risk of Parkinson’s disease. Neurology. 2001;57(3):456-462.
19. Stocchi F, Torti M. Constipation in Parkinson’s disease. Int Rev Neurobiol. 2017;134:811-826.
20. Yu QJ, Yu SY, Zuo LJ, et al. Parkinson disease with constipation: clinical features and relevant factors. Sci Rep. 2018;8(1):567.
21. Hill-Burns EM, Debelius JW, Morton JT, et al. Parkinson’s disease and Parkinson’s disease medications have distinct signatures of the gut microbiome. Mov Disord. 2017;32(5):739-749.
22. Mulak A, Bonaz B. Brain-gut-microbiota axis in Parkinson’s disease. World J Gastroenterol. 2015;21(37): 10609-10620.
23. Shah SP, Duda JE. Dietary modifications in Parkinson’s disease: a neuroprotective intervention? Med Hypotheses. 2015;85(6):1002-1005.
24. Perez-Pardo P, de Jong EM, Broersen LM, et al. Promising effects of neurorestorative diets on motor, cognitive, and gastrointestinal dysfunction after symptom development in a mouse model of Parkinson’s disease. Front Aging Neurosci. 2017;9:57.
25. Fang F, Xu Q, Park Y, et al. Depression and the subsequent risk of Parkinson’s disease in the NIH-AARP Diet and Health Study. Mov Disord. 2010;25(9):1157-1162.
26. Leentjens AFG, Van den Akker M, Metsemakers JFM, Lousberg R, Verhey FRJ. Higher incidence of depression preceding the onset of Parkinson’s disease: a register study. Mov Disord. 2003;18(4):414-418.
27. Alonso A, Rodriguez LAG, Logroscino G, Hernán MA. Use of antidepressants and the risk of Parkinson’s disease: a prospective study. J Neurol Neurosurg Psychiatry. 2009;80(6):671-674.
28. Weisskopf MG, Chen H, Schwarzschild MA, Kawachi I, Ascherio A. Prospective study of phobic anxiety and risk of Parkinson’s disease. Mov Disord. 2003;18(6):646-651.
29. Darweesh SK, Verlinden VJ, Stricker BH, Hofman A, Koudstaal PJ, Ikram MA. Trajectories of prediagnostic functioning in Parkinson’s disease. Brain. 2017;140(2):429-441.
30. Santangelo G, Vitale C, Picillo M, et al. Apathy and striatal dopamine transporter levels in de-novo, untreated Parkinson’s disease patients. Parkinsonism Relat Disord. 2015;21(5):489-493.
31. Erro R, Pappatà S, Amboni M, et al. Anxiety is associated with striatal dopamine transporter availability in newly diagnosed untreated Parkinson’s disease patients. Parkinsonism Relat Disord. 2012;18(9):1034-1038.
32. Schenck CH, Boeve BF, Mahowald MW. Delayed emergence of a parkinsonian disorder or dementia in 81% of older men initially diagnosed with idiopathic rapid eye movement sleep behavior disorder: a 16-year update on a previously reported series. Sleep Med. 2013;14(8):
744-748.
33. Melendez J, Hesselbacher S, Sharafkhaneh A, Hirshkowitz M. Assessment of REM sleep behavior disorder in veterans with posttraumatic stress disorder. Chest. 2011;140(4):967A.
34. Pilotto A, Heinzel S, Suenkel U, et al. Application of the movement disorder society prodromal Parkinson’s disease research criteria in 2 independent prospective cohorts. Mov Disord. 2017;32(7):1025-1034.
35. Fereshtehnejad S-M, Montplaisir JY, Pelletier A, Gagnon J-F, Berg D, Postuma RB. Validation of the MDS research criteria for prodromal Parkinson’s disease: Longitudinal assessment in a REM sleep behavior disorder (RBD) cohort. Mov Disord. 2017;32(6):865-873.
36. Rizzo G, Copetti M, Arcuti S, Martino D, Fontana A, Logroscino G. Accuracy of clinical diagnosis of Parkinson disease: a systematic review and meta-analysis. Neurology. 2016;86(6):566-576.
37. Moccia M, Pappatà S, Picillo M, et al. Dopamine transporter availability in motor subtypes of de novo drug-naïve Parkinson’s disease. J Neurol. 2014;261(11):2112-2118.
38. Siepel FJ, Brønnick KS, Booij J, et al. Cognitive executive impairment and dopaminergic deficits in de novo Parkinson’s disease. Mov Disord. 2014;29(14):1802-1808.
39. Iranzo A, Valldeoriola F, Lomeña F, et al. Serial dopamine transporter imaging of nigrostriatal function in patients with idiopathic rapid-eye-movement sleep behaviour disorder: a prospective study. Lancet Neurol. 2011;10(9):797-805.
40. Booij J, Kemp P. Dopamine transporter imaging with [(123)I]FP-CIT SPECT: potential effects of drugs. Eur J Nucl Med Mol Imaging. 2008;35(2):424-438.
41. Gellad WF, Aspinall SL, Handler SM, et al. Use of antipsychotics among older residents in VA nursing homes. Med Care. 2012;50(11):954-960.
42. Mauri MC, Paletta S, Maffini M, et al. Clinical pharmacology of atypical antipsychotics: an update. EXCLI J. 2014;13:1163-1191.
43. Morley JF, Duda JE. Use of hyposmia and other non-motor symptoms to distinguish between drug-induced parkinsonism and Parkinson’s disease. J Parkinsons Dis. 2014;4(2):169-173.
44. Morley JF, Cheng G, Dubroff JG, Wood S, Wilkinson JR, Duda JE. Olfactory impairment predicts underlying dopaminergic deficit in presumed drug-induced parkinsonism. Mov Disord Clin Pract. 2017;4(4):603-606.
45. Whitwell JL, Höglinger GU, Antonini A, et al; Movement Disorder Society-endorsed PSP Study Group. Radiological biomarkers for diagnosis in PSP: where are we and where do we need to be? Mov Disord. 2017;32(7):955-971.
46. Laurens B, Constantinescu R, Freeman R, et al. Fluid biomarkers in multiple system atrophy: A review of the MSA Biomarker Initiative. Neurobiol Dis. 2015;80:29-41.
47. Barber TR, Klein JC, Mackay CE, Hu MTM. Neuroimaging in pre-motor Parkinson’s disease. NeuroImage Clin. 2017;15:215-227.
48. Parkinson Progression Marker Initiative. The Parkinson Progression Marker Initiative (PPMI). Prog Neurobiol. 2011;95(4):629-635.
49. Meles SK, Vadasz D, Renken RJ, et al. FDG PET, dopamine transporter SPECT, and olfaction: combining biomarkers in REM sleep behavior disorder. Mov Disord. 2017;32(10):1482-1486.
50. Noyce AJ, R’Bibo L, Peress L, et al. PREDICT‐PD: an online approach to prospectively identify risk indicators of Parkinson’s disease. Mov Disord. 2017 Feb; 32(2): 219–226.
51. Searles Nielsen S, Warden MN, Camacho-Soto A, Willis AW, Wright BA, Racette BA. A predictive model to identify Parkinson disease from administrative claims data. Neurology. 2017;89(14):1448-1456.
52. Institute of Medicine. Veterans and Agent Orange: Update 2012. National Academies Press: Washington, DC; 2013.
53. Department of Veterans Affairs. Diseases associated with exposure to Contaminants in the Water Supply at Camp Lejeune. Final rule. Fed Regist. 2017;82(9):4173-4185.
54. Goldman SM, Quinlan PJ, Ross GW, et al. Solvent exposures and Parkinson disease risk in twins. Ann Neurol. 2012;71(6):776-784.
55. Liu M, Shin EJ, Dang DK, et al. Trichloroethylene and Parkinson’s disease: risk assessment. Mol Neurobiol. 2018;55(7):6201-6214.
56. Betarbet R, Sherer TB, MacKenzie G, Garcia-Osuna M, Panov AV, Greenamyre JT. Chronic systemic pesticide exposure reproduces features of Parkinson’s disease. Nat Neurosci. 2000;3(12):1301-1306.
57. Manning-Bog AB, McCormack AL, Li J, Uversky VN, Fink AL, Monte DAD. The herbicide paraquat causes up-regulation and aggregation of alpha-synuclein in mice: paraquat and alpha-synuclein. J Biol Chem. 2002;277(3):1641-1644.
58. Camacho-Soto A, Warden MN, Searles Nielsen S, et al. Traumatic brain injury in the prodromal period of Parkinson’s disease: a large epidemiological study using medicare data. Ann Neurol. 2017;82(5):744-754.
59. Gardner RC, Burke JF, Nettiksimmons J, Goldman S, Tanner CM, Yaffe K. Traumatic brain injury in later life increases risk for Parkinson disease. Ann Neurol. 2015;77(6):987-995.
60. Gardner RC, Byers AL, Barnes DE, Li Y, Boscardin J, Yaffe K. Mild TBI and risk of Parkinson disease: a Chronic Effects of Neurotrauma Consortium Study. Neurology. 2018;90(20):e1771-e1779.
61. Cruz-Haces M, Tang J, Acosta G, Fernandez J, Shi R. Pathological correlations between traumatic brain injury and chronic neurodegenerative diseases. Transl Neurodegener. 2017;6:20.
62. Lee PC, Bordelon Y, Bronstein J, Ritz B. Traumatic brain injury, paraquat exposure, and their relationship to Parkinson disease. Neurology. 2012;79(20):2061-2066.
63. Disabilities that are proximately due to, or aggravated by, service-connected disease or injury. 38 CFR §3.310.
64. Diseases Associated With Exposure to Certain Herbicide Agents (Hairy Cell Leukemia and Other Chronic B-Cell Leukemias, Parkinson’s Disease and Ischemic Heart Disease). Federal Regist. 2010;75(173):53202-53216. To be codified at 38 CFR §3.
65. Cheng EM, Swarztrauber K, Siderowf AD, et al. Association of specialist involvement and quality of care for Parkinson’s disease. Mov Disord. 2007;22(4):515-522.
66. Qamar MA, Harington G, Trump S, Johnson J, Roberts F, Frost E. Multidisciplinary care in Parkinson’s disease. Int Rev Neurobiol. 2017;132:511-523.
67. Pogoda TK, Cramer IE, Meterko M, et al. Patient and organizational factors related to education and support use by veterans with Parkinson’s disease. Mov Disord. 2009;24(13):1916-1924.
Parkinson disease (PD) affects about 680,000 in the US, including > 110,000 veterans (Caroline Tanner, MD, PhD, unpublished data).1 In the next 10 years, this number is expected to double, in part because of the aging of the US population.1 Although the classic diagnostic criteria emphasize motor symptoms that include tremor, gait disturbance, and paucity of movement, there is increasing recognition that disease pathology begins decades before the development of motor impairment.2
Pathologic studies confirm that by the onset of motor symptoms, at least 30% of nigrostriatal neurons are lost or dysfunctional.3-5 Similarly, the Braak staging hypothesis posits initial deposition of Lewy bodies in the olfactory bulb and the dorsal motor nucleus of the vagus nerve, followed by prion-like spread through the brain stem into the midbrain/substantia nigra, and finally into the cortex (Figure 1).6
The decades-long prodromal or preclinical phase represents a unique opportunity for early identification of those at highest risk for developing the motor symptoms of Parkinson disease.7 Accurate identification, ideally before the onset of manifest motor disability, would not only improve prognostic counseling of veterans and families, but also could allow for early enrollment into trials of potentially disease-modifying therapeutic agents. Thus, early and accurate identification of PD is an important goal of the care of veterans with potential PD.
Prodromal Symptoms
Prodromal PD, as defined by the International Parkinson Disease and Movement Disorders Society (MDS), focuses on nonmotor symptoms that herald the onset of manifest motor PD.8 The most commonly assessed nonmotor features include olfaction, constipation, sleep disturbance, and mood disorders.
Olfaction is impaired in > 90% of patients with motor PD at the time of diagnosis; by contrast, the prevalence of hyposmia in the general population ranges from 20% to 50%, with higher rates in older adults and in smokers.9-11 Thus, olfaction appears to be a relatively sensitive, though nonspecific, prodromal feature. Importantly, subjective report of hyposmia is poorly reliable, so a number of different tests have been developed for objective assessment of olfactory dysfunction.12 The 12-item Brief Smell Identification Test (B-SIT), derived from the longer University of Pennsylvania Smell Identification Test, is a “scratch-and-sniff” forced multiple choice test that can be self-administered by cooperative patients.13,14 The B-SIT has been validated in multiple ethnic and cultural groups and shows high discrimination between PD subjects and controls.13,15 Of note, olfactory impairment appears to be associated with risk of cognitive decline in PD, further emphasizing the need for accurate assessment to guide prognosis.16
Like hyposmia, constipation can be noted long before the diagnosis of manifest motor PD.17 After adjustment for lifestyle factors, constipated individuals have up to 4.5-fold increased odds of developing PD, and those with constipation suffer worsened disease outcomes and health-related quality of life.17-20 Some groups have demonstrated alterations in gut microbiota of those with prodromal PD, which suggests local inflammatory processes and intestinal permeability may contribute to protein misfolding and disease development.21,22 This also raises the intriguing possibility that dietary alterations may be neuroprotective or neurorestorative, although this has yet to be tested in humans.23,24
Like constipation, mood changes can precede the appearance of manifest motor PD.25,26 Case control studies suggest a higher risk of developing PD among individuals who were previously diagnosed with depression or anxiety, particularly in the 1 to 2 years prior to PD diagnosis.27-29 Both apathy and anxiety are associated with striatal dopamine dysfunction, particularly in the right caudate nucleus, which suggests that mood changes are directly related to disease pathology.30,31
Of the prodromal features, rapid eye movement sleep behavior disorder (RBD) is associated with the highest risk of conversion to motor PD.8 Up to 80% of older men with socalled idiopathic RBD develop a parkinsonian syndrome within 20 years; risk is divided about equally between idiopathic PD and dementia with Lewy bodies (DLB).32 Collateral history from a bed-partner is usually sufficient to make the diagnosis, although, this is often confounded by the prevalence of nightmares in those with posttraumatic stress disorder in the veteran population.32 Thus, in suspected cases, obtaining a polysomnogram can aid in distinguishing between idiopathic PC and DLB.33 Given the specificity of RBD as a marker of synuclein deposition and the high risk of progression to a degenerative syndrome, accurate diagnosis and counseling is imperative.
Each of the prodromal nonmotor features of PD are at best moderately sensitive or specific in isolation, but in concert, they can be used to develop a Parkinson risk score. For instance, the MDS prodromal criteria combine individual likelihood ratios into Bayesian analysis to determine a combined probability of PD, which can be further stratified to probable or possible prodromal PD (probability > 80%, > 50%, respectively).8 These criteria have been applied to several independent cohorts and demonstrate high sensitivity and specificity, especially over time.34,35 Applicability in a veteran population has yet to be determined.
Use of Imaging in Diagnosis
Although clinical diagnostic criteria and prodromal features can improve diagnostic accuracy, it can be extremely challenging to distinguish idiopathic PD from nondegenerative parkinsonism or atypical syndromes (see below). Compared with the gold standard of pathologic assessment, the clinical diagnostic accuracy for PD ranges from 73% for nonexperts to 80% for fellowship-trained movement disorders specialists.36 Thus, objective biomarkers are sought to improve diagnostic accuracy both for clinical care as well as for research purposes, such as enrollment into clinical trials.
Multiple potential imaging biomarkers for preclinical PD can aid in early diagnosis and help differentiate PD from related but distinct disorders. While beyond the scope of this review, these techniques have recently been reviewed.7 Of these, the most widely available and accurate is dopamine transporter (DAT) imaging, which uses a radioiodinated ligand that binds to DAT on striatal dopaminergic terminals; binding is detected through single photon emission computed tomography (SPECT) scanning. Thus, a SPECT DaTscan (GE Healthcare Bio-Sciences, Little Chalfont, England) directly assesses the integrity of the presynaptic nigrostriatal system and is well correlated with severity of motor and nonmotor parkinsonism.37,38
In individuals with suspected prodromal PD, abnormal DaTscans are associated with faster progression to manifest motor PD.39 However, it should be noted that a number of medications, several of which are commonly utilized in the veteran population, can affect the outcome of a DaTscan.40 Some of these medications only mildly affect the outcome, so the physician interpreting the scan should be made aware of their use, while others need to be held for days to weeks so as not to invalidate the DaTscan. DaTscan also do not differentiate between PD and atypical degenerative parkinsonisms such as multiple system atrophy (MSA), DLB, progressive supranuclear palsy (PSP), or corticobasal syndrome (CBS). Nevertheless, these scans can be used to distinguish degenerative parkinsonisms from other conditions that can be difficult to distinguish clinically from PD, including essential tremor, normal pressure hydrocephalus, vascular parkinsonism, or druginduced parkinsonism (DIP).
DIP usually is caused by blockade of postsynaptic dopamine receptors by antipsychotic medications, which are prescribed to as many as 1 in 4 older veterans; antiemetic agents such as metoclopramide are also potential offenders if used chronically.41 The risk of DIP appears to be associated with the D2 binding affinity of the drug. Thus, of the newer atypical antipsychotics, clozapine and quetiapine appear to have the lowest risk, while ziprasidone and aripiprazole have the highest binding affinity and therefore the highest risk.42 In many patients, parkinsonism persists even after discontinuation of the offending agent, suggesting that in at least a subset of patients, DIP may be an “unmasking” of latent PD rather than a true adverse effect of the medication. The prodromal features discussed above can be used to distinguish isolated DIP from unmasked latent PD.43 In a study we conducted in veterans at the Michael J. Crescenz VA Medical Center in Philadelphia, Pennsylvania, hyposmia in particular was shown to be highly predictive of an underlying dopaminergic deficit with an odds ratio of 63.44
Other important considerations in the differential diagnosis of PD are the atypical degenerative parkinsonian syndromes, formerly called Parkinson plus syndromes. These may be further divided into the synucleinopathies (MSA, DLB) or the tauopathies (PSP, CBS), depending on the predominant amyloidogenic protein. Early in the disease, the atypical syndromes and idiopathic PD may be clinically indistinguishable, although the atypical syndromes tend to progress more rapidly and often have a less robust response to levodopa.
Radiologic and fluid biomarkers for the atypical syndromes are under active investigation; at present the most accessible study is magnetic resonance imaging (MRI), which may show characteristic features such as degeneration of the pontocerebellar fibers in MSA or midbrain atrophy in PSP.45,46 By contrast, standard MRI sequences in idiopathic PD are usually normal, although high-resolution (7 tesla) imaging can reveal loss of neuromelanin in the substantia nigra.47 MRI also can be useful in the workup of suspected normal pressure hydrocephalus or vascular parkinsonism, which would show disproportionate ventriculomegaly with transependymal flow, or white matter lesions in the basal ganglia, respectively.
Data-Based Identification of Preclinical PD
The integration of clinical motor or prodromal features with biomarker data has led to the development of several large-scale clinical and administrative databases to identify PD. The Parkinson Progression Markers Initiative initially enrolled only de novo clinically identified people with PD, but it expanded to include a prodromal cohort who are being assessed for rates of conversion to PD.48 Similarly, metabolic imaging can be combined with prodromal symptoms, such as hyposmia or RBD, to predict risk for phenoconversion into manifest motor PD.49
The PREDICT-PD study synthesizes mood symptoms, RBD, smell testing, genotyping, and keyboard-tapping tasks to divide individuals into high-, middle-, and low-risk groups; interim analysis at 3 years of follow-up (N = 842) demonstrated a hazard ratio of 4.39 (95% CI, 1.03-18.68) for the diagnosis of PD in the highrisk group compared with the low-risk group.50 Lastly, administrative claims data for prodromal features, such as constipation, RBD, and mood symptoms, is highly predictive of eventual PD diagnosis.51 VA databases accessed through the Corporate Data Warehouse are complementary sources of information to nonveteranspecific Medicare databases; to our knowledge there has not yet been a comprehensive search of VA databases to identify veterans with preclinical PD.
Risk Factors Associated With Military Service
A number of potential environmental risk factors may increase the risk of developing Parkinson disease for veterans. Perhaps the most commonly recognized is pesticide exposure, particularly given the presumptive service connections established by the VA for Parkinson disease and exposure to Agent Orange or contaminated water at Camp Lejeune.52,53 Both dioxin, the toxic ingredient in Agent Orange, and the solvents trichloroethylene and perchloroethylene, found in the water supply at Camp Lejeune, interfere with mitochondrial function leading to oxidative stress and apoptosis of nigrostriatal neurons.54,55 Other potential exposures, which are not necessarily limited to the veteran population, include rotenone, a phytochemical used to kill fish in reservoirs, and paraquat, an herbicide that may directly promote synuclein aggregation.56,57 Veterans who have reported exposure to these or other environmental chemicals in civilian life should be carefully assessed for the presence of motor PD or prodromal features.
Traumatic brain injury (TBI) also may be a risk factor for PD, which may be particularly relevant for veterans who had served in Iraq or Afghanistan. Retrospective claims data suggest a strong association between PD and recent TBI in the 5 to 10 years prior to motor PD diagnosis.58,59 A recent assessment of combat veterans with TBI found that even mild TBI was associated with a 56% increased risk of PD, while moderate-to-severe TBI was associated with an 83% higher risk of PD.60 The pathologic mechanism for this link is unclear, but post-TBI inflammatory processes may lead to the formation of reactive oxygen species and/or glutamatergic excitotoxicity, thus leading to secondary injury in the nigrostriatal pathway.61 As with prodromal symptoms, the risk of PD related to environmental risk factors may be synergistic; repetitive TBI may be more damaging than a single injury, and a combination of TBI and pesticide exposure markedly increases PD risk beyond the risk of TBI or the risk of pesticides alone.62 Recently, parkinsonism, including Parkinson disease, was recognized as a service connected condition for veterans with a servicerelated moderate or severe TBI.63
Conclusion
Because of the substantial impact on quality of life and disability-adjusted life years, early and accurate identification and management of veterans at risk for PD is an important priority area for the VA. The 10-year cost of PD-related benefits through the VA was estimated at $3.5 billion in fiscal year 2010, and that number is likely to rise in coming years, due to the aging population as well as synergistic effects of independent risk factors described above.64 In response, the VA has created a network of specialty care sites, known as Parkinson Disease Research, Education, and Clinical Centers (PADRECCs) located in Philadelphia, Pennsylvania; Richmond, Virginia; Houston, Texas; West Los Angeles and San Francisco, California; and Seattle, Washington/ Portland, Oregon (www.parkinsons.va.gov).
The PADRECCs are supplemented by a National VA PD Consortium network of VA physicians trained in PD management (Figure 2). Studies, including one investigating care of veterans with PD, have demonstrated that involvement of specialty care services early in the course of PD leads to improved patient outcomes.65,66 In addition to patient-facing resources such as support groups and specialized physical/occupational/speech therapy, PADRECCs and the consortium sites are national leaders in PD education and clinical trials and provide high-quality, multidisciplinary care for veterans with PD.67 Thus, veterans with significant risk factors or prodromal symptoms of PD should be referred into the PADRECC/Consortium network in order to maximize their quality of care and quality of life.
1. Marras C, Beck JC, Bower JH, et al; Parkinson’s Foundation P4 Group. Prevalence of Parkinson’s disease across North America. NPJ Parkinsons Dis. 2018;4:21.
2. Postuma RB, Berg D, Stern M, et al. MDS clinical diagnostic criteria for Parkinson’s disease. Mov Disord. 2015;30(12):1591-1601.
3. Fearnley JM, Lees AJ. Ageing and Parkinson’s disease: substantia nigra regional selectivity. Brain. 1991;114(pt 5):2283-2301.
4. Greffard S, Verny M, Bonnet A-M, et al. Motor score of the Unified Parkinson Disease Rating Scale as a good predictor of Lewy body-associated neuronal loss in the substantia nigra. Arch Neurol. 2006;63(4):584-588.
5. Hilker R, Schweitzer K, Coburger S, et al. Nonlinear progression of Parkinson disease as determined by serial positron emission tomographic imaging of striatal fluorodopa F 18 activity. Arch Neurol. 2005;62(3):378-382.
6. Braak H, Del Tredici K, Rüb U, de Vos RAI, Jansen Steur ENH, Braak E. Staging of brain pathology related to sporadic Parkinson’s disease. Neurobiol Aging. 2003;24(2):197-211.
7. Mantri S, Morley JF, Siderowf AD. The importance of preclinical diagnostics in Parkinson disease. Parkinsonism Relat Disord. 2018;pii:S1353-8020(18)30396-1. [Epub ahead of print]
8. Berg D, Postuma RB, Adler CH, et al. MDS research criteria for prodromal Parkinson’s disease. Mov Disord. 2015;30(12):1600-1611.
9. Haehner A, Boesveldt S, Berendse HW, et al. Prevalence of smell loss in Parkinson’s disease – a multicenter study. Parkinsonism Relat Disord. 2009;15(7):490-494.
10. Mullol J, Alobid I, Mariño-Sánchez F, et al. Furthering the understanding of olfaction, prevalence of loss of smell and risk factors: a population-based survey (OLFACAT study). BMJ Open. 2012;2(6).pii:e001256.
11. Doty RL, Shaman P, Applebaum SL, Giberson R, Siksorski L, Rosenberg L. Smell identification ability: changes with age. Science. 1984;226(4681):1441-1443.
12. Doty RL. Olfactory dysfunction in Parkinson disease. Nat Rev Neurol. 2012;8(6):329-339.
13. Double KL, Rowe DB, Hayes M, et al. Identifying the pattern of olfactory deficits in Parkinson disease using the brief smell identification test. Arch Neurol. 2003;60(4):545-549.
14. Doty RL, Shaman P, Dann M. Development of the University of Pennsylvania Smell Identification Test: a standardized microencapsulated test of olfactory function. Physiol Behav. 1984;32(3):489-502.
15. Morley JF, Cohen A, Silveira-Moriyama L, et al. Optimizing olfactory testing for the diagnosis of Parkinson’s disease: item analysis of the University of Pennsylvania smell identification test. NPJ Parkinsons Dis. 2018;4:2.
16. Fullard ME, Tran B, Xie SX, et al. Olfactory impairment predicts cognitive decline in early Parkinson’s disease. Parkinsonism Relat Disord. 2016;25:45-51.
17. Savica R, Carlin JM, Grossardt BR, et al. Medical records documentation of constipation preceding Parkinson disease: a case-control study. Neurology. 2009;73(21):1752-1758.
18. Abbott RD, Petrovitch H, White LR, et al. Frequency of bowel movements and the future risk of Parkinson’s disease. Neurology. 2001;57(3):456-462.
19. Stocchi F, Torti M. Constipation in Parkinson’s disease. Int Rev Neurobiol. 2017;134:811-826.
20. Yu QJ, Yu SY, Zuo LJ, et al. Parkinson disease with constipation: clinical features and relevant factors. Sci Rep. 2018;8(1):567.
21. Hill-Burns EM, Debelius JW, Morton JT, et al. Parkinson’s disease and Parkinson’s disease medications have distinct signatures of the gut microbiome. Mov Disord. 2017;32(5):739-749.
22. Mulak A, Bonaz B. Brain-gut-microbiota axis in Parkinson’s disease. World J Gastroenterol. 2015;21(37): 10609-10620.
23. Shah SP, Duda JE. Dietary modifications in Parkinson’s disease: a neuroprotective intervention? Med Hypotheses. 2015;85(6):1002-1005.
24. Perez-Pardo P, de Jong EM, Broersen LM, et al. Promising effects of neurorestorative diets on motor, cognitive, and gastrointestinal dysfunction after symptom development in a mouse model of Parkinson’s disease. Front Aging Neurosci. 2017;9:57.
25. Fang F, Xu Q, Park Y, et al. Depression and the subsequent risk of Parkinson’s disease in the NIH-AARP Diet and Health Study. Mov Disord. 2010;25(9):1157-1162.
26. Leentjens AFG, Van den Akker M, Metsemakers JFM, Lousberg R, Verhey FRJ. Higher incidence of depression preceding the onset of Parkinson’s disease: a register study. Mov Disord. 2003;18(4):414-418.
27. Alonso A, Rodriguez LAG, Logroscino G, Hernán MA. Use of antidepressants and the risk of Parkinson’s disease: a prospective study. J Neurol Neurosurg Psychiatry. 2009;80(6):671-674.
28. Weisskopf MG, Chen H, Schwarzschild MA, Kawachi I, Ascherio A. Prospective study of phobic anxiety and risk of Parkinson’s disease. Mov Disord. 2003;18(6):646-651.
29. Darweesh SK, Verlinden VJ, Stricker BH, Hofman A, Koudstaal PJ, Ikram MA. Trajectories of prediagnostic functioning in Parkinson’s disease. Brain. 2017;140(2):429-441.
30. Santangelo G, Vitale C, Picillo M, et al. Apathy and striatal dopamine transporter levels in de-novo, untreated Parkinson’s disease patients. Parkinsonism Relat Disord. 2015;21(5):489-493.
31. Erro R, Pappatà S, Amboni M, et al. Anxiety is associated with striatal dopamine transporter availability in newly diagnosed untreated Parkinson’s disease patients. Parkinsonism Relat Disord. 2012;18(9):1034-1038.
32. Schenck CH, Boeve BF, Mahowald MW. Delayed emergence of a parkinsonian disorder or dementia in 81% of older men initially diagnosed with idiopathic rapid eye movement sleep behavior disorder: a 16-year update on a previously reported series. Sleep Med. 2013;14(8):
744-748.
33. Melendez J, Hesselbacher S, Sharafkhaneh A, Hirshkowitz M. Assessment of REM sleep behavior disorder in veterans with posttraumatic stress disorder. Chest. 2011;140(4):967A.
34. Pilotto A, Heinzel S, Suenkel U, et al. Application of the movement disorder society prodromal Parkinson’s disease research criteria in 2 independent prospective cohorts. Mov Disord. 2017;32(7):1025-1034.
35. Fereshtehnejad S-M, Montplaisir JY, Pelletier A, Gagnon J-F, Berg D, Postuma RB. Validation of the MDS research criteria for prodromal Parkinson’s disease: Longitudinal assessment in a REM sleep behavior disorder (RBD) cohort. Mov Disord. 2017;32(6):865-873.
36. Rizzo G, Copetti M, Arcuti S, Martino D, Fontana A, Logroscino G. Accuracy of clinical diagnosis of Parkinson disease: a systematic review and meta-analysis. Neurology. 2016;86(6):566-576.
37. Moccia M, Pappatà S, Picillo M, et al. Dopamine transporter availability in motor subtypes of de novo drug-naïve Parkinson’s disease. J Neurol. 2014;261(11):2112-2118.
38. Siepel FJ, Brønnick KS, Booij J, et al. Cognitive executive impairment and dopaminergic deficits in de novo Parkinson’s disease. Mov Disord. 2014;29(14):1802-1808.
39. Iranzo A, Valldeoriola F, Lomeña F, et al. Serial dopamine transporter imaging of nigrostriatal function in patients with idiopathic rapid-eye-movement sleep behaviour disorder: a prospective study. Lancet Neurol. 2011;10(9):797-805.
40. Booij J, Kemp P. Dopamine transporter imaging with [(123)I]FP-CIT SPECT: potential effects of drugs. Eur J Nucl Med Mol Imaging. 2008;35(2):424-438.
41. Gellad WF, Aspinall SL, Handler SM, et al. Use of antipsychotics among older residents in VA nursing homes. Med Care. 2012;50(11):954-960.
42. Mauri MC, Paletta S, Maffini M, et al. Clinical pharmacology of atypical antipsychotics: an update. EXCLI J. 2014;13:1163-1191.
43. Morley JF, Duda JE. Use of hyposmia and other non-motor symptoms to distinguish between drug-induced parkinsonism and Parkinson’s disease. J Parkinsons Dis. 2014;4(2):169-173.
44. Morley JF, Cheng G, Dubroff JG, Wood S, Wilkinson JR, Duda JE. Olfactory impairment predicts underlying dopaminergic deficit in presumed drug-induced parkinsonism. Mov Disord Clin Pract. 2017;4(4):603-606.
45. Whitwell JL, Höglinger GU, Antonini A, et al; Movement Disorder Society-endorsed PSP Study Group. Radiological biomarkers for diagnosis in PSP: where are we and where do we need to be? Mov Disord. 2017;32(7):955-971.
46. Laurens B, Constantinescu R, Freeman R, et al. Fluid biomarkers in multiple system atrophy: A review of the MSA Biomarker Initiative. Neurobiol Dis. 2015;80:29-41.
47. Barber TR, Klein JC, Mackay CE, Hu MTM. Neuroimaging in pre-motor Parkinson’s disease. NeuroImage Clin. 2017;15:215-227.
48. Parkinson Progression Marker Initiative. The Parkinson Progression Marker Initiative (PPMI). Prog Neurobiol. 2011;95(4):629-635.
49. Meles SK, Vadasz D, Renken RJ, et al. FDG PET, dopamine transporter SPECT, and olfaction: combining biomarkers in REM sleep behavior disorder. Mov Disord. 2017;32(10):1482-1486.
50. Noyce AJ, R’Bibo L, Peress L, et al. PREDICT‐PD: an online approach to prospectively identify risk indicators of Parkinson’s disease. Mov Disord. 2017 Feb; 32(2): 219–226.
51. Searles Nielsen S, Warden MN, Camacho-Soto A, Willis AW, Wright BA, Racette BA. A predictive model to identify Parkinson disease from administrative claims data. Neurology. 2017;89(14):1448-1456.
52. Institute of Medicine. Veterans and Agent Orange: Update 2012. National Academies Press: Washington, DC; 2013.
53. Department of Veterans Affairs. Diseases associated with exposure to Contaminants in the Water Supply at Camp Lejeune. Final rule. Fed Regist. 2017;82(9):4173-4185.
54. Goldman SM, Quinlan PJ, Ross GW, et al. Solvent exposures and Parkinson disease risk in twins. Ann Neurol. 2012;71(6):776-784.
55. Liu M, Shin EJ, Dang DK, et al. Trichloroethylene and Parkinson’s disease: risk assessment. Mol Neurobiol. 2018;55(7):6201-6214.
56. Betarbet R, Sherer TB, MacKenzie G, Garcia-Osuna M, Panov AV, Greenamyre JT. Chronic systemic pesticide exposure reproduces features of Parkinson’s disease. Nat Neurosci. 2000;3(12):1301-1306.
57. Manning-Bog AB, McCormack AL, Li J, Uversky VN, Fink AL, Monte DAD. The herbicide paraquat causes up-regulation and aggregation of alpha-synuclein in mice: paraquat and alpha-synuclein. J Biol Chem. 2002;277(3):1641-1644.
58. Camacho-Soto A, Warden MN, Searles Nielsen S, et al. Traumatic brain injury in the prodromal period of Parkinson’s disease: a large epidemiological study using medicare data. Ann Neurol. 2017;82(5):744-754.
59. Gardner RC, Burke JF, Nettiksimmons J, Goldman S, Tanner CM, Yaffe K. Traumatic brain injury in later life increases risk for Parkinson disease. Ann Neurol. 2015;77(6):987-995.
60. Gardner RC, Byers AL, Barnes DE, Li Y, Boscardin J, Yaffe K. Mild TBI and risk of Parkinson disease: a Chronic Effects of Neurotrauma Consortium Study. Neurology. 2018;90(20):e1771-e1779.
61. Cruz-Haces M, Tang J, Acosta G, Fernandez J, Shi R. Pathological correlations between traumatic brain injury and chronic neurodegenerative diseases. Transl Neurodegener. 2017;6:20.
62. Lee PC, Bordelon Y, Bronstein J, Ritz B. Traumatic brain injury, paraquat exposure, and their relationship to Parkinson disease. Neurology. 2012;79(20):2061-2066.
63. Disabilities that are proximately due to, or aggravated by, service-connected disease or injury. 38 CFR §3.310.
64. Diseases Associated With Exposure to Certain Herbicide Agents (Hairy Cell Leukemia and Other Chronic B-Cell Leukemias, Parkinson’s Disease and Ischemic Heart Disease). Federal Regist. 2010;75(173):53202-53216. To be codified at 38 CFR §3.
65. Cheng EM, Swarztrauber K, Siderowf AD, et al. Association of specialist involvement and quality of care for Parkinson’s disease. Mov Disord. 2007;22(4):515-522.
66. Qamar MA, Harington G, Trump S, Johnson J, Roberts F, Frost E. Multidisciplinary care in Parkinson’s disease. Int Rev Neurobiol. 2017;132:511-523.
67. Pogoda TK, Cramer IE, Meterko M, et al. Patient and organizational factors related to education and support use by veterans with Parkinson’s disease. Mov Disord. 2009;24(13):1916-1924.
The Pediatric Hospital Medicine Core Competencies: 2020 Revision. Introduction and Methodology
The Pediatric Hospital Medicine Core Competencies were first published in 2010 to help define a specific body of knowledge and measurable skills needed to practice high quality care for hospitalized pediatric patients across all practice settings.1 Since then, the number of practicing pediatric hospitalists has grown to a conservative estimate of 3,000 physicians and the scope of practice among pediatric hospitalists has matured.2 Pediatric hospitalists are increasingly leading or participating in organizational and national efforts that emphasize interprofessional collaboration and the delivery of high value care to hospitalized children and their caregivers—including innovative and family-centered care models, patient safety and quality improvement initiatives, and research and educational enterprises.3-8 In response to these changes, the American Board of Medical Specialties designated Pediatric Hospital Medicine (PHM) as a pediatric subspecialty in 2016.
The field of PHM in the United States continues to be supported by three core societies—Society of Hospital Medicine (SHM), American Academy of Pediatrics (AAP), and Academic Pediatric Association (APA). Together, these societies serve as tri-sponsors of the annual Pediatric Hospital Medicine national conference, which now welcomes over 1,200 attendees from the United States and abroad.9 Each society also individually sponsors a variety of professional development and continuing medical education activities specific to PHM.
In addition, pediatric hospitalists often serve a pivotal role in teaching learners (medical students, residents, and other health profession students), physician colleagues, and other healthcare professionals on the hospital wards and via institutional educational programs. Nearly 50 institutions in the United States offer graduate medical education training in PHM.10 The PHM Fellowship Directors Council has developed a standardized curricular framework and entrustable professional activities, which reflect the tenets of competency-based medical education, for use in PHM training programs.11-13
These changes in the practice environment of pediatric hospitalists, as well as the changing landscape of graduate and continuing medical education in PHM, have informed this revision of The PHM Core Competencies. The purpose of this article is to describe the methodology of the review and revision process.
OVERVIEW OF THE PHM CORECOMPETENCIES: 2020
Revision
The PHM Core Competencies: 2020 Revision provide a framework for graduate and continuing medical education that reflects the current roles and expectations for all pediatric hospitalists in the United States. The acuity and complexity of hospitalized children, the availability of pediatric subspecialty care and other resources, and the institutional orientation towards pediatric populations vary across community, tertiary, and children’s hospital settings. In order to unify the practice of PHM across these environments, The PHM Core Competencies: 2020 Revision address the fundamental and most common components of PHM which are encountered by the majority of practicing pediatric hospitalists, as opposed to an extensive review of all aspects of the field.
The compendium includes 66 chapters on both clinical and nonclinical topics, divided into four sections—Common Clinical Diagnoses and Conditions, Core Skills, Specialized Services, and Healthcare Systems: Supporting and Advancing Child Health (Table 1). Within each chapter is an introductory paragraph and learning objectives in three domains of educational outcomes—cognitive (knowledge), psychomotor (skills), and affective (attitudes)—as well as systems organization and improvement, to reflect the emphasis of PHM practice on improving healthcare systems. The objectives encompass a range of observable behaviors and other attributes, from foundational skills such as taking a history and performing a physical exam to more advanced actions such as participating in the development of care models to support the health of complex patient populations. Implicit in these objectives is the expectation that pediatric hospitalists build on experiences in medical school and residency training to attain a level of competency at the advanced levels of a developmental continuum, such as proficient, expert, or master.14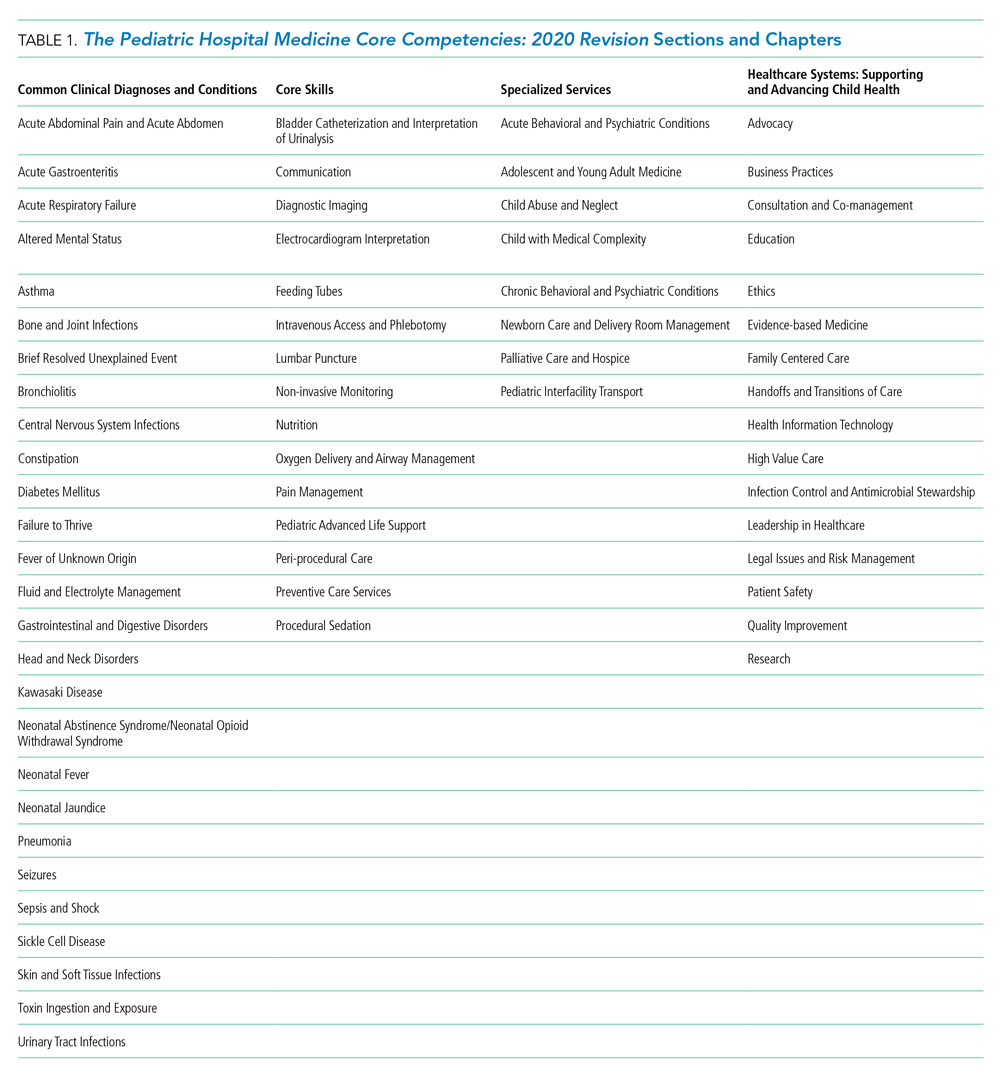
The objectives also balance specificity to the topic with a timeless quality, allowing for flexibility both as new information emerges and when applied to various educational activities and learner groups. Each chapter can stand alone, and thus themes recur if one reads the compendium in its entirety. However, in order to reflect related content among the chapters, the appendix contains a list of associated chapters (Chapter Links) for further exploration. In addition, a short reference list is provided in each chapter to reflect the literature and best practices at the time of publication.
Finally, The PHM Core Competencies: 2020 Revision reflect the status of children as a vulnerable population. Care for hospitalized children requires attention to many elements unique to the pediatric population. These include age-based differences in development, behavior, physiology, and prevalence of clinical conditions, the impact of acute and chronic disease states on child development, the use of medications and other medical interventions with limited investigative guidance, and the role of caregivers in decision-making and care delivery. Heightened awareness of these factors is required in the hospital setting, where diagnoses and interventions often include the use of high-risk modalities and require coordination of care across multiple providers.
METHODS
Project Initiation
Revision of The PHM Core Competencies: 2020 Revision began in early 2017 following SHM’s work on The Core Competencies in Hospital Medicine 2017 Revision.15 The Executive Committee of the SHM Pediatrics Special Interest Group (SIG) supported the initiation of the revision. The 3 editors from the original compendium created an initial plan for the project that included a proposed timeline, processes for engagement of previously involved experts and new talent, and performance of a needs assessment to guide content selection. The Figure highlights these and other important steps in the revision process.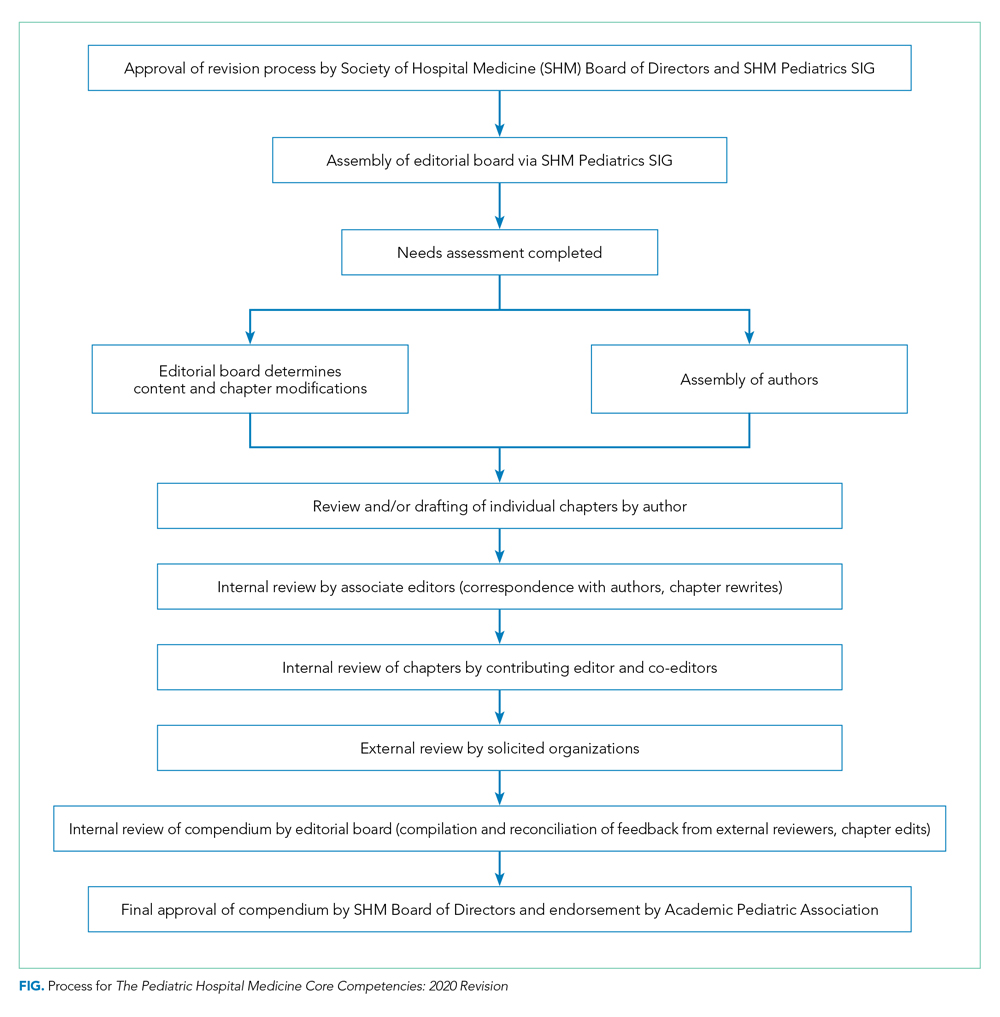
Editor and Associate Editor Selection
The above editors reviewed best practice examples of roles and responsibilities for editor and associate editor positions from relevant, leading societies and journals. From this review, the editors created an editorial structure specifically for The PHM Core Competencies: 2020 Revision. A new position of Contributing Editor was created to address the need for dedicated attention to the community site perspective and ensure review of all content, within and across chapters, by a pediatric hospitalist who is dedicated to this environment. Solicitation for additional editors and associate editors occurred via the SHM Pediatrics SIG to the wider SHM membership. The criteria for selection included active engagement in regional or national activities related to the growth and operations of PHM, strong organizational and leadership skills, including the ability to manage tasks and foster creativity, among others. In addition, a deliberate effort was made to recruit a diverse editorial cohort, considering geographic location, primary work environment, organizational affiliations, content expertise, time in practice, gender, and other factors.
Chapter Topic Selection
The editors conducted a two-pronged needs assessment related to optimal content for inclusion in The PHM Core Competencies: 2020 Revision. First, the editors reviewed content from conferences, textbooks, and handbooks specific to the field of PHM, including the conference programs for the most recent 5 years of both the annual PHM national conference and annual meetings of PHM’s 3 core societies in the United States—SHM, AAP, and APA. Second, the editors conducted a needs assessment survey with several stakeholder groups, including SHM’s Pediatrics and Medicine-Pediatrics SIGs, AAP Section on Hospital Medicine and its subcommittees, APA Hospital Medicine SIG, PHM Fellowship Directors Council, and PHM Division Directors, with encouragement to pass the survey link to others in the PHM community interested in providing input (Appendix Figure). The solicitation asked for comment on existing chapters and suggestions for new chapters. For any new chapter, respondents were asked to note the intended purpose of the chapter and the anticipated value that chapter would bring to our profession and the children and the caregivers served by pediatric hospitalists.
The entire editorial board then reviewed all of the needs assessment data and considered potential changes (additions or deletions) based on emerging trends in pediatric healthcare, the frequency, relevance, and value of the item across all environments in which pediatric hospitalists function, and the value to or impact on hospitalized children and caregivers. Almost all survey ratings and comments were either incorporated into an existing chapter or used to create a new chapter. There was a paucity of comments related to the deletion of chapters, and thus no chapters were entirely excluded. However, there were several comments supporting the exclusion of the suprapubic bladder tap procedure, and thus related content was eliminated from the relevant section in Core Skills. Of the 66 chapters in this revision, the needs assessment data directly informed the creation of 12 new chapters, as well as adjustments and/or additions to the titles of 7 chapters and the content of 29 chapters. In addition, the title of the Specialized Clinical Services section was changed to Specialized Services to represent that both clinical and nonclinical competencies reside in this section devoted to comprehensive management of these unique patient populations commonly encountered by pediatric hospitalists. Many of these changes are highlighted in Table 2.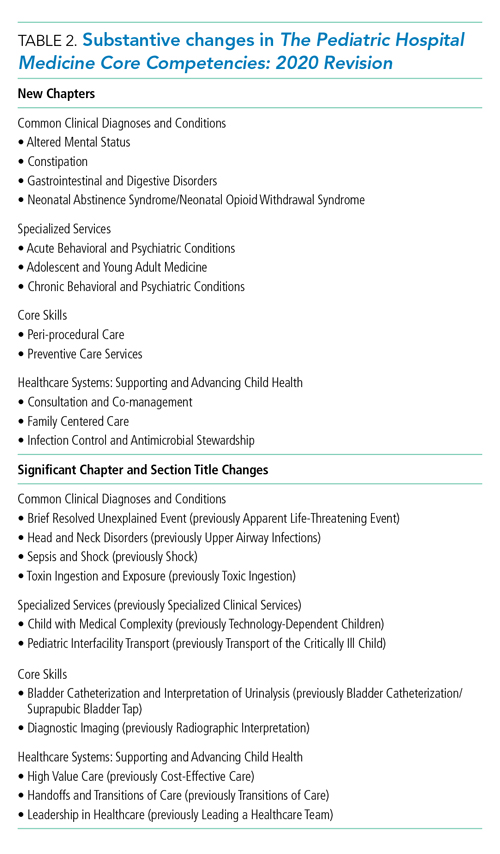
Author selection
Authors from the initial work were invited to participate again as author of their given chapter. Subsequently, authors were identified for new chapters and chapters for which previous authors were no longer able to be engaged. Authors with content expertise were found by reviewing content from conferences, textbooks, and handbooks specific to the field of PHM. Any content expert who was not identified as a pediatric hospitalist was paired with a pediatric hospitalist as coauthor. In addition, as with the editorial board, a deliberate effort was made to recruit a diverse author cohort, considering geographic location, primary work environment, time in practice, gender, and other factors.
The editorial board held numerous conference calls to review potential authors, and the SHM Pediatrics SIG was directly engaged to ensure authorship opportunities were extended broadly. This vetting process resulted in a robust author list and included members of all three of PHM’s sponsoring societies in the United States. Once participation was confirmed, authors received an “author packet” detailing the process with the proposed timeline, resources related to writing learning objectives, the past chapter (if applicable), assigned associate editor, and other helpful resources.
Internal and External Review Process
After all chapters were drafted, the editorial board conducted a rigorous, internal review process. Each chapter was reviewed by at least one associate editor and two editors, with a focus on content, scope, and a standard approach to phrasing and formatting. In addition, the contributing editor reviewed all the chapters to ensure the community hospitalist perspective was adequately represented.
Thirty-two agencies and societies were solicited for external review, including both those involved in review of the previous edition and new stakeholder groups. External reviewers were first contacted to ascertain their interest in participating in the review process, and if interested, were provided with information on the review process. Robust feedback was received from the APA Hospital Medicine SIG, SHM Pediatrics and Medicine-Pediatrics SIGs, Association of Pediatric Program Directors Curriculum Committee, and 20 AAP committees, councils, and sections.
The feedback from the external reviewers and subsequent edits for each chapter were reviewed by at least one associate editor, two editors, and the contributing editor. Authors were engaged to address any salient changes recommended. As the final steps in the review process, the SHM Board of Directors approved the compendium and the APA provided their endorsement.
SUMMARY AND FUTURE DIRECTIONS
This second edition of The PHM Core Competencies: 2020 Revision addresses the knowledge, skills, attitudes, and systems organization and improvement objectives that define the field of pediatric hospital medicine and the leadership roles of pediatric hospitalists. This compendium reflects the recent changes in the practice and educational environments of pediatric hospitalists and can inform education, training, and career development for pediatric hospitalists across all environments in which comprehensive care is rendered for the hospitalized child. Future work at the local and national level can lead to development of associated curricula, conference content, and other training materials.
Acknowledgments
We wish to humbly and respectfully acknowledge the work of the authors, editors, and reviewers involved in the creation of the first edition, as well as this revision, of The PHM Core Competencies. In addition, we are grateful for the input of all pediatric hospitalists and other stakeholders who informed this compendium via contributions to the needs assessment survey, conference proceedings, publications, and other works. Finally, we acknowledge the support and work of SHM project coordinator, Nyla Nicholson, the SHM Pediatrics SIG, and the SHM Board of Directors.
Disclosures
SHM provided administrative support for project coordination (N. Nicholson). No author, editor, or other involved member received any compensation for efforts related to this work. There are no reported conflicts of interest.
1. Pediatric hospital medicine core competencies. Stucky ER, Ottolini MC, Maniscalco J, editors. J Hosp Med April 2010; Vol 5 No 2 (Supplement), 86 pages. Available at: https://www.journalofhospitalmedicine.com/jhospmed/issue/128018/journal-hospital-medicine-52. Accessed August 7, 2019.
2. Association of American Medical Colleges: Analysis in Brief. Estimating the Number and Characteristics of Hospitalist Physicians in the United States and Their Possible Workforce Implications. August 2012 Edition. https://www.aamc.org/download/300620/data/aibvol12_no3-hospitalist.pdf. Accessed August 19, 2019.
3. White CM, Thomson JE, Statile AM, et al. Development of a new care model for hospitalized children with medical complexity. Hosp Pediatr. 2017;7(7):410-414. https://doi.org/10.1542/hpeds.2016-0149.
4. Committee on Hospital Care and Institute for Patient- and Family-Centered Care. Patient- and family-centered care and the pediatrician’s role. Pediatr. 2012;129(2):394-404. https://doi.org/10.1542/peds.2011-3084.
5. Pediatric Research in Inpatient Setting. https://www.prisnetwork.org/. Accessed August 27, 2019.
6. American Academy of Pediatrics. Value in Inpatient Pediatric Network. 2019 Edition. https://www.aap.org/en-us/professional-resources/quality-improvement/Pages/Value-in-Inpatient-Pediatrics.aspx. Accessed August 27, 2019.
7. American Academy of Pediatrics. Advancing Pediatric Educator Excellence Teaching Program. 2019 Edition. https://www.aap.org/en-us/continuing-medical-education/APEX/Pages/APEX.aspx. Accessed August 27, 2019.
8. O’Toole JK, Starmer AJ, Calaman S, et al. I-PASS mentored implementation handoff curriculum: Champion training materials. MedEdPORTAL. 2019;15:10794. https://doi.org/10.15766/mep_2374-8265.10794.
9. Academic Pediatric Association. Pediatric Hospital Medicine 2018 Recap. 2018 Edition. http://2018.phmmeeting.org/. Accessed July 20, 2019.
10. PHM Fellowship Programs. 2019 Edition. http://phmfellows.org/phm-programs/. Accessed July 20, 2019.
11. Shah NH, Rhim HJH, Maniscalco J, et al. The current state of pediatric hospital medicine fellowships: A survey of program directors. J Hosp Med. 2016;11:324–328.21. https://doi.org/10.1002/jhm.2571.
12. Jerardi K, Fisher E, Rassbach C, et al. Development of a curricular framework for pediatric hospital medicine fellowships. Pediatr. 2017;140(1): e20170698.22. https://doi.org/10.1542/peds.2017-0698.
13. Blankenburg R, Chase L, Maniscalco J, Ottolini M. Hospital Medicine Entrustable Professional Activities, American Board of Pediatrics, 2018. https://www.abp.org/subspecialty-epas#Hospitalist%20Medicine. Accessed July 20, 2019.
14. Carraccio CL, Benson BJ, Nixon LJ, Derstine PL. From the educational bench to the clinical bedside: translating the Dreyfus Developmental Model to the learning of clinical skills. Accad Med. 2008;83(8):761-767. https://doi.org/10.1097/ACM.0b013e31817eb632.
15. Nichani S, Crocker J, Fetterman N, Lukela M. Updating the core competencies in hospital medicine—2017 revision: Introduction and methodology. J Hosp Med. 2017;4;283-287. https://doi.org/10.12788/jhm.2715.
The Pediatric Hospital Medicine Core Competencies were first published in 2010 to help define a specific body of knowledge and measurable skills needed to practice high quality care for hospitalized pediatric patients across all practice settings.1 Since then, the number of practicing pediatric hospitalists has grown to a conservative estimate of 3,000 physicians and the scope of practice among pediatric hospitalists has matured.2 Pediatric hospitalists are increasingly leading or participating in organizational and national efforts that emphasize interprofessional collaboration and the delivery of high value care to hospitalized children and their caregivers—including innovative and family-centered care models, patient safety and quality improvement initiatives, and research and educational enterprises.3-8 In response to these changes, the American Board of Medical Specialties designated Pediatric Hospital Medicine (PHM) as a pediatric subspecialty in 2016.
The field of PHM in the United States continues to be supported by three core societies—Society of Hospital Medicine (SHM), American Academy of Pediatrics (AAP), and Academic Pediatric Association (APA). Together, these societies serve as tri-sponsors of the annual Pediatric Hospital Medicine national conference, which now welcomes over 1,200 attendees from the United States and abroad.9 Each society also individually sponsors a variety of professional development and continuing medical education activities specific to PHM.
In addition, pediatric hospitalists often serve a pivotal role in teaching learners (medical students, residents, and other health profession students), physician colleagues, and other healthcare professionals on the hospital wards and via institutional educational programs. Nearly 50 institutions in the United States offer graduate medical education training in PHM.10 The PHM Fellowship Directors Council has developed a standardized curricular framework and entrustable professional activities, which reflect the tenets of competency-based medical education, for use in PHM training programs.11-13
These changes in the practice environment of pediatric hospitalists, as well as the changing landscape of graduate and continuing medical education in PHM, have informed this revision of The PHM Core Competencies. The purpose of this article is to describe the methodology of the review and revision process.
OVERVIEW OF THE PHM CORECOMPETENCIES: 2020
Revision
The PHM Core Competencies: 2020 Revision provide a framework for graduate and continuing medical education that reflects the current roles and expectations for all pediatric hospitalists in the United States. The acuity and complexity of hospitalized children, the availability of pediatric subspecialty care and other resources, and the institutional orientation towards pediatric populations vary across community, tertiary, and children’s hospital settings. In order to unify the practice of PHM across these environments, The PHM Core Competencies: 2020 Revision address the fundamental and most common components of PHM which are encountered by the majority of practicing pediatric hospitalists, as opposed to an extensive review of all aspects of the field.
The compendium includes 66 chapters on both clinical and nonclinical topics, divided into four sections—Common Clinical Diagnoses and Conditions, Core Skills, Specialized Services, and Healthcare Systems: Supporting and Advancing Child Health (Table 1). Within each chapter is an introductory paragraph and learning objectives in three domains of educational outcomes—cognitive (knowledge), psychomotor (skills), and affective (attitudes)—as well as systems organization and improvement, to reflect the emphasis of PHM practice on improving healthcare systems. The objectives encompass a range of observable behaviors and other attributes, from foundational skills such as taking a history and performing a physical exam to more advanced actions such as participating in the development of care models to support the health of complex patient populations. Implicit in these objectives is the expectation that pediatric hospitalists build on experiences in medical school and residency training to attain a level of competency at the advanced levels of a developmental continuum, such as proficient, expert, or master.14
The objectives also balance specificity to the topic with a timeless quality, allowing for flexibility both as new information emerges and when applied to various educational activities and learner groups. Each chapter can stand alone, and thus themes recur if one reads the compendium in its entirety. However, in order to reflect related content among the chapters, the appendix contains a list of associated chapters (Chapter Links) for further exploration. In addition, a short reference list is provided in each chapter to reflect the literature and best practices at the time of publication.
Finally, The PHM Core Competencies: 2020 Revision reflect the status of children as a vulnerable population. Care for hospitalized children requires attention to many elements unique to the pediatric population. These include age-based differences in development, behavior, physiology, and prevalence of clinical conditions, the impact of acute and chronic disease states on child development, the use of medications and other medical interventions with limited investigative guidance, and the role of caregivers in decision-making and care delivery. Heightened awareness of these factors is required in the hospital setting, where diagnoses and interventions often include the use of high-risk modalities and require coordination of care across multiple providers.
METHODS
Project Initiation
Revision of The PHM Core Competencies: 2020 Revision began in early 2017 following SHM’s work on The Core Competencies in Hospital Medicine 2017 Revision.15 The Executive Committee of the SHM Pediatrics Special Interest Group (SIG) supported the initiation of the revision. The 3 editors from the original compendium created an initial plan for the project that included a proposed timeline, processes for engagement of previously involved experts and new talent, and performance of a needs assessment to guide content selection. The Figure highlights these and other important steps in the revision process.
Editor and Associate Editor Selection
The above editors reviewed best practice examples of roles and responsibilities for editor and associate editor positions from relevant, leading societies and journals. From this review, the editors created an editorial structure specifically for The PHM Core Competencies: 2020 Revision. A new position of Contributing Editor was created to address the need for dedicated attention to the community site perspective and ensure review of all content, within and across chapters, by a pediatric hospitalist who is dedicated to this environment. Solicitation for additional editors and associate editors occurred via the SHM Pediatrics SIG to the wider SHM membership. The criteria for selection included active engagement in regional or national activities related to the growth and operations of PHM, strong organizational and leadership skills, including the ability to manage tasks and foster creativity, among others. In addition, a deliberate effort was made to recruit a diverse editorial cohort, considering geographic location, primary work environment, organizational affiliations, content expertise, time in practice, gender, and other factors.
Chapter Topic Selection
The editors conducted a two-pronged needs assessment related to optimal content for inclusion in The PHM Core Competencies: 2020 Revision. First, the editors reviewed content from conferences, textbooks, and handbooks specific to the field of PHM, including the conference programs for the most recent 5 years of both the annual PHM national conference and annual meetings of PHM’s 3 core societies in the United States—SHM, AAP, and APA. Second, the editors conducted a needs assessment survey with several stakeholder groups, including SHM’s Pediatrics and Medicine-Pediatrics SIGs, AAP Section on Hospital Medicine and its subcommittees, APA Hospital Medicine SIG, PHM Fellowship Directors Council, and PHM Division Directors, with encouragement to pass the survey link to others in the PHM community interested in providing input (Appendix Figure). The solicitation asked for comment on existing chapters and suggestions for new chapters. For any new chapter, respondents were asked to note the intended purpose of the chapter and the anticipated value that chapter would bring to our profession and the children and the caregivers served by pediatric hospitalists.
The entire editorial board then reviewed all of the needs assessment data and considered potential changes (additions or deletions) based on emerging trends in pediatric healthcare, the frequency, relevance, and value of the item across all environments in which pediatric hospitalists function, and the value to or impact on hospitalized children and caregivers. Almost all survey ratings and comments were either incorporated into an existing chapter or used to create a new chapter. There was a paucity of comments related to the deletion of chapters, and thus no chapters were entirely excluded. However, there were several comments supporting the exclusion of the suprapubic bladder tap procedure, and thus related content was eliminated from the relevant section in Core Skills. Of the 66 chapters in this revision, the needs assessment data directly informed the creation of 12 new chapters, as well as adjustments and/or additions to the titles of 7 chapters and the content of 29 chapters. In addition, the title of the Specialized Clinical Services section was changed to Specialized Services to represent that both clinical and nonclinical competencies reside in this section devoted to comprehensive management of these unique patient populations commonly encountered by pediatric hospitalists. Many of these changes are highlighted in Table 2.
Author selection
Authors from the initial work were invited to participate again as author of their given chapter. Subsequently, authors were identified for new chapters and chapters for which previous authors were no longer able to be engaged. Authors with content expertise were found by reviewing content from conferences, textbooks, and handbooks specific to the field of PHM. Any content expert who was not identified as a pediatric hospitalist was paired with a pediatric hospitalist as coauthor. In addition, as with the editorial board, a deliberate effort was made to recruit a diverse author cohort, considering geographic location, primary work environment, time in practice, gender, and other factors.
The editorial board held numerous conference calls to review potential authors, and the SHM Pediatrics SIG was directly engaged to ensure authorship opportunities were extended broadly. This vetting process resulted in a robust author list and included members of all three of PHM’s sponsoring societies in the United States. Once participation was confirmed, authors received an “author packet” detailing the process with the proposed timeline, resources related to writing learning objectives, the past chapter (if applicable), assigned associate editor, and other helpful resources.
Internal and External Review Process
After all chapters were drafted, the editorial board conducted a rigorous, internal review process. Each chapter was reviewed by at least one associate editor and two editors, with a focus on content, scope, and a standard approach to phrasing and formatting. In addition, the contributing editor reviewed all the chapters to ensure the community hospitalist perspective was adequately represented.
Thirty-two agencies and societies were solicited for external review, including both those involved in review of the previous edition and new stakeholder groups. External reviewers were first contacted to ascertain their interest in participating in the review process, and if interested, were provided with information on the review process. Robust feedback was received from the APA Hospital Medicine SIG, SHM Pediatrics and Medicine-Pediatrics SIGs, Association of Pediatric Program Directors Curriculum Committee, and 20 AAP committees, councils, and sections.
The feedback from the external reviewers and subsequent edits for each chapter were reviewed by at least one associate editor, two editors, and the contributing editor. Authors were engaged to address any salient changes recommended. As the final steps in the review process, the SHM Board of Directors approved the compendium and the APA provided their endorsement.
SUMMARY AND FUTURE DIRECTIONS
This second edition of The PHM Core Competencies: 2020 Revision addresses the knowledge, skills, attitudes, and systems organization and improvement objectives that define the field of pediatric hospital medicine and the leadership roles of pediatric hospitalists. This compendium reflects the recent changes in the practice and educational environments of pediatric hospitalists and can inform education, training, and career development for pediatric hospitalists across all environments in which comprehensive care is rendered for the hospitalized child. Future work at the local and national level can lead to development of associated curricula, conference content, and other training materials.
Acknowledgments
We wish to humbly and respectfully acknowledge the work of the authors, editors, and reviewers involved in the creation of the first edition, as well as this revision, of The PHM Core Competencies. In addition, we are grateful for the input of all pediatric hospitalists and other stakeholders who informed this compendium via contributions to the needs assessment survey, conference proceedings, publications, and other works. Finally, we acknowledge the support and work of SHM project coordinator, Nyla Nicholson, the SHM Pediatrics SIG, and the SHM Board of Directors.
Disclosures
SHM provided administrative support for project coordination (N. Nicholson). No author, editor, or other involved member received any compensation for efforts related to this work. There are no reported conflicts of interest.
1. Pediatric hospital medicine core competencies. Stucky ER, Ottolini MC, Maniscalco J, editors. J Hosp Med April 2010; Vol 5 No 2 (Supplement), 86 pages. Available at: https://www.journalofhospitalmedicine.com/jhospmed/issue/128018/journal-hospital-medicine-52. Accessed August 7, 2019.
2. Association of American Medical Colleges: Analysis in Brief. Estimating the Number and Characteristics of Hospitalist Physicians in the United States and Their Possible Workforce Implications. August 2012 Edition. https://www.aamc.org/download/300620/data/aibvol12_no3-hospitalist.pdf. Accessed August 19, 2019.
3. White CM, Thomson JE, Statile AM, et al. Development of a new care model for hospitalized children with medical complexity. Hosp Pediatr. 2017;7(7):410-414. https://doi.org/10.1542/hpeds.2016-0149.
4. Committee on Hospital Care and Institute for Patient- and Family-Centered Care. Patient- and family-centered care and the pediatrician’s role. Pediatr. 2012;129(2):394-404. https://doi.org/10.1542/peds.2011-3084.
5. Pediatric Research in Inpatient Setting. https://www.prisnetwork.org/. Accessed August 27, 2019.
6. American Academy of Pediatrics. Value in Inpatient Pediatric Network. 2019 Edition. https://www.aap.org/en-us/professional-resources/quality-improvement/Pages/Value-in-Inpatient-Pediatrics.aspx. Accessed August 27, 2019.
7. American Academy of Pediatrics. Advancing Pediatric Educator Excellence Teaching Program. 2019 Edition. https://www.aap.org/en-us/continuing-medical-education/APEX/Pages/APEX.aspx. Accessed August 27, 2019.
8. O’Toole JK, Starmer AJ, Calaman S, et al. I-PASS mentored implementation handoff curriculum: Champion training materials. MedEdPORTAL. 2019;15:10794. https://doi.org/10.15766/mep_2374-8265.10794.
9. Academic Pediatric Association. Pediatric Hospital Medicine 2018 Recap. 2018 Edition. http://2018.phmmeeting.org/. Accessed July 20, 2019.
10. PHM Fellowship Programs. 2019 Edition. http://phmfellows.org/phm-programs/. Accessed July 20, 2019.
11. Shah NH, Rhim HJH, Maniscalco J, et al. The current state of pediatric hospital medicine fellowships: A survey of program directors. J Hosp Med. 2016;11:324–328.21. https://doi.org/10.1002/jhm.2571.
12. Jerardi K, Fisher E, Rassbach C, et al. Development of a curricular framework for pediatric hospital medicine fellowships. Pediatr. 2017;140(1): e20170698.22. https://doi.org/10.1542/peds.2017-0698.
13. Blankenburg R, Chase L, Maniscalco J, Ottolini M. Hospital Medicine Entrustable Professional Activities, American Board of Pediatrics, 2018. https://www.abp.org/subspecialty-epas#Hospitalist%20Medicine. Accessed July 20, 2019.
14. Carraccio CL, Benson BJ, Nixon LJ, Derstine PL. From the educational bench to the clinical bedside: translating the Dreyfus Developmental Model to the learning of clinical skills. Accad Med. 2008;83(8):761-767. https://doi.org/10.1097/ACM.0b013e31817eb632.
15. Nichani S, Crocker J, Fetterman N, Lukela M. Updating the core competencies in hospital medicine—2017 revision: Introduction and methodology. J Hosp Med. 2017;4;283-287. https://doi.org/10.12788/jhm.2715.
© 2020 Society of Hospital Medicine
Procalcitonin-Guided Antibiotic Discontinuation: An Antimicrobial Stewardship Initiative to Assist Providers
From Western Michigan University, Homer Stryker MD School of Medicine, Kalamazoo, MI (Dr. Vaillant and Dr. Kavanaugh), Ferris State University, Grand Rapids, MI (Dr. Mersfelder), and Bronson Methodist Hospital, Kalamazoo, MI (Dr. Maynard).
Abstract
- Background: Procalcitonin has emerged as an important marker of sepsis and lung infections of bacterial origin. The role of procalcitonin in guiding antibiotic stewardship in lower respiratory tract infections and sepsis has been extensively studied, and use of this biomarker has been shown to decrease antibiotic usage in clinical trials. We sought to evaluate the impact of a pharmacist-driven initiative regarding discontinuation of antibiotics utilizing procalcitonin levels at a community teaching hospital.
- Methods: We retrospectively gathered baseline data on adult patients admitted to a community teaching hospital who were 18 years of age and older, under the care of an inpatient service, and had a single procalcitonin level < 0.25 mcg/L obtained during admission. We then prospectively identified an intervention group of similar patients using a web-based, real-time clinical surveillance system. When a low procalcitonin level was identified in the intervention group, the participating clinical pharmacists screened for antibiotic use and the indication(s), determined whether the antibiotic could be discontinued based on the low procalcitonin level and the absence of another indication for antibiotics, and, when appropriate, contacted the patient’s health care provider via telephone to discuss possible antibiotic discontinuation. The total antibiotic treatment duration was compared between the baseline and intervention groups.
- Results: A total of 172 patients were included in this study (86 in each group). The duration of antibiotic use was not significantly different between the baseline (3.14 ± 4.04 days) and the intervention (3.34 ± 2.8 days) groups (P = 0.1083). Other patient demographics did not influence antibiotic duration.
- Conclusion: Our study did not demonstrate a difference in total antibiotic treatment duration with the utilization of procalcitonin and an oral communication intervention made by a clinical pharmacist at a community-based teaching hospital. Outside of clinical trials, and in the absence of an algorithmic approach, procalcitonin has not consistently been shown to aid in the diagnosis and treatment of infectious diseases. It is important to have a comprehensive antimicrobial stewardship program to reduce antibiotic use and effectively use laboratory values.
Keywords: antibiotic use; bacterial infection; biomarkers; procalcitonin.
Procalcitonin is the precursor of the hormone calcitonin, which is normally produced in the parafollicular cells of the thyroid gland under physiological conditions.1 However, procalcitonin is also released in response to a proinflammatory stimulus, especially that of bacterial origin.1 The source of the procalcitonin surge seen during proinflammatory states is not the parafollicular cells of the thyroid, but rather the neuroendocrine cells of the lung and intestine.1 Stimulants of procalcitonin in these scenarios include bacterial endotoxin, tumor necrosis factor, and interleukin-6.1,2 Due to these observations, procalcitonin has emerged as an important marker of sepsis and lung infections of bacterial origin.3
The role of procalcitonin in guiding antibiotic stewardship in lower respiratory tract infections and sepsis has been extensively studied.4,5 Various randomized controlled trials have shown that antibiotic stewardship guided by procalcitonin levels resulted in lower rates of antibiotic initiation and shorter duration of antibiotic use.4-6 Similar results were obtained in prospective studies evaluating its role in patients with chronic obstructive pulmonary disease and sepsis.7,8 Based on these data, protocol-driven procalcitonin-guided antibiotic stewardship appears beneficial.
Many of these studies employed rigorous protocols. Studies of procalcitonin use in a so-called real-world setting, in which the provider can order and use procalcitonin levels without the use of protocols, are limited. The objective of our study was to evaluate the impact of a pharmacist-driven initiative on discontinuing antibiotics, if indicated, utilizing single procalcitonin measurement results of < 0.25 mcg/L at a community teaching hospital.
Methods
Our study utilized a 2-phase approach. The first phase was a retrospective chart review to establish baseline data regarding adult inpatients with a low procalcitonin level; these patients were randomly selected over a 1-year period (2017). Patients were included if they were 18 years of age or older, under the care of an inpatient service, and had a single procalcitonin level < 0.25 mcg/L obtained during their admission. Patients admitted to the intensive care unit were excluded. In the second phase, we prospectively identified similar patients admitted between January and March 2018 using a web-based, real-time clinical surveillance system. When patients with low procalcitonin levels were identified, 2 participating clinical pharmacists screened for antibiotic use and indication. If it was determined that the antibiotic could be discontinued as a result of the low procalcitonin level and no additional indication for antibiotics was present, the pharmacist contacted the patient’s health care provider via telephone to discuss possible antibiotic discontinuation. Data collected before and after the intervention included total antibiotic treatment duration, white blood cell count, maximum temperature, age, and procalcitonin level.
A sample size of 86 was calculated to provide an alpha of 0.05 and a power of 0.8. A nonparametric Wilcoxon 2-sample test was used to test for a difference in duration of antibiotic treatment between the baseline and intervention groups. A nonparametric test was used due to right-skewed data. All patients were included in the group analysis, regardless of antibiotic use, as the procalcitonin level may have been used in the decision to initiate antibiotics, and this is more representative of a real-world application of the test. This allowed for detection of a significant decrease of 2 days in antibiotic duration post intervention, with a 10% margin to compensate for potential missing data. Data from 86 patients obtained prior to the pharmacist intervention acted as a control comparison group. Statistical analysis was performed using SAS 9.4.
Results
A total of 172 patients were included in this study: 86 patients prior to the intervention, and 86 after implementation. Baseline demographics, laboratory values, vitals, and principal diagnoses for both groups are shown in Table 1 and Table 2. The most common indications for procalcitonin measurement were pneumonia (45.9%), chronic obstructive pulmonary disease (15.7%), and sepsis (14.5%). The remaining diagnoses were encephalopathy, fever and leukocytosis, skin and soft tissue infection, urinary tract infection or pyelonephritis, bone and joint infection, meningitis, intra-abdominal infection, and asthma exacerbation.

Antibiotic therapy was initiated in 68% of the patients overall, 59% in the baseline group and 76% in the intervention group. The duration of antibiotic use was not significantly different between the baseline (3.14 ± 4.04 days) and intervention (3.34 ± 2.8 days) groups (P = 0.1083). Furthermore, antibiotic treatment duration did not vary significantly with patient age, white blood cell count, maximum temperature, or procalcitonin level in either group. Although there was no difference in total antibiotic treatment duration, a post-hoc analysis revealed a 0.6-day decrease in the interval between the date of procalcitonin measurement and the stop date of antibiotics in the intervention group. The average time from admission to obtaining a procalcitonin level was 3 days in the baseline group and 2 days in the intervention group.

Discussion
Our study did not demonstrate a difference in total antibiotic treatment duration with procalcitonin measurement and an oral communication intervention made by a clinical pharmacist at a community teaching hospital with a well-established antimicrobial stewardship program. This may be due to several factors. First, the providers did not receive ongoing education regarding the appropriate use or interpretation of procalcitonin. The procalcitonin result in the electronic health record references the risk for progression to severe sepsis and/or septic shock, but does not indicate how to use procalcitonin as an aid in antibiotic decision-making. However, a recent study in patients with lower respiratory tract infections treated by providers who had been educated on the use of procalcitonin failed to find a reduction in total antibiotic use.9 Second, our study included hospital-wide use of procalcitonin, and was not limited to infections for which procalcitonin use has the strongest evidence (eg, upper respiratory tract infections, pneumonia, sepsis). Thus, providers may have been less likely to use protocolized guidelines. Last, we did not limit the data on antibiotic duration to patients with a procalcitonin level obtained within a defined time frame from antibiotic initiation or time of admission, and some patients had procalcitonin levels measured several days into their hospital stay. While this is likely to have skewed the data in favor of longer antibiotic treatment courses, it also represents a more realistic way in which this laboratory test is being used. Our post-hoc finding of earlier discontinuation of antibiotics after procalcitonin measurement suggests that our intervention may have influenced the decision to discontinue antibiotics. Such an effect may be augmented if procalcitonin is measured earlier in a hospital admission.
Previous studies have also failed to show that the use of procalcitonin decreased duration of antibiotics.9,10 In the aforementioned study regarding real-world outcomes in patients with lower respiratory tract infections, antibiotic duration was not reduced, despite provider education.9 A large observational study that evaluated real-world outcomes in intensive care unit patients did not find decreased antibiotic use or improved outcomes with procalcitonin use.10 With these large studies evaluating the 2 most common infectious diseases for which procalcitonin has previously been found to have clinical benefit, it is important for institutions to re-evaluate how procalcitonin is being utilized by providers. Furthermore, institutions should explore ways to optimize procalcitonin use and decrease unnecessary health care costs. Notably, the current community-acquired pneumonia guidelines recommend against routine use of procalcitonin.11
Conclusion
Outside of clinical trials, and in the absence of an algorithmic approach, procalcitonin has not consistently been shown to aid in the diagnosis or treatment of infectious diseases. It is important to have a comprehensive antimicrobial stewardship program that includes an algorithmic protocol to promote appropriate laboratory testing and reduce total antibiotic use. In addition to improved communication with providers, other interventions need to be investigated to effectively use this biomarker or limit its use.
Acknowledgment: The authors thank the Western Michigan University Department of Epidemiology and Biostatistics for their assistance in preparing this article.
Corresponding author: James Vaillant, MD, Western Michigan University, Homer Stryker MD School of Medicine, 1000 Oakland Drive, Kalamazoo, MI, 49008; james.vaillant@med.wmich.edu.
Financial disclosures: None.
1. Maruna P, Nedelníková K, Gürlich R. Physiology and genetics of procalcitonin. Physiol Res. 2000;(49 suppl 1):S57-S61.
2. Becker KL, Snider R, Nylen ES. Procalcitonin in sepsis and systemic inflammation: a harmful biomarker and a therapeutic target. Br J Pharmacol. 2010;159:253-264.
3. Vijayan AL, Vanimaya RS, Saikant R, et al. Procalcitonin: a promising diagnostic marker for sepsis and antibiotic therapy. J Intensive Care. 2017;5:51.
4. Hey J, Thompson-Leduc P, Kirson NY, et al. Procalcitonin guidance in patients with lower respiratory tract infections: A systematic review and meta-analysis. Clin Chem Lab Med. 2018;56:1200-1209.
5. Schuetz P, Wirz Y, Sager R, et al. Procalcitonin to initiate or discontinue antibiotics in acute respiratory tract infections. Cochrane Database Syst Rev. 2017;10:CD007498.
6. Huang HB, Peng JM, Weng L, et al. Procalcitonin-guided antibiotic therapy in intensive care unit patients: a systematic review and meta-analysis. Ann Intensive Care. 2017;7:114.
7. Stolz D, Christ-Crain M, Bingisser R, et al. Antibiotic treatment of exacerbations of COPD: a randomized, controlled trial comparing procalcitonin-guidance with standard therapy. Chest. 2007;131:9-19.
8. Prkno A, Wacker C, Brunkhorst FM, Schlattmann P. Procalcitonin-guided therapy in intensive care unit patients with severe sepsis and septic shock—a systematic review and meta-analysis. Crit Care. 2013;17:R291.
9. Huang DT, Yealy DM, Filbin MR, et al. Procalcitonin-guided use of antibiotics for lower respiratory tract infections. N Engl J Med. 2018;379:236-249.
10. Chu DC, Mehta AB, Walkey AJ. Practice patterns and outcomes associated with procalcitonin use in critically ill patients with sepsis. Clin Infect Dis. 2017;64:1509-1515.
11. Metlay JP, Waterer GW, Long AC, et al. Diagnosis and treatment of adults with community-acquired pneumonia. An official clinical practice guideline of the American Thoracic Society and Infectious Diseases Society of America. Am J Respir Crit Care Med. 2019;200:e45-e67.
From Western Michigan University, Homer Stryker MD School of Medicine, Kalamazoo, MI (Dr. Vaillant and Dr. Kavanaugh), Ferris State University, Grand Rapids, MI (Dr. Mersfelder), and Bronson Methodist Hospital, Kalamazoo, MI (Dr. Maynard).
Abstract
- Background: Procalcitonin has emerged as an important marker of sepsis and lung infections of bacterial origin. The role of procalcitonin in guiding antibiotic stewardship in lower respiratory tract infections and sepsis has been extensively studied, and use of this biomarker has been shown to decrease antibiotic usage in clinical trials. We sought to evaluate the impact of a pharmacist-driven initiative regarding discontinuation of antibiotics utilizing procalcitonin levels at a community teaching hospital.
- Methods: We retrospectively gathered baseline data on adult patients admitted to a community teaching hospital who were 18 years of age and older, under the care of an inpatient service, and had a single procalcitonin level < 0.25 mcg/L obtained during admission. We then prospectively identified an intervention group of similar patients using a web-based, real-time clinical surveillance system. When a low procalcitonin level was identified in the intervention group, the participating clinical pharmacists screened for antibiotic use and the indication(s), determined whether the antibiotic could be discontinued based on the low procalcitonin level and the absence of another indication for antibiotics, and, when appropriate, contacted the patient’s health care provider via telephone to discuss possible antibiotic discontinuation. The total antibiotic treatment duration was compared between the baseline and intervention groups.
- Results: A total of 172 patients were included in this study (86 in each group). The duration of antibiotic use was not significantly different between the baseline (3.14 ± 4.04 days) and the intervention (3.34 ± 2.8 days) groups (P = 0.1083). Other patient demographics did not influence antibiotic duration.
- Conclusion: Our study did not demonstrate a difference in total antibiotic treatment duration with the utilization of procalcitonin and an oral communication intervention made by a clinical pharmacist at a community-based teaching hospital. Outside of clinical trials, and in the absence of an algorithmic approach, procalcitonin has not consistently been shown to aid in the diagnosis and treatment of infectious diseases. It is important to have a comprehensive antimicrobial stewardship program to reduce antibiotic use and effectively use laboratory values.
Keywords: antibiotic use; bacterial infection; biomarkers; procalcitonin.
Procalcitonin is the precursor of the hormone calcitonin, which is normally produced in the parafollicular cells of the thyroid gland under physiological conditions.1 However, procalcitonin is also released in response to a proinflammatory stimulus, especially that of bacterial origin.1 The source of the procalcitonin surge seen during proinflammatory states is not the parafollicular cells of the thyroid, but rather the neuroendocrine cells of the lung and intestine.1 Stimulants of procalcitonin in these scenarios include bacterial endotoxin, tumor necrosis factor, and interleukin-6.1,2 Due to these observations, procalcitonin has emerged as an important marker of sepsis and lung infections of bacterial origin.3
The role of procalcitonin in guiding antibiotic stewardship in lower respiratory tract infections and sepsis has been extensively studied.4,5 Various randomized controlled trials have shown that antibiotic stewardship guided by procalcitonin levels resulted in lower rates of antibiotic initiation and shorter duration of antibiotic use.4-6 Similar results were obtained in prospective studies evaluating its role in patients with chronic obstructive pulmonary disease and sepsis.7,8 Based on these data, protocol-driven procalcitonin-guided antibiotic stewardship appears beneficial.
Many of these studies employed rigorous protocols. Studies of procalcitonin use in a so-called real-world setting, in which the provider can order and use procalcitonin levels without the use of protocols, are limited. The objective of our study was to evaluate the impact of a pharmacist-driven initiative on discontinuing antibiotics, if indicated, utilizing single procalcitonin measurement results of < 0.25 mcg/L at a community teaching hospital.
Methods
Our study utilized a 2-phase approach. The first phase was a retrospective chart review to establish baseline data regarding adult inpatients with a low procalcitonin level; these patients were randomly selected over a 1-year period (2017). Patients were included if they were 18 years of age or older, under the care of an inpatient service, and had a single procalcitonin level < 0.25 mcg/L obtained during their admission. Patients admitted to the intensive care unit were excluded. In the second phase, we prospectively identified similar patients admitted between January and March 2018 using a web-based, real-time clinical surveillance system. When patients with low procalcitonin levels were identified, 2 participating clinical pharmacists screened for antibiotic use and indication. If it was determined that the antibiotic could be discontinued as a result of the low procalcitonin level and no additional indication for antibiotics was present, the pharmacist contacted the patient’s health care provider via telephone to discuss possible antibiotic discontinuation. Data collected before and after the intervention included total antibiotic treatment duration, white blood cell count, maximum temperature, age, and procalcitonin level.
A sample size of 86 was calculated to provide an alpha of 0.05 and a power of 0.8. A nonparametric Wilcoxon 2-sample test was used to test for a difference in duration of antibiotic treatment between the baseline and intervention groups. A nonparametric test was used due to right-skewed data. All patients were included in the group analysis, regardless of antibiotic use, as the procalcitonin level may have been used in the decision to initiate antibiotics, and this is more representative of a real-world application of the test. This allowed for detection of a significant decrease of 2 days in antibiotic duration post intervention, with a 10% margin to compensate for potential missing data. Data from 86 patients obtained prior to the pharmacist intervention acted as a control comparison group. Statistical analysis was performed using SAS 9.4.
Results
A total of 172 patients were included in this study: 86 patients prior to the intervention, and 86 after implementation. Baseline demographics, laboratory values, vitals, and principal diagnoses for both groups are shown in Table 1 and Table 2. The most common indications for procalcitonin measurement were pneumonia (45.9%), chronic obstructive pulmonary disease (15.7%), and sepsis (14.5%). The remaining diagnoses were encephalopathy, fever and leukocytosis, skin and soft tissue infection, urinary tract infection or pyelonephritis, bone and joint infection, meningitis, intra-abdominal infection, and asthma exacerbation.
Antibiotic therapy was initiated in 68% of the patients overall, 59% in the baseline group and 76% in the intervention group. The duration of antibiotic use was not significantly different between the baseline (3.14 ± 4.04 days) and intervention (3.34 ± 2.8 days) groups (P = 0.1083). Furthermore, antibiotic treatment duration did not vary significantly with patient age, white blood cell count, maximum temperature, or procalcitonin level in either group. Although there was no difference in total antibiotic treatment duration, a post-hoc analysis revealed a 0.6-day decrease in the interval between the date of procalcitonin measurement and the stop date of antibiotics in the intervention group. The average time from admission to obtaining a procalcitonin level was 3 days in the baseline group and 2 days in the intervention group.
Discussion
Our study did not demonstrate a difference in total antibiotic treatment duration with procalcitonin measurement and an oral communication intervention made by a clinical pharmacist at a community teaching hospital with a well-established antimicrobial stewardship program. This may be due to several factors. First, the providers did not receive ongoing education regarding the appropriate use or interpretation of procalcitonin. The procalcitonin result in the electronic health record references the risk for progression to severe sepsis and/or septic shock, but does not indicate how to use procalcitonin as an aid in antibiotic decision-making. However, a recent study in patients with lower respiratory tract infections treated by providers who had been educated on the use of procalcitonin failed to find a reduction in total antibiotic use.9 Second, our study included hospital-wide use of procalcitonin, and was not limited to infections for which procalcitonin use has the strongest evidence (eg, upper respiratory tract infections, pneumonia, sepsis). Thus, providers may have been less likely to use protocolized guidelines. Last, we did not limit the data on antibiotic duration to patients with a procalcitonin level obtained within a defined time frame from antibiotic initiation or time of admission, and some patients had procalcitonin levels measured several days into their hospital stay. While this is likely to have skewed the data in favor of longer antibiotic treatment courses, it also represents a more realistic way in which this laboratory test is being used. Our post-hoc finding of earlier discontinuation of antibiotics after procalcitonin measurement suggests that our intervention may have influenced the decision to discontinue antibiotics. Such an effect may be augmented if procalcitonin is measured earlier in a hospital admission.
Previous studies have also failed to show that the use of procalcitonin decreased duration of antibiotics.9,10 In the aforementioned study regarding real-world outcomes in patients with lower respiratory tract infections, antibiotic duration was not reduced, despite provider education.9 A large observational study that evaluated real-world outcomes in intensive care unit patients did not find decreased antibiotic use or improved outcomes with procalcitonin use.10 With these large studies evaluating the 2 most common infectious diseases for which procalcitonin has previously been found to have clinical benefit, it is important for institutions to re-evaluate how procalcitonin is being utilized by providers. Furthermore, institutions should explore ways to optimize procalcitonin use and decrease unnecessary health care costs. Notably, the current community-acquired pneumonia guidelines recommend against routine use of procalcitonin.11
Conclusion
Outside of clinical trials, and in the absence of an algorithmic approach, procalcitonin has not consistently been shown to aid in the diagnosis or treatment of infectious diseases. It is important to have a comprehensive antimicrobial stewardship program that includes an algorithmic protocol to promote appropriate laboratory testing and reduce total antibiotic use. In addition to improved communication with providers, other interventions need to be investigated to effectively use this biomarker or limit its use.
Acknowledgment: The authors thank the Western Michigan University Department of Epidemiology and Biostatistics for their assistance in preparing this article.
Corresponding author: James Vaillant, MD, Western Michigan University, Homer Stryker MD School of Medicine, 1000 Oakland Drive, Kalamazoo, MI, 49008; james.vaillant@med.wmich.edu.
Financial disclosures: None.
1. Maruna P, Nedelníková K, Gürlich R. Physiology and genetics of procalcitonin. Physiol Res. 2000;(49 suppl 1):S57-S61.
2. Becker KL, Snider R, Nylen ES. Procalcitonin in sepsis and systemic inflammation: a harmful biomarker and a therapeutic target. Br J Pharmacol. 2010;159:253-264.
3. Vijayan AL, Vanimaya RS, Saikant R, et al. Procalcitonin: a promising diagnostic marker for sepsis and antibiotic therapy. J Intensive Care. 2017;5:51.
4. Hey J, Thompson-Leduc P, Kirson NY, et al. Procalcitonin guidance in patients with lower respiratory tract infections: A systematic review and meta-analysis. Clin Chem Lab Med. 2018;56:1200-1209.
5. Schuetz P, Wirz Y, Sager R, et al. Procalcitonin to initiate or discontinue antibiotics in acute respiratory tract infections. Cochrane Database Syst Rev. 2017;10:CD007498.
6. Huang HB, Peng JM, Weng L, et al. Procalcitonin-guided antibiotic therapy in intensive care unit patients: a systematic review and meta-analysis. Ann Intensive Care. 2017;7:114.
7. Stolz D, Christ-Crain M, Bingisser R, et al. Antibiotic treatment of exacerbations of COPD: a randomized, controlled trial comparing procalcitonin-guidance with standard therapy. Chest. 2007;131:9-19.
8. Prkno A, Wacker C, Brunkhorst FM, Schlattmann P. Procalcitonin-guided therapy in intensive care unit patients with severe sepsis and septic shock—a systematic review and meta-analysis. Crit Care. 2013;17:R291.
9. Huang DT, Yealy DM, Filbin MR, et al. Procalcitonin-guided use of antibiotics for lower respiratory tract infections. N Engl J Med. 2018;379:236-249.
10. Chu DC, Mehta AB, Walkey AJ. Practice patterns and outcomes associated with procalcitonin use in critically ill patients with sepsis. Clin Infect Dis. 2017;64:1509-1515.
11. Metlay JP, Waterer GW, Long AC, et al. Diagnosis and treatment of adults with community-acquired pneumonia. An official clinical practice guideline of the American Thoracic Society and Infectious Diseases Society of America. Am J Respir Crit Care Med. 2019;200:e45-e67.