User login
The Anvil of Indecision

Lying in bed, I’m jarred by what can only be an anvil dropping heavily upon my chest. Wakefulness reveals a more canine, cranium-like object. Staring deep into cataract-smudged eyes, I ponder the question that has occupied my mind for nearly two weeks: What would Hogan want?
My Dog Has Cancer
More accurately, he has a tumor—or, I guess, what appears to be a tumor on his chest X-ray. It was discovered, incidentally, on a liver ultrasound that was being done for abnormal liver function test results. That study revealed nothing wrong with his liver, but led to a follow-up radiograph showing a 4.9-cm, right-lower-lobe lung mass. Also uncovered in this process was a tangle of complex emotions, turmoil, and uncertainty surrounding my first personal foray into end-of-life decision-making.
Hogan, my now-presumed-cancer-ridden, 10-year-old Weimaraner, came into my life permanently when he was all of 8 weeks old. I first met him during a visit to the breeder when his litter was only three days old. Over the successive weeks, I visited him often, anxious for the day I’d be able to take my new companion home.
I picked up Hogan on Fourth of July weekend during my chief year of residency—sort of a gift for completing my grueling training. He was the first dog I raised, trained, and cared for by myself. And while we had our share of eaten walls, destroyed comforters, and chewed bits of Jeep Cherokee, this was no “Marley & Me” relationship. We were more like roommates, best friends. We hiked, camped, and went everywhere together—either an idyllic boy-and-his-dog relationship or a sad, pitifully lonely, soul-in-need-of-a-girlfriend existence, depending on your point of view, I suppose.
In the end, the two viewpoints melded as Hogan eventually brought my wife and I together, a story that shall not be printed in these pages.
Through the years, Hogan bore witness to many personal and family milestones. My chief residency, my first grand rounds (his constant audience during my preparation brought him unparalleled expertise in canine zoonoses), my first house, our marriage, a horribly flailing attempt to recapture the magic of my first dog through a second Weim named Grady (definitely “Marley & Me” mixed with a healthy dose of “Dumb & Dumber”), and the birth of our first child.
It was during this time that Hogan began a long journey toward today. He became a little long in the tooth, droopy in the belly, and slow on the trail. His limitless energy and boundless passion for chasing tennis balls gave way to such leisurely pursuits as park pooping and command disobedience. His fluid, sinew-laced limbs became arthritic shells of their former selves, betraying the youthful grace that still echoed inside of him. I distinctly recall the first time Grady beat him to a tennis ball, a moment that clearly represented a passing of the baton—a crestfallen 6-year-old canine eclipsed by the 2-year-old whippersnapper. The youngster sprinted back, bursting with a mouthful of tennis ball and pride. The elder took a decidedly more tortuous and tortured route back—a carriage of nonchalance that failed in its attempt to convey the message that “chasing tennis balls is stupid.”

On the advice of our veterinarian, we stopped throwing Frisbees at Hogan at age 8, out of concern that an awkward jump might result in a paralytic shift in his progressively stenosing spine. While Hogan is otherwise healthy, his hips and forepaws are riddled with osteoarthritis, his eyes carry the cottony haze of cataracts, and his abdomen and skin are home to lumpy lipomas. So, on the advent of his 10th birthday, we are asked to decide how many resources, how much physical distress, how much intervention we afford to an older, sleep-most-of-the-day arthritic dog.
This scenario is complicated by the idiosyncrasies and mores of veterinary medicine. Unlike human medicine, which is replete with tomes of data steeped in decades of experience, our veterinarian counterparts often are left with gaping treatment holes and inadequately studied interventions. This is not a knock against the profession. In fact, I have had nothing short of fantastic experiences with the veterinary professionals with whom I’ve interacted. Rather, there just aren’t prospective, randomized, controlled trials to inform whether intervention will enhance Hogan’s quantity and quality of life.
Then there are the economic realities of the situation. As one who has rarely been ill and always been insured, I was staggered by the cost of medicine for the uninsured. Two-hundred-dollar antibiotics, $500 ultrasounds, $1,500 CT scans, and up to $10,000 operative and surgical ICU stays would have invoked, “you’re joking, right?” exclamations from me prior to this experience. Now they are just another variable that complicates this already emotionally complex discussion—the variable that makes you feel hollow inside for considering it, foolhardy for not.
Questions Abound
What price would I pay to have another few years with my best friend? What if it’s only a year, six months? Would the money be better spent funding my child’s 529 account? What if this is a benign process and intervention is for naught? What if this tumor is metastatic and intervention is futile? Should we spend the extra money on an upfront staging CT scan that has much lower sensitivity than those we routinely utilize?
If we intervene, should we attempt a costly, CT-guided biopsy to rule in malignant disease, or go straight to lobectomy? What if the surgery negatively alters his quality of life? What if he dies on the table? What do I know about the surgical outcomes of the two centers I’m considering? Should we attempt an open or laparoscopic approach to this tumor?
Can we achieve a cure? If we do, what does that mean for a dog in the twilight years of his life? Should we just let the disease progress to its natural endpoint?
What Would Hogan Want?
These are the questions that haunt me. As I stare into Hogan’s eyes, a portal to my companion’s soul, I am tormented by the cauldron of emotions, the indecision bred by incomplete information and the guilt that comes from knowing that Hogan unconditionally trusts that I will do what is right for him.
Will I? My eyes continue to ask Hogan what he would want until finally the answer becomes obvious.
Hogan wants his breakfast. TH
Dr. Glasheen is associate professor of medicine and director of the hospital medicine group and hospitalist training program at the University of Colorado at Denver.
Lying in bed, I’m jarred by what can only be an anvil dropping heavily upon my chest. Wakefulness reveals a more canine, cranium-like object. Staring deep into cataract-smudged eyes, I ponder the question that has occupied my mind for nearly two weeks: What would Hogan want?
My Dog Has Cancer
More accurately, he has a tumor—or, I guess, what appears to be a tumor on his chest X-ray. It was discovered, incidentally, on a liver ultrasound that was being done for abnormal liver function test results. That study revealed nothing wrong with his liver, but led to a follow-up radiograph showing a 4.9-cm, right-lower-lobe lung mass. Also uncovered in this process was a tangle of complex emotions, turmoil, and uncertainty surrounding my first personal foray into end-of-life decision-making.
Hogan, my now-presumed-cancer-ridden, 10-year-old Weimaraner, came into my life permanently when he was all of 8 weeks old. I first met him during a visit to the breeder when his litter was only three days old. Over the successive weeks, I visited him often, anxious for the day I’d be able to take my new companion home.
I picked up Hogan on Fourth of July weekend during my chief year of residency—sort of a gift for completing my grueling training. He was the first dog I raised, trained, and cared for by myself. And while we had our share of eaten walls, destroyed comforters, and chewed bits of Jeep Cherokee, this was no “Marley & Me” relationship. We were more like roommates, best friends. We hiked, camped, and went everywhere together—either an idyllic boy-and-his-dog relationship or a sad, pitifully lonely, soul-in-need-of-a-girlfriend existence, depending on your point of view, I suppose.
In the end, the two viewpoints melded as Hogan eventually brought my wife and I together, a story that shall not be printed in these pages.
Through the years, Hogan bore witness to many personal and family milestones. My chief residency, my first grand rounds (his constant audience during my preparation brought him unparalleled expertise in canine zoonoses), my first house, our marriage, a horribly flailing attempt to recapture the magic of my first dog through a second Weim named Grady (definitely “Marley & Me” mixed with a healthy dose of “Dumb & Dumber”), and the birth of our first child.
It was during this time that Hogan began a long journey toward today. He became a little long in the tooth, droopy in the belly, and slow on the trail. His limitless energy and boundless passion for chasing tennis balls gave way to such leisurely pursuits as park pooping and command disobedience. His fluid, sinew-laced limbs became arthritic shells of their former selves, betraying the youthful grace that still echoed inside of him. I distinctly recall the first time Grady beat him to a tennis ball, a moment that clearly represented a passing of the baton—a crestfallen 6-year-old canine eclipsed by the 2-year-old whippersnapper. The youngster sprinted back, bursting with a mouthful of tennis ball and pride. The elder took a decidedly more tortuous and tortured route back—a carriage of nonchalance that failed in its attempt to convey the message that “chasing tennis balls is stupid.”
On the advice of our veterinarian, we stopped throwing Frisbees at Hogan at age 8, out of concern that an awkward jump might result in a paralytic shift in his progressively stenosing spine. While Hogan is otherwise healthy, his hips and forepaws are riddled with osteoarthritis, his eyes carry the cottony haze of cataracts, and his abdomen and skin are home to lumpy lipomas. So, on the advent of his 10th birthday, we are asked to decide how many resources, how much physical distress, how much intervention we afford to an older, sleep-most-of-the-day arthritic dog.
This scenario is complicated by the idiosyncrasies and mores of veterinary medicine. Unlike human medicine, which is replete with tomes of data steeped in decades of experience, our veterinarian counterparts often are left with gaping treatment holes and inadequately studied interventions. This is not a knock against the profession. In fact, I have had nothing short of fantastic experiences with the veterinary professionals with whom I’ve interacted. Rather, there just aren’t prospective, randomized, controlled trials to inform whether intervention will enhance Hogan’s quantity and quality of life.
Then there are the economic realities of the situation. As one who has rarely been ill and always been insured, I was staggered by the cost of medicine for the uninsured. Two-hundred-dollar antibiotics, $500 ultrasounds, $1,500 CT scans, and up to $10,000 operative and surgical ICU stays would have invoked, “you’re joking, right?” exclamations from me prior to this experience. Now they are just another variable that complicates this already emotionally complex discussion—the variable that makes you feel hollow inside for considering it, foolhardy for not.
Questions Abound
What price would I pay to have another few years with my best friend? What if it’s only a year, six months? Would the money be better spent funding my child’s 529 account? What if this is a benign process and intervention is for naught? What if this tumor is metastatic and intervention is futile? Should we spend the extra money on an upfront staging CT scan that has much lower sensitivity than those we routinely utilize?
If we intervene, should we attempt a costly, CT-guided biopsy to rule in malignant disease, or go straight to lobectomy? What if the surgery negatively alters his quality of life? What if he dies on the table? What do I know about the surgical outcomes of the two centers I’m considering? Should we attempt an open or laparoscopic approach to this tumor?
Can we achieve a cure? If we do, what does that mean for a dog in the twilight years of his life? Should we just let the disease progress to its natural endpoint?
What Would Hogan Want?
These are the questions that haunt me. As I stare into Hogan’s eyes, a portal to my companion’s soul, I am tormented by the cauldron of emotions, the indecision bred by incomplete information and the guilt that comes from knowing that Hogan unconditionally trusts that I will do what is right for him.
Will I? My eyes continue to ask Hogan what he would want until finally the answer becomes obvious.
Hogan wants his breakfast. TH
Dr. Glasheen is associate professor of medicine and director of the hospital medicine group and hospitalist training program at the University of Colorado at Denver.
Life under the Big Tent

SHM prides itself on being a “big tent” organization—inclusive of care providers with different training backgrounds, from varied clinical settings, and representing a multitude of hospital roles. SHM’s diversity expands beyond care providers to include other key stakeholders, such as administrators of hospitalist programs or departments. The diversity was highlighted in the society’s 2007-2008 “Bi-annual Survey on the State of the Hospital Medicine Movement,” which shows that 40% of our members are hospital-employed, 20% are from academic settings, about 15% work in large multistate management companies, and the remaining 25% are equally split between multispecialty practices and local hospitalist groups. The diversity extends to internists, pediatricians, family practitioners, nurse practitioners, physician assistants, specialists—the list goes on.
All of us at SHM appreciate that diversity and routinely try to nurture it. Our board of directors includes physicians from all the aforementioned practice settings and includes dedicated seats for such key constituencies as pediatrics. We have more than 25 committees and task-force groups representing all the key factions of our membership. These groups address issues of relevance to every type of hospitalist and hospitalist group. Our annual meeting has evolved to meet the needs of this diverse membership by addressing an enormous volume of topics and incorporating a variety of tracks that cater to general hospitalists, quality experts, academics, and pediatricians.
One notable area in which we lack diversity: age. We are a young specialty; the average hospitalist is 40 years old.
SHM’s organizational diversity creates challenges; new issues surface every year. One key issue is the balance between academic hospitalists and community hospitalists. Academic hospitalists have wanted SHM to more aggressively support their interests. Community hospitalists want SHM to advocate for their interests, as well as develop programs and projects to meet their needs.
With my election as president and the recent election of another academic hospitalist to serve as SHM president in 2010-2011, there might be some concern that community hospitalists could get lost in an academic agenda. Interestingly, academic hospitalists might have raised similar concerns several years ago following the election of a second consecutive community hospitalist as society president. We have been fortunate to have leaders who can see the whole HM picture, regardless of their professional backgrounds.
One Tent, Many Spikes in the Ground
The issues are more complex than simply the differences between academic and community hospitalists. Appropriately, each of our members wants their groups’ issues discussed and addressed. Although workforce might be an issue for private-practice hospitalists, academic hospitalists share these same issues—just in a different environment. Pediatricians see SHM develop core competencies for adult medicine, then want their own pediatric core competencies; SHM needs to look for a way to make this happen. Nurse practitioners (NPs), physician assistants (PAs), and administrators have looked to SHM to represent not just physicians in HM, but also their interests.
As a result, SHM has developed committees and approaches to engage the professional societies representing PAs and NPs, along with the Medical Group Management Association, to design specific projects and programs. At any point in time, there might be a group of members who see a need for SHM to pay attention to “their” issue or perceive that a current approach, while relevant to one group, falls short of the needs of another. As our diversity grows, the frequency of these situations will increase.
So, is this worrisome? Quite the contrary. I believe it is healthy.
Having an established organization with members of differing opinions and backgrounds helps challenge our assumptions. It refines our approach to complex problems, highlights issues or concerns we did not anticipate, and, most importantly, guards against “groupthink”—the tendency to agree with one another all the time. SHM’s board of directors is committed to this type of inclusive leadership.
We do need to be cautious and think quite a bit about this issue in the coming years. The big tent is filling up quickly. It’s becoming more diverse by the week. The concern is that in trying to work at a level that keeps all our constituents happy, we might please no one. If all our activities have to be justified as being relevant to every distinct group that makes up SHM, then we might dilute our effectiveness.
Alternatively, we do not currently have the bandwidth as an organization to initiate in-depth projects in areas relevant to all our members. So far, our approach has been to focus on areas core to every hospitalist: quality and safety, process improvement, leadership, practice management, care transitions, networking, and education.
As unique problems or issues arise that are relevant to only a subset of members, we will weigh the importance. In many cases, we have created task-force groups to clarify and tackle the problem. We provide the support, but the members of the group create the solution. It has worked well so far.
One Voice, One Goal
But can we stick to this strategy as the diversity of membership expands and the number of relevant issues grows? I don’t know. What I do know is that there is strength in numbers, and even though we all have different issues we deem more important, there are times when it helps to come together and speak as one very big, very loud voice.
Older specialties like endocrinology, allergy, and others have split into a variety of organizations and potentially diluted their message. SHM needs to look for creative ways to be relevant to many constituencies within the specialty. In the meantime, we must pay close attention to the big-tent issues. An academic hospitalist in leadership needs to listen to the voices of hospitalists in the community, work to understand them, and support efforts to address problems relevant to them.
In the past, SHM leadership from the community hospitalist setting has worked to help address and solve issues relevant to academic hospitalists. We need to understand and respect the diversity within SHM’s tent, and we need to work to keep us all together. I firmly believe that is the way forward, and I assure you that is the goal of SHM’s leadership.
As President Kennedy said, “If we cannot end now our differences, at least we can help make the world safe for diversity.” I pledge to keep SHM your organization, regardless of how you were trained or where you practice HM. I can’t hope to know all of your important issues, but I can commit to stand ready to hear your concerns and do what SHM has always done—give your request a thoughtful response and all of our energy.
SHM is your organization. Let me know the direction you think SHM should go. Send me an e-mail at sflanders@hospitalmedicine.org. TH
Dr. Flanders is president of SHM.
How should hypertension in pregnant patients be managed?
Case
You are consulted on a 29-year-old gravida 1 at nine weeks gestation with a two-year history of Type 2 diabetes and hypertension. She is admitted to the obstetric inpatient service for glycemic control. Although prescribed metformin and lisinopril, she ran out of both four months ago. Her current hemoglobin A1C is 9%. Her blood pressure is 140/90 mmHg in both arms, with an appropriately sized manual cuff while seated. She does not have retinopathy, nephropathy, or neuropathy. The obstetric team will begin weight-based insulin to achieve glycemic targets, and they ask for your input regarding blood-pressure management. How should one approach a pregnant patient with hypertension?
Overview
The most common chronic medical issue in reproductive-age women, essential hypertension (termed chronic hypertension in obstetric literature) contributes significantly to maternal and perinatal morbidity and mortality, primarily via increased risk of preeclampsia.
Chronic hypertension complicates up to 5% of pregnancies in the U.S., or as many as 120,000 pregnant women per year.1 Rates of chronic hypertension are expected to increase with later childbearing and increased rate of obesity. Prior to and during pregnancy, hypertension is defined as blood pressure 140/90 mmHg or higher. Chronic hypertension can be either hypertension diagnosed prior to pregnancy or elevated blood pressures identified prior to 20 weeks gestation.2 Normal pregnancy physiology leads to decreased systemic vascular resistance by the end of the first trimester, dropping systolic and diastolic blood pressure between 10 and 15 mmHg, with maximal effect mid-pregnancy followed by a gradual return to baseline.3 Therefore, chronic hypertension might be masked in early pregnancy. Normal changes in pregnancy include renal vasodilatation and increased glomerular filtration rate, so the average serum creatinine (SCr) is 0.5 mg/dL.4
Newly identified hypertension or accelerating hypertension after 20 weeks warrants close evaluation for preeclampsia. Preeclampsia is a multisystem, life-threatening disorder characterized by hypertension and proteinuria (greater than 300 mg/day). Severe forms of preeclampsia include HELLP (hemolysis, elevated liver enzymes and low platelets) syndrome and eclampsia (seizures with no other attributable cause). Superimposed preeclampsia occurs in 20% to 25% of women with chronic hypertension.5 Women with hypertensive target organ damage have an even greater likelihood of preeclampsia as well as maternal and fetal complications. Unfortunately, blood-pressure control during pregnancy has not been shown to minimize the likelihood of developing superimposed preeclampsia or associated maternal and fetal complications.6 The goal of antihypertensive management during pregnancy is to avoid acute maternal or fetal complications of severe hypertension.
Review of the Data
Q: How are hypertensive disorders of pregnancy classified?
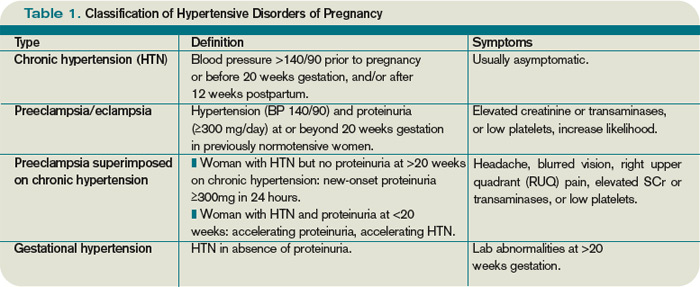
The American College of Obstetrics and Gynecology and the National High Blood Pressure Education Program guideline committees have classified hypertensive disorders of pregnancy into four categories: chronic hypertension, preeclampsia, preeclampsia superimposed on chronic hypertension, and gestational hypertension.2,7
Chronic hypertension is defined as blood pressure 140/90 mmHg or greater on two occasions before pregnancy, prior to 20 weeks of gestation, or persisting 12 weeks postpartum. Severe hypertension is defined as diastolic blood pressure ≥110 mm Hg. Hypertensive women tend to have a greater decline in blood pressure during early pregnancy than normotensive women.8
Secondary hypertension is an important consideration in women of reproductive age. A brief screen for secondary causes includes bilateral arm pressures and femoral pulse assessment, renal bruit assessment, inquiry into snoring, gasping, and daytime somnolence, as well as measurement of serum thyrotropin, potassium, calcium, creatinine, and urinalysis. This kind of evaluation will assess for coarctation of the aorta, renal artery stenosis, obstructive sleep apnea, hyper- or hypothyroidism, hyperaldosteronism, hyperparathyroidism, and underlying renal disease.9,10 Patient reports of episodic headache, palpitations, and diaphoresis should prompt investigation for pheochromocytoma.

Hyperaldosteronism, pheochromocytoma, or hyperthyroidism might be quiescent during pregnancy but flare in the postpartum period.
Women with severe chronic hypertension or target organ damage have higher rates of superimposed preeclampsia. In these individuals, preeclampsia is more likely to present early (before 34 weeks gestation) or with severe disease.1
Preeclampsia is defined as hypertension and proteinuria (greater than 300 mg/day) at or beyond 20 weeks gestation in a previously normotensive woman. Preeclampsia rates vary from 5% to 10% of nulliparous women, to much higher rates in women with medical comorbidities or fetal factors (e.g., multiple gestations, molar pregnancies, hydrops, or triploidy). Preeclampsia’s pathogenesis is attributed to abnormal placental implantation with abnormal maternal immune adaptation, altered angiogenic factors with increased systemic vascular resistance and endothelial dysfunction leading to the clinically apparent maternal syndrome.11
Severe preeclampsia criteria include any of the following: eclampsia, HELLP syndrome (platelets less than 100,000/mm³, transaminases more than twice the upper limit of normal, and/or epigastric pain), SBP ≥160 mmHg, DBP ≥110 mmHg, proteinuria ≥5 grams per day, oliguria, pulmonary edema, placental abruption, or fetal manifestations such as intrauterine growth restriction (≤10th percentile of expected fetal weight based on gestational age), decreased amniotic fluid index, or fetal demise.2,5,12
Maternal symptoms might include headache, visual disturbances, epigastric or right upper quadrant (RUQ) pain, rapid weight gain, and severe edema. Some women remain asymptomatic. Preeclampsia can rapidly progress from “less severe” to severe. Maternal symptoms and abnormal lab findings are more predictive of adverse pregnancy outcomes than the degree of hypertension and/or proteinuria.1
It is always in the mother’s interest to deliver when preeclampsia is diagnosed, because preeclampsia will not resolve until after delivery, with hypertension and lab abnormalities sometimes persisting for months postpartum. Preeclampsia might be diagnosed before fetal viability (approximately 24 weeks gestation), although the vast majority of cases occur near term.
Risks of premature delivery must be balanced with the risks of progressively severe manifestations for the mother and fetus. Guidelines for expectant management of early (<34 weeks) preeclampsia are based on available evidence and expert opinion.13 Magnesium sulfate has been shown to be the most effective agent to minimize the likelihood of seizure in preeclamptic women.14 With an initial bolus of 4 g to 6 g IV followed by infusion of 1-2 g/hour, magnesium sulfate is usually continued for 24 to 48 hours after delivery.
Preeclampsia can first appear postpartum, most likely in the first days to weeks. A growing body of literature links preeclampsia, particularly early and/or recurrent, to subsequent increased risk for cardiovascular disease and end-stage renal disease.15
Preeclampsia superimposed on chronic hypertension is defined as the new onset or markedly increasing proteinuria or accelerating hypertension in the latter half of pregnancy. Maternal symptoms, transaminase elevation, thrombocytopenia, or fetal manifestations further support this diagnosis.
Gestational hypertension, previously known as pregnancy-induced hypertension, is defined as hypertension in the absence of proteinuria in the latter half of pregnancy. Symptoms and lab abnormalities of preeclampsia will be absent. At least half of women with hypertension in the latter half of pregnancy progress to preeclampsia, so gestational hypertension should be considered a provisional diagnosis. Severe gestational hypertension, even without proteinuria or other lab abnormalities, carries increased perinatal risk.
Q: What factors contribute to increased preeclampsia risk?
Maternal factors include: first pregnancy, first pregnancy with a new father, maternal age >35, particularly >40, personal or family history of preeclampsia, chronic hypertension, diabetes mellitus (Type 1, 2 or gestational), systemic lupus erythematosus, antiphospholipid antibody syndrome, renal disease, and obesity. Fetal factors include: multiple gestations, molar pregnancies, hydrops, and triploidy.5,12
Q: When should antihypertensive medications be used in pregnancy?
Most women are hesitant to expose their fetus to medication, and thus must be in therapeutic alliance with their obstetrician and consultants. The overriding principle of medication use in pregnancy is that a healthy fetus requires a healthy mother, and medication use is justified when there is definite benefit to the mother. Due to increased metabolism during pregnancy, medications otherwise dosed once per day often require two doses per day, and those dosed twice daily often require every-eight-hour dosing to maintain efficacy. Additionally, titration up every few days may be required.
Therapy goals include avoiding maternal and fetal complications from severely elevated blood pressure, as well as avoiding fetal growth restriction due to impaired uteroplacental flow. The ideal blood pressure for a hypertensive pregnant woman has not been established, but recommendations are based upon available data and expert opinion.2,5,10,12 Maternal risk of intracerebral hemorrhage increases with SBP ≥160 mmHg.16 Diastolic BP ≥110 mmHg has been associated with greater risk of placental abruption and intrauterine growth restriction.
Pharmacologic treatment generally is initiated or adjusted to achieve SBP <160 mm Hg and DBP <100 to <105 mmHg, although some societies advocate treatment initiation at 140/90 mmHg.2,5,12,17,18 If a woman has target organ damage or concomitant medical issues warranting tighter control (e.g., diabetes or pre-existing renal disease), 130/80 mmHg is preferable.19 Activity limitation and/or bed rest, although commonly recommended, have not been shown to reduce maternal or fetal morbidity or mortality, or prolong time to delivery.
An ongoing, randomized, prospective trial will compare maternal and fetal outcomes in women with mild chronic hypertension with deliberate blood-pressure stratification (goal DBP 85 mmHg vs. goal DBP 100 mmHg).20
Q: What are reasonable treatment options for a woman with chronic hypertension during pregnancy?
Due to vasodilatation of pregnancy, antihypertensive agents often can be discontinued early in pregnancy with close, ongoing monitoring. The majority of women with mild chronic hypertension will have blood pressures <160/100 mmHg without medication during the first half of pregnancy.
If a woman has been using a pharmacologic agent not advisable during pregnancy, she could be switched to a preferred agent. If a woman has been using a pharmacologic agent preferred during pregnancy, she could continue this agent.
Q: What antihypertensives are favored during pregnancy?
Methyldopa and labetalol have been used extensively. Methyldopa has not been found to adversely affect cognitive development in children exposed in utero. On the maternal side, somnolence, dizziness, and dry mouth are common side effects.
Labetalol is widely used as a first- or second-line agent. It can be used intravenously or orally. Intravenous labetalol in escalating doses (10 mg, 20 mg, 40 mg, 80 mg) is the first line of acute treatment for severe hypertension/preeclampsia.
Atenolol and propranolol have been associated with fetal growth restriction, metoprolol to a lesser degree.
Metoprolol is useful in women with coronary artery disease, tachyarrhythmias, and/or requiring migraine prophylaxis during pregnancy.
Nifedipine is often used as a second-line agent, with extended-release preparation preferred. Short-acting nifedipine should be used with caution during pregnancy due to the potential for acute impairment of uteroplacental flow. However, short-acting nifedipine is used for tocolysis in pre-term labor.
Intravenous hydralazine is another option for acute treatment in the setting of severe hypertension/preeclampsia.
Angiotensin-converting enzyme (ACE) inhibitors are contraindicated during pregnancy due to association with increased rates of cardiovascular and central nervous system malformations when used in the first trimester, as well as fetal anuric renal failure when used later in pregnancy.21 Due to similar mechanisms of action, angiotensin receptor blockers (ARBs) are contraindicated.
In general, antihypertensive agents are considered compatible with lactation, with most minimally excreted into breast milk. Women requiring antihypertensive agents or almost any medication during lactation seek particular reassurance from caregivers.
It is essential to emphasize the benefit of breastfeeding for both mother and newborn, which far outweighs the risk of medication exposure to the newborn—with rare exceptions. Enalapril and captopril are considered compatible with breastfeeding by the American Academy of Pediatrics.22
Q: Can we identify and possibly prevent preeclampsia?
Escalating hypertension or maternal symptoms, especially in women with increased risk factors, warrant careful examination and laboratory assessment for preeclampsia. Physical findings may include retinal vasospasm, rales on pulmonary exam, cardiac gallop, RUQ or midepigastric tenderness from hepatic capsule stretching, nondependent edema (e.g., face, hands), or clonus on deep tendon reflex evaluation. Useful laboratory values include complete blood count, serum creatinine, hepatic transaminases, uric acid, and urinalysis.
Marked anemia or hemoconcentration, thrombocytopenia, SCr ≥0.8 mg/dL, transaminases above normal, uric acid ≥5.0 mg/dL, urine protein 1+ or greater on dipstick, are all suggestive of preeclampsia, particularly if worsened compared to prior values. Urine protein-to-creatinine ratios have not reliably correlated with 24-hour urine protein collections in preeclamptic patients, although very high or low values could be helpful.23
Women are typically admitted for fetal monitoring, 24-hour urine protein collection, and blood-pressure management during a preeclampsia evaluation.
Thus far, the only intervention shown to reduce the likelihood of preeclampsia in women at increased risk is low-dose aspirin. A recent meta-analysis noted 10% reduction of relative risk of preeclampsia and pre-term birth prior to 34 weeks in women with history of preeclampsia treated with aspirin from the second trimester onward.24 Other interventions in trials that have not displayed reduced risk include vitamin C, vitamin E, calcium, fish oil, zinc, magnesium, and antihypertensive therapy.
Back to the Case
Our patient has chronic hypertension and diabetes, so she should have a blood-pressure goal of <130/80 mmHg. She could be initiated on methyldopa or labetalol. She should have a screen for secondary hypertension via exam and serum thyrotropin, potassium, and calcium, as well as baseline “preeclampsia labs”: complete blood count, serum creatinine, transaminases, uric acid, and 24-hour urine protein assessment. Aspirin at 81 mg daily should be considered from 12 weeks gestation to delivery.
Glycemic control is critical in early gestation to avoid increased risk for congenital malformations and spontaneous abortion, and later on to minimize macrosomia. Close monitoring for maternal symptoms of preeclampsia and blood-pressure assessment is advisable. With medical comorbidities of hypertension and diabetes mellitus, the woman’s risk of preeclampsia is at least 25%. Her pregnancy dating should be confirmed by a first-trimester ultrasound.
Bottom Line
A pregnant woman with chronic hypertension should have evaluation for secondary causes of hypertension, adjustment or initiation of preferred antihypertensive agents to achieve blood pressures that minimize the risk for acute hypertensive complications and fetal growth impairment, and close monitoring for superimposed preeclampsia. TH
Dr. Hayes is an obstetric internist at Women & Infants’ Hospital and assistant professor of medicine (clinical) at the Warren Alpert Medical School of Brown University, Providence, R.I.
References
- Sibai BM. Caring for women with hypertension in pregnancy. JAMA. 2007;298(13):1566-1568.
- Report of the National High Blood Pressure Education Program Working Group on High Blood Pressure in Pregnancy. Am J Obstet Gynecol. 2000;183:S1-S22.
- Christianson RE. Studies on blood pressure during pregnancy. I. Influence of parity and age. Am J Obstet Gynecol. 1976;125(4):509-513.
- Gibson P, Rosene-Montella K. Normal renal and vascular changes in pregnancy. In: Rosene-Montella K, Keely E, Barbour LA, Lee RV, eds. Medical Care of the Pregnant Patient. 2nd ed. Philadelphia: American College of Physicians; 2008:149-152.
- ACOG practice bulletin, No. 33, January 2002. Diagnosis and management of preeclampsia and eclampsia. Obstet Gynecol. 2002;99(1):159-167.
- Sibai BM. Chronic hypertension in pregnancy. Obstet Gynecol. 2002;100(2):369-377.
- Mulrow CD, Chiquette E, Ferrer RL, et al. Management of Chronic Hypertension During Pregnancy. Rockville: Agency for Healthcare Research and Quality; 2000.
- Pickering TG, Hall JE, Appel LJ, et al. Recommendations for blood pressure measurement in humans and experimental animals: part 1: blood pressure measurement in humans: a statement for professionals from the Subcommittee of Prof-essional and Public Education of the American Heart Association Council on high blood pressure Research. Circulation. 2005;111(5):697-716.
- Powrie RO. A 30-year-old woman with chronic hypertension trying to conceive. JAMA. 2007; 298(13):1548-1558.
- Chobanian AV, Bakris GL, Black HR, et al. The Seventh Report of the Joint National Committee on Prevention, Detection, Evaluation, and Treatment of High Blood Pressure: the JNC 7 report. JAMA. 2003:289(19):2560-2571.
- Widmer M, Villar J, Benigni A, Conde-Agudelo A, Karumanchi SA, Lindheimer M. Mapping the theories of preeclampsia and the role of angiogenic factors: a systematic review. Obstet Gynecol. 2007; 109(1):168-180.
- Magee LA, Helewa M, Moutquin JM, van Dadelszen P. Diagnosis, evaluation, and management of the hypertensive disorders of pregnancy. SOGC Clinical Practice Guideline. J Obstet Gynaecol Can. 2008; 30:S1-S48.
- Sibai BM, Barton JR. Expectant management of severe preeclampsia remote from term: patient selection, treatment, and delivery indications. Am J Obstet Gynecol. 2007;196(6):514.e1-514.e1-9.
- Duley L, Gülmezoglu AM, Henderson-Smart DJ. Magnesium sulphate and other anticonvulsants for women with preeclampsia. Cochrane Database Syst Rev. 2003;(2):CD000025.
- McDonald SD, Malinowski A, Zhou Q, Yusuf S, Devereaux PJ. Cardiovascular sequelae of preeclampsia/eclampsia: a systematic review and meta-analyses. Am Heart J. 2008;156(5):918-930.
- Martin JN Jr., Thigpen BD, Moore RC, Rose CH, Cushman J, May W. Stroke and severe preeclampsia and eclampsia: a paradigm shift focusing on systolic blood pressure. Obstet Gynecol. 2005;105(2): 246-254.
- Lindheimer MD, Taler SJ, Cunningham FG. Hyper-tension in pregnancy. J Am Soc Hypertens. 2008; 2(6):484-494.
- Podymow T, August P. Update on the use of antihypertensive drugs in pregnancy. Hypertension. 2008; 51(4):960-969.
- Kitzmiller JL, Block JM, Brown FM, et al. Managing preexisting diabetes for pregnancy: summary of evidence and consensus recommendations for care. Diabetes Care. 2008;31(5):1060-1079.
- Magee LA, von Dadelszen P, Chan S, et al. The Control of Hypertension In Pregnancy Study pilot trial. BJOG. 2007;114(6):770,e13-e20.
- Cooper WO, Hernandez-Diaz S, Arbogast PG, et al. Major congenital malformations after first-trimester exposure to ACE inhibitors. N Engl J Med. 2006; 354(23):2442-2451.
- American Academy of Pediatrics Committee on Drugs. Transfer of drugs and other chemicals into human milk. Pediatrics. 2001;108(3):776-789.
- Papanna R, Mann LK, Kouides RW, Glantz JC. Protein/creatinine ratio in preeclampsia: a systematic review. Obstet Gynecol. 2008;112(1):135-144.
- Askie LM, Duley L, Henderson-Smart DJ, Stewart LA, PARIS Collaborative group. Antiplatelet agents for prevention of pre-eclampsia: a meta-analysis of individual patient data. Lancet. 2007;369(9575): 1791-1798.
Case
You are consulted on a 29-year-old gravida 1 at nine weeks gestation with a two-year history of Type 2 diabetes and hypertension. She is admitted to the obstetric inpatient service for glycemic control. Although prescribed metformin and lisinopril, she ran out of both four months ago. Her current hemoglobin A1C is 9%. Her blood pressure is 140/90 mmHg in both arms, with an appropriately sized manual cuff while seated. She does not have retinopathy, nephropathy, or neuropathy. The obstetric team will begin weight-based insulin to achieve glycemic targets, and they ask for your input regarding blood-pressure management. How should one approach a pregnant patient with hypertension?
Overview
The most common chronic medical issue in reproductive-age women, essential hypertension (termed chronic hypertension in obstetric literature) contributes significantly to maternal and perinatal morbidity and mortality, primarily via increased risk of preeclampsia.
Chronic hypertension complicates up to 5% of pregnancies in the U.S., or as many as 120,000 pregnant women per year.1 Rates of chronic hypertension are expected to increase with later childbearing and increased rate of obesity. Prior to and during pregnancy, hypertension is defined as blood pressure 140/90 mmHg or higher. Chronic hypertension can be either hypertension diagnosed prior to pregnancy or elevated blood pressures identified prior to 20 weeks gestation.2 Normal pregnancy physiology leads to decreased systemic vascular resistance by the end of the first trimester, dropping systolic and diastolic blood pressure between 10 and 15 mmHg, with maximal effect mid-pregnancy followed by a gradual return to baseline.3 Therefore, chronic hypertension might be masked in early pregnancy. Normal changes in pregnancy include renal vasodilatation and increased glomerular filtration rate, so the average serum creatinine (SCr) is 0.5 mg/dL.4
Newly identified hypertension or accelerating hypertension after 20 weeks warrants close evaluation for preeclampsia. Preeclampsia is a multisystem, life-threatening disorder characterized by hypertension and proteinuria (greater than 300 mg/day). Severe forms of preeclampsia include HELLP (hemolysis, elevated liver enzymes and low platelets) syndrome and eclampsia (seizures with no other attributable cause). Superimposed preeclampsia occurs in 20% to 25% of women with chronic hypertension.5 Women with hypertensive target organ damage have an even greater likelihood of preeclampsia as well as maternal and fetal complications. Unfortunately, blood-pressure control during pregnancy has not been shown to minimize the likelihood of developing superimposed preeclampsia or associated maternal and fetal complications.6 The goal of antihypertensive management during pregnancy is to avoid acute maternal or fetal complications of severe hypertension.
Review of the Data
Q: How are hypertensive disorders of pregnancy classified?
The American College of Obstetrics and Gynecology and the National High Blood Pressure Education Program guideline committees have classified hypertensive disorders of pregnancy into four categories: chronic hypertension, preeclampsia, preeclampsia superimposed on chronic hypertension, and gestational hypertension.2,7
Chronic hypertension is defined as blood pressure 140/90 mmHg or greater on two occasions before pregnancy, prior to 20 weeks of gestation, or persisting 12 weeks postpartum. Severe hypertension is defined as diastolic blood pressure ≥110 mm Hg. Hypertensive women tend to have a greater decline in blood pressure during early pregnancy than normotensive women.8
Secondary hypertension is an important consideration in women of reproductive age. A brief screen for secondary causes includes bilateral arm pressures and femoral pulse assessment, renal bruit assessment, inquiry into snoring, gasping, and daytime somnolence, as well as measurement of serum thyrotropin, potassium, calcium, creatinine, and urinalysis. This kind of evaluation will assess for coarctation of the aorta, renal artery stenosis, obstructive sleep apnea, hyper- or hypothyroidism, hyperaldosteronism, hyperparathyroidism, and underlying renal disease.9,10 Patient reports of episodic headache, palpitations, and diaphoresis should prompt investigation for pheochromocytoma.
Hyperaldosteronism, pheochromocytoma, or hyperthyroidism might be quiescent during pregnancy but flare in the postpartum period.
Women with severe chronic hypertension or target organ damage have higher rates of superimposed preeclampsia. In these individuals, preeclampsia is more likely to present early (before 34 weeks gestation) or with severe disease.1
Preeclampsia is defined as hypertension and proteinuria (greater than 300 mg/day) at or beyond 20 weeks gestation in a previously normotensive woman. Preeclampsia rates vary from 5% to 10% of nulliparous women, to much higher rates in women with medical comorbidities or fetal factors (e.g., multiple gestations, molar pregnancies, hydrops, or triploidy). Preeclampsia’s pathogenesis is attributed to abnormal placental implantation with abnormal maternal immune adaptation, altered angiogenic factors with increased systemic vascular resistance and endothelial dysfunction leading to the clinically apparent maternal syndrome.11
Severe preeclampsia criteria include any of the following: eclampsia, HELLP syndrome (platelets less than 100,000/mm³, transaminases more than twice the upper limit of normal, and/or epigastric pain), SBP ≥160 mmHg, DBP ≥110 mmHg, proteinuria ≥5 grams per day, oliguria, pulmonary edema, placental abruption, or fetal manifestations such as intrauterine growth restriction (≤10th percentile of expected fetal weight based on gestational age), decreased amniotic fluid index, or fetal demise.2,5,12
Maternal symptoms might include headache, visual disturbances, epigastric or right upper quadrant (RUQ) pain, rapid weight gain, and severe edema. Some women remain asymptomatic. Preeclampsia can rapidly progress from “less severe” to severe. Maternal symptoms and abnormal lab findings are more predictive of adverse pregnancy outcomes than the degree of hypertension and/or proteinuria.1
It is always in the mother’s interest to deliver when preeclampsia is diagnosed, because preeclampsia will not resolve until after delivery, with hypertension and lab abnormalities sometimes persisting for months postpartum. Preeclampsia might be diagnosed before fetal viability (approximately 24 weeks gestation), although the vast majority of cases occur near term.
Risks of premature delivery must be balanced with the risks of progressively severe manifestations for the mother and fetus. Guidelines for expectant management of early (<34 weeks) preeclampsia are based on available evidence and expert opinion.13 Magnesium sulfate has been shown to be the most effective agent to minimize the likelihood of seizure in preeclamptic women.14 With an initial bolus of 4 g to 6 g IV followed by infusion of 1-2 g/hour, magnesium sulfate is usually continued for 24 to 48 hours after delivery.
Preeclampsia can first appear postpartum, most likely in the first days to weeks. A growing body of literature links preeclampsia, particularly early and/or recurrent, to subsequent increased risk for cardiovascular disease and end-stage renal disease.15
Preeclampsia superimposed on chronic hypertension is defined as the new onset or markedly increasing proteinuria or accelerating hypertension in the latter half of pregnancy. Maternal symptoms, transaminase elevation, thrombocytopenia, or fetal manifestations further support this diagnosis.
Gestational hypertension, previously known as pregnancy-induced hypertension, is defined as hypertension in the absence of proteinuria in the latter half of pregnancy. Symptoms and lab abnormalities of preeclampsia will be absent. At least half of women with hypertension in the latter half of pregnancy progress to preeclampsia, so gestational hypertension should be considered a provisional diagnosis. Severe gestational hypertension, even without proteinuria or other lab abnormalities, carries increased perinatal risk.
Q: What factors contribute to increased preeclampsia risk?
Maternal factors include: first pregnancy, first pregnancy with a new father, maternal age >35, particularly >40, personal or family history of preeclampsia, chronic hypertension, diabetes mellitus (Type 1, 2 or gestational), systemic lupus erythematosus, antiphospholipid antibody syndrome, renal disease, and obesity. Fetal factors include: multiple gestations, molar pregnancies, hydrops, and triploidy.5,12
Q: When should antihypertensive medications be used in pregnancy?
Most women are hesitant to expose their fetus to medication, and thus must be in therapeutic alliance with their obstetrician and consultants. The overriding principle of medication use in pregnancy is that a healthy fetus requires a healthy mother, and medication use is justified when there is definite benefit to the mother. Due to increased metabolism during pregnancy, medications otherwise dosed once per day often require two doses per day, and those dosed twice daily often require every-eight-hour dosing to maintain efficacy. Additionally, titration up every few days may be required.
Therapy goals include avoiding maternal and fetal complications from severely elevated blood pressure, as well as avoiding fetal growth restriction due to impaired uteroplacental flow. The ideal blood pressure for a hypertensive pregnant woman has not been established, but recommendations are based upon available data and expert opinion.2,5,10,12 Maternal risk of intracerebral hemorrhage increases with SBP ≥160 mmHg.16 Diastolic BP ≥110 mmHg has been associated with greater risk of placental abruption and intrauterine growth restriction.
Pharmacologic treatment generally is initiated or adjusted to achieve SBP <160 mm Hg and DBP <100 to <105 mmHg, although some societies advocate treatment initiation at 140/90 mmHg.2,5,12,17,18 If a woman has target organ damage or concomitant medical issues warranting tighter control (e.g., diabetes or pre-existing renal disease), 130/80 mmHg is preferable.19 Activity limitation and/or bed rest, although commonly recommended, have not been shown to reduce maternal or fetal morbidity or mortality, or prolong time to delivery.
An ongoing, randomized, prospective trial will compare maternal and fetal outcomes in women with mild chronic hypertension with deliberate blood-pressure stratification (goal DBP 85 mmHg vs. goal DBP 100 mmHg).20
Q: What are reasonable treatment options for a woman with chronic hypertension during pregnancy?
Due to vasodilatation of pregnancy, antihypertensive agents often can be discontinued early in pregnancy with close, ongoing monitoring. The majority of women with mild chronic hypertension will have blood pressures <160/100 mmHg without medication during the first half of pregnancy.
If a woman has been using a pharmacologic agent not advisable during pregnancy, she could be switched to a preferred agent. If a woman has been using a pharmacologic agent preferred during pregnancy, she could continue this agent.
Q: What antihypertensives are favored during pregnancy?
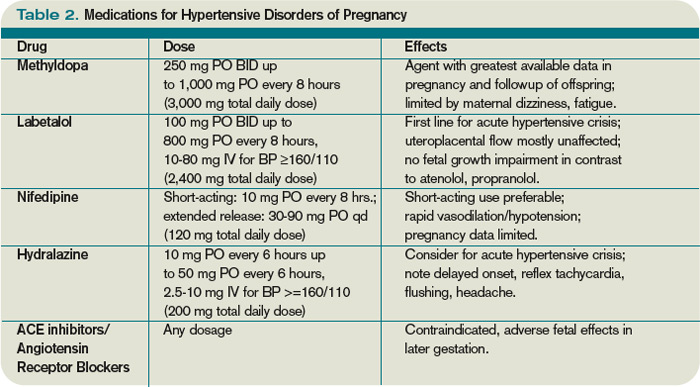
Methyldopa and labetalol have been used extensively. Methyldopa has not been found to adversely affect cognitive development in children exposed in utero. On the maternal side, somnolence, dizziness, and dry mouth are common side effects.
Labetalol is widely used as a first- or second-line agent. It can be used intravenously or orally. Intravenous labetalol in escalating doses (10 mg, 20 mg, 40 mg, 80 mg) is the first line of acute treatment for severe hypertension/preeclampsia.
Atenolol and propranolol have been associated with fetal growth restriction, metoprolol to a lesser degree.
Metoprolol is useful in women with coronary artery disease, tachyarrhythmias, and/or requiring migraine prophylaxis during pregnancy.
Nifedipine is often used as a second-line agent, with extended-release preparation preferred. Short-acting nifedipine should be used with caution during pregnancy due to the potential for acute impairment of uteroplacental flow. However, short-acting nifedipine is used for tocolysis in pre-term labor.
Intravenous hydralazine is another option for acute treatment in the setting of severe hypertension/preeclampsia.
Angiotensin-converting enzyme (ACE) inhibitors are contraindicated during pregnancy due to association with increased rates of cardiovascular and central nervous system malformations when used in the first trimester, as well as fetal anuric renal failure when used later in pregnancy.21 Due to similar mechanisms of action, angiotensin receptor blockers (ARBs) are contraindicated.
In general, antihypertensive agents are considered compatible with lactation, with most minimally excreted into breast milk. Women requiring antihypertensive agents or almost any medication during lactation seek particular reassurance from caregivers.
It is essential to emphasize the benefit of breastfeeding for both mother and newborn, which far outweighs the risk of medication exposure to the newborn—with rare exceptions. Enalapril and captopril are considered compatible with breastfeeding by the American Academy of Pediatrics.22
Q: Can we identify and possibly prevent preeclampsia?
Escalating hypertension or maternal symptoms, especially in women with increased risk factors, warrant careful examination and laboratory assessment for preeclampsia. Physical findings may include retinal vasospasm, rales on pulmonary exam, cardiac gallop, RUQ or midepigastric tenderness from hepatic capsule stretching, nondependent edema (e.g., face, hands), or clonus on deep tendon reflex evaluation. Useful laboratory values include complete blood count, serum creatinine, hepatic transaminases, uric acid, and urinalysis.
Marked anemia or hemoconcentration, thrombocytopenia, SCr ≥0.8 mg/dL, transaminases above normal, uric acid ≥5.0 mg/dL, urine protein 1+ or greater on dipstick, are all suggestive of preeclampsia, particularly if worsened compared to prior values. Urine protein-to-creatinine ratios have not reliably correlated with 24-hour urine protein collections in preeclamptic patients, although very high or low values could be helpful.23
Women are typically admitted for fetal monitoring, 24-hour urine protein collection, and blood-pressure management during a preeclampsia evaluation.
Thus far, the only intervention shown to reduce the likelihood of preeclampsia in women at increased risk is low-dose aspirin. A recent meta-analysis noted 10% reduction of relative risk of preeclampsia and pre-term birth prior to 34 weeks in women with history of preeclampsia treated with aspirin from the second trimester onward.24 Other interventions in trials that have not displayed reduced risk include vitamin C, vitamin E, calcium, fish oil, zinc, magnesium, and antihypertensive therapy.
Back to the Case
Our patient has chronic hypertension and diabetes, so she should have a blood-pressure goal of <130/80 mmHg. She could be initiated on methyldopa or labetalol. She should have a screen for secondary hypertension via exam and serum thyrotropin, potassium, and calcium, as well as baseline “preeclampsia labs”: complete blood count, serum creatinine, transaminases, uric acid, and 24-hour urine protein assessment. Aspirin at 81 mg daily should be considered from 12 weeks gestation to delivery.
Glycemic control is critical in early gestation to avoid increased risk for congenital malformations and spontaneous abortion, and later on to minimize macrosomia. Close monitoring for maternal symptoms of preeclampsia and blood-pressure assessment is advisable. With medical comorbidities of hypertension and diabetes mellitus, the woman’s risk of preeclampsia is at least 25%. Her pregnancy dating should be confirmed by a first-trimester ultrasound.
Bottom Line
A pregnant woman with chronic hypertension should have evaluation for secondary causes of hypertension, adjustment or initiation of preferred antihypertensive agents to achieve blood pressures that minimize the risk for acute hypertensive complications and fetal growth impairment, and close monitoring for superimposed preeclampsia. TH
Dr. Hayes is an obstetric internist at Women & Infants’ Hospital and assistant professor of medicine (clinical) at the Warren Alpert Medical School of Brown University, Providence, R.I.
References
- Sibai BM. Caring for women with hypertension in pregnancy. JAMA. 2007;298(13):1566-1568.
- Report of the National High Blood Pressure Education Program Working Group on High Blood Pressure in Pregnancy. Am J Obstet Gynecol. 2000;183:S1-S22.
- Christianson RE. Studies on blood pressure during pregnancy. I. Influence of parity and age. Am J Obstet Gynecol. 1976;125(4):509-513.
- Gibson P, Rosene-Montella K. Normal renal and vascular changes in pregnancy. In: Rosene-Montella K, Keely E, Barbour LA, Lee RV, eds. Medical Care of the Pregnant Patient. 2nd ed. Philadelphia: American College of Physicians; 2008:149-152.
- ACOG practice bulletin, No. 33, January 2002. Diagnosis and management of preeclampsia and eclampsia. Obstet Gynecol. 2002;99(1):159-167.
- Sibai BM. Chronic hypertension in pregnancy. Obstet Gynecol. 2002;100(2):369-377.
- Mulrow CD, Chiquette E, Ferrer RL, et al. Management of Chronic Hypertension During Pregnancy. Rockville: Agency for Healthcare Research and Quality; 2000.
- Pickering TG, Hall JE, Appel LJ, et al. Recommendations for blood pressure measurement in humans and experimental animals: part 1: blood pressure measurement in humans: a statement for professionals from the Subcommittee of Prof-essional and Public Education of the American Heart Association Council on high blood pressure Research. Circulation. 2005;111(5):697-716.
- Powrie RO. A 30-year-old woman with chronic hypertension trying to conceive. JAMA. 2007; 298(13):1548-1558.
- Chobanian AV, Bakris GL, Black HR, et al. The Seventh Report of the Joint National Committee on Prevention, Detection, Evaluation, and Treatment of High Blood Pressure: the JNC 7 report. JAMA. 2003:289(19):2560-2571.
- Widmer M, Villar J, Benigni A, Conde-Agudelo A, Karumanchi SA, Lindheimer M. Mapping the theories of preeclampsia and the role of angiogenic factors: a systematic review. Obstet Gynecol. 2007; 109(1):168-180.
- Magee LA, Helewa M, Moutquin JM, van Dadelszen P. Diagnosis, evaluation, and management of the hypertensive disorders of pregnancy. SOGC Clinical Practice Guideline. J Obstet Gynaecol Can. 2008; 30:S1-S48.
- Sibai BM, Barton JR. Expectant management of severe preeclampsia remote from term: patient selection, treatment, and delivery indications. Am J Obstet Gynecol. 2007;196(6):514.e1-514.e1-9.
- Duley L, Gülmezoglu AM, Henderson-Smart DJ. Magnesium sulphate and other anticonvulsants for women with preeclampsia. Cochrane Database Syst Rev. 2003;(2):CD000025.
- McDonald SD, Malinowski A, Zhou Q, Yusuf S, Devereaux PJ. Cardiovascular sequelae of preeclampsia/eclampsia: a systematic review and meta-analyses. Am Heart J. 2008;156(5):918-930.
- Martin JN Jr., Thigpen BD, Moore RC, Rose CH, Cushman J, May W. Stroke and severe preeclampsia and eclampsia: a paradigm shift focusing on systolic blood pressure. Obstet Gynecol. 2005;105(2): 246-254.
- Lindheimer MD, Taler SJ, Cunningham FG. Hyper-tension in pregnancy. J Am Soc Hypertens. 2008; 2(6):484-494.
- Podymow T, August P. Update on the use of antihypertensive drugs in pregnancy. Hypertension. 2008; 51(4):960-969.
- Kitzmiller JL, Block JM, Brown FM, et al. Managing preexisting diabetes for pregnancy: summary of evidence and consensus recommendations for care. Diabetes Care. 2008;31(5):1060-1079.
- Magee LA, von Dadelszen P, Chan S, et al. The Control of Hypertension In Pregnancy Study pilot trial. BJOG. 2007;114(6):770,e13-e20.
- Cooper WO, Hernandez-Diaz S, Arbogast PG, et al. Major congenital malformations after first-trimester exposure to ACE inhibitors. N Engl J Med. 2006; 354(23):2442-2451.
- American Academy of Pediatrics Committee on Drugs. Transfer of drugs and other chemicals into human milk. Pediatrics. 2001;108(3):776-789.
- Papanna R, Mann LK, Kouides RW, Glantz JC. Protein/creatinine ratio in preeclampsia: a systematic review. Obstet Gynecol. 2008;112(1):135-144.
- Askie LM, Duley L, Henderson-Smart DJ, Stewart LA, PARIS Collaborative group. Antiplatelet agents for prevention of pre-eclampsia: a meta-analysis of individual patient data. Lancet. 2007;369(9575): 1791-1798.
Investigate Claim Denials
In order to recover the appropriate payment for services provided by hospitalists, the following must occur:
- The billing provider renders service fully, or jointly with a resident under the teaching physician guidelines or nonphysician provider under the shared/split billing rules;
- The service is completely and accurately documented in the medical record;
- The correct information is entered on the claim form that is submitted to the payor; and
- The service is determined to be a covered benefit and eligible for payment.
Claims frequently are rejected or denied. Even more frequently, the physician or billing staff does not understand the reason for the denial. The typical reaction to claim denial is twofold: “appeal with paper” and “write off.” In other words, send a copy of the physician notes to the payor and consider the claim unsuccessful and payment unable to be obtained.
Examining and understanding the payor’s initial claim determination might prompt a more successful response. Presuming the patient demographics are entered without error, the insurance information is correct, the patient is eligible for coverage, and all precertifications and authorizations were obtained, check for these other common errors.
Medical Necessity
Denials for “medical necessity” are not always what they seem. Individuals often assume that the physician reported an incorrect diagnosis code. Consider the service/procedure code when trying to formulate a response to the denial. When dealing with procedure codes, it is likely the denial is received for a mismatched diagnosis.
For example, a payor might deny a claim for cardiopulmonary resuscitation (92950) that is associated with a diagnosis code of congestive heart failure (428.0), despite this being the underlying condition that prompted the decline in the patient’s condition. The payor might only accept “cardiac arrest” (427.5) as the diagnosis for cardiopulmonary resuscitation because it was the direct reason for the procedure. After you ensure that the documentation supports the diagnosis, the claim should be resubmitted with the corrected diagnosis code.
If the “medical necessity” denial involves a covered evaluation and management (E/M) visit, it is less likely that the diagnosis code is the issue. When dealing with Medicare in particular, this type of denial likely is the result of a failure to respond to a prepayment request for documentation. Medicare issues prepayment requests for documentation for the following inpatient CPT codes: 99255, 99254, 99233, 99232, 99223, 99239, and 99292. If the documentation isn’t provided to the Medicare review department within the designated time frame, the claim is automatically denied. The reason for denial is cited as “not deemed a medical necessity.” Some providers misunderstand this remittance remark and assume that the physician assigned an incorrect diagnosis code. Although that might be true, it probably is due to a failure to respond to the prepayment documentation request. Appealing these claims requires the submission of documentation to the Medicare appeals department. Once the supporting documentation is reviewed, reimbursement is granted.
Bundling
The National Correct Coding Initiative (NCCI) identifies edits that ultimately affect claims submission and payment. The Column One/Column Two Correct Coding Edits and the Mutually Exclusive Edits list code pairs that should not be reported together on the same date by either a single physician or physicians of the same specialty within a provider group. Under some well-documented circumstances, the physician is allowed to “unbundle” the services by appending the appropriate modifier.
When services are denied as being “incidental/integral” to another reimbursed service (e.g., bundled), the claim should not automatically be resubmitted with a modifier appended to the “bundled” procedure code.
Documentation should be reviewed to determine if the denied service is separately reportable from the paid service. Only when supported by documentation can the physician append the appropriate modifier and resubmit the claim. For example, a hospitalist evaluated a patient with congestive heart failure and pleural effusions. The hospitalist determined that the patient requires placement of a central venous catheter (36556). Because the patient’s underlying condition was evaluated and resulted in the decision to place a central venous catheter, both the visit (99233) and the procedure (36556) can be reported. If submitted without modifiers, some payors may deny payment for the visit because it was not “integral” to the catheter placement. You should resubmit those claims with modifier 25.
Place of Service
Ensure that the place of service (POS) matches the service/procedure code. For example, say a hospitalist performs a consultation in the ED and determines that the patient does not need to be treated as an inpatient but provides recommendations for ED care and outpatient followup. Avoid a mismatch of the service code and the location. Consults performed in the ED should be reported with outpatient consultation codes (99241-99245) as appropriate. The correct POS should be the ED, not the inpatient hospital. Reporting outpatient codes with an inpatient POS (e.g., 21: inpatient hospital, 31: skilled nursing facility) will result in claim denial.
The same is true when trying to report inpatient consultation codes (99251-99255) in an outpatient location (e.g., 23-ED). The appropriate response for this type of denial is to resubmit the claim with the correct the POS and service/procedure code. A complete list of POS codes and corresponding definitions can be found in Chapter 26, Section 10.5 of the Medicare Claims Processing Manual, available at www.cms.hhs.gov/manuals/downloads/clm104c26.pdf.
Provider Enrollment
Provider enrollment issues occur when a physician’s national provider identifier (NPI) is not properly linked to the group practice. More often than not, the group practice receives claim rejections for enrollment issues when services involve nurse practitioners or physician assistants who have not enrolled with Medicare or cannot enroll with non-Medicare payors.
For example, a nurse practitioner independently provides a subsequent hospital-care service (e.g., 99232). The claim is submitted and Medicare reimburses the service at the correct amount as a primary insurer. The remaining balance is submitted to the secondary insurer. Because the submitted claim identifies the service provider as a nonphysician provider, who likely is not enrolled with the non-Medicare payor, the claim is rejected.
If the physician group has a contractual agreement to recognize nonphysician provider services by reporting them under the collaborating physician’s name, the claim can be resubmitted in the physician’s name. In absence of such an agreement, the claim should be written off. TH
Carol Pohlig is a billing and coding expert with the University of Pennsylvania Medical Center in Philadelphia. She is faculty of SHM’s inpatient coding course.
Reference
- Beebe M, Dalton J, Espronceda M, Evans D, Glenn R. Current Procedural Terminology Professional Edition. Chicago: American Medical Association Press; 2008.
Pharma Pledges Price Cut
The June 22 announcement of an $80 billion deal to help reduce out-of-pocket drug costs for Medicare beneficiaries has elicited mixed reactions on what it might mean for patients, and calls for hospitalists to remain vigilant about prescription drug expenses.
Under a pledge negotiated with the White House and congressional Democrats, the pharmaceutical industry has promised a 50% discount for name-brand drugs to beneficiaries stuck in the notorious gap of the Medicare Part D prescription drug plan, commonly called the “doughnut hole” (see “Beware the Doughnut Hole,” June 2009, p. 1) In 2009, the gap in coverage kicks in after $2,700 in total drug costs and persists until $6,154 in total costs, by which point patients have spent as much as $4,350 of their own money for prescription drugs.
President Obama says the gap “has been placing a crushing burden on many older Americans who live on fixed incomes and can’t afford thousands of dollars in out-of-pocket expenses.” The AARP hails the “unique solution” as a “major step forward,” though other industry observers have taken a more circumspect stance and say they want to see tougher cost-control measures in writing.
“You don’t want to look an $80 billion gift horse in the mouth, but there’s some halitosis in this mouth,” says Bill Vaughan, a health policy analyst for Consumers Union in Washington, D.C. “It’s not as pure and altruistic as it seems at first blush, and people need to keep pushing for generics because these [brand-name drugs] are grossly overpriced.”
Under the proposal, the cost for a 30-day supply of the beta-blocker drug carvedilol (Coreg) could be halved, from $142.79 to $71.40, based on Drugstore.com’s current retail prices. Even with the savings, the drug would still cost almost four and a half times more than a generic alternative, metoprolol tartrate (Lopressor), which costs $15.99 for a 30-day supply.
The deal also includes several caveats: The pledge doesn’t address the cost of brand-name drugs before or after the coverage gap, and the doughnut-hole price reduction would go into effect only if Congress enacts healthcare reform legislation.
Battles already are looming over the fight to make generics more accessible and to eliminate the doughnut hole entirely.
“I think the sense is that … everybody is going to have to give back a little bit,” says William D. Atchley Jr., MD, FACP, FHM, chief of the division of hospital medicine for Sentara Medical Group in Norfolk, Va., and a member of SHM’s Public Policy Committee. “This is a different landscape than the early 1990s. … Stakeholders are ready to be proactive and work with people.”
News accounts suggest that the pharmaceutical industry will offer an estimated $30 billion over 10 years toward narrowing the gap, while another $50 billion in concessions still must be worked out. Even so, consumer advocates like Vaughan say the need for hospitalists to help patients avoid unnecessary drug costs remains as high as ever.
Dr. Atchley, a former member of SHM’s board of directors, says hospitalists need to know what’s available in the hospital pharmacy and maintain an open line of communication with their patients in terms of their access and ability to pay for prescriptions.
“You need to understand patients’ economic status. You need to know if they get their medication from Walmart or the [Veterans Affairs] hospital pharmacy,” he says. “Cost is an issue to our Medicare patients, and it’s important to collaborate with them to make sure they can afford the drug. If they can’t, you need to work with them to find another affordable drug that will provide the same benefit.” TH
Bryn Nelson, PhD, is a freelance writer based in Seattle.
Disruptive Doctors
If you’ve been a hospitalist leader for a few years, you likely are familiar with the specter of the disruptive physician. Most group leaders dread dealing with a hospitalist who exhibits behavior that upsets the group or the hospital staff; fewer meet the task head-on and try to change that behavior; and fewer still enjoy the challenge.
If you fall into one of the first two categories, take comfort in knowing you aren’t alone. But if you know that problem hospitalists are a management challenge, you should seek counsel or training to address such issues when they arise.
—Aaron Gottesman, MD, FACP, Staten Island (N.Y.) University Hospital
Define “Disruptive”
Managers are responsible for maintaining equilibrium in their HM groups, so it’s important to understand what constitutes disruptive behavior. “What it really comes down to is behavior which can impair patient care, collegiality, and the overall work in the hospital,” says Aaron Gottesman, MD, FACP, director of hospitalist services at Staten Island University Hospital in New York. “If a specific physician or other staff member acts in a way that hampers staff satisfaction, patient satisfaction, and obviously care, then that is disruptive.”
Disruptive behavior in the hospital can come from any staff member, not just physicians. Disruptive physicians receive greater attention because their bad behavior is more likely to be noticed and reported. And they do tend to get angry. “Physicians are time-sensitive, and they’re perfectionists,” says Timothy J. Keogh, PhD, assistant professor at the Citadel School of Business Administration in Charleston, S.C., who has researched physicians’ personality traits. “When they’re put in a stressful situation—such as an ED or ICU, where the outcomes may be uncertain and they’re operating on insufficient sleep or under stress—you may see this behavior.”
Although HM is a stressful career path with challenges of its own, Dr. Gottesman says he rarely notices the same level of disruptive behavior as can be found in the ED, OR, or ICU. “I don’t think it occurs among hospitalists any more than among the general physician population,” he says. “Hospitalists are not under the same time constraints; they don’t have as much stress or pressure—or at least they have a different kind.”
So who is responsible for dealing with a physician who behaves badly? In all cases, it should be the individual’s immediate supervisor.
Policy Preparation
The crucial component in dealing with a disruptive employee is to have an official behavior policy that is shared with everyone in your organization. The Joint Commission recently required hospitals to employ a code of conduct that outlines acceptable and unacceptable behavior, and it sets a process for addressing problematic behavior.
“You can bet physicians and nurses know it, including the disruptive individuals,” Dr. Keogh says. “This will make it much easier for executives to enforce.”
Dr. Gottesman relies on his organization’s policy. “It’s absolutely critical to have a sense of direction, to know what’s appropriate and what’s inappropriate, to have a procedure to follow,” he says. “Having policies and protocol in place is also critical for legal protection if the situation escalates. It protects the physician, the staff, the patients, and the institution.”
Dr. Keogh, a faculty member of SHM’s Leadership Academy, recommends that all physician employees learn their code of conduct policy. “To prevent downstream behaviors, when you get a new hire, don’t just give them this statement—read that section to them out loud,” he advises. “This ensures that they notice it, and gives hospitalist executives a much stronger position when something happens.”
Face-to-Face Meeting
There are two proven methods to successfully deal with disruptive behavior: 1) React to it immediately, and 2) follow up to ensure it doesn’t happen again. When you receive a complaint about a disruptive hospitalist, gather all the information you can on the incident and schedule a meeting to discuss it with the party accused of poor behavior.
“The first occurrence should result in an informal conversation. ‘You stepped over the line here, and we have to make sure it doesn’t happen again,’ ” Dr. Keogh says. He recommends that a human resources staffer be present at this meeting, and supervisors should come prepared with documentation.
“You have to sit them down and go over a written document—don’t just talk about word-of-mouth. Go over the documented occurrence of the behavior,” Dr. Keogh explains. “Talk through what they did, and let them know that you both have to find a way to ensure that it doesn’t happen again. They’ll rationalize their behavior at first, but make sure they understand that it’s unacceptable.”
In the case of an allegation or a one-on-one dispute, Dr. Gottesman advises you “clarify both sides before taking any action. I hear both sides of the story, then we find some common ground and work toward a solution.” In his experience, he says, “by and large, most physicians tend to be responsive when spoken to in a constructive, positive fashion. Let them know that you’re here to support them, not prosecute them. You need to maintain a professional demeanor.”
Dr. Keogh says oftentimes the first disciplinary meeting will be enough to end the disruptive behavior. If the same individual has another incident, schedule a second meeting and emphasize the seriousness of the infraction and disciplinary measures. You might want to have a senior manager, such as your chief medical officer, join the discussion. Officially document the problem and identify the consequences if the employee is disruptive again.
Followup Is Key
Another key to quashing disruptive behavior is doing your part to ensure it doesn’t happen again. “The problem is that the impact is residual on the people around that individual, whether it’s the nurses or patients,” Dr. Keogh says. “The results are avoidance and silence.”
Supervisors should follow up on the disruptive behavior by placing themselves in the problem employee’s way; doing so will let you see how they work and how others react to them, and it will show that you’re keeping an eye on them. “The [manager] has to show ongoing oversight of that individual, with occasional walks in the [hospital halls] and ongoing verbal encouragement, to show that someone is paying attention,” Dr. Keogh says. “They can fall back into bad behaviors if they think no one is watching.” Positive recognition of good behavior and outcomes (i.e., improved patient satisfaction) also helps reinforce your followup.
Depending on the individual and the situation, dealing with a disruptive behavior can be a long-term, never-ending job. But it’s a necessary one.
“There has to be zero tolerance,” Dr. Gottesman says. “People should be comfortable and confident with reporting this behavior. It should not be accepted as a normal part of work to put up with it. And they should know that the situation will be looked at objectively, and both sides will be heard.” TH
Jane Jerrard is a freelance writer based in Chicago.
Market Watch
Product Withdrawal
- Efalizumab (Raptiva), the once-weekly monoclonal antibody used to treat moderate to severe plaque psoriasis, has been withdrawn from the U.S. market due to its association with an increased risk of developing progressive multifocal leukoencephalopathy (PML).1 Four cases of PML have been confirmed, and the manufacturer has decided the risks outweigh the benefits.2
New Generics
- Carbamazepine extended-release (generic Tegretol-XR) tablets (100 mg, 200 mg and 400 mg)3
- Mycophenolate mofetil (generic Cellcept)4
New Drugs, Indications & Dosage Forms
- You might have noticed some difficulty getting pancrelipase products for your patients with exocrine pancreatic insufficiency (EPI), pancreatitis, or cystic fibrosis. Here’s why: Pancreatic enzyme replacement therapies (PERT), pancreatic enzyme products (PEP), pancrelipase products, or EPI products were available prior to the formation of the U.S. Food and Drug Administration (FDA) and the Federal Food, Drug and Cosmetic Act (FDCA) of 1938.
Until recently, none of these drug products had been marketed under approved new drug applications (NDAs). Since none of the products were subject to the NDA process, they were never subjected to safety, efficacy, bioavailability, or dose-ranging studies.5 The FDA has since decided that these agents must undergo the NDA process and, if approved, will only be available with a prescription.6
Part of the guidance states that all approved formulations will contain “zero overfill.” In other words, the products will not have a range of lipase (90% to 165%), as they had before. Overfill leads to side effects, including diarrhea, flatulence, hyperuricosuria, hyperuricosemia, and fibrosing colonopathy.
The new deadline to submit an NDA is April 29, 2010. The FDA has approved its first PEP agent, Creon pancrelipase, under the new guidance. It is expected to be available later this year.7
- Amlodipine, hydrochlorothiazide (HCTZ), and valsartan (Exforge HCT) is the first—and currently only—triple-combination antihypertensive agent to receive FDA approval.8 It can be used in patients already on these three medications, or it can be used as add-on therapy in patients not adequately controlled on two agents. The manufacturer plans to price the agent the same as amlodipine/valsartan (Exforge). Dose options are amlodipine 5 mg/valsartan 160 mg/HCTZ 12.5 mg, up to a maximum of two tablets daily.9
- Bromocriptine (Cycloset) is reformulated in a lower dose that is fast-acting and should be taken in the morning to boost dopamine levels and improve glycemic control in Type 2 diabetes patients.10 The drug is approved for monotherapy, as an adjunct to sulfonylurea therapy, or metformin plus a sulfonylurea. It’s the first diabetes agent to be FDA-approved since the guidance on cardiovascular risks. The most common side effects in clinical trials were nausea and dizziness. It should be used cautiously in patients taking antihypertensive treatment. Women who are nursing should not use it. The launch date is unknown.11
- Golimumab (Simponi), a once-a-month tumor necrosis factor-alpha inhibitor injection, has been FDA-approved for treating moderate to severe rheumatoid arthritis, active psoriatic arthritis, and active ankylosing spondylitis.12 It carries the same warnings as other agents in the same class, including the risk of developing tuberculosis and invasive fungal infections. A risk evaluation mitigation strategy (REMS) and medication guide are required for this agent.
- Iloperidone (Fanapt), an atypical antipsychotic, has been FDA-approved to treat adults with schizophrenia. The most common side effects in clinical trials were dizziness, dry mouth, fatigue, nasal congestion, and orthostatic hypotension. Similar to other atypical antipsychotics, iloperidone carries a boxed warning regarding increased risk of death associated with treating behavioral problems in older patients with dementia-related psychosis, as it is not FDA-approved for this use.13
New Warnings
- Topical testosterone products (e.g., Androgel and Testim) have received a boxed warning.14 This warning is due to multiple reports of adverse effects in children exposed to the drug via contact with a topical testosterone-treated person. There are current product label precautions; however, the FDA has received reports of secondary exposure to testosterone in children 5 years old or younger. Adverse events included inappropriate genitalia enlargement, premature pubic hair development, bone age advancement, increased libido, and aggressive behavior. The FDA has provided recommendations to minimize secondary exposure. TH
Michele B. Kaufman, PharmD, BSc, RPh, is a freelance medical writer based in New York City.
References
- FDA statement on the voluntary withdrawal of Raptiva from the U.S. market. Food and Drug Administration Web site. Available at: www.fda.gov/NewsEvents/Newsroom/PressAnnouncements/ucm149561.htm Accessed July 2, 2009.
- Withdrawal of Raptiva from U.S. market. The Medical News Web site. Available at: www.news-medical.net/news/48133.aspx. Accessed May 12, 2009.
- Taro receives final FDA approval for carbamazepine extended-release tablets. Medicine News Today Web site. Available at: www.medicalnewstoday.com/articles/145217.php. Accessed May 12, 2009.
- FDA OKs Mylan generic version of transplant drug. Forbes Web site. Available at: www.forbes.com/feeds/ap/2009/05/07/ap6392275.html. Accessed May 8, 2009.
- Exocrine Pancreatic Insufficiency Drug Products. Federal Register Web site. Available at: www.fda.gov/ohrms/dockets/98fr/04-9652.htm. Accessed May 7, 2009.
- Guidance for industry exocrine pancreatic insufficiency drug products—submitting NDAs. FDA Web site. Available at: www.fda.gov/ohrms/dockets/98fr/2003d-0206-gdl0001.pdf. Accessed May 7, 2009.
- Phend C. FDA formally approves Creon pancrelipase. Medpage Today Web site. Available at: www.medpagetoday.com/ProductAlert/Prescriptions/14021. Accessed May 7, 2009.
- FDA approves Exforge HCT—the only high blood pressure treatment to combine three medications in a single pill. Novartis Web site. Available at: www.novartis.com/newsroom/media-releases/en/2009/1310474.shtml. Accessed May 7, 2009.
- Phend C. FDA approves triple-drug antihypertensive polypill. Medpage Today Web site. Available at: www.medpagetoday.com/ProductAlert/Prescriptions/14032. Accessed May 7, 2009.
- Neergaard L. FDA backs drug that treats diabetes via the brain. Physorg.com Web site. Available at: www.physorg.com/news160843146.html. Last Accessed May 8, 2009.
- FDA approves Cycloset. Drugs.com Web site. Available at: www.drugs.com/newdrugs/veroscience-announces-fda-approval-cycloset-type-2-diabetes-1344.html. Accessed May 8, 2009.
- FDA approves monthly injectable drug for treating three types of immune-related arthritis. FDA Web site. Available at: www.fda.gov/NewsEvents/Newsroom/PressAnnouncements/ucm149569.htm. Accessed April 24, 2009.
- FDA approves Fanapt to treat schizophrenia. FDA Web site. Available at: www.fda.gov/NewsEvents/Newsroom/PressAnnouncements/ucm149578.htm. Accessed May 7, 2009.
- Testosterone gel safety concerns prompt FDA to require label changes, medication guide. FDA Web site. Available at: www.fda.gov/NewsEvents/Newsroom/PressAnnouncements/ucm149580.htm. Accessed May 12, 2009.
In the Literature
In This Edition
Literature at a Glance
A guide to this month’s studies
- PE and COPD exacerbations.
- Care bundles and readmission rates.
- Family history and VTE risk.
- Vasopressor choice and mortality in sepsis.
- Vitamin K use in overanticoagulation.
- Appropriate treatment of asymptomatic bacteriuria.
- Guideline adherence in thrombocytopenia.
Pulmonary Embolism Frequently Complicates COPD Exacerbations
Clinical question: What percentage of patients with acute chronic obstructive pulmonary disease (COPD) exacerbations has pulmonary emboli?
Background: As many as 30% of COPD exacerbations have no apparent precipitating event. Even in patients with evidence of a precipitating event, such as an upper-respiratory illness or increased environmental irritants, pulmonary emboli (PE) may coexist and warrant evaluation.
Study design: Literature review.
Setting: Multiple studies in Europe and the U.S.
Synopsis: This literature review included five studies to estimate the rate of PE in patients with a COPD exacerbation. Overall incidence of PE in COPD exacerbations was 19.9%, but of those patients requiring hospitalization, the incidence was as high as 25.5%. Incidence estimates varied based on interpretation of data that were missing or inconsistent between studies. Patients most commonly present with dyspnea, chest pain, hemoptysis, cough, and palpitations. Six percent of PE patients presented with syncope; no patients with an exacerbation without a PE presented with syncope.
Risk of mortality from PE is almost twice as high in patients with a COPD exacerbation compared with PE in other settings. A significant number of patients have PE without history or evidence of DVT, so in situ thrombosis is a significant factor. The interpretation of these results is limited by the heterogeneity of the study designs, and by the relatively low number of cases. Larger trials are necessary.
Bottom line: Pulmonary emboli are present in as many as 25% of all COPD exacerbations. Delay in diagnosis of PE in COPD patients affects morbidity and mortality. PE should be a consideration in many COPD exacerbations.
Citation: Rizkallah J, Man SF, Din DD. Prevalence of pulmonary embolism in acute exacerbations of COPD: a systematic review and metaanalysis. Chest. 2009;135(3):786-793.
Targeted-Care Bundle Can Reduce ED Visits and Readmission Rates in High-Risk Elderly Patients
Clinical question: Can a care coordination bundle reduce length of stay (LOS), ED visits, or readmissions within 30 days of a hospital admission?
Background: Hospital-based care coordination interventions have shown mixed results in affecting LOS, post-discharge ED visits, and readmission rates. Although there has been some success with particular interventions, no consistent benefit has been demonstrated. Most notably, a recent meta-analysis of several different interventions showed no improvement in mortality, LOS, or readmission rates.
Study design: A randomized, controlled trial of select high-risk elderly patients.
Setting: A large teaching hospital at Baylor University Medical Center.
Synopsis: A “targeted-care bundle” was implemented with high-risk elderly patients to try to reduce LOS, readmissions, and ED visits. High-risk patients were identified by age, diagnosis-related group (DRG), number of medications at admission, comorbid conditions, and need for assistance in activities of daily living. Subjects were randomized to usual care or to receive a targeted-care bundle. The targeted-care bundle included multiple interventions. A study care coordinator provided daily patient education, including condition-specific teaching, discharge teaching and planning, and a follow-up phone call at five to seven days after discharge. A clinical pharmacist intervened for medication reconciliation at admission and discharge, medication teaching, and a follow-up phone call at five to seven days after discharge. Structured documents, including a personal health record and supplemental discharge form, were implemented.
The study had low enrollment, largely due to the requirement to obtain informed consent from all participants. Therefore, the study was underpowered to detect such target endpoints as LOS. A significant decrease in 30-day readmission rates/ED visits was noticed, but there was no persistent effect at 60 days.
The intervention was designed to use existing hospital staff in order to be practical for broad utilization. Future studies need to focus on increased enrollment to demonstrate beneficial effect.
Bottom line: Targeted health interventions focusing on education and coordination of care might effect some significant outcomes, most notably readmissions or ED visits within 30 days, but the nature of the clinical problem makes rigorous testing of interventions a challenge.
Citation: Kohler BE, Richter KM, Youngblood L, et al. Reduction of 30-day postdischarge hospital readmission or emergency department (ED) visit rates in high-risk elderly medical patients through delivery of a targeted care bundle. J Hosp Med. 2009;4(4):211-218.
Family History Is a Risk Factor for Venous Thrombosis
Clinical question: Is family history of additional value in predicting an individual’s risk of venous thrombosis once a genetic risk factor is identified?
Background: A positive family history of venous thrombosis might suggest the presence of genetic risk factors in a given family. However, it is not known whether family history is of additional significance—once a risk factor is identified—in predicting an individual’s risk for venous thrombosis.
Study design: Population-based, case-control study.
Setting: Participants in the Multiple Environmental and Genetic Assessment (MEGA) of risk factors for venous thrombosis study.
Synopsis: Recruitment, data collection, and blood samples were obtained from individuals in the MEGA study. Participants completed a questionnaire about risk factors for venous thrombosis and family history. A positive family history more than doubled the risk of venous thrombosis, and when more than one family member was affected, the risk increased fourfold. The risk for venous thrombosis increased 64 times for individuals who had a family history, genetic risk factor, and environmental risk factor when compared with those with a negative family history and no known risk factors.
The underreporting or overestimation of the prevalence of a positive family history might limit this study.
Bottom line: Family history is a risk indictor for a first venous thrombosis, despite the presence of other risk factors.
Citation: Bezemer ID, van der Meer FJ, Eikenboom JC, Rosendaal FR, Doggen CJ. The value of family history as a risk indicator for venous thrombosis. Arch Intern Med. 2009;169(6):610-615.
Vasopressor Choice Predicts Mortality in Septic Shock
Clinical question: Does vasopressor choice affect mortality in patients with community-acquired septic shock?
Background: Community-acquired septic shock is a common illness and, despite aggressive care, a leading cause of death. Randomized clinical control trials evaluating the efficacy and safety of different adrenergic supportive agents are lacking. Thus, both norepinephrine and dopamine are recommended as first-line agents in the treatment of septic shock by the Surviving Sepsis Campaign guidelines.
Study design: Multicenter, cohort observational study.
Setting: Seventeen intensive-care units in Portugal.
Synopsis: In adjusted analysis controlling for Simplified Acute Physiology Score (SAPS) II, use of norepinephrine in community-acquired septic shock was associated with higher hospital mortality and lower 28-day survival when compared with dopamine. Specifically, patients treated with norepinephrine had a statistically significant higher hospital mortality rate than those treated with dopamine (52% and 38.5%, respectively, P=0.002) and a lower 28-day survival (log rank=22.6; P<0.001). While this data is valuable, the nonrandomized, observational study design limits firm conclusions regarding vasopressor choice. Further results from three large trials comparing vasopressor use in septic shock should continue to shed light on this debate.
Bottom line: Norepinephrine administration is associated with higher hospital mortality and lower 28-day survival when compared with dopamine in patients with community-acquired septic shock.
Citation: Póvoa PR, Carneiro AH, Ribeiro OS, Pereira AC, Portuguese Community-Acquired Sepsis Study Group. Influence of vasopressor agent in septic shock mortality. Results from the Portuguese Community-Acquired Sepsis Study (SACiUCI study). Crit Care Med. 2009;37(2):410-416.
Oral Vitamin K Versus Placebo to Correct Excess Anticoagulation in Warfarin Patients
Clinical question: In nonbleeding patients with warfarin-associated coagulopathy, does oral vitamin K reduce bleeding events when compared to placebo?
Background: Warfarin is a common drug for primary and secondary prevention of thromboembolism, but it requires continued monitoring of the international normalized ratio (INR) value. INR values >4.0 are associated with an increase in bleeding complications, with specific concern for intracranial bleeding when INR values exceed 4.5. Small, randomized trials have shown that single, low-dose administration of oral vitamin K effectively reduces the INR in nonbleeding, overanticoagulated patients.
However, these studies have not shown if vitamin K reduces risk for bleeding without increasing the risk for thromboembolism.
Study design: Randomized, placebo-controlled trial.
Setting: Fourteen anticoagulation clinics in Canada, Italy, and the U.S.
Synopsis: Nonbleeding patients with supratherapeutic INR values between 4.5 and 10.0 were randomly assigned to receive 1.25 mg of oral vitamin K or placebo, then evaluated for all forms of bleeding for 90 days. Bleeding events were defined as “major bleeding,” “minor bleeding,” and “trivial bleeding.”
Though patients who received oral vitamin K had a significantly more rapid INR decrease, there were no differences between the two groups with regard to all bleeding events, thromboembolism, or death. The study was underpowered to detect differences in major bleeding.
Bottom line: Low-dose oral vitamin K leads to more rapid correction of the INR in overanticoagulated patients on warfarin therapy, but has little effect on clinical outcomes at 90 days.
Citation: Crowther MA, Ageno W, Garcia D, et al. Oral vitamin K versus placebo to correct excessive anticoagulation in patients receiving warfarin: a randomized trial. Ann Intern Med. 2009;150(5):293-300.
Inappropriate Treatment of Catheter-Associated Asymptomatic Bacteriuria
Clinical question: Are hospitalized patients with urinary catheters inappropriately treated with antibiotics for asymptomatic bacteriuria?
Background: Persons with catheters acquire bacteriuria at the rate of 3% to 10% per day, but in the majority of cases, no symptoms or secondary complications occur. Evidenced-based guidelines state that asymptomatic bacteriuria is not a clinically significant infection, and numerous studies have shown that treatment is unlikely to confer clinical benefit.
Study design: Retrospective cohort study.
Setting: A single-site Veterans Affairs hospital.
Synopsis: Using urine culture results over a three-month period from a single VA medical center, 280 cases were analyzed: 164 catheter-associated asymptomatic bacteriuria and 116 catheter-associated urinary tract infections (UTIs). A UTI was defined as having one or more of these symptoms: fever, urgency, frequency, dysuria, suprapubic tenderness, altered mental status, or hypotension in a patient without another recognized infection and a positive urine culture. Of the asymptomatic bacteriuria cases, 68% were managed appropriately with no antibiotic treatment; 32% were inappropriately treated with antibiotics.
In multivariate analysis, older patient age, predominance of gram-negative bacteria, and higher urine white blood cell count were significantly associated with inappropriate treatment.
This study highlights the fact that antibiotics continue to be used inappropriately in patients with catheters. Current guidelines do not distinguish well between asymptomatic bacteriuria and UTI, so there might be a knowledge gap. This study was based on urine culture data, not urinalysis of all patients with a catheter, so the symptomatic patients were likely over-represented.
An associated editorial observes that the study extrapolates data from studies that involved patients with uncomplicated UTIs and, therefore, might reach erroneous conclusions. Further, viewing catheter-associated symptomatic UTIs and catheter-associated asymptomatic bactiuria as dichotomous and warranting inherently different management fails to encompass a number of clinical factors, including co-infection, and further fails to acknowledge that removal of the catheter is the first step in treatment. However, the finding that antibiotics continue to be used inappropriately is useful.
Bottom line: A clinical determination of whether a patient with a catheter really has a symptomatic UTI/urosepsis or only has asymptomatic bacteriuria should precede starting antibiotics in hospitalized patients.
Citations: Cope M, Cevallos ME, Cadle RM, Darouiche RO, Musher DM, Trautner BW. Inappropriate treatment of catheter-associated asymptomatic bateriuria in a tertiary care hospital. Clin Infect Dis. 2009;48(9):1182-1188.
Kunin CM. Catheter-associated urinary tract infections: a syllogism compounded by a questionable dichotomy. Clin Infect Dis. 2009;48:1189-1190.
Current Practices in the Evaluation and Management of Thrombocytopenia in Heparin Patients
Clinical question: Are the current American College of Chest Physicians (ACCP) guidelines for the recognition, treatment, and prevention of heparin-induced thrombocytopenia (HIT) being followed?
Background: Heparin-based anticoagulation is frequently given to hospitalized patients, and approximately 1% to 5% of these patients develop HIT. In 2004, the ACCP published a consensus statement on the evaluation, management, and prevention of HIT.
Study design: Prospective, observational study.
Setting: Forty-eight U.S. hospitals in the Complications After Thrombocytopenia Caused by Heparin (CATCH) registry.
Synopsis: The CATCH trial enrolled patients receiving any form of heparin for >96 hours (n=2,420), cardiac-care-unit patients treated with heparin (n=1,090), and patients who had an HIT antibody assay performed (n=449), for a total of 3,536 total patients. The study included patients on unfractionated heparin (UFH) or low-molecular-weight heparin (LMWH). Thrombocytopenia was defined at a platelet count <150,000, or a decrease of 50% when compared with admission.
In the prolonged heparin group, 36.4% of patients developed thrombocytopenia; however, HIT was suspected in only 19.8% of these high-risk patients. While physicians were more likely to consider HIT in the cardiac-care patients (37.6%), the diagnosis was considered>24 hours after the thrombocytopenia developed. Physicians often waited until after a thromboembolic complication occurred before evaluating for HIT. More often than not, preventive measures were missed (e.g., failing to check for HIT antibodies, continuing heparin after HIT was suspected).
Bottom line: Thrombocytopenia is a common occurrence in patients receiving heparin and, despite the risk of devastating complications from HIT, treatment infrequently conforms to the established guidelines.
Citation: Crespo EM, Oliveira GBF, Honeycutt EF, et al. Evaluation and management of thrombocytopenia and suspected heparin-induced thrombocytopenia in hospitalized patients: The Complications After Thrombocytopenia Caused by Heparin (CATCH) registry. Am Heart J. 2009;157(4):651-657. TH
PEDIATRIC HM LITerature
Epinephrine and Dexamethasone Alone Do Not Reduce Hospital Admissions in Infants with Bronchiolitis
By Mark Shen, MD

Clinical question: Does nebulized epinephrine, oral dexamethasone, or a combination of the two result in a decrease in hospital admissions when given in the ED to infants with bronchiolitis?
Background: Bronchiolitis is the most common lower-respiratory-tract infection of infancy. Rates of admission have climbed in the past two decades. Bronchodilators and corticosteroids are not routinely recommended, and the evidence surrounding epinephrine and dexamethasone has shown varying results.
Study design: Randomized, double-blind, placebo-controlled trial.
Setting: Eight Canadian pediatric EDs.
Synopsis: Eight hundred infants ages six weeks to 12 months with a first episode of bronchiolitis were randomized to nebulized epinephrine and oral dexamethasone, epinephrine and oral placebo, dexamethasone and nebulized placebo, or oral and nebulized placebo. Epinephrine was delivered as two nebulizations 30 minutes apart, and dexamethasone was given as a 1 mg/kg oral dose, followed by five once-daily doses of 0.6 mg/kg. In unadjusted analysis, only the infants who received epinephrine and dexamethasone were less likely to be admitted to the hospital by day seven.
Limitations of this study include a small effect size and a non-statistically-significant difference between the epinephrine/dexamethasone group and placebo after statistical adjustment for multiple comparisons. Given that admission rates did not decrease in the epinephrine/placebo group and the dexamethasone/placebo group, this study supports national guidelines that do not recommend the routine use of these agents in bronchiolitis. The authors suggest that synergy between epinephrine and dexamethasone in bronchiolitis be further studied.
Bottom line: When given alone, epinephrine and dexamethasone do not reduce hospital admissions in infants with bronchiolitis.
Citation: Plint AC, Johnson DW, Patel H, et al. Epinephrine and dexamethasone in children with bronchiolitis. N Engl J Med. 2009;360(20):2079-2089.
Reviewed by Pediatric Editor Mark Shen, MD, medical director of hospital medicine at Dell Children’s Medical Center, Austin, Texas.
In This Edition
Literature at a Glance
A guide to this month’s studies
- PE and COPD exacerbations.
- Care bundles and readmission rates.
- Family history and VTE risk.
- Vasopressor choice and mortality in sepsis.
- Vitamin K use in overanticoagulation.
- Appropriate treatment of asymptomatic bacteriuria.
- Guideline adherence in thrombocytopenia.
Pulmonary Embolism Frequently Complicates COPD Exacerbations
Clinical question: What percentage of patients with acute chronic obstructive pulmonary disease (COPD) exacerbations has pulmonary emboli?
Background: As many as 30% of COPD exacerbations have no apparent precipitating event. Even in patients with evidence of a precipitating event, such as an upper-respiratory illness or increased environmental irritants, pulmonary emboli (PE) may coexist and warrant evaluation.
Study design: Literature review.
Setting: Multiple studies in Europe and the U.S.
Synopsis: This literature review included five studies to estimate the rate of PE in patients with a COPD exacerbation. Overall incidence of PE in COPD exacerbations was 19.9%, but of those patients requiring hospitalization, the incidence was as high as 25.5%. Incidence estimates varied based on interpretation of data that were missing or inconsistent between studies. Patients most commonly present with dyspnea, chest pain, hemoptysis, cough, and palpitations. Six percent of PE patients presented with syncope; no patients with an exacerbation without a PE presented with syncope.
Risk of mortality from PE is almost twice as high in patients with a COPD exacerbation compared with PE in other settings. A significant number of patients have PE without history or evidence of DVT, so in situ thrombosis is a significant factor. The interpretation of these results is limited by the heterogeneity of the study designs, and by the relatively low number of cases. Larger trials are necessary.
Bottom line: Pulmonary emboli are present in as many as 25% of all COPD exacerbations. Delay in diagnosis of PE in COPD patients affects morbidity and mortality. PE should be a consideration in many COPD exacerbations.
Citation: Rizkallah J, Man SF, Din DD. Prevalence of pulmonary embolism in acute exacerbations of COPD: a systematic review and metaanalysis. Chest. 2009;135(3):786-793.
Targeted-Care Bundle Can Reduce ED Visits and Readmission Rates in High-Risk Elderly Patients
Clinical question: Can a care coordination bundle reduce length of stay (LOS), ED visits, or readmissions within 30 days of a hospital admission?
Background: Hospital-based care coordination interventions have shown mixed results in affecting LOS, post-discharge ED visits, and readmission rates. Although there has been some success with particular interventions, no consistent benefit has been demonstrated. Most notably, a recent meta-analysis of several different interventions showed no improvement in mortality, LOS, or readmission rates.
Study design: A randomized, controlled trial of select high-risk elderly patients.
Setting: A large teaching hospital at Baylor University Medical Center.
Synopsis: A “targeted-care bundle” was implemented with high-risk elderly patients to try to reduce LOS, readmissions, and ED visits. High-risk patients were identified by age, diagnosis-related group (DRG), number of medications at admission, comorbid conditions, and need for assistance in activities of daily living. Subjects were randomized to usual care or to receive a targeted-care bundle. The targeted-care bundle included multiple interventions. A study care coordinator provided daily patient education, including condition-specific teaching, discharge teaching and planning, and a follow-up phone call at five to seven days after discharge. A clinical pharmacist intervened for medication reconciliation at admission and discharge, medication teaching, and a follow-up phone call at five to seven days after discharge. Structured documents, including a personal health record and supplemental discharge form, were implemented.
The study had low enrollment, largely due to the requirement to obtain informed consent from all participants. Therefore, the study was underpowered to detect such target endpoints as LOS. A significant decrease in 30-day readmission rates/ED visits was noticed, but there was no persistent effect at 60 days.
The intervention was designed to use existing hospital staff in order to be practical for broad utilization. Future studies need to focus on increased enrollment to demonstrate beneficial effect.
Bottom line: Targeted health interventions focusing on education and coordination of care might effect some significant outcomes, most notably readmissions or ED visits within 30 days, but the nature of the clinical problem makes rigorous testing of interventions a challenge.
Citation: Kohler BE, Richter KM, Youngblood L, et al. Reduction of 30-day postdischarge hospital readmission or emergency department (ED) visit rates in high-risk elderly medical patients through delivery of a targeted care bundle. J Hosp Med. 2009;4(4):211-218.
Family History Is a Risk Factor for Venous Thrombosis
Clinical question: Is family history of additional value in predicting an individual’s risk of venous thrombosis once a genetic risk factor is identified?
Background: A positive family history of venous thrombosis might suggest the presence of genetic risk factors in a given family. However, it is not known whether family history is of additional significance—once a risk factor is identified—in predicting an individual’s risk for venous thrombosis.
Study design: Population-based, case-control study.
Setting: Participants in the Multiple Environmental and Genetic Assessment (MEGA) of risk factors for venous thrombosis study.
Synopsis: Recruitment, data collection, and blood samples were obtained from individuals in the MEGA study. Participants completed a questionnaire about risk factors for venous thrombosis and family history. A positive family history more than doubled the risk of venous thrombosis, and when more than one family member was affected, the risk increased fourfold. The risk for venous thrombosis increased 64 times for individuals who had a family history, genetic risk factor, and environmental risk factor when compared with those with a negative family history and no known risk factors.
The underreporting or overestimation of the prevalence of a positive family history might limit this study.
Bottom line: Family history is a risk indictor for a first venous thrombosis, despite the presence of other risk factors.
Citation: Bezemer ID, van der Meer FJ, Eikenboom JC, Rosendaal FR, Doggen CJ. The value of family history as a risk indicator for venous thrombosis. Arch Intern Med. 2009;169(6):610-615.
Vasopressor Choice Predicts Mortality in Septic Shock
Clinical question: Does vasopressor choice affect mortality in patients with community-acquired septic shock?
Background: Community-acquired septic shock is a common illness and, despite aggressive care, a leading cause of death. Randomized clinical control trials evaluating the efficacy and safety of different adrenergic supportive agents are lacking. Thus, both norepinephrine and dopamine are recommended as first-line agents in the treatment of septic shock by the Surviving Sepsis Campaign guidelines.
Study design: Multicenter, cohort observational study.
Setting: Seventeen intensive-care units in Portugal.
Synopsis: In adjusted analysis controlling for Simplified Acute Physiology Score (SAPS) II, use of norepinephrine in community-acquired septic shock was associated with higher hospital mortality and lower 28-day survival when compared with dopamine. Specifically, patients treated with norepinephrine had a statistically significant higher hospital mortality rate than those treated with dopamine (52% and 38.5%, respectively, P=0.002) and a lower 28-day survival (log rank=22.6; P<0.001). While this data is valuable, the nonrandomized, observational study design limits firm conclusions regarding vasopressor choice. Further results from three large trials comparing vasopressor use in septic shock should continue to shed light on this debate.
Bottom line: Norepinephrine administration is associated with higher hospital mortality and lower 28-day survival when compared with dopamine in patients with community-acquired septic shock.
Citation: Póvoa PR, Carneiro AH, Ribeiro OS, Pereira AC, Portuguese Community-Acquired Sepsis Study Group. Influence of vasopressor agent in septic shock mortality. Results from the Portuguese Community-Acquired Sepsis Study (SACiUCI study). Crit Care Med. 2009;37(2):410-416.
Oral Vitamin K Versus Placebo to Correct Excess Anticoagulation in Warfarin Patients
Clinical question: In nonbleeding patients with warfarin-associated coagulopathy, does oral vitamin K reduce bleeding events when compared to placebo?
Background: Warfarin is a common drug for primary and secondary prevention of thromboembolism, but it requires continued monitoring of the international normalized ratio (INR) value. INR values >4.0 are associated with an increase in bleeding complications, with specific concern for intracranial bleeding when INR values exceed 4.5. Small, randomized trials have shown that single, low-dose administration of oral vitamin K effectively reduces the INR in nonbleeding, overanticoagulated patients.
However, these studies have not shown if vitamin K reduces risk for bleeding without increasing the risk for thromboembolism.
Study design: Randomized, placebo-controlled trial.
Setting: Fourteen anticoagulation clinics in Canada, Italy, and the U.S.
Synopsis: Nonbleeding patients with supratherapeutic INR values between 4.5 and 10.0 were randomly assigned to receive 1.25 mg of oral vitamin K or placebo, then evaluated for all forms of bleeding for 90 days. Bleeding events were defined as “major bleeding,” “minor bleeding,” and “trivial bleeding.”
Though patients who received oral vitamin K had a significantly more rapid INR decrease, there were no differences between the two groups with regard to all bleeding events, thromboembolism, or death. The study was underpowered to detect differences in major bleeding.
Bottom line: Low-dose oral vitamin K leads to more rapid correction of the INR in overanticoagulated patients on warfarin therapy, but has little effect on clinical outcomes at 90 days.
Citation: Crowther MA, Ageno W, Garcia D, et al. Oral vitamin K versus placebo to correct excessive anticoagulation in patients receiving warfarin: a randomized trial. Ann Intern Med. 2009;150(5):293-300.
Inappropriate Treatment of Catheter-Associated Asymptomatic Bacteriuria
Clinical question: Are hospitalized patients with urinary catheters inappropriately treated with antibiotics for asymptomatic bacteriuria?
Background: Persons with catheters acquire bacteriuria at the rate of 3% to 10% per day, but in the majority of cases, no symptoms or secondary complications occur. Evidenced-based guidelines state that asymptomatic bacteriuria is not a clinically significant infection, and numerous studies have shown that treatment is unlikely to confer clinical benefit.
Study design: Retrospective cohort study.
Setting: A single-site Veterans Affairs hospital.
Synopsis: Using urine culture results over a three-month period from a single VA medical center, 280 cases were analyzed: 164 catheter-associated asymptomatic bacteriuria and 116 catheter-associated urinary tract infections (UTIs). A UTI was defined as having one or more of these symptoms: fever, urgency, frequency, dysuria, suprapubic tenderness, altered mental status, or hypotension in a patient without another recognized infection and a positive urine culture. Of the asymptomatic bacteriuria cases, 68% were managed appropriately with no antibiotic treatment; 32% were inappropriately treated with antibiotics.
In multivariate analysis, older patient age, predominance of gram-negative bacteria, and higher urine white blood cell count were significantly associated with inappropriate treatment.
This study highlights the fact that antibiotics continue to be used inappropriately in patients with catheters. Current guidelines do not distinguish well between asymptomatic bacteriuria and UTI, so there might be a knowledge gap. This study was based on urine culture data, not urinalysis of all patients with a catheter, so the symptomatic patients were likely over-represented.
An associated editorial observes that the study extrapolates data from studies that involved patients with uncomplicated UTIs and, therefore, might reach erroneous conclusions. Further, viewing catheter-associated symptomatic UTIs and catheter-associated asymptomatic bactiuria as dichotomous and warranting inherently different management fails to encompass a number of clinical factors, including co-infection, and further fails to acknowledge that removal of the catheter is the first step in treatment. However, the finding that antibiotics continue to be used inappropriately is useful.
Bottom line: A clinical determination of whether a patient with a catheter really has a symptomatic UTI/urosepsis or only has asymptomatic bacteriuria should precede starting antibiotics in hospitalized patients.
Citations: Cope M, Cevallos ME, Cadle RM, Darouiche RO, Musher DM, Trautner BW. Inappropriate treatment of catheter-associated asymptomatic bateriuria in a tertiary care hospital. Clin Infect Dis. 2009;48(9):1182-1188.
Kunin CM. Catheter-associated urinary tract infections: a syllogism compounded by a questionable dichotomy. Clin Infect Dis. 2009;48:1189-1190.
Current Practices in the Evaluation and Management of Thrombocytopenia in Heparin Patients
Clinical question: Are the current American College of Chest Physicians (ACCP) guidelines for the recognition, treatment, and prevention of heparin-induced thrombocytopenia (HIT) being followed?
Background: Heparin-based anticoagulation is frequently given to hospitalized patients, and approximately 1% to 5% of these patients develop HIT. In 2004, the ACCP published a consensus statement on the evaluation, management, and prevention of HIT.
Study design: Prospective, observational study.
Setting: Forty-eight U.S. hospitals in the Complications After Thrombocytopenia Caused by Heparin (CATCH) registry.
Synopsis: The CATCH trial enrolled patients receiving any form of heparin for >96 hours (n=2,420), cardiac-care-unit patients treated with heparin (n=1,090), and patients who had an HIT antibody assay performed (n=449), for a total of 3,536 total patients. The study included patients on unfractionated heparin (UFH) or low-molecular-weight heparin (LMWH). Thrombocytopenia was defined at a platelet count <150,000, or a decrease of 50% when compared with admission.
In the prolonged heparin group, 36.4% of patients developed thrombocytopenia; however, HIT was suspected in only 19.8% of these high-risk patients. While physicians were more likely to consider HIT in the cardiac-care patients (37.6%), the diagnosis was considered>24 hours after the thrombocytopenia developed. Physicians often waited until after a thromboembolic complication occurred before evaluating for HIT. More often than not, preventive measures were missed (e.g., failing to check for HIT antibodies, continuing heparin after HIT was suspected).
Bottom line: Thrombocytopenia is a common occurrence in patients receiving heparin and, despite the risk of devastating complications from HIT, treatment infrequently conforms to the established guidelines.
Citation: Crespo EM, Oliveira GBF, Honeycutt EF, et al. Evaluation and management of thrombocytopenia and suspected heparin-induced thrombocytopenia in hospitalized patients: The Complications After Thrombocytopenia Caused by Heparin (CATCH) registry. Am Heart J. 2009;157(4):651-657. TH
PEDIATRIC HM LITerature
Epinephrine and Dexamethasone Alone Do Not Reduce Hospital Admissions in Infants with Bronchiolitis
By Mark Shen, MD
Clinical question: Does nebulized epinephrine, oral dexamethasone, or a combination of the two result in a decrease in hospital admissions when given in the ED to infants with bronchiolitis?
Background: Bronchiolitis is the most common lower-respiratory-tract infection of infancy. Rates of admission have climbed in the past two decades. Bronchodilators and corticosteroids are not routinely recommended, and the evidence surrounding epinephrine and dexamethasone has shown varying results.
Study design: Randomized, double-blind, placebo-controlled trial.
Setting: Eight Canadian pediatric EDs.
Synopsis: Eight hundred infants ages six weeks to 12 months with a first episode of bronchiolitis were randomized to nebulized epinephrine and oral dexamethasone, epinephrine and oral placebo, dexamethasone and nebulized placebo, or oral and nebulized placebo. Epinephrine was delivered as two nebulizations 30 minutes apart, and dexamethasone was given as a 1 mg/kg oral dose, followed by five once-daily doses of 0.6 mg/kg. In unadjusted analysis, only the infants who received epinephrine and dexamethasone were less likely to be admitted to the hospital by day seven.
Limitations of this study include a small effect size and a non-statistically-significant difference between the epinephrine/dexamethasone group and placebo after statistical adjustment for multiple comparisons. Given that admission rates did not decrease in the epinephrine/placebo group and the dexamethasone/placebo group, this study supports national guidelines that do not recommend the routine use of these agents in bronchiolitis. The authors suggest that synergy between epinephrine and dexamethasone in bronchiolitis be further studied.
Bottom line: When given alone, epinephrine and dexamethasone do not reduce hospital admissions in infants with bronchiolitis.
Citation: Plint AC, Johnson DW, Patel H, et al. Epinephrine and dexamethasone in children with bronchiolitis. N Engl J Med. 2009;360(20):2079-2089.
Reviewed by Pediatric Editor Mark Shen, MD, medical director of hospital medicine at Dell Children’s Medical Center, Austin, Texas.
Lessons in Leadership
For hospitalists attending SHM’s Leadership Academy, the final day isn’t the end of the experience. It’s just the beginning.
Now in its fifth year, the Leadership Academy provides hospitalists of all backgrounds the opportunity to come together and address the managerial and practical issues of HM that aren’t covered in medical school. The demand for leadership training within the specialty has been so great that the Leadership Academy is now split into two levels; Level II is reserved for hospitalists who have completed the Level I program or have an MBA.
Level I covers the fundamental elements for leading groups—and change—within a hospital. Hospitalists learn how to take on leadership roles, better understand group dynamics, manage conflict, and improve communication.
Level II, which traditionally has had smaller class sizes, goes deeper into managerial issues that relate to hospital administration and leadership. The advanced program features such all-day sessions as “Financial Storytelling” and the popular “Meta-Leadership in Hospital Medicine.”
Leadership Academy’s true impact is felt shortly after hospitalists return to their hospitals. “Hospitalists send e-mails within a week of the end of Leadership Academy,” says Larry Wellikson, MD, FHM, CEO of SHM. “They tell us about the tangible actions that they’ve already taken as a result of what they’ve learned over the four days of Leadership Academy. … In just a few days, hospitalists learn from some of the best in the specialty and thought leaders outside of the field, too.”
—Rachel George, MD, regional medical director, vice president of operations, Cogent Healthcare, Brentwood, Tenn.
Immediate Results
Hospitalists—and those who work with them—often see the change the academy has on a physician soon after the attendee returns to work. “It’s like a light bulb goes on,” says Rachel George, MD, regional medical director and vice president for operations at Brentwood, Tenn.-based Cogent Healthcare. “They get it. They come back from the Leadership Academy with an understanding of how to lead their own groups and manage through change.”
Dr. George, who attended Level I and Level II programs and now facilitates academy sessions, says Leadership Academy is “almost mandatory” for Cogent’s medical directors. The company encourages all of its physicians to attend.
One of the most valuable aspects of the program, she says, is the long-term impact. Dr. George completed the advanced course in 2005 and still enjoys catching up with her fellow academy attendees, as well as learning about what they have achieved in the subsequent years. Many classmates have become medical directors, and she says they credit the academy for many of the positive changes in their groups.
“It’s absolutely worth it,” she says. “Both levels are worth the time and investment. And ‘leadership’ doesn’t necessarily mean being a leader of your group. It can also mean being a leader of change and initiatives within the hospital.”

Active Training for Active Leaders
Although the word “academy” might conjure ideas of long-winded seminars or Socratic debate, SHM’s Leadership Academy emphasizes a hands-on learning style. Hospitalists are divided into groups to tackle real-world issues that affect hospitals, hospitalists, and patients, such as QI initiatives and ED throughput.
The courses feature some of the most engaging speakers in HM and insightful presentations from experts outside of the specialty.
The faculty also includes nonphysicians; for example, Tim Keogh, PhD, who teaches postgraduate managerial communications at The Citadel School of Business Administration in Charleston, S.C., and Tulane University’s School of Public Health and Tropical Medicine in New Orleans, offers a unique perspective to hospitalists who are often accustomed to learning only from those within the specialty.
Young Specialty Grows Leaders
The Leadership Academy’s origins stem from HM’s youthful roots; the average age of a hospitalist is 40, and the average age of a hospitalist leader is 43, according to SHM’s 2007-2008 “Bi-Annual Survey on the State of the Hospital Medicine Movement.” Unlike more established medical fields, HM is in the unique position of cultivating the first generation of the specialty’s leadership. Through mentorship and motivation, the academy is arming hospitalists with the tools they’ll need to become leaders in a still-developing field.
Individuals within HM benefit from leadership training, too. “I see Leadership Academy as filling a real void in hospital medicine,” Dr. George says. “We’re still a young profession. We don’t have a lot of gray hair in the field, but we’re in the unusual position to work closely with hospital administrators.”
That paradigm means hospitalists have to learn to speak the language of administration, she says. And they need to learn it quick if they want to create real change and value. For Dr. George, who sees the academy’s impact from the hospitalist and executive perspectives, the academy prepares hospitalists to fill a necessary role in the hospital.
“As a relatively new profession, we still have to prove ourselves on a regular basis,” she says. TH
Brendon Shank is a freelance writer based in Philadelphia.
Chapter Updates
Southwest Wisconsin Chapter

Hospitalists from five HM groups met May 7 in Madison. Julia Wright, MD, FHM, clinical associate professor of medicine and director of hospital medicine at the University of Wisconsin School of Medicine and Public Health in Madison, spoke about “The State of Hospital Medicine.” Her presentation included an exploration of factors that influence and drive the specialty, as well as a look at HM demographics.
Northern Nevada
The Northern Nevada chapter met April 7 at the Charlie Palmer Steakhouse in Reno. The 36 attendees represented five HM groups. The meeting topic was “Difficult Decisions in Anticoagulation,” with guest speaker Christine Tankersley, PharmD, from Sanofi-Aventis Pharmaceuticals.
The chapter provided Tankersley with several real-patient cases that involved challenging decisions, and she led a step-wise discussion within the context of new American College of Clinial Pharmacy guidelines for anticoagulation.
Chapter President Phil Goodman, MD, FHM, stressed the importance of joining SHM and attending the annual meeting. It was decided to continue the community SHM journal club, which enjoyed a successful debut in September 2008, with 15 attendees reviewing a pair of New England Journal of Medicine articles at P.F. Chang’s in Reno.
Annual chapter elections were planned for the next meeting.
Long Island
The March 19 meeting provided SHM updates on the national meeting, advancement to fellowship opportunities, and a call to encourage HM group leaders to promote SHM membership.
A presentation on antibiotic stewardship revealed data on the improved clinical and economical outcomes of such a program in the hospital setting.
Connecticut
Joseph Ming-Wah Li, MD, FHM, director of the hospital medicine program at Beth Israel Deaconess Medical Center in Boston and an SHM board member, spoke at the March 25 chapter meeting. He discussed the exponential growth of HM as a specialty and reviewed data on hospitalist numbers past, present, and future.
Dr. Li also analyzed data from SHM’s 2007-2008 “Bi-Annual Survey on the State of Hospital Medicine,” and provided benchmarks for hospitalist productivity, night scheduling, administrative work, use of physician extenders, and residents.
Dr. Li’s talk was followed by a presentation on billing-capture software by Courtney Shickel from Ingenious Med Company. The demonstration touted the benefits of using the software for charge capture and some quality measures. The data showed the software can increase hospital revenues within 30 to 60 days of implementation, and lost charges were almost completely mitigated.
Upstate South Carolina
The March 19 meeting brought together nearly 20 attendees representing five hospitals in upstate South Carolina. Bruce Friedman, MD, of Doctor’s Hospital presented information on doripenem (Doribax).
Following the presentation, chapter President Imran Shaikh, MD, a hospitalist with Inpatient Medicine Service, directed the business meeting. Members discussed development of a chapter newsletter as well as an online forum to allow discussion of clinical and administrative issues.
Sanjeev Kumar, MD, a hospitalist with Hospital Medicine Consultants, will query members as to which portal would be most accessible to members, then proceed with establishing the forum.
Georgia Coastal

The April 16 chapter meeting featured SHM board member and president-elect Jeff Wiese, MD, FHM, speaking on the direction of HM and the progress of a board certification in hospital medicine.
This meeting was well attended by SHM members, including physician assistants and nurse practitioners.
For hospitalists attending SHM’s Leadership Academy, the final day isn’t the end of the experience. It’s just the beginning.
Now in its fifth year, the Leadership Academy provides hospitalists of all backgrounds the opportunity to come together and address the managerial and practical issues of HM that aren’t covered in medical school. The demand for leadership training within the specialty has been so great that the Leadership Academy is now split into two levels; Level II is reserved for hospitalists who have completed the Level I program or have an MBA.
Level I covers the fundamental elements for leading groups—and change—within a hospital. Hospitalists learn how to take on leadership roles, better understand group dynamics, manage conflict, and improve communication.
Level II, which traditionally has had smaller class sizes, goes deeper into managerial issues that relate to hospital administration and leadership. The advanced program features such all-day sessions as “Financial Storytelling” and the popular “Meta-Leadership in Hospital Medicine.”
Leadership Academy’s true impact is felt shortly after hospitalists return to their hospitals. “Hospitalists send e-mails within a week of the end of Leadership Academy,” says Larry Wellikson, MD, FHM, CEO of SHM. “They tell us about the tangible actions that they’ve already taken as a result of what they’ve learned over the four days of Leadership Academy. … In just a few days, hospitalists learn from some of the best in the specialty and thought leaders outside of the field, too.”
—Rachel George, MD, regional medical director, vice president of operations, Cogent Healthcare, Brentwood, Tenn.
Immediate Results
Hospitalists—and those who work with them—often see the change the academy has on a physician soon after the attendee returns to work. “It’s like a light bulb goes on,” says Rachel George, MD, regional medical director and vice president for operations at Brentwood, Tenn.-based Cogent Healthcare. “They get it. They come back from the Leadership Academy with an understanding of how to lead their own groups and manage through change.”
Dr. George, who attended Level I and Level II programs and now facilitates academy sessions, says Leadership Academy is “almost mandatory” for Cogent’s medical directors. The company encourages all of its physicians to attend.
One of the most valuable aspects of the program, she says, is the long-term impact. Dr. George completed the advanced course in 2005 and still enjoys catching up with her fellow academy attendees, as well as learning about what they have achieved in the subsequent years. Many classmates have become medical directors, and she says they credit the academy for many of the positive changes in their groups.
“It’s absolutely worth it,” she says. “Both levels are worth the time and investment. And ‘leadership’ doesn’t necessarily mean being a leader of your group. It can also mean being a leader of change and initiatives within the hospital.”
Active Training for Active Leaders
Although the word “academy” might conjure ideas of long-winded seminars or Socratic debate, SHM’s Leadership Academy emphasizes a hands-on learning style. Hospitalists are divided into groups to tackle real-world issues that affect hospitals, hospitalists, and patients, such as QI initiatives and ED throughput.
The courses feature some of the most engaging speakers in HM and insightful presentations from experts outside of the specialty.
The faculty also includes nonphysicians; for example, Tim Keogh, PhD, who teaches postgraduate managerial communications at The Citadel School of Business Administration in Charleston, S.C., and Tulane University’s School of Public Health and Tropical Medicine in New Orleans, offers a unique perspective to hospitalists who are often accustomed to learning only from those within the specialty.
Young Specialty Grows Leaders
The Leadership Academy’s origins stem from HM’s youthful roots; the average age of a hospitalist is 40, and the average age of a hospitalist leader is 43, according to SHM’s 2007-2008 “Bi-Annual Survey on the State of the Hospital Medicine Movement.” Unlike more established medical fields, HM is in the unique position of cultivating the first generation of the specialty’s leadership. Through mentorship and motivation, the academy is arming hospitalists with the tools they’ll need to become leaders in a still-developing field.
Individuals within HM benefit from leadership training, too. “I see Leadership Academy as filling a real void in hospital medicine,” Dr. George says. “We’re still a young profession. We don’t have a lot of gray hair in the field, but we’re in the unusual position to work closely with hospital administrators.”
That paradigm means hospitalists have to learn to speak the language of administration, she says. And they need to learn it quick if they want to create real change and value. For Dr. George, who sees the academy’s impact from the hospitalist and executive perspectives, the academy prepares hospitalists to fill a necessary role in the hospital.
“As a relatively new profession, we still have to prove ourselves on a regular basis,” she says. TH
Brendon Shank is a freelance writer based in Philadelphia.
Chapter Updates
Southwest Wisconsin Chapter
Hospitalists from five HM groups met May 7 in Madison. Julia Wright, MD, FHM, clinical associate professor of medicine and director of hospital medicine at the University of Wisconsin School of Medicine and Public Health in Madison, spoke about “The State of Hospital Medicine.” Her presentation included an exploration of factors that influence and drive the specialty, as well as a look at HM demographics.
Northern Nevada
The Northern Nevada chapter met April 7 at the Charlie Palmer Steakhouse in Reno. The 36 attendees represented five HM groups. The meeting topic was “Difficult Decisions in Anticoagulation,” with guest speaker Christine Tankersley, PharmD, from Sanofi-Aventis Pharmaceuticals.
The chapter provided Tankersley with several real-patient cases that involved challenging decisions, and she led a step-wise discussion within the context of new American College of Clinial Pharmacy guidelines for anticoagulation.
Chapter President Phil Goodman, MD, FHM, stressed the importance of joining SHM and attending the annual meeting. It was decided to continue the community SHM journal club, which enjoyed a successful debut in September 2008, with 15 attendees reviewing a pair of New England Journal of Medicine articles at P.F. Chang’s in Reno.
Annual chapter elections were planned for the next meeting.
Long Island
The March 19 meeting provided SHM updates on the national meeting, advancement to fellowship opportunities, and a call to encourage HM group leaders to promote SHM membership.
A presentation on antibiotic stewardship revealed data on the improved clinical and economical outcomes of such a program in the hospital setting.
Connecticut
Joseph Ming-Wah Li, MD, FHM, director of the hospital medicine program at Beth Israel Deaconess Medical Center in Boston and an SHM board member, spoke at the March 25 chapter meeting. He discussed the exponential growth of HM as a specialty and reviewed data on hospitalist numbers past, present, and future.
Dr. Li also analyzed data from SHM’s 2007-2008 “Bi-Annual Survey on the State of Hospital Medicine,” and provided benchmarks for hospitalist productivity, night scheduling, administrative work, use of physician extenders, and residents.
Dr. Li’s talk was followed by a presentation on billing-capture software by Courtney Shickel from Ingenious Med Company. The demonstration touted the benefits of using the software for charge capture and some quality measures. The data showed the software can increase hospital revenues within 30 to 60 days of implementation, and lost charges were almost completely mitigated.
Upstate South Carolina
The March 19 meeting brought together nearly 20 attendees representing five hospitals in upstate South Carolina. Bruce Friedman, MD, of Doctor’s Hospital presented information on doripenem (Doribax).
Following the presentation, chapter President Imran Shaikh, MD, a hospitalist with Inpatient Medicine Service, directed the business meeting. Members discussed development of a chapter newsletter as well as an online forum to allow discussion of clinical and administrative issues.
Sanjeev Kumar, MD, a hospitalist with Hospital Medicine Consultants, will query members as to which portal would be most accessible to members, then proceed with establishing the forum.
Georgia Coastal
The April 16 chapter meeting featured SHM board member and president-elect Jeff Wiese, MD, FHM, speaking on the direction of HM and the progress of a board certification in hospital medicine.
This meeting was well attended by SHM members, including physician assistants and nurse practitioners.
JHM Makes Immediate Industry Impact

On June 19, the Journal of Hospital Medicine (JHM) received a higher-than-expected first Impact Factor score, the measure of citations received in 2008 to articles published in 2006 and 2007. The 3.613 initial score ranks JHM No. 21 out of 107 journals in the Internal and General Medicine subject category.
Impact Factor scores are used as a proxy for the importance of a journal to its field. Academic researchers are evaluated on the “impact” of their publications based on this score.
“There are journals that are 20 years old that don’t have impact factors as high as we do,” says Mark V. Williams, MD, FACP, FHM, professor and chief of the division of hospital medicine at Northwestern University’s Feinberg School of Medicine in Chicago and editor of JHM. “Hopefully, this will lead to academicians across the world being interested in submitting their scholarly work.”
JHM’s top-cited source is Core Competencies in Hospital Medicine: A Framework for Curriculum Development (www.hospitalmedicine.org/ResourceRoomRedesign/RR_Main/html/Core_Competencies.cfm). The clinical content is an essential tool for practicing hospitalists, providing guidance in the areas of clinical conditions, procedures, healthcare systems, development, and methodology.
“SHM is very proud of our journal, JHM, and getting such a sterling impact factor is a further acknowledgement of JHM’s credibility, reach, and world-class content,” says Larry Wellikson, MD, FHM, CEO of SHM. TH
Freelance Writer Richard Quinn contributed to this report.
Letters
SHM Should Support Reform Measures to Medicare System
As part of healthcare reform, I believe SHM should support the following ideas for Medicare reform:
- Primary-care physician (PCP) reimbursement should increase by 25%;
- Surgical reimbursement should decrease by 10%;
- Medical subspecialist reimbursement should decrease by 10%;
- All HIV/AIDS patients should be covered under Medicaid;
- All end-stage renal disease (ESRD) should be covered under Medicaid;
- Community health center funding should be covered under Medicaid;
- Children’s Health Insurance Plan (CHIP) funding should not come out of the Medicare fund;
- National Institutes of Health (NIH) funding should not come out of the Medicare fund;
- The Medicare tax on income before deductions should have no income ceiling; and
- The Social Security tax should be higher for those earning more than $250,000 per year before any deductions.
These changes would strengthen the Medicare fund to provide for our senior citizens’ healthcare and retirement. The above will be better than budget-neutral. Those to be covered (above) under Medicaid (HIV, ESRD, CHC, etc.) will actually have to pay less out of pocket for medications, services, procedures, and hospitalization.
The disproportionately low reimbursement to PCPs would be partially corrected in line with the medical home program concept. Partial financial correction of the overcompensated specialists and procedurists who dominate the rate commission would be accomplished with only a small amount of financial distress, which PCPs have been suffering for more than a decade.
Robert Beshany, MD,
SHM charter member,
Colorado Springs, Colo.
SHM responds:
SHM advocates for reforms that increase access to affordable healthcare and deliver safer, higher-quality, and more cost-effective healthcare to all Americans. Over the past five years, SHM has become widely respected for our progressive and collaborative approach to healthcare payment reform.
We advocate for:
- Improved care coordination, particularly during transitions of care. We have met with MedPAC, key Congressional leaders, and CMS to advocate for reimbursement that supports better care transitions and reduces unnecessary rehospitalizations.
- Incentive alignment. Providers, hospitals, and payors must have aligned incentives that consistently reward quality as well as evidence-based, cost-effective care. To that end, we have strongly supported such pay-for-performance initiatives as the Physician Quality Reporting Initiative and Hospital Value Based Purchasing. We also support exploration of new payment methodologies, such as bundled payments to accountable-care organizations, which is still at the demonstration project stage. Properly structured, these new reimbursement models could spur innovation, reduce compartmentalization of care, and decrease costs.
- Expanded federal support for the Agency for Healthcare Research and Quality, as well as robust funding for comparative effectiveness research.
- Incentives supporting the adoption of e-prescribing and health information technology.
- Replacement of the flawed Sustainable Growth Rate with a stable, predictable payment methodology.
- Support for initiatives that encourage physicians to choose generalist tracks.
We encourage our members to visit our Legislative Advocacy Web site (www.hospitalmedicine.org/advocacy) to see where we stand on healthcare reform.
Eric M. Siegal, MD, FHM,
chairman, SHM Public
Policy Committee