User login
Pearce-ings: Why should dermatologists have all the fun?
Acne vulgaris is a diagnosis common to all primary care physicians, and the No. 1 concern for most adolescents. Referral wait times to a dermatologist can be anywhere from 3 to 6 months; if you’re lucky, dermatologists have a physician assistant or nurse practitioner who can see patients sooner. But the majority of acne cases – even complex ones – can successfully be treated by a primary care physician. Not only would you be improving patient satisfaction because the patient can be treated immediately, you also would increase your revenue.
Acne care is a billion dollar industry. Prescription medications are a $2 billion industry, and nonprescription medications are three to four times that (Semin. Cutan. Med. Surg. 2008;27:170). Yet, the average primary care physician will start treatment, then refer to the dermatologist.
The scope of acne care is not that broad; this should decrease your anxiety about being more aggressive with the treatment. Acne begins when there is follicular hyperproliferation, which leads to the obstruction of the follicle. This is followed by an increase in the sebum, by inflammation, and then by colonization with bacteria. Topical retinoids (tretinoin, adapalene, and tazarotene) normalize the follicular hyperproliferation and decrease inflammation. Antibiotics kill the bacteria. So, with implementation of topical retinoids, antibiotics, and a good home regimen, the vast majority of acne cases can be successfully treated without a referral.
When a patient presents with either concerns about acne or obvious full-blown acne, an assessment of the condition should be done. Realizing that there is gender gap in the treatment of acne is crucial. Males are much less likely to admit that they are bothered by their acne or adhere to treatment because they think it’s “girly” to use products on the face or follow a cleansing regimen. But, it is well documented that acne is associated with lower self-esteem, being bullied, depression, and anxiety. The patient assessment should identify acne type (comedonal, inflammatory, nodular), severity, scarring, menstrual history in girls, and the psychological impact on the patient.
Also review past treatments and what worked, what didn’t work, and why. Most patients upon presentation have used the over-the-counter preparations, which usually consist of benzoyl peroxide and salicylic acid.
Managing patients’ expectations is another key component to successful treatment. Most of the topical treatments have undesirable side effects like drying and reddening and hyperpigmentation of the skin. Informing them that irritations will lessen and will improve over time can aid in adherence to the regimen.
If a patient has dry skin, cream formulations will be less irritating; more oily skin will respond better to gels that tend to be more drying. The percentage of benzoyl peroxide also contributes to the discomfort. One study showed that the 2.5% was as effective as the 10% formulation, but resulted in less irritation (Br. J. Dermatol .2014;170:557). Salicylic acid is a good alternative if benzoyl peroxide is not tolerated.
Antibiotics are an essential part of acne treatment. Topicals such as erythromycin, clindamycin, and dapsone reduce Propionibacterium acnes, which also reduces inflammation. Oral antibiotics have similar efficacy, but are associated with more rapid clinical improvement. Another consideration in using oral antibiotics is the side effects. Photosensitivity and gastrointestinal upset are significant issues that arise with their use. Doxycycline monohydrate tends to have fewer GI side effects and is preferred over doxycycline hyclate. Minocycline has fewer GI effects and less photosensitivity, but tends to be more expensive and is associated with vertigo and serum sickness (Arch. Dermatol. 1982;118:989-92). Prolonged use of either topical or oral antibiotics increases the risk of resistant strains of P. acnes. Other antibiotics are available for use, such as trimethoprim-sulfamethoxazole, clindamycin, and erythromycin, but all have either significant side effects associated with them or higher levels of resistance.
Combination therapy is superior to monotherapy. Whether combining benzoyl peroxide with a topical retinoid, antibiotic, or both, improved outcomes have been shown. Studies also confirm that use of benzoyl peroxide with antibiotics lowers the risk of P. acne’s resistance (Dermatol. Clin. 2009;27:25-31).
Now, how do you make acne care work for your business model? It’s easier than you may think. Other highly effective, inexpensive, and efficient treatments can be implemented with little investment.
Establishing and marketing an acne program and dedicating a few hours a week to an acne clinic can add significant revenue to your practice. Educate the patient on cleansing and diet; information can be found at www.acne.com. Beyond using the traditional acne treatments, consider adding peels and a light-based therapy to the regimen. Salicylic acid peels are easy to apply and give great results. Treatments are done monthly for five to six treatments at a cost of $140-$250 per treatment. The application process takes 15-20 minutes.
Light therapy is also easy to implement. With the purchase of a lamp that costs less than $1,000, you can offer this treatment. Patients can come twice a week for 15-minute sessions for a total of eight sessions. The average cost for these treatments is $50-$75 per treatment. Combinations of peels and light therapy have great results with minimal risk and prevent families from having to wait the 3-6 months it takes to get to see the dermatologist.
Lastly, consider cosmeceuticals. There is no great mystery as to what is in the acne medications. You can create your own line using a compounding pharmacy such as MasterPharm or University Compounding Pharmacy . Or use a cosmeceuticals company that will provide you quality products at wholesale prices. Many of them don’t require you to stock the product. SkinMedica and SkinCeuticals ( are popular ones, but there are several more. As opposed to your patient going to the local pharmacy and guessing at which product is best, you can provide a full line of products that will give the best results.
Without compromising care, you can provide complete skin care to your patients and increase your revenue and your patient’s satisfaction.
Dr. Pearce is a pediatrician in Frankfort, Ill. Dr. Pearce had no relevant financial disclosures. E-mail her at pdnews@frontlinemedcom.com.
Acne vulgaris is a diagnosis common to all primary care physicians, and the No. 1 concern for most adolescents. Referral wait times to a dermatologist can be anywhere from 3 to 6 months; if you’re lucky, dermatologists have a physician assistant or nurse practitioner who can see patients sooner. But the majority of acne cases – even complex ones – can successfully be treated by a primary care physician. Not only would you be improving patient satisfaction because the patient can be treated immediately, you also would increase your revenue.
Acne care is a billion dollar industry. Prescription medications are a $2 billion industry, and nonprescription medications are three to four times that (Semin. Cutan. Med. Surg. 2008;27:170). Yet, the average primary care physician will start treatment, then refer to the dermatologist.
The scope of acne care is not that broad; this should decrease your anxiety about being more aggressive with the treatment. Acne begins when there is follicular hyperproliferation, which leads to the obstruction of the follicle. This is followed by an increase in the sebum, by inflammation, and then by colonization with bacteria. Topical retinoids (tretinoin, adapalene, and tazarotene) normalize the follicular hyperproliferation and decrease inflammation. Antibiotics kill the bacteria. So, with implementation of topical retinoids, antibiotics, and a good home regimen, the vast majority of acne cases can be successfully treated without a referral.
When a patient presents with either concerns about acne or obvious full-blown acne, an assessment of the condition should be done. Realizing that there is gender gap in the treatment of acne is crucial. Males are much less likely to admit that they are bothered by their acne or adhere to treatment because they think it’s “girly” to use products on the face or follow a cleansing regimen. But, it is well documented that acne is associated with lower self-esteem, being bullied, depression, and anxiety. The patient assessment should identify acne type (comedonal, inflammatory, nodular), severity, scarring, menstrual history in girls, and the psychological impact on the patient.
Also review past treatments and what worked, what didn’t work, and why. Most patients upon presentation have used the over-the-counter preparations, which usually consist of benzoyl peroxide and salicylic acid.
Managing patients’ expectations is another key component to successful treatment. Most of the topical treatments have undesirable side effects like drying and reddening and hyperpigmentation of the skin. Informing them that irritations will lessen and will improve over time can aid in adherence to the regimen.
If a patient has dry skin, cream formulations will be less irritating; more oily skin will respond better to gels that tend to be more drying. The percentage of benzoyl peroxide also contributes to the discomfort. One study showed that the 2.5% was as effective as the 10% formulation, but resulted in less irritation (Br. J. Dermatol .2014;170:557). Salicylic acid is a good alternative if benzoyl peroxide is not tolerated.
Antibiotics are an essential part of acne treatment. Topicals such as erythromycin, clindamycin, and dapsone reduce Propionibacterium acnes, which also reduces inflammation. Oral antibiotics have similar efficacy, but are associated with more rapid clinical improvement. Another consideration in using oral antibiotics is the side effects. Photosensitivity and gastrointestinal upset are significant issues that arise with their use. Doxycycline monohydrate tends to have fewer GI side effects and is preferred over doxycycline hyclate. Minocycline has fewer GI effects and less photosensitivity, but tends to be more expensive and is associated with vertigo and serum sickness (Arch. Dermatol. 1982;118:989-92). Prolonged use of either topical or oral antibiotics increases the risk of resistant strains of P. acnes. Other antibiotics are available for use, such as trimethoprim-sulfamethoxazole, clindamycin, and erythromycin, but all have either significant side effects associated with them or higher levels of resistance.
Combination therapy is superior to monotherapy. Whether combining benzoyl peroxide with a topical retinoid, antibiotic, or both, improved outcomes have been shown. Studies also confirm that use of benzoyl peroxide with antibiotics lowers the risk of P. acne’s resistance (Dermatol. Clin. 2009;27:25-31).
Now, how do you make acne care work for your business model? It’s easier than you may think. Other highly effective, inexpensive, and efficient treatments can be implemented with little investment.
Establishing and marketing an acne program and dedicating a few hours a week to an acne clinic can add significant revenue to your practice. Educate the patient on cleansing and diet; information can be found at www.acne.com. Beyond using the traditional acne treatments, consider adding peels and a light-based therapy to the regimen. Salicylic acid peels are easy to apply and give great results. Treatments are done monthly for five to six treatments at a cost of $140-$250 per treatment. The application process takes 15-20 minutes.
Light therapy is also easy to implement. With the purchase of a lamp that costs less than $1,000, you can offer this treatment. Patients can come twice a week for 15-minute sessions for a total of eight sessions. The average cost for these treatments is $50-$75 per treatment. Combinations of peels and light therapy have great results with minimal risk and prevent families from having to wait the 3-6 months it takes to get to see the dermatologist.
Lastly, consider cosmeceuticals. There is no great mystery as to what is in the acne medications. You can create your own line using a compounding pharmacy such as MasterPharm or University Compounding Pharmacy . Or use a cosmeceuticals company that will provide you quality products at wholesale prices. Many of them don’t require you to stock the product. SkinMedica and SkinCeuticals ( are popular ones, but there are several more. As opposed to your patient going to the local pharmacy and guessing at which product is best, you can provide a full line of products that will give the best results.
Without compromising care, you can provide complete skin care to your patients and increase your revenue and your patient’s satisfaction.
Dr. Pearce is a pediatrician in Frankfort, Ill. Dr. Pearce had no relevant financial disclosures. E-mail her at pdnews@frontlinemedcom.com.
Acne vulgaris is a diagnosis common to all primary care physicians, and the No. 1 concern for most adolescents. Referral wait times to a dermatologist can be anywhere from 3 to 6 months; if you’re lucky, dermatologists have a physician assistant or nurse practitioner who can see patients sooner. But the majority of acne cases – even complex ones – can successfully be treated by a primary care physician. Not only would you be improving patient satisfaction because the patient can be treated immediately, you also would increase your revenue.
Acne care is a billion dollar industry. Prescription medications are a $2 billion industry, and nonprescription medications are three to four times that (Semin. Cutan. Med. Surg. 2008;27:170). Yet, the average primary care physician will start treatment, then refer to the dermatologist.
The scope of acne care is not that broad; this should decrease your anxiety about being more aggressive with the treatment. Acne begins when there is follicular hyperproliferation, which leads to the obstruction of the follicle. This is followed by an increase in the sebum, by inflammation, and then by colonization with bacteria. Topical retinoids (tretinoin, adapalene, and tazarotene) normalize the follicular hyperproliferation and decrease inflammation. Antibiotics kill the bacteria. So, with implementation of topical retinoids, antibiotics, and a good home regimen, the vast majority of acne cases can be successfully treated without a referral.
When a patient presents with either concerns about acne or obvious full-blown acne, an assessment of the condition should be done. Realizing that there is gender gap in the treatment of acne is crucial. Males are much less likely to admit that they are bothered by their acne or adhere to treatment because they think it’s “girly” to use products on the face or follow a cleansing regimen. But, it is well documented that acne is associated with lower self-esteem, being bullied, depression, and anxiety. The patient assessment should identify acne type (comedonal, inflammatory, nodular), severity, scarring, menstrual history in girls, and the psychological impact on the patient.
Also review past treatments and what worked, what didn’t work, and why. Most patients upon presentation have used the over-the-counter preparations, which usually consist of benzoyl peroxide and salicylic acid.
Managing patients’ expectations is another key component to successful treatment. Most of the topical treatments have undesirable side effects like drying and reddening and hyperpigmentation of the skin. Informing them that irritations will lessen and will improve over time can aid in adherence to the regimen.
If a patient has dry skin, cream formulations will be less irritating; more oily skin will respond better to gels that tend to be more drying. The percentage of benzoyl peroxide also contributes to the discomfort. One study showed that the 2.5% was as effective as the 10% formulation, but resulted in less irritation (Br. J. Dermatol .2014;170:557). Salicylic acid is a good alternative if benzoyl peroxide is not tolerated.
Antibiotics are an essential part of acne treatment. Topicals such as erythromycin, clindamycin, and dapsone reduce Propionibacterium acnes, which also reduces inflammation. Oral antibiotics have similar efficacy, but are associated with more rapid clinical improvement. Another consideration in using oral antibiotics is the side effects. Photosensitivity and gastrointestinal upset are significant issues that arise with their use. Doxycycline monohydrate tends to have fewer GI side effects and is preferred over doxycycline hyclate. Minocycline has fewer GI effects and less photosensitivity, but tends to be more expensive and is associated with vertigo and serum sickness (Arch. Dermatol. 1982;118:989-92). Prolonged use of either topical or oral antibiotics increases the risk of resistant strains of P. acnes. Other antibiotics are available for use, such as trimethoprim-sulfamethoxazole, clindamycin, and erythromycin, but all have either significant side effects associated with them or higher levels of resistance.
Combination therapy is superior to monotherapy. Whether combining benzoyl peroxide with a topical retinoid, antibiotic, or both, improved outcomes have been shown. Studies also confirm that use of benzoyl peroxide with antibiotics lowers the risk of P. acne’s resistance (Dermatol. Clin. 2009;27:25-31).
Now, how do you make acne care work for your business model? It’s easier than you may think. Other highly effective, inexpensive, and efficient treatments can be implemented with little investment.
Establishing and marketing an acne program and dedicating a few hours a week to an acne clinic can add significant revenue to your practice. Educate the patient on cleansing and diet; information can be found at www.acne.com. Beyond using the traditional acne treatments, consider adding peels and a light-based therapy to the regimen. Salicylic acid peels are easy to apply and give great results. Treatments are done monthly for five to six treatments at a cost of $140-$250 per treatment. The application process takes 15-20 minutes.
Light therapy is also easy to implement. With the purchase of a lamp that costs less than $1,000, you can offer this treatment. Patients can come twice a week for 15-minute sessions for a total of eight sessions. The average cost for these treatments is $50-$75 per treatment. Combinations of peels and light therapy have great results with minimal risk and prevent families from having to wait the 3-6 months it takes to get to see the dermatologist.
Lastly, consider cosmeceuticals. There is no great mystery as to what is in the acne medications. You can create your own line using a compounding pharmacy such as MasterPharm or University Compounding Pharmacy . Or use a cosmeceuticals company that will provide you quality products at wholesale prices. Many of them don’t require you to stock the product. SkinMedica and SkinCeuticals ( are popular ones, but there are several more. As opposed to your patient going to the local pharmacy and guessing at which product is best, you can provide a full line of products that will give the best results.
Without compromising care, you can provide complete skin care to your patients and increase your revenue and your patient’s satisfaction.
Dr. Pearce is a pediatrician in Frankfort, Ill. Dr. Pearce had no relevant financial disclosures. E-mail her at pdnews@frontlinemedcom.com.

Cigarette smoking rates among U.S. adults hit all-time low
The rate of cigarette smoking among adults in the United States dropped from 20.9% in 2005 to 17.8% in 2013, the lowest it has been since the Centers for Disease Control and Prevention began recording such data in 1965.
The numbers come from the Nov. 28 issue of the CDC’s Morbidity and Mortality Weekly Report (MMWR 2014;63:1108-12), which also states that the percentage of daily smokers who went through 20-29 cigarettes per day dropped from 34.9% in 2005 to 29.3% in 2013. Conversely, the rate of daily smokers who consumed 10 or fewer cigarettes per day increased from 16.4% in 2005 to 23.3% in 2013.

“Though smokers are smoking fewer cigarettes, cutting back by a few cigarettes a day rather than quitting completely does not produce significant health benefits,” Brian King, Ph.D., a senior scientific advisor with the CDC’s Office on Smoking and Health, said in a statement. “Smokers who quit before they’re 40 years old can get back almost all of the 10 years of life expectancy smoking takes away.”
Despite the strides in cutting down overall smoking among American adults, certain demographics continue to struggle. A total of 42.1 million adults remained smokers in 2013. Smoking rates remain especially high among males, younger individuals, those who are multiracial or American Indian/Alaska Native, have less education, live below the federal poverty level, live in the South or Midwest, have a disability or other limitation, and those who are lesbian, gay, or bisexual.
“There is encouraging news in this study, but we still have much more work to do to help people quit,” Dr. Tim McAfee, director of the CDC’s Office on Smoking and Health, noted in the statement. “We can bring down cigarette smoking rates much further, much faster, if strategies proven to work are put in place like funding tobacco control programs at the CDC-recommended levels, increasing prices of tobacco products, implementing and enforcing comprehensive smoke-free laws, and sustaining hard-hitting media campaigns.”
According to the CDC, cigarette smoking is the leading preventable cause of disease and death in the United States, claiming over 480,000 lives annually. Its impact can also be felt economically, with cigarette smoking costing the United States at least $133 billion in direct medical care for adults and more than $156 billion in lost productivity. Meanwhile, the rates of other forms of tobacco consumption, such as cigars and hookahs, are not declining.
Surveys cited by the CDC estimate that 70% of smokers want to quit.
The rate of cigarette smoking among adults in the United States dropped from 20.9% in 2005 to 17.8% in 2013, the lowest it has been since the Centers for Disease Control and Prevention began recording such data in 1965.
The numbers come from the Nov. 28 issue of the CDC’s Morbidity and Mortality Weekly Report (MMWR 2014;63:1108-12), which also states that the percentage of daily smokers who went through 20-29 cigarettes per day dropped from 34.9% in 2005 to 29.3% in 2013. Conversely, the rate of daily smokers who consumed 10 or fewer cigarettes per day increased from 16.4% in 2005 to 23.3% in 2013.
“Though smokers are smoking fewer cigarettes, cutting back by a few cigarettes a day rather than quitting completely does not produce significant health benefits,” Brian King, Ph.D., a senior scientific advisor with the CDC’s Office on Smoking and Health, said in a statement. “Smokers who quit before they’re 40 years old can get back almost all of the 10 years of life expectancy smoking takes away.”
Despite the strides in cutting down overall smoking among American adults, certain demographics continue to struggle. A total of 42.1 million adults remained smokers in 2013. Smoking rates remain especially high among males, younger individuals, those who are multiracial or American Indian/Alaska Native, have less education, live below the federal poverty level, live in the South or Midwest, have a disability or other limitation, and those who are lesbian, gay, or bisexual.
“There is encouraging news in this study, but we still have much more work to do to help people quit,” Dr. Tim McAfee, director of the CDC’s Office on Smoking and Health, noted in the statement. “We can bring down cigarette smoking rates much further, much faster, if strategies proven to work are put in place like funding tobacco control programs at the CDC-recommended levels, increasing prices of tobacco products, implementing and enforcing comprehensive smoke-free laws, and sustaining hard-hitting media campaigns.”
According to the CDC, cigarette smoking is the leading preventable cause of disease and death in the United States, claiming over 480,000 lives annually. Its impact can also be felt economically, with cigarette smoking costing the United States at least $133 billion in direct medical care for adults and more than $156 billion in lost productivity. Meanwhile, the rates of other forms of tobacco consumption, such as cigars and hookahs, are not declining.
Surveys cited by the CDC estimate that 70% of smokers want to quit.
The rate of cigarette smoking among adults in the United States dropped from 20.9% in 2005 to 17.8% in 2013, the lowest it has been since the Centers for Disease Control and Prevention began recording such data in 1965.
The numbers come from the Nov. 28 issue of the CDC’s Morbidity and Mortality Weekly Report (MMWR 2014;63:1108-12), which also states that the percentage of daily smokers who went through 20-29 cigarettes per day dropped from 34.9% in 2005 to 29.3% in 2013. Conversely, the rate of daily smokers who consumed 10 or fewer cigarettes per day increased from 16.4% in 2005 to 23.3% in 2013.
“Though smokers are smoking fewer cigarettes, cutting back by a few cigarettes a day rather than quitting completely does not produce significant health benefits,” Brian King, Ph.D., a senior scientific advisor with the CDC’s Office on Smoking and Health, said in a statement. “Smokers who quit before they’re 40 years old can get back almost all of the 10 years of life expectancy smoking takes away.”
Despite the strides in cutting down overall smoking among American adults, certain demographics continue to struggle. A total of 42.1 million adults remained smokers in 2013. Smoking rates remain especially high among males, younger individuals, those who are multiracial or American Indian/Alaska Native, have less education, live below the federal poverty level, live in the South or Midwest, have a disability or other limitation, and those who are lesbian, gay, or bisexual.
“There is encouraging news in this study, but we still have much more work to do to help people quit,” Dr. Tim McAfee, director of the CDC’s Office on Smoking and Health, noted in the statement. “We can bring down cigarette smoking rates much further, much faster, if strategies proven to work are put in place like funding tobacco control programs at the CDC-recommended levels, increasing prices of tobacco products, implementing and enforcing comprehensive smoke-free laws, and sustaining hard-hitting media campaigns.”
According to the CDC, cigarette smoking is the leading preventable cause of disease and death in the United States, claiming over 480,000 lives annually. Its impact can also be felt economically, with cigarette smoking costing the United States at least $133 billion in direct medical care for adults and more than $156 billion in lost productivity. Meanwhile, the rates of other forms of tobacco consumption, such as cigars and hookahs, are not declining.
Surveys cited by the CDC estimate that 70% of smokers want to quit.
FROM MMWR

Child Psychiatry Consult: Evidence-based therapies
Introduction
Parents sometimes come to clinicians with concerns about their children’s moods and behaviors, hoping for a rapid fix of the problem. Most child psychiatric issues can’t be fixed with just medication and respond better with psychotherapy or a combination of psychotherapy and medication. In the past 30 years, tremendous strides have been made in studying the effectiveness of psychotherapeutic interventions among youth.
Case Summary
Katy is a 10-year-old girl who gets into arguments with her mother every day after school because she wants to walk to her grandmother’s house not far away. She was exposed to severe domestic violence by her father against her mother when she was 5 years old, and she has nightmares that cause her to wake up often at night, a fear of men, and rapid mood shifts into sudden rage as well as oppositional behavior with her mother. Her mother also has significant fears and views the world as a very unsafe place. She is worried that Katy has bipolar disorder because of her daughter’s rapid mood changes.
Discussion
While Katy has angry outbursts at times, she does not present with clear-cut episodes of elevated mood along with other symptoms of bipolar disorder, particularly grandiosity. Instead her presentation raises the possibility of post-traumatic stress disorder (PTSD) with nightmares, a fear of men who likely trigger past memories, and sudden mood shifts. Her mother also may have some elements of PTSD, which may be complicating Katy’s presentation. No medication interventions so far have demonstrated significant benefit in youth with PTSD. If further evaluation confirms PTSD, what sort of therapy should be sought for Katy?
A large number of websites now list evidence-based treatments, although many of those require that the creators of the treatment apply for inclusion, and do not address the issue of varying levels of evidence. The American Psychological Association has a website entitled Effective Child Therapy, which discusses psychotherapeutic interventions for various diagnostic areas in youth and the varying levels of evidence for such treatments based on the types and numbers of studies that support them. The website also has an excellent video resource library.
Trauma-focused cognitive-behavioral therapy has numerous studies supporting its efficacy for a wide range of traumas and includes work with both the parent and the child to address the ways the trauma can affect their interaction. This would be an excellent choice for Katy and her mother. Other therapies that have supporting research include child-parent psychotherapy, eye movement desensitization and reprocessing therapy, resilient peer treatment, child-centered therapy, and family therapy for PTSD. Treatments have usually been designed for specific ages, so it is important to consider whether the intervention fits the age of the child.
The extent to which evidence-based treatments are available in the community is variable. However, pediatricians can play a significant role in the availability of these interventions by being aware of which ones are most strongly supported, asking the therapists to whom they refer what their experience is with such interventions, and encouraging training in their offices and communities. Therapists should be comfortable describing exactly how much training they have had in a certain area, for instance, extensive training through their professional education or one or several postgraduate trainings, preferably with follow-up consultation with an experienced practitioner while they are seeing their first cases with a particular intervention.
There is controversy about evidence-based treatment among some psychotherapists who argue that the strict requirements of the research setting make the results inapplicable to the complexity of patients seen in typical clinical settings. In fact, many of the treatments, including trauma-focused cognitive-behavioral therapy, work very well in complex families. Certainly there is much more to learn about how to help patients who don’t respond to certain types of therapy or how to engage families who are reluctant to participate in treatment, but the treatments that we know work are clearly what we should choose first.
Dr. Hall is an assistant professor of psychiatry and pediatrics at the University of Vermont, Burlington. Dr. Hall said she had no relevant financial disclosures. To comment, e-mail her at pdnews@frontlinemedcom.com.
Introduction
Parents sometimes come to clinicians with concerns about their children’s moods and behaviors, hoping for a rapid fix of the problem. Most child psychiatric issues can’t be fixed with just medication and respond better with psychotherapy or a combination of psychotherapy and medication. In the past 30 years, tremendous strides have been made in studying the effectiveness of psychotherapeutic interventions among youth.
Case Summary
Katy is a 10-year-old girl who gets into arguments with her mother every day after school because she wants to walk to her grandmother’s house not far away. She was exposed to severe domestic violence by her father against her mother when she was 5 years old, and she has nightmares that cause her to wake up often at night, a fear of men, and rapid mood shifts into sudden rage as well as oppositional behavior with her mother. Her mother also has significant fears and views the world as a very unsafe place. She is worried that Katy has bipolar disorder because of her daughter’s rapid mood changes.
Discussion
While Katy has angry outbursts at times, she does not present with clear-cut episodes of elevated mood along with other symptoms of bipolar disorder, particularly grandiosity. Instead her presentation raises the possibility of post-traumatic stress disorder (PTSD) with nightmares, a fear of men who likely trigger past memories, and sudden mood shifts. Her mother also may have some elements of PTSD, which may be complicating Katy’s presentation. No medication interventions so far have demonstrated significant benefit in youth with PTSD. If further evaluation confirms PTSD, what sort of therapy should be sought for Katy?
A large number of websites now list evidence-based treatments, although many of those require that the creators of the treatment apply for inclusion, and do not address the issue of varying levels of evidence. The American Psychological Association has a website entitled Effective Child Therapy, which discusses psychotherapeutic interventions for various diagnostic areas in youth and the varying levels of evidence for such treatments based on the types and numbers of studies that support them. The website also has an excellent video resource library.
Trauma-focused cognitive-behavioral therapy has numerous studies supporting its efficacy for a wide range of traumas and includes work with both the parent and the child to address the ways the trauma can affect their interaction. This would be an excellent choice for Katy and her mother. Other therapies that have supporting research include child-parent psychotherapy, eye movement desensitization and reprocessing therapy, resilient peer treatment, child-centered therapy, and family therapy for PTSD. Treatments have usually been designed for specific ages, so it is important to consider whether the intervention fits the age of the child.
The extent to which evidence-based treatments are available in the community is variable. However, pediatricians can play a significant role in the availability of these interventions by being aware of which ones are most strongly supported, asking the therapists to whom they refer what their experience is with such interventions, and encouraging training in their offices and communities. Therapists should be comfortable describing exactly how much training they have had in a certain area, for instance, extensive training through their professional education or one or several postgraduate trainings, preferably with follow-up consultation with an experienced practitioner while they are seeing their first cases with a particular intervention.
There is controversy about evidence-based treatment among some psychotherapists who argue that the strict requirements of the research setting make the results inapplicable to the complexity of patients seen in typical clinical settings. In fact, many of the treatments, including trauma-focused cognitive-behavioral therapy, work very well in complex families. Certainly there is much more to learn about how to help patients who don’t respond to certain types of therapy or how to engage families who are reluctant to participate in treatment, but the treatments that we know work are clearly what we should choose first.
Dr. Hall is an assistant professor of psychiatry and pediatrics at the University of Vermont, Burlington. Dr. Hall said she had no relevant financial disclosures. To comment, e-mail her at pdnews@frontlinemedcom.com.
Introduction
Parents sometimes come to clinicians with concerns about their children’s moods and behaviors, hoping for a rapid fix of the problem. Most child psychiatric issues can’t be fixed with just medication and respond better with psychotherapy or a combination of psychotherapy and medication. In the past 30 years, tremendous strides have been made in studying the effectiveness of psychotherapeutic interventions among youth.
Case Summary
Katy is a 10-year-old girl who gets into arguments with her mother every day after school because she wants to walk to her grandmother’s house not far away. She was exposed to severe domestic violence by her father against her mother when she was 5 years old, and she has nightmares that cause her to wake up often at night, a fear of men, and rapid mood shifts into sudden rage as well as oppositional behavior with her mother. Her mother also has significant fears and views the world as a very unsafe place. She is worried that Katy has bipolar disorder because of her daughter’s rapid mood changes.
Discussion
While Katy has angry outbursts at times, she does not present with clear-cut episodes of elevated mood along with other symptoms of bipolar disorder, particularly grandiosity. Instead her presentation raises the possibility of post-traumatic stress disorder (PTSD) with nightmares, a fear of men who likely trigger past memories, and sudden mood shifts. Her mother also may have some elements of PTSD, which may be complicating Katy’s presentation. No medication interventions so far have demonstrated significant benefit in youth with PTSD. If further evaluation confirms PTSD, what sort of therapy should be sought for Katy?
A large number of websites now list evidence-based treatments, although many of those require that the creators of the treatment apply for inclusion, and do not address the issue of varying levels of evidence. The American Psychological Association has a website entitled Effective Child Therapy, which discusses psychotherapeutic interventions for various diagnostic areas in youth and the varying levels of evidence for such treatments based on the types and numbers of studies that support them. The website also has an excellent video resource library.
Trauma-focused cognitive-behavioral therapy has numerous studies supporting its efficacy for a wide range of traumas and includes work with both the parent and the child to address the ways the trauma can affect their interaction. This would be an excellent choice for Katy and her mother. Other therapies that have supporting research include child-parent psychotherapy, eye movement desensitization and reprocessing therapy, resilient peer treatment, child-centered therapy, and family therapy for PTSD. Treatments have usually been designed for specific ages, so it is important to consider whether the intervention fits the age of the child.
The extent to which evidence-based treatments are available in the community is variable. However, pediatricians can play a significant role in the availability of these interventions by being aware of which ones are most strongly supported, asking the therapists to whom they refer what their experience is with such interventions, and encouraging training in their offices and communities. Therapists should be comfortable describing exactly how much training they have had in a certain area, for instance, extensive training through their professional education or one or several postgraduate trainings, preferably with follow-up consultation with an experienced practitioner while they are seeing their first cases with a particular intervention.
There is controversy about evidence-based treatment among some psychotherapists who argue that the strict requirements of the research setting make the results inapplicable to the complexity of patients seen in typical clinical settings. In fact, many of the treatments, including trauma-focused cognitive-behavioral therapy, work very well in complex families. Certainly there is much more to learn about how to help patients who don’t respond to certain types of therapy or how to engage families who are reluctant to participate in treatment, but the treatments that we know work are clearly what we should choose first.
Dr. Hall is an assistant professor of psychiatry and pediatrics at the University of Vermont, Burlington. Dr. Hall said she had no relevant financial disclosures. To comment, e-mail her at pdnews@frontlinemedcom.com.
Language development is the canary in the coal mine
The development of language in children is like the canary in the coal mine – problems of genetics, medical conditions, and environment all can cause it to go awry. Whatever the cause, it is very important to make sure a child with a problem in this area gets prompt assistance, because how speech and language progress also affects many aspects of the child’s success in life and what it is like to parent them.
Some of the factors known to put a child at risk for delays or deviations in speech and language development include prematurity and low birth weight; genetic conditions such as Down syndrome; physical problems such as cerebral palsy or seizure disorders; hearing impairment; and, as usual, being a boy. The most common reason for delayed language is general delay or intellectual disability. A family history of speech and language disorders also adds to the risk, and one single gene defect has even been found for a few of these. Eight percent of young children have been estimated to have a delay in speech or language. The vast majority of them have no specific risk factors.
The “language environment” of the home is critical to language learning. Compared with high-income families, parents on welfare say one-third as many words to their children and working-class parents say one-half as many in the first 3 years. Because over 85% of a child’s words at age 3 years come from words heard from their parents, this is estimated to create a 30-million-word difference between children of high- versus low-income families by age 4 years! In addition, low-income parents provide two discouragements for each one encouragement, in contrast to one correction to six encouragements in high-income homes, with the additional psychological implications.
These sad facts contributed to the creation of the Reach Out and Read program, which I hope you have joined. A free book from the doctor at every checkup visit, some modeling of how to read to the child, and information about the importance of talking with the child are things you can do to emphasize the importance of language stimulation to development and academic success.
Most parents are very motivated by the promise of better school success from better language, but it can seem far away when the child is only 1 year old! A more immediate motivator is the threat of more temper tantrums and noncompliance in children with delayed language. Almost all children with language problems understand more than they can express. When the gap between understanding and speaking is greater, so is the child’s frustration. While a large percentage of children with expressive language problems will “outgrow” them, the pattern of angry reactivity and difficult parent child interactions may continue. This is a good reason to discuss promoting language but to also suggest Baby Signs (www.babysignstoo.com) starting in the first year, especially if communication frustration starts to emerge.
School is where the big impact from language impairments appears. And it is not just the significant association between early language disorders and persistent reading disability and even written language disability that you should worry about and monitor. Children with speech and language disorders, even simply dysarticulation, can be teased, bullied, and rejected socially. As a result, children with speech and language deficits experience lower self-esteem, greater discouragement, and sometimes reactive aggression. In addition to identifying these problems and getting treatment for the issues of language, learning, and socio-emotional adjustment, it is important to find nonverbal strengths in the child such as sports or music to give them a social group where they can find success.
Language problems in older children may be subtle and not noticed or complained about by their parents, who may have the same weakness. Even teachers may not connect the student’s poor academic performance to language difficulties because they seem to have “the basics.” If you notice a schoolaged child unable to understand or answer your questions with some sentence complexity, it is important to refer to a speech pathologist for assessment. Although there should be free evaluation and treatment services at the school, the speech pathologist may not be expert at assessing more complex language disorders. In addition, the child’s difficulties may not measure up as “impairing enough” to receive those services, and private services may be needed.
But if you do not feel like a child language expert, you are not alone! Not only were you lucky if you heard one lecture on language development during training, but the younger the child, the less language you are likely to hear from him or her during brief health supervision visits. The parent is probably dominating the conversation (if you are a good listener) trying to have their agenda addressed, and the child is either excited or terrified by your office environment.
The broadband developmental screening now recommended by the American Academy of Pediatrics for all children at 9, 18, and 30 months includes language milestones or parental concern, but these have not been shown to have adequate sensitivity or specificity and will miss many affected children.
Many young children with language disorders are now or will later be on the autism spectrum. The recommended autism-specific screens at 18 and 24-30 months will detect many, but not all, of these children. It is important to realize that the most common reason for a false positive autism screen is language delay, and it deserves follow-up and treatment even though not representing autism.
What should you do given these gaps between need, tools, and knowledge? Of course, collect the general and autism screens as recommended, but also use them when you or the parent have a concern. For children under 2 years, the parent’s report is generally accurate, as expected language is fairly simple. Infants should have different cries and reactions to caregivers in the first 3 months; babble and laugh by 6 months; and imitate sounds as well as recognize a few words by 1 year. While infants typically have 1-2 words by 12 months and two-word combinations by 18 months, as a cutoff they should show 1-2 words by 18 months and either 50 words or 2 words together by 24 months. Listening to a child’s spontaneous language is the best gauge of articulation. By age 2 years, we – a stranger to the child – can only expect to understand about 25% of what they say, but by 3 years it should be 66%, and by age 4 years almost 100%.
Gestures are an important aspect of communication. Use of gestures such as raising arms to be picked up or waving bye-bye by 1 year are typical. Between 1 and 2 years, children should follow your pointing and share their interests by pointing in addition to indicating named pictures and body parts. Deficits in use of gestures should spur a language evaluation and also are part of diagnosing autism, a much more serious and specific condition defined by communication deficits. Most autism screening tools include tapping gestures as well as spoken language.
After 2 years, language assessment has to include more elements than many parents can report easily or you can observe. There is now no formal additional language screening recommendation beyond surveillance, and the general developmental and autism screens. Every state has free child development services that can assess and provide intervention for children 0-3 years if you or the parent has concerns. But you may want to do more to either reassure or clarify the need for and type of referral by using a language-specific tool. The most accurate and practical tools applicable to children 8-35 months are the MacArthur-Bates Communicative Development Inventories (CDI) and the Language Development Survey (LDS), both parent completed. The LDS assesses based on a list of vocabulary words and examples of phrases, and the CDI has three different forms using vocabulary, gestures, and sentences.
After age 3 years, language is so complex that direct testing of the child is needed. A draft report from the U.S. Preventive Services Task Force in November 2014 presents a review of all available measures.
The good news is that a variety of approaches to therapy for speech and language disorders in young children are effective in reducing impairment. The most effective ones involve the parents in learning what communication skills to observe, stimulate, and reinforce, and have an adequate number of total hours of intervention spread over several months.
As for all children and youth with special health care needs, we have the responsibility to detect, monitor, refer, track, and support families of children with speech and language disorders to assure their best outcomes. Whatever the cause, improving the communication abilities of the child can make a big difference to many aspects of their lives.
Dr. Howard is an assistant professor of pediatrics at the Johns Hopkins University School of Medicine, Baltimore, and creator of CHADIS (www.CHADIS.com). She has no other relevant disclosures. Dr. Howard’s contribution to this publication was as a paid expert to Frontline. E-mail her at pdnews@frontlinemedcom.com.
The development of language in children is like the canary in the coal mine – problems of genetics, medical conditions, and environment all can cause it to go awry. Whatever the cause, it is very important to make sure a child with a problem in this area gets prompt assistance, because how speech and language progress also affects many aspects of the child’s success in life and what it is like to parent them.
Some of the factors known to put a child at risk for delays or deviations in speech and language development include prematurity and low birth weight; genetic conditions such as Down syndrome; physical problems such as cerebral palsy or seizure disorders; hearing impairment; and, as usual, being a boy. The most common reason for delayed language is general delay or intellectual disability. A family history of speech and language disorders also adds to the risk, and one single gene defect has even been found for a few of these. Eight percent of young children have been estimated to have a delay in speech or language. The vast majority of them have no specific risk factors.
The “language environment” of the home is critical to language learning. Compared with high-income families, parents on welfare say one-third as many words to their children and working-class parents say one-half as many in the first 3 years. Because over 85% of a child’s words at age 3 years come from words heard from their parents, this is estimated to create a 30-million-word difference between children of high- versus low-income families by age 4 years! In addition, low-income parents provide two discouragements for each one encouragement, in contrast to one correction to six encouragements in high-income homes, with the additional psychological implications.
These sad facts contributed to the creation of the Reach Out and Read program, which I hope you have joined. A free book from the doctor at every checkup visit, some modeling of how to read to the child, and information about the importance of talking with the child are things you can do to emphasize the importance of language stimulation to development and academic success.
Most parents are very motivated by the promise of better school success from better language, but it can seem far away when the child is only 1 year old! A more immediate motivator is the threat of more temper tantrums and noncompliance in children with delayed language. Almost all children with language problems understand more than they can express. When the gap between understanding and speaking is greater, so is the child’s frustration. While a large percentage of children with expressive language problems will “outgrow” them, the pattern of angry reactivity and difficult parent child interactions may continue. This is a good reason to discuss promoting language but to also suggest Baby Signs (www.babysignstoo.com) starting in the first year, especially if communication frustration starts to emerge.
School is where the big impact from language impairments appears. And it is not just the significant association between early language disorders and persistent reading disability and even written language disability that you should worry about and monitor. Children with speech and language disorders, even simply dysarticulation, can be teased, bullied, and rejected socially. As a result, children with speech and language deficits experience lower self-esteem, greater discouragement, and sometimes reactive aggression. In addition to identifying these problems and getting treatment for the issues of language, learning, and socio-emotional adjustment, it is important to find nonverbal strengths in the child such as sports or music to give them a social group where they can find success.
Language problems in older children may be subtle and not noticed or complained about by their parents, who may have the same weakness. Even teachers may not connect the student’s poor academic performance to language difficulties because they seem to have “the basics.” If you notice a schoolaged child unable to understand or answer your questions with some sentence complexity, it is important to refer to a speech pathologist for assessment. Although there should be free evaluation and treatment services at the school, the speech pathologist may not be expert at assessing more complex language disorders. In addition, the child’s difficulties may not measure up as “impairing enough” to receive those services, and private services may be needed.
But if you do not feel like a child language expert, you are not alone! Not only were you lucky if you heard one lecture on language development during training, but the younger the child, the less language you are likely to hear from him or her during brief health supervision visits. The parent is probably dominating the conversation (if you are a good listener) trying to have their agenda addressed, and the child is either excited or terrified by your office environment.
The broadband developmental screening now recommended by the American Academy of Pediatrics for all children at 9, 18, and 30 months includes language milestones or parental concern, but these have not been shown to have adequate sensitivity or specificity and will miss many affected children.
Many young children with language disorders are now or will later be on the autism spectrum. The recommended autism-specific screens at 18 and 24-30 months will detect many, but not all, of these children. It is important to realize that the most common reason for a false positive autism screen is language delay, and it deserves follow-up and treatment even though not representing autism.
What should you do given these gaps between need, tools, and knowledge? Of course, collect the general and autism screens as recommended, but also use them when you or the parent have a concern. For children under 2 years, the parent’s report is generally accurate, as expected language is fairly simple. Infants should have different cries and reactions to caregivers in the first 3 months; babble and laugh by 6 months; and imitate sounds as well as recognize a few words by 1 year. While infants typically have 1-2 words by 12 months and two-word combinations by 18 months, as a cutoff they should show 1-2 words by 18 months and either 50 words or 2 words together by 24 months. Listening to a child’s spontaneous language is the best gauge of articulation. By age 2 years, we – a stranger to the child – can only expect to understand about 25% of what they say, but by 3 years it should be 66%, and by age 4 years almost 100%.
Gestures are an important aspect of communication. Use of gestures such as raising arms to be picked up or waving bye-bye by 1 year are typical. Between 1 and 2 years, children should follow your pointing and share their interests by pointing in addition to indicating named pictures and body parts. Deficits in use of gestures should spur a language evaluation and also are part of diagnosing autism, a much more serious and specific condition defined by communication deficits. Most autism screening tools include tapping gestures as well as spoken language.
After 2 years, language assessment has to include more elements than many parents can report easily or you can observe. There is now no formal additional language screening recommendation beyond surveillance, and the general developmental and autism screens. Every state has free child development services that can assess and provide intervention for children 0-3 years if you or the parent has concerns. But you may want to do more to either reassure or clarify the need for and type of referral by using a language-specific tool. The most accurate and practical tools applicable to children 8-35 months are the MacArthur-Bates Communicative Development Inventories (CDI) and the Language Development Survey (LDS), both parent completed. The LDS assesses based on a list of vocabulary words and examples of phrases, and the CDI has three different forms using vocabulary, gestures, and sentences.
After age 3 years, language is so complex that direct testing of the child is needed. A draft report from the U.S. Preventive Services Task Force in November 2014 presents a review of all available measures.
The good news is that a variety of approaches to therapy for speech and language disorders in young children are effective in reducing impairment. The most effective ones involve the parents in learning what communication skills to observe, stimulate, and reinforce, and have an adequate number of total hours of intervention spread over several months.
As for all children and youth with special health care needs, we have the responsibility to detect, monitor, refer, track, and support families of children with speech and language disorders to assure their best outcomes. Whatever the cause, improving the communication abilities of the child can make a big difference to many aspects of their lives.
Dr. Howard is an assistant professor of pediatrics at the Johns Hopkins University School of Medicine, Baltimore, and creator of CHADIS (www.CHADIS.com). She has no other relevant disclosures. Dr. Howard’s contribution to this publication was as a paid expert to Frontline. E-mail her at pdnews@frontlinemedcom.com.
The development of language in children is like the canary in the coal mine – problems of genetics, medical conditions, and environment all can cause it to go awry. Whatever the cause, it is very important to make sure a child with a problem in this area gets prompt assistance, because how speech and language progress also affects many aspects of the child’s success in life and what it is like to parent them.
Some of the factors known to put a child at risk for delays or deviations in speech and language development include prematurity and low birth weight; genetic conditions such as Down syndrome; physical problems such as cerebral palsy or seizure disorders; hearing impairment; and, as usual, being a boy. The most common reason for delayed language is general delay or intellectual disability. A family history of speech and language disorders also adds to the risk, and one single gene defect has even been found for a few of these. Eight percent of young children have been estimated to have a delay in speech or language. The vast majority of them have no specific risk factors.
The “language environment” of the home is critical to language learning. Compared with high-income families, parents on welfare say one-third as many words to their children and working-class parents say one-half as many in the first 3 years. Because over 85% of a child’s words at age 3 years come from words heard from their parents, this is estimated to create a 30-million-word difference between children of high- versus low-income families by age 4 years! In addition, low-income parents provide two discouragements for each one encouragement, in contrast to one correction to six encouragements in high-income homes, with the additional psychological implications.
These sad facts contributed to the creation of the Reach Out and Read program, which I hope you have joined. A free book from the doctor at every checkup visit, some modeling of how to read to the child, and information about the importance of talking with the child are things you can do to emphasize the importance of language stimulation to development and academic success.
Most parents are very motivated by the promise of better school success from better language, but it can seem far away when the child is only 1 year old! A more immediate motivator is the threat of more temper tantrums and noncompliance in children with delayed language. Almost all children with language problems understand more than they can express. When the gap between understanding and speaking is greater, so is the child’s frustration. While a large percentage of children with expressive language problems will “outgrow” them, the pattern of angry reactivity and difficult parent child interactions may continue. This is a good reason to discuss promoting language but to also suggest Baby Signs (www.babysignstoo.com) starting in the first year, especially if communication frustration starts to emerge.
School is where the big impact from language impairments appears. And it is not just the significant association between early language disorders and persistent reading disability and even written language disability that you should worry about and monitor. Children with speech and language disorders, even simply dysarticulation, can be teased, bullied, and rejected socially. As a result, children with speech and language deficits experience lower self-esteem, greater discouragement, and sometimes reactive aggression. In addition to identifying these problems and getting treatment for the issues of language, learning, and socio-emotional adjustment, it is important to find nonverbal strengths in the child such as sports or music to give them a social group where they can find success.
Language problems in older children may be subtle and not noticed or complained about by their parents, who may have the same weakness. Even teachers may not connect the student’s poor academic performance to language difficulties because they seem to have “the basics.” If you notice a schoolaged child unable to understand or answer your questions with some sentence complexity, it is important to refer to a speech pathologist for assessment. Although there should be free evaluation and treatment services at the school, the speech pathologist may not be expert at assessing more complex language disorders. In addition, the child’s difficulties may not measure up as “impairing enough” to receive those services, and private services may be needed.
But if you do not feel like a child language expert, you are not alone! Not only were you lucky if you heard one lecture on language development during training, but the younger the child, the less language you are likely to hear from him or her during brief health supervision visits. The parent is probably dominating the conversation (if you are a good listener) trying to have their agenda addressed, and the child is either excited or terrified by your office environment.
The broadband developmental screening now recommended by the American Academy of Pediatrics for all children at 9, 18, and 30 months includes language milestones or parental concern, but these have not been shown to have adequate sensitivity or specificity and will miss many affected children.
Many young children with language disorders are now or will later be on the autism spectrum. The recommended autism-specific screens at 18 and 24-30 months will detect many, but not all, of these children. It is important to realize that the most common reason for a false positive autism screen is language delay, and it deserves follow-up and treatment even though not representing autism.
What should you do given these gaps between need, tools, and knowledge? Of course, collect the general and autism screens as recommended, but also use them when you or the parent have a concern. For children under 2 years, the parent’s report is generally accurate, as expected language is fairly simple. Infants should have different cries and reactions to caregivers in the first 3 months; babble and laugh by 6 months; and imitate sounds as well as recognize a few words by 1 year. While infants typically have 1-2 words by 12 months and two-word combinations by 18 months, as a cutoff they should show 1-2 words by 18 months and either 50 words or 2 words together by 24 months. Listening to a child’s spontaneous language is the best gauge of articulation. By age 2 years, we – a stranger to the child – can only expect to understand about 25% of what they say, but by 3 years it should be 66%, and by age 4 years almost 100%.
Gestures are an important aspect of communication. Use of gestures such as raising arms to be picked up or waving bye-bye by 1 year are typical. Between 1 and 2 years, children should follow your pointing and share their interests by pointing in addition to indicating named pictures and body parts. Deficits in use of gestures should spur a language evaluation and also are part of diagnosing autism, a much more serious and specific condition defined by communication deficits. Most autism screening tools include tapping gestures as well as spoken language.
After 2 years, language assessment has to include more elements than many parents can report easily or you can observe. There is now no formal additional language screening recommendation beyond surveillance, and the general developmental and autism screens. Every state has free child development services that can assess and provide intervention for children 0-3 years if you or the parent has concerns. But you may want to do more to either reassure or clarify the need for and type of referral by using a language-specific tool. The most accurate and practical tools applicable to children 8-35 months are the MacArthur-Bates Communicative Development Inventories (CDI) and the Language Development Survey (LDS), both parent completed. The LDS assesses based on a list of vocabulary words and examples of phrases, and the CDI has three different forms using vocabulary, gestures, and sentences.
After age 3 years, language is so complex that direct testing of the child is needed. A draft report from the U.S. Preventive Services Task Force in November 2014 presents a review of all available measures.
The good news is that a variety of approaches to therapy for speech and language disorders in young children are effective in reducing impairment. The most effective ones involve the parents in learning what communication skills to observe, stimulate, and reinforce, and have an adequate number of total hours of intervention spread over several months.
As for all children and youth with special health care needs, we have the responsibility to detect, monitor, refer, track, and support families of children with speech and language disorders to assure their best outcomes. Whatever the cause, improving the communication abilities of the child can make a big difference to many aspects of their lives.
Dr. Howard is an assistant professor of pediatrics at the Johns Hopkins University School of Medicine, Baltimore, and creator of CHADIS (www.CHADIS.com). She has no other relevant disclosures. Dr. Howard’s contribution to this publication was as a paid expert to Frontline. E-mail her at pdnews@frontlinemedcom.com.
Leukemia survival rates vary widely across the globe

Credit: Bill Branson
A large, international study has revealed sizable differences in cancer survival rates between countries.
In particular, investigators observed a wide gap in survival for children with acute lymphoblastic leukemia (ALL).
The most recent 5-year survival rate was less than 60% in several countries—and as low as 16% in one nation—but more than 90% in other countries.
This indicates major deficiencies in managing this largely curable disease, according to researchers.
Results from this study, known as CONCORD-2, appear in The Lancet alongside a linked comment article.
Claudia Allemani, PhD, of the London School of Hygiene & Tropical Medicine in the UK, and her colleagues analyzed individual patient data from 279 cancer registries in 67 countries.
The team reported 5-year survival estimates for 25.7 million cancer patients diagnosed with 1 of 10 common cancers—stomach, colon, rectum, liver, lung, breast (women), cervix, ovary, prostate, and leukemia (n=873,588)—from 1995 through 2009.
The investigators also reported survival estimates for 74,343 children diagnosed with ALL during that period.
Even after they adjusted for differences between countries and regions in the risk of death from other causes by age, sex, and race, and over time, the researchers found very large variations between countries in survival for specific cancers.
Adult leukemia
For adults diagnosed with leukemia from 2005 through 2009, the 5-year net survival was 50% to 60% in 21 countries in North America, west Asia, Europe, and Oceania. Survival rates were generally much lower in the 15 participating Asian countries than in other parts of the world.
Survival rates tended to be low in east Asia—ranging from 19% in Japan to 23% in South Korea and Taiwan—but higher in west Asia—ranging from 33% in Turkey to 53% in Qatar. And results were mixed in other Asian countries—ranging from 7% in Jordan to 40% in Indonesia.
ALL in children
For children diagnosed with ALL from 2005 through 2009, 5-year survival was 90% or higher in Austria, Belgium, Canada, Germany, and Norway. It was 80% to 89% in 21 countries on various continents.
However, 5-year survival was lower than 60% in several countries and the lowest—16%—in Jordan.
The range of survival estimates for childhood ALL in Central/South America and Asia was much lower than the range in North America, Europe, and Oceania.
Solid tumor malignancies
The study also showed that liver and lung cancer have the worst prognosis among the 10 cancers examined, with 5-year survival of less than 20% in both developed and developing countries. The researchers said this suggests most patients still visit their doctors too late for treatment to be effective.
Five-year survival from breast and colorectal cancers increased in most developed countries and in South America (Brazil, Colombia, and Ecuador) from the beginning of the study period to the end. These trends likely reflect earlier diagnosis and the availability of better treatment options, according to the investigators.
Stomach cancer survival was higher in Southeast Asia than in other regions. This is likely a result of intensive diagnostic activity, early stage at diagnosis, and radical surgery, the researchers said. And this suggests important lessons could be learned from these countries about diagnosis and treatment.
Cervical and ovarian cancers showed particularly wide differences in survival, and overall improvements during the study period were slight.
“Our findings show that, in some countries, cancer is far more lethal than in others,” Dr Allemani said. “In the 21st century, there should not be such a dramatic gulf in survival. The majority of the variability in survival is probably due to factors that can be changed, such as the availability and quality of diagnostic and treatment services.”
“The findings can be used to evaluate the extent to which investment in healthcare systems is improving their effectiveness. We expect them to act as a stimulus for politicians to improve health policy and invest in healthcare.” 
Credit: Bill Branson
A large, international study has revealed sizable differences in cancer survival rates between countries.
In particular, investigators observed a wide gap in survival for children with acute lymphoblastic leukemia (ALL).
The most recent 5-year survival rate was less than 60% in several countries—and as low as 16% in one nation—but more than 90% in other countries.
This indicates major deficiencies in managing this largely curable disease, according to researchers.
Results from this study, known as CONCORD-2, appear in The Lancet alongside a linked comment article.
Claudia Allemani, PhD, of the London School of Hygiene & Tropical Medicine in the UK, and her colleagues analyzed individual patient data from 279 cancer registries in 67 countries.
The team reported 5-year survival estimates for 25.7 million cancer patients diagnosed with 1 of 10 common cancers—stomach, colon, rectum, liver, lung, breast (women), cervix, ovary, prostate, and leukemia (n=873,588)—from 1995 through 2009.
The investigators also reported survival estimates for 74,343 children diagnosed with ALL during that period.
Even after they adjusted for differences between countries and regions in the risk of death from other causes by age, sex, and race, and over time, the researchers found very large variations between countries in survival for specific cancers.
Adult leukemia
For adults diagnosed with leukemia from 2005 through 2009, the 5-year net survival was 50% to 60% in 21 countries in North America, west Asia, Europe, and Oceania. Survival rates were generally much lower in the 15 participating Asian countries than in other parts of the world.
Survival rates tended to be low in east Asia—ranging from 19% in Japan to 23% in South Korea and Taiwan—but higher in west Asia—ranging from 33% in Turkey to 53% in Qatar. And results were mixed in other Asian countries—ranging from 7% in Jordan to 40% in Indonesia.
ALL in children
For children diagnosed with ALL from 2005 through 2009, 5-year survival was 90% or higher in Austria, Belgium, Canada, Germany, and Norway. It was 80% to 89% in 21 countries on various continents.
However, 5-year survival was lower than 60% in several countries and the lowest—16%—in Jordan.
The range of survival estimates for childhood ALL in Central/South America and Asia was much lower than the range in North America, Europe, and Oceania.
Solid tumor malignancies
The study also showed that liver and lung cancer have the worst prognosis among the 10 cancers examined, with 5-year survival of less than 20% in both developed and developing countries. The researchers said this suggests most patients still visit their doctors too late for treatment to be effective.
Five-year survival from breast and colorectal cancers increased in most developed countries and in South America (Brazil, Colombia, and Ecuador) from the beginning of the study period to the end. These trends likely reflect earlier diagnosis and the availability of better treatment options, according to the investigators.
Stomach cancer survival was higher in Southeast Asia than in other regions. This is likely a result of intensive diagnostic activity, early stage at diagnosis, and radical surgery, the researchers said. And this suggests important lessons could be learned from these countries about diagnosis and treatment.
Cervical and ovarian cancers showed particularly wide differences in survival, and overall improvements during the study period were slight.
“Our findings show that, in some countries, cancer is far more lethal than in others,” Dr Allemani said. “In the 21st century, there should not be such a dramatic gulf in survival. The majority of the variability in survival is probably due to factors that can be changed, such as the availability and quality of diagnostic and treatment services.”
“The findings can be used to evaluate the extent to which investment in healthcare systems is improving their effectiveness. We expect them to act as a stimulus for politicians to improve health policy and invest in healthcare.”
Credit: Bill Branson
A large, international study has revealed sizable differences in cancer survival rates between countries.
In particular, investigators observed a wide gap in survival for children with acute lymphoblastic leukemia (ALL).
The most recent 5-year survival rate was less than 60% in several countries—and as low as 16% in one nation—but more than 90% in other countries.
This indicates major deficiencies in managing this largely curable disease, according to researchers.
Results from this study, known as CONCORD-2, appear in The Lancet alongside a linked comment article.
Claudia Allemani, PhD, of the London School of Hygiene & Tropical Medicine in the UK, and her colleagues analyzed individual patient data from 279 cancer registries in 67 countries.
The team reported 5-year survival estimates for 25.7 million cancer patients diagnosed with 1 of 10 common cancers—stomach, colon, rectum, liver, lung, breast (women), cervix, ovary, prostate, and leukemia (n=873,588)—from 1995 through 2009.
The investigators also reported survival estimates for 74,343 children diagnosed with ALL during that period.
Even after they adjusted for differences between countries and regions in the risk of death from other causes by age, sex, and race, and over time, the researchers found very large variations between countries in survival for specific cancers.
Adult leukemia
For adults diagnosed with leukemia from 2005 through 2009, the 5-year net survival was 50% to 60% in 21 countries in North America, west Asia, Europe, and Oceania. Survival rates were generally much lower in the 15 participating Asian countries than in other parts of the world.
Survival rates tended to be low in east Asia—ranging from 19% in Japan to 23% in South Korea and Taiwan—but higher in west Asia—ranging from 33% in Turkey to 53% in Qatar. And results were mixed in other Asian countries—ranging from 7% in Jordan to 40% in Indonesia.
ALL in children
For children diagnosed with ALL from 2005 through 2009, 5-year survival was 90% or higher in Austria, Belgium, Canada, Germany, and Norway. It was 80% to 89% in 21 countries on various continents.
However, 5-year survival was lower than 60% in several countries and the lowest—16%—in Jordan.
The range of survival estimates for childhood ALL in Central/South America and Asia was much lower than the range in North America, Europe, and Oceania.
Solid tumor malignancies
The study also showed that liver and lung cancer have the worst prognosis among the 10 cancers examined, with 5-year survival of less than 20% in both developed and developing countries. The researchers said this suggests most patients still visit their doctors too late for treatment to be effective.
Five-year survival from breast and colorectal cancers increased in most developed countries and in South America (Brazil, Colombia, and Ecuador) from the beginning of the study period to the end. These trends likely reflect earlier diagnosis and the availability of better treatment options, according to the investigators.
Stomach cancer survival was higher in Southeast Asia than in other regions. This is likely a result of intensive diagnostic activity, early stage at diagnosis, and radical surgery, the researchers said. And this suggests important lessons could be learned from these countries about diagnosis and treatment.
Cervical and ovarian cancers showed particularly wide differences in survival, and overall improvements during the study period were slight.
“Our findings show that, in some countries, cancer is far more lethal than in others,” Dr Allemani said. “In the 21st century, there should not be such a dramatic gulf in survival. The majority of the variability in survival is probably due to factors that can be changed, such as the availability and quality of diagnostic and treatment services.”
“The findings can be used to evaluate the extent to which investment in healthcare systems is improving their effectiveness. We expect them to act as a stimulus for politicians to improve health policy and invest in healthcare.”
Ponatinib approved in Australia

The Therapeutic Goods Administration (TGA) has approved marketing of ponatinib (Iclusig) in Australia.
The drug is now approved to treat adults with chronic myeloid leukemia (CML) who could not tolerate or were resistant to at least 2 prior tyrosine kinase inhibitors (TKIs), or those patients with a T315I mutation.
Ponatinib is also approved to treat certain adults with Philadelphia-chromosome-positive acute lymphoblastic leukemia (Ph+ ALL).
These patients must be resistant to or intolerant of dasatinib and ineligible for treatment with imatinib, or they must have a T315I mutation.
Ponatinib is the only TKI approved in Australia for an indication that includes CML and Ph+ ALL patients with the T315I mutation.
The drug’s developers, Ariad Pharmaceuticals, Inc., and Specialized Therapeutics Australia Pty. Ltd., expect to launch ponatinib in early 2015.
The PACE trial
The TGA’s decision to approve ponatinib was based on results from the phase 2 PACE trial, which included patients with CML or Ph+ ALL who were resistant to or intolerant of prior TKI therapy, or who had the T315I mutation.
The median follow-up times were 15.3 months in chronic-phase CML patients, 15.8 months in accelerated-phase CML patients, and 6.2 months in patients with blast-phase CML or Ph+ ALL.
In chronic-phase CML, the primary endpoint was major cytogenetic response, and it occurred in 56% of patients. Among chronic-phase patients with the T315I mutation, 70% achieved a major cytogenetic response. Among patients who had failed treatment with dasatinib or nilotinib, 51% achieved a major cytogenetic response.
In accelerated-phase CML, the primary endpoint was major hematologic response. This occurred in 57% of all patients in this group, 50% of patients with the T315I mutation, and 58% of patients who had failed treatment with dasatinib or nilotinib.
The primary endpoint was major hematologic response in blast-phase CML/Ph+ ALL as well. Thirty-four percent of all patients in this group met this endpoint, as did 33% of patients with the T315I mutation and 35% of patients who had failed treatment with dasatinib or nilotinib.
Common non-hematologic adverse events included rash (38%), abdominal pain (38%), headache (35%), dry skin (35%), constipation (34%), fatigue (27%), pyrexia (27%), nausea (26%), arthralgia (25%), hypertension (21%), increased lipase (19%), and increased amylase (7%).
Hematologic events of any grade included thrombocytopenia (42%), neutropenia (24%), and anemia (20%). And serious adverse events of arterial thromboembolism, including arterial stenosis, occurred in patients with cardiovascular risk factors.
Safety concerns
Ponatinib is also approved to treat CML and Ph+ ALL in the European Union and the US. However, the drug was pulled from the US market for a little over 2 months, and ponatinib trials were placed on partial hold, after extended follow-up from the PACE trial showed an increase in thrombotic events.
The drug went back on the market last January, with new safety measures in place.
Ponatinib was not pulled from the market in the European Union, but the European Medicine’s Agency released recommendations for safer use of the drug. The Committee for Medicinal Products for Human Use reviewed data on ponatinib and decided the drug’s benefits outweigh its risks.
The Therapeutic Goods Administration (TGA) has approved marketing of ponatinib (Iclusig) in Australia.
The drug is now approved to treat adults with chronic myeloid leukemia (CML) who could not tolerate or were resistant to at least 2 prior tyrosine kinase inhibitors (TKIs), or those patients with a T315I mutation.
Ponatinib is also approved to treat certain adults with Philadelphia-chromosome-positive acute lymphoblastic leukemia (Ph+ ALL).
These patients must be resistant to or intolerant of dasatinib and ineligible for treatment with imatinib, or they must have a T315I mutation.
Ponatinib is the only TKI approved in Australia for an indication that includes CML and Ph+ ALL patients with the T315I mutation.
The drug’s developers, Ariad Pharmaceuticals, Inc., and Specialized Therapeutics Australia Pty. Ltd., expect to launch ponatinib in early 2015.
The PACE trial
The TGA’s decision to approve ponatinib was based on results from the phase 2 PACE trial, which included patients with CML or Ph+ ALL who were resistant to or intolerant of prior TKI therapy, or who had the T315I mutation.
The median follow-up times were 15.3 months in chronic-phase CML patients, 15.8 months in accelerated-phase CML patients, and 6.2 months in patients with blast-phase CML or Ph+ ALL.
In chronic-phase CML, the primary endpoint was major cytogenetic response, and it occurred in 56% of patients. Among chronic-phase patients with the T315I mutation, 70% achieved a major cytogenetic response. Among patients who had failed treatment with dasatinib or nilotinib, 51% achieved a major cytogenetic response.
In accelerated-phase CML, the primary endpoint was major hematologic response. This occurred in 57% of all patients in this group, 50% of patients with the T315I mutation, and 58% of patients who had failed treatment with dasatinib or nilotinib.
The primary endpoint was major hematologic response in blast-phase CML/Ph+ ALL as well. Thirty-four percent of all patients in this group met this endpoint, as did 33% of patients with the T315I mutation and 35% of patients who had failed treatment with dasatinib or nilotinib.
Common non-hematologic adverse events included rash (38%), abdominal pain (38%), headache (35%), dry skin (35%), constipation (34%), fatigue (27%), pyrexia (27%), nausea (26%), arthralgia (25%), hypertension (21%), increased lipase (19%), and increased amylase (7%).
Hematologic events of any grade included thrombocytopenia (42%), neutropenia (24%), and anemia (20%). And serious adverse events of arterial thromboembolism, including arterial stenosis, occurred in patients with cardiovascular risk factors.
Safety concerns
Ponatinib is also approved to treat CML and Ph+ ALL in the European Union and the US. However, the drug was pulled from the US market for a little over 2 months, and ponatinib trials were placed on partial hold, after extended follow-up from the PACE trial showed an increase in thrombotic events.
The drug went back on the market last January, with new safety measures in place.
Ponatinib was not pulled from the market in the European Union, but the European Medicine’s Agency released recommendations for safer use of the drug. The Committee for Medicinal Products for Human Use reviewed data on ponatinib and decided the drug’s benefits outweigh its risks.
The Therapeutic Goods Administration (TGA) has approved marketing of ponatinib (Iclusig) in Australia.
The drug is now approved to treat adults with chronic myeloid leukemia (CML) who could not tolerate or were resistant to at least 2 prior tyrosine kinase inhibitors (TKIs), or those patients with a T315I mutation.
Ponatinib is also approved to treat certain adults with Philadelphia-chromosome-positive acute lymphoblastic leukemia (Ph+ ALL).
These patients must be resistant to or intolerant of dasatinib and ineligible for treatment with imatinib, or they must have a T315I mutation.
Ponatinib is the only TKI approved in Australia for an indication that includes CML and Ph+ ALL patients with the T315I mutation.
The drug’s developers, Ariad Pharmaceuticals, Inc., and Specialized Therapeutics Australia Pty. Ltd., expect to launch ponatinib in early 2015.
The PACE trial
The TGA’s decision to approve ponatinib was based on results from the phase 2 PACE trial, which included patients with CML or Ph+ ALL who were resistant to or intolerant of prior TKI therapy, or who had the T315I mutation.
The median follow-up times were 15.3 months in chronic-phase CML patients, 15.8 months in accelerated-phase CML patients, and 6.2 months in patients with blast-phase CML or Ph+ ALL.
In chronic-phase CML, the primary endpoint was major cytogenetic response, and it occurred in 56% of patients. Among chronic-phase patients with the T315I mutation, 70% achieved a major cytogenetic response. Among patients who had failed treatment with dasatinib or nilotinib, 51% achieved a major cytogenetic response.
In accelerated-phase CML, the primary endpoint was major hematologic response. This occurred in 57% of all patients in this group, 50% of patients with the T315I mutation, and 58% of patients who had failed treatment with dasatinib or nilotinib.
The primary endpoint was major hematologic response in blast-phase CML/Ph+ ALL as well. Thirty-four percent of all patients in this group met this endpoint, as did 33% of patients with the T315I mutation and 35% of patients who had failed treatment with dasatinib or nilotinib.
Common non-hematologic adverse events included rash (38%), abdominal pain (38%), headache (35%), dry skin (35%), constipation (34%), fatigue (27%), pyrexia (27%), nausea (26%), arthralgia (25%), hypertension (21%), increased lipase (19%), and increased amylase (7%).
Hematologic events of any grade included thrombocytopenia (42%), neutropenia (24%), and anemia (20%). And serious adverse events of arterial thromboembolism, including arterial stenosis, occurred in patients with cardiovascular risk factors.
Safety concerns
Ponatinib is also approved to treat CML and Ph+ ALL in the European Union and the US. However, the drug was pulled from the US market for a little over 2 months, and ponatinib trials were placed on partial hold, after extended follow-up from the PACE trial showed an increase in thrombotic events.
The drug went back on the market last January, with new safety measures in place.
Ponatinib was not pulled from the market in the European Union, but the European Medicine’s Agency released recommendations for safer use of the drug. The Committee for Medicinal Products for Human Use reviewed data on ponatinib and decided the drug’s benefits outweigh its risks.
Protein inhibits HSC engraftment

in the bone marrow
Researchers say they have identified a protein that plays a key role in regulating hematopoietic stem cell (HSC) engraftment.
Experiments revealed that protein tyrosine phosphatase-sigma (PTP-sigma) suppresses normal HSC engraftment capacity, but targeted inhibition of
PTP-sigma can substantially improve mouse and human HSC engraftment.
The researchers described these findings in The Journal of Clinical Investigation.
Mamle Quarmyne, a graduate student at the University of California, Los Angeles, and her colleagues first found that PTP-sigma is expressed on a high percentage of mouse and human HSCs.
When the team deleted PTP-sigma in mice, they observed a marked increase in HSCs’ ability to engraft.
When they selected human HSCs that did not express PTP-sigma and transplanted these cells into immune-deficient mice, the researchers observed a 15-fold increase in HSC engraftment.
The team also discovered that PTP-sigma regulates HSC function by suppressing a protein called RAC1, which is known to promote HSC engraftment.
“These findings have tremendous therapeutic potential, since we have identified a new receptor on HSCs, PTP-sigma, which can be specifically targeted as a means to potently increase the engraftment of transplanted HSCs in patients,” said John P. Chute, MD, of the University of California, Los Angeles.
“This approach can also potentially accelerate hematologic recovery in cancer patients receiving chemotherapy and/or radiation, which also suppress the blood and immune systems.”
Now, the researchers are testing small molecules for their ability to inhibit PTP-sigma on HSCs. If these studies are successful, the team aims to translate these findings into clinical trials in the near future.
in the bone marrow
Researchers say they have identified a protein that plays a key role in regulating hematopoietic stem cell (HSC) engraftment.
Experiments revealed that protein tyrosine phosphatase-sigma (PTP-sigma) suppresses normal HSC engraftment capacity, but targeted inhibition of
PTP-sigma can substantially improve mouse and human HSC engraftment.
The researchers described these findings in The Journal of Clinical Investigation.
Mamle Quarmyne, a graduate student at the University of California, Los Angeles, and her colleagues first found that PTP-sigma is expressed on a high percentage of mouse and human HSCs.
When the team deleted PTP-sigma in mice, they observed a marked increase in HSCs’ ability to engraft.
When they selected human HSCs that did not express PTP-sigma and transplanted these cells into immune-deficient mice, the researchers observed a 15-fold increase in HSC engraftment.
The team also discovered that PTP-sigma regulates HSC function by suppressing a protein called RAC1, which is known to promote HSC engraftment.
“These findings have tremendous therapeutic potential, since we have identified a new receptor on HSCs, PTP-sigma, which can be specifically targeted as a means to potently increase the engraftment of transplanted HSCs in patients,” said John P. Chute, MD, of the University of California, Los Angeles.
“This approach can also potentially accelerate hematologic recovery in cancer patients receiving chemotherapy and/or radiation, which also suppress the blood and immune systems.”
Now, the researchers are testing small molecules for their ability to inhibit PTP-sigma on HSCs. If these studies are successful, the team aims to translate these findings into clinical trials in the near future.
in the bone marrow
Researchers say they have identified a protein that plays a key role in regulating hematopoietic stem cell (HSC) engraftment.
Experiments revealed that protein tyrosine phosphatase-sigma (PTP-sigma) suppresses normal HSC engraftment capacity, but targeted inhibition of
PTP-sigma can substantially improve mouse and human HSC engraftment.
The researchers described these findings in The Journal of Clinical Investigation.
Mamle Quarmyne, a graduate student at the University of California, Los Angeles, and her colleagues first found that PTP-sigma is expressed on a high percentage of mouse and human HSCs.
When the team deleted PTP-sigma in mice, they observed a marked increase in HSCs’ ability to engraft.
When they selected human HSCs that did not express PTP-sigma and transplanted these cells into immune-deficient mice, the researchers observed a 15-fold increase in HSC engraftment.
The team also discovered that PTP-sigma regulates HSC function by suppressing a protein called RAC1, which is known to promote HSC engraftment.
“These findings have tremendous therapeutic potential, since we have identified a new receptor on HSCs, PTP-sigma, which can be specifically targeted as a means to potently increase the engraftment of transplanted HSCs in patients,” said John P. Chute, MD, of the University of California, Los Angeles.
“This approach can also potentially accelerate hematologic recovery in cancer patients receiving chemotherapy and/or radiation, which also suppress the blood and immune systems.”
Now, the researchers are testing small molecules for their ability to inhibit PTP-sigma on HSCs. If these studies are successful, the team aims to translate these findings into clinical trials in the near future.
CAR T-cell therapy gets breakthrough designation
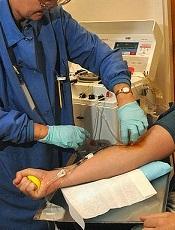
Credit: Charles Haymond
The US Food and Drug Administration (FDA) has granted breakthrough therapy designation for JCAR015, a chimeric antigen receptor (CAR) T-cell therapy, to treat patients with relapsed or refractory B-cell acute lymphoblastic leukemia (ALL).
Breakthrough designation is designed to help accelerate the development and review of new drugs for serious or life-threatening conditions.
The designation comes with potential benefits, including intensive FDA guidance and eligibility for priority review. It is granted to applicants when preliminary clinical evidence indicates the drug may demonstrate substantial improvement over existing therapies on one or more clinical endpoints.
The FDA recently granted JCAR015 orphan designation to treat ALL as well.
JCAR015 consists of autologous T cells expressing a CD19-specific, CD28/CD3z CAR. The treatment has shown promise in an ongoing phase 1 trial of patients with B-cell ALL.
Initial results from this study were published in Science Translational Medicine last year and in February. Updated results were presented at the AACR Annual Meeting in April.
At that point, the researchers had enrolled 22 adult patients with relapsed or refractory B-ALL who were minimal residual disease-positive or were in first complete remission at enrollment. Patients in complete remission were monitored and only received JCAR015 if they relapsed.
The remaining patients received re-induction chemotherapy (physician’s choice), followed by an infusion of JCAR015. After treatment, patients could receive allogeneic transplant, a different salvage therapy, or monitoring.
Eighty-two percent of patients achieved a complete response to JCAR015. The average time to complete response was about 24.5 days.
Twelve of the responders were eligible for transplant. Of the 8 patients who ultimately underwent transplant and survived, 1 relapsed, but the rest remained in remission.
Ten patients had died at the time of the AACR presentation. Six deaths were a result of disease relapse or progression, and 2 patients died of complications from stem cell transplant.
The 2 remaining deaths prompted a temporary suspension of enrollment in this trial. Those deaths were related to complications from cytokine release syndrome. One patient died of cardiovascular disease, and the other died following persistent seizure activity.
So researchers at the Memorial Sloan-Kettering Cancer Center, where the trial is being conducted, reviewed these cases. The results prompted them to amend trial enrollment criteria and dosing recommendations. Now, patients with cardiac disease are ineligible to receive JCAR015.
And the T-cell dose a patient receives will depend on the extent of his or her disease. The hope is that this will reduce the risk of cytokine release syndrome and any resulting seizures. The researchers also noted that the monoclonal antibody tocilizumab has proven effective in treating cytokine release syndrome.
In addition to this trial, JCAR015 is under investigation at Memorial Sloan-Kettering Cancer Center in a phase 1 trial of patients with relapsed and refractory non-Hodgkin lymphoma.
Two other CAR T-cell product candidates under development by the same company, Juno Therapeutics, Inc., are being tested in clinical trials as well. JCAR017 is under investigation at Seattle Children’s Hospital for relapsed/refractory CD19-positive pediatric leukemia.
JCAR014 is being tested for refractory chronic lymphocytic leukemia, non-Hodgkin lymphoma, and ALL at the Fred Hutchinson Cancer Research Center. Data on these programs are set to be presented at the 56th ASH Annual Meeting next week in San Francisco.
Credit: Charles Haymond
The US Food and Drug Administration (FDA) has granted breakthrough therapy designation for JCAR015, a chimeric antigen receptor (CAR) T-cell therapy, to treat patients with relapsed or refractory B-cell acute lymphoblastic leukemia (ALL).
Breakthrough designation is designed to help accelerate the development and review of new drugs for serious or life-threatening conditions.
The designation comes with potential benefits, including intensive FDA guidance and eligibility for priority review. It is granted to applicants when preliminary clinical evidence indicates the drug may demonstrate substantial improvement over existing therapies on one or more clinical endpoints.
The FDA recently granted JCAR015 orphan designation to treat ALL as well.
JCAR015 consists of autologous T cells expressing a CD19-specific, CD28/CD3z CAR. The treatment has shown promise in an ongoing phase 1 trial of patients with B-cell ALL.
Initial results from this study were published in Science Translational Medicine last year and in February. Updated results were presented at the AACR Annual Meeting in April.
At that point, the researchers had enrolled 22 adult patients with relapsed or refractory B-ALL who were minimal residual disease-positive or were in first complete remission at enrollment. Patients in complete remission were monitored and only received JCAR015 if they relapsed.
The remaining patients received re-induction chemotherapy (physician’s choice), followed by an infusion of JCAR015. After treatment, patients could receive allogeneic transplant, a different salvage therapy, or monitoring.
Eighty-two percent of patients achieved a complete response to JCAR015. The average time to complete response was about 24.5 days.
Twelve of the responders were eligible for transplant. Of the 8 patients who ultimately underwent transplant and survived, 1 relapsed, but the rest remained in remission.
Ten patients had died at the time of the AACR presentation. Six deaths were a result of disease relapse or progression, and 2 patients died of complications from stem cell transplant.
The 2 remaining deaths prompted a temporary suspension of enrollment in this trial. Those deaths were related to complications from cytokine release syndrome. One patient died of cardiovascular disease, and the other died following persistent seizure activity.
So researchers at the Memorial Sloan-Kettering Cancer Center, where the trial is being conducted, reviewed these cases. The results prompted them to amend trial enrollment criteria and dosing recommendations. Now, patients with cardiac disease are ineligible to receive JCAR015.
And the T-cell dose a patient receives will depend on the extent of his or her disease. The hope is that this will reduce the risk of cytokine release syndrome and any resulting seizures. The researchers also noted that the monoclonal antibody tocilizumab has proven effective in treating cytokine release syndrome.
In addition to this trial, JCAR015 is under investigation at Memorial Sloan-Kettering Cancer Center in a phase 1 trial of patients with relapsed and refractory non-Hodgkin lymphoma.
Two other CAR T-cell product candidates under development by the same company, Juno Therapeutics, Inc., are being tested in clinical trials as well. JCAR017 is under investigation at Seattle Children’s Hospital for relapsed/refractory CD19-positive pediatric leukemia.
JCAR014 is being tested for refractory chronic lymphocytic leukemia, non-Hodgkin lymphoma, and ALL at the Fred Hutchinson Cancer Research Center. Data on these programs are set to be presented at the 56th ASH Annual Meeting next week in San Francisco.
Credit: Charles Haymond
The US Food and Drug Administration (FDA) has granted breakthrough therapy designation for JCAR015, a chimeric antigen receptor (CAR) T-cell therapy, to treat patients with relapsed or refractory B-cell acute lymphoblastic leukemia (ALL).
Breakthrough designation is designed to help accelerate the development and review of new drugs for serious or life-threatening conditions.
The designation comes with potential benefits, including intensive FDA guidance and eligibility for priority review. It is granted to applicants when preliminary clinical evidence indicates the drug may demonstrate substantial improvement over existing therapies on one or more clinical endpoints.
The FDA recently granted JCAR015 orphan designation to treat ALL as well.
JCAR015 consists of autologous T cells expressing a CD19-specific, CD28/CD3z CAR. The treatment has shown promise in an ongoing phase 1 trial of patients with B-cell ALL.
Initial results from this study were published in Science Translational Medicine last year and in February. Updated results were presented at the AACR Annual Meeting in April.
At that point, the researchers had enrolled 22 adult patients with relapsed or refractory B-ALL who were minimal residual disease-positive or were in first complete remission at enrollment. Patients in complete remission were monitored and only received JCAR015 if they relapsed.
The remaining patients received re-induction chemotherapy (physician’s choice), followed by an infusion of JCAR015. After treatment, patients could receive allogeneic transplant, a different salvage therapy, or monitoring.
Eighty-two percent of patients achieved a complete response to JCAR015. The average time to complete response was about 24.5 days.
Twelve of the responders were eligible for transplant. Of the 8 patients who ultimately underwent transplant and survived, 1 relapsed, but the rest remained in remission.
Ten patients had died at the time of the AACR presentation. Six deaths were a result of disease relapse or progression, and 2 patients died of complications from stem cell transplant.
The 2 remaining deaths prompted a temporary suspension of enrollment in this trial. Those deaths were related to complications from cytokine release syndrome. One patient died of cardiovascular disease, and the other died following persistent seizure activity.
So researchers at the Memorial Sloan-Kettering Cancer Center, where the trial is being conducted, reviewed these cases. The results prompted them to amend trial enrollment criteria and dosing recommendations. Now, patients with cardiac disease are ineligible to receive JCAR015.
And the T-cell dose a patient receives will depend on the extent of his or her disease. The hope is that this will reduce the risk of cytokine release syndrome and any resulting seizures. The researchers also noted that the monoclonal antibody tocilizumab has proven effective in treating cytokine release syndrome.
In addition to this trial, JCAR015 is under investigation at Memorial Sloan-Kettering Cancer Center in a phase 1 trial of patients with relapsed and refractory non-Hodgkin lymphoma.
Two other CAR T-cell product candidates under development by the same company, Juno Therapeutics, Inc., are being tested in clinical trials as well. JCAR017 is under investigation at Seattle Children’s Hospital for relapsed/refractory CD19-positive pediatric leukemia.
JCAR014 is being tested for refractory chronic lymphocytic leukemia, non-Hodgkin lymphoma, and ALL at the Fred Hutchinson Cancer Research Center. Data on these programs are set to be presented at the 56th ASH Annual Meeting next week in San Francisco.
What Matters: Salt substitutes to reduce blood pressure
Most of my counseling to patients about lowering blood pressure through self management is heavy on weight loss and light on dietary causes of high blood pressure – other than the obvious ones that make people gain weight.
Denial of the effects of dietary salt on blood pressure is not the issue. Rather, it is a time-hewn lack of confidence in the ability of patients to significantly and consistently modify their diet. Part of this may also relate to our inability to provide useful lifestyle tips on how to do so, other than the obvious referral to a dietitian. Telling them not to eat out does not solve this problem, because they can just as easily add salt at home.
However, a recent meta-analysis evaluating the effect of salt substitutes on blood pressure has reinvigorated my desire to counsel my patients on blood pressure self-management.
In this study, the investigators sought randomized, controlled trials with interventions lasting at least 6 months in duration (Am. J. Clin. Nutr. 2014;100:1448-54). Six cohorts were identified in the literature involving a total of 1,974 participants. Included studies took place in China and the Netherlands. Three studies used 65% NaCl/25% KCl/10% MgSO2, one used 41% NaCl/41% KCl/17% magnesium salt/trace minerals, and one used 65% NaCl/30% KCl/5% calcium salt and folic acid.
Salt substitutes had significant effects on systolic blood pressure with a mean difference of –4.9 mm Hg and on diastolic blood pressure with a mean difference of –1.5 mm Hg.
Overall, one may not be impressed with a 5–mm Hg change in systolic blood pressure. But this is the mean difference – and we presume population heterogeneity in response to salt substitution, such that some patients will respond to a higher degree than this and some to a lower degree. But we do not know which ones are which.
Population interventions aimed at reducing salt intake have been shown to be effective. The Finnish government, for example, collaborated with private industry and was able to achieve reductions in sodium content of food. That initiative resulted in a 33% reduction in the population’s average salt intake, a greater than 10–mm Hg decrease in the population average of both systolic BP and diastolic BP, and a 75%-80% decrease in both stroke and coronary artery disease mortality. Australia, Japan, and the United Kingdom were able to do similar things.
Because we are unlikely to ever see such organized political will exercised in the United States, it seems reasonable to recommend salt substitutes to our patients on an individual level. Adverse effects have been noted with salt substitutes in patients with kidney disease, however, which will have to be considered in that specific population of patients.
Dr. Ebbert is professor of medicine, a general internist at the Mayo Clinic in Rochester, Minn., and a diplomate of the American Board of Addiction Medicine. The opinions expressed are those of the author. The opinions expressed in this article should not be used to diagnose or treat any medical condition nor should they be used as a substitute for medical advice from a qualified, board-certified practicing clinician.
Most of my counseling to patients about lowering blood pressure through self management is heavy on weight loss and light on dietary causes of high blood pressure – other than the obvious ones that make people gain weight.
Denial of the effects of dietary salt on blood pressure is not the issue. Rather, it is a time-hewn lack of confidence in the ability of patients to significantly and consistently modify their diet. Part of this may also relate to our inability to provide useful lifestyle tips on how to do so, other than the obvious referral to a dietitian. Telling them not to eat out does not solve this problem, because they can just as easily add salt at home.
However, a recent meta-analysis evaluating the effect of salt substitutes on blood pressure has reinvigorated my desire to counsel my patients on blood pressure self-management.
In this study, the investigators sought randomized, controlled trials with interventions lasting at least 6 months in duration (Am. J. Clin. Nutr. 2014;100:1448-54). Six cohorts were identified in the literature involving a total of 1,974 participants. Included studies took place in China and the Netherlands. Three studies used 65% NaCl/25% KCl/10% MgSO2, one used 41% NaCl/41% KCl/17% magnesium salt/trace minerals, and one used 65% NaCl/30% KCl/5% calcium salt and folic acid.
Salt substitutes had significant effects on systolic blood pressure with a mean difference of –4.9 mm Hg and on diastolic blood pressure with a mean difference of –1.5 mm Hg.
Overall, one may not be impressed with a 5–mm Hg change in systolic blood pressure. But this is the mean difference – and we presume population heterogeneity in response to salt substitution, such that some patients will respond to a higher degree than this and some to a lower degree. But we do not know which ones are which.
Population interventions aimed at reducing salt intake have been shown to be effective. The Finnish government, for example, collaborated with private industry and was able to achieve reductions in sodium content of food. That initiative resulted in a 33% reduction in the population’s average salt intake, a greater than 10–mm Hg decrease in the population average of both systolic BP and diastolic BP, and a 75%-80% decrease in both stroke and coronary artery disease mortality. Australia, Japan, and the United Kingdom were able to do similar things.
Because we are unlikely to ever see such organized political will exercised in the United States, it seems reasonable to recommend salt substitutes to our patients on an individual level. Adverse effects have been noted with salt substitutes in patients with kidney disease, however, which will have to be considered in that specific population of patients.
Dr. Ebbert is professor of medicine, a general internist at the Mayo Clinic in Rochester, Minn., and a diplomate of the American Board of Addiction Medicine. The opinions expressed are those of the author. The opinions expressed in this article should not be used to diagnose or treat any medical condition nor should they be used as a substitute for medical advice from a qualified, board-certified practicing clinician.
Most of my counseling to patients about lowering blood pressure through self management is heavy on weight loss and light on dietary causes of high blood pressure – other than the obvious ones that make people gain weight.
Denial of the effects of dietary salt on blood pressure is not the issue. Rather, it is a time-hewn lack of confidence in the ability of patients to significantly and consistently modify their diet. Part of this may also relate to our inability to provide useful lifestyle tips on how to do so, other than the obvious referral to a dietitian. Telling them not to eat out does not solve this problem, because they can just as easily add salt at home.
However, a recent meta-analysis evaluating the effect of salt substitutes on blood pressure has reinvigorated my desire to counsel my patients on blood pressure self-management.
In this study, the investigators sought randomized, controlled trials with interventions lasting at least 6 months in duration (Am. J. Clin. Nutr. 2014;100:1448-54). Six cohorts were identified in the literature involving a total of 1,974 participants. Included studies took place in China and the Netherlands. Three studies used 65% NaCl/25% KCl/10% MgSO2, one used 41% NaCl/41% KCl/17% magnesium salt/trace minerals, and one used 65% NaCl/30% KCl/5% calcium salt and folic acid.
Salt substitutes had significant effects on systolic blood pressure with a mean difference of –4.9 mm Hg and on diastolic blood pressure with a mean difference of –1.5 mm Hg.
Overall, one may not be impressed with a 5–mm Hg change in systolic blood pressure. But this is the mean difference – and we presume population heterogeneity in response to salt substitution, such that some patients will respond to a higher degree than this and some to a lower degree. But we do not know which ones are which.
Population interventions aimed at reducing salt intake have been shown to be effective. The Finnish government, for example, collaborated with private industry and was able to achieve reductions in sodium content of food. That initiative resulted in a 33% reduction in the population’s average salt intake, a greater than 10–mm Hg decrease in the population average of both systolic BP and diastolic BP, and a 75%-80% decrease in both stroke and coronary artery disease mortality. Australia, Japan, and the United Kingdom were able to do similar things.
Because we are unlikely to ever see such organized political will exercised in the United States, it seems reasonable to recommend salt substitutes to our patients on an individual level. Adverse effects have been noted with salt substitutes in patients with kidney disease, however, which will have to be considered in that specific population of patients.
Dr. Ebbert is professor of medicine, a general internist at the Mayo Clinic in Rochester, Minn., and a diplomate of the American Board of Addiction Medicine. The opinions expressed are those of the author. The opinions expressed in this article should not be used to diagnose or treat any medical condition nor should they be used as a substitute for medical advice from a qualified, board-certified practicing clinician.

You can’t get there from here
Readers of this column may recall that we have been following the fate of a small 14 primary care physician–owned accountable care organization bordering the Rio Grande River in Texas, the Rio Grande Valley Health Alliance. These physicians in 12 practices started with no infrastructure, no common electronic health records, or capital, and nonetheless took the plunge to become a Medicare Shared Savings Program accountable care organization beginning Jan. 1, 2013. It is time for an update on them.
Admittedly, I have been dragging my feet about an update, not because the results were poor, but because they were so great. With barely the minimum 5,000 beneficiaries, they saved more than $6 million in their first year. They are in the no-downside-risk plan, and thus got 50% of those savings. They have had time in 2014 to crunch the data even more to identify the 10% of patients driving more than 50% of costs and begin implementing complex high-risk patient management. For these reasons, I wager that they will do even better in 2014 through increased efficiencies.

How about quality? In the first year in the Medicare Shared Savings Program (MSSP), an ACO need only show the ability to report; they are not graded on their quality performance. But the Rio Grande Valley Health Alliance kept track internally, and the ACO regularly appears to be hitting the 90th percentile on the bulk of the 33 quality metrics. Their model tracked the elements for success outlined in previous columns.
So, why have I been I hesitant to report this?
Well, so many of you readers have called or written me to say that, while this type of physician-driven community or rural ACO with a primary care core makes sense, there is no way that you can get the money to organize and build the infrastructure necessary to succeed like RGVHA has. You would have to create a legal entity and apply to a program such as the MSSP, create infrastructure, track savings over a calendar year, then wait 6 or 8 months to get the results and the shared savings payment.
In sum, it’s a great idea. You are in the best position to drive high-value health improvement. You are located where the historic lack of access and medical infrastructure has resulted in high avoidable costs.
But the cruel irony is that, thanks to the fee-for-service system, those in the best position to drive value – primary care physicians – are in the worst position to front the necessary capital costs.
RGVHA was able to go forward because they were eligible for the now-gone Advance Payment Model program that advanced them the necessary operational costs. Their exciting success would ring hollow as a message to you if you couldn’t get this type of developmental financial support. Deferred shared savings and improved quality for your Medicare patients is a great concept – but this is a proverbial “you can’t get there from here” dilemma.
The CMS ACO investment model
The Centers for Medicare and Medicaid Services also saw this disconnect. So, CMS announced a new upfront infrastructure support program specifically to promote new small nonhospital* or managed care ACOs, rural ACOs, ACOs where there is low ACO penetration, and existing ACOs wanting to move toward taking financial risk. This prepaid shared savings builds on the Advance Payment Model program.
ACOs that plan to apply for the program in the next cycle and start in 2016 must have a preliminary prospective beneficiary assignment of 10,000 or less. CMS will give preference to new ACOs in rural or low-penetration areas, or in areas with exceptional need, or to ACOs with compelling proposals on how they would invest their funds and the CMS funds.
Each dollar given by CMS is a prepayment against the ACO’s shared savings distribution. If there are not enough shared savings, there is no further repayment obligation unless the ACO leaves the program before the 3-year program period.
Applications will be accepted during the summer of 2015, which is roughly the same time as the MSSP application period.
In my mind, this is the single best investment in improving health delivery and reining in runaway health care costs that CMS could have made. It will empower those in the best position to generate the highest quality at the lowest cost: readers like you.
This could be a game changer for primary care and rural care. But it won’t happen without physician leaders like those at RGVHA. The summer of 2015 seems a long way off, but the time to begin preparing your fully financed ACO is now!
* Exceptions to the nonhospital condition exist for critical access hospitals or inpatient prospective payment hospitals with 100 or fewer beds.
Mr. Bobbitt is a senior partner and head of the Health Law Group at the Smith Anderson law firm in Raleigh, N.C. He has many years’ experience assisting physicians form integrated delivery systems. He has spoken and written nationally to primary care physicians on the strategies and practicalities of forming or joining ACOs. This article is meant to be educational and does not constitute legal advice. For additional information, readers may contact the author at bbobbitt@smithlaw.com or 919-821-6612.
Readers of this column may recall that we have been following the fate of a small 14 primary care physician–owned accountable care organization bordering the Rio Grande River in Texas, the Rio Grande Valley Health Alliance. These physicians in 12 practices started with no infrastructure, no common electronic health records, or capital, and nonetheless took the plunge to become a Medicare Shared Savings Program accountable care organization beginning Jan. 1, 2013. It is time for an update on them.
Admittedly, I have been dragging my feet about an update, not because the results were poor, but because they were so great. With barely the minimum 5,000 beneficiaries, they saved more than $6 million in their first year. They are in the no-downside-risk plan, and thus got 50% of those savings. They have had time in 2014 to crunch the data even more to identify the 10% of patients driving more than 50% of costs and begin implementing complex high-risk patient management. For these reasons, I wager that they will do even better in 2014 through increased efficiencies.
How about quality? In the first year in the Medicare Shared Savings Program (MSSP), an ACO need only show the ability to report; they are not graded on their quality performance. But the Rio Grande Valley Health Alliance kept track internally, and the ACO regularly appears to be hitting the 90th percentile on the bulk of the 33 quality metrics. Their model tracked the elements for success outlined in previous columns.
So, why have I been I hesitant to report this?
Well, so many of you readers have called or written me to say that, while this type of physician-driven community or rural ACO with a primary care core makes sense, there is no way that you can get the money to organize and build the infrastructure necessary to succeed like RGVHA has. You would have to create a legal entity and apply to a program such as the MSSP, create infrastructure, track savings over a calendar year, then wait 6 or 8 months to get the results and the shared savings payment.
In sum, it’s a great idea. You are in the best position to drive high-value health improvement. You are located where the historic lack of access and medical infrastructure has resulted in high avoidable costs.
But the cruel irony is that, thanks to the fee-for-service system, those in the best position to drive value – primary care physicians – are in the worst position to front the necessary capital costs.
RGVHA was able to go forward because they were eligible for the now-gone Advance Payment Model program that advanced them the necessary operational costs. Their exciting success would ring hollow as a message to you if you couldn’t get this type of developmental financial support. Deferred shared savings and improved quality for your Medicare patients is a great concept – but this is a proverbial “you can’t get there from here” dilemma.
The CMS ACO investment model
The Centers for Medicare and Medicaid Services also saw this disconnect. So, CMS announced a new upfront infrastructure support program specifically to promote new small nonhospital* or managed care ACOs, rural ACOs, ACOs where there is low ACO penetration, and existing ACOs wanting to move toward taking financial risk. This prepaid shared savings builds on the Advance Payment Model program.
ACOs that plan to apply for the program in the next cycle and start in 2016 must have a preliminary prospective beneficiary assignment of 10,000 or less. CMS will give preference to new ACOs in rural or low-penetration areas, or in areas with exceptional need, or to ACOs with compelling proposals on how they would invest their funds and the CMS funds.
Each dollar given by CMS is a prepayment against the ACO’s shared savings distribution. If there are not enough shared savings, there is no further repayment obligation unless the ACO leaves the program before the 3-year program period.
Applications will be accepted during the summer of 2015, which is roughly the same time as the MSSP application period.
In my mind, this is the single best investment in improving health delivery and reining in runaway health care costs that CMS could have made. It will empower those in the best position to generate the highest quality at the lowest cost: readers like you.
This could be a game changer for primary care and rural care. But it won’t happen without physician leaders like those at RGVHA. The summer of 2015 seems a long way off, but the time to begin preparing your fully financed ACO is now!
* Exceptions to the nonhospital condition exist for critical access hospitals or inpatient prospective payment hospitals with 100 or fewer beds.
Mr. Bobbitt is a senior partner and head of the Health Law Group at the Smith Anderson law firm in Raleigh, N.C. He has many years’ experience assisting physicians form integrated delivery systems. He has spoken and written nationally to primary care physicians on the strategies and practicalities of forming or joining ACOs. This article is meant to be educational and does not constitute legal advice. For additional information, readers may contact the author at bbobbitt@smithlaw.com or 919-821-6612.
Readers of this column may recall that we have been following the fate of a small 14 primary care physician–owned accountable care organization bordering the Rio Grande River in Texas, the Rio Grande Valley Health Alliance. These physicians in 12 practices started with no infrastructure, no common electronic health records, or capital, and nonetheless took the plunge to become a Medicare Shared Savings Program accountable care organization beginning Jan. 1, 2013. It is time for an update on them.
Admittedly, I have been dragging my feet about an update, not because the results were poor, but because they were so great. With barely the minimum 5,000 beneficiaries, they saved more than $6 million in their first year. They are in the no-downside-risk plan, and thus got 50% of those savings. They have had time in 2014 to crunch the data even more to identify the 10% of patients driving more than 50% of costs and begin implementing complex high-risk patient management. For these reasons, I wager that they will do even better in 2014 through increased efficiencies.
How about quality? In the first year in the Medicare Shared Savings Program (MSSP), an ACO need only show the ability to report; they are not graded on their quality performance. But the Rio Grande Valley Health Alliance kept track internally, and the ACO regularly appears to be hitting the 90th percentile on the bulk of the 33 quality metrics. Their model tracked the elements for success outlined in previous columns.
So, why have I been I hesitant to report this?
Well, so many of you readers have called or written me to say that, while this type of physician-driven community or rural ACO with a primary care core makes sense, there is no way that you can get the money to organize and build the infrastructure necessary to succeed like RGVHA has. You would have to create a legal entity and apply to a program such as the MSSP, create infrastructure, track savings over a calendar year, then wait 6 or 8 months to get the results and the shared savings payment.
In sum, it’s a great idea. You are in the best position to drive high-value health improvement. You are located where the historic lack of access and medical infrastructure has resulted in high avoidable costs.
But the cruel irony is that, thanks to the fee-for-service system, those in the best position to drive value – primary care physicians – are in the worst position to front the necessary capital costs.
RGVHA was able to go forward because they were eligible for the now-gone Advance Payment Model program that advanced them the necessary operational costs. Their exciting success would ring hollow as a message to you if you couldn’t get this type of developmental financial support. Deferred shared savings and improved quality for your Medicare patients is a great concept – but this is a proverbial “you can’t get there from here” dilemma.
The CMS ACO investment model
The Centers for Medicare and Medicaid Services also saw this disconnect. So, CMS announced a new upfront infrastructure support program specifically to promote new small nonhospital* or managed care ACOs, rural ACOs, ACOs where there is low ACO penetration, and existing ACOs wanting to move toward taking financial risk. This prepaid shared savings builds on the Advance Payment Model program.
ACOs that plan to apply for the program in the next cycle and start in 2016 must have a preliminary prospective beneficiary assignment of 10,000 or less. CMS will give preference to new ACOs in rural or low-penetration areas, or in areas with exceptional need, or to ACOs with compelling proposals on how they would invest their funds and the CMS funds.
Each dollar given by CMS is a prepayment against the ACO’s shared savings distribution. If there are not enough shared savings, there is no further repayment obligation unless the ACO leaves the program before the 3-year program period.
Applications will be accepted during the summer of 2015, which is roughly the same time as the MSSP application period.
In my mind, this is the single best investment in improving health delivery and reining in runaway health care costs that CMS could have made. It will empower those in the best position to generate the highest quality at the lowest cost: readers like you.
This could be a game changer for primary care and rural care. But it won’t happen without physician leaders like those at RGVHA. The summer of 2015 seems a long way off, but the time to begin preparing your fully financed ACO is now!
* Exceptions to the nonhospital condition exist for critical access hospitals or inpatient prospective payment hospitals with 100 or fewer beds.
Mr. Bobbitt is a senior partner and head of the Health Law Group at the Smith Anderson law firm in Raleigh, N.C. He has many years’ experience assisting physicians form integrated delivery systems. He has spoken and written nationally to primary care physicians on the strategies and practicalities of forming or joining ACOs. This article is meant to be educational and does not constitute legal advice. For additional information, readers may contact the author at bbobbitt@smithlaw.com or 919-821-6612.