User login
VIDEO: When surgery hurts the surgeon: Intervening to prevent ergonomic injuries
SAN DIEGO – Work-related musculoskeletal disorders are practically inevitable for surgeons, eventually occurring in more than 90%, no matter what type of surgery they practice.
At the annual clinical congress of the American College of Surgeons, this eyebrow-raising fact was presented with a sobering addendum: No one seems to be doing much about it.
“There are some ergonomic guidelines for surgeons out there, but most surgeons don’t know about them,” said Tatiana Catanzarite, MD, who has conducted research on this topic. When she began looking into the problem of work-related injuries among surgeons, she was surprised at the dearth of published research. It’s no wonder then, said Dr. Catanzarite and other panel members, that most surgeons learn proper work posture on the fly and may or may not be using the most efficient and mechanically sound instrumentation angles when performing surgery.
Dr. Catanzarite, a female pelvic medicine and reconstructive surgery fellow at the University of California, San Diego, has just published a literature review on surgeon ergonomics. But reading about how to stand, how to hold instruments, and even how to sit at a robotic surgical console is no match for having an observer on the ground guiding and reinforcing work posture, she said. Unfortunately, that’s an unrealistic expectation for most surgeons, so Dr. Catanzarite is borrowing video-gaming technology to address the situation, she said in an interview.
She has adapted a popular video game motion-capture system that uses an infrared laser projector and a computer sensor to capture video data in three dimensions. The sensing range of the depth sensor is adjustable, and the software is capable of automatically calibrating the sensor based on the physical environment, accommodating the presence of obstacles and using infrared and depth cameras to capture a subject’s 3-D movements. The system doesn’t require bulky wearable components, “making it an ideal technology for the live operating room setting,” Dr. Catanzarite said. “In order to effectively assess surgical ergonomics, a less intrusive approach is needed, which can deliver precise reports on the body movements of the surgeons, as well as capturing the temporal distribution of different postures and limb angles.”
Dr. Catanzarite is using the system to launch an ergonomics assessment tool she calls Ergo-Kinect. The system will record surgeons’ movements in real time, gathering data about how they stand, move, and operate their instruments.
“Three-D interactive visualizations allow us to rotate and investigate specific motor activities from the collected data,” she said. The technology enables them to capture the movements of the surgeon and assign an ergonomic score for each movement. “Eventually we may be able to develop a system that can warn surgeons in real time if they are performing an activity which may be harmful from an ergonomics standpoint,” Dr. Catanzarite said.
The research is in its earliest phase – Dr. Catanzarite has only scanned a few surgeons. But she will continue to accrue data in order to eventually construct a system that could help surgeons of the future avoid the painful, and sometimes debilitating, physical costs of their career.
Dr. Catanzarite reported having no financial disclosures.
msullivan@frontlinemedcom.com
On Twitter @alz_gal
AT THE ACS CLINICAL CONGRESS
AML patients overestimate treatment risk and chance of cure
Older patients with acute myeloid leukemia (AML) tend to overestimate not only the risks of treatment, but also their likelihood of cure, according to the results of a 100-patient longitudinal study presented at the Palliative and Supportive Care in Oncology Symposium.
Compared with what their oncologists thought, patients were significantly more likely to believe they would die from treatment, said senior study author Areej El-Jawahri, MD, of Massachusetts General Hospital in Boston.
Yet when surveyed again 1 month later, they were significantly more likely to overestimate the chances of being cured, versus the chances of cure given by their oncologists.
“We really need interventions to facilitate communication and ensure accurate prognostic understanding in this patient population, where understanding the treatment risk and prognosis can have a significant effect on their treatment choices and treatment decisions,” Dr. El-Jawahri said in a press conference from the symposium, which was cosponsored by AAHPM, ASCO, ASTRO, and MASCC.
Patients were first surveyed within 72 hours of starting chemotherapy.
At that point, 91% of patients said it was somewhat likely (63%) or extremely likely (28%) they would die as a result of their treatment, but among their oncologists, only 22% said death due to treatment was somewhat likely, and none thought it was very likely, according to the presented data.
A much different picture emerged 1 month later, when 90% of patients said they were somewhat or very likely to be cured of their leukemia, while only 26% of physicians said it was somewhat likely for the patient to be cured.
For both the question on treatment risk and the question on cure potential, the differences between patient responses and physician responses was significant (P less than .001), according to Dr. El-Jawahri.
Of note, half of the patients (n = 50) received intensive chemotherapy, while the other half received nonintensive (that is, palliative) chemotherapy. Patients receiving palliative therapy were even more likely to overestimate their chances of cure, Dr. El-Jawahi said.
This study highlights how stress and anxiety might shape a patient’s perception of treatment and prognosis, and provides new evidence that “accurate knowledge” can lead to “efficiencies on both sides of this [doctor-patient] interface,” said Andrew S. Epstein, MD, of Memorial Sloan-Kettering Cancer Center, New York.
A shared understanding of prognosis and treatment risk between clinician and patient is “crucial in informed consent” and can help patients make better-informed decisions with their doctor, said Dr. Epstein, who was not involved with the study.
This study was funded by a grant from the National Cancer Institute. Dr. El-Jawahri, the senior author, reported no relevant financial disclosures.
FROM PALLONC 2017
Key clinical point: Acute myeloid leukemia (AML) patients overestimated both the risks of treatment and the chances of cure, compared with estimates from their own oncologists.
Major finding: Ninety-one percent of patients thought it was somewhat or extremely likely they would die from the treatment, while only 22% of oncologists said it was somewhat likely. A month later, 90% of patients thought it was somewhat or very likely they would be cured of their AML, but only 26% of oncologists said cure was somewhat likely.
Data source: A longitudinal study including 100 patients with newly diagnosed AML treated at one of two tertiary hospitals.
Disclosures: This study was funded by a grant from the National Cancer Institute. Dr. El-Jawahri, the senior author, reported no relevant financial disclosures.
Still too early to determine impact of 1-year deferral for MSM blood donors
SAN DIEGO – It’s still too early to assess the impact of new guidelines for blood donation by men who have had sex with men, Brian S. Custer, PhD, MPH, of Blood Systems Research Institute, San Francisco, said at the annual meeting of the American Association of Blood Banks.
In 2015, the U.S. Food and Drug Administration lifted its lifetime ban on blood donations by men who have sex with men (MSM) and changed it to a 1-year deferral policy. Based on this new guidance, many U.S. blood centers moved from an indefinite deferral for any man who reported having had sex with a man since 1977 to a 1-year deferral from last sexual contact with a man.
In their study, Dr. Custer and his colleagues assessed the impact of the change in policy on donors and whether there was any early evidence of a change in risk to blood recipients.
At their center, the 1-year deferral was implemented on Aug. 29, 2016. On the health questionnaire that potential donors must complete, males are now asked two questions – one regarding sexual contact with men in the previous 12 months, and another about sex with men since 1977.
The rates of deferral were evaluated in two 7-month periods before and after the policy change (September 2015-March 2016 and September 2016-March 2017). They also looked at donor requests to be reinstated in lieu of the new policy, along with infectious disease marker test results in accepted donors.
In 272,306 interviews conducted before the policy change, 408 men responded yes to having sex with men since 1977 and 370 were deferred.
For the 252,395 interviews conducted after the policy change, 245 men answered yes to having sexual contact with men in the previous 12 months, and 245 were deferred.
Some of the men who reported having sex with men before the policy change were evaluated and accepted as donors. Overall, the donor acceptance rate was 9.3% during the period before the policy change, and 64.2% for the period after the policy change.
“Only 67 men requested to be reinstated and have been reinstated, and 39 returned to donate. There have been 59 successful donations to date,” said Dr. Custer.
Some of the reinstated donors were deferred for reasons similar to those for deferral of donors who are not men who have sex with men. Although it is still too early to draw any conclusions, Dr. Custer noted that they are being cautious, because infectious markers still are running a little higher among male donors with a history of having sex with men and donors without such a history.
AT AABB2017
Key clinical point:
Major finding: Of 370 men deferred for blood donation because of ever having sex with a man since 1977, 67 have requested to be reinstated as donors under the new 1-year deferral policy and 39 returned to donate blood.
Data source: 272,306 interviews conducted before the policy change, and 252,395 interviews conducted after the policy change, at Blood Systems Research Institute.
Disclosures: Dr. Custer had no relevant financial disclosures.

Oligoclonal Bands Could Be a Valuable Criterion for the Diagnosis of MS
PARIS—Oligoclonal bands, together with symptomatic lesions disseminated in space, increase the risk of multiple sclerosis (MS), according to data presented at the Seventh Joint ECTRIMS–ACTRIMS Meeting. MRI dissemination in space (DIS) at any time plus positive oligoclonal bands should be considered as an additional criterion for MS diagnosis, according to the researchers.

Previous research has suggested that the presence of oligoclonal bands in typical clinically isolated syndromes (CIS) increases the risk of a second attack independently of MRI findings. Georgina Arrambide, MD, PhD, a neurologist at Vall d’Hebron University Hospital in Barcelona, and colleagues studied an ongoing CIS cohort to explore whether oligoclonal bands would be a valuable criterion for MS diagnosis in the context of the 2010 McDonald criteria.
An Examination of MRIs
The investigators obtained MRIs at three to five months after CIS diagnosis, at one year, and at every five years. Oligoclonal bands were determined by isoelectric focusing combined with immunoblotting. Dr. Arrambide and colleagues selected 565 patients with oligoclonal band determination and sufficient data on baseline brain MRI to assess 2010 DIS and dissemination in time (DIT) considering the symptomatic lesions. They excluded 167 participants (29.6%) who already fulfilled DIS and DIT criteria and divided the remaining 398 participants into groups with no DIS and no DIT (n = 218), DIS only (n = 164), and DIT only (n = 16).
Next, the researchers performed Cox proportional hazards regression models with 2010 McDonald as the outcome, using no DIS no DIT with no lesions (n = 107) as the reference for no DIS no DIT with one or more lesion, DIS only, and DIT only. To assess performance, Dr. Arrambide’s group selected cases with a follow-up of three or more years or a second attack within three years of the CIS (n = 305). These participants were divided into groups with no DIS and no DIT (n = 165), DIS only (n = 129), and DIT only (n = 11). The investigators classified participants with no DIS and no DIT with one or more lesion (n = 93) and DIS only according to their oligoclonal band status. They assessed sensitivity, specificity, accuracy, positive predictive value, and negative predictive value with 2010 McDonald at three years as the outcome.
Oligoclonal Bands Increased Risk of Conversion to MS
The adjusted hazard ratios of second attack were 2.8 for no DIS and no DIT with one or more lesion and negative oligoclonal bands, 6.4 for no DIS and no DIT with one or more lesion and positive oligoclonal bands, 9.7 for DIS only with negative oligoclonal bands, 14.8 for DIS only with positive oligoclonal bands, and 7.9 for DIT only. Regarding performance, specificity was 77.6 for no DIS no DIT with one or more lesion and negative oligoclonal bands, 89.1 for no DIS no DIT with one or more lesion and positive oligoclonal bands, 92.5 for DIS only and negative oligoclonal bands, 88.1 for DIS only and positive oligoclonal bands, and 97.8 for DIT only. DIS only with positive oligoclonal bands had the highest sensitivity (46.2), accuracy (64.6), and positive predictive value (83.2).
PARIS—Oligoclonal bands, together with symptomatic lesions disseminated in space, increase the risk of multiple sclerosis (MS), according to data presented at the Seventh Joint ECTRIMS–ACTRIMS Meeting. MRI dissemination in space (DIS) at any time plus positive oligoclonal bands should be considered as an additional criterion for MS diagnosis, according to the researchers.
Previous research has suggested that the presence of oligoclonal bands in typical clinically isolated syndromes (CIS) increases the risk of a second attack independently of MRI findings. Georgina Arrambide, MD, PhD, a neurologist at Vall d’Hebron University Hospital in Barcelona, and colleagues studied an ongoing CIS cohort to explore whether oligoclonal bands would be a valuable criterion for MS diagnosis in the context of the 2010 McDonald criteria.
An Examination of MRIs
The investigators obtained MRIs at three to five months after CIS diagnosis, at one year, and at every five years. Oligoclonal bands were determined by isoelectric focusing combined with immunoblotting. Dr. Arrambide and colleagues selected 565 patients with oligoclonal band determination and sufficient data on baseline brain MRI to assess 2010 DIS and dissemination in time (DIT) considering the symptomatic lesions. They excluded 167 participants (29.6%) who already fulfilled DIS and DIT criteria and divided the remaining 398 participants into groups with no DIS and no DIT (n = 218), DIS only (n = 164), and DIT only (n = 16).
Next, the researchers performed Cox proportional hazards regression models with 2010 McDonald as the outcome, using no DIS no DIT with no lesions (n = 107) as the reference for no DIS no DIT with one or more lesion, DIS only, and DIT only. To assess performance, Dr. Arrambide’s group selected cases with a follow-up of three or more years or a second attack within three years of the CIS (n = 305). These participants were divided into groups with no DIS and no DIT (n = 165), DIS only (n = 129), and DIT only (n = 11). The investigators classified participants with no DIS and no DIT with one or more lesion (n = 93) and DIS only according to their oligoclonal band status. They assessed sensitivity, specificity, accuracy, positive predictive value, and negative predictive value with 2010 McDonald at three years as the outcome.
Oligoclonal Bands Increased Risk of Conversion to MS
The adjusted hazard ratios of second attack were 2.8 for no DIS and no DIT with one or more lesion and negative oligoclonal bands, 6.4 for no DIS and no DIT with one or more lesion and positive oligoclonal bands, 9.7 for DIS only with negative oligoclonal bands, 14.8 for DIS only with positive oligoclonal bands, and 7.9 for DIT only. Regarding performance, specificity was 77.6 for no DIS no DIT with one or more lesion and negative oligoclonal bands, 89.1 for no DIS no DIT with one or more lesion and positive oligoclonal bands, 92.5 for DIS only and negative oligoclonal bands, 88.1 for DIS only and positive oligoclonal bands, and 97.8 for DIT only. DIS only with positive oligoclonal bands had the highest sensitivity (46.2), accuracy (64.6), and positive predictive value (83.2).
Pre-injury statin use found to benefit survival following TBI
SAN DIEGO – Patients who were on statins prior to sustaining a traumatic brain injury doubled their survival rate over those who were not on the drugs in a retrospective analysis.
The study provides preliminary data that can help set a framework to conduct larger, randomized, controlled trials to further evaluate the role of statins, which have been shown in animal models to improve outcomes after traumatic brain injury (TBI).
In an effort to evaluate the effect of pre-injury statins on outcomes after TBI, Dr. Lokhandwala, a general surgery resident at the University of Arizona, Tucson, and his associates identified all patients aged 40 years and older from the Multiparameter Intelligent Monitoring in Intensive Care (MIMIC) III database with a diagnosis of TBI and ICU length of stay of greater than 24 hours. They divided patients into two groups: those who were on statins and those who were not. The primary outcome was in-hospital survival. Secondary outcomes measures were hospital length of stay and ICU length of stay.
Dr. Lokhandwala, who is also a commissioned officer with the U.S. Army Reserves, reported results from 918 patients with a TBI. Their mean age was 55 years, 76% were white, and 22% were on statins. The overall in-hospital survival rate was 78.6%, while the median Glasgow Coma Scale was 12. The median hospital length of stay and ICU length of stay were 9.1 and 7.2 days, respectively. The researchers observed that compared with patients who were not on statins, those on statin therapy had significantly higher rates of survival (88% vs. 68.4%; P less than .001). However, there was no difference in hospital or ICU length of stay between the two groups (P = .19 and P = .39, respectively). On regression analysis after controlling for confounding factors, statin use was found to be an independent predictor of survival (odds ratio, 1.8; 95% confidence interval, 1.5-2.2; P less than .001).
“Even though we isolated our patients to TBI, there could have been other causes of their mortality, like a pulmonary embolism or a myocardial infarction,” Dr. Lokhandwala said. “We need to conduct a randomized, controlled trial to follow these individuals and see what their actual mortality is and look at their psychosocial outcomes to see if there’s a long-term benefit to statins. Do these people have decreased incidence of PTSD or are they more functional? Is it easier for them to hold a job or develop social relationships? The impact of post-injury statin use could also be studied.”
He went on to note that many studies have shown that aggressive team-based rehabilitation can improve outcomes in TBI patients. “Would we be able to include statin use in such a program to see if statins further improve outcomes faster or are there individuals that don’t benefit as much?” Dr. Lokhandwala asked. “This study sets up a framework to show that there is a strong association, and take this further in a more structured trial to see if there is any potential for therapeutic use in TBI.”
Dr. Lokhandwala reported having no financial disclosures.
AT THE ACS CLINICAL CONGRESS
Key clinical point:
Major finding: After controlling for confounding factors, statin use was found to be an independent predictor of survival following traumatic brain injury (OR, 1.8; 95% CI, 1.5-2.2; P less than .001).
Study details: A retrospective analysis of 918 patients who sustained a TBI.
Disclosures: Dr. Lokhandwala reported having no financial disclosures.
Only half of appropriate COPD patients get long-acting bronchodilators
Nearly half of Medicare beneficiaries with COPD are not being treated with recommended long-acting bronchodilator (LABD) maintenance therapy, based on study results scheduled to be presented at CHEST 2017.
Bartolome R. Celli, MD, FCCP, of Brigham and Women’s Hospital, Boston, and his colleagues will report results based on Medicare administrative data from 2010 to 2014 on 11,886 patients who had at least two outpatient visits for COPD within 30 days or at least one COPD-related hospitalization and received nebulized arformoterol therapy.
The findings should stimulate further study on why clinicians overrely on short-acting rather than the recommended long-acting bronchodilators for maintenance treatment of appropriate patients, according to the researchers’ abstract. Additionally, studies should examine triggers for initiating arformoterol, and link outcomes to arformoterol monotherapy vs. combination therapy. Such analyses could help advance clinical decision making, particularly for COPD patients with a history of exacerbations and hospitalizations.
Rates of medication initiation and treatment continuation or discontinuation within these classes were determined based on refill patterns following the start of arformoterol therapy. The researchers note that 42% of the patient cohort was 75 years or older, and 37% were dually eligible for Medicaid.
Overall, 46% of the cohort had received no LABD maintenance treatment in the 90 days prior to initiating arformoterol. Instead, they were being treated with a nebulized (50%) or an inhaled (37%) short-acting bronchodilator, a systemic corticosteroid (46%), and antibiotics (37%).
After starting arformoteral, 58% of beneficiaries received dual therapy. More than half of them, 52%, received LABA and inhaled/nebulized corticosteroids, 6% received LAMA/LAMA therapy, and 21% received triple-therapy (LABA/LAMA plus inhaled or nebulized corticosteroids). The other 20% received only arformoterol.
After initiating arformoterol, 41% of the cohort discontinued one or more classes of their pre-arformoteral medications. The largest decrease was a 23% drop in use of corticosteroids.
Dr. Celli is scheduled to present his research on Tuesday, Oct. 31, from 2:45 to 3:00 pm in Convention Center - 602B at the CHEST annual meeting. His presentation will be part of a session entitled “COPD: Lessons for the Real-World Management of Disease,” running from 2:45 to 4:15 pm.
One of the researchers is an employee of Sunovion Pharmaceuticals, and two others are with Advance Health Solutions.
FROM CHEST 2017
Key clinical point:
Major finding: Overall, 46% of COPD patients on Medicare had received no long-acting bronchodilator maintenance treatment in the 90 days before they started arformoterol therapy.
Data source: Medicare administrative data from 2010 to 2014 on 11,886 patients who had at least two outpatient visits for COPD within 30 days or at least one COPD-related hospitalization and received nebulized arformoteral therapy.
Disclosures: One of the researchers is an employee of Sunovion Pharmaceuticals, and two others are with Advance Health Solutions.
Vaccine renaissance
In 1967, pediatric patients were vaccinated routinely against eight diseases with 10 vaccines: smallpox; diphtheria; tetanus and pertussis; polio serotypes 1, 2, and 3; measles; rubella; and mumps. Then in 1989, vaccine discovery took a dramatic upward trend. For the physicians and scientists involved in vaccine discovery, the driving force may have been a passion for scientific discovery and a humanitarian motivation, but what drove this major change in pediatric infectious diseases was economics.

I believe The hiatus of more than 20 years between the introduction of the mumps vaccine in 1967 and that of the Hib vaccine in 1989 in my view was because the economic incentives to develop vaccines were absent. In fact, in the 1970s and early 1980s, vaccine manufacturers were drawing back from making vaccines because they were losing money selling them at a few dollars per dose.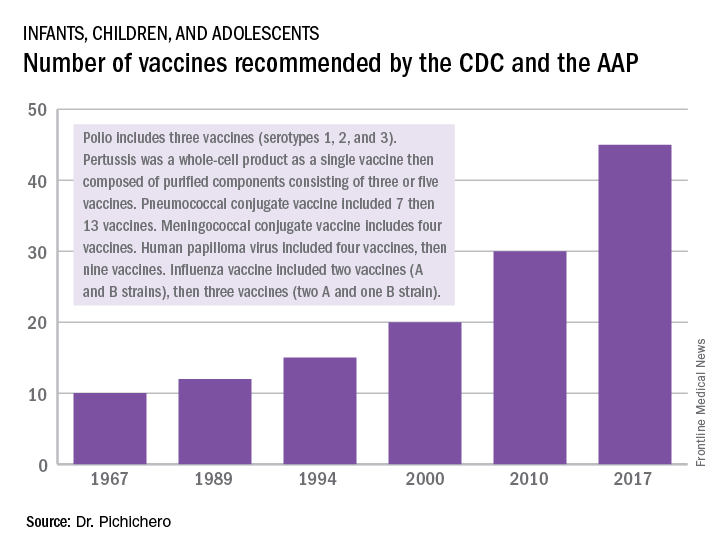
A trailblazing path had been created, and more and more vaccines have been discovered and come to market since then. Combination vaccines and vaccines for adolescents and adults have followed. The biggest blockbuster is Prevnar13 (actually 13 vaccines contained in a single combination), now with annual sales in excess of $7 billion worldwide and growing. Other vaccines with sales of a billion dollars or more are also on the market; anything in excess of $1 billion is considered a blockbuster in the pharmaceutical industry and gets the attention of CEOs (and investors) in a big way.
Dr. Pichichero, a specialist in pediatric infectious diseases, is director of the Research Institute at Rochester (N.Y.) General Hospital. He is also a pediatrician at Legacy Pediatrics in Rochester. He has received funding awarded to his institution for vaccine research from GlaxoSmithKline, Merck, Pfizer, and Sanofi Pasteur. Email him at pdnews@frontlinemedcom.com.
In 1967, pediatric patients were vaccinated routinely against eight diseases with 10 vaccines: smallpox; diphtheria; tetanus and pertussis; polio serotypes 1, 2, and 3; measles; rubella; and mumps. Then in 1989, vaccine discovery took a dramatic upward trend. For the physicians and scientists involved in vaccine discovery, the driving force may have been a passion for scientific discovery and a humanitarian motivation, but what drove this major change in pediatric infectious diseases was economics.
I believe The hiatus of more than 20 years between the introduction of the mumps vaccine in 1967 and that of the Hib vaccine in 1989 in my view was because the economic incentives to develop vaccines were absent. In fact, in the 1970s and early 1980s, vaccine manufacturers were drawing back from making vaccines because they were losing money selling them at a few dollars per dose.
A trailblazing path had been created, and more and more vaccines have been discovered and come to market since then. Combination vaccines and vaccines for adolescents and adults have followed. The biggest blockbuster is Prevnar13 (actually 13 vaccines contained in a single combination), now with annual sales in excess of $7 billion worldwide and growing. Other vaccines with sales of a billion dollars or more are also on the market; anything in excess of $1 billion is considered a blockbuster in the pharmaceutical industry and gets the attention of CEOs (and investors) in a big way.
Dr. Pichichero, a specialist in pediatric infectious diseases, is director of the Research Institute at Rochester (N.Y.) General Hospital. He is also a pediatrician at Legacy Pediatrics in Rochester. He has received funding awarded to his institution for vaccine research from GlaxoSmithKline, Merck, Pfizer, and Sanofi Pasteur. Email him at pdnews@frontlinemedcom.com.
Artemisinin: Its global impact on the treatment of malaria
Malaria remains a major international public health concern. In 2015, the World Health Organization estimated that 212 million individuals were infected and that there were 429,000 deaths. This represents a 21% decline in incidence globally and a 29% decline in global mortality between 2010 and 2015. In 2016, malaria was endemic in 91 countries and territories, down from 108 in 2000. Although malaria has been eliminated from the United States since the early 1950s, approximately 1,700 cases are reported annually, most of which occur in returned travelers, according to the Centers for Disease Control and Prevention.

Five species of Plasmodium (P. falciparum, P. vivax, P. malariae, P. ovale, and, more recently, P. knowelsi) account for most of the infections in humans and are transmitted by the bite of an infected female Anopheles mosquito. The disease is rarely acquired by blood transfusion, by needle sharing, by organ transplantation, or congenitally. Once diagnosed, malaria can be treated; however, delay in initiating therapy can lead to both serious and fatal outcomes.
Treatment
Historically, drug development was driven by the need to protect the military. While quinine was isolated from the bark of the cinchona tree in 1820, chloroquine, proguanil, mefloquine, and atovaquone each were developed during or after a military conflict during 1945-1985. Tetracycline/doxycycline and clindamycin also have antimalarial activity. Use of any of these agents as monotherapy has led to drug resistance and treatment failure.
Artemisinin
Artemisinin (also known as qinghao su) and its derivatives are a new class of antimalarials derived from the sweet wormwood plant Artemisia annua. Initially developed in China in the 1970s, this class gained global attention in the 1990s. and have the fastest parasite clearance time, rapid resolution of symptoms, and an excellent safety profile. They have activity against all Plasmodium species.
Because of artemisinins’ rapid elimination, they are used in combination with an agent that also kills blood parasites but has a slower elimination rate and a different mechanism of action. The goal is to prevent and delay the development of resistance and reduce recrudescence. The superiority of artemisinin-based combination therapy (ACT) over monotherapies has been documented.

Resistance, always a concern, has remained limited to specific areas in Southeast Asia since reported in 2008. Monitoring drug efficacy, safety, quality of antimalarials is ongoing, as is discouraging monotherapy use of these agents. Globally, artemisinins are the mainstay of treatment. Spread of resistance would be a major setback for both malaria control and elimination.
Dr. Word is a pediatric infectious disease specialist and director of the Houston Travel Medicine Clinic. She said she had no relevant financial disclosures. Email her at pdnews@frontlinemedcom.com.
Malaria remains a major international public health concern. In 2015, the World Health Organization estimated that 212 million individuals were infected and that there were 429,000 deaths. This represents a 21% decline in incidence globally and a 29% decline in global mortality between 2010 and 2015. In 2016, malaria was endemic in 91 countries and territories, down from 108 in 2000. Although malaria has been eliminated from the United States since the early 1950s, approximately 1,700 cases are reported annually, most of which occur in returned travelers, according to the Centers for Disease Control and Prevention.
Five species of Plasmodium (P. falciparum, P. vivax, P. malariae, P. ovale, and, more recently, P. knowelsi) account for most of the infections in humans and are transmitted by the bite of an infected female Anopheles mosquito. The disease is rarely acquired by blood transfusion, by needle sharing, by organ transplantation, or congenitally. Once diagnosed, malaria can be treated; however, delay in initiating therapy can lead to both serious and fatal outcomes.
Treatment
Historically, drug development was driven by the need to protect the military. While quinine was isolated from the bark of the cinchona tree in 1820, chloroquine, proguanil, mefloquine, and atovaquone each were developed during or after a military conflict during 1945-1985. Tetracycline/doxycycline and clindamycin also have antimalarial activity. Use of any of these agents as monotherapy has led to drug resistance and treatment failure.
Artemisinin
Artemisinin (also known as qinghao su) and its derivatives are a new class of antimalarials derived from the sweet wormwood plant Artemisia annua. Initially developed in China in the 1970s, this class gained global attention in the 1990s. and have the fastest parasite clearance time, rapid resolution of symptoms, and an excellent safety profile. They have activity against all Plasmodium species.
Because of artemisinins’ rapid elimination, they are used in combination with an agent that also kills blood parasites but has a slower elimination rate and a different mechanism of action. The goal is to prevent and delay the development of resistance and reduce recrudescence. The superiority of artemisinin-based combination therapy (ACT) over monotherapies has been documented.
Resistance, always a concern, has remained limited to specific areas in Southeast Asia since reported in 2008. Monitoring drug efficacy, safety, quality of antimalarials is ongoing, as is discouraging monotherapy use of these agents. Globally, artemisinins are the mainstay of treatment. Spread of resistance would be a major setback for both malaria control and elimination.
Dr. Word is a pediatric infectious disease specialist and director of the Houston Travel Medicine Clinic. She said she had no relevant financial disclosures. Email her at pdnews@frontlinemedcom.com.
Nurse practitioner/pediatrician collaboration: Try a pediatric health care/medical home model
The first nurse practitioner program owes much to Henry K. Silver, MD, a pediatrician, an endocrinologist, and a pioneer who was influential in the development of innovative educational programs for advanced pediatric health care providers. Dr. Silver, then a professor at the University of Colorado School of Medicine in Aurora, with Loretta Ford, EdD, a pediatric nurse and professor at the same university’s School of Nursing, developed that program in 1967 (Pediatrics. 1967;39[5]:756-60). They were responding to a serious shortage of pediatric providers, especially in rural and low socioeconomic areas. Pediatric nurses learned about primary care, office-based practice that included evaluating children with hearing and speech deficits, nutritional needs, vision impairment, and other congenital and acute problems. They made home visits and participated in follow-up of children with medical, surgical, and mental health concerns.
Now, more than 50 years later, an era when health care for children is at the forefront of policy and financial concerns, children are surviving longer with chronic and complex illness, and receive sophisticated therapies for medical and surgical problems. The definition of family is very different from that used in the 1960s, and challenges in health care provision begin with identification of basic needs such as food and shelter. In light of the risks for children today, there are many more opportunities for pediatricians and pediatric nurse practitioners (PNPs) to collaborate, especially in planning complex care strategies.
One example for collaboration is within the pediatric health care/medical home model (PHC/MHM). Practices, whether primary or subspecialty, can benefit patients and their families by providing a coordinated model of comprehensive care, especially for children who are at greatest identified risk. In addition, the PHC/MHM practice can receive insurance reimbursement benefits, and demonstrate a decrease in hospitalization rates, improved health care quality, and increased patient satisfaction (JAMA. 2014 Dec 24-31;312[24]:2640-8).
The American Academy of Pediatrics defines the medical home as “a model of delivering primary care that is accessible, continuous, family centered, coordinated, compassionate, and culturally effective to every child and adolescent” (Pediatrics. 2002. doi: 10.1542/peds.110.1.184). The National Association of Pediatric Nurse Practitioners (NAPNAP) describes the pediatric health care/medical home as a “model of care that promotes holistic care of children and their families where each patient/family has an ongoing relationship with a health care professional” (J Pediatr Health Care. 2015. doi: 10.1016/j.pedhc.2015.10.010). This is an approach to providing comprehensive pediatric care that facilitates partnerships between patients, providers, and families, which is not contained within the walls of the office or building.
By virtue of their designation and training, nurses provide care for the patient in a holistic fashion, including physical care, therapeutic treatments, education, and coordination of services. Primary care nurse practitioners are trained in health promotion and prevention. They receive advanced level education in pharmacology, pathophysiology, and physical assessment, diagnosis, and management. The combination of skills between the PNP and the pediatrician are complementary and, as history suggests, can result in improved patient care. In 1967, Dr. Silver and Ms. Ford reported: “It is becoming increasingly clear that competent professional nurses working cooperatively with physicians can make greater contributions to patient care.” The PHC/MHM is an excellent opportunity for collaboration between pediatricians and NPs.
Examples of collaboration in the PHC/MHM
Building the PHC/MHM requires an evidence base, with data obtained from EHRs and current research, but also founded on individual practice culture, type of practice, and patients served. Physician and NP collaboration in collecting, reviewing, and applying this evidence can result in the development of unique guidelines for that specific practice. Patients who are considered at risk for frequent illness and hospitalizations, or who have multisystem problems, including mental health or social issues, are primary candidates who can benefit from the medical home model. The NP, by virtue of leadership training, can assist in coordinating care teams, procedures, and office staff.
Cheryl Samuels, PNP, works at the University of Texas Health Science Center at Houston, McGovern Medical School in the UT Physicians High Risk Clinic, along with two other PNPs and two pediatricians. Their collaboration has resulted in the development of a certified health care home for children with complex illness. This practice has continued to collect data and publish research to document the effectiveness of their program. One recent study was a randomized controlled trial demonstrating cost efficiency and decreased serious illness when children with complex needs are cared for in a medical home (JAMA. 2014 Dec 24-31;312[24]:2640-8). Ms. Samuels and her colleagues published, “Case for the use of a nurse practitioner in the care of children with medical complexity,” in which they described the role of the NP and benefits in utilizing these skills in the multifaceted care of children with chronic and complex illness (Children [Basel]. 2017 Apr. doi: 10.3390/children4040024).

At the University of California, Los Angeles, Mattel Children’s Hospital, the pediatric medical home program provides primary care services and care coordination for more than 300 children, adolescents, and young adults with medical complexity. Nurse practitioner Siem Ia oversees the coordination of care for these patients, and collaborates with a team of four attending physicians, resident physicians, care coordinators, and an administrative assistant. These children have multisystem problems requiring multiple specialty services, and frequent hospitalizations. Ms. Ia works with her colleagues to ensure patients and families are provided with care that is aligned with the AAP and NAPNAP medical home principles. This team is now involved in a national collaborative project that aims to improve health outcomes for children with medical complexity, and enhance family partnerships to support the health of the child and promote family well being. She also has provided clinical expertise for the recently completed randomized, controlled trial aimed at reducing utilization for children with medical complexity through care coordination and health education.
These are just a few examples of the possibilities when pediatricians and NPs collaborate to influence and change models of primary patient care. The medical care of any child can be multifaceted, with increasing complexity, and require vigilance and thoughtful planning to be successful. Outcomes from these attempts documented in the literature include opportunities for certification and accreditation, insurance reimbursement at incentive levels, and, most importantly, patient and family satisfaction.
Dr. Haut is a PNP at Beacon Pediatrics, a large primary care practice in Rehoboth Beach, Del. She also works part time for Pediatrix Medical Group, serving the pediatric intensive care unit medical team at the Herman & Walter Samuelson Children’s Hospital at Sinai in Baltimore and as adjunct faculty at the University of Maryland School of Nursing, also in Baltimore.
The first nurse practitioner program owes much to Henry K. Silver, MD, a pediatrician, an endocrinologist, and a pioneer who was influential in the development of innovative educational programs for advanced pediatric health care providers. Dr. Silver, then a professor at the University of Colorado School of Medicine in Aurora, with Loretta Ford, EdD, a pediatric nurse and professor at the same university’s School of Nursing, developed that program in 1967 (Pediatrics. 1967;39[5]:756-60). They were responding to a serious shortage of pediatric providers, especially in rural and low socioeconomic areas. Pediatric nurses learned about primary care, office-based practice that included evaluating children with hearing and speech deficits, nutritional needs, vision impairment, and other congenital and acute problems. They made home visits and participated in follow-up of children with medical, surgical, and mental health concerns.
Now, more than 50 years later, an era when health care for children is at the forefront of policy and financial concerns, children are surviving longer with chronic and complex illness, and receive sophisticated therapies for medical and surgical problems. The definition of family is very different from that used in the 1960s, and challenges in health care provision begin with identification of basic needs such as food and shelter. In light of the risks for children today, there are many more opportunities for pediatricians and pediatric nurse practitioners (PNPs) to collaborate, especially in planning complex care strategies.
One example for collaboration is within the pediatric health care/medical home model (PHC/MHM). Practices, whether primary or subspecialty, can benefit patients and their families by providing a coordinated model of comprehensive care, especially for children who are at greatest identified risk. In addition, the PHC/MHM practice can receive insurance reimbursement benefits, and demonstrate a decrease in hospitalization rates, improved health care quality, and increased patient satisfaction (JAMA. 2014 Dec 24-31;312[24]:2640-8).
The American Academy of Pediatrics defines the medical home as “a model of delivering primary care that is accessible, continuous, family centered, coordinated, compassionate, and culturally effective to every child and adolescent” (Pediatrics. 2002. doi: 10.1542/peds.110.1.184). The National Association of Pediatric Nurse Practitioners (NAPNAP) describes the pediatric health care/medical home as a “model of care that promotes holistic care of children and their families where each patient/family has an ongoing relationship with a health care professional” (J Pediatr Health Care. 2015. doi: 10.1016/j.pedhc.2015.10.010). This is an approach to providing comprehensive pediatric care that facilitates partnerships between patients, providers, and families, which is not contained within the walls of the office or building.
By virtue of their designation and training, nurses provide care for the patient in a holistic fashion, including physical care, therapeutic treatments, education, and coordination of services. Primary care nurse practitioners are trained in health promotion and prevention. They receive advanced level education in pharmacology, pathophysiology, and physical assessment, diagnosis, and management. The combination of skills between the PNP and the pediatrician are complementary and, as history suggests, can result in improved patient care. In 1967, Dr. Silver and Ms. Ford reported: “It is becoming increasingly clear that competent professional nurses working cooperatively with physicians can make greater contributions to patient care.” The PHC/MHM is an excellent opportunity for collaboration between pediatricians and NPs.
Examples of collaboration in the PHC/MHM
Building the PHC/MHM requires an evidence base, with data obtained from EHRs and current research, but also founded on individual practice culture, type of practice, and patients served. Physician and NP collaboration in collecting, reviewing, and applying this evidence can result in the development of unique guidelines for that specific practice. Patients who are considered at risk for frequent illness and hospitalizations, or who have multisystem problems, including mental health or social issues, are primary candidates who can benefit from the medical home model. The NP, by virtue of leadership training, can assist in coordinating care teams, procedures, and office staff.
Cheryl Samuels, PNP, works at the University of Texas Health Science Center at Houston, McGovern Medical School in the UT Physicians High Risk Clinic, along with two other PNPs and two pediatricians. Their collaboration has resulted in the development of a certified health care home for children with complex illness. This practice has continued to collect data and publish research to document the effectiveness of their program. One recent study was a randomized controlled trial demonstrating cost efficiency and decreased serious illness when children with complex needs are cared for in a medical home (JAMA. 2014 Dec 24-31;312[24]:2640-8). Ms. Samuels and her colleagues published, “Case for the use of a nurse practitioner in the care of children with medical complexity,” in which they described the role of the NP and benefits in utilizing these skills in the multifaceted care of children with chronic and complex illness (Children [Basel]. 2017 Apr. doi: 10.3390/children4040024).
At the University of California, Los Angeles, Mattel Children’s Hospital, the pediatric medical home program provides primary care services and care coordination for more than 300 children, adolescents, and young adults with medical complexity. Nurse practitioner Siem Ia oversees the coordination of care for these patients, and collaborates with a team of four attending physicians, resident physicians, care coordinators, and an administrative assistant. These children have multisystem problems requiring multiple specialty services, and frequent hospitalizations. Ms. Ia works with her colleagues to ensure patients and families are provided with care that is aligned with the AAP and NAPNAP medical home principles. This team is now involved in a national collaborative project that aims to improve health outcomes for children with medical complexity, and enhance family partnerships to support the health of the child and promote family well being. She also has provided clinical expertise for the recently completed randomized, controlled trial aimed at reducing utilization for children with medical complexity through care coordination and health education.
These are just a few examples of the possibilities when pediatricians and NPs collaborate to influence and change models of primary patient care. The medical care of any child can be multifaceted, with increasing complexity, and require vigilance and thoughtful planning to be successful. Outcomes from these attempts documented in the literature include opportunities for certification and accreditation, insurance reimbursement at incentive levels, and, most importantly, patient and family satisfaction.
Dr. Haut is a PNP at Beacon Pediatrics, a large primary care practice in Rehoboth Beach, Del. She also works part time for Pediatrix Medical Group, serving the pediatric intensive care unit medical team at the Herman & Walter Samuelson Children’s Hospital at Sinai in Baltimore and as adjunct faculty at the University of Maryland School of Nursing, also in Baltimore.
DMTs Reduce the Risk of Conversion to Secondary Progressive MS
PARIS—Secondary progressive multiple sclerosis (MS) is at least partly a consequence of early inflammation, and the risk of conversion from relapsing-remitting MS to secondary progressive MS is modifiable over five years with existing disease-modifying therapies (DMTs), according to research described at the Seventh Joint ECTRIMS–ACTRIMS Meeting. High-efficacy therapies such as alemtuzumab and natalizumab reduce the risk to a greater extent than do other DMTs.
Current immunotherapies do not slow secondary progressive MS after disease onset. The extent to which secondary progressive MS reflects early inflammation is not certain. Also unclear is whether conversion to secondary progressive MS might be modified by immunomodulatory DMTs during the relapsing-remitting phase.
Using an objective definition of secondary progressive MS published by Lorscheider et al in 2016, J. William L. Brown, MD, of the Queen Square MS Center at University College of London Institute of Neurology, and colleagues examined whether DMTs delay or reduce conversion from relapsing-remitting MS to secondary progressive MS. They examined patients with relapsing-remitting MS who participated in the MSBase database and were treated with a single DMT with at least four years of on-treatment follow-up. In all, 240 patients received injectables (ie, interferons or glatiramer acetate), 109 took fingolimod, 93 received natalizumab, and 44 took alemtuzumab.
Participants were each propensity matched to untreated patients with relapsing-remitting MS from a historical cohort (n = 622; mean follow-up, 9.2 years) and then matched to different DMT groups. Patients were matched on gender, baseline age, annualized-relapse rate, Expanded Disability Status Scale (EDSS) score, and disease duration. The researchers used weighted conditional proportional hazards models adjusted for EDSS frequency with pairwise censoring to compare the proportions of patients in each group who were free from conversion to secondary progressive MS.
Because lower-efficacy drug groups may have been biased towards participants with milder disease through excluding patients with multiple DMTs (such as treatment escalators), the investigators limited the injectables group to patients followed up before higher-efficacy drugs became available in 2006.
All DMTs reduced the hazard of conversion to secondary progressive MS, compared with different groups of matched untreated patients, in a series of pairwise analyses. For injectables, the hazard ratio (HR) of conversion to secondary progressive MS was 0.31 (median censored on-treatment follow-up, 7.9 years). For fingolimod, the HR was 0.23 (follow-up, 4.6 years). Natalizumab was associated with an HR of 0.50 (follow-up, 4.9 years). Alemtuzumab had an HR of 0.60 (follow-up, 7.2 years).
When the investigators matched patients between the treated cohorts, they found no significant difference in rate of conversion to secondary progressive MS between alemtuzumab and natalizumab. Alemtuzumab and natalizumab were therefore combined in a category of high-efficacy therapies (n = 118) and matched and compared with the injectables group (n = 236). High-efficacy therapies conferred greater protection against conversion to secondary progressive MS than injectables did (HR, 0.65; follow-up, 5.7 years).