User login
Focused Ethnography of Diagnosis in Academic Medical Centers
Diagnostic error—defined as a failure to establish an accurate and timely explanation of the patient’s health problem—is an important source of patient harm.1 Data suggest that all patients will experience at least 1 diagnostic error in their lifetime.2-4 Not surprisingly, diagnostic errors are among the leading categories of paid malpractice claims in the United States.5
Despite diagnostic errors being morbid and sometimes deadly in the hospital,6,7 little is known about how residents and learners approach diagnostic decision making. Errors in diagnosis are believed to stem from cognitive or system failures,8 with errors in cognition believed to occur due to rapid, reflexive thinking operating in the absence of a more analytical, deliberate process. System-based problems (eg, lack of expert availability, technology barriers, and access to data) have also been cited as contributors.9 However, whether and how these apply to trainees is not known.
Therefore, we conducted a focused ethnography of inpatient medicine teams (ie, attendings, residents, interns, and medical students) in 2 affiliated teaching hospitals, aiming to (a) observe the process of diagnosis by trainees and (b) identify methods to improve the diagnostic process and prevent errors.
METHODS
We designed a multimethod, focused ethnographic study to examine diagnostic decision making in hospital settings.10,11 In contrast to anthropologic ethnographies that study entire fields using open-ended questions, our study was designed to examine the process of diagnosis from the perspective of clinicians engaged in this activity.11 This approach allowed us to capture diagnostic decisions and cognitive and system-based factors in a manner currently lacking in the literature.12
Setting and Participants
Between January 2016 and May 2016, we observed the members of four inpatient internal medicine teaching teams at 2 affiliated teaching hospitals. We purposefully selected teaching teams for observation because they are the primary model of care in academic settings and we have expertise in carrying out similar studies.13,14 Teaching teams typically consisted of a medical attending (senior-level physician), 1 senior resident (a second- or third-year postgraduate trainee), two interns (a trainee in their first postgraduate year), and two to four medical students. Teams were selected at random using existing schedules and followed Monday to Friday so as to permit observation of work on call and noncall days. Owing to manpower limitations, weekend and night shifts were not observed. However, overnight events were captured during morning rounds.
Most of the teams began rounds at 8:30 AM. Typically, rounds lasted for 90–120 min and concluded with a recap (ie, “running the list”) with a review of explicit plans for patients after they had been evaluated by the attending. This discussion often occurred in the team rooms, with the attending leading the discussion with the trainees.
Data Collection
A multidisciplinary team, including clinicians (eg, physicians, nurses), nonclinicians (eg, qualitative researchers, social scientists), and healthcare engineers, conducted the observations. We observed preround activities of interns and residents before arrival of the attending (7:00 AM - 8:30 AM), followed by morning rounds with the entire team, and afternoon work that included senior residents, interns, and students.
To capture multiple aspects of the diagnostic process, we collected data using field notes modeled on components of the National Academy of Science model for diagnosis (Appendix).1,15 This model encompasses phases of the diagnostic process (eg, data gathering, integration, formulation of a working diagnosis, treatment delivery, and outcomes) and the work system (team members, organization, technology and tools, physical environment, tasks).
Focus Groups and Interviews
At the end of weekly observations, we conducted focus groups with the residents and one-on- one interviews with the attendings. Focus groups with the residents were conducted to encourage a group discussion about the diagnostic process. Separate interviews with the attendings were performed to ensure that power differentials did not influence discussions. During focus groups, we specifically asked about challenges and possible solutions to improve diagnosis. Experienced qualitative methodologists (J.F., M.H., M.Q.) used semistructured interview guides for discussions (Appendix).
Data Analysis
After aggregating and reading the data, three reviewers (V.C., S.K., S.S.) began inductive analysis by handwriting notes and initial reflective thoughts to create preliminary codes. Multiple team members then reread the original field notes and the focus group/interview data to refine the preliminary codes and develop additional codes. Next, relationships between codes were identified and used to develop key themes. Triangulation of data collected from observations and interview/focus group sessions was carried out to compare data that we surmised with data that were verbalized by the team. The developed themes were discussed as a group to ensure consistency of major findings.
Ethical and Regulatory Oversight
This study was reviewed and approved by the Institutional Review Boards at the University of Michigan Health System (HUM-00106657) and the VA Ann Arbor Healthcare System (1-2016-010040).
RESULTS
Four teaching teams (4 attendings, 4 senior residents, 9 interns, and 14 medical students) were observed over 33 distinct shifts and 168 hours. Observations included morning rounds (96 h), postround call days (52 h), and postround non-call days (20 h). Morning rounds lasted an average of 127 min (range: 48-232 min) and included an average of 9 patients (range: 4-16 patients).
Themes Regarding the Diagnostic Process
We identified the following 4 primary themes related to the diagnostic process in teaching hospitals: (1) diagnosis is a social phenomenon; (2) data necessary to make diagnoses are fragmented; (3) distractions undermine the diagnostic process; and (4) time pressures interfere with diagnostic decision making (Appendix Table 1).
(1) Diagnosis is a Social Phenomenon.
Team members viewed the process of diagnosis as a social exchange of facts, findings, and strategies within a defined structure. The opportunity to discuss impressions with others was valued as a means to share, test, and process assumptions.
“Rounds are the most important part of the process. That is where we make most decisions in a collective, collaborative way with the attending present. We bounce ideas off each other.” (Intern)
Typical of social processes, variations based on time of day and schedule were observed. For instance, during call days, learners gathered data and formed working diagnosis and treatment plans with minimal attending interaction. This separation of roles and responsibilities introduced a hierarchy within diagnosis as follows:
“The interns would not call me first; they would talk to the senior resident and then if the senior thought he should chat with me, then they would call. But for the most part, they gather information and come up with the plan.” (Attending).
The work system was suited to facilitate social interactions. For instance, designated rooms (with team members informally assigned to a computer) provided physical proximity of the resident to interns and medical students. In this space, numerous informal discussions between team members (eg, “What do you think about this test?” “I’m not sure what to do about this finding.” “Should I call a [consult] on this patient?”) were observed. Although proximity to each other was viewed as beneficial, dangers to the social nature of diagnosis in the form of anchoring (ie, a cognitive bias where emphasis is placed on the first piece of data)16 were also mentioned. Similarly, the paradox associated with social proof (ie, the pressure to assume conformity within a group) was also observed as disagreement between team members and attendings rarely occurred during observations.
“I mean, they’re the attending, right? It’s hard to argue with them when they want a test or something done. When I do push back, it’s rare that others will support me–so it’s usually me and the attending.” (Resident)
“I would push back if I think it’s really bad for the patient or could cause harm–but the truth is, it doesn’t happen much.” (Intern)
(2) Data Necessary to Make Diagnoses are Fragmented
Team members universally cited fragmentation in data delivery, retrieval, and processing as a barrier to diagnosis. Team members indicated that test results might not be looked at or acted upon in a timely manner, and participants pointed to the electronic medical record as a source of this challenge.
“Before I knew about [the app for Epic], I would literally sit on the computer to get all the information we would need on rounds. Its key to making decisions. We often say we will do something, only to find the test result doesn’t support it–and then we’re back to square 1.” (Intern)
Information used by teams came from myriad sources (eg, patients, family members, electronic records) and from various settings (eg, emergency department, patient rooms, discussions with consultants). Additionally, test results often appeared without warning. Thus, availability of information was poorly aligned with clinical duties.
“They (the lab) will call us when a blood culture is positive or something is off. That is very helpful but it often comes later in the day, when we’re done with rounds.” (Resident)
The work system was highlighted as a key contributor to data fragmentation. Peculiarities of our electronic medical record (EMR) and how data were collected, stored, or presented were described as “frustrating,” and “unsafe,” by team members. Correspondingly, we frequently observed interns asking for assistance for tasks such as ordering tests or finding information despite being “trained” to use the EMR.
“People have to learn how to filter, how to recognize the most important points and link data streams together in terms of causality. But we assume they know where to find that information. It’s actually a very hard thing to do, for both the house staff and me.” (Attending)
(3) Distractions Undermine the Diagnostic Process
Distractions often created cognitive difficulties. For example, ambient noise and interruptions from neighbors working on other teams were cited as barriers to diagnosis. In addition, we observed several team members using headphones to drown out ambient noise while working on the computer.
“I know I shouldn’t do it (wear headphones), but I have no other way of turning down the noise so I can concentrate.” (Intern)
Similarly, the unpredictable nature and the volume of pages often interrupted thinking about diagnosis.
“Sometimes the pager just goes off all the time and (after making sure its not an urgent issue), I will just ignore it for a bit, especially if I am in the middle of something. It would be great if I could finish my thought process knowing I would not be interrupted.” (Resident)
To mitigate this problem, 1 attending described how he would proactively seek out nurses caring for his patients to “head off” questions (eg, “I will renew the restraints and medications this morning,” and “Is there anything you need in terms of orders for this patient that I can take care of now?”) that might lead to pages. Another resident described his approach as follows:
“I make it a point to tell the nurses where I will be hanging out and where they can find me if they have any questions. I tell them to come talk to me rather than page me since that will be less distracting.” (Resident).
Most of the interns described documentation work such as writing admission and progress notes in negative terms (“an academic exercise,” “part of the billing activity”). However, in the context of interruptions, some described this as helpful.
“The most valuable part of the thinking process was writing the assessment and plan because that’s actually my schema for all problems. It literally is the only time where I can sit and collect my thoughts to formulate a diagnosis and plan.” (Intern)
(4) Time Pressures Interfere With Diagnostic Decision Making
All team members spoke about the challenge of finding time for diagnosis during the workday. Often, they had to skip learning sessions for this purpose.
“They tell us we should go to morning report or noon conference but when I’m running around trying to get things done. I hate having to choose between my education and doing what’s best for the patient–but that’s often what it comes down to.” (Intern)
When specifically asked whether setting aside dedicated time to specifically review and formulate diagnoses would be valuable, respondents were uniformly enthusiastic. Team members described attentional conflicts as being the worst when “cross covering” other teams on call days, as their patient load effectively doubled during this time. Of note, cross-covering occurred when teams were also on call—and thus took them away from important diagnostic activities such as data gathering or synthesis for patients they were admitting.
“If you were to ever design a system where errors were likely–this is how you would design it: take a team with little supervision, double their patient load, keep them busy with new challenging cases and then ask questions about patients they know little about.” (Resident)
DISCUSSION
Although diagnostic errors have been called “the next frontier for patient safety,”17 little is known about the process, barriers, and facilitators to diagnosis in teaching hospitals. In this focused ethnography conducted at 2 academic medical centers, we identified multiple cognitive and system-level challenges and potential strategies to improve diagnosis from trainees engaged in this activity. Key themes identified by those we observed included the social nature of diagnosis, fragmented information delivery, constant distractions and interruptions, and time pressures. In turn, these insights allow us to generate strategies that can be applied to improve the diagnostic process in teaching hospitals.
Our study underscores the importance of social interactions in diagnosis. In contrast, most of the interventions to prevent diagnostic errors target individual providers through practices such as metacognition and “thinking about thinking.”18-20 These interventions are based on Daniel Kahnemann’s work on dual thought process. Type 1 thought processes are fast, subconscious, reflexive, largely intuitive, and more vulnerable to error. In contrast, Type 2 processes are slower, deliberate, analytic, and less prone to error.21 Although an individual’s Type 2 thought capacity is limited, a major goal of cognitive interventions is to encourage Type 2 over Type 1 thinking, an approach termed “de-biasing.”22-24 Unfortunately, cognitive interventions testing such approaches have suffered mixed results–perhaps because of lack of focus on collective wisdom or group thinking, which may be key to diagnosis from our findings.9,25 In this sense, morning rounds were a social gathering used to strategize and develop care plans, but with limited time to think about diagnosis.26 Introduction of defined periods for individuals to engage in diagnostic activities such as de-biasing (ie, asking “what else could this be)27 before or after rounds may provide an opportunity for reflection and improving diagnosis. In addition, embedding tools such as diagnosis expanders and checklists within these defined time slots28,29 may prove to be useful in reflecting on diagnosis and preventing diagnostic errors.
An unexpected yet important finding from this study were the challenges posed by distractions and the physical environment. Potentially maladaptive workarounds to these interruptions included use of headphones; more productive strategies included updating nurses with plans to avert pages and creating a list of activities to ensure that key tasks were not forgotten.30,31 Applying lessons from aviation, a focused effort to limit distractions during key portions of the day, might be worth considering for diagnostic safety.32 Similarly, improving the environment in which diagnosis occurs—including creating spaces that are quiet, orderly, and optimized for thinking—may be valuable.33Our study has limitations. First, our findings are limited to direct observations; we are thus unable to comment on how unobserved aspects of care (eg, cognitive processes) might have influenced our findings. Our observations of clinical care might also have introduced a Hawthorne effect. However, because we were closely integrated with teams and conducted focus groups to corroborate our assessments, we believe that this was not the case. Second, we did not identify diagnostic errors or link processes we observed to errors. Third, our approach is limited to 2 teaching centers, thereby limiting the generalizability of findings. Relatedly, we were only able to conduct observations during weekdays; differences in weekend and night resources might affect our insights.
The cognitive and system-based barriers faced by clinicians in teaching hospitals suggest that new methods to improve diagnosis are needed. Future interventions such as defined “time-outs” for diagnosis, strategies focused on limiting distractions, and methods to improve communication between team members are novel and have parallels in other industries. As challenges to quantify diagnostic errors abound,34 improving cognitive- and system-based factors via reflection through communication, concentration, and organization is necessary to improve medical decision making in academic medical centers.
Disclosures
None declared for all coauthors.
Funding
This project was supported by grant number P30HS024385 from the Agency for Healthcare Research and Quality. The funding source played no role in study design, data acquisition, analysis or decision to report these data. Dr. Chopra is supported by a career development award from the Agency of Healthcare Research and Quality (1-K08-HS022835-01). Dr. Krein is supported by a VA Health Services Research and Development Research Career Scientist Award (RCS 11-222). Dr. Singh is partially supported by Houston VA HSR&D Center for Innovations in Quality, Effectiveness and Safety (CIN 13-413). The content is solely the responsibility of the authors and does not necessarily represent the official views of the Agency for Healthcare Research and Quality or the Department of Veterans Affairs.
1. National Academies of Sciences, Engineering, and Medicine. 2015. Improving Diagnosis in Health Care. Washington, DC: The National Academies Press. http://www.nap.edu/21794. Accessed November 1; 2016:2015. https://doi.org/10.17226/21794.
2. Schiff GD, Hasan O, Kim S, et al. Diagnostic error in medicine: analysis of 583 physician-reported errors. Arch Intern Med. 2009;169(20):1881-1887. http://dx.doi.org/10.1001/archinternmed.2009.333. PubMed
3. Sonderegger-Iseli K, Burger S, Muntwyler J, Salomon F. Diagnostic errors in three medical eras: A necropsy study. Lancet. 2000;355(9220):2027-2031. http://dx.doi.org/10.1016/S0140-6736(00)02349-7. PubMed
4. Winters B, Custer J, Galvagno SM Jr, et al. Diagnostic errors in the intensive care unit: a systematic review of autopsy studies. BMJ Qual Saf. 2012;21(11):894-902. http://dx.doi.org/10.1136/bmjqs-2012-000803. PubMed
5. Saber Tehrani AS, Lee H, Mathews SC, et al. 25-Year summary of US malpractice claims for diagnostic errors 1986-2010: an analysis from the National Practitioner Data Bank. BMJ Qual Saf. 2013;22(8):672-680. http://dx.doi.org/10.1136/bmjqs-2012-001550. PubMed
6. Graber M, Gordon R, Franklin N. Reducing diagnostic errors in medicine: what’s the goal? Acad Med. 2002;77(10):981-992. http://dx.doi.org/10.1097/00001888-200210000-00009. PubMed
7. Gupta A, Snyder A, Kachalia A, Flanders S, Saint S, Chopra V. Malpractice claims related to diagnostic errors in the hospital. BMJ Qual Saf. 2018;27(1):53-60. 10.1136/bmjqs-2017-006774. PubMed
8. van Noord I, Eikens MP, Hamersma AM, de Bruijne MC. Application of root cause analysis on malpractice claim files related to diagnostic failures. Qual Saf Health Care. 2010;19(6):e21. http://dx.doi.org/10.1136/qshc.2008.029801. PubMed
9. Croskerry P, Petrie DA, Reilly JB, Tait G. Deciding about fast and slow decisions. Acad Med. 2014;89(2):197-200. 10.1097/ACM.0000000000000121. PubMed
10. Higginbottom GM, Pillay JJ, Boadu NY. Guidance on performing focused ethnographies with an emphasis on healthcare research. Qual Rep. 2013;18(9):1-6. https://doi.org/10.7939/R35M6287P.
11. Savage J. Participative observation: standing in the shoes of others? Qual Health Res. 2000;10(3):324-339. http://dx.doi.org/10.1177/104973200129118471. PubMed
12. Patton MQ. Qualitative Research and Evaluation Methods. 3rd ed. Thousand Oaks, CA: SAGE Publications; 2002.
13. Harrod M, Weston LE, Robinson C, Tremblay A, Greenstone CL, Forman J. “It goes beyond good camaraderie”: A qualitative study of the process of becoming an interprofessional healthcare “teamlet.” J Interprof Care. 2016;30(3):295-300. http://dx.doi.org/10.3109/13561820.2015.1130028. PubMed
14. Houchens N, Harrod M, Moody S, Fowler KE, Saint S. Techniques and behaviors associated with exemplary inpatient general medicine teaching: an exploratory qualitative study. J Hosp Med. 2017;12(7):503-509. http://dx.doi.org/10.12788/jhm.2763. PubMed
15. Mulhall A. In the field: notes on observation in qualitative research. J Adv Nurs. 2003;41(3):306-313. http://dx.doi.org/10.1046/j.1365-2648.2003.02514.x. PubMed
16. Zwaan L, Monteiro S, Sherbino J, Ilgen J, Howey B, Norman G. Is bias in the eye of the beholder? A vignette study to assess recognition of cognitive biases in clinical case workups. BMJ Qual Saf. 2017;26(2):104-110. http://dx.doi.org/10.1136/bmjqs-2015-005014. PubMed
17. Singh H, Graber ML. Improving diagnosis in health care--the next imperative for patient safety. N Engl J Med. 2015;373(26):2493-2495. http://dx.doi.org/10.1056/NEJMp1512241. PubMed
18. Croskerry P. From mindless to mindful practice--cognitive bias and clinical decision making. N Engl J Med. 2013;368(26):2445-2448. http://dx.doi.org/10.1056/NEJMp1303712. PubMed
19. van den Berge K, Mamede S. Cognitive diagnostic error in internal medicine. Eur J Intern Med. 2013;24(6):525-529. http://dx.doi.org/10.1016/j.ejim.2013.03.006. PubMed
20. Norman G, Sherbino J, Dore K, et al. The etiology of diagnostic errors: A controlled trial of system 1 versus system 2 reasoning. Acad Med. 2014;89(2):277-284. 10.1097/ACM.0000000000000105 PubMed
21. Dhaliwal G. Premature closure? Not so fast. BMJ Qual Saf. 2017;26(2):87-89. http://dx.doi.org/10.1136/bmjqs-2016-005267. PubMed
22. Croskerry P, Singhal G, Mamede S. Cognitive debiasing 1: Origins of bias and theory of debiasing. BMJ Qual Saf. 2013;22(suppl 2):ii58-iiii64. http://dx.doi.org/10.1136/bmjqs-2012-001712. PubMed
23. Croskerry P, Singhal G, Mamede S. Cognitive debiasing 2: Impediments to and strategies for change. BMJ Qual Saf. 2013;22(suppl 2):ii65-iiii72. http://dx.doi.org/10.1136/bmjqs-2012-001713. PubMed
24. Reilly JB, Ogdie AR, Von Feldt JM, Myers JS. Teaching about how doctors think: a longitudinal curriculum in cognitive bias and diagnostic error for residents. BMJ Qual Saf. 2013;22(12):1044-1050. http://dx.doi.org/10.1136/bmjqs-2013-001987. PubMed
25. Schmidt HG, Mamede S, van den Berge K, van Gog T, van Saase JL, Rikers RM. Exposure to media information about a disease can cause doctors to misdiagnose similar-looking clinical cases. Acad Med. 2014;89(2):285-291. http://dx.doi.org/10.1097/ACM.0000000000000107. PubMed
26. Hess BJ, Lipner RS, Thompson V, Holmboe ES, Graber ML. Blink or think: can further reflection improve initial diagnostic impressions? Acad Med. 2015;90(1):112-118. http://dx.doi.org/10.1097/ACM.0000000000000550. PubMed
27. Lambe KA, O’Reilly G, Kelly BD, Curristan S. Dual-process cognitive interventions to enhance diagnostic reasoning: A systematic review. BMJ Qual Saf. 2016;25(10):808-820. http://dx.doi.org/10.1136/bmjqs-2015-004417. PubMed
28. Graber ML, Kissam S, Payne VL, et al. Cognitive interventions to reduce diagnostic error: a narrative review. BMJ Qual Saf. 2012;21(7):535-557. http://dx.doi.org/10.1136/bmjqs-2011-000149. PubMed
29. McDonald KM, Matesic B, Contopoulos-Ioannidis DG, et al. Patient safety strategies targeted at diagnostic errors: a systematic review. Ann Intern Med. 2013;158(5 Pt 2):381-389. http://dx.doi.org/10.7326/0003-4819-158-5-201303051-00004. PubMed
30. Wray CM, Chaudhry S, Pincavage A, et al. Resident shift handoff strategies in US internal medicine residency programs. JAMA. 2016;316(21):2273-2275. http://dx.doi.org/10.1001/jama.2016.17786. PubMed
31. Choo KJ, Arora VM, Barach P, Johnson JK, Farnan JM. How do supervising physicians decide to entrust residents with unsupervised tasks? A qualitative analysis. J Hosp Med. 2014;9(3):169-175. http://dx.doi.org/10.1002/jhm.2150. PubMed
32. Carayon P, Wood KE. Patient safety - the role of human factors and systems engineering. Stud Health Technol Inform. 2010;153:23-46.
.http://dx.doi.org/10.1001/jama.2015.13453 PubMed
34. McGlynn EA, McDonald KM, Cassel CK. Measurement is essential for improving diagnosis and reducing diagnostic error: A report from the Institute of Medicine. JAMA. 2015;314(23):2501-2502.
.http://dx.doi.org/10.1136/bmjqs-2013-001812 PubMed
33. Carayon P, Xie A, Kianfar S. Human factors and ergonomics as a patient safety practice. BMJ Qual Saf. 2014;23(3):196-205. PubMed
Diagnostic error—defined as a failure to establish an accurate and timely explanation of the patient’s health problem—is an important source of patient harm.1 Data suggest that all patients will experience at least 1 diagnostic error in their lifetime.2-4 Not surprisingly, diagnostic errors are among the leading categories of paid malpractice claims in the United States.5
Despite diagnostic errors being morbid and sometimes deadly in the hospital,6,7 little is known about how residents and learners approach diagnostic decision making. Errors in diagnosis are believed to stem from cognitive or system failures,8 with errors in cognition believed to occur due to rapid, reflexive thinking operating in the absence of a more analytical, deliberate process. System-based problems (eg, lack of expert availability, technology barriers, and access to data) have also been cited as contributors.9 However, whether and how these apply to trainees is not known.
Therefore, we conducted a focused ethnography of inpatient medicine teams (ie, attendings, residents, interns, and medical students) in 2 affiliated teaching hospitals, aiming to (a) observe the process of diagnosis by trainees and (b) identify methods to improve the diagnostic process and prevent errors.
METHODS
We designed a multimethod, focused ethnographic study to examine diagnostic decision making in hospital settings.10,11 In contrast to anthropologic ethnographies that study entire fields using open-ended questions, our study was designed to examine the process of diagnosis from the perspective of clinicians engaged in this activity.11 This approach allowed us to capture diagnostic decisions and cognitive and system-based factors in a manner currently lacking in the literature.12
Setting and Participants
Between January 2016 and May 2016, we observed the members of four inpatient internal medicine teaching teams at 2 affiliated teaching hospitals. We purposefully selected teaching teams for observation because they are the primary model of care in academic settings and we have expertise in carrying out similar studies.13,14 Teaching teams typically consisted of a medical attending (senior-level physician), 1 senior resident (a second- or third-year postgraduate trainee), two interns (a trainee in their first postgraduate year), and two to four medical students. Teams were selected at random using existing schedules and followed Monday to Friday so as to permit observation of work on call and noncall days. Owing to manpower limitations, weekend and night shifts were not observed. However, overnight events were captured during morning rounds.
Most of the teams began rounds at 8:30 AM. Typically, rounds lasted for 90–120 min and concluded with a recap (ie, “running the list”) with a review of explicit plans for patients after they had been evaluated by the attending. This discussion often occurred in the team rooms, with the attending leading the discussion with the trainees.
Data Collection
A multidisciplinary team, including clinicians (eg, physicians, nurses), nonclinicians (eg, qualitative researchers, social scientists), and healthcare engineers, conducted the observations. We observed preround activities of interns and residents before arrival of the attending (7:00 AM - 8:30 AM), followed by morning rounds with the entire team, and afternoon work that included senior residents, interns, and students.
To capture multiple aspects of the diagnostic process, we collected data using field notes modeled on components of the National Academy of Science model for diagnosis (Appendix).1,15 This model encompasses phases of the diagnostic process (eg, data gathering, integration, formulation of a working diagnosis, treatment delivery, and outcomes) and the work system (team members, organization, technology and tools, physical environment, tasks).
Focus Groups and Interviews
At the end of weekly observations, we conducted focus groups with the residents and one-on- one interviews with the attendings. Focus groups with the residents were conducted to encourage a group discussion about the diagnostic process. Separate interviews with the attendings were performed to ensure that power differentials did not influence discussions. During focus groups, we specifically asked about challenges and possible solutions to improve diagnosis. Experienced qualitative methodologists (J.F., M.H., M.Q.) used semistructured interview guides for discussions (Appendix).
Data Analysis
After aggregating and reading the data, three reviewers (V.C., S.K., S.S.) began inductive analysis by handwriting notes and initial reflective thoughts to create preliminary codes. Multiple team members then reread the original field notes and the focus group/interview data to refine the preliminary codes and develop additional codes. Next, relationships between codes were identified and used to develop key themes. Triangulation of data collected from observations and interview/focus group sessions was carried out to compare data that we surmised with data that were verbalized by the team. The developed themes were discussed as a group to ensure consistency of major findings.
Ethical and Regulatory Oversight
This study was reviewed and approved by the Institutional Review Boards at the University of Michigan Health System (HUM-00106657) and the VA Ann Arbor Healthcare System (1-2016-010040).
RESULTS
Four teaching teams (4 attendings, 4 senior residents, 9 interns, and 14 medical students) were observed over 33 distinct shifts and 168 hours. Observations included morning rounds (96 h), postround call days (52 h), and postround non-call days (20 h). Morning rounds lasted an average of 127 min (range: 48-232 min) and included an average of 9 patients (range: 4-16 patients).
Themes Regarding the Diagnostic Process
We identified the following 4 primary themes related to the diagnostic process in teaching hospitals: (1) diagnosis is a social phenomenon; (2) data necessary to make diagnoses are fragmented; (3) distractions undermine the diagnostic process; and (4) time pressures interfere with diagnostic decision making (Appendix Table 1).
(1) Diagnosis is a Social Phenomenon.
Team members viewed the process of diagnosis as a social exchange of facts, findings, and strategies within a defined structure. The opportunity to discuss impressions with others was valued as a means to share, test, and process assumptions.
“Rounds are the most important part of the process. That is where we make most decisions in a collective, collaborative way with the attending present. We bounce ideas off each other.” (Intern)
Typical of social processes, variations based on time of day and schedule were observed. For instance, during call days, learners gathered data and formed working diagnosis and treatment plans with minimal attending interaction. This separation of roles and responsibilities introduced a hierarchy within diagnosis as follows:
“The interns would not call me first; they would talk to the senior resident and then if the senior thought he should chat with me, then they would call. But for the most part, they gather information and come up with the plan.” (Attending).
The work system was suited to facilitate social interactions. For instance, designated rooms (with team members informally assigned to a computer) provided physical proximity of the resident to interns and medical students. In this space, numerous informal discussions between team members (eg, “What do you think about this test?” “I’m not sure what to do about this finding.” “Should I call a [consult] on this patient?”) were observed. Although proximity to each other was viewed as beneficial, dangers to the social nature of diagnosis in the form of anchoring (ie, a cognitive bias where emphasis is placed on the first piece of data)16 were also mentioned. Similarly, the paradox associated with social proof (ie, the pressure to assume conformity within a group) was also observed as disagreement between team members and attendings rarely occurred during observations.
“I mean, they’re the attending, right? It’s hard to argue with them when they want a test or something done. When I do push back, it’s rare that others will support me–so it’s usually me and the attending.” (Resident)
“I would push back if I think it’s really bad for the patient or could cause harm–but the truth is, it doesn’t happen much.” (Intern)
(2) Data Necessary to Make Diagnoses are Fragmented
Team members universally cited fragmentation in data delivery, retrieval, and processing as a barrier to diagnosis. Team members indicated that test results might not be looked at or acted upon in a timely manner, and participants pointed to the electronic medical record as a source of this challenge.
“Before I knew about [the app for Epic], I would literally sit on the computer to get all the information we would need on rounds. Its key to making decisions. We often say we will do something, only to find the test result doesn’t support it–and then we’re back to square 1.” (Intern)
Information used by teams came from myriad sources (eg, patients, family members, electronic records) and from various settings (eg, emergency department, patient rooms, discussions with consultants). Additionally, test results often appeared without warning. Thus, availability of information was poorly aligned with clinical duties.
“They (the lab) will call us when a blood culture is positive or something is off. That is very helpful but it often comes later in the day, when we’re done with rounds.” (Resident)
The work system was highlighted as a key contributor to data fragmentation. Peculiarities of our electronic medical record (EMR) and how data were collected, stored, or presented were described as “frustrating,” and “unsafe,” by team members. Correspondingly, we frequently observed interns asking for assistance for tasks such as ordering tests or finding information despite being “trained” to use the EMR.
“People have to learn how to filter, how to recognize the most important points and link data streams together in terms of causality. But we assume they know where to find that information. It’s actually a very hard thing to do, for both the house staff and me.” (Attending)
(3) Distractions Undermine the Diagnostic Process
Distractions often created cognitive difficulties. For example, ambient noise and interruptions from neighbors working on other teams were cited as barriers to diagnosis. In addition, we observed several team members using headphones to drown out ambient noise while working on the computer.
“I know I shouldn’t do it (wear headphones), but I have no other way of turning down the noise so I can concentrate.” (Intern)
Similarly, the unpredictable nature and the volume of pages often interrupted thinking about diagnosis.
“Sometimes the pager just goes off all the time and (after making sure its not an urgent issue), I will just ignore it for a bit, especially if I am in the middle of something. It would be great if I could finish my thought process knowing I would not be interrupted.” (Resident)
To mitigate this problem, 1 attending described how he would proactively seek out nurses caring for his patients to “head off” questions (eg, “I will renew the restraints and medications this morning,” and “Is there anything you need in terms of orders for this patient that I can take care of now?”) that might lead to pages. Another resident described his approach as follows:
“I make it a point to tell the nurses where I will be hanging out and where they can find me if they have any questions. I tell them to come talk to me rather than page me since that will be less distracting.” (Resident).
Most of the interns described documentation work such as writing admission and progress notes in negative terms (“an academic exercise,” “part of the billing activity”). However, in the context of interruptions, some described this as helpful.
“The most valuable part of the thinking process was writing the assessment and plan because that’s actually my schema for all problems. It literally is the only time where I can sit and collect my thoughts to formulate a diagnosis and plan.” (Intern)
(4) Time Pressures Interfere With Diagnostic Decision Making
All team members spoke about the challenge of finding time for diagnosis during the workday. Often, they had to skip learning sessions for this purpose.
“They tell us we should go to morning report or noon conference but when I’m running around trying to get things done. I hate having to choose between my education and doing what’s best for the patient–but that’s often what it comes down to.” (Intern)
When specifically asked whether setting aside dedicated time to specifically review and formulate diagnoses would be valuable, respondents were uniformly enthusiastic. Team members described attentional conflicts as being the worst when “cross covering” other teams on call days, as their patient load effectively doubled during this time. Of note, cross-covering occurred when teams were also on call—and thus took them away from important diagnostic activities such as data gathering or synthesis for patients they were admitting.
“If you were to ever design a system where errors were likely–this is how you would design it: take a team with little supervision, double their patient load, keep them busy with new challenging cases and then ask questions about patients they know little about.” (Resident)
DISCUSSION
Although diagnostic errors have been called “the next frontier for patient safety,”17 little is known about the process, barriers, and facilitators to diagnosis in teaching hospitals. In this focused ethnography conducted at 2 academic medical centers, we identified multiple cognitive and system-level challenges and potential strategies to improve diagnosis from trainees engaged in this activity. Key themes identified by those we observed included the social nature of diagnosis, fragmented information delivery, constant distractions and interruptions, and time pressures. In turn, these insights allow us to generate strategies that can be applied to improve the diagnostic process in teaching hospitals.
Our study underscores the importance of social interactions in diagnosis. In contrast, most of the interventions to prevent diagnostic errors target individual providers through practices such as metacognition and “thinking about thinking.”18-20 These interventions are based on Daniel Kahnemann’s work on dual thought process. Type 1 thought processes are fast, subconscious, reflexive, largely intuitive, and more vulnerable to error. In contrast, Type 2 processes are slower, deliberate, analytic, and less prone to error.21 Although an individual’s Type 2 thought capacity is limited, a major goal of cognitive interventions is to encourage Type 2 over Type 1 thinking, an approach termed “de-biasing.”22-24 Unfortunately, cognitive interventions testing such approaches have suffered mixed results–perhaps because of lack of focus on collective wisdom or group thinking, which may be key to diagnosis from our findings.9,25 In this sense, morning rounds were a social gathering used to strategize and develop care plans, but with limited time to think about diagnosis.26 Introduction of defined periods for individuals to engage in diagnostic activities such as de-biasing (ie, asking “what else could this be)27 before or after rounds may provide an opportunity for reflection and improving diagnosis. In addition, embedding tools such as diagnosis expanders and checklists within these defined time slots28,29 may prove to be useful in reflecting on diagnosis and preventing diagnostic errors.
An unexpected yet important finding from this study were the challenges posed by distractions and the physical environment. Potentially maladaptive workarounds to these interruptions included use of headphones; more productive strategies included updating nurses with plans to avert pages and creating a list of activities to ensure that key tasks were not forgotten.30,31 Applying lessons from aviation, a focused effort to limit distractions during key portions of the day, might be worth considering for diagnostic safety.32 Similarly, improving the environment in which diagnosis occurs—including creating spaces that are quiet, orderly, and optimized for thinking—may be valuable.33Our study has limitations. First, our findings are limited to direct observations; we are thus unable to comment on how unobserved aspects of care (eg, cognitive processes) might have influenced our findings. Our observations of clinical care might also have introduced a Hawthorne effect. However, because we were closely integrated with teams and conducted focus groups to corroborate our assessments, we believe that this was not the case. Second, we did not identify diagnostic errors or link processes we observed to errors. Third, our approach is limited to 2 teaching centers, thereby limiting the generalizability of findings. Relatedly, we were only able to conduct observations during weekdays; differences in weekend and night resources might affect our insights.
The cognitive and system-based barriers faced by clinicians in teaching hospitals suggest that new methods to improve diagnosis are needed. Future interventions such as defined “time-outs” for diagnosis, strategies focused on limiting distractions, and methods to improve communication between team members are novel and have parallels in other industries. As challenges to quantify diagnostic errors abound,34 improving cognitive- and system-based factors via reflection through communication, concentration, and organization is necessary to improve medical decision making in academic medical centers.
Disclosures
None declared for all coauthors.
Funding
This project was supported by grant number P30HS024385 from the Agency for Healthcare Research and Quality. The funding source played no role in study design, data acquisition, analysis or decision to report these data. Dr. Chopra is supported by a career development award from the Agency of Healthcare Research and Quality (1-K08-HS022835-01). Dr. Krein is supported by a VA Health Services Research and Development Research Career Scientist Award (RCS 11-222). Dr. Singh is partially supported by Houston VA HSR&D Center for Innovations in Quality, Effectiveness and Safety (CIN 13-413). The content is solely the responsibility of the authors and does not necessarily represent the official views of the Agency for Healthcare Research and Quality or the Department of Veterans Affairs.
1. National Academies of Sciences, Engineering, and Medicine. 2015. Improving Diagnosis in Health Care. Washington, DC: The National Academies Press. http://www.nap.edu/21794. Accessed November 1; 2016:2015. https://doi.org/10.17226/21794.
2. Schiff GD, Hasan O, Kim S, et al. Diagnostic error in medicine: analysis of 583 physician-reported errors. Arch Intern Med. 2009;169(20):1881-1887. http://dx.doi.org/10.1001/archinternmed.2009.333. PubMed
3. Sonderegger-Iseli K, Burger S, Muntwyler J, Salomon F. Diagnostic errors in three medical eras: A necropsy study. Lancet. 2000;355(9220):2027-2031. http://dx.doi.org/10.1016/S0140-6736(00)02349-7. PubMed
4. Winters B, Custer J, Galvagno SM Jr, et al. Diagnostic errors in the intensive care unit: a systematic review of autopsy studies. BMJ Qual Saf. 2012;21(11):894-902. http://dx.doi.org/10.1136/bmjqs-2012-000803. PubMed
5. Saber Tehrani AS, Lee H, Mathews SC, et al. 25-Year summary of US malpractice claims for diagnostic errors 1986-2010: an analysis from the National Practitioner Data Bank. BMJ Qual Saf. 2013;22(8):672-680. http://dx.doi.org/10.1136/bmjqs-2012-001550. PubMed
6. Graber M, Gordon R, Franklin N. Reducing diagnostic errors in medicine: what’s the goal? Acad Med. 2002;77(10):981-992. http://dx.doi.org/10.1097/00001888-200210000-00009. PubMed
7. Gupta A, Snyder A, Kachalia A, Flanders S, Saint S, Chopra V. Malpractice claims related to diagnostic errors in the hospital. BMJ Qual Saf. 2018;27(1):53-60. 10.1136/bmjqs-2017-006774. PubMed
8. van Noord I, Eikens MP, Hamersma AM, de Bruijne MC. Application of root cause analysis on malpractice claim files related to diagnostic failures. Qual Saf Health Care. 2010;19(6):e21. http://dx.doi.org/10.1136/qshc.2008.029801. PubMed
9. Croskerry P, Petrie DA, Reilly JB, Tait G. Deciding about fast and slow decisions. Acad Med. 2014;89(2):197-200. 10.1097/ACM.0000000000000121. PubMed
10. Higginbottom GM, Pillay JJ, Boadu NY. Guidance on performing focused ethnographies with an emphasis on healthcare research. Qual Rep. 2013;18(9):1-6. https://doi.org/10.7939/R35M6287P.
11. Savage J. Participative observation: standing in the shoes of others? Qual Health Res. 2000;10(3):324-339. http://dx.doi.org/10.1177/104973200129118471. PubMed
12. Patton MQ. Qualitative Research and Evaluation Methods. 3rd ed. Thousand Oaks, CA: SAGE Publications; 2002.
13. Harrod M, Weston LE, Robinson C, Tremblay A, Greenstone CL, Forman J. “It goes beyond good camaraderie”: A qualitative study of the process of becoming an interprofessional healthcare “teamlet.” J Interprof Care. 2016;30(3):295-300. http://dx.doi.org/10.3109/13561820.2015.1130028. PubMed
14. Houchens N, Harrod M, Moody S, Fowler KE, Saint S. Techniques and behaviors associated with exemplary inpatient general medicine teaching: an exploratory qualitative study. J Hosp Med. 2017;12(7):503-509. http://dx.doi.org/10.12788/jhm.2763. PubMed
15. Mulhall A. In the field: notes on observation in qualitative research. J Adv Nurs. 2003;41(3):306-313. http://dx.doi.org/10.1046/j.1365-2648.2003.02514.x. PubMed
16. Zwaan L, Monteiro S, Sherbino J, Ilgen J, Howey B, Norman G. Is bias in the eye of the beholder? A vignette study to assess recognition of cognitive biases in clinical case workups. BMJ Qual Saf. 2017;26(2):104-110. http://dx.doi.org/10.1136/bmjqs-2015-005014. PubMed
17. Singh H, Graber ML. Improving diagnosis in health care--the next imperative for patient safety. N Engl J Med. 2015;373(26):2493-2495. http://dx.doi.org/10.1056/NEJMp1512241. PubMed
18. Croskerry P. From mindless to mindful practice--cognitive bias and clinical decision making. N Engl J Med. 2013;368(26):2445-2448. http://dx.doi.org/10.1056/NEJMp1303712. PubMed
19. van den Berge K, Mamede S. Cognitive diagnostic error in internal medicine. Eur J Intern Med. 2013;24(6):525-529. http://dx.doi.org/10.1016/j.ejim.2013.03.006. PubMed
20. Norman G, Sherbino J, Dore K, et al. The etiology of diagnostic errors: A controlled trial of system 1 versus system 2 reasoning. Acad Med. 2014;89(2):277-284. 10.1097/ACM.0000000000000105 PubMed
21. Dhaliwal G. Premature closure? Not so fast. BMJ Qual Saf. 2017;26(2):87-89. http://dx.doi.org/10.1136/bmjqs-2016-005267. PubMed
22. Croskerry P, Singhal G, Mamede S. Cognitive debiasing 1: Origins of bias and theory of debiasing. BMJ Qual Saf. 2013;22(suppl 2):ii58-iiii64. http://dx.doi.org/10.1136/bmjqs-2012-001712. PubMed
23. Croskerry P, Singhal G, Mamede S. Cognitive debiasing 2: Impediments to and strategies for change. BMJ Qual Saf. 2013;22(suppl 2):ii65-iiii72. http://dx.doi.org/10.1136/bmjqs-2012-001713. PubMed
24. Reilly JB, Ogdie AR, Von Feldt JM, Myers JS. Teaching about how doctors think: a longitudinal curriculum in cognitive bias and diagnostic error for residents. BMJ Qual Saf. 2013;22(12):1044-1050. http://dx.doi.org/10.1136/bmjqs-2013-001987. PubMed
25. Schmidt HG, Mamede S, van den Berge K, van Gog T, van Saase JL, Rikers RM. Exposure to media information about a disease can cause doctors to misdiagnose similar-looking clinical cases. Acad Med. 2014;89(2):285-291. http://dx.doi.org/10.1097/ACM.0000000000000107. PubMed
26. Hess BJ, Lipner RS, Thompson V, Holmboe ES, Graber ML. Blink or think: can further reflection improve initial diagnostic impressions? Acad Med. 2015;90(1):112-118. http://dx.doi.org/10.1097/ACM.0000000000000550. PubMed
27. Lambe KA, O’Reilly G, Kelly BD, Curristan S. Dual-process cognitive interventions to enhance diagnostic reasoning: A systematic review. BMJ Qual Saf. 2016;25(10):808-820. http://dx.doi.org/10.1136/bmjqs-2015-004417. PubMed
28. Graber ML, Kissam S, Payne VL, et al. Cognitive interventions to reduce diagnostic error: a narrative review. BMJ Qual Saf. 2012;21(7):535-557. http://dx.doi.org/10.1136/bmjqs-2011-000149. PubMed
29. McDonald KM, Matesic B, Contopoulos-Ioannidis DG, et al. Patient safety strategies targeted at diagnostic errors: a systematic review. Ann Intern Med. 2013;158(5 Pt 2):381-389. http://dx.doi.org/10.7326/0003-4819-158-5-201303051-00004. PubMed
30. Wray CM, Chaudhry S, Pincavage A, et al. Resident shift handoff strategies in US internal medicine residency programs. JAMA. 2016;316(21):2273-2275. http://dx.doi.org/10.1001/jama.2016.17786. PubMed
31. Choo KJ, Arora VM, Barach P, Johnson JK, Farnan JM. How do supervising physicians decide to entrust residents with unsupervised tasks? A qualitative analysis. J Hosp Med. 2014;9(3):169-175. http://dx.doi.org/10.1002/jhm.2150. PubMed
32. Carayon P, Wood KE. Patient safety - the role of human factors and systems engineering. Stud Health Technol Inform. 2010;153:23-46.
.http://dx.doi.org/10.1001/jama.2015.13453 PubMed
34. McGlynn EA, McDonald KM, Cassel CK. Measurement is essential for improving diagnosis and reducing diagnostic error: A report from the Institute of Medicine. JAMA. 2015;314(23):2501-2502.
.http://dx.doi.org/10.1136/bmjqs-2013-001812 PubMed
33. Carayon P, Xie A, Kianfar S. Human factors and ergonomics as a patient safety practice. BMJ Qual Saf. 2014;23(3):196-205. PubMed
© 2018 Society of Hospital Medicine
Appraising the Evidence Supporting Choosing Wisely® Recommendations
As healthcare costs rise, physicians and other stakeholders are now seeking innovative and effective ways to reduce the provision of low-value services.1,2 The Choosing Wisely® campaign aims to further this goal by promoting lists of specific procedures, tests, and treatments that providers should avoid in selected clinical settings.3 On February 21, 2013, the Society of Hospital Medicine (SHM) released 2 Choosing Wisely® lists consisting of adult and pediatric services that are seen as costly to consumers and to the healthcare system, but which are often nonbeneficial or even harmful.4,5 A total of 80 physician and nurse specialty societies have joined in submitting additional lists.
Despite the growing enthusiasm for this effort, questions remain regarding the Choosing Wisely® campaign’s ability to initiate the meaningful de-adoption of low-value services. Specifically, prior efforts to reduce the use of services deemed to be of questionable benefit have met several challenges.2,6 Early analyses of the Choosing Wisely® recommendations reveal similar roadblocks and variable uptakes of several recommendations.7-10 While the reasons for difficulties in achieving de-adoption are broad, one important factor in whether clinicians are willing to follow guideline recommendations from such initiatives as Choosing Wisely®is the extent to which they believe in the underlying evidence.11 The current work seeks to formally evaluate the evidence supporting the Choosing Wisely® recommendations, and to compare the quality of evidence supporting SHM lists to other published Choosing Wisely® lists.
METHODS
Data Sources
Using the online listing of published Choosing Wisely® recommendations, a dataset was generated incorporating all 320 recommendations comprising the 58 lists published through August, 2014; these include both the adult and pediatric hospital medicine lists released by the SHM.4,5,12 Although data collection ended at this point, this represents a majority of all 81 lists and 535 recommendations published through December, 2017. The reviewers (A.J.A., A.G., M.W., T.S.V., M.S., and C.R.C) extracted information about the references cited for each recommendation.
Data Analysis
The reviewers obtained each reference cited by a Choosing Wisely® recommendation and categorized it by evidence strength along the following hierarchy: clinical practice guideline (CPG), primary research, review article, expert opinion, book, or others/unknown. CPGs were used as the highest level of evidence based on standard expectations for methodological rigor.13 Primary research was further rated as follows: systematic reviews and meta-analyses, randomized controlled trials (RCTs), observational studies, and case series. Each recommendation was graded using only the strongest piece of evidence cited.
Guideline Appraisal
We further sought to evaluate the strength of referenced CPGs. To accomplish this, a 10% random sample of the Choosing Wisely® recommendations citing CPGs was selected, and the referenced CPGs were obtained. Separately, CPGs referenced by the SHM-published adult and pediatric lists were also obtained. For both groups, one CPG was randomly selected when a recommendation cited more than one CPG. These guidelines were assessed using the Appraisal of Guidelines for Research and Evaluation (AGREE) II instrument, a widely used instrument designed to assess CPG quality.14,15 AGREE II consists of 25 questions categorized into 6 domains: scope and purpose, stakeholder involvement, rigor of development, clarity of presentation, applicability, and editorial independence. Guidelines are also assigned an overall score. Two trained reviewers (A.J.A. and A.G.) assessed each of the sampled CPGs using a standardized form. Scores were then standardized using the method recommended by the instrument and reported as a percentage of available points. Although a standard interpretation of scores is not provided by the instrument, prior applications deemed scores below 50% as deficient16,17. When a recommendation item cited multiple CPGs, one was randomly selected. We also abstracted data on the year of publication, the evidence grade assigned to specific items recommended by Choosing Wisely®, and whether the CPG addressed the referring recommendation. All data management and analysis were conducted using Stata (V14.2, StataCorp, College Station, Texas).
RESULTS
A total of 320 recommendations were considered in our analysis, including 10 published across the 2 hospital medicine lists. When limited to the highest quality citation for each of the recommendations, 225 (70.3%) cited CPGs, whereas 71 (22.2%) cited primary research articles (Table 1). Specifically, 29 (9.1%) cited systematic reviews and meta-analyses, 28 (8.8%) cited observational studies, and 13 (4.1%) cited RCTs. One recommendation (0.3%) cited a case series as its highest level of evidence, 7 (2.2%) cited review articles, 7 (2.2%) cited editorials or opinion pieces, and 10 (3.1%) cited other types of documents, such as websites or books. Among hospital medicine recommendations, 9 (90%) referenced CPGs and 1 (10%) cited an observational study.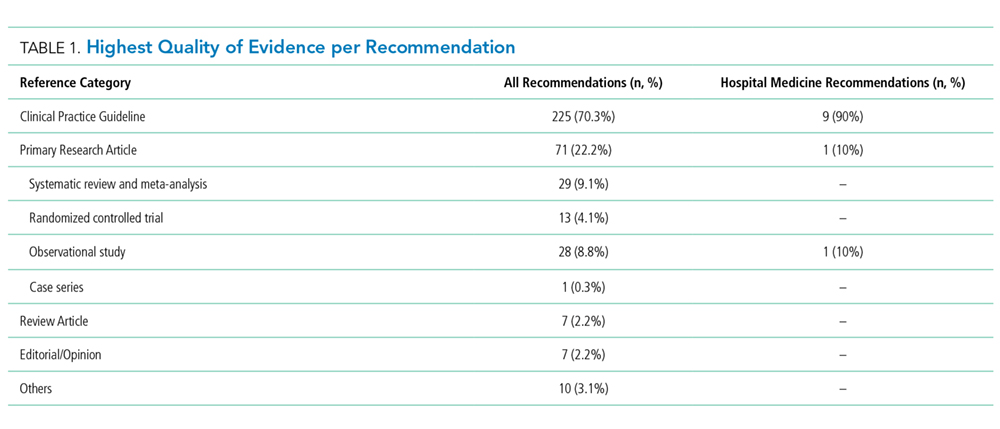
For the AGREE II assessment, we included 23 CPGs from the 225 referenced across all recommendations, after which we separately selected 6 CPGs from the hospital medicine recommendations. There was no overlap. Notably, 4 hospital medicine recommendations referenced a common CPG. Among the random sample of referenced CPGs, the median overall score obtained by using AGREE II was 54.2% (IQR 33.3%-70.8%, Table 2). This was similar to the median overall among hospital medicine guidelines (58.2%, IQR 50.0%-83.3%). Both hospital medicine and other sampled guidelines tended to score poorly in stakeholder involvement (48.6%, IQR 44.1%-61.1% and 47.2%, IQR 38.9%-61.1%, respectively). There were no significant differences between hospital medicine-referenced CPGs and the larger sample of CPGs in any AGREE II subdomains. The median age from the CPG publication to the list publication was 7 years (IQR 4–7) for hospital medicine recommendations and 3 years (IQR 2–6) for the nonhospital medicine recommendations. Substantial agreement was found between raters on the overall guideline assessment (ICC 0.80, 95% CI 0.58-0.91; Supplementary Table 1).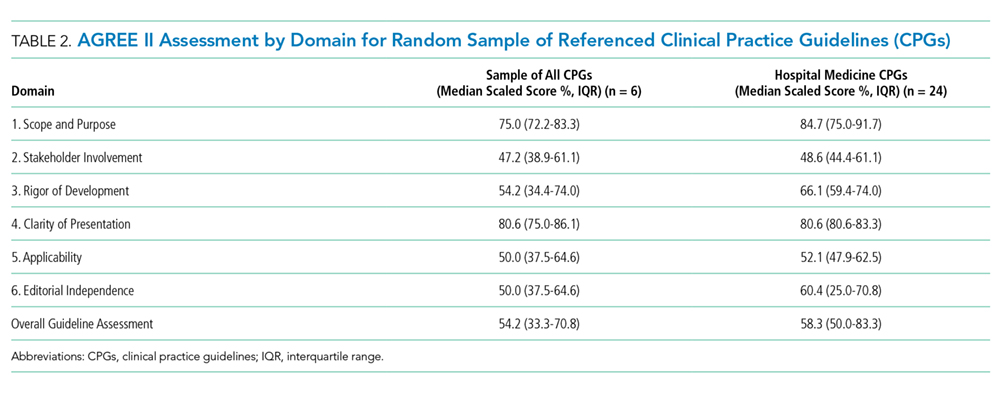
In terms of recommendation strengths and evidence grades, several recommendations were backed by Grades II–III (on a scale of I-III) evidence and level C (on a scale of A–C) recommendations in the reviewed CPG (Society of Maternal-Fetal Medicine, Recommendation 4, and Heart Rhythm Society, Recommendation 1). In one other case, the cited CPG did not directly address the Choosing Wisely® item (Society of Vascular Medicine, Recommendation 2).
DISCUSSION
Given the rising costs and the potential for iatrogenic harm, curbing ineffective practices has become an urgent concern. To achieve this, the Choosing Wisely® campaign has taken an important step by targeting certain low-value practices for de-adoption. However, the evidence supporting recommendations is variable. Specifically, 25 recommendations cited case series, review articles, or lower quality evidence as their highest level of support; moreover, among recommendations citing CPGs, quality, timeliness, and support for the recommendation item were variable. Although the hospital medicine lists tended to cite higher-quality evidence in the form of CPGs, these CPGs were often less recent than the guidelines referenced by other lists.
Our findings parallel those of other works that evaluate evidence among Choosing Wisely® recommendations and, more broadly, among CPGs.18–21 Lin and Yancey evaluated the quality of primary care-focused Choosing Wisely® recommendations using the Strength of Recommendation Taxonomy, a ranking system that evaluates evidence quality, consistency, and patient-centeredness.18 In their analysis, the authors found that many recommendations were based on lower quality evidence or relied on nonpatent-centered intermediate outcomes. Several groups, meanwhile, have evaluated the quality of evidence supporting CPG recommendations, finding them to be highly variable as well.19–21 These findings likely reflect inherent difficulties in the process, by which guideline development groups distill a broad evidence base into useful clinical recommendations, a reality that may have influenced the Choosing Wisely® list development groups seeking to make similar recommendations on low-value services.
These data should be taken in context due to several limitations. First, our sample of referenced CPGs includes only a small sample of all CPGs cited; thus, it may not be representative of all referenced guidelines. Second, the AGREE II assessment is inherently subjective, despite the availability of training materials. Third, data collection ended in April, 2014. Although this represents a majority of published lists to date, it is possible that more recent Choosing Wisely®lists include a stronger focus on evidence quality. Finally, references cited by Choosing Wisely®may not be representative of the entirety of the dataset that was considered when formulating the recommendations.
Despite these limitations, our findings suggest that Choosing Wisely®recommendations vary in terms of evidence strength. Although our results reveal that the majority of recommendations cite guidelines or high-quality original research, evidence gaps remain, with a small number citing low-quality evidence or low-quality CPGs as their highest form of support. Given the barriers to the successful de-implementation of low-value services, such campaigns as Choosing Wisely®face an uphill battle in their attempt to prompt behavior changes among providers and consumers.6-9 As a result, it is incumbent on funding agencies and medical journals to promote studies evaluating the harms and overall value of the care we deliver.
CONCLUSIONS
Although a majority of Choosing Wisely® recommendations cite high-quality evidence, some reference low-quality evidence or low-quality CPGs as their highest form of support. To overcome clinical inertia and other barriers to the successful de-implementation of low-value services, a clear rationale for the impetus to eradicate entrenched practices is critical.2,22 Choosing Wisely® has provided visionary leadership and a powerful platform to question low-value care. To expand the campaign’s efforts, the medical field must be able to generate the high-quality evidence necessary to support these efforts; further, list development groups must consider the availability of strong evidence when targeting services for de-implementation.
ACKNOWLEDGMENT
This work was supported, in part, by a grant from the Agency for Healthcare Research and Quality (No. K08HS020672, Dr. Cooke).
Disclosures
The authors have nothing to disclose.
1. Institute of Medicine Roundtable on Evidence-Based Medicine. The Healthcare Imperative: Lowering Costs and Improving Outcomes: Workshop Series Summary. Yong P, Saudners R, Olsen L, editors. Washington, D.C.: National Academies Press; 2010. PubMed
2. Weinberger SE. Providing high-value, cost-conscious care: a critical seventh general competency for physicians. Ann Intern Med. 2011;155(6):386-388. PubMed
3. Cassel CK, Guest JA. Choosing wisely: Helping physicians and patients make smart decisions about their care. JAMA. 2012;307(17):1801-1802. PubMed
4. Bulger J, Nickel W, Messler J, Goldstein J, O’Callaghan J, Auron M, et al. Choosing wisely in adult hospital medicine: Five opportunities for improved healthcare value. J Hosp Med. 2013;8(9):486-492. PubMed
5. Quinonez RA, Garber MD, Schroeder AR, Alverson BK, Nickel W, Goldstein J, et al. Choosing wisely in pediatric hospital medicine: Five opportunities for improved healthcare value. J Hosp Med. 2013;8(9):479-485. PubMed
6. Prasad V, Ioannidis JP. Evidence-based de-implementation for contradicted, unproven, and aspiring healthcare practices. Implement Sci. 2014;9:1. PubMed
7. Rosenberg A, Agiro A, Gottlieb M, Barron J, Brady P, Liu Y, et al. Early trends among seven recommendations from the Choosing Wisely campaign. JAMA Intern Med. 2015;175(12):1913-1920. PubMed
8. Zikmund-Fisher BJ, Kullgren JT, Fagerlin A, Klamerus ML, Bernstein SJ, Kerr EA. Perceived barriers to implementing individual Choosing Wisely® recommendations in two national surveys of primary care providers. J Gen Intern Med. 2017;32(2):210-217. PubMed
9. Bishop TF, Cea M, Miranda Y, Kim R, Lash-Dardia M, Lee JI, et al. Academic physicians’ views on low-value services and the choosing wisely campaign: A qualitative study. Healthc (Amsterdam, Netherlands). 2017;5(1-2):17-22. PubMed
10. Prochaska MT, Hohmann SF, Modes M, Arora VM. Trends in Troponin-only testing for AMI in academic teaching hospitals and the impact of Choosing Wisely®. J Hosp Med. 2017;12(12):957-962. PubMed
11. Cabana MD, Rand CS, Powe NR, Wu AW, Wilson MH, Abboud PA, et al. Why don’t physicians follow clinical practice guidelines? A framework for improvement. JAMA. 1999;282(15):1458-1465. PubMed
12. ABIM Foundation. ChoosingWisely.org Search Recommendations. 2014.
13. Institute of Medicine (US) Committee on Standards for Developing Trustworthy Clinical Practice Guidelines. Clinical Practice Guidelines We Can Trust. Graham R, Mancher M, Miller Wolman D, Greenfield S, Steinberg E, editors. Washington, D.C.: National Academies Press; 2011. PubMed
14. Brouwers MC, Kho ME, Browman GP, Burgers JS, Cluzeau F, Feder G, et al. AGREE II: Advancing guideline development, reporting, and evaluation in health care. Prev Med (Baltim). 2010;51(5):421-424. PubMed
15. Brouwers MC, Kho ME, Browman GP, Burgers JS, Cluzeau F, Feder G, et al. Development of the AGREE II, part 2: Assessment of validity of items and tools to support application. CMAJ. 2010;182(10):E472-E478. PubMed
16. He Z, Tian H, Song A, Jin L, Zhou X, Liu X, et al. Quality appraisal of clinical practice guidelines on pancreatic cancer. Medicine (Baltimore). 2015;94(12):e635. PubMed
17. Isaac A, Saginur M, Hartling L, Robinson JL. Quality of reporting and evidence in American Academy of Pediatrics guidelines. Pediatrics. 2013;131(4):732-738. PubMed
18. Lin KW, Yancey JR. Evaluating the Evidence for Choosing WiselyTM in Primary Care Using the Strength of Recommendation Taxonomy (SORT). J Am Board Fam Med. 2016;29(4):512-515. PubMed
19. McAlister FA, van Diepen S, Padwal RS, Johnson JA, Majumdar SR. How evidence-based are the recommendations in evidence-based guidelines? PLoS Med. 2007;4(8):e250. PubMed
20. Tricoci P, Allen JM, Kramer JM, Califf RM, Smith SC. Scientific evidence underlying the ACC/AHA clinical practice guidelines. JAMA. 2009;301(8):831-841. PubMed
21. Feuerstein JD, Gifford AE, Akbari M, Goldman J, Leffler DA, Sheth SG, et al. Systematic analysis underlying the quality of the scientific evidence and conflicts of interest in gastroenterology practice guidelines. Am J Gastroenterol. 2013;108(11):1686-1693. PubMed
22. Robert G, Harlock J, Williams I. Disentangling rhetoric and reality: an international Delphi study of factors and processes that facilitate the successful implementation of decisions to decommission healthcare services. Implement Sci. 2014;9:123. PubMed
As healthcare costs rise, physicians and other stakeholders are now seeking innovative and effective ways to reduce the provision of low-value services.1,2 The Choosing Wisely® campaign aims to further this goal by promoting lists of specific procedures, tests, and treatments that providers should avoid in selected clinical settings.3 On February 21, 2013, the Society of Hospital Medicine (SHM) released 2 Choosing Wisely® lists consisting of adult and pediatric services that are seen as costly to consumers and to the healthcare system, but which are often nonbeneficial or even harmful.4,5 A total of 80 physician and nurse specialty societies have joined in submitting additional lists.
Despite the growing enthusiasm for this effort, questions remain regarding the Choosing Wisely® campaign’s ability to initiate the meaningful de-adoption of low-value services. Specifically, prior efforts to reduce the use of services deemed to be of questionable benefit have met several challenges.2,6 Early analyses of the Choosing Wisely® recommendations reveal similar roadblocks and variable uptakes of several recommendations.7-10 While the reasons for difficulties in achieving de-adoption are broad, one important factor in whether clinicians are willing to follow guideline recommendations from such initiatives as Choosing Wisely®is the extent to which they believe in the underlying evidence.11 The current work seeks to formally evaluate the evidence supporting the Choosing Wisely® recommendations, and to compare the quality of evidence supporting SHM lists to other published Choosing Wisely® lists.
METHODS
Data Sources
Using the online listing of published Choosing Wisely® recommendations, a dataset was generated incorporating all 320 recommendations comprising the 58 lists published through August, 2014; these include both the adult and pediatric hospital medicine lists released by the SHM.4,5,12 Although data collection ended at this point, this represents a majority of all 81 lists and 535 recommendations published through December, 2017. The reviewers (A.J.A., A.G., M.W., T.S.V., M.S., and C.R.C) extracted information about the references cited for each recommendation.
Data Analysis
The reviewers obtained each reference cited by a Choosing Wisely® recommendation and categorized it by evidence strength along the following hierarchy: clinical practice guideline (CPG), primary research, review article, expert opinion, book, or others/unknown. CPGs were used as the highest level of evidence based on standard expectations for methodological rigor.13 Primary research was further rated as follows: systematic reviews and meta-analyses, randomized controlled trials (RCTs), observational studies, and case series. Each recommendation was graded using only the strongest piece of evidence cited.
Guideline Appraisal
We further sought to evaluate the strength of referenced CPGs. To accomplish this, a 10% random sample of the Choosing Wisely® recommendations citing CPGs was selected, and the referenced CPGs were obtained. Separately, CPGs referenced by the SHM-published adult and pediatric lists were also obtained. For both groups, one CPG was randomly selected when a recommendation cited more than one CPG. These guidelines were assessed using the Appraisal of Guidelines for Research and Evaluation (AGREE) II instrument, a widely used instrument designed to assess CPG quality.14,15 AGREE II consists of 25 questions categorized into 6 domains: scope and purpose, stakeholder involvement, rigor of development, clarity of presentation, applicability, and editorial independence. Guidelines are also assigned an overall score. Two trained reviewers (A.J.A. and A.G.) assessed each of the sampled CPGs using a standardized form. Scores were then standardized using the method recommended by the instrument and reported as a percentage of available points. Although a standard interpretation of scores is not provided by the instrument, prior applications deemed scores below 50% as deficient16,17. When a recommendation item cited multiple CPGs, one was randomly selected. We also abstracted data on the year of publication, the evidence grade assigned to specific items recommended by Choosing Wisely®, and whether the CPG addressed the referring recommendation. All data management and analysis were conducted using Stata (V14.2, StataCorp, College Station, Texas).
RESULTS
A total of 320 recommendations were considered in our analysis, including 10 published across the 2 hospital medicine lists. When limited to the highest quality citation for each of the recommendations, 225 (70.3%) cited CPGs, whereas 71 (22.2%) cited primary research articles (Table 1). Specifically, 29 (9.1%) cited systematic reviews and meta-analyses, 28 (8.8%) cited observational studies, and 13 (4.1%) cited RCTs. One recommendation (0.3%) cited a case series as its highest level of evidence, 7 (2.2%) cited review articles, 7 (2.2%) cited editorials or opinion pieces, and 10 (3.1%) cited other types of documents, such as websites or books. Among hospital medicine recommendations, 9 (90%) referenced CPGs and 1 (10%) cited an observational study.
For the AGREE II assessment, we included 23 CPGs from the 225 referenced across all recommendations, after which we separately selected 6 CPGs from the hospital medicine recommendations. There was no overlap. Notably, 4 hospital medicine recommendations referenced a common CPG. Among the random sample of referenced CPGs, the median overall score obtained by using AGREE II was 54.2% (IQR 33.3%-70.8%, Table 2). This was similar to the median overall among hospital medicine guidelines (58.2%, IQR 50.0%-83.3%). Both hospital medicine and other sampled guidelines tended to score poorly in stakeholder involvement (48.6%, IQR 44.1%-61.1% and 47.2%, IQR 38.9%-61.1%, respectively). There were no significant differences between hospital medicine-referenced CPGs and the larger sample of CPGs in any AGREE II subdomains. The median age from the CPG publication to the list publication was 7 years (IQR 4–7) for hospital medicine recommendations and 3 years (IQR 2–6) for the nonhospital medicine recommendations. Substantial agreement was found between raters on the overall guideline assessment (ICC 0.80, 95% CI 0.58-0.91; Supplementary Table 1).
In terms of recommendation strengths and evidence grades, several recommendations were backed by Grades II–III (on a scale of I-III) evidence and level C (on a scale of A–C) recommendations in the reviewed CPG (Society of Maternal-Fetal Medicine, Recommendation 4, and Heart Rhythm Society, Recommendation 1). In one other case, the cited CPG did not directly address the Choosing Wisely® item (Society of Vascular Medicine, Recommendation 2).
DISCUSSION
Given the rising costs and the potential for iatrogenic harm, curbing ineffective practices has become an urgent concern. To achieve this, the Choosing Wisely® campaign has taken an important step by targeting certain low-value practices for de-adoption. However, the evidence supporting recommendations is variable. Specifically, 25 recommendations cited case series, review articles, or lower quality evidence as their highest level of support; moreover, among recommendations citing CPGs, quality, timeliness, and support for the recommendation item were variable. Although the hospital medicine lists tended to cite higher-quality evidence in the form of CPGs, these CPGs were often less recent than the guidelines referenced by other lists.
Our findings parallel those of other works that evaluate evidence among Choosing Wisely® recommendations and, more broadly, among CPGs.18–21 Lin and Yancey evaluated the quality of primary care-focused Choosing Wisely® recommendations using the Strength of Recommendation Taxonomy, a ranking system that evaluates evidence quality, consistency, and patient-centeredness.18 In their analysis, the authors found that many recommendations were based on lower quality evidence or relied on nonpatent-centered intermediate outcomes. Several groups, meanwhile, have evaluated the quality of evidence supporting CPG recommendations, finding them to be highly variable as well.19–21 These findings likely reflect inherent difficulties in the process, by which guideline development groups distill a broad evidence base into useful clinical recommendations, a reality that may have influenced the Choosing Wisely® list development groups seeking to make similar recommendations on low-value services.
These data should be taken in context due to several limitations. First, our sample of referenced CPGs includes only a small sample of all CPGs cited; thus, it may not be representative of all referenced guidelines. Second, the AGREE II assessment is inherently subjective, despite the availability of training materials. Third, data collection ended in April, 2014. Although this represents a majority of published lists to date, it is possible that more recent Choosing Wisely®lists include a stronger focus on evidence quality. Finally, references cited by Choosing Wisely®may not be representative of the entirety of the dataset that was considered when formulating the recommendations.
Despite these limitations, our findings suggest that Choosing Wisely®recommendations vary in terms of evidence strength. Although our results reveal that the majority of recommendations cite guidelines or high-quality original research, evidence gaps remain, with a small number citing low-quality evidence or low-quality CPGs as their highest form of support. Given the barriers to the successful de-implementation of low-value services, such campaigns as Choosing Wisely®face an uphill battle in their attempt to prompt behavior changes among providers and consumers.6-9 As a result, it is incumbent on funding agencies and medical journals to promote studies evaluating the harms and overall value of the care we deliver.
CONCLUSIONS
Although a majority of Choosing Wisely® recommendations cite high-quality evidence, some reference low-quality evidence or low-quality CPGs as their highest form of support. To overcome clinical inertia and other barriers to the successful de-implementation of low-value services, a clear rationale for the impetus to eradicate entrenched practices is critical.2,22 Choosing Wisely® has provided visionary leadership and a powerful platform to question low-value care. To expand the campaign’s efforts, the medical field must be able to generate the high-quality evidence necessary to support these efforts; further, list development groups must consider the availability of strong evidence when targeting services for de-implementation.
ACKNOWLEDGMENT
This work was supported, in part, by a grant from the Agency for Healthcare Research and Quality (No. K08HS020672, Dr. Cooke).
Disclosures
The authors have nothing to disclose.
1. Institute of Medicine Roundtable on Evidence-Based Medicine. The Healthcare Imperative: Lowering Costs and Improving Outcomes: Workshop Series Summary. Yong P, Saudners R, Olsen L, editors. Washington, D.C.: National Academies Press; 2010. PubMed
2. Weinberger SE. Providing high-value, cost-conscious care: a critical seventh general competency for physicians. Ann Intern Med. 2011;155(6):386-388. PubMed
3. Cassel CK, Guest JA. Choosing wisely: Helping physicians and patients make smart decisions about their care. JAMA. 2012;307(17):1801-1802. PubMed
4. Bulger J, Nickel W, Messler J, Goldstein J, O’Callaghan J, Auron M, et al. Choosing wisely in adult hospital medicine: Five opportunities for improved healthcare value. J Hosp Med. 2013;8(9):486-492. PubMed
5. Quinonez RA, Garber MD, Schroeder AR, Alverson BK, Nickel W, Goldstein J, et al. Choosing wisely in pediatric hospital medicine: Five opportunities for improved healthcare value. J Hosp Med. 2013;8(9):479-485. PubMed
6. Prasad V, Ioannidis JP. Evidence-based de-implementation for contradicted, unproven, and aspiring healthcare practices. Implement Sci. 2014;9:1. PubMed
7. Rosenberg A, Agiro A, Gottlieb M, Barron J, Brady P, Liu Y, et al. Early trends among seven recommendations from the Choosing Wisely campaign. JAMA Intern Med. 2015;175(12):1913-1920. PubMed
8. Zikmund-Fisher BJ, Kullgren JT, Fagerlin A, Klamerus ML, Bernstein SJ, Kerr EA. Perceived barriers to implementing individual Choosing Wisely® recommendations in two national surveys of primary care providers. J Gen Intern Med. 2017;32(2):210-217. PubMed
9. Bishop TF, Cea M, Miranda Y, Kim R, Lash-Dardia M, Lee JI, et al. Academic physicians’ views on low-value services and the choosing wisely campaign: A qualitative study. Healthc (Amsterdam, Netherlands). 2017;5(1-2):17-22. PubMed
10. Prochaska MT, Hohmann SF, Modes M, Arora VM. Trends in Troponin-only testing for AMI in academic teaching hospitals and the impact of Choosing Wisely®. J Hosp Med. 2017;12(12):957-962. PubMed
11. Cabana MD, Rand CS, Powe NR, Wu AW, Wilson MH, Abboud PA, et al. Why don’t physicians follow clinical practice guidelines? A framework for improvement. JAMA. 1999;282(15):1458-1465. PubMed
12. ABIM Foundation. ChoosingWisely.org Search Recommendations. 2014.
13. Institute of Medicine (US) Committee on Standards for Developing Trustworthy Clinical Practice Guidelines. Clinical Practice Guidelines We Can Trust. Graham R, Mancher M, Miller Wolman D, Greenfield S, Steinberg E, editors. Washington, D.C.: National Academies Press; 2011. PubMed
14. Brouwers MC, Kho ME, Browman GP, Burgers JS, Cluzeau F, Feder G, et al. AGREE II: Advancing guideline development, reporting, and evaluation in health care. Prev Med (Baltim). 2010;51(5):421-424. PubMed
15. Brouwers MC, Kho ME, Browman GP, Burgers JS, Cluzeau F, Feder G, et al. Development of the AGREE II, part 2: Assessment of validity of items and tools to support application. CMAJ. 2010;182(10):E472-E478. PubMed
16. He Z, Tian H, Song A, Jin L, Zhou X, Liu X, et al. Quality appraisal of clinical practice guidelines on pancreatic cancer. Medicine (Baltimore). 2015;94(12):e635. PubMed
17. Isaac A, Saginur M, Hartling L, Robinson JL. Quality of reporting and evidence in American Academy of Pediatrics guidelines. Pediatrics. 2013;131(4):732-738. PubMed
18. Lin KW, Yancey JR. Evaluating the Evidence for Choosing WiselyTM in Primary Care Using the Strength of Recommendation Taxonomy (SORT). J Am Board Fam Med. 2016;29(4):512-515. PubMed
19. McAlister FA, van Diepen S, Padwal RS, Johnson JA, Majumdar SR. How evidence-based are the recommendations in evidence-based guidelines? PLoS Med. 2007;4(8):e250. PubMed
20. Tricoci P, Allen JM, Kramer JM, Califf RM, Smith SC. Scientific evidence underlying the ACC/AHA clinical practice guidelines. JAMA. 2009;301(8):831-841. PubMed
21. Feuerstein JD, Gifford AE, Akbari M, Goldman J, Leffler DA, Sheth SG, et al. Systematic analysis underlying the quality of the scientific evidence and conflicts of interest in gastroenterology practice guidelines. Am J Gastroenterol. 2013;108(11):1686-1693. PubMed
22. Robert G, Harlock J, Williams I. Disentangling rhetoric and reality: an international Delphi study of factors and processes that facilitate the successful implementation of decisions to decommission healthcare services. Implement Sci. 2014;9:123. PubMed
© 2018 Society of Hospital Medicine
Patient Perceptions of Readmission Risk: An Exploratory Survey
Recent years have seen a proliferation of programs designed to prevent readmissions, including patient education initiatives, financial assistance programs, postdischarge services, and clinical personnel assigned to help patients navigate their posthospitalization clinical care. Although some strategies do not require direct patient participation (such as timely and effective handoffs between inpatient and outpatient care teams), many rely upon a commitment by the patient to participate in the postdischarge care plan. At our hospital, we have found that only about 2/3 of patients who are offered transitional interventions (such as postdischarge phone calls by nurses or home nursing through a “transition guide” program) receive the intended interventions, and those who do not receive them are more likely to be readmitted.1 While limited patient uptake may relate, in part, to factors that are difficult to overcome, such as inadequate housing or phone service, we have also encountered patients whose values, beliefs, or preferences about their care do not align with those of the care team. The purposes of this exploratory study were to (1) assess patient attitudes surrounding readmission, (2) ascertain whether these attitudes are associated with actual readmission, and (3) determine whether patients can estimate their own risk of readmission.
METHODS
From January 2014 to September 2016, we circulated surveys to patients on internal medicine nursing units who were being discharged home within 24 hours. Blank surveys were distributed to nursing units by the researchers. Unit clerks and support staff were educated on the purpose of the project and asked to distribute surveys to patients who were identified by unit case managers or nurses as slated for discharge. Staff members were not asked to help with or supervise survey completion. Surveys were generally filled out by patients, but we allowed family members to assist patients if needed, and to indicate so with a checkbox. There were no exclusion criteria. Because surveys were distributed by clinical staff, the received surveys can be considered a convenience sample. Patients were asked 5 questions with 4- or 5-point Likert scale responses:
(1) “How likely is it that you will be admitted to the hospital (have to stay in the hospital overnight) again within the next 30 days after you leave the hospital this time?” [answers ranging from “Very Unlikely (<5% chance)” to “Very Likely (>50% chance)”];
(2) “How would you feel about being rehospitalized in the next month?” [answers ranging from “Very sad, frustrated, or disappointed” to “Very happy or relieved”];
(3) “How much do you think that you personally can control whether or not you will be rehospitalized (based on what you do to take care of your body, take your medicines, and follow-up with your healthcare team)?” [answers ranging from “I have no control over whether I will be rehospitalized” to “I have complete control over whether I will be rehospitalized”];
(4) “Which of the options below best describes how you plan to follow the medical instructions after you leave the hospital?” [answers ranging from “I do NOT plan to do very much of what I am being asked to do by the doctors, nurses, therapists, and other members of the care team” to “I plan to do EVERYTHING I am being asked to do by the doctors, nurses, therapists and other members of the care team”]; and
(5) “Pick the item below that best describes YOUR OWN VIEW of the care team’s recommendations:” [answers ranging from “I DO NOT AGREE AT ALL that the best way to be healthy is to do exactly what I am being asked to do by the doctors, nurses, therapists, and other members of the care team” to “I FULLY AGREE that the best way to be healthy is to do exactly what I am being asked to do by the doctors, nurses, therapists, and other members of the care team”].
Responses were linked, based on discharge date and medical record number, to administrative data, including age, sex, race, payer, and clinical data. Subsequent hospitalizations to our hospital were ascertained from administrative data. We estimated expected risk of readmission using the all payer refined diagnosis related group coupled with the associated severity-of-illness (SOI) score, as we have reported previously.2-5 We restricted our analysis to patients who answered the question related to the likelihood of readmission. Logistic regression models were constructed using actual 30-day readmission as the dependent variable to determine whether patients could predict their own readmissions and whether patient attitudes and beliefs about their care were predictive of subsequent readmission. Patient survey responses were entered as continuous independent variables (ranging from 1-4 or 1-5, as appropriate). Multivariable logistic regression was used to determine whether patients could predict their readmissions independent of demographic variables and expected readmission rate (modeled continuously); we repeated this model after dichotomizing the patient’s estimate of the likelihood of readmission as either “unlikely” or “likely.” Patients with missing survey responses were excluded from individual models without imputation. The study was approved by the Johns Hopkins institutional review board.
RESULTS
Responses were obtained from 895 patients. Their median age was 56 years [interquartile range, 43-67], 51.4% were female, and 41.7% were white. Mean SOI was 2.53 (on a 1-4 scale), and median length-of-stay was representative for our medical service at 5.2 days (range, 1-66 days). Family members reported filling out the survey in 57 cases. The primary payer was Medicare in 40.7%, Medicaid in 24.9%, and other in 34.4%. A total of 138 patients (15.4%) were readmitted within 30 days. The Table shows survey responses and associated readmission rates. None of the attitudes related to readmission were predictive of actual readmission. However, patients were able to predict their own readmissions (P = .002 for linear trend). After adjustment for expected readmission rate, race, sex, age, and payer, the trend remained significant (P = .005). Other significant predictors of readmissions in this model included expected readmission rate (P = .002), age (P = .02), and payer (P = .002). After dichotomizing the patient estimate of readmission rate as “unlikely” (N = 581) or “likely” (N = 314), the unadjusted odds ratio associating a patient-estimated risk of readmission as “likely” with actual readmission was 1.8 (95% confidence interval, 1.2-2.5). The adjusted odds ratio (including the variables above) was 1.6 (1.1-2.4).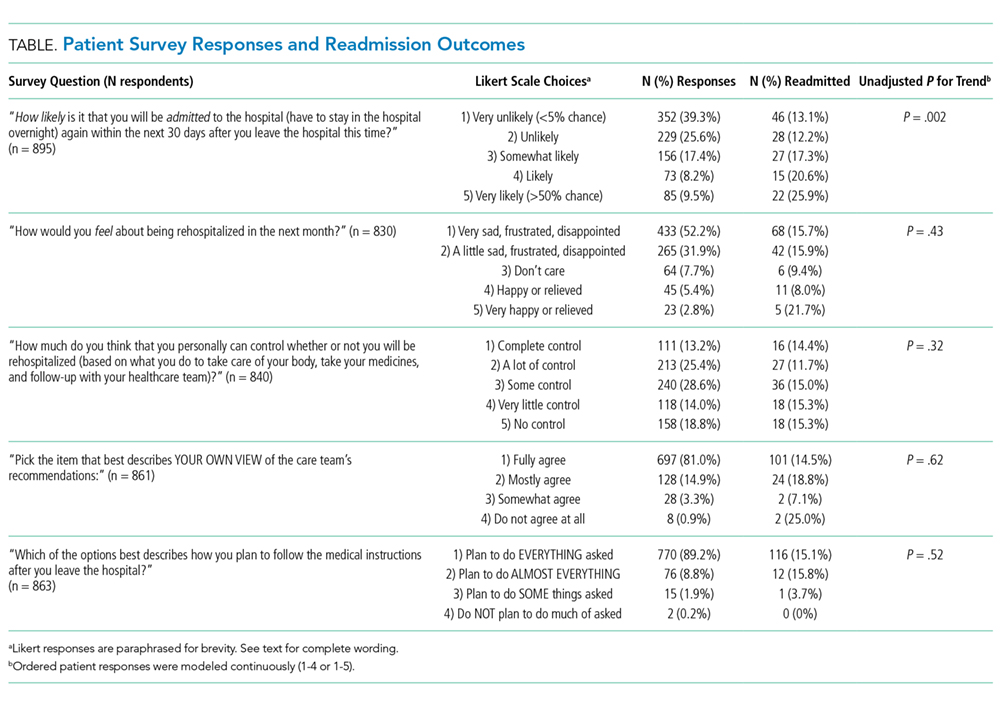
DISCUSSION
Our findings demonstrate that patients are able to quantify their own readmission risk. This was true even after adjustment for expected readmission rate, age, sex, race, and payer. However, we did not identify any patient attitudes, beliefs, or preferences related to readmission or discharge instructions that were associated with subsequent rehospitalization. Reassuringly, more than 80% of patients who responded to the survey indicated that they would be sad, frustrated, or disappointed should readmission occur. This suggests that most patients are invested in preventing rehospitalization. Also reassuring was that patients indicated that they agreed with the discharge care plan and intended to follow their discharge instructions.
The major limitation of this study is that it was a convenience sample. Surveys were distributed inconsistently by nursing unit staff, preventing us from calculating a response rate. Further, it is possible, if not likely, that those patients with higher levels of engagement were more likely to take the time to respond, enriching our sample with activated patients. Although we allowed family members to fill out surveys on behalf of patients, this was done in fewer than 10% of instances; as such, our data may have limited applicability to patients who are physically or cognitively unable to participate in the discharge process. Finally, in this study, we did not capture readmissions to other facilities.
We conclude that patients are able to predict their own readmissions, even after accounting for other potential predictors of readmission. However, we found no evidence to support the possibility that low levels of engagement, limited trust in the healthcare team, or nonchalance about being readmitted are associated with subsequent rehospitalization. Whether asking patients about their perceived risk of readmission might help target readmission prevention programs deserves further study.
Acknowledgments
Dr. Daniel J. Brotman had full access to the data in the study and takes responsibility for the integrity of the study data and the accuracy of the data analysis. The authors also thank the following individuals for their contributions: Drafting the manuscript (Brotman); revising the manuscript for important intellectual content (Brotman, Shihab, Tieu, Cheng, Bertram, Hoyer, Deutschendorf); acquiring the data (Brotman, Shihab, Tieu, Cheng, Bertram, Deutschendorf); interpreting the data (Brotman, Shihab, Tieu, Cheng, Bertram, Hoyer, Deutschendorf); and analyzing the data (Brotman). The authors thank nursing leadership and nursing unit staff for their assistance in distributing surveys.
Funding support: Johns Hopkins Hospitalist Scholars Program
Disclosures: The authors have declared no conflicts of interest.
1. Hoyer EH, Brotman DJ, Apfel A, et al. Improving outcomes after hospitalization: a prospective observational multi-center evaluation of care-coordination strategies on 30-day readmissions to Maryland hospitals. J Gen Int Med. 2017 (in press). PubMed
2. Oduyebo I, Lehmann CU, Pollack CE, et al. Association of self-reported hospital discharge handoffs with 30-day readmissions. JAMA Intern Med. 2013;173(8):624-629. PubMed
3. Hoyer EH, Needham DM, Atanelov L, Knox B, Friedman M, Brotman DJ. Association of impaired functional status at hospital discharge and subsequent rehospitalization. J Hosp Med. 2014;9(5):277-282. PubMed
4. Hoyer EH, Needham DM, Miller J, Deutschendorf A, Friedman M, Brotman DJ. Functional status impairment is associated with unplanned readmissions. Arch Phys Med Rehabil. 2013;94(10):1951-1958. PubMed
5. Hoyer EH, Odonkor CA, Bhatia SN, Leung C, Deutschendorf A, Brotman DJ. Association between days to complete inpatient discharge summaries with all-payer hospital readmissions in Maryland. J Hosp Med. 2016;11(6):393-400. PubMed
Recent years have seen a proliferation of programs designed to prevent readmissions, including patient education initiatives, financial assistance programs, postdischarge services, and clinical personnel assigned to help patients navigate their posthospitalization clinical care. Although some strategies do not require direct patient participation (such as timely and effective handoffs between inpatient and outpatient care teams), many rely upon a commitment by the patient to participate in the postdischarge care plan. At our hospital, we have found that only about 2/3 of patients who are offered transitional interventions (such as postdischarge phone calls by nurses or home nursing through a “transition guide” program) receive the intended interventions, and those who do not receive them are more likely to be readmitted.1 While limited patient uptake may relate, in part, to factors that are difficult to overcome, such as inadequate housing or phone service, we have also encountered patients whose values, beliefs, or preferences about their care do not align with those of the care team. The purposes of this exploratory study were to (1) assess patient attitudes surrounding readmission, (2) ascertain whether these attitudes are associated with actual readmission, and (3) determine whether patients can estimate their own risk of readmission.
METHODS
From January 2014 to September 2016, we circulated surveys to patients on internal medicine nursing units who were being discharged home within 24 hours. Blank surveys were distributed to nursing units by the researchers. Unit clerks and support staff were educated on the purpose of the project and asked to distribute surveys to patients who were identified by unit case managers or nurses as slated for discharge. Staff members were not asked to help with or supervise survey completion. Surveys were generally filled out by patients, but we allowed family members to assist patients if needed, and to indicate so with a checkbox. There were no exclusion criteria. Because surveys were distributed by clinical staff, the received surveys can be considered a convenience sample. Patients were asked 5 questions with 4- or 5-point Likert scale responses:
(1) “How likely is it that you will be admitted to the hospital (have to stay in the hospital overnight) again within the next 30 days after you leave the hospital this time?” [answers ranging from “Very Unlikely (<5% chance)” to “Very Likely (>50% chance)”];
(2) “How would you feel about being rehospitalized in the next month?” [answers ranging from “Very sad, frustrated, or disappointed” to “Very happy or relieved”];
(3) “How much do you think that you personally can control whether or not you will be rehospitalized (based on what you do to take care of your body, take your medicines, and follow-up with your healthcare team)?” [answers ranging from “I have no control over whether I will be rehospitalized” to “I have complete control over whether I will be rehospitalized”];
(4) “Which of the options below best describes how you plan to follow the medical instructions after you leave the hospital?” [answers ranging from “I do NOT plan to do very much of what I am being asked to do by the doctors, nurses, therapists, and other members of the care team” to “I plan to do EVERYTHING I am being asked to do by the doctors, nurses, therapists and other members of the care team”]; and
(5) “Pick the item below that best describes YOUR OWN VIEW of the care team’s recommendations:” [answers ranging from “I DO NOT AGREE AT ALL that the best way to be healthy is to do exactly what I am being asked to do by the doctors, nurses, therapists, and other members of the care team” to “I FULLY AGREE that the best way to be healthy is to do exactly what I am being asked to do by the doctors, nurses, therapists, and other members of the care team”].
Responses were linked, based on discharge date and medical record number, to administrative data, including age, sex, race, payer, and clinical data. Subsequent hospitalizations to our hospital were ascertained from administrative data. We estimated expected risk of readmission using the all payer refined diagnosis related group coupled with the associated severity-of-illness (SOI) score, as we have reported previously.2-5 We restricted our analysis to patients who answered the question related to the likelihood of readmission. Logistic regression models were constructed using actual 30-day readmission as the dependent variable to determine whether patients could predict their own readmissions and whether patient attitudes and beliefs about their care were predictive of subsequent readmission. Patient survey responses were entered as continuous independent variables (ranging from 1-4 or 1-5, as appropriate). Multivariable logistic regression was used to determine whether patients could predict their readmissions independent of demographic variables and expected readmission rate (modeled continuously); we repeated this model after dichotomizing the patient’s estimate of the likelihood of readmission as either “unlikely” or “likely.” Patients with missing survey responses were excluded from individual models without imputation. The study was approved by the Johns Hopkins institutional review board.
RESULTS
Responses were obtained from 895 patients. Their median age was 56 years [interquartile range, 43-67], 51.4% were female, and 41.7% were white. Mean SOI was 2.53 (on a 1-4 scale), and median length-of-stay was representative for our medical service at 5.2 days (range, 1-66 days). Family members reported filling out the survey in 57 cases. The primary payer was Medicare in 40.7%, Medicaid in 24.9%, and other in 34.4%. A total of 138 patients (15.4%) were readmitted within 30 days. The Table shows survey responses and associated readmission rates. None of the attitudes related to readmission were predictive of actual readmission. However, patients were able to predict their own readmissions (P = .002 for linear trend). After adjustment for expected readmission rate, race, sex, age, and payer, the trend remained significant (P = .005). Other significant predictors of readmissions in this model included expected readmission rate (P = .002), age (P = .02), and payer (P = .002). After dichotomizing the patient estimate of readmission rate as “unlikely” (N = 581) or “likely” (N = 314), the unadjusted odds ratio associating a patient-estimated risk of readmission as “likely” with actual readmission was 1.8 (95% confidence interval, 1.2-2.5). The adjusted odds ratio (including the variables above) was 1.6 (1.1-2.4).
DISCUSSION
Our findings demonstrate that patients are able to quantify their own readmission risk. This was true even after adjustment for expected readmission rate, age, sex, race, and payer. However, we did not identify any patient attitudes, beliefs, or preferences related to readmission or discharge instructions that were associated with subsequent rehospitalization. Reassuringly, more than 80% of patients who responded to the survey indicated that they would be sad, frustrated, or disappointed should readmission occur. This suggests that most patients are invested in preventing rehospitalization. Also reassuring was that patients indicated that they agreed with the discharge care plan and intended to follow their discharge instructions.
The major limitation of this study is that it was a convenience sample. Surveys were distributed inconsistently by nursing unit staff, preventing us from calculating a response rate. Further, it is possible, if not likely, that those patients with higher levels of engagement were more likely to take the time to respond, enriching our sample with activated patients. Although we allowed family members to fill out surveys on behalf of patients, this was done in fewer than 10% of instances; as such, our data may have limited applicability to patients who are physically or cognitively unable to participate in the discharge process. Finally, in this study, we did not capture readmissions to other facilities.
We conclude that patients are able to predict their own readmissions, even after accounting for other potential predictors of readmission. However, we found no evidence to support the possibility that low levels of engagement, limited trust in the healthcare team, or nonchalance about being readmitted are associated with subsequent rehospitalization. Whether asking patients about their perceived risk of readmission might help target readmission prevention programs deserves further study.
Acknowledgments
Dr. Daniel J. Brotman had full access to the data in the study and takes responsibility for the integrity of the study data and the accuracy of the data analysis. The authors also thank the following individuals for their contributions: Drafting the manuscript (Brotman); revising the manuscript for important intellectual content (Brotman, Shihab, Tieu, Cheng, Bertram, Hoyer, Deutschendorf); acquiring the data (Brotman, Shihab, Tieu, Cheng, Bertram, Deutschendorf); interpreting the data (Brotman, Shihab, Tieu, Cheng, Bertram, Hoyer, Deutschendorf); and analyzing the data (Brotman). The authors thank nursing leadership and nursing unit staff for their assistance in distributing surveys.
Funding support: Johns Hopkins Hospitalist Scholars Program
Disclosures: The authors have declared no conflicts of interest.
1. Hoyer EH, Brotman DJ, Apfel A, et al. Improving outcomes after hospitalization: a prospective observational multi-center evaluation of care-coordination strategies on 30-day readmissions to Maryland hospitals. J Gen Int Med. 2017 (in press). PubMed
2. Oduyebo I, Lehmann CU, Pollack CE, et al. Association of self-reported hospital discharge handoffs with 30-day readmissions. JAMA Intern Med. 2013;173(8):624-629. PubMed
3. Hoyer EH, Needham DM, Atanelov L, Knox B, Friedman M, Brotman DJ. Association of impaired functional status at hospital discharge and subsequent rehospitalization. J Hosp Med. 2014;9(5):277-282. PubMed
4. Hoyer EH, Needham DM, Miller J, Deutschendorf A, Friedman M, Brotman DJ. Functional status impairment is associated with unplanned readmissions. Arch Phys Med Rehabil. 2013;94(10):1951-1958. PubMed
5. Hoyer EH, Odonkor CA, Bhatia SN, Leung C, Deutschendorf A, Brotman DJ. Association between days to complete inpatient discharge summaries with all-payer hospital readmissions in Maryland. J Hosp Med. 2016;11(6):393-400. PubMed
© 2018 Society of Hospital Medicine
The Influence of Hospitalist Continuity on the Likelihood of Patient Discharge in General Medicine Patients
In addition to treating patients, physicians frequently have other time commitments that could include administrative, teaching, research, and family duties. Inpatient medicine is particularly unforgiving to these nonclinical duties since patients have to be assessed on a daily basis. Because of this characteristic, it is not uncommon for inpatient care responsibility to be switched between physicians to create time for nonclinical duties and personal health.
In contrast to the ambulatory setting, the influence of physician continuity of care on inpatient outcomes has not been studied frequently. Studies of inpatient continuity have primarily focused on patient discharge (likely because of its objective nature) over the weekends (likely because weekend cross-coverage is common) and have reported conflicting results.1-3 However, discontinuity of care is not isolated to the weekend since hospitalist-switches can occur at any time. In addition, expressing hospitalist continuity of care as a dichotomous variable (Was there weekend cross-coverage?) could incompletely express continuity since discharge likelihood might change with the consecutive number of days that a hospitalist is on service. This study measured the influence of hospitalist continuity throughout the patient’s hospitalization (rather than just the weekend) on daily patient discharge.
METHODS
Study Setting and Databases Used for Analysis
The study was conducted at The Ottawa Hospital, Ontario, Canada, a 1000-bed teaching hospital with 2 campuses and the primary referral center in our region. The division of general internal medicine has 6 patient services (or “teams”) at two campuses led by a staff hospitalist (exclusively general internists), a senior medical resident (2nd year of training), and various numbers of interns and medical students. Staff hospitalists do not treat more than one patient service even on the weekends.
Patients are admitted to each service on a daily basis and almost exclusively from the emergency room. Assignment of patients is essentially random since all services have the same clinical expertise. At a particular campus, the number of patients assigned daily to each service is usually equivalent between teams. Patients almost never switch between teams but may be transferred to another specialty. The study was approved by our local research ethics board.
The Patient Registry Database records for each patient the date and time of admissions (defined as the moment that a patient’s admission request is entered into the database), death or discharge from hospital (defined as the time when the patient’s discharge from hospital was entered into the database), or transfer to another specialty. It also records emergency visits, patient demographics, and location during admission. The Laboratory Database records all laboratory tests and their results.
Study Cohort
The Patient Registry Database was used to identify all individuals who were admitted to the general medicine services between January 1 and December 31, 2015. This time frame was selected to ensure that data were complete and current. General medicine services were analyzed because they are collectively the largest inpatient specialty in the hospital.
Study Outcome
The primary outcome was discharge from hospital as determined from the Patient Registry Database. Patients who died or were transferred to another service were not counted as outcomes.
Covariables
The primary exposure variable was the consecutive number of days (including weekends) that a particular hospitalist rounded on patients on a particular general medicine service. This was measured using call schedules. Other covariates included tomorrow’s expected number of discharges (TEND) daily discharge probability and its components. The TEND model4 used patient factors (age, Laboratory Abnormality Physiological Score [LAPS]5 calculated at admission) and hospitalization factors (hospital campus and service, admission urgency, day of the week, ICU status) to predict the daily discharge probability. In a validation population, these daily discharge probabilities (when summed over a particular day) strongly predicted the daily number of discharges (adjusted R2 of 89.2% [P < .001], median relative difference between observed and expected number of discharges of only 1.4% [Interquartile range,IQR: −5.5% to 7.1%]). The expected annual death risk was determined using the HOMR-now! model.6 This model used routinely collected data available at patient admission regarding the patient (sex, life-table-estimated 1-year death risk, Charlson score, current living location, previous cancer clinic status, and number of emergency department visits in the previous year) and the hospitalization (urgency, service, and LAPS score). The model explained more than half of the total variability in death likelihood of death (Nagelkirke’s R2 value of 0.53),7 was highly discriminative (C-statistic 0.92), and accurately predicted death risk (calibration slope 0.98).
Analysis
Logistic generalized estimating equation (GEE) methods were used to model the adjusted daily discharge probability.8 Data in the analytical dataset were expressed in a patient-day format (each dataset row represented one day for a particular patient). This permitted the inclusion of time-dependent covariates and allowed the GEE model to cluster hospitalization days within patients.
Model construction started with the TEND daily discharge probability and the HOMR-now! expected annual death risk (both expressed as log-odds). Then, hospitalist continuity was entered as a time-dependent covariate (ie, its value changed every day). Linear, square root, and natural logarithm forms of physician continuity were examined to determine the best fit (determined using the QIC statistic9). Finally, individual components of the TEND model were also offered to the model with those which significantly improving fit kept in the model. The GEE model used an independent correlation structure since this minimized the QIC statistic in the base model. All covariates in the final daily discharge probability model were used in the hospital death model. Analyses were conducted using SAS 9.4 (Cary, NC).
RESULTS
There were 6,405 general medicine admissions involving 5208 patients and 38,967 patient-days between January 1 and December 31, 2015 (Appendix A). Patients were elderly and were evenly divided in terms of gender, with 85% of them being admitted from the community. Comorbidities were common (median coded Charlson score was 2), with 6.0% of patients known to our cancer clinic. The median length of stay was 4 days (IQR, 2–7), with 378 admissions (5.9%) ending in death and 121 admissions (1.9%) ending in a transfer to another service.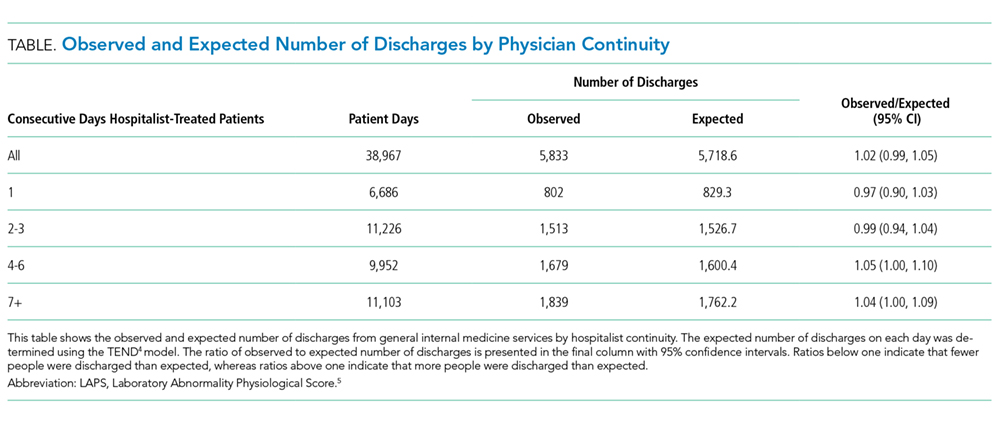
There were 41 different staff people having at least 1 day on service. The median total service by physicians was 9 weeks (IQR 1.8–10.9 weeks). Changes in hospitalist coverage were common; hospitalizations had a median of 1 (IQR 1–2) physician switches and a median of 1 (IQR 1–2) different physicians. However, patients spent a median of 100% (IQR 66.7%–100%] of their total hospitalization with their primary hospitalist. The median duration of individual physician “stints” on service was 5 days (IQR 2–7, range 1–42).
The TEND model accurately estimated daily discharge probability for the entire cohort with 5833 and 5718.6 observed and expected discharges, respectively, during 38,967 patient-days (O/E 1.02, 95% CI 0.99–1.05). Discharge probability increased as hospitalist continuity increased, but this was statistically significant only when hospitalist continuity exceeded 4 days. Other covariables also significantly influenced discharge probability (Appendix B).
After adjusting for important covariables (Appendix C), hospitalist continuity was significantly associated with daily discharge probability (Figure). Discharge probability increased linearly with increasing consecutive days that hospitalists treated patients. For each additional consecutive day with the same hospitalist, the adjusted daily odds increased by 2% (Adj-odds ratio [OR] 1.02, 95% CI 1.01–1.02, Appendix C). When the consecutive number of days that hospitalists remained on service increased from 1 to 28 days, the adjusted discharge probability for the average patient increased from 18.1% to 25.7%, respectively. Discharge was significantly influenced by other factors (Appendix C). Continuity did not influence the risk of death in hospital (Appendix D).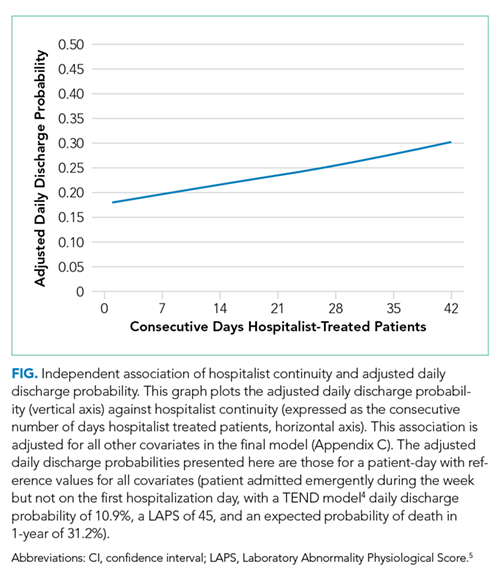
DISCUSSION
In a general medicine service at a large teaching hospital, this study found that greater hospitalist continuity was associated with a significantly increased adjusted daily discharge probability, increasing (in the average patient) from 18.1% to 25.7% when the consecutive number of hospitalist days on service increased from 1 to 28 days, respectively.
The study demonstrated some interesting findings. First, it shows that shifting patient care between physicians can significantly influence patient outcomes. This could be a function of incomplete transfer of knowledge between physicians, a phenomenon that should be expected given the extensive amount of information–both explicit and implicit–that physicians collect about particular patients during their hospitalization. Second, continuity of care could increase a physician’s and a patient’s confidence in clinical decision-making. Perhaps physicians are subconsciously more trusting of their instincts (and the decisions based on those instincts) when they have been on service for a while. It is also possible that patients more readily trust recommendations of a physician they have had throughout their stay. Finally, people wishing to decrease patient length of stay might consider minimizing the extent that hospitalists sign over patient care to colleagues.
Several issues should be noted when interpreting the results of the study. First, the study examined only patient discharge and death. These are by no means the only or the most important outcomes that might be influenced by hospitalist continuity. Second, this study was limited to a single service at a single center. Third, the analysis did not account for house-staff continuity. Since hospitalist and house-staff at the study hospital invariably switched at different times, it is unlikely that hospitalist continuity was a surrogate for house-staff continuity.
Disclosures
This study was supported by the Department of Medicine, University of Ottawa, Ottawa, Ontario, Canada. The author has nothing to disclose.
1. Ali NA, Hammersley J, Hoffmann SP et al. Continuity of care in intensive care units: a cluster-randomized trial of intensivist staffing. Am J Respir Crit Care Med. 2011;184(7):803-808. PubMed
2. Epstein K, Juarez E, Epstein A, Loya K, Singer A. The impact of fragmentation of hospitalist care on length of stay. J Hosp Med. 2010;5(6):335-338. PubMed
3. Blecker S, Shine D, Park N et al. Association of weekend continuity of care with hospital length of stay. Int J Qual Health Care. 2014;26(5):530-537. PubMed
4. van Walraven C, Forster AJ. The TEND (Tomorrow’s Expected Number of Discharges) model accurately predicted the number of patients who were discharged from the hospital in the next day. J Hosp Med. In press. PubMed
5. Escobar GJ, Greene JD, Scheirer P, Gardner MN, Draper D, Kipnis P. Risk-adjusting hospital inpatient mortality using automated inpatient, outpatient, and laboratory databases. Med Care. 2008;46(3):232-239. PubMed
6. van Walraven C, Forster AJ. HOMR-now! A modification of the HOMR score that predicts 1-year death risk for hospitalized patients using data immediately available at patient admission. Am J Med. In press. PubMed
7. Nagelkerke NJ. A note on a general definition of the coefficient of determination. Biometrika. 1991;78(3):691-692.
8. Stokes ME, Davis CS, Koch GG. Generalized estimating equations. Categorical Data Analysis Using the SAS System. 2nd ed. Cary, NC: SAS Institute Inc; 2000;469-549.
9. Pan W. Akaike’s information criterion in generalized estimating equations. Biometrics. 2001;57(1):120-125. PubMed
In addition to treating patients, physicians frequently have other time commitments that could include administrative, teaching, research, and family duties. Inpatient medicine is particularly unforgiving to these nonclinical duties since patients have to be assessed on a daily basis. Because of this characteristic, it is not uncommon for inpatient care responsibility to be switched between physicians to create time for nonclinical duties and personal health.
In contrast to the ambulatory setting, the influence of physician continuity of care on inpatient outcomes has not been studied frequently. Studies of inpatient continuity have primarily focused on patient discharge (likely because of its objective nature) over the weekends (likely because weekend cross-coverage is common) and have reported conflicting results.1-3 However, discontinuity of care is not isolated to the weekend since hospitalist-switches can occur at any time. In addition, expressing hospitalist continuity of care as a dichotomous variable (Was there weekend cross-coverage?) could incompletely express continuity since discharge likelihood might change with the consecutive number of days that a hospitalist is on service. This study measured the influence of hospitalist continuity throughout the patient’s hospitalization (rather than just the weekend) on daily patient discharge.
METHODS
Study Setting and Databases Used for Analysis
The study was conducted at The Ottawa Hospital, Ontario, Canada, a 1000-bed teaching hospital with 2 campuses and the primary referral center in our region. The division of general internal medicine has 6 patient services (or “teams”) at two campuses led by a staff hospitalist (exclusively general internists), a senior medical resident (2nd year of training), and various numbers of interns and medical students. Staff hospitalists do not treat more than one patient service even on the weekends.
Patients are admitted to each service on a daily basis and almost exclusively from the emergency room. Assignment of patients is essentially random since all services have the same clinical expertise. At a particular campus, the number of patients assigned daily to each service is usually equivalent between teams. Patients almost never switch between teams but may be transferred to another specialty. The study was approved by our local research ethics board.
The Patient Registry Database records for each patient the date and time of admissions (defined as the moment that a patient’s admission request is entered into the database), death or discharge from hospital (defined as the time when the patient’s discharge from hospital was entered into the database), or transfer to another specialty. It also records emergency visits, patient demographics, and location during admission. The Laboratory Database records all laboratory tests and their results.
Study Cohort
The Patient Registry Database was used to identify all individuals who were admitted to the general medicine services between January 1 and December 31, 2015. This time frame was selected to ensure that data were complete and current. General medicine services were analyzed because they are collectively the largest inpatient specialty in the hospital.
Study Outcome
The primary outcome was discharge from hospital as determined from the Patient Registry Database. Patients who died or were transferred to another service were not counted as outcomes.
Covariables
The primary exposure variable was the consecutive number of days (including weekends) that a particular hospitalist rounded on patients on a particular general medicine service. This was measured using call schedules. Other covariates included tomorrow’s expected number of discharges (TEND) daily discharge probability and its components. The TEND model4 used patient factors (age, Laboratory Abnormality Physiological Score [LAPS]5 calculated at admission) and hospitalization factors (hospital campus and service, admission urgency, day of the week, ICU status) to predict the daily discharge probability. In a validation population, these daily discharge probabilities (when summed over a particular day) strongly predicted the daily number of discharges (adjusted R2 of 89.2% [P < .001], median relative difference between observed and expected number of discharges of only 1.4% [Interquartile range,IQR: −5.5% to 7.1%]). The expected annual death risk was determined using the HOMR-now! model.6 This model used routinely collected data available at patient admission regarding the patient (sex, life-table-estimated 1-year death risk, Charlson score, current living location, previous cancer clinic status, and number of emergency department visits in the previous year) and the hospitalization (urgency, service, and LAPS score). The model explained more than half of the total variability in death likelihood of death (Nagelkirke’s R2 value of 0.53),7 was highly discriminative (C-statistic 0.92), and accurately predicted death risk (calibration slope 0.98).
Analysis
Logistic generalized estimating equation (GEE) methods were used to model the adjusted daily discharge probability.8 Data in the analytical dataset were expressed in a patient-day format (each dataset row represented one day for a particular patient). This permitted the inclusion of time-dependent covariates and allowed the GEE model to cluster hospitalization days within patients.
Model construction started with the TEND daily discharge probability and the HOMR-now! expected annual death risk (both expressed as log-odds). Then, hospitalist continuity was entered as a time-dependent covariate (ie, its value changed every day). Linear, square root, and natural logarithm forms of physician continuity were examined to determine the best fit (determined using the QIC statistic9). Finally, individual components of the TEND model were also offered to the model with those which significantly improving fit kept in the model. The GEE model used an independent correlation structure since this minimized the QIC statistic in the base model. All covariates in the final daily discharge probability model were used in the hospital death model. Analyses were conducted using SAS 9.4 (Cary, NC).
RESULTS
There were 6,405 general medicine admissions involving 5208 patients and 38,967 patient-days between January 1 and December 31, 2015 (Appendix A). Patients were elderly and were evenly divided in terms of gender, with 85% of them being admitted from the community. Comorbidities were common (median coded Charlson score was 2), with 6.0% of patients known to our cancer clinic. The median length of stay was 4 days (IQR, 2–7), with 378 admissions (5.9%) ending in death and 121 admissions (1.9%) ending in a transfer to another service.
There were 41 different staff people having at least 1 day on service. The median total service by physicians was 9 weeks (IQR 1.8–10.9 weeks). Changes in hospitalist coverage were common; hospitalizations had a median of 1 (IQR 1–2) physician switches and a median of 1 (IQR 1–2) different physicians. However, patients spent a median of 100% (IQR 66.7%–100%] of their total hospitalization with their primary hospitalist. The median duration of individual physician “stints” on service was 5 days (IQR 2–7, range 1–42).
The TEND model accurately estimated daily discharge probability for the entire cohort with 5833 and 5718.6 observed and expected discharges, respectively, during 38,967 patient-days (O/E 1.02, 95% CI 0.99–1.05). Discharge probability increased as hospitalist continuity increased, but this was statistically significant only when hospitalist continuity exceeded 4 days. Other covariables also significantly influenced discharge probability (Appendix B).
After adjusting for important covariables (Appendix C), hospitalist continuity was significantly associated with daily discharge probability (Figure). Discharge probability increased linearly with increasing consecutive days that hospitalists treated patients. For each additional consecutive day with the same hospitalist, the adjusted daily odds increased by 2% (Adj-odds ratio [OR] 1.02, 95% CI 1.01–1.02, Appendix C). When the consecutive number of days that hospitalists remained on service increased from 1 to 28 days, the adjusted discharge probability for the average patient increased from 18.1% to 25.7%, respectively. Discharge was significantly influenced by other factors (Appendix C). Continuity did not influence the risk of death in hospital (Appendix D).
DISCUSSION
In a general medicine service at a large teaching hospital, this study found that greater hospitalist continuity was associated with a significantly increased adjusted daily discharge probability, increasing (in the average patient) from 18.1% to 25.7% when the consecutive number of hospitalist days on service increased from 1 to 28 days, respectively.
The study demonstrated some interesting findings. First, it shows that shifting patient care between physicians can significantly influence patient outcomes. This could be a function of incomplete transfer of knowledge between physicians, a phenomenon that should be expected given the extensive amount of information–both explicit and implicit–that physicians collect about particular patients during their hospitalization. Second, continuity of care could increase a physician’s and a patient’s confidence in clinical decision-making. Perhaps physicians are subconsciously more trusting of their instincts (and the decisions based on those instincts) when they have been on service for a while. It is also possible that patients more readily trust recommendations of a physician they have had throughout their stay. Finally, people wishing to decrease patient length of stay might consider minimizing the extent that hospitalists sign over patient care to colleagues.
Several issues should be noted when interpreting the results of the study. First, the study examined only patient discharge and death. These are by no means the only or the most important outcomes that might be influenced by hospitalist continuity. Second, this study was limited to a single service at a single center. Third, the analysis did not account for house-staff continuity. Since hospitalist and house-staff at the study hospital invariably switched at different times, it is unlikely that hospitalist continuity was a surrogate for house-staff continuity.
Disclosures
This study was supported by the Department of Medicine, University of Ottawa, Ottawa, Ontario, Canada. The author has nothing to disclose.
1. Ali NA, Hammersley J, Hoffmann SP et al. Continuity of care in intensive care units: a cluster-randomized trial of intensivist staffing. Am J Respir Crit Care Med. 2011;184(7):803-808. PubMed
2. Epstein K, Juarez E, Epstein A, Loya K, Singer A. The impact of fragmentation of hospitalist care on length of stay. J Hosp Med. 2010;5(6):335-338. PubMed
3. Blecker S, Shine D, Park N et al. Association of weekend continuity of care with hospital length of stay. Int J Qual Health Care. 2014;26(5):530-537. PubMed
4. van Walraven C, Forster AJ. The TEND (Tomorrow’s Expected Number of Discharges) model accurately predicted the number of patients who were discharged from the hospital in the next day. J Hosp Med. In press. PubMed
5. Escobar GJ, Greene JD, Scheirer P, Gardner MN, Draper D, Kipnis P. Risk-adjusting hospital inpatient mortality using automated inpatient, outpatient, and laboratory databases. Med Care. 2008;46(3):232-239. PubMed
6. van Walraven C, Forster AJ. HOMR-now! A modification of the HOMR score that predicts 1-year death risk for hospitalized patients using data immediately available at patient admission. Am J Med. In press. PubMed
7. Nagelkerke NJ. A note on a general definition of the coefficient of determination. Biometrika. 1991;78(3):691-692.
8. Stokes ME, Davis CS, Koch GG. Generalized estimating equations. Categorical Data Analysis Using the SAS System. 2nd ed. Cary, NC: SAS Institute Inc; 2000;469-549.
9. Pan W. Akaike’s information criterion in generalized estimating equations. Biometrics. 2001;57(1):120-125. PubMed
© 2018 Society of Hospital Medicine
Mental health visits, boarding continue to climb
SAN DIEGO – Between 2009 and 2015, the number of emergency department visits related to mental health increased 56% among children and 41% among adults, results from an analysis of national hospital data showed.

According to Dr. Santillanes, an emergency medicine physician at the University of Southern California, Los Angeles, data from older studies and non–nationally representative studies have demonstrated that mental health–related ED visits have been increasing. “Emergency physicians know from experience that mental health–related ED visits are increasing and that patients are boarding in EDs longer, but there had not been recent nationally representative studies analyzing these trends in visits by pediatric and adult patients,” she said.
In an effort to describe recent trends in mental health–related ED visits for patients of different ages, Dr. Santillanes and her colleagues retrospectively analyzed data from the National Hospital Ambulatory Medical Care Survey, which generates nationally representative annual estimates of ambulatory care visits to general, nonfederal, short-stay U.S. hospitals. They calculated the proportion of ED visits during 2009-2015 in which one of the first three discharge diagnoses was a mental health or substance abuse diagnosis as defined by the Healthcare Cost and Utilization Project’s Clinical Classifications Software categorization scheme. They excluded patients diagnosed with developmental disorders, as well as those with a diagnosis of delirium, dementia, amnestic and other cognitive disorders, fetal/newborn complications of alcohol and substance abuse, and chronic medical complications of alcohol abuse. The researchers also calculated ED length of stay (LOS) and the proportion of mental health ED visits resulting in inpatient care in the form of admission, observation, or transfer and used linear regression models to examined time trends of the survey data estimates.
Dr. Santillanes and her associates found that mental health–related ED visits for children jumped from 699,677 visits in 2009 to 1,095,313 visits in 2015, an increase of 56%. Adult mental health–related ED visits rose from 7.1 million in 2009 to 10 million in 2015, an increase of 41%. The researchers also found that encounters with a mental health discharge diagnosis rose from 2.1% of pediatric ED visits in 2009 to 3.4% of visits in 2015 (P = .006). For adults, the proportion of ED visits with a mental health discharge diagnosis rose from 6.9% in 2009 to 9.9% in 2015 (P less than .001). In 2015, more than 10% of visits in patients aged 15-64 years and 8.9% of visits in children aged 10-14 years resulted in a mental health discharge diagnosis visits. During this period, the proportion of ED mental health visits that resulted in inpatient care declined from 29.8% to 20.4%, or an average of –2.3% per year; P = .004). At the same time, ED LOS for patients receiving inpatient care increased from 401 to 528 minutes (a 31.7% increase, or an average of 28.6 minutes per year; P = .006), while ED LOS for discharged patients averaged 259.5 minutes and did not significantly change over the study period (P = .660).
“The mean length of stay for these visits was 8.8 hours in 2015,” Dr. Santillanes said. “That represents more than a 30% increase in length of stay from 2009. When we board patients awaiting admission for other medical conditions, we treat their medical conditions while they wait for an inpatient bed. In most EDs, when patients board awaiting a psychiatric bed, they are not receiving treatment for their psychiatric condition. Besides adding to ED crowding, those prolonged boarding times result in patients who need intensive mental health treatment spending many hours in an ED without treatment for their mental health condition.”
Knowing that patients with mental health disorders represent a significant and increasing portion of the patients treated in our EDs, Dr. Santillanes continued, emergency physicians need to determine how to best treat patients with mental health emergencies. “We have dramatically improved the care we provide to patients with medical and surgical conditions,” she said. “We need to do the same for patients with mental health emergencies. Patients with mental health emergencies represent a large proportion of the patients we treat, so we need to be prepared to provide compassionate and evidence-based care for patients with mental health conditions. At the same time, we also need to continue to advocate for improved access to mental health care for all patients so that [they] do not have to rely on emergency departments to access care.”
The researchers reported having no financial disclosures.
SOURCE: Santillanes G et al. Ann Emerg Med. 2018 Oct. doi. 10.1016/j.annemergmed.2018.08.050.
SAN DIEGO – Between 2009 and 2015, the number of emergency department visits related to mental health increased 56% among children and 41% among adults, results from an analysis of national hospital data showed.
According to Dr. Santillanes, an emergency medicine physician at the University of Southern California, Los Angeles, data from older studies and non–nationally representative studies have demonstrated that mental health–related ED visits have been increasing. “Emergency physicians know from experience that mental health–related ED visits are increasing and that patients are boarding in EDs longer, but there had not been recent nationally representative studies analyzing these trends in visits by pediatric and adult patients,” she said.
In an effort to describe recent trends in mental health–related ED visits for patients of different ages, Dr. Santillanes and her colleagues retrospectively analyzed data from the National Hospital Ambulatory Medical Care Survey, which generates nationally representative annual estimates of ambulatory care visits to general, nonfederal, short-stay U.S. hospitals. They calculated the proportion of ED visits during 2009-2015 in which one of the first three discharge diagnoses was a mental health or substance abuse diagnosis as defined by the Healthcare Cost and Utilization Project’s Clinical Classifications Software categorization scheme. They excluded patients diagnosed with developmental disorders, as well as those with a diagnosis of delirium, dementia, amnestic and other cognitive disorders, fetal/newborn complications of alcohol and substance abuse, and chronic medical complications of alcohol abuse. The researchers also calculated ED length of stay (LOS) and the proportion of mental health ED visits resulting in inpatient care in the form of admission, observation, or transfer and used linear regression models to examined time trends of the survey data estimates.
Dr. Santillanes and her associates found that mental health–related ED visits for children jumped from 699,677 visits in 2009 to 1,095,313 visits in 2015, an increase of 56%. Adult mental health–related ED visits rose from 7.1 million in 2009 to 10 million in 2015, an increase of 41%. The researchers also found that encounters with a mental health discharge diagnosis rose from 2.1% of pediatric ED visits in 2009 to 3.4% of visits in 2015 (P = .006). For adults, the proportion of ED visits with a mental health discharge diagnosis rose from 6.9% in 2009 to 9.9% in 2015 (P less than .001). In 2015, more than 10% of visits in patients aged 15-64 years and 8.9% of visits in children aged 10-14 years resulted in a mental health discharge diagnosis visits. During this period, the proportion of ED mental health visits that resulted in inpatient care declined from 29.8% to 20.4%, or an average of –2.3% per year; P = .004). At the same time, ED LOS for patients receiving inpatient care increased from 401 to 528 minutes (a 31.7% increase, or an average of 28.6 minutes per year; P = .006), while ED LOS for discharged patients averaged 259.5 minutes and did not significantly change over the study period (P = .660).
“The mean length of stay for these visits was 8.8 hours in 2015,” Dr. Santillanes said. “That represents more than a 30% increase in length of stay from 2009. When we board patients awaiting admission for other medical conditions, we treat their medical conditions while they wait for an inpatient bed. In most EDs, when patients board awaiting a psychiatric bed, they are not receiving treatment for their psychiatric condition. Besides adding to ED crowding, those prolonged boarding times result in patients who need intensive mental health treatment spending many hours in an ED without treatment for their mental health condition.”
Knowing that patients with mental health disorders represent a significant and increasing portion of the patients treated in our EDs, Dr. Santillanes continued, emergency physicians need to determine how to best treat patients with mental health emergencies. “We have dramatically improved the care we provide to patients with medical and surgical conditions,” she said. “We need to do the same for patients with mental health emergencies. Patients with mental health emergencies represent a large proportion of the patients we treat, so we need to be prepared to provide compassionate and evidence-based care for patients with mental health conditions. At the same time, we also need to continue to advocate for improved access to mental health care for all patients so that [they] do not have to rely on emergency departments to access care.”
The researchers reported having no financial disclosures.
SOURCE: Santillanes G et al. Ann Emerg Med. 2018 Oct. doi. 10.1016/j.annemergmed.2018.08.050.
REPORTING FROM ACEP18
Key clinical point: Mental health ED visits are rising, in total number and as a proportion of all ED visits for children and adults.
Major finding: Between 2009 and 2015, the proportion of children and adults who made mental health–related ED visits increased 56% and 41%, respectively.
Study details: A retrospective analysis of National Hospital Ambulatory Medical Care Survey data between 2009 and 2015.
Disclosures: The researchers reported having no financial disclosures.
Source: Santillanes G et al. Ann Emerg Med. 2018 Oct. doi. 10.1016/j.annemergmed.2018.08.050.
October 2018 Digital Edition
Click here to access the October 2018 Digital Edition.
Table of Contents
- Comparison of Cardiovascular Outcomes Between Statin Monotherapy and Fish Oil and Statin Combination Therapy in a Veteran Population
- Improving Team-Based Care Coordination Delivery and Documentation in the Health Record
- An Overview of Pharmacotherapy Options for Alcohol Use Disorder
- An Imposter Twice Over: A Case of IgG4-Related Disease
- Happy Federal New Year
- FDA Update
AGA Research Foundation researcher of the month: David L. Boone, PhD
AGA Research Foundation pilot awards are an invaluable tool for investigators – they provide seed funding to explore promising new lines of research and generate preliminary data for larger grants. So, when David L. Boone, PhD, received the 2017 AGA-Pfizer Young Investigator Pilot Research Award in Inflammatory Bowel Disease from the AGA Research Foundation, he was able to double-down on a very targeted project studying innate immunity in IBD. Based on his recent accomplishments – both in and out of the lab – we’re excited for you to get to know Dr. Boone, associate professor of microbiology and immunology at Indiana University School of Medicine-South Bend, and our AGA Research Foundation researcher of the month.

Bench to bedside: working toward new treatment options in IBD
The Boone lab AGA-funded project is specifically focused on JAK inhibitors, which are becoming a more popular treatment option for patients with IBD, especially for those patients who don’t respond to anti-TNF therapy. Dr. Boone is committed to enhancing our understanding of how these JAK inhibitors work at a cellular level. If we can understand this, Dr. Boone is optimistic it will lead to new approaches for treating inflammation in IBD.
With his AGA Research Foundation grant, Dr. Boone and his lab characterized a new robust mouse model of colitis that is entirely driven by innate immune mechanisms. With this model, his team is investigating the cellular and molecular mechanisms that drive innate immune-mediated inflammation in the intestine, which will provide important insights for future IBD drug development. You can read the specifics of Dr. Boone’s research in his recently published work in Mucosal Immunology.
Pilot award provides a stepping stone
Dr. Boone’s AGA Research Foundation pilot grant has paved the way for future success. Using the data from his AGA-funded project, as well as the constructive feedback he received from the AGA awards panel, Dr. Boone went on to successfully obtain new funding in the form of a Pfizer ASPIRE research grant. This work is building the foundation for Dr. Boone’s next big grant venture: an NIH R01 grant.
Two postdocs, a graduate student, a technician, and a dog named Boone
Dr. Boone shared with us that the best outcome from his AGA grant was that the additional funding made it possible to grow his lab by a postdoctoral researcher and lab technician. One of Dr. Boone’s great passions is training the next generation of scientists, both in the lab and through his role as a microbiology and immunology professor for first-year medical students at Indiana University Medical School.

Beyond the lab – a commitment to IBD patients
Dr. Boone wanted to do more to support patients with IBD. He had heard of Camp Oasis – the Crohn’s & Colitis Foundation regional camp for patients with IBD – and knew of physicians who provided medical services at the camp. After looking into making a donation to Camp Oasis Michigan, Dr. Boone learned that what the camp really needed was male counselors. So, despite being “older than an average camp counselor,” Dr. Boone packed his bags for Michigan. Participating in Camp Oasis the last 2 years has been a great joy for Dr. Boone and provides added inspiration and motivation for his work in the lab.

The AGA Research Foundation is proud to fund researchers who are committed to improving the lives of patients – both in and out of the lab. You can help keep great researchers in GI by making a gift to the AGA Research Foundation, www.gastro.org/foundation.
AGA Research Foundation pilot awards are an invaluable tool for investigators – they provide seed funding to explore promising new lines of research and generate preliminary data for larger grants. So, when David L. Boone, PhD, received the 2017 AGA-Pfizer Young Investigator Pilot Research Award in Inflammatory Bowel Disease from the AGA Research Foundation, he was able to double-down on a very targeted project studying innate immunity in IBD. Based on his recent accomplishments – both in and out of the lab – we’re excited for you to get to know Dr. Boone, associate professor of microbiology and immunology at Indiana University School of Medicine-South Bend, and our AGA Research Foundation researcher of the month.
Bench to bedside: working toward new treatment options in IBD
The Boone lab AGA-funded project is specifically focused on JAK inhibitors, which are becoming a more popular treatment option for patients with IBD, especially for those patients who don’t respond to anti-TNF therapy. Dr. Boone is committed to enhancing our understanding of how these JAK inhibitors work at a cellular level. If we can understand this, Dr. Boone is optimistic it will lead to new approaches for treating inflammation in IBD.
With his AGA Research Foundation grant, Dr. Boone and his lab characterized a new robust mouse model of colitis that is entirely driven by innate immune mechanisms. With this model, his team is investigating the cellular and molecular mechanisms that drive innate immune-mediated inflammation in the intestine, which will provide important insights for future IBD drug development. You can read the specifics of Dr. Boone’s research in his recently published work in Mucosal Immunology.
Pilot award provides a stepping stone
Dr. Boone’s AGA Research Foundation pilot grant has paved the way for future success. Using the data from his AGA-funded project, as well as the constructive feedback he received from the AGA awards panel, Dr. Boone went on to successfully obtain new funding in the form of a Pfizer ASPIRE research grant. This work is building the foundation for Dr. Boone’s next big grant venture: an NIH R01 grant.
Two postdocs, a graduate student, a technician, and a dog named Boone
Dr. Boone shared with us that the best outcome from his AGA grant was that the additional funding made it possible to grow his lab by a postdoctoral researcher and lab technician. One of Dr. Boone’s great passions is training the next generation of scientists, both in the lab and through his role as a microbiology and immunology professor for first-year medical students at Indiana University Medical School.
Beyond the lab – a commitment to IBD patients
Dr. Boone wanted to do more to support patients with IBD. He had heard of Camp Oasis – the Crohn’s & Colitis Foundation regional camp for patients with IBD – and knew of physicians who provided medical services at the camp. After looking into making a donation to Camp Oasis Michigan, Dr. Boone learned that what the camp really needed was male counselors. So, despite being “older than an average camp counselor,” Dr. Boone packed his bags for Michigan. Participating in Camp Oasis the last 2 years has been a great joy for Dr. Boone and provides added inspiration and motivation for his work in the lab.
The AGA Research Foundation is proud to fund researchers who are committed to improving the lives of patients – both in and out of the lab. You can help keep great researchers in GI by making a gift to the AGA Research Foundation, www.gastro.org/foundation.

Family therapy and cultural conflicts
I recently had the privilege of treating a family who spoke my first language, Hindi. My patient, Ms. M, was 16 years old and struggling to adjust to her new life in the United States, having recently come from India. America’s schooling, culture, and “open society” was a contrast to her life in a semi-rural town, especially her close-knit family structure in which her parents and siblings are everything. Due to their cultural beliefs and religious faith in Islam, both Ms. M and her father were initially resistant to begin treatment for her depression and anxiety. “Let’s give it a trial” was the attitude I finally got from the father. But to me, there was a clear discordance in the communication among the family members in addition to the primary mental illness that led them to come for treatment. I was attracted to work with this family because I had a reasonable understanding of their faith, their culture, and their family system, and I have an inclination toward spirituality. Even though I recognized this family’s social isolation, I wondered why they were still in a state of unrest, given their deep commitment to their faith.
Ms. M was isolating herself at home, in an environment that wasn’t supportive of talking about her concerns. These included being bullied for being “different,” for how she dressed, and for having home-cooked traditional meals for lunch, and being unable to socialize with most of her male peers, except for those from her same community. This led her to dream of returning to India.
The family did not have a social life. Ms. M told me, “I wanted to socialize, but I cannot because of my faith and religion.” So she chose to wear attire to identify with her mother and her culture of origin. She also did this to hide her emotional pain from enduring trauma related to bullying at her school. It was a challenge to understand how faith, resilience, and trauma were intermingled in Ms. M and her family.
I saw Ms. M and her family for 12 one-hour family psychotherapy sessions. The initial session unfolded uneasily. It was a challenge to build rapport and help them understand how family therapy works. Circular inquiries to each family member, specifically to get the mother’s point of view, brought mourning, shame, and guilt to this family. The importance of marriage, education, and immigration were processed in reference to their culture and their incomplete acculturation to life in the United States.
I wondered if there were other families with different cultural backgrounds who struggled with similar conflicts. I also wondered if those families understood the value of family therapy or had ever experienced this therapeutic process.
The 3 key signs that made me believe that this family was making progress through our work together included:
- They complied with treatment; the family never missed a session.
- The parents acknowledged that their daughter was doing better.
- The mother brought me a dinner as a gesture of gratitude in our last session. This is a particularly meaningful gesture on the part of people with their cultural background.
I clearly remember our first meeting, when Ms. M asked

Antipsychotics for patients with dementia: The road less traveled
As psychiatrists treating an aging population, we frequently face the daunting challenges of managing medically complex and behaviorally unstable patients whose fragile condition tests the brightest among us. As our population enters late life, not only are physicians confronted with aging patients whose bodies have decreased renal and hepatic function, but we also face the challenges of the aging brain, severed neuronal networks, and neurotransmitter diminution. These physiological changes can alter treatment response, increase the frequency of adverse effects, and increase the likelihood of emergence of behavioral and psychological symptoms.
During the past decade, the number of people reaching age 65 has dramatically increased. As life expectancy improves, the “oldest old”—those age 85 and older—are the fastest-growing segment of the population. The prevalence of cognitive impairment, including mild cognitive impairment and dementia, in this cohort is >40%.1 Roughly 90% of patients with dementia will develop clinically significant behavioral problems at some point in the course of their illness.2
Behavioral and psychological symptoms of dementia (BPSD) have a tremendous impact on the quality of life for both patients and their caregivers. We are experts in understanding these behaviors and crafting nonpharmacologic treatment plans to manage them. Understanding the context in which behaviors emerge allows us to modify the environment, communication strategies, and other potential triggers, in turn reducing the need for pharmacologic intervention.
However, when nonpharmacologic interventions have been exhausted, what are the options? Antipsychotics have been one of the approaches used to address the challenges of behavioral disturbances and psychosis occurring in dementia. Unfortunately, there is conflicting evidence regarding the risks and benefits associated with the use of antipsychotics in this population. In this article, we provide a roadmap for the judicious use of antipsychotics for patients with dementia.
Weighing the risks and benefits of antipsychotics
Until better treatment options become available, second-generation antipsychotics (SGAs) continue to have an important but limited role in the treatment of behavioral disturbances in dementia. Although safety risks exist, they can be minimized through the careful selection of appropriate patients for treatment, close monitoring, and effective communication with patients and caregivers before and during treatment.
Several studies examining the efficacy of antipsychotics in the treatment of BPSD have demonstrated an increased risk of cerebrovascular events, including stroke and death due to any cause.3 This evidence prompted the FDA to issue a “black-box” warning in 2005 to highlight the increased risk of mortality for patients with dementia who are treated with SGAs.4 Both first-generation antipsychotics (FGAs) and SGAs have been associated with higher rates of mortality than most other psychotropic classes, except anticonvulsants. This increased mortality risk has been shown to persist for at least 6 to 12 months.5,6 FGAs appear to be associated with a greater mortality risk compared with SGAs. As a result, if antipsychotic treatment is necessary, the use of FGAs in this population is not recommended.
The potential mechanisms leading to stroke and death remain unclear. They could include orthostatic hypotension, anticholinergic adverse effects, QT prolongation, platelet aggregation effects, and venous thromboembolism. The presence of cardiovascular and vascular risk factors, electrolyte imbalances, cardiac arrhythmias, and concomitant use of medications that prolong the QTc interval may confer additional risks.
Continued to: Although the use of antipsychotics for patients with dementia...
Although the use of antipsychotics for patients with dementia may increase the risk of mortality, the absolute increased risk to a given individual, at least with short-term treatment, is likely small. The risk may also vary depending on the choice of SGA. Patients who were treated with quetiapine had a slightly lower risk of death than those who were treated risperidone.5 Death rates among patients prescribed aripiprazole, olanzapine, and ziprasidone were similar to the death rates of patients who were treated with risperidone. Compared with patients who were treated with risperidone, patients who were treated with the FGA haloperidol were twice as likely to die during a subsequent 6-month observation period. The largest number of deaths occurred during the first 40 days of treatment.5
While this increased risk of mortality is an important factor to discuss with patients and caregivers when deciding whether to initiate antipsychotic treatment, it is also important to put it into perspective. For example, the risk of suddenly dying from a stroke or heart attack for a person with dementia who is not taking an antipsychotic is approximately 2%. When an individual is started on one of these agents, that risk increases to approximately 4%. While the mortality risk is doubled, it remains relatively small.4 When faced with verbal or physical assaults, hostility, paranoid ideations, or other psychotic symptoms, many families feel that this relatively low risk does not outweigh the potential benefits of reducing caregiver and patient distress. If nonpharmacologic and/or other pharmacologic interventions have failed, the treatment has reached a point of no good alternatives and therapy should then focus on minimizing risk.
Informed consent is essential. A discussion of risks and benefits with the patient, family, or other decision-makers should focus on the risk of stroke, potential metabolic effects, and mortality, as well as potential worsening of cognitive decline associated with antipsychotic treatment. This should be weighed together with the evidence that suggests psychosis and agitation are associated with earlier nursing home admission and death.7,8 Families should be given ample time and opportunity to ask questions. Alternatives to immediate initiation of antipsychotics should be thoroughly reviewed.
Despite the above-noted risks, expert consensus suggests that the use of antipsychotics in the treatment of individuals with dementia can be appropriate, particularly in individuals with dangerous agitation or psychosis.9 These agents can minimize the risk of violence, reduce patient distress, improve the patient’s quality of life, and reduce caregiver burden. In clinical trials, the benefits of antipsychotics have been modest. Nevertheless, evidence has shown that these agents can reduce psychosis, agitation, aggression, hostility, and suspiciousness, which makes them a valid option when other interventions have proven insufficient.
Target specific symptoms
Despite this article’s focus on the appropriate use of antipsychotics for patients with BPSD, it is important to emphasize that the first-line approach to the management of BPSD in this population should always be a person-centered, psychosocial, multidisciplinary, nonpharmacologic approach that focuses on identifying triggers and treating potentially modifiable contributors to behavioral symptoms. Table 110 outlines common underlying causes of BPSD in dementia that should be assessed before prescribing an antipsychotic.
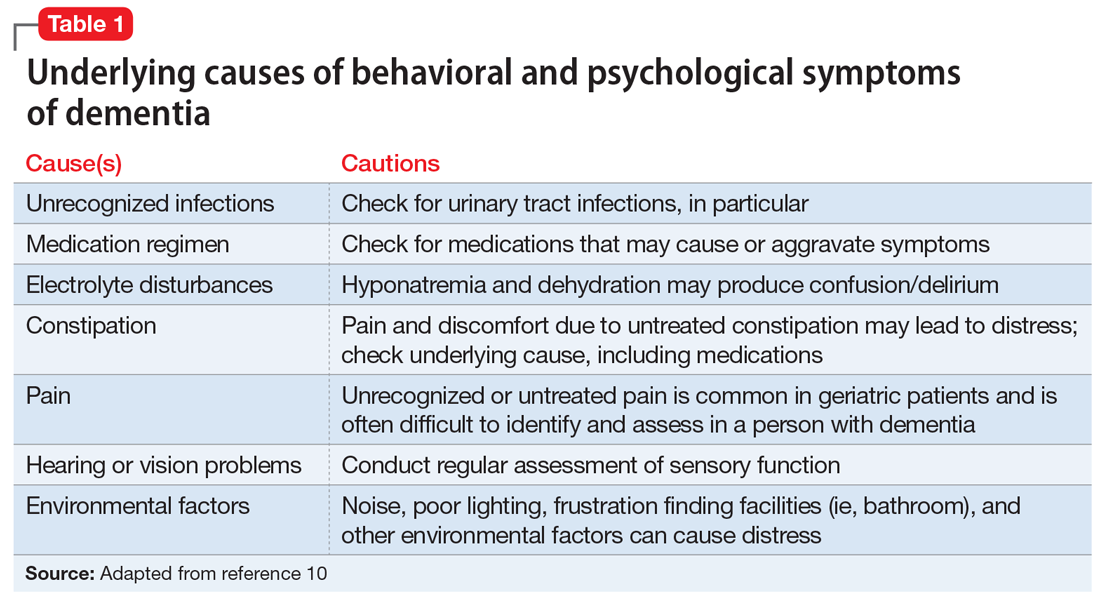
Continued to: Alternative psychopharmacologic treatments...
Alternative psychopharmacologic treatments based on a psychobehavioral metaphor should also be considered (Table 211). This approach matches the dominant target symptoms to the most relevant medication class.11 For example, in the case of a verbally and physically agitated patient who is also irritable, negative, socially withdrawn, and appears dysphoric, we might first undertake a trial of an antidepressant. Conversely, if the patient shows agitation in the context of increased motor activity, loud and rapid speech, and affective lability, we might consider the use of a mood stabilizer. Pharmacologic treatment should be aimed at the modification of clearly identified and documented target behaviors.
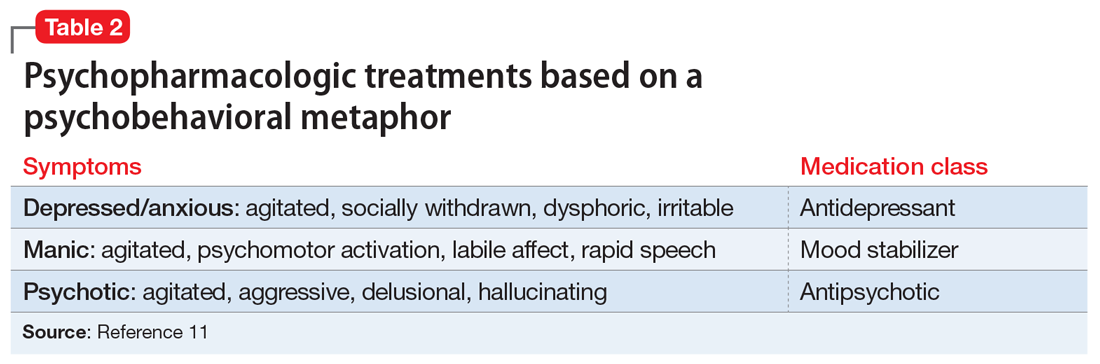
Indications to use antipsychotics for patients with dementia include:
- severe agitation and aggression associated with risk of harm
- delusions and hallucinations
- comorbid preexisting mental health conditions (eg, bipolar disorder, schizophrenia, treatment-resistant depression, etc.).
Symptoms that do not usually respond to an antipsychotic include wandering, social withdrawal, shouting, pacing, touching, cognitive defects, and incontinence.12 These symptoms may respond to interventions such as changes to the environment.
Continued to: Choosing an antipsychotic
Choosing an antipsychotic
Once you have identified that an antipsychotic is truly indicated, the choice of an agent will focus on patient-related factors. Considerations such as frailty, comorbid medical conditions including diabetes, history of falls, hepatic insufficiency, cardiac arrhythmias, and cerebrovascular risk factors, should all be analyzed prior to initiating an antipsychotic. The presence of these conditions will increase the likelihood that adverse effects may occur. It will also guide the dose trajectory and the target dose for discontinuation. Antipsychotics differ with respect to their efficacy and adverse effect profile. For practical purposes, adverse effects typically guide the selection of these agents when used for patients with dementia.
Continued to: Gradual structural changes occur...
Gradual structural changes occur in the dopaminergic system with age and increase the propensity for antipsychotic adverse effects. The number of dopaminergic neurons and D2 receptors decreases approximately 10% per decade. In order to avoid the development of adverse effects related to extrapyramidal symptoms, approximately 20% of receptors need to be free. FGAs tend to block approximately 90% of D2 receptors, whereas SGAs block less than 70% to 80% and dissociate more rapidly from D2 receptors.13 FGAs should therefore be avoided, as they have been associated with numerous adverse effects, including parkinsonism, tardive dyskinesia, akathisia, sedation, peripheral and central anticholinergic effects, postural hypotension, cardiac conduction defects, and falls. As noted above, they have been linked to a greater risk of mortality (Figure14 ).
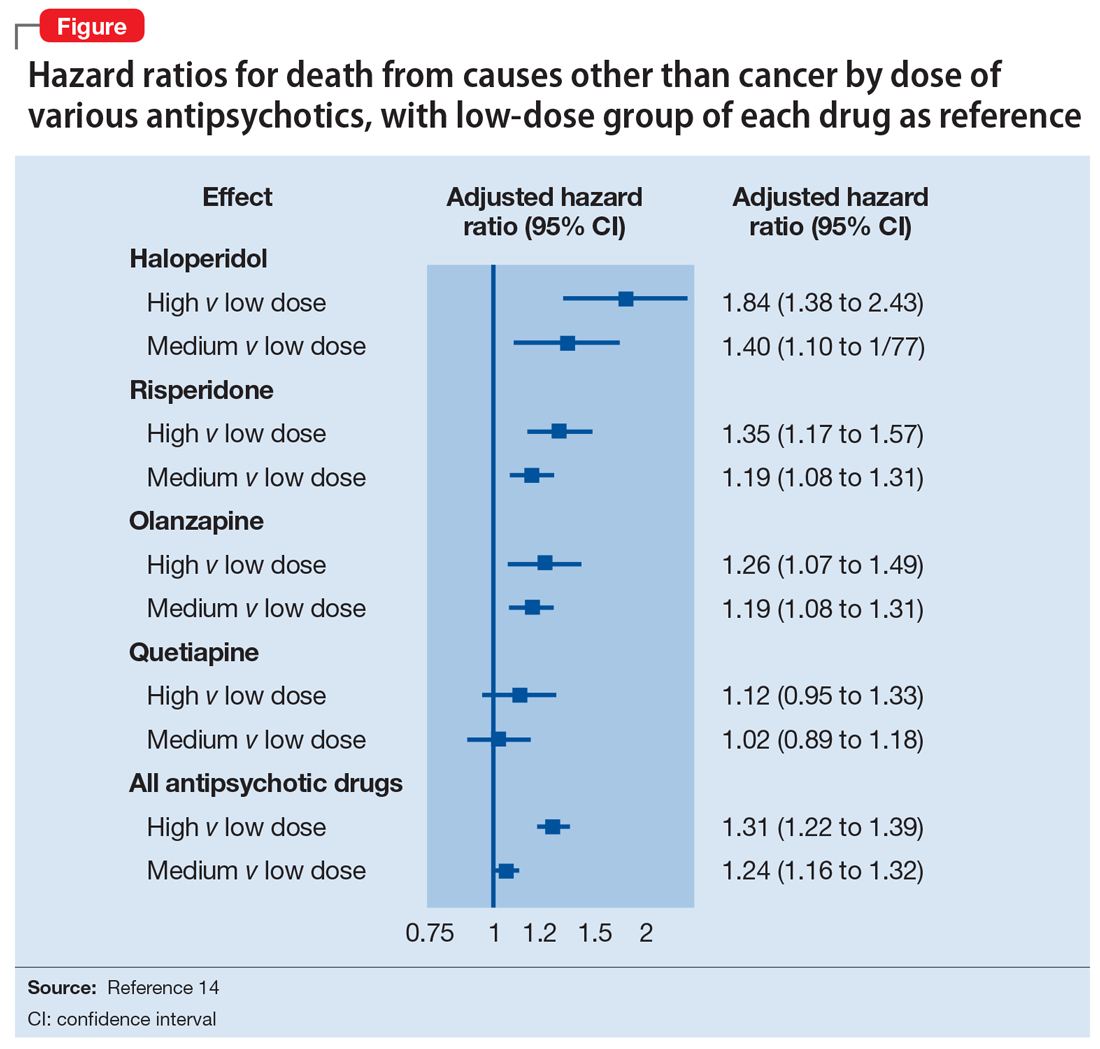
When the decision to use an antipsychotic agent is made for a person with dementia, SGAs appear to be a better choice. There appear to be modest differences within the class of SGAs in terms of effectiveness, tolerability, and adverse effect profile. Although the association between the dose of an antipsychotic and the risk of mortality or stroke remains undefined, other common adverse effects, such as sedation, extrapyramidal symptoms, and risk of falls, can be reduced by starting at the lowest dose possible and titrating slowly.
Dosing considerations
Dose increments should be modest and, in a nonemergent setting, may be adjusted at weekly intervals depending on response. Prior to starting a treatment trial, it is advisable to estimate what will constitute a worthwhile clinical response, the duration of treatment, and the maximum dose. Avoid high doses or prolonged use of antipsychotics that have not significantly improved the target behavior.
When the decision to use a SGA is made, choosing the initial starting dose is challenging given that none of these medications has an indication for use in this population. We propose doses that have been used in completed randomized trials that reflect the best information available about the dose likely to maximize benefit and minimize risk. On the basis of those trials, reasonable starting doses would be15-22:
- quetiapine 25 to 50 mg/d
- risperidone 0.5 to 1 mg/d
- aripiprazole 2 to 10 mg/d
- olanzapine 2.5 to 5 mg/d
- ziprasidone 20 mg/d
Continued to: The highest doses tested...
The highest doses tested for each of these compounds in randomized clinical trials for this population were: risperidone 2 mg/d, olanzapine 10 mg/d, and aripiprazole 15 mg/d. A wide variety of maximum doses of quetiapine were studied in clinical trials, with a top dose of 200 mg being most common. It is worth noting that doses higher than these have been used for other indications.15-22
Quetiapine. One of the most commonly prescribed antipsychotics for the treatment of BPSD in individuals with memory disorders is quetiapine. The reasons for this preference include a low risk of extrapyramidal adverse effects, flexibility of dosing, ability to use lower dosages, and evidence of the lower risk of mortality when compared with other second-generation agents.5,15 If an antipsychotic is indicated, quetiapine should be considered as a first-line antipsychotic therapy. Quetiapine has well-established effects on mood, anxiety, and sleep, all of which can be disrupted in dementia and can act as drivers for agitation.5,15 Starting quetiapine may mitigate the need for separate agents to treat insomnia, loss of appetite, or anxiety, although it is not FDA-indicated for these comorbid conditions. Quetiapine is also less likely to exacerbate motor symptoms compared with other SGAs but has the potential to increase the risk of falls, and orthostasis, and carries a considerable anticholinergic burden.5,15
Risperidone has been shown to provide modest improvements in some people exhibiting symptoms of aggression, agitation, and psychosis.5,15 There is no evidence that risperidone is any more effective than other SGAs, but it has been tested on more geriatric patients than other SGAs. The fact that it is also available in an orally disintegrating tablet makes it a practical treatment in certain populations of patients, such as those who have difficulty swallowing. Risperidone carries the highest extrapyramidal symptom burden among the SGAs due to its potent D2 receptor binding. 5,15
Aripiprazole. There have been several studies of aripiprazole for the treatment of psychosis and agitation in Alzheimer’s dementia.15 This medication showed modest effect and was generally well tolerated. Aripiprazole appears to have less associated weight gain, which may be pertinent for some patients. It also appears to be less sedating than many of the other SGAs. However, some patients may experience activation or insomnia with this agent, particularly with doses <15 mg/d. This activating effect may be beneficial for treating comorbid depressive symptoms, although lower doses could theoretically worsen psychosis due to the activating effects.
Aripiprazole has also been studied in Parkinson’s disease. While some patients had favorable responses with improvement in psychosis and behavioral disturbances, this medication was also associated with worsening of motor symptoms. Certain individuals also experienced a worsening of their psychosis.23 For this reason, it is unlikely to be a useful agent for patients displaying evidence of parkinsonism, Parkinson’s dementia, or dementia with Lewy bodies.
Olanzapine. Several studies have shown that low-dose olanzapine has been modestly effective in decreasing agitation and aggression in patients suffering from Alzheimer’s and vascular dementias.24 The medication is also available in an orally disintegrating form, which may be beneficial when treating individuals whose swallowing abilities are compromised. Olanzapine also has been associated with significant weight gain and metabolic syndrome.24
Continued to: Ziprasidone
Ziprasidone. There are no specific studies of ziprasidone for geriatric patients and none for patients with dementia. However, case reports have suggested both oral and injectable forms of the medication may be well tolerated and have some benefit in treating agitation in this population.25 Based on evidence from younger populations, ziprasidone is less likely to be associated with weight gain or orthostatic hypotension. Medication has been associated with QTc prolongation and should be used with caution and monitored with an ECG.
The initial dosing and potential adverse effects of quetiapine, risperidone, aripiprazole, olanzapine, and ziprasidone are highlighted in Table 3.10
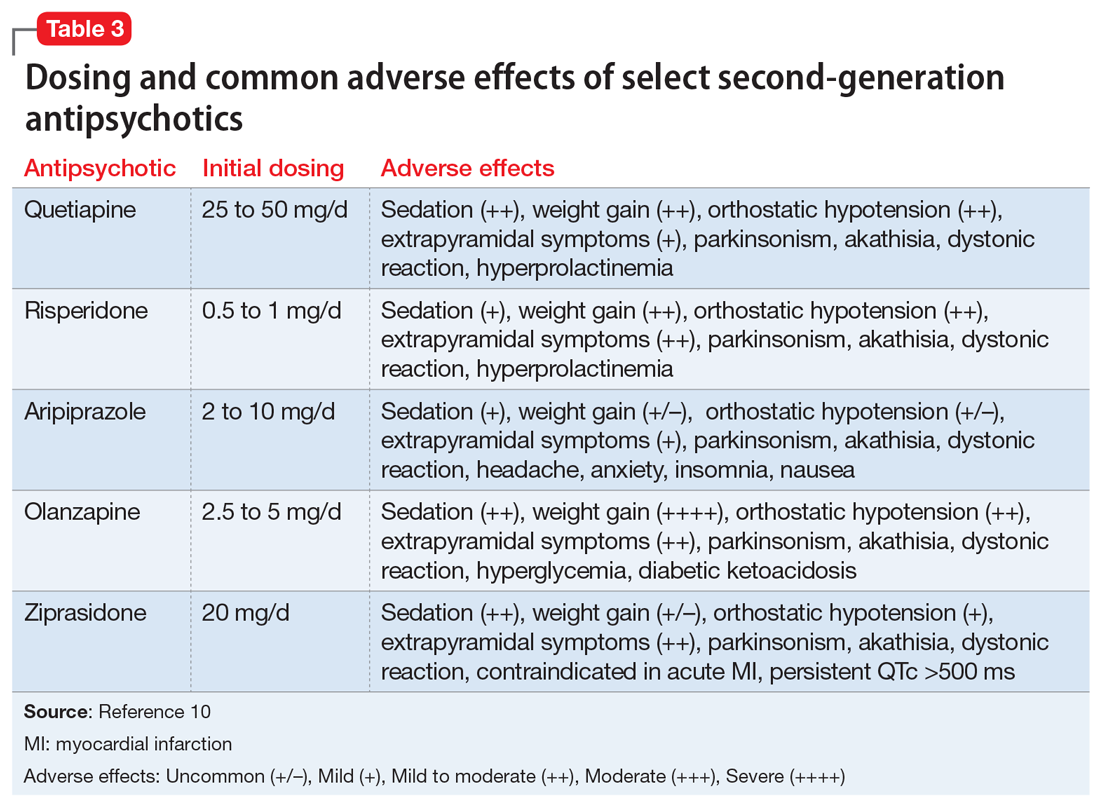
Other SGAs. Newer antipsychotics have recently become available and may serve as additional tools for managing BPSD in the future. Unfortunately, there are currently no available studies regarding their efficacy in the treatment of agitation and psychosis in dementia. One notable exception is pimavaserin, a serotonin 2A receptor inverse agonist. This medication has recently been FDA-approved for the treatment of Parkinson’s disease psychosis. The medication was extensively studied in older patients. It appeared to be effective in reducing delusions and hallucinations while not impairing motor function or causing sedation or hypotension.23 Additional studies are currently ongoing for the treatment of Alzheimer’s dementia psychosis.
Monitor treatment, consider discontinuation
American Psychiatric Association guidelines on the use of antipsychotics to treat agitation or psychosis in patients with dementia currently recommend that clinicians use a quantitative measure to track symptoms and response to treatment.26 These measures may be formal, such as an overall assessment of symptom severity on a Likert scale, or as simple as monitoring the changes in the frequency of periods of agitation.
After starting an antipsychotic, a follow-up appointment should typically take place within 1 month. If the patient is at high risk for developing adverse effects, or if the symptoms are severe, a follow-up appointment for monitoring the response to treatment and potential adverse effects should occur within 1 week. At a minimum, expert consensus suggests follow-up visits should occur every 3 months.
If there is no clinical response after 4 weeks of adequate dosing of an antipsychotic, the medication should be tapered and withdrawn. Switching to an alternative agent may be appropriate.
Many patients will have only partial remission of target symptoms. Therefore, increasing the dose or switching to an alternative agent may be necessary. Concurrent use of multiple antipsychotic agents should be avoided.
Continued to: Maintenance treatment may be appropriate
Maintenance treatment may be appropriate for patients who have demonstrated a clear benefit from antipsychotic treatment without undue adverse effects, and in whom a trial dose reduction has resulted in reappearance of the target symptoms. A formal monitoring plan to assess changes in response and the significance of adverse effects should be in place. Review the target behavior, changes in function, and significance of adverse effects at least every 3 months.
How to approach discontinuation
Behavioral and psychological symptoms of dementia are frequently temporary. If the patient has been stable, gradual dose reduction and eventual discontinuation of antipsychotics should be attempted every 3 months. Studies have reported that most patients who were taken off antipsychotics for treating BPSD showed no worsening of behavioral symptoms.27
Discontinuation of antipsychotics should be done gradually by reducing the dose by 50% every 2 weeks, and then stopping after 2 weeks on the minimum dose, with monitoring for recurrence of target symptoms or emergence of new ones. The longer a medication has been prescribed, the slower the withdrawal occurs. Thus, the possibility of emerging symptoms related to drug withdrawal will lessen.
A roadmap for judicious prescribing
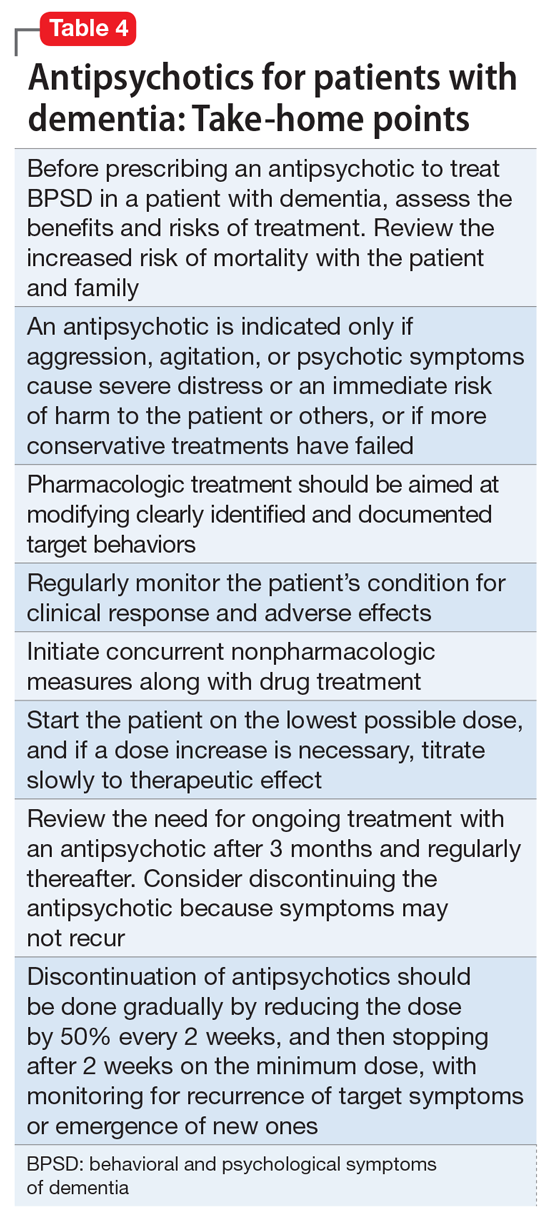
When underlying treatable or reversible causes of BPSD in dementia have been ruled out or nonpharmacologic treatments have failed, a trial of an antipsychotic may be indicated. The choice of agent should focus on patient-related factors and on clearly identified target behaviors. Treatment should be started at a low dose and titrated cautiously to the lowest effective dose.
Behavioral and psychological symptoms of dementia are frequently temporary. Therefore, a gradual reduction and eventual withdrawal of antipsychotic medications should be attempted every 3 months. Studies indicate that most patients are able to tolerate elimination of antipsychotic medications with no worsening of behavioral symptoms.
Despite the limitations of treatment, SGAs remain a valid consideration when other interventions have proven insufficient. However, judicious use of these agents remains the cornerstone of therapy.
Bottom Line
Until better treatment options become available, second-generation antipsychotics (SGAs) continue to have an important, albeit limited, role in the treatment of behavioral disturbances in dementia. Despite the limitations of treatment, SGAs remain a valid consideration when other interventions have proven insufficient. However, judicious use of these agents remains the cornerstone of therapy.
Related Resources
- Kales HC, Mulsant BH, Sajatovic MS. Prescribing antipsychotics in geriatric patients: Focus on dementia. Third of 3 parts. Current Psychiatry. 2017;16(12):24-30.
- Meeks TW, Jeste DV. Antipsychotics in dementia: Beyond ‘black-box’ warnings. Current Psychiatry. 2008;7(6):51-52, 55-58, 64-65.
Drug Brand Names
Aripiprazole • Abilify
Haloperidol • Haldol
Olanzapine • Zyprexa
Pimavanserin • Nuplazid
Risperidone • Risperdal
Quetiapine • Seroquel
Ziprasidone • Geodon
1. Gardner RC, Valcour V, Yaffe K. Dementia in the oldest old: a multi-factorial and growing public health issue. Alzheimers Res Ther. 2013;5(4):27.
2. Tariot PN, Blazina L. The psychopathology of dementia. In: Morris JC, ed. Handbook of dementing illnesses. New York, NY: Marcel Dekker Inc.; 1993:461-475.
3. Schneider LS, Dagerman KS, Insel P. Risk of death with atypical antipsychotic drug treatment for dementia: meta-analysis of randomized placebo-controlled trials. JAMA. 2005;294:1934-1943.
4. Lenzer J. FDA warns about using antipsychotic drugs for dementia. BMJ. 2005;330(7497):922.
5. Kales HC, Valenstein M, Kim HM, et al. Mortality risk in patients with dementia treated with antipsychotics versus other psychiatric medications. Am J Psychiatry. 2007;164(10):1568-1576; quiz 1623.
6. Gill SS, Bronskill SE, Normand SL, et al. Antipsychotic drug use and mortality in older adults with dementia. Ann Intern Med. 2007;146(11):775-786.
7. Okura T, Plassman BL, Steffens DC, et al. Neuropsychiatric symptoms and the risk of institutionalization and death: the aging, demographics, and memory study. J Am Geriatr Soc. 2011;59:473-481.
8. Banerjee S, Murray J, Foley B, et al. Predictors of institutionalisation in people with dementia. J Neurol Neurosurg Psychiatry. 2003;74:1315-1316.
9. Alexopoulos GS, Jeste DV, Chung H, et al. The expert consensus guideline series. Treatment of dementia and its behavioral disturbances. Introduction: methods, commentary, and summary. Postgrad Med. 2005;Spec No:6-22.
10. Burke AD, Hall G, Yaari R, et al. Pocket reference to Alzheimer’s disease management. Philadelphia, PA: Springer Healthcare Communications; 2015:39-46
11. Burke AD, Burke WJ, Tariot PN. Drug treatments for the behavioural and psychiatric symptoms of dementia. In: Ames D, O’Brien JT, Burns A, eds. Dementia, 5th ed. Boca Raton, FL: CRC Press; 2016:231-252.
12. Royal Australian and New Zealand College of Psychiatrists. Antipsychotics in dementia: best practice guide. https://bpac.org.nz/a4d/resources/docs/bpac_A4D_best_practice_guide.pdf. Accessed September 4, 2018.
13. Nyberg L, Backman L. Cognitive aging: a view from brain imaging. In: Dixon RA, Backman L, Nilsson LG, eds. New frontiers in cognitive aging. Oxford: Oxford Univ Press; 2004:135-60.
14. Huybrechts KF, Gerhard T, Crystal S, et al. Differential risk of death in older residents in nursing homes prescribed specific antipsychotic drugs: population based cohort study. BMJ. 2012;344:e977. doi: 10.1136/bmj.e977.
15. Burke AD, Tariot PN. Atypical antipsychotics in the elderly: a review of therapeutic trends and clinical outcomes. Expert Opin Pharmacother. 2009;10(15):2407-2414.
16. De Deyn PP, Rabheru K, Rasmussen A, et al. A randomized trial of risperidone, placebo, and haloperidol for behavioral symptoms of dementia. Neurology.1999;53(5):946-955.
17. De Deyn PP, Jeste DV, Auby P, et al. Aripiprazole in dementia of the Alzheimer’s type. Poster presented at: 16th Annual Meeting of American Association for Geriatric Psychiatry; March 1-4, 2003; Honolulu, HI.
18. Lopez OL, Becker JT, Chang YF, et al. The long-term effects of conventional and atypical antipsychotics in patients with probable Alzheimer’s disease. Am J Psychiatry. 2013;170(9):1051-1058.
19. Mintzer J, Weiner M, Greenspan A, et al. Efficacy and safety of a flexible dose of risperidone versus placebo in the treatment of psychosis of Alzheimer’s disease. In: International College of Geriatric Psychopharmacology. Basel, Switzerland; 2004.
20. Mintzer JE, Tune LE, Breder CD, et al. Aripiprazole for the treatment of psychoses in institutionalized patients with Alzheimer dementia: a multicenter, randomized, double-blind, placebo-controlled assessment of three fixed doses. Am J Geriatr Psychiatry. 2007;15(11):918-931.
21. Sultzer DL, Davis SM, Tariot PN, et al; CATIE-AD Study Group. Clinical symptom responses to atypical antipsychotic medications in Alzheimer’s disease: phase 1 outcomes from the CATIE-AD effectiveness trial. Am J Psychiatry. 2008;165(7):844-854.
22. Zhong KX, Tariot PN, Mintzer J, et al. Quetiapine to treat agitation in dementia: a randomized, double-blind, placebo-controlled study. Curr Alzheimer Res. 2007;4(1):81-93.
23. Bozymski KM, Lowe DK, Pasternak KM, et al. Pimavanserin: a novel antipsychotic for Parkinson’s disease psychosis. Ann Pharmacother. 2017;51(6):479-487.
24. Moretti R, Torre R, Antonello T, et al. Olanzapine as a possible treatment of behavioral symptoms in vascular dementia: risks of cerebrovascular events. J Neurol. 2005;252:1186.
25. Cole SA, Saleem R, Shea WP, et al. Ziprasidone for agitation or psychosis in dementia: four cases. Int J Psychiatry Med. 2005;35(1):91-98.
26. Reus VI, Fochtmann LJ, Eyler AE, et al. The American Psychiatric Association practice guideline on the use of antipsychotics to treat agitation or psychosis in patients with dementia. Am J Psychiatry. 2016;173(5):543-546.
27. Horwitz GJ, Tariot PN, Mead K, et al. Discontinuation of antipsychotics in nursing home patients with dementia. Am J Geriatr Psychiatry. 1995;3(4):290-299.
As psychiatrists treating an aging population, we frequently face the daunting challenges of managing medically complex and behaviorally unstable patients whose fragile condition tests the brightest among us. As our population enters late life, not only are physicians confronted with aging patients whose bodies have decreased renal and hepatic function, but we also face the challenges of the aging brain, severed neuronal networks, and neurotransmitter diminution. These physiological changes can alter treatment response, increase the frequency of adverse effects, and increase the likelihood of emergence of behavioral and psychological symptoms.
During the past decade, the number of people reaching age 65 has dramatically increased. As life expectancy improves, the “oldest old”—those age 85 and older—are the fastest-growing segment of the population. The prevalence of cognitive impairment, including mild cognitive impairment and dementia, in this cohort is >40%.1 Roughly 90% of patients with dementia will develop clinically significant behavioral problems at some point in the course of their illness.2
Behavioral and psychological symptoms of dementia (BPSD) have a tremendous impact on the quality of life for both patients and their caregivers. We are experts in understanding these behaviors and crafting nonpharmacologic treatment plans to manage them. Understanding the context in which behaviors emerge allows us to modify the environment, communication strategies, and other potential triggers, in turn reducing the need for pharmacologic intervention.
However, when nonpharmacologic interventions have been exhausted, what are the options? Antipsychotics have been one of the approaches used to address the challenges of behavioral disturbances and psychosis occurring in dementia. Unfortunately, there is conflicting evidence regarding the risks and benefits associated with the use of antipsychotics in this population. In this article, we provide a roadmap for the judicious use of antipsychotics for patients with dementia.
Weighing the risks and benefits of antipsychotics
Until better treatment options become available, second-generation antipsychotics (SGAs) continue to have an important but limited role in the treatment of behavioral disturbances in dementia. Although safety risks exist, they can be minimized through the careful selection of appropriate patients for treatment, close monitoring, and effective communication with patients and caregivers before and during treatment.
Several studies examining the efficacy of antipsychotics in the treatment of BPSD have demonstrated an increased risk of cerebrovascular events, including stroke and death due to any cause.3 This evidence prompted the FDA to issue a “black-box” warning in 2005 to highlight the increased risk of mortality for patients with dementia who are treated with SGAs.4 Both first-generation antipsychotics (FGAs) and SGAs have been associated with higher rates of mortality than most other psychotropic classes, except anticonvulsants. This increased mortality risk has been shown to persist for at least 6 to 12 months.5,6 FGAs appear to be associated with a greater mortality risk compared with SGAs. As a result, if antipsychotic treatment is necessary, the use of FGAs in this population is not recommended.
The potential mechanisms leading to stroke and death remain unclear. They could include orthostatic hypotension, anticholinergic adverse effects, QT prolongation, platelet aggregation effects, and venous thromboembolism. The presence of cardiovascular and vascular risk factors, electrolyte imbalances, cardiac arrhythmias, and concomitant use of medications that prolong the QTc interval may confer additional risks.
Continued to: Although the use of antipsychotics for patients with dementia...
Although the use of antipsychotics for patients with dementia may increase the risk of mortality, the absolute increased risk to a given individual, at least with short-term treatment, is likely small. The risk may also vary depending on the choice of SGA. Patients who were treated with quetiapine had a slightly lower risk of death than those who were treated risperidone.5 Death rates among patients prescribed aripiprazole, olanzapine, and ziprasidone were similar to the death rates of patients who were treated with risperidone. Compared with patients who were treated with risperidone, patients who were treated with the FGA haloperidol were twice as likely to die during a subsequent 6-month observation period. The largest number of deaths occurred during the first 40 days of treatment.5
While this increased risk of mortality is an important factor to discuss with patients and caregivers when deciding whether to initiate antipsychotic treatment, it is also important to put it into perspective. For example, the risk of suddenly dying from a stroke or heart attack for a person with dementia who is not taking an antipsychotic is approximately 2%. When an individual is started on one of these agents, that risk increases to approximately 4%. While the mortality risk is doubled, it remains relatively small.4 When faced with verbal or physical assaults, hostility, paranoid ideations, or other psychotic symptoms, many families feel that this relatively low risk does not outweigh the potential benefits of reducing caregiver and patient distress. If nonpharmacologic and/or other pharmacologic interventions have failed, the treatment has reached a point of no good alternatives and therapy should then focus on minimizing risk.
Informed consent is essential. A discussion of risks and benefits with the patient, family, or other decision-makers should focus on the risk of stroke, potential metabolic effects, and mortality, as well as potential worsening of cognitive decline associated with antipsychotic treatment. This should be weighed together with the evidence that suggests psychosis and agitation are associated with earlier nursing home admission and death.7,8 Families should be given ample time and opportunity to ask questions. Alternatives to immediate initiation of antipsychotics should be thoroughly reviewed.
Despite the above-noted risks, expert consensus suggests that the use of antipsychotics in the treatment of individuals with dementia can be appropriate, particularly in individuals with dangerous agitation or psychosis.9 These agents can minimize the risk of violence, reduce patient distress, improve the patient’s quality of life, and reduce caregiver burden. In clinical trials, the benefits of antipsychotics have been modest. Nevertheless, evidence has shown that these agents can reduce psychosis, agitation, aggression, hostility, and suspiciousness, which makes them a valid option when other interventions have proven insufficient.
Target specific symptoms
Despite this article’s focus on the appropriate use of antipsychotics for patients with BPSD, it is important to emphasize that the first-line approach to the management of BPSD in this population should always be a person-centered, psychosocial, multidisciplinary, nonpharmacologic approach that focuses on identifying triggers and treating potentially modifiable contributors to behavioral symptoms. Table 110 outlines common underlying causes of BPSD in dementia that should be assessed before prescribing an antipsychotic.
Continued to: Alternative psychopharmacologic treatments...
Alternative psychopharmacologic treatments based on a psychobehavioral metaphor should also be considered (Table 211). This approach matches the dominant target symptoms to the most relevant medication class.11 For example, in the case of a verbally and physically agitated patient who is also irritable, negative, socially withdrawn, and appears dysphoric, we might first undertake a trial of an antidepressant. Conversely, if the patient shows agitation in the context of increased motor activity, loud and rapid speech, and affective lability, we might consider the use of a mood stabilizer. Pharmacologic treatment should be aimed at the modification of clearly identified and documented target behaviors.
Indications to use antipsychotics for patients with dementia include:
- severe agitation and aggression associated with risk of harm
- delusions and hallucinations
- comorbid preexisting mental health conditions (eg, bipolar disorder, schizophrenia, treatment-resistant depression, etc.).
Symptoms that do not usually respond to an antipsychotic include wandering, social withdrawal, shouting, pacing, touching, cognitive defects, and incontinence.12 These symptoms may respond to interventions such as changes to the environment.
Continued to: Choosing an antipsychotic
Choosing an antipsychotic
Once you have identified that an antipsychotic is truly indicated, the choice of an agent will focus on patient-related factors. Considerations such as frailty, comorbid medical conditions including diabetes, history of falls, hepatic insufficiency, cardiac arrhythmias, and cerebrovascular risk factors, should all be analyzed prior to initiating an antipsychotic. The presence of these conditions will increase the likelihood that adverse effects may occur. It will also guide the dose trajectory and the target dose for discontinuation. Antipsychotics differ with respect to their efficacy and adverse effect profile. For practical purposes, adverse effects typically guide the selection of these agents when used for patients with dementia.
Continued to: Gradual structural changes occur...
Gradual structural changes occur in the dopaminergic system with age and increase the propensity for antipsychotic adverse effects. The number of dopaminergic neurons and D2 receptors decreases approximately 10% per decade. In order to avoid the development of adverse effects related to extrapyramidal symptoms, approximately 20% of receptors need to be free. FGAs tend to block approximately 90% of D2 receptors, whereas SGAs block less than 70% to 80% and dissociate more rapidly from D2 receptors.13 FGAs should therefore be avoided, as they have been associated with numerous adverse effects, including parkinsonism, tardive dyskinesia, akathisia, sedation, peripheral and central anticholinergic effects, postural hypotension, cardiac conduction defects, and falls. As noted above, they have been linked to a greater risk of mortality (Figure14 ).
When the decision to use an antipsychotic agent is made for a person with dementia, SGAs appear to be a better choice. There appear to be modest differences within the class of SGAs in terms of effectiveness, tolerability, and adverse effect profile. Although the association between the dose of an antipsychotic and the risk of mortality or stroke remains undefined, other common adverse effects, such as sedation, extrapyramidal symptoms, and risk of falls, can be reduced by starting at the lowest dose possible and titrating slowly.
Dosing considerations
Dose increments should be modest and, in a nonemergent setting, may be adjusted at weekly intervals depending on response. Prior to starting a treatment trial, it is advisable to estimate what will constitute a worthwhile clinical response, the duration of treatment, and the maximum dose. Avoid high doses or prolonged use of antipsychotics that have not significantly improved the target behavior.
When the decision to use a SGA is made, choosing the initial starting dose is challenging given that none of these medications has an indication for use in this population. We propose doses that have been used in completed randomized trials that reflect the best information available about the dose likely to maximize benefit and minimize risk. On the basis of those trials, reasonable starting doses would be15-22:
- quetiapine 25 to 50 mg/d
- risperidone 0.5 to 1 mg/d
- aripiprazole 2 to 10 mg/d
- olanzapine 2.5 to 5 mg/d
- ziprasidone 20 mg/d
Continued to: The highest doses tested...
The highest doses tested for each of these compounds in randomized clinical trials for this population were: risperidone 2 mg/d, olanzapine 10 mg/d, and aripiprazole 15 mg/d. A wide variety of maximum doses of quetiapine were studied in clinical trials, with a top dose of 200 mg being most common. It is worth noting that doses higher than these have been used for other indications.15-22
Quetiapine. One of the most commonly prescribed antipsychotics for the treatment of BPSD in individuals with memory disorders is quetiapine. The reasons for this preference include a low risk of extrapyramidal adverse effects, flexibility of dosing, ability to use lower dosages, and evidence of the lower risk of mortality when compared with other second-generation agents.5,15 If an antipsychotic is indicated, quetiapine should be considered as a first-line antipsychotic therapy. Quetiapine has well-established effects on mood, anxiety, and sleep, all of which can be disrupted in dementia and can act as drivers for agitation.5,15 Starting quetiapine may mitigate the need for separate agents to treat insomnia, loss of appetite, or anxiety, although it is not FDA-indicated for these comorbid conditions. Quetiapine is also less likely to exacerbate motor symptoms compared with other SGAs but has the potential to increase the risk of falls, and orthostasis, and carries a considerable anticholinergic burden.5,15
Risperidone has been shown to provide modest improvements in some people exhibiting symptoms of aggression, agitation, and psychosis.5,15 There is no evidence that risperidone is any more effective than other SGAs, but it has been tested on more geriatric patients than other SGAs. The fact that it is also available in an orally disintegrating tablet makes it a practical treatment in certain populations of patients, such as those who have difficulty swallowing. Risperidone carries the highest extrapyramidal symptom burden among the SGAs due to its potent D2 receptor binding. 5,15
Aripiprazole. There have been several studies of aripiprazole for the treatment of psychosis and agitation in Alzheimer’s dementia.15 This medication showed modest effect and was generally well tolerated. Aripiprazole appears to have less associated weight gain, which may be pertinent for some patients. It also appears to be less sedating than many of the other SGAs. However, some patients may experience activation or insomnia with this agent, particularly with doses <15 mg/d. This activating effect may be beneficial for treating comorbid depressive symptoms, although lower doses could theoretically worsen psychosis due to the activating effects.
Aripiprazole has also been studied in Parkinson’s disease. While some patients had favorable responses with improvement in psychosis and behavioral disturbances, this medication was also associated with worsening of motor symptoms. Certain individuals also experienced a worsening of their psychosis.23 For this reason, it is unlikely to be a useful agent for patients displaying evidence of parkinsonism, Parkinson’s dementia, or dementia with Lewy bodies.
Olanzapine. Several studies have shown that low-dose olanzapine has been modestly effective in decreasing agitation and aggression in patients suffering from Alzheimer’s and vascular dementias.24 The medication is also available in an orally disintegrating form, which may be beneficial when treating individuals whose swallowing abilities are compromised. Olanzapine also has been associated with significant weight gain and metabolic syndrome.24
Continued to: Ziprasidone
Ziprasidone. There are no specific studies of ziprasidone for geriatric patients and none for patients with dementia. However, case reports have suggested both oral and injectable forms of the medication may be well tolerated and have some benefit in treating agitation in this population.25 Based on evidence from younger populations, ziprasidone is less likely to be associated with weight gain or orthostatic hypotension. Medication has been associated with QTc prolongation and should be used with caution and monitored with an ECG.
The initial dosing and potential adverse effects of quetiapine, risperidone, aripiprazole, olanzapine, and ziprasidone are highlighted in Table 3.10
Other SGAs. Newer antipsychotics have recently become available and may serve as additional tools for managing BPSD in the future. Unfortunately, there are currently no available studies regarding their efficacy in the treatment of agitation and psychosis in dementia. One notable exception is pimavaserin, a serotonin 2A receptor inverse agonist. This medication has recently been FDA-approved for the treatment of Parkinson’s disease psychosis. The medication was extensively studied in older patients. It appeared to be effective in reducing delusions and hallucinations while not impairing motor function or causing sedation or hypotension.23 Additional studies are currently ongoing for the treatment of Alzheimer’s dementia psychosis.
Monitor treatment, consider discontinuation
American Psychiatric Association guidelines on the use of antipsychotics to treat agitation or psychosis in patients with dementia currently recommend that clinicians use a quantitative measure to track symptoms and response to treatment.26 These measures may be formal, such as an overall assessment of symptom severity on a Likert scale, or as simple as monitoring the changes in the frequency of periods of agitation.
After starting an antipsychotic, a follow-up appointment should typically take place within 1 month. If the patient is at high risk for developing adverse effects, or if the symptoms are severe, a follow-up appointment for monitoring the response to treatment and potential adverse effects should occur within 1 week. At a minimum, expert consensus suggests follow-up visits should occur every 3 months.
If there is no clinical response after 4 weeks of adequate dosing of an antipsychotic, the medication should be tapered and withdrawn. Switching to an alternative agent may be appropriate.
Many patients will have only partial remission of target symptoms. Therefore, increasing the dose or switching to an alternative agent may be necessary. Concurrent use of multiple antipsychotic agents should be avoided.
Continued to: Maintenance treatment may be appropriate
Maintenance treatment may be appropriate for patients who have demonstrated a clear benefit from antipsychotic treatment without undue adverse effects, and in whom a trial dose reduction has resulted in reappearance of the target symptoms. A formal monitoring plan to assess changes in response and the significance of adverse effects should be in place. Review the target behavior, changes in function, and significance of adverse effects at least every 3 months.
How to approach discontinuation
Behavioral and psychological symptoms of dementia are frequently temporary. If the patient has been stable, gradual dose reduction and eventual discontinuation of antipsychotics should be attempted every 3 months. Studies have reported that most patients who were taken off antipsychotics for treating BPSD showed no worsening of behavioral symptoms.27
Discontinuation of antipsychotics should be done gradually by reducing the dose by 50% every 2 weeks, and then stopping after 2 weeks on the minimum dose, with monitoring for recurrence of target symptoms or emergence of new ones. The longer a medication has been prescribed, the slower the withdrawal occurs. Thus, the possibility of emerging symptoms related to drug withdrawal will lessen.
A roadmap for judicious prescribing
When underlying treatable or reversible causes of BPSD in dementia have been ruled out or nonpharmacologic treatments have failed, a trial of an antipsychotic may be indicated. The choice of agent should focus on patient-related factors and on clearly identified target behaviors. Treatment should be started at a low dose and titrated cautiously to the lowest effective dose.
Behavioral and psychological symptoms of dementia are frequently temporary. Therefore, a gradual reduction and eventual withdrawal of antipsychotic medications should be attempted every 3 months. Studies indicate that most patients are able to tolerate elimination of antipsychotic medications with no worsening of behavioral symptoms.
Despite the limitations of treatment, SGAs remain a valid consideration when other interventions have proven insufficient. However, judicious use of these agents remains the cornerstone of therapy.
Bottom Line
Until better treatment options become available, second-generation antipsychotics (SGAs) continue to have an important, albeit limited, role in the treatment of behavioral disturbances in dementia. Despite the limitations of treatment, SGAs remain a valid consideration when other interventions have proven insufficient. However, judicious use of these agents remains the cornerstone of therapy.
Related Resources
- Kales HC, Mulsant BH, Sajatovic MS. Prescribing antipsychotics in geriatric patients: Focus on dementia. Third of 3 parts. Current Psychiatry. 2017;16(12):24-30.
- Meeks TW, Jeste DV. Antipsychotics in dementia: Beyond ‘black-box’ warnings. Current Psychiatry. 2008;7(6):51-52, 55-58, 64-65.
Drug Brand Names
Aripiprazole • Abilify
Haloperidol • Haldol
Olanzapine • Zyprexa
Pimavanserin • Nuplazid
Risperidone • Risperdal
Quetiapine • Seroquel
Ziprasidone • Geodon
1. Gardner RC, Valcour V, Yaffe K. Dementia in the oldest old: a multi-factorial and growing public health issue. Alzheimers Res Ther. 2013;5(4):27.
2. Tariot PN, Blazina L. The psychopathology of dementia. In: Morris JC, ed. Handbook of dementing illnesses. New York, NY: Marcel Dekker Inc.; 1993:461-475.
3. Schneider LS, Dagerman KS, Insel P. Risk of death with atypical antipsychotic drug treatment for dementia: meta-analysis of randomized placebo-controlled trials. JAMA. 2005;294:1934-1943.
4. Lenzer J. FDA warns about using antipsychotic drugs for dementia. BMJ. 2005;330(7497):922.
5. Kales HC, Valenstein M, Kim HM, et al. Mortality risk in patients with dementia treated with antipsychotics versus other psychiatric medications. Am J Psychiatry. 2007;164(10):1568-1576; quiz 1623.
6. Gill SS, Bronskill SE, Normand SL, et al. Antipsychotic drug use and mortality in older adults with dementia. Ann Intern Med. 2007;146(11):775-786.
7. Okura T, Plassman BL, Steffens DC, et al. Neuropsychiatric symptoms and the risk of institutionalization and death: the aging, demographics, and memory study. J Am Geriatr Soc. 2011;59:473-481.
8. Banerjee S, Murray J, Foley B, et al. Predictors of institutionalisation in people with dementia. J Neurol Neurosurg Psychiatry. 2003;74:1315-1316.
9. Alexopoulos GS, Jeste DV, Chung H, et al. The expert consensus guideline series. Treatment of dementia and its behavioral disturbances. Introduction: methods, commentary, and summary. Postgrad Med. 2005;Spec No:6-22.
10. Burke AD, Hall G, Yaari R, et al. Pocket reference to Alzheimer’s disease management. Philadelphia, PA: Springer Healthcare Communications; 2015:39-46
11. Burke AD, Burke WJ, Tariot PN. Drug treatments for the behavioural and psychiatric symptoms of dementia. In: Ames D, O’Brien JT, Burns A, eds. Dementia, 5th ed. Boca Raton, FL: CRC Press; 2016:231-252.
12. Royal Australian and New Zealand College of Psychiatrists. Antipsychotics in dementia: best practice guide. https://bpac.org.nz/a4d/resources/docs/bpac_A4D_best_practice_guide.pdf. Accessed September 4, 2018.
13. Nyberg L, Backman L. Cognitive aging: a view from brain imaging. In: Dixon RA, Backman L, Nilsson LG, eds. New frontiers in cognitive aging. Oxford: Oxford Univ Press; 2004:135-60.
14. Huybrechts KF, Gerhard T, Crystal S, et al. Differential risk of death in older residents in nursing homes prescribed specific antipsychotic drugs: population based cohort study. BMJ. 2012;344:e977. doi: 10.1136/bmj.e977.
15. Burke AD, Tariot PN. Atypical antipsychotics in the elderly: a review of therapeutic trends and clinical outcomes. Expert Opin Pharmacother. 2009;10(15):2407-2414.
16. De Deyn PP, Rabheru K, Rasmussen A, et al. A randomized trial of risperidone, placebo, and haloperidol for behavioral symptoms of dementia. Neurology.1999;53(5):946-955.
17. De Deyn PP, Jeste DV, Auby P, et al. Aripiprazole in dementia of the Alzheimer’s type. Poster presented at: 16th Annual Meeting of American Association for Geriatric Psychiatry; March 1-4, 2003; Honolulu, HI.
18. Lopez OL, Becker JT, Chang YF, et al. The long-term effects of conventional and atypical antipsychotics in patients with probable Alzheimer’s disease. Am J Psychiatry. 2013;170(9):1051-1058.
19. Mintzer J, Weiner M, Greenspan A, et al. Efficacy and safety of a flexible dose of risperidone versus placebo in the treatment of psychosis of Alzheimer’s disease. In: International College of Geriatric Psychopharmacology. Basel, Switzerland; 2004.
20. Mintzer JE, Tune LE, Breder CD, et al. Aripiprazole for the treatment of psychoses in institutionalized patients with Alzheimer dementia: a multicenter, randomized, double-blind, placebo-controlled assessment of three fixed doses. Am J Geriatr Psychiatry. 2007;15(11):918-931.
21. Sultzer DL, Davis SM, Tariot PN, et al; CATIE-AD Study Group. Clinical symptom responses to atypical antipsychotic medications in Alzheimer’s disease: phase 1 outcomes from the CATIE-AD effectiveness trial. Am J Psychiatry. 2008;165(7):844-854.
22. Zhong KX, Tariot PN, Mintzer J, et al. Quetiapine to treat agitation in dementia: a randomized, double-blind, placebo-controlled study. Curr Alzheimer Res. 2007;4(1):81-93.
23. Bozymski KM, Lowe DK, Pasternak KM, et al. Pimavanserin: a novel antipsychotic for Parkinson’s disease psychosis. Ann Pharmacother. 2017;51(6):479-487.
24. Moretti R, Torre R, Antonello T, et al. Olanzapine as a possible treatment of behavioral symptoms in vascular dementia: risks of cerebrovascular events. J Neurol. 2005;252:1186.
25. Cole SA, Saleem R, Shea WP, et al. Ziprasidone for agitation or psychosis in dementia: four cases. Int J Psychiatry Med. 2005;35(1):91-98.
26. Reus VI, Fochtmann LJ, Eyler AE, et al. The American Psychiatric Association practice guideline on the use of antipsychotics to treat agitation or psychosis in patients with dementia. Am J Psychiatry. 2016;173(5):543-546.
27. Horwitz GJ, Tariot PN, Mead K, et al. Discontinuation of antipsychotics in nursing home patients with dementia. Am J Geriatr Psychiatry. 1995;3(4):290-299.

5 Strategies for managing antipsychotic-induced hyperprolactinemia
There is a well-established relationship between antipsychotic treatment and hyperprolactinemia. Most antipsychotics have been linked to increased prolactin levels, and the risk appears to be dose-related.1 Antipsychotic-induced hyperprolactinemia can be asymptomatic, but it also has been associated with several adverse effects, including menstrual irregularity, osteoporosis, gynecomastia, and sexual dysfunction. Here I discuss what to do before starting a patient on an antipsychotic, and 5 treatment strategies for addressing antipsychotic-induced hyperprolactinemia.
Get a baseline prolactin level
Before starting a patient on an antipsychotic, obtain a baseline prolactin level measurement. If the patient later develops hyperprolactinemia, having a baseline measurement will make it easier to determine if the antipsychotic is a potential cause. Also, it is helpful to gather additional information regarding baseline psychosexual function and menstruation before starting an antipsychotic.
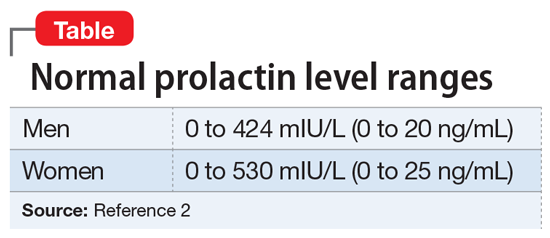
It is critical to determine if a temporal relationship exists between exposure to an antipsychotic and increase in prolactin levels.3 If the time course is unclear, laboratory tests need to be performed, including assessing liver, renal, and thyroid function or imaging of the pituitary gland. Also, hyperprolactinemia should not be diagnosed based on a single blood test result, because emotional and physical stress can elevate prolactin levels.
Continued to: 5 strategies for addressing hyperprolactinemia
5 strategies for addressing hyperprolactinemia
1. Reduce the antipsychotic dose. Because the risk of hyperprolactinemia is dose-dependent, reducing the antipsychotic dose could be helpful for some patients.
2. Switch to a prolactin-sparing antipsychotic, such as clozapine, quetiapine, olanzapine, or ziprasidone. However, it is often difficult to predict positive outcomes because switching antipsychotics may cause new adverse effects or trigger a psychotic relapse.
3. Consider sex hormone replacement therapy. A combined oral contraceptive could prevent osteoporosis and help estrogen deficiency symptoms in women who require antipsychotic medication. However, this treatment approach may worsen galactorrhea.
4. Use a dopamine receptor agonist. Dopamine receptor agonists, such as cabergoline or bromocriptine, have been shown to suppress prolactin secretion. Clinicians should always proceed cautiously because these medications can potentially increase the risk of psychosis.
5. Examine the potential benefits of adding aripiprazole because it can be used for augmentation to reduce prolactin levels in patients receiving other antipsychotics. In some cases, dopamine receptors can be exposed to competition between a partial agonist (aripiprazole) and an antagonist (the current antipsychotic). This competition may decrease the effectiveness of the current antipsychotic.1 Also, adding another antipsychotic could increase overall adverse effects.
1. Montejo ÁL, Arango C, Bernardo M, et al. Multidisciplinary consensus on the therapeutic recommendations for iatrogenic hyperprolactinemia secondary to antipsychotics. Front Neuroendocrinol. 2017;45:25-34.
2. Taylor D, Paton C, Kapur S. Schizophrenia. In: Taylor D, Paton C, Kapur S. The Maudsley Prescribing Guidelines in psychiatry. 12th ed. Chichester, UK: Wiley Blackwell; 2015:133-134.
3. Miyamoto BE, Galecki M, Francois D. Guidelines for antipsychotic-induced hyperprolactinemia. Psychiatr Ann. 2015;45(5):266,268,270-272.
There is a well-established relationship between antipsychotic treatment and hyperprolactinemia. Most antipsychotics have been linked to increased prolactin levels, and the risk appears to be dose-related.1 Antipsychotic-induced hyperprolactinemia can be asymptomatic, but it also has been associated with several adverse effects, including menstrual irregularity, osteoporosis, gynecomastia, and sexual dysfunction. Here I discuss what to do before starting a patient on an antipsychotic, and 5 treatment strategies for addressing antipsychotic-induced hyperprolactinemia.
Get a baseline prolactin level
Before starting a patient on an antipsychotic, obtain a baseline prolactin level measurement. If the patient later develops hyperprolactinemia, having a baseline measurement will make it easier to determine if the antipsychotic is a potential cause. Also, it is helpful to gather additional information regarding baseline psychosexual function and menstruation before starting an antipsychotic.
It is critical to determine if a temporal relationship exists between exposure to an antipsychotic and increase in prolactin levels.3 If the time course is unclear, laboratory tests need to be performed, including assessing liver, renal, and thyroid function or imaging of the pituitary gland. Also, hyperprolactinemia should not be diagnosed based on a single blood test result, because emotional and physical stress can elevate prolactin levels.
Continued to: 5 strategies for addressing hyperprolactinemia
5 strategies for addressing hyperprolactinemia
1. Reduce the antipsychotic dose. Because the risk of hyperprolactinemia is dose-dependent, reducing the antipsychotic dose could be helpful for some patients.
2. Switch to a prolactin-sparing antipsychotic, such as clozapine, quetiapine, olanzapine, or ziprasidone. However, it is often difficult to predict positive outcomes because switching antipsychotics may cause new adverse effects or trigger a psychotic relapse.
3. Consider sex hormone replacement therapy. A combined oral contraceptive could prevent osteoporosis and help estrogen deficiency symptoms in women who require antipsychotic medication. However, this treatment approach may worsen galactorrhea.
4. Use a dopamine receptor agonist. Dopamine receptor agonists, such as cabergoline or bromocriptine, have been shown to suppress prolactin secretion. Clinicians should always proceed cautiously because these medications can potentially increase the risk of psychosis.
5. Examine the potential benefits of adding aripiprazole because it can be used for augmentation to reduce prolactin levels in patients receiving other antipsychotics. In some cases, dopamine receptors can be exposed to competition between a partial agonist (aripiprazole) and an antagonist (the current antipsychotic). This competition may decrease the effectiveness of the current antipsychotic.1 Also, adding another antipsychotic could increase overall adverse effects.
1. Montejo ÁL, Arango C, Bernardo M, et al. Multidisciplinary consensus on the therapeutic recommendations for iatrogenic hyperprolactinemia secondary to antipsychotics. Front Neuroendocrinol. 2017;45:25-34.
2. Taylor D, Paton C, Kapur S. Schizophrenia. In: Taylor D, Paton C, Kapur S. The Maudsley Prescribing Guidelines in psychiatry. 12th ed. Chichester, UK: Wiley Blackwell; 2015:133-134.
3. Miyamoto BE, Galecki M, Francois D. Guidelines for antipsychotic-induced hyperprolactinemia. Psychiatr Ann. 2015;45(5):266,268,270-272.