User login
Hospital at Home and Emergence of the Home Hospitalist
Ms. P., an 86-year-old woman with a history of hypertension, hyperlipidemia, coronary artery disease, and transient ischemic attack, presents to the emergency department with a three-day history of cough, fever, purulent sputum, fatigue, and dyspnea on exertion. Her vital signs are notable for a fever of 39.0°C, blood pressure 136/92, pulse 102, respiratory rate 30, and room air oxygen saturation of 91%. She looks ill. She has a white blood cell count of 16,000, lactate 1.9, and a right lower lobe infiltrate on imaging. The emergency department attending physician presents the case to you for admission, and you accept the patient into your inpatient hospitalist service.
Now, let’s imagine a different future in which you are the attending hospitalist on your institution’s Hospital at Home (HaH) service, where you will provide hospital-level care to Ms. P. in the comfort of her own home. Hospitalists should prepare for this paradigm shift.
WHAT IS HOSPITAL AT HOME?
HaH provides hospital-level care in a patient’s home, for those with qualifying acute illnesses and appropriate degrees of acuity, as a substitute for traditional inpatient care.1 This is achieved by bringing the critical elements of hospital care to the home—physician and nursing care, intravenous medications and fluids, oxygen and respiratory therapies, basic radiography and ultrasound, durable medical equipment, skilled therapies, and more.2
All hospitalists have cared for patients like Ms. P., and she and many patients like her will have a straightforward hospital trajectory: initial evaluation in the emergency department, inpatient care provided by a hospitalist inpatient service, a few days of intravenous antibiotics and other hospital services, and finally, discharge to home.
A SHARED RATIONALE FOR HOSPITAL MEDICINE AND HOSPITAL AT HOME
However, not all patients will experience a smooth, or safe, hospital course. Studies that launched the hospital safety movement also provide the rationale for HaH, namely, that hospitals are often dangerous environments for patients.3
A complementary approach to improving outcomes for patients at high risk of iatrogenic illness such as functional decline, falls, delirium, adverse drug events, and hospital-associated disability syndrome,4-6 is to care for patients outside the traditional inpatient hospital environment. Over the past 20 years, many studies—including dozens of randomized controlled trials and several meta-analyses—have shown better outcomes for patients cared for in HaH: decreased length of stay, decreased incidence of adverse events (including substantially lower six-month mortality), better patient and caregiver care experiences, lower caregiver stress, and lower costs.7-9A recent Center for Medicare and Medicaid Innovation (CMMI) Demonstration conducted at the Mount Sinai Health System found similar results.10
GROWING INTEREST IN HOSPITAL AT HOME AND CHALLENGES TO DISSEMINATION
Interest in HaH has increased markedly over the past few years with increased penetration of Medicare and Medicaid managed care, the development and spread of accountable care organizations (ACOs), and a shift in focus among some health systems towards value-based care, population health, and community-based care. Recently, commercial entities have entered the HaH space and have raised substantial capital to fund development. Despite this growing interest in HaH and substantial evidence of its effectiveness, HaH has not been widely implemented or scaled in the United States.
Widespread dissemination and implementation of HaH has been hampered by several barriers. First, despite growing interest in HaH, the culture of healthcare and health system leadership, for the most part, remains focused on facility-based care.11
Second, while HaH makes financial sense in the managed care arena, given the strong evidence for high-quality, lower-cost care, there is currently no standard payment mechanism for HaH in fee-for-service Medicare or in the commercial insurance space. However, there are indications that this may soon change. In the fall of 2017, a proposal for a bundled payment mechanism for acute HaH care plus 30 days of postacute care was unanimously approved by an Advisory Committee to the Secretary of the Department of Health and Human Services (HHS).12,13 The HHS Secretary recently noted that “the Department of Health and Human Services is keenly interested in ideas for home-based, hospital-level care, and agrees … that this proposal holds promise for testing.”14
Third is the need to create the logistics and supply chain to support HaH. There currently exists a well-established supply chain for providing hospital care. A hospitalist orders a dose of intravenous antibiotic or oxygen, and it is supplied in a timely manner. Similarly, the postacute sector of healthcare has a robust supply chain, though it operates on a somewhat different clock from the acute care setting. However, there is currently no easily replicable supply chain to meet the needs of providing acute care in the home. Each HaH has had to create its own system of logistics with the existing healthcare assets in its local environment. Developing this capacity at scale will require significant capital investment.
There are examples where HaH has scaled. Beginning in 1994, in the state of Victoria, Australia (population 6.3 million), the health authority reimbursed HaH care at the same rates as traditional hospital care. At last report, HaH provided approximately 5% of all hospital bed days of care in Victoria. Providing HaH on this scale helped avoid the need to build a new 500-bed hospital to care for those patients.15 The avoided costs of building new hospital beds (and the ongoing need to fill those beds) represents significant societal return on investment attributable to HaH.
EMERGENCE OF THE HOME HOSPITALIST?
A key element in implementing a HaH program is its physician staff in terms of the types of doctors who provide HaH care, how they are organized, and how they interact with patients. To date, HaH physicians have been predominantly geriatricians, but internists and family medicine physicians, employed as full-time members of a dedicated HaH team, also provide care by physically visiting patients in their homes. The reason for significant involvement of geriatricians in HaH may relate to the fact that geriatric fellowship training includes training in home-based medical care, whereas this is less common in family medicine and internal medicine residency training programs.
In order to provide HaH on a nationwide scale, there will be a need for a larger workforce. There is an opportunity here to leverage existing hospital physician staff, such as hospitalists. In addition, while there is significant value in physicians seeing patients in their homes, more scalable versions of HaH are being developed and implemented that leverage biometrically enhanced telemedicine approaches for a dedicated physician component of care, with in-person visits provided by other members of an interdisciplinary team.
We believe that hospitalists can play a key role as HaH physicians as the HaH model continues to evolve and expand. Hospitalists bring valuable expertise relevant to HaH care delivery, including extensive experience with the triage of acutely ill patients, an understanding of the natural course of acute illness and team-based care, and for some, experience with telemedicine care.
While a hospitalist providing HaH care would leverage many of the competencies of the traditional hospitalist, we suggest that such a provider should receive additional training and clinical experience in home-based medical care to help them better understand the unique aspects of providing care in patients’ homes.16 Such training could include experience in making house calls, which can be a transformational experience in helping physicians improve their skills in dealing with social determinants of health, diagnosing and managing geriatric syndromes, and mobilizing community resources in the care of their patients, as well as managing care transitions. Hospitalists delivering care in HaH may also need to upgrade specific clinical skills commonly addressed by home-based medical care providers: wound care, caregiver-related issues, social and ethical issues specific to home-based care, problems with functional status, psychiatric and cognitive issues, management of gastrostomy tubes and bladder catheters, and dermatologic problems, as well as palliative care and end-of-life symptom management. These skills are slightly different from the usual realm of the typical hospitalists’ wheelhouse. However, it is all learnable.17 Similarly, geriatricians can learn from hospitalists as the HaH model evolves; there are HaH programs in existence today that take care of a sicker tranche of patients than earlier versions of HaH, with continuous telemonitoring of patients and the ability to rapidly deploy providers, labs, imaging, and medications. Going forward, as healthcare organizations begin to develop HaH programs staffed by hospitalists, it is probably wise for hospitalists and geriatricians to collaborate on the optimal physician models for HaH.
There may emerge a new specialty. Ticona and Schulman described a “home intensivist” with competencies including informatics of remote monitoring technology, leadership of multidisciplinary care teams, and the interpersonal skills required for compassionate end-of-life care.18 We prefer the term Home Hospitalist. Home Hospitalists would develop an enhanced understanding of the transitions of care and social determinants of health, and they would gain valuable knowledge about the social and environmental challenges many patients face after discharge from the hospital.
When this vision is realized, there will be enormous benefits to both HaH and Hospital Medicine. HaH could tap into a large and competent workforce to enhance its implementation and dissemination. Hospital Medicine would gain a new pathway for its providers and could develop new collaborative efforts with geriatric, internal, and family medicine.
Disclosures
Dr. Danielsson has nothing to disclose. Dr. Leff reports personal fees from Medically Home, other from Dispatch Health, other from Landmark Health, personal fees from Medibank, personal fees from Apple, personal fees from Health Affairs, other from Honor, personal fees from Institute for Healthcare Improvement, outside the submitted work; and American Academy of Home Care Medicine - member board of directors, voluntary.
Funding
Dr. Leff was supported in this work by a grant from The John A. Hartford Foundation.
1. Leff B, Montalto M. Home hospital-toward a tighter definition. J Am Geriatr Soc. 2004;52(12):2141. doi: 10.1111/j.1532-5415.2004.52579_1.x. PubMed
2. Leff B, Burton L, Mader SL, et al. Hospital at home: feasibility and outcomes of a program to provide hospital-level care at home for acutely ill older patients. Ann Intern Med. 2005;143(11):798-808. doi: 10.7326/0003-4819-143-11-200512060-00008. PubMed
3. Brennan TA, Leape LL, Laird NM, et al. Incidence of adverse events and negligence in hospitalized patients. Results of the Harvard Medical Practice Study I. N Engl J Med. 1991;324(6):370-376. doi: 10.1056/NEJM199102073240604. PubMed
4. Creditor MC. Hazards of hospitalization of the elderly. Ann Intern Med. 1993;118(3):219-223. doi: 10.7326/0003-4819-118-3-199302010-00011. PubMed
5. Covinsky KE, Pierluissi E, Johnston CB. Hospitalization-associated disability: “She was probably able to ambulate, but I’m not sure”. JAMA. 2011;306(16):1782-1793. doi: 10.1001/jama.2011.1556. PubMed
6. Wald HL. The Geometry of Patient Safety: Horizontal and Vertical Approaches to the Hazards of Hospitalization. J Am Geriatr Soc. 2017;65(12):2559-2561. doi: 10.1111/jgs.15049. PubMed
7. Shepperd S, Doll H, Angus RM, et al. Avoiding hospital admission through provision of hospital care at home: a systematic review and meta-analysis of individual patient data. CMAJ. 2009;180(2):175-182. doi: 10.1503/cmaj.081491. PubMed
8. Caplan GA, Sulaiman NS, Mangin N, et al. A meta-analysis of “Hospital in the Home”. Med J Aust. 2012;197:512-519. doi: 10.5694/mja12.10480. PubMed
9. Shepperd S, Iliffe S, Doll HA, et al. Admission avoidance hospital at home. Cochrane Database Syst Rev. 2016;9:CD007491. doi: 10.1002/14651858.CD007491.pub2. PubMed
10. Federman AD, Soones T, DeCherrie LV, Leff B, Siu AL. Association of a bundled hospital-at-home and 30-day postacute transitional care program with clinical outcomes and patient experiences. JAMA Intern Med. 2018;178(8):1033-1040. doi: 10.1001/jamainternmed.2018.2562. PubMed
11. Stein PD, Hull RD, Matta F, Willyerd GL. Modest response in translation to home management of deep venous thrombosis. Am J Med. 2010;123(12):1107-1113. doi: 10.1016/j.amjmed.2010.07.016. PubMed
12. Icahn School of Medicine at Mount Sinai. “HaH-Plus” (Hospital at Home Plus) Provider Focused Payment Model. https://aspe.hhs.gov/system/files/pdf/255906/HaHPlusProviderFocusedPaymentModel.pdf. Accessed November 11, 2018.
13. Physician-F ocused Payment Model Technical Advisory Committee. Report to the Secretary of Health and Human Services. Comments and Recommendation on “HaH-Plus (Hospital at Home Plus) Provider-Focused Payment Model. https://aspe.hhs.gov/system/files/pdf/255906/MtSinaiHAHReportSecretary.pdf. Accessed November 11, 2018.
14. The Secretary of Health and Human Services. Response to the Report to the Secretary of Health and Human Services. Comments and Recommendation on “HaH-Plus (Hospital at Home Plus) Provider-Focused Payment Model. https://downloads.cms.gov/files/cmmi/ptac-hhssecresponse-oct17-may18.pdf. Accessed November 11, 2018.
15. Montalto M. The 500-bed hospital that isn’t there: the Victorian Department of Health review of the Hospital in the Home program. Med J Aust. 2010;193(10);598-601. PubMed
16. Hayashi J, Leff B. Geriatric Home-Based Medical Care. New York, NY: Springer Publishers; 2015. PubMed
17. Reckrey JM, Ornstein KA, Wajnberg A, Kopke MV, DeCherrie LV. Teaching home-based primary care. Home Healthc Now. 2017;35(10):561-565. doi: 10.1097/NHH.0000000000000621. PubMed
18. Ticona L, Schulman KA. Extreme home makeover - the role of intensive home health care. N Engl J Med. 2016;375(18):1707-1709. doi: 10.1056/NEJMp1608301. PubMed
Ms. P., an 86-year-old woman with a history of hypertension, hyperlipidemia, coronary artery disease, and transient ischemic attack, presents to the emergency department with a three-day history of cough, fever, purulent sputum, fatigue, and dyspnea on exertion. Her vital signs are notable for a fever of 39.0°C, blood pressure 136/92, pulse 102, respiratory rate 30, and room air oxygen saturation of 91%. She looks ill. She has a white blood cell count of 16,000, lactate 1.9, and a right lower lobe infiltrate on imaging. The emergency department attending physician presents the case to you for admission, and you accept the patient into your inpatient hospitalist service.
Now, let’s imagine a different future in which you are the attending hospitalist on your institution’s Hospital at Home (HaH) service, where you will provide hospital-level care to Ms. P. in the comfort of her own home. Hospitalists should prepare for this paradigm shift.
WHAT IS HOSPITAL AT HOME?
HaH provides hospital-level care in a patient’s home, for those with qualifying acute illnesses and appropriate degrees of acuity, as a substitute for traditional inpatient care.1 This is achieved by bringing the critical elements of hospital care to the home—physician and nursing care, intravenous medications and fluids, oxygen and respiratory therapies, basic radiography and ultrasound, durable medical equipment, skilled therapies, and more.2
All hospitalists have cared for patients like Ms. P., and she and many patients like her will have a straightforward hospital trajectory: initial evaluation in the emergency department, inpatient care provided by a hospitalist inpatient service, a few days of intravenous antibiotics and other hospital services, and finally, discharge to home.
A SHARED RATIONALE FOR HOSPITAL MEDICINE AND HOSPITAL AT HOME
However, not all patients will experience a smooth, or safe, hospital course. Studies that launched the hospital safety movement also provide the rationale for HaH, namely, that hospitals are often dangerous environments for patients.3
A complementary approach to improving outcomes for patients at high risk of iatrogenic illness such as functional decline, falls, delirium, adverse drug events, and hospital-associated disability syndrome,4-6 is to care for patients outside the traditional inpatient hospital environment. Over the past 20 years, many studies—including dozens of randomized controlled trials and several meta-analyses—have shown better outcomes for patients cared for in HaH: decreased length of stay, decreased incidence of adverse events (including substantially lower six-month mortality), better patient and caregiver care experiences, lower caregiver stress, and lower costs.7-9A recent Center for Medicare and Medicaid Innovation (CMMI) Demonstration conducted at the Mount Sinai Health System found similar results.10
GROWING INTEREST IN HOSPITAL AT HOME AND CHALLENGES TO DISSEMINATION
Interest in HaH has increased markedly over the past few years with increased penetration of Medicare and Medicaid managed care, the development and spread of accountable care organizations (ACOs), and a shift in focus among some health systems towards value-based care, population health, and community-based care. Recently, commercial entities have entered the HaH space and have raised substantial capital to fund development. Despite this growing interest in HaH and substantial evidence of its effectiveness, HaH has not been widely implemented or scaled in the United States.
Widespread dissemination and implementation of HaH has been hampered by several barriers. First, despite growing interest in HaH, the culture of healthcare and health system leadership, for the most part, remains focused on facility-based care.11
Second, while HaH makes financial sense in the managed care arena, given the strong evidence for high-quality, lower-cost care, there is currently no standard payment mechanism for HaH in fee-for-service Medicare or in the commercial insurance space. However, there are indications that this may soon change. In the fall of 2017, a proposal for a bundled payment mechanism for acute HaH care plus 30 days of postacute care was unanimously approved by an Advisory Committee to the Secretary of the Department of Health and Human Services (HHS).12,13 The HHS Secretary recently noted that “the Department of Health and Human Services is keenly interested in ideas for home-based, hospital-level care, and agrees … that this proposal holds promise for testing.”14
Third is the need to create the logistics and supply chain to support HaH. There currently exists a well-established supply chain for providing hospital care. A hospitalist orders a dose of intravenous antibiotic or oxygen, and it is supplied in a timely manner. Similarly, the postacute sector of healthcare has a robust supply chain, though it operates on a somewhat different clock from the acute care setting. However, there is currently no easily replicable supply chain to meet the needs of providing acute care in the home. Each HaH has had to create its own system of logistics with the existing healthcare assets in its local environment. Developing this capacity at scale will require significant capital investment.
There are examples where HaH has scaled. Beginning in 1994, in the state of Victoria, Australia (population 6.3 million), the health authority reimbursed HaH care at the same rates as traditional hospital care. At last report, HaH provided approximately 5% of all hospital bed days of care in Victoria. Providing HaH on this scale helped avoid the need to build a new 500-bed hospital to care for those patients.15 The avoided costs of building new hospital beds (and the ongoing need to fill those beds) represents significant societal return on investment attributable to HaH.
EMERGENCE OF THE HOME HOSPITALIST?
A key element in implementing a HaH program is its physician staff in terms of the types of doctors who provide HaH care, how they are organized, and how they interact with patients. To date, HaH physicians have been predominantly geriatricians, but internists and family medicine physicians, employed as full-time members of a dedicated HaH team, also provide care by physically visiting patients in their homes. The reason for significant involvement of geriatricians in HaH may relate to the fact that geriatric fellowship training includes training in home-based medical care, whereas this is less common in family medicine and internal medicine residency training programs.
In order to provide HaH on a nationwide scale, there will be a need for a larger workforce. There is an opportunity here to leverage existing hospital physician staff, such as hospitalists. In addition, while there is significant value in physicians seeing patients in their homes, more scalable versions of HaH are being developed and implemented that leverage biometrically enhanced telemedicine approaches for a dedicated physician component of care, with in-person visits provided by other members of an interdisciplinary team.
We believe that hospitalists can play a key role as HaH physicians as the HaH model continues to evolve and expand. Hospitalists bring valuable expertise relevant to HaH care delivery, including extensive experience with the triage of acutely ill patients, an understanding of the natural course of acute illness and team-based care, and for some, experience with telemedicine care.
While a hospitalist providing HaH care would leverage many of the competencies of the traditional hospitalist, we suggest that such a provider should receive additional training and clinical experience in home-based medical care to help them better understand the unique aspects of providing care in patients’ homes.16 Such training could include experience in making house calls, which can be a transformational experience in helping physicians improve their skills in dealing with social determinants of health, diagnosing and managing geriatric syndromes, and mobilizing community resources in the care of their patients, as well as managing care transitions. Hospitalists delivering care in HaH may also need to upgrade specific clinical skills commonly addressed by home-based medical care providers: wound care, caregiver-related issues, social and ethical issues specific to home-based care, problems with functional status, psychiatric and cognitive issues, management of gastrostomy tubes and bladder catheters, and dermatologic problems, as well as palliative care and end-of-life symptom management. These skills are slightly different from the usual realm of the typical hospitalists’ wheelhouse. However, it is all learnable.17 Similarly, geriatricians can learn from hospitalists as the HaH model evolves; there are HaH programs in existence today that take care of a sicker tranche of patients than earlier versions of HaH, with continuous telemonitoring of patients and the ability to rapidly deploy providers, labs, imaging, and medications. Going forward, as healthcare organizations begin to develop HaH programs staffed by hospitalists, it is probably wise for hospitalists and geriatricians to collaborate on the optimal physician models for HaH.
There may emerge a new specialty. Ticona and Schulman described a “home intensivist” with competencies including informatics of remote monitoring technology, leadership of multidisciplinary care teams, and the interpersonal skills required for compassionate end-of-life care.18 We prefer the term Home Hospitalist. Home Hospitalists would develop an enhanced understanding of the transitions of care and social determinants of health, and they would gain valuable knowledge about the social and environmental challenges many patients face after discharge from the hospital.
When this vision is realized, there will be enormous benefits to both HaH and Hospital Medicine. HaH could tap into a large and competent workforce to enhance its implementation and dissemination. Hospital Medicine would gain a new pathway for its providers and could develop new collaborative efforts with geriatric, internal, and family medicine.
Disclosures
Dr. Danielsson has nothing to disclose. Dr. Leff reports personal fees from Medically Home, other from Dispatch Health, other from Landmark Health, personal fees from Medibank, personal fees from Apple, personal fees from Health Affairs, other from Honor, personal fees from Institute for Healthcare Improvement, outside the submitted work; and American Academy of Home Care Medicine - member board of directors, voluntary.
Funding
Dr. Leff was supported in this work by a grant from The John A. Hartford Foundation.
Ms. P., an 86-year-old woman with a history of hypertension, hyperlipidemia, coronary artery disease, and transient ischemic attack, presents to the emergency department with a three-day history of cough, fever, purulent sputum, fatigue, and dyspnea on exertion. Her vital signs are notable for a fever of 39.0°C, blood pressure 136/92, pulse 102, respiratory rate 30, and room air oxygen saturation of 91%. She looks ill. She has a white blood cell count of 16,000, lactate 1.9, and a right lower lobe infiltrate on imaging. The emergency department attending physician presents the case to you for admission, and you accept the patient into your inpatient hospitalist service.
Now, let’s imagine a different future in which you are the attending hospitalist on your institution’s Hospital at Home (HaH) service, where you will provide hospital-level care to Ms. P. in the comfort of her own home. Hospitalists should prepare for this paradigm shift.
WHAT IS HOSPITAL AT HOME?
HaH provides hospital-level care in a patient’s home, for those with qualifying acute illnesses and appropriate degrees of acuity, as a substitute for traditional inpatient care.1 This is achieved by bringing the critical elements of hospital care to the home—physician and nursing care, intravenous medications and fluids, oxygen and respiratory therapies, basic radiography and ultrasound, durable medical equipment, skilled therapies, and more.2
All hospitalists have cared for patients like Ms. P., and she and many patients like her will have a straightforward hospital trajectory: initial evaluation in the emergency department, inpatient care provided by a hospitalist inpatient service, a few days of intravenous antibiotics and other hospital services, and finally, discharge to home.
A SHARED RATIONALE FOR HOSPITAL MEDICINE AND HOSPITAL AT HOME
However, not all patients will experience a smooth, or safe, hospital course. Studies that launched the hospital safety movement also provide the rationale for HaH, namely, that hospitals are often dangerous environments for patients.3
A complementary approach to improving outcomes for patients at high risk of iatrogenic illness such as functional decline, falls, delirium, adverse drug events, and hospital-associated disability syndrome,4-6 is to care for patients outside the traditional inpatient hospital environment. Over the past 20 years, many studies—including dozens of randomized controlled trials and several meta-analyses—have shown better outcomes for patients cared for in HaH: decreased length of stay, decreased incidence of adverse events (including substantially lower six-month mortality), better patient and caregiver care experiences, lower caregiver stress, and lower costs.7-9A recent Center for Medicare and Medicaid Innovation (CMMI) Demonstration conducted at the Mount Sinai Health System found similar results.10
GROWING INTEREST IN HOSPITAL AT HOME AND CHALLENGES TO DISSEMINATION
Interest in HaH has increased markedly over the past few years with increased penetration of Medicare and Medicaid managed care, the development and spread of accountable care organizations (ACOs), and a shift in focus among some health systems towards value-based care, population health, and community-based care. Recently, commercial entities have entered the HaH space and have raised substantial capital to fund development. Despite this growing interest in HaH and substantial evidence of its effectiveness, HaH has not been widely implemented or scaled in the United States.
Widespread dissemination and implementation of HaH has been hampered by several barriers. First, despite growing interest in HaH, the culture of healthcare and health system leadership, for the most part, remains focused on facility-based care.11
Second, while HaH makes financial sense in the managed care arena, given the strong evidence for high-quality, lower-cost care, there is currently no standard payment mechanism for HaH in fee-for-service Medicare or in the commercial insurance space. However, there are indications that this may soon change. In the fall of 2017, a proposal for a bundled payment mechanism for acute HaH care plus 30 days of postacute care was unanimously approved by an Advisory Committee to the Secretary of the Department of Health and Human Services (HHS).12,13 The HHS Secretary recently noted that “the Department of Health and Human Services is keenly interested in ideas for home-based, hospital-level care, and agrees … that this proposal holds promise for testing.”14
Third is the need to create the logistics and supply chain to support HaH. There currently exists a well-established supply chain for providing hospital care. A hospitalist orders a dose of intravenous antibiotic or oxygen, and it is supplied in a timely manner. Similarly, the postacute sector of healthcare has a robust supply chain, though it operates on a somewhat different clock from the acute care setting. However, there is currently no easily replicable supply chain to meet the needs of providing acute care in the home. Each HaH has had to create its own system of logistics with the existing healthcare assets in its local environment. Developing this capacity at scale will require significant capital investment.
There are examples where HaH has scaled. Beginning in 1994, in the state of Victoria, Australia (population 6.3 million), the health authority reimbursed HaH care at the same rates as traditional hospital care. At last report, HaH provided approximately 5% of all hospital bed days of care in Victoria. Providing HaH on this scale helped avoid the need to build a new 500-bed hospital to care for those patients.15 The avoided costs of building new hospital beds (and the ongoing need to fill those beds) represents significant societal return on investment attributable to HaH.
EMERGENCE OF THE HOME HOSPITALIST?
A key element in implementing a HaH program is its physician staff in terms of the types of doctors who provide HaH care, how they are organized, and how they interact with patients. To date, HaH physicians have been predominantly geriatricians, but internists and family medicine physicians, employed as full-time members of a dedicated HaH team, also provide care by physically visiting patients in their homes. The reason for significant involvement of geriatricians in HaH may relate to the fact that geriatric fellowship training includes training in home-based medical care, whereas this is less common in family medicine and internal medicine residency training programs.
In order to provide HaH on a nationwide scale, there will be a need for a larger workforce. There is an opportunity here to leverage existing hospital physician staff, such as hospitalists. In addition, while there is significant value in physicians seeing patients in their homes, more scalable versions of HaH are being developed and implemented that leverage biometrically enhanced telemedicine approaches for a dedicated physician component of care, with in-person visits provided by other members of an interdisciplinary team.
We believe that hospitalists can play a key role as HaH physicians as the HaH model continues to evolve and expand. Hospitalists bring valuable expertise relevant to HaH care delivery, including extensive experience with the triage of acutely ill patients, an understanding of the natural course of acute illness and team-based care, and for some, experience with telemedicine care.
While a hospitalist providing HaH care would leverage many of the competencies of the traditional hospitalist, we suggest that such a provider should receive additional training and clinical experience in home-based medical care to help them better understand the unique aspects of providing care in patients’ homes.16 Such training could include experience in making house calls, which can be a transformational experience in helping physicians improve their skills in dealing with social determinants of health, diagnosing and managing geriatric syndromes, and mobilizing community resources in the care of their patients, as well as managing care transitions. Hospitalists delivering care in HaH may also need to upgrade specific clinical skills commonly addressed by home-based medical care providers: wound care, caregiver-related issues, social and ethical issues specific to home-based care, problems with functional status, psychiatric and cognitive issues, management of gastrostomy tubes and bladder catheters, and dermatologic problems, as well as palliative care and end-of-life symptom management. These skills are slightly different from the usual realm of the typical hospitalists’ wheelhouse. However, it is all learnable.17 Similarly, geriatricians can learn from hospitalists as the HaH model evolves; there are HaH programs in existence today that take care of a sicker tranche of patients than earlier versions of HaH, with continuous telemonitoring of patients and the ability to rapidly deploy providers, labs, imaging, and medications. Going forward, as healthcare organizations begin to develop HaH programs staffed by hospitalists, it is probably wise for hospitalists and geriatricians to collaborate on the optimal physician models for HaH.
There may emerge a new specialty. Ticona and Schulman described a “home intensivist” with competencies including informatics of remote monitoring technology, leadership of multidisciplinary care teams, and the interpersonal skills required for compassionate end-of-life care.18 We prefer the term Home Hospitalist. Home Hospitalists would develop an enhanced understanding of the transitions of care and social determinants of health, and they would gain valuable knowledge about the social and environmental challenges many patients face after discharge from the hospital.
When this vision is realized, there will be enormous benefits to both HaH and Hospital Medicine. HaH could tap into a large and competent workforce to enhance its implementation and dissemination. Hospital Medicine would gain a new pathway for its providers and could develop new collaborative efforts with geriatric, internal, and family medicine.
Disclosures
Dr. Danielsson has nothing to disclose. Dr. Leff reports personal fees from Medically Home, other from Dispatch Health, other from Landmark Health, personal fees from Medibank, personal fees from Apple, personal fees from Health Affairs, other from Honor, personal fees from Institute for Healthcare Improvement, outside the submitted work; and American Academy of Home Care Medicine - member board of directors, voluntary.
Funding
Dr. Leff was supported in this work by a grant from The John A. Hartford Foundation.
1. Leff B, Montalto M. Home hospital-toward a tighter definition. J Am Geriatr Soc. 2004;52(12):2141. doi: 10.1111/j.1532-5415.2004.52579_1.x. PubMed
2. Leff B, Burton L, Mader SL, et al. Hospital at home: feasibility and outcomes of a program to provide hospital-level care at home for acutely ill older patients. Ann Intern Med. 2005;143(11):798-808. doi: 10.7326/0003-4819-143-11-200512060-00008. PubMed
3. Brennan TA, Leape LL, Laird NM, et al. Incidence of adverse events and negligence in hospitalized patients. Results of the Harvard Medical Practice Study I. N Engl J Med. 1991;324(6):370-376. doi: 10.1056/NEJM199102073240604. PubMed
4. Creditor MC. Hazards of hospitalization of the elderly. Ann Intern Med. 1993;118(3):219-223. doi: 10.7326/0003-4819-118-3-199302010-00011. PubMed
5. Covinsky KE, Pierluissi E, Johnston CB. Hospitalization-associated disability: “She was probably able to ambulate, but I’m not sure”. JAMA. 2011;306(16):1782-1793. doi: 10.1001/jama.2011.1556. PubMed
6. Wald HL. The Geometry of Patient Safety: Horizontal and Vertical Approaches to the Hazards of Hospitalization. J Am Geriatr Soc. 2017;65(12):2559-2561. doi: 10.1111/jgs.15049. PubMed
7. Shepperd S, Doll H, Angus RM, et al. Avoiding hospital admission through provision of hospital care at home: a systematic review and meta-analysis of individual patient data. CMAJ. 2009;180(2):175-182. doi: 10.1503/cmaj.081491. PubMed
8. Caplan GA, Sulaiman NS, Mangin N, et al. A meta-analysis of “Hospital in the Home”. Med J Aust. 2012;197:512-519. doi: 10.5694/mja12.10480. PubMed
9. Shepperd S, Iliffe S, Doll HA, et al. Admission avoidance hospital at home. Cochrane Database Syst Rev. 2016;9:CD007491. doi: 10.1002/14651858.CD007491.pub2. PubMed
10. Federman AD, Soones T, DeCherrie LV, Leff B, Siu AL. Association of a bundled hospital-at-home and 30-day postacute transitional care program with clinical outcomes and patient experiences. JAMA Intern Med. 2018;178(8):1033-1040. doi: 10.1001/jamainternmed.2018.2562. PubMed
11. Stein PD, Hull RD, Matta F, Willyerd GL. Modest response in translation to home management of deep venous thrombosis. Am J Med. 2010;123(12):1107-1113. doi: 10.1016/j.amjmed.2010.07.016. PubMed
12. Icahn School of Medicine at Mount Sinai. “HaH-Plus” (Hospital at Home Plus) Provider Focused Payment Model. https://aspe.hhs.gov/system/files/pdf/255906/HaHPlusProviderFocusedPaymentModel.pdf. Accessed November 11, 2018.
13. Physician-F ocused Payment Model Technical Advisory Committee. Report to the Secretary of Health and Human Services. Comments and Recommendation on “HaH-Plus (Hospital at Home Plus) Provider-Focused Payment Model. https://aspe.hhs.gov/system/files/pdf/255906/MtSinaiHAHReportSecretary.pdf. Accessed November 11, 2018.
14. The Secretary of Health and Human Services. Response to the Report to the Secretary of Health and Human Services. Comments and Recommendation on “HaH-Plus (Hospital at Home Plus) Provider-Focused Payment Model. https://downloads.cms.gov/files/cmmi/ptac-hhssecresponse-oct17-may18.pdf. Accessed November 11, 2018.
15. Montalto M. The 500-bed hospital that isn’t there: the Victorian Department of Health review of the Hospital in the Home program. Med J Aust. 2010;193(10);598-601. PubMed
16. Hayashi J, Leff B. Geriatric Home-Based Medical Care. New York, NY: Springer Publishers; 2015. PubMed
17. Reckrey JM, Ornstein KA, Wajnberg A, Kopke MV, DeCherrie LV. Teaching home-based primary care. Home Healthc Now. 2017;35(10):561-565. doi: 10.1097/NHH.0000000000000621. PubMed
18. Ticona L, Schulman KA. Extreme home makeover - the role of intensive home health care. N Engl J Med. 2016;375(18):1707-1709. doi: 10.1056/NEJMp1608301. PubMed
1. Leff B, Montalto M. Home hospital-toward a tighter definition. J Am Geriatr Soc. 2004;52(12):2141. doi: 10.1111/j.1532-5415.2004.52579_1.x. PubMed
2. Leff B, Burton L, Mader SL, et al. Hospital at home: feasibility and outcomes of a program to provide hospital-level care at home for acutely ill older patients. Ann Intern Med. 2005;143(11):798-808. doi: 10.7326/0003-4819-143-11-200512060-00008. PubMed
3. Brennan TA, Leape LL, Laird NM, et al. Incidence of adverse events and negligence in hospitalized patients. Results of the Harvard Medical Practice Study I. N Engl J Med. 1991;324(6):370-376. doi: 10.1056/NEJM199102073240604. PubMed
4. Creditor MC. Hazards of hospitalization of the elderly. Ann Intern Med. 1993;118(3):219-223. doi: 10.7326/0003-4819-118-3-199302010-00011. PubMed
5. Covinsky KE, Pierluissi E, Johnston CB. Hospitalization-associated disability: “She was probably able to ambulate, but I’m not sure”. JAMA. 2011;306(16):1782-1793. doi: 10.1001/jama.2011.1556. PubMed
6. Wald HL. The Geometry of Patient Safety: Horizontal and Vertical Approaches to the Hazards of Hospitalization. J Am Geriatr Soc. 2017;65(12):2559-2561. doi: 10.1111/jgs.15049. PubMed
7. Shepperd S, Doll H, Angus RM, et al. Avoiding hospital admission through provision of hospital care at home: a systematic review and meta-analysis of individual patient data. CMAJ. 2009;180(2):175-182. doi: 10.1503/cmaj.081491. PubMed
8. Caplan GA, Sulaiman NS, Mangin N, et al. A meta-analysis of “Hospital in the Home”. Med J Aust. 2012;197:512-519. doi: 10.5694/mja12.10480. PubMed
9. Shepperd S, Iliffe S, Doll HA, et al. Admission avoidance hospital at home. Cochrane Database Syst Rev. 2016;9:CD007491. doi: 10.1002/14651858.CD007491.pub2. PubMed
10. Federman AD, Soones T, DeCherrie LV, Leff B, Siu AL. Association of a bundled hospital-at-home and 30-day postacute transitional care program with clinical outcomes and patient experiences. JAMA Intern Med. 2018;178(8):1033-1040. doi: 10.1001/jamainternmed.2018.2562. PubMed
11. Stein PD, Hull RD, Matta F, Willyerd GL. Modest response in translation to home management of deep venous thrombosis. Am J Med. 2010;123(12):1107-1113. doi: 10.1016/j.amjmed.2010.07.016. PubMed
12. Icahn School of Medicine at Mount Sinai. “HaH-Plus” (Hospital at Home Plus) Provider Focused Payment Model. https://aspe.hhs.gov/system/files/pdf/255906/HaHPlusProviderFocusedPaymentModel.pdf. Accessed November 11, 2018.
13. Physician-F ocused Payment Model Technical Advisory Committee. Report to the Secretary of Health and Human Services. Comments and Recommendation on “HaH-Plus (Hospital at Home Plus) Provider-Focused Payment Model. https://aspe.hhs.gov/system/files/pdf/255906/MtSinaiHAHReportSecretary.pdf. Accessed November 11, 2018.
14. The Secretary of Health and Human Services. Response to the Report to the Secretary of Health and Human Services. Comments and Recommendation on “HaH-Plus (Hospital at Home Plus) Provider-Focused Payment Model. https://downloads.cms.gov/files/cmmi/ptac-hhssecresponse-oct17-may18.pdf. Accessed November 11, 2018.
15. Montalto M. The 500-bed hospital that isn’t there: the Victorian Department of Health review of the Hospital in the Home program. Med J Aust. 2010;193(10);598-601. PubMed
16. Hayashi J, Leff B. Geriatric Home-Based Medical Care. New York, NY: Springer Publishers; 2015. PubMed
17. Reckrey JM, Ornstein KA, Wajnberg A, Kopke MV, DeCherrie LV. Teaching home-based primary care. Home Healthc Now. 2017;35(10):561-565. doi: 10.1097/NHH.0000000000000621. PubMed
18. Ticona L, Schulman KA. Extreme home makeover - the role of intensive home health care. N Engl J Med. 2016;375(18):1707-1709. doi: 10.1056/NEJMp1608301. PubMed
© 2019 Society of Hospital Medicine
An Advanced Practice Provider Clinical Fellowship as a Pipeline to Staffing a Hospitalist Program
There is an increasing utilization of advanced practice providers (APPs) in the delivery of healthcare in the United States.1,2 As of 2016, there were 157, 025 nurse practitioners (NPs) and 102,084 physician assistants (PAs) with a projected growth rate of 6.8% and 4.3%, respectively, which exceeds the physician growth rate of 1.1%.2 This increased growth rate has been attributed to the expectation that APPs can enhance the quality of physician care, relieve physician shortages, and reduce service costs, as APPs are less expensive to hire than physicians.3,4 Hospital medicine is the fastest growing medical field in the United States, and approximately 83% of hospitalist groups around the country utilize APPs; however, the demand for hospitalists continues to exceed the supply, and this has led to increased utilization of APPs in hospital medicine.5-10
APPs receive very limited inpatient training and there is wide variation in their clinical abilities after graduation.11 This is an issue that has become exacerbated in recent years by a change in the training process for PAs. Before 2005, PA programs were typically two to three years long and required the same prerequisite courses as medical schools.11 PA students completed more than 2,000 hours of clinical rotations and then had to pass the Physician Assistant National Certifying Exam before they could practice.12 Traditionally, PA programs typically attracted students with prior healthcare experience.11 In 2005, PA programs began transitioning from bachelor’s degrees to requiring a master’s level degree for completion of the programs. This has shifted the demographics of the students matriculating to younger students with little-to-no prior healthcare experience; moreover, these fresh graduates lack exposure to hospital medicine.11
NPs usually gain clinical experience working as registered nurses (RNs) for two or more years prior to entry into the NP program. NP programs for baccalaureate-prepared RNs vary in length from two to three years.2 There is an acute care focus for NPs in training; however, there is no standardized training or licensure to ensure that hospital medicine competencies are met.13-15 Some studies have shown that a lack of structured support has been found to affect NP role transition negatively during the first year of practice,16 and graduating NPs have indicated that they needed more out of their clinical education in terms of content, clinical experience, and competency testing.17
Hiring new APP graduates as hospitalists requires a longer and more rigorous onboarding process. On‐the‐job training in hospital medicine for new APP graduates can take as long as six to 12 months in order for them to acquire the basic skill set necessary to adequately manage hospitalized patients.15 This extended onboarding is costly because the APPs are receiving a full hospitalist salary, yet they are not functioning at full capacity. Ideally, there should be an intermediary training step between graduation and employment as hospitalist APPs. Studies have shown that APPs are interested in formal postgraduate hospital medicine training, even if it means having a lower stipend during the first year after graduating from their NP or PA program.9,15,18
The growing need for hospitalists, driven by residency work-hour reform, increased age and complexity of patients, and the need to improve the quality of inpatient care while simultaneously reducing waste, has contributed to the increasing utilization of and need for highly qualified APPs in hospital medicine.11,19,20 We established a fellowship to train APPs. The goal of this study was to determine if an APP fellowship is a cost-effective pipeline for filling vacancies within a hospitalist program.
METHODS
Design and Setting
Johns Hopkins Bayview Medical Center (JHBMC) is a 440 bed hospital in Baltimore Maryland. The hospitalist group was started in 1996 with one physician seeing approximately 500 discharges a year. Over the last 20 years, the group has grown and is now its own division with 57 providers, including 42 physicians, 11 APPs, and four APP fellows. The hospitalist division manages ~7,000 discharges a year, which corresponds to approximately 60% of admissions to general medicine. Hospitalist APPs help staff general medicine by working alongside doctors and admitting patients during the day and night. The APPs also staff the pulmonary step down unit with a pulmonary attending and the chemical dependency unit with an internal medicine addiction specialist.
The growth of the division of hospital medicine at JHBMC is a result of increasing volumes and reduced residency duty hours. The increasing full time equivalents (FTEs) resulted in a need for APPs; however, vacancies went unfilled for an average of 35 weeks due to the time it took to post open positions, interview applicants, and hire applicants through the credentialing process. Further, it took as long as 22 to 34 weeks for a new hire to work independently. The APP vacancies and onboarding resulted in increased costs to the division incurred by physician moonlighting to cover open shifts. The hourly physician moonlighting rate at JHBMC is $150. All costs were calculated on the basis of a 40-hour work week. We performed a pre- and postanalysis of outcomes of interest between January 2009 and June 2018. This study was exempt from institutional review board review.
Intervention
In 2014, a one year APP clinical fellowship in hospital medicine was started. The fellows evaluate and manage patients working one-on-one with an experienced hospitalist faculty member. The program consists of 80% clinical experience in the inpatient setting and 20% didactic instruction (Table 1). Up to four fellows are accepted each year and are eligible for hire after training if vacancies exist. The program is cost neutral and was financed by downsizing, through attrition, two physician FTEs. Four APP fellows’ salaries are the equivalent of two entry-level hospitalist physicians’ salaries at JHBMC. The annual salary for an APP fellow is $69,000.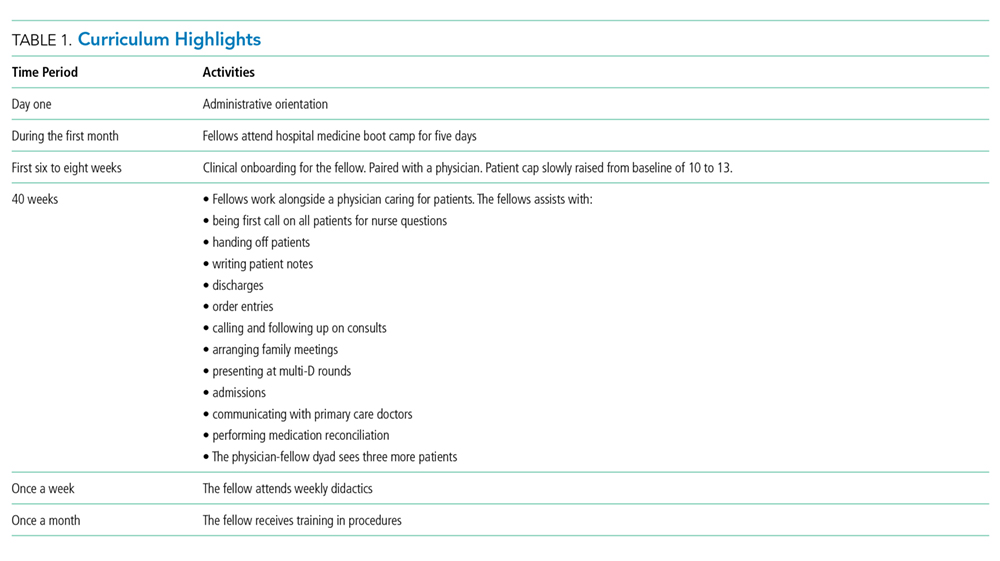
Downsizing by two physician FTEs meant that one less doctor was scheduled every day. The patient load previously seen by that one doctor (10 patients) was absorbed by the MD–APP fellow dyads. Paired with a fellow, each physician sees a higher cap of 13 patients, and it takes six weeks for the fellows to ramp-up to this patient load. When the fellow first starts, the team sees 10 patients. Every two weeks, the pair’s census increases by one patient to the cap of 13. Collectively, the four APP fellow–MD dyads make it possible for four physicians to see an additional 12 patients. The two extra patients absorbed by the service per day results in a net increase in capacity of up to 730 patient encounters a year.
Outcomes and Analysis
Our main outcomes of interest were duration of onboarding and cost incurred by the division to (1) staff the service during a vacancy and (2) onboard new hires. Secondary outcomes included duration of vacancy and total time spent with the group. We collected basic demographic data on participants, including, age, gender, and race. Demographics and outcomes of interest were compared pre- (2009-2013) and post- (2014-2018) initiation of the APP clinical fellowship using the chi-square test, the t-test for normally distributed data, and the Wilcoxon rank-sum for nonnormally distributed data, as appropriate. The normality of the data distribution was tested using the Shapiro-Wilk W test. Two-tailed P values less than .05 were considered to be statistically significant. Results were analyzed using Stata/MP version 13.0 (StataCorp Inc, College Station, Texas).
RESULTS
Twelve fellows have been recruited, and of these, 10 have graduated. Two chose to leave the program prior to completion. Of the 10 fellows that have graduated, six have been hired into our group, one was hired within our facility, and three were hired as hospitalists at other institutions. The median time from APP school graduation to hire was also not different between the two groups (10.5 vs 3.9 months, P = .069). In addition, the total time that the new APP hires spent with the group was nonstatistically significantly different between the two periods (17.9 vs 18.3 months, P = .735). Both the mean duration of onboarding and the cost to the division were significantly reduced after implementation of the program (25.4 vs 11.0 weeks, P = .017 and $361,714 vs $66,000, P = .004; Table 2).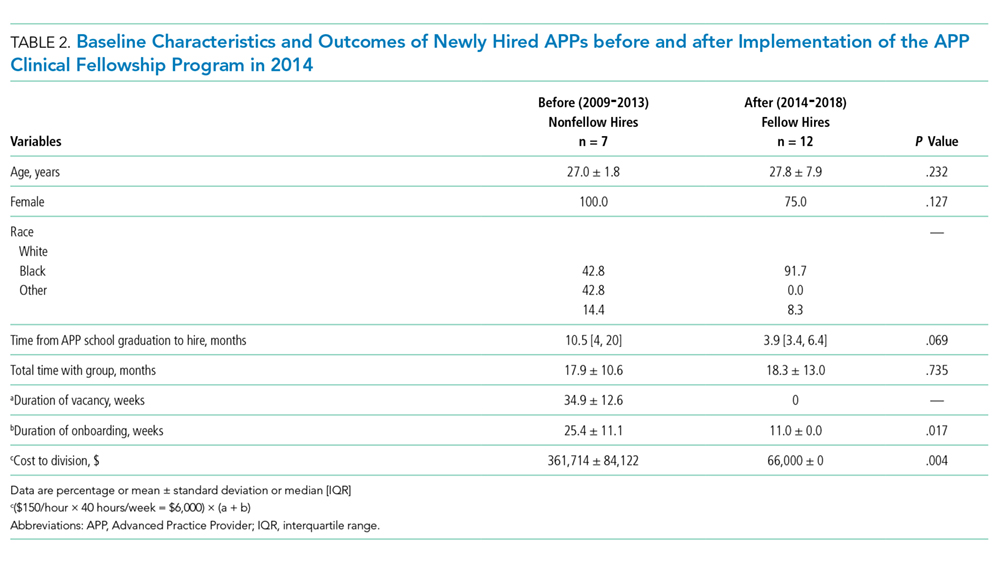
The yearly cost of an APP vacancy and onboarding is incurred by doctor moonlighting costs (at the rate of $150 per hour) to cover open shifts. The mean duration of vacancies and onboarding each year was 34.9 and 25.4 weeks, respectively, before the fellowship. The yearly cost of onboarding, after the establishment of the fellowship, is a maximum of $66,000, derived from physician moonlighting to cover the six-week ramp-up at the very beginning of the fellowship and the five weeks of orientation to the pulmonary and chemical dependency units after the fellowship (Table 3).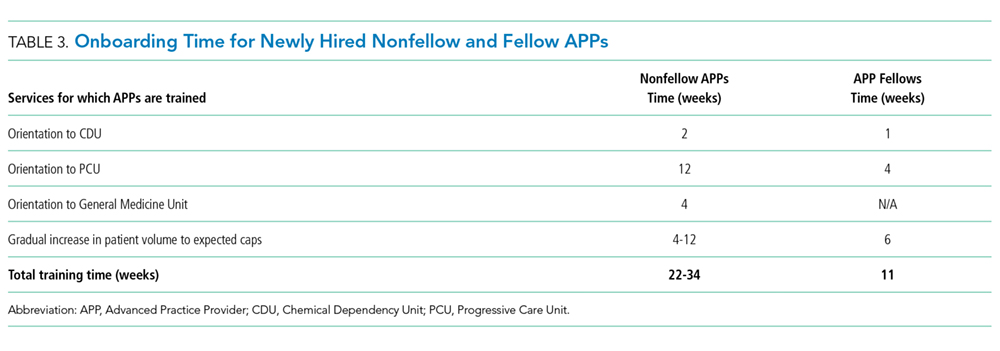
DISCUSSION
Our APP clinical fellowship in hospital medicine at JHBMC has produced several benefits. First, the fellowship has become a pipeline for filling APP vacancies within our division. We have been able to hire for four consecutive years from the fellowship. Second, the ready availability of high-functioning and efficient APP hospitalists has cut down on the onboarding time for our new APP hires. Many new APP graduates lack confidence in caring for complex hospitalized patients. Following our 12-month clinical fellowship, our matriculated fellows are able to practice at the top of their license immediately and confidently. Third, the reduced vacancy and shortened onboarding periods have reduced costs to the division. Fourth, the fellowship has created additional teaching avenues for the faculty. The medicine units at JHBMC are comprised of hospitalist and internal medicine residency services. The hospitalists spend the majority of their clinical time in direct patient care; however, they rotate on the residency service for two weeks out of the year. The majority of physicians welcome the chance to teach more, and partnering with an APP fellow provides that opportunity.
As we have developed and grown this program, the one great challenge has been what to do with graduating fellows when we cannot hire them. Fortunately, the market for highly qualified, well trained APPs is strong, and every one of the fellows that we could not hire within our group has been able to find a position either within our facility or outside our institution. To facilitate this process, program directors and recruiters are invited to meet with the fellows toward the end of their fellowship to share employment opportunities with them.
Our study has limitations. First, had the $276,000 from the attrition of two physicians been used to hire nonfellow APPs under the old model, then the costs of the two models would have been similar, but this was simply not possible because the positions could not be filled. Second, this is a single-site experience, and our findings may not be generalizable, particularly those pertaining to remuneration. Third, our study was underpowered to detect small but important differences in characteristics of APPs, especially time from graduation to hire, before and after the implementation of our fellowship. Further research comparing various programs both in structure and outcomes—such as fellows’ readiness for practice, costs, duration of vacancies, and provider satisfaction—are an important next step.
We have developed a pool of applicants within our division to fill vacancies left by turnover from senior NPs and PAs. This program has reduced costs and improved the joy of practice for both doctors and APPs. As the need for highly qualified NPs and PAs in hospital medicine continues to grow, we may see more APP fellowships in hospital medicine in the United States.
Acknowledgments
The authors thank the advanced practice providers who have helped us grow and refine our fellowship.
Disclosures
The authors have nothing to disclose
1. Martsoff G, Nguyen P, Freund D, Poghosyan L. What we know about postgraduate nurse practitioner residency and fellowship programs. J Nurse Pract. 2017;13(7):482-487. doi: 10.1016/j.nurpra.2017.05.013.
2. Auerbach D, Staiger D, Buerhaus P. Growing ranks of advanced practice clinicians-implications for the physician workforce. N Engl J Med. 2018;378(25):2358-2360. doi: 10.1056/NEJMp1801869. PubMed
3. Laurant M, Harmsen M, Wollersheim H, Grol R, Faber M, Sibbald B. The
impact of nonphysician clinicians: do they improve the quality and cost-effectiveness
of health care services? Med Care Res Rev. 2009;66(6 Suppl):36S-89S. doi: 10.1177/1077558709346277. PubMed
4. Auerbach DI. Will the NP workforce grow in the future? New forecasts and
implications for healthcare delivery. Med Care. 2012;50(7):606-610. doi:
10.1097/MLR.0b013e318249d6e7. PubMed
5. Kisuule F, Howell E. Hospital medicine beyond the United States. Int J Gen
Med. 2018;11:65-71. doi: 10.2147/IJGM.S151275. PubMed
6. Wachter RM, Goldman L. Zero to 50, 000-The 20th anniversary of the hospitalist.
N Engl J Med. 2016;375(11):1009-1011. doi: 10.1056/NEJMp1607958. PubMed
7. Conrad, K and Valovska T. The current state of hospital medicine: trends in
compensation, practice patterns, advanced practice providers, malpractice,
and career satisfaction. In: Conrad K, ed. Clinical Approaches to Hospital
Medicine. Cham, Springer; 2017:259-270.
8. Bryant SE. Filling the gaps: preparing nurse practitioners for hospitalist
practice. J Am Assoc Nurse Pract. 2018;30(1):4-9. doi: 10.1097/
JXX.0000000000000008. PubMed
9. Sharma P, Brooks M, Roomiany P, Verma L, Criscione-Schreiber, L. Physician
assistant student training for the inpatient setting: a needs assessment. J Physician
Assist Educ. 2017;28(4):189-195. doi: 10.1097/JPA.0000000000000174. PubMed
10. Society of Hospital Medicine. 2016 State of Hospital Medicine Report. Available
at: https://www.hospitalmedicine.org/about/press-releases/shm-releases-
2016-state-of-hospital-medicine-report/. Accessed July 17, 2018.
11. Will KK, Budavari AI, Wilkens JA, Mishari K, Hartsell ZC. A Hospitalist postgraduate
training program for physician assistants. J Hosp Med. 2010;5(2):94-
8. doi: 10.1002/jhm.619. PubMed
12. Naqvi, S. Is it time for Physician Assistant (PA)/Nurse Practitioner (NP) Hospital
Medicine Residency Training. Available at: http://medicine2.missouri.e.,-
du/jahm/wp-content/uploads/2017/03/Is-it-time-for-PANP-Hospital-Medicine-
Residency-Training-Final.pdf. Accessed July 17, 2018.
13. Scheurer D, Cardin T. The Role of NPs and PAs in Hospital Medicine Programs.
From July, 2017 The Hospitalist. Available at: https://www.the-hospitalist.
org/hospitalist/article/142565/leadership-training/role-nps-and-pashospital-
medicine-programs. Accessed July 17, 2018.
14. Furfari K , Rosenthal L, Tad-y D, Wolfe B, Glasheen J. Nurse practitioners as
inpatinet providers: a hospital medicine fellowship program. J Nurse Pract.
2014;10(6):425-429. doi: 10.1016/j.nurpra.2014.03.022.
15. Taylor D, Broyhill B, Burris A, Wilcox M. A strategic approach for developing
an advanced practice workforce: from postgraduate transition-to-practice
fellowship programs and beyond. Nurs Adm Q. 2017;41(1):11-19. doi:
10.1097/NAQ.0000000000000198. PubMed
16. Barnes H. Exploring the factors that influence nurse practitioners role transition.
J Nurse Pract. 2015;11(2):178-183. doi: 10.1016/j.nurpra.2014.11.004. PubMed
17. Hart MA, Macnee LC. How well are nurse practitioners prepared for practice:
results of a 2004 questionnaire study. J Am Acad Nurse Pract. 2007;19(1):35-
42. doi: 10.1111/j.1745-7599.2006.00191.x PubMed
18. Torok H, Lackner C, Landis R, Wright S. Learning needs of physician assistants
working in hospital medicine. J Hosp Med. 2012;7(3):190-194. doi:
10.1002/jhm.1001. PubMed
19. Kisuule F, Howell E. Hospitalists and their impact on quality, patient safety,
and satisfaction. Obstet Gynecol Clin N Am. 2015;42(3):433-446. doi:
10.1016/j.ogc.2015.05.003. PubMed
20. Ford, W, Britting L. Nonphysician Providers in the hospitalist model: a prescription
for change and a warning about unintended side effects. J Hosp
Med. 2010;5(2):99-102. doi: 10.1002/jhm.556. PubMed
There is an increasing utilization of advanced practice providers (APPs) in the delivery of healthcare in the United States.1,2 As of 2016, there were 157, 025 nurse practitioners (NPs) and 102,084 physician assistants (PAs) with a projected growth rate of 6.8% and 4.3%, respectively, which exceeds the physician growth rate of 1.1%.2 This increased growth rate has been attributed to the expectation that APPs can enhance the quality of physician care, relieve physician shortages, and reduce service costs, as APPs are less expensive to hire than physicians.3,4 Hospital medicine is the fastest growing medical field in the United States, and approximately 83% of hospitalist groups around the country utilize APPs; however, the demand for hospitalists continues to exceed the supply, and this has led to increased utilization of APPs in hospital medicine.5-10
APPs receive very limited inpatient training and there is wide variation in their clinical abilities after graduation.11 This is an issue that has become exacerbated in recent years by a change in the training process for PAs. Before 2005, PA programs were typically two to three years long and required the same prerequisite courses as medical schools.11 PA students completed more than 2,000 hours of clinical rotations and then had to pass the Physician Assistant National Certifying Exam before they could practice.12 Traditionally, PA programs typically attracted students with prior healthcare experience.11 In 2005, PA programs began transitioning from bachelor’s degrees to requiring a master’s level degree for completion of the programs. This has shifted the demographics of the students matriculating to younger students with little-to-no prior healthcare experience; moreover, these fresh graduates lack exposure to hospital medicine.11
NPs usually gain clinical experience working as registered nurses (RNs) for two or more years prior to entry into the NP program. NP programs for baccalaureate-prepared RNs vary in length from two to three years.2 There is an acute care focus for NPs in training; however, there is no standardized training or licensure to ensure that hospital medicine competencies are met.13-15 Some studies have shown that a lack of structured support has been found to affect NP role transition negatively during the first year of practice,16 and graduating NPs have indicated that they needed more out of their clinical education in terms of content, clinical experience, and competency testing.17
Hiring new APP graduates as hospitalists requires a longer and more rigorous onboarding process. On‐the‐job training in hospital medicine for new APP graduates can take as long as six to 12 months in order for them to acquire the basic skill set necessary to adequately manage hospitalized patients.15 This extended onboarding is costly because the APPs are receiving a full hospitalist salary, yet they are not functioning at full capacity. Ideally, there should be an intermediary training step between graduation and employment as hospitalist APPs. Studies have shown that APPs are interested in formal postgraduate hospital medicine training, even if it means having a lower stipend during the first year after graduating from their NP or PA program.9,15,18
The growing need for hospitalists, driven by residency work-hour reform, increased age and complexity of patients, and the need to improve the quality of inpatient care while simultaneously reducing waste, has contributed to the increasing utilization of and need for highly qualified APPs in hospital medicine.11,19,20 We established a fellowship to train APPs. The goal of this study was to determine if an APP fellowship is a cost-effective pipeline for filling vacancies within a hospitalist program.
METHODS
Design and Setting
Johns Hopkins Bayview Medical Center (JHBMC) is a 440 bed hospital in Baltimore Maryland. The hospitalist group was started in 1996 with one physician seeing approximately 500 discharges a year. Over the last 20 years, the group has grown and is now its own division with 57 providers, including 42 physicians, 11 APPs, and four APP fellows. The hospitalist division manages ~7,000 discharges a year, which corresponds to approximately 60% of admissions to general medicine. Hospitalist APPs help staff general medicine by working alongside doctors and admitting patients during the day and night. The APPs also staff the pulmonary step down unit with a pulmonary attending and the chemical dependency unit with an internal medicine addiction specialist.
The growth of the division of hospital medicine at JHBMC is a result of increasing volumes and reduced residency duty hours. The increasing full time equivalents (FTEs) resulted in a need for APPs; however, vacancies went unfilled for an average of 35 weeks due to the time it took to post open positions, interview applicants, and hire applicants through the credentialing process. Further, it took as long as 22 to 34 weeks for a new hire to work independently. The APP vacancies and onboarding resulted in increased costs to the division incurred by physician moonlighting to cover open shifts. The hourly physician moonlighting rate at JHBMC is $150. All costs were calculated on the basis of a 40-hour work week. We performed a pre- and postanalysis of outcomes of interest between January 2009 and June 2018. This study was exempt from institutional review board review.
Intervention
In 2014, a one year APP clinical fellowship in hospital medicine was started. The fellows evaluate and manage patients working one-on-one with an experienced hospitalist faculty member. The program consists of 80% clinical experience in the inpatient setting and 20% didactic instruction (Table 1). Up to four fellows are accepted each year and are eligible for hire after training if vacancies exist. The program is cost neutral and was financed by downsizing, through attrition, two physician FTEs. Four APP fellows’ salaries are the equivalent of two entry-level hospitalist physicians’ salaries at JHBMC. The annual salary for an APP fellow is $69,000.
Downsizing by two physician FTEs meant that one less doctor was scheduled every day. The patient load previously seen by that one doctor (10 patients) was absorbed by the MD–APP fellow dyads. Paired with a fellow, each physician sees a higher cap of 13 patients, and it takes six weeks for the fellows to ramp-up to this patient load. When the fellow first starts, the team sees 10 patients. Every two weeks, the pair’s census increases by one patient to the cap of 13. Collectively, the four APP fellow–MD dyads make it possible for four physicians to see an additional 12 patients. The two extra patients absorbed by the service per day results in a net increase in capacity of up to 730 patient encounters a year.
Outcomes and Analysis
Our main outcomes of interest were duration of onboarding and cost incurred by the division to (1) staff the service during a vacancy and (2) onboard new hires. Secondary outcomes included duration of vacancy and total time spent with the group. We collected basic demographic data on participants, including, age, gender, and race. Demographics and outcomes of interest were compared pre- (2009-2013) and post- (2014-2018) initiation of the APP clinical fellowship using the chi-square test, the t-test for normally distributed data, and the Wilcoxon rank-sum for nonnormally distributed data, as appropriate. The normality of the data distribution was tested using the Shapiro-Wilk W test. Two-tailed P values less than .05 were considered to be statistically significant. Results were analyzed using Stata/MP version 13.0 (StataCorp Inc, College Station, Texas).
RESULTS
Twelve fellows have been recruited, and of these, 10 have graduated. Two chose to leave the program prior to completion. Of the 10 fellows that have graduated, six have been hired into our group, one was hired within our facility, and three were hired as hospitalists at other institutions. The median time from APP school graduation to hire was also not different between the two groups (10.5 vs 3.9 months, P = .069). In addition, the total time that the new APP hires spent with the group was nonstatistically significantly different between the two periods (17.9 vs 18.3 months, P = .735). Both the mean duration of onboarding and the cost to the division were significantly reduced after implementation of the program (25.4 vs 11.0 weeks, P = .017 and $361,714 vs $66,000, P = .004; Table 2).
The yearly cost of an APP vacancy and onboarding is incurred by doctor moonlighting costs (at the rate of $150 per hour) to cover open shifts. The mean duration of vacancies and onboarding each year was 34.9 and 25.4 weeks, respectively, before the fellowship. The yearly cost of onboarding, after the establishment of the fellowship, is a maximum of $66,000, derived from physician moonlighting to cover the six-week ramp-up at the very beginning of the fellowship and the five weeks of orientation to the pulmonary and chemical dependency units after the fellowship (Table 3).
DISCUSSION
Our APP clinical fellowship in hospital medicine at JHBMC has produced several benefits. First, the fellowship has become a pipeline for filling APP vacancies within our division. We have been able to hire for four consecutive years from the fellowship. Second, the ready availability of high-functioning and efficient APP hospitalists has cut down on the onboarding time for our new APP hires. Many new APP graduates lack confidence in caring for complex hospitalized patients. Following our 12-month clinical fellowship, our matriculated fellows are able to practice at the top of their license immediately and confidently. Third, the reduced vacancy and shortened onboarding periods have reduced costs to the division. Fourth, the fellowship has created additional teaching avenues for the faculty. The medicine units at JHBMC are comprised of hospitalist and internal medicine residency services. The hospitalists spend the majority of their clinical time in direct patient care; however, they rotate on the residency service for two weeks out of the year. The majority of physicians welcome the chance to teach more, and partnering with an APP fellow provides that opportunity.
As we have developed and grown this program, the one great challenge has been what to do with graduating fellows when we cannot hire them. Fortunately, the market for highly qualified, well trained APPs is strong, and every one of the fellows that we could not hire within our group has been able to find a position either within our facility or outside our institution. To facilitate this process, program directors and recruiters are invited to meet with the fellows toward the end of their fellowship to share employment opportunities with them.
Our study has limitations. First, had the $276,000 from the attrition of two physicians been used to hire nonfellow APPs under the old model, then the costs of the two models would have been similar, but this was simply not possible because the positions could not be filled. Second, this is a single-site experience, and our findings may not be generalizable, particularly those pertaining to remuneration. Third, our study was underpowered to detect small but important differences in characteristics of APPs, especially time from graduation to hire, before and after the implementation of our fellowship. Further research comparing various programs both in structure and outcomes—such as fellows’ readiness for practice, costs, duration of vacancies, and provider satisfaction—are an important next step.
We have developed a pool of applicants within our division to fill vacancies left by turnover from senior NPs and PAs. This program has reduced costs and improved the joy of practice for both doctors and APPs. As the need for highly qualified NPs and PAs in hospital medicine continues to grow, we may see more APP fellowships in hospital medicine in the United States.
Acknowledgments
The authors thank the advanced practice providers who have helped us grow and refine our fellowship.
Disclosures
The authors have nothing to disclose
There is an increasing utilization of advanced practice providers (APPs) in the delivery of healthcare in the United States.1,2 As of 2016, there were 157, 025 nurse practitioners (NPs) and 102,084 physician assistants (PAs) with a projected growth rate of 6.8% and 4.3%, respectively, which exceeds the physician growth rate of 1.1%.2 This increased growth rate has been attributed to the expectation that APPs can enhance the quality of physician care, relieve physician shortages, and reduce service costs, as APPs are less expensive to hire than physicians.3,4 Hospital medicine is the fastest growing medical field in the United States, and approximately 83% of hospitalist groups around the country utilize APPs; however, the demand for hospitalists continues to exceed the supply, and this has led to increased utilization of APPs in hospital medicine.5-10
APPs receive very limited inpatient training and there is wide variation in their clinical abilities after graduation.11 This is an issue that has become exacerbated in recent years by a change in the training process for PAs. Before 2005, PA programs were typically two to three years long and required the same prerequisite courses as medical schools.11 PA students completed more than 2,000 hours of clinical rotations and then had to pass the Physician Assistant National Certifying Exam before they could practice.12 Traditionally, PA programs typically attracted students with prior healthcare experience.11 In 2005, PA programs began transitioning from bachelor’s degrees to requiring a master’s level degree for completion of the programs. This has shifted the demographics of the students matriculating to younger students with little-to-no prior healthcare experience; moreover, these fresh graduates lack exposure to hospital medicine.11
NPs usually gain clinical experience working as registered nurses (RNs) for two or more years prior to entry into the NP program. NP programs for baccalaureate-prepared RNs vary in length from two to three years.2 There is an acute care focus for NPs in training; however, there is no standardized training or licensure to ensure that hospital medicine competencies are met.13-15 Some studies have shown that a lack of structured support has been found to affect NP role transition negatively during the first year of practice,16 and graduating NPs have indicated that they needed more out of their clinical education in terms of content, clinical experience, and competency testing.17
Hiring new APP graduates as hospitalists requires a longer and more rigorous onboarding process. On‐the‐job training in hospital medicine for new APP graduates can take as long as six to 12 months in order for them to acquire the basic skill set necessary to adequately manage hospitalized patients.15 This extended onboarding is costly because the APPs are receiving a full hospitalist salary, yet they are not functioning at full capacity. Ideally, there should be an intermediary training step between graduation and employment as hospitalist APPs. Studies have shown that APPs are interested in formal postgraduate hospital medicine training, even if it means having a lower stipend during the first year after graduating from their NP or PA program.9,15,18
The growing need for hospitalists, driven by residency work-hour reform, increased age and complexity of patients, and the need to improve the quality of inpatient care while simultaneously reducing waste, has contributed to the increasing utilization of and need for highly qualified APPs in hospital medicine.11,19,20 We established a fellowship to train APPs. The goal of this study was to determine if an APP fellowship is a cost-effective pipeline for filling vacancies within a hospitalist program.
METHODS
Design and Setting
Johns Hopkins Bayview Medical Center (JHBMC) is a 440 bed hospital in Baltimore Maryland. The hospitalist group was started in 1996 with one physician seeing approximately 500 discharges a year. Over the last 20 years, the group has grown and is now its own division with 57 providers, including 42 physicians, 11 APPs, and four APP fellows. The hospitalist division manages ~7,000 discharges a year, which corresponds to approximately 60% of admissions to general medicine. Hospitalist APPs help staff general medicine by working alongside doctors and admitting patients during the day and night. The APPs also staff the pulmonary step down unit with a pulmonary attending and the chemical dependency unit with an internal medicine addiction specialist.
The growth of the division of hospital medicine at JHBMC is a result of increasing volumes and reduced residency duty hours. The increasing full time equivalents (FTEs) resulted in a need for APPs; however, vacancies went unfilled for an average of 35 weeks due to the time it took to post open positions, interview applicants, and hire applicants through the credentialing process. Further, it took as long as 22 to 34 weeks for a new hire to work independently. The APP vacancies and onboarding resulted in increased costs to the division incurred by physician moonlighting to cover open shifts. The hourly physician moonlighting rate at JHBMC is $150. All costs were calculated on the basis of a 40-hour work week. We performed a pre- and postanalysis of outcomes of interest between January 2009 and June 2018. This study was exempt from institutional review board review.
Intervention
In 2014, a one year APP clinical fellowship in hospital medicine was started. The fellows evaluate and manage patients working one-on-one with an experienced hospitalist faculty member. The program consists of 80% clinical experience in the inpatient setting and 20% didactic instruction (Table 1). Up to four fellows are accepted each year and are eligible for hire after training if vacancies exist. The program is cost neutral and was financed by downsizing, through attrition, two physician FTEs. Four APP fellows’ salaries are the equivalent of two entry-level hospitalist physicians’ salaries at JHBMC. The annual salary for an APP fellow is $69,000.
Downsizing by two physician FTEs meant that one less doctor was scheduled every day. The patient load previously seen by that one doctor (10 patients) was absorbed by the MD–APP fellow dyads. Paired with a fellow, each physician sees a higher cap of 13 patients, and it takes six weeks for the fellows to ramp-up to this patient load. When the fellow first starts, the team sees 10 patients. Every two weeks, the pair’s census increases by one patient to the cap of 13. Collectively, the four APP fellow–MD dyads make it possible for four physicians to see an additional 12 patients. The two extra patients absorbed by the service per day results in a net increase in capacity of up to 730 patient encounters a year.
Outcomes and Analysis
Our main outcomes of interest were duration of onboarding and cost incurred by the division to (1) staff the service during a vacancy and (2) onboard new hires. Secondary outcomes included duration of vacancy and total time spent with the group. We collected basic demographic data on participants, including, age, gender, and race. Demographics and outcomes of interest were compared pre- (2009-2013) and post- (2014-2018) initiation of the APP clinical fellowship using the chi-square test, the t-test for normally distributed data, and the Wilcoxon rank-sum for nonnormally distributed data, as appropriate. The normality of the data distribution was tested using the Shapiro-Wilk W test. Two-tailed P values less than .05 were considered to be statistically significant. Results were analyzed using Stata/MP version 13.0 (StataCorp Inc, College Station, Texas).
RESULTS
Twelve fellows have been recruited, and of these, 10 have graduated. Two chose to leave the program prior to completion. Of the 10 fellows that have graduated, six have been hired into our group, one was hired within our facility, and three were hired as hospitalists at other institutions. The median time from APP school graduation to hire was also not different between the two groups (10.5 vs 3.9 months, P = .069). In addition, the total time that the new APP hires spent with the group was nonstatistically significantly different between the two periods (17.9 vs 18.3 months, P = .735). Both the mean duration of onboarding and the cost to the division were significantly reduced after implementation of the program (25.4 vs 11.0 weeks, P = .017 and $361,714 vs $66,000, P = .004; Table 2).
The yearly cost of an APP vacancy and onboarding is incurred by doctor moonlighting costs (at the rate of $150 per hour) to cover open shifts. The mean duration of vacancies and onboarding each year was 34.9 and 25.4 weeks, respectively, before the fellowship. The yearly cost of onboarding, after the establishment of the fellowship, is a maximum of $66,000, derived from physician moonlighting to cover the six-week ramp-up at the very beginning of the fellowship and the five weeks of orientation to the pulmonary and chemical dependency units after the fellowship (Table 3).
DISCUSSION
Our APP clinical fellowship in hospital medicine at JHBMC has produced several benefits. First, the fellowship has become a pipeline for filling APP vacancies within our division. We have been able to hire for four consecutive years from the fellowship. Second, the ready availability of high-functioning and efficient APP hospitalists has cut down on the onboarding time for our new APP hires. Many new APP graduates lack confidence in caring for complex hospitalized patients. Following our 12-month clinical fellowship, our matriculated fellows are able to practice at the top of their license immediately and confidently. Third, the reduced vacancy and shortened onboarding periods have reduced costs to the division. Fourth, the fellowship has created additional teaching avenues for the faculty. The medicine units at JHBMC are comprised of hospitalist and internal medicine residency services. The hospitalists spend the majority of their clinical time in direct patient care; however, they rotate on the residency service for two weeks out of the year. The majority of physicians welcome the chance to teach more, and partnering with an APP fellow provides that opportunity.
As we have developed and grown this program, the one great challenge has been what to do with graduating fellows when we cannot hire them. Fortunately, the market for highly qualified, well trained APPs is strong, and every one of the fellows that we could not hire within our group has been able to find a position either within our facility or outside our institution. To facilitate this process, program directors and recruiters are invited to meet with the fellows toward the end of their fellowship to share employment opportunities with them.
Our study has limitations. First, had the $276,000 from the attrition of two physicians been used to hire nonfellow APPs under the old model, then the costs of the two models would have been similar, but this was simply not possible because the positions could not be filled. Second, this is a single-site experience, and our findings may not be generalizable, particularly those pertaining to remuneration. Third, our study was underpowered to detect small but important differences in characteristics of APPs, especially time from graduation to hire, before and after the implementation of our fellowship. Further research comparing various programs both in structure and outcomes—such as fellows’ readiness for practice, costs, duration of vacancies, and provider satisfaction—are an important next step.
We have developed a pool of applicants within our division to fill vacancies left by turnover from senior NPs and PAs. This program has reduced costs and improved the joy of practice for both doctors and APPs. As the need for highly qualified NPs and PAs in hospital medicine continues to grow, we may see more APP fellowships in hospital medicine in the United States.
Acknowledgments
The authors thank the advanced practice providers who have helped us grow and refine our fellowship.
Disclosures
The authors have nothing to disclose
1. Martsoff G, Nguyen P, Freund D, Poghosyan L. What we know about postgraduate nurse practitioner residency and fellowship programs. J Nurse Pract. 2017;13(7):482-487. doi: 10.1016/j.nurpra.2017.05.013.
2. Auerbach D, Staiger D, Buerhaus P. Growing ranks of advanced practice clinicians-implications for the physician workforce. N Engl J Med. 2018;378(25):2358-2360. doi: 10.1056/NEJMp1801869. PubMed
3. Laurant M, Harmsen M, Wollersheim H, Grol R, Faber M, Sibbald B. The
impact of nonphysician clinicians: do they improve the quality and cost-effectiveness
of health care services? Med Care Res Rev. 2009;66(6 Suppl):36S-89S. doi: 10.1177/1077558709346277. PubMed
4. Auerbach DI. Will the NP workforce grow in the future? New forecasts and
implications for healthcare delivery. Med Care. 2012;50(7):606-610. doi:
10.1097/MLR.0b013e318249d6e7. PubMed
5. Kisuule F, Howell E. Hospital medicine beyond the United States. Int J Gen
Med. 2018;11:65-71. doi: 10.2147/IJGM.S151275. PubMed
6. Wachter RM, Goldman L. Zero to 50, 000-The 20th anniversary of the hospitalist.
N Engl J Med. 2016;375(11):1009-1011. doi: 10.1056/NEJMp1607958. PubMed
7. Conrad, K and Valovska T. The current state of hospital medicine: trends in
compensation, practice patterns, advanced practice providers, malpractice,
and career satisfaction. In: Conrad K, ed. Clinical Approaches to Hospital
Medicine. Cham, Springer; 2017:259-270.
8. Bryant SE. Filling the gaps: preparing nurse practitioners for hospitalist
practice. J Am Assoc Nurse Pract. 2018;30(1):4-9. doi: 10.1097/
JXX.0000000000000008. PubMed
9. Sharma P, Brooks M, Roomiany P, Verma L, Criscione-Schreiber, L. Physician
assistant student training for the inpatient setting: a needs assessment. J Physician
Assist Educ. 2017;28(4):189-195. doi: 10.1097/JPA.0000000000000174. PubMed
10. Society of Hospital Medicine. 2016 State of Hospital Medicine Report. Available
at: https://www.hospitalmedicine.org/about/press-releases/shm-releases-
2016-state-of-hospital-medicine-report/. Accessed July 17, 2018.
11. Will KK, Budavari AI, Wilkens JA, Mishari K, Hartsell ZC. A Hospitalist postgraduate
training program for physician assistants. J Hosp Med. 2010;5(2):94-
8. doi: 10.1002/jhm.619. PubMed
12. Naqvi, S. Is it time for Physician Assistant (PA)/Nurse Practitioner (NP) Hospital
Medicine Residency Training. Available at: http://medicine2.missouri.e.,-
du/jahm/wp-content/uploads/2017/03/Is-it-time-for-PANP-Hospital-Medicine-
Residency-Training-Final.pdf. Accessed July 17, 2018.
13. Scheurer D, Cardin T. The Role of NPs and PAs in Hospital Medicine Programs.
From July, 2017 The Hospitalist. Available at: https://www.the-hospitalist.
org/hospitalist/article/142565/leadership-training/role-nps-and-pashospital-
medicine-programs. Accessed July 17, 2018.
14. Furfari K , Rosenthal L, Tad-y D, Wolfe B, Glasheen J. Nurse practitioners as
inpatinet providers: a hospital medicine fellowship program. J Nurse Pract.
2014;10(6):425-429. doi: 10.1016/j.nurpra.2014.03.022.
15. Taylor D, Broyhill B, Burris A, Wilcox M. A strategic approach for developing
an advanced practice workforce: from postgraduate transition-to-practice
fellowship programs and beyond. Nurs Adm Q. 2017;41(1):11-19. doi:
10.1097/NAQ.0000000000000198. PubMed
16. Barnes H. Exploring the factors that influence nurse practitioners role transition.
J Nurse Pract. 2015;11(2):178-183. doi: 10.1016/j.nurpra.2014.11.004. PubMed
17. Hart MA, Macnee LC. How well are nurse practitioners prepared for practice:
results of a 2004 questionnaire study. J Am Acad Nurse Pract. 2007;19(1):35-
42. doi: 10.1111/j.1745-7599.2006.00191.x PubMed
18. Torok H, Lackner C, Landis R, Wright S. Learning needs of physician assistants
working in hospital medicine. J Hosp Med. 2012;7(3):190-194. doi:
10.1002/jhm.1001. PubMed
19. Kisuule F, Howell E. Hospitalists and their impact on quality, patient safety,
and satisfaction. Obstet Gynecol Clin N Am. 2015;42(3):433-446. doi:
10.1016/j.ogc.2015.05.003. PubMed
20. Ford, W, Britting L. Nonphysician Providers in the hospitalist model: a prescription
for change and a warning about unintended side effects. J Hosp
Med. 2010;5(2):99-102. doi: 10.1002/jhm.556. PubMed
1. Martsoff G, Nguyen P, Freund D, Poghosyan L. What we know about postgraduate nurse practitioner residency and fellowship programs. J Nurse Pract. 2017;13(7):482-487. doi: 10.1016/j.nurpra.2017.05.013.
2. Auerbach D, Staiger D, Buerhaus P. Growing ranks of advanced practice clinicians-implications for the physician workforce. N Engl J Med. 2018;378(25):2358-2360. doi: 10.1056/NEJMp1801869. PubMed
3. Laurant M, Harmsen M, Wollersheim H, Grol R, Faber M, Sibbald B. The
impact of nonphysician clinicians: do they improve the quality and cost-effectiveness
of health care services? Med Care Res Rev. 2009;66(6 Suppl):36S-89S. doi: 10.1177/1077558709346277. PubMed
4. Auerbach DI. Will the NP workforce grow in the future? New forecasts and
implications for healthcare delivery. Med Care. 2012;50(7):606-610. doi:
10.1097/MLR.0b013e318249d6e7. PubMed
5. Kisuule F, Howell E. Hospital medicine beyond the United States. Int J Gen
Med. 2018;11:65-71. doi: 10.2147/IJGM.S151275. PubMed
6. Wachter RM, Goldman L. Zero to 50, 000-The 20th anniversary of the hospitalist.
N Engl J Med. 2016;375(11):1009-1011. doi: 10.1056/NEJMp1607958. PubMed
7. Conrad, K and Valovska T. The current state of hospital medicine: trends in
compensation, practice patterns, advanced practice providers, malpractice,
and career satisfaction. In: Conrad K, ed. Clinical Approaches to Hospital
Medicine. Cham, Springer; 2017:259-270.
8. Bryant SE. Filling the gaps: preparing nurse practitioners for hospitalist
practice. J Am Assoc Nurse Pract. 2018;30(1):4-9. doi: 10.1097/
JXX.0000000000000008. PubMed
9. Sharma P, Brooks M, Roomiany P, Verma L, Criscione-Schreiber, L. Physician
assistant student training for the inpatient setting: a needs assessment. J Physician
Assist Educ. 2017;28(4):189-195. doi: 10.1097/JPA.0000000000000174. PubMed
10. Society of Hospital Medicine. 2016 State of Hospital Medicine Report. Available
at: https://www.hospitalmedicine.org/about/press-releases/shm-releases-
2016-state-of-hospital-medicine-report/. Accessed July 17, 2018.
11. Will KK, Budavari AI, Wilkens JA, Mishari K, Hartsell ZC. A Hospitalist postgraduate
training program for physician assistants. J Hosp Med. 2010;5(2):94-
8. doi: 10.1002/jhm.619. PubMed
12. Naqvi, S. Is it time for Physician Assistant (PA)/Nurse Practitioner (NP) Hospital
Medicine Residency Training. Available at: http://medicine2.missouri.e.,-
du/jahm/wp-content/uploads/2017/03/Is-it-time-for-PANP-Hospital-Medicine-
Residency-Training-Final.pdf. Accessed July 17, 2018.
13. Scheurer D, Cardin T. The Role of NPs and PAs in Hospital Medicine Programs.
From July, 2017 The Hospitalist. Available at: https://www.the-hospitalist.
org/hospitalist/article/142565/leadership-training/role-nps-and-pashospital-
medicine-programs. Accessed July 17, 2018.
14. Furfari K , Rosenthal L, Tad-y D, Wolfe B, Glasheen J. Nurse practitioners as
inpatinet providers: a hospital medicine fellowship program. J Nurse Pract.
2014;10(6):425-429. doi: 10.1016/j.nurpra.2014.03.022.
15. Taylor D, Broyhill B, Burris A, Wilcox M. A strategic approach for developing
an advanced practice workforce: from postgraduate transition-to-practice
fellowship programs and beyond. Nurs Adm Q. 2017;41(1):11-19. doi:
10.1097/NAQ.0000000000000198. PubMed
16. Barnes H. Exploring the factors that influence nurse practitioners role transition.
J Nurse Pract. 2015;11(2):178-183. doi: 10.1016/j.nurpra.2014.11.004. PubMed
17. Hart MA, Macnee LC. How well are nurse practitioners prepared for practice:
results of a 2004 questionnaire study. J Am Acad Nurse Pract. 2007;19(1):35-
42. doi: 10.1111/j.1745-7599.2006.00191.x PubMed
18. Torok H, Lackner C, Landis R, Wright S. Learning needs of physician assistants
working in hospital medicine. J Hosp Med. 2012;7(3):190-194. doi:
10.1002/jhm.1001. PubMed
19. Kisuule F, Howell E. Hospitalists and their impact on quality, patient safety,
and satisfaction. Obstet Gynecol Clin N Am. 2015;42(3):433-446. doi:
10.1016/j.ogc.2015.05.003. PubMed
20. Ford, W, Britting L. Nonphysician Providers in the hospitalist model: a prescription
for change and a warning about unintended side effects. J Hosp
Med. 2010;5(2):99-102. doi: 10.1002/jhm.556. PubMed
© 2019 Society of Hospital Medicine
Things We Do For No Reason: Use of Antipsychotic Medications in Patients with Delirium
Inspired by the ABIM Foundation’s Choosing Wisely® campaign, the “Things We Do for No ReasonTM” (TWDFNR) series reviews practices that have become common parts of hospital care but may provide little value to our patients. Practices reviewed in the TWDFNRTM series do not represent “black and white” conclusions or clinical practice standards but are meant as a starting place for research and active discussions among hospitalists and patients. We invite you to be part of that discussion.
CASE
An 86-year-old woman with mild dementia falls at home while preparing a meal. Her son brings her to the emergency department for excruciating pain in her right hip. X-rays reveal a fractured right femur that requires open reduction and internal fixation. On the first postoperative day, she does not participate in therapy and sleeps most of the day. Overnight, a nurse observes her calmly speaking to a hallucination of a family member in the room and picking at the tape around her peripheral intravenous catheter (PIV) causing the PIV to fall out twice. Her vital signs are temperature 36.7°C, pulse 82 beats per minute, respirations 12 breaths per minute, blood pressure 143/72 mm Hg, and pulse oximetry of 99% on room air. She is hypoactive, distractedly picks at her clothing and PIV, inattentive, and unable to say the day of the week or count months backward. Nursing asks for haloperidol for her delirium.
WHY YOU MIGHT THINK ANTIPSYCHOTICS FOR DELIRIUM ARE HELPFUL
Delirium is an acute change in cognition characterized by inattention typically associated with disorganized thinking and/or alteration in consciousness.1 Delirium occurs in almost 25% of hospitalized patients, and clinicians have a limited pharmacologic armamentarium to treat it, given the absence of benefit for acetylcholinesterase inhibitors and concern that benzodiazepine medications cause/exacerbate delirium.2-4 Another treatment option is antipsychotic medications which block dopamine since dopamine excess is a key element in the neurotransmitter pathophysiology of delirium.5 A small 2005 trial of haloperidol prophylaxis in hip fracture patients found that haloperidol reduced the overall severity and duration of delirium.6 Based in part on this trial, a 2007 Cochrane Systematic Review concluded that antipsychotics “may reduce severity and duration of delirium episodes and shorten length of hospital stay in hip surgery.”7 Another study in 2010 demonstrated a 55% faster decline in total Delirium Rating Scale-Revised 98 (DRS-R-98) scores in patients on a general/medical-surgical floor receiving quetiapine treatment compared to those who received placebo.8
Studies show that 10%-30% of patients receive antipsychotics at some point during their hospitalization, usually for delirium.9,10 Variability in antipsychotic prescribing patterns not explained by patient characteristics suggests the local culture may influence antipsychotic prescribing practices when evidence from randomized controlled trials is sparse or conflicting.10
WHY ANTIPSYCHOTIC MEDICATIONS ARE NOT HELPFUL IN PATIENTS WITH DELIRIUM
While few studies have demonstrated positive effects of antipsychotics in delirium treatment, the overall evidence is not persuasive. The results of some studies have not been reproduced while only the positive effects rather than the adverse side effects of antipsychotic medications were highlighted in other articles. For instance, the 2005 hip fracture delirium prophylaxis trial found there was no difference in the incidence of delirium in patients on postoperative day one.7 Furthermore, the 2010 quetiapine study was underpowered for the primary outcome of lower DRS-R-98 scores. Importantly, there was no significant difference in severity of delirium between treatment (quetiapine) and placebo groups on days one, three, or 10.10 These studies show that antipsychotics were neither effective at preventing delirium or in reducing its severity compared to placebo. In 2016, a systemic review in the Journal of the American Geriatric Society included both of the above studies in addition to 17 other studies to assess the efficacy of antipsychotics in preventing and treating delirium. This analysis concluded that antipsychotics did not change the length of delirium or length of stay.11 In addition, the absence of convincing evidence of antipsychotics benefits in postoperative delirium has led the American Geriatrics Society to recommend: “The prescribing practitioner should not prescribe antipsychotic… medications for the treatment of older adults with postoperative delirium who are not agitated and threatening substantial harm to self or others.”12
There is a paucity of data speaking directly to whether antipsychotics reduce patient distress. A recent randomized controlled study compared haloperidol, risperidone, and placebo for delirium treatment in palliative care and hospice patients. With treatment, the patients in the antipsychotic arms demonstrated slightly more severe delirium and a significantly higher incidence of extrapyramidal symptoms (EPS) than the patients receiving placebo.13
Side effects such as EPS, aspiration pneumonia, and arrhythmia are concerns when using antipsychotics for delirium treatment.14 A systematic review and meta-analysis found the difference in EPS incidence between patients treated for delirium with antipsychotics versus no intervention ranged from no difference to over 10%.11 In addition to EPS, patients receiving antipsychotics in a cohort study were at increased risk for aspiration pneumonia compared to patients who did not receive antipsychotics (adjusted odds ratio = 1.5, 95% CI, 1.2-1.9).15 These serious side effects led the Food and Drug Administration (FDA) to issue a black box warning for antipsychotic treatment in dementia-related psychosis. Most importantly, the FDA warns that there is an increased risk of death.16
WHAT YOU SHOULD DO INSTEAD OF USING ANTIPSYCHOTICS
In the first line management of delirium, hospitalists should address underlying modifiable contributions to the condition with attention to medications, pain, electrolytes, ischemia, infection, alcohol withdrawal, and reducing invasive lines. For example, two studies demonstrated a decrease in delirium severity and duration of palliative care in patients by treating delirium triggers, such as dehydration, electrolyte abnormalities, or infection, rather than using antipsychotics.13,17 Furthermore, hospitalists should review the medication list carefully and look for opportunities to deprescribe sedative/hypnotics and anticholinergics.
In addition, hospitalists should implement the core elements of the nursing delirium protocol from the Hospital Elder Life Program (http://www.hospitalelderlifeprogram.org/). The program focuses on orientation, hydration, mobility, sensory aids, and an environment conducive to sleep.18 When not representing an acute threat to the patient or staff, hospitalists should manage transient agitation from blood draws or vital sign checks by having staff members deescalate and re-approach the intervention later. While multicomponent nonpharmacologic interventions have more robust evidence for prevention of delirium than for treatment, they are low risk and still recommended for the patient with established delirium.19,20
A delirious patient picking at PIVs should prompt clinicians to re-evaluate the need for continued PIV access. If still necessary, experience suggests that PIVs can be protected with a combination of well-taped gauze extending from wrist to shoulder with any attached tubing exiting out of reach behind the shoulder. Also “beneficial distraction” with a task or “activity vest” that consists of an apron with zips, ties, and buttons designed to provide harmless objects can occupy the patient’s hands.
WHEN IT IS HELPFUL TO USE ANTIPSYCHOTICS FOR DELIRIUM
The literature does not provide clear evidence for when the use of antipsychotics is warranted. Antipsychotics may have a role for patients who are having severe psychotic symptoms posing an acute safety risk. In those situations, the American Geriatrics Society recommends using the “lowest effective dose for the shortest possible duration to treat patients who are severely agitated or distressed, and are threatening substantial harm to self and/or others…only if behavioral interventions have failed or are not possible.”12 In those patients who are having an acute myocardial infarction, consider atypical antipsychotics since haloperidol carries a small increased risk of mortality in that patient population.21
RECOMMENDATIONS
- Address underlying modifiable contributions to the delirium paying attention to medications, pain, electrolytes, ischemia, infection, alcohol withdrawal, and reducing invasive lines. Deprescribe sedative/hypnotic and anticholinergic medications.
- After addressing modifiable risk factors, attempt behavioral interventions for continuous problematic behaviors or symptoms of delirium.
- Reserve antipsychotics for cases where the patient poses an immediate danger of self-harm or harm to others. Treat for the shortest possible duration with the lowest effective dose of antipsychotic.
CONCLUSION
Returning to our case presentation, the hospitalist should not prescribe antipsychotic medications since there is no immediate risk of harm and antipsychotics do not treat hypoactive delirium. Delirium is a complex condition requiring a review of multifactorial causes. The hospitalist should investigate and address modifiable contributions. Furthermore, the hospitalist can make the PIV less accessible to deter the patient’s efforts to remove it and offer a distracting activity. Resolution of delirium, in all its forms, is still best achieved by treating the underlying etiology. The use of antipsychotics for treatment of patients with delirium in the absence of severe agitation
Do you think this is a low-value practice? Is this truly a “Thing We Do for No ReasonTM?” Share what you do in your practice and join in the conversation online by retweeting it on Twitter (#TWDFNR) and liking it on Facebook. We invite you to propose ideas for other “Things We Do for No ReasonTM” topics by emailing TWDFNR@hospitalmedicine.org.
Disclosures
Dr. Pahwa has received compensation for Expert Testimony, royalties from Aquifer, and owns stock/stock options in Pfizer and Aetna outside the submitted work. Dr. Qureshi and Dr. Cumbler have nothing to disclose.
1. American Psychiatric Association. DSM-5 Task Force. Diagnostic and statistical manual of mental disorders: DSM-5. 5th ed. Washington, D.C.: American Psychiatric Association; 2013.
2. Lonergan E, Luxenberg J, Areosa Sastre A. Benzodiazepines for delirium. Cochrane Database Syst Rev. 2009;(4):CD006379. https://doi.org/10.1002/14651858.CD006379.pub2.
3. Overshott R, Karim S, Burns A. Cholinesterase inhibitors for delirium. Cochrane Database Syst Rev. 2008;(1):CD005317. https://doi.org/10.1002/14651858.CD005317.pub2.
4. Zaal IJ, Devlin JW, Hazelbag M, et al. Benzodiazepine-associated delirium in critically ill adults. Intensive Care Med. 2015;41(12):2130-2137. https://doi.org/10.1007/s00134-015-4063-z.
5. Maldonado JR. Neuropathogenesis of delirium: review of current etiologic theories and common pathways. Am J Geriatr Psychiatry. 2013;21(12):1190-1222. https://doi.org/10.1016/j.jagp.2013.09.005.
6. Kalisvaart KJ, de Jonghe JF, Bogaards MJ, et al. Haloperidol prophylaxis for elderly hip-surgery patients at risk for delirium: a randomized placebo-controlled study. J Am Geriatr Soc. 2005;53(10):1658-1666. https://doi.org/10.1111/j.1532-5415.2005.53503.x
7. Siddiqi N, Stockdale R, Britton AM, Holmes J. Interventions for preventing delirium in hospitalized patients. Cochrane Database Syst Rev. 2007;(2):CD005563. https://doi.org/10.1002/14651858.CD005563.pub2
8. Tahir TA, Eeles E, Karapareddy V, et al. A randomized controlled trial of quetiapine versus placebo in the treatment of delirium. J Psychosom Res. 2010;69(5):485-490. https://doi.org/10.1016/j.jpsychores.2010.05.006.
9. Loh KP, Ramdass S, Garb JL, Brennan MJ, Lindenauer PK, Lagu T. From hospital to community: use of antipsychotics in hospitalized elders. J Hosp Med. 2014;9(12):802-804. https://doi.org/10.1002/jhm.2277.
10. Herzig SJ, Rothberg MB, Guess JR, Gurwitz JH, Marcantonio ER. Antipsychotic medication utilization in nonpsychiatric hospitalizations. J Hosp Med. 2016;11(8):543-549. https://doi.org/10.1002/jhm.2596.
11. Neufeld KJ, Yue J, Robinson TN, Inouye SK, Needham DM. Antipsychotic medication for prevention and treatment of delirium in hospitalized adults: a systematic review and meta-analysis. J Am Geriatr Soc. 2016;64(4):705-714. https://doi.org/10.1111/jgs.14076.
12. American Geriatrics Society Expert Panel on Postoperative Delirium in Older A. American Geriatrics Society abstracted clinical practice guideline for postoperative delirium in older adults. J Am Geriatr Soc. 2015;63(1):142-150. https://doi.org/10.1111/jgs.13281
13. Agar MR, Lawlor PG, Quinn S, et al. Efficacy of oral risperidone, haloperidol, or placebo for symptoms of delirium among patients in palliative care: a randomized clinical trial. JAMA Intern Med. 2017;177(1):34-42. https://doi.org/10.1001/jamainternmed.2016.7491.
14. Hatta K, Kishi Y, Wada K, et al. Antipsychotics for delirium in the general hospital setting in consecutive 2453 inpatients: a prospective observational study. Int J Geriatr Psychiatry. 2014;29(3):253-262. https://doi.org/10.1002/gps.3999.
15. Herzig SJ, LaSalvia MT, Naidus E, et al. Antipsychotics and the risk of aspiration pneumonia in individuals hospitalized for nonpsychiatric conditions: a cohort study. J Am Geriatr Soc. 2017;65(12):2580-2586. https://doi.org/10.1111/jgs.15066.
16. Jeste DV, Blazer D, Casey D, et al. ACNP White Paper: update on use of antipsychotic drugs in elderly persons with dementia. Neuropsychopharmacology. 2008;33(5):957-970. https://doi.org/10.1038/sj.npp.1301492
17. Hui D, Frisbee-Hume S, Wilson A, et al. Effect of lorazepam with haloperidol vs haloperidol alone on agitated delirium in patients with advanced cancer receiving palliative care: a randomized clinical trial. JAMA. 2017;318(11):1047-1056. https://doi.org/10.1001/jama.2017.11468.
18. Inouye SK, Bogardus ST, Jr., Charpentier PA, et al. A multicomponent intervention to prevent delirium in hospitalized older patients. N Engl J Med. 1999;340(9):669-676. https://doi.org/10.1056/NEJM199903043400901
19. Milisen K, Lemiengre J, Braes T, Foreman MD. Multicomponent intervention strategies for managing delirium in hospitalized older people: systematic review. J Adv Nurs. 2005;52(1):79-90. https://doi.org/10.1111/j.1365-2648.2005.03557.x
20. Marcantonio ER. Delirium in hospitalized older adults. N Engl J Med. 2017;377(15):1456-1466. https://doi.org/10.1056/NEJMcp1605501.
21. Park Y, Bateman BT, Kim DH, et al. Use of haloperidol versus atypical antipsychotics and risk of in-hospital death in patients with acute myocardial infarction: cohort study. BMJ. 2018;360. https://doi.org/10.1136/bmj.k1218.
Inspired by the ABIM Foundation’s Choosing Wisely® campaign, the “Things We Do for No ReasonTM” (TWDFNR) series reviews practices that have become common parts of hospital care but may provide little value to our patients. Practices reviewed in the TWDFNRTM series do not represent “black and white” conclusions or clinical practice standards but are meant as a starting place for research and active discussions among hospitalists and patients. We invite you to be part of that discussion.
CASE
An 86-year-old woman with mild dementia falls at home while preparing a meal. Her son brings her to the emergency department for excruciating pain in her right hip. X-rays reveal a fractured right femur that requires open reduction and internal fixation. On the first postoperative day, she does not participate in therapy and sleeps most of the day. Overnight, a nurse observes her calmly speaking to a hallucination of a family member in the room and picking at the tape around her peripheral intravenous catheter (PIV) causing the PIV to fall out twice. Her vital signs are temperature 36.7°C, pulse 82 beats per minute, respirations 12 breaths per minute, blood pressure 143/72 mm Hg, and pulse oximetry of 99% on room air. She is hypoactive, distractedly picks at her clothing and PIV, inattentive, and unable to say the day of the week or count months backward. Nursing asks for haloperidol for her delirium.
WHY YOU MIGHT THINK ANTIPSYCHOTICS FOR DELIRIUM ARE HELPFUL
Delirium is an acute change in cognition characterized by inattention typically associated with disorganized thinking and/or alteration in consciousness.1 Delirium occurs in almost 25% of hospitalized patients, and clinicians have a limited pharmacologic armamentarium to treat it, given the absence of benefit for acetylcholinesterase inhibitors and concern that benzodiazepine medications cause/exacerbate delirium.2-4 Another treatment option is antipsychotic medications which block dopamine since dopamine excess is a key element in the neurotransmitter pathophysiology of delirium.5 A small 2005 trial of haloperidol prophylaxis in hip fracture patients found that haloperidol reduced the overall severity and duration of delirium.6 Based in part on this trial, a 2007 Cochrane Systematic Review concluded that antipsychotics “may reduce severity and duration of delirium episodes and shorten length of hospital stay in hip surgery.”7 Another study in 2010 demonstrated a 55% faster decline in total Delirium Rating Scale-Revised 98 (DRS-R-98) scores in patients on a general/medical-surgical floor receiving quetiapine treatment compared to those who received placebo.8
Studies show that 10%-30% of patients receive antipsychotics at some point during their hospitalization, usually for delirium.9,10 Variability in antipsychotic prescribing patterns not explained by patient characteristics suggests the local culture may influence antipsychotic prescribing practices when evidence from randomized controlled trials is sparse or conflicting.10
WHY ANTIPSYCHOTIC MEDICATIONS ARE NOT HELPFUL IN PATIENTS WITH DELIRIUM
While few studies have demonstrated positive effects of antipsychotics in delirium treatment, the overall evidence is not persuasive. The results of some studies have not been reproduced while only the positive effects rather than the adverse side effects of antipsychotic medications were highlighted in other articles. For instance, the 2005 hip fracture delirium prophylaxis trial found there was no difference in the incidence of delirium in patients on postoperative day one.7 Furthermore, the 2010 quetiapine study was underpowered for the primary outcome of lower DRS-R-98 scores. Importantly, there was no significant difference in severity of delirium between treatment (quetiapine) and placebo groups on days one, three, or 10.10 These studies show that antipsychotics were neither effective at preventing delirium or in reducing its severity compared to placebo. In 2016, a systemic review in the Journal of the American Geriatric Society included both of the above studies in addition to 17 other studies to assess the efficacy of antipsychotics in preventing and treating delirium. This analysis concluded that antipsychotics did not change the length of delirium or length of stay.11 In addition, the absence of convincing evidence of antipsychotics benefits in postoperative delirium has led the American Geriatrics Society to recommend: “The prescribing practitioner should not prescribe antipsychotic… medications for the treatment of older adults with postoperative delirium who are not agitated and threatening substantial harm to self or others.”12
There is a paucity of data speaking directly to whether antipsychotics reduce patient distress. A recent randomized controlled study compared haloperidol, risperidone, and placebo for delirium treatment in palliative care and hospice patients. With treatment, the patients in the antipsychotic arms demonstrated slightly more severe delirium and a significantly higher incidence of extrapyramidal symptoms (EPS) than the patients receiving placebo.13
Side effects such as EPS, aspiration pneumonia, and arrhythmia are concerns when using antipsychotics for delirium treatment.14 A systematic review and meta-analysis found the difference in EPS incidence between patients treated for delirium with antipsychotics versus no intervention ranged from no difference to over 10%.11 In addition to EPS, patients receiving antipsychotics in a cohort study were at increased risk for aspiration pneumonia compared to patients who did not receive antipsychotics (adjusted odds ratio = 1.5, 95% CI, 1.2-1.9).15 These serious side effects led the Food and Drug Administration (FDA) to issue a black box warning for antipsychotic treatment in dementia-related psychosis. Most importantly, the FDA warns that there is an increased risk of death.16
WHAT YOU SHOULD DO INSTEAD OF USING ANTIPSYCHOTICS
In the first line management of delirium, hospitalists should address underlying modifiable contributions to the condition with attention to medications, pain, electrolytes, ischemia, infection, alcohol withdrawal, and reducing invasive lines. For example, two studies demonstrated a decrease in delirium severity and duration of palliative care in patients by treating delirium triggers, such as dehydration, electrolyte abnormalities, or infection, rather than using antipsychotics.13,17 Furthermore, hospitalists should review the medication list carefully and look for opportunities to deprescribe sedative/hypnotics and anticholinergics.
In addition, hospitalists should implement the core elements of the nursing delirium protocol from the Hospital Elder Life Program (http://www.hospitalelderlifeprogram.org/). The program focuses on orientation, hydration, mobility, sensory aids, and an environment conducive to sleep.18 When not representing an acute threat to the patient or staff, hospitalists should manage transient agitation from blood draws or vital sign checks by having staff members deescalate and re-approach the intervention later. While multicomponent nonpharmacologic interventions have more robust evidence for prevention of delirium than for treatment, they are low risk and still recommended for the patient with established delirium.19,20
A delirious patient picking at PIVs should prompt clinicians to re-evaluate the need for continued PIV access. If still necessary, experience suggests that PIVs can be protected with a combination of well-taped gauze extending from wrist to shoulder with any attached tubing exiting out of reach behind the shoulder. Also “beneficial distraction” with a task or “activity vest” that consists of an apron with zips, ties, and buttons designed to provide harmless objects can occupy the patient’s hands.
WHEN IT IS HELPFUL TO USE ANTIPSYCHOTICS FOR DELIRIUM
The literature does not provide clear evidence for when the use of antipsychotics is warranted. Antipsychotics may have a role for patients who are having severe psychotic symptoms posing an acute safety risk. In those situations, the American Geriatrics Society recommends using the “lowest effective dose for the shortest possible duration to treat patients who are severely agitated or distressed, and are threatening substantial harm to self and/or others…only if behavioral interventions have failed or are not possible.”12 In those patients who are having an acute myocardial infarction, consider atypical antipsychotics since haloperidol carries a small increased risk of mortality in that patient population.21
RECOMMENDATIONS
- Address underlying modifiable contributions to the delirium paying attention to medications, pain, electrolytes, ischemia, infection, alcohol withdrawal, and reducing invasive lines. Deprescribe sedative/hypnotic and anticholinergic medications.
- After addressing modifiable risk factors, attempt behavioral interventions for continuous problematic behaviors or symptoms of delirium.
- Reserve antipsychotics for cases where the patient poses an immediate danger of self-harm or harm to others. Treat for the shortest possible duration with the lowest effective dose of antipsychotic.
CONCLUSION
Returning to our case presentation, the hospitalist should not prescribe antipsychotic medications since there is no immediate risk of harm and antipsychotics do not treat hypoactive delirium. Delirium is a complex condition requiring a review of multifactorial causes. The hospitalist should investigate and address modifiable contributions. Furthermore, the hospitalist can make the PIV less accessible to deter the patient’s efforts to remove it and offer a distracting activity. Resolution of delirium, in all its forms, is still best achieved by treating the underlying etiology. The use of antipsychotics for treatment of patients with delirium in the absence of severe agitation
Do you think this is a low-value practice? Is this truly a “Thing We Do for No ReasonTM?” Share what you do in your practice and join in the conversation online by retweeting it on Twitter (#TWDFNR) and liking it on Facebook. We invite you to propose ideas for other “Things We Do for No ReasonTM” topics by emailing TWDFNR@hospitalmedicine.org.
Disclosures
Dr. Pahwa has received compensation for Expert Testimony, royalties from Aquifer, and owns stock/stock options in Pfizer and Aetna outside the submitted work. Dr. Qureshi and Dr. Cumbler have nothing to disclose.
Inspired by the ABIM Foundation’s Choosing Wisely® campaign, the “Things We Do for No ReasonTM” (TWDFNR) series reviews practices that have become common parts of hospital care but may provide little value to our patients. Practices reviewed in the TWDFNRTM series do not represent “black and white” conclusions or clinical practice standards but are meant as a starting place for research and active discussions among hospitalists and patients. We invite you to be part of that discussion.
CASE
An 86-year-old woman with mild dementia falls at home while preparing a meal. Her son brings her to the emergency department for excruciating pain in her right hip. X-rays reveal a fractured right femur that requires open reduction and internal fixation. On the first postoperative day, she does not participate in therapy and sleeps most of the day. Overnight, a nurse observes her calmly speaking to a hallucination of a family member in the room and picking at the tape around her peripheral intravenous catheter (PIV) causing the PIV to fall out twice. Her vital signs are temperature 36.7°C, pulse 82 beats per minute, respirations 12 breaths per minute, blood pressure 143/72 mm Hg, and pulse oximetry of 99% on room air. She is hypoactive, distractedly picks at her clothing and PIV, inattentive, and unable to say the day of the week or count months backward. Nursing asks for haloperidol for her delirium.
WHY YOU MIGHT THINK ANTIPSYCHOTICS FOR DELIRIUM ARE HELPFUL
Delirium is an acute change in cognition characterized by inattention typically associated with disorganized thinking and/or alteration in consciousness.1 Delirium occurs in almost 25% of hospitalized patients, and clinicians have a limited pharmacologic armamentarium to treat it, given the absence of benefit for acetylcholinesterase inhibitors and concern that benzodiazepine medications cause/exacerbate delirium.2-4 Another treatment option is antipsychotic medications which block dopamine since dopamine excess is a key element in the neurotransmitter pathophysiology of delirium.5 A small 2005 trial of haloperidol prophylaxis in hip fracture patients found that haloperidol reduced the overall severity and duration of delirium.6 Based in part on this trial, a 2007 Cochrane Systematic Review concluded that antipsychotics “may reduce severity and duration of delirium episodes and shorten length of hospital stay in hip surgery.”7 Another study in 2010 demonstrated a 55% faster decline in total Delirium Rating Scale-Revised 98 (DRS-R-98) scores in patients on a general/medical-surgical floor receiving quetiapine treatment compared to those who received placebo.8
Studies show that 10%-30% of patients receive antipsychotics at some point during their hospitalization, usually for delirium.9,10 Variability in antipsychotic prescribing patterns not explained by patient characteristics suggests the local culture may influence antipsychotic prescribing practices when evidence from randomized controlled trials is sparse or conflicting.10
WHY ANTIPSYCHOTIC MEDICATIONS ARE NOT HELPFUL IN PATIENTS WITH DELIRIUM
While few studies have demonstrated positive effects of antipsychotics in delirium treatment, the overall evidence is not persuasive. The results of some studies have not been reproduced while only the positive effects rather than the adverse side effects of antipsychotic medications were highlighted in other articles. For instance, the 2005 hip fracture delirium prophylaxis trial found there was no difference in the incidence of delirium in patients on postoperative day one.7 Furthermore, the 2010 quetiapine study was underpowered for the primary outcome of lower DRS-R-98 scores. Importantly, there was no significant difference in severity of delirium between treatment (quetiapine) and placebo groups on days one, three, or 10.10 These studies show that antipsychotics were neither effective at preventing delirium or in reducing its severity compared to placebo. In 2016, a systemic review in the Journal of the American Geriatric Society included both of the above studies in addition to 17 other studies to assess the efficacy of antipsychotics in preventing and treating delirium. This analysis concluded that antipsychotics did not change the length of delirium or length of stay.11 In addition, the absence of convincing evidence of antipsychotics benefits in postoperative delirium has led the American Geriatrics Society to recommend: “The prescribing practitioner should not prescribe antipsychotic… medications for the treatment of older adults with postoperative delirium who are not agitated and threatening substantial harm to self or others.”12
There is a paucity of data speaking directly to whether antipsychotics reduce patient distress. A recent randomized controlled study compared haloperidol, risperidone, and placebo for delirium treatment in palliative care and hospice patients. With treatment, the patients in the antipsychotic arms demonstrated slightly more severe delirium and a significantly higher incidence of extrapyramidal symptoms (EPS) than the patients receiving placebo.13
Side effects such as EPS, aspiration pneumonia, and arrhythmia are concerns when using antipsychotics for delirium treatment.14 A systematic review and meta-analysis found the difference in EPS incidence between patients treated for delirium with antipsychotics versus no intervention ranged from no difference to over 10%.11 In addition to EPS, patients receiving antipsychotics in a cohort study were at increased risk for aspiration pneumonia compared to patients who did not receive antipsychotics (adjusted odds ratio = 1.5, 95% CI, 1.2-1.9).15 These serious side effects led the Food and Drug Administration (FDA) to issue a black box warning for antipsychotic treatment in dementia-related psychosis. Most importantly, the FDA warns that there is an increased risk of death.16
WHAT YOU SHOULD DO INSTEAD OF USING ANTIPSYCHOTICS
In the first line management of delirium, hospitalists should address underlying modifiable contributions to the condition with attention to medications, pain, electrolytes, ischemia, infection, alcohol withdrawal, and reducing invasive lines. For example, two studies demonstrated a decrease in delirium severity and duration of palliative care in patients by treating delirium triggers, such as dehydration, electrolyte abnormalities, or infection, rather than using antipsychotics.13,17 Furthermore, hospitalists should review the medication list carefully and look for opportunities to deprescribe sedative/hypnotics and anticholinergics.
In addition, hospitalists should implement the core elements of the nursing delirium protocol from the Hospital Elder Life Program (http://www.hospitalelderlifeprogram.org/). The program focuses on orientation, hydration, mobility, sensory aids, and an environment conducive to sleep.18 When not representing an acute threat to the patient or staff, hospitalists should manage transient agitation from blood draws or vital sign checks by having staff members deescalate and re-approach the intervention later. While multicomponent nonpharmacologic interventions have more robust evidence for prevention of delirium than for treatment, they are low risk and still recommended for the patient with established delirium.19,20
A delirious patient picking at PIVs should prompt clinicians to re-evaluate the need for continued PIV access. If still necessary, experience suggests that PIVs can be protected with a combination of well-taped gauze extending from wrist to shoulder with any attached tubing exiting out of reach behind the shoulder. Also “beneficial distraction” with a task or “activity vest” that consists of an apron with zips, ties, and buttons designed to provide harmless objects can occupy the patient’s hands.
WHEN IT IS HELPFUL TO USE ANTIPSYCHOTICS FOR DELIRIUM
The literature does not provide clear evidence for when the use of antipsychotics is warranted. Antipsychotics may have a role for patients who are having severe psychotic symptoms posing an acute safety risk. In those situations, the American Geriatrics Society recommends using the “lowest effective dose for the shortest possible duration to treat patients who are severely agitated or distressed, and are threatening substantial harm to self and/or others…only if behavioral interventions have failed or are not possible.”12 In those patients who are having an acute myocardial infarction, consider atypical antipsychotics since haloperidol carries a small increased risk of mortality in that patient population.21
RECOMMENDATIONS
- Address underlying modifiable contributions to the delirium paying attention to medications, pain, electrolytes, ischemia, infection, alcohol withdrawal, and reducing invasive lines. Deprescribe sedative/hypnotic and anticholinergic medications.
- After addressing modifiable risk factors, attempt behavioral interventions for continuous problematic behaviors or symptoms of delirium.
- Reserve antipsychotics for cases where the patient poses an immediate danger of self-harm or harm to others. Treat for the shortest possible duration with the lowest effective dose of antipsychotic.
CONCLUSION
Returning to our case presentation, the hospitalist should not prescribe antipsychotic medications since there is no immediate risk of harm and antipsychotics do not treat hypoactive delirium. Delirium is a complex condition requiring a review of multifactorial causes. The hospitalist should investigate and address modifiable contributions. Furthermore, the hospitalist can make the PIV less accessible to deter the patient’s efforts to remove it and offer a distracting activity. Resolution of delirium, in all its forms, is still best achieved by treating the underlying etiology. The use of antipsychotics for treatment of patients with delirium in the absence of severe agitation
Do you think this is a low-value practice? Is this truly a “Thing We Do for No ReasonTM?” Share what you do in your practice and join in the conversation online by retweeting it on Twitter (#TWDFNR) and liking it on Facebook. We invite you to propose ideas for other “Things We Do for No ReasonTM” topics by emailing TWDFNR@hospitalmedicine.org.
Disclosures
Dr. Pahwa has received compensation for Expert Testimony, royalties from Aquifer, and owns stock/stock options in Pfizer and Aetna outside the submitted work. Dr. Qureshi and Dr. Cumbler have nothing to disclose.
1. American Psychiatric Association. DSM-5 Task Force. Diagnostic and statistical manual of mental disorders: DSM-5. 5th ed. Washington, D.C.: American Psychiatric Association; 2013.
2. Lonergan E, Luxenberg J, Areosa Sastre A. Benzodiazepines for delirium. Cochrane Database Syst Rev. 2009;(4):CD006379. https://doi.org/10.1002/14651858.CD006379.pub2.
3. Overshott R, Karim S, Burns A. Cholinesterase inhibitors for delirium. Cochrane Database Syst Rev. 2008;(1):CD005317. https://doi.org/10.1002/14651858.CD005317.pub2.
4. Zaal IJ, Devlin JW, Hazelbag M, et al. Benzodiazepine-associated delirium in critically ill adults. Intensive Care Med. 2015;41(12):2130-2137. https://doi.org/10.1007/s00134-015-4063-z.
5. Maldonado JR. Neuropathogenesis of delirium: review of current etiologic theories and common pathways. Am J Geriatr Psychiatry. 2013;21(12):1190-1222. https://doi.org/10.1016/j.jagp.2013.09.005.
6. Kalisvaart KJ, de Jonghe JF, Bogaards MJ, et al. Haloperidol prophylaxis for elderly hip-surgery patients at risk for delirium: a randomized placebo-controlled study. J Am Geriatr Soc. 2005;53(10):1658-1666. https://doi.org/10.1111/j.1532-5415.2005.53503.x
7. Siddiqi N, Stockdale R, Britton AM, Holmes J. Interventions for preventing delirium in hospitalized patients. Cochrane Database Syst Rev. 2007;(2):CD005563. https://doi.org/10.1002/14651858.CD005563.pub2
8. Tahir TA, Eeles E, Karapareddy V, et al. A randomized controlled trial of quetiapine versus placebo in the treatment of delirium. J Psychosom Res. 2010;69(5):485-490. https://doi.org/10.1016/j.jpsychores.2010.05.006.
9. Loh KP, Ramdass S, Garb JL, Brennan MJ, Lindenauer PK, Lagu T. From hospital to community: use of antipsychotics in hospitalized elders. J Hosp Med. 2014;9(12):802-804. https://doi.org/10.1002/jhm.2277.
10. Herzig SJ, Rothberg MB, Guess JR, Gurwitz JH, Marcantonio ER. Antipsychotic medication utilization in nonpsychiatric hospitalizations. J Hosp Med. 2016;11(8):543-549. https://doi.org/10.1002/jhm.2596.
11. Neufeld KJ, Yue J, Robinson TN, Inouye SK, Needham DM. Antipsychotic medication for prevention and treatment of delirium in hospitalized adults: a systematic review and meta-analysis. J Am Geriatr Soc. 2016;64(4):705-714. https://doi.org/10.1111/jgs.14076.
12. American Geriatrics Society Expert Panel on Postoperative Delirium in Older A. American Geriatrics Society abstracted clinical practice guideline for postoperative delirium in older adults. J Am Geriatr Soc. 2015;63(1):142-150. https://doi.org/10.1111/jgs.13281
13. Agar MR, Lawlor PG, Quinn S, et al. Efficacy of oral risperidone, haloperidol, or placebo for symptoms of delirium among patients in palliative care: a randomized clinical trial. JAMA Intern Med. 2017;177(1):34-42. https://doi.org/10.1001/jamainternmed.2016.7491.
14. Hatta K, Kishi Y, Wada K, et al. Antipsychotics for delirium in the general hospital setting in consecutive 2453 inpatients: a prospective observational study. Int J Geriatr Psychiatry. 2014;29(3):253-262. https://doi.org/10.1002/gps.3999.
15. Herzig SJ, LaSalvia MT, Naidus E, et al. Antipsychotics and the risk of aspiration pneumonia in individuals hospitalized for nonpsychiatric conditions: a cohort study. J Am Geriatr Soc. 2017;65(12):2580-2586. https://doi.org/10.1111/jgs.15066.
16. Jeste DV, Blazer D, Casey D, et al. ACNP White Paper: update on use of antipsychotic drugs in elderly persons with dementia. Neuropsychopharmacology. 2008;33(5):957-970. https://doi.org/10.1038/sj.npp.1301492
17. Hui D, Frisbee-Hume S, Wilson A, et al. Effect of lorazepam with haloperidol vs haloperidol alone on agitated delirium in patients with advanced cancer receiving palliative care: a randomized clinical trial. JAMA. 2017;318(11):1047-1056. https://doi.org/10.1001/jama.2017.11468.
18. Inouye SK, Bogardus ST, Jr., Charpentier PA, et al. A multicomponent intervention to prevent delirium in hospitalized older patients. N Engl J Med. 1999;340(9):669-676. https://doi.org/10.1056/NEJM199903043400901
19. Milisen K, Lemiengre J, Braes T, Foreman MD. Multicomponent intervention strategies for managing delirium in hospitalized older people: systematic review. J Adv Nurs. 2005;52(1):79-90. https://doi.org/10.1111/j.1365-2648.2005.03557.x
20. Marcantonio ER. Delirium in hospitalized older adults. N Engl J Med. 2017;377(15):1456-1466. https://doi.org/10.1056/NEJMcp1605501.
21. Park Y, Bateman BT, Kim DH, et al. Use of haloperidol versus atypical antipsychotics and risk of in-hospital death in patients with acute myocardial infarction: cohort study. BMJ. 2018;360. https://doi.org/10.1136/bmj.k1218.
1. American Psychiatric Association. DSM-5 Task Force. Diagnostic and statistical manual of mental disorders: DSM-5. 5th ed. Washington, D.C.: American Psychiatric Association; 2013.
2. Lonergan E, Luxenberg J, Areosa Sastre A. Benzodiazepines for delirium. Cochrane Database Syst Rev. 2009;(4):CD006379. https://doi.org/10.1002/14651858.CD006379.pub2.
3. Overshott R, Karim S, Burns A. Cholinesterase inhibitors for delirium. Cochrane Database Syst Rev. 2008;(1):CD005317. https://doi.org/10.1002/14651858.CD005317.pub2.
4. Zaal IJ, Devlin JW, Hazelbag M, et al. Benzodiazepine-associated delirium in critically ill adults. Intensive Care Med. 2015;41(12):2130-2137. https://doi.org/10.1007/s00134-015-4063-z.
5. Maldonado JR. Neuropathogenesis of delirium: review of current etiologic theories and common pathways. Am J Geriatr Psychiatry. 2013;21(12):1190-1222. https://doi.org/10.1016/j.jagp.2013.09.005.
6. Kalisvaart KJ, de Jonghe JF, Bogaards MJ, et al. Haloperidol prophylaxis for elderly hip-surgery patients at risk for delirium: a randomized placebo-controlled study. J Am Geriatr Soc. 2005;53(10):1658-1666. https://doi.org/10.1111/j.1532-5415.2005.53503.x
7. Siddiqi N, Stockdale R, Britton AM, Holmes J. Interventions for preventing delirium in hospitalized patients. Cochrane Database Syst Rev. 2007;(2):CD005563. https://doi.org/10.1002/14651858.CD005563.pub2
8. Tahir TA, Eeles E, Karapareddy V, et al. A randomized controlled trial of quetiapine versus placebo in the treatment of delirium. J Psychosom Res. 2010;69(5):485-490. https://doi.org/10.1016/j.jpsychores.2010.05.006.
9. Loh KP, Ramdass S, Garb JL, Brennan MJ, Lindenauer PK, Lagu T. From hospital to community: use of antipsychotics in hospitalized elders. J Hosp Med. 2014;9(12):802-804. https://doi.org/10.1002/jhm.2277.
10. Herzig SJ, Rothberg MB, Guess JR, Gurwitz JH, Marcantonio ER. Antipsychotic medication utilization in nonpsychiatric hospitalizations. J Hosp Med. 2016;11(8):543-549. https://doi.org/10.1002/jhm.2596.
11. Neufeld KJ, Yue J, Robinson TN, Inouye SK, Needham DM. Antipsychotic medication for prevention and treatment of delirium in hospitalized adults: a systematic review and meta-analysis. J Am Geriatr Soc. 2016;64(4):705-714. https://doi.org/10.1111/jgs.14076.
12. American Geriatrics Society Expert Panel on Postoperative Delirium in Older A. American Geriatrics Society abstracted clinical practice guideline for postoperative delirium in older adults. J Am Geriatr Soc. 2015;63(1):142-150. https://doi.org/10.1111/jgs.13281
13. Agar MR, Lawlor PG, Quinn S, et al. Efficacy of oral risperidone, haloperidol, or placebo for symptoms of delirium among patients in palliative care: a randomized clinical trial. JAMA Intern Med. 2017;177(1):34-42. https://doi.org/10.1001/jamainternmed.2016.7491.
14. Hatta K, Kishi Y, Wada K, et al. Antipsychotics for delirium in the general hospital setting in consecutive 2453 inpatients: a prospective observational study. Int J Geriatr Psychiatry. 2014;29(3):253-262. https://doi.org/10.1002/gps.3999.
15. Herzig SJ, LaSalvia MT, Naidus E, et al. Antipsychotics and the risk of aspiration pneumonia in individuals hospitalized for nonpsychiatric conditions: a cohort study. J Am Geriatr Soc. 2017;65(12):2580-2586. https://doi.org/10.1111/jgs.15066.
16. Jeste DV, Blazer D, Casey D, et al. ACNP White Paper: update on use of antipsychotic drugs in elderly persons with dementia. Neuropsychopharmacology. 2008;33(5):957-970. https://doi.org/10.1038/sj.npp.1301492
17. Hui D, Frisbee-Hume S, Wilson A, et al. Effect of lorazepam with haloperidol vs haloperidol alone on agitated delirium in patients with advanced cancer receiving palliative care: a randomized clinical trial. JAMA. 2017;318(11):1047-1056. https://doi.org/10.1001/jama.2017.11468.
18. Inouye SK, Bogardus ST, Jr., Charpentier PA, et al. A multicomponent intervention to prevent delirium in hospitalized older patients. N Engl J Med. 1999;340(9):669-676. https://doi.org/10.1056/NEJM199903043400901
19. Milisen K, Lemiengre J, Braes T, Foreman MD. Multicomponent intervention strategies for managing delirium in hospitalized older people: systematic review. J Adv Nurs. 2005;52(1):79-90. https://doi.org/10.1111/j.1365-2648.2005.03557.x
20. Marcantonio ER. Delirium in hospitalized older adults. N Engl J Med. 2017;377(15):1456-1466. https://doi.org/10.1056/NEJMcp1605501.
21. Park Y, Bateman BT, Kim DH, et al. Use of haloperidol versus atypical antipsychotics and risk of in-hospital death in patients with acute myocardial infarction: cohort study. BMJ. 2018;360. https://doi.org/10.1136/bmj.k1218.
Amit K Pahwa, MD, FAAP; E-mail: apahwa1@jhmi.edu; Telephone: 410-502-1934.
© 2019 Society of Hospital Medicine
Things We Do for No Reason: Neuroimaging for Hospitalized Patients with Delirium
Inspired by the ABIM Foundation’s Choosing Wisely® campaign, the “Things We Do for No Reason” (TWDFNR) series reviews practices that have become common parts of hospital care but may provide little value to our patients. Practices reviewed in the TWDFNR series do not represent “black and white” conclusions or clinical practice standards but are meant as a starting place for research and active discussions among hospitalists and patients. We invite you to be part of that discussion.
CLINICAL SCENARIO
A 67-year-old woman with a history of hypertension and osteoarthritis was hospitalized for fever, flank pain, and dysuria with pyuria on urinalysis. She was diagnosed with acute pyelonephritis and started ceftriaxone, ondansetron for nausea, and oxycodone for pain. On hospital day two, she developed acute confusion that waxed and waned in severity throughout the day. On examination, she appeared mildly agitated, inattentive, and was noted to pick at her linens and garment. She was oriented to person only and had a nonfocal neurologic examination. Her nurse reported no recent falls or trauma. As part of the patient’s evaluation, her attending physician ordered a head computed tomography (CT) scan.
BACKGROUND
Delirium is commonly diagnosed in hospitalized patients. It has a prevalence of 29%-64% and is associated with longer lengths of stay, higher mortality, and costs of over $164 billion per year in the United States.1 While a number of practice guidelines have been created to help guide delirium diagnosis and management, there is not a clear consensus on when neuroimaging should be performed during the evaluation.2-4 It should also be noted that numerous guidelines for delirium management exist, with variable quality and a heavy reliance on expert opinion.5 Perhaps due to this lack of consensus, neuroimaging is performed in 33% to 67% of hospitalized patients with delirium.6,7
WHY YOU MAY THINK NEUROIMAGING IS HELPFUL IN EVALUATING UNDIFFERENTIATED HOSPITALIZED PATIENTS WITH DELIRIUM
Delirium is known to be associated with intracranial processes. For example, delirium occurs in 13% to 48% of patients with acute stroke8 and conversely 7% of patients with new confusion evaluated in emergency departments or inpatient settings were found to have an acute stroke.9 The inclusion of neuroimaging as part of a delirium evaluation is supported in certain circumstances, such as in patients with recent falls, focal neurologic signs (including papilledema), systemic anticoagulation,2 or increased risk of intracranial processes such as metastatic malignancy.4
WHY NEUROIMAGING IS NOT HELPFUL IN EVALUATING UNDIFFERENTIATED HOSPITALIZED PATIENTS WITH DELIRIUM
A number of studies have evaluated the diagnostic yield of neuroimaging in hospitalized patients with delirium (Table).6,7,10,11 Two studies included patients with delirium that developed after hospitalization10,11 and two included patients with delirium at admission.6,7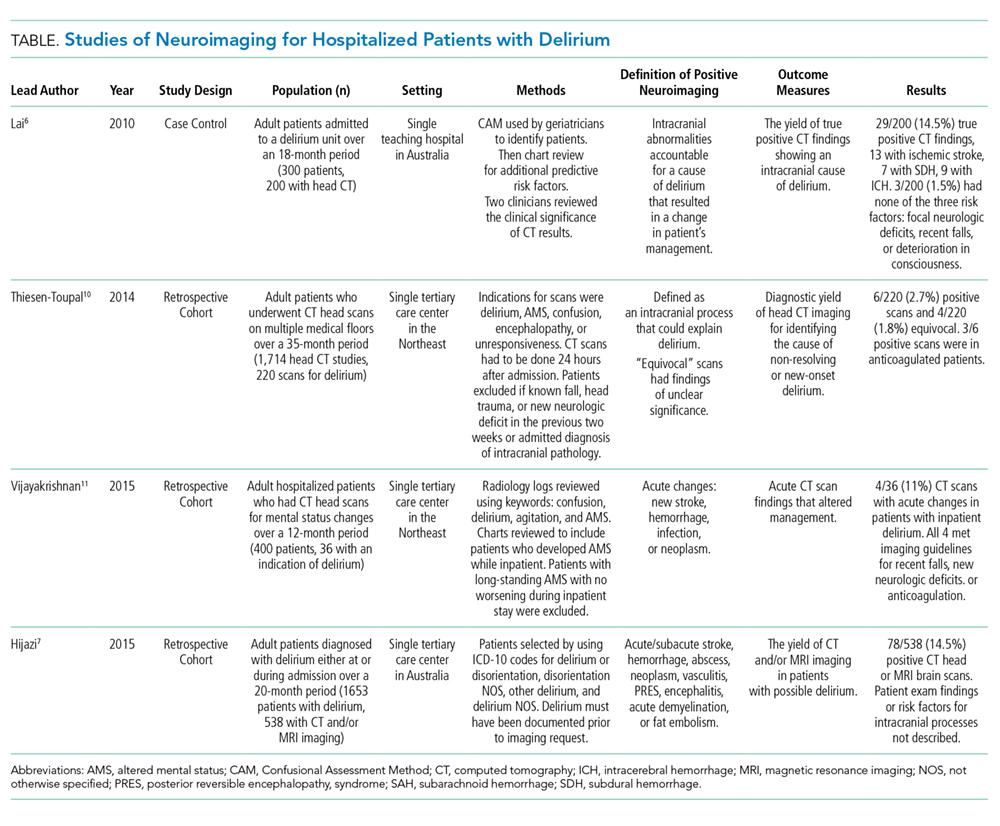
Theisen-Toupal et al. conducted a retrospective study of 220 hospitalized general medical patients who underwent head CT scans for an indication of delirium, altered mental status, confusion, encephalopathy, somnolence or unresponsiveness.10 Patients were excluded if they had a history of falls, head trauma, or new neurologic deficits in the preceding two weeks or if the admitting diagnosis was stroke or cerebral hemorrhage. Additionally, the authors limited patients to those who developed delirium 24 hours or more after admission. There were 6/220 (2.7%) patients identified with an acute intracranial process. Of these six patients, three were receiving anticoagulation. An additional 4/220 (1.8%) head CT scans were identified as equivocal, prompting further neuroimaging, which ultimately showed chronic findings.
Vijayakrishnan et al. performed a retrospective review of 400 hospitalized patients who underwent inpatient CT scans, then limited to those with new delirium.11 They identified 36 patients, of which four (11%) had acute findings on CT: one case each of acute hemorrhage, subdural hematoma, brain metastases, and septic emboli. The authors state “all the four patients had preimaging clinical symptoms and signs, which warranted imaging as per guidelines suggested by the British Geriatrics Society and the Australian and New Zealand Society for Geriatric Medicine,” though they do not provide further details. The strength of this paper is that it isolated patients who developed delirium while hospitalized; however, conclusions were limited by the small sample size.
Lai et al.’s case-control study evaluated 300 consecutive patients admitted to a delirium unit over 18 months.6 Of these 300 patients, 200 (67%) had CT performed; 29/200 (14.5%) had intracranial findings on CT that explained their delirium, including 13 ischemic strokes, seven subdural hemorrhages, nine intracerebral hemorrhages, and three additional ischemic strokes that evolved on follow-up imaging but were not present on the initial scans. The authors performed univariate and multivariate analyses to identify risk factors for an intracranial cause of delirium. Only 3/29 patients with a positive scan did not have one of three main risk factors the authors identified: a fall in the preceding two weeks, new neurologic findings, or sudden deterioration of consciousness. It should be noted that authors did not define “deterioration of consciousness” and that all patients had confusion on admission to the unit, rather than developing during hospitalization.
Hijazi et al. conducted a retrospective cohort study over a 20-month period of 1,653 patients with delirium at the time of admission or during their hospitalization. Patients with delirium due to drug or medication withdrawal or “psychiatric reasons” were excluded. Overall, 538 (32.5%) patients underwent CT, MRI or both, and 78 (14.5%) patients had a positive finding on neuroimaging. This study’s 14.5 % overall yield matches that of Lai et al. Unfortunately, the study included all patients with delirium and did not report the rates of fall, neurologic deficits, and/or use of anticoagulation among those with positive neuroimaging. This limits the generalizability of the findings to a cohort of patients without intracranial pathology risk factors.
The reported yield of neuroimaging for hospitalized patients with delirium ranged from 2.7% to 14.5% across studies. However, in studies taking into account specific patient risk factors; the reported yields in patients without focal neurologic findings, new decline in mental status, systemic anticoagulation, or recent falls were 0%,11 1.4%,10 and 1.5%.6 While a rate of 1.5% may appear high for a serious outcome such as stroke or intracranial bleeding, it is comparable to rates reported for missed major cardiac events in clinical algorithms for evaluating chest pain.12 It should also be noted that neuroimaging is imperfect for acute stroke, and thus the positive or negative predictive value may be poor in the setting of low prevalence. For example, for detection of any acute stroke, the sensitivity/specificity of MRI and CT are 83%/97% and 26%/98% respectively.13
Neuroimaging is expensive and has risks. The average charge for a head CT is approximately $1,400 at academic institutions.14 Moreover, computed tomography exposes patients to significant radiation and up to 2% of malignancies in the United States may be attributable to prior tomography exposure.15 Additionally, there are non-negligible rates of incidental findings during neuroimaging, 1% for CT16 and 2.7%-13.7% for MRI,17,18 which may result in further evaluation or treatment that causes significant patient anxiety. Obtaining neuroimaging on delirious patients can be time consuming and labor intensive, which could delay care to other patients. Additionally, sedating medications are often administered to agitated patients prior to imaging, which risk worsening delirium. Ordering neuroimaging for all patients with acute delirium, therefore, exposes the large majority to unnecessary costs and potential harms.
WHEN NEUROIMAGING TO EVALUATE DELIRIUM IN HOSPITALIZED PATIENTS COULD BE REASONABLE
The diagnostic yield of head CT in the evaluation of delirium is significantly higher in patients with specific risk factors. Lai et al. found adjusted odds ratios for abnormal CT of 18.2 in patients with new focal deficits, 5.6 with a fall in the preceding two weeks and 4.6 in patients with deterioration in consciousness. Patients with systemic anticoagulation had higher unadjusted, (OR 2.4) though not adjusted odds of having an abnormal CT.6 Thiesen-Toupal et al. excluded patients with recent falls or neurologic deficits but reported that three out of six delirious patients with abnormal neuroimaging were anticoagulated.10 Vijayakrishnan et al. found that all four delirious patients with intracranial findings met guideline criteria for neuroimaging.11 Thus, current recommendations for neuroimaging in delirious patients with falls, focal neurologic deficits, or systemic anticoagulation are appropriate. In situations when a provider lacks an accurate history and is unable to determine if risk factors are present (for example a confused patient found sitting on the floor next to the bed), it may also be reasonable to consider neuroimaging.
Data are limited, but some authors advocate for neuroimaging in cases of delirium that do not improve with treatment.6 Additionally, it may be reasonable to consider neuroimaging in delirium patients with predispositions to embolic or metastatic intracranial processes such as endovascular infections and certain malignancies.4
WHAT YOU SHOULD DO INSTEAD OF NEUROIMAGING TO EVALUATE DELIRIUM IN HOSPITALIZED PATIENTS
Hospitalized patients with acute confusion should be assessed for delirium with a validated instrument such as the Confusion Assessment Method (CAM).19,20 The original CAM included several components: acute change in mental status with a fluctuating course and inattention, plus either disorganized thinking and/or altered level of consciousness. Multiple delirium assessment tools have been created and validated, all of which include inattention as a required feature. A recent hospital-based study using a two item bedside test asking the patient to name the day of the week and list the months of the year backwards detected delirium with a sensitivity of 93% and specificity of 64%.21 Once the diagnosis of delirium is established, evaluation should begin with a careful history and physical examination focused on the identification of risk factors such as physical restraints, indwelling urinary catheters, and drugs known to precipitate delirium, particularly those with withdrawal potential, anticholinergic properties, and sedative-hypnotic agents.22-24 Delirium may be the first harbinger of serious medical illness and specific testing should be guided by clinical suspicion. In general, a thorough physical examination should look for focal neurologic deficits, hypoxia, signs of infection, and other inflammatory or painful processes that could precipitate delirium.25 Targeted laboratory evaluation may include a basic metabolic panel to identify electrolyte (including calcium) and metabolic derangements, complete blood count, and urinalysis if infection is suspected.
RECOMMENDATIONS
- Use a validated instrument such as CAM to evaluate hospitalized patients who develop altered mental status.
- Delirious patients should undergo a thorough history including a review of medications, physical exam, and targeted laboratory testing aimed at identifying common risk factors and precipitants of delirium that should be addressed.
- Perform neuroimaging if there is a history of fall or head trauma in the preceding two weeks, any new focal abnormalities on neurologic exam or if the patient is receiving systemic anticoagulation.
- It may be reasonable to consider neuroimaging for patients with an atypical course of delirium, such as a sudden decline in the level of consciousness, persistence despite addressing identified factors, or if there is a high degree of suspicion for embolic or metastatic processes.
CONCLUSIONS
Performing neuroimaging in undifferentiated patients who develop delirium while hospitalized has a low diagnostic yield, is costly, and is potentially harmful. Neuroimaging should be reserved for those with identified risk factors for intracranial pathology. For the patient described in the initial vignette with no risk factors for intracranial cause, neuroimaging would be unlikely to contribute to her care. To change provider beliefs and behaviors regarding neuroimaging, prospective studies evaluating guideline implementation are needed. However, based on the current evidence, neuroimaging should be reserved for those with identified risk factors.
Do you think this is a low-value practice? Is this truly a “Thing We Do for No Reason?” Share what you do in your practice and join in the conversation online by retweeting it on Twitter (#TWDFNR) and liking it on Facebook. We invite you to propose ideas for other “Things We Do for No Reason” topics by e-mailing TWDFNR@hospitalmedicine.org.
Disclosures
The authors have no conflicts of interest relevant to this article to disclose.
1. Inouye SK, Westendorp RG, Saczynski JS. Delirium in elderly people. Lancet. 2014;383(9920):911-922. doi: 10.1016/S0140-6736(13)60688-1. PubMed
2. Clinical practice guidelines for the management of delirium in older people. 2006; https://www2.health.vic.gov.au/Api/downloadmedia/%7BDAA8404B-FEE7-4BDA-8A1E-A32494783B7F%7D. Accessed June 4, 2018.
3. Delirium: prevention, diagnosis and management. NICE Guidance 2010; https://www.nice.org.uk/guidance/cg103. Accessed June 4, 2018.
4. Michaud L, Bula C, Berney A, et al. Delirium: guidelines for general hospitals. J Psychosom Res. 2007;62(3):371-383. doi: 10.1016/j.jpsychores.2006.10.004. PubMed
5. Bush SH, Marchington KL, Agar M, Davis DH, Sikora L, Tsang TW. Quality of clinical practice guidelines in delirium: a systematic appraisal. BMJ Open. 2017;7(3):e013809. doi: 10.1136/bmjopen-2016-013809. PubMed
6. Lai MM, Wong Tin Niam DM. Intracranial cause of delirium: computed tomography yield and predictive factors. Intern Med J. 2012;42(4):422-427. doi: 10.1111/j.1445-5994.2010.02400.x. PubMed
7. Hijazi Z, Lange P, Watson R, Maier AB. The use of cerebral imaging for investigating delirium aetiology. Eur J Intern Med. 2018;52:35-39. doi: 10.1016/j.ejim.2018.01.024. PubMed
8. Oldenbeuving AW, de Kort PL, Jansen BP, Roks G, Kappelle LJ. Delirium in acute stroke: a review. Int J Stroke. 2007;2(4):270-275. doi: 10.1111/j.1747-4949.2007.00163.x. PubMed
9. Benbadis SR, Sila CA, Cristea RL. Mental status changes and stroke. J Stroke Cerebrovasc Dis. 1994;4(4):216-219. doi: 10.1016/S1052-3057(10)80093-X. PubMed
10. Theisen-Toupal J, Breu AC, Mattison ML, Arnaout R. Diagnostic yield of head computed tomography for the hospitalized medical patient with delirium. J Hosp Med. 2014;9(8):497-501. doi: 10.1002/jhm.2198. PubMed
11. Vijayakrishnan R, Ramasubramanian A, Dhand S. Utility of head CT scan for acute inpatient delirium. Hosp Top. 2015;93(1):9-12. doi: 10.1080/00185868.2015.1012928. PubMed
12. Backus BE, Six AJ, Kelder JC, et al. A prospective validation of the HEART score for chest pain patients at the emergency department. Int J Cardiol. 2013;168(3):2153-2158. doi: 10.1016/j.ijcard.2013.01.255. PubMed
13. Chalela JA, Kidwell CS, Nentwich LM, et al. Magnetic resonance imaging and computed tomography in emergency assessment of patients with suspected acute stroke: a prospective comparison. Lancet. 2007;369(9558):293-298. doi: 10.1016/S0140-6736(07)60151-2. PubMed
14. Paul AB, Oklu R, Saini S, Prabhakar AM. How much is that head CT? Price transparency and variability in radiology. J Am Coll Radiol. 2015;12(5):453-457. doi: 10.1016/j.jacr.2014.12.016. PubMed
15. Brenner DJ, Hall EJ. Computed tomography--an increasing source of radiation exposure. N Engl J Med. 2007;357(22):2277-2284. doi: 10.1056/NEJMra072149. PubMed
16. Eskandary H, Sabbagh M, Khajehpour F, Eskandari M. Incidental findings in brain computed tomography scans of 3000 head trauma patients. Surg Neurol. 2005;63(6):550-553; discussion 553. doi: 10.1016/j.surneu.2004.07.049. PubMed
17. Vernooij MW, Ikram MA, Tanghe HL, et al. Incidental findings on brain MRI in the general population. N Engl J Med. 2007;357(18):1821-1828. doi: 10.1056/NEJMoa070972. PubMed
18. Morris Z, Whiteley WN, Longstreth WT, Jr., et al. Incidental findings on brain magnetic resonance imaging: systematic review and meta-analysis. BMJ. 2009;339:b3016. doi: 10.1136/bmj.b3016. PubMed
19. Inouye SK, van Dyck CH, Alessi CA, Balkin S, Siegal AP, Horwitz RI. Clarifying confusion: the confusion assessment method. A new method for detection of delirium. Ann Intern Med. 1990;113(12):941-948. doi: 10.7326/0003-4819-113-12-941. PubMed
20. Wei LA, Fearing MA, Sternberg EJ, Inouye SK. The Confusion Assessment Method: a systematic review of current usage. J Am Geriatr Soc. 2008;56(5):823-830. doi: 10.1111/j.1532-5415.2008.01674.x. PubMed
21. Fick DM, Inouye SK, Guess J, et al. Preliminary development of an ultrabrief two-item bedside test for delirium. J Hosp Med. 2015;10(10):645-650. doi: 10.1002/jhm.2418. PubMed
22. Tune L, Carr S, Hoag E, Cooper T. Anticholinergic effects of drugs commonly prescribed for the elderly: potential means for assessing the risk of delirium. Am J Psychiatry. 1992;149(10):1393-1394. doi: 10.1176/ajp.149.10.1393. PubMed
23. Inouye SK, Schlesinger MJ, Lydon TJ. Delirium: a symptom of how hospital care is failing older persons and a window to improve the quality of hospital care. Am J Med. 1999;106(5):565-573. doi: 0.1016/S0002-9343(99)00070-4. PubMed
24. Marcantonio ER. Delirium in hospitalized older adults. N Engl J Med. 2017;377(15):1456-1466. doi: 10.1056/NEJMc1714932. PubMed
25. Inouye SK, Charpentier PA. Precipitating factors for delirium in hospitalized elderly persons. Predictive model and interrelationship with baseline vulnerability. JAMA. 1996;275(11):852-857. doi: 10.1001/jama.1996.03530350034031. PubMed
Inspired by the ABIM Foundation’s Choosing Wisely® campaign, the “Things We Do for No Reason” (TWDFNR) series reviews practices that have become common parts of hospital care but may provide little value to our patients. Practices reviewed in the TWDFNR series do not represent “black and white” conclusions or clinical practice standards but are meant as a starting place for research and active discussions among hospitalists and patients. We invite you to be part of that discussion.
CLINICAL SCENARIO
A 67-year-old woman with a history of hypertension and osteoarthritis was hospitalized for fever, flank pain, and dysuria with pyuria on urinalysis. She was diagnosed with acute pyelonephritis and started ceftriaxone, ondansetron for nausea, and oxycodone for pain. On hospital day two, she developed acute confusion that waxed and waned in severity throughout the day. On examination, she appeared mildly agitated, inattentive, and was noted to pick at her linens and garment. She was oriented to person only and had a nonfocal neurologic examination. Her nurse reported no recent falls or trauma. As part of the patient’s evaluation, her attending physician ordered a head computed tomography (CT) scan.
BACKGROUND
Delirium is commonly diagnosed in hospitalized patients. It has a prevalence of 29%-64% and is associated with longer lengths of stay, higher mortality, and costs of over $164 billion per year in the United States.1 While a number of practice guidelines have been created to help guide delirium diagnosis and management, there is not a clear consensus on when neuroimaging should be performed during the evaluation.2-4 It should also be noted that numerous guidelines for delirium management exist, with variable quality and a heavy reliance on expert opinion.5 Perhaps due to this lack of consensus, neuroimaging is performed in 33% to 67% of hospitalized patients with delirium.6,7
WHY YOU MAY THINK NEUROIMAGING IS HELPFUL IN EVALUATING UNDIFFERENTIATED HOSPITALIZED PATIENTS WITH DELIRIUM
Delirium is known to be associated with intracranial processes. For example, delirium occurs in 13% to 48% of patients with acute stroke8 and conversely 7% of patients with new confusion evaluated in emergency departments or inpatient settings were found to have an acute stroke.9 The inclusion of neuroimaging as part of a delirium evaluation is supported in certain circumstances, such as in patients with recent falls, focal neurologic signs (including papilledema), systemic anticoagulation,2 or increased risk of intracranial processes such as metastatic malignancy.4
WHY NEUROIMAGING IS NOT HELPFUL IN EVALUATING UNDIFFERENTIATED HOSPITALIZED PATIENTS WITH DELIRIUM
A number of studies have evaluated the diagnostic yield of neuroimaging in hospitalized patients with delirium (Table).6,7,10,11 Two studies included patients with delirium that developed after hospitalization10,11 and two included patients with delirium at admission.6,7
Theisen-Toupal et al. conducted a retrospective study of 220 hospitalized general medical patients who underwent head CT scans for an indication of delirium, altered mental status, confusion, encephalopathy, somnolence or unresponsiveness.10 Patients were excluded if they had a history of falls, head trauma, or new neurologic deficits in the preceding two weeks or if the admitting diagnosis was stroke or cerebral hemorrhage. Additionally, the authors limited patients to those who developed delirium 24 hours or more after admission. There were 6/220 (2.7%) patients identified with an acute intracranial process. Of these six patients, three were receiving anticoagulation. An additional 4/220 (1.8%) head CT scans were identified as equivocal, prompting further neuroimaging, which ultimately showed chronic findings.
Vijayakrishnan et al. performed a retrospective review of 400 hospitalized patients who underwent inpatient CT scans, then limited to those with new delirium.11 They identified 36 patients, of which four (11%) had acute findings on CT: one case each of acute hemorrhage, subdural hematoma, brain metastases, and septic emboli. The authors state “all the four patients had preimaging clinical symptoms and signs, which warranted imaging as per guidelines suggested by the British Geriatrics Society and the Australian and New Zealand Society for Geriatric Medicine,” though they do not provide further details. The strength of this paper is that it isolated patients who developed delirium while hospitalized; however, conclusions were limited by the small sample size.
Lai et al.’s case-control study evaluated 300 consecutive patients admitted to a delirium unit over 18 months.6 Of these 300 patients, 200 (67%) had CT performed; 29/200 (14.5%) had intracranial findings on CT that explained their delirium, including 13 ischemic strokes, seven subdural hemorrhages, nine intracerebral hemorrhages, and three additional ischemic strokes that evolved on follow-up imaging but were not present on the initial scans. The authors performed univariate and multivariate analyses to identify risk factors for an intracranial cause of delirium. Only 3/29 patients with a positive scan did not have one of three main risk factors the authors identified: a fall in the preceding two weeks, new neurologic findings, or sudden deterioration of consciousness. It should be noted that authors did not define “deterioration of consciousness” and that all patients had confusion on admission to the unit, rather than developing during hospitalization.
Hijazi et al. conducted a retrospective cohort study over a 20-month period of 1,653 patients with delirium at the time of admission or during their hospitalization. Patients with delirium due to drug or medication withdrawal or “psychiatric reasons” were excluded. Overall, 538 (32.5%) patients underwent CT, MRI or both, and 78 (14.5%) patients had a positive finding on neuroimaging. This study’s 14.5 % overall yield matches that of Lai et al. Unfortunately, the study included all patients with delirium and did not report the rates of fall, neurologic deficits, and/or use of anticoagulation among those with positive neuroimaging. This limits the generalizability of the findings to a cohort of patients without intracranial pathology risk factors.
The reported yield of neuroimaging for hospitalized patients with delirium ranged from 2.7% to 14.5% across studies. However, in studies taking into account specific patient risk factors; the reported yields in patients without focal neurologic findings, new decline in mental status, systemic anticoagulation, or recent falls were 0%,11 1.4%,10 and 1.5%.6 While a rate of 1.5% may appear high for a serious outcome such as stroke or intracranial bleeding, it is comparable to rates reported for missed major cardiac events in clinical algorithms for evaluating chest pain.12 It should also be noted that neuroimaging is imperfect for acute stroke, and thus the positive or negative predictive value may be poor in the setting of low prevalence. For example, for detection of any acute stroke, the sensitivity/specificity of MRI and CT are 83%/97% and 26%/98% respectively.13
Neuroimaging is expensive and has risks. The average charge for a head CT is approximately $1,400 at academic institutions.14 Moreover, computed tomography exposes patients to significant radiation and up to 2% of malignancies in the United States may be attributable to prior tomography exposure.15 Additionally, there are non-negligible rates of incidental findings during neuroimaging, 1% for CT16 and 2.7%-13.7% for MRI,17,18 which may result in further evaluation or treatment that causes significant patient anxiety. Obtaining neuroimaging on delirious patients can be time consuming and labor intensive, which could delay care to other patients. Additionally, sedating medications are often administered to agitated patients prior to imaging, which risk worsening delirium. Ordering neuroimaging for all patients with acute delirium, therefore, exposes the large majority to unnecessary costs and potential harms.
WHEN NEUROIMAGING TO EVALUATE DELIRIUM IN HOSPITALIZED PATIENTS COULD BE REASONABLE
The diagnostic yield of head CT in the evaluation of delirium is significantly higher in patients with specific risk factors. Lai et al. found adjusted odds ratios for abnormal CT of 18.2 in patients with new focal deficits, 5.6 with a fall in the preceding two weeks and 4.6 in patients with deterioration in consciousness. Patients with systemic anticoagulation had higher unadjusted, (OR 2.4) though not adjusted odds of having an abnormal CT.6 Thiesen-Toupal et al. excluded patients with recent falls or neurologic deficits but reported that three out of six delirious patients with abnormal neuroimaging were anticoagulated.10 Vijayakrishnan et al. found that all four delirious patients with intracranial findings met guideline criteria for neuroimaging.11 Thus, current recommendations for neuroimaging in delirious patients with falls, focal neurologic deficits, or systemic anticoagulation are appropriate. In situations when a provider lacks an accurate history and is unable to determine if risk factors are present (for example a confused patient found sitting on the floor next to the bed), it may also be reasonable to consider neuroimaging.
Data are limited, but some authors advocate for neuroimaging in cases of delirium that do not improve with treatment.6 Additionally, it may be reasonable to consider neuroimaging in delirium patients with predispositions to embolic or metastatic intracranial processes such as endovascular infections and certain malignancies.4
WHAT YOU SHOULD DO INSTEAD OF NEUROIMAGING TO EVALUATE DELIRIUM IN HOSPITALIZED PATIENTS
Hospitalized patients with acute confusion should be assessed for delirium with a validated instrument such as the Confusion Assessment Method (CAM).19,20 The original CAM included several components: acute change in mental status with a fluctuating course and inattention, plus either disorganized thinking and/or altered level of consciousness. Multiple delirium assessment tools have been created and validated, all of which include inattention as a required feature. A recent hospital-based study using a two item bedside test asking the patient to name the day of the week and list the months of the year backwards detected delirium with a sensitivity of 93% and specificity of 64%.21 Once the diagnosis of delirium is established, evaluation should begin with a careful history and physical examination focused on the identification of risk factors such as physical restraints, indwelling urinary catheters, and drugs known to precipitate delirium, particularly those with withdrawal potential, anticholinergic properties, and sedative-hypnotic agents.22-24 Delirium may be the first harbinger of serious medical illness and specific testing should be guided by clinical suspicion. In general, a thorough physical examination should look for focal neurologic deficits, hypoxia, signs of infection, and other inflammatory or painful processes that could precipitate delirium.25 Targeted laboratory evaluation may include a basic metabolic panel to identify electrolyte (including calcium) and metabolic derangements, complete blood count, and urinalysis if infection is suspected.
RECOMMENDATIONS
- Use a validated instrument such as CAM to evaluate hospitalized patients who develop altered mental status.
- Delirious patients should undergo a thorough history including a review of medications, physical exam, and targeted laboratory testing aimed at identifying common risk factors and precipitants of delirium that should be addressed.
- Perform neuroimaging if there is a history of fall or head trauma in the preceding two weeks, any new focal abnormalities on neurologic exam or if the patient is receiving systemic anticoagulation.
- It may be reasonable to consider neuroimaging for patients with an atypical course of delirium, such as a sudden decline in the level of consciousness, persistence despite addressing identified factors, or if there is a high degree of suspicion for embolic or metastatic processes.
CONCLUSIONS
Performing neuroimaging in undifferentiated patients who develop delirium while hospitalized has a low diagnostic yield, is costly, and is potentially harmful. Neuroimaging should be reserved for those with identified risk factors for intracranial pathology. For the patient described in the initial vignette with no risk factors for intracranial cause, neuroimaging would be unlikely to contribute to her care. To change provider beliefs and behaviors regarding neuroimaging, prospective studies evaluating guideline implementation are needed. However, based on the current evidence, neuroimaging should be reserved for those with identified risk factors.
Do you think this is a low-value practice? Is this truly a “Thing We Do for No Reason?” Share what you do in your practice and join in the conversation online by retweeting it on Twitter (#TWDFNR) and liking it on Facebook. We invite you to propose ideas for other “Things We Do for No Reason” topics by e-mailing TWDFNR@hospitalmedicine.org.
Disclosures
The authors have no conflicts of interest relevant to this article to disclose.
Inspired by the ABIM Foundation’s Choosing Wisely® campaign, the “Things We Do for No Reason” (TWDFNR) series reviews practices that have become common parts of hospital care but may provide little value to our patients. Practices reviewed in the TWDFNR series do not represent “black and white” conclusions or clinical practice standards but are meant as a starting place for research and active discussions among hospitalists and patients. We invite you to be part of that discussion.
CLINICAL SCENARIO
A 67-year-old woman with a history of hypertension and osteoarthritis was hospitalized for fever, flank pain, and dysuria with pyuria on urinalysis. She was diagnosed with acute pyelonephritis and started ceftriaxone, ondansetron for nausea, and oxycodone for pain. On hospital day two, she developed acute confusion that waxed and waned in severity throughout the day. On examination, she appeared mildly agitated, inattentive, and was noted to pick at her linens and garment. She was oriented to person only and had a nonfocal neurologic examination. Her nurse reported no recent falls or trauma. As part of the patient’s evaluation, her attending physician ordered a head computed tomography (CT) scan.
BACKGROUND
Delirium is commonly diagnosed in hospitalized patients. It has a prevalence of 29%-64% and is associated with longer lengths of stay, higher mortality, and costs of over $164 billion per year in the United States.1 While a number of practice guidelines have been created to help guide delirium diagnosis and management, there is not a clear consensus on when neuroimaging should be performed during the evaluation.2-4 It should also be noted that numerous guidelines for delirium management exist, with variable quality and a heavy reliance on expert opinion.5 Perhaps due to this lack of consensus, neuroimaging is performed in 33% to 67% of hospitalized patients with delirium.6,7
WHY YOU MAY THINK NEUROIMAGING IS HELPFUL IN EVALUATING UNDIFFERENTIATED HOSPITALIZED PATIENTS WITH DELIRIUM
Delirium is known to be associated with intracranial processes. For example, delirium occurs in 13% to 48% of patients with acute stroke8 and conversely 7% of patients with new confusion evaluated in emergency departments or inpatient settings were found to have an acute stroke.9 The inclusion of neuroimaging as part of a delirium evaluation is supported in certain circumstances, such as in patients with recent falls, focal neurologic signs (including papilledema), systemic anticoagulation,2 or increased risk of intracranial processes such as metastatic malignancy.4
WHY NEUROIMAGING IS NOT HELPFUL IN EVALUATING UNDIFFERENTIATED HOSPITALIZED PATIENTS WITH DELIRIUM
A number of studies have evaluated the diagnostic yield of neuroimaging in hospitalized patients with delirium (Table).6,7,10,11 Two studies included patients with delirium that developed after hospitalization10,11 and two included patients with delirium at admission.6,7
Theisen-Toupal et al. conducted a retrospective study of 220 hospitalized general medical patients who underwent head CT scans for an indication of delirium, altered mental status, confusion, encephalopathy, somnolence or unresponsiveness.10 Patients were excluded if they had a history of falls, head trauma, or new neurologic deficits in the preceding two weeks or if the admitting diagnosis was stroke or cerebral hemorrhage. Additionally, the authors limited patients to those who developed delirium 24 hours or more after admission. There were 6/220 (2.7%) patients identified with an acute intracranial process. Of these six patients, three were receiving anticoagulation. An additional 4/220 (1.8%) head CT scans were identified as equivocal, prompting further neuroimaging, which ultimately showed chronic findings.
Vijayakrishnan et al. performed a retrospective review of 400 hospitalized patients who underwent inpatient CT scans, then limited to those with new delirium.11 They identified 36 patients, of which four (11%) had acute findings on CT: one case each of acute hemorrhage, subdural hematoma, brain metastases, and septic emboli. The authors state “all the four patients had preimaging clinical symptoms and signs, which warranted imaging as per guidelines suggested by the British Geriatrics Society and the Australian and New Zealand Society for Geriatric Medicine,” though they do not provide further details. The strength of this paper is that it isolated patients who developed delirium while hospitalized; however, conclusions were limited by the small sample size.
Lai et al.’s case-control study evaluated 300 consecutive patients admitted to a delirium unit over 18 months.6 Of these 300 patients, 200 (67%) had CT performed; 29/200 (14.5%) had intracranial findings on CT that explained their delirium, including 13 ischemic strokes, seven subdural hemorrhages, nine intracerebral hemorrhages, and three additional ischemic strokes that evolved on follow-up imaging but were not present on the initial scans. The authors performed univariate and multivariate analyses to identify risk factors for an intracranial cause of delirium. Only 3/29 patients with a positive scan did not have one of three main risk factors the authors identified: a fall in the preceding two weeks, new neurologic findings, or sudden deterioration of consciousness. It should be noted that authors did not define “deterioration of consciousness” and that all patients had confusion on admission to the unit, rather than developing during hospitalization.
Hijazi et al. conducted a retrospective cohort study over a 20-month period of 1,653 patients with delirium at the time of admission or during their hospitalization. Patients with delirium due to drug or medication withdrawal or “psychiatric reasons” were excluded. Overall, 538 (32.5%) patients underwent CT, MRI or both, and 78 (14.5%) patients had a positive finding on neuroimaging. This study’s 14.5 % overall yield matches that of Lai et al. Unfortunately, the study included all patients with delirium and did not report the rates of fall, neurologic deficits, and/or use of anticoagulation among those with positive neuroimaging. This limits the generalizability of the findings to a cohort of patients without intracranial pathology risk factors.
The reported yield of neuroimaging for hospitalized patients with delirium ranged from 2.7% to 14.5% across studies. However, in studies taking into account specific patient risk factors; the reported yields in patients without focal neurologic findings, new decline in mental status, systemic anticoagulation, or recent falls were 0%,11 1.4%,10 and 1.5%.6 While a rate of 1.5% may appear high for a serious outcome such as stroke or intracranial bleeding, it is comparable to rates reported for missed major cardiac events in clinical algorithms for evaluating chest pain.12 It should also be noted that neuroimaging is imperfect for acute stroke, and thus the positive or negative predictive value may be poor in the setting of low prevalence. For example, for detection of any acute stroke, the sensitivity/specificity of MRI and CT are 83%/97% and 26%/98% respectively.13
Neuroimaging is expensive and has risks. The average charge for a head CT is approximately $1,400 at academic institutions.14 Moreover, computed tomography exposes patients to significant radiation and up to 2% of malignancies in the United States may be attributable to prior tomography exposure.15 Additionally, there are non-negligible rates of incidental findings during neuroimaging, 1% for CT16 and 2.7%-13.7% for MRI,17,18 which may result in further evaluation or treatment that causes significant patient anxiety. Obtaining neuroimaging on delirious patients can be time consuming and labor intensive, which could delay care to other patients. Additionally, sedating medications are often administered to agitated patients prior to imaging, which risk worsening delirium. Ordering neuroimaging for all patients with acute delirium, therefore, exposes the large majority to unnecessary costs and potential harms.
WHEN NEUROIMAGING TO EVALUATE DELIRIUM IN HOSPITALIZED PATIENTS COULD BE REASONABLE
The diagnostic yield of head CT in the evaluation of delirium is significantly higher in patients with specific risk factors. Lai et al. found adjusted odds ratios for abnormal CT of 18.2 in patients with new focal deficits, 5.6 with a fall in the preceding two weeks and 4.6 in patients with deterioration in consciousness. Patients with systemic anticoagulation had higher unadjusted, (OR 2.4) though not adjusted odds of having an abnormal CT.6 Thiesen-Toupal et al. excluded patients with recent falls or neurologic deficits but reported that three out of six delirious patients with abnormal neuroimaging were anticoagulated.10 Vijayakrishnan et al. found that all four delirious patients with intracranial findings met guideline criteria for neuroimaging.11 Thus, current recommendations for neuroimaging in delirious patients with falls, focal neurologic deficits, or systemic anticoagulation are appropriate. In situations when a provider lacks an accurate history and is unable to determine if risk factors are present (for example a confused patient found sitting on the floor next to the bed), it may also be reasonable to consider neuroimaging.
Data are limited, but some authors advocate for neuroimaging in cases of delirium that do not improve with treatment.6 Additionally, it may be reasonable to consider neuroimaging in delirium patients with predispositions to embolic or metastatic intracranial processes such as endovascular infections and certain malignancies.4
WHAT YOU SHOULD DO INSTEAD OF NEUROIMAGING TO EVALUATE DELIRIUM IN HOSPITALIZED PATIENTS
Hospitalized patients with acute confusion should be assessed for delirium with a validated instrument such as the Confusion Assessment Method (CAM).19,20 The original CAM included several components: acute change in mental status with a fluctuating course and inattention, plus either disorganized thinking and/or altered level of consciousness. Multiple delirium assessment tools have been created and validated, all of which include inattention as a required feature. A recent hospital-based study using a two item bedside test asking the patient to name the day of the week and list the months of the year backwards detected delirium with a sensitivity of 93% and specificity of 64%.21 Once the diagnosis of delirium is established, evaluation should begin with a careful history and physical examination focused on the identification of risk factors such as physical restraints, indwelling urinary catheters, and drugs known to precipitate delirium, particularly those with withdrawal potential, anticholinergic properties, and sedative-hypnotic agents.22-24 Delirium may be the first harbinger of serious medical illness and specific testing should be guided by clinical suspicion. In general, a thorough physical examination should look for focal neurologic deficits, hypoxia, signs of infection, and other inflammatory or painful processes that could precipitate delirium.25 Targeted laboratory evaluation may include a basic metabolic panel to identify electrolyte (including calcium) and metabolic derangements, complete blood count, and urinalysis if infection is suspected.
RECOMMENDATIONS
- Use a validated instrument such as CAM to evaluate hospitalized patients who develop altered mental status.
- Delirious patients should undergo a thorough history including a review of medications, physical exam, and targeted laboratory testing aimed at identifying common risk factors and precipitants of delirium that should be addressed.
- Perform neuroimaging if there is a history of fall or head trauma in the preceding two weeks, any new focal abnormalities on neurologic exam or if the patient is receiving systemic anticoagulation.
- It may be reasonable to consider neuroimaging for patients with an atypical course of delirium, such as a sudden decline in the level of consciousness, persistence despite addressing identified factors, or if there is a high degree of suspicion for embolic or metastatic processes.
CONCLUSIONS
Performing neuroimaging in undifferentiated patients who develop delirium while hospitalized has a low diagnostic yield, is costly, and is potentially harmful. Neuroimaging should be reserved for those with identified risk factors for intracranial pathology. For the patient described in the initial vignette with no risk factors for intracranial cause, neuroimaging would be unlikely to contribute to her care. To change provider beliefs and behaviors regarding neuroimaging, prospective studies evaluating guideline implementation are needed. However, based on the current evidence, neuroimaging should be reserved for those with identified risk factors.
Do you think this is a low-value practice? Is this truly a “Thing We Do for No Reason?” Share what you do in your practice and join in the conversation online by retweeting it on Twitter (#TWDFNR) and liking it on Facebook. We invite you to propose ideas for other “Things We Do for No Reason” topics by e-mailing TWDFNR@hospitalmedicine.org.
Disclosures
The authors have no conflicts of interest relevant to this article to disclose.
1. Inouye SK, Westendorp RG, Saczynski JS. Delirium in elderly people. Lancet. 2014;383(9920):911-922. doi: 10.1016/S0140-6736(13)60688-1. PubMed
2. Clinical practice guidelines for the management of delirium in older people. 2006; https://www2.health.vic.gov.au/Api/downloadmedia/%7BDAA8404B-FEE7-4BDA-8A1E-A32494783B7F%7D. Accessed June 4, 2018.
3. Delirium: prevention, diagnosis and management. NICE Guidance 2010; https://www.nice.org.uk/guidance/cg103. Accessed June 4, 2018.
4. Michaud L, Bula C, Berney A, et al. Delirium: guidelines for general hospitals. J Psychosom Res. 2007;62(3):371-383. doi: 10.1016/j.jpsychores.2006.10.004. PubMed
5. Bush SH, Marchington KL, Agar M, Davis DH, Sikora L, Tsang TW. Quality of clinical practice guidelines in delirium: a systematic appraisal. BMJ Open. 2017;7(3):e013809. doi: 10.1136/bmjopen-2016-013809. PubMed
6. Lai MM, Wong Tin Niam DM. Intracranial cause of delirium: computed tomography yield and predictive factors. Intern Med J. 2012;42(4):422-427. doi: 10.1111/j.1445-5994.2010.02400.x. PubMed
7. Hijazi Z, Lange P, Watson R, Maier AB. The use of cerebral imaging for investigating delirium aetiology. Eur J Intern Med. 2018;52:35-39. doi: 10.1016/j.ejim.2018.01.024. PubMed
8. Oldenbeuving AW, de Kort PL, Jansen BP, Roks G, Kappelle LJ. Delirium in acute stroke: a review. Int J Stroke. 2007;2(4):270-275. doi: 10.1111/j.1747-4949.2007.00163.x. PubMed
9. Benbadis SR, Sila CA, Cristea RL. Mental status changes and stroke. J Stroke Cerebrovasc Dis. 1994;4(4):216-219. doi: 10.1016/S1052-3057(10)80093-X. PubMed
10. Theisen-Toupal J, Breu AC, Mattison ML, Arnaout R. Diagnostic yield of head computed tomography for the hospitalized medical patient with delirium. J Hosp Med. 2014;9(8):497-501. doi: 10.1002/jhm.2198. PubMed
11. Vijayakrishnan R, Ramasubramanian A, Dhand S. Utility of head CT scan for acute inpatient delirium. Hosp Top. 2015;93(1):9-12. doi: 10.1080/00185868.2015.1012928. PubMed
12. Backus BE, Six AJ, Kelder JC, et al. A prospective validation of the HEART score for chest pain patients at the emergency department. Int J Cardiol. 2013;168(3):2153-2158. doi: 10.1016/j.ijcard.2013.01.255. PubMed
13. Chalela JA, Kidwell CS, Nentwich LM, et al. Magnetic resonance imaging and computed tomography in emergency assessment of patients with suspected acute stroke: a prospective comparison. Lancet. 2007;369(9558):293-298. doi: 10.1016/S0140-6736(07)60151-2. PubMed
14. Paul AB, Oklu R, Saini S, Prabhakar AM. How much is that head CT? Price transparency and variability in radiology. J Am Coll Radiol. 2015;12(5):453-457. doi: 10.1016/j.jacr.2014.12.016. PubMed
15. Brenner DJ, Hall EJ. Computed tomography--an increasing source of radiation exposure. N Engl J Med. 2007;357(22):2277-2284. doi: 10.1056/NEJMra072149. PubMed
16. Eskandary H, Sabbagh M, Khajehpour F, Eskandari M. Incidental findings in brain computed tomography scans of 3000 head trauma patients. Surg Neurol. 2005;63(6):550-553; discussion 553. doi: 10.1016/j.surneu.2004.07.049. PubMed
17. Vernooij MW, Ikram MA, Tanghe HL, et al. Incidental findings on brain MRI in the general population. N Engl J Med. 2007;357(18):1821-1828. doi: 10.1056/NEJMoa070972. PubMed
18. Morris Z, Whiteley WN, Longstreth WT, Jr., et al. Incidental findings on brain magnetic resonance imaging: systematic review and meta-analysis. BMJ. 2009;339:b3016. doi: 10.1136/bmj.b3016. PubMed
19. Inouye SK, van Dyck CH, Alessi CA, Balkin S, Siegal AP, Horwitz RI. Clarifying confusion: the confusion assessment method. A new method for detection of delirium. Ann Intern Med. 1990;113(12):941-948. doi: 10.7326/0003-4819-113-12-941. PubMed
20. Wei LA, Fearing MA, Sternberg EJ, Inouye SK. The Confusion Assessment Method: a systematic review of current usage. J Am Geriatr Soc. 2008;56(5):823-830. doi: 10.1111/j.1532-5415.2008.01674.x. PubMed
21. Fick DM, Inouye SK, Guess J, et al. Preliminary development of an ultrabrief two-item bedside test for delirium. J Hosp Med. 2015;10(10):645-650. doi: 10.1002/jhm.2418. PubMed
22. Tune L, Carr S, Hoag E, Cooper T. Anticholinergic effects of drugs commonly prescribed for the elderly: potential means for assessing the risk of delirium. Am J Psychiatry. 1992;149(10):1393-1394. doi: 10.1176/ajp.149.10.1393. PubMed
23. Inouye SK, Schlesinger MJ, Lydon TJ. Delirium: a symptom of how hospital care is failing older persons and a window to improve the quality of hospital care. Am J Med. 1999;106(5):565-573. doi: 0.1016/S0002-9343(99)00070-4. PubMed
24. Marcantonio ER. Delirium in hospitalized older adults. N Engl J Med. 2017;377(15):1456-1466. doi: 10.1056/NEJMc1714932. PubMed
25. Inouye SK, Charpentier PA. Precipitating factors for delirium in hospitalized elderly persons. Predictive model and interrelationship with baseline vulnerability. JAMA. 1996;275(11):852-857. doi: 10.1001/jama.1996.03530350034031. PubMed
1. Inouye SK, Westendorp RG, Saczynski JS. Delirium in elderly people. Lancet. 2014;383(9920):911-922. doi: 10.1016/S0140-6736(13)60688-1. PubMed
2. Clinical practice guidelines for the management of delirium in older people. 2006; https://www2.health.vic.gov.au/Api/downloadmedia/%7BDAA8404B-FEE7-4BDA-8A1E-A32494783B7F%7D. Accessed June 4, 2018.
3. Delirium: prevention, diagnosis and management. NICE Guidance 2010; https://www.nice.org.uk/guidance/cg103. Accessed June 4, 2018.
4. Michaud L, Bula C, Berney A, et al. Delirium: guidelines for general hospitals. J Psychosom Res. 2007;62(3):371-383. doi: 10.1016/j.jpsychores.2006.10.004. PubMed
5. Bush SH, Marchington KL, Agar M, Davis DH, Sikora L, Tsang TW. Quality of clinical practice guidelines in delirium: a systematic appraisal. BMJ Open. 2017;7(3):e013809. doi: 10.1136/bmjopen-2016-013809. PubMed
6. Lai MM, Wong Tin Niam DM. Intracranial cause of delirium: computed tomography yield and predictive factors. Intern Med J. 2012;42(4):422-427. doi: 10.1111/j.1445-5994.2010.02400.x. PubMed
7. Hijazi Z, Lange P, Watson R, Maier AB. The use of cerebral imaging for investigating delirium aetiology. Eur J Intern Med. 2018;52:35-39. doi: 10.1016/j.ejim.2018.01.024. PubMed
8. Oldenbeuving AW, de Kort PL, Jansen BP, Roks G, Kappelle LJ. Delirium in acute stroke: a review. Int J Stroke. 2007;2(4):270-275. doi: 10.1111/j.1747-4949.2007.00163.x. PubMed
9. Benbadis SR, Sila CA, Cristea RL. Mental status changes and stroke. J Stroke Cerebrovasc Dis. 1994;4(4):216-219. doi: 10.1016/S1052-3057(10)80093-X. PubMed
10. Theisen-Toupal J, Breu AC, Mattison ML, Arnaout R. Diagnostic yield of head computed tomography for the hospitalized medical patient with delirium. J Hosp Med. 2014;9(8):497-501. doi: 10.1002/jhm.2198. PubMed
11. Vijayakrishnan R, Ramasubramanian A, Dhand S. Utility of head CT scan for acute inpatient delirium. Hosp Top. 2015;93(1):9-12. doi: 10.1080/00185868.2015.1012928. PubMed
12. Backus BE, Six AJ, Kelder JC, et al. A prospective validation of the HEART score for chest pain patients at the emergency department. Int J Cardiol. 2013;168(3):2153-2158. doi: 10.1016/j.ijcard.2013.01.255. PubMed
13. Chalela JA, Kidwell CS, Nentwich LM, et al. Magnetic resonance imaging and computed tomography in emergency assessment of patients with suspected acute stroke: a prospective comparison. Lancet. 2007;369(9558):293-298. doi: 10.1016/S0140-6736(07)60151-2. PubMed
14. Paul AB, Oklu R, Saini S, Prabhakar AM. How much is that head CT? Price transparency and variability in radiology. J Am Coll Radiol. 2015;12(5):453-457. doi: 10.1016/j.jacr.2014.12.016. PubMed
15. Brenner DJ, Hall EJ. Computed tomography--an increasing source of radiation exposure. N Engl J Med. 2007;357(22):2277-2284. doi: 10.1056/NEJMra072149. PubMed
16. Eskandary H, Sabbagh M, Khajehpour F, Eskandari M. Incidental findings in brain computed tomography scans of 3000 head trauma patients. Surg Neurol. 2005;63(6):550-553; discussion 553. doi: 10.1016/j.surneu.2004.07.049. PubMed
17. Vernooij MW, Ikram MA, Tanghe HL, et al. Incidental findings on brain MRI in the general population. N Engl J Med. 2007;357(18):1821-1828. doi: 10.1056/NEJMoa070972. PubMed
18. Morris Z, Whiteley WN, Longstreth WT, Jr., et al. Incidental findings on brain magnetic resonance imaging: systematic review and meta-analysis. BMJ. 2009;339:b3016. doi: 10.1136/bmj.b3016. PubMed
19. Inouye SK, van Dyck CH, Alessi CA, Balkin S, Siegal AP, Horwitz RI. Clarifying confusion: the confusion assessment method. A new method for detection of delirium. Ann Intern Med. 1990;113(12):941-948. doi: 10.7326/0003-4819-113-12-941. PubMed
20. Wei LA, Fearing MA, Sternberg EJ, Inouye SK. The Confusion Assessment Method: a systematic review of current usage. J Am Geriatr Soc. 2008;56(5):823-830. doi: 10.1111/j.1532-5415.2008.01674.x. PubMed
21. Fick DM, Inouye SK, Guess J, et al. Preliminary development of an ultrabrief two-item bedside test for delirium. J Hosp Med. 2015;10(10):645-650. doi: 10.1002/jhm.2418. PubMed
22. Tune L, Carr S, Hoag E, Cooper T. Anticholinergic effects of drugs commonly prescribed for the elderly: potential means for assessing the risk of delirium. Am J Psychiatry. 1992;149(10):1393-1394. doi: 10.1176/ajp.149.10.1393. PubMed
23. Inouye SK, Schlesinger MJ, Lydon TJ. Delirium: a symptom of how hospital care is failing older persons and a window to improve the quality of hospital care. Am J Med. 1999;106(5):565-573. doi: 0.1016/S0002-9343(99)00070-4. PubMed
24. Marcantonio ER. Delirium in hospitalized older adults. N Engl J Med. 2017;377(15):1456-1466. doi: 10.1056/NEJMc1714932. PubMed
25. Inouye SK, Charpentier PA. Precipitating factors for delirium in hospitalized elderly persons. Predictive model and interrelationship with baseline vulnerability. JAMA. 1996;275(11):852-857. doi: 10.1001/jama.1996.03530350034031. PubMed
© 2019 Society of Hospital Medicine
Every Nook and Cranny
A 46-year-old man presented to the emergency room in the postmonsoon month of September with a seven-day history of high fevers as well as a four-day history of a dry cough, dyspnea, and progressive rash. The patient reported no chest pain, hemoptysis, chest tightness, palpitations, wheezing, orthopnea, paroxysmal nocturnal dyspnea, or leg swelling. He lived and sought healthcare in Delhi, India.
Fever followed by a progressive but as yet uncharacterized rash and pulmonary symptoms in a middle-aged man suggests a host of possibilities. While it is tempting to ascribe his symptoms to an infectious process, especially a “tropical” infection based on his residence in Delhi, the location may simply represent a red herring. Potential infections can be divided into those endemic to the Indian subcontinent, and those encountered more globally. The former include diseases such as measles and dengue, while the latter include entities such as Mycoplasma pneumonia, varicella, and acute human immunodeficiency virus (HIV) infection. Noninfectious categories of diseases that should be considered include drug reactions and rheumatologic processes. Several rheumatologic diseases, including granulomatosis with polyangiitis, eosinophilic granulomatosis with polyangiitis, and systemic lupus erythematosus (SLE) may present with fever, rash, and pulmonary symptomatology.
A history of the patient’s exposures, both environmental and pharmaceutical, should be obtained. More information regarding his immunization history, rash characteristics (distribution and nature of the lesions), and other salient exam findings such as organomegaly and joint abnormalities will be helpful.
Fever reached a maximum of 103° Fahrenheit and was associated with chills but not rigors. There were several fever spikes daily, relieved completely with antipyretics. The patient’s dyspnea was predominantly noted on exertion, nonpleuritic, not temporally related to cough, and progressively worsening over three days. The skin lesions were first noticed on his trunk and were described as reddish, flat, and pinpoint size. However, the rash spread to the face and extremities sparing the palms and soles. There was no bleeding, nausea, vomiting, abdominal pain, change in bowel habits, dysuria, headache, photophobia, neck stiffness, or joint pain.
The patient reported no significant past medical history, took no medications, and had no recent travel outside of Delhi, India in the past year. He was married and monogamous. He had no pets nor did he report any contact with animals. He did not use tobacco, alcohol, or illicit substances. He did not remember being bitten by an insect. He worked as a software engineer. There was no history of similar illness in the patient’s family or at his workplace. He had no history of recent blood transfusion or immunization (including MMR and Tdap).
Several noninfectious and inflammatory conditions can explain his symptoms. Eosinophilic granulomatosis with polyangiitis is considerably less likely in the absence of asthma, and vasculitic processes, in general, are less likely given the nongravity dependent nature of the rash. SLE and sarcoidosis are possible causes of a systemic inflammatory illness presenting acutely with fever, rash, and pulmonary symptoms.
The patient’s expanded history makes several infections less likely. Although much of the presentation is consistent with measles, the initial appearance of the truncal rash is atypical, and there is no mention of coryza or conjunctivitis. Likewise, the description of the exanthem is not suggestive of varicella, and dengue and chikungunya are much less likely in the absence of a headache and arthralgias. Other infections including leptospirosis and scrub typhus are possible, and both might be contracted in greater Delhi. Typhoid is another infectious syndrome endemic to the Indian subcontinent that should be considered. The presence of rash involving the face and extremities would be highly atypical, however; and the presence of dyspnea and the absence of a headache argue against typhoid. Acute HIV infection and Mycoplasma pneumonia remain possible diagnoses. Toxic shock syndrome is possible, but a faster and fulminant course would be expected.
On physical examination, the temperature was 103° Fahrenheit, heart rate was 120 beats per minute and regular, respiratory rate was 24 breaths per minute, blood pressure was 100/60 mm Hg, and resting oxygen saturation was 93% while breathing ambient air. He appeared uncomfortable. Jugular venous pulse was elevated at 10 cm H2O. Mild icterus was present, but there was neither conjunctival congestion nor subconjunctival hemorrhage. S1 and S2 heart sounds were loud, but there were no murmurs. Chest auscultation revealed bilateral basal coarse crackles. The abdominal right upper quadrant was mildly tender to palpation, and the liver edge was palpable 2 cm below the subcostal margin. There was neither splenomegaly nor peripheral lymphadenopathy. Kernig and Brudzinski signs were negative, and there were no focal neurological deficits. A generalized, nonpalpable, maculopapular and petechial rash was present on the face, extremities, and trunk.
The patient’s presentation must now incorporate the additional findings of bibasilar chest crackles, maculopapular/petechial rash, icterus, modest hypoxia, and hepatomegaly. Some of the noninfectious entities already mentioned (SLE and sarcoidosis) remain possible explanations. Hemophagocytic lymphohistiocytosis (HLH) may also explain most of the patient’s presenting signs and symptoms, and several other infectious diseases account for his presentation. Scrub typhus (or a more uncommon rickettsia disease, Indian tick typhus), leptospirosis, and perhaps infective endocarditis seem most likely to provide a unifying diagnosis for the symptoms mentioned above. Leptospirosis presents in a minority of instances as a severe illness known as Weil disease, characterized by several of this patient’s findings including icterus, kidney injury, and pulmonary symptoms. However, the rash is relatively uncommon in leptospirosis and when present, is usually more localized. The patient’s rash as described is not typically expected in infective endocarditis, although high-grade Staphylococcus aureus bacteremia will occasionally present with a diffuse rash that may be confused with that of meningococcemia. The etiology of the patient’s elevated jugular venous pressure is not readily apparent, with the cardiac examination making acute valvular insufficiency much less likely. Myocarditis, however, is possible in the setting of several of the diseases listed above, including leptospirosis, scrub typhus, SLE, and dengue.
In addition to basic laboratory studies and a chest radiograph, multiple sets of blood cultures should be obtained, along with a transthoracic echocardiogram and a ferritin level. The evidence to support leptospirosis and scrub typhus is strong enough to justify empiric use of doxycycline once the blood cultures are obtained, especially given the difficulty in definitively diagnosing these diseases in a timely fashion.
Laboratory analysis revealed a total leukocyte count of 13,600/uL (85% neutrophils), hemoglobin 10 g/dL, and platelet count 35,000/uL. Absolute eosinophil count was 136/uL. Serum chemistry showed sodium of 145 meq/L, potassium 4.1 meq/L, blood urea nitrogen 80 mg/dL, creatinine 1.6 mg/dL, aspartate transaminase (AST) 44 U/L (normal, 0-40), alanine transaminase (ALT) 81 U/L (normal, 0-40), direct bilirubin 3 mg/dL, and indirect bilirubin 3 mg/dL. Lactate dehydrogenase, alkaline phosphatase, albumin, and coagulation studies were normal. Erythrocyte sedimentation rate (ESR) was 42 mm (normal, 0-25) and highly sensitive C-reactive protein was 42 mg/L (normal, 0-10). Arterial blood gas on ambient air revealed a pH of 7.52, PaCO2 24 mm Hg, PaO2 55 mm Hg, and bicarbonate 20 meq/L. Urinalysis was normal. Blood cultures were obtained. Electrocardiogram (ECG) showed regular narrow complex tachycardia with incomplete left bundle branch block. Old ECGs were not available for comparison. Chest radiograph showed bilateral air space opacities with evidence of vein cephalization. Abdominal and pelvis ultrasonography showed pericholecystic fluid and mild hepatomegaly, but no free fluid, pleural effusion, or evidence of cholecystitis. Point of care immunochromatographic rapid malarial antigen detection test (detects Plasmodium falciparum, Plasmodium vivax, Plasmodium malaria, and Plasmodium ovale) was negative.
Most of the findings described are commonly observed in both scrub typhus and leptospirosis, including cytopenias, parenchymal infiltrates, hepatomegaly, elevated transaminases and bilirubin, cardiac involvement, fever, and rash. The rash described is more consistent with scrub typhus than with leptospirosis. The absence of a headache and joint findings argue modestly against these diagnoses. Likewise, HLH provides an adequate explanation for most of the patient’s symptoms, signs, and test results. These include fever, lung involvement, rash, hepatomegaly, elevated bilirubin, and cytopenias; however, leukocytosis and cardiac involvement are less characteristic. SLE also provides a satisfactory explanation for much of the symptoms, although the rash characteristics, normal urinalysis, and leukocytosis make this diagnosis less likely.
Additional testing that should be performed includes serum antinuclear antibody (ANA) and ferritin, since the latter may be markedly elevated in the setting of HLH. Bone marrow aspirate and biopsy should be performed looking specifically for evidence of hemophagocytosis. Finally, a transthoracic echocardiogram (TTE) should be performed to assess evidence of myocardial dysfunction as it may alter the therapeutic approach, although the results will be unlikely to differentiate between the preceding considerations.
Troponin I was negative, but N-terminal probrain natriuretic peptide was elevated at 20,000 pg/mL (normal, 0-900). D-dimer was negative. TTE showed left ventricular ejection fraction (LVEF) of 35% with global left ventricular hypokinesis. On three separate examinations, the peripheral blood smear did not show malarial parasites, atypical lymphocytes, or schistocytes. Three sets of blood cultures, testing for bacteria and fungi, were sterile. A throat culture was sterile. Widal test, as well as Leptospira and Mycoplasma serologies, were negative. Serology for Legionella pneumophila was positive, but the urinary antigen testing was negative. Antibodies to HIV 1 and 2 and anti-hepatitis C virus (HCV) antibody were negative. Dengue IgM ELISA (qualitative) returned positive.
Despite the absence of arthralgias, myalgias, headache, and retro-orbital pain, a positive dengue IgM ELISA supports acute dengue infection, provided the patient did not experience an unexplained febrile illness in the previous months. Most of his presentation may be explained by dengue, including fever, rash, liver abnormalities, myocardial dysfunction, and thrombocytopenia. The bilateral airspace opacities seen on chest radiograph also fit reasonably provided these actually reflect pulmonary edema. Leukocytosis (as opposed to leukopenia) is highly unexpected in dengue, but its presence could be an outlier.
If dengue does indeed explain the entire presentation, defervescence should have occurred by the time the blood cultures and serologic studies returned. Also, by that time, the patient would be expected to demonstrate evidence of improvement, barring the appearance of the serious complications of dengue hemorrhagic fever/dengue shock syndrome. Should fever persist and signs of recovery fail to materialize, the possibility of a superimposed process will need to be considered. Of note, the sensitivity of Leptospira serology early in the course of illness is low, and leptospirosis is thus not yet excluded.
A presumptive diagnosis of severe dengue fever was made, based on evidence of pulmonary edema and sepsis. The patient was managed conservatively with oral fluid restriction, low dose of diuretics, and supplemental oxygenation. The patient was also given levofloxacin for possible legionellosis. Despite these therapies, the patient had no improvement in 24 hours. His tachypnea increased, and his measured PaO2 to FIO2 (P:F) ratio decreased to 230 from 285 on admission. This prompted the initiation of BiPAP at 10 cm H2O inspiration PAP and 5 cm H2O expiration PAP. However, he did not tolerate BiPAP, and his P:F ratio decreased to below 200.
The patient was transferred to the intensive care unit and underwent elective intubation with mechanical ventilation. Axial and coronal computed tomography of the thorax (Figure 1A and 1B, respectively) showed extensive ground-glass opacities and consolidation sparing the nondependent portions of the lungs. On physical inspection, a round, well-defined, painless black lesion surrounded by erythema was noticed in the right axilla (Figure 2). The rest of the examination findings were unchanged.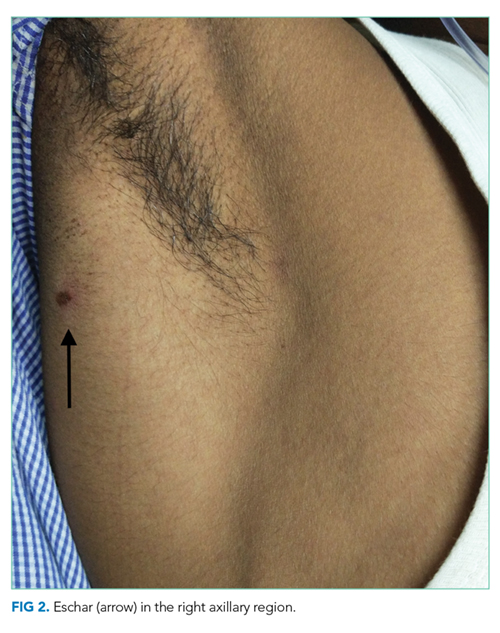
The discovery of eschar in the axilla provides a “pivot point” in determining the cause of the patient’s illness. This finding appears to point, with high specificity, toward rickettsia as the explanation of the patient’s disease, and this is most likely to be scrub typhus. The report of a positive dengue IgM may represent concurrent infection or may simply reflect a recent infection in an area that is highly endemic for dengue. Although most of the patient’s clinical presentation could be attributed to dengue, multiple features including the leukocytosis, myocarditis, and elevated bilirubin are more likely to be seen in scrub typhus. In any event, dengue cannot satisfactorily explain the eschar.
No mention has been made to the initiation of doxycycline thus far; this agent needs to be started promptly. Polymerase chain reaction (PCR) testing for scrub typhus should be ordered if available; if not, acute and convalescent serology may be obtained.
Given the finding of axillary eschar, the patient was diagnosed with scrub typhus. Doxycycline 100 mg by nasogastric tube twice a day was initiated. The patient began to show marked symptomatic improvement. His P:F ratio improved, and he was successfully weaned off and extubated after 24 hours. Postextubation, he was kept on BiPAP for 12 hours. He was transferred out of the ICU and monitored for 72 hours. With therapy, his cytopenias, liver and renal function, and ECG normalized. Indirect immunofluorescence assay for scrub typhus returned positive at a dilution of > 1:512. PCR assay targeting the 56 kDa region of Orientia tsutsugamushi was also positive. Repeated TTE showed an LVEF of 65%. He was subsequently discharged with oral doxycycline and a plan to complete a course of 14 days on an outpatient basis. The final diagnosis was scrub typhus with myocarditis leading to acutely decompensated heart failure with reduced ejection fraction.
DISCUSSION
Scrub typhus is a mite-borne tropical infection caused by the gram-negative intracellular parasite Orientia tsutsugamushi from the Rickettsiaceae family that is known to occur in certain parts of Asia and Australia. Although this entity is well known in the Sub Himalayan belt and southern part of India, very few cases have been described in Delhi, the capital state in North India. Scrub typhus, like most other tropical infections, is found most often during the postmonsoon season.1,2
Patients with scrub typhus present with fever in addition to a variety of nonspecific symptoms and findings. These often manifest within 10 days of being bitten by a mite. Malaise, headache, myalgias, lymphadenopathy, and maculopapular or petechial rash are common. If present, the rash manifests on the 3rd to 5th day of fever.3 Disseminated vasculitis due to scrub typhus can frequently result in multiorgan system involvement. Pulmonary involvement often leads to acute respiratory distress syndrome (ARDS) with an incidence of 8%-10%.1,4 Acute kidney injury, mostly mild and nonoliguric, has been reported in up to 2/3 cases.4-6 The cardiac myocyte is a known target cell affected by scrub typhus, and therefore patients commonly present with myocarditis.7 Liver involvement in scrub typhus is evident through elevated liver enzymes and can occur without other clinical evidence of the illness.4,6,8,9 As in dengue, patients often develop thrombocytopenia, but normal hemoglobin in scrub typhus differentiates it from dengue.6,8
Given the nonspecific presentation, it can be challenging to diagnose and treat scrub typhus. The gold standard for diagnosis is the detection of IgM antibodies to Orientia tsutsugamushi using an indirect immunofluorescence assay (IFA). For patients from endemic regions, it may be necessary to show a four-fold increase in titers two weeks apart to distinguish from background immunity. Presence of the characteristic eschar, as discussed below, is highly suggestive of scrub typhus. The treatment of choice is doxycycline or azithromycin for seven days.10,11 Early initiation of doxycycline when considering either scrub typhus or leptospirosis is appropriate and may be life-saving.
Medical decision making is fraught with uncertainty, and physicians must use their experience, evidence base, and cognitive heuristics wisely to care for patients effectively. For this patient, the region of Delhi experiences massive outbreaks of dengue every year during the time the patient presented to the hospital, whereas rickettsia infections are relatively uncommon. The clinical presentation was conceivably consistent with either dengue or scrub typhus, though somewhat more suggestive of the latter. Once the serological diagnosis of recent or concomitant dengue was obtained, however, scrub typhus was considered even less. The team called upon Occam’s razor or the heuristic that the simplest and most unifying explanation for any given problem is the one most likely to be correct and that other, less satisfactory explanations (in this case, scrub typhus) are “shaven off.” The patient was managed conservatively for dengue. Only when his condition worsened did the team recognize this conflicting information without dismissing it, consider alternative possibilities, and reexamined the patient.
An eschar can be an important clue in the diagnosis of scrub typhus, though it is not often obvious. The presence of this necrotic skin lesion with black crust is highly suggestive of scrub typhus, and in the right clinical context, it is virtually diagnostic. However, it is uncommon (9.5%-45%) in most of the studies from the Indian subcontinent (ie, high specificity but low sensitivity).1,12 An eschar is often found in obscure locations such as the axillae or groin, areas that may easily be missed or overlooked. Eschars may be seen in a variety of other infectious diseases, including rickettsia pox, Rocky Mountain spotted fever, other members of the spotted fever group, tularemia, and cutaneous anthrax. Given this patient’s lack of improvement, repeated examination revealed an eschar in the right axilla, a finding that was either missed or still evolving at the time of presentation.
This case illustrates the challenges in interpreting the significance of multiple positive serological tests in the context of an undifferentiated clinical syndrome. Possible reasons for a positive dengue serology could have been persistent antibodies from a previous infection, recent asymptomatic infection, concurrent infection, or cross-reactivity with flaviviruses such as West Nile Virus or Japanese Encephalitis.13 The patient also had positive IgM antibodies against Legionella pneumophila, but the urinary antigen was negative. In view of a negative antigen test, low specificity of the serologic test, low incidence of legionellosis in the Indian subcontinent, and absence of therapeutic response to a trial of fluoroquinolones, the diagnosis of legionellosis was considered unlikely in this patient.
With rapid advancements in technology, the importance of history taking and physical examination is at risk of being overshadowed. Approximately 80% of correct diagnoses in medicine can arrive through history and physical examination alone.14,15 In this case, Occam’s razor combined with multiple serological tests was relied on to create the likely list of diagnoses. However, recognition of the limitations of these heuristics and tests proved critical. The life-saving diagnosis was only made when the clinicians returned to basics, looked in every nook and cranny, and found the eschar on physical examination.
KEY TEACHING POINTS
- In patients living in endemic areas who present with an acute febrile illness, the differential diagnosis should include “tropical” infections such as dengue, chikungunya, enteric fever, leptospirosis, malaria, and scrub typhus.
- Serology is commonly employed for diagnosis of tropical infections, which may be misleading. These tests can be falsely positive from past asymptomatic infection or cross reactivity between antibodies, or falsely negative, as in the first few days of infection.
- Presence of eschar is a very useful clue in the diagnosis of scrub typhus, but this finding can be missed since it is often found in obscure locations. A thorough clinical history and physical examination are paramount.
Disclosures
The authors do not report any conflict of interest.
1. Gupta N, Chaudhry R, Kabra SK, et al. In search of scrub typhus: a prospective analysis of clinical and epidemiological profile of patients from a tertiary care hospital in New Delhi. Adv Infect Dis. 2015;5(4):140. doi: 10.4236/aid.2015.54017.
2. Kamarasu K, Malathi M, Rajagopal V, Subramani K, Jagadeeshramasamy D, Mathai E. Serological evidence for the wide distribution of spotted fevers & typhus fever in Tamil Nadu. Indian J Med Res. 2007;126(2):128-130. PubMed
3. Mahajan SK. Scrub typhus. J Assoc Physicians India. 2005;53:954-958. PubMed
4. Mahajan SK, Rolain JM, Kashyap R, et al. Scrub typhus in the Himalayas. Emerg Infect Dis. 2006;12(10):1590-1592. doi: 10.3201/eid1210.051697. PubMed
5. Attur RP, Kuppasamy S, Bairy M, et al. Acute kidney injury in scrub typhus. Clin Exp Nephrol. 2013;17(5):725-729. doi: 10.1007/s10157-012-0753-9. PubMed
6. Varghese GM, Trowbridge P, Janardhanan J, et al. Clinical profile and improving mortality trend of scrub typhus in South India. Int J Infect Dis. 2014;23:39-43. doi: 10.1016/j.ijid.2014.02.009. PubMed
7. Taylor AJ, Paris DH, Newton PN. A systematic review of mortality from untreated scrub typhus (Orientia tsutsugamushi). PLoS Negl Trop Dis. 2015;9(8):e0003971. doi.org/10.1371/journal.pntd.0003971 PubMed
8. Chrispal A, Boorugu H, Gopinath KG, et al. Scrub typhus: an unrecognized threat in South India-clinical profile and predictors of mortality. Trop Doct. 2010;40(3):129-133. doi: 10.1258/td.2010.090452. PubMed
9. Mathai E, Rolain JM, Verghese GM, et al. Outbreak of scrub typhus in southern India during the cooler months. Ann N Y Acad Sci. 2003;990:359-364. doi: 10.1111/j.1749-6632.2003.tb07391.x PubMed
10. Gupta N, Chaudhry R, Kabra SK, et al. Comparative evaluation of serological and molecular methods for the diagnosis of scrub typhus in Indian settings. Jpn J Infect Dis. 2017;70(2):221-222. doi: 10.7883/yoken.JJID.2016.139. PubMed
11. Rahi M, Gupte MD, Bhargava A, Varghese GM, Arora R. DHR-ICMR Guidelines for diagnosis & management of Rickettsial diseases in India. Indian J Med Res. 2015;141(4):417-422. doi: 10.4103/0971-5916.159279. PubMed
12. Sharma A, Mahajan S, Gupta ML, Kanga A, Sharma V. Investigation of an outbreak of scrub typhus in the Himalayan region of India. Jpn J Infect Dis. 2005;58(4):208-210. PubMed
13. Gupta N, Chaudhry R, Mirdha B, et al. Scrub typhus and leptospirosis: the fallacy of diagnosing with IgM enzyme-linked immunosorbent assay. J Microb Biochem Technol. 2016;8:71-75. doi: 10.4172/1948-5948.1000265.
14. Peterson MC, Holbrook JH, Von Hales D, Smith NL, Staker LV. Contributions of the history, physical examination, and laboratory investigation in making medical diagnoses. West J Med. 1992;156(2):163-165. doi: 10.1097/00006254-199210000-00013 PubMed
15. Roshan M, Rao AP. A study on relative contributions of the history, physical examination and investigations in making a medical diagnosis. J Assoc Physicians India. 2000;48(8):771-775. PubMed
A 46-year-old man presented to the emergency room in the postmonsoon month of September with a seven-day history of high fevers as well as a four-day history of a dry cough, dyspnea, and progressive rash. The patient reported no chest pain, hemoptysis, chest tightness, palpitations, wheezing, orthopnea, paroxysmal nocturnal dyspnea, or leg swelling. He lived and sought healthcare in Delhi, India.
Fever followed by a progressive but as yet uncharacterized rash and pulmonary symptoms in a middle-aged man suggests a host of possibilities. While it is tempting to ascribe his symptoms to an infectious process, especially a “tropical” infection based on his residence in Delhi, the location may simply represent a red herring. Potential infections can be divided into those endemic to the Indian subcontinent, and those encountered more globally. The former include diseases such as measles and dengue, while the latter include entities such as Mycoplasma pneumonia, varicella, and acute human immunodeficiency virus (HIV) infection. Noninfectious categories of diseases that should be considered include drug reactions and rheumatologic processes. Several rheumatologic diseases, including granulomatosis with polyangiitis, eosinophilic granulomatosis with polyangiitis, and systemic lupus erythematosus (SLE) may present with fever, rash, and pulmonary symptomatology.
A history of the patient’s exposures, both environmental and pharmaceutical, should be obtained. More information regarding his immunization history, rash characteristics (distribution and nature of the lesions), and other salient exam findings such as organomegaly and joint abnormalities will be helpful.
Fever reached a maximum of 103° Fahrenheit and was associated with chills but not rigors. There were several fever spikes daily, relieved completely with antipyretics. The patient’s dyspnea was predominantly noted on exertion, nonpleuritic, not temporally related to cough, and progressively worsening over three days. The skin lesions were first noticed on his trunk and were described as reddish, flat, and pinpoint size. However, the rash spread to the face and extremities sparing the palms and soles. There was no bleeding, nausea, vomiting, abdominal pain, change in bowel habits, dysuria, headache, photophobia, neck stiffness, or joint pain.
The patient reported no significant past medical history, took no medications, and had no recent travel outside of Delhi, India in the past year. He was married and monogamous. He had no pets nor did he report any contact with animals. He did not use tobacco, alcohol, or illicit substances. He did not remember being bitten by an insect. He worked as a software engineer. There was no history of similar illness in the patient’s family or at his workplace. He had no history of recent blood transfusion or immunization (including MMR and Tdap).
Several noninfectious and inflammatory conditions can explain his symptoms. Eosinophilic granulomatosis with polyangiitis is considerably less likely in the absence of asthma, and vasculitic processes, in general, are less likely given the nongravity dependent nature of the rash. SLE and sarcoidosis are possible causes of a systemic inflammatory illness presenting acutely with fever, rash, and pulmonary symptoms.
The patient’s expanded history makes several infections less likely. Although much of the presentation is consistent with measles, the initial appearance of the truncal rash is atypical, and there is no mention of coryza or conjunctivitis. Likewise, the description of the exanthem is not suggestive of varicella, and dengue and chikungunya are much less likely in the absence of a headache and arthralgias. Other infections including leptospirosis and scrub typhus are possible, and both might be contracted in greater Delhi. Typhoid is another infectious syndrome endemic to the Indian subcontinent that should be considered. The presence of rash involving the face and extremities would be highly atypical, however; and the presence of dyspnea and the absence of a headache argue against typhoid. Acute HIV infection and Mycoplasma pneumonia remain possible diagnoses. Toxic shock syndrome is possible, but a faster and fulminant course would be expected.
On physical examination, the temperature was 103° Fahrenheit, heart rate was 120 beats per minute and regular, respiratory rate was 24 breaths per minute, blood pressure was 100/60 mm Hg, and resting oxygen saturation was 93% while breathing ambient air. He appeared uncomfortable. Jugular venous pulse was elevated at 10 cm H2O. Mild icterus was present, but there was neither conjunctival congestion nor subconjunctival hemorrhage. S1 and S2 heart sounds were loud, but there were no murmurs. Chest auscultation revealed bilateral basal coarse crackles. The abdominal right upper quadrant was mildly tender to palpation, and the liver edge was palpable 2 cm below the subcostal margin. There was neither splenomegaly nor peripheral lymphadenopathy. Kernig and Brudzinski signs were negative, and there were no focal neurological deficits. A generalized, nonpalpable, maculopapular and petechial rash was present on the face, extremities, and trunk.
The patient’s presentation must now incorporate the additional findings of bibasilar chest crackles, maculopapular/petechial rash, icterus, modest hypoxia, and hepatomegaly. Some of the noninfectious entities already mentioned (SLE and sarcoidosis) remain possible explanations. Hemophagocytic lymphohistiocytosis (HLH) may also explain most of the patient’s presenting signs and symptoms, and several other infectious diseases account for his presentation. Scrub typhus (or a more uncommon rickettsia disease, Indian tick typhus), leptospirosis, and perhaps infective endocarditis seem most likely to provide a unifying diagnosis for the symptoms mentioned above. Leptospirosis presents in a minority of instances as a severe illness known as Weil disease, characterized by several of this patient’s findings including icterus, kidney injury, and pulmonary symptoms. However, the rash is relatively uncommon in leptospirosis and when present, is usually more localized. The patient’s rash as described is not typically expected in infective endocarditis, although high-grade Staphylococcus aureus bacteremia will occasionally present with a diffuse rash that may be confused with that of meningococcemia. The etiology of the patient’s elevated jugular venous pressure is not readily apparent, with the cardiac examination making acute valvular insufficiency much less likely. Myocarditis, however, is possible in the setting of several of the diseases listed above, including leptospirosis, scrub typhus, SLE, and dengue.
In addition to basic laboratory studies and a chest radiograph, multiple sets of blood cultures should be obtained, along with a transthoracic echocardiogram and a ferritin level. The evidence to support leptospirosis and scrub typhus is strong enough to justify empiric use of doxycycline once the blood cultures are obtained, especially given the difficulty in definitively diagnosing these diseases in a timely fashion.
Laboratory analysis revealed a total leukocyte count of 13,600/uL (85% neutrophils), hemoglobin 10 g/dL, and platelet count 35,000/uL. Absolute eosinophil count was 136/uL. Serum chemistry showed sodium of 145 meq/L, potassium 4.1 meq/L, blood urea nitrogen 80 mg/dL, creatinine 1.6 mg/dL, aspartate transaminase (AST) 44 U/L (normal, 0-40), alanine transaminase (ALT) 81 U/L (normal, 0-40), direct bilirubin 3 mg/dL, and indirect bilirubin 3 mg/dL. Lactate dehydrogenase, alkaline phosphatase, albumin, and coagulation studies were normal. Erythrocyte sedimentation rate (ESR) was 42 mm (normal, 0-25) and highly sensitive C-reactive protein was 42 mg/L (normal, 0-10). Arterial blood gas on ambient air revealed a pH of 7.52, PaCO2 24 mm Hg, PaO2 55 mm Hg, and bicarbonate 20 meq/L. Urinalysis was normal. Blood cultures were obtained. Electrocardiogram (ECG) showed regular narrow complex tachycardia with incomplete left bundle branch block. Old ECGs were not available for comparison. Chest radiograph showed bilateral air space opacities with evidence of vein cephalization. Abdominal and pelvis ultrasonography showed pericholecystic fluid and mild hepatomegaly, but no free fluid, pleural effusion, or evidence of cholecystitis. Point of care immunochromatographic rapid malarial antigen detection test (detects Plasmodium falciparum, Plasmodium vivax, Plasmodium malaria, and Plasmodium ovale) was negative.
Most of the findings described are commonly observed in both scrub typhus and leptospirosis, including cytopenias, parenchymal infiltrates, hepatomegaly, elevated transaminases and bilirubin, cardiac involvement, fever, and rash. The rash described is more consistent with scrub typhus than with leptospirosis. The absence of a headache and joint findings argue modestly against these diagnoses. Likewise, HLH provides an adequate explanation for most of the patient’s symptoms, signs, and test results. These include fever, lung involvement, rash, hepatomegaly, elevated bilirubin, and cytopenias; however, leukocytosis and cardiac involvement are less characteristic. SLE also provides a satisfactory explanation for much of the symptoms, although the rash characteristics, normal urinalysis, and leukocytosis make this diagnosis less likely.
Additional testing that should be performed includes serum antinuclear antibody (ANA) and ferritin, since the latter may be markedly elevated in the setting of HLH. Bone marrow aspirate and biopsy should be performed looking specifically for evidence of hemophagocytosis. Finally, a transthoracic echocardiogram (TTE) should be performed to assess evidence of myocardial dysfunction as it may alter the therapeutic approach, although the results will be unlikely to differentiate between the preceding considerations.
Troponin I was negative, but N-terminal probrain natriuretic peptide was elevated at 20,000 pg/mL (normal, 0-900). D-dimer was negative. TTE showed left ventricular ejection fraction (LVEF) of 35% with global left ventricular hypokinesis. On three separate examinations, the peripheral blood smear did not show malarial parasites, atypical lymphocytes, or schistocytes. Three sets of blood cultures, testing for bacteria and fungi, were sterile. A throat culture was sterile. Widal test, as well as Leptospira and Mycoplasma serologies, were negative. Serology for Legionella pneumophila was positive, but the urinary antigen testing was negative. Antibodies to HIV 1 and 2 and anti-hepatitis C virus (HCV) antibody were negative. Dengue IgM ELISA (qualitative) returned positive.
Despite the absence of arthralgias, myalgias, headache, and retro-orbital pain, a positive dengue IgM ELISA supports acute dengue infection, provided the patient did not experience an unexplained febrile illness in the previous months. Most of his presentation may be explained by dengue, including fever, rash, liver abnormalities, myocardial dysfunction, and thrombocytopenia. The bilateral airspace opacities seen on chest radiograph also fit reasonably provided these actually reflect pulmonary edema. Leukocytosis (as opposed to leukopenia) is highly unexpected in dengue, but its presence could be an outlier.
If dengue does indeed explain the entire presentation, defervescence should have occurred by the time the blood cultures and serologic studies returned. Also, by that time, the patient would be expected to demonstrate evidence of improvement, barring the appearance of the serious complications of dengue hemorrhagic fever/dengue shock syndrome. Should fever persist and signs of recovery fail to materialize, the possibility of a superimposed process will need to be considered. Of note, the sensitivity of Leptospira serology early in the course of illness is low, and leptospirosis is thus not yet excluded.
A presumptive diagnosis of severe dengue fever was made, based on evidence of pulmonary edema and sepsis. The patient was managed conservatively with oral fluid restriction, low dose of diuretics, and supplemental oxygenation. The patient was also given levofloxacin for possible legionellosis. Despite these therapies, the patient had no improvement in 24 hours. His tachypnea increased, and his measured PaO2 to FIO2 (P:F) ratio decreased to 230 from 285 on admission. This prompted the initiation of BiPAP at 10 cm H2O inspiration PAP and 5 cm H2O expiration PAP. However, he did not tolerate BiPAP, and his P:F ratio decreased to below 200.
The patient was transferred to the intensive care unit and underwent elective intubation with mechanical ventilation. Axial and coronal computed tomography of the thorax (Figure 1A and 1B, respectively) showed extensive ground-glass opacities and consolidation sparing the nondependent portions of the lungs. On physical inspection, a round, well-defined, painless black lesion surrounded by erythema was noticed in the right axilla (Figure 2). The rest of the examination findings were unchanged.
The discovery of eschar in the axilla provides a “pivot point” in determining the cause of the patient’s illness. This finding appears to point, with high specificity, toward rickettsia as the explanation of the patient’s disease, and this is most likely to be scrub typhus. The report of a positive dengue IgM may represent concurrent infection or may simply reflect a recent infection in an area that is highly endemic for dengue. Although most of the patient’s clinical presentation could be attributed to dengue, multiple features including the leukocytosis, myocarditis, and elevated bilirubin are more likely to be seen in scrub typhus. In any event, dengue cannot satisfactorily explain the eschar.
No mention has been made to the initiation of doxycycline thus far; this agent needs to be started promptly. Polymerase chain reaction (PCR) testing for scrub typhus should be ordered if available; if not, acute and convalescent serology may be obtained.
Given the finding of axillary eschar, the patient was diagnosed with scrub typhus. Doxycycline 100 mg by nasogastric tube twice a day was initiated. The patient began to show marked symptomatic improvement. His P:F ratio improved, and he was successfully weaned off and extubated after 24 hours. Postextubation, he was kept on BiPAP for 12 hours. He was transferred out of the ICU and monitored for 72 hours. With therapy, his cytopenias, liver and renal function, and ECG normalized. Indirect immunofluorescence assay for scrub typhus returned positive at a dilution of > 1:512. PCR assay targeting the 56 kDa region of Orientia tsutsugamushi was also positive. Repeated TTE showed an LVEF of 65%. He was subsequently discharged with oral doxycycline and a plan to complete a course of 14 days on an outpatient basis. The final diagnosis was scrub typhus with myocarditis leading to acutely decompensated heart failure with reduced ejection fraction.
DISCUSSION
Scrub typhus is a mite-borne tropical infection caused by the gram-negative intracellular parasite Orientia tsutsugamushi from the Rickettsiaceae family that is known to occur in certain parts of Asia and Australia. Although this entity is well known in the Sub Himalayan belt and southern part of India, very few cases have been described in Delhi, the capital state in North India. Scrub typhus, like most other tropical infections, is found most often during the postmonsoon season.1,2
Patients with scrub typhus present with fever in addition to a variety of nonspecific symptoms and findings. These often manifest within 10 days of being bitten by a mite. Malaise, headache, myalgias, lymphadenopathy, and maculopapular or petechial rash are common. If present, the rash manifests on the 3rd to 5th day of fever.3 Disseminated vasculitis due to scrub typhus can frequently result in multiorgan system involvement. Pulmonary involvement often leads to acute respiratory distress syndrome (ARDS) with an incidence of 8%-10%.1,4 Acute kidney injury, mostly mild and nonoliguric, has been reported in up to 2/3 cases.4-6 The cardiac myocyte is a known target cell affected by scrub typhus, and therefore patients commonly present with myocarditis.7 Liver involvement in scrub typhus is evident through elevated liver enzymes and can occur without other clinical evidence of the illness.4,6,8,9 As in dengue, patients often develop thrombocytopenia, but normal hemoglobin in scrub typhus differentiates it from dengue.6,8
Given the nonspecific presentation, it can be challenging to diagnose and treat scrub typhus. The gold standard for diagnosis is the detection of IgM antibodies to Orientia tsutsugamushi using an indirect immunofluorescence assay (IFA). For patients from endemic regions, it may be necessary to show a four-fold increase in titers two weeks apart to distinguish from background immunity. Presence of the characteristic eschar, as discussed below, is highly suggestive of scrub typhus. The treatment of choice is doxycycline or azithromycin for seven days.10,11 Early initiation of doxycycline when considering either scrub typhus or leptospirosis is appropriate and may be life-saving.
Medical decision making is fraught with uncertainty, and physicians must use their experience, evidence base, and cognitive heuristics wisely to care for patients effectively. For this patient, the region of Delhi experiences massive outbreaks of dengue every year during the time the patient presented to the hospital, whereas rickettsia infections are relatively uncommon. The clinical presentation was conceivably consistent with either dengue or scrub typhus, though somewhat more suggestive of the latter. Once the serological diagnosis of recent or concomitant dengue was obtained, however, scrub typhus was considered even less. The team called upon Occam’s razor or the heuristic that the simplest and most unifying explanation for any given problem is the one most likely to be correct and that other, less satisfactory explanations (in this case, scrub typhus) are “shaven off.” The patient was managed conservatively for dengue. Only when his condition worsened did the team recognize this conflicting information without dismissing it, consider alternative possibilities, and reexamined the patient.
An eschar can be an important clue in the diagnosis of scrub typhus, though it is not often obvious. The presence of this necrotic skin lesion with black crust is highly suggestive of scrub typhus, and in the right clinical context, it is virtually diagnostic. However, it is uncommon (9.5%-45%) in most of the studies from the Indian subcontinent (ie, high specificity but low sensitivity).1,12 An eschar is often found in obscure locations such as the axillae or groin, areas that may easily be missed or overlooked. Eschars may be seen in a variety of other infectious diseases, including rickettsia pox, Rocky Mountain spotted fever, other members of the spotted fever group, tularemia, and cutaneous anthrax. Given this patient’s lack of improvement, repeated examination revealed an eschar in the right axilla, a finding that was either missed or still evolving at the time of presentation.
This case illustrates the challenges in interpreting the significance of multiple positive serological tests in the context of an undifferentiated clinical syndrome. Possible reasons for a positive dengue serology could have been persistent antibodies from a previous infection, recent asymptomatic infection, concurrent infection, or cross-reactivity with flaviviruses such as West Nile Virus or Japanese Encephalitis.13 The patient also had positive IgM antibodies against Legionella pneumophila, but the urinary antigen was negative. In view of a negative antigen test, low specificity of the serologic test, low incidence of legionellosis in the Indian subcontinent, and absence of therapeutic response to a trial of fluoroquinolones, the diagnosis of legionellosis was considered unlikely in this patient.
With rapid advancements in technology, the importance of history taking and physical examination is at risk of being overshadowed. Approximately 80% of correct diagnoses in medicine can arrive through history and physical examination alone.14,15 In this case, Occam’s razor combined with multiple serological tests was relied on to create the likely list of diagnoses. However, recognition of the limitations of these heuristics and tests proved critical. The life-saving diagnosis was only made when the clinicians returned to basics, looked in every nook and cranny, and found the eschar on physical examination.
KEY TEACHING POINTS
- In patients living in endemic areas who present with an acute febrile illness, the differential diagnosis should include “tropical” infections such as dengue, chikungunya, enteric fever, leptospirosis, malaria, and scrub typhus.
- Serology is commonly employed for diagnosis of tropical infections, which may be misleading. These tests can be falsely positive from past asymptomatic infection or cross reactivity between antibodies, or falsely negative, as in the first few days of infection.
- Presence of eschar is a very useful clue in the diagnosis of scrub typhus, but this finding can be missed since it is often found in obscure locations. A thorough clinical history and physical examination are paramount.
Disclosures
The authors do not report any conflict of interest.
A 46-year-old man presented to the emergency room in the postmonsoon month of September with a seven-day history of high fevers as well as a four-day history of a dry cough, dyspnea, and progressive rash. The patient reported no chest pain, hemoptysis, chest tightness, palpitations, wheezing, orthopnea, paroxysmal nocturnal dyspnea, or leg swelling. He lived and sought healthcare in Delhi, India.
Fever followed by a progressive but as yet uncharacterized rash and pulmonary symptoms in a middle-aged man suggests a host of possibilities. While it is tempting to ascribe his symptoms to an infectious process, especially a “tropical” infection based on his residence in Delhi, the location may simply represent a red herring. Potential infections can be divided into those endemic to the Indian subcontinent, and those encountered more globally. The former include diseases such as measles and dengue, while the latter include entities such as Mycoplasma pneumonia, varicella, and acute human immunodeficiency virus (HIV) infection. Noninfectious categories of diseases that should be considered include drug reactions and rheumatologic processes. Several rheumatologic diseases, including granulomatosis with polyangiitis, eosinophilic granulomatosis with polyangiitis, and systemic lupus erythematosus (SLE) may present with fever, rash, and pulmonary symptomatology.
A history of the patient’s exposures, both environmental and pharmaceutical, should be obtained. More information regarding his immunization history, rash characteristics (distribution and nature of the lesions), and other salient exam findings such as organomegaly and joint abnormalities will be helpful.
Fever reached a maximum of 103° Fahrenheit and was associated with chills but not rigors. There were several fever spikes daily, relieved completely with antipyretics. The patient’s dyspnea was predominantly noted on exertion, nonpleuritic, not temporally related to cough, and progressively worsening over three days. The skin lesions were first noticed on his trunk and were described as reddish, flat, and pinpoint size. However, the rash spread to the face and extremities sparing the palms and soles. There was no bleeding, nausea, vomiting, abdominal pain, change in bowel habits, dysuria, headache, photophobia, neck stiffness, or joint pain.
The patient reported no significant past medical history, took no medications, and had no recent travel outside of Delhi, India in the past year. He was married and monogamous. He had no pets nor did he report any contact with animals. He did not use tobacco, alcohol, or illicit substances. He did not remember being bitten by an insect. He worked as a software engineer. There was no history of similar illness in the patient’s family or at his workplace. He had no history of recent blood transfusion or immunization (including MMR and Tdap).
Several noninfectious and inflammatory conditions can explain his symptoms. Eosinophilic granulomatosis with polyangiitis is considerably less likely in the absence of asthma, and vasculitic processes, in general, are less likely given the nongravity dependent nature of the rash. SLE and sarcoidosis are possible causes of a systemic inflammatory illness presenting acutely with fever, rash, and pulmonary symptoms.
The patient’s expanded history makes several infections less likely. Although much of the presentation is consistent with measles, the initial appearance of the truncal rash is atypical, and there is no mention of coryza or conjunctivitis. Likewise, the description of the exanthem is not suggestive of varicella, and dengue and chikungunya are much less likely in the absence of a headache and arthralgias. Other infections including leptospirosis and scrub typhus are possible, and both might be contracted in greater Delhi. Typhoid is another infectious syndrome endemic to the Indian subcontinent that should be considered. The presence of rash involving the face and extremities would be highly atypical, however; and the presence of dyspnea and the absence of a headache argue against typhoid. Acute HIV infection and Mycoplasma pneumonia remain possible diagnoses. Toxic shock syndrome is possible, but a faster and fulminant course would be expected.
On physical examination, the temperature was 103° Fahrenheit, heart rate was 120 beats per minute and regular, respiratory rate was 24 breaths per minute, blood pressure was 100/60 mm Hg, and resting oxygen saturation was 93% while breathing ambient air. He appeared uncomfortable. Jugular venous pulse was elevated at 10 cm H2O. Mild icterus was present, but there was neither conjunctival congestion nor subconjunctival hemorrhage. S1 and S2 heart sounds were loud, but there were no murmurs. Chest auscultation revealed bilateral basal coarse crackles. The abdominal right upper quadrant was mildly tender to palpation, and the liver edge was palpable 2 cm below the subcostal margin. There was neither splenomegaly nor peripheral lymphadenopathy. Kernig and Brudzinski signs were negative, and there were no focal neurological deficits. A generalized, nonpalpable, maculopapular and petechial rash was present on the face, extremities, and trunk.
The patient’s presentation must now incorporate the additional findings of bibasilar chest crackles, maculopapular/petechial rash, icterus, modest hypoxia, and hepatomegaly. Some of the noninfectious entities already mentioned (SLE and sarcoidosis) remain possible explanations. Hemophagocytic lymphohistiocytosis (HLH) may also explain most of the patient’s presenting signs and symptoms, and several other infectious diseases account for his presentation. Scrub typhus (or a more uncommon rickettsia disease, Indian tick typhus), leptospirosis, and perhaps infective endocarditis seem most likely to provide a unifying diagnosis for the symptoms mentioned above. Leptospirosis presents in a minority of instances as a severe illness known as Weil disease, characterized by several of this patient’s findings including icterus, kidney injury, and pulmonary symptoms. However, the rash is relatively uncommon in leptospirosis and when present, is usually more localized. The patient’s rash as described is not typically expected in infective endocarditis, although high-grade Staphylococcus aureus bacteremia will occasionally present with a diffuse rash that may be confused with that of meningococcemia. The etiology of the patient’s elevated jugular venous pressure is not readily apparent, with the cardiac examination making acute valvular insufficiency much less likely. Myocarditis, however, is possible in the setting of several of the diseases listed above, including leptospirosis, scrub typhus, SLE, and dengue.
In addition to basic laboratory studies and a chest radiograph, multiple sets of blood cultures should be obtained, along with a transthoracic echocardiogram and a ferritin level. The evidence to support leptospirosis and scrub typhus is strong enough to justify empiric use of doxycycline once the blood cultures are obtained, especially given the difficulty in definitively diagnosing these diseases in a timely fashion.
Laboratory analysis revealed a total leukocyte count of 13,600/uL (85% neutrophils), hemoglobin 10 g/dL, and platelet count 35,000/uL. Absolute eosinophil count was 136/uL. Serum chemistry showed sodium of 145 meq/L, potassium 4.1 meq/L, blood urea nitrogen 80 mg/dL, creatinine 1.6 mg/dL, aspartate transaminase (AST) 44 U/L (normal, 0-40), alanine transaminase (ALT) 81 U/L (normal, 0-40), direct bilirubin 3 mg/dL, and indirect bilirubin 3 mg/dL. Lactate dehydrogenase, alkaline phosphatase, albumin, and coagulation studies were normal. Erythrocyte sedimentation rate (ESR) was 42 mm (normal, 0-25) and highly sensitive C-reactive protein was 42 mg/L (normal, 0-10). Arterial blood gas on ambient air revealed a pH of 7.52, PaCO2 24 mm Hg, PaO2 55 mm Hg, and bicarbonate 20 meq/L. Urinalysis was normal. Blood cultures were obtained. Electrocardiogram (ECG) showed regular narrow complex tachycardia with incomplete left bundle branch block. Old ECGs were not available for comparison. Chest radiograph showed bilateral air space opacities with evidence of vein cephalization. Abdominal and pelvis ultrasonography showed pericholecystic fluid and mild hepatomegaly, but no free fluid, pleural effusion, or evidence of cholecystitis. Point of care immunochromatographic rapid malarial antigen detection test (detects Plasmodium falciparum, Plasmodium vivax, Plasmodium malaria, and Plasmodium ovale) was negative.
Most of the findings described are commonly observed in both scrub typhus and leptospirosis, including cytopenias, parenchymal infiltrates, hepatomegaly, elevated transaminases and bilirubin, cardiac involvement, fever, and rash. The rash described is more consistent with scrub typhus than with leptospirosis. The absence of a headache and joint findings argue modestly against these diagnoses. Likewise, HLH provides an adequate explanation for most of the patient’s symptoms, signs, and test results. These include fever, lung involvement, rash, hepatomegaly, elevated bilirubin, and cytopenias; however, leukocytosis and cardiac involvement are less characteristic. SLE also provides a satisfactory explanation for much of the symptoms, although the rash characteristics, normal urinalysis, and leukocytosis make this diagnosis less likely.
Additional testing that should be performed includes serum antinuclear antibody (ANA) and ferritin, since the latter may be markedly elevated in the setting of HLH. Bone marrow aspirate and biopsy should be performed looking specifically for evidence of hemophagocytosis. Finally, a transthoracic echocardiogram (TTE) should be performed to assess evidence of myocardial dysfunction as it may alter the therapeutic approach, although the results will be unlikely to differentiate between the preceding considerations.
Troponin I was negative, but N-terminal probrain natriuretic peptide was elevated at 20,000 pg/mL (normal, 0-900). D-dimer was negative. TTE showed left ventricular ejection fraction (LVEF) of 35% with global left ventricular hypokinesis. On three separate examinations, the peripheral blood smear did not show malarial parasites, atypical lymphocytes, or schistocytes. Three sets of blood cultures, testing for bacteria and fungi, were sterile. A throat culture was sterile. Widal test, as well as Leptospira and Mycoplasma serologies, were negative. Serology for Legionella pneumophila was positive, but the urinary antigen testing was negative. Antibodies to HIV 1 and 2 and anti-hepatitis C virus (HCV) antibody were negative. Dengue IgM ELISA (qualitative) returned positive.
Despite the absence of arthralgias, myalgias, headache, and retro-orbital pain, a positive dengue IgM ELISA supports acute dengue infection, provided the patient did not experience an unexplained febrile illness in the previous months. Most of his presentation may be explained by dengue, including fever, rash, liver abnormalities, myocardial dysfunction, and thrombocytopenia. The bilateral airspace opacities seen on chest radiograph also fit reasonably provided these actually reflect pulmonary edema. Leukocytosis (as opposed to leukopenia) is highly unexpected in dengue, but its presence could be an outlier.
If dengue does indeed explain the entire presentation, defervescence should have occurred by the time the blood cultures and serologic studies returned. Also, by that time, the patient would be expected to demonstrate evidence of improvement, barring the appearance of the serious complications of dengue hemorrhagic fever/dengue shock syndrome. Should fever persist and signs of recovery fail to materialize, the possibility of a superimposed process will need to be considered. Of note, the sensitivity of Leptospira serology early in the course of illness is low, and leptospirosis is thus not yet excluded.
A presumptive diagnosis of severe dengue fever was made, based on evidence of pulmonary edema and sepsis. The patient was managed conservatively with oral fluid restriction, low dose of diuretics, and supplemental oxygenation. The patient was also given levofloxacin for possible legionellosis. Despite these therapies, the patient had no improvement in 24 hours. His tachypnea increased, and his measured PaO2 to FIO2 (P:F) ratio decreased to 230 from 285 on admission. This prompted the initiation of BiPAP at 10 cm H2O inspiration PAP and 5 cm H2O expiration PAP. However, he did not tolerate BiPAP, and his P:F ratio decreased to below 200.
The patient was transferred to the intensive care unit and underwent elective intubation with mechanical ventilation. Axial and coronal computed tomography of the thorax (Figure 1A and 1B, respectively) showed extensive ground-glass opacities and consolidation sparing the nondependent portions of the lungs. On physical inspection, a round, well-defined, painless black lesion surrounded by erythema was noticed in the right axilla (Figure 2). The rest of the examination findings were unchanged.
The discovery of eschar in the axilla provides a “pivot point” in determining the cause of the patient’s illness. This finding appears to point, with high specificity, toward rickettsia as the explanation of the patient’s disease, and this is most likely to be scrub typhus. The report of a positive dengue IgM may represent concurrent infection or may simply reflect a recent infection in an area that is highly endemic for dengue. Although most of the patient’s clinical presentation could be attributed to dengue, multiple features including the leukocytosis, myocarditis, and elevated bilirubin are more likely to be seen in scrub typhus. In any event, dengue cannot satisfactorily explain the eschar.
No mention has been made to the initiation of doxycycline thus far; this agent needs to be started promptly. Polymerase chain reaction (PCR) testing for scrub typhus should be ordered if available; if not, acute and convalescent serology may be obtained.
Given the finding of axillary eschar, the patient was diagnosed with scrub typhus. Doxycycline 100 mg by nasogastric tube twice a day was initiated. The patient began to show marked symptomatic improvement. His P:F ratio improved, and he was successfully weaned off and extubated after 24 hours. Postextubation, he was kept on BiPAP for 12 hours. He was transferred out of the ICU and monitored for 72 hours. With therapy, his cytopenias, liver and renal function, and ECG normalized. Indirect immunofluorescence assay for scrub typhus returned positive at a dilution of > 1:512. PCR assay targeting the 56 kDa region of Orientia tsutsugamushi was also positive. Repeated TTE showed an LVEF of 65%. He was subsequently discharged with oral doxycycline and a plan to complete a course of 14 days on an outpatient basis. The final diagnosis was scrub typhus with myocarditis leading to acutely decompensated heart failure with reduced ejection fraction.
DISCUSSION
Scrub typhus is a mite-borne tropical infection caused by the gram-negative intracellular parasite Orientia tsutsugamushi from the Rickettsiaceae family that is known to occur in certain parts of Asia and Australia. Although this entity is well known in the Sub Himalayan belt and southern part of India, very few cases have been described in Delhi, the capital state in North India. Scrub typhus, like most other tropical infections, is found most often during the postmonsoon season.1,2
Patients with scrub typhus present with fever in addition to a variety of nonspecific symptoms and findings. These often manifest within 10 days of being bitten by a mite. Malaise, headache, myalgias, lymphadenopathy, and maculopapular or petechial rash are common. If present, the rash manifests on the 3rd to 5th day of fever.3 Disseminated vasculitis due to scrub typhus can frequently result in multiorgan system involvement. Pulmonary involvement often leads to acute respiratory distress syndrome (ARDS) with an incidence of 8%-10%.1,4 Acute kidney injury, mostly mild and nonoliguric, has been reported in up to 2/3 cases.4-6 The cardiac myocyte is a known target cell affected by scrub typhus, and therefore patients commonly present with myocarditis.7 Liver involvement in scrub typhus is evident through elevated liver enzymes and can occur without other clinical evidence of the illness.4,6,8,9 As in dengue, patients often develop thrombocytopenia, but normal hemoglobin in scrub typhus differentiates it from dengue.6,8
Given the nonspecific presentation, it can be challenging to diagnose and treat scrub typhus. The gold standard for diagnosis is the detection of IgM antibodies to Orientia tsutsugamushi using an indirect immunofluorescence assay (IFA). For patients from endemic regions, it may be necessary to show a four-fold increase in titers two weeks apart to distinguish from background immunity. Presence of the characteristic eschar, as discussed below, is highly suggestive of scrub typhus. The treatment of choice is doxycycline or azithromycin for seven days.10,11 Early initiation of doxycycline when considering either scrub typhus or leptospirosis is appropriate and may be life-saving.
Medical decision making is fraught with uncertainty, and physicians must use their experience, evidence base, and cognitive heuristics wisely to care for patients effectively. For this patient, the region of Delhi experiences massive outbreaks of dengue every year during the time the patient presented to the hospital, whereas rickettsia infections are relatively uncommon. The clinical presentation was conceivably consistent with either dengue or scrub typhus, though somewhat more suggestive of the latter. Once the serological diagnosis of recent or concomitant dengue was obtained, however, scrub typhus was considered even less. The team called upon Occam’s razor or the heuristic that the simplest and most unifying explanation for any given problem is the one most likely to be correct and that other, less satisfactory explanations (in this case, scrub typhus) are “shaven off.” The patient was managed conservatively for dengue. Only when his condition worsened did the team recognize this conflicting information without dismissing it, consider alternative possibilities, and reexamined the patient.
An eschar can be an important clue in the diagnosis of scrub typhus, though it is not often obvious. The presence of this necrotic skin lesion with black crust is highly suggestive of scrub typhus, and in the right clinical context, it is virtually diagnostic. However, it is uncommon (9.5%-45%) in most of the studies from the Indian subcontinent (ie, high specificity but low sensitivity).1,12 An eschar is often found in obscure locations such as the axillae or groin, areas that may easily be missed or overlooked. Eschars may be seen in a variety of other infectious diseases, including rickettsia pox, Rocky Mountain spotted fever, other members of the spotted fever group, tularemia, and cutaneous anthrax. Given this patient’s lack of improvement, repeated examination revealed an eschar in the right axilla, a finding that was either missed or still evolving at the time of presentation.
This case illustrates the challenges in interpreting the significance of multiple positive serological tests in the context of an undifferentiated clinical syndrome. Possible reasons for a positive dengue serology could have been persistent antibodies from a previous infection, recent asymptomatic infection, concurrent infection, or cross-reactivity with flaviviruses such as West Nile Virus or Japanese Encephalitis.13 The patient also had positive IgM antibodies against Legionella pneumophila, but the urinary antigen was negative. In view of a negative antigen test, low specificity of the serologic test, low incidence of legionellosis in the Indian subcontinent, and absence of therapeutic response to a trial of fluoroquinolones, the diagnosis of legionellosis was considered unlikely in this patient.
With rapid advancements in technology, the importance of history taking and physical examination is at risk of being overshadowed. Approximately 80% of correct diagnoses in medicine can arrive through history and physical examination alone.14,15 In this case, Occam’s razor combined with multiple serological tests was relied on to create the likely list of diagnoses. However, recognition of the limitations of these heuristics and tests proved critical. The life-saving diagnosis was only made when the clinicians returned to basics, looked in every nook and cranny, and found the eschar on physical examination.
KEY TEACHING POINTS
- In patients living in endemic areas who present with an acute febrile illness, the differential diagnosis should include “tropical” infections such as dengue, chikungunya, enteric fever, leptospirosis, malaria, and scrub typhus.
- Serology is commonly employed for diagnosis of tropical infections, which may be misleading. These tests can be falsely positive from past asymptomatic infection or cross reactivity between antibodies, or falsely negative, as in the first few days of infection.
- Presence of eschar is a very useful clue in the diagnosis of scrub typhus, but this finding can be missed since it is often found in obscure locations. A thorough clinical history and physical examination are paramount.
Disclosures
The authors do not report any conflict of interest.
1. Gupta N, Chaudhry R, Kabra SK, et al. In search of scrub typhus: a prospective analysis of clinical and epidemiological profile of patients from a tertiary care hospital in New Delhi. Adv Infect Dis. 2015;5(4):140. doi: 10.4236/aid.2015.54017.
2. Kamarasu K, Malathi M, Rajagopal V, Subramani K, Jagadeeshramasamy D, Mathai E. Serological evidence for the wide distribution of spotted fevers & typhus fever in Tamil Nadu. Indian J Med Res. 2007;126(2):128-130. PubMed
3. Mahajan SK. Scrub typhus. J Assoc Physicians India. 2005;53:954-958. PubMed
4. Mahajan SK, Rolain JM, Kashyap R, et al. Scrub typhus in the Himalayas. Emerg Infect Dis. 2006;12(10):1590-1592. doi: 10.3201/eid1210.051697. PubMed
5. Attur RP, Kuppasamy S, Bairy M, et al. Acute kidney injury in scrub typhus. Clin Exp Nephrol. 2013;17(5):725-729. doi: 10.1007/s10157-012-0753-9. PubMed
6. Varghese GM, Trowbridge P, Janardhanan J, et al. Clinical profile and improving mortality trend of scrub typhus in South India. Int J Infect Dis. 2014;23:39-43. doi: 10.1016/j.ijid.2014.02.009. PubMed
7. Taylor AJ, Paris DH, Newton PN. A systematic review of mortality from untreated scrub typhus (Orientia tsutsugamushi). PLoS Negl Trop Dis. 2015;9(8):e0003971. doi.org/10.1371/journal.pntd.0003971 PubMed
8. Chrispal A, Boorugu H, Gopinath KG, et al. Scrub typhus: an unrecognized threat in South India-clinical profile and predictors of mortality. Trop Doct. 2010;40(3):129-133. doi: 10.1258/td.2010.090452. PubMed
9. Mathai E, Rolain JM, Verghese GM, et al. Outbreak of scrub typhus in southern India during the cooler months. Ann N Y Acad Sci. 2003;990:359-364. doi: 10.1111/j.1749-6632.2003.tb07391.x PubMed
10. Gupta N, Chaudhry R, Kabra SK, et al. Comparative evaluation of serological and molecular methods for the diagnosis of scrub typhus in Indian settings. Jpn J Infect Dis. 2017;70(2):221-222. doi: 10.7883/yoken.JJID.2016.139. PubMed
11. Rahi M, Gupte MD, Bhargava A, Varghese GM, Arora R. DHR-ICMR Guidelines for diagnosis & management of Rickettsial diseases in India. Indian J Med Res. 2015;141(4):417-422. doi: 10.4103/0971-5916.159279. PubMed
12. Sharma A, Mahajan S, Gupta ML, Kanga A, Sharma V. Investigation of an outbreak of scrub typhus in the Himalayan region of India. Jpn J Infect Dis. 2005;58(4):208-210. PubMed
13. Gupta N, Chaudhry R, Mirdha B, et al. Scrub typhus and leptospirosis: the fallacy of diagnosing with IgM enzyme-linked immunosorbent assay. J Microb Biochem Technol. 2016;8:71-75. doi: 10.4172/1948-5948.1000265.
14. Peterson MC, Holbrook JH, Von Hales D, Smith NL, Staker LV. Contributions of the history, physical examination, and laboratory investigation in making medical diagnoses. West J Med. 1992;156(2):163-165. doi: 10.1097/00006254-199210000-00013 PubMed
15. Roshan M, Rao AP. A study on relative contributions of the history, physical examination and investigations in making a medical diagnosis. J Assoc Physicians India. 2000;48(8):771-775. PubMed
1. Gupta N, Chaudhry R, Kabra SK, et al. In search of scrub typhus: a prospective analysis of clinical and epidemiological profile of patients from a tertiary care hospital in New Delhi. Adv Infect Dis. 2015;5(4):140. doi: 10.4236/aid.2015.54017.
2. Kamarasu K, Malathi M, Rajagopal V, Subramani K, Jagadeeshramasamy D, Mathai E. Serological evidence for the wide distribution of spotted fevers & typhus fever in Tamil Nadu. Indian J Med Res. 2007;126(2):128-130. PubMed
3. Mahajan SK. Scrub typhus. J Assoc Physicians India. 2005;53:954-958. PubMed
4. Mahajan SK, Rolain JM, Kashyap R, et al. Scrub typhus in the Himalayas. Emerg Infect Dis. 2006;12(10):1590-1592. doi: 10.3201/eid1210.051697. PubMed
5. Attur RP, Kuppasamy S, Bairy M, et al. Acute kidney injury in scrub typhus. Clin Exp Nephrol. 2013;17(5):725-729. doi: 10.1007/s10157-012-0753-9. PubMed
6. Varghese GM, Trowbridge P, Janardhanan J, et al. Clinical profile and improving mortality trend of scrub typhus in South India. Int J Infect Dis. 2014;23:39-43. doi: 10.1016/j.ijid.2014.02.009. PubMed
7. Taylor AJ, Paris DH, Newton PN. A systematic review of mortality from untreated scrub typhus (Orientia tsutsugamushi). PLoS Negl Trop Dis. 2015;9(8):e0003971. doi.org/10.1371/journal.pntd.0003971 PubMed
8. Chrispal A, Boorugu H, Gopinath KG, et al. Scrub typhus: an unrecognized threat in South India-clinical profile and predictors of mortality. Trop Doct. 2010;40(3):129-133. doi: 10.1258/td.2010.090452. PubMed
9. Mathai E, Rolain JM, Verghese GM, et al. Outbreak of scrub typhus in southern India during the cooler months. Ann N Y Acad Sci. 2003;990:359-364. doi: 10.1111/j.1749-6632.2003.tb07391.x PubMed
10. Gupta N, Chaudhry R, Kabra SK, et al. Comparative evaluation of serological and molecular methods for the diagnosis of scrub typhus in Indian settings. Jpn J Infect Dis. 2017;70(2):221-222. doi: 10.7883/yoken.JJID.2016.139. PubMed
11. Rahi M, Gupte MD, Bhargava A, Varghese GM, Arora R. DHR-ICMR Guidelines for diagnosis & management of Rickettsial diseases in India. Indian J Med Res. 2015;141(4):417-422. doi: 10.4103/0971-5916.159279. PubMed
12. Sharma A, Mahajan S, Gupta ML, Kanga A, Sharma V. Investigation of an outbreak of scrub typhus in the Himalayan region of India. Jpn J Infect Dis. 2005;58(4):208-210. PubMed
13. Gupta N, Chaudhry R, Mirdha B, et al. Scrub typhus and leptospirosis: the fallacy of diagnosing with IgM enzyme-linked immunosorbent assay. J Microb Biochem Technol. 2016;8:71-75. doi: 10.4172/1948-5948.1000265.
14. Peterson MC, Holbrook JH, Von Hales D, Smith NL, Staker LV. Contributions of the history, physical examination, and laboratory investigation in making medical diagnoses. West J Med. 1992;156(2):163-165. doi: 10.1097/00006254-199210000-00013 PubMed
15. Roshan M, Rao AP. A study on relative contributions of the history, physical examination and investigations in making a medical diagnosis. J Assoc Physicians India. 2000;48(8):771-775. PubMed
© 2019 Society of Hospital Medicine
Condom Catheters versus Indwelling Urethral Catheters in Men: A Prospective, Observational Study
Millions of patients use urinary collection devices. For men, both indwelling and condom-style urinary catheters (known as “external catheters”) are commonly used. National infection prevention guidelines recommend condom catheters as a preferred alternative to indwelling catheters for patients without urinary retention1,2 to reduce the risk of catheter-associated urinary tract infection (UTI). Unfortunately, little outcome data comparing condom catheters with indwelling urethral catheters exists. We therefore assessed the incidence of infectious and noninfectious complications in condom catheter and indwelling urethral catheter users.
PATIENTS AND METHODS
Study Overview
As part of a larger prospective, observational study,3 we compared complications in patients who received a condom catheter during hospitalization with those in patients who received an indwelling urethral catheter. Hospitalized patients with either a condom catheter or indwelling urethral catheter were identified at two Veterans Affairs (VA) medical centers and followed for 30 days after initial catheter placement. Patient-reported data were collected during in-person patient interviews at baseline (within three days of catheter placement), and by in-person or phone interviews at 14 days and 30 days postplacement (Supplementary Appendix A and B). Questions were primarily closed-ended, except for a final question inviting open comments. Information about the catheter and any reported complications was also collected from electronic medical record documentation for each patient. Institutional review board approval was received from both participating study sites.
Data Collection and Inclusion Criteria
Hospitalized patients who had a condom or indwelling urethral catheter placed were eligible to participate if they met the following criteria: (1) were hospitalized on an acute care unit; (2) had a new condom catheter or indwelling urethral catheter placed during this hospital stay that was not present on admission; (3) had a device in place for three days or less; (4) were at least 18 years old; and (5) were able to speak English. Patients were excluded if they: (1) did not have the capacity to give consent or participate in the interview/assessment process; (2) refused to provide written informed consent to participate; or (3) had previously participated in this project.
As the larger study was focused on indwelling urethral catheter users, participants with a condom catheter were recruited from only one facility, while those with an indwelling urethral catheter were recruited from both hospitals. Indwelling catheter patients that had a possible contraindication to condom catheter use (such as urinary retention or perioperative use for a surgical procedure) were excluded to make the groups comparable. Any indication for condom catheterization was permitted.
Information about catheter-related complications was collected from two sources: directly from patients and through medical record review. Patients were interviewed at baseline and approximately 14 days and 30 days after catheter placement. The follow-up assessments asked patients about their symptoms and experience over the previous two weeks. We also conducted a medical record review covering the 30 days after initial catheter placement.
Study Measures
Data Analysis
The primary outcome was the percentage of patients who experienced a complication related to a urinary catheter during the 30 days after the catheter was initially placed. Comparisons by group—condom versus indwelling catheter—were conducted using chi-square tests (Fisher’s exact test when necessary) for categorical variables and the Student’s t-test for continuous variables. All analyses were performed using SAS (Cary, North Carolina). All statistical tests were two-sided with alpha set to .05.
RESULTS
Of the 76 patients invited to participate after having a condom catheter placed, 49 consented (64.5%). Of those, 36 had sufficient data for inclusion in this analysis. The comparison group consisted of 44 patients with an indwelling urethral catheter. There were no statistically significant differences between the two groups in terms of age, race, or ethnicity (Table 1). There were statistically significant differences in patient-reported reasons for catheter placement, but these were due to the exclusion criteria used for indwelling urethral catheter patients.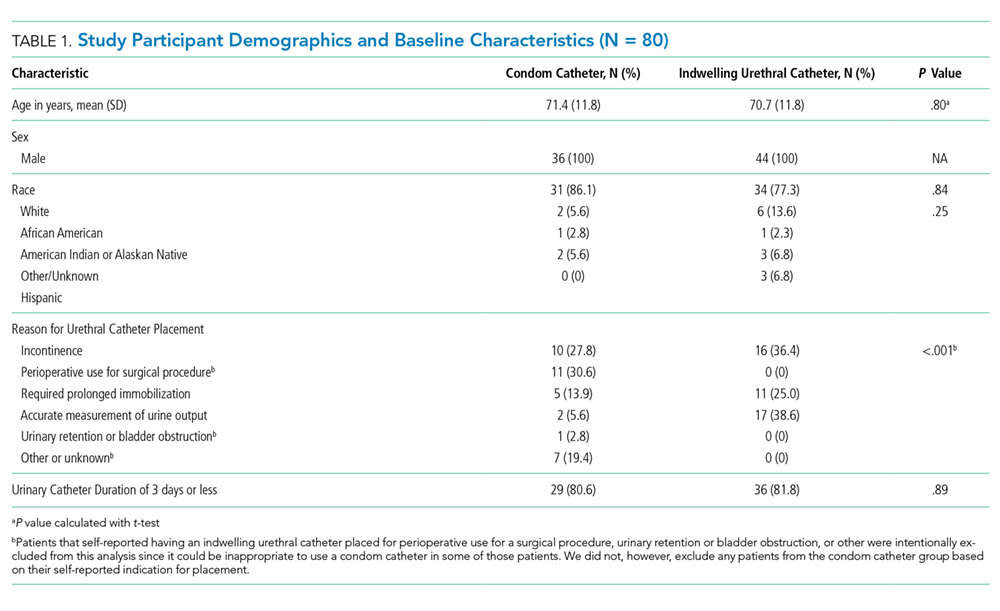
Both patient-reported and clinician-reported (ie, recorded in the patient’s medical record) outcomes are described in Table 2. In total, 80.6% of condom catheter users reported experiencing at least one catheter-related complication during the month after initial catheter placement compared with 88.6% of indwelling catheter users (P = .32). A similar number of condom catheter patients and indwelling urethral catheter patients experienced an infectious complication according to both self-report data (8.3% condom, 6.8% indwelling; P = .99) and medical record review (11.1% condom, 6.8% indwelling; P = .69).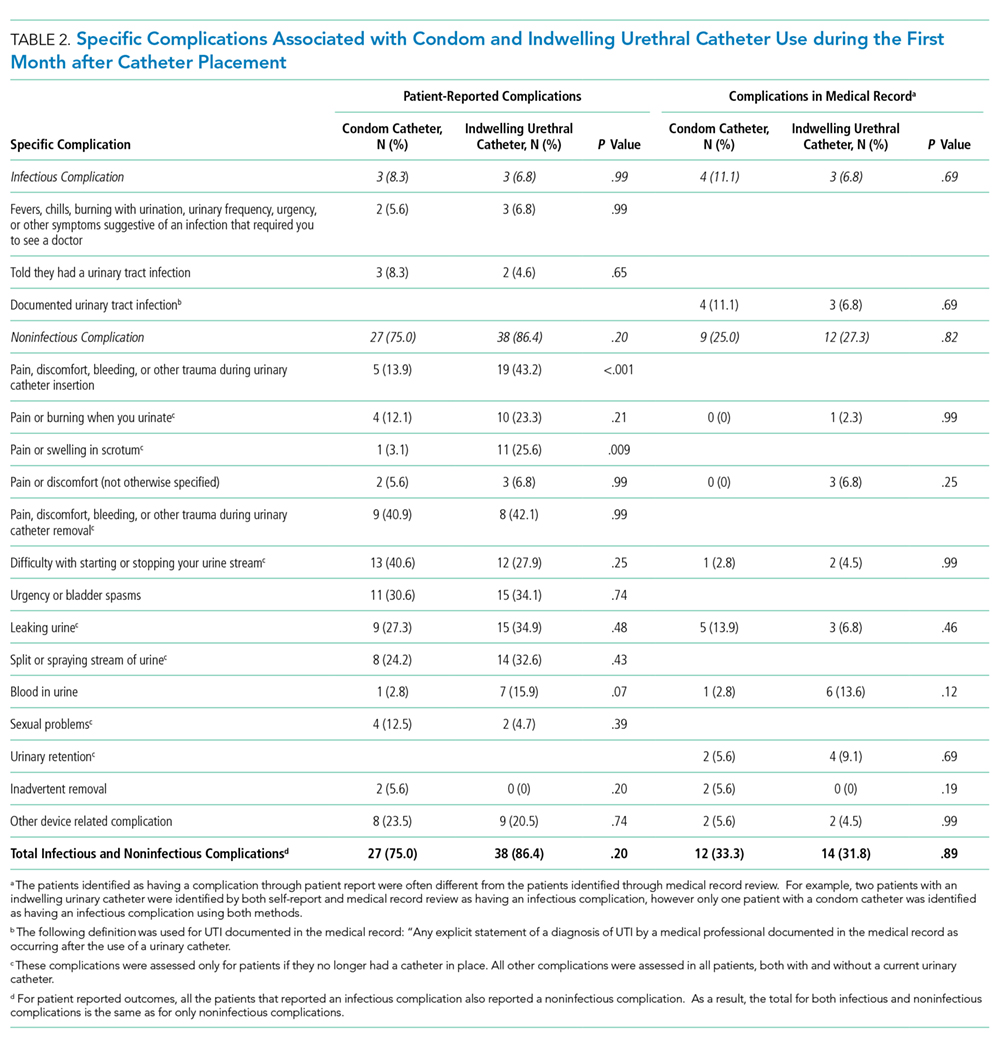
At least one noninfectious complication was identified in 77.8% of condom catheter patients (28 of 36) and 88.6% of indwelling urethral catheter patients (39 of 44) using combined self-report and medical record review data (P = .19); most of these were based on self-reported data. Significantly fewer condom catheter patients reported complications during placement (eg, pain, discomfort, bleeding, or other trauma) compared with those with indwelling catheters (13.9% vs 43.2%, P < .001). Pain, discomfort, bleeding, or other trauma during catheter removal were commonly reported by both condom catheter and indwelling urethral catheter patients (40.9% vs 42.1%, respectively; P = .99).
Patient-reported noninfectious complications were often not documented in the medical record: 75.0% of condom catheter patients and 86.4% of indwelling catheter patients reported complications, in comparison with the 25.0% of condom catheter patients and 27.3% of indwelling urethral catheter patients with noninfectious complications identified during medical record review.
DISCUSSION
Our study revealed three important findings. First, noninfectious complications greatly outnumbered infectious complications, regardless of the device type. Second, condom catheter users reported significantly less pain related to placement of their device compared with the indwelling urethral catheter group. Finally, many patients reported complications that were not documented in the medical record.
The only randomized trial comparing these devices enrolled 75 men hospitalized at a single VA medical center and found that using a condom catheter rather than an indwelling catheter in patients without urinary retention lowered the composite endpoint of bacteriuria, symptomatic UTI, or death.4 Additionally, patients in this trial reported that the condom catheter was significantly more comfortable (90% vs 58%; P = .02) and less painful (5% vs 36%; P = .02) than the indwelling catheter,4 supporting a previous study in hospitalized male Veterans.5
Importantly, we included patient-reported complications that may be of concern to patients but inconsistently documented in the medical record. Pain associated with removal of both condom catheters and indwelling urethral catheters was reported in over 40% in both groups but was not documented in the medical record. One patient with a condom catheter described removal this way: “It got stuck on my hair, so was hard to get off…” Condom catheters also posed some issues with staying in place as has been previously described.6 As one condom catheter user said: “When I was laying down it was okay, but every time I moved around…it would slide off.”
Recent efforts to reduce catheter-associated UTI,7-9 which have focused on reducing the use of indwelling urethral catheters,10,11 have been relatively successful. Clinical policy makers should consider similar efforts to address the noninfectious harms of both catheter types. Such efforts could include further decreasing any type of catheter use along with improved training of those placing such devices.12 Substantial improvement will require a systematic approach to surveilling noninfectious complications of both types of urinary catheters.
Our study has several limitations. First, we conducted the study at two VA hospitals; therefore, the results may not be generalizable to a non-VA population. Second, we only included 80 patients because we recruited a limited number of condom catheter users.
Limitations notwithstanding, we provide comparison data between condom and indwelling urethral catheters. Condom catheter users reported significantly less pain related to initial placement of their device compared with those using an indwelling urethral catheter. For both devices, patients experienced noninfectious complications much more commonly than infectious ones, underscoring the need to systematically address such complications, perhaps through a surveillance system that includes the patient’s perspective. The patient’s voice is important and necessary in view of the apparent underreporting of noninfectious harms in the medical record.
A cknowledgments
Disclaimer
The funding sources played no role in the design, conducting, or evaluation of this study. The findings and conclusions in this manuscript are those of the authors and do not necessarily represent the official position of the Department of Veterans Affairs.
1. Gould CV, Umscheid CA, Agarwal RK, Kuntz G, Pegues DA, Healthcare Infection Control Practices Advisory Committee. Guideline for prevention of catheter-associated urinary tract infections 2009. Infect Control Hosp Epidemiol. 2010;31(4):319-326. doi: 10.1086/651091.
2. Lo E, Nicolle LE, Coffin SE, et al. Strategies to prevent catheter-associated urinary tract infections in acute care hospitals: 2014 update. Infect Control Hosp Epidemiol. 2014;35(5):464-479. doi: 10.1086/675718.
3. Saint S, Trautner BW, Fowler KE, et al. A multicenter study of patient-reported infectious and noninfectious complications associated with indwelling urethral catheters. JAMA Intern Med. 2018. doi:10.1001/jamainternmed.2018.2417.
4. Saint S, Kaufman SR, Rogers MA, Baker PD, Ossenkop K, Lipsky BA. Condom versus indwelling urinary catheters: a randomized trial. J Am Geriatr Soc. 2006;54(7):1055-1061. doi: 10.1111/j.1532-5415.2006.00785.x.
5. Saint S, Lipsky BA, Baker PD, McDonald LL, Ossenkop K. Urinary catheters: what type do men and their nurses prefer? J Am Geriatr Soc. 1999;47(12):1453-1457. doi: 10.1111/j.1532-5415.1999.tb01567.x.
6. Smart C. Male urinary incontinence and the urinary sheath. Br J Nurs. 2014;23(9):S20, S22-S25. doi: 10.12968/bjon.2014.23.Sup9.S20.
7. Saint S, Greene MT, Kowalski CP, Watson SR, Hofer TP, Krein SL. Preventing catheter-associated urinary tract infection in the United States: a national comparative study. JAMA Intern Med. 2013;173(10):874-879. doi: 10.1001/jamainternmed.2013.101.
8. Saint S, Greene MT, Krein SL, et al. A program to prevent catheter-associated urinary tract infection in acute care. N Engl J Med. 2016;374(22):2111-2119. doi: 10.1056/NEJMoa1504906.
9. Saint S, Fowler KE, Sermak K, et al. Introducing the No preventable harms campaign: creating the safest health care system in the world, starting with catheter-associated urinary tract infection prevention. Am J Infect Control. 2015;43(3):254-259. doi: 10.1016/j.ajic.2014.11.016.
10. Fakih MG, Watson SR, Greene MT, et al. Reducing inappropriate urinary catheter use: a statewide effort. Arch Intern Med. 2012;172(3):255-260. doi: 10.1001/archinternmed.2011.627.
11. Krein SL, Kowalski CP, Harrod M, Forman J, Saint S. Barriers to reducing urinary catheter use: a qualitative assessment of a statewide initiative. JAMA Intern Med. 2013;173(10):881-886. doi: 10.1001/jamainternmed.2013.105.
12. Manojlovich M, Saint S, Meddings J, et al. Indwelling urinary catheter insertion practices in the emergency department: an observational study. Infect Control Hosp Epidemiol. 2016;37(1):117-119. doi: 10.1017/ice.2015.238.
13. Meddings JA, Reichert H, Rogers MA, Saint S, Stephansky J, McMahon LF. Effect of nonpayment for hospital-acquired, catheter-associated urinary tract infection: a statewide analysis. Ann Intern Med. 2012;157(5):305-312. doi: 10.7326/0003-4819-157-5-201209040-00003.
Millions of patients use urinary collection devices. For men, both indwelling and condom-style urinary catheters (known as “external catheters”) are commonly used. National infection prevention guidelines recommend condom catheters as a preferred alternative to indwelling catheters for patients without urinary retention1,2 to reduce the risk of catheter-associated urinary tract infection (UTI). Unfortunately, little outcome data comparing condom catheters with indwelling urethral catheters exists. We therefore assessed the incidence of infectious and noninfectious complications in condom catheter and indwelling urethral catheter users.
PATIENTS AND METHODS
Study Overview
As part of a larger prospective, observational study,3 we compared complications in patients who received a condom catheter during hospitalization with those in patients who received an indwelling urethral catheter. Hospitalized patients with either a condom catheter or indwelling urethral catheter were identified at two Veterans Affairs (VA) medical centers and followed for 30 days after initial catheter placement. Patient-reported data were collected during in-person patient interviews at baseline (within three days of catheter placement), and by in-person or phone interviews at 14 days and 30 days postplacement (Supplementary Appendix A and B). Questions were primarily closed-ended, except for a final question inviting open comments. Information about the catheter and any reported complications was also collected from electronic medical record documentation for each patient. Institutional review board approval was received from both participating study sites.
Data Collection and Inclusion Criteria
Hospitalized patients who had a condom or indwelling urethral catheter placed were eligible to participate if they met the following criteria: (1) were hospitalized on an acute care unit; (2) had a new condom catheter or indwelling urethral catheter placed during this hospital stay that was not present on admission; (3) had a device in place for three days or less; (4) were at least 18 years old; and (5) were able to speak English. Patients were excluded if they: (1) did not have the capacity to give consent or participate in the interview/assessment process; (2) refused to provide written informed consent to participate; or (3) had previously participated in this project.
As the larger study was focused on indwelling urethral catheter users, participants with a condom catheter were recruited from only one facility, while those with an indwelling urethral catheter were recruited from both hospitals. Indwelling catheter patients that had a possible contraindication to condom catheter use (such as urinary retention or perioperative use for a surgical procedure) were excluded to make the groups comparable. Any indication for condom catheterization was permitted.
Information about catheter-related complications was collected from two sources: directly from patients and through medical record review. Patients were interviewed at baseline and approximately 14 days and 30 days after catheter placement. The follow-up assessments asked patients about their symptoms and experience over the previous two weeks. We also conducted a medical record review covering the 30 days after initial catheter placement.
Study Measures
Data Analysis
The primary outcome was the percentage of patients who experienced a complication related to a urinary catheter during the 30 days after the catheter was initially placed. Comparisons by group—condom versus indwelling catheter—were conducted using chi-square tests (Fisher’s exact test when necessary) for categorical variables and the Student’s t-test for continuous variables. All analyses were performed using SAS (Cary, North Carolina). All statistical tests were two-sided with alpha set to .05.
RESULTS
Of the 76 patients invited to participate after having a condom catheter placed, 49 consented (64.5%). Of those, 36 had sufficient data for inclusion in this analysis. The comparison group consisted of 44 patients with an indwelling urethral catheter. There were no statistically significant differences between the two groups in terms of age, race, or ethnicity (Table 1). There were statistically significant differences in patient-reported reasons for catheter placement, but these were due to the exclusion criteria used for indwelling urethral catheter patients.
Both patient-reported and clinician-reported (ie, recorded in the patient’s medical record) outcomes are described in Table 2. In total, 80.6% of condom catheter users reported experiencing at least one catheter-related complication during the month after initial catheter placement compared with 88.6% of indwelling catheter users (P = .32). A similar number of condom catheter patients and indwelling urethral catheter patients experienced an infectious complication according to both self-report data (8.3% condom, 6.8% indwelling; P = .99) and medical record review (11.1% condom, 6.8% indwelling; P = .69).
At least one noninfectious complication was identified in 77.8% of condom catheter patients (28 of 36) and 88.6% of indwelling urethral catheter patients (39 of 44) using combined self-report and medical record review data (P = .19); most of these were based on self-reported data. Significantly fewer condom catheter patients reported complications during placement (eg, pain, discomfort, bleeding, or other trauma) compared with those with indwelling catheters (13.9% vs 43.2%, P < .001). Pain, discomfort, bleeding, or other trauma during catheter removal were commonly reported by both condom catheter and indwelling urethral catheter patients (40.9% vs 42.1%, respectively; P = .99).
Patient-reported noninfectious complications were often not documented in the medical record: 75.0% of condom catheter patients and 86.4% of indwelling catheter patients reported complications, in comparison with the 25.0% of condom catheter patients and 27.3% of indwelling urethral catheter patients with noninfectious complications identified during medical record review.
DISCUSSION
Our study revealed three important findings. First, noninfectious complications greatly outnumbered infectious complications, regardless of the device type. Second, condom catheter users reported significantly less pain related to placement of their device compared with the indwelling urethral catheter group. Finally, many patients reported complications that were not documented in the medical record.
The only randomized trial comparing these devices enrolled 75 men hospitalized at a single VA medical center and found that using a condom catheter rather than an indwelling catheter in patients without urinary retention lowered the composite endpoint of bacteriuria, symptomatic UTI, or death.4 Additionally, patients in this trial reported that the condom catheter was significantly more comfortable (90% vs 58%; P = .02) and less painful (5% vs 36%; P = .02) than the indwelling catheter,4 supporting a previous study in hospitalized male Veterans.5
Importantly, we included patient-reported complications that may be of concern to patients but inconsistently documented in the medical record. Pain associated with removal of both condom catheters and indwelling urethral catheters was reported in over 40% in both groups but was not documented in the medical record. One patient with a condom catheter described removal this way: “It got stuck on my hair, so was hard to get off…” Condom catheters also posed some issues with staying in place as has been previously described.6 As one condom catheter user said: “When I was laying down it was okay, but every time I moved around…it would slide off.”
Recent efforts to reduce catheter-associated UTI,7-9 which have focused on reducing the use of indwelling urethral catheters,10,11 have been relatively successful. Clinical policy makers should consider similar efforts to address the noninfectious harms of both catheter types. Such efforts could include further decreasing any type of catheter use along with improved training of those placing such devices.12 Substantial improvement will require a systematic approach to surveilling noninfectious complications of both types of urinary catheters.
Our study has several limitations. First, we conducted the study at two VA hospitals; therefore, the results may not be generalizable to a non-VA population. Second, we only included 80 patients because we recruited a limited number of condom catheter users.
Limitations notwithstanding, we provide comparison data between condom and indwelling urethral catheters. Condom catheter users reported significantly less pain related to initial placement of their device compared with those using an indwelling urethral catheter. For both devices, patients experienced noninfectious complications much more commonly than infectious ones, underscoring the need to systematically address such complications, perhaps through a surveillance system that includes the patient’s perspective. The patient’s voice is important and necessary in view of the apparent underreporting of noninfectious harms in the medical record.
A cknowledgments
Disclaimer
The funding sources played no role in the design, conducting, or evaluation of this study. The findings and conclusions in this manuscript are those of the authors and do not necessarily represent the official position of the Department of Veterans Affairs.
Millions of patients use urinary collection devices. For men, both indwelling and condom-style urinary catheters (known as “external catheters”) are commonly used. National infection prevention guidelines recommend condom catheters as a preferred alternative to indwelling catheters for patients without urinary retention1,2 to reduce the risk of catheter-associated urinary tract infection (UTI). Unfortunately, little outcome data comparing condom catheters with indwelling urethral catheters exists. We therefore assessed the incidence of infectious and noninfectious complications in condom catheter and indwelling urethral catheter users.
PATIENTS AND METHODS
Study Overview
As part of a larger prospective, observational study,3 we compared complications in patients who received a condom catheter during hospitalization with those in patients who received an indwelling urethral catheter. Hospitalized patients with either a condom catheter or indwelling urethral catheter were identified at two Veterans Affairs (VA) medical centers and followed for 30 days after initial catheter placement. Patient-reported data were collected during in-person patient interviews at baseline (within three days of catheter placement), and by in-person or phone interviews at 14 days and 30 days postplacement (Supplementary Appendix A and B). Questions were primarily closed-ended, except for a final question inviting open comments. Information about the catheter and any reported complications was also collected from electronic medical record documentation for each patient. Institutional review board approval was received from both participating study sites.
Data Collection and Inclusion Criteria
Hospitalized patients who had a condom or indwelling urethral catheter placed were eligible to participate if they met the following criteria: (1) were hospitalized on an acute care unit; (2) had a new condom catheter or indwelling urethral catheter placed during this hospital stay that was not present on admission; (3) had a device in place for three days or less; (4) were at least 18 years old; and (5) were able to speak English. Patients were excluded if they: (1) did not have the capacity to give consent or participate in the interview/assessment process; (2) refused to provide written informed consent to participate; or (3) had previously participated in this project.
As the larger study was focused on indwelling urethral catheter users, participants with a condom catheter were recruited from only one facility, while those with an indwelling urethral catheter were recruited from both hospitals. Indwelling catheter patients that had a possible contraindication to condom catheter use (such as urinary retention or perioperative use for a surgical procedure) were excluded to make the groups comparable. Any indication for condom catheterization was permitted.
Information about catheter-related complications was collected from two sources: directly from patients and through medical record review. Patients were interviewed at baseline and approximately 14 days and 30 days after catheter placement. The follow-up assessments asked patients about their symptoms and experience over the previous two weeks. We also conducted a medical record review covering the 30 days after initial catheter placement.
Study Measures
Data Analysis
The primary outcome was the percentage of patients who experienced a complication related to a urinary catheter during the 30 days after the catheter was initially placed. Comparisons by group—condom versus indwelling catheter—were conducted using chi-square tests (Fisher’s exact test when necessary) for categorical variables and the Student’s t-test for continuous variables. All analyses were performed using SAS (Cary, North Carolina). All statistical tests were two-sided with alpha set to .05.
RESULTS
Of the 76 patients invited to participate after having a condom catheter placed, 49 consented (64.5%). Of those, 36 had sufficient data for inclusion in this analysis. The comparison group consisted of 44 patients with an indwelling urethral catheter. There were no statistically significant differences between the two groups in terms of age, race, or ethnicity (Table 1). There were statistically significant differences in patient-reported reasons for catheter placement, but these were due to the exclusion criteria used for indwelling urethral catheter patients.
Both patient-reported and clinician-reported (ie, recorded in the patient’s medical record) outcomes are described in Table 2. In total, 80.6% of condom catheter users reported experiencing at least one catheter-related complication during the month after initial catheter placement compared with 88.6% of indwelling catheter users (P = .32). A similar number of condom catheter patients and indwelling urethral catheter patients experienced an infectious complication according to both self-report data (8.3% condom, 6.8% indwelling; P = .99) and medical record review (11.1% condom, 6.8% indwelling; P = .69).
At least one noninfectious complication was identified in 77.8% of condom catheter patients (28 of 36) and 88.6% of indwelling urethral catheter patients (39 of 44) using combined self-report and medical record review data (P = .19); most of these were based on self-reported data. Significantly fewer condom catheter patients reported complications during placement (eg, pain, discomfort, bleeding, or other trauma) compared with those with indwelling catheters (13.9% vs 43.2%, P < .001). Pain, discomfort, bleeding, or other trauma during catheter removal were commonly reported by both condom catheter and indwelling urethral catheter patients (40.9% vs 42.1%, respectively; P = .99).
Patient-reported noninfectious complications were often not documented in the medical record: 75.0% of condom catheter patients and 86.4% of indwelling catheter patients reported complications, in comparison with the 25.0% of condom catheter patients and 27.3% of indwelling urethral catheter patients with noninfectious complications identified during medical record review.
DISCUSSION
Our study revealed three important findings. First, noninfectious complications greatly outnumbered infectious complications, regardless of the device type. Second, condom catheter users reported significantly less pain related to placement of their device compared with the indwelling urethral catheter group. Finally, many patients reported complications that were not documented in the medical record.
The only randomized trial comparing these devices enrolled 75 men hospitalized at a single VA medical center and found that using a condom catheter rather than an indwelling catheter in patients without urinary retention lowered the composite endpoint of bacteriuria, symptomatic UTI, or death.4 Additionally, patients in this trial reported that the condom catheter was significantly more comfortable (90% vs 58%; P = .02) and less painful (5% vs 36%; P = .02) than the indwelling catheter,4 supporting a previous study in hospitalized male Veterans.5
Importantly, we included patient-reported complications that may be of concern to patients but inconsistently documented in the medical record. Pain associated with removal of both condom catheters and indwelling urethral catheters was reported in over 40% in both groups but was not documented in the medical record. One patient with a condom catheter described removal this way: “It got stuck on my hair, so was hard to get off…” Condom catheters also posed some issues with staying in place as has been previously described.6 As one condom catheter user said: “When I was laying down it was okay, but every time I moved around…it would slide off.”
Recent efforts to reduce catheter-associated UTI,7-9 which have focused on reducing the use of indwelling urethral catheters,10,11 have been relatively successful. Clinical policy makers should consider similar efforts to address the noninfectious harms of both catheter types. Such efforts could include further decreasing any type of catheter use along with improved training of those placing such devices.12 Substantial improvement will require a systematic approach to surveilling noninfectious complications of both types of urinary catheters.
Our study has several limitations. First, we conducted the study at two VA hospitals; therefore, the results may not be generalizable to a non-VA population. Second, we only included 80 patients because we recruited a limited number of condom catheter users.
Limitations notwithstanding, we provide comparison data between condom and indwelling urethral catheters. Condom catheter users reported significantly less pain related to initial placement of their device compared with those using an indwelling urethral catheter. For both devices, patients experienced noninfectious complications much more commonly than infectious ones, underscoring the need to systematically address such complications, perhaps through a surveillance system that includes the patient’s perspective. The patient’s voice is important and necessary in view of the apparent underreporting of noninfectious harms in the medical record.
A cknowledgments
Disclaimer
The funding sources played no role in the design, conducting, or evaluation of this study. The findings and conclusions in this manuscript are those of the authors and do not necessarily represent the official position of the Department of Veterans Affairs.
1. Gould CV, Umscheid CA, Agarwal RK, Kuntz G, Pegues DA, Healthcare Infection Control Practices Advisory Committee. Guideline for prevention of catheter-associated urinary tract infections 2009. Infect Control Hosp Epidemiol. 2010;31(4):319-326. doi: 10.1086/651091.
2. Lo E, Nicolle LE, Coffin SE, et al. Strategies to prevent catheter-associated urinary tract infections in acute care hospitals: 2014 update. Infect Control Hosp Epidemiol. 2014;35(5):464-479. doi: 10.1086/675718.
3. Saint S, Trautner BW, Fowler KE, et al. A multicenter study of patient-reported infectious and noninfectious complications associated with indwelling urethral catheters. JAMA Intern Med. 2018. doi:10.1001/jamainternmed.2018.2417.
4. Saint S, Kaufman SR, Rogers MA, Baker PD, Ossenkop K, Lipsky BA. Condom versus indwelling urinary catheters: a randomized trial. J Am Geriatr Soc. 2006;54(7):1055-1061. doi: 10.1111/j.1532-5415.2006.00785.x.
5. Saint S, Lipsky BA, Baker PD, McDonald LL, Ossenkop K. Urinary catheters: what type do men and their nurses prefer? J Am Geriatr Soc. 1999;47(12):1453-1457. doi: 10.1111/j.1532-5415.1999.tb01567.x.
6. Smart C. Male urinary incontinence and the urinary sheath. Br J Nurs. 2014;23(9):S20, S22-S25. doi: 10.12968/bjon.2014.23.Sup9.S20.
7. Saint S, Greene MT, Kowalski CP, Watson SR, Hofer TP, Krein SL. Preventing catheter-associated urinary tract infection in the United States: a national comparative study. JAMA Intern Med. 2013;173(10):874-879. doi: 10.1001/jamainternmed.2013.101.
8. Saint S, Greene MT, Krein SL, et al. A program to prevent catheter-associated urinary tract infection in acute care. N Engl J Med. 2016;374(22):2111-2119. doi: 10.1056/NEJMoa1504906.
9. Saint S, Fowler KE, Sermak K, et al. Introducing the No preventable harms campaign: creating the safest health care system in the world, starting with catheter-associated urinary tract infection prevention. Am J Infect Control. 2015;43(3):254-259. doi: 10.1016/j.ajic.2014.11.016.
10. Fakih MG, Watson SR, Greene MT, et al. Reducing inappropriate urinary catheter use: a statewide effort. Arch Intern Med. 2012;172(3):255-260. doi: 10.1001/archinternmed.2011.627.
11. Krein SL, Kowalski CP, Harrod M, Forman J, Saint S. Barriers to reducing urinary catheter use: a qualitative assessment of a statewide initiative. JAMA Intern Med. 2013;173(10):881-886. doi: 10.1001/jamainternmed.2013.105.
12. Manojlovich M, Saint S, Meddings J, et al. Indwelling urinary catheter insertion practices in the emergency department: an observational study. Infect Control Hosp Epidemiol. 2016;37(1):117-119. doi: 10.1017/ice.2015.238.
13. Meddings JA, Reichert H, Rogers MA, Saint S, Stephansky J, McMahon LF. Effect of nonpayment for hospital-acquired, catheter-associated urinary tract infection: a statewide analysis. Ann Intern Med. 2012;157(5):305-312. doi: 10.7326/0003-4819-157-5-201209040-00003.
1. Gould CV, Umscheid CA, Agarwal RK, Kuntz G, Pegues DA, Healthcare Infection Control Practices Advisory Committee. Guideline for prevention of catheter-associated urinary tract infections 2009. Infect Control Hosp Epidemiol. 2010;31(4):319-326. doi: 10.1086/651091.
2. Lo E, Nicolle LE, Coffin SE, et al. Strategies to prevent catheter-associated urinary tract infections in acute care hospitals: 2014 update. Infect Control Hosp Epidemiol. 2014;35(5):464-479. doi: 10.1086/675718.
3. Saint S, Trautner BW, Fowler KE, et al. A multicenter study of patient-reported infectious and noninfectious complications associated with indwelling urethral catheters. JAMA Intern Med. 2018. doi:10.1001/jamainternmed.2018.2417.
4. Saint S, Kaufman SR, Rogers MA, Baker PD, Ossenkop K, Lipsky BA. Condom versus indwelling urinary catheters: a randomized trial. J Am Geriatr Soc. 2006;54(7):1055-1061. doi: 10.1111/j.1532-5415.2006.00785.x.
5. Saint S, Lipsky BA, Baker PD, McDonald LL, Ossenkop K. Urinary catheters: what type do men and their nurses prefer? J Am Geriatr Soc. 1999;47(12):1453-1457. doi: 10.1111/j.1532-5415.1999.tb01567.x.
6. Smart C. Male urinary incontinence and the urinary sheath. Br J Nurs. 2014;23(9):S20, S22-S25. doi: 10.12968/bjon.2014.23.Sup9.S20.
7. Saint S, Greene MT, Kowalski CP, Watson SR, Hofer TP, Krein SL. Preventing catheter-associated urinary tract infection in the United States: a national comparative study. JAMA Intern Med. 2013;173(10):874-879. doi: 10.1001/jamainternmed.2013.101.
8. Saint S, Greene MT, Krein SL, et al. A program to prevent catheter-associated urinary tract infection in acute care. N Engl J Med. 2016;374(22):2111-2119. doi: 10.1056/NEJMoa1504906.
9. Saint S, Fowler KE, Sermak K, et al. Introducing the No preventable harms campaign: creating the safest health care system in the world, starting with catheter-associated urinary tract infection prevention. Am J Infect Control. 2015;43(3):254-259. doi: 10.1016/j.ajic.2014.11.016.
10. Fakih MG, Watson SR, Greene MT, et al. Reducing inappropriate urinary catheter use: a statewide effort. Arch Intern Med. 2012;172(3):255-260. doi: 10.1001/archinternmed.2011.627.
11. Krein SL, Kowalski CP, Harrod M, Forman J, Saint S. Barriers to reducing urinary catheter use: a qualitative assessment of a statewide initiative. JAMA Intern Med. 2013;173(10):881-886. doi: 10.1001/jamainternmed.2013.105.
12. Manojlovich M, Saint S, Meddings J, et al. Indwelling urinary catheter insertion practices in the emergency department: an observational study. Infect Control Hosp Epidemiol. 2016;37(1):117-119. doi: 10.1017/ice.2015.238.
13. Meddings JA, Reichert H, Rogers MA, Saint S, Stephansky J, McMahon LF. Effect of nonpayment for hospital-acquired, catheter-associated urinary tract infection: a statewide analysis. Ann Intern Med. 2012;157(5):305-312. doi: 10.7326/0003-4819-157-5-201209040-00003.
© 2019 Society of Hospital Medicine
Prevalence and Postdischarge Outcomes Associated with Frailty in Medical Inpatients: Impact of Different Frailty Definitions
Frailty is associated with adverse outcomes in hospitalized patients, including longer length of stay, increased risk of institutionalization at discharge, and higher rates of readmissions or death postdischarge.1-4 Multiple tools have been developed to evaluate frailty and in an earlier study,4 we compared the three most common of these and demonstrated that the Clinical Frailty Scale (CFS)5 was the most useful tool clinically as it was most strongly associated with adverse events in the first 30 days after discharge. However, it must be collected prospectively and requires contact with patients or proxies for the evaluator to assign the patient into one of nine categories depending on their disease state, mobility, cognition, and ability to perform instrumental and functional activities of daily living. Recently, a new score has been described which is based on an administrative data algorithm that assigns points to patients having any of 109 ICD-10 codes listed for their index hospitalization and all hospitalizations in the prior two years and can be generated retrospectively without trained observers.6 Although higher Hospital Frailty Risk Scores (HFRS) were associated with greater risk of postdischarge adverse events, the kappa when compared with the CFS was only 0.30 (95% CI 0.22-0.38) in that study.6 However, as the HFRS was developed and validated in patients aged ≥75 years within the UK National Health Service, the authors themselves recommended that it be evaluated in other healthcare systems, other populations, and with comparison to prospectively collected frailty data from cumulative deficit models such as the CFS.
The aim of this study was to compare frailty assessments using the CFS and the HFRS in a population of adult patients hospitalized on general medical wards in North America to determine the impact on prevalence estimates and prediction of outcomes within the first 30 days after hospital discharge (a timeframe highlighted in the Affordable Care Act and used by Centers for Medicare & Medicaid Services as an important hospital quality indicator).
METHODS
As described previously,7 we performed a prospective cohort study of adults without cognitive impairment or life expectancy less than three months being discharged back to the community (not to long-term care facilities) from general medical wards in two teaching hospitals in Edmonton, Alberta, between October 2013 and November 2014. All patients provided signed consent, and the University of Alberta Health Research Ethics board (project ID Pro00036880) approved the study.
Trained observers assessed each patient’s frailty status within 24 hours of discharge based on the patient’s best status in the week prior to becoming ill with the reason for the index hospitalization. The research assistant classified patients into one of the following nine CFS categories: very fit, well, managing well, vulnerable, mildly frail (need help with at least one instrumental activities of daily living such as shopping, finances, meal preparation, or housework), moderately frail (need help with one or two activities of daily living such as bathing and dressing), severely frail (dependent for personal care), very severely frail (bedbound), and terminally ill. According to the CFS validation studies, the last five categories were defined as frail for the purposes of our analyses.
Independent of the trained observer’s assessments, we calculated the HFRS for each participant in our cohort by linking to Alberta administrative data holdings within the Alberta Health Services Data Integration and Measurement Reporting unit and examining all diagnostic codes for the index hospitalization and any other hospitalizations in the prior two years for the 109 ICD-10 codes listed in the original HFRS paper and used the same score cutpoints as they reported (HFRS <5 being low risk, 5-15 defined as intermediate risk, and >15 as high risk for frailty; scores ≥5 were defined as frail).6
All patients were followed after discharge by research personnel blinded to the patient’s frailty assessment. We used patient/caregiver self-report and the provincial electronic health record to collect information on all-cause readmissions or mortality within 30 days.
We have previously reported4,7 the association between frailty defined by the CFS and unplanned readmissions or death within 30 days of discharge but in this study, we examined the correlation between CFS-defined frailty and the HFRS score (classifying those with intermediate or high scores as frail) using chance-corrected kappa coefficients. We also compared the prognostic accuracy of both models for predicting death and/or unplanned readmissions within 30 days using the C statistic and the integrated discrimination improvement index and examined patients aged >65 years as a subgroup.8 We used SAS version 9.4 (SAS Institute, Cary, North Carolina) for analyses, with P values of <.05 considered as statistically significant.
RESULTS
Of the 499 patients in our original cohort,7 we could not link 10 to the administrative data to calculate HFRS, and thus this study sample is only 489 patients (mean age 64 years, 50% women, 52% older than 65 years, a mean of 4.9 comorbidities, and median length of stay five days).
Overall, 276 (56%) patients were deemed frail according to at least one assessment (214 [44%] on the HFRS [35% intermediate risk and 9% high risk] and 161 [33%] on the CFS), and 99 (20%) met both frailty definitions (Appendix Figure). Among the 252 patients aged >65 years, 66 (26%) met both frailty definitions and 166 (66%) were frail according to at least one assessment. Agreement between HFRS and the CFS (kappa 0.24, 95% CI 0.16-0.33) was poor. The CFS definition of frailty was 46% sensitive and 77% specific in classifying frail patients compared with HFRS-defined frailty.
As we reported earlier,4 patients deemed frail were generally similar across scales in that they were older, had more comorbidities, more prescriptions, longer lengths of stay, and poorer quality of life than nonfrail patients (all P < .01, Table 1). However, patients classified as frail on the HFRS only but not meeting the CFS definition were younger, had higher quality of life, and despite a similar Charlson Score and number of comorbidities were much more likely to have been living independently prior to admission than those classified as frail on the CFS.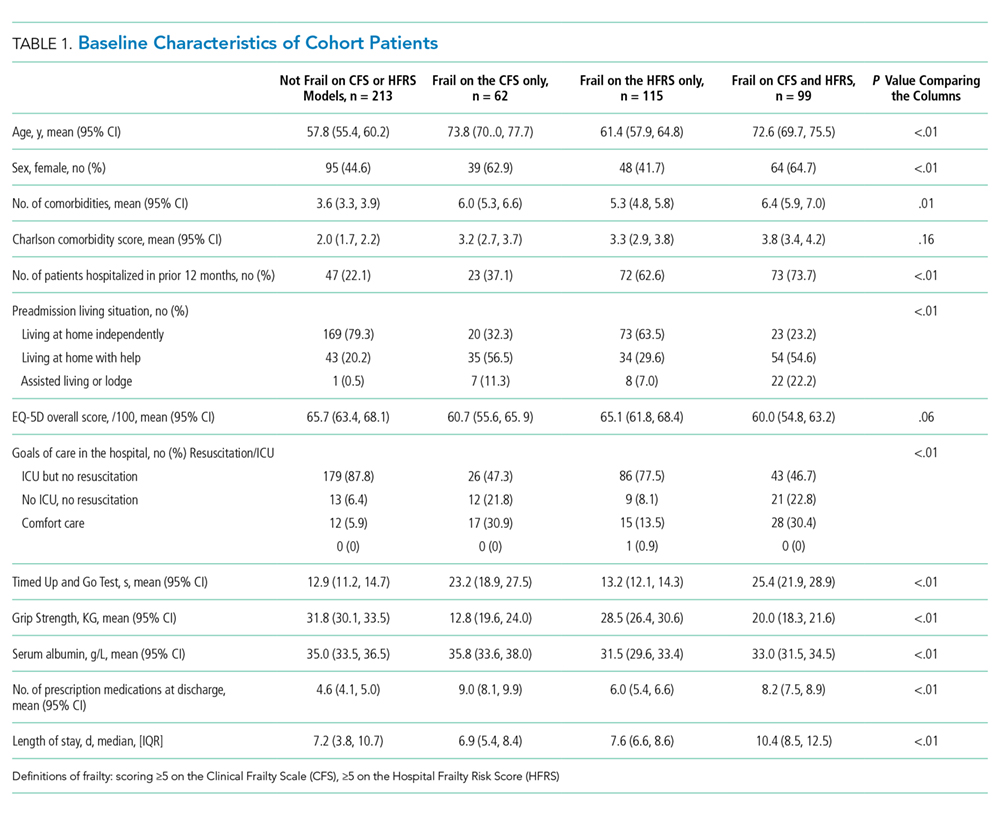
Death or unplanned readmission within 30 days occurred in 13.3% (65 patients), with most events being readmissions (62, 12.7%). HFRS-defined frail patients exhibited higher 30-day death/readmission rates (16% vs 11% for not frail, P = .08; 14% vs 11% in the elderly, P = .5), which was not statistically significantly different from the nonfrail patients even after adjusting for age and sex (aOR [adjusted odds ratio] 1.62, 95% CI 0.95-2.75 for all adults; aOR 1.24, 95% CI 0.58-2.63 for the elderly). CFS-defined frail patients had significantly higher 30-day readmission/death rates (19% vs 10% for not frail, aOR 2.53, 95% CI 1.40-4.57 for all adults and 21% vs 6% in the elderly, aOR 4.31, 95% CI 1.80-10.31).
Adding the HFRS results to the CFS-based predictive models added little new information, with an integrated discrimination improvement of only 0.009 that was not statistically significant (P = .09, Table 2). In fact, the HFRS was not an independent predictor of postdischarge outcomes after adjusting for age and sex. Although predictive models incorporating the CFS demonstrated the best C statistics, none of the models had high C statistics (ranging between 0.54 and 0.64 for all adults and between 0.55 and 0.68 for those aged >65 years). Even when the frailty definitions were examined as continuous variables, the C statistics were similar as for the dichotomized analyses (0.64 for CFS and 0.58 for HFRS) and the correlation between the two remained weak (Spearman’s correlation coefficient 0.34).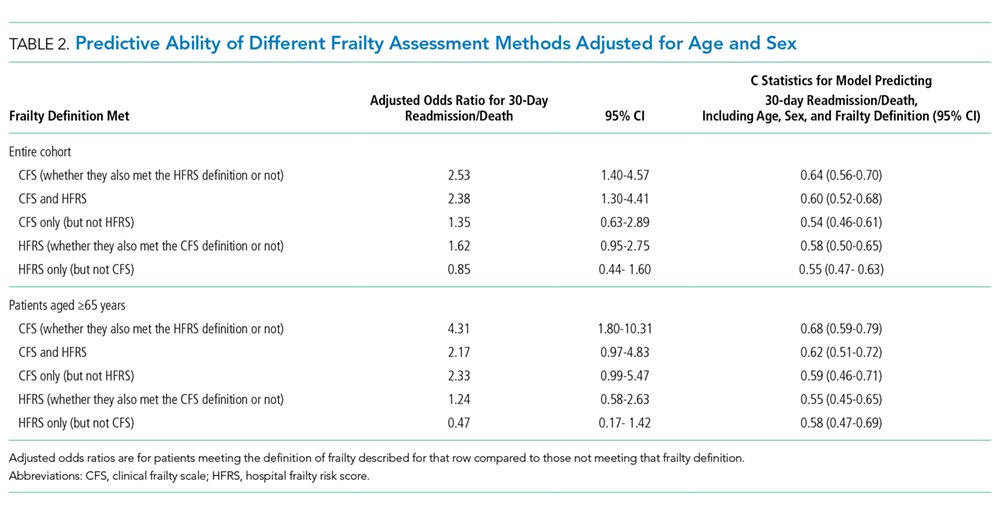
DISCUSSION
We have demonstrated that the prevalence of frailty in patients being discharged from medical wards was high, with the HFRS (44%) being higher than the CFS (33%), and that only 46% of patients deemed frail on the HFRS were also deemed frail on the CFS. We confirm the report by the developers of the HFRS that there was poor correlation between the CFS cumulative deficit model and the administrative-data-based HFRS model in our cohort, even among those older than 65 years.
Previous studies have reported marked heterogeneity in prevalence estimates between different frailty instruments.2,9 For example, Aguayo et al. found that the prevalence of frailty in the English Longitudinal Study of Aging varied between 0.9% and 68% depending on which of the 35 frailty scales they tested were used, although the prevalence with comprehensive geriatric assessments (the gold standard) was 14.9% (and 15.3% on the CFS).9 Although frail patients are at higher risk for death and/or readmission after discharge, other investigators have also reported similar findings to ours that frailty-based risk models are surprisingly modest at predicting postdischarge readmission or death, with the C statistics ranging between 0.52 and 0.57, although the CFS appears to correlate best with the gold standard of comprehensive geriatric assessment.10-14 This is not surprising since the CFS is multidimensional and as a cumulative deficit model, it incorporates assessment of the patient’s underlying diseases, cognition, function, mobility, and mood in the assignment of their CFS level. Regardless, others15 have pointed out the need for studies such as ours to compare the validity of published frailty scales.
Despite our prospective cohort design and blinded endpoint ascertainment, there are some potential limitations to our study. First, we excluded long-term care residents and patients with foreshortened life expectancy – the frailest of the frail – from our analysis of 30-day outcomes, thereby potentially reducing the magnitude of the association between frailty and adverse outcomes. However, we were interested only in situations where clinicians were faced with equipoise about patient prognosis. Second, we assessed only 30-day readmissions or deaths and cannot comment on the impact of frailty definitions on other postdischarge outcomes (such as discharge locale or need for home care services) or other timeframes. Finally, although the association between the HFRS definition of frailty and the 30-day mortality/readmission was not statistically significant, the 95% confidence intervals were wide and thus we cannot definitively rule out a positive association.
In conclusion, considering that it had the strongest association with postdischarge outcomes and is the fastest and easiest to perform, the most useful of the frailty assessment tools for clinicians at the bedside still appears to be the CFS (both overall and in those patients who are elderly). However, for researchers who are analyzing data retrospectively or policy planners looking at health services data where the CFS was not collected, the HFRS holds promise for risk adjustment in population-level studies comparing processes and outcomes between hospitals.
Acknowledgments
The authors would like to acknowledge Miriam Fradette, Debbie Boyko, Sara Belga, Darren Lau, Jenelle Pederson, and Sharry Kahlon for their important contributions in data acquisition in our original cohort study, as well as all the physicians rotating through the general internal medicine wards at the University of Alberta Hospital for their help in identifying the patients. We also thank Dr. Simon Conroy, MB ChB PhD, University of Leicester, UK, for his helpful comments on an earlier draft of this manuscript.
Disclosures
The authors declare no conflicts of interest. All authors had access to the data and played a role in writing and revising this manuscript.
Funding
Funding for this study was provided by an operating grant from Alberta Innovates - Health Solutions. F.A.M. holds the Chair in Cardiovascular Outcomes Research at the Mazankowski Heart Institute, University of Alberta. The authors have no affiliations or financial interests with any organization or entity with a financial interest in the contents of this manuscript.
1. Clegg A, Young J, Iliffe S, Rikkert MO, Rockwood K. Frailty in elderly people. Lancet. 2013;381(9868):752-762. doi: 10.1016/S0140-6736(12)62167-9. PubMed
2. Collard RM, Boter H, Schoevers RA, Oude Voshaar RC. Prevalence of frailty in community-dwelling older persons: a systematic review. J Am Geriatr Soc. 2012;60(8):1487-1492. doi: 10.1111/j.1532-5415.2012.04054.x. PubMed
3. de Vries NM, Staal JB, van Ravensberg CD, Hobbelen JS, Olde Rikkert MG, Nijhuis-van der Sanden MW. Outcome instruments to measure frailty: a systematic review. Ageing Res Rev. 2011;10(1):104-114. doi: 10.1016/j.arr.2010.09.001. PubMed
4. Belga S, Majumdar SR, Kahlon S, et al. Comparing three different measures of frailty in medical inpatients: multicenter prospective cohort study examining 30-day risk of readmission or death. J Hosp Med. 2016;11(8):556-562. doi: 10.1002/jhm.2607. PubMed
5. Rockwood K, Andrew M, Mintnitski A. A comparison of two approaches to measuring frailty in elerly people. J Gerontol. 2007;62(7):738-743. doi: 10.1093/gerona/62.7.738. PubMed
6. Gilbert T, Neuburger J, Kraindler J, et al. Development and validation of a Hospital Frailty Risk Score focusing on older people in acute care settings using electronic hospital records: an observational study. Lancet. 2018;391(10132):1775-1782. doi: 10.1016/S0140-6736(18)30668-8Get. PubMed
7. Kahlon S, Pederson J, Majumdar SR, et al. Association between frailty and 30-day outcomes after discharge from hospital. CMAJ. 2015;187(11):799-804. doi: 10.1503/cmaj.150100. PubMed
8. Pencina MJ, D’ Agostino RB, Vasan RS. Evaluating the added predictive ability of a new marker: from area under the roc curve to reclassification and beyond. Stat Med. 2008;27(2):157-172. doi: 10.1002/sim.2929.
9. Aguayo GA, Donneau A-F, Vaillant MT, et al. Agreement between 35 published frailty scores in the general population. Am J Epidemiol. 2017;186(4):420-434. doi: 10.1093/aje/kwx061. PubMed
10. Ritt M, Bollheimer LC, Siever CC, Gaßmann KG. Prediction of one-year mortality by five different frailty instruments: a comparative study in hospitalized geriatric patients. Arch Gerontol Geriatr. 2016;66:66-72. doi: 10.1016/j.archger.2016.05.004. PubMed
11. Forti P, Rietti E, Pisacane N, Olivelli V, Maltoni B, Ravaglia G. A comparison of frailty indexes for prediction of adverse health outcomes in a elderly cohort. Arch Gerontol Geriatr. 2012;54(1):16-20. doi: 10.1016/j.archger.2011.01.007. PubMed
12. Wou F, Gladman JR, Bradshaw L, Franklin M, Edmans J, Conroy SP. The predictive properties of frailty-rating scales in the acute medical unit. Age Ageing. 2013;42(6):776-781. doi: 10.1093/ageing/aft055. PubMed
13. Wallis SJ, Wall J, Biram RW, Romero-Ortuno R. Association of the clinical frailty scale with hospital outcomes. QJM. 2015;108(12):943-949. doi: 10.1093/qjmed/hcv066. PubMed
14. Harmand MGC, Meillon C, Bergua V, et al. Comparing the predictive value of three definitions of frailty: results from the Three-City Study. Arch Gerontol Geriatr. 2017;72:153-163. doi: 10.1016/j.archger.2017.06.005. PubMed
15. Bouillon K, Kivimaki M, Hamer M, et al. Measures of frailty in population-based studies: an overview. BMC Geriatrics. 2013;13(1):64. doi: 10.1186/1471-2318-13-64. PubMed
Frailty is associated with adverse outcomes in hospitalized patients, including longer length of stay, increased risk of institutionalization at discharge, and higher rates of readmissions or death postdischarge.1-4 Multiple tools have been developed to evaluate frailty and in an earlier study,4 we compared the three most common of these and demonstrated that the Clinical Frailty Scale (CFS)5 was the most useful tool clinically as it was most strongly associated with adverse events in the first 30 days after discharge. However, it must be collected prospectively and requires contact with patients or proxies for the evaluator to assign the patient into one of nine categories depending on their disease state, mobility, cognition, and ability to perform instrumental and functional activities of daily living. Recently, a new score has been described which is based on an administrative data algorithm that assigns points to patients having any of 109 ICD-10 codes listed for their index hospitalization and all hospitalizations in the prior two years and can be generated retrospectively without trained observers.6 Although higher Hospital Frailty Risk Scores (HFRS) were associated with greater risk of postdischarge adverse events, the kappa when compared with the CFS was only 0.30 (95% CI 0.22-0.38) in that study.6 However, as the HFRS was developed and validated in patients aged ≥75 years within the UK National Health Service, the authors themselves recommended that it be evaluated in other healthcare systems, other populations, and with comparison to prospectively collected frailty data from cumulative deficit models such as the CFS.
The aim of this study was to compare frailty assessments using the CFS and the HFRS in a population of adult patients hospitalized on general medical wards in North America to determine the impact on prevalence estimates and prediction of outcomes within the first 30 days after hospital discharge (a timeframe highlighted in the Affordable Care Act and used by Centers for Medicare & Medicaid Services as an important hospital quality indicator).
METHODS
As described previously,7 we performed a prospective cohort study of adults without cognitive impairment or life expectancy less than three months being discharged back to the community (not to long-term care facilities) from general medical wards in two teaching hospitals in Edmonton, Alberta, between October 2013 and November 2014. All patients provided signed consent, and the University of Alberta Health Research Ethics board (project ID Pro00036880) approved the study.
Trained observers assessed each patient’s frailty status within 24 hours of discharge based on the patient’s best status in the week prior to becoming ill with the reason for the index hospitalization. The research assistant classified patients into one of the following nine CFS categories: very fit, well, managing well, vulnerable, mildly frail (need help with at least one instrumental activities of daily living such as shopping, finances, meal preparation, or housework), moderately frail (need help with one or two activities of daily living such as bathing and dressing), severely frail (dependent for personal care), very severely frail (bedbound), and terminally ill. According to the CFS validation studies, the last five categories were defined as frail for the purposes of our analyses.
Independent of the trained observer’s assessments, we calculated the HFRS for each participant in our cohort by linking to Alberta administrative data holdings within the Alberta Health Services Data Integration and Measurement Reporting unit and examining all diagnostic codes for the index hospitalization and any other hospitalizations in the prior two years for the 109 ICD-10 codes listed in the original HFRS paper and used the same score cutpoints as they reported (HFRS <5 being low risk, 5-15 defined as intermediate risk, and >15 as high risk for frailty; scores ≥5 were defined as frail).6
All patients were followed after discharge by research personnel blinded to the patient’s frailty assessment. We used patient/caregiver self-report and the provincial electronic health record to collect information on all-cause readmissions or mortality within 30 days.
We have previously reported4,7 the association between frailty defined by the CFS and unplanned readmissions or death within 30 days of discharge but in this study, we examined the correlation between CFS-defined frailty and the HFRS score (classifying those with intermediate or high scores as frail) using chance-corrected kappa coefficients. We also compared the prognostic accuracy of both models for predicting death and/or unplanned readmissions within 30 days using the C statistic and the integrated discrimination improvement index and examined patients aged >65 years as a subgroup.8 We used SAS version 9.4 (SAS Institute, Cary, North Carolina) for analyses, with P values of <.05 considered as statistically significant.
RESULTS
Of the 499 patients in our original cohort,7 we could not link 10 to the administrative data to calculate HFRS, and thus this study sample is only 489 patients (mean age 64 years, 50% women, 52% older than 65 years, a mean of 4.9 comorbidities, and median length of stay five days).
Overall, 276 (56%) patients were deemed frail according to at least one assessment (214 [44%] on the HFRS [35% intermediate risk and 9% high risk] and 161 [33%] on the CFS), and 99 (20%) met both frailty definitions (Appendix Figure). Among the 252 patients aged >65 years, 66 (26%) met both frailty definitions and 166 (66%) were frail according to at least one assessment. Agreement between HFRS and the CFS (kappa 0.24, 95% CI 0.16-0.33) was poor. The CFS definition of frailty was 46% sensitive and 77% specific in classifying frail patients compared with HFRS-defined frailty.
As we reported earlier,4 patients deemed frail were generally similar across scales in that they were older, had more comorbidities, more prescriptions, longer lengths of stay, and poorer quality of life than nonfrail patients (all P < .01, Table 1). However, patients classified as frail on the HFRS only but not meeting the CFS definition were younger, had higher quality of life, and despite a similar Charlson Score and number of comorbidities were much more likely to have been living independently prior to admission than those classified as frail on the CFS.
Death or unplanned readmission within 30 days occurred in 13.3% (65 patients), with most events being readmissions (62, 12.7%). HFRS-defined frail patients exhibited higher 30-day death/readmission rates (16% vs 11% for not frail, P = .08; 14% vs 11% in the elderly, P = .5), which was not statistically significantly different from the nonfrail patients even after adjusting for age and sex (aOR [adjusted odds ratio] 1.62, 95% CI 0.95-2.75 for all adults; aOR 1.24, 95% CI 0.58-2.63 for the elderly). CFS-defined frail patients had significantly higher 30-day readmission/death rates (19% vs 10% for not frail, aOR 2.53, 95% CI 1.40-4.57 for all adults and 21% vs 6% in the elderly, aOR 4.31, 95% CI 1.80-10.31).
Adding the HFRS results to the CFS-based predictive models added little new information, with an integrated discrimination improvement of only 0.009 that was not statistically significant (P = .09, Table 2). In fact, the HFRS was not an independent predictor of postdischarge outcomes after adjusting for age and sex. Although predictive models incorporating the CFS demonstrated the best C statistics, none of the models had high C statistics (ranging between 0.54 and 0.64 for all adults and between 0.55 and 0.68 for those aged >65 years). Even when the frailty definitions were examined as continuous variables, the C statistics were similar as for the dichotomized analyses (0.64 for CFS and 0.58 for HFRS) and the correlation between the two remained weak (Spearman’s correlation coefficient 0.34).
DISCUSSION
We have demonstrated that the prevalence of frailty in patients being discharged from medical wards was high, with the HFRS (44%) being higher than the CFS (33%), and that only 46% of patients deemed frail on the HFRS were also deemed frail on the CFS. We confirm the report by the developers of the HFRS that there was poor correlation between the CFS cumulative deficit model and the administrative-data-based HFRS model in our cohort, even among those older than 65 years.
Previous studies have reported marked heterogeneity in prevalence estimates between different frailty instruments.2,9 For example, Aguayo et al. found that the prevalence of frailty in the English Longitudinal Study of Aging varied between 0.9% and 68% depending on which of the 35 frailty scales they tested were used, although the prevalence with comprehensive geriatric assessments (the gold standard) was 14.9% (and 15.3% on the CFS).9 Although frail patients are at higher risk for death and/or readmission after discharge, other investigators have also reported similar findings to ours that frailty-based risk models are surprisingly modest at predicting postdischarge readmission or death, with the C statistics ranging between 0.52 and 0.57, although the CFS appears to correlate best with the gold standard of comprehensive geriatric assessment.10-14 This is not surprising since the CFS is multidimensional and as a cumulative deficit model, it incorporates assessment of the patient’s underlying diseases, cognition, function, mobility, and mood in the assignment of their CFS level. Regardless, others15 have pointed out the need for studies such as ours to compare the validity of published frailty scales.
Despite our prospective cohort design and blinded endpoint ascertainment, there are some potential limitations to our study. First, we excluded long-term care residents and patients with foreshortened life expectancy – the frailest of the frail – from our analysis of 30-day outcomes, thereby potentially reducing the magnitude of the association between frailty and adverse outcomes. However, we were interested only in situations where clinicians were faced with equipoise about patient prognosis. Second, we assessed only 30-day readmissions or deaths and cannot comment on the impact of frailty definitions on other postdischarge outcomes (such as discharge locale or need for home care services) or other timeframes. Finally, although the association between the HFRS definition of frailty and the 30-day mortality/readmission was not statistically significant, the 95% confidence intervals were wide and thus we cannot definitively rule out a positive association.
In conclusion, considering that it had the strongest association with postdischarge outcomes and is the fastest and easiest to perform, the most useful of the frailty assessment tools for clinicians at the bedside still appears to be the CFS (both overall and in those patients who are elderly). However, for researchers who are analyzing data retrospectively or policy planners looking at health services data where the CFS was not collected, the HFRS holds promise for risk adjustment in population-level studies comparing processes and outcomes between hospitals.
Acknowledgments
The authors would like to acknowledge Miriam Fradette, Debbie Boyko, Sara Belga, Darren Lau, Jenelle Pederson, and Sharry Kahlon for their important contributions in data acquisition in our original cohort study, as well as all the physicians rotating through the general internal medicine wards at the University of Alberta Hospital for their help in identifying the patients. We also thank Dr. Simon Conroy, MB ChB PhD, University of Leicester, UK, for his helpful comments on an earlier draft of this manuscript.
Disclosures
The authors declare no conflicts of interest. All authors had access to the data and played a role in writing and revising this manuscript.
Funding
Funding for this study was provided by an operating grant from Alberta Innovates - Health Solutions. F.A.M. holds the Chair in Cardiovascular Outcomes Research at the Mazankowski Heart Institute, University of Alberta. The authors have no affiliations or financial interests with any organization or entity with a financial interest in the contents of this manuscript.
Frailty is associated with adverse outcomes in hospitalized patients, including longer length of stay, increased risk of institutionalization at discharge, and higher rates of readmissions or death postdischarge.1-4 Multiple tools have been developed to evaluate frailty and in an earlier study,4 we compared the three most common of these and demonstrated that the Clinical Frailty Scale (CFS)5 was the most useful tool clinically as it was most strongly associated with adverse events in the first 30 days after discharge. However, it must be collected prospectively and requires contact with patients or proxies for the evaluator to assign the patient into one of nine categories depending on their disease state, mobility, cognition, and ability to perform instrumental and functional activities of daily living. Recently, a new score has been described which is based on an administrative data algorithm that assigns points to patients having any of 109 ICD-10 codes listed for their index hospitalization and all hospitalizations in the prior two years and can be generated retrospectively without trained observers.6 Although higher Hospital Frailty Risk Scores (HFRS) were associated with greater risk of postdischarge adverse events, the kappa when compared with the CFS was only 0.30 (95% CI 0.22-0.38) in that study.6 However, as the HFRS was developed and validated in patients aged ≥75 years within the UK National Health Service, the authors themselves recommended that it be evaluated in other healthcare systems, other populations, and with comparison to prospectively collected frailty data from cumulative deficit models such as the CFS.
The aim of this study was to compare frailty assessments using the CFS and the HFRS in a population of adult patients hospitalized on general medical wards in North America to determine the impact on prevalence estimates and prediction of outcomes within the first 30 days after hospital discharge (a timeframe highlighted in the Affordable Care Act and used by Centers for Medicare & Medicaid Services as an important hospital quality indicator).
METHODS
As described previously,7 we performed a prospective cohort study of adults without cognitive impairment or life expectancy less than three months being discharged back to the community (not to long-term care facilities) from general medical wards in two teaching hospitals in Edmonton, Alberta, between October 2013 and November 2014. All patients provided signed consent, and the University of Alberta Health Research Ethics board (project ID Pro00036880) approved the study.
Trained observers assessed each patient’s frailty status within 24 hours of discharge based on the patient’s best status in the week prior to becoming ill with the reason for the index hospitalization. The research assistant classified patients into one of the following nine CFS categories: very fit, well, managing well, vulnerable, mildly frail (need help with at least one instrumental activities of daily living such as shopping, finances, meal preparation, or housework), moderately frail (need help with one or two activities of daily living such as bathing and dressing), severely frail (dependent for personal care), very severely frail (bedbound), and terminally ill. According to the CFS validation studies, the last five categories were defined as frail for the purposes of our analyses.
Independent of the trained observer’s assessments, we calculated the HFRS for each participant in our cohort by linking to Alberta administrative data holdings within the Alberta Health Services Data Integration and Measurement Reporting unit and examining all diagnostic codes for the index hospitalization and any other hospitalizations in the prior two years for the 109 ICD-10 codes listed in the original HFRS paper and used the same score cutpoints as they reported (HFRS <5 being low risk, 5-15 defined as intermediate risk, and >15 as high risk for frailty; scores ≥5 were defined as frail).6
All patients were followed after discharge by research personnel blinded to the patient’s frailty assessment. We used patient/caregiver self-report and the provincial electronic health record to collect information on all-cause readmissions or mortality within 30 days.
We have previously reported4,7 the association between frailty defined by the CFS and unplanned readmissions or death within 30 days of discharge but in this study, we examined the correlation between CFS-defined frailty and the HFRS score (classifying those with intermediate or high scores as frail) using chance-corrected kappa coefficients. We also compared the prognostic accuracy of both models for predicting death and/or unplanned readmissions within 30 days using the C statistic and the integrated discrimination improvement index and examined patients aged >65 years as a subgroup.8 We used SAS version 9.4 (SAS Institute, Cary, North Carolina) for analyses, with P values of <.05 considered as statistically significant.
RESULTS
Of the 499 patients in our original cohort,7 we could not link 10 to the administrative data to calculate HFRS, and thus this study sample is only 489 patients (mean age 64 years, 50% women, 52% older than 65 years, a mean of 4.9 comorbidities, and median length of stay five days).
Overall, 276 (56%) patients were deemed frail according to at least one assessment (214 [44%] on the HFRS [35% intermediate risk and 9% high risk] and 161 [33%] on the CFS), and 99 (20%) met both frailty definitions (Appendix Figure). Among the 252 patients aged >65 years, 66 (26%) met both frailty definitions and 166 (66%) were frail according to at least one assessment. Agreement between HFRS and the CFS (kappa 0.24, 95% CI 0.16-0.33) was poor. The CFS definition of frailty was 46% sensitive and 77% specific in classifying frail patients compared with HFRS-defined frailty.
As we reported earlier,4 patients deemed frail were generally similar across scales in that they were older, had more comorbidities, more prescriptions, longer lengths of stay, and poorer quality of life than nonfrail patients (all P < .01, Table 1). However, patients classified as frail on the HFRS only but not meeting the CFS definition were younger, had higher quality of life, and despite a similar Charlson Score and number of comorbidities were much more likely to have been living independently prior to admission than those classified as frail on the CFS.
Death or unplanned readmission within 30 days occurred in 13.3% (65 patients), with most events being readmissions (62, 12.7%). HFRS-defined frail patients exhibited higher 30-day death/readmission rates (16% vs 11% for not frail, P = .08; 14% vs 11% in the elderly, P = .5), which was not statistically significantly different from the nonfrail patients even after adjusting for age and sex (aOR [adjusted odds ratio] 1.62, 95% CI 0.95-2.75 for all adults; aOR 1.24, 95% CI 0.58-2.63 for the elderly). CFS-defined frail patients had significantly higher 30-day readmission/death rates (19% vs 10% for not frail, aOR 2.53, 95% CI 1.40-4.57 for all adults and 21% vs 6% in the elderly, aOR 4.31, 95% CI 1.80-10.31).
Adding the HFRS results to the CFS-based predictive models added little new information, with an integrated discrimination improvement of only 0.009 that was not statistically significant (P = .09, Table 2). In fact, the HFRS was not an independent predictor of postdischarge outcomes after adjusting for age and sex. Although predictive models incorporating the CFS demonstrated the best C statistics, none of the models had high C statistics (ranging between 0.54 and 0.64 for all adults and between 0.55 and 0.68 for those aged >65 years). Even when the frailty definitions were examined as continuous variables, the C statistics were similar as for the dichotomized analyses (0.64 for CFS and 0.58 for HFRS) and the correlation between the two remained weak (Spearman’s correlation coefficient 0.34).
DISCUSSION
We have demonstrated that the prevalence of frailty in patients being discharged from medical wards was high, with the HFRS (44%) being higher than the CFS (33%), and that only 46% of patients deemed frail on the HFRS were also deemed frail on the CFS. We confirm the report by the developers of the HFRS that there was poor correlation between the CFS cumulative deficit model and the administrative-data-based HFRS model in our cohort, even among those older than 65 years.
Previous studies have reported marked heterogeneity in prevalence estimates between different frailty instruments.2,9 For example, Aguayo et al. found that the prevalence of frailty in the English Longitudinal Study of Aging varied between 0.9% and 68% depending on which of the 35 frailty scales they tested were used, although the prevalence with comprehensive geriatric assessments (the gold standard) was 14.9% (and 15.3% on the CFS).9 Although frail patients are at higher risk for death and/or readmission after discharge, other investigators have also reported similar findings to ours that frailty-based risk models are surprisingly modest at predicting postdischarge readmission or death, with the C statistics ranging between 0.52 and 0.57, although the CFS appears to correlate best with the gold standard of comprehensive geriatric assessment.10-14 This is not surprising since the CFS is multidimensional and as a cumulative deficit model, it incorporates assessment of the patient’s underlying diseases, cognition, function, mobility, and mood in the assignment of their CFS level. Regardless, others15 have pointed out the need for studies such as ours to compare the validity of published frailty scales.
Despite our prospective cohort design and blinded endpoint ascertainment, there are some potential limitations to our study. First, we excluded long-term care residents and patients with foreshortened life expectancy – the frailest of the frail – from our analysis of 30-day outcomes, thereby potentially reducing the magnitude of the association between frailty and adverse outcomes. However, we were interested only in situations where clinicians were faced with equipoise about patient prognosis. Second, we assessed only 30-day readmissions or deaths and cannot comment on the impact of frailty definitions on other postdischarge outcomes (such as discharge locale or need for home care services) or other timeframes. Finally, although the association between the HFRS definition of frailty and the 30-day mortality/readmission was not statistically significant, the 95% confidence intervals were wide and thus we cannot definitively rule out a positive association.
In conclusion, considering that it had the strongest association with postdischarge outcomes and is the fastest and easiest to perform, the most useful of the frailty assessment tools for clinicians at the bedside still appears to be the CFS (both overall and in those patients who are elderly). However, for researchers who are analyzing data retrospectively or policy planners looking at health services data where the CFS was not collected, the HFRS holds promise for risk adjustment in population-level studies comparing processes and outcomes between hospitals.
Acknowledgments
The authors would like to acknowledge Miriam Fradette, Debbie Boyko, Sara Belga, Darren Lau, Jenelle Pederson, and Sharry Kahlon for their important contributions in data acquisition in our original cohort study, as well as all the physicians rotating through the general internal medicine wards at the University of Alberta Hospital for their help in identifying the patients. We also thank Dr. Simon Conroy, MB ChB PhD, University of Leicester, UK, for his helpful comments on an earlier draft of this manuscript.
Disclosures
The authors declare no conflicts of interest. All authors had access to the data and played a role in writing and revising this manuscript.
Funding
Funding for this study was provided by an operating grant from Alberta Innovates - Health Solutions. F.A.M. holds the Chair in Cardiovascular Outcomes Research at the Mazankowski Heart Institute, University of Alberta. The authors have no affiliations or financial interests with any organization or entity with a financial interest in the contents of this manuscript.
1. Clegg A, Young J, Iliffe S, Rikkert MO, Rockwood K. Frailty in elderly people. Lancet. 2013;381(9868):752-762. doi: 10.1016/S0140-6736(12)62167-9. PubMed
2. Collard RM, Boter H, Schoevers RA, Oude Voshaar RC. Prevalence of frailty in community-dwelling older persons: a systematic review. J Am Geriatr Soc. 2012;60(8):1487-1492. doi: 10.1111/j.1532-5415.2012.04054.x. PubMed
3. de Vries NM, Staal JB, van Ravensberg CD, Hobbelen JS, Olde Rikkert MG, Nijhuis-van der Sanden MW. Outcome instruments to measure frailty: a systematic review. Ageing Res Rev. 2011;10(1):104-114. doi: 10.1016/j.arr.2010.09.001. PubMed
4. Belga S, Majumdar SR, Kahlon S, et al. Comparing three different measures of frailty in medical inpatients: multicenter prospective cohort study examining 30-day risk of readmission or death. J Hosp Med. 2016;11(8):556-562. doi: 10.1002/jhm.2607. PubMed
5. Rockwood K, Andrew M, Mintnitski A. A comparison of two approaches to measuring frailty in elerly people. J Gerontol. 2007;62(7):738-743. doi: 10.1093/gerona/62.7.738. PubMed
6. Gilbert T, Neuburger J, Kraindler J, et al. Development and validation of a Hospital Frailty Risk Score focusing on older people in acute care settings using electronic hospital records: an observational study. Lancet. 2018;391(10132):1775-1782. doi: 10.1016/S0140-6736(18)30668-8Get. PubMed
7. Kahlon S, Pederson J, Majumdar SR, et al. Association between frailty and 30-day outcomes after discharge from hospital. CMAJ. 2015;187(11):799-804. doi: 10.1503/cmaj.150100. PubMed
8. Pencina MJ, D’ Agostino RB, Vasan RS. Evaluating the added predictive ability of a new marker: from area under the roc curve to reclassification and beyond. Stat Med. 2008;27(2):157-172. doi: 10.1002/sim.2929.
9. Aguayo GA, Donneau A-F, Vaillant MT, et al. Agreement between 35 published frailty scores in the general population. Am J Epidemiol. 2017;186(4):420-434. doi: 10.1093/aje/kwx061. PubMed
10. Ritt M, Bollheimer LC, Siever CC, Gaßmann KG. Prediction of one-year mortality by five different frailty instruments: a comparative study in hospitalized geriatric patients. Arch Gerontol Geriatr. 2016;66:66-72. doi: 10.1016/j.archger.2016.05.004. PubMed
11. Forti P, Rietti E, Pisacane N, Olivelli V, Maltoni B, Ravaglia G. A comparison of frailty indexes for prediction of adverse health outcomes in a elderly cohort. Arch Gerontol Geriatr. 2012;54(1):16-20. doi: 10.1016/j.archger.2011.01.007. PubMed
12. Wou F, Gladman JR, Bradshaw L, Franklin M, Edmans J, Conroy SP. The predictive properties of frailty-rating scales in the acute medical unit. Age Ageing. 2013;42(6):776-781. doi: 10.1093/ageing/aft055. PubMed
13. Wallis SJ, Wall J, Biram RW, Romero-Ortuno R. Association of the clinical frailty scale with hospital outcomes. QJM. 2015;108(12):943-949. doi: 10.1093/qjmed/hcv066. PubMed
14. Harmand MGC, Meillon C, Bergua V, et al. Comparing the predictive value of three definitions of frailty: results from the Three-City Study. Arch Gerontol Geriatr. 2017;72:153-163. doi: 10.1016/j.archger.2017.06.005. PubMed
15. Bouillon K, Kivimaki M, Hamer M, et al. Measures of frailty in population-based studies: an overview. BMC Geriatrics. 2013;13(1):64. doi: 10.1186/1471-2318-13-64. PubMed
1. Clegg A, Young J, Iliffe S, Rikkert MO, Rockwood K. Frailty in elderly people. Lancet. 2013;381(9868):752-762. doi: 10.1016/S0140-6736(12)62167-9. PubMed
2. Collard RM, Boter H, Schoevers RA, Oude Voshaar RC. Prevalence of frailty in community-dwelling older persons: a systematic review. J Am Geriatr Soc. 2012;60(8):1487-1492. doi: 10.1111/j.1532-5415.2012.04054.x. PubMed
3. de Vries NM, Staal JB, van Ravensberg CD, Hobbelen JS, Olde Rikkert MG, Nijhuis-van der Sanden MW. Outcome instruments to measure frailty: a systematic review. Ageing Res Rev. 2011;10(1):104-114. doi: 10.1016/j.arr.2010.09.001. PubMed
4. Belga S, Majumdar SR, Kahlon S, et al. Comparing three different measures of frailty in medical inpatients: multicenter prospective cohort study examining 30-day risk of readmission or death. J Hosp Med. 2016;11(8):556-562. doi: 10.1002/jhm.2607. PubMed
5. Rockwood K, Andrew M, Mintnitski A. A comparison of two approaches to measuring frailty in elerly people. J Gerontol. 2007;62(7):738-743. doi: 10.1093/gerona/62.7.738. PubMed
6. Gilbert T, Neuburger J, Kraindler J, et al. Development and validation of a Hospital Frailty Risk Score focusing on older people in acute care settings using electronic hospital records: an observational study. Lancet. 2018;391(10132):1775-1782. doi: 10.1016/S0140-6736(18)30668-8Get. PubMed
7. Kahlon S, Pederson J, Majumdar SR, et al. Association between frailty and 30-day outcomes after discharge from hospital. CMAJ. 2015;187(11):799-804. doi: 10.1503/cmaj.150100. PubMed
8. Pencina MJ, D’ Agostino RB, Vasan RS. Evaluating the added predictive ability of a new marker: from area under the roc curve to reclassification and beyond. Stat Med. 2008;27(2):157-172. doi: 10.1002/sim.2929.
9. Aguayo GA, Donneau A-F, Vaillant MT, et al. Agreement between 35 published frailty scores in the general population. Am J Epidemiol. 2017;186(4):420-434. doi: 10.1093/aje/kwx061. PubMed
10. Ritt M, Bollheimer LC, Siever CC, Gaßmann KG. Prediction of one-year mortality by five different frailty instruments: a comparative study in hospitalized geriatric patients. Arch Gerontol Geriatr. 2016;66:66-72. doi: 10.1016/j.archger.2016.05.004. PubMed
11. Forti P, Rietti E, Pisacane N, Olivelli V, Maltoni B, Ravaglia G. A comparison of frailty indexes for prediction of adverse health outcomes in a elderly cohort. Arch Gerontol Geriatr. 2012;54(1):16-20. doi: 10.1016/j.archger.2011.01.007. PubMed
12. Wou F, Gladman JR, Bradshaw L, Franklin M, Edmans J, Conroy SP. The predictive properties of frailty-rating scales in the acute medical unit. Age Ageing. 2013;42(6):776-781. doi: 10.1093/ageing/aft055. PubMed
13. Wallis SJ, Wall J, Biram RW, Romero-Ortuno R. Association of the clinical frailty scale with hospital outcomes. QJM. 2015;108(12):943-949. doi: 10.1093/qjmed/hcv066. PubMed
14. Harmand MGC, Meillon C, Bergua V, et al. Comparing the predictive value of three definitions of frailty: results from the Three-City Study. Arch Gerontol Geriatr. 2017;72:153-163. doi: 10.1016/j.archger.2017.06.005. PubMed
15. Bouillon K, Kivimaki M, Hamer M, et al. Measures of frailty in population-based studies: an overview. BMC Geriatrics. 2013;13(1):64. doi: 10.1186/1471-2318-13-64. PubMed
© 2019 Society of Hospital Medicine
Things We Do For No Reason: Failing to Question a Penicillin Allergy History
Inspired by the ABIM Foundation’s Choosing Wisely® campaign, the “Things We Do for No Reason” (TWDFNR) series reviews practices that have become common parts of hospital care but may provide little value to our patients. Practices reviewed in the TWDFNR series do not represent “black and white” conclusions or clinical practice standards but are meant as a starting place for research and active discussions among hospitalists and patients. We invite you to be part of that discussion.

CLINICAL SCENARIO
An 80-year-old male—with a past medical history significant for hypertension, atrial fibrillation, and type II diabetes mellitus—presented to the hospital with fevers, confusion, and urinary outflow tract difficulties. On exam, he was noted to have mild suprapubic tenderness with flank tenderness. Blood and urine cultures grew Enterococcus faecalis sensitive to ampicillin. Because of the patient’s listed penicillin (PCN) allergy, he was started on aztreonam and vancomycin instead of ampicillin.
WHY YOU MIGHT SIMPLY ACCEPT A PCN ALLERGY HISTORY
Ten percent of the population in the United States reports an allergy to penicillin and derivatives—one of the most commonly reported drug allergies.1 Allergic reactions to drugs are distinct immune reactions mediated by drug-specific immunoglobulin E (IgE) that are potentially life-threatening. Specifically these allergic reactions are called IgE-mediated, type 1 hypersensitivity reactions which are characterized by hives; itching; flushing; tissue swelling, especially in areas of the face and neck; bronchospasm; and gastrointestinal (GI) symptoms, including cramping and diarrhea. Head and neck swelling can quickly result in airway compromise. Profound fluid extravasation and release of mediators from mast cells and basophils can rapidly drop blood pressure. Anaphylaxis requires rapid intervention to prevent severe complications and death. Given the life-threatening consequences of anaphylaxis, a cautious approach before administering PCN to PCN-allergic patients is mandatory.
WHY YOU SHOULD QUESTION A REPORTED PCN ALLERGY
While 10% of the adult population and 15% of hospitalized adults report PCN allergy, clinical studies suggest that 90% of all patients reporting a PCN allergy can tolerate PCN antibiotics.1-3 There are several reasons patients initially labeled as PCN allergic may later be able to tolerate this drug. First, patients can lose sensitivity to specific PCN IgE antibodies over time if PCN is avoided.4 Second, non-IgE-mediated immune reactions of skin or GI tract are often wrongly attributed to an IgE-mediated process from a concurrent medication (Table). For example, viral infections can cause exanthems or hives which may be mistaken for an antibiotic-associated IgE-meditated allergic reaction.6 These non-IgE skin reactions include severe manifestations including Stevens-Johnson syndrome (SJS) and toxic epidermal necrolysis or benign adverse reactions such as GI upset, dizziness, or diarrhea which are often misclassified as an allergy, and this error is perpetuated in the medical record. Third, patients may report a PCN allergy for themselves when a family member is possibly allergic.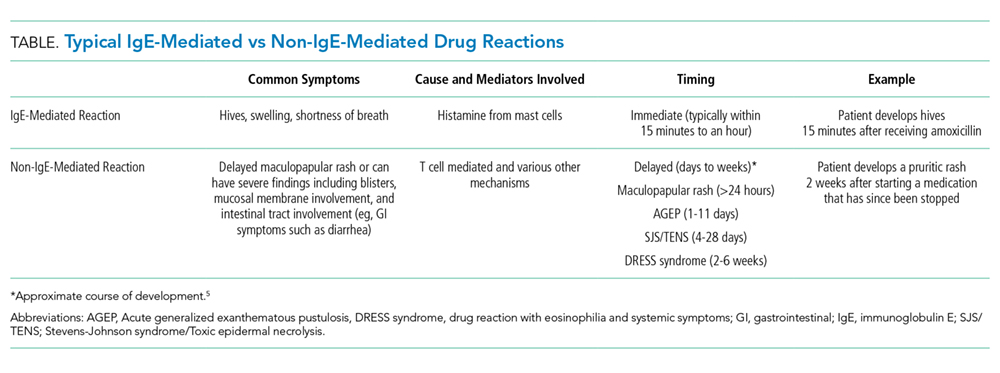
PCN allergy has risen to the level of a public health issue as PCN-allergic patients are often relegated to second-line broad-spectrum antibiotics.7 This public health issue is exacerbated when patients with faux or resolved PCN allergy receive the same treatment. Patients labeled as PCN allergic—whether correctly or incorrectly—have poorer outcomes as noted by increased rates of serious infections and tend to have longer hospital stays.8-10 Treatment-related secondary infections from the use of broad-spectrum antibiotics, such as Clostridiiodes difficile and vancomycin-resistant Enterococcus, are identified more frequently in PCN-allergic patients.7 Additionally, pregnant women with PCN allergy, with or without group B streptococcus infections, have higher rates of cesarean sections and longer hospitalizations.11 The misuse and overuse of antibiotics, especially broad-spectrum medications, has led to resistant bacteria that are increasingly difficult to treat.7 Treating with the most narrow-spectrum antibiotic whenever possible is critical. Overall, failure to address and assess PCN allergy can result in treatment failures and unnecessary broad-spectrum antibiotic use.
WHEN YOU SHOULD BELIEVE A REPORTED PCN AND BETA-LACTAMS ALLERGY HISTORY
Avoid beta-lactams for patients with a reported allergy who are medically frail (eg, critically ill intensive care unit patients and those unable to communicate) or have a documented allergic reaction to a beta-lactam within five years. An estimated 50% of patients who had a documented true IgE-mediated allergic reaction within five years of a documented true allergic reaction remain allergic to PCN and are at risk for an allergic reaction with reexposure.1 PCN allergy evaluation with PCN skin testing (PST) and oral challenge in patients who had a reaction within five years have a higher risk of a fatal outcome with an oral challenge despite negative skin testing. PCN allergy evaluation is best handled on a case by case basis in this population.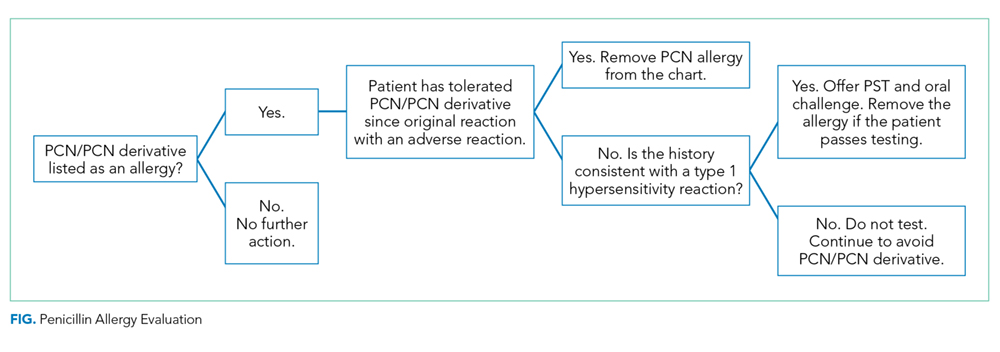
WHAT YOU SHOULD DO INSTEAD
Obtain a thorough drug allergy history. If the history is not consistent with a personal history of an IgE-mediated reaction to PCN ever or if there is documentation that PCN was administered and tolerated since the reaction (eg, a dental prescription), a PCN or beta-lactam can be given. An exception to this rule are patients with a history of an allergic reaction to both a cephalosporin and a PCN—approach this as two separate allergies. Remove the PCN allergy if it is not consistent with the history of IgE-mediated reaction or the patient subsequently had tolerated a PCN/PCN derivative. Regarding the cephalosporin issue, patients are often allergic to a side chain of the cephalosporin and not to the beta-lactam ring. Patients should avoid the specific cephalosporin unless the history is also not consistent with an IgE-mediated reaction or the patient had subsequently tolerated this medication. An allergy evaluation can be useful to discern next steps for cephalosporin allergy. Once the antibiotic is administered and tolerated, the medical record should be updated as well to prevent future mislabeling.
If the symptoms associated with a reported history of a PCN allergy are unknown or consistent with an IgE-mediated reaction, or the patient has not been exposed to PCN since the allergic reaction, the patient should undergo PST followed by a supervised oral test dose to determine whether the allergy exists or persists. PCN allergy evaluation is a simple two-step process of PST followed by an oral challenge of amoxicillin. The use of PCN allergy testing as described is validated and safe.12 A negative skin prick and intradermal test have a negative predictive value that approaches 100%.12,13 Completing the final step—the oral challenge—eliminates concerns for false-negative testing results and patient fears. Additionally, once a patient has had negative skin testing and passed an oral challenge, he/she is not at increased risk of resensitization after PCN/PCN derivative use.14
Although the test takes one and a half hours on average, the benefits that follow are lifelong. Improving future management by disproving a reported allergy affects an individual patient’s clinical course globally, results in cost savings, and increases the use of narrow-spectrum antimicrobials. It is particularly important to test PCN-allergic patients preemptively who are at high risk of requiring PCN/PCN derivative antibiotics. High-risk patients include, but are not limited to, surgery, transplant, hematology/oncology, and immunosuppressed patients. Inpatients with PCN allergy have higher antibiotic costs—both for medications used during their hospitalization and also for discharge medications.15 A study by Macy and Contreras compared the cost of skin testing to money saved by shortening hospitalization days for 51,582 patients with PCN allergy.7 The cost for testing was $131.37 each (total of $6.7 million). The testing contributed to a $64 million savings for the three-year study period—savings that is 9.5 times larger than the cost of the evaluation.8 A smaller study that looked at cost-effectiveness of PST for 50 patients found an overall cost savings of $11,005 due to the antimicrobial choice alone ($297 per patient switched to a beta-lactam antibiotic).16
RECOMMENDATIONS
- Obtain a thorough drug allergy history as many “allergic reactions” can be removed by history alone. Update the medical record if you can confirm a patient has since tolerated PCN or a PCN derivative to which they were previously allergic. Offer a supervised oral challenge if the patient has any concerns.
- Perform PST if a patient has a PCN allergy listed in their chart and the allergy history is unclear. A negative skin test should be followed by a supervised oral challenge to PCN/PCN derivative if skin testing is negative.
- Test PCN-allergic patients preemptively who are at high risk of requiring PCN/PCN derivative antibiotics. High-risk patients include surgery, transplant, hematology/oncology, and immunosuppressed patients.
- Implement published protocols from allergists for healthcare systems that lack access to allergy physicians.
- Do not perform PST on patients with a history that is suggestive of a non-IgE-mediated allergic reaction. For these cases, patients are advised to avoid the medication. A supervised graded oral challenge can be considered on a case by case basis if the reaction was not a severe cutaneous adverse reaction syndrome, like SJS, and the benefit of using the medication outweighs the potential harm.
CONCLUSION
The patient, in this case, reported an allergic reaction to PCN over 50 years before this presentation. The reported reaction immediately after receiving IV PCN was a rash—a symptom concerning for an IgE-mediated reaction. Since the patient is well over 10 years from his allergic reaction and would benefit from a PCN derivative, PST testing should be pursued.
The patient passed his skin testing and an oral challenge dose of amoxicillin. With the PCN allergy removed from his chart, his medical team transitioned him from aztreonam and vancomycin to ampicillin. He was then discharged home on amoxicillin and informed that he might be safely treated with PCN/PCN derivatives in the future.
Given the rise in antimicrobial resistance and both the clinical implications and increased costs associated with PCN allergy, it is crucial to offer an allergy evaluation to patients identified as PCN allergic. Hospitalists play a crucial role in obtaining the initial history, determining if the patient has tolerated the antibiotic since the initial reaction, and identifying patients who may benefit from further evaluation for PCN allergy. In hospitals with PST available for inpatients, testing can be performed during the admission. Additionally, it is essential that allergists work with hospitalists and primary care physicians to provide seamless access to outpatient drug allergy evaluations (PST followed by oral challenge) to address the issue of PCN allergy before an acute need for a PCN/PCN derivative antibiotic in the hospital.
Do you think this is a low-value practice? Is this truly a “Thing We Do for No Reason?” Share what you do in your practice and join in the conversation online by retweeting it on Twitter (#TWDFNR) and liking it on Facebook. We invite you to propose ideas for other “Things We Do for No Reason” topics by e-mailing TWDFNR@hospitalmedicine.org.
Disclosures
The authors have no conflicts of interest.
Funding
This work is supported by the following NIH Grant: T-32 AI007062-39.
1. American Academy of Allergy, Asthma and Immunology, the American College of Allergy, Asthma and Immunology, and the Joint Council of Allergy, Asthma and Immunology. Drug allergy: an updated practice parameter. Ann Allergy Asthma Immunol. 2010;105(4):259-273. https://doi.org/10.1016/j.anai.2010.08.002.
2. American Academy of Allergy AI. Ten things physicians and patients should question Choosing Wisely, ABIM Foundation 2014. http://www.choosingwisely.org/clinician-lists/american-academy-allergy-asthma-immunlogy-non-beta-lactam-antibiotics-penicillin-allergy/. Accessed October 23, 2017.
3. Blumenthal KG, Wickner PG, Hurwitz S, et al. Tackling inpatient penicillin allergies: Assessing tools for antimicrobial stewardship. J Allergy Clin Immunol. 2017;140(1):154-161. https://doi.org/10.1016/j.jaci.2017.02.005.
4. Blanca M, Torres MJ, Garcia JJ, et al. Natural evolution of skin test sensitivity in patients allergic to beta-lactam antibiotics. J Allergy Clin Immunol. 1999;103(5):918-924. https://doi.org/10.1016/S0091-6749(99)70439-2.
5. Duong TA Valeyrie-Allanore L, Wolkenstein P, Chosidow O. Severe cutaneous adverse reactions to drugs. Lancet. 2017;390(10106:1996-2011. doi:10.1016/S0140-6736(16)30378-6.
6. Gonzalez-Estrada A, Radojicic C. Penicillin allergy: a practical guide for clinicians. Cleve Clin J Med. 2015;82(5):295-300. https://doi.org/10.3949/ccjm.82a.14111.
7. Solensky R. Penicillin allergy as a public health measure. J Allergy Clin Immunol. 2014;133(3):797-798. https://doi.org/10.1016/j.jaci.2013.10.032.
8. Macy E, Contreras R. Health care use and serious infection prevalence associated with penicillin “allergy” in hospitalized patients: a cohort study. J Allergy Clin Immunol. 2014;133(3):790-796. https://doi.org/10.1016/j.jaci.2013.09.021.
9. Chen JR, Khan DA. Evaluation of penicillin allergy in the hospitalized patient: opportunities for antimicrobial stewardship. Curr Allergy Asthma Rep. 2017;17(6):40. https://doi.org/10.1007/s11882-017-0706-1.
10. Blumenthal KG, Wickner PG, Hurwitz S, et al. Tackling inpatient penicillin allergies: Assessing tools for antimicrobial stewardship. J Allergy Clin Immunol. 2017;140(1):154-161. https://doi.org/10.1016/j.jaci.2017.02.005.
11. Desai SH, Kaplan MS, Chen Q, Macy EM. Morbidity in pregnant women associated with unverified penicillin allergies, antibiotic use, and group B Streptococcus infections. Perm J. 2017;21. https://doi.org/10.7812/TPP/16-080.
12. Macy E, Ngor EW. Safely diagnosing clinically significant penicillin allergy using only penicilloyl-poly-lysine, penicillin, and oral amoxicillin. J Allergy Clin Immunol Pract. 2013;1(3):258-263. https://doi.org/10.1016/j.jaip.2013.02.002.
13. Solensky R. The time for penicillin skin testing is here. J Allergy Clin Immunol Pract. 2013;1(3):264-265. https://doi.org/10.1016/j.jaip.2013.03.010.
14. Solensky R, Earl HS, Gruchalla RS. Lack of penicillin resensitization in patients with a history of penicillin allergy after receiving repeated penicillin courses. Arch Intern Med. 2002;162(7):822-826.
15. Sade K, Holtzer I, Levo Y, Kivity S. The economic burden of antibiotic treatment of penicillin-allergic patients in internal medicine wards of a general tertiary care hospital. Clin Exp Allergy. 2003;33(4):501-506. https://doi.org/10.1046/j.1365-2222.2003.01638.x.
16. King EA, Challa S, Curtin P, Bielory L. Penicillin skin testing in hospitalized patients with beta-lactam allergies: effect on antibiotic selection and cost. Ann Allergy Asthma Immunol. 2016;117(1):67-71. https://doi.org/10.1016/j.anai.2016.04.021.
Inspired by the ABIM Foundation’s Choosing Wisely® campaign, the “Things We Do for No Reason” (TWDFNR) series reviews practices that have become common parts of hospital care but may provide little value to our patients. Practices reviewed in the TWDFNR series do not represent “black and white” conclusions or clinical practice standards but are meant as a starting place for research and active discussions among hospitalists and patients. We invite you to be part of that discussion.
CLINICAL SCENARIO
An 80-year-old male—with a past medical history significant for hypertension, atrial fibrillation, and type II diabetes mellitus—presented to the hospital with fevers, confusion, and urinary outflow tract difficulties. On exam, he was noted to have mild suprapubic tenderness with flank tenderness. Blood and urine cultures grew Enterococcus faecalis sensitive to ampicillin. Because of the patient’s listed penicillin (PCN) allergy, he was started on aztreonam and vancomycin instead of ampicillin.
WHY YOU MIGHT SIMPLY ACCEPT A PCN ALLERGY HISTORY
Ten percent of the population in the United States reports an allergy to penicillin and derivatives—one of the most commonly reported drug allergies.1 Allergic reactions to drugs are distinct immune reactions mediated by drug-specific immunoglobulin E (IgE) that are potentially life-threatening. Specifically these allergic reactions are called IgE-mediated, type 1 hypersensitivity reactions which are characterized by hives; itching; flushing; tissue swelling, especially in areas of the face and neck; bronchospasm; and gastrointestinal (GI) symptoms, including cramping and diarrhea. Head and neck swelling can quickly result in airway compromise. Profound fluid extravasation and release of mediators from mast cells and basophils can rapidly drop blood pressure. Anaphylaxis requires rapid intervention to prevent severe complications and death. Given the life-threatening consequences of anaphylaxis, a cautious approach before administering PCN to PCN-allergic patients is mandatory.
WHY YOU SHOULD QUESTION A REPORTED PCN ALLERGY
While 10% of the adult population and 15% of hospitalized adults report PCN allergy, clinical studies suggest that 90% of all patients reporting a PCN allergy can tolerate PCN antibiotics.1-3 There are several reasons patients initially labeled as PCN allergic may later be able to tolerate this drug. First, patients can lose sensitivity to specific PCN IgE antibodies over time if PCN is avoided.4 Second, non-IgE-mediated immune reactions of skin or GI tract are often wrongly attributed to an IgE-mediated process from a concurrent medication (Table). For example, viral infections can cause exanthems or hives which may be mistaken for an antibiotic-associated IgE-meditated allergic reaction.6 These non-IgE skin reactions include severe manifestations including Stevens-Johnson syndrome (SJS) and toxic epidermal necrolysis or benign adverse reactions such as GI upset, dizziness, or diarrhea which are often misclassified as an allergy, and this error is perpetuated in the medical record. Third, patients may report a PCN allergy for themselves when a family member is possibly allergic.
PCN allergy has risen to the level of a public health issue as PCN-allergic patients are often relegated to second-line broad-spectrum antibiotics.7 This public health issue is exacerbated when patients with faux or resolved PCN allergy receive the same treatment. Patients labeled as PCN allergic—whether correctly or incorrectly—have poorer outcomes as noted by increased rates of serious infections and tend to have longer hospital stays.8-10 Treatment-related secondary infections from the use of broad-spectrum antibiotics, such as Clostridiiodes difficile and vancomycin-resistant Enterococcus, are identified more frequently in PCN-allergic patients.7 Additionally, pregnant women with PCN allergy, with or without group B streptococcus infections, have higher rates of cesarean sections and longer hospitalizations.11 The misuse and overuse of antibiotics, especially broad-spectrum medications, has led to resistant bacteria that are increasingly difficult to treat.7 Treating with the most narrow-spectrum antibiotic whenever possible is critical. Overall, failure to address and assess PCN allergy can result in treatment failures and unnecessary broad-spectrum antibiotic use.
WHEN YOU SHOULD BELIEVE A REPORTED PCN AND BETA-LACTAMS ALLERGY HISTORY
Avoid beta-lactams for patients with a reported allergy who are medically frail (eg, critically ill intensive care unit patients and those unable to communicate) or have a documented allergic reaction to a beta-lactam within five years. An estimated 50% of patients who had a documented true IgE-mediated allergic reaction within five years of a documented true allergic reaction remain allergic to PCN and are at risk for an allergic reaction with reexposure.1 PCN allergy evaluation with PCN skin testing (PST) and oral challenge in patients who had a reaction within five years have a higher risk of a fatal outcome with an oral challenge despite negative skin testing. PCN allergy evaluation is best handled on a case by case basis in this population.
WHAT YOU SHOULD DO INSTEAD
Obtain a thorough drug allergy history. If the history is not consistent with a personal history of an IgE-mediated reaction to PCN ever or if there is documentation that PCN was administered and tolerated since the reaction (eg, a dental prescription), a PCN or beta-lactam can be given. An exception to this rule are patients with a history of an allergic reaction to both a cephalosporin and a PCN—approach this as two separate allergies. Remove the PCN allergy if it is not consistent with the history of IgE-mediated reaction or the patient subsequently had tolerated a PCN/PCN derivative. Regarding the cephalosporin issue, patients are often allergic to a side chain of the cephalosporin and not to the beta-lactam ring. Patients should avoid the specific cephalosporin unless the history is also not consistent with an IgE-mediated reaction or the patient had subsequently tolerated this medication. An allergy evaluation can be useful to discern next steps for cephalosporin allergy. Once the antibiotic is administered and tolerated, the medical record should be updated as well to prevent future mislabeling.
If the symptoms associated with a reported history of a PCN allergy are unknown or consistent with an IgE-mediated reaction, or the patient has not been exposed to PCN since the allergic reaction, the patient should undergo PST followed by a supervised oral test dose to determine whether the allergy exists or persists. PCN allergy evaluation is a simple two-step process of PST followed by an oral challenge of amoxicillin. The use of PCN allergy testing as described is validated and safe.12 A negative skin prick and intradermal test have a negative predictive value that approaches 100%.12,13 Completing the final step—the oral challenge—eliminates concerns for false-negative testing results and patient fears. Additionally, once a patient has had negative skin testing and passed an oral challenge, he/she is not at increased risk of resensitization after PCN/PCN derivative use.14
Although the test takes one and a half hours on average, the benefits that follow are lifelong. Improving future management by disproving a reported allergy affects an individual patient’s clinical course globally, results in cost savings, and increases the use of narrow-spectrum antimicrobials. It is particularly important to test PCN-allergic patients preemptively who are at high risk of requiring PCN/PCN derivative antibiotics. High-risk patients include, but are not limited to, surgery, transplant, hematology/oncology, and immunosuppressed patients. Inpatients with PCN allergy have higher antibiotic costs—both for medications used during their hospitalization and also for discharge medications.15 A study by Macy and Contreras compared the cost of skin testing to money saved by shortening hospitalization days for 51,582 patients with PCN allergy.7 The cost for testing was $131.37 each (total of $6.7 million). The testing contributed to a $64 million savings for the three-year study period—savings that is 9.5 times larger than the cost of the evaluation.8 A smaller study that looked at cost-effectiveness of PST for 50 patients found an overall cost savings of $11,005 due to the antimicrobial choice alone ($297 per patient switched to a beta-lactam antibiotic).16
RECOMMENDATIONS
- Obtain a thorough drug allergy history as many “allergic reactions” can be removed by history alone. Update the medical record if you can confirm a patient has since tolerated PCN or a PCN derivative to which they were previously allergic. Offer a supervised oral challenge if the patient has any concerns.
- Perform PST if a patient has a PCN allergy listed in their chart and the allergy history is unclear. A negative skin test should be followed by a supervised oral challenge to PCN/PCN derivative if skin testing is negative.
- Test PCN-allergic patients preemptively who are at high risk of requiring PCN/PCN derivative antibiotics. High-risk patients include surgery, transplant, hematology/oncology, and immunosuppressed patients.
- Implement published protocols from allergists for healthcare systems that lack access to allergy physicians.
- Do not perform PST on patients with a history that is suggestive of a non-IgE-mediated allergic reaction. For these cases, patients are advised to avoid the medication. A supervised graded oral challenge can be considered on a case by case basis if the reaction was not a severe cutaneous adverse reaction syndrome, like SJS, and the benefit of using the medication outweighs the potential harm.
CONCLUSION
The patient, in this case, reported an allergic reaction to PCN over 50 years before this presentation. The reported reaction immediately after receiving IV PCN was a rash—a symptom concerning for an IgE-mediated reaction. Since the patient is well over 10 years from his allergic reaction and would benefit from a PCN derivative, PST testing should be pursued.
The patient passed his skin testing and an oral challenge dose of amoxicillin. With the PCN allergy removed from his chart, his medical team transitioned him from aztreonam and vancomycin to ampicillin. He was then discharged home on amoxicillin and informed that he might be safely treated with PCN/PCN derivatives in the future.
Given the rise in antimicrobial resistance and both the clinical implications and increased costs associated with PCN allergy, it is crucial to offer an allergy evaluation to patients identified as PCN allergic. Hospitalists play a crucial role in obtaining the initial history, determining if the patient has tolerated the antibiotic since the initial reaction, and identifying patients who may benefit from further evaluation for PCN allergy. In hospitals with PST available for inpatients, testing can be performed during the admission. Additionally, it is essential that allergists work with hospitalists and primary care physicians to provide seamless access to outpatient drug allergy evaluations (PST followed by oral challenge) to address the issue of PCN allergy before an acute need for a PCN/PCN derivative antibiotic in the hospital.
Do you think this is a low-value practice? Is this truly a “Thing We Do for No Reason?” Share what you do in your practice and join in the conversation online by retweeting it on Twitter (#TWDFNR) and liking it on Facebook. We invite you to propose ideas for other “Things We Do for No Reason” topics by e-mailing TWDFNR@hospitalmedicine.org.
Disclosures
The authors have no conflicts of interest.
Funding
This work is supported by the following NIH Grant: T-32 AI007062-39.
Inspired by the ABIM Foundation’s Choosing Wisely® campaign, the “Things We Do for No Reason” (TWDFNR) series reviews practices that have become common parts of hospital care but may provide little value to our patients. Practices reviewed in the TWDFNR series do not represent “black and white” conclusions or clinical practice standards but are meant as a starting place for research and active discussions among hospitalists and patients. We invite you to be part of that discussion.
CLINICAL SCENARIO
An 80-year-old male—with a past medical history significant for hypertension, atrial fibrillation, and type II diabetes mellitus—presented to the hospital with fevers, confusion, and urinary outflow tract difficulties. On exam, he was noted to have mild suprapubic tenderness with flank tenderness. Blood and urine cultures grew Enterococcus faecalis sensitive to ampicillin. Because of the patient’s listed penicillin (PCN) allergy, he was started on aztreonam and vancomycin instead of ampicillin.
WHY YOU MIGHT SIMPLY ACCEPT A PCN ALLERGY HISTORY
Ten percent of the population in the United States reports an allergy to penicillin and derivatives—one of the most commonly reported drug allergies.1 Allergic reactions to drugs are distinct immune reactions mediated by drug-specific immunoglobulin E (IgE) that are potentially life-threatening. Specifically these allergic reactions are called IgE-mediated, type 1 hypersensitivity reactions which are characterized by hives; itching; flushing; tissue swelling, especially in areas of the face and neck; bronchospasm; and gastrointestinal (GI) symptoms, including cramping and diarrhea. Head and neck swelling can quickly result in airway compromise. Profound fluid extravasation and release of mediators from mast cells and basophils can rapidly drop blood pressure. Anaphylaxis requires rapid intervention to prevent severe complications and death. Given the life-threatening consequences of anaphylaxis, a cautious approach before administering PCN to PCN-allergic patients is mandatory.
WHY YOU SHOULD QUESTION A REPORTED PCN ALLERGY
While 10% of the adult population and 15% of hospitalized adults report PCN allergy, clinical studies suggest that 90% of all patients reporting a PCN allergy can tolerate PCN antibiotics.1-3 There are several reasons patients initially labeled as PCN allergic may later be able to tolerate this drug. First, patients can lose sensitivity to specific PCN IgE antibodies over time if PCN is avoided.4 Second, non-IgE-mediated immune reactions of skin or GI tract are often wrongly attributed to an IgE-mediated process from a concurrent medication (Table). For example, viral infections can cause exanthems or hives which may be mistaken for an antibiotic-associated IgE-meditated allergic reaction.6 These non-IgE skin reactions include severe manifestations including Stevens-Johnson syndrome (SJS) and toxic epidermal necrolysis or benign adverse reactions such as GI upset, dizziness, or diarrhea which are often misclassified as an allergy, and this error is perpetuated in the medical record. Third, patients may report a PCN allergy for themselves when a family member is possibly allergic.
PCN allergy has risen to the level of a public health issue as PCN-allergic patients are often relegated to second-line broad-spectrum antibiotics.7 This public health issue is exacerbated when patients with faux or resolved PCN allergy receive the same treatment. Patients labeled as PCN allergic—whether correctly or incorrectly—have poorer outcomes as noted by increased rates of serious infections and tend to have longer hospital stays.8-10 Treatment-related secondary infections from the use of broad-spectrum antibiotics, such as Clostridiiodes difficile and vancomycin-resistant Enterococcus, are identified more frequently in PCN-allergic patients.7 Additionally, pregnant women with PCN allergy, with or without group B streptococcus infections, have higher rates of cesarean sections and longer hospitalizations.11 The misuse and overuse of antibiotics, especially broad-spectrum medications, has led to resistant bacteria that are increasingly difficult to treat.7 Treating with the most narrow-spectrum antibiotic whenever possible is critical. Overall, failure to address and assess PCN allergy can result in treatment failures and unnecessary broad-spectrum antibiotic use.
WHEN YOU SHOULD BELIEVE A REPORTED PCN AND BETA-LACTAMS ALLERGY HISTORY
Avoid beta-lactams for patients with a reported allergy who are medically frail (eg, critically ill intensive care unit patients and those unable to communicate) or have a documented allergic reaction to a beta-lactam within five years. An estimated 50% of patients who had a documented true IgE-mediated allergic reaction within five years of a documented true allergic reaction remain allergic to PCN and are at risk for an allergic reaction with reexposure.1 PCN allergy evaluation with PCN skin testing (PST) and oral challenge in patients who had a reaction within five years have a higher risk of a fatal outcome with an oral challenge despite negative skin testing. PCN allergy evaluation is best handled on a case by case basis in this population.
WHAT YOU SHOULD DO INSTEAD
Obtain a thorough drug allergy history. If the history is not consistent with a personal history of an IgE-mediated reaction to PCN ever or if there is documentation that PCN was administered and tolerated since the reaction (eg, a dental prescription), a PCN or beta-lactam can be given. An exception to this rule are patients with a history of an allergic reaction to both a cephalosporin and a PCN—approach this as two separate allergies. Remove the PCN allergy if it is not consistent with the history of IgE-mediated reaction or the patient subsequently had tolerated a PCN/PCN derivative. Regarding the cephalosporin issue, patients are often allergic to a side chain of the cephalosporin and not to the beta-lactam ring. Patients should avoid the specific cephalosporin unless the history is also not consistent with an IgE-mediated reaction or the patient had subsequently tolerated this medication. An allergy evaluation can be useful to discern next steps for cephalosporin allergy. Once the antibiotic is administered and tolerated, the medical record should be updated as well to prevent future mislabeling.
If the symptoms associated with a reported history of a PCN allergy are unknown or consistent with an IgE-mediated reaction, or the patient has not been exposed to PCN since the allergic reaction, the patient should undergo PST followed by a supervised oral test dose to determine whether the allergy exists or persists. PCN allergy evaluation is a simple two-step process of PST followed by an oral challenge of amoxicillin. The use of PCN allergy testing as described is validated and safe.12 A negative skin prick and intradermal test have a negative predictive value that approaches 100%.12,13 Completing the final step—the oral challenge—eliminates concerns for false-negative testing results and patient fears. Additionally, once a patient has had negative skin testing and passed an oral challenge, he/she is not at increased risk of resensitization after PCN/PCN derivative use.14
Although the test takes one and a half hours on average, the benefits that follow are lifelong. Improving future management by disproving a reported allergy affects an individual patient’s clinical course globally, results in cost savings, and increases the use of narrow-spectrum antimicrobials. It is particularly important to test PCN-allergic patients preemptively who are at high risk of requiring PCN/PCN derivative antibiotics. High-risk patients include, but are not limited to, surgery, transplant, hematology/oncology, and immunosuppressed patients. Inpatients with PCN allergy have higher antibiotic costs—both for medications used during their hospitalization and also for discharge medications.15 A study by Macy and Contreras compared the cost of skin testing to money saved by shortening hospitalization days for 51,582 patients with PCN allergy.7 The cost for testing was $131.37 each (total of $6.7 million). The testing contributed to a $64 million savings for the three-year study period—savings that is 9.5 times larger than the cost of the evaluation.8 A smaller study that looked at cost-effectiveness of PST for 50 patients found an overall cost savings of $11,005 due to the antimicrobial choice alone ($297 per patient switched to a beta-lactam antibiotic).16
RECOMMENDATIONS
- Obtain a thorough drug allergy history as many “allergic reactions” can be removed by history alone. Update the medical record if you can confirm a patient has since tolerated PCN or a PCN derivative to which they were previously allergic. Offer a supervised oral challenge if the patient has any concerns.
- Perform PST if a patient has a PCN allergy listed in their chart and the allergy history is unclear. A negative skin test should be followed by a supervised oral challenge to PCN/PCN derivative if skin testing is negative.
- Test PCN-allergic patients preemptively who are at high risk of requiring PCN/PCN derivative antibiotics. High-risk patients include surgery, transplant, hematology/oncology, and immunosuppressed patients.
- Implement published protocols from allergists for healthcare systems that lack access to allergy physicians.
- Do not perform PST on patients with a history that is suggestive of a non-IgE-mediated allergic reaction. For these cases, patients are advised to avoid the medication. A supervised graded oral challenge can be considered on a case by case basis if the reaction was not a severe cutaneous adverse reaction syndrome, like SJS, and the benefit of using the medication outweighs the potential harm.
CONCLUSION
The patient, in this case, reported an allergic reaction to PCN over 50 years before this presentation. The reported reaction immediately after receiving IV PCN was a rash—a symptom concerning for an IgE-mediated reaction. Since the patient is well over 10 years from his allergic reaction and would benefit from a PCN derivative, PST testing should be pursued.
The patient passed his skin testing and an oral challenge dose of amoxicillin. With the PCN allergy removed from his chart, his medical team transitioned him from aztreonam and vancomycin to ampicillin. He was then discharged home on amoxicillin and informed that he might be safely treated with PCN/PCN derivatives in the future.
Given the rise in antimicrobial resistance and both the clinical implications and increased costs associated with PCN allergy, it is crucial to offer an allergy evaluation to patients identified as PCN allergic. Hospitalists play a crucial role in obtaining the initial history, determining if the patient has tolerated the antibiotic since the initial reaction, and identifying patients who may benefit from further evaluation for PCN allergy. In hospitals with PST available for inpatients, testing can be performed during the admission. Additionally, it is essential that allergists work with hospitalists and primary care physicians to provide seamless access to outpatient drug allergy evaluations (PST followed by oral challenge) to address the issue of PCN allergy before an acute need for a PCN/PCN derivative antibiotic in the hospital.
Do you think this is a low-value practice? Is this truly a “Thing We Do for No Reason?” Share what you do in your practice and join in the conversation online by retweeting it on Twitter (#TWDFNR) and liking it on Facebook. We invite you to propose ideas for other “Things We Do for No Reason” topics by e-mailing TWDFNR@hospitalmedicine.org.
Disclosures
The authors have no conflicts of interest.
Funding
This work is supported by the following NIH Grant: T-32 AI007062-39.
1. American Academy of Allergy, Asthma and Immunology, the American College of Allergy, Asthma and Immunology, and the Joint Council of Allergy, Asthma and Immunology. Drug allergy: an updated practice parameter. Ann Allergy Asthma Immunol. 2010;105(4):259-273. https://doi.org/10.1016/j.anai.2010.08.002.
2. American Academy of Allergy AI. Ten things physicians and patients should question Choosing Wisely, ABIM Foundation 2014. http://www.choosingwisely.org/clinician-lists/american-academy-allergy-asthma-immunlogy-non-beta-lactam-antibiotics-penicillin-allergy/. Accessed October 23, 2017.
3. Blumenthal KG, Wickner PG, Hurwitz S, et al. Tackling inpatient penicillin allergies: Assessing tools for antimicrobial stewardship. J Allergy Clin Immunol. 2017;140(1):154-161. https://doi.org/10.1016/j.jaci.2017.02.005.
4. Blanca M, Torres MJ, Garcia JJ, et al. Natural evolution of skin test sensitivity in patients allergic to beta-lactam antibiotics. J Allergy Clin Immunol. 1999;103(5):918-924. https://doi.org/10.1016/S0091-6749(99)70439-2.
5. Duong TA Valeyrie-Allanore L, Wolkenstein P, Chosidow O. Severe cutaneous adverse reactions to drugs. Lancet. 2017;390(10106:1996-2011. doi:10.1016/S0140-6736(16)30378-6.
6. Gonzalez-Estrada A, Radojicic C. Penicillin allergy: a practical guide for clinicians. Cleve Clin J Med. 2015;82(5):295-300. https://doi.org/10.3949/ccjm.82a.14111.
7. Solensky R. Penicillin allergy as a public health measure. J Allergy Clin Immunol. 2014;133(3):797-798. https://doi.org/10.1016/j.jaci.2013.10.032.
8. Macy E, Contreras R. Health care use and serious infection prevalence associated with penicillin “allergy” in hospitalized patients: a cohort study. J Allergy Clin Immunol. 2014;133(3):790-796. https://doi.org/10.1016/j.jaci.2013.09.021.
9. Chen JR, Khan DA. Evaluation of penicillin allergy in the hospitalized patient: opportunities for antimicrobial stewardship. Curr Allergy Asthma Rep. 2017;17(6):40. https://doi.org/10.1007/s11882-017-0706-1.
10. Blumenthal KG, Wickner PG, Hurwitz S, et al. Tackling inpatient penicillin allergies: Assessing tools for antimicrobial stewardship. J Allergy Clin Immunol. 2017;140(1):154-161. https://doi.org/10.1016/j.jaci.2017.02.005.
11. Desai SH, Kaplan MS, Chen Q, Macy EM. Morbidity in pregnant women associated with unverified penicillin allergies, antibiotic use, and group B Streptococcus infections. Perm J. 2017;21. https://doi.org/10.7812/TPP/16-080.
12. Macy E, Ngor EW. Safely diagnosing clinically significant penicillin allergy using only penicilloyl-poly-lysine, penicillin, and oral amoxicillin. J Allergy Clin Immunol Pract. 2013;1(3):258-263. https://doi.org/10.1016/j.jaip.2013.02.002.
13. Solensky R. The time for penicillin skin testing is here. J Allergy Clin Immunol Pract. 2013;1(3):264-265. https://doi.org/10.1016/j.jaip.2013.03.010.
14. Solensky R, Earl HS, Gruchalla RS. Lack of penicillin resensitization in patients with a history of penicillin allergy after receiving repeated penicillin courses. Arch Intern Med. 2002;162(7):822-826.
15. Sade K, Holtzer I, Levo Y, Kivity S. The economic burden of antibiotic treatment of penicillin-allergic patients in internal medicine wards of a general tertiary care hospital. Clin Exp Allergy. 2003;33(4):501-506. https://doi.org/10.1046/j.1365-2222.2003.01638.x.
16. King EA, Challa S, Curtin P, Bielory L. Penicillin skin testing in hospitalized patients with beta-lactam allergies: effect on antibiotic selection and cost. Ann Allergy Asthma Immunol. 2016;117(1):67-71. https://doi.org/10.1016/j.anai.2016.04.021.
1. American Academy of Allergy, Asthma and Immunology, the American College of Allergy, Asthma and Immunology, and the Joint Council of Allergy, Asthma and Immunology. Drug allergy: an updated practice parameter. Ann Allergy Asthma Immunol. 2010;105(4):259-273. https://doi.org/10.1016/j.anai.2010.08.002.
2. American Academy of Allergy AI. Ten things physicians and patients should question Choosing Wisely, ABIM Foundation 2014. http://www.choosingwisely.org/clinician-lists/american-academy-allergy-asthma-immunlogy-non-beta-lactam-antibiotics-penicillin-allergy/. Accessed October 23, 2017.
3. Blumenthal KG, Wickner PG, Hurwitz S, et al. Tackling inpatient penicillin allergies: Assessing tools for antimicrobial stewardship. J Allergy Clin Immunol. 2017;140(1):154-161. https://doi.org/10.1016/j.jaci.2017.02.005.
4. Blanca M, Torres MJ, Garcia JJ, et al. Natural evolution of skin test sensitivity in patients allergic to beta-lactam antibiotics. J Allergy Clin Immunol. 1999;103(5):918-924. https://doi.org/10.1016/S0091-6749(99)70439-2.
5. Duong TA Valeyrie-Allanore L, Wolkenstein P, Chosidow O. Severe cutaneous adverse reactions to drugs. Lancet. 2017;390(10106:1996-2011. doi:10.1016/S0140-6736(16)30378-6.
6. Gonzalez-Estrada A, Radojicic C. Penicillin allergy: a practical guide for clinicians. Cleve Clin J Med. 2015;82(5):295-300. https://doi.org/10.3949/ccjm.82a.14111.
7. Solensky R. Penicillin allergy as a public health measure. J Allergy Clin Immunol. 2014;133(3):797-798. https://doi.org/10.1016/j.jaci.2013.10.032.
8. Macy E, Contreras R. Health care use and serious infection prevalence associated with penicillin “allergy” in hospitalized patients: a cohort study. J Allergy Clin Immunol. 2014;133(3):790-796. https://doi.org/10.1016/j.jaci.2013.09.021.
9. Chen JR, Khan DA. Evaluation of penicillin allergy in the hospitalized patient: opportunities for antimicrobial stewardship. Curr Allergy Asthma Rep. 2017;17(6):40. https://doi.org/10.1007/s11882-017-0706-1.
10. Blumenthal KG, Wickner PG, Hurwitz S, et al. Tackling inpatient penicillin allergies: Assessing tools for antimicrobial stewardship. J Allergy Clin Immunol. 2017;140(1):154-161. https://doi.org/10.1016/j.jaci.2017.02.005.
11. Desai SH, Kaplan MS, Chen Q, Macy EM. Morbidity in pregnant women associated with unverified penicillin allergies, antibiotic use, and group B Streptococcus infections. Perm J. 2017;21. https://doi.org/10.7812/TPP/16-080.
12. Macy E, Ngor EW. Safely diagnosing clinically significant penicillin allergy using only penicilloyl-poly-lysine, penicillin, and oral amoxicillin. J Allergy Clin Immunol Pract. 2013;1(3):258-263. https://doi.org/10.1016/j.jaip.2013.02.002.
13. Solensky R. The time for penicillin skin testing is here. J Allergy Clin Immunol Pract. 2013;1(3):264-265. https://doi.org/10.1016/j.jaip.2013.03.010.
14. Solensky R, Earl HS, Gruchalla RS. Lack of penicillin resensitization in patients with a history of penicillin allergy after receiving repeated penicillin courses. Arch Intern Med. 2002;162(7):822-826.
15. Sade K, Holtzer I, Levo Y, Kivity S. The economic burden of antibiotic treatment of penicillin-allergic patients in internal medicine wards of a general tertiary care hospital. Clin Exp Allergy. 2003;33(4):501-506. https://doi.org/10.1046/j.1365-2222.2003.01638.x.
16. King EA, Challa S, Curtin P, Bielory L. Penicillin skin testing in hospitalized patients with beta-lactam allergies: effect on antibiotic selection and cost. Ann Allergy Asthma Immunol. 2016;117(1):67-71. https://doi.org/10.1016/j.anai.2016.04.021.
©2019 Society of Hospital Medicine
Genetic signature helps ID MS risk
Also today, the CDC has a plan to cut undiagnosed and untreated HIV, which patients who have diabetes benefit the most from long-term metformin, and why amlodopine may be the best choice for lowering blood pressure in black patients.
Amazon Alexa
Apple Podcasts
Google Podcasts
Spotify
Also today, the CDC has a plan to cut undiagnosed and untreated HIV, which patients who have diabetes benefit the most from long-term metformin, and why amlodopine may be the best choice for lowering blood pressure in black patients.
Amazon Alexa
Apple Podcasts
Google Podcasts
Spotify
Also today, the CDC has a plan to cut undiagnosed and untreated HIV, which patients who have diabetes benefit the most from long-term metformin, and why amlodopine may be the best choice for lowering blood pressure in black patients.
Amazon Alexa
Apple Podcasts
Google Podcasts
Spotify

Study Provides Insight Into Alcohol’s Effects on the Brain
The findings could lead the way to understanding the brain’s intake and output of energy in good health and bad and the part that alcohol plays.
In previous studies, the researchers have shown that alcohol significantly affects brain glucose metabolism, a measure of energy use, as well as regional brain activity, assessed through changes in blood oxygenation. But regional differences in glucose metabolism are hard to interpret, they say. In a study with healthy volunteers, they used brain imaging techniques to help quantify “match and mismatch” in energy consumption and expenditure across the brain—what they termed power and cost.
The researchers assessed power by observing to what extent brain regions are active and use energy, and cost by observing how brain regions expended energy. They found that different brain regions that serve distinct functions have “notably different power and different cost.”
Next, they tested a group of light drinkers and heavy drinkers and found both acute and chronic exposure to alcohol affected power and cost. In heavy drinkers, the researchers say, they saw less regional power, for example, in the thalamus, the sensory gateway, and frontal cortex. The researchers interpreted the decreases in power as reflecting the toxic effects of long-term exposure to alcohol on the brain cells.
They also found power dropped in the visual regions during acute alcohol exposure, which was related to disruption of visual processing. Visual regions also had the most significant drops in cost of activity during intoxication. That is consistent with the reliance of those regions on alternative energy sources, such as acetate (a byproduct of alcohol metabolism), the researchers say.
Their approach for characterizing brain energetic patterns related to alcohol use could be useful in other ways, the researchers say. “Studying energetic signatures of brain regions in different neuropsychiatric diseases is an important future direction,” said co-lead investigator Dr. Ehsan Schokri-Kojori. “The measures of power and cost may provide new multimodal biomarkers.”
The findings could lead the way to understanding the brain’s intake and output of energy in good health and bad and the part that alcohol plays.
In previous studies, the researchers have shown that alcohol significantly affects brain glucose metabolism, a measure of energy use, as well as regional brain activity, assessed through changes in blood oxygenation. But regional differences in glucose metabolism are hard to interpret, they say. In a study with healthy volunteers, they used brain imaging techniques to help quantify “match and mismatch” in energy consumption and expenditure across the brain—what they termed power and cost.
The researchers assessed power by observing to what extent brain regions are active and use energy, and cost by observing how brain regions expended energy. They found that different brain regions that serve distinct functions have “notably different power and different cost.”
Next, they tested a group of light drinkers and heavy drinkers and found both acute and chronic exposure to alcohol affected power and cost. In heavy drinkers, the researchers say, they saw less regional power, for example, in the thalamus, the sensory gateway, and frontal cortex. The researchers interpreted the decreases in power as reflecting the toxic effects of long-term exposure to alcohol on the brain cells.
They also found power dropped in the visual regions during acute alcohol exposure, which was related to disruption of visual processing. Visual regions also had the most significant drops in cost of activity during intoxication. That is consistent with the reliance of those regions on alternative energy sources, such as acetate (a byproduct of alcohol metabolism), the researchers say.
Their approach for characterizing brain energetic patterns related to alcohol use could be useful in other ways, the researchers say. “Studying energetic signatures of brain regions in different neuropsychiatric diseases is an important future direction,” said co-lead investigator Dr. Ehsan Schokri-Kojori. “The measures of power and cost may provide new multimodal biomarkers.”
The findings could lead the way to understanding the brain’s intake and output of energy in good health and bad and the part that alcohol plays.
In previous studies, the researchers have shown that alcohol significantly affects brain glucose metabolism, a measure of energy use, as well as regional brain activity, assessed through changes in blood oxygenation. But regional differences in glucose metabolism are hard to interpret, they say. In a study with healthy volunteers, they used brain imaging techniques to help quantify “match and mismatch” in energy consumption and expenditure across the brain—what they termed power and cost.
The researchers assessed power by observing to what extent brain regions are active and use energy, and cost by observing how brain regions expended energy. They found that different brain regions that serve distinct functions have “notably different power and different cost.”
Next, they tested a group of light drinkers and heavy drinkers and found both acute and chronic exposure to alcohol affected power and cost. In heavy drinkers, the researchers say, they saw less regional power, for example, in the thalamus, the sensory gateway, and frontal cortex. The researchers interpreted the decreases in power as reflecting the toxic effects of long-term exposure to alcohol on the brain cells.
They also found power dropped in the visual regions during acute alcohol exposure, which was related to disruption of visual processing. Visual regions also had the most significant drops in cost of activity during intoxication. That is consistent with the reliance of those regions on alternative energy sources, such as acetate (a byproduct of alcohol metabolism), the researchers say.
Their approach for characterizing brain energetic patterns related to alcohol use could be useful in other ways, the researchers say. “Studying energetic signatures of brain regions in different neuropsychiatric diseases is an important future direction,” said co-lead investigator Dr. Ehsan Schokri-Kojori. “The measures of power and cost may provide new multimodal biomarkers.”