User login
Hospitalist Compensation Models Evolve Toward Production, Performance-Based Variables
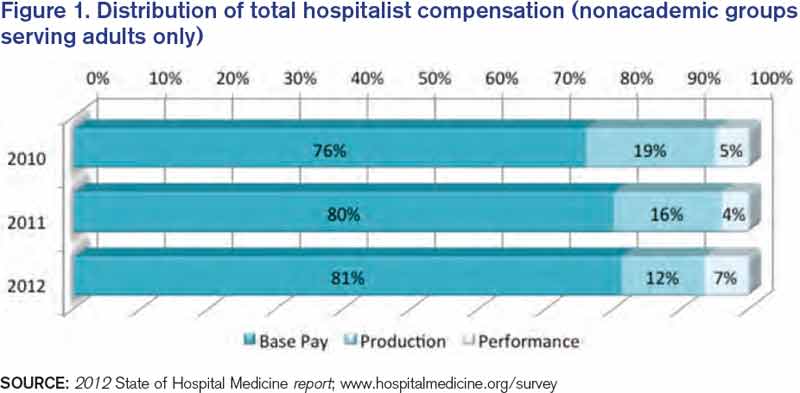
Hospitalists have long recognized that compensation varies significantly by geographic location and by the type of hospitalist medicine group (HMG) you work in: private vs. hospital-owned vs. national-management-owned. A review of SHM’s 2012 State of Hospital Medicine report suggests that hospitalist compensation is also evolving toward a model that more routinely includes both some production variable and performance-based pay (see Figure 1). Although the proportion of compensation paid as a base salary has been trending up over the last few years, so has the proportion paid as a performance incentive.
Source: 2012 State of Hospital Medicine report; www.hospitalmedicine.org/survey
The pay distribution of adult-medicine hospitalists employed by management companies is composed of a high base percentage (mean 88.3% by survey data) and relatively low production and performance variables (mean 6.8% and 4.9%, respectively) compared with other employment models. Contrast that with private hospitalist-only groups, where the mean base is 76.3% with an emphasis on a production component (19.4%) and slightly less on performance pay at 4.2%.
Of the three employment models, however, hospital-/health-system-employed groups have the highest proportion of compensation based on performance metrics with a mean of 7.8%. This makes sense given the financial penalties hospitals and health systems are facing from the Centers for Medicare & Medicaid Services (CMS) around pay-for-performance measures. Hospitals are looking for help from hospitalists in improving quality of care and patient satisfaction and avoiding incurring future penalties. Compensation models in these groups reflect the goals of aligning performance on these measures with financial incentives/risk for hospitalists working in these environments.
What are the top performance metrics hospitalists are being compensated for? CMS’ hospital value-based purchasing (HVBP) core measures and patient satisfaction scores are at the top of the list. More than 70% of all HMGs identify these two measures as part of their performance pay incentive, which is seen consistently by geographic location and by type of hospitalist group.
Beyond these top two metrics, management-company-employed groups also focus on ED throughput measures and early morning discharge times, with more than 70% of these groups having pay incentives aligned with these goals. They also have a higher proportion of their groups participating in several other measures, such as clinical protocols, medication reconciliation, EHR utilization, transitions of care, and readmission rates. In comparison, both hospital-employed and private groups have a wider variety of performance measures in which they participate. Differences are seen geographically, too, with hospitalists located in the Western region having a wider variety of performance measures than other regions.
How hospitalists are compensated for their work will likely continue to evolve. Overall, for nonacademic HMGs serving adults only, we are seeing an upward trend in percentage paid as base pay (from 76% in 2010 to 81% in 2012) and in performance (from 5% in 2010 to 7% in 2012). Hospitalists should anticipate that performance-based pay will continue to account for an increasingly larger percentage of their overall compensation, especially as CMS’ pay-for-performance measures for hospital systems really start to take effect.
Hospital CEOs and CFOs are looking to hospitalists to help deliver on quality, satisfaction, and other performance measures. Incentives will be put in place to reward those groups who do it well.
Dr. Sites is senior medical director of hospitalist programs at Providence Health and Services in Oregon. She is a member of SHM’s Practice Analysis Committee.
Hospitalist Groups Extract New Solutions Via Data Mining
One hospital wanted to reduce readmissions among patients with congestive heart failure. Another hoped to improve upon its sepsis mortality rates. A third sought to determine whether its doctors were providing cost-effective care for pneumonia patients. All of them adopted the same type of technology to help identify a solution.
As the healthcare industry tilts toward accountable care, pay for performance and an increasingly

cost-conscious mindset, hospitalists and other providers are tapping into a fast-growing analytical tool collectively known as data mining to help make sense of the growing mounds of information. Although no single technology can be considered a cure-all, HM leaders are so optimistic about data mining’s potential to address cost, outcome, and performance issues that some have labeled it a “game changer” for hospitalists.
Karim Godamunne, MD, MBA, SFHM, chief medical officer at North Fulton Hospital in Roswell, Ga., and a member of SHM’s Practice Management Committee, says he can’t overstate the importance of hospitalists’ involvement in physician data mining. “From my perspective, we’re looking to hospitalists to help drive this quality-utilization bandwagon, to be the real leaders in it,” he says. With the tremendous value that can be generated through understanding and using the information, “it’s good for your group and can be good to your hospital as a whole.”
So what is data mining? The technology fully emerged in the mid-1990s as a way to help scientists analyze large and often disparate bodies of data, present relevant information in new ways, and illuminate previously unknown relationships.1 In the healthcare industry, early adopters realized that the insights gleaned from data mining could help inform their clinical decision-making; organizations used the new tools to help predict health insurance fraud and identify at-risk patients, for example.
Cynthia Burghard, research director of Accountable Care IT Strategies at IDC Health Insights in Framingham, Mass., says researchers in academic medical centers initially conducted most of the clinical analytical work. Within the past few years, however, the increasing availability of data has allowed more hospitals to begin analyzing chronic disease, readmissions, and other areas of concern. In addition, Burghard says, new tools based on natural language processing are giving hospitals better access to unstructured clinical data, such as notes written by doctors and nurses.
“What I’m seeing both in my surveys as well as in conversations with hospitals is that analytics is the top of the investment priority for both hospitals and health plans,” Burghard says. According to IDC estimates, total spending for clinical analytics in the U.S. reached $3.7 billion in 2012 and is expected to grow to $5.14 billion by 2016. Much of the growth, she notes, is being driven by healthcare reform. “If your mandate is to manage populations of patients, it behooves you to know who those patients are and what their illnesses are, and to monitor what you’re doing for them,” she says.
Practice Improvement
Accordingly, a major goal of all this data-mining technology is to change practice behavior in a way that achieves the triple aim of improving quality of care, controlling costs, and bettering patient outcomes.
A growing number of companies are releasing tools that can compile and analyze the separate bits of information captured from claims and billing systems, Medicare reporting requirements, internal benchmarks, and other sources. Unlike passive data sources, such as Medicare’s Hospital Compare website, more active analytics can help their users zoom down to the level of an individual doctor or patient, pan out to the level of a hospitalist group, or expand out even more for a broader comparison among peer institutions.
Some newer data-mining tools with names like CRIMSON, Truven, Iodine, and Imagine are billing themselves as hospitalist-friendly performance-improvement aids and giving individual providers the ability to access and analyze the data themselves. A few of these applications can even provide real-time data via mobile devices (see “Physician Performance Aids,”).
Thomas Frederickson, MD, MBA, SFHM, medical director of the HM service at Alegent Creighton Health in Omaha, Neb., and a member of SHM’s Practice Management Committee, sees the biggest potential of this data-mining technology in its ability to help drive practice consistency. “You can use the database to analyze practice patterns of large groups, or even individuals, and see where variability exists,” he says. “And then, based on that, you can analyze why the variability exists and begin to address whether it’s variability that’s clinically indicated or not.”
When Alegent Creighton Health was scrutinizing the care of its pneumonia patients, for example, officials could compare the number of chest X-rays per pneumonia patient by hospital or across the entire CRIMSON database. At a deeper level, the officials could see how often individual providers ordered the tests compared to their peers. For outliers, they could follow up to determine whether the variability was warranted.
As champions of process improvement, Dr. Frederickson says, hospitalists can make particularly good use of database analytics. “It’s part of the process of making hospitalists invaluable to their hospitals and their systems,” he says. “Part of that is building up expertise on process improvement and safety, and familiarity with these kinds of tools is one thing that will help us do that.”
North Fulton Hospital used CRIMSON to analyze how its doctors care for patients with sepsis and to establish new benchmarks. Dr. Godamunne says the tools allowed the hospital to track its doctors’ progress over time and identify potential problems. “If a patient with sepsis is staying too long, you can see who admitted the patient and see if, a few months ago, the same physician was having similar problems,” he says. Similarly, the hospital was able to track the top DRGs resulting in excess length of stay among patients, to identify potential bottlenecks in the care and discharge processes.
Some tools require only two-day training sessions for basic proficiency, though more advanced manipulations often require a bigger commitment, like the 12-week training session that Dr. Godamunne completed. That training included one hour of online learning and one hour of homework every week, and most of the cases highlighted during his coursework, he says, focused on hospitalists—another sign of the major role he believes HM will play in harnessing data to improve performance quality.

—Thomas Frederickson, MD, MBA, SFHM, medical director, hospital medicine service, Alegent Creighton Health, Omaha, Neb., SHM Practice Management Committee member
Slow—Construction Ahead
The best information is meaningful, individualized, and timely, says Steven Deitelzweig, MD, SFHM, system chairman for hospital medicine and medical director of regional business development at Ochsner Health System in New Orleans. “If you get something back six months after you’ve delivered the care, you’ll have a limited opportunity to improve, versus if you get it back in a week or two, or ideally, in real time,” says Dr. Deitelzweig, chair of SHM’s Practice Management Committee.
In examining length of stay, Dr. Deitelzweig says doctors could use data mining to look at time-stamped elements of patient flow and the timeliness of provider response: how patients go through the ED, and when they receive written orders or lab results. “It could be really powerful, and right now it’s a little bit of a black hole,” he says.
Based on her conversations with hospital executives and leaders, however, Burghard cautions that some real-time mobile applications, although technologically impressive, may be less useful or necessary in practice. “If it’s performance measurement, why do you need that in real time? It’s not going to change your behavior in the moment,” she says. “What you may want to get is an alert that your patient, who is in the hospital, has had some sort of negative event.”
Data mining has other potential limitations. “There’s always going to be questions of attribution, and you need to have clinical knowledge of your location,” Dr. Godamunne says. And data mining is only as good as the data that have been documented, underscoring the importance of securing provider cooperation.
Dr. Frederickson says physician acceptance, in fact, might be one of the biggest obstacles—a major reason why he recommends introducing the technology slowly and explaining why and how it will be used. If introduced too quickly and without adequate explanation about what a hospital or health system hopes to accomplish, he says, “there certainly is the potential for suspicion.” The key, he says, is to emphasize that the tools provide a valuable mechanism for gleaning new insights into doctors’ practice patterns, “not something that’s going to be used against them.”
Paul Roscoe, CEO of the Washington, D.C.-based Advisory Board Company's Crimson division, agrees that personally engaging physicians is essential for a good return on investment in analytical tools like his company’s suite of CRIMSON products. “If you can’t work with the physicians to get them to understand the data and actively use the data in their practice patterns, it becomes a bit meaningless,” he says.

—Karim Godamunne, MD, MBA, SFHM, chief medical officer, North Fulton Hospital, Roswell, Ga., SHM Practice Management Committee member
Roscoe sees big opportunities in prospectively examining information while a patient is still in the hospital and when a change of course by providers could avert a bad outcome. “Suggesting a set of interventions that they could do differently is really the value-add,” he says. But he cautions that those suggestions must be worded carefully to avoid alienating physicians.
“If doctors don’t feel like they’re being judged, they’ll engage with you,” Roscoe says.
Similar nuances can affect how users perceive the tools themselves. After hearing feedback from members that the words “data mining” didn’t conjure trust and confidence, the Advisory Board Company dropped the phrase altogether in favor of “data analytics,” “physician engagement,” and similar descriptors. “It’s simple things like that that can very quickly either turn a physician on or off,” Roscoe says.
Once users take the time to understand data-mining tools and how they can be properly harnessed, advocates say, the technology can lead to a host of unanticipated benefits. When a hospital bills the federal government for a Medicare patient, for example, it must submit an HCC code that describes the patient’s condition. By doing a better job of mining the data, Burghard says, a hospital can more accurately reflect that patient’s contdition. For example, if a hospital is treating a diabetic who comes in with a broken leg, the hospital could receive a lower payment rate if it does not properly identify and record both conditions.
And by using the tools prospectively, Burghard says, “I think there’s the opportunity to make a quantum leap from what we’re doing today. We usually just report on facts, and usually retrospectively. With some of the new technology that’s available, the healthcare industry can begin to do discovery analytics—you’re identifying insights, patterns, and relationships.”
Better integration of computerized physician order entry with data-mining ports, Dr. Godamunne predicts, will allow for much better attribution and finer parsing of the data. As the transparency increases, though, hospitalists will have to adapt to a new reality in which stronger analytical tools may point out individual outliers. And that level of detail, in turn, will require some hospitalists to justify why they’re different than their peers.
Even so, Roscoe says, he’s found that hospitalists are very open to using data to improve performance and that they make up a high percentage of CRIMSON users. “There isn’t a physician group that is in a better position to help drive this quality- and data-driven culture,” he says.
Bryn Nelson is a freelance medical writer in Seattle.
Physician Performance Aids

Company: The Advisory Board Company
Sample product: CRIMSON Continuum of Care
Claim: “Places credible, severity-adjusted performance profiles directly in the hands of physicians, enabling the hospital-physician collaboration needed to advance quality goals and secure cost savings.”
Number of users: More than 850 hospitals
Real-time data? No, but available as add-on service
To learn more: www.advisory.com/Technology/Crimson-Continuum-of-Care
Company: Panacea Developments
Sample product: Iodine
Claim: “An easy-to-use mobile system that analyzes a hospital’s sea of data for knowledge that physicians, case managers, and documentation specialists can act upon to improve length-of-stay, readmissions, and documentation.”
Number of users: More than 50 hospitals
Real-time data? Yes
To learn more: www.panaceadevelopments.com/iodine
Company: Truven Health
Sample product: CareDiscovery
Claim: “Provides powerful insights into a hospital’s or health system’s quality measures and resource utilization to support improvement with objective, fact-based information.”
Real-time data? No
Number of users: More than 3,000 users in 400 hospitals
To learn more: http://truvenhealth.com/products/carediscovery
Company: Ingenious Med
Sample product: Imagine
Claim: “A comprehensive analytics dashboard platform that provides actionable decision making data to optimize physician performance and revenue.”
Real-time data? Yes
Number of users: 25,000 total users (not separated by individual products)
To learn more: http://ingeniousmed.com/what-we-do/imagine
Reference
One hospital wanted to reduce readmissions among patients with congestive heart failure. Another hoped to improve upon its sepsis mortality rates. A third sought to determine whether its doctors were providing cost-effective care for pneumonia patients. All of them adopted the same type of technology to help identify a solution.
As the healthcare industry tilts toward accountable care, pay for performance and an increasingly
cost-conscious mindset, hospitalists and other providers are tapping into a fast-growing analytical tool collectively known as data mining to help make sense of the growing mounds of information. Although no single technology can be considered a cure-all, HM leaders are so optimistic about data mining’s potential to address cost, outcome, and performance issues that some have labeled it a “game changer” for hospitalists.
Karim Godamunne, MD, MBA, SFHM, chief medical officer at North Fulton Hospital in Roswell, Ga., and a member of SHM’s Practice Management Committee, says he can’t overstate the importance of hospitalists’ involvement in physician data mining. “From my perspective, we’re looking to hospitalists to help drive this quality-utilization bandwagon, to be the real leaders in it,” he says. With the tremendous value that can be generated through understanding and using the information, “it’s good for your group and can be good to your hospital as a whole.”
So what is data mining? The technology fully emerged in the mid-1990s as a way to help scientists analyze large and often disparate bodies of data, present relevant information in new ways, and illuminate previously unknown relationships.1 In the healthcare industry, early adopters realized that the insights gleaned from data mining could help inform their clinical decision-making; organizations used the new tools to help predict health insurance fraud and identify at-risk patients, for example.
Cynthia Burghard, research director of Accountable Care IT Strategies at IDC Health Insights in Framingham, Mass., says researchers in academic medical centers initially conducted most of the clinical analytical work. Within the past few years, however, the increasing availability of data has allowed more hospitals to begin analyzing chronic disease, readmissions, and other areas of concern. In addition, Burghard says, new tools based on natural language processing are giving hospitals better access to unstructured clinical data, such as notes written by doctors and nurses.
“What I’m seeing both in my surveys as well as in conversations with hospitals is that analytics is the top of the investment priority for both hospitals and health plans,” Burghard says. According to IDC estimates, total spending for clinical analytics in the U.S. reached $3.7 billion in 2012 and is expected to grow to $5.14 billion by 2016. Much of the growth, she notes, is being driven by healthcare reform. “If your mandate is to manage populations of patients, it behooves you to know who those patients are and what their illnesses are, and to monitor what you’re doing for them,” she says.
Practice Improvement
Accordingly, a major goal of all this data-mining technology is to change practice behavior in a way that achieves the triple aim of improving quality of care, controlling costs, and bettering patient outcomes.
A growing number of companies are releasing tools that can compile and analyze the separate bits of information captured from claims and billing systems, Medicare reporting requirements, internal benchmarks, and other sources. Unlike passive data sources, such as Medicare’s Hospital Compare website, more active analytics can help their users zoom down to the level of an individual doctor or patient, pan out to the level of a hospitalist group, or expand out even more for a broader comparison among peer institutions.
Some newer data-mining tools with names like CRIMSON, Truven, Iodine, and Imagine are billing themselves as hospitalist-friendly performance-improvement aids and giving individual providers the ability to access and analyze the data themselves. A few of these applications can even provide real-time data via mobile devices (see “Physician Performance Aids,”).
Thomas Frederickson, MD, MBA, SFHM, medical director of the HM service at Alegent Creighton Health in Omaha, Neb., and a member of SHM’s Practice Management Committee, sees the biggest potential of this data-mining technology in its ability to help drive practice consistency. “You can use the database to analyze practice patterns of large groups, or even individuals, and see where variability exists,” he says. “And then, based on that, you can analyze why the variability exists and begin to address whether it’s variability that’s clinically indicated or not.”
When Alegent Creighton Health was scrutinizing the care of its pneumonia patients, for example, officials could compare the number of chest X-rays per pneumonia patient by hospital or across the entire CRIMSON database. At a deeper level, the officials could see how often individual providers ordered the tests compared to their peers. For outliers, they could follow up to determine whether the variability was warranted.
As champions of process improvement, Dr. Frederickson says, hospitalists can make particularly good use of database analytics. “It’s part of the process of making hospitalists invaluable to their hospitals and their systems,” he says. “Part of that is building up expertise on process improvement and safety, and familiarity with these kinds of tools is one thing that will help us do that.”
North Fulton Hospital used CRIMSON to analyze how its doctors care for patients with sepsis and to establish new benchmarks. Dr. Godamunne says the tools allowed the hospital to track its doctors’ progress over time and identify potential problems. “If a patient with sepsis is staying too long, you can see who admitted the patient and see if, a few months ago, the same physician was having similar problems,” he says. Similarly, the hospital was able to track the top DRGs resulting in excess length of stay among patients, to identify potential bottlenecks in the care and discharge processes.
Some tools require only two-day training sessions for basic proficiency, though more advanced manipulations often require a bigger commitment, like the 12-week training session that Dr. Godamunne completed. That training included one hour of online learning and one hour of homework every week, and most of the cases highlighted during his coursework, he says, focused on hospitalists—another sign of the major role he believes HM will play in harnessing data to improve performance quality.
—Thomas Frederickson, MD, MBA, SFHM, medical director, hospital medicine service, Alegent Creighton Health, Omaha, Neb., SHM Practice Management Committee member
Slow—Construction Ahead
The best information is meaningful, individualized, and timely, says Steven Deitelzweig, MD, SFHM, system chairman for hospital medicine and medical director of regional business development at Ochsner Health System in New Orleans. “If you get something back six months after you’ve delivered the care, you’ll have a limited opportunity to improve, versus if you get it back in a week or two, or ideally, in real time,” says Dr. Deitelzweig, chair of SHM’s Practice Management Committee.
In examining length of stay, Dr. Deitelzweig says doctors could use data mining to look at time-stamped elements of patient flow and the timeliness of provider response: how patients go through the ED, and when they receive written orders or lab results. “It could be really powerful, and right now it’s a little bit of a black hole,” he says.
Based on her conversations with hospital executives and leaders, however, Burghard cautions that some real-time mobile applications, although technologically impressive, may be less useful or necessary in practice. “If it’s performance measurement, why do you need that in real time? It’s not going to change your behavior in the moment,” she says. “What you may want to get is an alert that your patient, who is in the hospital, has had some sort of negative event.”
Data mining has other potential limitations. “There’s always going to be questions of attribution, and you need to have clinical knowledge of your location,” Dr. Godamunne says. And data mining is only as good as the data that have been documented, underscoring the importance of securing provider cooperation.
Dr. Frederickson says physician acceptance, in fact, might be one of the biggest obstacles—a major reason why he recommends introducing the technology slowly and explaining why and how it will be used. If introduced too quickly and without adequate explanation about what a hospital or health system hopes to accomplish, he says, “there certainly is the potential for suspicion.” The key, he says, is to emphasize that the tools provide a valuable mechanism for gleaning new insights into doctors’ practice patterns, “not something that’s going to be used against them.”
Paul Roscoe, CEO of the Washington, D.C.-based Advisory Board Company's Crimson division, agrees that personally engaging physicians is essential for a good return on investment in analytical tools like his company’s suite of CRIMSON products. “If you can’t work with the physicians to get them to understand the data and actively use the data in their practice patterns, it becomes a bit meaningless,” he says.
—Karim Godamunne, MD, MBA, SFHM, chief medical officer, North Fulton Hospital, Roswell, Ga., SHM Practice Management Committee member
Roscoe sees big opportunities in prospectively examining information while a patient is still in the hospital and when a change of course by providers could avert a bad outcome. “Suggesting a set of interventions that they could do differently is really the value-add,” he says. But he cautions that those suggestions must be worded carefully to avoid alienating physicians.
“If doctors don’t feel like they’re being judged, they’ll engage with you,” Roscoe says.
Similar nuances can affect how users perceive the tools themselves. After hearing feedback from members that the words “data mining” didn’t conjure trust and confidence, the Advisory Board Company dropped the phrase altogether in favor of “data analytics,” “physician engagement,” and similar descriptors. “It’s simple things like that that can very quickly either turn a physician on or off,” Roscoe says.
Once users take the time to understand data-mining tools and how they can be properly harnessed, advocates say, the technology can lead to a host of unanticipated benefits. When a hospital bills the federal government for a Medicare patient, for example, it must submit an HCC code that describes the patient’s condition. By doing a better job of mining the data, Burghard says, a hospital can more accurately reflect that patient’s contdition. For example, if a hospital is treating a diabetic who comes in with a broken leg, the hospital could receive a lower payment rate if it does not properly identify and record both conditions.
And by using the tools prospectively, Burghard says, “I think there’s the opportunity to make a quantum leap from what we’re doing today. We usually just report on facts, and usually retrospectively. With some of the new technology that’s available, the healthcare industry can begin to do discovery analytics—you’re identifying insights, patterns, and relationships.”
Better integration of computerized physician order entry with data-mining ports, Dr. Godamunne predicts, will allow for much better attribution and finer parsing of the data. As the transparency increases, though, hospitalists will have to adapt to a new reality in which stronger analytical tools may point out individual outliers. And that level of detail, in turn, will require some hospitalists to justify why they’re different than their peers.
Even so, Roscoe says, he’s found that hospitalists are very open to using data to improve performance and that they make up a high percentage of CRIMSON users. “There isn’t a physician group that is in a better position to help drive this quality- and data-driven culture,” he says.
Bryn Nelson is a freelance medical writer in Seattle.
Physician Performance Aids
Company: The Advisory Board Company
Sample product: CRIMSON Continuum of Care
Claim: “Places credible, severity-adjusted performance profiles directly in the hands of physicians, enabling the hospital-physician collaboration needed to advance quality goals and secure cost savings.”
Number of users: More than 850 hospitals
Real-time data? No, but available as add-on service
To learn more: www.advisory.com/Technology/Crimson-Continuum-of-Care
Company: Panacea Developments
Sample product: Iodine
Claim: “An easy-to-use mobile system that analyzes a hospital’s sea of data for knowledge that physicians, case managers, and documentation specialists can act upon to improve length-of-stay, readmissions, and documentation.”
Number of users: More than 50 hospitals
Real-time data? Yes
To learn more: www.panaceadevelopments.com/iodine
Company: Truven Health
Sample product: CareDiscovery
Claim: “Provides powerful insights into a hospital’s or health system’s quality measures and resource utilization to support improvement with objective, fact-based information.”
Real-time data? No
Number of users: More than 3,000 users in 400 hospitals
To learn more: http://truvenhealth.com/products/carediscovery
Company: Ingenious Med
Sample product: Imagine
Claim: “A comprehensive analytics dashboard platform that provides actionable decision making data to optimize physician performance and revenue.”
Real-time data? Yes
Number of users: 25,000 total users (not separated by individual products)
To learn more: http://ingeniousmed.com/what-we-do/imagine
Reference
FDA rolls out unique ID system for medical devices
The Food and Drug Administration is moving forward with plans to create a unique identification system for medical devices over the next several years.
In a final rule published Sept. 24, the agency outlined a schedule for placing a unique ID number on most medical devices over 7 years and launching a publicly searchable database with all of the product information.
The new Unique Device Identification (UDI) system requires medical device manufacturers to create a unique number for every version or model of a device. The number will include the lot or batch number, device expiration date, and manufacturing date. That information will then be incorporated into the Global Unique Device Identification Database (GUDID), run by the FDA. The new database will not store identifying patient information, according to the agency.

The new system should help to improve adverse event reporting, allow for faster recalls, and reduce counterfeiting and device diversion, according to the FDA.
"A consistent and clear way to identify medical devices will result in more reliable data on how medical devices are used," Dr. Jeffrey Shuren, director of the FDA Center for Devices and Radiological Health, said in a statement. "In turn, this can promote safe device use by providers and patients as well as faster, more innovative, and less costly device development."
While there are no requirements for physicians under the new regulations, FDA officials wrote that they anticipate physicians and other providers will include the unique identifiers in patients’ electronic health records and personal health records to help improve postmarket surveillance, adverse event reporting, and recalls.
Manufacturers of high-risk medical devices, those in class III, are required to place the identifiers on the label and packaging by Sept. 24, 2014. They must also submit information to GUDID within 1 year. Manufacturers of implantable, life-supporting, and life-sustaining devices have until Sept. 24, 2015, to comply.
For moderate-risk devices (class II), manufacturers have 3 years to transition their labeling; and for low-risk devices (class I) they have 5 years. For certain class I and unclassified devices, the compliance date is pushed out to 2020.
The FDA noted that many low-risk devices are exempt from some or all of the labeling requirements in the final rule.
The final rule was called an improvement over a July 2012 proposed rule by the medical device industry. The Advanced Medical Technology Association (AdvaMed) said the final rule made some key changes, such as not requiring that the ID number be marked directly on implants and allowing manufacturers an extra 3 years for devices that are already out in circulation. The FDA is also allowing firms that produce class III devices to petition for a 1-year extension if the extra time is necessary to protect public health.
Implementing the UDI system will be "costly and challenging," Janet Trunzo, senior executive vice president for technology and regulatory affairs at AdvaMed, said in a statement. "It is imperative that it is implemented correctly the first time, and that its ongoing use is practical, economical, and of value to patients, health care providers, industry, and FDA."
The Pew Charitable Trusts, a watchdog group, applauded the FDA for getting the UDI system off the ground. But the final rule is only the first step, Josh Rising, director of Pew’s medical devices initiative, said in a statement. Hospitals, health plans, and physicians need to integrate the identifiers into patients’ health records and insurance billing transactions before the benefits can be fully realized, he said.
The Food and Drug Administration is moving forward with plans to create a unique identification system for medical devices over the next several years.
In a final rule published Sept. 24, the agency outlined a schedule for placing a unique ID number on most medical devices over 7 years and launching a publicly searchable database with all of the product information.
The new Unique Device Identification (UDI) system requires medical device manufacturers to create a unique number for every version or model of a device. The number will include the lot or batch number, device expiration date, and manufacturing date. That information will then be incorporated into the Global Unique Device Identification Database (GUDID), run by the FDA. The new database will not store identifying patient information, according to the agency.
The new system should help to improve adverse event reporting, allow for faster recalls, and reduce counterfeiting and device diversion, according to the FDA.
"A consistent and clear way to identify medical devices will result in more reliable data on how medical devices are used," Dr. Jeffrey Shuren, director of the FDA Center for Devices and Radiological Health, said in a statement. "In turn, this can promote safe device use by providers and patients as well as faster, more innovative, and less costly device development."
While there are no requirements for physicians under the new regulations, FDA officials wrote that they anticipate physicians and other providers will include the unique identifiers in patients’ electronic health records and personal health records to help improve postmarket surveillance, adverse event reporting, and recalls.
Manufacturers of high-risk medical devices, those in class III, are required to place the identifiers on the label and packaging by Sept. 24, 2014. They must also submit information to GUDID within 1 year. Manufacturers of implantable, life-supporting, and life-sustaining devices have until Sept. 24, 2015, to comply.
For moderate-risk devices (class II), manufacturers have 3 years to transition their labeling; and for low-risk devices (class I) they have 5 years. For certain class I and unclassified devices, the compliance date is pushed out to 2020.
The FDA noted that many low-risk devices are exempt from some or all of the labeling requirements in the final rule.
The final rule was called an improvement over a July 2012 proposed rule by the medical device industry. The Advanced Medical Technology Association (AdvaMed) said the final rule made some key changes, such as not requiring that the ID number be marked directly on implants and allowing manufacturers an extra 3 years for devices that are already out in circulation. The FDA is also allowing firms that produce class III devices to petition for a 1-year extension if the extra time is necessary to protect public health.
Implementing the UDI system will be "costly and challenging," Janet Trunzo, senior executive vice president for technology and regulatory affairs at AdvaMed, said in a statement. "It is imperative that it is implemented correctly the first time, and that its ongoing use is practical, economical, and of value to patients, health care providers, industry, and FDA."
The Pew Charitable Trusts, a watchdog group, applauded the FDA for getting the UDI system off the ground. But the final rule is only the first step, Josh Rising, director of Pew’s medical devices initiative, said in a statement. Hospitals, health plans, and physicians need to integrate the identifiers into patients’ health records and insurance billing transactions before the benefits can be fully realized, he said.
FDA to regulate few medical apps
Officials at the Food and Drug Administration have no plans to regulate mobile applications that let consumers compare their symptoms to a list of medical conditions, link patients to a portal with their own health information, or allow patients to measure and track their own vital signs.
But the agency has identified a limited scope of mobile medical apps that it intends to regulate because they function as medical devices and pose a potential safety risk if they malfunction. For instance, a mobile app that uses either internal or external sensors to create an electronic stethoscope would be regulated as a medical device.
The FDA issued a 43-page guidance document on Sept. 23 outlining its regulatory approach and listing examples of what will be regulated, what probably won’t be regulated, and what is not considered a medical app.

In general, the FDA plans to regulate mobile apps that act as an extension of a medical device by displaying, storing, analyzing, or transmitting patient-specific medical data. Also, the agency will regulate apps that transform a mobile platform into a device, such as the attachment of electrocardiographic (ECG) electrodes to a mobile platform to measure, store, or display ECG signals.
Mobile apps will be regulated if they perform patient-specific diagnoses or make treatment recommendations. This type of app might use patient data to calculate a drug dosage or create a dosage plan for radiation therapy.
The agency does not plan to regulate apps that help patients self-manage their health conditions, provide tools for patients to track their health information, automate simple tasks for providers, or allow patients and providers to interact with a personal health record or an electronic health record.
"Although many mobile apps pertain to health, of which many may be medical devices, we are only continuing our oversight for a very small subset of those mobile apps that are medical devices," Dr. Jeffrey Shuren, director of the FDA’s Center for Devices and Radiological Health, said during a press briefing. "We believe this approach will promote innovation, while protecting patient safety, by focusing on those mobile apps that pose greater risk to patients."
But even if an app is deemed a mobile medical app by the FDA, the agency does not intend to regulate apps that pose minimal risks to consumers. For instance, a mobile app that prompts consumers to enter which herbs or drugs they would like to take concurrently and provides drug interaction information could be considered a medical device, according to the guidance document. But because it poses a low risk to the public, the agency does not intend to regulate it at this time.
The FDA first issued draft guidance on mobile medical apps in July 2011. This final guidance document represents the agency’s current thinking on the topic, but it is not binding on either the agency or the public.
"Regulating mobile apps is nothing new for us," Dr. Shuren said. Over the past 15 years, the FDA has cleared more than 75 apps, with about 20 of those receiving approval in the past year.
The guidance also makes clear that physicians who create mobile medical apps, or who customize a medical app for their own professional use, are not subject to regulation as long as they aren’t promoting it for general use by others. Even if the physician allows the app to be used by others in a group practice, he or she is still not considered a manufacturer under the FDA guidance.
The guidance does not apply to clinical decision support software. That software will be addressed as part of a larger health information technology regulatory framework that the FDA is working on in collaboration with the Office of the National Coordinator for Health Information Technology.
mschneider@frontlinemedcom.com
On Twitter @MaryEllenNY
Officials at the Food and Drug Administration have no plans to regulate mobile applications that let consumers compare their symptoms to a list of medical conditions, link patients to a portal with their own health information, or allow patients to measure and track their own vital signs.
But the agency has identified a limited scope of mobile medical apps that it intends to regulate because they function as medical devices and pose a potential safety risk if they malfunction. For instance, a mobile app that uses either internal or external sensors to create an electronic stethoscope would be regulated as a medical device.
The FDA issued a 43-page guidance document on Sept. 23 outlining its regulatory approach and listing examples of what will be regulated, what probably won’t be regulated, and what is not considered a medical app.
In general, the FDA plans to regulate mobile apps that act as an extension of a medical device by displaying, storing, analyzing, or transmitting patient-specific medical data. Also, the agency will regulate apps that transform a mobile platform into a device, such as the attachment of electrocardiographic (ECG) electrodes to a mobile platform to measure, store, or display ECG signals.
Mobile apps will be regulated if they perform patient-specific diagnoses or make treatment recommendations. This type of app might use patient data to calculate a drug dosage or create a dosage plan for radiation therapy.
The agency does not plan to regulate apps that help patients self-manage their health conditions, provide tools for patients to track their health information, automate simple tasks for providers, or allow patients and providers to interact with a personal health record or an electronic health record.
"Although many mobile apps pertain to health, of which many may be medical devices, we are only continuing our oversight for a very small subset of those mobile apps that are medical devices," Dr. Jeffrey Shuren, director of the FDA’s Center for Devices and Radiological Health, said during a press briefing. "We believe this approach will promote innovation, while protecting patient safety, by focusing on those mobile apps that pose greater risk to patients."
But even if an app is deemed a mobile medical app by the FDA, the agency does not intend to regulate apps that pose minimal risks to consumers. For instance, a mobile app that prompts consumers to enter which herbs or drugs they would like to take concurrently and provides drug interaction information could be considered a medical device, according to the guidance document. But because it poses a low risk to the public, the agency does not intend to regulate it at this time.
The FDA first issued draft guidance on mobile medical apps in July 2011. This final guidance document represents the agency’s current thinking on the topic, but it is not binding on either the agency or the public.
"Regulating mobile apps is nothing new for us," Dr. Shuren said. Over the past 15 years, the FDA has cleared more than 75 apps, with about 20 of those receiving approval in the past year.
The guidance also makes clear that physicians who create mobile medical apps, or who customize a medical app for their own professional use, are not subject to regulation as long as they aren’t promoting it for general use by others. Even if the physician allows the app to be used by others in a group practice, he or she is still not considered a manufacturer under the FDA guidance.
The guidance does not apply to clinical decision support software. That software will be addressed as part of a larger health information technology regulatory framework that the FDA is working on in collaboration with the Office of the National Coordinator for Health Information Technology.
mschneider@frontlinemedcom.com
On Twitter @MaryEllenNY

High-volume, low-mortality hospitals have lowest postsurgical readmissions
Hospitals that conduct a high volume of surgical procedures and have a low 30-day mortality rate have lower readmission rates, according to a new study. Even so, about one in seven patients discharged after major surgery is readmitted in the first 30 days, the authors found.
The researchers also showed that strictly following surgical process measures – such as infection control techniques – was only weakly associated with reduced readmissions.
The results are not terribly surprising, according to the authors, Dr. Thomas C. Tsai and his colleagues from Harvard University, Brigham and Women’s Hospital, and the Veterans Affairs Boston Healthcare System. The researchers could not specifically determine why the higher-volume, lower-mortality hospitals had lower readmission rates, but they speculated that these facilities have systems in place to protect surgical patients from bad outcomes that might bring them back to the hospital. Their study was published Sept. 18 in the New England Journal of Medicine (2013;369:1134-42).

The Medicare program now penalizes hospitals for excess readmissions after discharge for heart failure, heart attack, and pneumonia. For fiscal year 2013, which ends on Oct. 1, hospitals will be penalized 1% of their total Medicare billings if readmissions are too high. In fiscal 2014, chronic obstructive pulmonary disease and coronary artery bypass grafting will be added to the list of monitored conditions. The penalty rises to 2% in fiscal year 2014 and 3% in fiscal 2015. In coming years, the Centers for Medicare and Medicaid Services is expected to add more surgical procedures to the readmission penalty list.
The researchers analyzed national Medicare data, which comprised 479,471 discharges from 3,004 hospitals. These hospitals accounted for 90% of the discharges for the six major procedures studied: coronary artery bypass grafting, pulmonary lobectomy, endovascular repair of abdominal aortic aneurysm, open repair of AAA, colectomy, and hip replacement. The authors also analyzed Hospital Quality Alliance (HQA) surgical care scores. The HQA score is calculated based on how well hospitals perform on process measures established by the Surgical Care Improvement Project.
The three measures of surgical quality included the HQA score, procedure volume, and 30-day mortality. The primary outcome measure was a hospital-level composite of the six procedure-specific, risk-adjusted readmission rates at 30 days. The authors compared the characteristics of patients who were readmitted within 30 days with those who were not, and compared the characteristics of hospitals that had composite readmission rates above the median with those that had rates below the median.
The median composite risk-adjusted 30-day readmission rate was 13%. Patients who were readmitted tended to be older (78 years vs. 77 years) and had more comorbidities. The hospitals with readmission rates below the median were more likely to be nonprofit, nonteaching, and located in the West. They also had a higher number of full-time nurses per 1,000 patient-days and a lower proportion of Medicaid patients.
There was no significant difference between urban and rural hospitals.
The authors used multivariate models to gauge the impact of quality measures on readmission rates. After accounting for hospital characteristics, they found that hospitals with the highest volume of procedures had a readmission rate just under the median, compared with those with the lowest procedure volumes, which had a readmission rate of close to 17%.
Hospitals in the lowest quartile for mortality rates had a 13% readmission rate, compared with 14% for those in the highest mortality quartile.
Overall, there was no significant difference in readmissions between the hospitals that performed the best on the HQA score and those that were the poorest performers. That might be because there was only a very small variation in performance on the HQA score – with a median of 99% for high performers and 92% for low performers, said the authors.
Policymakers should be reassured by their consistent findings that readmissions are linked to certain quality measures – volume and mortality, the investigators said. But a direct link is still not definitive, said Dr. Tsai and his colleagues. Previous studies have indicated that volume did help reduce readmissions, while others have shown no relationship.
But those studies were conducted before the widespread use of minimally invasive procedures and process measures aimed at reducing postsurgical complications, the authors said.
The authors reported no relevant conflicts of interest.
On Twitter @aliciaault
Readmissions have clearly become a tremendous focus for payers and oversight agencies. The Readmission Reduction Program put forth by the Centers for Medicare and Medicaid Services (CMS) will potentially penalize hospitals up to 3% for high readmission rates in fiscal year 2015. This penalty is higher than for any other CMS pay-for-performance programs. The main CMS measure compares hospitals on risk-adjusted all-cause hospital-wide readmissions.
The study by Tsai and his colleagues concluded that surgical readmission rates are a relevant and valid approach to measure surgical quality. However, this has been the topic of much debate in the surgical community, and admittedly, my thinking has evolved on this topic.
Readmissions have gained momentum because they are undoubtedly costly, but they also certainly adversely affect quality of life for the patient. Readmission quality metrics were initially pioneered for medical admissions. Medical readmissions were thought to be caused by issues with the transition from the inpatient team to the outpatient physicians; thus there was potentially a systems-based intervention that could be implemented. Hospitals were able to reduce readmission rates with early postdischarge follow-up visits to intervene (e.g., weigh patients, assess symptoms, and adjust diuretics for heart failure patients) and better coordination of care.
Surgeons have argued that readmissions after medical admissions differ considerably from readmissions after surgery. Surgical readmissions are almost entirely caused by postoperative complications, whereas readmissions after medical admissions are due to worsening of the clinical problem or issues with coordination of care. Thus, surgeons have suggested that surgical readmissions are not preventable with a change in postoperative follow-up visits or an improvement in coordination of care. Thus, some may argue that readmissions are unavoidable and simply an aggregate measure of postdischarge postoperative complications. Some also suggest that surgeons are penalized twice: once for the postoperative complication and again for the readmission that is likely related to the complication.
While this was my initial inclination, I do now believe there is value in readmission as a quality measure. There are likely many opportunities for hospitals to reduce readmissions and cost by dealing with more complications in the outpatient setting. For example, if a hospital has a high readmission rate and they find it is caused by surgical site infection (SSI), they could implement an outpatient system to deal with SSIs without needing to readmit patients. Hospitals have had success with this approach and have been able to insert PICC lines for antibiotics, open incisions, debride wounds, and place negative pressure wound therapy in the outpatient clinic.
In 2014, the American College of Surgeons’ National Surgical Quality Improvement Program (NSQIP) will provide hospitals with risk-adjusted readmission rates. Since the CMS measure only provides an overall, hospital-wide rate, hospitals will need to examine their readmission performance for surgical patients overall and for individual surgeries to identify targeted opportunities for improvement. The ACS NSQIP will fill this need. Moreover, since the ACS NSQIP data abstractors record the reason for the readmission and other patient variables, ACS NSQIP hospitals will be able to better understand why the readmission happened and develop strategies to reduce readmissions. Hospitals will also be able to share experiences and best practices through the ACS NSQIP community to drive down readmission rates.
While readmission may not initially make intuitive sense as a surgical quality measure, it will likely prompt improvements in care for the patients and reduce costs for payers and hospitals, making it a worthwhile focus for quality improvement efforts.
Dr. Karl Bilimoria is an ACS Faculty Scholar and a surgical oncologist at Northwestern Memorial Hospital, Chicago, and an assistant professor of surgery at the Northwestern University Feinberg School of Medicine. He is also director of the Surgical Outcomes and Quality Improvement Center at Northwestern University.
Hospitals that conduct a high volume of surgical procedures and have a low 30-day mortality rate have lower readmission rates, according to a new study. Even so, about one in seven patients discharged after major surgery is readmitted in the first 30 days, the authors found.
The researchers also showed that strictly following surgical process measures – such as infection control techniques – was only weakly associated with reduced readmissions.
The results are not terribly surprising, according to the authors, Dr. Thomas C. Tsai and his colleagues from Harvard University, Brigham and Women’s Hospital, and the Veterans Affairs Boston Healthcare System. The researchers could not specifically determine why the higher-volume, lower-mortality hospitals had lower readmission rates, but they speculated that these facilities have systems in place to protect surgical patients from bad outcomes that might bring them back to the hospital. Their study was published Sept. 18 in the New England Journal of Medicine (2013;369:1134-42).
The Medicare program now penalizes hospitals for excess readmissions after discharge for heart failure, heart attack, and pneumonia. For fiscal year 2013, which ends on Oct. 1, hospitals will be penalized 1% of their total Medicare billings if readmissions are too high. In fiscal 2014, chronic obstructive pulmonary disease and coronary artery bypass grafting will be added to the list of monitored conditions. The penalty rises to 2% in fiscal year 2014 and 3% in fiscal 2015. In coming years, the Centers for Medicare and Medicaid Services is expected to add more surgical procedures to the readmission penalty list.
The researchers analyzed national Medicare data, which comprised 479,471 discharges from 3,004 hospitals. These hospitals accounted for 90% of the discharges for the six major procedures studied: coronary artery bypass grafting, pulmonary lobectomy, endovascular repair of abdominal aortic aneurysm, open repair of AAA, colectomy, and hip replacement. The authors also analyzed Hospital Quality Alliance (HQA) surgical care scores. The HQA score is calculated based on how well hospitals perform on process measures established by the Surgical Care Improvement Project.
The three measures of surgical quality included the HQA score, procedure volume, and 30-day mortality. The primary outcome measure was a hospital-level composite of the six procedure-specific, risk-adjusted readmission rates at 30 days. The authors compared the characteristics of patients who were readmitted within 30 days with those who were not, and compared the characteristics of hospitals that had composite readmission rates above the median with those that had rates below the median.
The median composite risk-adjusted 30-day readmission rate was 13%. Patients who were readmitted tended to be older (78 years vs. 77 years) and had more comorbidities. The hospitals with readmission rates below the median were more likely to be nonprofit, nonteaching, and located in the West. They also had a higher number of full-time nurses per 1,000 patient-days and a lower proportion of Medicaid patients.
There was no significant difference between urban and rural hospitals.
The authors used multivariate models to gauge the impact of quality measures on readmission rates. After accounting for hospital characteristics, they found that hospitals with the highest volume of procedures had a readmission rate just under the median, compared with those with the lowest procedure volumes, which had a readmission rate of close to 17%.
Hospitals in the lowest quartile for mortality rates had a 13% readmission rate, compared with 14% for those in the highest mortality quartile.
Overall, there was no significant difference in readmissions between the hospitals that performed the best on the HQA score and those that were the poorest performers. That might be because there was only a very small variation in performance on the HQA score – with a median of 99% for high performers and 92% for low performers, said the authors.
Policymakers should be reassured by their consistent findings that readmissions are linked to certain quality measures – volume and mortality, the investigators said. But a direct link is still not definitive, said Dr. Tsai and his colleagues. Previous studies have indicated that volume did help reduce readmissions, while others have shown no relationship.
But those studies were conducted before the widespread use of minimally invasive procedures and process measures aimed at reducing postsurgical complications, the authors said.
The authors reported no relevant conflicts of interest.
On Twitter @aliciaault
FROM THE NEW ENGLAND JOURNAL OF MEDICINE
Major finding: Hospitals with the highest surgical volume and lowest 30-day mortality rates had the lowest 30-day readmission rates for six major surgical procedures.
Data source: A bivariate and multivariate analysis of Medicare data on 479,471 discharges from 3,004 hospitals.
Disclosures: The authors reported no relevant conflicts of interest.

Uninsured number holds steady during ACA implementation lull
About 48 million Americans lacked health insurance in 2012, a figure not significantly changed from 2011, according to data released by the U.S. Census Bureau on Sept. 17.
But the percentage of Americans who had health coverage rose slightly in 2012, compared with 2011. The most recent figures from the Census Bureau show that 84.6% of Americans had health insurance in 2012, compared with 84.3% in the previous year. Gains in coverage came largely from government programs such as Medicare, Medicaid, and military health care programs.
Private insurance coverage held steady between 2011 and 2012, with 64% of Americans getting their coverage from those plans. Most private coverage was employer-sponsored.

The percentage of Americans whose health coverage came from government-sponsored programs increased for the sixth consecutive year, growing to 33%. Though Medicaid coverage stayed about the same at about 16%, Medicare coverage rose from 15.2% to 15.7% between 2011 and 2012. That uptick is likely due to the first wave of baby boomers entering the Medicare program, said David S. Johnson, Ph.D., chief of the social, economic, and housing statistics division of the U.S. Census Bureau.
The rate of uninsured among children under age 18 fell from 9.4% (7.0 million) to 8.9% (6.6 million) between 2011 and 2012.
However, the uninsured rate was statistically unchanged in all other age groups, including young adults aged 19-25 years. Since 2009, the uninsured rate for young adults had dropped 4.2%, putting it on par with adults aged 26-34 years. The recent decline has been attributed to the Affordable Care Act provision that allows young adults to stay on their parents’ health insurance as dependents up to age 26. But now that the provision has been in effect for a few years, the bulk of the declines have been realized, Dr. Johnson said.
The ACA has also required states to maintain their eligibility levels for Medicaid and the Children’s Health Insurance Program (CHIP), said Edwin Park, vice president for health policy at the Center on Budget and Policy Priorities. "Medicaid and CHIP have either increased or stayed steady and, particularly in the case of kids, that has more than offset declines in private coverage," he said.
But the most dramatic impacts of the ACA won’t be seen until 2014, when the health insurance exchanges open and some states expand their Medicaid eligibility, Mr. Park said. He cited Congressional Budget Office estimates that about 13 million individuals who otherwise would be uninsured would gain coverage in 2014, with the number rising to about 25 million by 2016. But due to the 1-year lag in census data, data on the extent of the insurance uptake won’t be available until 2015, he said.
The current census findings are based on data from the Current Population Survey Annual Social and Economic Supplement.
About 48 million Americans lacked health insurance in 2012, a figure not significantly changed from 2011, according to data released by the U.S. Census Bureau on Sept. 17.
But the percentage of Americans who had health coverage rose slightly in 2012, compared with 2011. The most recent figures from the Census Bureau show that 84.6% of Americans had health insurance in 2012, compared with 84.3% in the previous year. Gains in coverage came largely from government programs such as Medicare, Medicaid, and military health care programs.
Private insurance coverage held steady between 2011 and 2012, with 64% of Americans getting their coverage from those plans. Most private coverage was employer-sponsored.
The percentage of Americans whose health coverage came from government-sponsored programs increased for the sixth consecutive year, growing to 33%. Though Medicaid coverage stayed about the same at about 16%, Medicare coverage rose from 15.2% to 15.7% between 2011 and 2012. That uptick is likely due to the first wave of baby boomers entering the Medicare program, said David S. Johnson, Ph.D., chief of the social, economic, and housing statistics division of the U.S. Census Bureau.
The rate of uninsured among children under age 18 fell from 9.4% (7.0 million) to 8.9% (6.6 million) between 2011 and 2012.
However, the uninsured rate was statistically unchanged in all other age groups, including young adults aged 19-25 years. Since 2009, the uninsured rate for young adults had dropped 4.2%, putting it on par with adults aged 26-34 years. The recent decline has been attributed to the Affordable Care Act provision that allows young adults to stay on their parents’ health insurance as dependents up to age 26. But now that the provision has been in effect for a few years, the bulk of the declines have been realized, Dr. Johnson said.
The ACA has also required states to maintain their eligibility levels for Medicaid and the Children’s Health Insurance Program (CHIP), said Edwin Park, vice president for health policy at the Center on Budget and Policy Priorities. "Medicaid and CHIP have either increased or stayed steady and, particularly in the case of kids, that has more than offset declines in private coverage," he said.
But the most dramatic impacts of the ACA won’t be seen until 2014, when the health insurance exchanges open and some states expand their Medicaid eligibility, Mr. Park said. He cited Congressional Budget Office estimates that about 13 million individuals who otherwise would be uninsured would gain coverage in 2014, with the number rising to about 25 million by 2016. But due to the 1-year lag in census data, data on the extent of the insurance uptake won’t be available until 2015, he said.
The current census findings are based on data from the Current Population Survey Annual Social and Economic Supplement.

ED visits spike among California Medicaid patients
Medicaid patients in California increased their use of emergency departments by 35.6% over a 5-year period while use by privately insured patients barely increased.
"Increasing ED use by Medicaid beneficiaries could reflect decreasing access to primary care, which is supported by our findings of high and increasing rates of ED use for ambulatory care sensitive conditions by Medicaid patients," wrote Dr. Renee Hsia. The report was published in the Sept. 18 issue of JAMA.
Dr. Hsia of the University of California, San Francisco, and her coauthors examined rates of ED utilization in California from 2005 to 2010 and broke down the data by insurance status (JAMA 2013;310:1181-81). They looked at adult patients younger than 65 years, because these patients "have experienced the greatest changes in insurance coverage in recent years, and are likely to see the biggest shifts as a result of health care reform."
The investigators based their retrospective analysis on the California Office of Statewide Health Planning and Development’s Emergency Discharge Data and Patient Discharge Data. The study grouped patients by insurance status: Medicaid, private, uninsured or self-pay, or other (workers compensation, CHAMPUS/TRICARE, Title V, and Veterans Affairs, and similar coverage).
Overall, ED visits jumped from 5.4 million to 6.1 million over the 5-year period – a 13% increase. While visits for patients with private insurance barely increased, with a 5-year difference of just 1%, visits by Medicaid patients increased by 35.6%, and visits by uninsured patients rose 25.4%. Visits by patients with coverage in the "other" category decreased by more than 10%, the authors noted.
Medicaid patients also maintained the highest rate of visits such as hypertension, which are potentially preventable with primary care. Among Medicaid recipients, the average yearly rate of ED visits for these problems was 54.76/1,000, compared with 10.93/1,000 for those with private insurance and 16.6/1,000 for those who were uninsured.
These visits showed the same kinds of coverage-dependent increases over the study period: a 6.8% hike among Medicaid beneficiaries and 6.2% among the uninsured, but a decline of 0.7% among privately insured patients.
Neither Dr. Hsia nor her coauthors reported any financial disclosures.
FROM JAMA
Major finding: From 2005 to 2010, ED visits among California Medicaid patients increased 35.6% while visits for privately insured patients remained almost the same.
Data source: Claims data from several state sources.
Disclosures: The investigators reported no financial conflicts of interest.
HHS releases tools for patient consent to share data electronically
As more medical practices exchange patients’ health information electronically with hospitals and other providers, physicians have a new problem on their hands: how to explain the process to patients and gain their consent to share the information.
Federal health officials have developed some tools – including customizable patient videos – that aim to simplify the process by creating a standardized explanation of the data exchange process and patient options for sharing their medical information.

The effort, known as meaningful consent, deals specifically with information shared through health information exchange organizations (HIEs). These third-party organizations help health care providers in several ways, including directly exchanging information and orders, allowing providers to request specific patient information, or allowing consumers to aggregate their own data online to share with specific providers.
While state laws and regulations create a patchwork of different requirements for when patient consent is required to release information for treatment, federal officials are encouraging physicians to develop a "meaningful consent" process that includes education about how the information is shared, gives patients time to review the educational materials, and allows them to change or revoke their consent at any time.
The HHS Office of the National Coordinator for Health Information Technology (ONC) recently conducted a pilot project to test the use of tablet computers to educate patients about their options in sharing information through an HIE. The project, which was completed in March 2013, found that patients were most interested in who could access their information, whether sensitive health information would be shared, how the information would be protected from misuse, and why it needed to be shared at all.
"As patients become more engaged in their health care, it’s vitally important that they understand more about various aspects of their choices when it relates to sharing their health in the electronic health information exchange environment," Joy Pritts, ONC’s chief privacy officer, said in a statement.
mschneider@frontlinemedcom.com
On Twitter @MaryEllenNY
As more medical practices exchange patients’ health information electronically with hospitals and other providers, physicians have a new problem on their hands: how to explain the process to patients and gain their consent to share the information.
Federal health officials have developed some tools – including customizable patient videos – that aim to simplify the process by creating a standardized explanation of the data exchange process and patient options for sharing their medical information.
The effort, known as meaningful consent, deals specifically with information shared through health information exchange organizations (HIEs). These third-party organizations help health care providers in several ways, including directly exchanging information and orders, allowing providers to request specific patient information, or allowing consumers to aggregate their own data online to share with specific providers.
While state laws and regulations create a patchwork of different requirements for when patient consent is required to release information for treatment, federal officials are encouraging physicians to develop a "meaningful consent" process that includes education about how the information is shared, gives patients time to review the educational materials, and allows them to change or revoke their consent at any time.
The HHS Office of the National Coordinator for Health Information Technology (ONC) recently conducted a pilot project to test the use of tablet computers to educate patients about their options in sharing information through an HIE. The project, which was completed in March 2013, found that patients were most interested in who could access their information, whether sensitive health information would be shared, how the information would be protected from misuse, and why it needed to be shared at all.
"As patients become more engaged in their health care, it’s vitally important that they understand more about various aspects of their choices when it relates to sharing their health in the electronic health information exchange environment," Joy Pritts, ONC’s chief privacy officer, said in a statement.
mschneider@frontlinemedcom.com
On Twitter @MaryEllenNY

U.S. physician population grew fastest in South Atlantic region
The U.S. South Atlantic states’ growth rate of 10.4% gave that region the fastest-growing population of physicians in the United States between 2010 and 2012, according to data from the Federation of State Medical Boards.
The South Atlantic also had the largest physician population of any census division in 2012 – 163,319 (18.6%) of the 878,194 doctors with an active license, said Aaron Young, Ph.D., of the FSMB in Euless, Tex., and his associates (J. Med. Regul. 2013;99:11-24).
Of the nine geographic divisions defined by the U.S. Census Bureau, five saw their physician population increase, while four experienced decreases from 2010 to 2012. After the South Atlantic, the West South Central region had the second-largest increase, at 9.3%, with the Pacific next at 9.0%. The East North Central (1.9%) and Mountain (0.1%) regions had much smaller increases, the authors reported.
Of the four regions with declines, the West North Central division had the largest decrease, at 5.9%, with New England second, at 5.7%. The Middle Atlantic was down by 2.3%, and the East South Central had a 1.5% decline, Dr. Young and his associates said.
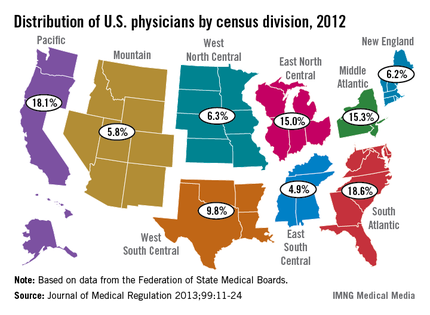
FROM THE JOURNAL OF MEDICAL REGULATION

SGR replacement cost now up to $176 billion
The price tag to replace the Medicare Sustainable Growth Rate formula has grown to an estimated $176 billion over 10 years, up $40 billion from the most recent estimates, according to a Sept. 13 Congressional Budget Office analysis.
This time, the nonpartisan CBO analyzed the Medicare Patient Access and Quality Improvement Act of 2013 (H.R. 2810), which was approved unanimously by the House Energy and Commerce Committee in July. The bill has not seen any further movement since that time, but it is expected that Congress will take up SGR reform again this fall.
In its analysis, the CBO said that it thought that H.R. 2810, in part because it continues to rely largely on fee-for-service, would continue to drive up Medicare spending. Between 2014 and 2018, the bill proposes to increase physician fees by a flat 0.5%.
Starting in 2019, physicians will be paid based on performance in a program that gives rewards for quality, or on so-called alternative payment models.
The CBO said it believed that physicians would choose payment models that would increase their fees, which would, in turn, create a rise in Medicare spending. The pay increases for 2014-2018 will likely cost $64 billion, according to the agency. From 2019 to 2023, spending on physician fees is expected to hit $112 billion.
In addition, the agency said that Medicare would end up spending about $0.3 billion on other payment reforms proposed in the legislation, including modifying payment rates in certain California counties, adjusting relative value units for certain physicians’ services, and requiring the development of payment codes to encourage care coordination and the use of medical homes.
On Twitter @aliciaault