User login
Radiation often underused in follicular lymphoma
woman for radiotherapy
Photo by Rhoda Baer
SAN ANTONIO—A new study indicates that patients with early stage follicular lymphoma (FL) are increasingly receiving no treatment or single-agent chemotherapy, despite evidence suggesting that radiation therapy can produce better outcomes.
Guidelines from the National Comprehensive Cancer Network and the European Society for Medical Oncology both list radiation therapy as the preferred treatment for low-grade FL.
However, investigators found that, in recent years, radiation has been replaced by alternative strategies.
“Our study highlights the increasing omission of radiation therapy in [FL] and its associated negative effect on overall survival at a national level,” said John Austin Vargo, MD, of the University of Pittsburg Cancer Institute in Pennsylvania.
“This increasing bias towards the omission of radiation therapy is despite proven efficacy and increasing adoption of lower radiation therapy doses and more modern radiation therapy techniques which decrease risk of side effects.”
Dr Vargo presented these findings at the 57th Annual Meeting of the American Society for Radiation Oncology (presentation #183).
He and his colleagues analyzed patterns of care and survival outcomes for 35,961 patients diagnosed with early stage FL as listed in the National Cancer Data Base. A majority of patients were older than 60 (61%), and most had stage I disease (63%).
The use of radiation therapy in this group of patients decreased from 37% in 1999 to 24% in 2012 (P<0.0001).
The use of observation increased from 34% in 1998 to 44% in 2012 (P<0.0001). And the use of single-agent chemotherapy increased from 5.4% in 1999 to 11.7% in 2006 (P=0.01).
The 5-year overall survival rate was 86% in patients who received radiation and 74% in those who did not (P<0.0001). Ten-year overall survival rates were 68% and 54%, respectively (P<0.0001).
In multivariate analysis, radiation therapy remained significantly associated with improved overall survival (P<0.0001). ![]()
Novel compound could treat leukemia

A small-molecule compound that has previously shown activity against Ewing sarcoma and prostate cancer may fight leukemia as well, according to preclinical research published in Oncotarget.
The compound, YK-4-279, inhibits the oncogenic activity of the fusion protein EWS-FLI1.
“EWS-FLI1 is already known to drive a rare but deadly bone cancer called Ewing sarcoma,” said study author Aykut Üren, MD, of Georgetown University Medical Center in Washington, DC.
“It also appears to drive cancer cell growth in some prostate cancers.”
ETS family fusion proteins are found in patients with acute myeloid leukemia and acute lymphoblastic leukemia as well.
So Dr Üren and his colleagues decided to create a mouse model of EWS-FLI1-induced leukemia and assess the activity of YK-4-279 in this model.
Mice with EWS-FLI1-induced leukemia presented with severe hepatomegaly, splenomegaly, and anemia, followed by rapid death.
The investigators treated these mice with injections of YK-4-279 five days a week for 2 weeks or vehicle intraperitoneal injections on the same schedule.
The team said treatment with YK-4-279 significantly reduced white blood cell counts, nucleated erythroblasts in the peripheral blood, splenomegaly, and hepatomegaly.
They noted that mice experienced reductions in the weight of their spleens and livers without experiencing reductions in total body weight.
In addition, mice that received YK-4-279 had significantly better overall survival than control mice. The median survival times were 60.5 days and 21 days, respectively.
The investigators also noted that treated mice did not exhibit overt toxicity in the liver, spleen, or bone marrow.
“The fact that treated mice did not get sick from the YK-4-279 gives us an early indication that it might be safe to use in humans, but that is a question that can’t be answered until we conduct clinical trials,” Dr Üren said.
Nevertheless, he and his colleagues believe these results support the continued preclinical development of YK-4-279 for Ewing sarcoma, prostate cancers, and leukemias with highly homologous translocation products or with a clear ETS-driven gene signature. ![]()
Team targets gene to increase RBC production

Researchers say they can increase the production of red blood cells (RBCs) in the lab by targeting a single gene—SH2B3.
The team used RNA interference (RNAi) to turn down SH2B3 in human hematopoietic stem and progenitor cells (HSPCs) and increased the yield of RBCs about 3- to 7-fold.
They also used CRISPR/Cas9 genome editing to shut off SH2B3 in human embryonic stem cell (hESC) lines, increasing the yield of RBCs about 3-fold.
The researchers noted that the method involving hESCs would be easier to use for large-scale production of RBCs.
Vijay Sankaran, MD, PhD, of the Broad Institute in Cambridge, Massachusetts, and his colleagues conducted this research and reported the results in Cell Stem Cell.
The researchers homed in on their target gene, SH2B3, after genome sequencing data revealed naturally occurring variations in SH2B3. These variations reduce the gene’s activity and increase RBC production.
“There’s a variation in SH2B3 found in about 40% of people that leads to modestly higher red blood cell counts,” Dr Sankaran said. “But if you look at people with really high red blood cell levels, they often have rare SH2B3 mutations. That said to us that here is a target where you can partially or completely eliminate its function as a way of increasing red blood cells robustly.”
So Dr Sankaran and his colleagues set out to see if they could use SH2B3 as a target to increase the yield of lab-based RBC production processes (as opposed to tweaking cells in culture by adding cytokines and other factors).
To do this, they first used RNAi to turn down SH2B3 in donated adult HSPCs and HSPCs from umbilical cord blood.
The team’s data confirmed that shutting off SH2B3 with RNAi skews an HSPC’s profile of cell production to favor RBCs. Adult HSPCs treated with RNAi produced 3- to 5-fold more RBCs than controls. And RNAi-treated HSPCs from cord blood produced 5- to 7-fold more RBCs than controls.
Using multiple tests, the researchers found the RBCs produced by RNAi were essentially indistinguishable from control cells.
Dr Sankaran and his colleagues recognized that this approach would be very difficult to scale up to a level that could impact the clinical need for RBCs. So, in a separate set of experiments, they used CRISPR to permanently shut off SH2B3 in hESC lines, which can be readily renewed in a lab.
The team then treated the edited cells with a cocktail of factors known to encourage blood cell production. Under these conditions, the edited hESCs produced 3 times more RBCs than controls. Again, the team could find no significant differences between RBCs from the edited stem cells and controls.
Dr Sankaran believes that SH2B3 enforces some kind of upper limit on how much RBC precursors respond to calls for more RBC production.
“This is a nice approach because it removes the brakes that normally keep cells restrained and limit how much red blood cell precursors respond to different laboratory conditions,” he said.
Dr Sankaran also believes that, with further development, the combination of CRISPR and hESCs could increase the yields and reduce the costs of producing RBCs in the lab to the level where commercial-scale manufacture could be feasible.
“This is allowing us to get close to the cost of normal donor-derived blood units,” he said. “If we can get the costs down to about $2000 per unit, that’s a reasonable cost.”
Previous research has shown it is possible to produce transfusion-grade RBCs, but the costs ranged from $8000 to $15,000 per unit of blood. ![]()
Genetic variation influences effect of malaria vaccine candidate
Photo by Caitlin Kleiboer
Results of a genomic sequencing analysis appear to explain why the malaria vaccine candidate RTS,S/AS01 (Mosquirix) is more effective in some children than others.
Researchers sequenced nearly 5000 patient samples and discovered that genetic variation in the protein targeted by RTS,S influences the vaccine’s ability to ward off malaria in young children.
The variation did not appear to affect the vaccine’s efficacy for infants.
Daniel E. Neafsey, PhD, of the Broad Institute in Cambridge, Massachusetts, and his colleagues reported these findings in NEJM.
RTS,S is designed to target a fragment of the protein circumsporozoite (CS), which sits on the surface of the Plasmodium falciparum parasite.
The CS protein is capable of provoking an immune response that can prevent parasites from infecting the liver, where they typically mature and reproduce before dispersing and invading red blood cells, leading to symptomatic malaria.
RTS,S aims to trigger that response as a way to protect against the disease. However, the CS protein is genetically diverse—perhaps due to its evolutionary role in the immune response—and RTS,S includes only one allele of the protein.
With their study, Dr Neafsey and his colleagues sought to test whether alleles of CS that matched the one targeted by RTS,S were linked with better vaccine protection.
The team obtained blood samples from 4985 of the approximately 15,000 infants and children who participated in the vaccine’s phase 3 trial between 2009 and 2013.
The researchers were sent samples when the first symptomatic cases appeared in those vaccinated, as well as samples from all participants at month 14 and month 20 following vaccination.
The team used polymerase chain reaction-based next-generation sequencing of DNA extracted from the samples to survey CS protein polymorphisms. And they set out to determine whether polymorphic positions and haplotypic regions within CS had any effect on the vaccine’s efficacy against first episodes of malaria within a year of vaccination.
The researchers found that RTS,S provided at least partial protection against all strains of P falciparum. However, the vaccine was significantly more effective at preventing malaria in children with matched allele parasites than those with mismatched allele parasites.
Among children who were 5 months to 17 months of age, the 1-year cumulative vaccine efficacy was 50.3% against malaria in which parasites matched the vaccine in the entire CS protein C-terminal, compared to 33.4% against mismatched malaria (P=0.04).
The same effect was not noted in infants. Among infants 6 weeks to 12 weeks of age, there was no evidence of differential allele-specific vaccine efficacy.
Previous genetic studies conducted during RTS,S’s phase 2 trials had not detected an allele-specific effect for this vaccine candidate. The current study had a larger sample size, and recent technological advances made it possible to read the genetic samples with greater sensitivity.
“This is the first study that was big enough and used a methodology that was sufficiently sensitive to detect this phenomenon,” Dr Neafsey said. “Now that we know that it exists, it contributes to our understanding of how RTS,S confers protection and informs future vaccine development efforts.”
RTS,S is the first malaria vaccine candidate to complete phase 3 trials and receive a positive opinion from the European Medicines Agency’s Committee for Medicinal Products for Human Use.
The vaccine was originally designed by scientists at GlaxoSmithKline in 1987. It is now being developed via a public-private partnership between GlaxoSmithKline and PATH Malaria Vaccine Initiative.
The current study was supported by the National Institute of Allergy and Infectious Diseases, the Bill & Melinda Gates Foundation, and the PATH Malaria Vaccine Initiative. ![]()
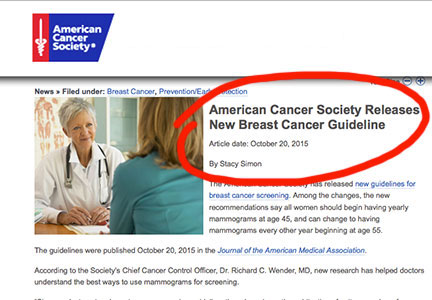
What you should know about the latest change in mammography screening guidelines
When the American Cancer Society (ACS) updated its guidelines for screening mammography earlier this week,1 the effect was that of a stone being tossed into a tranquil pond, generating ripples in all directions.
The new guidelines focus on women at average risk for breast cancer (TABLE 1) and were updated for the first time since 2003, based on new evidence, a new emphasis on eliminating as many screening harms as possible, and a goal of “supporting the interplay among values, preferences, informed decision making, and recommendations.”1 Earlier ACS guidelines recommended annual screening starting at age 40.
TABLE 1 What constitutes “average risk” of breast cancer?
|
The new guidelines are graded according to the strength of the rec ommendation as being either “strong” or “qualified.” The ACS defines a “strong” recommendation as one that most individuals should follow. “Adherence to this recommendation according to the guideline could be used as a quality criterion or performance indicator,” the guidelines note.1
A “qualified” recommendation indicates that “Clinicians should acknowledge that different choices will be appropriate for different patients and that clinicians must help each patient arrive at a management decision consistent with her or his values and preferences.”1
The recommendations are:
- Regular screening mammography should start at age 45 years (strong recommendation)
- Screening should be annual in women aged 45 to 54 years (qualified recommendation)
- Screening should shift to biennial intervals at age 55, unless the patient prefers to continue screening annually (qualified recommendation)
- Women who desire to initiate annual screening between the ages of 40 and 44 years should be accommodated (qualified recommendation)
- Screening mammography should continue as long as the woman is in good health and has a life expectancy of at least 10 years (qualified recommendation)
- Clinical breast examination (CBE) is not recommended at any age (qualified recommendation).1
ACOG weighs in
Shortly after publication of the new ACS guidelines, the American College of Obstetricians and Gynecologists (ACOG) issued a formal statement in response2:
Response of the USPSTF
The US Preventive Services Task Force (USPSTF) also issued a statement in response to the new ACS guidelines:
The USPSTF currently recommends biennial screening beginning at age 50.
A leader in breast health cites pros and cons of ACS recommendations
Mark Pearlman, MD, professor of obstetrics and gynecology at the University of Michigan health system, is a nationally recognized expert on breast cancer screening. He sits on the National Comprehensive Cancer Network (NCCN) breast cancer screening and diagnosis group, helped author ACOG guidelines on mammography screening, and serves as a Contributing Editor to OBG Management.
“I believe the overall ACS mammography benefit evidence synthesis is reasonable and is in keeping with both NCCN and ACOG’s current recommendations. NCCN and ACOG mammography screening recommendations have both valued lives saved more highly than the ‘harms’ such as recalls and needle biopsies,” Dr. Pearlman says.
“If one combines ACS ‘strong’ and ‘qualified’ recommendations, ACS recommendations are similar to current ACOG and NCCN recommendations for mammography,” he adds.
Dr. Pearlman finds 7 areas of agreement between NCCN/ACOG and ACS recommendations, using both strong and qualified recommendations:
- “They reaffirm that screening from age 40 to 69 years is associated with a reduction in breast cancer deaths.
- They support annual screening for women in their 40s [although the ACS’ ‘strong’ recommendation is that regular screening begin at age 45 instead of 40].
- They support screening for women 70 and older who are in good health (10-year life expectancy).
- They support the finding that annual screening yields a larger mortality reduction than biennial screening.
- They confirm much uncertainty about the “over-diagnosis/overtreatment” issue.
- They endorse insurance coverage at all ages and intervals of screening (not just USPSTF ‘A’ or ‘B’ recommendations).
- They involve the patient in informed decision making.”
Where the ACS and ACOG/NCCN disagree is over the issue of the physical exam (abandoning CBE in average-risk women).
In regard to this last item, Dr. Pearlman says, “The ACS made a qualified recommendation against clinical breast exam. There is no high-level data to support such a marked change in practice. For example, when recommendations against breast self-examinations (BSE) were made, there were randomized controlled trials (RCTs) showing a lack of benefit and significant harms with BSE. With RCT-level data, it made sense to make a recommendation against the long-taught practice of SBE in average-risk women. That was not the case here. In fact, there are small amounts of data showing benefits of clinical breast exam.”
“One of my biggest concerns is not just the recommendation against CBE,” says Dr. Pearlman, “but that this may lead many women to interpret [this statement] as if they do not need to see their health care provider anymore. As you may recall, the American College of Physicians (ACP) recommended against annual pelvic examinations in asymptomatic patients. The ACS recommendation statement—taken together with the ACP statement—basically suggests that average-risk women don’t ever need to see a provider for a pelvic or breast examination except every 5 years for a Pap smear. That thinking does not recognize the importance of the clinical encounter (not just the CBE or pelvic exam), which is the opportunity to perform risk assessment and provide risk-reduction recommendations and healthy lifestyle recommendations.”
Radiologists resist new recommendations
Although the American College of Radiology (ACR) and the Society of Breast Imaging (SBI) agree with the ACS that mammography screening saves lives and should be available to women aged 40 and older, the 2 imaging organizations continue to recommend that annual screening begin at age 40. Their rationale: The latest ACS breast cancer screening guidelines, and earlier data used by the USPSTF to create its recommendations, both note that starting annual mammography at age 40 “saves the most lives.”
Where the organizations differ from the ACR is summed up by a formal statement on the ACR Web site: “The ACR and SBI strongly encourage women to obtain the maximum lifesaving benefits from mammography by continuing to get annual screening.”4
When OBG Management touched base with radiologist Barbara Monsees, MD, professor of radiology and Evens Professor of Women’s Health at Washington University Medical Center in St. Louis, Missouri, she expressed dismay at early news reports on the ACS guidelines.
“I’m dismayed that the headlines don’t seem to correlate with what the ACS actually recommended. The ACS did not state that women should wait until age 45 to begin screening. I believe the ACS was going for a more nuanced approach, but since that’s a bit complicated, I think that reporters have misconstrued what was intended,” Dr. Monsees says.
“The ACS guideline says that women between 40 and 44 years should have the opportunity to begin annual screening,” she says, noting that this recommendation was graded as “qualified.”
“The ACS states that a qualified recommendation indicates that ‘there is clear evidence of benefit of screening, but less certainty about the balance of benefits and harms, or about patients’ values and preferences, which could lead to different decisions about screening.’” The guideline also articulates the view “that the meaning of a qualified recommendation for patients is that the ‘majority of individuals in this situation would want the suggested course of action, but many would not.’ Therefore, I find it mind-boggling that this has been interpreted to mean that women should not begin screening until age 45.”1
“It is my opinion that it is clear that if women want to achieve the most lifesaving benefit from screening, they should adhere to a schedule of yearly mammograms beginning at age 40,” says Dr. Monsees. However, she also agrees with the ACS notation that clinicians should acknowledge that “different choices will be appropriate for different patients and that clinicians must help each patient arrive at a management decision consistent with her values and preferences.”1
The word from an expert ObGyn
“By changing its guidance to begin screening at age 45 instead of 40, and in recommending biennial rather than annual screens in women 55 years of age and older, the updated ACS guidance will reduce harms (overdiagnosis and unnecessary additional imaging and biopsies) and moves closer to USPSTF guidance,” says Andrew M. Kaunitz, MD. He is University of Florida Research Foundation Professor and Associate Chairman, Department of Obstetrics and Gynecology, at the University of Florida College of Medicine–Jacksonville. He also serves on the OBG Management Board of Editors.
“As one editorialist points out, the ACS recommendation that women begin screening at age 45 years is based on observational comparisons of screened and unscreened cohorts—a type of analysis which the USPSTF does not consider due to concerns regarding bias,” notes Dr. Kaunitz.5
“The ACS recommendation for annual screening in women aged 45 to 54 is largely based on the findings of a report showing that, for premenopausal (but not postmenopausal) women, tumor stage was higher and size larger for screen-detected lesions among women undergoing biennial screens."6
As for the recommendation against screening CBE, Dr. Kaunitz considers that “a dramatic change from prior guidance. It is based on the absence of data finding benefits with CBE (alone or with screening mammography). Furthermore, the updated ACS guidance does not change its 2003 guidance, which does not support routine performance of or instruction regarding SBE.”
“These updated ACS guidelines should result in more women starting screening mammograms later in life, and they endorse biennial screening for many women, meaning that patients following ACS guidance will have fewer lifetime screens than with earlier recommendations,” says Dr. Kaunitz.
“Another plus is that performing fewer breast examinations during well-woman visits will allow us more time to assess family history and other risk factors for breast cancer, and to discuss screening recommendations.”
The bottom line
What is one to make of the many viewpoints on screening? For now, it probably is best to adhere to either the new ACS guidelines or current ACOG guidelines (TABLE 2), says OBG Management Editor in Chief Robert L. Barbieri, MD. He is chief of the Department of Obstetrics and Gynecology at Brigham and Women’s Hospital in Boston, and Kate Macy Ladd Professor of Obstetrics, Gynecology, and Reproductive Biology at Harvard Medical School.
TABLE 2 What are ACOG’s current recommendations?
|
ACOG recommends screening mammography every year for women starting at age 40. ACOG also states that “breast self-awareness has the potential to detect palpable breast cancer and can be recommended”; it also recommends CBE every year for women aged 19 or older.
These recommendations may change early next year, after ACOG convenes a consensus conference on the subject. The aim: “To develop a consistent set of uniform guidelines for breast cancer screening that can be implemented nationwide. Major organizations and providers of women’s health care, including ACS, will gather to evaluate and interpret the data in greater detail.”2
Share your thoughts! Send your Letter to the Editor to rbarbieri@frontlinemedcom.com. Please include your name and the city and state in which you practice.
- Oeffinger KC, Fontham ET, Etzioni R, et al. Breast cancer screening for women at average risk. 2015 guideline update from the American Cancer Society. JAMA. 2015;314(15):1599–1614.
- American College of Obstetricians and Gynecologists. ACOG Statement on Revised American Cancer Society Recommendations on Breast Cancer Screening. http://www.acog.org/About-ACOG/News-Room/Statements/2015/ACOG-Statement-on-Recommendations-on-Breast-Cancer-Screening. Published October 20, 2015. Accessed October 20, 2015.
- US Preventive Services Task Force. Email communication, USPSTF Newsroom, October 20, 2015.
- American College of Radiology. News Release: ACR and SBI Continue to Recommend Regular Mammography Starting at Age 40. http://www.acr.org/About-Us/Media-Center/Press-Releases/2015-Press-Releases/20151020-ACR-SBI-Recommend-Mammography-at-Age-40. Published October 20, 2015. Accessed October 21, 2015.
- Kerlikowske K. Progress toward consensus on breast cancer screening guidelines and reducing screening harms [published online ahead of print October 20, 2015]. JAMA Intern Med. doi:10.1001/jamainternmed.2015.6466.
- Miglioretti DL, Zhu W, Kerlikowske K, et al; Breast Cancer Surveillance Consortium. Breast tumor prognostic characteristics and biennial vs annual mammography, age, and menopausal status [published online ahead of print October 20, 2015]. JAMA. doi:10.1001/jamaoncol.2015.3084.
When the American Cancer Society (ACS) updated its guidelines for screening mammography earlier this week,1 the effect was that of a stone being tossed into a tranquil pond, generating ripples in all directions.
The new guidelines focus on women at average risk for breast cancer (TABLE 1) and were updated for the first time since 2003, based on new evidence, a new emphasis on eliminating as many screening harms as possible, and a goal of “supporting the interplay among values, preferences, informed decision making, and recommendations.”1 Earlier ACS guidelines recommended annual screening starting at age 40.
TABLE 1 What constitutes “average risk” of breast cancer?
|
The new guidelines are graded according to the strength of the rec ommendation as being either “strong” or “qualified.” The ACS defines a “strong” recommendation as one that most individuals should follow. “Adherence to this recommendation according to the guideline could be used as a quality criterion or performance indicator,” the guidelines note.1
A “qualified” recommendation indicates that “Clinicians should acknowledge that different choices will be appropriate for different patients and that clinicians must help each patient arrive at a management decision consistent with her or his values and preferences.”1
The recommendations are:
- Regular screening mammography should start at age 45 years (strong recommendation)
- Screening should be annual in women aged 45 to 54 years (qualified recommendation)
- Screening should shift to biennial intervals at age 55, unless the patient prefers to continue screening annually (qualified recommendation)
- Women who desire to initiate annual screening between the ages of 40 and 44 years should be accommodated (qualified recommendation)
- Screening mammography should continue as long as the woman is in good health and has a life expectancy of at least 10 years (qualified recommendation)
- Clinical breast examination (CBE) is not recommended at any age (qualified recommendation).1
ACOG weighs in
Shortly after publication of the new ACS guidelines, the American College of Obstetricians and Gynecologists (ACOG) issued a formal statement in response2:
Response of the USPSTF
The US Preventive Services Task Force (USPSTF) also issued a statement in response to the new ACS guidelines:
The USPSTF currently recommends biennial screening beginning at age 50.
A leader in breast health cites pros and cons of ACS recommendations
Mark Pearlman, MD, professor of obstetrics and gynecology at the University of Michigan health system, is a nationally recognized expert on breast cancer screening. He sits on the National Comprehensive Cancer Network (NCCN) breast cancer screening and diagnosis group, helped author ACOG guidelines on mammography screening, and serves as a Contributing Editor to OBG Management.
“I believe the overall ACS mammography benefit evidence synthesis is reasonable and is in keeping with both NCCN and ACOG’s current recommendations. NCCN and ACOG mammography screening recommendations have both valued lives saved more highly than the ‘harms’ such as recalls and needle biopsies,” Dr. Pearlman says.
“If one combines ACS ‘strong’ and ‘qualified’ recommendations, ACS recommendations are similar to current ACOG and NCCN recommendations for mammography,” he adds.
Dr. Pearlman finds 7 areas of agreement between NCCN/ACOG and ACS recommendations, using both strong and qualified recommendations:
- “They reaffirm that screening from age 40 to 69 years is associated with a reduction in breast cancer deaths.
- They support annual screening for women in their 40s [although the ACS’ ‘strong’ recommendation is that regular screening begin at age 45 instead of 40].
- They support screening for women 70 and older who are in good health (10-year life expectancy).
- They support the finding that annual screening yields a larger mortality reduction than biennial screening.
- They confirm much uncertainty about the “over-diagnosis/overtreatment” issue.
- They endorse insurance coverage at all ages and intervals of screening (not just USPSTF ‘A’ or ‘B’ recommendations).
- They involve the patient in informed decision making.”
Where the ACS and ACOG/NCCN disagree is over the issue of the physical exam (abandoning CBE in average-risk women).
In regard to this last item, Dr. Pearlman says, “The ACS made a qualified recommendation against clinical breast exam. There is no high-level data to support such a marked change in practice. For example, when recommendations against breast self-examinations (BSE) were made, there were randomized controlled trials (RCTs) showing a lack of benefit and significant harms with BSE. With RCT-level data, it made sense to make a recommendation against the long-taught practice of SBE in average-risk women. That was not the case here. In fact, there are small amounts of data showing benefits of clinical breast exam.”
“One of my biggest concerns is not just the recommendation against CBE,” says Dr. Pearlman, “but that this may lead many women to interpret [this statement] as if they do not need to see their health care provider anymore. As you may recall, the American College of Physicians (ACP) recommended against annual pelvic examinations in asymptomatic patients. The ACS recommendation statement—taken together with the ACP statement—basically suggests that average-risk women don’t ever need to see a provider for a pelvic or breast examination except every 5 years for a Pap smear. That thinking does not recognize the importance of the clinical encounter (not just the CBE or pelvic exam), which is the opportunity to perform risk assessment and provide risk-reduction recommendations and healthy lifestyle recommendations.”
Radiologists resist new recommendations
Although the American College of Radiology (ACR) and the Society of Breast Imaging (SBI) agree with the ACS that mammography screening saves lives and should be available to women aged 40 and older, the 2 imaging organizations continue to recommend that annual screening begin at age 40. Their rationale: The latest ACS breast cancer screening guidelines, and earlier data used by the USPSTF to create its recommendations, both note that starting annual mammography at age 40 “saves the most lives.”
Where the organizations differ from the ACR is summed up by a formal statement on the ACR Web site: “The ACR and SBI strongly encourage women to obtain the maximum lifesaving benefits from mammography by continuing to get annual screening.”4
When OBG Management touched base with radiologist Barbara Monsees, MD, professor of radiology and Evens Professor of Women’s Health at Washington University Medical Center in St. Louis, Missouri, she expressed dismay at early news reports on the ACS guidelines.
“I’m dismayed that the headlines don’t seem to correlate with what the ACS actually recommended. The ACS did not state that women should wait until age 45 to begin screening. I believe the ACS was going for a more nuanced approach, but since that’s a bit complicated, I think that reporters have misconstrued what was intended,” Dr. Monsees says.
“The ACS guideline says that women between 40 and 44 years should have the opportunity to begin annual screening,” she says, noting that this recommendation was graded as “qualified.”
“The ACS states that a qualified recommendation indicates that ‘there is clear evidence of benefit of screening, but less certainty about the balance of benefits and harms, or about patients’ values and preferences, which could lead to different decisions about screening.’” The guideline also articulates the view “that the meaning of a qualified recommendation for patients is that the ‘majority of individuals in this situation would want the suggested course of action, but many would not.’ Therefore, I find it mind-boggling that this has been interpreted to mean that women should not begin screening until age 45.”1
“It is my opinion that it is clear that if women want to achieve the most lifesaving benefit from screening, they should adhere to a schedule of yearly mammograms beginning at age 40,” says Dr. Monsees. However, she also agrees with the ACS notation that clinicians should acknowledge that “different choices will be appropriate for different patients and that clinicians must help each patient arrive at a management decision consistent with her values and preferences.”1
The word from an expert ObGyn
“By changing its guidance to begin screening at age 45 instead of 40, and in recommending biennial rather than annual screens in women 55 years of age and older, the updated ACS guidance will reduce harms (overdiagnosis and unnecessary additional imaging and biopsies) and moves closer to USPSTF guidance,” says Andrew M. Kaunitz, MD. He is University of Florida Research Foundation Professor and Associate Chairman, Department of Obstetrics and Gynecology, at the University of Florida College of Medicine–Jacksonville. He also serves on the OBG Management Board of Editors.
“As one editorialist points out, the ACS recommendation that women begin screening at age 45 years is based on observational comparisons of screened and unscreened cohorts—a type of analysis which the USPSTF does not consider due to concerns regarding bias,” notes Dr. Kaunitz.5
“The ACS recommendation for annual screening in women aged 45 to 54 is largely based on the findings of a report showing that, for premenopausal (but not postmenopausal) women, tumor stage was higher and size larger for screen-detected lesions among women undergoing biennial screens."6
As for the recommendation against screening CBE, Dr. Kaunitz considers that “a dramatic change from prior guidance. It is based on the absence of data finding benefits with CBE (alone or with screening mammography). Furthermore, the updated ACS guidance does not change its 2003 guidance, which does not support routine performance of or instruction regarding SBE.”
“These updated ACS guidelines should result in more women starting screening mammograms later in life, and they endorse biennial screening for many women, meaning that patients following ACS guidance will have fewer lifetime screens than with earlier recommendations,” says Dr. Kaunitz.
“Another plus is that performing fewer breast examinations during well-woman visits will allow us more time to assess family history and other risk factors for breast cancer, and to discuss screening recommendations.”
The bottom line
What is one to make of the many viewpoints on screening? For now, it probably is best to adhere to either the new ACS guidelines or current ACOG guidelines (TABLE 2), says OBG Management Editor in Chief Robert L. Barbieri, MD. He is chief of the Department of Obstetrics and Gynecology at Brigham and Women’s Hospital in Boston, and Kate Macy Ladd Professor of Obstetrics, Gynecology, and Reproductive Biology at Harvard Medical School.
TABLE 2 What are ACOG’s current recommendations?
|
ACOG recommends screening mammography every year for women starting at age 40. ACOG also states that “breast self-awareness has the potential to detect palpable breast cancer and can be recommended”; it also recommends CBE every year for women aged 19 or older.
These recommendations may change early next year, after ACOG convenes a consensus conference on the subject. The aim: “To develop a consistent set of uniform guidelines for breast cancer screening that can be implemented nationwide. Major organizations and providers of women’s health care, including ACS, will gather to evaluate and interpret the data in greater detail.”2
Share your thoughts! Send your Letter to the Editor to rbarbieri@frontlinemedcom.com. Please include your name and the city and state in which you practice.
- Oeffinger KC, Fontham ET, Etzioni R, et al. Breast cancer screening for women at average risk. 2015 guideline update from the American Cancer Society. JAMA. 2015;314(15):1599–1614.
- American College of Obstetricians and Gynecologists. ACOG Statement on Revised American Cancer Society Recommendations on Breast Cancer Screening. http://www.acog.org/About-ACOG/News-Room/Statements/2015/ACOG-Statement-on-Recommendations-on-Breast-Cancer-Screening. Published October 20, 2015. Accessed October 20, 2015.
- US Preventive Services Task Force. Email communication, USPSTF Newsroom, October 20, 2015.
- American College of Radiology. News Release: ACR and SBI Continue to Recommend Regular Mammography Starting at Age 40. http://www.acr.org/About-Us/Media-Center/Press-Releases/2015-Press-Releases/20151020-ACR-SBI-Recommend-Mammography-at-Age-40. Published October 20, 2015. Accessed October 21, 2015.
- Kerlikowske K. Progress toward consensus on breast cancer screening guidelines and reducing screening harms [published online ahead of print October 20, 2015]. JAMA Intern Med. doi:10.1001/jamainternmed.2015.6466.
- Miglioretti DL, Zhu W, Kerlikowske K, et al; Breast Cancer Surveillance Consortium. Breast tumor prognostic characteristics and biennial vs annual mammography, age, and menopausal status [published online ahead of print October 20, 2015]. JAMA. doi:10.1001/jamaoncol.2015.3084.
Price Display Systematic Review
Rising healthcare spending has garnered significant public attention, and is considered a threat to other national priorities. Up to one‐third of national health expenditures are wasteful, the largest fraction generated through unnecessary services that could be substituted for less‐costly alternatives or omitted altogether.[1] Physicians play a central role in health spending, as they purchase nearly all tests and therapies on behalf of patients.
One strategy to enhance cost‐conscious physician ordering is to increase transparency of cost data for providers.[2, 3, 4] Although physicians consider price an important factor in ordering decisions, they have difficulty estimating costs accurately or finding price information easily.[5, 6] Improving physicians' knowledge of order costs may prompt them to forego diagnostic tests or therapies of low utility, or shift ordering to lower‐cost alternatives. Real‐time price display during provider order entry is 1 approach for achieving this goal. Modern electronic health records (EHRs) with computerized physician order entry (CPOE) make price display not only practical but also scalable. Integrating price display into clinical workflow, however, can be challenging, and there remains lack of clarity about potential risks and benefits. The dissemination of real‐time CPOE price display, therefore, requires an understanding of its impact on clinical care.
Over the past 3 decades, several studies in the medical literature have evaluated the effect of price display on physician ordering behavior. To date, however, there has been only 1 narrative review of this literature, which did not include several recent studies on the topic or formally address study quality and physician acceptance of price display modules.[7] Therefore, to help inform healthcare leaders, technology innovators, and policy makers, we conducted a systematic review to address 4 key questions: (1) What are the characteristics of interventions that have displayed order prices to physicians in the context of actual practice? (2) To what degree does real‐time display of order prices impact order costs and order volume? (3) Does price display impact patient safety outcomes, and is it acceptable to providers? (4) What is the quality of the current literature on this topic?
METHODS
Data Sources
We searched 2 electronic databases, MEDLINE and Embase, using a combination of controlled vocabulary terms and keywords that covered both the targeted intervention (eg, fees and charges) and the outcome of interest (eg, physician's practice patterns), limited to English language articles with no restriction on country or year of publication (see Supporting Information, Appendix 1, in the online version of this article). The search was run through August 2014. Results from both database searches were combined and duplicates eliminated. We also ran a MEDLINE keyword search on titles and abstracts of articles from 2014 that were not yet indexed. A medical librarian was involved in all aspects of the search process.[8]
Study Selection
Studies were included if they evaluated the effect of displaying actual order prices to providers during the ordering process and reported the impact on provider ordering practices. Reports in any clinical context and with any study design were included. To assess most accurately the effect of price display on real‐life ordering and patient outcomes, studies were excluded if: (1) they were review articles, commentaries, or editorials; (2) they did not show order prices to providers; (3) the context was a simulation; (4) the prices displayed were relative (eg, $/$$/$$$) or were only cumulative; (5) prices were not presented real‐time during the ordering process; or (6) the primary outcome was neither order costs nor order volume. We decided a priori to exclude simulations because these may not accurately reflect provider behavior when treating real patients, and to exclude studies showing relative prices due to concerns that it is a less significant price transparency intervention and that providers may interpret relative prices differently from actual prices.
Two reviewers, both physicians and health service researchers (M.T.S. and T.R.B.), separately reviewed the full list of titles and abstracts. For studies that potentially met inclusion criteria, full articles were obtained and were independently read for inclusion in the final review. The references of all included studies were searched manually, and the Scopus database was used to search all studies that cited the included studies. We also searched the references of relevant literature reviews.[9, 10, 11] Articles of interest discovered through manual search were then subjected to the same process.
Data Extraction and Quality Assessment
Two reviewers (M.T.S. and T.R.B.) independently performed data extraction using a standardized spreadsheet. Discrepancies were resolved by reviewer consensus. Extracted study characteristics included study design and duration, clinical setting, study size, type of orders involved, characteristics of price display intervention and control, and type of outcome. Findings regarding patient safety and provider acceptability were also extracted when available.
Study quality was independently evaluated and scored by both reviewers using the Downs and Black checklist, designed to assess quality of both randomized and nonrandomized studies.[12] The checklist contains 5 items pertaining to allocation concealment, blinding, or follow‐up that are not applicable to an administrative intervention like price display, so these questions were excluded. Additionally, few studies calculated sample size or reported post hoc statistical power, so we also excluded this question, leaving a modified 21‐item checklist. We also assessed each study for sources of bias that were not already assessed by the Downs and Black checklist, including contamination between study groups, confounding of results, and incomplete intervention or data collection.
Data Synthesis
Data are reported in tabular form for all included studies. Due to heterogeneity of study designs and outcome measures, data from the studies were not pooled quantitatively. This review is reported according to the Preferred Reporting Items for Systematic Reviews and Meta‐Analysis guidelines.
RESULTS
Database searches yielded a total of 1400 articles, of which 18 were selected on the basis of title and abstract for detailed assessment. Reference searching led us to retrieve 94 further studies of possible interest, of which 23 were selected on the basis of abstract for detailed assessment. Thus, 41 publications underwent full manuscript review, 19 of which met all inclusion criteria (see Supporting Information, Appendix 2, in the online version of this article).[13, 14, 15, 16, 17, 18, 19, 20, 21, 22, 23, 24, 25, 26, 27, 28, 29, 30, 31] These studies were published between 1983 and 2014, and were conducted primarily in the United States.
Study Characteristics
There was considerable heterogeneity among the 19 studies with regard to design, setting, and scope (Table 1). There were 5 randomized trials, for which the units of randomization were patient (1), provider team (2), and test (2). There were 13 pre‐post intervention studies, 5 of which used a concomitant control group, and 2 of which included a washout period. There was 1 interrupted time series study. Studies were conducted within inpatient hospital floors (8), outpatient clinics (4), emergency departments (ED) or urgent care facilities (4), and hospital operating rooms (3).
| Study | Design | Clinical Setting | Providers | Intervention and Duration | Order(s) Studied | Type of Price Displayed | Concurrent Interventions |
|---|---|---|---|---|---|---|---|
| |||||||
| Fang et al.[14] 2014 | Pre‐post study with control group | Academic hospital (USA) | All inpatient ordering providers | CPOE system with prices displayed for reference lab tests; 8 months | All send‐out lab tests | Charge from send‐out laboratory, displayed as range (eg, $100300) | Display also contained expected lab turnaround time |
| Nougon et al.[13] 2014 | Pre‐post study with washout | Academic adult emergency department (Belgium) | 9 ED house staff | CPOE system with prices displayed on common orders form, and price list displayed above all workstations and in patient rooms; 2 months | Common lab and imaging tests | Reference costs from Belgian National Institute for Health Insurance and Invalidity | None |
| Durand et al.[17] 2013 | RCT (randomized by test) | Academic hospital, all inpatients (USA) | All inpatient ordering providers | CPOE system with prices displayed; 6 months | 10 common imaging tests | Medicare allowable fee | None |
| Feldman et al.[16] 2013 | RCT (randomized by test) | Academic hospital, all inpatients (USA) | All inpatient ordering providers | CPOE system with prices displayed; 6 months | 61 lab tests | Medicare allowable fee | None |
| Horn et al.[15] 2014 | Interrupted time series study with control group | Private outpatient group practice alliance (USA) | 215 primary care physicians | CPOE system with prices displayed; 6 months | 27 lab tests | Medicare allowable fee, displayed as narrow range (eg, $5$10) | None |
| Ellemdin et al.[18] 2011 | Pre‐post study with control group | Academic hospital, internal medicine units (South Africa) | Internal medicine physicians (number NR) | Sheet with lab test costs given to intervention group physicians who were required to write out cost for each order; 4 months | Common lab tests | Not reported | None |
| Schilling,[19] 2010 | Pre‐post study with control group | Academic adult emergency department (Sweden) | All internal medicine physicians in ED | Standard provider workstations with price lists posted on each; 2 months | 91 common lab tests, 39 common imaging tests | Not reported | None |
| Guterman et al.[21] 2002 | Pre‐post study | Academic‐affiliated urgent care clinic (USA) | 51 attendings and housestaff | Preformatted paper prescription form with medication prices displayed; 2 weeks | 2 H2‐blocker medications | Acquisition cost of medication plus fill fee | None |
| Seguin et al.[20] 2002 | Pre‐post study | Academic surgical intensive care unit (France) | All intensive care unit physicians | Paper quick‐order checklist with prices displayed; 2 months | 6 common lab tests, 1 imaging test | Not reported | None |
| Hampers et al.[23] 1999 | Pre‐post study with washout | Academic pediatric emergency department (USA) | Pediatric ED attendings and housestaff (number NR) | Paper common‐order checklist with prices displayed; 3 months | 22 common lab and imaging tests | Chargemaster price* | Physicians required to calculate total charges for diagnostic workup |
| Ornstein et al.[22] 1999 | Pre‐post study | Academic family medicine outpatient clinic (USA) | 46 attendings and housestaff | Microcomputer CPOE system with medication prices displayed; 6 months | All medications | AWP for total supply (acute medications) or 30‐day supply (chronic medications) | Additional keystroke produced list of less costly alternative medications |
| Lin et al.[25] 1998 | Pre‐post study | Academic hospital operating rooms (USA) | All anesthesia providers | Standard muscle relaxant drug vials with price stickers displayed; 12 months | All muscle relaxant medications | Not reported | None |
| McNitt et al.[24] 1998 | Pre‐post study | Academic hospital operating rooms (USA) | 90 anesthesia attendings, housestaff and anesthetists | List of drug costs displayed in operating rooms, anesthesia lounge, and anesthesia satellite pharmacy; 10 months | 22 common anesthesia medications | Hospital acquisition cost | Regular anesthesia department reviews of drug usage and cost |
| Bates et al.[27] 1997 | RCT (randomized by patient) | Academic hospital, medical and surgical inpatients (USA) | All inpatient ordering providers | CPOE system with display of test price and running total of prices for the ordering session; 4 months (lab) and 7 months (imaging) | All lab tests, 35 common imaging tests | Chargemaster price | None |
| Vedsted et al.[26] 1997 | Pre‐post study with control group | Outpatient general practices (Denmark) | 231 general practitioners | In practices already using APEX CPOE system, introduction of medication price display (control practices used non‐APEX computer system or paper‐based prescribing); 12 months | All medications | Chargemaster price | Medication price comparison module (stars indicated availability of cheaper option) |
| Horrow et al.[28] 1994 | Pre‐post study | Private tertiary care hospital operating rooms (USA) | 56 anesthesia attendings, housestaff and anesthetists | Standard anesthesia drug vials and syringes with supermarket price stickers displayed; 3 months | 13 neuromuscular relaxant and sedative‐hypnotic medications | Hospital acquisition cost | None |
| Tierney et al.[29] 1993 | Cluster RCT (randomized by provider team) | Public hospital, internal medicine services (USA) | 68 teams of internal medicine attendings and housestaff | Microcomputer CPOE system with prices displayed (control group used written order sheets); 17 months | All orders | Chargemaster price | CPOE system listed cost‐effective tests for common problems and displayed reasonable test intervals |
| Tierney et al.[30] 1990 | Cluster RCT (randomized by clinic session) | Academic, outpatient, general medicine practice (USA) | 121 internal medicine attendings and housestaff | Microcomputer CPOE system with pop‐up window displaying price for current test and running total of cumulative test prices for current visit; 6 months | All lab and imaging tests | Chargemaster price | None |
| Everett et al.[31] 1983 | Pre‐post study with control group | Academic hospital, general internal medicine wards (USA) | Internal medicine attendings and housestaff (number NR) | Written order sheet with adjacent sheet of lab test prices; 3 months | Common lab tests | Chargemaster price | None |
Prices were displayed for laboratory tests (12 studies), imaging tests (8 studies), and medications (7 studies). Study scope ranged from examining a single medication class to evaluating all inpatient orders. The type of price used for the display varied, with the most common being the facility charges or chargemaster prices (6 studies), and Medicare prices (3 studies). In several cases, price display was only 1 component of the study, and 6 studies introduced additional interventions concurrent with price display, such as cost‐effective ordering menus,[29] medication comparison modules,[26] or display of test turnaround times.[14] Seven of the 19 studies were conducted in the past decade, of which 5 displayed prices within an EHR.[13, 14, 15, 16, 17]
Order Costs and Volume
Thirteen studies reported the numeric impact of price display on aggregate order costs (Table 2). Nine of these demonstrated a statistically significant (P 0.05) decrease in order costs, with effect sizes ranging from 10.7% to 62.8%.[13, 16, 18, 20, 23, 24, 28, 29, 30] Decreases were found for lab costs, imaging costs, and medication costs, and were observed in both the inpatient and outpatient settings. Three of these 9 studies were randomized. For example, in 1 study randomizing 61 lab tests to price display or no price display, costs for the intervention labs dropped 9.6% compared to the year prior, whereas costs for control labs increased 2.9% (P 0.001).[16] Two studies randomized by provider group showed that providers seeing order prices accrued 12.7% fewer charges per inpatient admission (P = 0.02) and 12.9% fewer test charges per outpatient visit (P 0.05).[29, 30] Three studies found no significant association between price display and order costs, with effect sizes ranging from a decrease of 18.8% to an increase of 4.3%.[19, 22, 27] These studies also evaluated lab, imaging, and medication costs, and included 1 randomized trial. One additional large study noted a 12.5% decrease in medication costs after initiation of price display, but did not statistically evaluate this difference.[25]
| Study | No. of Encounters | Primary Outcome Measure(s) | Impact on Order Costs | Impact on Order Volume | ||||
|---|---|---|---|---|---|---|---|---|
| Control Group Outcome | Intervention Group Outcome | Relative Change | Control Group Outcome | Intervention Group Outcome | Relative Change | |||
| ||||||||
| Fang et al.[14] 2014 | 378,890 patient‐days | Reference lab orders per 1000 patient‐days | NR | NR | NA | 51 orders/1000 patient‐days | 38 orders/1000 patient‐days | 25.5% orders/1000 patient‐days (P 0.001) |
| Nougon et al.[13] 2015 | 2422 ED visits (excluding washout) | Lab and imaging test costs per ED visit | 7.1/visit (lab); 21.8/visit (imaging) | 6.4/visit (lab); 14.4/visit (imaging) | 10.7% lab costs/ visit (P = 0.02); 33.7% imaging costs/visit (P 0.001) | NR | NR | NA |
| Durand et al.[17] 2013 | NR | Imaging orders compared to baseline 1 year prior | NR | NR | NA | 3.0% total orders | +2.8% total orders | +5.8% total orders (P = 0.10) |
| Feldman et al.[16] 2013 | 245,758 patient‐days | Lab orders and fees per patient‐day compared to baseline 1 year prior | +2.9% fees/ patient‐day | 9.6% fees/ patient‐day | 12.5% fees/patient‐day (P 0.001) | +5.6% orders/patient‐day | 8.6% orders/ patient‐day | 14.2% orders/patient‐day (P 0.001) |
| Horn et al.[15] 2014 | NR | Lab test volume per patient visit, by individual lab test | NR | NR | NA | Aggregate data not reported | Aggregate data not reported | 5 of 27 tests had significant reduction in ordering (2.1% to 15.2%/patient visit) |
| Ellemdin et al.[18] 2011 | 897 admissions | Lab cost per hospital day | R442.90/day | R284.14/day | 35.8% lab costs/patient‐day (P = 0.001) | NR | NR | NA |
| Schilling[19] 2010 | 3222 ED visits | Combined lab and imaging test costs per ED visit | 108/visit | 88/visit | 18.8% test costs/visit (P = 0.07) | NR | NR | NA |
| Guterman et al.[21] 2002 | 168 urgent care visits | Percent of acid reducer prescriptions for ranitidine (the higher‐cost option) | NR | NR | NA | 49% ranitidine | 21% ranitidine | 57.1% ranitidine (P = 0.007) |
| Seguin et al.[20] 2002 | 287 SICU admissions | Tests ordered per admission; test costs per admission | 341/admission | 266/admission | 22.0% test costs/admission (P 0.05) | 13.6 tests/admission | 11.1 tests/ admission | 18.4% tests/admission (P = 0.12) |
| Hampers et al.[23] 1999 | 4881 ED visits (excluding washout) | Adjusted mean test charges per patient visit | $86.79/visit | $63.74/visit | 26.6% test charges/visit (P 0.01) | NR | NR | NA |
| Ornstein et al.[22] 1999 | 30,461 outpatient visits | Prescriptions per visit; prescription cost per visit; cost per prescription | $12.49/visit; $21.83/ prescription | $13.03/visit; $22.03/prescription |
+4.3% prescription costs/visit (P = 0.12); +0.9% cost/prescription (P = 0.61) |
0.66 prescriptions/visit | 0.64 prescriptions/ visit | 3.0% prescriptions/visit (P value not reported) |
| Lin et al.[25] 1998 | 40,747 surgical cases | Annual spending on muscle relaxants medication |
$378,234/year (20,389 cases) |
$330,923/year (20,358 cases) |
12.5% | NR | NR | NA |
| McNitt et al.[24] 1998 | 15,130 surgical cases | Anesthesia drug cost per case | $51.02/case | $18.99/case | 62.8% drug costs/case (P 0.05) | NR | NR | NA |
| Bates et al.[27] 1997 | 7090 admissions (lab); 17,381 admissions (imaging) | Tests ordered per admission; charges for tests ordered per admission |
$771/ admission (lab); $276/admission (imaging) |
$739/admission (lab); $275/admission (imaging) |
4.2% lab charges/admission (P = 0.97); 0.4% imaging charges/admission (P = 0.10) |
26.8 lab tests/admission; 1.76 imaging tests/admission |
25.6 lab tests/ admission; 1.76 imaging tests/ admission |
4.5% lab tests/admission (P = 0.74); 0% imaging tests/admission (P = 0.13) |
| Vedsted et al.[26] 1997 | NR | Prescribed daily doses per 1000 insured; total drug reimbursement per 1000 insured; reimbursement per daily dose | Reported graphically only | Reported graphically only | No difference | Reported graphically only | Reported graphically only | No difference |
| Horrow et al.[28] 1994 | NR | Anesthetic drugs used per week; anesthetic drug cost per week | $3837/week | $3179/week | 17.1% drug costs/week (P = 0.04) | 97 drugs/week | 94 drugs/week | 3.1% drugs/week (P = 0.56) |
| Tierney et al.[29] 1993 | 5219 admissions | Total charges per admission | $6964/admission | $6077/admission | 12.7% total charges/admission (P = 0.02) | NR | NR | NA |
| Tierney et al.[30] 1990 | 15,257 outpatient visits | Test orders per outpatient visit; test charges per outpatient visit | $51.81/visit | $45.13/visit | 12.9% test charges/visit (P 0.05) | 1.82 tests/visit | 1.56 tests/visit | 14.3% tests/visit (P 0.005) |
| Everett et al.[31] 1983 | NR | Lab tests per admission; charges per admission | NR | NR | NA | NR | NR | No statistically significant changes |
Eight studies reported the numeric impact of price display on aggregate order volume. Three of these demonstrated a statistically significant decrease in order volume, with effect sizes ranging from 14.2% to 25.5%.[14, 16, 30] Decreases were found for lab and imaging tests, and were observed in both inpatient and outpatient settings. For example, 1 pre‐post study displaying prices for inpatient send‐out lab tests demonstrated a 25.5% reduction in send‐out labs per 1000 patient‐days (P 0.001), whereas there was no change for the control group in‐house lab tests, for which prices were not shown.[14] The other 5 studies reported no significant association between price display and order volume, with effect sizes ranging from a decrease of 18.4% to an increase of 5.8%.[17, 20, 22, 27, 28] These studies evaluated lab, imaging, and medication volume. One trial randomizing by individual inpatient showed a nonsignificant decrease of 4.5% in lab orders per admission in the intervention group (P = 0.74), although the authors noted that their study had insufficient power to detect differences less than 10%.[27] Of note, 2 of the 5 studies reporting nonsignificant impacts on order volume (3.1%, P = 0.56; and 18.4%, P = 0.12) did demonstrate significant decreases in order costs (17.1%, P = 0.04; and 22.0%, P 0.05).[20, 28]
There were an additional 2 studies that reported the impact of price display on order volume for individual orders only. In 1 time‐series study showing lab test prices, there was a statistically significant decrease in order volume for 5 of 27 individual tests studied (using a Bonferroni‐adjusted threshold of significance), with no tests showing a significant increase.[15] In 1 pre‐post study showing prices for H2‐antagonist drugs, there was a statistically significant 57.1% decrease in order volume for the high‐cost medication, with a corresponding 58.7% increase in the low‐cost option.[21] These studies did not report impact on aggregate order costs. Two further studies in this review did not report outcomes numerically, but did state in their articles that significant impacts on order volume were not observed.[26, 31]
Therefore, of the 19 studies included in this review, 17 reported numeric results. Of these 17 studies, 12 showed that price display was associated with statistically significant decreases in either order costs or volume, either in aggregate (10 studies; Figure 1) or for individual orders (2 studies). Of the 7 studies conducted within the past decade, 5 noted significant decreases in order costs or volume. Prices were embedded into an EHR in 5 of these recent studies, and 4 of the 5 observed significant decreases in order costs or volume. Only 2 studies from the past decade1 from Belgium and 1 from the United Statesincorporated prices into an EHR and reported aggregate order costs. Both found statistically significant decreases in order costs with price display.[13, 16]
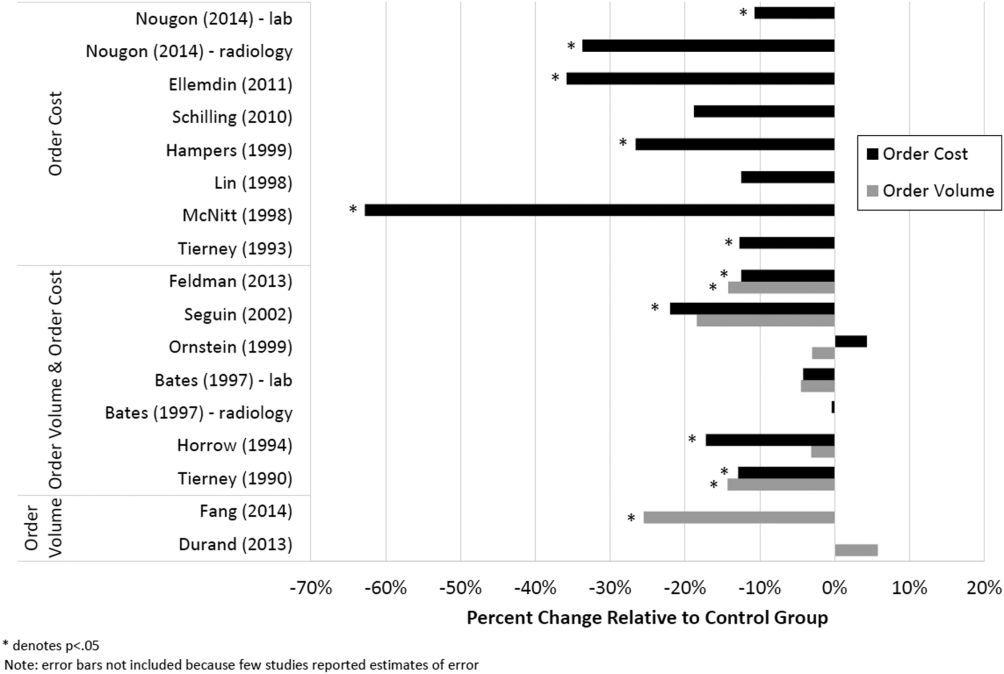
Patient Safety and Provider Acceptability
Five studies reported patient‐safety outcomes. One inpatient randomized trial showed similar rates of postdischarge utilization and charges between the intervention and control groups.[29] An outpatient randomized trial showed similar rates of hospital admissions, ED visits, and outpatient visits between the intervention and control groups.[30] Two pre‐post studies showing anesthesia prices in hospital operating rooms included a quality assurance review and showed no changes in adverse outcomes such as prolonged postoperative intubation, recovery room stay, or unplanned intensive care unit admissions.[24, 25] The only adverse safety finding was in a pre‐post study in a pediatric ED, which showed a higher rate of unscheduled follow‐up care during the intervention period compared to the control period (24.4% vs 17.8%, P 0.01) but similar rates of patients feeling better (83.4% vs 86.7%, P = 0.05). These findings, however, were based on self‐report during telephone follow‐up with a 47% response rate.[23]
Five studies reported on provider acceptability of price display. Two conducted questionnaires as part of the study plan, whereas the other 3 offered general provider feedback. One questionnaire revealed that 83% of practices were satisfied or very satisfied with the price display.[26] The other questionnaire found that 81% of physicians felt the price display improved my knowledge of the relative costs of tests I order and similarly 81% would like additional cost information displayed for other orders.[15] Three studies reported subjectively that showing prices initially caused questions from most physicians,[13] but that ultimately, physicians like seeing this information[27] and gave feedback that was generally positive.[21] One study evaluated the impact of price display on provider cost knowledge. Providers in the intervention group did not improve in their cost‐awareness, with average errors in cost estimates exceeding 40% even after 6 months of price display.[30]
Study Quality
Using a modified Downs and Black checklist of 21 items, studies in this review ranged in scores from 5 to 20, with a median score of 15. Studies most frequently lost points for being nonrandomized, failing to describe or adjust for potential confounders, being prone to historical confounding, or not evaluating potential adverse events.
We supplemented this modified Downs and Black checklist by reviewing 3 categories of study limitations not well‐reflected in the checklist scoring (Table 3). The first was potential for contamination between study groups, which was a concern in 4 studies. For example, 1 pre‐post study assessing medication ordering included clinical pharmacists in patient encounters both before and after the price display intervention.[22] This may have enhanced cost‐awareness even before prices were shown. The second set of limitations, present in 12 studies, included confounders that were not addressed by study design or analysis. For example, the intervention in 1 study displayed not just test cost but also test turnaround time, which may have separately influenced providers against ordering a particular test.[14] The third set of limitations included unanticipated gaps in the display of prices or in the collection of ordering data, which occurred in 5 studies. If studies did not report on gaps in the intervention or data collection, we assumed there were none.
| Study | Modified Downs & Black Score (Max Score 21) | Other Price Display Quality Criteria (Not Included in Downs & Black Score) | ||
|---|---|---|---|---|
| Potential for Contamination Between Study Groups | Potential Confounders of Results Not Addressed by Study Design or Analysis | Incomplete Price Display Intervention or Data Collection | ||
| ||||
| Fang et al.[14] 2014 | 14 | None | Concurrent display of test turnaround time may have independently contributed to decreased test ordering | 21% of reference lab orders were excluded from analysis because no price or turnaround‐time data were available |
| Nougon et al.[13] 2015 | 16 | None | Historical confounding may have existed due to pre‐post study design without control group | None |
| Durand et al.[17] 2013 | 17 | Providers seeing test prices for intervention tests (including lab tests in concurrent Feldman study) may have remained cost‐conscious when placing orders for control tests | Interference between units likely occurred because intervention test ordering (eg, chest x‐ray) was not independent of control test ordering (eg, CT chest) | None |
| Feldman et al.[16] 2013 | 18 | Providers seeing test prices for intervention tests (including imaging tests in concurrent Durand study) may have remained cost‐conscious when placing orders for control tests | Interference between units likely occurred because intervention test ordering (eg, CMP) was not independent of control test ordering (eg, BMP) | None |
| Horn et al.[15] 2014 | 15 | None | None | None |
| Ellemdin et al.[18] 2011 | 15 | None | None | None |
| Schilling[19] 2010 | 12 | None | None | None |
| Guterman et al.[21] 2002 | 14 | None | Historical confounding may have existed due to pre‐post study design without control group | None |
| Seguin et al.[20] 2002 | 17 | None | Because primary outcome was not adjusted for length of stay, the 30% shorter average length of stay during intervention period may have contributed to decreased costs per admission; historical confounding may have existed due to pre‐post study design without control group | None |
| Hampers et al.[23] 1999 | 17 | None | Requirement that physicians calculate total charges for each visit may have independently contributed to decreased test ordering; historical confounding may have existed due to pre‐post study design without control group | 10% of eligible patient visits were excluded from analysis because prices were not displayed or ordering data were not collected |
| Ornstein et al.[22] 1999 | 15 | Clinical pharmacists and pharmacy students involved in half of all patient contacts may have enhanced cost‐awareness during control period | Emergence of new drugs during intervention period and an ongoing quality improvement activity to increase prescribing of lipid‐lowering medications may have contributed to increased medication costs; historical confounding may have existed due to pre‐post study design without control group | 25% of prescription orders had no price displayed, and average prices were imputed for purposes of analysis |
| Lin et al.[25] 1998 | 12 | None | Emergence of new drug during intervention period and changes in several drug prices may have contributed to decreased order costs; historical confounding may have existed due to pre‐post study design without control group | None |
| McNitt et al.[24] 1998 | 15 | None | Intensive drug‐utilization review and cost‐reduction efforts may have independently contributed to decreased drug costs; historical confounding may have existed due to pre‐post study design without control group | None |
| Bates et al.[27] 1997 | 18 | Providers seeing test prices on intervention patients may have remembered prices or remained cost‐conscious when placing orders for control patients | None | 47% of lab tests and 26% of imaging tests were ordered manually outside of the trial's CPOE display system* |
| Vedsted et al.[26] 1997 | 5 | None | Medication price comparison module may have independently influenced physician ordering | None |
| Horrow et al.[28] 1994 | 14 | None | Historical confounding may have existed due to pre‐post study design without control group | Ordering data for 2 medications during 2 of 24 weeks were excluded from analysis due to internal inconsistency in the data |
| Tierney et al.[29] 1993 | 20 | None | Introduction of computerized order entry and menus for cost‐effective ordering may have independently contributed to decreased test ordering | None |
| Tierney et al.[30] 1990 | 20 | None | None | None |
| Everett et al.[31] 1983 | 7 | None | None | None |
Even among the 5 randomized trials there were substantial limitations. For example, 2 trials used individual tests as the unit of randomization, although ordering patterns for these tests are not independent of each other (eg, ordering rates for comprehensive metabolic panels are not independent of ordering rates for basic metabolic panels).[16, 17] This creates interference between units that was not accounted for in the analysis.[32] A third trial was randomized at the level of the patient, so was subject to contamination as providers seeing the price display for intervention group patients may have remained cost‐conscious while placing orders for control group patients.[27] In a fourth trial, the measured impact of the price display may have been confounded by other aspects of the overall cost intervention, which included cost‐effective test menus and suggestions for reasonable testing intervals.[29]
The highest‐quality study was a cluster‐randomized trial published in 1990 specifically measuring the effect of price display on a wide range of orders.[30] Providers and patients were separated by clinic session so as to avoid contamination between groups, and the trial included more than 15,000 outpatient visits. The intervention group providers ordered 14.3% fewer tests than control group providers, which resulted in 12.9% lower charges.
DISCUSSION
We identified 19 published reports of interventions that displayed real‐time order prices to providers and evaluated the impact on provider ordering. There was substantial heterogeneity in study setting, design, and quality. Although there is insufficient evidence on which to base strong conclusions, these studies collectively suggest that provider price display likely reduces order costs to a modest degree. Data on patient safety were largely lacking, although in the few studies that examined patient outcomes, there was little evidence that patient safety was adversely affected by the intervention. Providers widely viewed display of prices positively.
Our findings align with those of a recent systematic review that concluded that real‐time price information changed provider ordering in the majority of studies.[7] Whereas that review evaluated 17 studies from both clinical settings and simulations, our review focused exclusively on studies conducted in actual ordering environments. Additionally, our literature search yielded 8 studies not previously reviewed. We believe that the alignment of our findings with the prior review, despite the differences in studies included, adds validity to the conclusion that price display likely has a modest impact on reducing order costs. Our review contains several additions important for those considering price display interventions. We provide detailed information on study settings and intervention characteristics. We present a formal assessment of study quality to evaluate the strength of individual study findings and to guide future research in this area. Finally, because both patient safety and provider acceptability may be a concern when prices are shown, we describe all safety outcomes and provider feedback that these studies reported.
The largest effect sizes were noted in 5 studies reporting decreases in order volume or costs greater than 25%.[13, 14, 18, 23, 24] These were all pre‐post intervention studies, so the effect sizes may have been exaggerated by historical confounding. However, the 2 studies with concurrent control groups found no decreases in order volume or cost in the control group.[14, 18] Among the 5 studies that did not find a significant association between price display and provider ordering, 3 were subject to contamination between study groups,[17, 22, 27] 1 was underpowered,[19] and 1 noted a substantial effect size but did not perform a statistical analysis.[25] We also found that order costs were more frequently reduced than order volume, likely because shifts in ordering to less expensive alternatives may cause costs to decrease while volume remains unchanged.[20, 28]
If price display reduces order costs, as the majority of studies in this review indicate, this finding carries broad implications. Policy makers could promote cost‐conscious care by creating incentives for widespread adoption of price display. Hospital and health system leaders could improve transparency and reduce expenses by prioritizing price display. The specific beneficiaries of any reduced spending would depend on payment structures. With shifts toward financial risk‐bearing arrangements like accountable care organizations, healthcare institutions may have a financial interest in adopting price display. Because price display is an administrative intervention that can be developed within EHRs, it is potentially 1 of the most rapidly scalable strategies for reducing healthcare spending. Even modest reductions in spending on laboratory tests, imaging studies, and medications would result in substantial savings on a system‐wide basis.
Implementing price display does not come without challenges. Prices need to be calculated or obtained, loaded into an EHR system, and updated periodically. Technology innovators could enhance EHR software by making these processes easier. Healthcare institutions may find displaying relative prices (eg, $/$$/$$$) logistically simpler in some contexts than showing actual prices (eg, purchase cost), such as when contracts require prices to be confidential. Although we decided to exclude studies displaying relative prices, our search identified no studies that met other inclusion criteria but displayed relative prices, suggesting a lack of evidence regarding the impact of relative price display as an alternative to actual price display.
There are 4 key limitations to our review. First, the heterogeneity of the study designs and reported outcomes precluded pooling of data. The variety of clinical settings and mechanisms through which prices were displayed enhances the generalizability of our findings, but makes it difficult to identify particular contexts (eg, type of price or type of order) in which the intervention may be most effective. Second, although the presence of negative studies on this subject reduces the concern for reporting bias, it remains possible that sites willing to implement and study price displays may be inherently more sensitive to prices, such that published results might be more pronounced than if the intervention were widely implemented across multiple sites. Third, the mixed study quality limits the strength of conclusions that can be drawn. Several studies with both positive and negative findings had issues of bias, contamination, or confounding that make it difficult to be confident of the direction or magnitude of the main findings. Studies evaluating price display are challenging to conduct without these limitations, and that was apparent in our review. Finally, because over half of the studies were conducted over 15 years ago, it may limit their generalizability to modern ordering environments.
We believe there remains a need for high‐quality evidence on this subject within a contemporary context to confirm these findings. The optimal methodology for evaluating this intervention is a cluster randomized trial by facility or provider group, similar to that reported by Tierney et al. in 1990, with a primary outcome of aggregate order costs.[30] Given the substantial investment this would require, a large time series study could also be informative. As most prior price display interventions have been under 6 months in duration, it would be useful to know if the impact on order costs is sustained over a longer time period. The concurrent introduction of any EHR alerts that could impact ordering (eg, duplicate test warnings) should be simultaneously measured and reported. Studies also need to determine the impact of price display alone compared to price comparison displays (displaying prices for the selected order along with reasonable alternatives). Although price comparison was a component of the intervention in some of the studies in this review, it was not evaluated relative to price display alone. Furthermore, it would be helpful to know if the type of price displayed affects its impact. For instance, if providers are most sensitive to the absolute magnitude of prices, then displaying chargemaster prices may impact ordering more than showing hospital costs. If, however, relative prices are all that providers need, then showing lower numbers, such as Medicare prices or hospital costs, may be sufficient. Finally, it would be reassuring to have additional evidence that price display does not adversely impact patient outcomes.
Although some details need elucidation, the studies synthesized in this review provide valuable data in the current climate of increased emphasis on price transparency. Although substantial attention has been devoted by the academic community, technology start‐ups, private insurers, and even state legislatures to improving price transparency to patients, less focus has been given to physicians, for whom healthcare prices are often just as opaque.[4] The findings from this review suggest that provider price display may be an effective, safe, and acceptable approach to empower physicians to control healthcare spending.
Disclosures: Dr. Silvestri, Dr. Bongiovanni, and Ms. Glover have nothing to disclose. Dr. Gross reports grants from Johnson & Johnson, Medtronic Inc., and 21st Century Oncology during the conduct of this study. In addition, he received payment from Fair Health Inc. and ASTRO outside the submitted work.
- Institute of Medicine. Best Care at Lower Cost: The Path to Continuously Learning Health Care in America: Washington, DC: National Academies Press; 2012.
- . Do physicians need a “shopping cart” for health care services? JAMA. 2012;307(8):791–792.
- . The disruptive innovation of price transparency in health care. JAMA. 2013;310(18):1927–1928.
- , . Providing price displays for physicians: which price is right? JAMA. 2014;312(16):1631–1632.
- , . Physician awareness of diagnostic and nondrug therapeutic costs: a systematic review. Int J Tech Assess Health Care. 2008;24(2):158–165.
- , , . Physician awareness of drug cost: a systematic review. PLoS Med. 2007;4(9):e283.
- , , , . The effect of charge display on cost of care and physician practice behaviors: a systematic review. J Gen Intern Med. 2015;30:835–842.
- , , . Engaging medical librarians to improve the quality of review articles. JAMA. 2014;312(10):999–1000.
- , , . Influencing behavior of physicians ordering laboratory tests: a literature study. Med Care. 1993;31(9):784–794.
- , . Trials of providing costing information to general practitioners: a systematic review. Med J Aust. 1997;167(2):89–92.
- . A review of physician cost‐containment strategies for laboratory testing. Med Care. 1983;21(8):783–802.
- , . The feasibility of creating a checklist for the assessment of the methodological quality both of randomised and non‐randomised studies of health care interventions. J Epidemiol Community Health. 1998;52(6):377–384.
- , , , et al. Does offering pricing information to resident physicians in the emergency department potentially reduce laboratory and radiology costs? Eur J Emerg Med. 2015;22:247–252.
- , , , et al. Cost and turn‐around time display decreases inpatient ordering of reference laboratory tests: a time series. BMJ Qual Saf. 2014;23:994–1000.
- , , , , . The impact of cost displays on primary care physician laboratory test ordering. J Gen Intern Med. 2014;29:708–714.
- , , , et al. Impact of providing fee data on laboratory test ordering: a controlled clinical trial. JAMA Intern Med. 2013;173(10):903–908.
- , , , . Provider cost transparency alone has no impact on inpatient imaging utilization. J Am Coll Radiol. 2013;10(2):108–113.
- , , . Providing clinicians with information on laboratory test costs leads to reduction in hospital expenditure. S Afr Med J. 2011;101(10):746–748.
- . Cutting costs: the impact of price lists on the cost development at the emergency department. Eur J Emerg Med. 2010;17(6):337–339.
- , , , , . Effects of price information on test ordering in an intensive care unit. Intens Care Med. 2002;28(3):332–335.
- , , , , , . Modifying provider behavior: a low‐tech approach to pharmaceutical ordering. J Gen Intern Med. 2002;17(10):792–796.
- , , , , . Medication cost information in a computer‐based patient record system. Impact on prescribing in a family medicine clinical practice. Arch Fam Med. 1999;8(2):118–121.
- , , , , . The effect of price information on test‐ordering behavior and patient outcomes in a pediatric emergency department. Pediatrics. 1999;103(4 pt 2):877–882.
- , , . Long‐term pharmaceutical cost reduction using a data management system. Anesth Analg. 1998;87(4):837–842.
- , . The impact of price labeling of muscle relaxants on cost consciousness among anesthesiologists. J Clin Anesth. 1998;10(5):401–403.
- , , . Does a computerized price comparison module reduce prescribing costs in general practice? Fam Pract. 1997;14(3):199–203.
- , , , et al. Does the computerized display of charges affect inpatient ancillary test utilization? Arch Intern Med. 1997;157(21):2501–2508.
- , . Price stickers do not alter drug usage. Can J Anaesth. 1994;41(11):1047–1052.
- , , , . Physician inpatient order writing on microcomputer workstations. Effects on resource utilization. JAMA. 1993;269(3):379–383.
- , , . The effect on test ordering of informing physicians of the charges for outpatient diagnostic tests. N Engl J Med. 1990;322(21):1499–1504.
- , , , . Effect of cost education, cost audits, and faculty chart review on the use of laboratory services. Arch Intern Med. 1983;143(5):942–944.
- . Interference between units in randomized experiments. J Am Stat Assoc. 2007;102(477):191–200.
Rising healthcare spending has garnered significant public attention, and is considered a threat to other national priorities. Up to one‐third of national health expenditures are wasteful, the largest fraction generated through unnecessary services that could be substituted for less‐costly alternatives or omitted altogether.[1] Physicians play a central role in health spending, as they purchase nearly all tests and therapies on behalf of patients.
One strategy to enhance cost‐conscious physician ordering is to increase transparency of cost data for providers.[2, 3, 4] Although physicians consider price an important factor in ordering decisions, they have difficulty estimating costs accurately or finding price information easily.[5, 6] Improving physicians' knowledge of order costs may prompt them to forego diagnostic tests or therapies of low utility, or shift ordering to lower‐cost alternatives. Real‐time price display during provider order entry is 1 approach for achieving this goal. Modern electronic health records (EHRs) with computerized physician order entry (CPOE) make price display not only practical but also scalable. Integrating price display into clinical workflow, however, can be challenging, and there remains lack of clarity about potential risks and benefits. The dissemination of real‐time CPOE price display, therefore, requires an understanding of its impact on clinical care.
Over the past 3 decades, several studies in the medical literature have evaluated the effect of price display on physician ordering behavior. To date, however, there has been only 1 narrative review of this literature, which did not include several recent studies on the topic or formally address study quality and physician acceptance of price display modules.[7] Therefore, to help inform healthcare leaders, technology innovators, and policy makers, we conducted a systematic review to address 4 key questions: (1) What are the characteristics of interventions that have displayed order prices to physicians in the context of actual practice? (2) To what degree does real‐time display of order prices impact order costs and order volume? (3) Does price display impact patient safety outcomes, and is it acceptable to providers? (4) What is the quality of the current literature on this topic?
METHODS
Data Sources
We searched 2 electronic databases, MEDLINE and Embase, using a combination of controlled vocabulary terms and keywords that covered both the targeted intervention (eg, fees and charges) and the outcome of interest (eg, physician's practice patterns), limited to English language articles with no restriction on country or year of publication (see Supporting Information, Appendix 1, in the online version of this article). The search was run through August 2014. Results from both database searches were combined and duplicates eliminated. We also ran a MEDLINE keyword search on titles and abstracts of articles from 2014 that were not yet indexed. A medical librarian was involved in all aspects of the search process.[8]
Study Selection
Studies were included if they evaluated the effect of displaying actual order prices to providers during the ordering process and reported the impact on provider ordering practices. Reports in any clinical context and with any study design were included. To assess most accurately the effect of price display on real‐life ordering and patient outcomes, studies were excluded if: (1) they were review articles, commentaries, or editorials; (2) they did not show order prices to providers; (3) the context was a simulation; (4) the prices displayed were relative (eg, $/$$/$$$) or were only cumulative; (5) prices were not presented real‐time during the ordering process; or (6) the primary outcome was neither order costs nor order volume. We decided a priori to exclude simulations because these may not accurately reflect provider behavior when treating real patients, and to exclude studies showing relative prices due to concerns that it is a less significant price transparency intervention and that providers may interpret relative prices differently from actual prices.
Two reviewers, both physicians and health service researchers (M.T.S. and T.R.B.), separately reviewed the full list of titles and abstracts. For studies that potentially met inclusion criteria, full articles were obtained and were independently read for inclusion in the final review. The references of all included studies were searched manually, and the Scopus database was used to search all studies that cited the included studies. We also searched the references of relevant literature reviews.[9, 10, 11] Articles of interest discovered through manual search were then subjected to the same process.
Data Extraction and Quality Assessment
Two reviewers (M.T.S. and T.R.B.) independently performed data extraction using a standardized spreadsheet. Discrepancies were resolved by reviewer consensus. Extracted study characteristics included study design and duration, clinical setting, study size, type of orders involved, characteristics of price display intervention and control, and type of outcome. Findings regarding patient safety and provider acceptability were also extracted when available.
Study quality was independently evaluated and scored by both reviewers using the Downs and Black checklist, designed to assess quality of both randomized and nonrandomized studies.[12] The checklist contains 5 items pertaining to allocation concealment, blinding, or follow‐up that are not applicable to an administrative intervention like price display, so these questions were excluded. Additionally, few studies calculated sample size or reported post hoc statistical power, so we also excluded this question, leaving a modified 21‐item checklist. We also assessed each study for sources of bias that were not already assessed by the Downs and Black checklist, including contamination between study groups, confounding of results, and incomplete intervention or data collection.
Data Synthesis
Data are reported in tabular form for all included studies. Due to heterogeneity of study designs and outcome measures, data from the studies were not pooled quantitatively. This review is reported according to the Preferred Reporting Items for Systematic Reviews and Meta‐Analysis guidelines.
RESULTS
Database searches yielded a total of 1400 articles, of which 18 were selected on the basis of title and abstract for detailed assessment. Reference searching led us to retrieve 94 further studies of possible interest, of which 23 were selected on the basis of abstract for detailed assessment. Thus, 41 publications underwent full manuscript review, 19 of which met all inclusion criteria (see Supporting Information, Appendix 2, in the online version of this article).[13, 14, 15, 16, 17, 18, 19, 20, 21, 22, 23, 24, 25, 26, 27, 28, 29, 30, 31] These studies were published between 1983 and 2014, and were conducted primarily in the United States.
Study Characteristics
There was considerable heterogeneity among the 19 studies with regard to design, setting, and scope (Table 1). There were 5 randomized trials, for which the units of randomization were patient (1), provider team (2), and test (2). There were 13 pre‐post intervention studies, 5 of which used a concomitant control group, and 2 of which included a washout period. There was 1 interrupted time series study. Studies were conducted within inpatient hospital floors (8), outpatient clinics (4), emergency departments (ED) or urgent care facilities (4), and hospital operating rooms (3).
| Study | Design | Clinical Setting | Providers | Intervention and Duration | Order(s) Studied | Type of Price Displayed | Concurrent Interventions |
|---|---|---|---|---|---|---|---|
| |||||||
| Fang et al.[14] 2014 | Pre‐post study with control group | Academic hospital (USA) | All inpatient ordering providers | CPOE system with prices displayed for reference lab tests; 8 months | All send‐out lab tests | Charge from send‐out laboratory, displayed as range (eg, $100300) | Display also contained expected lab turnaround time |
| Nougon et al.[13] 2014 | Pre‐post study with washout | Academic adult emergency department (Belgium) | 9 ED house staff | CPOE system with prices displayed on common orders form, and price list displayed above all workstations and in patient rooms; 2 months | Common lab and imaging tests | Reference costs from Belgian National Institute for Health Insurance and Invalidity | None |
| Durand et al.[17] 2013 | RCT (randomized by test) | Academic hospital, all inpatients (USA) | All inpatient ordering providers | CPOE system with prices displayed; 6 months | 10 common imaging tests | Medicare allowable fee | None |
| Feldman et al.[16] 2013 | RCT (randomized by test) | Academic hospital, all inpatients (USA) | All inpatient ordering providers | CPOE system with prices displayed; 6 months | 61 lab tests | Medicare allowable fee | None |
| Horn et al.[15] 2014 | Interrupted time series study with control group | Private outpatient group practice alliance (USA) | 215 primary care physicians | CPOE system with prices displayed; 6 months | 27 lab tests | Medicare allowable fee, displayed as narrow range (eg, $5$10) | None |
| Ellemdin et al.[18] 2011 | Pre‐post study with control group | Academic hospital, internal medicine units (South Africa) | Internal medicine physicians (number NR) | Sheet with lab test costs given to intervention group physicians who were required to write out cost for each order; 4 months | Common lab tests | Not reported | None |
| Schilling,[19] 2010 | Pre‐post study with control group | Academic adult emergency department (Sweden) | All internal medicine physicians in ED | Standard provider workstations with price lists posted on each; 2 months | 91 common lab tests, 39 common imaging tests | Not reported | None |
| Guterman et al.[21] 2002 | Pre‐post study | Academic‐affiliated urgent care clinic (USA) | 51 attendings and housestaff | Preformatted paper prescription form with medication prices displayed; 2 weeks | 2 H2‐blocker medications | Acquisition cost of medication plus fill fee | None |
| Seguin et al.[20] 2002 | Pre‐post study | Academic surgical intensive care unit (France) | All intensive care unit physicians | Paper quick‐order checklist with prices displayed; 2 months | 6 common lab tests, 1 imaging test | Not reported | None |
| Hampers et al.[23] 1999 | Pre‐post study with washout | Academic pediatric emergency department (USA) | Pediatric ED attendings and housestaff (number NR) | Paper common‐order checklist with prices displayed; 3 months | 22 common lab and imaging tests | Chargemaster price* | Physicians required to calculate total charges for diagnostic workup |
| Ornstein et al.[22] 1999 | Pre‐post study | Academic family medicine outpatient clinic (USA) | 46 attendings and housestaff | Microcomputer CPOE system with medication prices displayed; 6 months | All medications | AWP for total supply (acute medications) or 30‐day supply (chronic medications) | Additional keystroke produced list of less costly alternative medications |
| Lin et al.[25] 1998 | Pre‐post study | Academic hospital operating rooms (USA) | All anesthesia providers | Standard muscle relaxant drug vials with price stickers displayed; 12 months | All muscle relaxant medications | Not reported | None |
| McNitt et al.[24] 1998 | Pre‐post study | Academic hospital operating rooms (USA) | 90 anesthesia attendings, housestaff and anesthetists | List of drug costs displayed in operating rooms, anesthesia lounge, and anesthesia satellite pharmacy; 10 months | 22 common anesthesia medications | Hospital acquisition cost | Regular anesthesia department reviews of drug usage and cost |
| Bates et al.[27] 1997 | RCT (randomized by patient) | Academic hospital, medical and surgical inpatients (USA) | All inpatient ordering providers | CPOE system with display of test price and running total of prices for the ordering session; 4 months (lab) and 7 months (imaging) | All lab tests, 35 common imaging tests | Chargemaster price | None |
| Vedsted et al.[26] 1997 | Pre‐post study with control group | Outpatient general practices (Denmark) | 231 general practitioners | In practices already using APEX CPOE system, introduction of medication price display (control practices used non‐APEX computer system or paper‐based prescribing); 12 months | All medications | Chargemaster price | Medication price comparison module (stars indicated availability of cheaper option) |
| Horrow et al.[28] 1994 | Pre‐post study | Private tertiary care hospital operating rooms (USA) | 56 anesthesia attendings, housestaff and anesthetists | Standard anesthesia drug vials and syringes with supermarket price stickers displayed; 3 months | 13 neuromuscular relaxant and sedative‐hypnotic medications | Hospital acquisition cost | None |
| Tierney et al.[29] 1993 | Cluster RCT (randomized by provider team) | Public hospital, internal medicine services (USA) | 68 teams of internal medicine attendings and housestaff | Microcomputer CPOE system with prices displayed (control group used written order sheets); 17 months | All orders | Chargemaster price | CPOE system listed cost‐effective tests for common problems and displayed reasonable test intervals |
| Tierney et al.[30] 1990 | Cluster RCT (randomized by clinic session) | Academic, outpatient, general medicine practice (USA) | 121 internal medicine attendings and housestaff | Microcomputer CPOE system with pop‐up window displaying price for current test and running total of cumulative test prices for current visit; 6 months | All lab and imaging tests | Chargemaster price | None |
| Everett et al.[31] 1983 | Pre‐post study with control group | Academic hospital, general internal medicine wards (USA) | Internal medicine attendings and housestaff (number NR) | Written order sheet with adjacent sheet of lab test prices; 3 months | Common lab tests | Chargemaster price | None |
Prices were displayed for laboratory tests (12 studies), imaging tests (8 studies), and medications (7 studies). Study scope ranged from examining a single medication class to evaluating all inpatient orders. The type of price used for the display varied, with the most common being the facility charges or chargemaster prices (6 studies), and Medicare prices (3 studies). In several cases, price display was only 1 component of the study, and 6 studies introduced additional interventions concurrent with price display, such as cost‐effective ordering menus,[29] medication comparison modules,[26] or display of test turnaround times.[14] Seven of the 19 studies were conducted in the past decade, of which 5 displayed prices within an EHR.[13, 14, 15, 16, 17]
Order Costs and Volume
Thirteen studies reported the numeric impact of price display on aggregate order costs (Table 2). Nine of these demonstrated a statistically significant (P 0.05) decrease in order costs, with effect sizes ranging from 10.7% to 62.8%.[13, 16, 18, 20, 23, 24, 28, 29, 30] Decreases were found for lab costs, imaging costs, and medication costs, and were observed in both the inpatient and outpatient settings. Three of these 9 studies were randomized. For example, in 1 study randomizing 61 lab tests to price display or no price display, costs for the intervention labs dropped 9.6% compared to the year prior, whereas costs for control labs increased 2.9% (P 0.001).[16] Two studies randomized by provider group showed that providers seeing order prices accrued 12.7% fewer charges per inpatient admission (P = 0.02) and 12.9% fewer test charges per outpatient visit (P 0.05).[29, 30] Three studies found no significant association between price display and order costs, with effect sizes ranging from a decrease of 18.8% to an increase of 4.3%.[19, 22, 27] These studies also evaluated lab, imaging, and medication costs, and included 1 randomized trial. One additional large study noted a 12.5% decrease in medication costs after initiation of price display, but did not statistically evaluate this difference.[25]
| Study | No. of Encounters | Primary Outcome Measure(s) | Impact on Order Costs | Impact on Order Volume | ||||
|---|---|---|---|---|---|---|---|---|
| Control Group Outcome | Intervention Group Outcome | Relative Change | Control Group Outcome | Intervention Group Outcome | Relative Change | |||
| ||||||||
| Fang et al.[14] 2014 | 378,890 patient‐days | Reference lab orders per 1000 patient‐days | NR | NR | NA | 51 orders/1000 patient‐days | 38 orders/1000 patient‐days | 25.5% orders/1000 patient‐days (P 0.001) |
| Nougon et al.[13] 2015 | 2422 ED visits (excluding washout) | Lab and imaging test costs per ED visit | 7.1/visit (lab); 21.8/visit (imaging) | 6.4/visit (lab); 14.4/visit (imaging) | 10.7% lab costs/ visit (P = 0.02); 33.7% imaging costs/visit (P 0.001) | NR | NR | NA |
| Durand et al.[17] 2013 | NR | Imaging orders compared to baseline 1 year prior | NR | NR | NA | 3.0% total orders | +2.8% total orders | +5.8% total orders (P = 0.10) |
| Feldman et al.[16] 2013 | 245,758 patient‐days | Lab orders and fees per patient‐day compared to baseline 1 year prior | +2.9% fees/ patient‐day | 9.6% fees/ patient‐day | 12.5% fees/patient‐day (P 0.001) | +5.6% orders/patient‐day | 8.6% orders/ patient‐day | 14.2% orders/patient‐day (P 0.001) |
| Horn et al.[15] 2014 | NR | Lab test volume per patient visit, by individual lab test | NR | NR | NA | Aggregate data not reported | Aggregate data not reported | 5 of 27 tests had significant reduction in ordering (2.1% to 15.2%/patient visit) |
| Ellemdin et al.[18] 2011 | 897 admissions | Lab cost per hospital day | R442.90/day | R284.14/day | 35.8% lab costs/patient‐day (P = 0.001) | NR | NR | NA |
| Schilling[19] 2010 | 3222 ED visits | Combined lab and imaging test costs per ED visit | 108/visit | 88/visit | 18.8% test costs/visit (P = 0.07) | NR | NR | NA |
| Guterman et al.[21] 2002 | 168 urgent care visits | Percent of acid reducer prescriptions for ranitidine (the higher‐cost option) | NR | NR | NA | 49% ranitidine | 21% ranitidine | 57.1% ranitidine (P = 0.007) |
| Seguin et al.[20] 2002 | 287 SICU admissions | Tests ordered per admission; test costs per admission | 341/admission | 266/admission | 22.0% test costs/admission (P 0.05) | 13.6 tests/admission | 11.1 tests/ admission | 18.4% tests/admission (P = 0.12) |
| Hampers et al.[23] 1999 | 4881 ED visits (excluding washout) | Adjusted mean test charges per patient visit | $86.79/visit | $63.74/visit | 26.6% test charges/visit (P 0.01) | NR | NR | NA |
| Ornstein et al.[22] 1999 | 30,461 outpatient visits | Prescriptions per visit; prescription cost per visit; cost per prescription | $12.49/visit; $21.83/ prescription | $13.03/visit; $22.03/prescription |
+4.3% prescription costs/visit (P = 0.12); +0.9% cost/prescription (P = 0.61) |
0.66 prescriptions/visit | 0.64 prescriptions/ visit | 3.0% prescriptions/visit (P value not reported) |
| Lin et al.[25] 1998 | 40,747 surgical cases | Annual spending on muscle relaxants medication |
$378,234/year (20,389 cases) |
$330,923/year (20,358 cases) |
12.5% | NR | NR | NA |
| McNitt et al.[24] 1998 | 15,130 surgical cases | Anesthesia drug cost per case | $51.02/case | $18.99/case | 62.8% drug costs/case (P 0.05) | NR | NR | NA |
| Bates et al.[27] 1997 | 7090 admissions (lab); 17,381 admissions (imaging) | Tests ordered per admission; charges for tests ordered per admission |
$771/ admission (lab); $276/admission (imaging) |
$739/admission (lab); $275/admission (imaging) |
4.2% lab charges/admission (P = 0.97); 0.4% imaging charges/admission (P = 0.10) |
26.8 lab tests/admission; 1.76 imaging tests/admission |
25.6 lab tests/ admission; 1.76 imaging tests/ admission |
4.5% lab tests/admission (P = 0.74); 0% imaging tests/admission (P = 0.13) |
| Vedsted et al.[26] 1997 | NR | Prescribed daily doses per 1000 insured; total drug reimbursement per 1000 insured; reimbursement per daily dose | Reported graphically only | Reported graphically only | No difference | Reported graphically only | Reported graphically only | No difference |
| Horrow et al.[28] 1994 | NR | Anesthetic drugs used per week; anesthetic drug cost per week | $3837/week | $3179/week | 17.1% drug costs/week (P = 0.04) | 97 drugs/week | 94 drugs/week | 3.1% drugs/week (P = 0.56) |
| Tierney et al.[29] 1993 | 5219 admissions | Total charges per admission | $6964/admission | $6077/admission | 12.7% total charges/admission (P = 0.02) | NR | NR | NA |
| Tierney et al.[30] 1990 | 15,257 outpatient visits | Test orders per outpatient visit; test charges per outpatient visit | $51.81/visit | $45.13/visit | 12.9% test charges/visit (P 0.05) | 1.82 tests/visit | 1.56 tests/visit | 14.3% tests/visit (P 0.005) |
| Everett et al.[31] 1983 | NR | Lab tests per admission; charges per admission | NR | NR | NA | NR | NR | No statistically significant changes |
Eight studies reported the numeric impact of price display on aggregate order volume. Three of these demonstrated a statistically significant decrease in order volume, with effect sizes ranging from 14.2% to 25.5%.[14, 16, 30] Decreases were found for lab and imaging tests, and were observed in both inpatient and outpatient settings. For example, 1 pre‐post study displaying prices for inpatient send‐out lab tests demonstrated a 25.5% reduction in send‐out labs per 1000 patient‐days (P 0.001), whereas there was no change for the control group in‐house lab tests, for which prices were not shown.[14] The other 5 studies reported no significant association between price display and order volume, with effect sizes ranging from a decrease of 18.4% to an increase of 5.8%.[17, 20, 22, 27, 28] These studies evaluated lab, imaging, and medication volume. One trial randomizing by individual inpatient showed a nonsignificant decrease of 4.5% in lab orders per admission in the intervention group (P = 0.74), although the authors noted that their study had insufficient power to detect differences less than 10%.[27] Of note, 2 of the 5 studies reporting nonsignificant impacts on order volume (3.1%, P = 0.56; and 18.4%, P = 0.12) did demonstrate significant decreases in order costs (17.1%, P = 0.04; and 22.0%, P 0.05).[20, 28]
There were an additional 2 studies that reported the impact of price display on order volume for individual orders only. In 1 time‐series study showing lab test prices, there was a statistically significant decrease in order volume for 5 of 27 individual tests studied (using a Bonferroni‐adjusted threshold of significance), with no tests showing a significant increase.[15] In 1 pre‐post study showing prices for H2‐antagonist drugs, there was a statistically significant 57.1% decrease in order volume for the high‐cost medication, with a corresponding 58.7% increase in the low‐cost option.[21] These studies did not report impact on aggregate order costs. Two further studies in this review did not report outcomes numerically, but did state in their articles that significant impacts on order volume were not observed.[26, 31]
Therefore, of the 19 studies included in this review, 17 reported numeric results. Of these 17 studies, 12 showed that price display was associated with statistically significant decreases in either order costs or volume, either in aggregate (10 studies; Figure 1) or for individual orders (2 studies). Of the 7 studies conducted within the past decade, 5 noted significant decreases in order costs or volume. Prices were embedded into an EHR in 5 of these recent studies, and 4 of the 5 observed significant decreases in order costs or volume. Only 2 studies from the past decade1 from Belgium and 1 from the United Statesincorporated prices into an EHR and reported aggregate order costs. Both found statistically significant decreases in order costs with price display.[13, 16]
Patient Safety and Provider Acceptability
Five studies reported patient‐safety outcomes. One inpatient randomized trial showed similar rates of postdischarge utilization and charges between the intervention and control groups.[29] An outpatient randomized trial showed similar rates of hospital admissions, ED visits, and outpatient visits between the intervention and control groups.[30] Two pre‐post studies showing anesthesia prices in hospital operating rooms included a quality assurance review and showed no changes in adverse outcomes such as prolonged postoperative intubation, recovery room stay, or unplanned intensive care unit admissions.[24, 25] The only adverse safety finding was in a pre‐post study in a pediatric ED, which showed a higher rate of unscheduled follow‐up care during the intervention period compared to the control period (24.4% vs 17.8%, P 0.01) but similar rates of patients feeling better (83.4% vs 86.7%, P = 0.05). These findings, however, were based on self‐report during telephone follow‐up with a 47% response rate.[23]
Five studies reported on provider acceptability of price display. Two conducted questionnaires as part of the study plan, whereas the other 3 offered general provider feedback. One questionnaire revealed that 83% of practices were satisfied or very satisfied with the price display.[26] The other questionnaire found that 81% of physicians felt the price display improved my knowledge of the relative costs of tests I order and similarly 81% would like additional cost information displayed for other orders.[15] Three studies reported subjectively that showing prices initially caused questions from most physicians,[13] but that ultimately, physicians like seeing this information[27] and gave feedback that was generally positive.[21] One study evaluated the impact of price display on provider cost knowledge. Providers in the intervention group did not improve in their cost‐awareness, with average errors in cost estimates exceeding 40% even after 6 months of price display.[30]
Study Quality
Using a modified Downs and Black checklist of 21 items, studies in this review ranged in scores from 5 to 20, with a median score of 15. Studies most frequently lost points for being nonrandomized, failing to describe or adjust for potential confounders, being prone to historical confounding, or not evaluating potential adverse events.
We supplemented this modified Downs and Black checklist by reviewing 3 categories of study limitations not well‐reflected in the checklist scoring (Table 3). The first was potential for contamination between study groups, which was a concern in 4 studies. For example, 1 pre‐post study assessing medication ordering included clinical pharmacists in patient encounters both before and after the price display intervention.[22] This may have enhanced cost‐awareness even before prices were shown. The second set of limitations, present in 12 studies, included confounders that were not addressed by study design or analysis. For example, the intervention in 1 study displayed not just test cost but also test turnaround time, which may have separately influenced providers against ordering a particular test.[14] The third set of limitations included unanticipated gaps in the display of prices or in the collection of ordering data, which occurred in 5 studies. If studies did not report on gaps in the intervention or data collection, we assumed there were none.
| Study | Modified Downs & Black Score (Max Score 21) | Other Price Display Quality Criteria (Not Included in Downs & Black Score) | ||
|---|---|---|---|---|
| Potential for Contamination Between Study Groups | Potential Confounders of Results Not Addressed by Study Design or Analysis | Incomplete Price Display Intervention or Data Collection | ||
| ||||
| Fang et al.[14] 2014 | 14 | None | Concurrent display of test turnaround time may have independently contributed to decreased test ordering | 21% of reference lab orders were excluded from analysis because no price or turnaround‐time data were available |
| Nougon et al.[13] 2015 | 16 | None | Historical confounding may have existed due to pre‐post study design without control group | None |
| Durand et al.[17] 2013 | 17 | Providers seeing test prices for intervention tests (including lab tests in concurrent Feldman study) may have remained cost‐conscious when placing orders for control tests | Interference between units likely occurred because intervention test ordering (eg, chest x‐ray) was not independent of control test ordering (eg, CT chest) | None |
| Feldman et al.[16] 2013 | 18 | Providers seeing test prices for intervention tests (including imaging tests in concurrent Durand study) may have remained cost‐conscious when placing orders for control tests | Interference between units likely occurred because intervention test ordering (eg, CMP) was not independent of control test ordering (eg, BMP) | None |
| Horn et al.[15] 2014 | 15 | None | None | None |
| Ellemdin et al.[18] 2011 | 15 | None | None | None |
| Schilling[19] 2010 | 12 | None | None | None |
| Guterman et al.[21] 2002 | 14 | None | Historical confounding may have existed due to pre‐post study design without control group | None |
| Seguin et al.[20] 2002 | 17 | None | Because primary outcome was not adjusted for length of stay, the 30% shorter average length of stay during intervention period may have contributed to decreased costs per admission; historical confounding may have existed due to pre‐post study design without control group | None |
| Hampers et al.[23] 1999 | 17 | None | Requirement that physicians calculate total charges for each visit may have independently contributed to decreased test ordering; historical confounding may have existed due to pre‐post study design without control group | 10% of eligible patient visits were excluded from analysis because prices were not displayed or ordering data were not collected |
| Ornstein et al.[22] 1999 | 15 | Clinical pharmacists and pharmacy students involved in half of all patient contacts may have enhanced cost‐awareness during control period | Emergence of new drugs during intervention period and an ongoing quality improvement activity to increase prescribing of lipid‐lowering medications may have contributed to increased medication costs; historical confounding may have existed due to pre‐post study design without control group | 25% of prescription orders had no price displayed, and average prices were imputed for purposes of analysis |
| Lin et al.[25] 1998 | 12 | None | Emergence of new drug during intervention period and changes in several drug prices may have contributed to decreased order costs; historical confounding may have existed due to pre‐post study design without control group | None |
| McNitt et al.[24] 1998 | 15 | None | Intensive drug‐utilization review and cost‐reduction efforts may have independently contributed to decreased drug costs; historical confounding may have existed due to pre‐post study design without control group | None |
| Bates et al.[27] 1997 | 18 | Providers seeing test prices on intervention patients may have remembered prices or remained cost‐conscious when placing orders for control patients | None | 47% of lab tests and 26% of imaging tests were ordered manually outside of the trial's CPOE display system* |
| Vedsted et al.[26] 1997 | 5 | None | Medication price comparison module may have independently influenced physician ordering | None |
| Horrow et al.[28] 1994 | 14 | None | Historical confounding may have existed due to pre‐post study design without control group | Ordering data for 2 medications during 2 of 24 weeks were excluded from analysis due to internal inconsistency in the data |
| Tierney et al.[29] 1993 | 20 | None | Introduction of computerized order entry and menus for cost‐effective ordering may have independently contributed to decreased test ordering | None |
| Tierney et al.[30] 1990 | 20 | None | None | None |
| Everett et al.[31] 1983 | 7 | None | None | None |
Even among the 5 randomized trials there were substantial limitations. For example, 2 trials used individual tests as the unit of randomization, although ordering patterns for these tests are not independent of each other (eg, ordering rates for comprehensive metabolic panels are not independent of ordering rates for basic metabolic panels).[16, 17] This creates interference between units that was not accounted for in the analysis.[32] A third trial was randomized at the level of the patient, so was subject to contamination as providers seeing the price display for intervention group patients may have remained cost‐conscious while placing orders for control group patients.[27] In a fourth trial, the measured impact of the price display may have been confounded by other aspects of the overall cost intervention, which included cost‐effective test menus and suggestions for reasonable testing intervals.[29]
The highest‐quality study was a cluster‐randomized trial published in 1990 specifically measuring the effect of price display on a wide range of orders.[30] Providers and patients were separated by clinic session so as to avoid contamination between groups, and the trial included more than 15,000 outpatient visits. The intervention group providers ordered 14.3% fewer tests than control group providers, which resulted in 12.9% lower charges.
DISCUSSION
We identified 19 published reports of interventions that displayed real‐time order prices to providers and evaluated the impact on provider ordering. There was substantial heterogeneity in study setting, design, and quality. Although there is insufficient evidence on which to base strong conclusions, these studies collectively suggest that provider price display likely reduces order costs to a modest degree. Data on patient safety were largely lacking, although in the few studies that examined patient outcomes, there was little evidence that patient safety was adversely affected by the intervention. Providers widely viewed display of prices positively.
Our findings align with those of a recent systematic review that concluded that real‐time price information changed provider ordering in the majority of studies.[7] Whereas that review evaluated 17 studies from both clinical settings and simulations, our review focused exclusively on studies conducted in actual ordering environments. Additionally, our literature search yielded 8 studies not previously reviewed. We believe that the alignment of our findings with the prior review, despite the differences in studies included, adds validity to the conclusion that price display likely has a modest impact on reducing order costs. Our review contains several additions important for those considering price display interventions. We provide detailed information on study settings and intervention characteristics. We present a formal assessment of study quality to evaluate the strength of individual study findings and to guide future research in this area. Finally, because both patient safety and provider acceptability may be a concern when prices are shown, we describe all safety outcomes and provider feedback that these studies reported.
The largest effect sizes were noted in 5 studies reporting decreases in order volume or costs greater than 25%.[13, 14, 18, 23, 24] These were all pre‐post intervention studies, so the effect sizes may have been exaggerated by historical confounding. However, the 2 studies with concurrent control groups found no decreases in order volume or cost in the control group.[14, 18] Among the 5 studies that did not find a significant association between price display and provider ordering, 3 were subject to contamination between study groups,[17, 22, 27] 1 was underpowered,[19] and 1 noted a substantial effect size but did not perform a statistical analysis.[25] We also found that order costs were more frequently reduced than order volume, likely because shifts in ordering to less expensive alternatives may cause costs to decrease while volume remains unchanged.[20, 28]
If price display reduces order costs, as the majority of studies in this review indicate, this finding carries broad implications. Policy makers could promote cost‐conscious care by creating incentives for widespread adoption of price display. Hospital and health system leaders could improve transparency and reduce expenses by prioritizing price display. The specific beneficiaries of any reduced spending would depend on payment structures. With shifts toward financial risk‐bearing arrangements like accountable care organizations, healthcare institutions may have a financial interest in adopting price display. Because price display is an administrative intervention that can be developed within EHRs, it is potentially 1 of the most rapidly scalable strategies for reducing healthcare spending. Even modest reductions in spending on laboratory tests, imaging studies, and medications would result in substantial savings on a system‐wide basis.
Implementing price display does not come without challenges. Prices need to be calculated or obtained, loaded into an EHR system, and updated periodically. Technology innovators could enhance EHR software by making these processes easier. Healthcare institutions may find displaying relative prices (eg, $/$$/$$$) logistically simpler in some contexts than showing actual prices (eg, purchase cost), such as when contracts require prices to be confidential. Although we decided to exclude studies displaying relative prices, our search identified no studies that met other inclusion criteria but displayed relative prices, suggesting a lack of evidence regarding the impact of relative price display as an alternative to actual price display.
There are 4 key limitations to our review. First, the heterogeneity of the study designs and reported outcomes precluded pooling of data. The variety of clinical settings and mechanisms through which prices were displayed enhances the generalizability of our findings, but makes it difficult to identify particular contexts (eg, type of price or type of order) in which the intervention may be most effective. Second, although the presence of negative studies on this subject reduces the concern for reporting bias, it remains possible that sites willing to implement and study price displays may be inherently more sensitive to prices, such that published results might be more pronounced than if the intervention were widely implemented across multiple sites. Third, the mixed study quality limits the strength of conclusions that can be drawn. Several studies with both positive and negative findings had issues of bias, contamination, or confounding that make it difficult to be confident of the direction or magnitude of the main findings. Studies evaluating price display are challenging to conduct without these limitations, and that was apparent in our review. Finally, because over half of the studies were conducted over 15 years ago, it may limit their generalizability to modern ordering environments.
We believe there remains a need for high‐quality evidence on this subject within a contemporary context to confirm these findings. The optimal methodology for evaluating this intervention is a cluster randomized trial by facility or provider group, similar to that reported by Tierney et al. in 1990, with a primary outcome of aggregate order costs.[30] Given the substantial investment this would require, a large time series study could also be informative. As most prior price display interventions have been under 6 months in duration, it would be useful to know if the impact on order costs is sustained over a longer time period. The concurrent introduction of any EHR alerts that could impact ordering (eg, duplicate test warnings) should be simultaneously measured and reported. Studies also need to determine the impact of price display alone compared to price comparison displays (displaying prices for the selected order along with reasonable alternatives). Although price comparison was a component of the intervention in some of the studies in this review, it was not evaluated relative to price display alone. Furthermore, it would be helpful to know if the type of price displayed affects its impact. For instance, if providers are most sensitive to the absolute magnitude of prices, then displaying chargemaster prices may impact ordering more than showing hospital costs. If, however, relative prices are all that providers need, then showing lower numbers, such as Medicare prices or hospital costs, may be sufficient. Finally, it would be reassuring to have additional evidence that price display does not adversely impact patient outcomes.
Although some details need elucidation, the studies synthesized in this review provide valuable data in the current climate of increased emphasis on price transparency. Although substantial attention has been devoted by the academic community, technology start‐ups, private insurers, and even state legislatures to improving price transparency to patients, less focus has been given to physicians, for whom healthcare prices are often just as opaque.[4] The findings from this review suggest that provider price display may be an effective, safe, and acceptable approach to empower physicians to control healthcare spending.
Disclosures: Dr. Silvestri, Dr. Bongiovanni, and Ms. Glover have nothing to disclose. Dr. Gross reports grants from Johnson & Johnson, Medtronic Inc., and 21st Century Oncology during the conduct of this study. In addition, he received payment from Fair Health Inc. and ASTRO outside the submitted work.
- Institute of Medicine. Best Care at Lower Cost: The Path to Continuously Learning Health Care in America: Washington, DC: National Academies Press; 2012.
- . Do physicians need a “shopping cart” for health care services? JAMA. 2012;307(8):791–792.
- . The disruptive innovation of price transparency in health care. JAMA. 2013;310(18):1927–1928.
- , . Providing price displays for physicians: which price is right? JAMA. 2014;312(16):1631–1632.
- , . Physician awareness of diagnostic and nondrug therapeutic costs: a systematic review. Int J Tech Assess Health Care. 2008;24(2):158–165.
- , , . Physician awareness of drug cost: a systematic review. PLoS Med. 2007;4(9):e283.
- , , , . The effect of charge display on cost of care and physician practice behaviors: a systematic review. J Gen Intern Med. 2015;30:835–842.
- , , . Engaging medical librarians to improve the quality of review articles. JAMA. 2014;312(10):999–1000.
- , , . Influencing behavior of physicians ordering laboratory tests: a literature study. Med Care. 1993;31(9):784–794.
- , . Trials of providing costing information to general practitioners: a systematic review. Med J Aust. 1997;167(2):89–92.
- . A review of physician cost‐containment strategies for laboratory testing. Med Care. 1983;21(8):783–802.
- , . The feasibility of creating a checklist for the assessment of the methodological quality both of randomised and non‐randomised studies of health care interventions. J Epidemiol Community Health. 1998;52(6):377–384.
- , , , et al. Does offering pricing information to resident physicians in the emergency department potentially reduce laboratory and radiology costs? Eur J Emerg Med. 2015;22:247–252.
- , , , et al. Cost and turn‐around time display decreases inpatient ordering of reference laboratory tests: a time series. BMJ Qual Saf. 2014;23:994–1000.
- , , , , . The impact of cost displays on primary care physician laboratory test ordering. J Gen Intern Med. 2014;29:708–714.
- , , , et al. Impact of providing fee data on laboratory test ordering: a controlled clinical trial. JAMA Intern Med. 2013;173(10):903–908.
- , , , . Provider cost transparency alone has no impact on inpatient imaging utilization. J Am Coll Radiol. 2013;10(2):108–113.
- , , . Providing clinicians with information on laboratory test costs leads to reduction in hospital expenditure. S Afr Med J. 2011;101(10):746–748.
- . Cutting costs: the impact of price lists on the cost development at the emergency department. Eur J Emerg Med. 2010;17(6):337–339.
- , , , , . Effects of price information on test ordering in an intensive care unit. Intens Care Med. 2002;28(3):332–335.
- , , , , , . Modifying provider behavior: a low‐tech approach to pharmaceutical ordering. J Gen Intern Med. 2002;17(10):792–796.
- , , , , . Medication cost information in a computer‐based patient record system. Impact on prescribing in a family medicine clinical practice. Arch Fam Med. 1999;8(2):118–121.
- , , , , . The effect of price information on test‐ordering behavior and patient outcomes in a pediatric emergency department. Pediatrics. 1999;103(4 pt 2):877–882.
- , , . Long‐term pharmaceutical cost reduction using a data management system. Anesth Analg. 1998;87(4):837–842.
- , . The impact of price labeling of muscle relaxants on cost consciousness among anesthesiologists. J Clin Anesth. 1998;10(5):401–403.
- , , . Does a computerized price comparison module reduce prescribing costs in general practice? Fam Pract. 1997;14(3):199–203.
- , , , et al. Does the computerized display of charges affect inpatient ancillary test utilization? Arch Intern Med. 1997;157(21):2501–2508.
- , . Price stickers do not alter drug usage. Can J Anaesth. 1994;41(11):1047–1052.
- , , , . Physician inpatient order writing on microcomputer workstations. Effects on resource utilization. JAMA. 1993;269(3):379–383.
- , , . The effect on test ordering of informing physicians of the charges for outpatient diagnostic tests. N Engl J Med. 1990;322(21):1499–1504.
- , , , . Effect of cost education, cost audits, and faculty chart review on the use of laboratory services. Arch Intern Med. 1983;143(5):942–944.
- . Interference between units in randomized experiments. J Am Stat Assoc. 2007;102(477):191–200.

Infections from endemic fungi, mycobacteria rare in patients on TNFIs
The development of infections from mycobacteria and fungi endemic to U.S. regions in patients taking tumor necrosis factor–alpha inhibitors (TNFIs) is rare and is not influenced by prescreening of targeted infections, research suggests.
A case-control study of 30,772 patients taking TNFIs showed that only 158 (0.51%) patients developed the fungal and/or mycobacterial infections targeted in this study, with tuberculosis and histoplasmosis being the most common infections.
Targeted infections were nontuberculous mycobacterial infection, blastomycosis, coccidioidomyocosis, cryptococcal infection, histoplasmosis, pneumocystosis, tuberculosis disease, and unspecified fungal infection.
Prednisone was the only predictive factor for infection and was associated with a twofold increase in the likelihood of patients seeking medical attention for a fungal or mycobacterial infection, which the authors said was supported by previous research, according to a paper published online in Arthritis & Rheumatology.
“Thus, the question remains if the increased infection rates are related solely to the use of the glucocorticoids or the active disease for which the medication is being prescribed,” wrote Elizabeth Salt, Ph.D., of the University of Kentucky, Lexington, and coauthors (Arthritis Rheumatol. 2015 Oct 16 doi: 10.1002/art.39462).
Researchers also noted that sulfamethoxazole-trimethoprim was associated with a nonsignificant 45% increase in the likelihood of requiring medical care, compared with controls.
“It is possible that providers recognized the infectious risk of this population and made attempts at controlling infectious processes among those most vulnerable.”
The study was supported by the National Institutes of Health. There were no conflicts of interest declared.
FROM ARTHRITIS & RHEUMATOLOGY
Key clinical point: The incidence of select mycobacterial and fungal infections in patients taking TNFIs is low.
Major finding: Only 0.51% of patients taking TNFIs developed the mycobacterial and fungal infections targeted in this study.
Data source: A case-control study of 30,772 patients taking TNFIs.
Disclosures: The study was supported by the National Institutes of Health. There were no conflicts of interest declared.
Thrombosis Management Demands Delicate, Balanced Approach
The delicate balance involved in providing hospitalized patients with needed anticoagulant, anti-platelet, and thrombolytic therapies for stroke and possible cardiac complications while minimizing bleed risks was explored by several speakers at the University of California San Francisco’s annual Management of the Hospitalized Patient Conference.
“These are dynamic issues and they’re moving all the time,” said Tracy Minichiello, MD, a former hospitalist who now runs the Anticoagulation and Thrombosis Service at the San Francisco VA Medical Center. Dosing and monitoring choices for physicians have grown more complicated with the new oral anticoagulants (apixaban, dabigatran, and rivaroxaban), and she said another balancing act is emerging in hospitals trying to avoid unnecessary and wasteful treatments.
“There is interest on both sides of that question,” Dr. Minichiello said, adding the stakes are high. “We don’t want to miss the diagnosis of pulmonary embolisms, which can be difficult to catch. But now there’s more discussion of the other side of the issue—over-diagnosis and over-treatment—where we’re also trying to avoid, for example, overuse of CT scans.”
Another major thrust of Dr. Minichiello’s presentations involved bridging therapies, the application of a parenteral, short-acting anticoagulant therapy during the temporary interruption of warfarin anticoagulation for an invasive procedure. Bridging decreases stroke and embolism risk, but with an increased risk for bleeding.
“Full intensity bridging therapy for anticoagulation potentially can do more harm than good,” she said, noting a dearth of data to support mortality benefits of bridging therapy.
Literature increasingly recommends hospitalists be more selective about the use of bridging therapies that might have been employed reflexively in the past, she noted.
“[Hospitalists] must be mindful of the risks and benefits,” she said.
Physicians should also think twice about concomitant antiplatelet therapy like aspirin with anticoagulants. “We need to work collaboratively with our cardiology colleagues when a patient is on two or three of these therapies,” she said. “Recommendations in this area are in evolution.”
Elise Bouchard, MD, an internist at Centre Maria-Chapdelaine in Dolbeau-Mistassini, Quebec, attended Dr. Minichiello’s breakout session on challenging cases.
“I learned that we shouldn’t use aspirin with Coumadin or other anticoagulants, except for cases like acute coronary syndrome,” Dr. Bouchard said. She also explained a number of her patients with cancer, for example, need anticoagulation treatment and hate getting another injection, so she tries when possible to offer the oral anticoagulants.
Dr. Minichiello works with hospitalists at the San Francisco VA who seek consults around procedures, anticoagulant choices, and when to restart treatments.
“Most hospitalists don’t have access to a service like ours, although they might be able to call on a hematology consult service [or pharmacist],” she said. She suggested hospitalists trying to develop their own evidenced-based protocols use websites like the University of Washington’s anticoagulation service website, or the American Society of Health System Pharmacists’ anticoagulation resource center. TH
Discussions about sexual orientation
The biological transition to puberty has always marked a critical point in a primary care pediatrician’s relationship to a patient. Adolescents’ capacity for abstract reasoning, their movement to autonomy, their nuanced sense of identity, their need for privacy, and their emerging sexuality together give the pediatrician an opportunity and a responsibility to create a safe place to talk. Your office can be an oasis from parents, peers, and a society that seems saturated with sexuality. You can be trusted more than the Internet and offer discussions that are leavened by your long-standing relationship with the patient.
The growing public awareness, acceptance, and legal standing given to gay, lesbian, bisexual, and transgender individuals represents welcome societal progress, and we sense that amidst this richer public conversation, a growing number of children and adolescents are presenting with questions or worries about their own emerging sexual orientation or gender identity. We would like to start with our key takeaway: Discussions about sexual orientation and gender identity do not require that you give answers or predict the future. Focus instead on being a curious, compassionate, and nonjudgmental listener, and you will be effective at helping your patient to better manage new, uncertain, and possibly stressful feelings.

Our focus today is how to create a safe setting and specifically how to ask about and discuss sexual orientation. Most teenagers will wonder at some point about their orientation. Studies suggest that among adults, 5%-10% are attracted to the same sex and 3% describe themselves as gay or bisexual. Such surveys are very challenging, though, and in our experience, these percentages are higher. Sexual orientation is believed to exist on a continuum rather than in a simple binary state – some people identify as purely homosexual or heterosexual, and the rest exist somewhere in the middle. Sharing this fact alone can offer a very helpful perspective to young people who are feeling pressure to “figure out” if they are gay or straight.
While sexual orientation describes whom a person is attracted to, gender identity is a person’s internal sense of his or her own gender. It emerges in childhood and becomes more rich and nuanced in adolescence and adulthood, and, like sexual orientation, it is also believed to exist on a continuum rather than in a simple binary state. Less than 0.1% of youth will experience gender dysphoria, or the pressing feeling that their gender identity is not the same as their phenotypic sex. While questions about gender identity should be approached with the same curious, compassionate, and nonjudgmental style, we will not discuss the management of patients with gender dysphoria here. It is a very complex (and controversial) topic. And, as a practical matter, sexual orientation will likely be a more common issue with your patients, whereas questions about gender identity will come up much less frequently.

It is worth knowing that there is a range of mental health issues that are associated with the stress of feeling comfortable with one’s sexual identity. There is some evidence that young people who identify as gay or bisexual have elevated risk for mood disorders (depression), anxiety disorders, conduct disorder, and substance use disorders, but this finding has not been consistent (Am J Public Health. 2010:100[12]; 2426-32). However, there is unequivocal evidence that there is an elevated risk for suicide attempts in lesbian, gay, or bisexual (LGB) youth above their heterosexual peers. One survey found that 9th-12th grade students who identified as LGB were up to seven times as likely to have a suicide attempt as were their peers who identify as heterosexual. This risk is especially pronounced in male adolescents and continues into adulthood, when there is an elevated risk for suicide completion among adult males who identify as homosexual, although not in adult females (J Homosex. 2011 Jan;58[1]:10-51). Importantly, the risk for suicide attempt in LGB adolescents remains elevated even in those adolescents without any diagnosable mental illness, likely attributable to the stresses of isolation, family conflict, stigmatization, or bullying that LGB adolescents are likely to experience.
Asking your early-adolescent patients in a calm and comfortable manner about sexual feelings builds an environment in which thoughts, feelings, and questions about sex and sexuality are more easily shared. It is important to find language that feels like yours, which you can use with ease. Perhaps starting with, “At about your age, I ask every patient of mine whether they are beginning to have sexual feelings. This is when you really want to be around someone, in a way that’s more powerful and different from even your favorite friend. Some people call it getting butterflies in your stomach.” If your patient recognizes what you are talking about, you might continue, “Do you feel attracted to boys or girls or both? Do you have those feelings about kids in your class or people you know, like a teacher? Perhaps about a celebrity in a TV show or a band?” You should absolutely reassure them, “You don’t have to talk about anything you do not want to, but you should know that this is a normal part of becoming a teenager. I talk about this a lot with patients who are younger and older than you are. I keep what we talk about very private, and sometimes this is the only place a teenager feels safe to ask questions.” If you start this process early enough – by the start of middle school – the patient will probably be a bit embarrassed or giggle and not talk much. But, by the next annual physical or the one after that, the issue will be more familiar and less charged. A meaningful discussion may start.
With patients who do describe feeling attracted to people of the same sex, more specific questions may be appropriate. You should expect these feelings to exist on a continuum: You may encounter a school-age child with great clarity about exactly whom she is attracted to and what that means, or an older teenager who is far less certain, responding to a less intense interest or having been told by a peer that he is probably gay. It can be powerfully reassuring to remind your patient that adolescence is when we start to figure out to whom we are attracted. They don’t have to decide, but just be aware of these feelings as they emerge, essentially getting to know themselves without any feelings of urgency or pressure. You might ask, “Have you wondered if you were gay or bisexual? Have you spoken to any friends about your feelings or have you experimented with a boy or girl to try and figure this out?” It’s very helpful if you ask if they are worried or stressed by these feelings. Some young people will suffer from internalized homophobia, which may be helped by your accepting stance or may require a referral for more ongoing support. It can be valuable to find out if they are dating people of the same sex, or if their “relationships” have all been online. While this “virtual” dating may seem safer, it may not help them better understand themselves and may expose them to exploitation or predatory behavior. If your patient is sexually active, you should be comfortable talking with them about the risks of unprotected sex and same-sex safe-sex practices.
It is particularly important to ask your adolescent LGB patient about whom they have told, and what responses have they gotten. The presence of good friends and loving family members is critical to all adolescents’ emotional well-being. If they have talked about their sexual orientation with their peers, have their friends been supportive, or has it left them more isolated at school? You should find out if they have been teased or bullied, and ask specifically about online teasing or harassment. If they are being bullied, how have they handled that? Find out also if they feel free to ask or talk about this subject with their parents. If not, try to understand if they are simply embarrassed and unsure how to bring it up, or if there is a strong sense that they will be shamed or even rejected by their parents. If the parents are truly shaming or rejecting, it will be critical to consider what kind of support may be necessary. Teens who are facing isolation or bullying at school may benefit from resources such as a gay-straight student alliance or a community organization dedicated to issues facing LGB youth. For patients who are facing hostile or rejecting parents, it can be protective to connect them with a therapist as well, as you are mindful of their marked isolation and subsequently heightened risk for mood problems and even suicide attempts.
Along a similar vein, it is very important that you are aware of your own comfort level with these issues. While discussing sexual orientation may feel awkward if it is new for you, it is important to be realistic if you cannot be supportive of your patients who are gay. If for religious or other reasons you are not comfortable talking about sexual orientation in an accepting, nonjudgmental manner, you should seek guidance on how to thoughtfully care for your LGB patients or appropriately refer them to someone who can provide a more-supportive treatment setting.
When you create an office that makes sexuality a safe topic for discussion, you should expect that you will hear questions or concerns about which you yourself may not know the answers. Do not panic, just maintain your posture of being a curious, compassionate, and nonjudgmental listener, and then look for the answers. We are delighted this news organization has devoted a column to the optimal care of LGBT youth (LGBT Youth Consult) and encourage the primary care pediatrician to “never to worry alone,” and instead get some advice and expert teammates when dealing with these complex and important issues.
Dr. Swick is an attending psychiatrist in the division of child psychiatry at Massachusetts General Hospital, Boston, and director of the Parenting at a Challenging Time (PACT) Program at the Vernon Cancer Center at Newton Wellesley Hospital, in Newton, Mass. Dr. Jellinek is professor of psychiatry and of pediatrics at Harvard Medical School, Boston.
The biological transition to puberty has always marked a critical point in a primary care pediatrician’s relationship to a patient. Adolescents’ capacity for abstract reasoning, their movement to autonomy, their nuanced sense of identity, their need for privacy, and their emerging sexuality together give the pediatrician an opportunity and a responsibility to create a safe place to talk. Your office can be an oasis from parents, peers, and a society that seems saturated with sexuality. You can be trusted more than the Internet and offer discussions that are leavened by your long-standing relationship with the patient.
The growing public awareness, acceptance, and legal standing given to gay, lesbian, bisexual, and transgender individuals represents welcome societal progress, and we sense that amidst this richer public conversation, a growing number of children and adolescents are presenting with questions or worries about their own emerging sexual orientation or gender identity. We would like to start with our key takeaway: Discussions about sexual orientation and gender identity do not require that you give answers or predict the future. Focus instead on being a curious, compassionate, and nonjudgmental listener, and you will be effective at helping your patient to better manage new, uncertain, and possibly stressful feelings.
Our focus today is how to create a safe setting and specifically how to ask about and discuss sexual orientation. Most teenagers will wonder at some point about their orientation. Studies suggest that among adults, 5%-10% are attracted to the same sex and 3% describe themselves as gay or bisexual. Such surveys are very challenging, though, and in our experience, these percentages are higher. Sexual orientation is believed to exist on a continuum rather than in a simple binary state – some people identify as purely homosexual or heterosexual, and the rest exist somewhere in the middle. Sharing this fact alone can offer a very helpful perspective to young people who are feeling pressure to “figure out” if they are gay or straight.
While sexual orientation describes whom a person is attracted to, gender identity is a person’s internal sense of his or her own gender. It emerges in childhood and becomes more rich and nuanced in adolescence and adulthood, and, like sexual orientation, it is also believed to exist on a continuum rather than in a simple binary state. Less than 0.1% of youth will experience gender dysphoria, or the pressing feeling that their gender identity is not the same as their phenotypic sex. While questions about gender identity should be approached with the same curious, compassionate, and nonjudgmental style, we will not discuss the management of patients with gender dysphoria here. It is a very complex (and controversial) topic. And, as a practical matter, sexual orientation will likely be a more common issue with your patients, whereas questions about gender identity will come up much less frequently.
It is worth knowing that there is a range of mental health issues that are associated with the stress of feeling comfortable with one’s sexual identity. There is some evidence that young people who identify as gay or bisexual have elevated risk for mood disorders (depression), anxiety disorders, conduct disorder, and substance use disorders, but this finding has not been consistent (Am J Public Health. 2010:100[12]; 2426-32). However, there is unequivocal evidence that there is an elevated risk for suicide attempts in lesbian, gay, or bisexual (LGB) youth above their heterosexual peers. One survey found that 9th-12th grade students who identified as LGB were up to seven times as likely to have a suicide attempt as were their peers who identify as heterosexual. This risk is especially pronounced in male adolescents and continues into adulthood, when there is an elevated risk for suicide completion among adult males who identify as homosexual, although not in adult females (J Homosex. 2011 Jan;58[1]:10-51). Importantly, the risk for suicide attempt in LGB adolescents remains elevated even in those adolescents without any diagnosable mental illness, likely attributable to the stresses of isolation, family conflict, stigmatization, or bullying that LGB adolescents are likely to experience.
Asking your early-adolescent patients in a calm and comfortable manner about sexual feelings builds an environment in which thoughts, feelings, and questions about sex and sexuality are more easily shared. It is important to find language that feels like yours, which you can use with ease. Perhaps starting with, “At about your age, I ask every patient of mine whether they are beginning to have sexual feelings. This is when you really want to be around someone, in a way that’s more powerful and different from even your favorite friend. Some people call it getting butterflies in your stomach.” If your patient recognizes what you are talking about, you might continue, “Do you feel attracted to boys or girls or both? Do you have those feelings about kids in your class or people you know, like a teacher? Perhaps about a celebrity in a TV show or a band?” You should absolutely reassure them, “You don’t have to talk about anything you do not want to, but you should know that this is a normal part of becoming a teenager. I talk about this a lot with patients who are younger and older than you are. I keep what we talk about very private, and sometimes this is the only place a teenager feels safe to ask questions.” If you start this process early enough – by the start of middle school – the patient will probably be a bit embarrassed or giggle and not talk much. But, by the next annual physical or the one after that, the issue will be more familiar and less charged. A meaningful discussion may start.
With patients who do describe feeling attracted to people of the same sex, more specific questions may be appropriate. You should expect these feelings to exist on a continuum: You may encounter a school-age child with great clarity about exactly whom she is attracted to and what that means, or an older teenager who is far less certain, responding to a less intense interest or having been told by a peer that he is probably gay. It can be powerfully reassuring to remind your patient that adolescence is when we start to figure out to whom we are attracted. They don’t have to decide, but just be aware of these feelings as they emerge, essentially getting to know themselves without any feelings of urgency or pressure. You might ask, “Have you wondered if you were gay or bisexual? Have you spoken to any friends about your feelings or have you experimented with a boy or girl to try and figure this out?” It’s very helpful if you ask if they are worried or stressed by these feelings. Some young people will suffer from internalized homophobia, which may be helped by your accepting stance or may require a referral for more ongoing support. It can be valuable to find out if they are dating people of the same sex, or if their “relationships” have all been online. While this “virtual” dating may seem safer, it may not help them better understand themselves and may expose them to exploitation or predatory behavior. If your patient is sexually active, you should be comfortable talking with them about the risks of unprotected sex and same-sex safe-sex practices.
It is particularly important to ask your adolescent LGB patient about whom they have told, and what responses have they gotten. The presence of good friends and loving family members is critical to all adolescents’ emotional well-being. If they have talked about their sexual orientation with their peers, have their friends been supportive, or has it left them more isolated at school? You should find out if they have been teased or bullied, and ask specifically about online teasing or harassment. If they are being bullied, how have they handled that? Find out also if they feel free to ask or talk about this subject with their parents. If not, try to understand if they are simply embarrassed and unsure how to bring it up, or if there is a strong sense that they will be shamed or even rejected by their parents. If the parents are truly shaming or rejecting, it will be critical to consider what kind of support may be necessary. Teens who are facing isolation or bullying at school may benefit from resources such as a gay-straight student alliance or a community organization dedicated to issues facing LGB youth. For patients who are facing hostile or rejecting parents, it can be protective to connect them with a therapist as well, as you are mindful of their marked isolation and subsequently heightened risk for mood problems and even suicide attempts.
Along a similar vein, it is very important that you are aware of your own comfort level with these issues. While discussing sexual orientation may feel awkward if it is new for you, it is important to be realistic if you cannot be supportive of your patients who are gay. If for religious or other reasons you are not comfortable talking about sexual orientation in an accepting, nonjudgmental manner, you should seek guidance on how to thoughtfully care for your LGB patients or appropriately refer them to someone who can provide a more-supportive treatment setting.
When you create an office that makes sexuality a safe topic for discussion, you should expect that you will hear questions or concerns about which you yourself may not know the answers. Do not panic, just maintain your posture of being a curious, compassionate, and nonjudgmental listener, and then look for the answers. We are delighted this news organization has devoted a column to the optimal care of LGBT youth (LGBT Youth Consult) and encourage the primary care pediatrician to “never to worry alone,” and instead get some advice and expert teammates when dealing with these complex and important issues.
Dr. Swick is an attending psychiatrist in the division of child psychiatry at Massachusetts General Hospital, Boston, and director of the Parenting at a Challenging Time (PACT) Program at the Vernon Cancer Center at Newton Wellesley Hospital, in Newton, Mass. Dr. Jellinek is professor of psychiatry and of pediatrics at Harvard Medical School, Boston.

EADV: Comorbid spondyloarthropathy common in hidradenitis suppurativa
COPENHAGEN – Back pain is surprisingly common in patients with hidradenitis suppurativa, and more than half of affected patients showed MRI evidence of axial spondyloarthropathy, Dr. Sylke Schneider-Burrus reported at the Annual Congress of the European Academy of Dermatology and Venereology.
“Our study demonstrates that back pain and spondyloarthropathy are very common among hidradenitis suppurativa patients and that neither history nor clinical parameters provide any hints for the presence of spondyloarthropathy. Therefore, we strongly suggest that hidradenitis suppurativa patients should be evaluated for spondyloarthropathy and affected patients should be treated systemically with TNF-alpha blockers in order to avoid chronic joint alterations,” said Dr. Schneider-Burrus, a dermatologist at Charite University Hospital in Berlin.

Hidradenitis suppurativa (HS) is a chronic, recurrent, scarring, inflammatory skin disease of the hair follicles. It causes painful, purulent, foul-smelling fistulating sinuses in the axillae, groin, and perianal region.
Because several other chronic inflammatory diseases affecting epithelial tissue have been associated with increased rates of axial spondyloarthropathy – notably, Crohn’s disease, ulcerative colitis, and psoriasis – Dr. Schneider-Burrus and coinvestigators wondered whether that might true of HS as well.
She presented a survey of 100 HS patients. To her surprise, fully 71% indicated they suffer from back pain, with lower back complaints predominating.
Forty-eight HS patients with back pain consented to undergo a pelvic MRI exam. Fifteen of the 48 (32%) showed clear MRI evidence of spondyloarthropathy, including sacroiliac erosions and subchondral sclerosis, while another 12 showed active sacroiliac synovitis and other acute inflammatory changes.
No significant differences were found between HS patients with and without axial spondyloarthropathy in terms of age at onset of HS, disease duration, HS severity as reflected in Sartorius score, age at MRI, body mass index, or smoking status.
Dr. Schneider-Burrus reported serving as a paid investigator for and consultant to Novartis and AbbVie.
COPENHAGEN – Back pain is surprisingly common in patients with hidradenitis suppurativa, and more than half of affected patients showed MRI evidence of axial spondyloarthropathy, Dr. Sylke Schneider-Burrus reported at the Annual Congress of the European Academy of Dermatology and Venereology.
“Our study demonstrates that back pain and spondyloarthropathy are very common among hidradenitis suppurativa patients and that neither history nor clinical parameters provide any hints for the presence of spondyloarthropathy. Therefore, we strongly suggest that hidradenitis suppurativa patients should be evaluated for spondyloarthropathy and affected patients should be treated systemically with TNF-alpha blockers in order to avoid chronic joint alterations,” said Dr. Schneider-Burrus, a dermatologist at Charite University Hospital in Berlin.
Hidradenitis suppurativa (HS) is a chronic, recurrent, scarring, inflammatory skin disease of the hair follicles. It causes painful, purulent, foul-smelling fistulating sinuses in the axillae, groin, and perianal region.
Because several other chronic inflammatory diseases affecting epithelial tissue have been associated with increased rates of axial spondyloarthropathy – notably, Crohn’s disease, ulcerative colitis, and psoriasis – Dr. Schneider-Burrus and coinvestigators wondered whether that might true of HS as well.
She presented a survey of 100 HS patients. To her surprise, fully 71% indicated they suffer from back pain, with lower back complaints predominating.
Forty-eight HS patients with back pain consented to undergo a pelvic MRI exam. Fifteen of the 48 (32%) showed clear MRI evidence of spondyloarthropathy, including sacroiliac erosions and subchondral sclerosis, while another 12 showed active sacroiliac synovitis and other acute inflammatory changes.
No significant differences were found between HS patients with and without axial spondyloarthropathy in terms of age at onset of HS, disease duration, HS severity as reflected in Sartorius score, age at MRI, body mass index, or smoking status.
Dr. Schneider-Burrus reported serving as a paid investigator for and consultant to Novartis and AbbVie.
AT THE EADV CONGRESS
Key clinical point: Axial spondyloarthropathy is extremely common in patients with hidradenitis suppurativa.
Major finding: Seventy-one percent of surveyed hidradenitis suppurativa patients reported suffering from back pain, and 56% of affected patients showed MRI evidence of axial spondyloarthropathy.
Data source: A back pain survey of 100 patients with hidradenitis suppurativa along with pelvic MRI exams in the 48 who reported back pain.
Disclosures: The presenter reported serving as a paid investigator for and consultant to Novartis and AbbVie.