User login
Lucas Franki is an associate editor for MDedge News, and has been with the company since 2014. He has a BA in English from Penn State University and is an Eagle Scout.
Preventive care getting past millions of American children
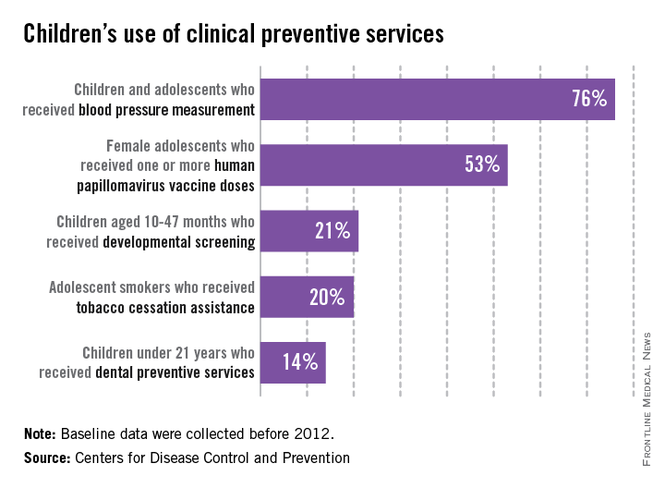
Large numbers of children in the United States did not receive basic clinical preventive care before 2012, according to the Centers for Disease Control and Prevention.
Almost a quarter of children aged 3-17 years who made clinic visits in 2009-2010 had no record of blood pressure measurement. In 2011, 47% of adolescent females had not received their first HPV vaccination. Only about 21% of parents with children aged 10-47 months reported completing a developmental screen in 2007, and 20% of adolescent smokers received advice on stopping tobacco use in 2004-2010. More than half of children reported not visiting the dentist in the past year in 2009, and only 14% of children received dental preventive measures in that time, the CDC said.
"Parents need to know that many clinical preventive services for their children, such as screening and vaccination, are available for free with many health plans," Dr. Lorraine Yeung, a medical epidemiologist with the CDC’s National Center on Birth Defects and Developmental Disabilities, said in the CDC statement.
The supplement to this week’s MMWR provides a baseline for care before implementation of the Affordable Care Act and is the second in a series of reports meant to measure the progress in increasing the use of preventive care (MMWR 2014 Sept. 10;63[suppl. 2]:1-107).

Weight misconception high in overweight children
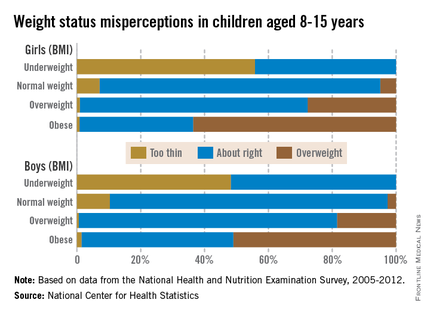
Almost a third of children aged 8-15 years misperceive their weight, with the majority of overweight children having incorrect perceptions of their weight, the National Center for Health Statistics reported.
Weight misperception is very high in all overweight and obese children, with 81% of overweight boys and 48% of obese boys viewing themselves as being of normal weight. For girls aged 8-15 years, 71% of those who are overweight and 36% of those who are obese believe they are the correct weight, according to the NCHS report.
About 30% of all children surveyed from 2005 to 2012 misperceived their weight status, with misperception being higher in boys than in girls. Weight-status misperception was also more common in children than in adolescents, with 33% of children aged 8-11 years and 27% of adolescents aged 12-15 years misperceiving their weight, the NCHS investigators noted.
The common misconception of weight status makes combating childhood obesity difficult, as "accurate self-perception of weight status has been linked to appropriate weight control behaviors in youth. Understanding the prevalence of weight status misconception among U.S children and adolescents may help inform public health interventions," they said.
The NCHS study used data from the National Health and Nutrition Examination Survey, 2005-20012 (NHANES).

Smokers not so welcome in the house anymore
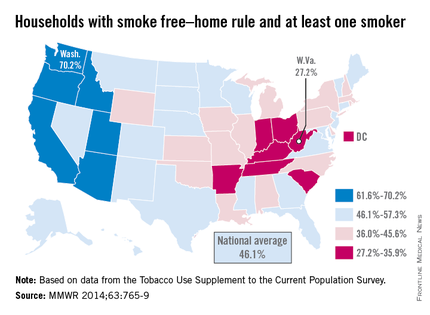
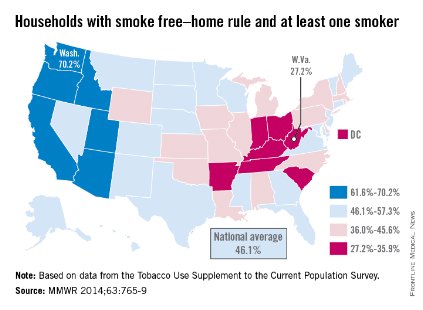
The national prevalence of households with a rule against smoking indoors and at least one adult smoker increased nearly fivefold from 1992 to 2011, the Centers for Disease Control and Prevention reported Sept. 4.
Washington had the highest rate of smokers forced to go outside in 2010-2011, with 70.2% of households with at least one adult smoker staying smoke free. Utah was second at 68.4%, and California was third at 67.9%. West Virginia reported the lowest rate of smoke-free households that had at least one adult smoker, with only 27.2% staying smoke free in 2010-2011. Kentucky was next with a reported rate of 29.3%, and Indiana was next with 31.4% (MMWR 2014;63:765-9).
The national rate of smoke-free households with at least one adult smoker was 46.1% in 2010-2011, compared with 9.6% in 1992-1993. For all households, 83% were smoke free in 2010-2011, compared with 43% in 1992-1993. The smoke-free home rate for households without an adult smoker was 91.4% in 2010-2011, up from 56.7% in 1992-1993, according to the CDC.
Although progress has been made on keeping homes smoke free, approximately 88 million U.S. residents 3 years or older were exposed to secondhand smoke during 2007-2008, the CDC investigators said.
The analysis was based on data from the Tobacco Use Supplement to the Current Population Survey.
FROM MORBIDITY AND MORTALITY WEEKLY REPORT
Blood test charges vary widely among California hospitals
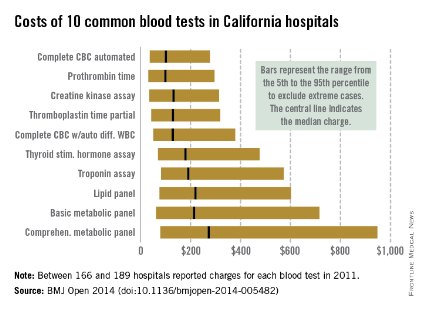
Charges for 10 common blood tests showed wide variation among hospitals in California, with the cost of one test ranging from $10 to more than $10,000, Dr. Renee Y. Hsia and her associates reported in BMJ Open.
In 2011, minimum charges for the examined blood tests ranged from $10 to $44. Maximum charges, with the exception of a creatine kinase assay at $628, were all more than $6,000. The highest charge for a lipid panel was $10,169 – more than a thousand times higher than the low of $10, according to Dr. Hsia and her associates (BMJ Open 2014 [doi: 10.1136/bmjopen-2014-005482]).

Large price differences remained after extreme cases were excluded (see graph). The test with the smallest variation between the 5th and 95th percentiles, an automated complete blood count, had a range of $37 to $278 (median, $100). A complete metabolic panel had the largest variation among the 10 blood tests, costing anywhere from $79 to $948 (median, $273).
Teaching hospitals charged significantly less than other hospitals for 7 of the 10 tests, and government hospitals charged less for 5 of the 10, but "it is notable how few characteristics were significant predictors of the charges patients faced. ... A hospital’s case mix and labor cost did not affect charges, nor did the competitiveness of the market or the percentage of uninsured people in the county," wrote Dr. Hsia of the University of California, San Francisco, and her associates.
The study used data from the California Office of Statewide Health Planning and Development. Of the 307 hospitals that reported charges in 2011, between 166 and 189 reported charges for each of the 10 tests included in the study.
Charges for 10 common blood tests showed wide variation among hospitals in California, with the cost of one test ranging from $10 to more than $10,000, Dr. Renee Y. Hsia and her associates reported in BMJ Open.
In 2011, minimum charges for the examined blood tests ranged from $10 to $44. Maximum charges, with the exception of a creatine kinase assay at $628, were all more than $6,000. The highest charge for a lipid panel was $10,169 – more than a thousand times higher than the low of $10, according to Dr. Hsia and her associates (BMJ Open 2014 [doi: 10.1136/bmjopen-2014-005482]).
Large price differences remained after extreme cases were excluded (see graph). The test with the smallest variation between the 5th and 95th percentiles, an automated complete blood count, had a range of $37 to $278 (median, $100). A complete metabolic panel had the largest variation among the 10 blood tests, costing anywhere from $79 to $948 (median, $273).
Teaching hospitals charged significantly less than other hospitals for 7 of the 10 tests, and government hospitals charged less for 5 of the 10, but "it is notable how few characteristics were significant predictors of the charges patients faced. ... A hospital’s case mix and labor cost did not affect charges, nor did the competitiveness of the market or the percentage of uninsured people in the county," wrote Dr. Hsia of the University of California, San Francisco, and her associates.
The study used data from the California Office of Statewide Health Planning and Development. Of the 307 hospitals that reported charges in 2011, between 166 and 189 reported charges for each of the 10 tests included in the study.
FROM BMJ OPEN
Two-thirds of adolescents say their doctors don’t ask about tobacco use
Less than a third of all adolescents surveyed were asked about tobacco use by their doctors, a study published in Pediatrics reported.
The study used data from 18,094 participants in the 2011 National Youth Tobacco Survey. All participants were in grades 6-12, and had visited a health care provider in the previous year.

Among all of those interviewed, 32.2% reported being asked by their doctors in the past year about tobacco use; 31.4% were advised to quit or avoid tobacco.
Established tobacco users were more likely to be asked about tobacco use, with 65% reporting their doctors asked about smoking and 53% reporting their doctor recommended that they quit, according to Gillian L. Schauer and associates (Pediatrics 2014;134:446-55).
Fewer nonsmokers said they were advised about tobacco use, with 38% of nonsmokers at high risk and 29% of adolescents at low risk reporting their doctors had talked to them about tobacco. Nonsmoking adolescents who indicated any interest in tobacco were labeled as high risk, whereas those who had no interest were labeled as low risk.
High school–aged teens, with the exception of nonestablished smokers, were more likely to be asked about tobacco use in general. Of females who were established smokers, 75% were asked about tobacco use; of males who were established smokers, 59% reported their doctors asked about smoking.
Though improvements are needed, the results indicate that more doctors are asking teens about their tobacco use. A previous version of the survey conducted in 2000 found that 30% of established smokers and 13% of nonestablished smokers were advised to quit, compared with 53% and 33%, respectively, in the more recent survey, the researchers reported.
Among all interviewed adolescents, 17% reported being a current tobacco user, with 11% smoking cigarettes. Participants reported that 17% were former smokers, and 72% had never smoked.
The authors of the study reported no disclosures.
When do you think physicians should ask adolescents about their smoking habits? Take our Quick Poll on the Pediatric News homepage.
These findings are critically important for child and adolescent health care delivery and should challenge both researchers and clinicians. The 4As (ask, advise, assess, arrange) tobacco cessation counseling guidelines have existed for decades, and specific pediatric and adolescent guidelines, adding the fifth A (anticipate) for anticipatory guidance, date to 1991.
The majority of adolescents’ health care encounters and clinical visits did not include discussion or interventions into the leading preventable cause of disease and death. Although the prevalence of being asked and advised about smoking was highest among youth who were smokers, these numbers, too, were low, reaching barely half of smokers with counseling interventions.
Dr. Jonathan D. Klein is with the American Academy of Pediatrics Julius B Richmond Center in Grove Village, Ill. The center offers clinicians advice and materials for counseling on smoking cessation. Dr. Klein made his remarks in an editorial that accompanied Dr. Schauer’s report (Pediatrics 2014; 134:600-1 [doi:10.1542/peds.2014-1925]).
Less than a third of all adolescents surveyed were asked about tobacco use by their doctors, a study published in Pediatrics reported.
The study used data from 18,094 participants in the 2011 National Youth Tobacco Survey. All participants were in grades 6-12, and had visited a health care provider in the previous year.
Among all of those interviewed, 32.2% reported being asked by their doctors in the past year about tobacco use; 31.4% were advised to quit or avoid tobacco.
Established tobacco users were more likely to be asked about tobacco use, with 65% reporting their doctors asked about smoking and 53% reporting their doctor recommended that they quit, according to Gillian L. Schauer and associates (Pediatrics 2014;134:446-55).
Fewer nonsmokers said they were advised about tobacco use, with 38% of nonsmokers at high risk and 29% of adolescents at low risk reporting their doctors had talked to them about tobacco. Nonsmoking adolescents who indicated any interest in tobacco were labeled as high risk, whereas those who had no interest were labeled as low risk.
High school–aged teens, with the exception of nonestablished smokers, were more likely to be asked about tobacco use in general. Of females who were established smokers, 75% were asked about tobacco use; of males who were established smokers, 59% reported their doctors asked about smoking.
Though improvements are needed, the results indicate that more doctors are asking teens about their tobacco use. A previous version of the survey conducted in 2000 found that 30% of established smokers and 13% of nonestablished smokers were advised to quit, compared with 53% and 33%, respectively, in the more recent survey, the researchers reported.
Among all interviewed adolescents, 17% reported being a current tobacco user, with 11% smoking cigarettes. Participants reported that 17% were former smokers, and 72% had never smoked.
The authors of the study reported no disclosures.
When do you think physicians should ask adolescents about their smoking habits? Take our Quick Poll on the Pediatric News homepage.
FROM PEDIATRICS
Key clinical point: Health professional advice to adolescents about tobacco is improving, but is still missing millions of people.
Major finding: 32.2% of surveyed children in grades 6-12 reported being asked by their doctors in the past year about tobacco use, and 31.4% were advised to quit or avoid tobacco.
Data source: Data were obtained from 18,094 respondents to the 2011 National Youth Tobacco Survey.
Disclosures: The authors of the study reported no disclosures.
Children aged 12-15 still use TVs more than computers
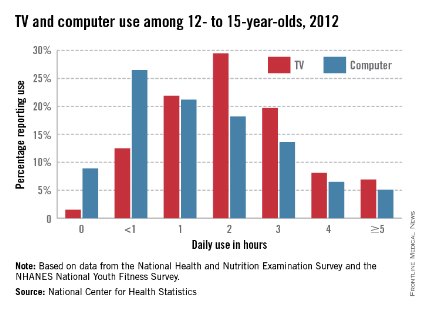
More than 60% of U.S. children aged 12-15 years watched TV for 2 or more hours a day in 2012, and over 40% used a computer for at least 2 hours daily, according to a report from the National Center of Health Statistics.
Nearly all participants reported using the TV at least once a day, and 91% used a computer outside of school in 2012. The NCHS found that 64% of youth aged 12-15 years used the TV for 2 or more hours a day, while 43% used a computer outside of school for 2 or more hours daily. Almost 7% used a TV for 5 or more hours a day, and 5% used a computer for at least 5 hours daily.
There was no statistical difference between boys and girls who watched TV for 2 or more hours per day or in overall screen time, the NCHS said, but significantly more boys than girls reported using the computer outside of school more than 2 hours daily.
The NCHS report was based on data collected in 2012 for the National Health and Nutrition Examination Survey and the NHANES National Youth Fitness Survey.
Children are eating more fruit
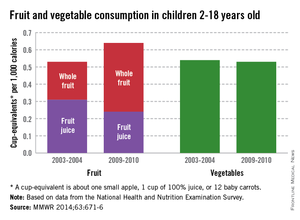
Children are consuming more whole fruit and less fruit juice, but their vegetable intake hasn’t changed in the past 7 years, according to a report from the Centers for Disease Control and Prevention (CDC).
From 2003 to 2010, whole fruit intake increased 67% and total fruit intake increased 13% in children aged 2-18 years. Children consumed 0.24 cup-equivalent per 1,000 calories (CEPC) in 2003 and 0.40 CEPC in 2010. Total fruit intake in 2004 was 0.55 CEPC, and 0.62 CEPC in 2010. A CEPC is the equivalent of one small apple, one cup of applesauce, one cup of 100% juice, or 12 baby carrots.
Fruit juice intake decreased 29% from 0.31 CEPC to 0.22 CEPC, the CDC investigators reported. The Healthy People 2020 national goal for fruit intake is 0.9 CEPC (Morb. Mortal. Wkly. Rep. 2014;63:1-6).
Over the same period, vegetable intake was steady at 0.54 CEPC reported in 2003 and 0.53 CEPC in 2010. The vegetable intake national goal is 1.1 CEPC by 2011.
Of all the demographic groups defined in the report, only children aged 2-5 years reached the national goal of 0.9 CEPC for fruit intake. No demographic reached the vegetable intake national goal, the investigators said.
The CDC report was based on data from 12,459 participants, collected for the National Health and Nutrition Examination Survey.
FROM MORBIDITY AND MORTALITY WEEKLY REPORT

Brief screening instrument for adolescent substance abuse shows promise
A new screening test has shown promise in successfully identifying substance use in adolescents, which is crucial to pediatricians as even low levels of usage may indicate a need to intervene, according to Sharon M. Kelly, Ph.D., of Friends Research Institute in Baltimore, and her associates.
Of the 525 adolescents in the study, 21.5% reported using alcohol, 16% reported using marijuana, and 9.5% reported using tobacco during the past year. Three percent of participants reported using one or more drugs other than marijuana, including prescription opioids, prescription sedatives, and over-the-counter medications. One participant each reported using cocaine/crack, amphetamines, and misuse of prescription stimulants (Pediatrics 2014;133:819-26).

The study was conducted by giving participants a short survey, the Brief Screener for Tobacco, Alcohol, and Other Drugs (BSTAD). Half of the study sample took the survey on a touch screen tablet, and the second half were interviewed by a research assistant. When asked about which mode they preferred, participants preferred taking the survey via tablet to taking it by interview or would have preferred using a tablet.
The study was based in Baltimore, with 92.8% of the participants being of African American descent, and the substance use reported in the study was in line with national data found for African Americans. Dr. Kelly and her associates recommended that research into the BSTAD be conducted in other population centers with a more diverse population.
The study was supported by a National Institute on Drug Abuse grant and funded by the National Institutes of Health. The authors reported no relevant financial disclosures.
A new screening test has shown promise in successfully identifying substance use in adolescents, which is crucial to pediatricians as even low levels of usage may indicate a need to intervene, according to Sharon M. Kelly, Ph.D., of Friends Research Institute in Baltimore, and her associates.
Of the 525 adolescents in the study, 21.5% reported using alcohol, 16% reported using marijuana, and 9.5% reported using tobacco during the past year. Three percent of participants reported using one or more drugs other than marijuana, including prescription opioids, prescription sedatives, and over-the-counter medications. One participant each reported using cocaine/crack, amphetamines, and misuse of prescription stimulants (Pediatrics 2014;133:819-26).
The study was conducted by giving participants a short survey, the Brief Screener for Tobacco, Alcohol, and Other Drugs (BSTAD). Half of the study sample took the survey on a touch screen tablet, and the second half were interviewed by a research assistant. When asked about which mode they preferred, participants preferred taking the survey via tablet to taking it by interview or would have preferred using a tablet.
The study was based in Baltimore, with 92.8% of the participants being of African American descent, and the substance use reported in the study was in line with national data found for African Americans. Dr. Kelly and her associates recommended that research into the BSTAD be conducted in other population centers with a more diverse population.
The study was supported by a National Institute on Drug Abuse grant and funded by the National Institutes of Health. The authors reported no relevant financial disclosures.
FROM PEDIATRICS
Major finding: Of the 525 teens, 21.5% reported using alcohol, 16% reported using marijuana, 9.5% reported using tobacco, and 3% reported using drugs other than marijuana.
Data source: A study of 525 Baltimore adolescents using the Brief Screener for Tobacco, Alcohol, and Other Drugs (BSTAD).
Disclosures: The study was supported by a National Institute on Drug Abuse grant and funded by the National Institutes of Health. The authors reported no relevant financial disclosures.
