User login
Lucas Franki is an associate editor for MDedge News, and has been with the company since 2014. He has a BA in English from Penn State University and is an Eagle Scout.
Antimicrobial use varies across hospital units
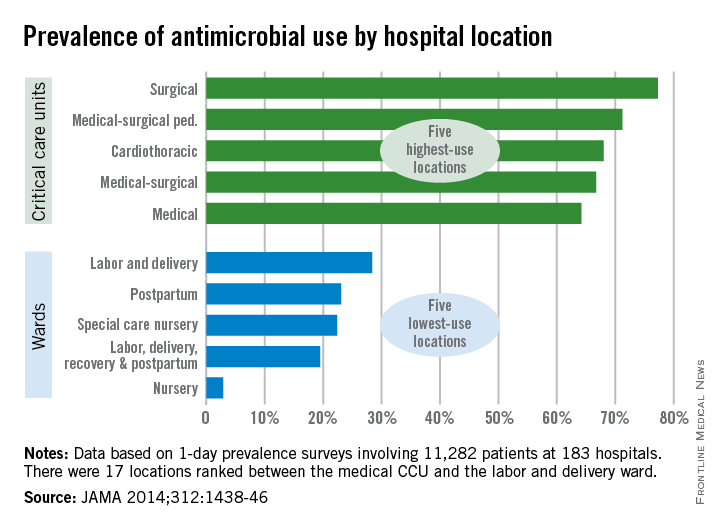
Patients in surgical critical care units were most likely to receive antimicrobial medication, while those in nursery wards were least likely to receive it, according to a recent study.
Nearly 78% of patients who used a surgical critical care unit (CCU) received antimicrobials in 2011, with 71% of patients in medical-surgical pediatric CCUs receiving antimicrobials and patients in cardiothoracic CCUs receiving antimicrobials at a 68% rate, according to Dr. Shelley S. Magill of the Centers for Disease Control and Prevention, Atlanta, and her associates (JAMA 2014;312:1438-46).
With only 3% of patients receiving antimicrobials, nursery wards had the lowest rate of medication, with labor, delivery, recovery, and postpartum wards giving antimicrobials to 20% of patients and 22% of patients receiving antimicrobials in special care nurseries, they reported.
Of the 5,635 patients who received antimicrobials, 4,278 received them for the treatment of infection. Lower respiratory tract infections were the most commonly treated type of infection, with 35% of patients receiving antimicrobials. Urinary tract and skin and soft tissue infections also were commonly treated with antimicrobials at a rate of 22% and 16%, respectively.
Overall (including prophylaxis,noninfection-related reasons, and undocumented rationale), vancomycin was the most commonly received antimicrobial, followed by cefazolin and ceftriaxone, according to Dr. Magill and her associates.
The study used data collected during 1-day prevalence surveys at 183 U.S. acute care hospitals and involving 11,282 patients.
FROM JAMA
Pertussis cases at highest level since 1950s
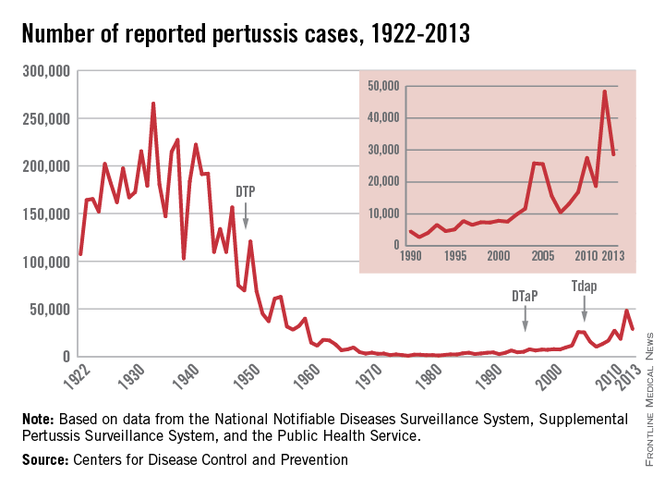
There were more than 48,000 cases of pertussis in the United States in 2012, the highest number since 1955, the CDC reported.
After a low of 1,010 cases in 1976, the annual number of pertussis cases grew slowly through the 1980s and 1990s, with 2002 being the last year there were fewer than 10,000 reported pertussis cases. The number of cases dropped in 2013, although the 28,639 cases was the second highest since 1959. There were 20 pertussis deaths in 2012 and 9 in 2013, the CDC data show.
The highest rate of infection is in children aged less than 6 months: 126.7/100,000 in 2012.That year, children aged 7-10 years had the second highest rate at 58.5/100,000, with children aged 11-19 years at 38/100,000, and children aged 1-6 years at 34.1/100,000, according to the CDC. Overall U.S. incidence was 15.4/100,000.
Things improved some in 2013. Children aged less than 6 months still had the highest rate of infection at 138/100,000. Children aged 7-10 years had the second highest rate at 26.2/100,000, followed by children aged 1-6 years at 18.8/100,000, and children aged 11-19 years at 17.6/100,00. Overall U.S. incidence was 7.69/100,000.
The CDC data were collected by the National Notifiable Disease Surveillance System and the Supplemental Pertussis Surveillance System.

For low-income urban adolescents, school-based health centers act as medical homes
School-based health centers met the criteria of a medical home for adolescents in a low-income urban population and often function as the primary source of care for students, according to a recent study.
The study surveyed students and parents of students who attended 1 of 10 middle and secondary schools in Denver with a school-based health center (SBHC), Dr. Sean O’Leary of the University of Colorado, Aurora, and his associates said. A total of 197 adolescents who had visited an SBHC during the 2011-2012 school year answered a survey, and 181 parents of different adolescents who also had visited an SBHC responded to a different, but related survey (Pediatrics 2014:134:5:1-8 [doi:10.1542/peds.2014-0296]).
Both surveys asked questions about how their experiences at SBHCs related to seven criteria of the medical home: accessibility, patient- and family-centeredness, continuity, comprehensiveness, coordination of care, compassion, and cultural effectiveness. At least two-thirds of both adolescents and parents responded favorably in all categories. Nearly 80% of adolescents and parents reported SBHCs were easily accessible, and more than 80% reported SBHCs were a kind and caring place to be seen for health care and were sensitive to cultural values. Nearly all students reported that they were very or somewhat satisfied with the services they had received. The top three services for which students sought care were illnesses, vaccines, and education about sexual health.
SBHCs were already functioning as the primary source of care for a third of students, Dr. O’Leary and his associates reported. Denver Health and Hospital Authority clinics were the second-most-common primary care source, with a reported rate of about 45% of students who did not use an SBHC as a primary care source, followed by private physicians’ offices, Kaiser Permanente clinics, other places, none, and emergency departments. Students who had no health insurance were more likely to use SBHCs as the primary source of care, and parents who valued access to mental health services also were more likely to report an SBHC was the primary source of care for their child.
While a majority of adolescents in the survey reported another source of primary care, more than half reported receiving a regular checkup at their SBHC, a service typically provided by the primary care provider, and two-thirds of those who identified another primary care source visited an SBHC at least three times. This raises “the possibility that the SBHC was functionally the primary source of care” for more students then those who reported it, Dr. O’Leary and his associates noted.
The authors had no relevant financial disclosures to report.
FROM PEDIATRICS
Key clinical point: SBHCs can act as medical homes for low-income urban adolescents and are currently the primary source of care for a large number of students.
Major finding: Two-thirds of students and parents of students responded favorably to questions about their SBHC through seven identified criteria of a medical home, as defined by the American Academy of Pediatrics.
Data source: 197 adolescent students and 181 parents of students who attended 1 of 10 middle and secondary schools in Denver and who had visited an SBHC during the 2011-2012 school year.
Disclosures: The authors had no disclosures to report.
Opioid-poisoning deaths rose fastest in 55- to 64-year-olds
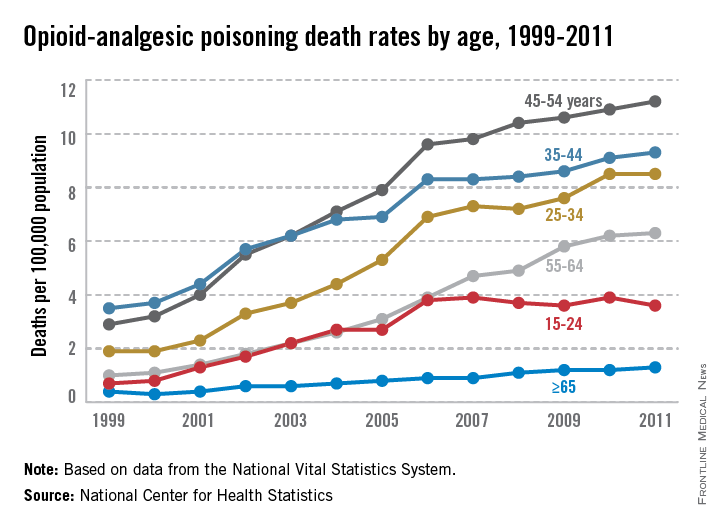
People aged 45-54 years had the highest rate of opioid-analgesic poisoning deaths in the United States in 2011, while people aged 55-64 years experienced the largest rise in deaths from opioid analgesics from 1999 to 2011, according to a report from the National Center for Health Statistics.
In 1999, the death rate for opioid analgesics was 1 per 100,000 people for adults aged 55-64 years. By 2011, this rate had increased to 6.3 per 100,000 people. This was the fourth-highest rate overall among reported age groups, with adults aged 45-54, 35-44, and 25-34 having higher rates, and people aged 15-24 and 65 and older having lower rates. The rate of increase slowed for all groups after 2006, except for people aged 15-24, whose death rate from opioid analgesics did not change significantly from 2006 to 2011, the NCHS reported.

Non-Hispanic white adults had the largest increase in the rate of opioid-analgesic poisoning deaths among measured ethnicities, rising from 1.6 per 100,000 in 1999 to 7.3 in 2011. The death rate for non-Hispanic black adults increased from 0.9 per 100,000 in 1999 to 2.3 in 2011. Hispanic adults did not see a large rate increase, with 1.7 per 100,000 deaths in 1999 and 2 per 100,000 deaths in 2011 attributed to opioid-analgesic poisoning, according to data from the National Vital Statistics System.
People aged 45-54 years had the highest rate of opioid-analgesic poisoning deaths in the United States in 2011, while people aged 55-64 years experienced the largest rise in deaths from opioid analgesics from 1999 to 2011, according to a report from the National Center for Health Statistics.
In 1999, the death rate for opioid analgesics was 1 per 100,000 people for adults aged 55-64 years. By 2011, this rate had increased to 6.3 per 100,000 people. This was the fourth-highest rate overall among reported age groups, with adults aged 45-54, 35-44, and 25-34 having higher rates, and people aged 15-24 and 65 and older having lower rates. The rate of increase slowed for all groups after 2006, except for people aged 15-24, whose death rate from opioid analgesics did not change significantly from 2006 to 2011, the NCHS reported.
Non-Hispanic white adults had the largest increase in the rate of opioid-analgesic poisoning deaths among measured ethnicities, rising from 1.6 per 100,000 in 1999 to 7.3 in 2011. The death rate for non-Hispanic black adults increased from 0.9 per 100,000 in 1999 to 2.3 in 2011. Hispanic adults did not see a large rate increase, with 1.7 per 100,000 deaths in 1999 and 2 per 100,000 deaths in 2011 attributed to opioid-analgesic poisoning, according to data from the National Vital Statistics System.
Patient-centered medical homes spend more, earn more
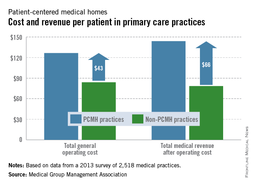
Patient-centered medical home practices spend about a third more per patient than non–medical home practices but earn nearly twice as much per patient after operating costs, the Medical Group Management Association reported.
Total operating costs for patient-centered medical home (PCMH) practices per patient in 2013 were, on average, $127, while non-PCMH practices spent $84 per patient. After operating costs, the total medical revenue for PCMH practices was $144 per patient, with non-PCMH practices earning $78 per patient – only 54% of what PCMH practices earned per patient, the MGMA said.
Total medical revenue after operating costs among primary care single-specialty practices was highest in the Midwest at just over $199,000 per physician, with the South lowest at $54,000, according to the MGMA. While primary care physicians in the East earned the least, primary care practices in the East earned $165,000 per physician, more than triple the revenue in the South and twice as much as in the West, where total medical revenue was just under $82,000 per physician.
The MGMA data were collected from 2,518 medical groups that responded to an annual survey.

Publication bias still strong in rheumatoid arthritis trials
Randomized, controlled trials of patients with rheumatoid arthritis are published sooner and more likely to be published if the outcome is positive, indicating publication bias, a recent study found.
The study surveyed ClinicalTrials.gov for randomized, controlled trials (RCTs) of patients with rheumatoid arthritis (RA), finding 143 eligible studies registered before 2012 and completed before 2010. The outcome of 16 trials could not be ascertained. Among the 127 RCTs whose outcomes were known, 74 had a positive result, and 53 were negative, according to Dr. Nasim A. Khan of the University of Arkansas, Little Rock, and his associates (Arthritis Rheumatol. 2014;66:2664-74). The researchers also found that trial registration at ClinicalTrials.gov increased dramatically after July 2005, when the International Committee of Medical Journal Editors made trial registration in a public registry a requirement for publication, with 37 trials being registered before 2006, and 106 registered during 2006-2009.
Of the 143 trials, 95 studies had been published, with 64 of these having positive results and 31 having negative results. Only 10 trials with positive outcomes had not been published, compared with 22 RCTs with negative outcomes, Dr. Khan and his associates reported. The median time to publication for studies with a positive outcome was 30 months, while studies with a negative outcome had a median time to publication of 49 months.
The rate of publication was slightly higher for studies completed after 2005, with 65% of studies completed before 2006 being published, 78% of studies completed from 2006-2007 being published, and 59% of studies completed from 2008-2009 being published. Some of those later trials may still be published, Dr. Khan and his fellow investigators conceded. The time to publication was much slower for studies completed before 2006, taking a median time of 55 months. Studies completed from 2006-2007 took 30 months to publication, and studies completed from 2008-2009 took 34 months.
The authors noted that while progress has been made to increase transparency, there are still issues within the system, and that “efforts must be made to increase awareness of the existence and drawbacks of publication bias among current and future physicians, scientists, individuals working in the pharmaceutical industry and insurances companies, and patients.”
The authors had no disclosures to report.
FROM ARTHRITIS & RHEUMATOLOGY
Key clinical point: Publication bias is still a significant problem in rheumatoid arthritis RCTs despite implementation of trial registration in 2005 by the International Committee of Medical Journal Editors.
Major finding: 86% of studies with positive outcomes were published, compared with 54% of studies with negative outcomes, and the median time to publication was an estimated 19 months faster for studies with positive outcomes.
Data source: 143 rheumatoid arthritis RCTs received by ClinicalTrials.gov by Dec. 31, 2011, and completed by Dec. 31, 2009.
Disclosures: The authors had no disclosures to report.
Chlamydia Rate Higher in Blacks Than in Whites, Mexican-Americans
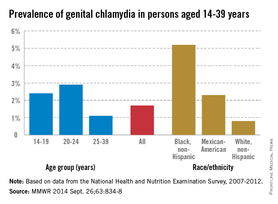
The prevalence of genital chlamydia for blacks is three times higher than is the national average for people aged 14-39 years, the Centers for Disease Control and Prevention reported.
The national prevalence of Chlamydia trachomatis for all people aged 14-39 years was 1.7% during 2007-2012. At 5.2%, non-Hispanic blacks had the highest rate, with non-Hispanic whites at lowest prevalence at 0.8% and Mexican-Americans at 2.3%. There was relatively little difference between the groups aged 14-19 years and aged 20-24 years, with the former at 2.4% and the latter at 2.9%; people aged 25-39 years had an infection rate of 1.1%, according to the CDC (MMWR 2014, Sept. 26;63:834-8).

The prevalence of chlamydia infection for all women aged 14-24 years was higher than the national average, despite being “the population targeted for routine screening” of the disease, the CDC said. The overall rate of chlamydia prevalence in women aged 14-24 years was 4.7%, with non-Hispanic blacks reporting a prevalence of 13.5%, Mexican-Americans of 4.5%, and non-Hispanic whites of 1.8%.
The CDC report used data collected by the National Health and Nutrition Examination Survey.
The prevalence of genital chlamydia for blacks is three times higher than is the national average for people aged 14-39 years, the Centers for Disease Control and Prevention reported.
The national prevalence of Chlamydia trachomatis for all people aged 14-39 years was 1.7% during 2007-2012. At 5.2%, non-Hispanic blacks had the highest rate, with non-Hispanic whites at lowest prevalence at 0.8% and Mexican-Americans at 2.3%. There was relatively little difference between the groups aged 14-19 years and aged 20-24 years, with the former at 2.4% and the latter at 2.9%; people aged 25-39 years had an infection rate of 1.1%, according to the CDC (MMWR 2014, Sept. 26;63:834-8).
The prevalence of chlamydia infection for all women aged 14-24 years was higher than the national average, despite being “the population targeted for routine screening” of the disease, the CDC said. The overall rate of chlamydia prevalence in women aged 14-24 years was 4.7%, with non-Hispanic blacks reporting a prevalence of 13.5%, Mexican-Americans of 4.5%, and non-Hispanic whites of 1.8%.
The CDC report used data collected by the National Health and Nutrition Examination Survey.
FROM MMWR

Chlamydia rate higher in blacks than in whites, Mexican-Americans
The prevalence of genital chlamydia for blacks is three times higher than is the national average for people aged 14-39 years, the Centers for Disease Control and Prevention reported.
The national prevalence of Chlamydia trachomatis for all people aged 14-39 years was 1.7% during 2007-2012. At 5.2%, non-Hispanic blacks had the highest rate, with non-Hispanic whites at lowest prevalence at 0.8% and Mexican-Americans at 2.3%. There was relatively little difference between the groups aged 14-19 years and aged 20-24 years, with the former at 2.4% and the latter at 2.9%; people aged 25-39 years had an infection rate of 1.1%, according to the CDC (MMWR 2014, Sept. 26;63:834-8).
The prevalence of chlamydia infection for all women aged 14-24 years was higher than the national average, despite being “the population targeted for routine screening” of the disease, the CDC said. The overall rate of chlamydia prevalence in women aged 14-24 years was 4.7%, with non-Hispanic blacks reporting a prevalence of 13.5%, Mexican-Americans of 4.5%, and non-Hispanic whites of 1.8%.
The CDC report used data collected by the National Health and Nutrition Examination Survey.
FROM MMWR

Physician income in 2013: The East earned least
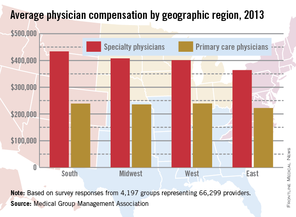
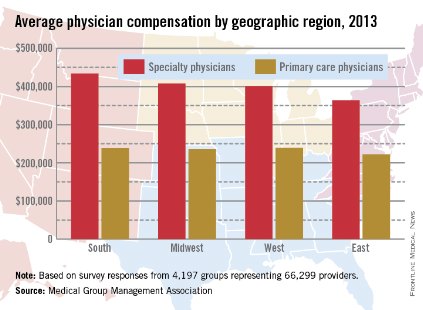
Both primary care and specialty care physicians in the Eastern United States had the lowest total compensation of any region in 2013, the Medical Group Management Association reported.
Specialists in the East earned an average of $364,000, and primary care physicians earned $222,000. Compensation for specialists was highest in the South, at $434,000, with primary care physicians there earning $238,611. Primary care physicians in the West earned slightly more, reporting the highest total at $239,968, with specialists earning an average of $401,000. In the Midwest, specialists earned almost $408,000, and primary care physicians averaged $236,000, according to the MGMA.
Nonmetropolitan areas reported the lowest compensation rates by population, with primary physicians earning more than $223,000 and specialists earning $337,000 in areas with less than 50,000 residents. The highest-earning areas by population were metropolitan areas of 50,000 to 250,000 people, where primary care physicians earned $241,000 and specialty physicians earned $422,000. Both specialists and nonspecialists in metropolitan areas of more than 1,000,000 people averaged marginally more than physicians in areas of between 250,001 and 1,000,000 people.
Compensation rates for certified registered nurse anesthetists, physician assistants, and nurse practitioners were highest in the Midwest and West, and lowest in the East, except for nurse practitioners.
The MGMA data were collected from almost 4,200 medical groups representing more than 66,000 providers.
Preventive Care Getting Past Millions of American Children
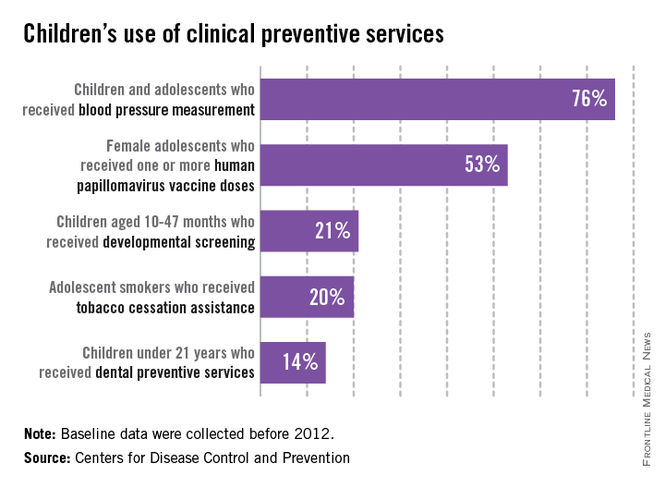
Large numbers of children in the United States did not receive basic clinical preventive care before 2012, according to the Centers for Disease Control and Prevention.
Almost a quarter of children aged 3-17 years who made clinic visits in 2009-2010 had no record of blood pressure measurement. In 2011, 47% of adolescent females had not received their first HPV vaccination. Only about 21% of parents with children aged 10-47 months reported completing a developmental screen in 2007, and 20% of adolescent smokers received advice on stopping tobacco use in 2004-2010. More than half of children reported not visiting the dentist in the past year in 2009, and only 14% of children received dental preventive measures in that time, the CDC said.
"Parents need to know that many clinical preventive services for their children, such as screening and vaccination, are available for free with many health plans," Dr. Lorraine Yeung, a medical epidemiologist with the CDC’s National Center on Birth Defects and Developmental Disabilities, said in the CDC statement.
The supplement to this week’s MMWR provides a baseline for care before implementation of the Affordable Care Act and is the second in a series of reports meant to measure the progress in increasing the use of preventive care (MMWR 2014 Sept. 10;63[suppl. 2]:1-107).
