User login
Lucas Franki is an associate editor for MDedge News, and has been with the company since 2014. He has a BA in English from Penn State University and is an Eagle Scout.
2015 class of ‘blockbuster’ drugs has plenty of heart
Of the new medications set to be released in 2015, three cardiovascular drugs could achieve “blockbuster” sales of over $1 billion by 2019, according to a report from Thomson Reuters.
Of the “Drugs to Watch in 2015,” those for the cardiovascular system are projected to reach nearly $10 billion by 2019.
Two PCSK9 inhibitors, alirocumab and evolocumab, are expected to gain Food and Drug Administration approval as early as this summer and become the next cholesterol-lowering blockbusters. Each has shown unprecedented LDL cholesterol lowering as well as reductions in adverse cardiovascular events, and the report projects sales of $4.4 billion and $1.9 billion, respectively. This $2.5-billion disparity between evolocumab and alirocumab (trade name Praluent) may be explained by alirocumab’s expected arrival on the market a month sooner.
The novel heart failure drug LCZ-696 (sacubitril and valsartan) has projected sales of $3.7 billion through 2019, Thomson Reuters said. The angiotensin receptor neprilysin inhibitor reduced cardiovascular death and heart failure hospitalization by 20%, compared with enalapril, in heart failure patients in the large PARADIGM-HF trial.
Overall, 11 drugs are expected to reach $1 billion in sales by 2019, many more than the three blockbusters predicted from the 2014 stock of drugs. With projected sales of nearly $5.7 billion for 2019, the melanoma drug Opdivo (nivolumab) is at the head of a large 2015 blockbuster class. However, the two highest-selling new drugs from 2014, Sovaldi (sofosbuvir) and Harvoni (sofosbuvir plus ledipasvir) – both HCV drugs – are each predicted to reach sales of over $10 billion by 2017, far exceeding anything from 2015, the report said.
With estimated sales of $2.8 billion, the breast cancer drug Ibrance (palbociclib) is the second oncologic drug making the blockbuster list, with the first noncancer or non-CV drug – lumacaftor plus ivacaftor for cystic fibrosis – rounding out the top five with projected sales of $2.7 billion by 2019.
The Thomson Reuters Market Insight Report used data collected from 2013 through early February 2015.

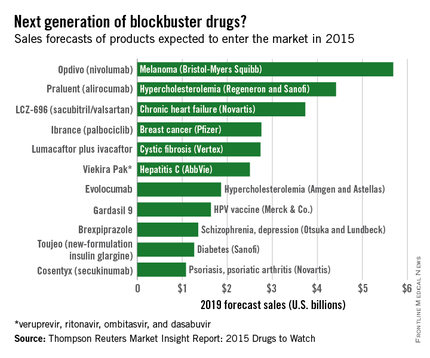
Class of 2015: New drugs projected to earn billions and billions
Of all drugs to be released in 2015, the melanoma drug Opdivo (nivolumab) is expected to have the brightest future, according to a report from Thomson Reuters.
With sales forecast to reach nearly $5.7 billion by 2019, Opdivo is at the head of a large 2015 “blockbuster” drug class. Opdivo is followed by a pair of drugs for the cardiovascular system: Praluent (alirocumab) for hypercholesterolemia with projected sales of $4.4 billion and LCZ-696 (sacubitril and valsartan) for chronic heart failure with projected 2019 sales of $3.7 billion, Thomson Reuters said.

With estimated sales of $2.8 billion, the breast cancer drug Ibrance (palbociclib) is the second oncologic drug making the blockbuster list, with the first noncancer or non-CV drug – lumacaftor plus ivacaftor for cystic fibrosis – rounding out the Top 5 with projected sales of $2.7 billion by 2019.
Next comes Viekira Pak (ombitasvir, paritaprevir, and ritonavir tablets, copackaged with dasabuvir tablets), a hepatitis C virus drug with estimated 2019 sales of $2.5 billion, followed by the hypercholesterolemia/hyperlipidemia drug evolocumab, with projected sales of $1.9 billion. This $2.5 billion disparity between evolocumab and Praluent may be explained by Praluent’s arrival on the market a month sooner, and also because Praluent had a reduced rate of cardiac death, heart attack, and stroke in a phase III trial, a point likely to be relevant to most patients, according to the report.
Overall, 11 drugs are expected to reach $1 billion in sales by 2019, many more than the three blockbusters predicted from the 2014 stock of drugs. However, the two highest-selling new drugs from 2014, Sovaldi (sofosbuvir) and Harvoni (sofosbuvir plus ledipasvir) – both HCV drugs – are each predicted to reach sales of more than $10 billion by 2017, far exceeding anything from 2015, the report said.
The Thomson Reuters Market Insight Report used data collected from 2013 through early February 2015.
Of all drugs to be released in 2015, the melanoma drug Opdivo (nivolumab) is expected to have the brightest future, according to a report from Thomson Reuters.
With sales forecast to reach nearly $5.7 billion by 2019, Opdivo is at the head of a large 2015 “blockbuster” drug class. Opdivo is followed by a pair of drugs for the cardiovascular system: Praluent (alirocumab) for hypercholesterolemia with projected sales of $4.4 billion and LCZ-696 (sacubitril and valsartan) for chronic heart failure with projected 2019 sales of $3.7 billion, Thomson Reuters said.
With estimated sales of $2.8 billion, the breast cancer drug Ibrance (palbociclib) is the second oncologic drug making the blockbuster list, with the first noncancer or non-CV drug – lumacaftor plus ivacaftor for cystic fibrosis – rounding out the Top 5 with projected sales of $2.7 billion by 2019.
Next comes Viekira Pak (ombitasvir, paritaprevir, and ritonavir tablets, copackaged with dasabuvir tablets), a hepatitis C virus drug with estimated 2019 sales of $2.5 billion, followed by the hypercholesterolemia/hyperlipidemia drug evolocumab, with projected sales of $1.9 billion. This $2.5 billion disparity between evolocumab and Praluent may be explained by Praluent’s arrival on the market a month sooner, and also because Praluent had a reduced rate of cardiac death, heart attack, and stroke in a phase III trial, a point likely to be relevant to most patients, according to the report.
Overall, 11 drugs are expected to reach $1 billion in sales by 2019, many more than the three blockbusters predicted from the 2014 stock of drugs. However, the two highest-selling new drugs from 2014, Sovaldi (sofosbuvir) and Harvoni (sofosbuvir plus ledipasvir) – both HCV drugs – are each predicted to reach sales of more than $10 billion by 2017, far exceeding anything from 2015, the report said.
The Thomson Reuters Market Insight Report used data collected from 2013 through early February 2015.
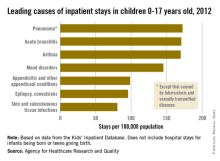
Respiratory Disorders Most Common Cause of Childhood Hospitalization
The three most common causes of nonneonatal and nonmaternal hospitalization in 2012 for children under 18 years were all respiratory disorders, according to a report from the Agency for Healthcare Research and Quality.
Pneumonia was the most common cause of hospitalization in children, with stays occurring at a rate of 169/100,000 population. There was very little difference in the rate between pneumonia and the next two most common diagnoses, acute bronchitis and asthma, which occurred at a rate of 168/100,000 and 167/100,000, respectively.
Mood disorders were the most common nonrespiratory and nonmaternal hospitalization diagnosis, with a hospital admission incidence of 144/100,000 population. This was followed by appendicitis (97/100,000), epilepsy and convulsions (95/100,000), and skin and subcutaneous tissue infections (80/100,000). The overall rate of hospitalization in children under age 18 years for nonneonatal and nonmaternal diagnoses was just over 2,500/100,000.
The incidence of six of the seven most common causes of hospitalization, and all but 1 of the 24 reported diagnostic categories, either decreased or remained steady from 2000 to 2012. Only skin and subcutaneous tissue conditions saw a significant increase in that time period. “Understanding the reasons why children are hospitalized and examining trends over time is critical to inform clinical practice and health policy,” the researchers commented.
The AHRQ report used data collected by the Healthcare Cost and Utilization Project Kids’ Inpatient Database.

Respiratory disorders most common cause of childhood hospitalization
The three most common causes of nonneonatal and nonmaternal hospitalization in 2012 for children under 18 years were all respiratory disorders, according to a report from the Agency for Healthcare Research and Quality.
Pneumonia was the most common cause of hospitalization in children, with stays occurring at a rate of 169/100,000 population. There was very little difference in the rate between pneumonia and the next two most common diagnoses, acute bronchitis and asthma, which occurred at a rate of 168/100,000 and 167/100,000, respectively.
Mood disorders were the most common nonrespiratory and nonmaternal hospitalization diagnosis, with a hospital admission incidence of 144/100,000 population. This was followed by appendicitis (97/100,000), epilepsy and convulsions (95/100,000), and skin and subcutaneous tissue infections (80/100,000). The overall rate of hospitalization in children under age 18 years for nonneonatal and nonmaternal diagnoses was just over 2,500/100,000.
The incidence of six of the seven most common causes of hospitalization, and all but 1 of the 24 reported diagnostic categories, either decreased or remained steady from 2000 to 2012. Only skin and subcutaneous tissue conditions saw a significant increase in that time period. “Understanding the reasons why children are hospitalized and examining trends over time is critical to inform clinical practice and health policy,” the researchers commented.
The AHRQ report used data collected by the Healthcare Cost and Utilization Project Kids’ Inpatient Database.

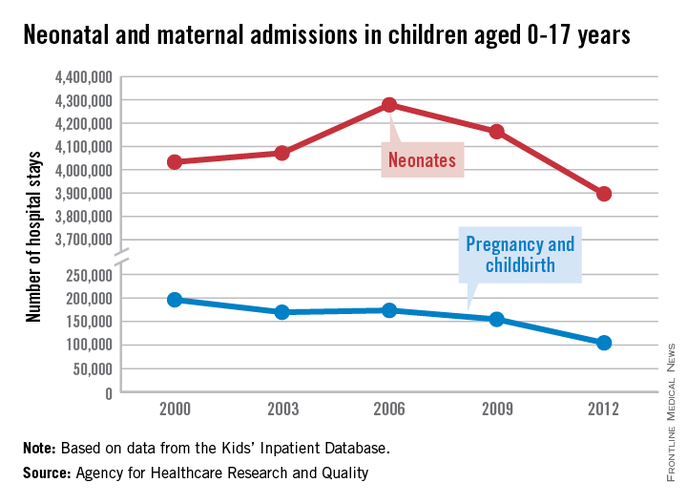
Neonatal and teen maternal hospital admissions falling
The number of neonatal and maternal hospitalizations in children less than 18 years old fell from 2000 to 2012, with maternal hospital stays in teenagers dropping significantly, according to a report from the Agency for Healthcare Research and Quality.
From 2000 to 2006, the number of neonatal hospitalizations increased by about 250,000, rising from slightly more than 4 million to just under 4.3 million. From 2006 to 2012, the number dropped significantly, dipping below the 2000 level to about 3.9 million. Overall, neonatal hospitalizations fell by about 140,000 from 2000 to 2012, or 3.3%, the AHRQ reported.
Maternal hospital stays for teenage girls dropped significantly from 2000 to 2012, despite a small rise from 2003 to 2006. There were just over 196,000 maternal hospitalizations in 2000, but by 2012, the number fell to less than 105,000, a decrease of about 47%. More than half of the decrease occurred in the last 3 years measured, with maternal hospitalizations falling by 50,000 from 2009 to 2012.
There were 5.85 million total hospitalizations in 2012 of children under 18 years. Of these, about two-thirds were neonatal related, while maternal hospitalizations accounted for less than 2% of the total, according to the AHRQ.
The AHRQ report used data collected by the Healthcare Cost and Utilization Project Kids’ Inpatient Database.
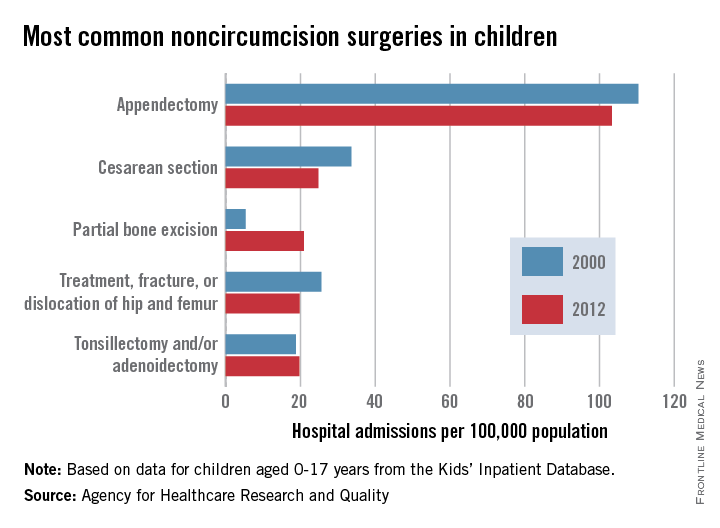
Circumcision, appendectomy most common pediatric surgeries
Appendectomies were the most common noncircumcision surgery performed during hospital inpatient stays on children aged 0-17 years in 2012, according to a report from the Agency for Healthcare Research and Quality.
With a rate of 103/100,000 population in 2012, appendectomy procedures were just over four times more common than the next procedure, cesarean section (25/100,000). The procedure rate for partial bone excision was 21/100,000, and treatment of a fractured or dislocated hip or femur and tonsillectomy and/or adenoidectomy were both 20.
The number of cesarean sections, appendectomies, and fractured or dislocated hip or femur surgeries decreased significantly from their 2000 level; tonsillectomy/adenoidectomy procedures remained steady. The number of partial bone excisions increased dramatically, however, rising more than 300% from 2000 to 2012.
Circumcisions were, by far, the most common surgery performed on children, however – a rate of 1,441 hospital stays per 100,000 in 2012, nearly 14 times higher than that of appendectomies. The circumcision rate represents a nearly 10% drop from 2000, though, when it was 1,593/100,000.
The AHRQ report used data collected by the Healthcare Cost and Utilization Project Kids’ Inpatient Database.
|

Uninsured made coverage gains from 2013 to 2014
A significantly higher percentage of uninsured adults aged 18-64 years reported that they gained health insurance in 2014, compared with 2013, according to a report from the Agency for Healthcare Research and Quality.
Between the first part of 2013 and the first part of 2014, just over 30% of uninsured nonelderly adults gained health insurance. For a similar period of time between 2012 and 2013, less than 25% of uninsured people gained health insurance. There was almost no difference in the percentage of insured adults who lost insurance for both years, with 6% losing insurance in 2013 and 5.5% losing insurance in 2014, the AHRQ reported.
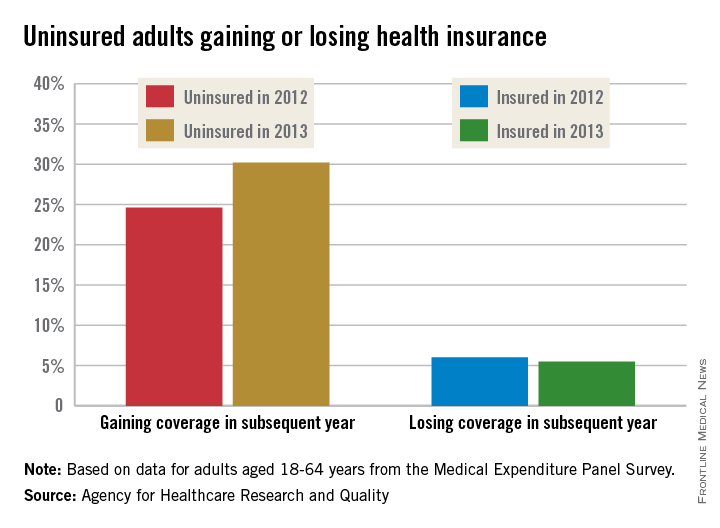
Since most of the Medical Expenditure Panel Survey (MEPS) interviews were completed in the first 3 months of the year, before the marketplace open enrollment period ended, the MEPS data on which the report is based “reflect some, but not all, of the increases in coverage obtained through the Affordable Care Act’s Health Insurance Marketplaces,” the AHRQ noted.
The greatest increase in newly insured adults among the measured groups was in adults in good health, for whom the percentage increased from 19.4% in 2013 to 28.6% in 2014. The greatest decrease in insurance coverage lost was in Hispanic adults, for whom the percentage fell from just over 12% to just under 9%.
States that expanded Medicare saw an increase in newly insured adults, as did states that did not expand Medicare (27% in 2013 vs. 33% in 2014 in Medicare expansion states; 22% in 2013 vs. 28% in 2014 in nonexpansion states). States that did not expand, however, saw a slight increase of adults who had lost insurance between the first parts of 2013 and 2014 (6.8%), compared with 2012 and 2013 (6.4%), the AHRQ reported.
A significantly higher percentage of uninsured adults aged 18-64 years reported that they gained health insurance in 2014, compared with 2013, according to a report from the Agency for Healthcare Research and Quality.
Between the first part of 2013 and the first part of 2014, just over 30% of uninsured nonelderly adults gained health insurance. For a similar period of time between 2012 and 2013, less than 25% of uninsured people gained health insurance. There was almost no difference in the percentage of insured adults who lost insurance for both years, with 6% losing insurance in 2013 and 5.5% losing insurance in 2014, the AHRQ reported.
Since most of the Medical Expenditure Panel Survey (MEPS) interviews were completed in the first 3 months of the year, before the marketplace open enrollment period ended, the MEPS data on which the report is based “reflect some, but not all, of the increases in coverage obtained through the Affordable Care Act’s Health Insurance Marketplaces,” the AHRQ noted.
The greatest increase in newly insured adults among the measured groups was in adults in good health, for whom the percentage increased from 19.4% in 2013 to 28.6% in 2014. The greatest decrease in insurance coverage lost was in Hispanic adults, for whom the percentage fell from just over 12% to just under 9%.
States that expanded Medicare saw an increase in newly insured adults, as did states that did not expand Medicare (27% in 2013 vs. 33% in 2014 in Medicare expansion states; 22% in 2013 vs. 28% in 2014 in nonexpansion states). States that did not expand, however, saw a slight increase of adults who had lost insurance between the first parts of 2013 and 2014 (6.8%), compared with 2012 and 2013 (6.4%), the AHRQ reported.

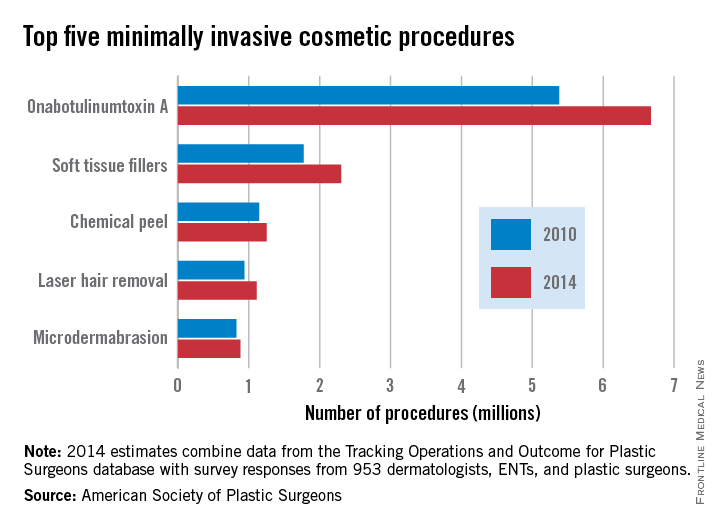
Minimally invasive cosmetic procedures climb by 20% since 2010
The number of minimally invasive cosmetic procedures increased by well over 2 million from 2010 to 2014, according to a report from the American Society of Plastic Surgeons (ASPS).
Almost 14 million cosmetic procedures were performed in 2014, a 20% increase from 11.6 million in 2010. OnabotulinumtoxinA injection was by far the most common procedure, with 6.7 million cases accounting for nearly half of all the cosmetic minimally invasive procedures in 2014. In addition, with a rise from 5.4 million in 2010, onabotulinumtoxinA injections accounted for approximately half of the overall growth in minimally invasive procedures from 2010 to 2014.
Although all of the five most common minimally invasive cosmetic procedures increased from 2010 to 2014, the number of microdermabrasions decreased from 2013 to 2014, from 970,000 to approximately 880,000. Soft tissue fillers saw the greatest relative change (about 30%), increasing from just under 1.8 million to about 2.3 million.
Overall, the number of cosmetic surgical procedures (including minimally invasive procedures) increased from 1.56 million to 1.68 million from 2010 to 2014, but three of the five most common surgeries in 2014 – breast augmentation, rhinoplasty, and eyelid surgery – decreased, with the number of rhinoplasties falling by nearly 14%. Of the remaining two most common surgeries, the number of liposuctions increased by approximately 4%, and face-lifts increased by nearly 14%.
The ASPS report used data from the society’s Tracking Operations and Outcomes for Plastic Surgeons database and survey results from 953 board-certified physicians.

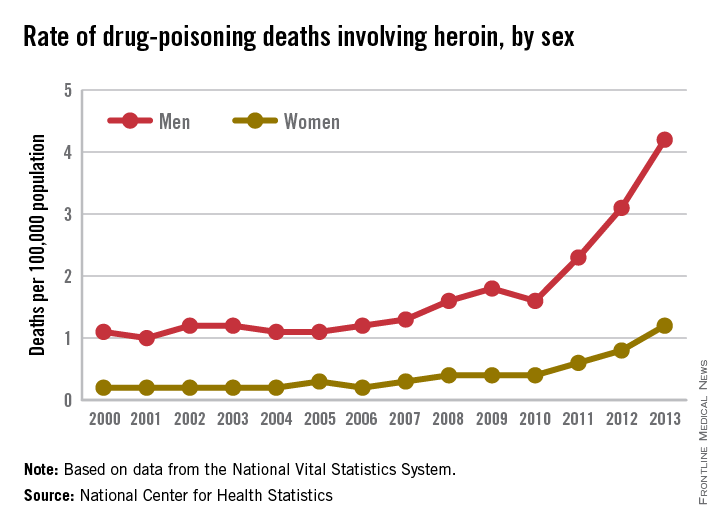
Heroin overdoses up dramatically since 2010
Drug-poisoning deaths involving heroin have soared since 2000, and most of the increase occurred since 2010, according to a report from the National Center for Health Statistics.
From 2010 to 2013, the rate of heroin overdose deaths increased 163% for men, from a rate of 1.6/100,000 population in 2010 to 4.2 in 2013. For women, the death rate increased by 200%, from 0.4/100,000 in 2010 to 1.2/100,000 in 2013. From 2000 to 2010, however, the rate of increase was much slower, with the death rate increasing from 1.1 to 1.6 for men and from 0.2 to 0.4 for women.

The overall rate for heroin overdose from 2000 to 2013 increased from 0.7 to 2.7/100,000. Most of this increase occurred from 2010 to 2013: From 2000 to 2010, the death rate increased to only 1/100,000, a growth rate of 6%, but after 2010, the rate grew by 37% per year, the NCHS reported.
In 2013, non-Hispanic whites aged 18-44 years had the highest heroin poisoning death rate among measured racial/ethnic groups at 7/100,000. In 2000, older, non-Hispanic blacks aged 45-64 years had the highest death rate among the reported racial/ethnic groups at 2/100,000. The death rate for whites aged 18-44 in 2000 was 1.2/100,000, meaning that the death rate increased by 483% from 2000 to 2013. For non-Hispanic blacks aged 45-64, the death rate in 2013 was 4.9, an increase of 145%.
The number of heroin-related overdose deaths climbed in every region of the country from 2000 through 2013. The largest change in heroin overdose by region occurred in the Midwest, where the death rate rose from 0.4/100,000 in 2000 to 4.3 in 2013, an increase of 975%, said the NCHS report, which used data collected by the National Vital Statistics System.
Drug-poisoning deaths involving heroin have soared since 2000, and most of the increase occurred since 2010, according to a report from the National Center for Health Statistics.
From 2010 to 2013, the rate of heroin overdose deaths increased 163% for men, from a rate of 1.6/100,000 population in 2010 to 4.2 in 2013. For women, the death rate increased by 200%, from 0.4/100,000 in 2010 to 1.2/100,000 in 2013. From 2000 to 2010, however, the rate of increase was much slower, with the death rate increasing from 1.1 to 1.6 for men and from 0.2 to 0.4 for women.
The overall rate for heroin overdose from 2000 to 2013 increased from 0.7 to 2.7/100,000. Most of this increase occurred from 2010 to 2013: From 2000 to 2010, the death rate increased to only 1/100,000, a growth rate of 6%, but after 2010, the rate grew by 37% per year, the NCHS reported.
In 2013, non-Hispanic whites aged 18-44 years had the highest heroin poisoning death rate among measured racial/ethnic groups at 7/100,000. In 2000, older, non-Hispanic blacks aged 45-64 years had the highest death rate among the reported racial/ethnic groups at 2/100,000. The death rate for whites aged 18-44 in 2000 was 1.2/100,000, meaning that the death rate increased by 483% from 2000 to 2013. For non-Hispanic blacks aged 45-64, the death rate in 2013 was 4.9, an increase of 145%.
The number of heroin-related overdose deaths climbed in every region of the country from 2000 through 2013. The largest change in heroin overdose by region occurred in the Midwest, where the death rate rose from 0.4/100,000 in 2000 to 4.3 in 2013, an increase of 975%, said the NCHS report, which used data collected by the National Vital Statistics System.
Males who experience teen dating violence more likely to attempt suicide
Male students who experienced both physical and sexual teen dating violence were about twice as likely to have attempted suicide in the previous 12 months than were females, according to a study published March 2 by JAMA Pediatrics.
The adjusted prevalence ratio (APR) for attempted suicide in males in grades 9-12 who had experienced both physical and sexual teen dating violence (TDV) was 9.3, compared with 4.7 for females, reported Kevin J. Vagi, Ph.D., and his associates at the division of violence prevention at the Centers for Disease Control and Prevention.
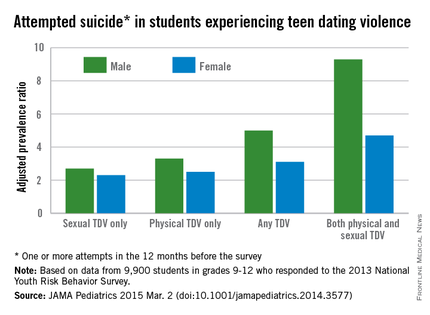
For males, the APR for attempted suicide was 3.3 among males who reported physical TDV only and 2.7 for sexual TDV only. For females, the APR for attempted suicide was 2.5 in those reporting physical TDV and 2.3 for those who experienced sexual TDV. The attempted-suicide APR for those who experienced any kind of teen dating violence was 5.0 for males and 3.1 for females, they said (JAMA Pediatrics 2015 Mar. 2 [doi:10.1001/jamapediatrics.2014.3577]).
Although males who experienced both physical and sexual TDV were slightly more likely than females to seriously consider suicide or to make suicide plans, the differences were much lower. The prevalence ratio for considering suicide was 3.7 for those males and 2.8 for those females, and the APR for making a suicide plan was 4.3 for those males and 3.8 for those females.
“These findings suggest that … there may be different health risks related to the type of violence experienced and that there may be a cumulative negative effect for victims experiencing both forms of TDV,” the CDC investigators said.
The study used data collected for the 2013 National Youth Risk Behavior Survey. The authors said they had no conflict of interest disclosures.
Male students who experienced both physical and sexual teen dating violence were about twice as likely to have attempted suicide in the previous 12 months than were females, according to a study published March 2 by JAMA Pediatrics.
The adjusted prevalence ratio (APR) for attempted suicide in males in grades 9-12 who had experienced both physical and sexual teen dating violence (TDV) was 9.3, compared with 4.7 for females, reported Kevin J. Vagi, Ph.D., and his associates at the division of violence prevention at the Centers for Disease Control and Prevention.
For males, the APR for attempted suicide was 3.3 among males who reported physical TDV only and 2.7 for sexual TDV only. For females, the APR for attempted suicide was 2.5 in those reporting physical TDV and 2.3 for those who experienced sexual TDV. The attempted-suicide APR for those who experienced any kind of teen dating violence was 5.0 for males and 3.1 for females, they said (JAMA Pediatrics 2015 Mar. 2 [doi:10.1001/jamapediatrics.2014.3577]).
Although males who experienced both physical and sexual TDV were slightly more likely than females to seriously consider suicide or to make suicide plans, the differences were much lower. The prevalence ratio for considering suicide was 3.7 for those males and 2.8 for those females, and the APR for making a suicide plan was 4.3 for those males and 3.8 for those females.
“These findings suggest that … there may be different health risks related to the type of violence experienced and that there may be a cumulative negative effect for victims experiencing both forms of TDV,” the CDC investigators said.
The study used data collected for the 2013 National Youth Risk Behavior Survey. The authors said they had no conflict of interest disclosures.
FROM JAMA PEDIATRICS
