User login
Clinical Endocrinology News is an independent news source that provides endocrinologists with timely and relevant news and commentary about clinical developments and the impact of health care policy on the endocrinologist's practice. Specialty topics include Diabetes, Lipid & Metabolic Disorders Menopause, Obesity, Osteoporosis, Pediatric Endocrinology, Pituitary, Thyroid & Adrenal Disorders, and Reproductive Endocrinology. Featured content includes Commentaries, Implementin Health Reform, Law & Medicine, and In the Loop, the blog of Clinical Endocrinology News. Clinical Endocrinology News is owned by Frontline Medical Communications.
addict
addicted
addicting
addiction
adult sites
alcohol
antibody
ass
attorney
audit
auditor
babies
babpa
baby
ban
banned
banning
best
bisexual
bitch
bleach
blog
blow job
bondage
boobs
booty
buy
cannabis
certificate
certification
certified
cheap
cheapest
class action
cocaine
cock
counterfeit drug
crack
crap
crime
criminal
cunt
curable
cure
dangerous
dangers
dead
deadly
death
defend
defended
depedent
dependence
dependent
detergent
dick
die
dildo
drug abuse
drug recall
dying
fag
fake
fatal
fatalities
fatality
free
fuck
gangs
gingivitis
guns
hardcore
herbal
herbs
heroin
herpes
home remedies
homo
horny
hypersensitivity
hypoglycemia treatment
illegal drug use
illegal use of prescription
incest
infant
infants
job
ketoacidosis
kill
killer
killing
kinky
law suit
lawsuit
lawyer
lesbian
marijuana
medicine for hypoglycemia
murder
naked
natural
newborn
nigger
noise
nude
nudity
orgy
over the counter
overdosage
overdose
overdosed
overdosing
penis
pimp
pistol
porn
porno
pornographic
pornography
prison
profanity
purchase
purchasing
pussy
queer
rape
rapist
recall
recreational drug
rob
robberies
sale
sales
sex
sexual
shit
shoot
slut
slutty
stole
stolen
store
sue
suicidal
suicide
supplements
supply company
theft
thief
thieves
tit
toddler
toddlers
toxic
toxin
tragedy
treating dka
treating hypoglycemia
treatment for hypoglycemia
vagina
violence
whore
withdrawal
without prescription
section[contains(@class, 'nav-hidden')]
footer[@id='footer']
div[contains(@class, 'pane-pub-article-imn')]
div[contains(@class, 'pane-pub-home-imn')]
div[contains(@class, 'pane-pub-topic-imn')]
div[contains(@class, 'panel-panel-inner')]
div[contains(@class, 'pane-node-field-article-topics')]
section[contains(@class, 'footer-nav-section-wrapper')]
Is pediatric subspecialty training financially worth it?
Pursuing fellowship training is often financially costly in terms of lifetime earnings, compared with starting a career as a general pediatrician immediately after residency, a report suggests.
Researchers found that most pediatric subspecialists – including those practicing neurology, pulmonology, and adolescent medicine – do not see a financial return from additional training because of the delays in receiving increased compensation and the repayment of educational debt.
“Most pediatric subspecialists don’t experience a relative increase in compensation after training compared to a general pediatrician, so there isn’t a financial benefit to additional training,” lead author Eva Catenaccio, MD, from the division of pediatric neurology, department of neurology, Johns Hopkins University, Baltimore, told this news organization.
The findings, published online March 8 in Pediatrics, contribute to the ongoing debate about the length of pediatric fellowship training programs. The data also provide evidence for the potential effect of a pediatric subspecialty loan repayment program.
Pediatric subspecialty training rarely pays off
However, not all practitioners in pediatric subspecialties would find themselves in the red relative to their generalist peers. Three subspecialties had a positive financial return: cardiology, critical care, and neonatology. Dr. Catenaccio explained that this may be because these subspecialties tend to be “inpatient procedure oriented, which are often more [lucrative] than outpatient cognitive–oriented subspecialties, such as pediatric infectious diseases, endocrinology, or adolescent medicine.”
Enrolling in a pediatric fellowship program resulted in lifetime financial returns that ranged from an increase of $852,129 for cardiology, relative to general pediatrics, to a loss of $1,594,366 for adolescent medicine, researchers found.
For the study, researchers calculated the financial returns of 15 pediatric subspecialties – emergency medicine, neurology, cardiology, critical care, neonatology, hematology and oncology, pulmonology, hospitalist medicine, allergy and immunology, gastroenterology, rheumatology, nephrology, adolescent medicine, infectious diseases, and endocrinology – in comparison with returns of private practice general pediatrics on the basis of 2018-2019 data on fellowship stipends, compensation, and educational debt.
They obtained most of the data from the Association of American Medical Colleges Survey of Resident/Fellow Stipends and Benefits, AAMC’s annual Medical School Faculty Salary Report, and the AAMC Medical School Graduation Questionnaire.
Richard Mink, MD, department of pediatrics, Harbor-UCLA Medical Center, Torrance, Calif., noted that it would have been helpful to have also compared the lifetime earnings of practitioners in pediatric subspecialties to academic general pediatricians and not just those in private practice.
The financial gap has worsened
To better understand which aspects of fellowship training have the greatest effect on lifetime compensation, Dr. Catenaccio and colleagues evaluated the potential effects of shortening fellowship length, eliminating school debt, and implementing a federal loan repayment plan. These changes enhanced the returns of cardiology, critical care, and neonatology – subspecialties that had already seen financial returns before these changes – and resulted in a positive financial return for emergency medicine.
The changes also narrowed the financial gap between subspecialties and general pediatrics. However, the remaining subspecialties still earned less than private practice pediatrics.
The new study is an update to a 2011 report, which reflected 2007-2008 data for 11 subspecialties. This time around, the researchers included the subspecialty of hospitalist medicine, which was approved as a board-certified subspecialty by the American Board of Pediatrics in 2014, as well as neurology, allergy and immunology, and adolescent medicine.
“I was most surprised that the additional pediatric subspecialties we included since the 2011 report followed the same general trend, with pediatric subspecialty training having a lower lifetime earning potential than general pediatrics,” Dr. Catenaccio said.
Comparing results from the two study periods showed that the financial gap between general pediatrics and subspecialty pediatrics worsened over time. For example, the financial return for pediatric endocrinology decreased an additional $500,000 between 2007 and 2018.
The researchers believe a combination of increased educational debt burden, slow growth in compensation, and changing interest rates over time have caused the financial differences between general pediatrics and subspecialty pediatrics to become more pronounced.
‘Pediatric subspecialty training is worth it!’
Despite the financial gaps, Dr. Catenaccio and colleagues say pediatric subspecialty training is still worthwhile but that policymakers should address these financial differences to help guide workforce distribution in a way that meets the needs of patients.
“I think pediatric subspecialty training is worth it,” said Dr. Catenaccio, who’s pursuing pediatric subspecialty training. “There are so many factors that go into choosing a specialty or subspecialty in medicine, including the desire to care for a particular patient population, interest in certain diseases or organ systems, lifestyle considerations, and research opportunities.”
But it’s also important for trainees to be aware of economic considerations in their decision-making.
Dr. Mink, who wrote an accompanying commentary, agrees that young clinicians should not make career decisions on the basis of metrics such as lifetime earning measures.
“I think people who go into pediatrics have decided that money is not the driving force,” said Dr. Mink. He noted that pediatricians are usually not paid well, compared with other specialists. “To me the important thing is you have to like what you’re doing.”
A 2020 study found that trainees who chose a career in pediatric pulmonology, a subspecialty, said that financial considerations were not the driving factor in their decision-making. Nevertheless, Dr. Mink also believes young clinicians should take into account their educational debt.
The further widening of the financial gap between general pediatrics and pediatric subspecialties could lead to shortages in the pediatric subspecialty workforce.
The authors and Dr. Mink have disclosed no relevant financial relationships.
A version of this article first appeared on Medscape.com.
Liver stiffness predicts hepatic events in NAFLD
Among patients with nonalcoholic fatty liver disease (NAFLD) and compensated advanced chronic liver disease, liver stiffness measurements (LSMs) are associated with risks of hepatic events, according to a retrospective analysis of more than 1,000 patients.
“[N]oninvasive markers that can predict liver disease severity and outcomes in patients with NAFLD and advanced fibrosis are a major unmet need,” wrote lead author Salvatore Petta, MD, of the University of Palermo, Italy, and colleagues. Their report is in Clinical Gastroenterology and Hepatology. “Data about the accuracy of LSM in the prediction of events in NAFLD, and especially in patients with NAFLD and F3-F4 fibrosis, are scarce.”
To address this knowledge gap, the investigators retrospectively analyzed data from 1,039 consecutive patients with NAFLD who had baseline LSMs of more than 10 kPa and/or histologically diagnosed F3-F4 fibrosis. Patients were prospectively recruited at 10 centers in 6 countries, then followed for a median of 35 months, ranging from 19 to 63 months.
All patients had their liver stiffness measured with an M or XL probe at baseline. In addition, approximately half of the patients (n = 533) had a follow-up measurement using the same method, generating a subgroup with changes in liver stiffness. “Improved” liver stiffness was defined as a decrease in LSM greater than 20% from baseline, “impaired” liver stiffness was defined as an increase in LSM greater than 20% from baseline, and “stable” liver stiffness was defined as a change falling between 20% lower and 20% higher than baseline.
At baseline, mean LSM was 17.6 kPa. Cox regression analysis revealed that baseline LSM was independently associated with HCC (hazard ratio, 1.03; 95% confidence interval, 1.00-1.04; P = .003), liver decompensation (HR, 1.03; 95% CI, 1.02-1.04; P < .001), and liver-related death (HR, 1.02; 95% CI, 1.00-1.03; P = .005), but not extrahepatic events.
According to the investigators, the association between LSM at baseline and risk of liver decompensation was maintained after adjustment for the severity of liver disease and for surrogate markers of portal hypertension, they noted. Furthermore, patients with a baseline LSM of at least 21 kPa – which indicates high risk of clinically significant portal hypertension (CSPH) – were at greater risk of liver decompensation than were those with an LSM less than 21 kPa (HR, 3.71; 95% CI, 1.89-6.78; P = .04).
In the subgroup with follow-up measurements, approximately half of the patients had an improved LSM (53.3%), while 27.2% had a stable LSM, and 19.5% had an impaired LSM, a pattern that was significantly associated with diabetes at baseline (P = .01).
“These data agree with the available literature identifying diabetes as a risk factor for liver disease progression and liver-related complications,” the investigators wrote.
Cox regression showed that, among those with follow-up LSM, changes in LSM were independently associated with HCC (HR, 1.72; 95% CI, 1.01-3.02; P = .04), liver decompensation (HR, 1.56; 95% CI, 1.05-2.51; P = . 04), liver-related mortality (HR, 1.96; 95% CI, 1.10-3.38; P = .02), and mortality of any cause (HR, 1.73; 95% CI, 1.11-2.69; P = .01).
These risks could be further stratified by level of change in liver stiffness, with greater impairment predicting greater risk: The crude rate of liver decompensation was 14.4% among those with impaired LSM, compared with 6.2% among those with stable LSM and 3.8% among those with LSM improvement. That said, the categories of changes in LSM were not predictive of decompensation among patients with high risk of CSPH at baseline; however, they remained predictive among those with low risk of CSPH at baseline.
“[T]his study … showed that an integrated assessment of baseline LSM or [changes in LSM] can help in stratifying the risk of development of liver-related complications and of both hepatic and overall mortality,” the investigators concluded. “These data, if further validated, could help personalize prognosis and follow-up in NAFLD with [compensated advanced chronic liver disease].”
The investigators disclosed relationships with AbbVie, Novo Nordisk, Gilead, and others.
FROM CLINICAL GASTROENTEROLOGY AND HEPATOLOGY
Eating fish tied to fewer CVD events in high-risk people
People with cardiovascular disease who regularly ate fish had significantly fewer major CVD events and there were fewer total deaths, compared with similar individuals who didn’t eat fish, but there was no beneficial link from eating fish among the general population in prospective data collected from more than 191,000 people from 58 countries.
Despite the neutral finding among people without CVD, the finding that eating fish was associated with significant benefit for those with CVD or who were at high risk for CVD confirms the public health importance of regular fish or fish oil consumption, said one expert.
A little over a quarter of those included in the new study had a history of CVD or were at high risk for CVD. In this subgroup of more than 51,000 people, those who consumed on average at least two servings of fish weekly (at least 175 g, or about 6.2 ounces per week) had a significant 16% lower rate of major CVD events during a median follow-up of about 7.5 years.
The rate of all-cause death was a significant 18% lower among people who ate two or more fish portions weekly, compared with those who didn’t, Deepa Mohan, PhD, and associates wrote in their report in JAMA Internal Medicine.
The researchers saw no additional benefit when people regularly ate greater amounts of fish.
“There is a significant protective benefit of fish consumption in people with cardiovascular disease,” said Andrew Mente, PhD, a senior investigator on the study and an epidemiologist at McMaster University, Hamilton, Ont..
“This study has important implications for guidelines on fish intake globally. It indicates that increasing fish consumption and particularly oily fish in vascular patients may produce a modest cardiovascular benefit,” he said in a statement released by McMaster.
‘A large body of evidence’ for CVD benefit
The neutral finding of no significant benefit (as well as no harm) regarding either CVD events or total mortality among people without CVD “does not alter the large body of prior observational evidence supporting the cardiac benefits of fish intake in general populations,” noted Dariush Mozaffarian, MD, DrPH, in a commentary that accompanies the report by Dr. Mohan and colleagues.
Although the new analysis failed to show a significant association between regular fish consumption and fewer CVD events for people without established CVD or CVD risk, “based on the cumulative evidence from prospective observational studies, randomized clinical trials, and mechanistic and experimental studies, modest fish consumption appears to have some cardiac benefits,” he added.
“Adults should aim to consume about two servings of fish per week, and larger benefits may accrue from nonfried oily (dark meat) fish,” wrote Dr. Mozaffarian, a professor of medicine and nutrition at Tufts University, Boston.
Oily, dark fishes include salmon, tuna steak, mackerel, herring, and sardines. Species such as these contain the highest levels of long-chain omega-3 fatty acids, eicosapentaenoic acid, and docosapentaenoic acid; these nutrients likely underlie the CVD benefits from fish, Dr. Mozaffarian said in an interview with JAMA Internal Medicine that accompanied his commentary. (Dr. Mente also participated.)
“Fish oil lowers heart rate, blood pressure, and triglycerides (at high dosages), increases adiponectin, improves endothelial function, and in some studies improves oxygen consumption in myocardium. If there is benefit from fish it’s from the omega 3s, and all in all the evidence supports this,” but because the evidence is primarily observational, it can only show linkage and cannot prove causation, he explained.
Given the potential benefit and limited risk, “I think everyone should aim to eat two servings of fish each week, preferentially oily fish. That’s very solid,” said Dr. Mozaffarian, who is also a cardiologist and dean of the Tufts Friedman School of Nutrition Science.
The investigators did not have adequate data to compare the associations between outcomes and a diet with oily fish versus less oily fish.
OTC fish oil capsules are ‘very reasonable’
For people who either can’t consume two fish meals a week or want to ensure their omega 3 intake is adequate, “it’s very reasonable for the average person to take one OTC [over-the-counter] fish oil capsule a day,” Dr. Mozaffarian added.
He acknowledged that several studies of fish oil supplements failed to show benefit, but several others have. “It’s a confusing field, but the evidence supports benefit from omega 3s,” he concluded.
He discounted the new finding that only people with established CVD or who are at high-risk benefit. “I’m not sure we should make too much of this, because many prior studies showed a lower CVD risk in fish-eating people without prevalent CVD,” he said. The new study “provides important information given its worldwide breadth.”
The new report used data regarding 191,558 people enrolled prospectively in any of four studies. The average age of the participants was 54 years, and 52% were women.
During follow-up, death from any cause occurred in 6% of those without CVD or CVD risk and in 13% of those with these factors. Major CVD events occurred in 5% and 17% of these two subgroups, respectively. To calculate the relative risks between those who ate fish and those who did not, the investigators used standard multivariate adjustment for potential confounders and adjusted for several dietary variables, Dr. Mente said.
Dr. Mohan and Dr. Mente disclosed no relevant financial relationships. Dr. Mozaffarian has received personal fees from Acasti Pharma, Amarin, America’s Test Kitchen, Barilla, Danone, GEOD, and Motif Food Works, and he has been an adviser to numerous companies.
A version of this article first appeared on Medscape.com.
JAMA editor resigns over controversial podcast
JAMA editor in chief Howard Bauchner, MD, apologized to JAMA staff and stakeholders and asked for and received Dr. Livingston’s resignation, according to a statement from AMA CEO James Madara.
More than 2,000 people have signed a petition on Change.org calling for an investigation at JAMA over the podcast, called “Structural Racism for Doctors: What Is It?”
It appears they are now getting their wish. Dr. Bauchner announced that the journal’s oversight committee is investigating how the podcast and a tweet promoting the episode were developed, reviewed, and ultimately posted.
“This investigation and report of its findings will be thorough and completed rapidly,” Dr. Bauchner said.
Dr. Livingston, the host of the podcast, has been heavily criticized across social media. During the podcast, Dr. Livingston, who is White, said: “Structural racism is an unfortunate term. Personally, I think taking racism out of the conversation will help. Many of us are offended by the concept that we are racist.”
The audio of the podcast has been deleted from JAMA’s website. In its place is audio of a statement from Dr. Bauchner. In his statement, which he released last week, he said the comments in the podcast, which also featured Mitch Katz, MD, were “inaccurate, offensive, hurtful, and inconsistent with the standards of JAMA.”
Dr. Katz is an editor at JAMA Internal Medicine and CEO of NYC Health + Hospitals in New York.
Also deleted was a JAMA tweet promoting the podcast episode. The tweet said: “No physician is racist, so how can there be structural racism in health care? An explanation of the idea by doctors for doctors in this user-friendly podcast.”
The incident was met with anger and confusion in the medical community.
Herbert C. Smitherman, MD, vice dean of diversity and community affairs at Wayne State University, Detroit, noted after hearing the podcast that it was a symptom of a much larger problem.
“At its core, this podcast had racist tendencies. Those attitudes are why you don’t have as many articles by Black and Brown people in JAMA,” he said. “People’s attitudes, whether conscious or unconscious, are what drive the policies and practices which create the structural racism.”
Dr. Katz responded to the backlash last week with the following statement: “Systemic racism exists in our country. The disparate effects of the pandemic have made this painfully clear in New York City and across the country.
“As clinicians, we must understand how these structures and policies have a direct impact on the health outcomes of the patients and communities we serve. It is woefully naive to say that no physician is a racist just because the Civil Rights Act of 1964 forbade it, or that we should avoid the term ‘systematic racism’ because it makes people uncomfortable. We must and can do better.”
JAMA, an independent arm of the AMA, is taking other steps to address concerns. Its executive publisher, Thomas Easley, held an employee town hall this week, and said JAMA acknowledges that “structural racism is real, pernicious, and pervasive in health care.” The journal is also starting an “end-to-end review” of all editorial processes across all JAMA publications. Finally, the journal will also create a new associate editor’s position who will provide “insight and counsel” on racism and structural racism in health care.
A version of this article first appeared on WebMD.com .
Don’t discontinue osteoporosis meds for COVID-19 vaccines, expert guidance says
COVID-19 vaccines are safe and effective for patients taking osteoporosis medications, according to joint guidance from six endocrine and osteoporosis societies and foundations.

They noted, though, that some timing modifications with certain medications should be considered to help distinguish between adverse events from the medication versus the vaccine.
The American Society for Bone and Mineral Research “is an international organization, so we brought together our sister societies that have a vested interested in bone health. Vaccination is happening worldwide, and we wanted to present a united front and united recommendations about how to handle osteoporosis medications appropriately during vaccination,” said Suzanne Jan De Beur, MD, who is president of ASBMR and an associate professor of medicine at Johns Hopkins University, Baltimore.
There has been quite a lot of concern from the community about vaccine and medications, from both physicians and patients wondering whether treatments and vaccines should occur in a certain order, and whether there should be a time gap between the two, said Dr. Jan De Beur. “There was a dearth of information about the best practices for osteoporosis treatment management during vaccination, and we didn’t want people missing their opportunity for a vaccine, and we also didn’t want them unnecessarily delaying their osteoporosis treatment.”
There is no evidence that osteoporosis therapies affect the risk or severity of COVID-19 disease, nor do they appear to change the disease course. Osteoporosis itself does not appear associated with increased risk of infection or severe outcomes, so patients with osteoporosis do not need to be prioritized for vaccination based on that condition alone.
There is no evidence that osteoporosis therapies affect the safety or efficacy of vaccination, but given that vaccine availability is currently inconsistent, patients may need to make temporary changes to their osteoporosis regimens to ensure they can receive vaccine when it is available, such as ensuring a delay between medication and vaccination injections.
A key reason for a delay between injectable or infusion medications and a vaccine is to distinguish between adverse events that could occur, so that an adverse reaction to vaccine isn’t mistaken for an adverse reaction to a drug. Nevertheless, the real world is messy. Dr. Jan De Beur noted a recent patient who arrived at her clinic for an injectable treatment who had just received a COVID-19 vaccination that morning. “We decided to put the injection in the other arm, rather than reschedule the person and put them through the risk of coming back. We could distinguish between injection-site reactions, at least,” she said.
No changes should be made to general bone health therapies, such as calcium and vitamin D supplementation, weight-bearing exercises, and maintenance of a balanced diet.
The guidance includes some recommendations for specific osteoporosis medications.
- Oral bisphosphonates: Alendronate, risedronate, and ibandronate should be continued.
- Intravenous bisphosphonates: a 7-day interval (4-day minimum) is recommended between intravenous bisphosphonate (zoledronic acid and ibandronate) infusion and COVID-19 vaccination in order to distinguish potential autoimmune or inflammatory reactions that could be attributable to either intravenous bisphosphonate or the vaccine.
- Denosumab: There should be a 4- to 7-day delay between denosumab infusion and COVID-19 vaccination to account for injection-site reactions. Another option is to have denosumab injected into the contralateral arm or another site like the abdomen or upper thigh, if spacing the injections is not possible. In any case, denosumab injections should be performed within 7 months of the previous dose.
- Teriparatide and abaloparatide should be continued.
- Romosozumab: There should be a 4- to 7-day delay between a romosozumab injection and COVID-19 vaccine, or romosozumab can be injected in the abdomen (with the exception of a 2-inch area around the naval) or thigh if spacing is not possible.
- Raloxifene should be continued in patients receiving COVID-19 vaccination.
Guidance signatories include ASBMR, the American Association of Clinical Endocrinology, the Endocrine Society, the European Calcified Tissue Society, the National Osteoporosis Foundation, and the International Osteoporosis Foundation.
Dr. Jan De Beur has no relevant financial disclosures.
COVID-19 vaccines are safe and effective for patients taking osteoporosis medications, according to joint guidance from six endocrine and osteoporosis societies and foundations.
They noted, though, that some timing modifications with certain medications should be considered to help distinguish between adverse events from the medication versus the vaccine.
The American Society for Bone and Mineral Research “is an international organization, so we brought together our sister societies that have a vested interested in bone health. Vaccination is happening worldwide, and we wanted to present a united front and united recommendations about how to handle osteoporosis medications appropriately during vaccination,” said Suzanne Jan De Beur, MD, who is president of ASBMR and an associate professor of medicine at Johns Hopkins University, Baltimore.
There has been quite a lot of concern from the community about vaccine and medications, from both physicians and patients wondering whether treatments and vaccines should occur in a certain order, and whether there should be a time gap between the two, said Dr. Jan De Beur. “There was a dearth of information about the best practices for osteoporosis treatment management during vaccination, and we didn’t want people missing their opportunity for a vaccine, and we also didn’t want them unnecessarily delaying their osteoporosis treatment.”
There is no evidence that osteoporosis therapies affect the risk or severity of COVID-19 disease, nor do they appear to change the disease course. Osteoporosis itself does not appear associated with increased risk of infection or severe outcomes, so patients with osteoporosis do not need to be prioritized for vaccination based on that condition alone.
There is no evidence that osteoporosis therapies affect the safety or efficacy of vaccination, but given that vaccine availability is currently inconsistent, patients may need to make temporary changes to their osteoporosis regimens to ensure they can receive vaccine when it is available, such as ensuring a delay between medication and vaccination injections.
A key reason for a delay between injectable or infusion medications and a vaccine is to distinguish between adverse events that could occur, so that an adverse reaction to vaccine isn’t mistaken for an adverse reaction to a drug. Nevertheless, the real world is messy. Dr. Jan De Beur noted a recent patient who arrived at her clinic for an injectable treatment who had just received a COVID-19 vaccination that morning. “We decided to put the injection in the other arm, rather than reschedule the person and put them through the risk of coming back. We could distinguish between injection-site reactions, at least,” she said.
No changes should be made to general bone health therapies, such as calcium and vitamin D supplementation, weight-bearing exercises, and maintenance of a balanced diet.
The guidance includes some recommendations for specific osteoporosis medications.
- Oral bisphosphonates: Alendronate, risedronate, and ibandronate should be continued.
- Intravenous bisphosphonates: a 7-day interval (4-day minimum) is recommended between intravenous bisphosphonate (zoledronic acid and ibandronate) infusion and COVID-19 vaccination in order to distinguish potential autoimmune or inflammatory reactions that could be attributable to either intravenous bisphosphonate or the vaccine.
- Denosumab: There should be a 4- to 7-day delay between denosumab infusion and COVID-19 vaccination to account for injection-site reactions. Another option is to have denosumab injected into the contralateral arm or another site like the abdomen or upper thigh, if spacing the injections is not possible. In any case, denosumab injections should be performed within 7 months of the previous dose.
- Teriparatide and abaloparatide should be continued.
- Romosozumab: There should be a 4- to 7-day delay between a romosozumab injection and COVID-19 vaccine, or romosozumab can be injected in the abdomen (with the exception of a 2-inch area around the naval) or thigh if spacing is not possible.
- Raloxifene should be continued in patients receiving COVID-19 vaccination.
Guidance signatories include ASBMR, the American Association of Clinical Endocrinology, the Endocrine Society, the European Calcified Tissue Society, the National Osteoporosis Foundation, and the International Osteoporosis Foundation.
Dr. Jan De Beur has no relevant financial disclosures.
Inpatient sodium imbalances linked to adverse COVID-19 outcomes
Both high and low serum sodium levels are associated with adverse outcomes for hospitalized patients with COVID-19, new research suggests.
In the retrospective study of 488 patients hospitalized with COVID-19 at one of two London hospitals between February and May 2020, hypernatremia (defined as serum sodium level >145 mmol/L) at any time point during hospital stay was associated with a threefold increase in inpatient mortality.
Hyponatremia (serum sodium level <135 mmol/L) was associated with twice the likelihood of requiring advanced ventilatory support. In-hospital mortality was also increased among patients with hypovolemic hyponatremia.
“Serum sodium values could be used in clinical practice to identify patients with COVID-19 at high risk of poor outcomes who would benefit from more intensive monitoring and judicious rehydration,” Ploutarchos Tzoulis, MD, PhD, and colleagues wrote in their article, which was published online on Feb. 24, 2021, in the Journal of Clinical Endocrinology and Metabolism.
The findings will be presented at the upcoming news conference held by the Endocrine Society
Should sodium be included in a risk calculator for COVID-19?
Dr. Tzoulis, professor of endocrinology at the University College London Medical School, said in an interview that “sodium could be incorporated in risk calculators across other routine biomarkers, such as white cell count, lymphocytes, and CRP [C-reactive protein], in order to provide a tool for dynamic risk stratification throughout the clinical course of COVID-19 and assist clinical decision-making.”
Moreover, he said, “we should follow less conservative strategies in the rate and amount of fluid resuscitation in order to prevent hypernatremia, which is induced by negative fluid balance and can often be iatrogenic.”
Asked to comment, Steven Q. Simpson, MD, professor of medicine in the division of pulmonary, critical care, and sleep medicine at the University of Kansas, Kansas City, said that the article is missing key results that would assist in interpreting of the findings.
“Data regarding diuretic use and sparing of fluid administration are not in the paper. ... It is simply not possible to tell whether serum sodium is a ‘predictor’ ... or if it is a side effect of other issues or actions taken by physicians in patients who are progressing poorly.
“To say that sodium needs to be included in a risk calculator is to subtly suggest that there is some causal association with mortality, and that has quite clearly not been established,” stressed Dr. Simpson, who is president of the American College of Chest Physicians but was not speaking for the organization.
He added: “The data are interesting, but not actionable. It is common practice in critical care medicine to adjust water and salt intake to maintain serum sodium within the normal range, so the paper really doesn’t change any behavior.”
Dr. Tzoulis said in an interview that, despite not having electronic medical record data on diuretic use or fluid input and output, “our acute physicians and intensivists at both study sites have been adamant that they’ve not routinely used diuretics in COVID-19 patients. Diuretics have been sparingly used in our cohort, and also the frequency of pulmonary edema was reported as below 5%.”
Regarding volume of fluid intake, Dr. Tzoulis noted, “At our hospital sites, the strategy has been that of cautious fluid resuscitation. In fact, the amount of fluid given has been reported by our physicians and intensivists as ‘on purpose much more conservative than the usual one adopted in patients with community-acquired pneumonia at risk of respiratory failure.’ ”
Hyper- and hyponatremia linked to adverse COVID-19 outcomes
In the study, 5.3% of the 488 patients had hypernatremia at hospital presentation, and 24.6% had hyponatremia. Of note, only 19% of those with hyponatremia underwent laboratory workup to determine the etiology. Of those, three quarters had hypovolemic hyponatremia, determined on the basis of a urinary sodium cutoff of 30 mmol/L.
The total in-hospital mortality rate was 31.1%. There was a strong, although nonsignificant, trend toward higher mortality in association with sodium status at admission. Death rates were 28.4%, 30.8%, and 46.1% for those who were normonatremic, hyponatremic, and hypernatremic, respectively (P = .07). Baseline serum sodium levels didn’t differ between survivors (137 mmol/L) and nonsurvivors (138 mmol/L).
In multivariable analysis, the occurrence of hypernatremia at any point during the first 5 days in the hospital was among three independent risk factors for higher in-hospital mortality (adjusted hazard ratio, 2.74; P = .02). The other risk factors were older age and higher CRP level.
Overall, hyponatremia was not associated with death (P = .41).
During hospitalization, 37.9% of patients remained normonatremic; 36.9% experienced hyponatremia; 10.9% had hypernatremia; and 14.3% had both conditions at some point during their stay.
In-hospital mortality was 21% among those with normonatremia, compared with 56.6% for those with hypernatremia (odds ratio, 3.05; P = .0038) and 45.7% for those with both (OR, 2.25; P < .0001).
The 28.3% mortality rate in the overall group that experienced hyponatremia didn’t differ significantly from the 21.1% in the normonatremic group (OR, 1.34; P = .16). However, the death rate was 40.9% among the subgroup that developed hypovolemic hyponatremia, significantly higher than the normonatremic group (OR, 2.59, P = .0017).
The incidence of hyponatremia decreased from 24.6% at admission to 14.1% 5 days later, whereas the frequency of hypernatremia rose from 5.3% to 13.8%.
Key finding: Link between hospital-acquired hypernatremia and death
“The key novel finding of our study was that hospital-acquired hypernatremia, rather than hypernatremia at admission, was a predictor for in-hospital mortality, with the worst prognosis being reported in patients with the largest increase in serum sodium in the first 5 days of hospitalization,” noted Dr. Tzoulis and colleagues.
Hypernatremia was present in 29.6% of nonsurvivors, compared with 5.2% in survivors.
Among 120 patients with hyponatremia at admission, 31.7% received advanced respiratory support, compared with 17.5% and 7.7% of those with normonatremia or hypernatremia, respectively (OR, 2.18; P = .0011).
In contrast, there was no difference in the proportions needing ventilatory support between those with hypernatremia and those with normonatremia (16.7% vs. 12.4%; OR, 1.44; P = .39).
Acute kidney injury occurred in 181 patients (37.1%). It was not related to serum sodium concentration at any time point.
Dr. Tzoulis and Dr. Simpson disclosed no relevant financial relationships.
A version of this article first appeared on Medscape.com.
Obesity: A ‘double hit’ in pregnant women with heart disease
Being obese and pregnant raises the risk for cardiac complications in women with preexisting heart disease, new research suggests, highlighting the need for earlier interventions in this high-risk population.
The analysis of 790 pregnancies revealed that 23% of women with obesity, defined as body mass index greater than 30 kg/m2, had a cardiac event during pregnancy versus 14% of women with normal body weight (P = .006).
The difference was driven largely by an increase in heart failure (8% vs. 3%; P = .02), although arrhythmias also trended higher in obese women (14% vs. 10%; P = .19).
Nearly half of the women with obesity and a cardiac event presented in the postpartum period (47%).
In multivariate analysis, both obesity and Canadian Cardiac Disease in Pregnancy Study (CARPREG) II risk score were independent predictors of cardiac events (odds ratios for both, 1.7), the investigators, led by Birgit Pfaller, MD, University of Toronto, reported in the Journal of the American College of Cardiology.
Although obesity has been linked to worse pregnancy outcomes and higher cardiovascular risk after delivery in the general population, the authors noted that this is the first study to examine its effect on outcomes in women with heart disease.
“We wanted to look at this high-risk group of women that had preexisting heart disease, but in addition had obesity, to try and find out if there was a kind of double hit for these women – and that, in the end, is what we found. It’s not just simply having heart disease, not simply having obesity, but the combination that’s problematic,” senior author and cardiologist Candice Silversides, MD, University of Toronto, said in an interview.
The findings are concerning given the rising prevalence of obesity worldwide. National data from 2018 show that slightly more than half of women who gave birth in the United States were significantly overweight or obese before becoming pregnant.
Similarly, in the present analysis of 600 women in the CARPREG study who gave birth from 2004 to 2014, nearly 1 in 5 pregnancies (19%) occurred in women with obesity and 25% were in overweight women.
Obese women were significantly more likely than those without obesity to have coronary artery disease (6% vs. 2%), cardiomyopathies (19% vs. 8%) and left ventricular dysfunction (19% vs. 12%) and to be hypertensive or have a hypertensive disorder of pregnancy (13% vs. 3%).
Preeclampsia developed in 32 women during the index pregnancy and 69% of these women were obese or overweight. Cardiac event rates were similar in women with or without preeclampsia but trended higher in women with preeclampsia with versus without obesity (36% vs. 14%; P = .20).
The ill effects of obesity were also reflected in fetal and neonatal events. Overall, 43% of women with obesity and 33% of normal-weight women had at least one fetal event (P = .02), with higher rates of preterm birth (19% vs. 10%; P = .005) and respiratory distress syndrome (8% vs. 3%; P = .02) in women with obesity. Congenital cardiac malformations were present in 6% of women in both groups.
Taken together, the composite of cardiac events, preeclampsia, or fetal events was significantly more common in women with obesity than in normal-weight women (56% vs. 41%; P = .002).
“We’ve spent the last number of years trying to research and understand what the drivers of these adverse outcomes are in this high-risk pregnant cohort, but on a bigger picture the real issue is how do we start intervening in a meaningful way,” Dr. Silversides said.
Like many in the burgeoning field of cardio-obstetrics, the team proposed a multidisciplinary approach that stresses preconception counseling, educating pregnant women with heart disease and obesity about their risks, ensuring that dietary advice, weight-gain recommendations, and comorbidities are addressed as part of routine care, and providing postpartum surveillance.
Preconception screening “has been the recommendation for a long, long time; it’s just that it doesn’t always happen in reality,” she said. “Many pregnancies aren’t planned and not all women are filtered into preconception counseling. So sometimes you’ll do it at the first antenatal visit and try to ensure women are educated but optimally you want to do it well in advance of pregnancy.”
Part of that preconception counseling “should also include giving them appropriate advice for contraception, if what they want to do is avoid pregnancy,” added Dr. Silversides.
Garima Sharma, MD, Ciccarone Center for the Prevention of Cardiovascular Disease, Johns Hopkins University, Baltimore, and colleagues wrote in an accompanying editorial that the adverse events observed in this high-risk cohort have “important implications for cardio-obstetricians and should be incorporated in routine prepregnancy and antenatal counseling, monitoring, and risk stratification for women with existing cardiovascular disease.”
They pointed to a paucity of data incorporating maternal prepregnancy obesity and gestational weight gain in risk prediction and called for larger population-based studies on the additive impact of obesity severity on predicting adverse cardiac events in women with existing cardiovascular disease.
Randomized trials are also urgently needed to evaluate the effect of nutritional and behavioral interventions in pregnancy on short- and long-term outcomes in mother and child.
“As the obesity epidemic continues to grow and public health interventions promoting lifestyle changes for obesity management remain a major challenge, maternal obesity may prove to be the ‘Achilles’ heel’ of sustainable national efforts to reduce maternal mortality and improve health equity. This is a call to action,” Dr. Sharma and colleagues concluded.
The investigators noted that the study was conducted at a single center and used self-reported pregnancy weight collected at the first antenatal visit, which may have underestimated obesity rates. Other limitations are that weight changes over the course of pregnancy were not studied and there was a limited number of women with a body mass index of 40 or higher.
The study was supported by a grant from the Allan E. Tiffin Trust, Toronto General and Western Hospital Foundation, and by a donation from Mrs. Josephine Rogers, Toronto General Hospital. Dr. Silversides is supported by the Miles Nadal Chair in Pregnancy and Heart Disease. Dr. Sharma and colleagues disclosed no relevant financial relationships.
A version of this article first appeared on Medscape.com.
Delay surgery by 7 weeks after COVID-19 diagnosis, study shows
Seven weeks appears to be the ideal amount of time to delay surgery, when possible, after someone tests positive for COVID-19, researchers in the United Kingdom report.

Risk for death was about 3.5 to 4 times higher in the first 6 weeks after surgery among more than 3,000 people with a preoperative COVID-19 diagnosis compared with patients without COVID-19. After 7 weeks, the 30-day mortality rate dropped to a baseline level.
The study was published online March 9 in Anaesthesia.
Surgery should be further delayed for people who remain symptomatic at 7 weeks post diagnosis, lead author Dmitri Nepogodiev, MBChB, said in an interview.
“In this group we recommend waiting until COVID-19 symptoms resolve, if possible. However, our study did not capture specific data on long COVID … so we are unable to make specific recommendations for this group,” said Dr. Nepogodiev, research fellow at the NIHR Global Health Research Unit on Global Surgery at the University of Birmingham (England).
“This should be an area for future research,” he added.
The international, multicenter, prospective cohort study is notable for its sheer size – more than 15,000 investigators reported outcomes for 140,231 surgical patients from 1,674 hospitals across 116 countries. In total, 2.2% of these patients tested positive for SARS-CoV-2 prior to surgery.
Surgery of any type performed in October 2020 was assessed. A greater proportion of patients with a preoperative COVID-19 diagnosis had emergency surgery, 44%, compared with 30% of people who never had a COVID-19 diagnosis.
Most patients were asymptomatic at the time of surgery, either because they never experienced COVID-19 symptoms or their symptoms resolved. The 30-day mortality rate was the primary outcome.
Death rates among surgical patients with preoperative COVID-19 diagnosis
Comparing the timing of surgery after COVID-19 diagnosis vs. 30-day mortality yielded the following results:
- 0 to 2 weeks – 9.1% mortality.
- 3 to 4 weeks – 6.9%.
- 5 to 6 weeks – 5.5%.
- 7 weeks or longer – 2.0%..
For comparison, the 30-day mortality rate for surgical patients without a preoperative COVID-19 diagnosis was 1.4%. A COVID-19 diagnosis more than 7 weeks before surgery did not make a significant difference on outcomes.
The ‘why’ remains unknown
The reasons for the association between a COVID-19 diagnosis and higher postoperative death rates remain unknown. However, Dr. Nepogodiev speculated that it could be related to “some degree of lung injury, even if patients are initially asymptomatic.”
Intubation and mechanical ventilation during surgery could exacerbate the existing lung injury, he said, thereby leading to more severe COVID-19.
In fact, Dr. Nepogodiev and colleagues found that postoperative pulmonary complications followed a pattern similar to the findings on death. They reported higher rates of pneumonia, acute respiratory distress syndrome, and unexpected reventilation in the first 6 weeks following a COVID-19 diagnosis. Again, at 7 weeks and beyond, the rates returned to be relatively the same as those for people who never had COVID-19.
“Waiting for 7 or more weeks may allow time for the initial COVID-19 injury to resolve,” Dr. Nepogodiev said.
‘An important study’
“This is an important study of postoperative mortality among patients recovered from COVID-19,” Adrian Diaz, MD, MPH, said in an interview when asked to comment.
The large cohort and numerous practice settings are among the strengths of the research, said Dr. Diaz, of the University of Michigan Institute for Healthcare Policy and Innovation in Ann Arbor. He was lead author of a June 2020 review article on elective surgery in the time of COVID-19, published in The American Journal of Surgery.
“As with nearly all studies of this nature, results must be interpreted on a case-by-case basis for individual patients. However, this study does add important information for patients and providers in helping them have an informed discussion on the timing of surgery,” said Dr. Diaz, a fellow in the Center for Healthcare Outcomes and Policy and a resident in general surgery at the Ohio State University, Columbus.
Dr. Nepogodiev and colleagues included both urgent and elective surgeries in the study. Dr. Diaz said this was a potential limitation because emergency operations “should never be delayed, by definition.” Lack of indications for the surgeries and information on cause of death were additional limitations.
Future research should evaluate any benefit in delaying surgery longer than 7 or more weeks, Dr. Diaz added, perhaps looking specifically at 10, 12, or 14 weeks, or considering outcomes as a continuous variable. This would help health care providers “garner more insight into risk and benefits of delaying surgery beyond 7 weeks.”
Dr. Nepogodiev and Dr. Diaz disclosed no relevant financial relationships. The study had multiple funding sources, including the National Institute for Health Research Global Health Research Unit, the Association of Upper Gastrointestinal Surgeons, the British Association of Surgical Oncology, and Medtronic.
A version of this article first appeared on Medscape.com.
Seven weeks appears to be the ideal amount of time to delay surgery, when possible, after someone tests positive for COVID-19, researchers in the United Kingdom report.
Risk for death was about 3.5 to 4 times higher in the first 6 weeks after surgery among more than 3,000 people with a preoperative COVID-19 diagnosis compared with patients without COVID-19. After 7 weeks, the 30-day mortality rate dropped to a baseline level.
The study was published online March 9 in Anaesthesia.
Surgery should be further delayed for people who remain symptomatic at 7 weeks post diagnosis, lead author Dmitri Nepogodiev, MBChB, said in an interview.
“In this group we recommend waiting until COVID-19 symptoms resolve, if possible. However, our study did not capture specific data on long COVID … so we are unable to make specific recommendations for this group,” said Dr. Nepogodiev, research fellow at the NIHR Global Health Research Unit on Global Surgery at the University of Birmingham (England).
“This should be an area for future research,” he added.
The international, multicenter, prospective cohort study is notable for its sheer size – more than 15,000 investigators reported outcomes for 140,231 surgical patients from 1,674 hospitals across 116 countries. In total, 2.2% of these patients tested positive for SARS-CoV-2 prior to surgery.
Surgery of any type performed in October 2020 was assessed. A greater proportion of patients with a preoperative COVID-19 diagnosis had emergency surgery, 44%, compared with 30% of people who never had a COVID-19 diagnosis.
Most patients were asymptomatic at the time of surgery, either because they never experienced COVID-19 symptoms or their symptoms resolved. The 30-day mortality rate was the primary outcome.
Death rates among surgical patients with preoperative COVID-19 diagnosis
Comparing the timing of surgery after COVID-19 diagnosis vs. 30-day mortality yielded the following results:
- 0 to 2 weeks – 9.1% mortality.
- 3 to 4 weeks – 6.9%.
- 5 to 6 weeks – 5.5%.
- 7 weeks or longer – 2.0%..
For comparison, the 30-day mortality rate for surgical patients without a preoperative COVID-19 diagnosis was 1.4%. A COVID-19 diagnosis more than 7 weeks before surgery did not make a significant difference on outcomes.
The ‘why’ remains unknown
The reasons for the association between a COVID-19 diagnosis and higher postoperative death rates remain unknown. However, Dr. Nepogodiev speculated that it could be related to “some degree of lung injury, even if patients are initially asymptomatic.”
Intubation and mechanical ventilation during surgery could exacerbate the existing lung injury, he said, thereby leading to more severe COVID-19.
In fact, Dr. Nepogodiev and colleagues found that postoperative pulmonary complications followed a pattern similar to the findings on death. They reported higher rates of pneumonia, acute respiratory distress syndrome, and unexpected reventilation in the first 6 weeks following a COVID-19 diagnosis. Again, at 7 weeks and beyond, the rates returned to be relatively the same as those for people who never had COVID-19.
“Waiting for 7 or more weeks may allow time for the initial COVID-19 injury to resolve,” Dr. Nepogodiev said.
‘An important study’
“This is an important study of postoperative mortality among patients recovered from COVID-19,” Adrian Diaz, MD, MPH, said in an interview when asked to comment.
The large cohort and numerous practice settings are among the strengths of the research, said Dr. Diaz, of the University of Michigan Institute for Healthcare Policy and Innovation in Ann Arbor. He was lead author of a June 2020 review article on elective surgery in the time of COVID-19, published in The American Journal of Surgery.
“As with nearly all studies of this nature, results must be interpreted on a case-by-case basis for individual patients. However, this study does add important information for patients and providers in helping them have an informed discussion on the timing of surgery,” said Dr. Diaz, a fellow in the Center for Healthcare Outcomes and Policy and a resident in general surgery at the Ohio State University, Columbus.
Dr. Nepogodiev and colleagues included both urgent and elective surgeries in the study. Dr. Diaz said this was a potential limitation because emergency operations “should never be delayed, by definition.” Lack of indications for the surgeries and information on cause of death were additional limitations.
Future research should evaluate any benefit in delaying surgery longer than 7 or more weeks, Dr. Diaz added, perhaps looking specifically at 10, 12, or 14 weeks, or considering outcomes as a continuous variable. This would help health care providers “garner more insight into risk and benefits of delaying surgery beyond 7 weeks.”
Dr. Nepogodiev and Dr. Diaz disclosed no relevant financial relationships. The study had multiple funding sources, including the National Institute for Health Research Global Health Research Unit, the Association of Upper Gastrointestinal Surgeons, the British Association of Surgical Oncology, and Medtronic.
A version of this article first appeared on Medscape.com.
Two popular screening tests for gestational diabetes clinically equivalent
Broadening the diagnosis of gestational diabetes mellitus (GDM) with a one-step screening approach does not lead to significant differences in maternal or perinatal outcomes, compared with a two-step approach. Investigators reported these findings in the New England Journal of Medicine after testing the two screening methods in more than 23,000 pregnant women.

GDM affects 6%-25% of pregnant women, increasing the risk of neonatal death and stillborn births. It can also lead to serious complications such as fetal overgrowth. Clinical guidelines recommend GDM screening between 24 and 28 weeks’ gestation to improve outcomes in mothers and infants. However, the scientific community has struggled to reach a consensus on testing approach.
For decades, clinicians used a two-step screening approach: a nonfasting 1-hour glucose challenge test and a longer 3-hour fasting oral glucose tolerance test to diagnose GDM; roughly 20% who test positive on this glucose challenge test require the second step. Results of a large study led to new diagnostic criteria on a one-step 75-g oral glucose tolerance test. The Hyperglycemia and Adverse Pregnancy Outcome (HAPO) study “found a linear relationship with hyperglycemia and outcomes – the higher the glucose, the worse the outcomes,” said Teresa Hillier, MD, MS, an endocrinologist and investigator with Kaiser Permanente Center for Health Research Northwest and CHR-Hawaii. The International Association of the Diabetes and Pregnancy Study Groups (IADPSG) made a clinical recommendation on the one-step approach, now a common screening tool in the United States.
A focus on rare GDM outcomes
The IADPSG fasting one-step criteria typically identifies women with milder symptoms as having gestational diabetes, a factor expected to increase diagnosis rates by two- or threefold, said Dr. Hillier. “The unknown question was whether diagnosing and treating more women would be associated with any differences in any of the multiple GDM-associated outcomes for mother and baby.”
She and her colleagues conducted a large-scale randomized trial at two Kaiser sites to assess multiple maternal and perinatal outcomes including rare but important GDM-associated outcomes such as stillbirth and neonatal death between the two screening methods.
They randomized 23,792 pregnant women 1:1 to the one- or two-step gestational diabetes test at their first prenatal visit. Primary outcomes included diagnosis of gestational diabetes; large-for-gestational-age infants; primary cesarean section, and gestational hypertension or preeclampsia; and a composite perinatal outcome of any stillbirth, neonatal death, shoulder dystocia, bone fracture, or arm or hand nerve palsy related to birth injury.
Most participants (94%) completed screening, although there was lower adherence to screening in the one-step approach. The reasons for this aren’t entirely clear, said Dr. Hillier. Convenience may be a factor; patients have to fast for several hours to complete the one-step test, whereas the first test of the two-step screening approach can be done at any time of day, and most patients pass this test.
Corroborating HAPO’s results, twice as many women in the one-step group (16.5%) received a GDM diagnosis, compared with 8.5% in the two-step group (unadjusted relative risk, 1.94; 97.5% confidence interval, 1.79-2.11). However, for the other primary outcomes, investigators found no significant differences in incidences or unadjusted risks. Perinatal composite outcomes for the one- and two-step groups were 3.1% and 3.0%, respectively, and primary cesarean section outcomes were 24.0% and 24.6%.
In the one-step group, 8.9% experienced large-for-gestational-age infants outcomes, compared with 9.2% in the two-step group (RR, 0.95; 97.5% CI, 0.87-1.05). Among those diagnosed with gestational diabetes, similar percentages of women in the one- and two-step groups received insulin or hypoglycemic medication (42.6% and 45.6%, respectively).
Dr. Hillier and colleagues also reported comparable results among the two groups on safety outcomes and secondary outcomes such as macrosomia incidence, small-for-gestational-age infants, and factors such as neonatal hypoglycemia and respiratory distress.
“Although we did not find increased harms associated with the diagnosis and treatment of gestational diabetes in many more women with the one-step approach, some retrospective observational cohort studies have shown higher incidences of primary cesarean delivery and neonatal hypoglycemia with one-step screening after conversion from two-step protocols, with no substantive improvement in outcomes,” Dr. Hillier and colleagues noted.
The trial had several limitations. Adjustments made to address lower adherence to the one-step approach might not have accounted for all nonadherence differences. Another issue is the two sites didn’t use identical thresholds for the glucose challenge test in the two-step cohort. Demographically, the study lacked Black and American Indian representation.
“Moreover, the potential long-term benefits of increased diagnoses of gestational diabetes – such as the identification of more women at high risk for subsequent diabetes who might benefit from risk-reduction strategies – were not addressed by the trial,” Brian Casey, MD, wrote in a related editorial. Based on the study’s findings, “the perinatal benefits of the diagnosis of gestational diabetes with the use of the IADPSG single-step approach appear to be insufficient to justify the associated patient and health care costs of broadening the diagnosis” of GDM, added Dr. Casey, a professor with the department of obstetrics and gynecology at the University of Alabama at Birmingham.
U.S. doctors unlikely to change behaviors
Most U.S. physicians favor the two-step method. This has been a huge controversy worldwide, with other countries pushing the United States to use the one-step method, Vincenzo Berghella, MD, a professor with Thomas Jefferson University, Philadelphia, said in an interview. “I expect this study will increase the divide between the U.S. and the rest of the world,” since U.S. physicians will see no benefit to the one-step method, and continue to use the two-step method.

It’s not surprising that GDM diagnosis incidence went up to 16.5% with the inclusion of the one-step test, compared with 8.5% with the two-step test, Dr. Berghella continued. What’s less clear, are the details of treatment among the 8% diagnosed to have GDM with the one-step test, but not the two-step test.
These women were likely to have milder degrees of insulin resistance or GDM. Dr. Berghella, who has advocated in the past for the one-step approach, said it would be important to find out if these women, who test positive at the one-step test but would test negative at the two-step test, were treated properly with diet, exercise, and possibly insulin or other hypoglycemic agents for their mild degree of insulin resistance. The researchers concluded that expanding the definition of GDM through the one-step test didn’t make a difference. However, “it’s not just the test that will make the difference in maternal and baby outcomes, but the aggressive management of diabetes with diet, exercise, and medications as needed once that test comes back abnormal,” he said.
The randomized trial was a massive undertaking, said Dr. Hillier.
“We are still evaluating our future plans,” she added. Forthcoming subgroup analyses from the trial could further help inform clinical practice guidelines.
Dr. Hillier received a grant from the Eunice Kennedy Shriver National Institute of Child Health and Human Development to support this study. The investigators reported no potential conflict of interest relevant to this article.
Broadening the diagnosis of gestational diabetes mellitus (GDM) with a one-step screening approach does not lead to significant differences in maternal or perinatal outcomes, compared with a two-step approach. Investigators reported these findings in the New England Journal of Medicine after testing the two screening methods in more than 23,000 pregnant women.
GDM affects 6%-25% of pregnant women, increasing the risk of neonatal death and stillborn births. It can also lead to serious complications such as fetal overgrowth. Clinical guidelines recommend GDM screening between 24 and 28 weeks’ gestation to improve outcomes in mothers and infants. However, the scientific community has struggled to reach a consensus on testing approach.
For decades, clinicians used a two-step screening approach: a nonfasting 1-hour glucose challenge test and a longer 3-hour fasting oral glucose tolerance test to diagnose GDM; roughly 20% who test positive on this glucose challenge test require the second step. Results of a large study led to new diagnostic criteria on a one-step 75-g oral glucose tolerance test. The Hyperglycemia and Adverse Pregnancy Outcome (HAPO) study “found a linear relationship with hyperglycemia and outcomes – the higher the glucose, the worse the outcomes,” said Teresa Hillier, MD, MS, an endocrinologist and investigator with Kaiser Permanente Center for Health Research Northwest and CHR-Hawaii. The International Association of the Diabetes and Pregnancy Study Groups (IADPSG) made a clinical recommendation on the one-step approach, now a common screening tool in the United States.
A focus on rare GDM outcomes
The IADPSG fasting one-step criteria typically identifies women with milder symptoms as having gestational diabetes, a factor expected to increase diagnosis rates by two- or threefold, said Dr. Hillier. “The unknown question was whether diagnosing and treating more women would be associated with any differences in any of the multiple GDM-associated outcomes for mother and baby.”
She and her colleagues conducted a large-scale randomized trial at two Kaiser sites to assess multiple maternal and perinatal outcomes including rare but important GDM-associated outcomes such as stillbirth and neonatal death between the two screening methods.
They randomized 23,792 pregnant women 1:1 to the one- or two-step gestational diabetes test at their first prenatal visit. Primary outcomes included diagnosis of gestational diabetes; large-for-gestational-age infants; primary cesarean section, and gestational hypertension or preeclampsia; and a composite perinatal outcome of any stillbirth, neonatal death, shoulder dystocia, bone fracture, or arm or hand nerve palsy related to birth injury.
Most participants (94%) completed screening, although there was lower adherence to screening in the one-step approach. The reasons for this aren’t entirely clear, said Dr. Hillier. Convenience may be a factor; patients have to fast for several hours to complete the one-step test, whereas the first test of the two-step screening approach can be done at any time of day, and most patients pass this test.
Corroborating HAPO’s results, twice as many women in the one-step group (16.5%) received a GDM diagnosis, compared with 8.5% in the two-step group (unadjusted relative risk, 1.94; 97.5% confidence interval, 1.79-2.11). However, for the other primary outcomes, investigators found no significant differences in incidences or unadjusted risks. Perinatal composite outcomes for the one- and two-step groups were 3.1% and 3.0%, respectively, and primary cesarean section outcomes were 24.0% and 24.6%.
In the one-step group, 8.9% experienced large-for-gestational-age infants outcomes, compared with 9.2% in the two-step group (RR, 0.95; 97.5% CI, 0.87-1.05). Among those diagnosed with gestational diabetes, similar percentages of women in the one- and two-step groups received insulin or hypoglycemic medication (42.6% and 45.6%, respectively).
Dr. Hillier and colleagues also reported comparable results among the two groups on safety outcomes and secondary outcomes such as macrosomia incidence, small-for-gestational-age infants, and factors such as neonatal hypoglycemia and respiratory distress.
“Although we did not find increased harms associated with the diagnosis and treatment of gestational diabetes in many more women with the one-step approach, some retrospective observational cohort studies have shown higher incidences of primary cesarean delivery and neonatal hypoglycemia with one-step screening after conversion from two-step protocols, with no substantive improvement in outcomes,” Dr. Hillier and colleagues noted.
The trial had several limitations. Adjustments made to address lower adherence to the one-step approach might not have accounted for all nonadherence differences. Another issue is the two sites didn’t use identical thresholds for the glucose challenge test in the two-step cohort. Demographically, the study lacked Black and American Indian representation.
“Moreover, the potential long-term benefits of increased diagnoses of gestational diabetes – such as the identification of more women at high risk for subsequent diabetes who might benefit from risk-reduction strategies – were not addressed by the trial,” Brian Casey, MD, wrote in a related editorial. Based on the study’s findings, “the perinatal benefits of the diagnosis of gestational diabetes with the use of the IADPSG single-step approach appear to be insufficient to justify the associated patient and health care costs of broadening the diagnosis” of GDM, added Dr. Casey, a professor with the department of obstetrics and gynecology at the University of Alabama at Birmingham.
U.S. doctors unlikely to change behaviors
Most U.S. physicians favor the two-step method. This has been a huge controversy worldwide, with other countries pushing the United States to use the one-step method, Vincenzo Berghella, MD, a professor with Thomas Jefferson University, Philadelphia, said in an interview. “I expect this study will increase the divide between the U.S. and the rest of the world,” since U.S. physicians will see no benefit to the one-step method, and continue to use the two-step method.
It’s not surprising that GDM diagnosis incidence went up to 16.5% with the inclusion of the one-step test, compared with 8.5% with the two-step test, Dr. Berghella continued. What’s less clear, are the details of treatment among the 8% diagnosed to have GDM with the one-step test, but not the two-step test.
These women were likely to have milder degrees of insulin resistance or GDM. Dr. Berghella, who has advocated in the past for the one-step approach, said it would be important to find out if these women, who test positive at the one-step test but would test negative at the two-step test, were treated properly with diet, exercise, and possibly insulin or other hypoglycemic agents for their mild degree of insulin resistance. The researchers concluded that expanding the definition of GDM through the one-step test didn’t make a difference. However, “it’s not just the test that will make the difference in maternal and baby outcomes, but the aggressive management of diabetes with diet, exercise, and medications as needed once that test comes back abnormal,” he said.
The randomized trial was a massive undertaking, said Dr. Hillier.
“We are still evaluating our future plans,” she added. Forthcoming subgroup analyses from the trial could further help inform clinical practice guidelines.
Dr. Hillier received a grant from the Eunice Kennedy Shriver National Institute of Child Health and Human Development to support this study. The investigators reported no potential conflict of interest relevant to this article.
FROM THE NEW ENGLAND JOURNAL OF MEDICINE
Bone loss common in kidney stone patients, yet rarely detected
Almost one in four men and women diagnosed with kidney stones have osteoporosis or a history of fracture at the time of their diagnosis, yet fewer than 10% undergo bone mineral density (BMD) screening, a retrospective analysis of a Veterans Health Administration database shows.
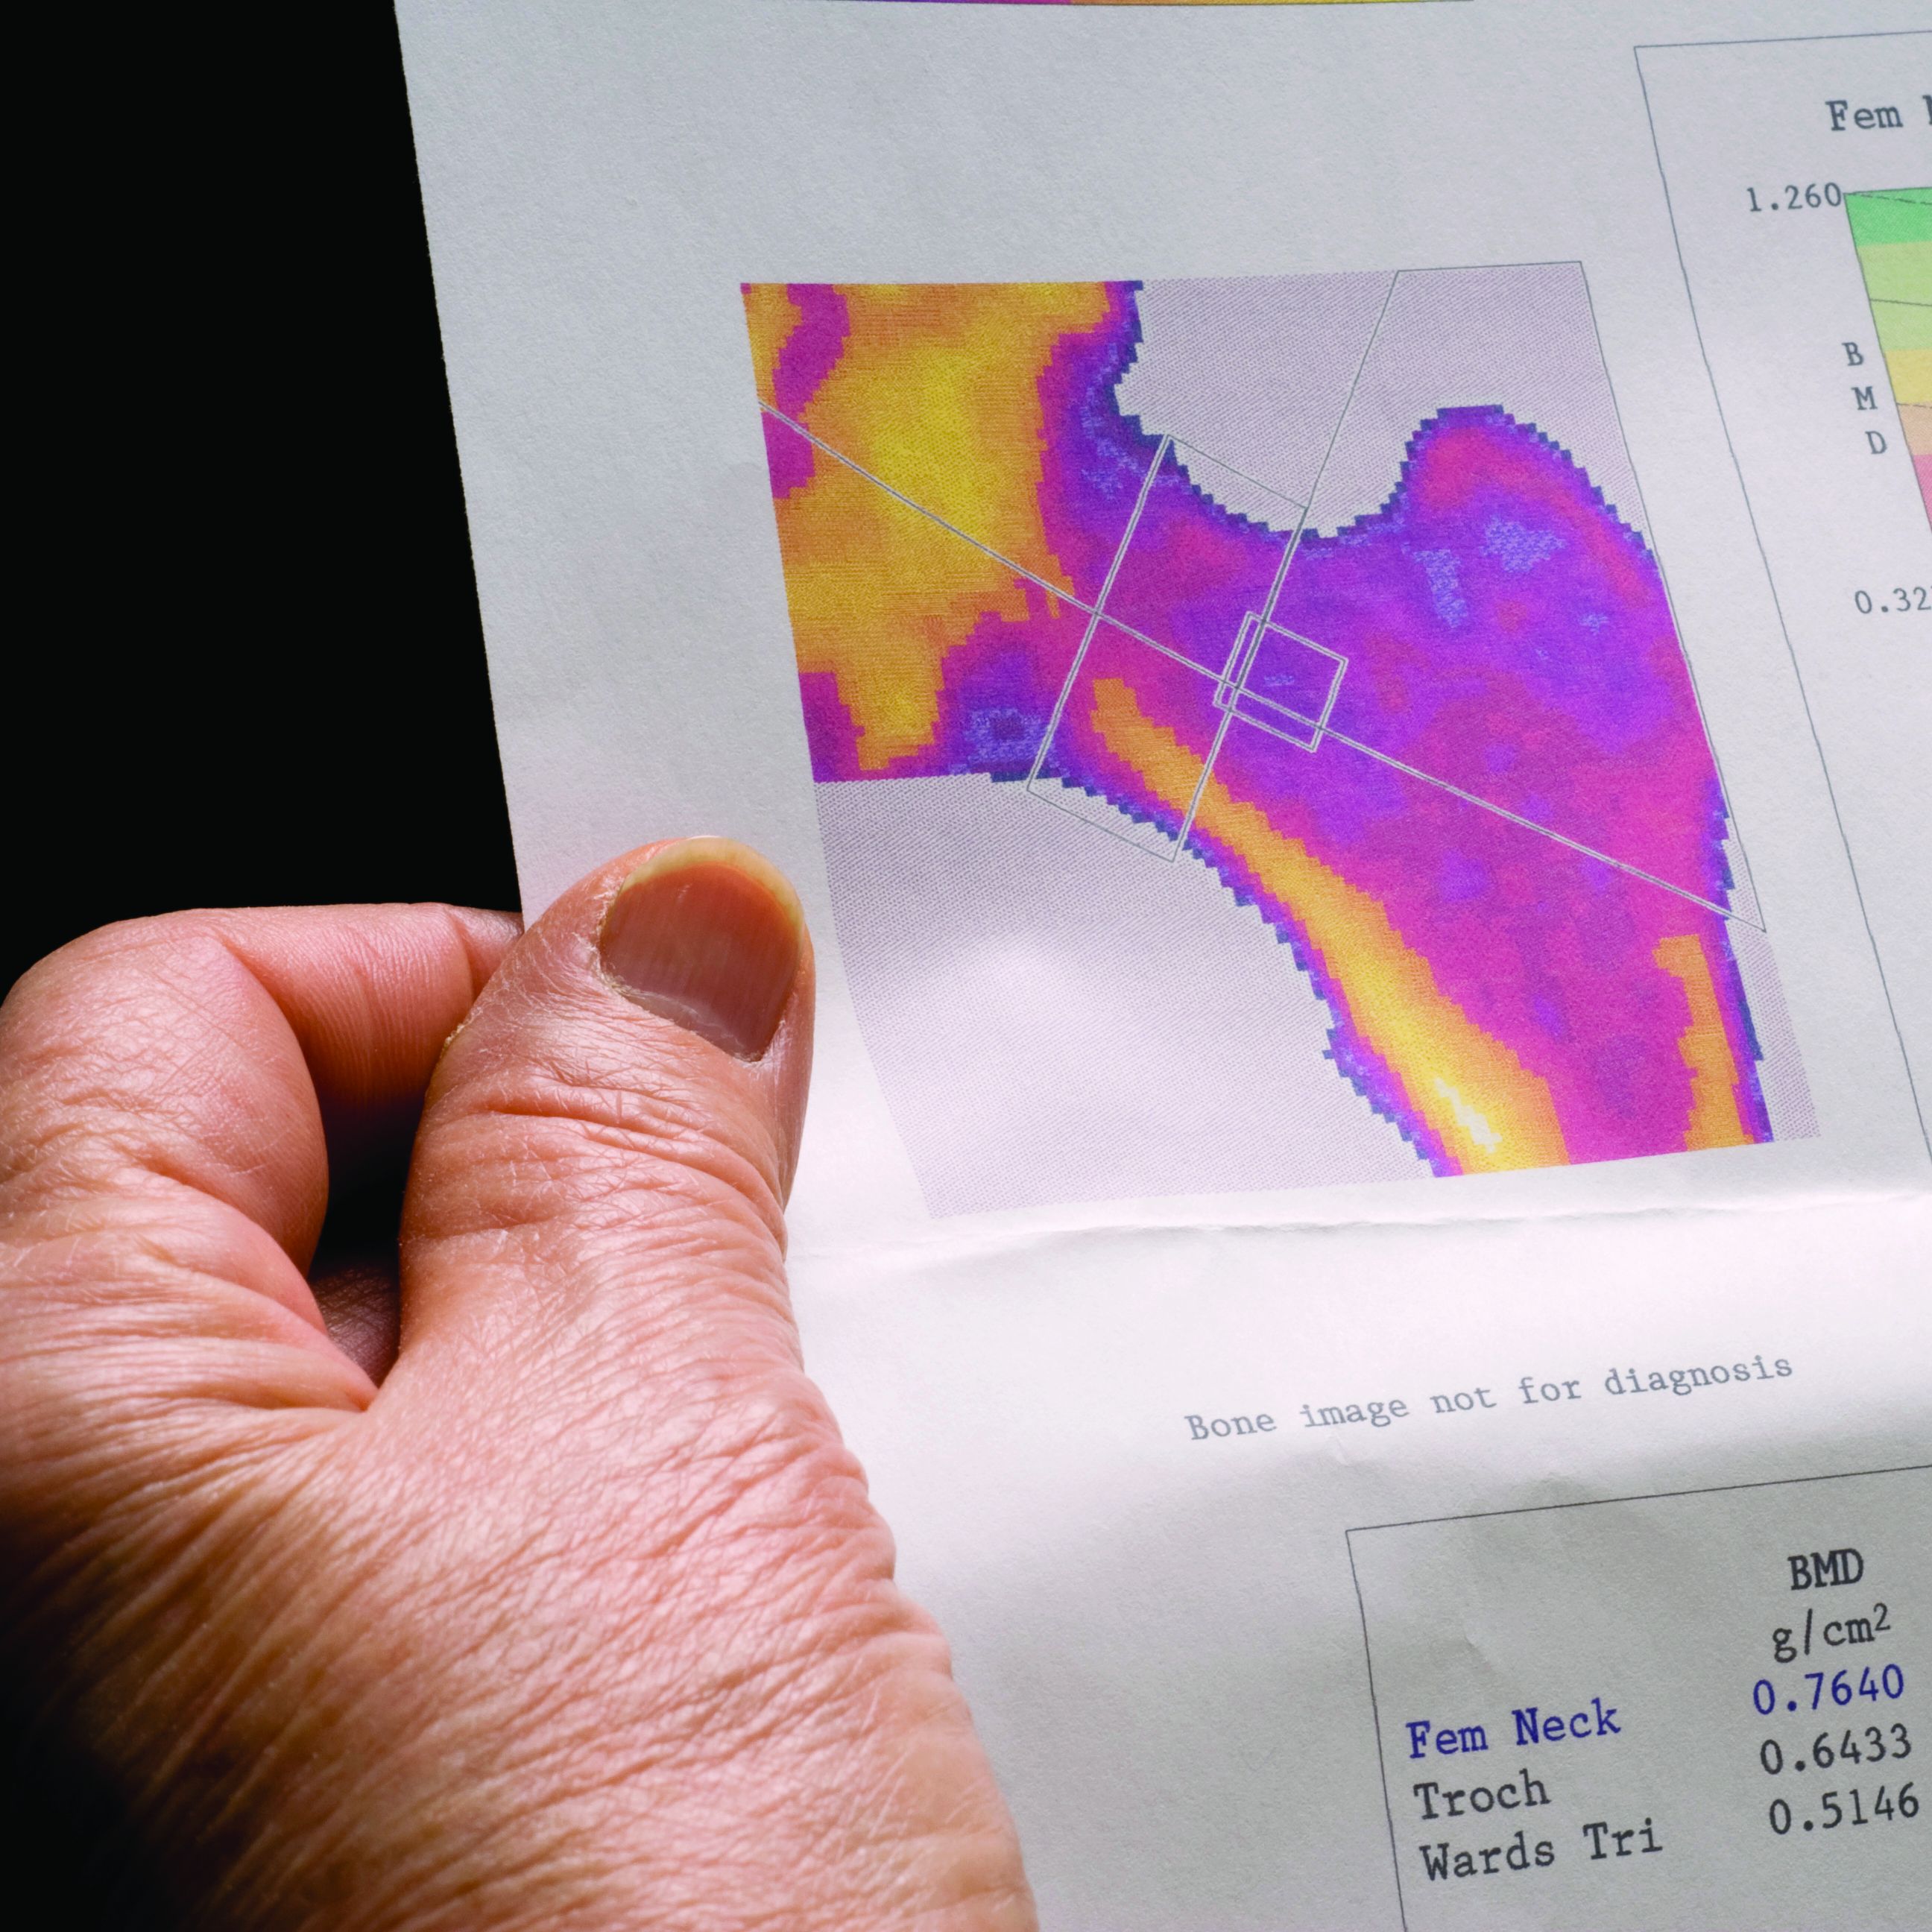
Because the majority of those analyzed in the VA dataset were men, this means that middle-aged and older men with kidney stones have about the same risk for osteoporosis as postmenopausal women do, but BMD screening for such men is not currently recommended, the study notes.
“These findings suggest that the risk of osteoporosis or fractures in patients with kidney stone disease is not restricted to postmenopausal women but is also observed in men, a group that is less well recognized to be at risk,” Calyani Ganesan, MD, of Stanford (Calif.) University and colleagues say in their article, published online March 3 in the Journal of Bone and Mineral Research.
“We hope this work raises awareness regarding the possibility of reduced bone strength in patients with kidney stones, [and] in our future work, we hope to identify which patients with kidney stones are at higher risk for osteoporosis or fracture to help guide bone density screening efforts by clinicians in this population,” Dr. Ganesan added in a statement.
VA dataset: Just 9.1% had DXA after kidney stone diagnosed
A total of 531,431 patients with a history of kidney stone disease were identified in the VA dataset. Of these, 23.6% either had been diagnosed with osteoporosis or had a history of fracture around the time of their kidney stone diagnosis. The most common diagnosis was a non-hip fracture, seen in 19% of patients, Dr. Ganesan and colleagues note, followed by osteoporosis in 6.1%, and hip fracture in 2.1%.
The mean age of the patients who concurrently had received a diagnosis of kidney stone disease and osteoporosis or had a fracture history was 64.2 years. In this cohort, more than 91% were men. The majority of the patients were White.
Among some 462,681 patients who had no prior history of either osteoporosis or fracture before their diagnosis of kidney stones, only 9.1% had undergone dual-energy x-ray absorptiometry (DXA) screening for BMD in the 5 years after their kidney stone diagnosis.
“Of those who completed DXA ... 20% were subsequently diagnosed with osteoporosis,” the authors note – 19% with non-hip fracture, and 2.4% with hip fracture.
Importantly, 85% of patients with kidney stone disease who were screened with DXA and were later diagnosed with osteoporosis were men.
“Given that almost 20% of patients in our cohort had a non-hip fracture, we contend that osteoporosis is underdiagnosed and undertreated in older men with kidney stone disease,” the authors stress.
Perform DXA screen in older men, even in absence of hypercalciuria
The authors also explain that the most common metabolic abnormality associated with kidney stones is high urine calcium excretion, or hypercalciuria.
“In a subset of patients with kidney stones, dysregulated calcium homeostasis may be present in which calcium is resorbed from bone and excreted into the urine, which can lead to osteoporosis and the formation of calcium stones,” they explain.
However, when they carried out a 24-hour assessment of urine calcium excretion on a small subset of patients with kidney stones, “we found no correlation between osteoporosis and the level of 24-hour urine calcium excretion,” they point out.
Even when the authors excluded patients who were taking a thiazide diuretic – a class of drugs that decreases urine calcium excretion – there was no correlation between osteoporosis and the level of 24-hour urine calcium excretion.
The investigators suggest it is possible that, in the majority of patients with kidney stones, the cause of hypercalciuria is more closely related to overabsorption of calcium from the gut, not to overresorption of calcium from the bone.
“Nonetheless, our findings indicate that patients with kidney stone disease could benefit from DXA screening even in the absence of hypercalciuria,” they state.
“And our findings provide support for wider use of bone mineral density screening in patients with kidney stone disease, including middle-aged and older men, for whom efforts to mitigate risks of osteoporosis and fractures are not commonly emphasized,” they reaffirm.
The study was funded by the VA Merit Review and the National Institute of Diabetes and Digestive and Kidney Diseases. The authors have disclosed no relevant financial relationships.
A version of this article first appeared on Medscape.com.
Almost one in four men and women diagnosed with kidney stones have osteoporosis or a history of fracture at the time of their diagnosis, yet fewer than 10% undergo bone mineral density (BMD) screening, a retrospective analysis of a Veterans Health Administration database shows.
Because the majority of those analyzed in the VA dataset were men, this means that middle-aged and older men with kidney stones have about the same risk for osteoporosis as postmenopausal women do, but BMD screening for such men is not currently recommended, the study notes.
“These findings suggest that the risk of osteoporosis or fractures in patients with kidney stone disease is not restricted to postmenopausal women but is also observed in men, a group that is less well recognized to be at risk,” Calyani Ganesan, MD, of Stanford (Calif.) University and colleagues say in their article, published online March 3 in the Journal of Bone and Mineral Research.
“We hope this work raises awareness regarding the possibility of reduced bone strength in patients with kidney stones, [and] in our future work, we hope to identify which patients with kidney stones are at higher risk for osteoporosis or fracture to help guide bone density screening efforts by clinicians in this population,” Dr. Ganesan added in a statement.
VA dataset: Just 9.1% had DXA after kidney stone diagnosed
A total of 531,431 patients with a history of kidney stone disease were identified in the VA dataset. Of these, 23.6% either had been diagnosed with osteoporosis or had a history of fracture around the time of their kidney stone diagnosis. The most common diagnosis was a non-hip fracture, seen in 19% of patients, Dr. Ganesan and colleagues note, followed by osteoporosis in 6.1%, and hip fracture in 2.1%.
The mean age of the patients who concurrently had received a diagnosis of kidney stone disease and osteoporosis or had a fracture history was 64.2 years. In this cohort, more than 91% were men. The majority of the patients were White.
Among some 462,681 patients who had no prior history of either osteoporosis or fracture before their diagnosis of kidney stones, only 9.1% had undergone dual-energy x-ray absorptiometry (DXA) screening for BMD in the 5 years after their kidney stone diagnosis.
“Of those who completed DXA ... 20% were subsequently diagnosed with osteoporosis,” the authors note – 19% with non-hip fracture, and 2.4% with hip fracture.
Importantly, 85% of patients with kidney stone disease who were screened with DXA and were later diagnosed with osteoporosis were men.
“Given that almost 20% of patients in our cohort had a non-hip fracture, we contend that osteoporosis is underdiagnosed and undertreated in older men with kidney stone disease,” the authors stress.
Perform DXA screen in older men, even in absence of hypercalciuria
The authors also explain that the most common metabolic abnormality associated with kidney stones is high urine calcium excretion, or hypercalciuria.
“In a subset of patients with kidney stones, dysregulated calcium homeostasis may be present in which calcium is resorbed from bone and excreted into the urine, which can lead to osteoporosis and the formation of calcium stones,” they explain.
However, when they carried out a 24-hour assessment of urine calcium excretion on a small subset of patients with kidney stones, “we found no correlation between osteoporosis and the level of 24-hour urine calcium excretion,” they point out.
Even when the authors excluded patients who were taking a thiazide diuretic – a class of drugs that decreases urine calcium excretion – there was no correlation between osteoporosis and the level of 24-hour urine calcium excretion.
The investigators suggest it is possible that, in the majority of patients with kidney stones, the cause of hypercalciuria is more closely related to overabsorption of calcium from the gut, not to overresorption of calcium from the bone.
“Nonetheless, our findings indicate that patients with kidney stone disease could benefit from DXA screening even in the absence of hypercalciuria,” they state.
“And our findings provide support for wider use of bone mineral density screening in patients with kidney stone disease, including middle-aged and older men, for whom efforts to mitigate risks of osteoporosis and fractures are not commonly emphasized,” they reaffirm.
The study was funded by the VA Merit Review and the National Institute of Diabetes and Digestive and Kidney Diseases. The authors have disclosed no relevant financial relationships.
A version of this article first appeared on Medscape.com.