User login
Frailty and cardiovascular disease: A two-way street?
Despite a marked increase in awareness in recent years surrounding the prevalence and prognosis of frailty in our aging population and its association with cardiovascular disease, itself highly prevalent in elderly cohorts, the exact pathobiological links between the 2 conditions have not been fully elucidated. As a consequence, this has led to difficulty not only in accurately defining cardiovascular risk in vulnerable elderly patients, but also in adequately mitigating against it.
It is well accepted that cardiovascular disease, whether clinical or subclinical, is associated with an increased risk of developing the frail phenotype.1,2 Frailty, in turn, has been consistently identified as a universal marker of adverse outcomes in patients at risk of, and in patients with already manifest, cardiovascular disease.2,3 However, whether or not frailty is its own unique risk factor for cardiovascular disease, independent of co-associated risk markers, or is merely a downstream byproduct indicating a more advanced disease state, has yet to be determined. Furthermore, the question of whether modification of frail status may impact the development and progression of cardiovascular disease has not yet been established.
The article by Orkaby et al4 in this issue delves deeper into this question by looking specifically at the interaction between frailty and standard risk factors as they relate to the prevention of cardiovascular disease.
NEEDED: A UNIVERSAL DEFINITION OF FRAILTY
It is important to acknowledge up front that before we can truly examine frailty as a novel risk entity in the assessment and management of cardiovascular risk in older-age patients, we need to agree on an accepted, validated definition of the phenotype as it relates to this population. As acknowledged by Orkaby et al,4 lack of such a standardized definition has resulted in highly variable estimates of the prevalence of frailty, ranging from 6.9% in a community-dwelling population in the original Cardiovascular Health Study to as high as 50% in older adults with manifest cardiovascular disease.1,2
The ideal frailty assessment tool should be a simple, quantitative, objective, and universally accepted method, capable of providing a consistent, valid, reproducible definition that can then be used in real time by the clinician to determine the absolute presence or absence of the phenotype, much like hypertension or diabetes. Whether this optimal tool will turn out to be the traditional or modified version of the Fried Scale,1 an alternative multicomponent measure such as the Deficit Index,5 or even the increasingly popular single-item measures such as gait speed or grip strength, remains to be determined.
Exact choice of tool is perhaps less important than the singular adoption of a universal method that can then be rigorously tried and tested in multicenter studies. Given the bulk of data to date for the original Fried phenotype and its development in an older-age community setting with a typical prevalence of cardiovascular risk factors, the Fried Scale appears a particularly suitable tool to use for this domain of disease prevention. Single-item spin-off measures from this phenotype, including gait speed, may also be useful for their increased feasibility and practicality in certain situations.
A TWO-WAY STREET
Given what we know about the pathophysiological, immunological, and inflammatory processes underlying advancing age that have also been implicated in both frailty and cardiovascular disease syndromes, how can we determine if frailty truly is an independent risk factor for cardiovascular disease or merely an epiphenomenon of the aging process?
We do know that older age is not a prerequisite for frailty, as is evident in studies of the phenotype in middle-aged (and younger) patients with advanced heart failure.6 We also know not only that frail populations have a higher age-adjusted prevalence of cardiovascular risk factors including diabetes and hypertension,1 but also that community-dwellers with prefrailty (as defined in studies using the Fried criteria as 1 or 2 vs 3 present criteria) at baseline have a significantly increased risk of developing incident cardiovascular disease compared with those defined as nonfrail, even after adjustment for traditional risk factors and other biomarkers.3 Exploring the differences between these subgroups at baseline revealed that prefrailty was significantly associated with several subclinical insults that may serve as adverse vascular mediators, including insulin resistance, elevated inflammatory markers, and central adiposity.3
A substudy of the Cardiovascular Health Study also found that in over 1,200 participants without a prior history of a cardiovascular event, the presence of frailty was associated with multiple noninvasive measures of subclinical cardiovascular disease, including electrocardiographic and echocardiographic markers of left ventricular hypertrophy, carotid stenosis, and silent cerebrovascular infarcts on magnetic resonance imaging.7
These findings support a mechanistic link between evolving stages of frailty and a gradient of progressive cardiovascular risk, with a multifaceted dysregulation of metabolic processes known to underpin the pathogenesis of the frailty phenotype likely also triggering risk pathways (altered insulin metabolism, inflammation) involved in incident cardiovascular disease. Although the exact pathobiological pathways underlying these complex interlinked relationships between aging, frailty, and cardiovascular disease have yet to be fully elucidated, awareness of the bidirectional relationship between both morbid conditions highlights the absolute importance of modifying risk factors and subclinical conditions that are common to both.
CAN RISK BE MODIFIED IN FRAIL ADULTS?
Orkaby et al4 nicely lay out the guidelines for standard cardiovascular risk factor modification viewed in light of what is currently known—or not known—about how these recommendations should be interpreted for the older, frail, at-risk population. It is important to note at the outset that clinical trial data both inclusive of this population and incorporating the up-front assessment of frailty to predefine frail-or-not subgroups are sparse, and thereby evidence for how to optimize cardiovascular disease prevention in this important cohort is largely based on smaller observational studies and expert consensus.
Hypertension
However, important subanalyses derived from 2 large randomized controlled trials (Hypertension in the Very Elderly Trial [HYVET] and Systolic Blood Pressure Intervention Trial [SPRINT]) looking specifically at the impact of frail status on blood pressure treatment targets and related outcomes in elderly adults have recently been published.8,9 Notably, both studies showed the beneficial outcomes of more intensive treatment (to 150/80 mm Hg or 120 mm Hg systolic, respectively) persisted in those characterized as frail (via Rockwood frailty index or slow gait speed).8,9 Importantly, in the SPRINT analysis, higher event rates were seen with increasing frailty in both treatment groups; across each frailty stratum, absolute event rates were lower for the intensive treatment arm.9 These results were evident without a significant difference in the overall rate of serious adverse events9 or withdrawal rates8 between treatment groups.
Hypertension is the primary domain in which up-to-date clinical trial data have shown benefit for continued aggressive treatment for cardiovascular disease prevention regardless of the presence of frailty. Despite these data, in the real world, the “eyeball” frailty test often leads us to err on the side of caution regarding blood pressure management in the frail older adult. Certainly, the use of antihypertensive therapy in this population requires balanced consideration of the risk for adverse effects; the SPRINT analysis also found higher absolute rates of hypotension, falls, and acute kidney injury in the more intensively treated group.9 These adverse effects may be ameliorated not necessarily by modifying the target goal that is required, but by employing alternative strategies in achieving this goal, such as starting with lower doses, uptitrating more slowly, and monitoring with more frequent laboratory testing.
Currently, consensus guidelines in Canada have recommended liberalizing blood pressure treatment goals in those with “advanced frailty” associated with a shorter life expectancy.10
Dyslipidemia
Regarding the other major vascular risk factors, trials looking at the role of frailty in the targeted treatment of hyperlipidemia with statins in older patients for primary prevention of cardiovascular disease are lacking, although the Justification for the Use of Statins in Prevention: an Intervention Trial Evaluating Rosuvastatin (JUPITER) trial showed a significant positive benefit for statin therapy in adults over age 70 (number needed to treat of 19 to prevent 1 major cardiovascular event, and 29 to prevent 1 cardiovascular death).11 This again may be counterbalanced by the purported increased risk of cognitive and potential adverse functional effects of statins in this age group; however, trial data specific to frail status or not is required to truly assess the benefit-risk ratio in this population.
Hyperglycemia
Meanwhile, recent clinical trials looking at the impact of age, functional impairment, and burden of comorbidities (rather than specific frailty measures) on glucose-lowering targets and cardiovascular outcomes have failed to show a benefit from intensive glycemic control strategies, leading guideline societies to endorse less-stringent hemoglobin A1c goals in this population.12 Given the well-documented association between hyperglycemia and cardiovascular disease, as well as the purported dysregulated glucose metabolism underlying the frail phenotype, it is important that future trials looking at optimal hemoglobin A1c targets incorporate the presence or absence of frailty to better inform specific recommendations for this population.
ONE SIZE MAY NOT FIT ALL
Overall, if both prefrailty and frailty are independent risk factors for, and a consequence of, clinical cardiovascular disease, it is worth bearing in mind that the modification of “intensive” or best practice therapies based on qualitatively assessed frailty may actually contribute to the problem. With best intentions, the negative impact of frailty on cardiovascular outcomes may be augmented by automatically assuming it to reflect a need for “therapy-light.” The adverse downstream consequences of inadequately treated cardiovascular risk factors are not in doubt, and it is important as the role of frailty becomes an increasingly recognized cofactor in the management of older adults with these risk factors that the vicious cycle underlying both syndromes is kept in mind, in order to avoid frailty becoming a harbinger of undertreatment in older, geriatric populations.
What is clear is that more prospective clinical trial data in this population are urgently needed in order to better delineate the exact interactions between frail status and these risk factors and the potential downstream consequences, using prespecified and robust frailty assessment methods.
Perhaps frailty should be seen as a series of stages rather than simply as a binary “there or not there” biomarker; through initial and established stages of the syndrome, which have been independently associated with both clinical events and subclinical surrogates of cardiovascular disease, risk factors should continue to be treated aggressively and according to best available evidence. However, as guideline societies are already beginning to endorse as highlighted above, once the phenotype becomes tethered with a certain threshold burden of comorbidity, cognitive or functional impairment, or more end-stage disease status, then goals for cardiovascular disease prevention may need to be readdressed and modified. If frailty is truly confirmed as a cardiovascular disease equivalent, not only appropriately treating associated cardiovascular risk factors but also seeking therapies that actively target the frailty syndrome itself should be an important goal of future studies seeking to impact the development of both clinical and subclinical cardiovascular disease in this population.
- Fried LP, Tangen CM, Walston J, et al; Cardiovascular Health Study Collaborative Research Group. Frailty in older adults: evidence for a phenotype. J Gerontol A Biol Sci Med Sci 2001; 56:M146–M156.
- Afilalo J, Alexander KP, Mack MJ, et al. Frailty assessment in the cardiovascular care of older adults. J Am Coll Cardiol 2014; 63:747–762.
- Sergi G, Veronese N, Fontana L, et al. Pre-frailty and risk of cardiovascular disease in elderly men and women: the Pro.V.A. study. J Am Coll Cardiol 2015; 65:976–983.
- Orkaby AR, Onuma O, Qazi S, Gaziano JM, Driver JA. Preventing cardiovascular disease in older adults: one size does not fit all. Cleve Clin J Med 2018; 85:55–64.
- Searle SD, Mitnitski A, Gahbauer EA, Gill TM, Rockwood K. A standard procedure for creating a frailty index. BMC Geriatr 2008;8:24.
- Joyce E. Frailty in advanced heart failure. Heart Fail Clin 2016; 12:363–374.
- Newman AB, Gottdiener JS, McBurnie MA, et al; Cardiovascular Health Study Research Group. Associations of subclinical cardiovascular disease with frailty. J Gerontol A Biol Sci Med Sci 2001; 56:M158–M166.
- Warwick J, Falaschetti E, Rockwood K, et al. No evidence that frailty modifies the positive impact of antihypertensive treatment in very elderly people: an investigation of the impact of frailty upon treatment effect in the Hypertension in the Very Elderly Trial (HYVET) study, a double-blind, placebo-controlled study of antihypertensives in people with hypertension aged 80 and over. BMC Med 2015; 13:78.
- Williamson JD, Supiano MA, Applegate WB, et al; SPRINT Research Group. Intensive vs standard blood pressure control and cardiovascular disease outcomes in adults aged ≥ 75 years: a randomized clinical trial. JAMA 2016; 315:2673–2682.
- Mallery LH, Allen M, Fleming I, et al. Promoting higher blood pressure targets for frail older adults: a consensus guideline from Canada. Cleve Clin J Med 2014; 81:427–437.
- Glynn RJ, Koenig W, Nordestgaard BG, Shepherd J, Ridker PM. Rosuvastatin for primary prevention in older persons with elevated C-reactive protein and low to average low-density lipoprotein cholesterol levels: exploratory analysis of a randomized trial. Ann Intern Med 2010; 152:488–496.
- Ismail-Beigi F, Moghissi E, Tiktin M, Hirsch IB, Inzucchi SE, Genuth S. Individualizing glycemic targets in type 2 diabetes mellitus: implications of recent clinical trials. Ann Intern Med 2011; 154:554–559.
Despite a marked increase in awareness in recent years surrounding the prevalence and prognosis of frailty in our aging population and its association with cardiovascular disease, itself highly prevalent in elderly cohorts, the exact pathobiological links between the 2 conditions have not been fully elucidated. As a consequence, this has led to difficulty not only in accurately defining cardiovascular risk in vulnerable elderly patients, but also in adequately mitigating against it.
It is well accepted that cardiovascular disease, whether clinical or subclinical, is associated with an increased risk of developing the frail phenotype.1,2 Frailty, in turn, has been consistently identified as a universal marker of adverse outcomes in patients at risk of, and in patients with already manifest, cardiovascular disease.2,3 However, whether or not frailty is its own unique risk factor for cardiovascular disease, independent of co-associated risk markers, or is merely a downstream byproduct indicating a more advanced disease state, has yet to be determined. Furthermore, the question of whether modification of frail status may impact the development and progression of cardiovascular disease has not yet been established.
The article by Orkaby et al4 in this issue delves deeper into this question by looking specifically at the interaction between frailty and standard risk factors as they relate to the prevention of cardiovascular disease.
NEEDED: A UNIVERSAL DEFINITION OF FRAILTY
It is important to acknowledge up front that before we can truly examine frailty as a novel risk entity in the assessment and management of cardiovascular risk in older-age patients, we need to agree on an accepted, validated definition of the phenotype as it relates to this population. As acknowledged by Orkaby et al,4 lack of such a standardized definition has resulted in highly variable estimates of the prevalence of frailty, ranging from 6.9% in a community-dwelling population in the original Cardiovascular Health Study to as high as 50% in older adults with manifest cardiovascular disease.1,2
The ideal frailty assessment tool should be a simple, quantitative, objective, and universally accepted method, capable of providing a consistent, valid, reproducible definition that can then be used in real time by the clinician to determine the absolute presence or absence of the phenotype, much like hypertension or diabetes. Whether this optimal tool will turn out to be the traditional or modified version of the Fried Scale,1 an alternative multicomponent measure such as the Deficit Index,5 or even the increasingly popular single-item measures such as gait speed or grip strength, remains to be determined.
Exact choice of tool is perhaps less important than the singular adoption of a universal method that can then be rigorously tried and tested in multicenter studies. Given the bulk of data to date for the original Fried phenotype and its development in an older-age community setting with a typical prevalence of cardiovascular risk factors, the Fried Scale appears a particularly suitable tool to use for this domain of disease prevention. Single-item spin-off measures from this phenotype, including gait speed, may also be useful for their increased feasibility and practicality in certain situations.
A TWO-WAY STREET
Given what we know about the pathophysiological, immunological, and inflammatory processes underlying advancing age that have also been implicated in both frailty and cardiovascular disease syndromes, how can we determine if frailty truly is an independent risk factor for cardiovascular disease or merely an epiphenomenon of the aging process?
We do know that older age is not a prerequisite for frailty, as is evident in studies of the phenotype in middle-aged (and younger) patients with advanced heart failure.6 We also know not only that frail populations have a higher age-adjusted prevalence of cardiovascular risk factors including diabetes and hypertension,1 but also that community-dwellers with prefrailty (as defined in studies using the Fried criteria as 1 or 2 vs 3 present criteria) at baseline have a significantly increased risk of developing incident cardiovascular disease compared with those defined as nonfrail, even after adjustment for traditional risk factors and other biomarkers.3 Exploring the differences between these subgroups at baseline revealed that prefrailty was significantly associated with several subclinical insults that may serve as adverse vascular mediators, including insulin resistance, elevated inflammatory markers, and central adiposity.3
A substudy of the Cardiovascular Health Study also found that in over 1,200 participants without a prior history of a cardiovascular event, the presence of frailty was associated with multiple noninvasive measures of subclinical cardiovascular disease, including electrocardiographic and echocardiographic markers of left ventricular hypertrophy, carotid stenosis, and silent cerebrovascular infarcts on magnetic resonance imaging.7
These findings support a mechanistic link between evolving stages of frailty and a gradient of progressive cardiovascular risk, with a multifaceted dysregulation of metabolic processes known to underpin the pathogenesis of the frailty phenotype likely also triggering risk pathways (altered insulin metabolism, inflammation) involved in incident cardiovascular disease. Although the exact pathobiological pathways underlying these complex interlinked relationships between aging, frailty, and cardiovascular disease have yet to be fully elucidated, awareness of the bidirectional relationship between both morbid conditions highlights the absolute importance of modifying risk factors and subclinical conditions that are common to both.
CAN RISK BE MODIFIED IN FRAIL ADULTS?
Orkaby et al4 nicely lay out the guidelines for standard cardiovascular risk factor modification viewed in light of what is currently known—or not known—about how these recommendations should be interpreted for the older, frail, at-risk population. It is important to note at the outset that clinical trial data both inclusive of this population and incorporating the up-front assessment of frailty to predefine frail-or-not subgroups are sparse, and thereby evidence for how to optimize cardiovascular disease prevention in this important cohort is largely based on smaller observational studies and expert consensus.
Hypertension
However, important subanalyses derived from 2 large randomized controlled trials (Hypertension in the Very Elderly Trial [HYVET] and Systolic Blood Pressure Intervention Trial [SPRINT]) looking specifically at the impact of frail status on blood pressure treatment targets and related outcomes in elderly adults have recently been published.8,9 Notably, both studies showed the beneficial outcomes of more intensive treatment (to 150/80 mm Hg or 120 mm Hg systolic, respectively) persisted in those characterized as frail (via Rockwood frailty index or slow gait speed).8,9 Importantly, in the SPRINT analysis, higher event rates were seen with increasing frailty in both treatment groups; across each frailty stratum, absolute event rates were lower for the intensive treatment arm.9 These results were evident without a significant difference in the overall rate of serious adverse events9 or withdrawal rates8 between treatment groups.
Hypertension is the primary domain in which up-to-date clinical trial data have shown benefit for continued aggressive treatment for cardiovascular disease prevention regardless of the presence of frailty. Despite these data, in the real world, the “eyeball” frailty test often leads us to err on the side of caution regarding blood pressure management in the frail older adult. Certainly, the use of antihypertensive therapy in this population requires balanced consideration of the risk for adverse effects; the SPRINT analysis also found higher absolute rates of hypotension, falls, and acute kidney injury in the more intensively treated group.9 These adverse effects may be ameliorated not necessarily by modifying the target goal that is required, but by employing alternative strategies in achieving this goal, such as starting with lower doses, uptitrating more slowly, and monitoring with more frequent laboratory testing.
Currently, consensus guidelines in Canada have recommended liberalizing blood pressure treatment goals in those with “advanced frailty” associated with a shorter life expectancy.10
Dyslipidemia
Regarding the other major vascular risk factors, trials looking at the role of frailty in the targeted treatment of hyperlipidemia with statins in older patients for primary prevention of cardiovascular disease are lacking, although the Justification for the Use of Statins in Prevention: an Intervention Trial Evaluating Rosuvastatin (JUPITER) trial showed a significant positive benefit for statin therapy in adults over age 70 (number needed to treat of 19 to prevent 1 major cardiovascular event, and 29 to prevent 1 cardiovascular death).11 This again may be counterbalanced by the purported increased risk of cognitive and potential adverse functional effects of statins in this age group; however, trial data specific to frail status or not is required to truly assess the benefit-risk ratio in this population.
Hyperglycemia
Meanwhile, recent clinical trials looking at the impact of age, functional impairment, and burden of comorbidities (rather than specific frailty measures) on glucose-lowering targets and cardiovascular outcomes have failed to show a benefit from intensive glycemic control strategies, leading guideline societies to endorse less-stringent hemoglobin A1c goals in this population.12 Given the well-documented association between hyperglycemia and cardiovascular disease, as well as the purported dysregulated glucose metabolism underlying the frail phenotype, it is important that future trials looking at optimal hemoglobin A1c targets incorporate the presence or absence of frailty to better inform specific recommendations for this population.
ONE SIZE MAY NOT FIT ALL
Overall, if both prefrailty and frailty are independent risk factors for, and a consequence of, clinical cardiovascular disease, it is worth bearing in mind that the modification of “intensive” or best practice therapies based on qualitatively assessed frailty may actually contribute to the problem. With best intentions, the negative impact of frailty on cardiovascular outcomes may be augmented by automatically assuming it to reflect a need for “therapy-light.” The adverse downstream consequences of inadequately treated cardiovascular risk factors are not in doubt, and it is important as the role of frailty becomes an increasingly recognized cofactor in the management of older adults with these risk factors that the vicious cycle underlying both syndromes is kept in mind, in order to avoid frailty becoming a harbinger of undertreatment in older, geriatric populations.
What is clear is that more prospective clinical trial data in this population are urgently needed in order to better delineate the exact interactions between frail status and these risk factors and the potential downstream consequences, using prespecified and robust frailty assessment methods.
Perhaps frailty should be seen as a series of stages rather than simply as a binary “there or not there” biomarker; through initial and established stages of the syndrome, which have been independently associated with both clinical events and subclinical surrogates of cardiovascular disease, risk factors should continue to be treated aggressively and according to best available evidence. However, as guideline societies are already beginning to endorse as highlighted above, once the phenotype becomes tethered with a certain threshold burden of comorbidity, cognitive or functional impairment, or more end-stage disease status, then goals for cardiovascular disease prevention may need to be readdressed and modified. If frailty is truly confirmed as a cardiovascular disease equivalent, not only appropriately treating associated cardiovascular risk factors but also seeking therapies that actively target the frailty syndrome itself should be an important goal of future studies seeking to impact the development of both clinical and subclinical cardiovascular disease in this population.
- Fried LP, Tangen CM, Walston J, et al; Cardiovascular Health Study Collaborative Research Group. Frailty in older adults: evidence for a phenotype. J Gerontol A Biol Sci Med Sci 2001; 56:M146–M156.
- Afilalo J, Alexander KP, Mack MJ, et al. Frailty assessment in the cardiovascular care of older adults. J Am Coll Cardiol 2014; 63:747–762.
- Sergi G, Veronese N, Fontana L, et al. Pre-frailty and risk of cardiovascular disease in elderly men and women: the Pro.V.A. study. J Am Coll Cardiol 2015; 65:976–983.
- Orkaby AR, Onuma O, Qazi S, Gaziano JM, Driver JA. Preventing cardiovascular disease in older adults: one size does not fit all. Cleve Clin J Med 2018; 85:55–64.
- Searle SD, Mitnitski A, Gahbauer EA, Gill TM, Rockwood K. A standard procedure for creating a frailty index. BMC Geriatr 2008;8:24.
- Joyce E. Frailty in advanced heart failure. Heart Fail Clin 2016; 12:363–374.
- Newman AB, Gottdiener JS, McBurnie MA, et al; Cardiovascular Health Study Research Group. Associations of subclinical cardiovascular disease with frailty. J Gerontol A Biol Sci Med Sci 2001; 56:M158–M166.
- Warwick J, Falaschetti E, Rockwood K, et al. No evidence that frailty modifies the positive impact of antihypertensive treatment in very elderly people: an investigation of the impact of frailty upon treatment effect in the Hypertension in the Very Elderly Trial (HYVET) study, a double-blind, placebo-controlled study of antihypertensives in people with hypertension aged 80 and over. BMC Med 2015; 13:78.
- Williamson JD, Supiano MA, Applegate WB, et al; SPRINT Research Group. Intensive vs standard blood pressure control and cardiovascular disease outcomes in adults aged ≥ 75 years: a randomized clinical trial. JAMA 2016; 315:2673–2682.
- Mallery LH, Allen M, Fleming I, et al. Promoting higher blood pressure targets for frail older adults: a consensus guideline from Canada. Cleve Clin J Med 2014; 81:427–437.
- Glynn RJ, Koenig W, Nordestgaard BG, Shepherd J, Ridker PM. Rosuvastatin for primary prevention in older persons with elevated C-reactive protein and low to average low-density lipoprotein cholesterol levels: exploratory analysis of a randomized trial. Ann Intern Med 2010; 152:488–496.
- Ismail-Beigi F, Moghissi E, Tiktin M, Hirsch IB, Inzucchi SE, Genuth S. Individualizing glycemic targets in type 2 diabetes mellitus: implications of recent clinical trials. Ann Intern Med 2011; 154:554–559.

Diagnosis and treatment of hyperkalemia
Hyperkalemia is common in patients with cardiovascular disease. Its consequences can be severe and life-threatening, and its management and prevention require a multidisciplinary approach that entails reducing intake of high-potassium foods, adjusting medications that cause hyperkalemia, and adding medications that reduce the plasma potassium concentration. With this approach, patients at high risk can receive the cardiorenal benefits of drugs that block the renin-angiotensin-aldosterone system without developing hyperkalemia.
98% OF POTASSIUM IS INSIDE CELLS
The body of a typical 70-kg man contains about 3,500 mmol of potassium, 98% of which is in the intracellular space; the remaining 2% is in the extracellular space. This large intracellular-to-extracellular gradient determines the cell voltage and explains why disorders in plasma potassium give rise to manifestations in excitable tissues such as the heart and nervous system.
The most important determinants of potassium distribution between the intracellular and extracellular space are insulin and beta-adrenergic receptor stimulation.
Maintenance of total-body potassium content is primarily the job of the kidneys, with a small contribution by the gastrointestinal tract.1,2 Hyperkalemia is most commonly encountered in patients with decreased kidney function.
The normal kidney can secrete a large amount of potassium, making hyperkalemia uncommon in the absence of kidney disease. This large capacity may have evolved to handle the diet of Paleolithic humans, which contained 4 times as much potassium as contemporary diets.3,4 With the onset of agriculture, dietary intake of potassium has progressively declined while sodium intake has risen. A popular theory suggests this mismatch between the modern diet and the nutritional requirements encoded in the human genome during evolution may contribute to chronic diseases such as hypertension, stroke, kidney stones, and bone disease.5
MANY POTENTIAL CAUSES OF HYPERKALEMIA

Causes of hyperkalemia are outlined in Table 1. Shifting of potassium from the cells to the extracellular space is a cause of transient hyperkalemia, while chronic hyperkalemia indicates an impairment in renal potassium secretion. The following discussion is a guide to the approach to the hyperkalemic patient.
Is the patient’s hyperkalemia really pseudohyperkalemia?
Pseudohyperkalemia, an artifact of measurement, occurs due to mechanical release of potassium from cells during phlebotomy or specimen processing.6 This diagnosis is made when the serum potassium concentration exceeds the plasma potassium concentration by more than 0.5 mmol/L, and should be considered when hyperkalemia occurs in the absence of a clinical risk factor. Fist-clenching, application of a tight-fitting tourniquet, or use of small-bore needles during phlebotomy can all cause pseudohyperkalemia.
Mechanism of pseudohyperkalemia. Since serum is the liquid part of blood remaining after coagulation, release of potassium from cells injured during the process of coagulation raises the potassium level in the serum. Plasma is the cell-free part of blood that has been treated with anticoagulants; it has no cells that can be injured and release potassium. Thus, the serum potassium level will be higher than that in the plasma.
Reverse pseudohyperkalemia, in contrast, occurs when the plasma potassium level is falsely elevated but the serum value is normal. This situation has been described in hematologic disorders characterized by pronounced leukocytosis in which malignant cells are prone to lysis with minimal mechanical stress due to increased fragility or altered sodium-potassium ATPase pump activity.7 This phenomenon is unusual but occurs because the cells are so fragile.
A spurious increase in plasma potassium concentration along with a low plasma calcium concentration raises the possibility of calcium chelation and release of potassium in a sample tube contaminated with the anticoagulant ethylenediaminetetraacetic acid.
Is there increased potassium intake?
Increased potassium intake is a potential cause of hyperkalemia in patients with decreased kidney function or adrenal disease.
Foods naturally rich in potassium include bananas (a medium-sized banana contains 451 mg or 12 mmol of potassium) and potatoes (844 mg or 22 mmol in a large baked potato with skin). Other potassium-rich foods are melons, citrus juice, and avocados. Less-obvious food sources include raw coconut juice (potassium concentration 44.3 mmol/L) and noni juice (56 mmol/L).
Salt substitutes, recommended to hypertensive patients with chronic kidney disease, can be a hidden source of dietary potassium.
Clay ingestion is a potential cause of dyskalemia. White clay consumption causes hypokalemia due to potassium binding in the gastrointestinal tract. Red clay or river bed clay, on the other hand, is enriched in potassium (100 mmol of potassium in 100 g of clay) and can cause life-threatening hyperkalemia in patients with chronic kidney disease.8
Eating burnt match heads. Some individuals chew and ingest burnt match heads, a condition called cautopyreiophagia. In one reported case,9 this activity contributed an additional 80 mmol of daily potassium intake in a dialysis patient, resulting in a plasma potassium concentration of 8 mmol/L.
Is the hyperkalemia the result of a cellular shift?
Acute hyperkalemia can be the result of redistribution of cellular potassium. Shifting of as little as 2% of the body’s potassium from the intracellular to the extracellular space can double the plasma potassium concentration.
Tissue injury. Hyperkalemia frequently occurs in diseases that cause tissue injury such as rhabdomyolysis, trauma, massive hemolysis, and tumor lysis.
Insulin deficiency. Insulin and catecholamines are major regulators of potassium distribution within the body. After a meal, release of insulin not only regulates the plasma glucose concentration, it also causes potassium to move into cells until the kidneys have had sufficient time to excrete the dietary potassium load and reestablish total-body potassium content.
Exercise, beta-blockers. During exercise, potassium is released from skeletal muscle cells and accumulates in the interstitial compartment, where it exerts a vasodilatory effect. The simultaneous increase in circulating catecholamines regulates this release by promoting cell potassium uptake through beta-adrenergic receptor stimulation.
Metabolic acidosis can facilitate exit (ie, shift) of potassium from cells, but this effect depends on the type of acidosis. Hyperchloremic normal anion gap acidosis (mineral acidosis) most commonly causes this effect due to the relative impermeability of the cell membrane to the chloride anion. As hydrogen ions move into the cell due to accumulation of ammonium chloride or hydrogen chloride, electrical neutrality is maintained by potassium exit.
In contrast, organic acidosis (due to lactic, beta-hydroxybutyric, or methylmalonic acid) tends not to cause a potassium shift, since most organic anions readily cross the cell membrane along with hydrogen. Lactic acidosis is often associated with potassium shift, but this effect is due to loss of cell integrity as a result of cell ischemia. The hyperkalemia typically present on admission in patients with diabetic ketoacidosis is the result of insulin deficiency and hypertonicity and not the underlying organic acidosis.10
Hypertonic states can cause hyperkalemia due to cell shift. For example, hyperglycemia, as in diabetic ketoacidosis, pulls water from the intracellular into the extracellular compartment, thereby concentrating intracellular potassium and creating a more favorable gradient for potassium efflux through membrane channels. This same effect can occur in neurosurgical patients given large amounts of hypertonic mannitol. Repetitive doses of immunoglobulin can lead to extracellular accumulation of sorbitol, maltose, or sucrose, since these sugars are added to the preparations to prevent immunoglobulin aggregation.11
Is a disturbance in renal potassium excretion present?
Sustained hyperkalemia is more commonly associated with decreases in renal potassium excretion than with a cellular shift. In most instances the clinician can distinguish between cell shift and impaired renal excretion based on the available clinical data.
The transtubular potassium gradient has been used to determine whether there is a disturbance in renal potassium excretion and to assess renal potassium handling.12

This calculation is based on the assumption that only water is reabsorbed past the cortical collecting duct, and not solutes. It has fallen out of favor since we have found this assumption to be incorrect; a large amount of urea is reabsorbed daily in the downstream medullary collecting duct as a result of intrarenal recycling of urea.
The one situation in which the transtubular potassium gradient may be of use is determining whether hyperkalemia is a result of low aldosterone levels as opposed to aldosterone resistance. One can compare the transtubular potassium gradient before and after a physiologic dose (0.05 mg) of 9-alpha fludrocortisone. An increase of more than 6 over a 4-hour period favors aldosterone deficiency, whereas smaller changes would indicate aldosterone resistance.
24-hour potassium excretion, spot urine potassium-creatinine ratio. A better way to assess renal potassium handling is to measure the amount of potassium in a 24-hour urine collection or determine a spot urine potassium-creatinine ratio. A 24-hour urinary potassium excretion of less than 15 mmol or a potassium-creatinine ratio less than 1 suggests an extrarenal cause of hypokalemia. A ratio greater than 20 would be an appropriate renal response to hyperkalemia.
One or more of 3 abnormalities should be considered in the hyperkalemic patient with impaired renal excretion of potassium:
- Decreased distal delivery of sodium
- Mineralocorticoid deficiency
- Abnormal cortical collecting tubule function.13
Decreased distal delivery of sodium
Under normal circumstances, potassium is freely filtered across the glomerulus and then mostly reabsorbed in the proximal tubule and thick ascending limb. Potassium secretion begins in the distal convoluted tubule and increases in magnitude into the collecting duct. Tubular secretion is the component of potassium handling that varies and is regulated according to physiologic needs.
In acute kidney injury, the rapid decline in glomerular filtration rate and reduction in functioning nephron mass lead to decreased distal potassium secretion.
Hyperkalemia is a frequent problem when oliguria is present, since the reduction in distal delivery of sodium and water further impairs potassium secretion. Patients with oliguric acute kidney injury are more likely to have a more severe underlying disease state, and therefore tissue breakdown and catabolism further increase the risk of hyperkalemia.
In contrast, in nonoliguric patients, the renal injury tends to be less severe, and enough sodium and water are usually delivered distally to prevent hyperkalemia.
In chronic kidney disease, nephron dropout and reduction in collecting tubule mass also lead to a global decline in distal potassium secretion. However, this is countered by an increased capacity of the remaining individual nephrons for potassium secretion. High flow, increased distal sodium delivery, and increased activity and number of sodium-potassium ATPase pumps in the remaining nephrons account for this increased secretory capacity.14 As renal function declines over time, colonic potassium secretion progressively increases.15
These adaptive changes help to keep the plasma potassium concentration within the normal range until the glomerular filtration rate falls to less than 10 or 15 mL/min. Development of hyperkalemia with more modest reductions in the glomerular filtration rate suggest decreased mineralocorticoid activity or a specific lesion of the tubule.
Mineralocorticoid deficiency

Aldosterone deficiency can occur alone or in combination with decreased cortisol levels. Destruction of the adrenal glands is suggested when both hormones are reduced. Enzyme defects in cortisol metabolism can result in either isolated deficiency of aldosterone or adrenogenital syndromes associated with decreased mineralocorticoid activity.
Heparin administration leads to a reversible defect in adrenal synthesis of aldosterone. Drugs that block the stimulatory effect of angiotensin II on the zona glomerulosa cells of the adrenal gland will lower aldosterone.
Renin-angiotensin-aldosterone system blockers. Angiotensin-converting enzyme inhibitors block the formation of angiotensin II, whereas angiotensin II receptor blockers prevent angiotensin II from binding to its adrenal receptor. The direct renin inhibitor aliskiren lowers angiotensin II levels by blocking the enzymatic activity of renin and lowers the circulating levels of both angiotensin I and II.16
The syndrome of hyporeninemic hypoaldosteronism is a common cause of hyperkalemia in patients who have a glomerular filtration rate between 40 and 60 mL/min. Diabetic nephropathy and interstitial renal disease are the most common clinical entities associated with this syndrome.10 Other causes include analgesic nephropathy, urinary tract obstruction, sickle cell disease, systemic lupus erythematosus, and amyloidosis.
Nonsteroidal anti-inflammatory drugs can cause hyperkalemia by suppressing renin release and reducing delivery of sodium to the distal nephron.18
Calcineurin inhibitors impair potassium secretion by suppressing renin release and by direct tubular effects.19
Beta-blockers. Beta-1 and to a lesser extent beta-2 receptor blockade can also result in a hyporeninemic state.
Distal tubular defect
Hyperkalemia can result from interstitial renal diseases that specifically affect the distal nephron. In this setting, the glomerular filtration rate is only mildly reduced, and circulating aldosterone levels are normal.
Renal transplant, lupus erythematosus, amyloidosis, urinary obstruction, and sickle cell disease are conditions in which an impairment in renin release may coexist with a defect in tubular secretion.
Potassium-sparing diuretics impair the ability of the cortical collecting tubule to secrete potassium. Specifically, amiloride and triamterene inhibit sodium reabsorption mediated by the epithelial sodium channel located on the apical membrane of the principal cell. This effect abolishes the lumen’s negative potential and thereby removes a driving force for potassium secretion.
Trimethoprim and pentamidine cause similar effects.
Spironolactone and eplerenone compete with aldosterone at the level of the mineralocorticoid receptor and can result in hyperkalemia.
Drospirenone, a non-testosterone-derived progestin contained in certain oral contraceptives, possesses mineralocorticoid-blocking effects similar to those of spironolactone.
The plasma potassium level should be monitored when these drugs are prescribed in patients receiving potassium supplements, renin-angiotensin-aldosterone system blockers, or nonsteroidal anti-inflammatory drugs.20
CLINICAL FEATURES OF HYPERKALEMIA
Neuromuscular manifestations of hyperkalemia include paresthesias and fasciculations in the arms and legs. Severe elevation in potassium can give rise to an ascending paralysis with eventual flaccid quadriplegia. Typically, the trunk, head, and respiratory muscles are spared, and respiratory failure is rare.
Cardiac signs

Hyperkalemia has depolarizing effects on the heart that are manifested by changes in the electrocardiogram (Figure 2). The progressive changes of hyperkalemia are classically listed as:
- Peaked T waves that are tall, narrow, and symmetrical and can occasionally be confused with the hyperacute T-wave change associated with an ST-segment elevation myocardial infarction.21 However, in the latter condition, the T waves tend to be more broad-based and asymmetric in shape.
- ST-segment depression
- Widening of the PR interval
- Widening of the QRS interval
- Loss of the P wave
- A sine-wave pattern—an ominous development and a harbinger of impending ventricular fibrillation and asystole.
The plasma potassium concentration often correlates poorly with cardiac manifestations. In a retrospective review, only 16 of 90 cases met strict criteria for electrocardiographic changes reflective of hyperkalemia (defined as new peaked and symmetric T waves that resolved on follow-up).22 In 13 of these cases, the electrocardiogram was interpreted as showing no T-wave changes even when read by a cardiologist. In addition, electrocardiographic criteria for hyperkalemia were noted in only 1 of 14 patients who manifested arrhythmias or cardiac arrest attributed to increased plasma potassium concentration.
TREATMENT OF ACUTE HYPERKALEMIA
The treatment of hyperkalemia depends on the magnitude of increase in the plasma potassium concentration and the presence or absence of electrocardiographic changes or neuromuscular symptoms.23 Acute treatment is indicated for marked electrocardiographic changes and severe muscle weakness.
Intravenous calcium rapidly normalizes membrane excitability by antagonizing the potassium-induced decrease in membrane excitability but does not alter the plasma potassium concentration.
Insulin lowers the plasma potassium concentration by promoting its entry into cells. To avoid hypoglycemia, 10 units of short-acting insulin should be accompanied by a 50-g infusion of glucose, increased to 60 g if 20 units of insulin are given.24
Beta-2 receptor agonists produce a similar effect. The shift of potassium into cells with insulin and beta-2-adrenergic receptor stimulation is brought about by increases in sodium-potassium ATPase pump activity, primarily in skeletal muscle cells.
Sodium bicarbonate, in the absence of acidosis, lowers the plasma potassium concentration only slightly. It should be reserved for hyperkalemic patients who have coexisting metabolic acidosis after the patient has received insulin and glucose, an adrenergic agent, and calcium.
These acute treatments need to be followed by therapies designed to lower the total body potassium content such as diuretics, potassium-binding drugs, and dialysis.
TREATMENT OF CHRONIC HYPERKALEMIA
Review medications. Once the diagnosis of hyperkalemia has been made, the initial approach should be to review the patient’s medications and make every effort to discontinue drugs that can impair renal potassium excretion.16 Patients should be asked about their use of over-the-counter nonsteroidal anti-inflammatory drugs and herbal remedies, since herbs may be a hidden source of dietary potassium.
Dietary counseling. Patients should be instructed to reduce their dietary intake of potassium and to avoid salt substitutes that contain potassium.

Diuretic therapy is beneficial in minimizing hyperkalemia in patients with chronic kidney disease. Thiazide and loop diuretics enhance renal potassium excretion by increasing flow and delivery of sodium to the collecting duct. Thiazide diuretics are effective when the estimated glomerular filtration rate is greater than 30 mL/min, while loop diuretics should be used in patients with more severe renal insufficiency (Table 2).
Sodium bicarbonate is an effective agent to minimize increases in the plasma potassium concentration in patients with chronic kidney disease and metabolic acidosis. This drug increases renal potassium excretion by increasing distal sodium delivery and shifts potassium into cells as the acidosis is corrected. The likelihood of developing volume overload as a complication of sodium bicarbonate administration can be minimized with effective diuretic therapy.
Avoiding hyperkalemia if renin-angiotensin-aldosterone system blockers are needed
Renin-angiotensin-aldosterone system blockers can be problematic, as these drugs cause hyperkalemia, often in the very patients who derive the greatest cardiovascular benefit from them.16 A number of steps can reduce the risk of hyperkalemia and allow these drugs to be used.
The initial dose should be low and the plasma potassium should be measured within 1 to 2 weeks after drug initiation. If the potassium level is normal, the dose can be titrated upwards with remeasurement of the plasma potassium after each dose titration. If the plasma potassium concentration rises to 5.5 mmol/L, in some cases lowering the dose will reduce the potassium concentration and allow the patient to remain on the drug.
In patients at risk of hyperkalemia, angiotensin II receptor blockers and direct renin inhibitors should be used with the same caution as angiotensin-converting enzyme inhibitors.
If the plasma potassium concentration exceeds 5.5 mmol/L despite the above precautions, one can consider using a potassium-binding drug (see below) before deciding to avoid renin-angiotensin-aldosterone system blockers.
Sodium polystyrene sulfonate binds potassium in the gastrointestinal tract in exchange for sodium and has been used to manage hyperkalemia. This drug is most commonly given along with sorbitol as a therapy for acute hyperkalemia. Although the drug is widely used, most of the potassium-lowering effect is due to an increase in stool volume caused by sorbitol.25,26 In addition, long-term use is poorly tolerated, and the drug has been linked to gastrointestinal toxicity in rare cases.
Patiromer and sodium zirconium cyclosilicate are two new potassium-binding drugs that have been shown to be effective in reducing plasma potassium concentration in the setting of ongoing use of renin-angiotensin-aldosterone system blockers.
Patiromer is a nonabsorbed polymer approved for clinical use to treat hyperkalemia. The drug binds potassium in exchange for calcium in the gastrointestinal tract, predominantly in the colon, and lowers the plasma potassium concentration in a dose-dependent manner, with the greatest reduction in those with higher starting values.27,28
Patiromer effectively controlled plasma potassium concentrations in a 1-year randomized trial in high-risk patients on renin-angiotensin-aldosterone system blockers.29 The main adverse events in clinical trials have been constipation and hypomagnesemia, which required magnesium replacement in a small number of patients, but overall, the drug is well tolerated.
Sodium zirconium cyclosilicate is a nonabsorbed microporous compound that binds potassium in exchange for sodium throughout the gastrointestinal tract. It has been found effective in lowering plasma potassium concentration in a dose-dependent fashion in high-risk patients, most of whom were receiving renin-angiotensin-aldosterone system blockers.30–32 Adverse events were generally comparable to those with placebo in clinical trials; however, edema occurred more frequently when higher doses were used. This drug is not yet approved for clinical use.
- Palmer BF, Clegg DJ. Physiology and pathophysiology of potassium homeostasis. Adv Physiol Educ 2016; 40:480–490.
- Palmer BF. Regulation of potassium homeostasis. Clin J Am Soc Nephrol 2015; 10:1050–1060.
- Eaton SB, Konner M. Paleolithic nutrition. A consideration of its nature and current implications. N Engl J Med 1985; 312:283–289.
- Sebastian A, Frassetto LA, Sellmeyer DE, Morris RC Jr. The evolution-informed optimal dietary potassium intake of human beings greatly exceeds current and recommended intakes. Semin Nephrol 2006; 26:447–453.
- Palmer BF, Clegg DJ. Achieving the benefits of a high potassium, Paleolithic diet, without the toxicity. Mayo Clin Proc 2016; 91:496–508.
- Liamis G, Liberopoulos E, Barkas F, Elisaf M. Spurious electrolyte disorders: a diagnostic challenge for clinicians. Am J Nephrol 2013; 38:50–57.
- Mansoor S, Holtzman N, Emadi A. Reverse pseudohyperkalemia: an important clinical entity in chronic lymphocytic leukemia. Case Rep Hematol 2015; 2015:930379.
- Gelfand M, Zarate A, Knepshield J. Geophagia. A cause of life-threatening hyperkalemia in patients with chronic renal failure. JAMA 1975; 234:738–740.
- Abu-Hamdan D, Sondheimer J, Mahajan S. Cautopyreiophagia. Cause of life-threatening hyperkalemia in a patient undergoing hemodialysis. Am J Med 1985; 79:517–519.
- Palmer BF, Clegg DJ. Electrolyte and acid-base disturbances in patients with diabetes mellitus. N Engl J Med 2015; 373:548–559.
- Daphnis E, Stylianou K, Alexandrakis M, et al. Acute renal failure, translocational hyponatremia and hyperkalemia following intravenous immunoglobulin therapy. Nephron Clin Pract 2007; 106:c143–c148.
- Choi M, Ziyadeh F. The utility of the transtubular potassium gradient in the evaluation of hyperkalemia. J Am Soc Nephrol 2008; 19:424–426.
- Palmer BF. A physiologic-based approach to the evaluation of a patient with hyperkalemia. Am J Kidney Dis 2010; 56:387–393.
- Stanton BA. Renal potassium transport: morphological and functional adaptations. Am J Physiol 1989; 257:R989–R997.
- Hayes CP Jr, McLeod ME, Robinson RR. An extravenal mechanism for the maintenance of potassium balance in severe chronic renal failure. Trans Assoc Am Physicians 1967; 80:207–216.
- Palmer BF. Managing hyperkalemia caused by inhibitors of the renin-angiotensin-aldosterone system. N Engl J Med 2004; 351:585–592.
- Palmer BF. Renal dysfunction complicating treatment of hypertension. N Engl J Med 2002; 347:1256–1261.
- Palmer BF. Renal complications associated with use of nonsteroidal anti-inflammatory agents. J Investig Med 1995; 43:516–533.
- Hoorn E, Walsh S, McCormick J, et al. The calcineurin inhibitor tacrolimus activates the renal sodium chloride cotransporter to cause hypertension. Nat Med 2011; 17:1304–1309.
- Bird ST, Pepe SR, Etminan M, Liu X, Brophy JM, Delaney JA. The association between drospirenone and hyperkalemia: a comparative-safety study. BMC Clin Pharmacol 2011; 11:23.
- Wang K. Images in clinical medicine. “Pseudoinfarction” pattern due to hyperkalemia. N Engl J Med 2004; 351:593.
- Montague BT, Ouellette JR, Buller GK. Retrospective review of the frequency of ECG changes in hyperkalemia. Clin J Am Soc Nephrol 2008; 3:324–330.
- Weisberg LS. Management of severe hyperkalemia. Crit Care Med 2008; 36:3246–3251.
- Harel Z, Kamel KS. Optimal dose and method of administration of intravenous insulin in the management of emergency hyperkalemia: a systematic review. PLoS One 2016; 11:e0154963.
- Sterns RH, Rojas M, Bernstein P, Chennupati S. Ion-exchange resins for the treatment of hyperkalemia: are they safe and effective? J Am Soc Nephrol 2010; 21:733–735.
- Emmett M, Hootkins RE, Fine KD, Santa Ana CA, Porter JL, Fordtran JS. Effect of three laxatives and a cation exchange resin on fecal sodium and potassium excretion. Gastroenterology 1995; 108:752–760.
- Bushinsky DA, Spiegel DM, Gross C, et al. Effect of patiromer on urinary ion excretion in healthy adults. Clin J Am Soc Nephrol 2016; 11:1769–1776.
- Weir MR, Bakris GL, Bushinsky DA, et al; OPAL-HK Investigators. Patiromer in patients with kidney disease and hyperkalemia receiving RAAS inhibitors. N Engl J Med 2015; 372:211–221.
- Bakris GL, Pitt B, Weir MR, et al; AMETHYST-DN Investigators. Effect of patiromer on serum potassium level in patients with hyperkalemia and diabetic kidney disease: the AMETHYST-DN randomized clinical trial. JAMA 2015; 314:151–161.
- Kosiborod M, Rasmussen HS, Lavin P, et al. Effect of sodium zirconium cyclosilicate on potassium lowering for 28 days among outpatients with hyperkalemia. The HARMONIZE randomized clinical trial. JAMA 2014; 312:2223–2233.
- Packham DK, Rasmussen HS, Lavin PT, et al. Sodium zirconium cyclosilicate in hyperkalemia. N Engl J Med 2015; 372:222–231.
- Anker SD, Kosiborod M, Zannad F, et al. Maintenance of serum potassium with sodium zirconium cyclosilicate (ZS-9) in heart failure patients: results from a phase 3 randomized, double-blind, placebo-controlled trial. Eur J Heart Fail 2015; 17:1050–1056.
Hyperkalemia is common in patients with cardiovascular disease. Its consequences can be severe and life-threatening, and its management and prevention require a multidisciplinary approach that entails reducing intake of high-potassium foods, adjusting medications that cause hyperkalemia, and adding medications that reduce the plasma potassium concentration. With this approach, patients at high risk can receive the cardiorenal benefits of drugs that block the renin-angiotensin-aldosterone system without developing hyperkalemia.
98% OF POTASSIUM IS INSIDE CELLS
The body of a typical 70-kg man contains about 3,500 mmol of potassium, 98% of which is in the intracellular space; the remaining 2% is in the extracellular space. This large intracellular-to-extracellular gradient determines the cell voltage and explains why disorders in plasma potassium give rise to manifestations in excitable tissues such as the heart and nervous system.
The most important determinants of potassium distribution between the intracellular and extracellular space are insulin and beta-adrenergic receptor stimulation.
Maintenance of total-body potassium content is primarily the job of the kidneys, with a small contribution by the gastrointestinal tract.1,2 Hyperkalemia is most commonly encountered in patients with decreased kidney function.
The normal kidney can secrete a large amount of potassium, making hyperkalemia uncommon in the absence of kidney disease. This large capacity may have evolved to handle the diet of Paleolithic humans, which contained 4 times as much potassium as contemporary diets.3,4 With the onset of agriculture, dietary intake of potassium has progressively declined while sodium intake has risen. A popular theory suggests this mismatch between the modern diet and the nutritional requirements encoded in the human genome during evolution may contribute to chronic diseases such as hypertension, stroke, kidney stones, and bone disease.5
MANY POTENTIAL CAUSES OF HYPERKALEMIA
Causes of hyperkalemia are outlined in Table 1. Shifting of potassium from the cells to the extracellular space is a cause of transient hyperkalemia, while chronic hyperkalemia indicates an impairment in renal potassium secretion. The following discussion is a guide to the approach to the hyperkalemic patient.
Is the patient’s hyperkalemia really pseudohyperkalemia?
Pseudohyperkalemia, an artifact of measurement, occurs due to mechanical release of potassium from cells during phlebotomy or specimen processing.6 This diagnosis is made when the serum potassium concentration exceeds the plasma potassium concentration by more than 0.5 mmol/L, and should be considered when hyperkalemia occurs in the absence of a clinical risk factor. Fist-clenching, application of a tight-fitting tourniquet, or use of small-bore needles during phlebotomy can all cause pseudohyperkalemia.
Mechanism of pseudohyperkalemia. Since serum is the liquid part of blood remaining after coagulation, release of potassium from cells injured during the process of coagulation raises the potassium level in the serum. Plasma is the cell-free part of blood that has been treated with anticoagulants; it has no cells that can be injured and release potassium. Thus, the serum potassium level will be higher than that in the plasma.
Reverse pseudohyperkalemia, in contrast, occurs when the plasma potassium level is falsely elevated but the serum value is normal. This situation has been described in hematologic disorders characterized by pronounced leukocytosis in which malignant cells are prone to lysis with minimal mechanical stress due to increased fragility or altered sodium-potassium ATPase pump activity.7 This phenomenon is unusual but occurs because the cells are so fragile.
A spurious increase in plasma potassium concentration along with a low plasma calcium concentration raises the possibility of calcium chelation and release of potassium in a sample tube contaminated with the anticoagulant ethylenediaminetetraacetic acid.
Is there increased potassium intake?
Increased potassium intake is a potential cause of hyperkalemia in patients with decreased kidney function or adrenal disease.
Foods naturally rich in potassium include bananas (a medium-sized banana contains 451 mg or 12 mmol of potassium) and potatoes (844 mg or 22 mmol in a large baked potato with skin). Other potassium-rich foods are melons, citrus juice, and avocados. Less-obvious food sources include raw coconut juice (potassium concentration 44.3 mmol/L) and noni juice (56 mmol/L).
Salt substitutes, recommended to hypertensive patients with chronic kidney disease, can be a hidden source of dietary potassium.
Clay ingestion is a potential cause of dyskalemia. White clay consumption causes hypokalemia due to potassium binding in the gastrointestinal tract. Red clay or river bed clay, on the other hand, is enriched in potassium (100 mmol of potassium in 100 g of clay) and can cause life-threatening hyperkalemia in patients with chronic kidney disease.8
Eating burnt match heads. Some individuals chew and ingest burnt match heads, a condition called cautopyreiophagia. In one reported case,9 this activity contributed an additional 80 mmol of daily potassium intake in a dialysis patient, resulting in a plasma potassium concentration of 8 mmol/L.
Is the hyperkalemia the result of a cellular shift?
Acute hyperkalemia can be the result of redistribution of cellular potassium. Shifting of as little as 2% of the body’s potassium from the intracellular to the extracellular space can double the plasma potassium concentration.
Tissue injury. Hyperkalemia frequently occurs in diseases that cause tissue injury such as rhabdomyolysis, trauma, massive hemolysis, and tumor lysis.
Insulin deficiency. Insulin and catecholamines are major regulators of potassium distribution within the body. After a meal, release of insulin not only regulates the plasma glucose concentration, it also causes potassium to move into cells until the kidneys have had sufficient time to excrete the dietary potassium load and reestablish total-body potassium content.
Exercise, beta-blockers. During exercise, potassium is released from skeletal muscle cells and accumulates in the interstitial compartment, where it exerts a vasodilatory effect. The simultaneous increase in circulating catecholamines regulates this release by promoting cell potassium uptake through beta-adrenergic receptor stimulation.
Metabolic acidosis can facilitate exit (ie, shift) of potassium from cells, but this effect depends on the type of acidosis. Hyperchloremic normal anion gap acidosis (mineral acidosis) most commonly causes this effect due to the relative impermeability of the cell membrane to the chloride anion. As hydrogen ions move into the cell due to accumulation of ammonium chloride or hydrogen chloride, electrical neutrality is maintained by potassium exit.
In contrast, organic acidosis (due to lactic, beta-hydroxybutyric, or methylmalonic acid) tends not to cause a potassium shift, since most organic anions readily cross the cell membrane along with hydrogen. Lactic acidosis is often associated with potassium shift, but this effect is due to loss of cell integrity as a result of cell ischemia. The hyperkalemia typically present on admission in patients with diabetic ketoacidosis is the result of insulin deficiency and hypertonicity and not the underlying organic acidosis.10
Hypertonic states can cause hyperkalemia due to cell shift. For example, hyperglycemia, as in diabetic ketoacidosis, pulls water from the intracellular into the extracellular compartment, thereby concentrating intracellular potassium and creating a more favorable gradient for potassium efflux through membrane channels. This same effect can occur in neurosurgical patients given large amounts of hypertonic mannitol. Repetitive doses of immunoglobulin can lead to extracellular accumulation of sorbitol, maltose, or sucrose, since these sugars are added to the preparations to prevent immunoglobulin aggregation.11
Is a disturbance in renal potassium excretion present?
Sustained hyperkalemia is more commonly associated with decreases in renal potassium excretion than with a cellular shift. In most instances the clinician can distinguish between cell shift and impaired renal excretion based on the available clinical data.
The transtubular potassium gradient has been used to determine whether there is a disturbance in renal potassium excretion and to assess renal potassium handling.12
This calculation is based on the assumption that only water is reabsorbed past the cortical collecting duct, and not solutes. It has fallen out of favor since we have found this assumption to be incorrect; a large amount of urea is reabsorbed daily in the downstream medullary collecting duct as a result of intrarenal recycling of urea.
The one situation in which the transtubular potassium gradient may be of use is determining whether hyperkalemia is a result of low aldosterone levels as opposed to aldosterone resistance. One can compare the transtubular potassium gradient before and after a physiologic dose (0.05 mg) of 9-alpha fludrocortisone. An increase of more than 6 over a 4-hour period favors aldosterone deficiency, whereas smaller changes would indicate aldosterone resistance.
24-hour potassium excretion, spot urine potassium-creatinine ratio. A better way to assess renal potassium handling is to measure the amount of potassium in a 24-hour urine collection or determine a spot urine potassium-creatinine ratio. A 24-hour urinary potassium excretion of less than 15 mmol or a potassium-creatinine ratio less than 1 suggests an extrarenal cause of hypokalemia. A ratio greater than 20 would be an appropriate renal response to hyperkalemia.
One or more of 3 abnormalities should be considered in the hyperkalemic patient with impaired renal excretion of potassium:
- Decreased distal delivery of sodium
- Mineralocorticoid deficiency
- Abnormal cortical collecting tubule function.13
Decreased distal delivery of sodium
Under normal circumstances, potassium is freely filtered across the glomerulus and then mostly reabsorbed in the proximal tubule and thick ascending limb. Potassium secretion begins in the distal convoluted tubule and increases in magnitude into the collecting duct. Tubular secretion is the component of potassium handling that varies and is regulated according to physiologic needs.
In acute kidney injury, the rapid decline in glomerular filtration rate and reduction in functioning nephron mass lead to decreased distal potassium secretion.
Hyperkalemia is a frequent problem when oliguria is present, since the reduction in distal delivery of sodium and water further impairs potassium secretion. Patients with oliguric acute kidney injury are more likely to have a more severe underlying disease state, and therefore tissue breakdown and catabolism further increase the risk of hyperkalemia.
In contrast, in nonoliguric patients, the renal injury tends to be less severe, and enough sodium and water are usually delivered distally to prevent hyperkalemia.
In chronic kidney disease, nephron dropout and reduction in collecting tubule mass also lead to a global decline in distal potassium secretion. However, this is countered by an increased capacity of the remaining individual nephrons for potassium secretion. High flow, increased distal sodium delivery, and increased activity and number of sodium-potassium ATPase pumps in the remaining nephrons account for this increased secretory capacity.14 As renal function declines over time, colonic potassium secretion progressively increases.15
These adaptive changes help to keep the plasma potassium concentration within the normal range until the glomerular filtration rate falls to less than 10 or 15 mL/min. Development of hyperkalemia with more modest reductions in the glomerular filtration rate suggest decreased mineralocorticoid activity or a specific lesion of the tubule.
Mineralocorticoid deficiency
Aldosterone deficiency can occur alone or in combination with decreased cortisol levels. Destruction of the adrenal glands is suggested when both hormones are reduced. Enzyme defects in cortisol metabolism can result in either isolated deficiency of aldosterone or adrenogenital syndromes associated with decreased mineralocorticoid activity.
Heparin administration leads to a reversible defect in adrenal synthesis of aldosterone. Drugs that block the stimulatory effect of angiotensin II on the zona glomerulosa cells of the adrenal gland will lower aldosterone.
Renin-angiotensin-aldosterone system blockers. Angiotensin-converting enzyme inhibitors block the formation of angiotensin II, whereas angiotensin II receptor blockers prevent angiotensin II from binding to its adrenal receptor. The direct renin inhibitor aliskiren lowers angiotensin II levels by blocking the enzymatic activity of renin and lowers the circulating levels of both angiotensin I and II.16
The syndrome of hyporeninemic hypoaldosteronism is a common cause of hyperkalemia in patients who have a glomerular filtration rate between 40 and 60 mL/min. Diabetic nephropathy and interstitial renal disease are the most common clinical entities associated with this syndrome.10 Other causes include analgesic nephropathy, urinary tract obstruction, sickle cell disease, systemic lupus erythematosus, and amyloidosis.
Nonsteroidal anti-inflammatory drugs can cause hyperkalemia by suppressing renin release and reducing delivery of sodium to the distal nephron.18
Calcineurin inhibitors impair potassium secretion by suppressing renin release and by direct tubular effects.19
Beta-blockers. Beta-1 and to a lesser extent beta-2 receptor blockade can also result in a hyporeninemic state.
Distal tubular defect
Hyperkalemia can result from interstitial renal diseases that specifically affect the distal nephron. In this setting, the glomerular filtration rate is only mildly reduced, and circulating aldosterone levels are normal.
Renal transplant, lupus erythematosus, amyloidosis, urinary obstruction, and sickle cell disease are conditions in which an impairment in renin release may coexist with a defect in tubular secretion.
Potassium-sparing diuretics impair the ability of the cortical collecting tubule to secrete potassium. Specifically, amiloride and triamterene inhibit sodium reabsorption mediated by the epithelial sodium channel located on the apical membrane of the principal cell. This effect abolishes the lumen’s negative potential and thereby removes a driving force for potassium secretion.
Trimethoprim and pentamidine cause similar effects.
Spironolactone and eplerenone compete with aldosterone at the level of the mineralocorticoid receptor and can result in hyperkalemia.
Drospirenone, a non-testosterone-derived progestin contained in certain oral contraceptives, possesses mineralocorticoid-blocking effects similar to those of spironolactone.
The plasma potassium level should be monitored when these drugs are prescribed in patients receiving potassium supplements, renin-angiotensin-aldosterone system blockers, or nonsteroidal anti-inflammatory drugs.20
CLINICAL FEATURES OF HYPERKALEMIA
Neuromuscular manifestations of hyperkalemia include paresthesias and fasciculations in the arms and legs. Severe elevation in potassium can give rise to an ascending paralysis with eventual flaccid quadriplegia. Typically, the trunk, head, and respiratory muscles are spared, and respiratory failure is rare.
Cardiac signs
Hyperkalemia has depolarizing effects on the heart that are manifested by changes in the electrocardiogram (Figure 2). The progressive changes of hyperkalemia are classically listed as:
- Peaked T waves that are tall, narrow, and symmetrical and can occasionally be confused with the hyperacute T-wave change associated with an ST-segment elevation myocardial infarction.21 However, in the latter condition, the T waves tend to be more broad-based and asymmetric in shape.
- ST-segment depression
- Widening of the PR interval
- Widening of the QRS interval
- Loss of the P wave
- A sine-wave pattern—an ominous development and a harbinger of impending ventricular fibrillation and asystole.
The plasma potassium concentration often correlates poorly with cardiac manifestations. In a retrospective review, only 16 of 90 cases met strict criteria for electrocardiographic changes reflective of hyperkalemia (defined as new peaked and symmetric T waves that resolved on follow-up).22 In 13 of these cases, the electrocardiogram was interpreted as showing no T-wave changes even when read by a cardiologist. In addition, electrocardiographic criteria for hyperkalemia were noted in only 1 of 14 patients who manifested arrhythmias or cardiac arrest attributed to increased plasma potassium concentration.
TREATMENT OF ACUTE HYPERKALEMIA
The treatment of hyperkalemia depends on the magnitude of increase in the plasma potassium concentration and the presence or absence of electrocardiographic changes or neuromuscular symptoms.23 Acute treatment is indicated for marked electrocardiographic changes and severe muscle weakness.
Intravenous calcium rapidly normalizes membrane excitability by antagonizing the potassium-induced decrease in membrane excitability but does not alter the plasma potassium concentration.
Insulin lowers the plasma potassium concentration by promoting its entry into cells. To avoid hypoglycemia, 10 units of short-acting insulin should be accompanied by a 50-g infusion of glucose, increased to 60 g if 20 units of insulin are given.24
Beta-2 receptor agonists produce a similar effect. The shift of potassium into cells with insulin and beta-2-adrenergic receptor stimulation is brought about by increases in sodium-potassium ATPase pump activity, primarily in skeletal muscle cells.
Sodium bicarbonate, in the absence of acidosis, lowers the plasma potassium concentration only slightly. It should be reserved for hyperkalemic patients who have coexisting metabolic acidosis after the patient has received insulin and glucose, an adrenergic agent, and calcium.
These acute treatments need to be followed by therapies designed to lower the total body potassium content such as diuretics, potassium-binding drugs, and dialysis.
TREATMENT OF CHRONIC HYPERKALEMIA
Review medications. Once the diagnosis of hyperkalemia has been made, the initial approach should be to review the patient’s medications and make every effort to discontinue drugs that can impair renal potassium excretion.16 Patients should be asked about their use of over-the-counter nonsteroidal anti-inflammatory drugs and herbal remedies, since herbs may be a hidden source of dietary potassium.
Dietary counseling. Patients should be instructed to reduce their dietary intake of potassium and to avoid salt substitutes that contain potassium.
Diuretic therapy is beneficial in minimizing hyperkalemia in patients with chronic kidney disease. Thiazide and loop diuretics enhance renal potassium excretion by increasing flow and delivery of sodium to the collecting duct. Thiazide diuretics are effective when the estimated glomerular filtration rate is greater than 30 mL/min, while loop diuretics should be used in patients with more severe renal insufficiency (Table 2).
Sodium bicarbonate is an effective agent to minimize increases in the plasma potassium concentration in patients with chronic kidney disease and metabolic acidosis. This drug increases renal potassium excretion by increasing distal sodium delivery and shifts potassium into cells as the acidosis is corrected. The likelihood of developing volume overload as a complication of sodium bicarbonate administration can be minimized with effective diuretic therapy.
Avoiding hyperkalemia if renin-angiotensin-aldosterone system blockers are needed
Renin-angiotensin-aldosterone system blockers can be problematic, as these drugs cause hyperkalemia, often in the very patients who derive the greatest cardiovascular benefit from them.16 A number of steps can reduce the risk of hyperkalemia and allow these drugs to be used.
The initial dose should be low and the plasma potassium should be measured within 1 to 2 weeks after drug initiation. If the potassium level is normal, the dose can be titrated upwards with remeasurement of the plasma potassium after each dose titration. If the plasma potassium concentration rises to 5.5 mmol/L, in some cases lowering the dose will reduce the potassium concentration and allow the patient to remain on the drug.
In patients at risk of hyperkalemia, angiotensin II receptor blockers and direct renin inhibitors should be used with the same caution as angiotensin-converting enzyme inhibitors.
If the plasma potassium concentration exceeds 5.5 mmol/L despite the above precautions, one can consider using a potassium-binding drug (see below) before deciding to avoid renin-angiotensin-aldosterone system blockers.
Sodium polystyrene sulfonate binds potassium in the gastrointestinal tract in exchange for sodium and has been used to manage hyperkalemia. This drug is most commonly given along with sorbitol as a therapy for acute hyperkalemia. Although the drug is widely used, most of the potassium-lowering effect is due to an increase in stool volume caused by sorbitol.25,26 In addition, long-term use is poorly tolerated, and the drug has been linked to gastrointestinal toxicity in rare cases.
Patiromer and sodium zirconium cyclosilicate are two new potassium-binding drugs that have been shown to be effective in reducing plasma potassium concentration in the setting of ongoing use of renin-angiotensin-aldosterone system blockers.
Patiromer is a nonabsorbed polymer approved for clinical use to treat hyperkalemia. The drug binds potassium in exchange for calcium in the gastrointestinal tract, predominantly in the colon, and lowers the plasma potassium concentration in a dose-dependent manner, with the greatest reduction in those with higher starting values.27,28
Patiromer effectively controlled plasma potassium concentrations in a 1-year randomized trial in high-risk patients on renin-angiotensin-aldosterone system blockers.29 The main adverse events in clinical trials have been constipation and hypomagnesemia, which required magnesium replacement in a small number of patients, but overall, the drug is well tolerated.
Sodium zirconium cyclosilicate is a nonabsorbed microporous compound that binds potassium in exchange for sodium throughout the gastrointestinal tract. It has been found effective in lowering plasma potassium concentration in a dose-dependent fashion in high-risk patients, most of whom were receiving renin-angiotensin-aldosterone system blockers.30–32 Adverse events were generally comparable to those with placebo in clinical trials; however, edema occurred more frequently when higher doses were used. This drug is not yet approved for clinical use.
- Palmer BF, Clegg DJ. Physiology and pathophysiology of potassium homeostasis. Adv Physiol Educ 2016; 40:480–490.
- Palmer BF. Regulation of potassium homeostasis. Clin J Am Soc Nephrol 2015; 10:1050–1060.
- Eaton SB, Konner M. Paleolithic nutrition. A consideration of its nature and current implications. N Engl J Med 1985; 312:283–289.
- Sebastian A, Frassetto LA, Sellmeyer DE, Morris RC Jr. The evolution-informed optimal dietary potassium intake of human beings greatly exceeds current and recommended intakes. Semin Nephrol 2006; 26:447–453.
- Palmer BF, Clegg DJ. Achieving the benefits of a high potassium, Paleolithic diet, without the toxicity. Mayo Clin Proc 2016; 91:496–508.
- Liamis G, Liberopoulos E, Barkas F, Elisaf M. Spurious electrolyte disorders: a diagnostic challenge for clinicians. Am J Nephrol 2013; 38:50–57.
- Mansoor S, Holtzman N, Emadi A. Reverse pseudohyperkalemia: an important clinical entity in chronic lymphocytic leukemia. Case Rep Hematol 2015; 2015:930379.
- Gelfand M, Zarate A, Knepshield J. Geophagia. A cause of life-threatening hyperkalemia in patients with chronic renal failure. JAMA 1975; 234:738–740.
- Abu-Hamdan D, Sondheimer J, Mahajan S. Cautopyreiophagia. Cause of life-threatening hyperkalemia in a patient undergoing hemodialysis. Am J Med 1985; 79:517–519.
- Palmer BF, Clegg DJ. Electrolyte and acid-base disturbances in patients with diabetes mellitus. N Engl J Med 2015; 373:548–559.
- Daphnis E, Stylianou K, Alexandrakis M, et al. Acute renal failure, translocational hyponatremia and hyperkalemia following intravenous immunoglobulin therapy. Nephron Clin Pract 2007; 106:c143–c148.
- Choi M, Ziyadeh F. The utility of the transtubular potassium gradient in the evaluation of hyperkalemia. J Am Soc Nephrol 2008; 19:424–426.
- Palmer BF. A physiologic-based approach to the evaluation of a patient with hyperkalemia. Am J Kidney Dis 2010; 56:387–393.
- Stanton BA. Renal potassium transport: morphological and functional adaptations. Am J Physiol 1989; 257:R989–R997.
- Hayes CP Jr, McLeod ME, Robinson RR. An extravenal mechanism for the maintenance of potassium balance in severe chronic renal failure. Trans Assoc Am Physicians 1967; 80:207–216.
- Palmer BF. Managing hyperkalemia caused by inhibitors of the renin-angiotensin-aldosterone system. N Engl J Med 2004; 351:585–592.
- Palmer BF. Renal dysfunction complicating treatment of hypertension. N Engl J Med 2002; 347:1256–1261.
- Palmer BF. Renal complications associated with use of nonsteroidal anti-inflammatory agents. J Investig Med 1995; 43:516–533.
- Hoorn E, Walsh S, McCormick J, et al. The calcineurin inhibitor tacrolimus activates the renal sodium chloride cotransporter to cause hypertension. Nat Med 2011; 17:1304–1309.
- Bird ST, Pepe SR, Etminan M, Liu X, Brophy JM, Delaney JA. The association between drospirenone and hyperkalemia: a comparative-safety study. BMC Clin Pharmacol 2011; 11:23.
- Wang K. Images in clinical medicine. “Pseudoinfarction” pattern due to hyperkalemia. N Engl J Med 2004; 351:593.
- Montague BT, Ouellette JR, Buller GK. Retrospective review of the frequency of ECG changes in hyperkalemia. Clin J Am Soc Nephrol 2008; 3:324–330.
- Weisberg LS. Management of severe hyperkalemia. Crit Care Med 2008; 36:3246–3251.
- Harel Z, Kamel KS. Optimal dose and method of administration of intravenous insulin in the management of emergency hyperkalemia: a systematic review. PLoS One 2016; 11:e0154963.
- Sterns RH, Rojas M, Bernstein P, Chennupati S. Ion-exchange resins for the treatment of hyperkalemia: are they safe and effective? J Am Soc Nephrol 2010; 21:733–735.
- Emmett M, Hootkins RE, Fine KD, Santa Ana CA, Porter JL, Fordtran JS. Effect of three laxatives and a cation exchange resin on fecal sodium and potassium excretion. Gastroenterology 1995; 108:752–760.
- Bushinsky DA, Spiegel DM, Gross C, et al. Effect of patiromer on urinary ion excretion in healthy adults. Clin J Am Soc Nephrol 2016; 11:1769–1776.
- Weir MR, Bakris GL, Bushinsky DA, et al; OPAL-HK Investigators. Patiromer in patients with kidney disease and hyperkalemia receiving RAAS inhibitors. N Engl J Med 2015; 372:211–221.
- Bakris GL, Pitt B, Weir MR, et al; AMETHYST-DN Investigators. Effect of patiromer on serum potassium level in patients with hyperkalemia and diabetic kidney disease: the AMETHYST-DN randomized clinical trial. JAMA 2015; 314:151–161.
- Kosiborod M, Rasmussen HS, Lavin P, et al. Effect of sodium zirconium cyclosilicate on potassium lowering for 28 days among outpatients with hyperkalemia. The HARMONIZE randomized clinical trial. JAMA 2014; 312:2223–2233.
- Packham DK, Rasmussen HS, Lavin PT, et al. Sodium zirconium cyclosilicate in hyperkalemia. N Engl J Med 2015; 372:222–231.
- Anker SD, Kosiborod M, Zannad F, et al. Maintenance of serum potassium with sodium zirconium cyclosilicate (ZS-9) in heart failure patients: results from a phase 3 randomized, double-blind, placebo-controlled trial. Eur J Heart Fail 2015; 17:1050–1056.
KEY POINTS
- Exclude pseudohyperkalemia in patients who have a normal electrocardiogram and no risk factors for the development of hyperkalemia.
- Decreased distal delivery of sodium, reduced mineralocorticoid levels or activity, and a distal tubular defect are causes of impaired renal potassium secretion.
- Medical conditions and medications that alter the renin-angiotensin-aldosterone system can give rise to hyperkalemia.
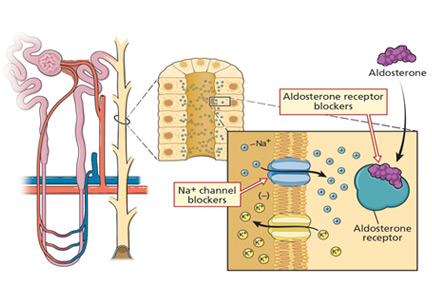
It’s time to consider pharmacotherapy for obesity
The article in this issue by Bersoux et al on pharmacotherapy to manage obesity1 is apropos in light of a recent study2 showing that patients are filling 15 times more prescriptions for antidiabetic medications (excluding insulin) than for antiobesity drugs. What makes this finding significant is that nearly 3 times more adults meet the criteria for use of antiobesity drugs than for antidiabetic drugs—116 million vs 30 million, respectively.
This underuse of antiobesity medications has been noted in other studies. In 1 study,3 only about 2% of adults eligible for weight-loss drug therapy received a prescription. Conversely, about 86% of adults diagnosed with diabetes received antidiabetic medications.3
WEIGHT LOSS: IT'S IMPORTANT
This underuse of weight-loss drugs occurs despite our understanding that obesity is a risk factor for developing diabetes and that weight loss in obese patients reduces the risk.
The landmark Diabetes Prevention Program study found that even modest weight loss of 7% reduced the risk of developing diabetes by 58% in overweight and prediabetic individuals.4 Additionally, a 5% to 10% weight loss can lead to significant improvements in many comorbidities, including diabetes, hyperlipidemia, hypertension, sleep apnea, and fatty liver disease.
Antiobesity medications can help patients achieve weight-loss goals, especially if lifestyle and behavioral modifications alone have been unsuccessful. Data show that these drugs result in an average weight loss of 5% to 15% when added to diet and exercise.
BARRIERS TO PRESCRIBING WEIGHT-LOSS DRUGS
Why are practitioners reluctant to prescribe these drugs despite the worsening obesity epidemic and despite knowing that obesity is a risk factor for diabetes? Many of us who practice obesity medicine believe there are several reasons.
One barrier is the misconception that obesity does not warrant treatment with weight-loss medications, even though most practitioners will readily admit that patients cannot achieve effective, durable, and meaningful weight loss with behavioral changes and lifestyle modifications alone.
Other barriers stem from issues such as time constraints in the office, lack of training to treat this condition, and not enough data on the newer chronic weight-loss medications. And there are stringent requirements for patient follow-up once a medication has been initiated. Finally, it’s often difficult to obtain insurance coverage.
Addressing the barriers
Of these, I believe the biggest barrier for busy practitioners is finding the time and effort they need to devote to prescribing weight-loss medications. There are ways to address these issues.
Regarding time constraints, practitioners can discuss weight loss at follow-up visits and refer patients to obesity specialists. Regarding gaps in training and knowledge of obesity management, there are consensus guidelines for the identification, evaluation, and treatment of the overweight or obese individual.5–7 Guidelines provide extensive information on the pharmacologic treatment of obesity. These resources provide valuable evidence-based recommendations on how to manage this chronic disease.
ARMED WITH INFORMATION, PHARMACOLOGIC OPTIONS
Bersoux et al provide another valuable resource for clinical use of weight-loss drugs.1 They accurately review the available medications, their mechanisms of action, dosing, efficacy, side effect profiles, and clinical indications. Their review is comprehensive in every aspect of this drug class.
This is important information for practitioners to have when considering prescribing antiobesity medications. It is especially important for primary care practitioners because of the large number of obese or overweight patients they treat.
Drug options have expanded
We did not always have this many drugs to choose from. As Bersoux et al note, practitioners had limited options for weight-loss medications during the 1990s and early 2000s, and several of those had to be taken off the market because of serious side effects. Then between 2012 and 2014, the US Food and Drug Administration approved 4 new medications, giving us a total of 6 weight-loss drugs. Those approvals greatly increased the available drug treatments, giving us much-needed options beyond lifestyle and behavioral modifications.
Although it is widely accepted that antiobesity drugs are underused, the study by Thomas et al was the first to quantify the extent of underuse, especially for the newer chronic weight-loss drugs.2 Their data show that only about 19% of antiobesity prescriptions were for the newer drugs while 74% were for the older but short-term medication phentermine.
Bersoux et al seem to encourage primary care physicians, or anyone caring for overweight or obese patients, to consider prescribing these treatments if nonpharmacologic options are unsuccessful. I agree with this concept because there are not enough specialists to care for the more than 116 million individuals who are potential candidates for antiobesity medications.
THE TIME HAS COME
This new class of medications has been strongly endorsed by the most prestigious organizations and societies involved in developing treatment guidelines for the overweight or obese patient. It is time for everyone who sees overweight or obese patients in daily practice to consider adopting chronic weight-loss medications as adjunctive therapy if lifestyle and behavioral strategies are ineffective.
- Bersoux S, Byun TH, Chaliki SS, Poole KJ Jr. Pharmacotherapy for obesity: what you need to know. Cleve Clin J Med 2017; 84:951–958.
- Thomas CE, Mauer EA, Shukla AP, Rathi S, Aronne LJ. Low adoption of weight loss medications: a comparison of prescribing patterns of antiobesity pharmacotherapies and SGLT2s. Obesity 2016; 24:1955–1961.
- Samaranayake NR, Ong KL, Leung RY, Cheung BM. Management of obesity in the National Health and Nutrition Examination Survey (NHANES), 2007–2008. Ann Epidemiol 2012; 22:349–353.
- Knowler WC, Fowler SE, Hamman RF, et al; for the Diabetes Prevention Program Research Group. 10-year follow-up of diabetes incidence and weight loss in the Diabetes Prevention Program Outcomes Study. Lancet 2009; 374:1677–1686.
- Jensen MD, Ryan DH, Apovian CM, et al; American College of Cardiology/American Heart Association Task Force on Practice Guidelines; Obesity Society. 2013 AHA/ACC/TOS guideline for the management of overweight and obesity in adults: a report of the American College of Cardiology/American Heart Association Task Force on Practice Guidelines and The Obesity Society. J Am Coll Cardiol 2014; 63:2985–3023.
- American Association of Clinical Endocrinologists. AACE/ACE algorithm for the medical care of patients with obesity.
https://www.aace.com/files/final-appendix.pdf. Accessed September 20, 2017.
- Obesity Medicine Association. Obesity algorithm: 2016-2017.
https://obesitymedicine.org/obesity-algorithm/. Accessed October 3, 2017.
The article in this issue by Bersoux et al on pharmacotherapy to manage obesity1 is apropos in light of a recent study2 showing that patients are filling 15 times more prescriptions for antidiabetic medications (excluding insulin) than for antiobesity drugs. What makes this finding significant is that nearly 3 times more adults meet the criteria for use of antiobesity drugs than for antidiabetic drugs—116 million vs 30 million, respectively.
This underuse of antiobesity medications has been noted in other studies. In 1 study,3 only about 2% of adults eligible for weight-loss drug therapy received a prescription. Conversely, about 86% of adults diagnosed with diabetes received antidiabetic medications.3
WEIGHT LOSS: IT'S IMPORTANT
This underuse of weight-loss drugs occurs despite our understanding that obesity is a risk factor for developing diabetes and that weight loss in obese patients reduces the risk.
The landmark Diabetes Prevention Program study found that even modest weight loss of 7% reduced the risk of developing diabetes by 58% in overweight and prediabetic individuals.4 Additionally, a 5% to 10% weight loss can lead to significant improvements in many comorbidities, including diabetes, hyperlipidemia, hypertension, sleep apnea, and fatty liver disease.
Antiobesity medications can help patients achieve weight-loss goals, especially if lifestyle and behavioral modifications alone have been unsuccessful. Data show that these drugs result in an average weight loss of 5% to 15% when added to diet and exercise.
BARRIERS TO PRESCRIBING WEIGHT-LOSS DRUGS
Why are practitioners reluctant to prescribe these drugs despite the worsening obesity epidemic and despite knowing that obesity is a risk factor for diabetes? Many of us who practice obesity medicine believe there are several reasons.
One barrier is the misconception that obesity does not warrant treatment with weight-loss medications, even though most practitioners will readily admit that patients cannot achieve effective, durable, and meaningful weight loss with behavioral changes and lifestyle modifications alone.
Other barriers stem from issues such as time constraints in the office, lack of training to treat this condition, and not enough data on the newer chronic weight-loss medications. And there are stringent requirements for patient follow-up once a medication has been initiated. Finally, it’s often difficult to obtain insurance coverage.
Addressing the barriers
Of these, I believe the biggest barrier for busy practitioners is finding the time and effort they need to devote to prescribing weight-loss medications. There are ways to address these issues.
Regarding time constraints, practitioners can discuss weight loss at follow-up visits and refer patients to obesity specialists. Regarding gaps in training and knowledge of obesity management, there are consensus guidelines for the identification, evaluation, and treatment of the overweight or obese individual.5–7 Guidelines provide extensive information on the pharmacologic treatment of obesity. These resources provide valuable evidence-based recommendations on how to manage this chronic disease.
ARMED WITH INFORMATION, PHARMACOLOGIC OPTIONS
Bersoux et al provide another valuable resource for clinical use of weight-loss drugs.1 They accurately review the available medications, their mechanisms of action, dosing, efficacy, side effect profiles, and clinical indications. Their review is comprehensive in every aspect of this drug class.
This is important information for practitioners to have when considering prescribing antiobesity medications. It is especially important for primary care practitioners because of the large number of obese or overweight patients they treat.
Drug options have expanded
We did not always have this many drugs to choose from. As Bersoux et al note, practitioners had limited options for weight-loss medications during the 1990s and early 2000s, and several of those had to be taken off the market because of serious side effects. Then between 2012 and 2014, the US Food and Drug Administration approved 4 new medications, giving us a total of 6 weight-loss drugs. Those approvals greatly increased the available drug treatments, giving us much-needed options beyond lifestyle and behavioral modifications.
Although it is widely accepted that antiobesity drugs are underused, the study by Thomas et al was the first to quantify the extent of underuse, especially for the newer chronic weight-loss drugs.2 Their data show that only about 19% of antiobesity prescriptions were for the newer drugs while 74% were for the older but short-term medication phentermine.
Bersoux et al seem to encourage primary care physicians, or anyone caring for overweight or obese patients, to consider prescribing these treatments if nonpharmacologic options are unsuccessful. I agree with this concept because there are not enough specialists to care for the more than 116 million individuals who are potential candidates for antiobesity medications.
THE TIME HAS COME
This new class of medications has been strongly endorsed by the most prestigious organizations and societies involved in developing treatment guidelines for the overweight or obese patient. It is time for everyone who sees overweight or obese patients in daily practice to consider adopting chronic weight-loss medications as adjunctive therapy if lifestyle and behavioral strategies are ineffective.
- Bersoux S, Byun TH, Chaliki SS, Poole KJ Jr. Pharmacotherapy for obesity: what you need to know. Cleve Clin J Med 2017; 84:951–958.
- Thomas CE, Mauer EA, Shukla AP, Rathi S, Aronne LJ. Low adoption of weight loss medications: a comparison of prescribing patterns of antiobesity pharmacotherapies and SGLT2s. Obesity 2016; 24:1955–1961.
- Samaranayake NR, Ong KL, Leung RY, Cheung BM. Management of obesity in the National Health and Nutrition Examination Survey (NHANES), 2007–2008. Ann Epidemiol 2012; 22:349–353.
- Knowler WC, Fowler SE, Hamman RF, et al; for the Diabetes Prevention Program Research Group. 10-year follow-up of diabetes incidence and weight loss in the Diabetes Prevention Program Outcomes Study. Lancet 2009; 374:1677–1686.
- Jensen MD, Ryan DH, Apovian CM, et al; American College of Cardiology/American Heart Association Task Force on Practice Guidelines; Obesity Society. 2013 AHA/ACC/TOS guideline for the management of overweight and obesity in adults: a report of the American College of Cardiology/American Heart Association Task Force on Practice Guidelines and The Obesity Society. J Am Coll Cardiol 2014; 63:2985–3023.
- American Association of Clinical Endocrinologists. AACE/ACE algorithm for the medical care of patients with obesity.
https://www.aace.com/files/final-appendix.pdf. Accessed September 20, 2017.
- Obesity Medicine Association. Obesity algorithm: 2016-2017.
https://obesitymedicine.org/obesity-algorithm/. Accessed October 3, 2017.

To have not and then to have: A challenging immune paradox

The successful interplay between the host defense system and infectious invaders depends on controlling the tissue damage that ensues from both the infection and the resultant inflammatory response. Even though an underactive immune system predisposes to unusual and potentially severe infections, an overly vigorous host response to infection can be as destructive as the infection itself. We can improve the outcome of some infections by introducing potent anti-inflammatory and immunosuppressive therapy concurrent with appropriate anti-infective therapy. What initially seemed counterintuitive has become the standard of care in the treatment of bacterial and mycobacterial meningitis and severe Pneumocystis and bacterial pneumonias, and favorable data are accruing in other infections such as bacterial arthritis.
A twist on the above scenario can occur when an immunosuppressed patient with a partially controlled indolent infection has his or her immune system suddenly normalized due to successful treatment of the underlying cause of their immunodeficiency. This treatment may be the introduction of successful antiretroviral therapy against human immunodeficiency virus (HIV), effective therapy of an immunosuppressing infection like tuberculosis, or withdrawal of an immunosuppressive anti-tumor necrosis factor (anti-TNF) drug. In this scenario, where the immune system is rapidly reconstituted and concurrently activated by the presence of persistent antigenic challenge or immunostimulatory molecules, a vigorous and clinically counterproductive inflammatory response may ensue, causing “collateral damage” to normal tissue. This immune reactivation syndrome may include fever, sweats, adenitis, and local tissue destruction at the site of infectious agents and associated phlogistic breakdown products. The result of this robust, tissue-injurious inflammatory response can be particularly devastating if it occurs in the brain or the retina, and may cause diagnostic confusion.
The trigger for this regional and systemic inflammatory response is multifactorial. It includes the newly recovered responsiveness to high levels of circulating cytokines, reaction to immune-stimulating fatty acids and other molecules released from dying mycobacteria (perhaps akin to the Jarisch-Herxheimer reaction to rapidly dying spirochetes), and possibly an over-vigorous “rebooting” immune system if an appropriate regulatory cell network is yet to be reconstituted.
In this issue of the Journal, Hara et al provide images from a patient appropriately treated for tuberculosis who experienced continued systemic symptoms of infection with the appearance of new pulmonary lesions. The trigger was the withdrawal of the infliximab (anti-TNF) therapy he was taking for ulcerative colitis, which at face value might be expected to facilitate the successful treatment of his tuberculosis. This seemingly paradoxical reaction has been well described with the successful treatment of HIV-infected patients coinfected with mycobacteria (tuberculous or nontuberculous), cytomegalovirus, and herpes-associated Kaposi sarcoma and zoster. But as in this instructive description of a patient with an immune reactivation syndrome, it also occurs in the setting of non-HIV reversibly immunosuppressed patients.1,2 The syndrome is often recognized 1 to 2 months after immune reconstitution and the initiation of anti-infective therapy.
The treatment of this paradoxical reaction is (not so paradoxically) the administration of corticosteroids or other immunosuppressive drugs. The efficacy of corticosteroids has been demonstrated in a small placebo-controlled trial3 as well as in clinical practice. The mechanism driving this reaction may not be the same for all infections, and thus steroids may not be ideal treatment for all patients. There are reports of using infliximab to temper the immune reactivation syndrome in some patients who did not respond to corticosteroids.
There is no definitive confirmatory test for immune reactivation syndrome. And certainly in the case of known mycobacterial infection, we must ensure the absence of drug resistance and that the appropriate antibiotics are being used, and that no additional infection is present and untreated by the antimycobacterial therapy. While lymphocytosis and an overly robust tuberculin skin test response have been described in patients with tuberculosis experiencing an immune reactivation syndrome, this “paradoxical reaction” remains a clinical diagnosis, worth considering in the appropriate setting.
- Carvalho AC, De Iaco G, Saleri N, et al. Paradoxical reaction during tuberculosis treatment in HIV-seronegative patients. Clin Infect Dis 2006; 42:893–895.
- Garcia Vidal C, Rodríguez Fernández S, Martínez Lacasa J, et al. Paradoxical response to antituberculous therapy in infliximab-treated patients with disseminated tuberculosis. Clin Infect Dis 2005; 40:756–759.
- Meintjes G, Wilkinson RJ, Morroni C, et al. Randomized placebo-controlled trial of prednisone for paradoxical TB-associated immune reconstitution inflammatory syndrome. AIDS (London, England) 2010; 24:2381–2390.
The successful interplay between the host defense system and infectious invaders depends on controlling the tissue damage that ensues from both the infection and the resultant inflammatory response. Even though an underactive immune system predisposes to unusual and potentially severe infections, an overly vigorous host response to infection can be as destructive as the infection itself. We can improve the outcome of some infections by introducing potent anti-inflammatory and immunosuppressive therapy concurrent with appropriate anti-infective therapy. What initially seemed counterintuitive has become the standard of care in the treatment of bacterial and mycobacterial meningitis and severe Pneumocystis and bacterial pneumonias, and favorable data are accruing in other infections such as bacterial arthritis.
A twist on the above scenario can occur when an immunosuppressed patient with a partially controlled indolent infection has his or her immune system suddenly normalized due to successful treatment of the underlying cause of their immunodeficiency. This treatment may be the introduction of successful antiretroviral therapy against human immunodeficiency virus (HIV), effective therapy of an immunosuppressing infection like tuberculosis, or withdrawal of an immunosuppressive anti-tumor necrosis factor (anti-TNF) drug. In this scenario, where the immune system is rapidly reconstituted and concurrently activated by the presence of persistent antigenic challenge or immunostimulatory molecules, a vigorous and clinically counterproductive inflammatory response may ensue, causing “collateral damage” to normal tissue. This immune reactivation syndrome may include fever, sweats, adenitis, and local tissue destruction at the site of infectious agents and associated phlogistic breakdown products. The result of this robust, tissue-injurious inflammatory response can be particularly devastating if it occurs in the brain or the retina, and may cause diagnostic confusion.
The trigger for this regional and systemic inflammatory response is multifactorial. It includes the newly recovered responsiveness to high levels of circulating cytokines, reaction to immune-stimulating fatty acids and other molecules released from dying mycobacteria (perhaps akin to the Jarisch-Herxheimer reaction to rapidly dying spirochetes), and possibly an over-vigorous “rebooting” immune system if an appropriate regulatory cell network is yet to be reconstituted.
In this issue of the Journal, Hara et al provide images from a patient appropriately treated for tuberculosis who experienced continued systemic symptoms of infection with the appearance of new pulmonary lesions. The trigger was the withdrawal of the infliximab (anti-TNF) therapy he was taking for ulcerative colitis, which at face value might be expected to facilitate the successful treatment of his tuberculosis. This seemingly paradoxical reaction has been well described with the successful treatment of HIV-infected patients coinfected with mycobacteria (tuberculous or nontuberculous), cytomegalovirus, and herpes-associated Kaposi sarcoma and zoster. But as in this instructive description of a patient with an immune reactivation syndrome, it also occurs in the setting of non-HIV reversibly immunosuppressed patients.1,2 The syndrome is often recognized 1 to 2 months after immune reconstitution and the initiation of anti-infective therapy.
The treatment of this paradoxical reaction is (not so paradoxically) the administration of corticosteroids or other immunosuppressive drugs. The efficacy of corticosteroids has been demonstrated in a small placebo-controlled trial3 as well as in clinical practice. The mechanism driving this reaction may not be the same for all infections, and thus steroids may not be ideal treatment for all patients. There are reports of using infliximab to temper the immune reactivation syndrome in some patients who did not respond to corticosteroids.
There is no definitive confirmatory test for immune reactivation syndrome. And certainly in the case of known mycobacterial infection, we must ensure the absence of drug resistance and that the appropriate antibiotics are being used, and that no additional infection is present and untreated by the antimycobacterial therapy. While lymphocytosis and an overly robust tuberculin skin test response have been described in patients with tuberculosis experiencing an immune reactivation syndrome, this “paradoxical reaction” remains a clinical diagnosis, worth considering in the appropriate setting.
- Carvalho AC, De Iaco G, Saleri N, et al. Paradoxical reaction during tuberculosis treatment in HIV-seronegative patients. Clin Infect Dis 2006; 42:893–895.
- Garcia Vidal C, Rodríguez Fernández S, Martínez Lacasa J, et al. Paradoxical response to antituberculous therapy in infliximab-treated patients with disseminated tuberculosis. Clin Infect Dis 2005; 40:756–759.
- Meintjes G, Wilkinson RJ, Morroni C, et al. Randomized placebo-controlled trial of prednisone for paradoxical TB-associated immune reconstitution inflammatory syndrome. AIDS (London, England) 2010; 24:2381–2390.

Pharmacotherapy for obesity: What you need to know
Weight-loss drugs are not magic pills, but they can help patients lose about 10 to 25 more pounds than they otherwise could, when used in a program that includes diet, exercise, and other lifestyle changes.

HALF OF ADULTS MAY BE OBESE BY 2030
Obesity is a major public health challenge in the United States, with nearly 37% of adults classified as obese.1 The prevalence has increased more than 75% since 1980,2 and it is estimated that 51% of US adults will be obese by 2030.3 Obesity is the second-leading cause of preventable deaths, after smoking.4
Obesity increases the risk of many chronic medical conditions, including type 2 diabetes mellitus, heart disease, hypertension, stroke, nonalcoholic fatty liver disease, osteoarthritis, and cancers of the breast, colon, endometrium, and kidney.5
WHEN IS DRUG THERAPY INDICATED?
Guidelines from the major obesity societies recommend that all weight-loss programs have a lifestyle component that includes a low-calorie diet, increased physical activity, and behavioral therapy, to which pharmacotherapy may be added as an adjunct.6–8
Weight-loss medications are indicated for patients who have a body mass index (BMI) of at least 30 kg/m2 or who have obesity-associated comorbidities and a BMI of at least 27 kg/m2. However, the best results are achieved when pharmacotherapy is combined with lifestyle modification.9

HISTORY OF WEIGHT-LOSS DRUGS: NOT A PRETTY PICTURE
The earliest drugs to induce weight loss, which worked mainly by increasing metabolism, included thyroid hormone, amphetamines (which also suppress appetite), and dinitrophenol (a pesticide). Adverse reactions limited their usefulness: cardiovascular effects with thyroid hormones, abuse potential with amphetamines, and neuropathy and cataracts with dinitrophenol.
Researchers then looked to drugs that could suppress appetite like amphetamines do, but without the potential for abuse. Medications that increased levels of norepinephrine and serotonin, both by increasing release and decreasing reuptake of these neuromodulators, had some success. But again, serious adverse effects occurred, and several drugs had to be withdrawn from the market.
The most publicized of these withdrawals was for the combination fenfluramine and phentermine (“fen-phen”) and its cousin dexfenfluramine (Redux). Up to 30% of patients taking fenfluramine-phentermine developed echocardiographic evidence of valvular heart disease.11 Fenfluramine also increased the risk of pulmonary hypertension. These findings led to the 1997 withdrawal of these drugs from the US market.
Sibutramine (Meridia), a norepinephrine and serotonin reuptake inhibitor, was approved for weight loss in 1997. Increases in blood pressure and heart rate were noted in the initial trial,12 and then a postmarketing study found increased rates of nonfatal myocardial infarction and stroke in patients with preexisting cardiovascular disease or diabetes mellitus.13 Based on these results, sibutramine was withdrawn from both US and European markets.
Rimonabant (Acomplia, Zimulti), a cannabinoid-receptor inhibitor, was approved in Europe in 2006, but its approval was withdrawn just 2 years later because of increased suicidality in a postmarketing study.14 It was never approved for use in the United States.
NORADRENERGIC SYMPATHOMIMETICS: FOR SHORT-TERM USE
Several noradrenergic sympathomimetic drugs are FDA-approved for short-term weight loss, but phentermine is by far the most commonly prescribed drug in this class. In fact, it is the most commonly prescribed drug for obesity in the United States.15
Phentermine
Phentermine is an atypical amphetamine analogue that suppresses appetite by norepinephrine agonism in the central nervous system. The FDA approved it for short-term weight management in 1959, and its use became widespread in the 1960s, followed by decades of popularity.
Dosage. Phentermine is prescribed at an oral dose of 15, 30, or 37.5 mg daily, either before breakfast or 1 to 2 hours after. It is a schedule IV controlled substance, based on its similarity to amphetamine. (The 5 US controlled substance schedules range from schedule I, which includes heroin, amphetamine, and cannabis, to schedule V, which includes cough syrups containing no more than 200 mg of codeine per 100 mL.) However, concerns about addiction and dependence with phentermine are largely unfounded, and abrupt cessation of the drug has not been shown to cause amphetamine-like withdrawal.16
Adverse effects. Common adverse reactions include nervousness, insomnia, and dry mouth, but these effects tend to wane with continued use.
Contraindications. Cardiovascular disease is a contraindication to phentermine because of concerns about increased blood pressure and pulse rate, although these concerns seem to be more theoretic than observed.16 Other contraindications include hyperthyroidism, glaucoma, agitation, a history of drug abuse, pregnancy, breastfeeding, and current or recent use of a monoamine oxidase inhibitor. No serious adverse events have been reported in trials of phentermine.
Efficacy. In a pooled analysis of 6 trials lasting 2 to 24 weeks completed between 1975 and 1999, phentermine-treated patients lost an average of 3.6 kg more weight than placebo recipients.17 More than 80% of study participants were women.
In a 36-week study in 108 women,18 participants lost a mean of 12.2 kg with continuous phentermine use, 13.0 kg with intermittent use (4 weeks on, 4 weeks off; the difference was not significant), and 4.8 kg with placebo.
Minimal data exist on long-term efficacy of phentermine monotherapy.
DRUGS FOR LONG-TERM THERAPY
Orlistat
Orlistat was approved as a prescription drug (Xenical, 120 mg) in 1999 and as an over-the-counter medication (Alli, 60 mg) in 2007.
Orlistat works by inhibiting pancreatic and gastric lipase, causing incomplete hydrolysis of ingested fat, thereby increasing fecal fat excretion in a dose-dependent manner. It is a good choice for weight-loss drug therapy because of its safe cardiovascular risk profile and beneficial effects on lipid levels. However, its long-term effect on weight is only modest.19,20
Dosage. The dosage for prescription orlistat is 120 mg 3 times per day, in addition to a low-fat diet (< 30% of daily calories from fat). To prevent potential deficiencies of fat-soluble vitamins, a daily multivitamin supplement is recommended, but it should not be taken with meals.
Efficacy. In a 2014 systematic review, 35% to 73% of patients treated with orlistat 120 mg had lost at least 5% of their body weight at 1 year, and 14% to 41% had lost at least 10%.21 At the end of the second year, orlistat-treated patients had lost about 3.3 kg more than placebo recipients.
In a randomized trial,22 4 years of treatment with orlistat vs placebo led to a significant (37.3%) risk reduction in the incidence of type 2 diabetes mellitus in obese participants, as well as significant improvements in cardiovascular risk factors. Mean weight loss at 1 year was significantly greater with orlistat than with placebo (10.6 vs 6.2 kg), and it remained greater at 4 years (5.8 vs 3.0 kg; P < .001).
Adverse effects. Long-term orlistat use is hampered by adverse reactions. A population-based, retrospective cohort analysis showed that fewer than 10% of patients were still using it at 1 year, and only 2% were using it at 2 years, although reasons for discontinuation were not reported.23
Adverse reactions are predominantly gastrointestinal, attributed to the high content of undigested fat in stools. Patients who do not limit their dietary fat intake are affected the most. Other reported adverse reactions include hepatotoxicity and oxalate-induced nephropathy.
Orlistat has been reported to interfere with some drugs, particularly those that are lipophilic. Drugs that should be closely monitored with orlistat are warfarin, amiodarone, cyclosporine, certain antiepileptic drugs, and levothyroxine.
Phentermine-topiramate
The combination of phentermine and topiramate was approved by the FDA in 2012 and is available under the brand name Qsymia.
Topiramate had been approved for treating seizure disorder in 1996 and as migraine prophylaxis in 2004. It is not approved as monotherapy for obesity; however, patients taking it for seizures or for psychiatric disorders (eg, binge eating, borderline personality disorder) have reported weight loss during treatment.
How topiramate promotes weight loss is not known. Proposed mechanisms include taste inhibition by carbonic anhydrase, influences on gamma-aminobutyric acid transmission causing appetite suppression, sensitization of insulin activity, and adiponectin secretion in the peripheral tissues.24,25
Phentermine-topiramate therapy has an advantage over monotherapy because lower doses of each medication can be used to achieve the same benefit, thus avoiding dose-related adverse reactions.
Dosage. Phentermine-topiramate is available in capsules containing 3.75/23, 7.5/46, 11.25/69, and 15/92 mg. The recommended starting dosage is 3.75/23 mg/day for 14 days, increasing to 7.5/46 mg/day. If patients do not lose at least 3% of their body weight after 12 weeks, the dose can be increased to 11.25/69 mg daily for 14 days, followed by 15/92 mg daily.26 Phentermine-topiramate is a schedule IV controlled substance with a low potential for abuse and dependence.
Efficacy. Approval of phentermine-topiramate for treating obesity was primarily based on 3 clinical trials.27–29 In 1 of these trials,28 at 1 year, patients had lost 9.9 kg with the medium dose and 12.9 kg with the high dose.
Adverse effects. Phentermine-topiramate was well tolerated in the trials. The most commonly reported adverse reactions were dry mouth, dizziness, constipation, insomnia, dysgeusia, paresthesia, and increased resting heart rate.28,29 Acute myopia and angle-closure glaucoma also have been reported with topiramate.30 Topiramate monotherapy has been associated with dose-dependent neuropsychiatric adverse effects, including memory symptoms and depression. However, across all 3 trials of phentermine-topiramate therapy, symptoms of depression improved over time, and no significant increase in suicide risk was identified.27–29
Recommended monitoring for patients on phentermine-topiramate includes a blood chemistry panel, resting heart rate, blood pressure, and depression screening.
Because topiramate has teratogenic potential (craniofacial abnormalities), it is labeled as pregnancy category X (contraindicated). A negative pregnancy test is needed before women of childbearing age take the drug and monthly thereafter. Women should be counseled to use effective birth control. A home pregnancy test is an alternative to laboratory testing, but this option should be left to the prescribing clinician’s judgment and be based on reliability of the test and patient compliance.
Lorcaserin
Lorcaserin (Belviq) was approved by the FDA in 2012 for chronic weight management. It suppresses appetite by activating the serotonin 2C receptor in the brain. Because it is selective for the 2C receptor, it does not appear to have the same detrimental effects on heart valves as occurred with less-selective serotonergic agents such as fenfluramine and dexfenfluramine.31
Dosage. The recommended dosage for lorcaserin is 10 mg twice daily. Lorcaserin is a schedule IV controlled substance because of studies that showed increases in positive subjective measures such as euphoria in patients taking the drug. The incidence of euphoria was similar to that seen with zolpidem.32
Efficacy. Lorcaserin was approved on the basis of 2 trials in nondiabetic obese and overweight adults who did not have diabetes but who had a weight-related condition,33,34 and in a third trial in obese and overweight adults with type 2 diabetes mellitus who were taking oral hypoglycemic agents.35 In these trials, lorcaserin use resulted in a modest 4.7- to 5.8-kg weight loss compared with 1.6 to 2.2 kg in the placebo group.33–35 There was a high dropout rate in all 3 of these studies (33% to 45% of participants).
A pilot study that added phentermine to lorcaserin yielded double the weight loss from lorcaserin alone.36 This drug combination warrants further investigation.
Contraindications. Lorcaserin should not be given to patients who have severe renal insufficiency (creatinine clearance < 30 mL/min) or severe hepatic impairment, or who are pregnant.
Adverse effects. Common adverse reactions include dry mouth, dizziness, somnolence, headache, and gastrointestinal disturbances (nausea, constipation, or diarrhea).37
Patients with type 2 diabetes mellitus should be monitored for hypoglycemia.
Lorcaserin should be used with extreme caution in patients taking other serotonergic agents because of the risk of the serotonin syndrome.
A theoretic potential for increased risk of breast cancer also exists with lorcaserin. When rats were given supraphysiologic doses of lorcaserin (more than 50 times higher than recommended in humans), fibroadenomas and adenocarcinomas occurred at higher rates.38 Breast cancer data were not reported in the 3 randomized trials discussed above.33–35
Naltrexone-bupropion
The combination of naltrexone and bupropion was approved by the FDA in 2014 under the brand name Contrave. Both drugs are approved for monotherapy in conditions other than obesity.
Naltrexone is a mu opioid receptor antagonist approved to treat alcohol and opioid dependency. Bupropion is a dopamine-norepinephrine reuptake inhibitor approved to treat depression and to help with smoking cessation. Combining the drugs produces weight loss and metabolic benefits through effects on 2 areas of the brain that regulate food intake: the hypothalamus (appetite) and the mesolimbic dopamine circuit (reward system).
Dosage. Naltrexone-bupropion comes as an extended-release tablet of 8/90 mg. The maintenance dose of 2 tablets twice daily is reached at week 4 through a specific dose-titration regimen (Table 1). The dose should be adjusted if patients have renal or hepatic impairment or if they are also taking a CYP2B6 inhibitor.
Efficacy. FDA approval was based on the results of 4 clinical trials.39–42 Using a modified intention-to-treat analysis, Yanovski and Yanovski43 calculated that at 1 year, placebo-subtracted mean weight loss was 4.6% (4.9 kg), and mean total weight loss was 6.8% (7.3 kg) across the studies. Attrition rates, however, were high, ranging from 42% to 50%.
Cardiometabolic effects in 2 of the trials40,41 included decreased waist circumference, triglyceride levels, and C-reactive protein levels, and increased high-density lipoprotein levels at the initial dose. At the maintenance dose, additional lowering of fasting plasma insulin and glucose levels occurred along with lower levels of the homeostatic model assessment of insulin resistance. In the COR-Diabetes Study Group trial, patients with type 2 diabetes mellitus had decreased hemoglobin A1c levels without an increase in hypoglycemia and an increased likelihood of reaching the target hemoglobin A1c level below 7%.39
Contraindications. Naltrexone-bupropion is contraindicated for patients who have uncontrolled hypertension, seizure disorder, eating disorder, or end-stage renal failure; who are pregnant; or who have been treated with a monoamine oxidase inhibitor within 14 days. It should not be used with other bupropion-containing products or in patients who have taken opioids chronically or have acute opiate withdrawal.
Because of its bupropion component, this product carries an FDA black-box warning about possible suicidal thoughts and behaviors and neuropsychiatric reactions.
Adverse effects. The adverse reactions most commonly associated with naltrexone-bupropion were nausea (32.5%), constipation (19.2%), headache (17.6%), vomiting (10.7%), dizziness (9.9%), insomnia (9.2%), dry mouth (8.1%), and diarrhea (7.1%).44
Liraglutide
Liraglutide, previously FDA-approved to treat type 2 diabetes mellitus under the brand name Victoza, received approval in 2014 in a higher-dose formulation (Saxenda) to treat obesity.
Liraglutide is a glucagon-like peptide-1 receptor agonist that stimulates glucose-dependent insulin release from the pancreatic islet cells, slows gastric emptying, regulates postprandial glucagon, and reduces food intake.
Dosage. Liraglutide is given as a once-daily injection in the abdomen, thigh, or arm. The initial dosage is 0.6 mg daily for the first week and can be titrated up by 0.6 mg weekly to a target dose of 3 mg daily. If a patient does not lose 4% of baseline body weight after 16 weeks on the target dose, the drug should be discontinued because it is unlikely to lead to clinically significant weight loss.
Efficacy. Liraglutide for weight management (3 mg once daily) was evaluated in a large (N = 3,731), randomized, double-blind, placebo-controlled international trial.45 Participants did not have diabetes mellitus, but 60% had prediabetes. Liraglutide or placebo was given for 56 weeks, along with lifestyle counseling. At the end of the study, the liraglutide group had lost a mean of 8.4 kg vs 2.8 kg in the placebo group. Additionally, 63% of the liraglutide group lost at least 5% of body weight vs 27% in the placebo group, and 33% lost at least 10% of body weight vs 10% in the placebo group.
A 2-year extension found systolic blood pressure decreased with no change in pulse, and the prevalence of prediabetes and metabolic syndrome decreased by 52% and 59%, respectively.46 At 2 years, mean scores for physical function, self-esteem, and work had improved more in the liraglutide group than the placebo group.47
Adverse effects. The most common adverse reactions with liraglutide were nausea, vomiting, diarrhea, constipation, hypoglycemia, and loss of appetite. In most cases, nausea and vomiting were tolerable, transient, and associated with greater weight loss but not with decreased quality-of-life scores. Serious adverse reactions included pancreatitis, gallbladder disease, renal impairment, and suicidal thoughts.
CHOOSING A DRUG
For obese patients, when lifestyle modifications do not result in the desired weight loss, pharmacotherapy is an option. Practitioners have several FDA-approved options for weight management. Because of evidence that these drugs can postpone the onset of other complications and improve metabolic and cardiovascular parameters, they should be considered.
In phase 3 trials, these drugs caused modest weight loss of 5% to 10% of body weight. More weight was lost with the combination of phentermine-topiramate than with the other drugs.
In a 2016 meta-analysis, these drugs were associated with at least 5% weight reduction compared with placebo.48 Phentermine-topiramate and liraglutide were most likely to produce at least a 5% weight loss, while liraglutide and naltrexone-bupropion were most likely to be discontinued because of adverse events. Combination drugs may have the advantages of synergistic effects on weight loss and fewer adverse reactions because lower doses of the individual drug components are used.
Response to therapy with most of these drugs should be evaluated at 12 weeks on the maintenance dose. If less than 5% weight loss has been achieved, the medication should be discontinued.
Adverse-effect profiles, drug interactions, abuse, misuse, and overdose potential should be considered when prescribing these drugs. Weight-loss drugs are contraindicated in pregnancy because they offer no potential benefit to a pregnant woman and may harm the fetus.
The development of new drugs and better drug combinations is expected to provide more effective therapeutic strategies, which are essential for combating the obesity epidemic.
- Ogden CL, Carroll MD, Fryar CD, Flegal KM. Prevalence of obesity among adults and youth: United States, 2011-2014. NCHS Data Brief 2015; 219:1–8.
- Yanovski SZ, Yanovski JA. Obesity. N Engl J Med 2002; 346:591–602.
- Finkelstein EA, Khavjou OA, Thompson H, et al. Obesity and severe obesity forecasts through 2030. Am J Prev Med 2012; 42:563–570.
- Hill JO, Wyatt H. Outpatient management of obesity: a primary care perspective. Obes Res 2002; 10(suppl 2):124S–130S.
- US Department of Health and Human Services. National Institute of Diabetes and Digestive and Kidney Diseases. Overweight and obesity statistics. www.niddk.nih.gov/health-information/health-statistics/Pages/overweight-obesity-statistics.aspx#overweight. Accessed October 10, 2017.
- Jensen MD, Ryan DH, Apovian CM, et al; American College of Cardiology/American Heart Association Task Force on Practice Guidelines; Obesity Society. 2013 AHA/ACC/TOS guideline for the management of overweight and obesity in adults: a report of the American College of Cardiology/American Heart Association Task Force on Practice Guidelines and the Obesity Society. J Am Coll Cardiol 2014; 63:2985–3023.
- Jensen MD, Ryan DH, Apovian CM, et al; American College of Cardiology/American Heart Association Task Force on Practice Guidelines; Obesity Society. 2013 AHA/ACC/TOS guideline for the management of overweight and obesity in adults: a report of the American College of Cardiology/American Heart Association Task Force on Practice Guidelines and the Obesity Society. Circulation 2014; 129(suppl 2):S102–S138.
- American Association of Clinical Endocrinologists. AACE/ACE algorithm for the medical care of patients with obesity. www.aace.com/files/guidelines/ObesityAlgorithm.pdf. Accessed July 25, 2017.
- Wadden TA, Berkowitz RI, Womble LG, et al. Randomized trial of lifestyle modification and pharmacotherapy for obesity. N Engl J Med 2005; 353:2111–2120.
- Mechanick JI, Youdim A, Jones DB, et al. Clinical practice guidelines for the perioperative nutritional, metabolic, and nonsurgical support of the bariatric surgery patient, 2013 update: cosponsored by American Association of Clinical Endocrinologists, the Obesity Society, and American Society for Metabolic and Bariatric Surgery. Surg Obes Relat Dis 2013; 9:159–191.
- Connolly HM, Crary JL, McGoon MD, et al. Valvular heart disease associated with fenfluramine-phentermine. N Engl J Med 1997; 337:581–588.
- Kim SH, Lee YM, Jee SH, et al. Effect of sibutramine on weight loss and blood pressure: a meta-analysis of controlled trials. Obes Res 2003; 11:1116–1123.
- James WP, Caterson ID, Coutinho W, et al; SCOUT Investigators. Effect of sibutramine on cardiovascular outcomes in overweight and obese subjects. N Engl J Med 2010; 363:905–917.
- Nissen SE, Nicholls SJ, Wolski K, et al; STRADIVARIUS Investigators. Effect of rimonabant on progression of atherosclerosis in patients with abdominal obesity and coronary artery disease: the STRADIVARIUS randomized controlled trial. JAMA 2008; 299:1547–1560.
- Ryan DH, Bray GA. Pharmacologic treatment options for obesity: what is old is new again. Curr Hypertens Rep 2013; 15:182–189.
- Hendricks EJ, Greenway FL, Westman EC, Gupta AK. Blood pressure and heart rate effects, weight loss and maintenance during long-term phentermine pharmacotherapy for obesity. Obesity (Silver Spring) 2011; 19:2351–2360.
- Li Z, Maglione M, Tu W, et al. Meta-analysis: pharmacologic treatment of obesity. Ann Intern Med 2005; 142:532–546.
- Munro JF, MacCuish AC, Wilson EM, Duncan LJ. Comparison of continuous and intermittent anorectic therapy in obesity. Br Med J 1968; 1:352–354.
- Hauptman J, Lucas C, Boldrin MN, Collins H, Segal KR. Orlistat in the long-term treatment of obesity in primary care settings. Arch Fam Med 2000; 9:160–167.
- Rossner S, Sjostrom L, Noack R, Meinders AE, Noseda G. Weight loss, weight maintenance, and improved cardiovascular risk factors after 2 years treatment with orlistat for obesity. European Orlistat Obesity Study Group. Obes Res 2000; 8:49–61.
- Yanovski SZ, Yanovski JA. Long-term drug treatment for obesity: a systematic and clinical review. JAMA 2014; 311:74–86.
- Torgerson JS, Hauptman J, Boldrin MN, Sjostrom L. XENical in the prevention of diabetes in obese subjects (XENDOS) study: a randomized study of orlistat as an adjunct to lifestyle changes for the prevention of type 2 diabetes in obese patients. Diabetes Care 2004; 27:155–161.
- Padwal R, Kezouh A, Levine M, Etminan M. Long-term persistence with orlistat and sibutramine in a population-based cohort. Int J Obes (Lond) 2007; 31:1567–1570.
- Xiong GL, Gadde KM. Combination phentermine-topiramate for obesity treatment in primary care: a review. Postgrad Med 2014; 126:110–116.
- Pucci A, Finer N. New medications for treatment of obesity: metabolic and cardiovascular effects. Can J Cardiol 2015; 31:142–152.
- Smith SM, Meyer M, Trinkley KE. Phentermine-topiramate for the treatment of obesity. Ann Pharmacother 2013; 47:340–349.
- Allison DB, Gadde KM, Garvey WT, et al. Controlled-release phentermine-topiramate in severely obese adults: a randomized controlled trial (EQUIP). Obesity (Silver Spring) 2012; 20:330–342.
- Gadde KM, Allison DB, Ryan DH, et al. Effects of low-dose, controlled-release, phentermine plus topiramate combination on weight and associated comorbidities in overweight and obese adults (CONQUER): a randomised, placebo-controlled, phase 3 trial. Lancet 2011; 377:1341–1352.
- Garvey WT, Ryan DH, Look M, et al. Two-year sustained weight loss and metabolic benefits with controlled-release phentermine-topiramate in obese and overweight adults (SEQUEL): a randomized, placebo-controlled, phase 3 extension study. Am J Clin Nutr 2012; 95:297–308.
- Richa S, Yazbek JC. Ocular adverse effects of common psychotropic agents: a review. CNS Drugs 2010; 24:501–526.
- Weissman NJ, Sanchez M, Koch GG, Smith SR, Shanahan WR, Anderson CM. Echocardiographic assessment of cardiac valvular regurgitation with lorcaserin from analysis of 3 phase 3 clinical trials. Circ Cardiovasc Imaging 2013; 6:560–567.
- US Department of Justice Drug Enforcement Administration. Schedules of controlled substances: placement of lorcaserin into Schedule IV. Federal Register 2013; 78:26701–26705.
- Smith SR, Weissman NJ, Anderson CM, et al; Behavioral Modification and Lorcaserin for Overweight and Obesity Management (BLOOM) Study Group. Multicenter, placebo-controlled trial of lorcaserin for weight management. N Engl J Med 2010; 363:245–256.
- Fidler MC, Sanchez M, Raether B, et al; BLOSSOM Clinical Trial Group. A one-year randomized trial of lorcaserin for weight loss in obese and overweight adults: the BLOSSOM trial. J Clin Endocrinol Metab 2011; 96:3067–3077.
- O’Neil PM, Smith SR, Weissman NJ, et al. Randomized placebo-controlled clinical trial of lorcaserin for weight loss in type 2 diabetes mellitus: the BLOOM-DM study. Obesity (Silver Spring) 2012; 20:1426–1436.
- Kumar RB, Aronne LJ. Efficacy comparison of medications approved for chronic weight management. Obesity (Silver Spring) 2015; 23(suppl 1):S4–S7.
- Chan EW, He Y, Chui CS, Wong AY, Lau WC, Wong IC. Efficacy and safety of lorcaserin in obese adults: a meta-analysis of 1-year randomized controlled trials (RCTs) and narrative review on short-term RCTs. Obes Rev 2013; 14:383–392.
- Miller LE. Lorcaserin for weight loss: insights into US Food and Drug Administration approval. J Acad Nutr Diet 2013; 113:25–30.
- Hollander P, Gupta AK, Plodkowski R, et al; COR-Diabetes Study Group. Effects of naltrexone sustained-release/bupropion sustained-release combination therapy on body weight and glycemic parameters in overweight and obese patients with type 2 diabetes. Diabetes Care 2013; 36:4022–4029.
- Apovian CM, Aronne L, Rubino D, et al; COR-II Study Group. A randomized, phase 3 trial of naltrexone SR/bupropion SR on weight and obesity-related risk factors (COR-II). Obesity (Silver Spring) 2013; 21:935–943.
- Greenway FL, Fujioka K, Plodkowski RA, et al; COR-I Study Group. Effect of naltrexone plus bupropion on weight loss in overweight and obese adults (COR-I): a multicentre, randomised, double-blind, placebo-controlled, phase 3 trial. Lancet 2010; 376:595–605.
- Wadden TA, Foreyt JP, Foster GD, et al. Weight loss with naltrexone SR/bupropion SR combination therapy as an adjunct to behavior modification: the COR-BMOD trial. Obesity (Silver Spring) 2011; 19:110–120.
- Yanovski SZ, Yanovski JA. Naltrexone extended-release plus bupropion extended-release for treatment of obesity. JAMA 2015; 313:1213–1214.
- Contrave (naltrexone HC1 and bupropion HC1) extended release tablets [package insert]. Orexigen Therapeutics, 2017. https://contrave.com/wp-content/uploads/2017/05/Contrave_PI.pdf. Accessed November 7, 2017.
- Pi-Sunyer X, Astrup A, Fujioka K, et al; SCALE Obesity and Prediabetes NN8022-1839 Study Group. A randomized, controlled trial of 3.0 mg of liraglutide in weight management. N Engl J Med 2015; 373:11–22.
- Astrup A, Carraro R, Finer N, et al; NN8022-1807 Investigators. Safety, tolerability and sustained weight loss over 2 years with the once-daily human GLP-1 analog, liraglutide. Int J Obes (Lond) 2012; 36:843–854.
- Lean ME, Carraro R, Finer N, et al; NN8022-1807 Investigators. Tolerability of nausea and vomiting and associations with weight loss in a randomized trial of liraglutide in obese, non-diabetic adults. Int J Obes (Lond) 2014; 38:689–697.
- Khera R, Murad MH, Chandar AK, et al. Association of pharmacological treatments for obesity with weight loss and adverse events: a systematic review and meta-analysis. JAMA 2016; 315:2424–2434.
Weight-loss drugs are not magic pills, but they can help patients lose about 10 to 25 more pounds than they otherwise could, when used in a program that includes diet, exercise, and other lifestyle changes.
HALF OF ADULTS MAY BE OBESE BY 2030
Obesity is a major public health challenge in the United States, with nearly 37% of adults classified as obese.1 The prevalence has increased more than 75% since 1980,2 and it is estimated that 51% of US adults will be obese by 2030.3 Obesity is the second-leading cause of preventable deaths, after smoking.4
Obesity increases the risk of many chronic medical conditions, including type 2 diabetes mellitus, heart disease, hypertension, stroke, nonalcoholic fatty liver disease, osteoarthritis, and cancers of the breast, colon, endometrium, and kidney.5
WHEN IS DRUG THERAPY INDICATED?
Guidelines from the major obesity societies recommend that all weight-loss programs have a lifestyle component that includes a low-calorie diet, increased physical activity, and behavioral therapy, to which pharmacotherapy may be added as an adjunct.6–8
Weight-loss medications are indicated for patients who have a body mass index (BMI) of at least 30 kg/m2 or who have obesity-associated comorbidities and a BMI of at least 27 kg/m2. However, the best results are achieved when pharmacotherapy is combined with lifestyle modification.9
HISTORY OF WEIGHT-LOSS DRUGS: NOT A PRETTY PICTURE
The earliest drugs to induce weight loss, which worked mainly by increasing metabolism, included thyroid hormone, amphetamines (which also suppress appetite), and dinitrophenol (a pesticide). Adverse reactions limited their usefulness: cardiovascular effects with thyroid hormones, abuse potential with amphetamines, and neuropathy and cataracts with dinitrophenol.
Researchers then looked to drugs that could suppress appetite like amphetamines do, but without the potential for abuse. Medications that increased levels of norepinephrine and serotonin, both by increasing release and decreasing reuptake of these neuromodulators, had some success. But again, serious adverse effects occurred, and several drugs had to be withdrawn from the market.
The most publicized of these withdrawals was for the combination fenfluramine and phentermine (“fen-phen”) and its cousin dexfenfluramine (Redux). Up to 30% of patients taking fenfluramine-phentermine developed echocardiographic evidence of valvular heart disease.11 Fenfluramine also increased the risk of pulmonary hypertension. These findings led to the 1997 withdrawal of these drugs from the US market.
Sibutramine (Meridia), a norepinephrine and serotonin reuptake inhibitor, was approved for weight loss in 1997. Increases in blood pressure and heart rate were noted in the initial trial,12 and then a postmarketing study found increased rates of nonfatal myocardial infarction and stroke in patients with preexisting cardiovascular disease or diabetes mellitus.13 Based on these results, sibutramine was withdrawn from both US and European markets.
Rimonabant (Acomplia, Zimulti), a cannabinoid-receptor inhibitor, was approved in Europe in 2006, but its approval was withdrawn just 2 years later because of increased suicidality in a postmarketing study.14 It was never approved for use in the United States.
NORADRENERGIC SYMPATHOMIMETICS: FOR SHORT-TERM USE
Several noradrenergic sympathomimetic drugs are FDA-approved for short-term weight loss, but phentermine is by far the most commonly prescribed drug in this class. In fact, it is the most commonly prescribed drug for obesity in the United States.15
Phentermine
Phentermine is an atypical amphetamine analogue that suppresses appetite by norepinephrine agonism in the central nervous system. The FDA approved it for short-term weight management in 1959, and its use became widespread in the 1960s, followed by decades of popularity.
Dosage. Phentermine is prescribed at an oral dose of 15, 30, or 37.5 mg daily, either before breakfast or 1 to 2 hours after. It is a schedule IV controlled substance, based on its similarity to amphetamine. (The 5 US controlled substance schedules range from schedule I, which includes heroin, amphetamine, and cannabis, to schedule V, which includes cough syrups containing no more than 200 mg of codeine per 100 mL.) However, concerns about addiction and dependence with phentermine are largely unfounded, and abrupt cessation of the drug has not been shown to cause amphetamine-like withdrawal.16
Adverse effects. Common adverse reactions include nervousness, insomnia, and dry mouth, but these effects tend to wane with continued use.
Contraindications. Cardiovascular disease is a contraindication to phentermine because of concerns about increased blood pressure and pulse rate, although these concerns seem to be more theoretic than observed.16 Other contraindications include hyperthyroidism, glaucoma, agitation, a history of drug abuse, pregnancy, breastfeeding, and current or recent use of a monoamine oxidase inhibitor. No serious adverse events have been reported in trials of phentermine.
Efficacy. In a pooled analysis of 6 trials lasting 2 to 24 weeks completed between 1975 and 1999, phentermine-treated patients lost an average of 3.6 kg more weight than placebo recipients.17 More than 80% of study participants were women.
In a 36-week study in 108 women,18 participants lost a mean of 12.2 kg with continuous phentermine use, 13.0 kg with intermittent use (4 weeks on, 4 weeks off; the difference was not significant), and 4.8 kg with placebo.
Minimal data exist on long-term efficacy of phentermine monotherapy.
DRUGS FOR LONG-TERM THERAPY
Orlistat
Orlistat was approved as a prescription drug (Xenical, 120 mg) in 1999 and as an over-the-counter medication (Alli, 60 mg) in 2007.
Orlistat works by inhibiting pancreatic and gastric lipase, causing incomplete hydrolysis of ingested fat, thereby increasing fecal fat excretion in a dose-dependent manner. It is a good choice for weight-loss drug therapy because of its safe cardiovascular risk profile and beneficial effects on lipid levels. However, its long-term effect on weight is only modest.19,20
Dosage. The dosage for prescription orlistat is 120 mg 3 times per day, in addition to a low-fat diet (< 30% of daily calories from fat). To prevent potential deficiencies of fat-soluble vitamins, a daily multivitamin supplement is recommended, but it should not be taken with meals.
Efficacy. In a 2014 systematic review, 35% to 73% of patients treated with orlistat 120 mg had lost at least 5% of their body weight at 1 year, and 14% to 41% had lost at least 10%.21 At the end of the second year, orlistat-treated patients had lost about 3.3 kg more than placebo recipients.
In a randomized trial,22 4 years of treatment with orlistat vs placebo led to a significant (37.3%) risk reduction in the incidence of type 2 diabetes mellitus in obese participants, as well as significant improvements in cardiovascular risk factors. Mean weight loss at 1 year was significantly greater with orlistat than with placebo (10.6 vs 6.2 kg), and it remained greater at 4 years (5.8 vs 3.0 kg; P < .001).
Adverse effects. Long-term orlistat use is hampered by adverse reactions. A population-based, retrospective cohort analysis showed that fewer than 10% of patients were still using it at 1 year, and only 2% were using it at 2 years, although reasons for discontinuation were not reported.23
Adverse reactions are predominantly gastrointestinal, attributed to the high content of undigested fat in stools. Patients who do not limit their dietary fat intake are affected the most. Other reported adverse reactions include hepatotoxicity and oxalate-induced nephropathy.
Orlistat has been reported to interfere with some drugs, particularly those that are lipophilic. Drugs that should be closely monitored with orlistat are warfarin, amiodarone, cyclosporine, certain antiepileptic drugs, and levothyroxine.
Phentermine-topiramate
The combination of phentermine and topiramate was approved by the FDA in 2012 and is available under the brand name Qsymia.
Topiramate had been approved for treating seizure disorder in 1996 and as migraine prophylaxis in 2004. It is not approved as monotherapy for obesity; however, patients taking it for seizures or for psychiatric disorders (eg, binge eating, borderline personality disorder) have reported weight loss during treatment.
How topiramate promotes weight loss is not known. Proposed mechanisms include taste inhibition by carbonic anhydrase, influences on gamma-aminobutyric acid transmission causing appetite suppression, sensitization of insulin activity, and adiponectin secretion in the peripheral tissues.24,25
Phentermine-topiramate therapy has an advantage over monotherapy because lower doses of each medication can be used to achieve the same benefit, thus avoiding dose-related adverse reactions.
Dosage. Phentermine-topiramate is available in capsules containing 3.75/23, 7.5/46, 11.25/69, and 15/92 mg. The recommended starting dosage is 3.75/23 mg/day for 14 days, increasing to 7.5/46 mg/day. If patients do not lose at least 3% of their body weight after 12 weeks, the dose can be increased to 11.25/69 mg daily for 14 days, followed by 15/92 mg daily.26 Phentermine-topiramate is a schedule IV controlled substance with a low potential for abuse and dependence.
Efficacy. Approval of phentermine-topiramate for treating obesity was primarily based on 3 clinical trials.27–29 In 1 of these trials,28 at 1 year, patients had lost 9.9 kg with the medium dose and 12.9 kg with the high dose.
Adverse effects. Phentermine-topiramate was well tolerated in the trials. The most commonly reported adverse reactions were dry mouth, dizziness, constipation, insomnia, dysgeusia, paresthesia, and increased resting heart rate.28,29 Acute myopia and angle-closure glaucoma also have been reported with topiramate.30 Topiramate monotherapy has been associated with dose-dependent neuropsychiatric adverse effects, including memory symptoms and depression. However, across all 3 trials of phentermine-topiramate therapy, symptoms of depression improved over time, and no significant increase in suicide risk was identified.27–29
Recommended monitoring for patients on phentermine-topiramate includes a blood chemistry panel, resting heart rate, blood pressure, and depression screening.
Because topiramate has teratogenic potential (craniofacial abnormalities), it is labeled as pregnancy category X (contraindicated). A negative pregnancy test is needed before women of childbearing age take the drug and monthly thereafter. Women should be counseled to use effective birth control. A home pregnancy test is an alternative to laboratory testing, but this option should be left to the prescribing clinician’s judgment and be based on reliability of the test and patient compliance.
Lorcaserin
Lorcaserin (Belviq) was approved by the FDA in 2012 for chronic weight management. It suppresses appetite by activating the serotonin 2C receptor in the brain. Because it is selective for the 2C receptor, it does not appear to have the same detrimental effects on heart valves as occurred with less-selective serotonergic agents such as fenfluramine and dexfenfluramine.31
Dosage. The recommended dosage for lorcaserin is 10 mg twice daily. Lorcaserin is a schedule IV controlled substance because of studies that showed increases in positive subjective measures such as euphoria in patients taking the drug. The incidence of euphoria was similar to that seen with zolpidem.32
Efficacy. Lorcaserin was approved on the basis of 2 trials in nondiabetic obese and overweight adults who did not have diabetes but who had a weight-related condition,33,34 and in a third trial in obese and overweight adults with type 2 diabetes mellitus who were taking oral hypoglycemic agents.35 In these trials, lorcaserin use resulted in a modest 4.7- to 5.8-kg weight loss compared with 1.6 to 2.2 kg in the placebo group.33–35 There was a high dropout rate in all 3 of these studies (33% to 45% of participants).
A pilot study that added phentermine to lorcaserin yielded double the weight loss from lorcaserin alone.36 This drug combination warrants further investigation.
Contraindications. Lorcaserin should not be given to patients who have severe renal insufficiency (creatinine clearance < 30 mL/min) or severe hepatic impairment, or who are pregnant.
Adverse effects. Common adverse reactions include dry mouth, dizziness, somnolence, headache, and gastrointestinal disturbances (nausea, constipation, or diarrhea).37
Patients with type 2 diabetes mellitus should be monitored for hypoglycemia.
Lorcaserin should be used with extreme caution in patients taking other serotonergic agents because of the risk of the serotonin syndrome.
A theoretic potential for increased risk of breast cancer also exists with lorcaserin. When rats were given supraphysiologic doses of lorcaserin (more than 50 times higher than recommended in humans), fibroadenomas and adenocarcinomas occurred at higher rates.38 Breast cancer data were not reported in the 3 randomized trials discussed above.33–35
Naltrexone-bupropion
The combination of naltrexone and bupropion was approved by the FDA in 2014 under the brand name Contrave. Both drugs are approved for monotherapy in conditions other than obesity.
Naltrexone is a mu opioid receptor antagonist approved to treat alcohol and opioid dependency. Bupropion is a dopamine-norepinephrine reuptake inhibitor approved to treat depression and to help with smoking cessation. Combining the drugs produces weight loss and metabolic benefits through effects on 2 areas of the brain that regulate food intake: the hypothalamus (appetite) and the mesolimbic dopamine circuit (reward system).
Dosage. Naltrexone-bupropion comes as an extended-release tablet of 8/90 mg. The maintenance dose of 2 tablets twice daily is reached at week 4 through a specific dose-titration regimen (Table 1). The dose should be adjusted if patients have renal or hepatic impairment or if they are also taking a CYP2B6 inhibitor.
Efficacy. FDA approval was based on the results of 4 clinical trials.39–42 Using a modified intention-to-treat analysis, Yanovski and Yanovski43 calculated that at 1 year, placebo-subtracted mean weight loss was 4.6% (4.9 kg), and mean total weight loss was 6.8% (7.3 kg) across the studies. Attrition rates, however, were high, ranging from 42% to 50%.
Cardiometabolic effects in 2 of the trials40,41 included decreased waist circumference, triglyceride levels, and C-reactive protein levels, and increased high-density lipoprotein levels at the initial dose. At the maintenance dose, additional lowering of fasting plasma insulin and glucose levels occurred along with lower levels of the homeostatic model assessment of insulin resistance. In the COR-Diabetes Study Group trial, patients with type 2 diabetes mellitus had decreased hemoglobin A1c levels without an increase in hypoglycemia and an increased likelihood of reaching the target hemoglobin A1c level below 7%.39
Contraindications. Naltrexone-bupropion is contraindicated for patients who have uncontrolled hypertension, seizure disorder, eating disorder, or end-stage renal failure; who are pregnant; or who have been treated with a monoamine oxidase inhibitor within 14 days. It should not be used with other bupropion-containing products or in patients who have taken opioids chronically or have acute opiate withdrawal.
Because of its bupropion component, this product carries an FDA black-box warning about possible suicidal thoughts and behaviors and neuropsychiatric reactions.
Adverse effects. The adverse reactions most commonly associated with naltrexone-bupropion were nausea (32.5%), constipation (19.2%), headache (17.6%), vomiting (10.7%), dizziness (9.9%), insomnia (9.2%), dry mouth (8.1%), and diarrhea (7.1%).44
Liraglutide
Liraglutide, previously FDA-approved to treat type 2 diabetes mellitus under the brand name Victoza, received approval in 2014 in a higher-dose formulation (Saxenda) to treat obesity.
Liraglutide is a glucagon-like peptide-1 receptor agonist that stimulates glucose-dependent insulin release from the pancreatic islet cells, slows gastric emptying, regulates postprandial glucagon, and reduces food intake.
Dosage. Liraglutide is given as a once-daily injection in the abdomen, thigh, or arm. The initial dosage is 0.6 mg daily for the first week and can be titrated up by 0.6 mg weekly to a target dose of 3 mg daily. If a patient does not lose 4% of baseline body weight after 16 weeks on the target dose, the drug should be discontinued because it is unlikely to lead to clinically significant weight loss.
Efficacy. Liraglutide for weight management (3 mg once daily) was evaluated in a large (N = 3,731), randomized, double-blind, placebo-controlled international trial.45 Participants did not have diabetes mellitus, but 60% had prediabetes. Liraglutide or placebo was given for 56 weeks, along with lifestyle counseling. At the end of the study, the liraglutide group had lost a mean of 8.4 kg vs 2.8 kg in the placebo group. Additionally, 63% of the liraglutide group lost at least 5% of body weight vs 27% in the placebo group, and 33% lost at least 10% of body weight vs 10% in the placebo group.
A 2-year extension found systolic blood pressure decreased with no change in pulse, and the prevalence of prediabetes and metabolic syndrome decreased by 52% and 59%, respectively.46 At 2 years, mean scores for physical function, self-esteem, and work had improved more in the liraglutide group than the placebo group.47
Adverse effects. The most common adverse reactions with liraglutide were nausea, vomiting, diarrhea, constipation, hypoglycemia, and loss of appetite. In most cases, nausea and vomiting were tolerable, transient, and associated with greater weight loss but not with decreased quality-of-life scores. Serious adverse reactions included pancreatitis, gallbladder disease, renal impairment, and suicidal thoughts.
CHOOSING A DRUG
For obese patients, when lifestyle modifications do not result in the desired weight loss, pharmacotherapy is an option. Practitioners have several FDA-approved options for weight management. Because of evidence that these drugs can postpone the onset of other complications and improve metabolic and cardiovascular parameters, they should be considered.
In phase 3 trials, these drugs caused modest weight loss of 5% to 10% of body weight. More weight was lost with the combination of phentermine-topiramate than with the other drugs.
In a 2016 meta-analysis, these drugs were associated with at least 5% weight reduction compared with placebo.48 Phentermine-topiramate and liraglutide were most likely to produce at least a 5% weight loss, while liraglutide and naltrexone-bupropion were most likely to be discontinued because of adverse events. Combination drugs may have the advantages of synergistic effects on weight loss and fewer adverse reactions because lower doses of the individual drug components are used.
Response to therapy with most of these drugs should be evaluated at 12 weeks on the maintenance dose. If less than 5% weight loss has been achieved, the medication should be discontinued.
Adverse-effect profiles, drug interactions, abuse, misuse, and overdose potential should be considered when prescribing these drugs. Weight-loss drugs are contraindicated in pregnancy because they offer no potential benefit to a pregnant woman and may harm the fetus.
The development of new drugs and better drug combinations is expected to provide more effective therapeutic strategies, which are essential for combating the obesity epidemic.
- Ogden CL, Carroll MD, Fryar CD, Flegal KM. Prevalence of obesity among adults and youth: United States, 2011-2014. NCHS Data Brief 2015; 219:1–8.
- Yanovski SZ, Yanovski JA. Obesity. N Engl J Med 2002; 346:591–602.
- Finkelstein EA, Khavjou OA, Thompson H, et al. Obesity and severe obesity forecasts through 2030. Am J Prev Med 2012; 42:563–570.
- Hill JO, Wyatt H. Outpatient management of obesity: a primary care perspective. Obes Res 2002; 10(suppl 2):124S–130S.
- US Department of Health and Human Services. National Institute of Diabetes and Digestive and Kidney Diseases. Overweight and obesity statistics. www.niddk.nih.gov/health-information/health-statistics/Pages/overweight-obesity-statistics.aspx#overweight. Accessed October 10, 2017.
- Jensen MD, Ryan DH, Apovian CM, et al; American College of Cardiology/American Heart Association Task Force on Practice Guidelines; Obesity Society. 2013 AHA/ACC/TOS guideline for the management of overweight and obesity in adults: a report of the American College of Cardiology/American Heart Association Task Force on Practice Guidelines and the Obesity Society. J Am Coll Cardiol 2014; 63:2985–3023.
- Jensen MD, Ryan DH, Apovian CM, et al; American College of Cardiology/American Heart Association Task Force on Practice Guidelines; Obesity Society. 2013 AHA/ACC/TOS guideline for the management of overweight and obesity in adults: a report of the American College of Cardiology/American Heart Association Task Force on Practice Guidelines and the Obesity Society. Circulation 2014; 129(suppl 2):S102–S138.
- American Association of Clinical Endocrinologists. AACE/ACE algorithm for the medical care of patients with obesity. www.aace.com/files/guidelines/ObesityAlgorithm.pdf. Accessed July 25, 2017.
- Wadden TA, Berkowitz RI, Womble LG, et al. Randomized trial of lifestyle modification and pharmacotherapy for obesity. N Engl J Med 2005; 353:2111–2120.
- Mechanick JI, Youdim A, Jones DB, et al. Clinical practice guidelines for the perioperative nutritional, metabolic, and nonsurgical support of the bariatric surgery patient, 2013 update: cosponsored by American Association of Clinical Endocrinologists, the Obesity Society, and American Society for Metabolic and Bariatric Surgery. Surg Obes Relat Dis 2013; 9:159–191.
- Connolly HM, Crary JL, McGoon MD, et al. Valvular heart disease associated with fenfluramine-phentermine. N Engl J Med 1997; 337:581–588.
- Kim SH, Lee YM, Jee SH, et al. Effect of sibutramine on weight loss and blood pressure: a meta-analysis of controlled trials. Obes Res 2003; 11:1116–1123.
- James WP, Caterson ID, Coutinho W, et al; SCOUT Investigators. Effect of sibutramine on cardiovascular outcomes in overweight and obese subjects. N Engl J Med 2010; 363:905–917.
- Nissen SE, Nicholls SJ, Wolski K, et al; STRADIVARIUS Investigators. Effect of rimonabant on progression of atherosclerosis in patients with abdominal obesity and coronary artery disease: the STRADIVARIUS randomized controlled trial. JAMA 2008; 299:1547–1560.
- Ryan DH, Bray GA. Pharmacologic treatment options for obesity: what is old is new again. Curr Hypertens Rep 2013; 15:182–189.
- Hendricks EJ, Greenway FL, Westman EC, Gupta AK. Blood pressure and heart rate effects, weight loss and maintenance during long-term phentermine pharmacotherapy for obesity. Obesity (Silver Spring) 2011; 19:2351–2360.
- Li Z, Maglione M, Tu W, et al. Meta-analysis: pharmacologic treatment of obesity. Ann Intern Med 2005; 142:532–546.
- Munro JF, MacCuish AC, Wilson EM, Duncan LJ. Comparison of continuous and intermittent anorectic therapy in obesity. Br Med J 1968; 1:352–354.
- Hauptman J, Lucas C, Boldrin MN, Collins H, Segal KR. Orlistat in the long-term treatment of obesity in primary care settings. Arch Fam Med 2000; 9:160–167.
- Rossner S, Sjostrom L, Noack R, Meinders AE, Noseda G. Weight loss, weight maintenance, and improved cardiovascular risk factors after 2 years treatment with orlistat for obesity. European Orlistat Obesity Study Group. Obes Res 2000; 8:49–61.
- Yanovski SZ, Yanovski JA. Long-term drug treatment for obesity: a systematic and clinical review. JAMA 2014; 311:74–86.
- Torgerson JS, Hauptman J, Boldrin MN, Sjostrom L. XENical in the prevention of diabetes in obese subjects (XENDOS) study: a randomized study of orlistat as an adjunct to lifestyle changes for the prevention of type 2 diabetes in obese patients. Diabetes Care 2004; 27:155–161.
- Padwal R, Kezouh A, Levine M, Etminan M. Long-term persistence with orlistat and sibutramine in a population-based cohort. Int J Obes (Lond) 2007; 31:1567–1570.
- Xiong GL, Gadde KM. Combination phentermine-topiramate for obesity treatment in primary care: a review. Postgrad Med 2014; 126:110–116.
- Pucci A, Finer N. New medications for treatment of obesity: metabolic and cardiovascular effects. Can J Cardiol 2015; 31:142–152.
- Smith SM, Meyer M, Trinkley KE. Phentermine-topiramate for the treatment of obesity. Ann Pharmacother 2013; 47:340–349.
- Allison DB, Gadde KM, Garvey WT, et al. Controlled-release phentermine-topiramate in severely obese adults: a randomized controlled trial (EQUIP). Obesity (Silver Spring) 2012; 20:330–342.
- Gadde KM, Allison DB, Ryan DH, et al. Effects of low-dose, controlled-release, phentermine plus topiramate combination on weight and associated comorbidities in overweight and obese adults (CONQUER): a randomised, placebo-controlled, phase 3 trial. Lancet 2011; 377:1341–1352.
- Garvey WT, Ryan DH, Look M, et al. Two-year sustained weight loss and metabolic benefits with controlled-release phentermine-topiramate in obese and overweight adults (SEQUEL): a randomized, placebo-controlled, phase 3 extension study. Am J Clin Nutr 2012; 95:297–308.
- Richa S, Yazbek JC. Ocular adverse effects of common psychotropic agents: a review. CNS Drugs 2010; 24:501–526.
- Weissman NJ, Sanchez M, Koch GG, Smith SR, Shanahan WR, Anderson CM. Echocardiographic assessment of cardiac valvular regurgitation with lorcaserin from analysis of 3 phase 3 clinical trials. Circ Cardiovasc Imaging 2013; 6:560–567.
- US Department of Justice Drug Enforcement Administration. Schedules of controlled substances: placement of lorcaserin into Schedule IV. Federal Register 2013; 78:26701–26705.
- Smith SR, Weissman NJ, Anderson CM, et al; Behavioral Modification and Lorcaserin for Overweight and Obesity Management (BLOOM) Study Group. Multicenter, placebo-controlled trial of lorcaserin for weight management. N Engl J Med 2010; 363:245–256.
- Fidler MC, Sanchez M, Raether B, et al; BLOSSOM Clinical Trial Group. A one-year randomized trial of lorcaserin for weight loss in obese and overweight adults: the BLOSSOM trial. J Clin Endocrinol Metab 2011; 96:3067–3077.
- O’Neil PM, Smith SR, Weissman NJ, et al. Randomized placebo-controlled clinical trial of lorcaserin for weight loss in type 2 diabetes mellitus: the BLOOM-DM study. Obesity (Silver Spring) 2012; 20:1426–1436.
- Kumar RB, Aronne LJ. Efficacy comparison of medications approved for chronic weight management. Obesity (Silver Spring) 2015; 23(suppl 1):S4–S7.
- Chan EW, He Y, Chui CS, Wong AY, Lau WC, Wong IC. Efficacy and safety of lorcaserin in obese adults: a meta-analysis of 1-year randomized controlled trials (RCTs) and narrative review on short-term RCTs. Obes Rev 2013; 14:383–392.
- Miller LE. Lorcaserin for weight loss: insights into US Food and Drug Administration approval. J Acad Nutr Diet 2013; 113:25–30.
- Hollander P, Gupta AK, Plodkowski R, et al; COR-Diabetes Study Group. Effects of naltrexone sustained-release/bupropion sustained-release combination therapy on body weight and glycemic parameters in overweight and obese patients with type 2 diabetes. Diabetes Care 2013; 36:4022–4029.
- Apovian CM, Aronne L, Rubino D, et al; COR-II Study Group. A randomized, phase 3 trial of naltrexone SR/bupropion SR on weight and obesity-related risk factors (COR-II). Obesity (Silver Spring) 2013; 21:935–943.
- Greenway FL, Fujioka K, Plodkowski RA, et al; COR-I Study Group. Effect of naltrexone plus bupropion on weight loss in overweight and obese adults (COR-I): a multicentre, randomised, double-blind, placebo-controlled, phase 3 trial. Lancet 2010; 376:595–605.
- Wadden TA, Foreyt JP, Foster GD, et al. Weight loss with naltrexone SR/bupropion SR combination therapy as an adjunct to behavior modification: the COR-BMOD trial. Obesity (Silver Spring) 2011; 19:110–120.
- Yanovski SZ, Yanovski JA. Naltrexone extended-release plus bupropion extended-release for treatment of obesity. JAMA 2015; 313:1213–1214.
- Contrave (naltrexone HC1 and bupropion HC1) extended release tablets [package insert]. Orexigen Therapeutics, 2017. https://contrave.com/wp-content/uploads/2017/05/Contrave_PI.pdf. Accessed November 7, 2017.
- Pi-Sunyer X, Astrup A, Fujioka K, et al; SCALE Obesity and Prediabetes NN8022-1839 Study Group. A randomized, controlled trial of 3.0 mg of liraglutide in weight management. N Engl J Med 2015; 373:11–22.
- Astrup A, Carraro R, Finer N, et al; NN8022-1807 Investigators. Safety, tolerability and sustained weight loss over 2 years with the once-daily human GLP-1 analog, liraglutide. Int J Obes (Lond) 2012; 36:843–854.
- Lean ME, Carraro R, Finer N, et al; NN8022-1807 Investigators. Tolerability of nausea and vomiting and associations with weight loss in a randomized trial of liraglutide in obese, non-diabetic adults. Int J Obes (Lond) 2014; 38:689–697.
- Khera R, Murad MH, Chandar AK, et al. Association of pharmacological treatments for obesity with weight loss and adverse events: a systematic review and meta-analysis. JAMA 2016; 315:2424–2434.
KEY POINTS
- Weight-loss drugs should only be used in combination with lifestyle modification.
- Preparations that combine 2 drugs have greater weight-loss benefits and better side-effect profiles.
- Weight-loss drugs should be discontinued if substantial (5%) weight loss has not occurred by 12 weeks.
- All weight-loss drugs are contraindicated in pregnancy.

Drug reaction or metastatic lung cancer?
A 76-year-old man with ulcerative colitis presented with a 1-week history of low-grade fever and progressive dyspnea. He was taking infliximab for the ulcerative colitis. He was known to be negative for human immunodeficiency virus.
. The left lung appeared normal (B).")

Since the M tuberculosis cultured from his lung proved to be sensitive to the antituberculosis drugs, we suspected that the nodules were a paradoxical reaction to the drug therapy, and thus we continued the treatment because of the continued low-grade fever. After 9 months of therapy, the fever had resolved and the nodules had disappeared, confirming our suspicion of a paradoxical reaction. The number of lymphocytes gradually increased during drug therapy.
Paradoxical reaction during tuberculosis treatment is defined as a worsening of pre-existing lesions or as the emergence of new lesions during appropriate therapy.1,2 The diagnosis is sometimes difficult, since new lesions can resemble other lung diseases. However, a paradoxical reaction involving randomly distributed nodules is rare and radiographically resembles metastatic lung cancer. Clinicians should be aware of this type of reaction in patients on tuberculosis therapy.
- Cheng SL, Wang HC, Yang PC. Paradoxical response during anti-tuberculosis treatment in HIV-negative patients with pulmonary tuberculosis. Int J Tuberc Lung Dis 2007; 11:1290–1295.
- Narita M, Ashkin D, Hollender ES, Pitchenik AE. Paradoxical worsening of tuberculosis following antiretroviral therapy in patients with AIDS. Am J Respir Crit Care Med 1998; 158:157–161.
A 76-year-old man with ulcerative colitis presented with a 1-week history of low-grade fever and progressive dyspnea. He was taking infliximab for the ulcerative colitis. He was known to be negative for human immunodeficiency virus.
Since the M tuberculosis cultured from his lung proved to be sensitive to the antituberculosis drugs, we suspected that the nodules were a paradoxical reaction to the drug therapy, and thus we continued the treatment because of the continued low-grade fever. After 9 months of therapy, the fever had resolved and the nodules had disappeared, confirming our suspicion of a paradoxical reaction. The number of lymphocytes gradually increased during drug therapy.
Paradoxical reaction during tuberculosis treatment is defined as a worsening of pre-existing lesions or as the emergence of new lesions during appropriate therapy.1,2 The diagnosis is sometimes difficult, since new lesions can resemble other lung diseases. However, a paradoxical reaction involving randomly distributed nodules is rare and radiographically resembles metastatic lung cancer. Clinicians should be aware of this type of reaction in patients on tuberculosis therapy.
- Cheng SL, Wang HC, Yang PC. Paradoxical response during anti-tuberculosis treatment in HIV-negative patients with pulmonary tuberculosis. Int J Tuberc Lung Dis 2007; 11:1290–1295.
- Narita M, Ashkin D, Hollender ES, Pitchenik AE. Paradoxical worsening of tuberculosis following antiretroviral therapy in patients with AIDS. Am J Respir Crit Care Med 1998; 158:157–161.
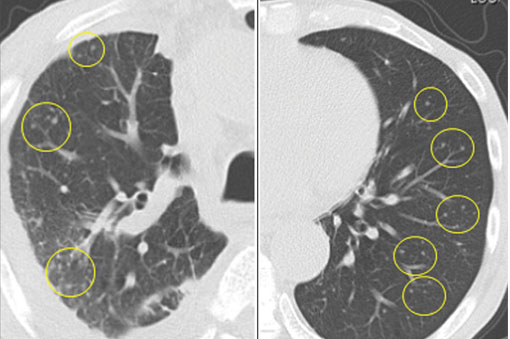
2017 Update in perioperative medicine: 6 questions answered
Perioperative care is increasingly complex, and the rapid evolution of literature in this field makes it a challenge for clinicians to stay up-to-date. To help meet this challenge, we used a systematic approach to identify appropriate articles in the medical literature and then, by consensus, to develop a list of 6 clinical questions based on their novelty and potential to change perioperative medical practice:
- How should we screen for cardiac risk in patients undergoing noncardiac surgery?
- What is the appropriate timing for surgery after coronary intervention?
- Can we use statin therapy to reduce perioperative cardiac risk?
- How should we manage sleep apnea risk perioperatively?
- Which patients with atrial fibrillation should receive perioperative bridging anticoagulation?
- Is frailty screening beneficial for elderly patients before noncardiac surgery?
The summaries in this article are a composite of perioperative medicine updates presented at the Perioperative Medicine Summit and the annual meetings of the Society for General Internal Medicine and the Society of Hospital Medicine. “Perioperative care is complex and changing”1–10 (page 864) offers a brief overview.
HOW TO SCREEN FOR CARDIAC RISK BEFORE NONCARDIAC SURGERY
Perioperative cardiac risk can be estimated by clinical risk indexes (based on history, physical examination, common blood tests, and electrocardiography), cardiac biomarkers (natriuretic peptide or troponin levels), and noninvasive cardiac tests.

American and European guidelines
In 2014, the American College of Cardiology/American Heart Association2 and the European Society of Cardiology11 published guidelines on perioperative cardiovascular evaluation and management. They recommended several tools to calculate the risk of postoperative cardiac complications but did not specify a preference. These tools include:
- The Revised Cardiac Risk Index (RCRI)12 (www.mdcalc.com/revised-cardiac-risk-index-pre-operative-risk), which has been externally validated in multiple studies and is the most widely used
- The American College of Surgeons surgical risk calculator13 (www.riskcalculator.facs.org), derived from the National Surgery Quality Improvement Program (NSQIP) database
- The myocardial infarction or cardiac arrest (MICA) calculator14 (www.surgicalriskcalculator.com/miorcardiacarrest), also derived from the NSQIP database.
2017 Canadian guidelines differ
In 2017, the Canadian Cardiovascular Society published its own guidelines on perioperative risk assessment and management.1 These differ from the American and European guidelines on several points.
RCRI recommended. The Canadian guidelines suggested using the RCRI over the other risk predictors, which despite superior discrimination lacked external validation (conditional recommendation; low-quality evidence). Additionally, the Canadians believed that the NSQIP risk indexes underestimated cardiac risk because patients did not undergo routine biomarker screening.

Biomarker measurement. The Canadian guidelines went a step further in their algorithm (Figure 1) and recommended measuring N-terminal-pro B-type natriuretic peptide (NT-proBNP) or BNP preoperatively to improve risk prediction in 3 groups (strong recommendation; moderate-quality evidence):
- Patients ages 65 and older
- Patients ages 45 to 64 with significant cardiovascular disease
- Patients with an RCRI score of 1 or more.
This differs from the American guidelines, which did not recommend measuring preoperative biomarkers but did acknowledge that they may provide incremental value. The American College of Cardiology/American Heart Association authors felt that there were no data to suggest that targeting these biomarkers for treatment and intervention would reduce postoperative risk. The European guidelines did not recommend routinely using biomarkers, but stated that they may be considered in high-risk patients (who have a functional capacity ≤ 4 metabolic equivalents or an RCRI score > 1 undergoing vascular surgery, or > 2 undergoing nonvascular surgery).
Stress testing deemphasized. The Canadian guidelines recommended biomarker testing rather than noninvasive tests to enhance risk assessment based on cost, potential delays in surgery, and absence of evidence of an overall absolute net improvement in risk reclassification. This contrasts with the American and European guidelines and algorithms, which recommended pharmacologic stress testing in patients at elevated risk with poor functional capacity undergoing intermediate- to high-risk surgery if the results would change how they are managed.
Postoperative monitoring. The Canadian guidelines recommended that if patients have an NT-proBNP level higher than 300 mg/L or a BNP level higher than 92 mg/L, they should receive postoperative monitoring with electrocardiography in the postanesthesia care unit and daily troponin measurements for 48 to 72 hours. The American guidelines recommended postoperative electrocardiography and troponin measurement only for patients suspected of having myocardial ischemia, and the European guidelines said postoperative biomarkers may be considered in patients at high risk.
Physician judgment needed
While guidelines and risk calculators are potentially helpful in risk assessment, the lack of consensus and the conflicting recommendations force the physician to weigh the evidence and make individual decisions based on his or her interpretation of the data.
Until there are studies directly comparing the various risk calculators, physicians will most likely use the RCRI, which is simple and has been externally validated, in conjunction with the American guidelines.
At this time, it is unclear how biomarkers should be used—preoperatively, postoperatively, or both—because there are no studies demonstrating that management strategies based on the results lead to better outcomes. We do not believe that biomarker testing will be accepted in lieu of stress testing by our surgery, anesthesiology, or cardiology colleagues, but going forward, it will probably be used more frequently postoperatively, particularly in patients at moderate to high risk.
WHAT IS THE APPROPRIATE TIMING FOR SURGERY AFTER PCI?
A 2014 American College of Cardiology/American Heart Association guideline recommended delaying noncardiac surgery for 1 month after percutaneous coronary intervention (PCI) with bare-metal stents and 1 year after PCI with drug-eluting stents.15 The guideline suggested that surgery may be performed 6 months after drug-eluting stent placement if the risks of delaying surgery outweigh the risk of thrombosis.15
The primary rationale behind these timeframes was to provide dual antiplatelet therapy for a minimally acceptable duration before temporary interruption for a procedure. These recommendations were influenced largely by observational studies of first-generation devices, which are no longer used. Studies of newer-generation stents have suggested that the risk of stent thrombosis reaches a plateau considerably earlier than 6 to 12 months after PCI.
2016 Revised guideline on dual antiplatelet therapy

Although not separately delineated in the recommendations, risk factors for stent thrombosis that should influence the decision include smoking, multivessel coronary artery disease, and suboptimally controlled diabetes mellitus or hyperlipidemia.17 The presence of such stent thrombosis risk factors should be factored into the decision about proceeding with surgery within 3 to 6 months after drug-eluting stent placement.
Holcomb et al: Higher postoperative risk after PCI for myocardial infarction
Another important consideration is the indication for which PCI was performed. In a recent study, Holcomb et al16 found an association between postoperative major adverse cardiac events and PCI for myocardial infarction (MI) that was independent of stent type.
Compared with patients who underwent PCI not associated with acute coronary syndrome, the odds ratios and 95% confidence intervals (CIs) for major adverse cardiac events in those who underwent PCI for MI were:
- 5.25 (4.08–6.75) in the first 3 months
- 2.45 (1.80–3.35) in months 3 to 6
- 2.50 (1.90–3.28) in months 6 to 12.
In absolute terms, patients with stenting performed for an MI had an incidence of major adverse cardiac events of:
- 22.2% in the first 3 months
- 9.4% in months 3 to 6
- 5.8% in months 6 to 12
- 4.4% in months 12 to 24.
The perioperative risks were reduced after 12 months but still remained greater in patients whose PCI was performed for MI rather than another indication.16
The authors of this study suggested delaying noncardiac surgery for up to 6 months after PCI for MI, regardless of stent type.16
A careful, individualized approach
Optimal timing of noncardiac surgery PCI requires a careful, individualized approach and should always be coordinated with the patient’s cardiologist, surgeon, and anesthesiologist.3,15 For most patients, surgery should be delayed for 30 days after bare-metal stent placement and 6 months after drug-eluting stent placement.3 However, for those with greater surgical need and less thrombotic risk, noncardiac surgery can be considered 3 to 6 months after drug-eluting stent placement.3
Additional discussion of the prolonged increased risk of postoperative major adverse cardiac events is warranted in patients whose PCI was performed for MI, in whom delaying noncardiac surgery for up to 6 months (irrespective of stent type) should be considered.16
CAN WE USE STATINS TO REDUCE PERIOPERATIVE RISK?
Current recommendations from the American College of Cardiology/American Heart Association support continuing statins in the perioperative period, but the evidence supporting starting statins in this period has yet to be fully determined. In 2013, a Cochrane review18 found insufficient evidence to conclude that statins reduced perioperative adverse cardiac events, though several large studies were excluded due to controversial methods and data.
In contrast, the Vascular Events in Noncardiac Surgery Patients Cohort Evaluation (VISION) study,4 a multicenter, prospective, cohort-matched study of approximately 7,200 patients, found a lower risk of a composite primary outcome of all-cause mortality, myocardial injury after noncardiac surgery, or stroke at 30 days for patients exposed to statin therapy (relative risk [RR] 0.83, 95% CI 0.73–0.95, P = .007).4
London et al retrospective study: 30-day mortality rate is lower with statins
In 2017, London et al5 published the results of a very large retrospective, observational cohort study of approximately 96,000 elective or emergency surgery patients in Department of Veterans Affairs hospitals. The patients were propensity-matched and evaluated for exposure to statins on the day of or the day after surgery, for a total of approximately 48,000 pairs.
The primary outcome was death at 30 days, and statin exposure was associated with a significant reduction (RR 0.82; 95% CI 0.75–0.89; P < .001). Significant risk reductions were demonstrated in nearly all secondary end points as well, except for stroke or coma and thrombosis (pulmonary embolism, deep vein thrombosis, or graft failure). Overall, the number needed to treat to prevent any complication was 67. Statin therapy did not show significant harm, though on subgroup analysis, those who received high-intensity statin therapy had a slightly higher risk of renal injury (odds ratio 1.18, 95% CI 1.02–1.37, P = .03). Also on subgroup analysis, after propensity matching, patients on long-term moderate- or high-intensity statin therapy for 6 to 12 months before surgery had a small risk reduction for many of the outcomes, including death.
The authors also noted that only 62% of the patients who were prescribed statins as outpatients received them in the hospital, which suggests that improvement is necessary in educating perioperative physicians about the benefits and widespread support for continuing statins perioperatively.5
LOAD trial: No benefit from starting statins
Both London et al5 and the VISION investigators4 called for a large randomized controlled trial of perioperative statin initiation. The Lowering the Risk of Operative Complications Using Atorvastatin Loading Dose (LOAD) trial attempted to answer this call.6
This trial randomized 648 statin-naïve Brazilian patients at high risk of perioperative cardiac events to receive either atorvastatin or placebo before surgery and then continuously for another 7 days. The primary outcomes were the rates of death, nonfatal myocardial injury after noncardiac surgery, and cerebrovascular accident at 30 days.6
The investigators found no significant difference in outcomes between the two groups and estimated that the sample size would need to be approximately 7,000 patients to demonstrate a significant benefit. Nonetheless, this trial established that a prospective perioperative statin trial is feasible.
When to continue or start statins
Although we cannot recommend starting statins for all perioperative patients, perioperative statins clearly can carry significant benefit and should be continued in all patients who have been taking them. It is also likely beneficial to initiate statins in those patients who would otherwise warrant therapy based on the American College of Cardiology/American Heart Association Pooled Cohort Equations Risk calculator.19
HOW SHOULD WE MANAGE SLEEP APNEA RISK PERIOPERATIVELY?
From 20% to 30% of US men and 10% to 15% of US women have obstructive sleep apnea, and many are undiagnosed. Obstructive sleep apnea increases the risk of perioperative respiratory failure, unplanned reintubation, unplanned transfer to the intensive care unit, and death.20 Sentinel events (unexpected respiratory arrest after surgery on general surgical wards) have prompted the development of guidelines that aim to identify patients with previously undiagnosed obstructive sleep apnea before surgery and to develop approaches to reduce perioperative morbidity and mortality.
Kaw et al: Beware obesity hypoventilation syndrome
A 2016 study suggested that patients with obstructive sleep apnea and obesity hypoventilation syndrome may be at particularly high risk of perioperative complications.21
Kaw et al21 queried a database of patients with obstructive sleep apnea undergoing elective noncardiac surgery at Cleveland Clinic. All patients (N = 519) had obstructive sleep apnea confirmed by polysomnography, and a body mass index greater than 30 kg/m2. The authors considered a patient to have obesity hypoventilation syndrome (n = 194) if he or she also had hypercapnia (Paco2 ≥ 45 mm Hg) on at least 2 occasions before or after surgery.
In an adjusted analysis, the odds ratios and 95% CIs for adverse outcomes in patients with obesity hypoventilation syndrome were:
- 10.9 (3.7–32.3) for respiratory failure
- 5.4 (1.9–15.7) for heart failure
- 10.9 (3.7–32.3) for intensive care unit transfer.
The absolute increases in risk in the presence of obesity hypoventilation syndrome were:
- 19% (21% vs 2%) for respiratory failure
- 8% (8% vs 0) for heart failure
- 15% (21% vs 6%) for intensive care unit transfer.
There was no difference in rates of perioperative mortality.21

The authors proposed an algorithm to identify patients with possible obesity hypoventilation syndrome before surgery that included prior sleep study results, STOP-BANG score (Table 2),22 and serum bicarbonate level.
Important limitations of the study were that most patients with obesity hypoventilation syndrome were undiagnosed at the time of surgery. Still, the study does offer a tool to potentially identify patients at high risk for perioperative morbidity due to obesity hypoventilation syndrome. Clinicians could then choose to cancel nonessential surgery, propose a lower-risk alternative procedure, or maximize the use of strategies known to reduce perioperative risk for patients with obstructive sleep apnea in general.
Two guidelines on obstructive sleep apnea
Two professional societies have issued guidelines aiming to improve detection of previously undiagnosed obstructive sleep apnea and perioperative outcomes in patients known to have it or suspected of having it:
- The American Society of Anesthesiologists in 201423
- The Society of Anesthesia and Sleep Medicine in 2016.7
Both guidelines recommend that each institution develop a local protocol to screen patients for possible obstructive sleep apnea before elective surgery. The American Society of Anesthesiologists does not recommend any particular tool, but does recommend taking a history and performing a focused examination that includes evaluation of the airway, nasopharyngeal characteristics, neck circumference, and tonsil and tongue size. The Society of Anesthesia and Sleep Medicine recommends using a validated tool such as the STOP-BANG score to estimate the risk of obstructive sleep apnea.
If this screening suggests that a patient has obstructive sleep apnea, should surgery be delayed until a formal sleep study can be done? Or should the patient be treated empirically as if he or she has obstructive sleep apnea? Both professional societies recommend shared decision-making with the patient in this situation, with the Society of Anesthesia and Sleep Medicine recommending additional cardiopulmonary evaluation for patients with hypoventilation, severe pulmonary hypertension, or resting hypoxemia.
Both recommend using continuous positive airway pressure (CPAP) after surgery in patients with known obstructive sleep apnea, although there is not enough evidence to determine if empiric CPAP for screening-positive patients (without polysomnography-diagnosed obstructive sleep apnea) is beneficial. The Society of Anesthesia and Sleep Medicine advises that it is safe to proceed to surgery if obstructive sleep apnea is suspected as long as monitoring and risk-reduction strategies are implemented after surgery to reduce complication rates.
During surgery, the American Society of Anesthesiologists advises peripheral nerve blocks when appropriate, general anesthesia with a secure airway rather than deep sedation, capnography when using moderate sedation, awake extubation, and full reversal of neuromuscular blockade before extubation. After surgery, they recommend reducing opioid use, minimizing postoperative sedatives, supplemental oxygen, and continuous pulse oximetry. The Society of Anesthesia and Sleep Medicine guideline addresses preoperative assessment and therefore makes no recommendations regarding postoperative care.
In conclusion, use of pertinent findings from the history and physical examination and a validated obstructive sleep apnea screening tool such as STOP-BANG before surgery are recommended, with joint decision-making as to proceeding with surgery with empiric CPAP vs a formal sleep study for patients who screen as high risk. The Society of Anesthesia and Sleep Medicine recommends further cardiopulmonary evaluation if there is evidence of hypoventilation, hypoxemia, or pulmonary hypertension in addition to likely obstructive sleep apnea.
WHICH ATRIAL FIBRILLATION PATIENTS NEED BRIDGING ANTICOAGULATION?
When patients receiving anticoagulation need surgery, we need to carefully assess the risks of thromboembolism without anticoagulation vs bleeding with anticoagulation.
Historically, we tended to worry more about thromboembolism24; however, recent studies have revealed a significant risk of bleeding when long-term anticoagulant therapy is bridged (ie, interrupted and replaced with a shorter-acting agent in the perioperative period), with minimal to no decrease in thromboembolic events.25–27
American College of Cardiology guideline
In 2017, the American College of Cardiology8 published a guideline on periprocedural management of anticoagulation in patients with nonvalvular atrial fibrillation. The guideline includes a series of decision algorithms on whether and when to interrupt anticoagulation, whether and how to provide bridging anticoagulation, and how to restart postprocedural anticoagulation.
When deciding whether to interrupt anticoagulation, we need to consider the risk of bleeding posed both by patient-specific factors and by the type of surgery. Bridging anticoagulation is not indicated when direct oral anticoagulants (eg, dabigatran, apixaban, edoxaban, rivaroxaban) are interrupted for procedures.
Unlike an earlier guideline statement by the American College of Chest Physicians,24 this consensus statement emphasizes using the CHA2DS2-VASc score as a predictor of thromboembolic events rather than the CHADS2 core.

Table 3 summarizes the key points in the guidance statement about which patients should receive periprocedural bridging anticoagulation.
As evidence continues to evolve in this complicated area of perioperative medicine, it will remain important to continue to create patient management plans that take individual patient and procedural risks into account.
IS FRAILTY SCREENING BENEFICIAL BEFORE NONCARDIAC SURGERY?
Frailty, defined as a composite score of a patient’s age and comorbidities, has great potential to become an obligatory factor in perioperative risk assessment. However, it remains difficult to incorporate frailty scoring into clinical practice due to variations among scoring systems,28 uncertain outcome data, and the imprecise role of socioeconomic factors. In particular, the effect of frailty on perioperative mortality over longer periods of time is uncertain.
McIsaac et al: Higher risk in frail patients
McIsaac and colleagues at the University of Ottawa used a frailty scoring system developed at Johns Hopkins University to evaluate the effect of frailty on all-cause postoperative mortality in approximately 202,000 patients over a 10-year period.9 Although this scoring system is proprietary, it is based on factors such as malnutrition, dementia, impaired vision, decubitus ulcers, urinary incontinence, weight loss, poverty, barriers to access of care, difficulty in walking, and falls.
After adjusting for the procedure risk, patient age, sex, and neighborhood income quintile, the 1-year mortality risk was significantly higher in the frail group (absolute risk 13.6% vs 4.8%; adjusted hazard ratio 2.23; 95% CI 2.08–2.40). The risk of death in the first 3 days was much higher in frail than in nonfrail patients (hazard ratio 35.58; 95% CI 29.78–40.1), but the hazard ratio decreased to approximately 2.4 by day 90.
The authors emphasize that the elevated risk for frail patients warrants particular perioperative planning, though it is not yet clear what frailty-specific interventions should be performed. Further study is needed into the benefit of “prehabilitation” (ie, exercise training to “build up” a patient before surgery) for perioperative risk reduction.
Hall et al: Better care for frail patients
Hall et al10 instituted a quality improvement initiative for perioperative care of patients at the Omaha Veterans Affairs Hospital. Frail patients were identified using the Risk Analysis Index, a 14-question screening tool previously developed and validated over several years using Veterans Administration databases.29 Questions in the Risk Analysis Index cover living situation, any diagnosis of cancer, ability to perform activities of daily living, and others.
To maximize compliance, a Risk Analysis Index score was required to schedule a surgery. Patients with high scores underwent further review by a designated team of physicians who initiated informal and formal consultations with anesthesiologists, critical care physicians, surgeons, and palliative care providers, with the goals of minimizing risk, clarifying patient goals or resuscitation wishes, and developing comprehensive perioperative planning.10
Approximately 9,100 patients were included in the cohort. The authors demonstrated a significant improvement in mortality for frail patients at 30, 180, and 365 days, but noted an improvement in postoperative mortality for the nonfrail patients as well, perhaps due to increased focus on geriatric patient care. In particular, the mortality rate at 365 days dropped from 34.5% to 11.7% for frail patients who underwent this intervention.
While this quality improvement initiative was unable to examine how surgical rates changed in frail patients, it is highly likely that very high-risk patients opted out of surgery or had their surgical plan change, though the authors point out that the overall surgical volume at the institution did not change significantly. As well, it remains unclear which particular interventions may have had the most effect in improving survival, as the perioperative plans were individualized and continually adjusted throughout the study period.
Nonetheless, this article highlights how higher vigilance, individualized planning and appreciation of the high risks of frail patients is associated with improved patient survival postoperatively. Although frailty screening is still in its early stages and further work is needed, it is likely that performing frailty screening in elderly patients and utilizing interdisciplinary collaboration for comprehensive management of frail patients can improve their postoperative course.
- Duceppe E, Parlow J, MacDonald P, et al. Canadian Cardiovascular Society guidelines on perioperative cardiac risk assessment and management for patients who undergo noncardiac surgery. Can J Cardiol 2017; 33:17–32.
- Fleisher LA, Fleischmann KE, Auerbach AD, et al. 2014 ACC/AHA guideline on perioperative cardiovascular evaluation and management of patients undergoing noncardiac surgery: a report of the American College of Cardiology/American Heart Association Task Force on practice guidelines. J Am Coll Cardiol 2014; 64:2373–2405.
- Levine GN, Bates ER, Bittl JA, et al. 2016 ACC/AHA guideline focused update on duration of dual antiplatelet therapy in patients with coronary artery disease. Circulation 2016; 134:e123–e155.
- Berwanger O, Le Manach Y, Suzumura EA, et al. Association between pre-operative statin use and major cardiovascular complications among patients undergoing non-cardiac surgery: the VISION study. Eur Heart J 2016; 37:177–185.
- London MJ, Schwartz GG, Hur K, Henderson WG. Association of perioperative statin use with mortality and morbidity after major noncardiac surgery. JAMA Intern Med 2017; 177:231–242.
- Berwanger O, de Barros E Silva PG, Barbosa RR, et al. Atorvastatin for high-risk statin-naïve patients undergoing noncardiac surgery: the Lowering the Risk of Operative Complications Using Atorvastatin Loading Dose (LOAD) randomized trial. Am Heart J 2017; 184:88–96.
- Chung F, Memtsoudis SG, Ramachandran SK, et al. Society of Anesthesia and Sleep Medicine guidelines on preoperative screening and assessment of adult patients with obstructive sleep apnea. Anesth Analg 2016; 123:452–473.
- Doherty JU, Gluckman TJ, Hucker W, et al. 2017 ACC expert consensus decision pathway for periprocedural management of anticoagulation in patients with nonvalvular atrial fibrillation: a report of the American College of Cardiology Clinical Expert Consensus Document Task Force. J Am Coll Cardiol 2017; 69:871–898.
- McIsaac DI, Bryson GL, van Walraven C. Association of frailty and 1-year postoperative mortality following major elective noncardiac surgery: a population-based cohort study. JAMA Surg 2016; 151:538–545.
- Hall DE, Arya S, Schmid KK, et al. Association of a frailty screening initiative with postoperative survival at 30, 180, and 365 days. JAMA Surg 2017; 152:233–240.
- Kristensen SD, Knuuti J, Saraste A, et al. 2014 ESC/ESA Guidelines on non-cardiac surgery: cardiovascular assessment and management: The Joint Task Force on non-cardiac surgery: cardiovascular assessment and management of the European Society of Cardiology (ESC) and the European Society of Anaesthesiology (ESA). Eur Heart J 2014; 35:2383–2431.
- Lee TH, Marcantonio ER, Mangione CM, et al. Derivation and prospective validation of a simple index for prediction of cardiac risk of major noncardiac surgery. Circulation 1999; 100:1043–1049.
- Bilimoria KY, Liu Y, Paruch JL, Zhou L, Kmiecik TE, Ko CY, Cohen ME. Development and evaluation of the universal ACS NSQIP surgical risk calculator: a decision aid and informed consent tool for patients and surgeons. J Am Coll Surg 2013; 217:833–842.
- Gupta PK, Gupta H, Sundaram A, et al. Development and validation of a risk calculator for prediction of cardiac risk after surgery. Circulation 2011; 124:381–387.
- Fleisher LA, Fleischmann KE, Auerbach AD, et al. 2014 ACC/AHA guideline on perioperative cardiovascular evaluation and management of patients undergoing noncardiac surgery: a report of the American College of Cardiology/American Heart Association Task Force on Practice Guidelines. J Am Coll Cardiol 2014; 64:e77–e137.
- Holcomb CN, Hollis RH, Graham LA, et al. Association of coronary stent indication with postoperative outcomes following noncardiac surgery. JAMA Surg 2016; 151:462–469.
- Lemesle G, Tricot O, Meurice T, et al. Incident myocardial infarction and very late stent thrombosis in outpatients with stable coronary artery disease. J Am Coll Cardiol 2017; 69:2149–2156.
- Sanders RD, Nicholson A, Lewis SR, Smith AF, Alderson P. Perioperative statin therapy for improving outcomes during and after noncardiac vascular surgery. Cochrane Database Syst Rev 2013; 7:CD009971.
- Goff DC, Lloyd-Jones DM, Bennett G, et al. 2013 ACC/AHA guideline on the assessment of cardiovascular risk: a report of the American College of Cardiology/American Heart Association Task Force on Practice Guidelines. J Am Coll Cardiol 2014; 63:2935–2959.
- Kaw R, Pasupuleti V, Walker E, et al. Postoperative complications in patients with obstructive sleep apnea. Chest 2012; 141:436–441.
- Kaw R, Bhateja P, Mar HP, et al. Postoperative complications in patients with unrecognized obesity hypoventilation syndrome undergoing elective noncardiac surgery. Chest 2016; 149:84–91.
- Chung F, Yegneswaran B, Liao P, et al. STOP questionnaire: a tool to screen patients for obstructive sleep apnea. Anesthesiology 2008; 108:812–821.
- Gross JB, Apfelbaum JL, Caplan RA, et al. Practice guidelines for the perioperative management of patients with obstructive sleep apnea: an updated report by the American Society of Anesthesiologists Task Force on Perioperative Management of Patients with Obstructive Sleep Apnea. Anesthesiology 2014; 120:268–286.
- Douketis JD, Spyropoulos AC, Spencer FA, et al. Perioperative management of antithrombotic therapy: Antithrombotic Therapy and Prevention of Thrombosis, 9th ed: American College of Chest Physicians Evidence-Based Clinical Practice Guidelines. Chest 2012; 141(2 suppl):e326S–e350S.
- Siegal D, Yudin J, Kaatz S, Douketis JD, Lim W, Spyropoulos AC. Periprocedural heparin bridging in patients receiving vitamin K antagonists: systematic review and meta-analysis of bleeding and thromboembolic rates. Circulation 2012; 126:1630–1639.
- Clark NP, Witt DM, Davies LE, et al. Bleeding, recurrent venous thromboembolism, and mortality risks during warfarin interruption for invasive procedures. JAMA Intern Med 2015; 175:1163–1168.
- Douketis JD, Spyropoulos AC, Kaatz S, et al. Perioperative bridging anticoagulation in patients with atrial fibrillation. N Engl J Med 2015; 373:823–833.
- Theou O, Brothers TD, Mitnitski A, Rockwood K. Operationalization of frailty using eight commonly used scales and comparison of their ability to predict all-cause mortality. J Am Geriatr Soc 2013; 61:1537–1551.
- Hall DE, Arya S, Schmid KK, et al. Development and initial validation of the risk analysis index for measuring frailty in surgical populations. JAMA Surg 2017; 152:175–182.
Perioperative care is increasingly complex, and the rapid evolution of literature in this field makes it a challenge for clinicians to stay up-to-date. To help meet this challenge, we used a systematic approach to identify appropriate articles in the medical literature and then, by consensus, to develop a list of 6 clinical questions based on their novelty and potential to change perioperative medical practice:
- How should we screen for cardiac risk in patients undergoing noncardiac surgery?
- What is the appropriate timing for surgery after coronary intervention?
- Can we use statin therapy to reduce perioperative cardiac risk?
- How should we manage sleep apnea risk perioperatively?
- Which patients with atrial fibrillation should receive perioperative bridging anticoagulation?
- Is frailty screening beneficial for elderly patients before noncardiac surgery?
The summaries in this article are a composite of perioperative medicine updates presented at the Perioperative Medicine Summit and the annual meetings of the Society for General Internal Medicine and the Society of Hospital Medicine. “Perioperative care is complex and changing”1–10 (page 864) offers a brief overview.
HOW TO SCREEN FOR CARDIAC RISK BEFORE NONCARDIAC SURGERY
Perioperative cardiac risk can be estimated by clinical risk indexes (based on history, physical examination, common blood tests, and electrocardiography), cardiac biomarkers (natriuretic peptide or troponin levels), and noninvasive cardiac tests.
American and European guidelines
In 2014, the American College of Cardiology/American Heart Association2 and the European Society of Cardiology11 published guidelines on perioperative cardiovascular evaluation and management. They recommended several tools to calculate the risk of postoperative cardiac complications but did not specify a preference. These tools include:
- The Revised Cardiac Risk Index (RCRI)12 (www.mdcalc.com/revised-cardiac-risk-index-pre-operative-risk), which has been externally validated in multiple studies and is the most widely used
- The American College of Surgeons surgical risk calculator13 (www.riskcalculator.facs.org), derived from the National Surgery Quality Improvement Program (NSQIP) database
- The myocardial infarction or cardiac arrest (MICA) calculator14 (www.surgicalriskcalculator.com/miorcardiacarrest), also derived from the NSQIP database.
2017 Canadian guidelines differ
In 2017, the Canadian Cardiovascular Society published its own guidelines on perioperative risk assessment and management.1 These differ from the American and European guidelines on several points.
RCRI recommended. The Canadian guidelines suggested using the RCRI over the other risk predictors, which despite superior discrimination lacked external validation (conditional recommendation; low-quality evidence). Additionally, the Canadians believed that the NSQIP risk indexes underestimated cardiac risk because patients did not undergo routine biomarker screening.
Biomarker measurement. The Canadian guidelines went a step further in their algorithm (Figure 1) and recommended measuring N-terminal-pro B-type natriuretic peptide (NT-proBNP) or BNP preoperatively to improve risk prediction in 3 groups (strong recommendation; moderate-quality evidence):
- Patients ages 65 and older
- Patients ages 45 to 64 with significant cardiovascular disease
- Patients with an RCRI score of 1 or more.
This differs from the American guidelines, which did not recommend measuring preoperative biomarkers but did acknowledge that they may provide incremental value. The American College of Cardiology/American Heart Association authors felt that there were no data to suggest that targeting these biomarkers for treatment and intervention would reduce postoperative risk. The European guidelines did not recommend routinely using biomarkers, but stated that they may be considered in high-risk patients (who have a functional capacity ≤ 4 metabolic equivalents or an RCRI score > 1 undergoing vascular surgery, or > 2 undergoing nonvascular surgery).
Stress testing deemphasized. The Canadian guidelines recommended biomarker testing rather than noninvasive tests to enhance risk assessment based on cost, potential delays in surgery, and absence of evidence of an overall absolute net improvement in risk reclassification. This contrasts with the American and European guidelines and algorithms, which recommended pharmacologic stress testing in patients at elevated risk with poor functional capacity undergoing intermediate- to high-risk surgery if the results would change how they are managed.
Postoperative monitoring. The Canadian guidelines recommended that if patients have an NT-proBNP level higher than 300 mg/L or a BNP level higher than 92 mg/L, they should receive postoperative monitoring with electrocardiography in the postanesthesia care unit and daily troponin measurements for 48 to 72 hours. The American guidelines recommended postoperative electrocardiography and troponin measurement only for patients suspected of having myocardial ischemia, and the European guidelines said postoperative biomarkers may be considered in patients at high risk.
Physician judgment needed
While guidelines and risk calculators are potentially helpful in risk assessment, the lack of consensus and the conflicting recommendations force the physician to weigh the evidence and make individual decisions based on his or her interpretation of the data.
Until there are studies directly comparing the various risk calculators, physicians will most likely use the RCRI, which is simple and has been externally validated, in conjunction with the American guidelines.
At this time, it is unclear how biomarkers should be used—preoperatively, postoperatively, or both—because there are no studies demonstrating that management strategies based on the results lead to better outcomes. We do not believe that biomarker testing will be accepted in lieu of stress testing by our surgery, anesthesiology, or cardiology colleagues, but going forward, it will probably be used more frequently postoperatively, particularly in patients at moderate to high risk.
WHAT IS THE APPROPRIATE TIMING FOR SURGERY AFTER PCI?
A 2014 American College of Cardiology/American Heart Association guideline recommended delaying noncardiac surgery for 1 month after percutaneous coronary intervention (PCI) with bare-metal stents and 1 year after PCI with drug-eluting stents.15 The guideline suggested that surgery may be performed 6 months after drug-eluting stent placement if the risks of delaying surgery outweigh the risk of thrombosis.15
The primary rationale behind these timeframes was to provide dual antiplatelet therapy for a minimally acceptable duration before temporary interruption for a procedure. These recommendations were influenced largely by observational studies of first-generation devices, which are no longer used. Studies of newer-generation stents have suggested that the risk of stent thrombosis reaches a plateau considerably earlier than 6 to 12 months after PCI.
2016 Revised guideline on dual antiplatelet therapy
Although not separately delineated in the recommendations, risk factors for stent thrombosis that should influence the decision include smoking, multivessel coronary artery disease, and suboptimally controlled diabetes mellitus or hyperlipidemia.17 The presence of such stent thrombosis risk factors should be factored into the decision about proceeding with surgery within 3 to 6 months after drug-eluting stent placement.
Holcomb et al: Higher postoperative risk after PCI for myocardial infarction
Another important consideration is the indication for which PCI was performed. In a recent study, Holcomb et al16 found an association between postoperative major adverse cardiac events and PCI for myocardial infarction (MI) that was independent of stent type.
Compared with patients who underwent PCI not associated with acute coronary syndrome, the odds ratios and 95% confidence intervals (CIs) for major adverse cardiac events in those who underwent PCI for MI were:
- 5.25 (4.08–6.75) in the first 3 months
- 2.45 (1.80–3.35) in months 3 to 6
- 2.50 (1.90–3.28) in months 6 to 12.
In absolute terms, patients with stenting performed for an MI had an incidence of major adverse cardiac events of:
- 22.2% in the first 3 months
- 9.4% in months 3 to 6
- 5.8% in months 6 to 12
- 4.4% in months 12 to 24.
The perioperative risks were reduced after 12 months but still remained greater in patients whose PCI was performed for MI rather than another indication.16
The authors of this study suggested delaying noncardiac surgery for up to 6 months after PCI for MI, regardless of stent type.16
A careful, individualized approach
Optimal timing of noncardiac surgery PCI requires a careful, individualized approach and should always be coordinated with the patient’s cardiologist, surgeon, and anesthesiologist.3,15 For most patients, surgery should be delayed for 30 days after bare-metal stent placement and 6 months after drug-eluting stent placement.3 However, for those with greater surgical need and less thrombotic risk, noncardiac surgery can be considered 3 to 6 months after drug-eluting stent placement.3
Additional discussion of the prolonged increased risk of postoperative major adverse cardiac events is warranted in patients whose PCI was performed for MI, in whom delaying noncardiac surgery for up to 6 months (irrespective of stent type) should be considered.16
CAN WE USE STATINS TO REDUCE PERIOPERATIVE RISK?
Current recommendations from the American College of Cardiology/American Heart Association support continuing statins in the perioperative period, but the evidence supporting starting statins in this period has yet to be fully determined. In 2013, a Cochrane review18 found insufficient evidence to conclude that statins reduced perioperative adverse cardiac events, though several large studies were excluded due to controversial methods and data.
In contrast, the Vascular Events in Noncardiac Surgery Patients Cohort Evaluation (VISION) study,4 a multicenter, prospective, cohort-matched study of approximately 7,200 patients, found a lower risk of a composite primary outcome of all-cause mortality, myocardial injury after noncardiac surgery, or stroke at 30 days for patients exposed to statin therapy (relative risk [RR] 0.83, 95% CI 0.73–0.95, P = .007).4
London et al retrospective study: 30-day mortality rate is lower with statins
In 2017, London et al5 published the results of a very large retrospective, observational cohort study of approximately 96,000 elective or emergency surgery patients in Department of Veterans Affairs hospitals. The patients were propensity-matched and evaluated for exposure to statins on the day of or the day after surgery, for a total of approximately 48,000 pairs.
The primary outcome was death at 30 days, and statin exposure was associated with a significant reduction (RR 0.82; 95% CI 0.75–0.89; P < .001). Significant risk reductions were demonstrated in nearly all secondary end points as well, except for stroke or coma and thrombosis (pulmonary embolism, deep vein thrombosis, or graft failure). Overall, the number needed to treat to prevent any complication was 67. Statin therapy did not show significant harm, though on subgroup analysis, those who received high-intensity statin therapy had a slightly higher risk of renal injury (odds ratio 1.18, 95% CI 1.02–1.37, P = .03). Also on subgroup analysis, after propensity matching, patients on long-term moderate- or high-intensity statin therapy for 6 to 12 months before surgery had a small risk reduction for many of the outcomes, including death.
The authors also noted that only 62% of the patients who were prescribed statins as outpatients received them in the hospital, which suggests that improvement is necessary in educating perioperative physicians about the benefits and widespread support for continuing statins perioperatively.5
LOAD trial: No benefit from starting statins
Both London et al5 and the VISION investigators4 called for a large randomized controlled trial of perioperative statin initiation. The Lowering the Risk of Operative Complications Using Atorvastatin Loading Dose (LOAD) trial attempted to answer this call.6
This trial randomized 648 statin-naïve Brazilian patients at high risk of perioperative cardiac events to receive either atorvastatin or placebo before surgery and then continuously for another 7 days. The primary outcomes were the rates of death, nonfatal myocardial injury after noncardiac surgery, and cerebrovascular accident at 30 days.6
The investigators found no significant difference in outcomes between the two groups and estimated that the sample size would need to be approximately 7,000 patients to demonstrate a significant benefit. Nonetheless, this trial established that a prospective perioperative statin trial is feasible.
When to continue or start statins
Although we cannot recommend starting statins for all perioperative patients, perioperative statins clearly can carry significant benefit and should be continued in all patients who have been taking them. It is also likely beneficial to initiate statins in those patients who would otherwise warrant therapy based on the American College of Cardiology/American Heart Association Pooled Cohort Equations Risk calculator.19
HOW SHOULD WE MANAGE SLEEP APNEA RISK PERIOPERATIVELY?
From 20% to 30% of US men and 10% to 15% of US women have obstructive sleep apnea, and many are undiagnosed. Obstructive sleep apnea increases the risk of perioperative respiratory failure, unplanned reintubation, unplanned transfer to the intensive care unit, and death.20 Sentinel events (unexpected respiratory arrest after surgery on general surgical wards) have prompted the development of guidelines that aim to identify patients with previously undiagnosed obstructive sleep apnea before surgery and to develop approaches to reduce perioperative morbidity and mortality.
Kaw et al: Beware obesity hypoventilation syndrome
A 2016 study suggested that patients with obstructive sleep apnea and obesity hypoventilation syndrome may be at particularly high risk of perioperative complications.21
Kaw et al21 queried a database of patients with obstructive sleep apnea undergoing elective noncardiac surgery at Cleveland Clinic. All patients (N = 519) had obstructive sleep apnea confirmed by polysomnography, and a body mass index greater than 30 kg/m2. The authors considered a patient to have obesity hypoventilation syndrome (n = 194) if he or she also had hypercapnia (Paco2 ≥ 45 mm Hg) on at least 2 occasions before or after surgery.
In an adjusted analysis, the odds ratios and 95% CIs for adverse outcomes in patients with obesity hypoventilation syndrome were:
- 10.9 (3.7–32.3) for respiratory failure
- 5.4 (1.9–15.7) for heart failure
- 10.9 (3.7–32.3) for intensive care unit transfer.
The absolute increases in risk in the presence of obesity hypoventilation syndrome were:
- 19% (21% vs 2%) for respiratory failure
- 8% (8% vs 0) for heart failure
- 15% (21% vs 6%) for intensive care unit transfer.
There was no difference in rates of perioperative mortality.21
The authors proposed an algorithm to identify patients with possible obesity hypoventilation syndrome before surgery that included prior sleep study results, STOP-BANG score (Table 2),22 and serum bicarbonate level.
Important limitations of the study were that most patients with obesity hypoventilation syndrome were undiagnosed at the time of surgery. Still, the study does offer a tool to potentially identify patients at high risk for perioperative morbidity due to obesity hypoventilation syndrome. Clinicians could then choose to cancel nonessential surgery, propose a lower-risk alternative procedure, or maximize the use of strategies known to reduce perioperative risk for patients with obstructive sleep apnea in general.
Two guidelines on obstructive sleep apnea
Two professional societies have issued guidelines aiming to improve detection of previously undiagnosed obstructive sleep apnea and perioperative outcomes in patients known to have it or suspected of having it:
- The American Society of Anesthesiologists in 201423
- The Society of Anesthesia and Sleep Medicine in 2016.7
Both guidelines recommend that each institution develop a local protocol to screen patients for possible obstructive sleep apnea before elective surgery. The American Society of Anesthesiologists does not recommend any particular tool, but does recommend taking a history and performing a focused examination that includes evaluation of the airway, nasopharyngeal characteristics, neck circumference, and tonsil and tongue size. The Society of Anesthesia and Sleep Medicine recommends using a validated tool such as the STOP-BANG score to estimate the risk of obstructive sleep apnea.
If this screening suggests that a patient has obstructive sleep apnea, should surgery be delayed until a formal sleep study can be done? Or should the patient be treated empirically as if he or she has obstructive sleep apnea? Both professional societies recommend shared decision-making with the patient in this situation, with the Society of Anesthesia and Sleep Medicine recommending additional cardiopulmonary evaluation for patients with hypoventilation, severe pulmonary hypertension, or resting hypoxemia.
Both recommend using continuous positive airway pressure (CPAP) after surgery in patients with known obstructive sleep apnea, although there is not enough evidence to determine if empiric CPAP for screening-positive patients (without polysomnography-diagnosed obstructive sleep apnea) is beneficial. The Society of Anesthesia and Sleep Medicine advises that it is safe to proceed to surgery if obstructive sleep apnea is suspected as long as monitoring and risk-reduction strategies are implemented after surgery to reduce complication rates.
During surgery, the American Society of Anesthesiologists advises peripheral nerve blocks when appropriate, general anesthesia with a secure airway rather than deep sedation, capnography when using moderate sedation, awake extubation, and full reversal of neuromuscular blockade before extubation. After surgery, they recommend reducing opioid use, minimizing postoperative sedatives, supplemental oxygen, and continuous pulse oximetry. The Society of Anesthesia and Sleep Medicine guideline addresses preoperative assessment and therefore makes no recommendations regarding postoperative care.
In conclusion, use of pertinent findings from the history and physical examination and a validated obstructive sleep apnea screening tool such as STOP-BANG before surgery are recommended, with joint decision-making as to proceeding with surgery with empiric CPAP vs a formal sleep study for patients who screen as high risk. The Society of Anesthesia and Sleep Medicine recommends further cardiopulmonary evaluation if there is evidence of hypoventilation, hypoxemia, or pulmonary hypertension in addition to likely obstructive sleep apnea.
WHICH ATRIAL FIBRILLATION PATIENTS NEED BRIDGING ANTICOAGULATION?
When patients receiving anticoagulation need surgery, we need to carefully assess the risks of thromboembolism without anticoagulation vs bleeding with anticoagulation.
Historically, we tended to worry more about thromboembolism24; however, recent studies have revealed a significant risk of bleeding when long-term anticoagulant therapy is bridged (ie, interrupted and replaced with a shorter-acting agent in the perioperative period), with minimal to no decrease in thromboembolic events.25–27
American College of Cardiology guideline
In 2017, the American College of Cardiology8 published a guideline on periprocedural management of anticoagulation in patients with nonvalvular atrial fibrillation. The guideline includes a series of decision algorithms on whether and when to interrupt anticoagulation, whether and how to provide bridging anticoagulation, and how to restart postprocedural anticoagulation.
When deciding whether to interrupt anticoagulation, we need to consider the risk of bleeding posed both by patient-specific factors and by the type of surgery. Bridging anticoagulation is not indicated when direct oral anticoagulants (eg, dabigatran, apixaban, edoxaban, rivaroxaban) are interrupted for procedures.
Unlike an earlier guideline statement by the American College of Chest Physicians,24 this consensus statement emphasizes using the CHA2DS2-VASc score as a predictor of thromboembolic events rather than the CHADS2 core.
Table 3 summarizes the key points in the guidance statement about which patients should receive periprocedural bridging anticoagulation.
As evidence continues to evolve in this complicated area of perioperative medicine, it will remain important to continue to create patient management plans that take individual patient and procedural risks into account.
IS FRAILTY SCREENING BENEFICIAL BEFORE NONCARDIAC SURGERY?
Frailty, defined as a composite score of a patient’s age and comorbidities, has great potential to become an obligatory factor in perioperative risk assessment. However, it remains difficult to incorporate frailty scoring into clinical practice due to variations among scoring systems,28 uncertain outcome data, and the imprecise role of socioeconomic factors. In particular, the effect of frailty on perioperative mortality over longer periods of time is uncertain.
McIsaac et al: Higher risk in frail patients
McIsaac and colleagues at the University of Ottawa used a frailty scoring system developed at Johns Hopkins University to evaluate the effect of frailty on all-cause postoperative mortality in approximately 202,000 patients over a 10-year period.9 Although this scoring system is proprietary, it is based on factors such as malnutrition, dementia, impaired vision, decubitus ulcers, urinary incontinence, weight loss, poverty, barriers to access of care, difficulty in walking, and falls.
After adjusting for the procedure risk, patient age, sex, and neighborhood income quintile, the 1-year mortality risk was significantly higher in the frail group (absolute risk 13.6% vs 4.8%; adjusted hazard ratio 2.23; 95% CI 2.08–2.40). The risk of death in the first 3 days was much higher in frail than in nonfrail patients (hazard ratio 35.58; 95% CI 29.78–40.1), but the hazard ratio decreased to approximately 2.4 by day 90.
The authors emphasize that the elevated risk for frail patients warrants particular perioperative planning, though it is not yet clear what frailty-specific interventions should be performed. Further study is needed into the benefit of “prehabilitation” (ie, exercise training to “build up” a patient before surgery) for perioperative risk reduction.
Hall et al: Better care for frail patients
Hall et al10 instituted a quality improvement initiative for perioperative care of patients at the Omaha Veterans Affairs Hospital. Frail patients were identified using the Risk Analysis Index, a 14-question screening tool previously developed and validated over several years using Veterans Administration databases.29 Questions in the Risk Analysis Index cover living situation, any diagnosis of cancer, ability to perform activities of daily living, and others.
To maximize compliance, a Risk Analysis Index score was required to schedule a surgery. Patients with high scores underwent further review by a designated team of physicians who initiated informal and formal consultations with anesthesiologists, critical care physicians, surgeons, and palliative care providers, with the goals of minimizing risk, clarifying patient goals or resuscitation wishes, and developing comprehensive perioperative planning.10
Approximately 9,100 patients were included in the cohort. The authors demonstrated a significant improvement in mortality for frail patients at 30, 180, and 365 days, but noted an improvement in postoperative mortality for the nonfrail patients as well, perhaps due to increased focus on geriatric patient care. In particular, the mortality rate at 365 days dropped from 34.5% to 11.7% for frail patients who underwent this intervention.
While this quality improvement initiative was unable to examine how surgical rates changed in frail patients, it is highly likely that very high-risk patients opted out of surgery or had their surgical plan change, though the authors point out that the overall surgical volume at the institution did not change significantly. As well, it remains unclear which particular interventions may have had the most effect in improving survival, as the perioperative plans were individualized and continually adjusted throughout the study period.
Nonetheless, this article highlights how higher vigilance, individualized planning and appreciation of the high risks of frail patients is associated with improved patient survival postoperatively. Although frailty screening is still in its early stages and further work is needed, it is likely that performing frailty screening in elderly patients and utilizing interdisciplinary collaboration for comprehensive management of frail patients can improve their postoperative course.
- Duceppe E, Parlow J, MacDonald P, et al. Canadian Cardiovascular Society guidelines on perioperative cardiac risk assessment and management for patients who undergo noncardiac surgery. Can J Cardiol 2017; 33:17–32.
- Fleisher LA, Fleischmann KE, Auerbach AD, et al. 2014 ACC/AHA guideline on perioperative cardiovascular evaluation and management of patients undergoing noncardiac surgery: a report of the American College of Cardiology/American Heart Association Task Force on practice guidelines. J Am Coll Cardiol 2014; 64:2373–2405.
- Levine GN, Bates ER, Bittl JA, et al. 2016 ACC/AHA guideline focused update on duration of dual antiplatelet therapy in patients with coronary artery disease. Circulation 2016; 134:e123–e155.
- Berwanger O, Le Manach Y, Suzumura EA, et al. Association between pre-operative statin use and major cardiovascular complications among patients undergoing non-cardiac surgery: the VISION study. Eur Heart J 2016; 37:177–185.
- London MJ, Schwartz GG, Hur K, Henderson WG. Association of perioperative statin use with mortality and morbidity after major noncardiac surgery. JAMA Intern Med 2017; 177:231–242.
- Berwanger O, de Barros E Silva PG, Barbosa RR, et al. Atorvastatin for high-risk statin-naïve patients undergoing noncardiac surgery: the Lowering the Risk of Operative Complications Using Atorvastatin Loading Dose (LOAD) randomized trial. Am Heart J 2017; 184:88–96.
- Chung F, Memtsoudis SG, Ramachandran SK, et al. Society of Anesthesia and Sleep Medicine guidelines on preoperative screening and assessment of adult patients with obstructive sleep apnea. Anesth Analg 2016; 123:452–473.
- Doherty JU, Gluckman TJ, Hucker W, et al. 2017 ACC expert consensus decision pathway for periprocedural management of anticoagulation in patients with nonvalvular atrial fibrillation: a report of the American College of Cardiology Clinical Expert Consensus Document Task Force. J Am Coll Cardiol 2017; 69:871–898.
- McIsaac DI, Bryson GL, van Walraven C. Association of frailty and 1-year postoperative mortality following major elective noncardiac surgery: a population-based cohort study. JAMA Surg 2016; 151:538–545.
- Hall DE, Arya S, Schmid KK, et al. Association of a frailty screening initiative with postoperative survival at 30, 180, and 365 days. JAMA Surg 2017; 152:233–240.
- Kristensen SD, Knuuti J, Saraste A, et al. 2014 ESC/ESA Guidelines on non-cardiac surgery: cardiovascular assessment and management: The Joint Task Force on non-cardiac surgery: cardiovascular assessment and management of the European Society of Cardiology (ESC) and the European Society of Anaesthesiology (ESA). Eur Heart J 2014; 35:2383–2431.
- Lee TH, Marcantonio ER, Mangione CM, et al. Derivation and prospective validation of a simple index for prediction of cardiac risk of major noncardiac surgery. Circulation 1999; 100:1043–1049.
- Bilimoria KY, Liu Y, Paruch JL, Zhou L, Kmiecik TE, Ko CY, Cohen ME. Development and evaluation of the universal ACS NSQIP surgical risk calculator: a decision aid and informed consent tool for patients and surgeons. J Am Coll Surg 2013; 217:833–842.
- Gupta PK, Gupta H, Sundaram A, et al. Development and validation of a risk calculator for prediction of cardiac risk after surgery. Circulation 2011; 124:381–387.
- Fleisher LA, Fleischmann KE, Auerbach AD, et al. 2014 ACC/AHA guideline on perioperative cardiovascular evaluation and management of patients undergoing noncardiac surgery: a report of the American College of Cardiology/American Heart Association Task Force on Practice Guidelines. J Am Coll Cardiol 2014; 64:e77–e137.
- Holcomb CN, Hollis RH, Graham LA, et al. Association of coronary stent indication with postoperative outcomes following noncardiac surgery. JAMA Surg 2016; 151:462–469.
- Lemesle G, Tricot O, Meurice T, et al. Incident myocardial infarction and very late stent thrombosis in outpatients with stable coronary artery disease. J Am Coll Cardiol 2017; 69:2149–2156.
- Sanders RD, Nicholson A, Lewis SR, Smith AF, Alderson P. Perioperative statin therapy for improving outcomes during and after noncardiac vascular surgery. Cochrane Database Syst Rev 2013; 7:CD009971.
- Goff DC, Lloyd-Jones DM, Bennett G, et al. 2013 ACC/AHA guideline on the assessment of cardiovascular risk: a report of the American College of Cardiology/American Heart Association Task Force on Practice Guidelines. J Am Coll Cardiol 2014; 63:2935–2959.
- Kaw R, Pasupuleti V, Walker E, et al. Postoperative complications in patients with obstructive sleep apnea. Chest 2012; 141:436–441.
- Kaw R, Bhateja P, Mar HP, et al. Postoperative complications in patients with unrecognized obesity hypoventilation syndrome undergoing elective noncardiac surgery. Chest 2016; 149:84–91.
- Chung F, Yegneswaran B, Liao P, et al. STOP questionnaire: a tool to screen patients for obstructive sleep apnea. Anesthesiology 2008; 108:812–821.
- Gross JB, Apfelbaum JL, Caplan RA, et al. Practice guidelines for the perioperative management of patients with obstructive sleep apnea: an updated report by the American Society of Anesthesiologists Task Force on Perioperative Management of Patients with Obstructive Sleep Apnea. Anesthesiology 2014; 120:268–286.
- Douketis JD, Spyropoulos AC, Spencer FA, et al. Perioperative management of antithrombotic therapy: Antithrombotic Therapy and Prevention of Thrombosis, 9th ed: American College of Chest Physicians Evidence-Based Clinical Practice Guidelines. Chest 2012; 141(2 suppl):e326S–e350S.
- Siegal D, Yudin J, Kaatz S, Douketis JD, Lim W, Spyropoulos AC. Periprocedural heparin bridging in patients receiving vitamin K antagonists: systematic review and meta-analysis of bleeding and thromboembolic rates. Circulation 2012; 126:1630–1639.
- Clark NP, Witt DM, Davies LE, et al. Bleeding, recurrent venous thromboembolism, and mortality risks during warfarin interruption for invasive procedures. JAMA Intern Med 2015; 175:1163–1168.
- Douketis JD, Spyropoulos AC, Kaatz S, et al. Perioperative bridging anticoagulation in patients with atrial fibrillation. N Engl J Med 2015; 373:823–833.
- Theou O, Brothers TD, Mitnitski A, Rockwood K. Operationalization of frailty using eight commonly used scales and comparison of their ability to predict all-cause mortality. J Am Geriatr Soc 2013; 61:1537–1551.
- Hall DE, Arya S, Schmid KK, et al. Development and initial validation of the risk analysis index for measuring frailty in surgical populations. JAMA Surg 2017; 152:175–182.
KEY POINTS
- Noncardiac surgery after drug-eluting stent placement can be considered after 3 to 6 months for those with greater surgical need and lower risk of stent thrombosis.
- Perioperative statin use continues to show benefits with minimal risk in large cohort studies, but significant randomized controlled trial data are lacking.
- Patients should be screened for obstructive sleep apnea before surgery, and further cardiopulmonary testing should be performed if the patient has evidence of significant sequelae from obstructive sleep apnea.
- For patients with atrial fibrillation on vitamin K antagonists, bridging can be considered for those with a CHA2DS2-VASc score of 5 or 6 and a history of stroke, transient ischemic attack, or systemic thromboembolism. Direct oral anticoagulation should not be bridged.
- Frailty carries significant perioperative mortality risk; systems-based changes to minimize these patients’ risks can be beneficial and warrant further study.

Toward understanding chronic kidney disease in African Americans
Clinical experience and observational studies made us aware that African American patients responded differently to some treatments than the white male patients in the clinical trials. This awareness led to some interesting biologic hypotheses and, over the past 13 years, has led to trials focused on the treatment of heart failure and hypertension in African Americans. But a full biologic understanding of the apparent racial differences in clinical response to specific therapies has for the most part remained elusive.
Contributing to this understanding gap was that we historically did not fully appreciate the differences according to race (and likely sex) in the clinical progression of diseases such as hypertension, heart failure, and, as discussed in this issue of the Journal by Dr. Joseph V. Nally, Jr., chronic kidney disease. African Americans with congestive heart failure seem to fare worse than their white counterparts with the same disease. Given the strong link between heart failure and chronic kidney disease and the crosstalk between the heart and kidneys, it is no surprise that African Americans with chronic kidney disease progress to end-stage renal disease at a higher rate than whites. Yet, as Dr. Nally points out, once on dialysis, African Americans live longer—an intriguing observation that came from analysis of large databases devoted to the study of patients with chronic kidney disease.
As a patient’s self-defined racial identity may not be biologically accurate, using molecular genetic techniques to delve more deeply into the characteristics of patients in these chronic kidney disease registries is starting to yield fascinating results—and even more questions. Links between APOL1 gene polymorphisms and the occurrence of renal disease and the survival of transplanted kidneys is assuredly just the start of a journey of genomic discovery and understanding.
Readers will note the short editor’s note at the start of Dr. Nally’s article, indicating that it was based on a Medicine Grand Rounds lecture at Cleveland Clinic, the 14th annual Lawrence “Chris” Crain Memorial Lecture. In 1997, Chris became the first African American chief resident in internal medicine at Cleveland Clinic, and I had the pleasure of interacting with him while he was in that role. Chris was a natural leader. He was soft-spoken, curious, and passionate about delivering and understanding the basics of high-quality clinical care.
After his residency, with Byron Hoogwerf as the internal medicine program director, Chris trained with Joe Nally as his program director in nephrology, and further developed his interest in renal and cardiovascular disease in African Americans. He moved to Atlanta, where he died far too prematurely in July 2003. That year, in conjunction with Chris’s mother, wife, extended family, and other faculty, Drs. Hoogwerf and Nally established the Lawrence “Chris” Crain Memorial Lectureship, devoted to Chris’s passion of furthering our understanding and our ability to deliver optimal care to African American patients with cardiovascular and renal disease.
I am pleased to share this lecture with you.

Fever after recent travel
A 28-year-old man developed fever, night sweats, nausea, headache, reduced appetite, skin rash, and hemoptysis 2 weeks after returning to the United States from Mexico.
The patient had fistulizing Crohn disease and had been taking the tumor necrosis factor alpha (TNF-alpha) blocker adalimumab for the past 3 months. He had no risk factors for human immunodeficiency virus infection, and he had stopped smoking 1 year previously. Chest radiography and a tuberculin skin test before he started adalimumab therapy were negative. While in Mexico, he did not drink more than 1 alcoholic beverage a day.
He had presented recently to his local hospital with the same symptoms and had been prescribed ciprofloxacin, metronidazole, ceftriaxone, vancomycin, and ampicillin, which he was still taking but with no improvement of symptoms. Blood cultures drawn before the start of antibiotic therapy had been negative. Urinalysis, a screen for infectious mononucleosis, and lumbar puncture were also negative. Results of renal function testing were normal except for the anion gap, which was 20.8 mmol/L (reference range 10–20).
INITIAL EVALUATION
On presentation to this hospital, the patient was afebrile but continued to have temperature spikes up to 39.0°C (102.2°F). His heart rate was 90 per minute, blood pressure 104/61 mm Hg, respiratory rate 18 per minute, and oxygen saturation 95% on 2 L of oxygen via nasal cannula.


- White blood cell count 10.0 × 10⁹/L (reference range 4.0–10.0 × 10⁹/L)
- Lymphocyte count 6.1 × 10⁹/L (1.2–3.4)
- Hemoglobin level 13.6 g/dL (14.0–18.0)
- Platelet count 87 × 109/L (150–400), reaching a nadir of 62 on hospital day 23
- Albumin 47 g/L (35–50)
- Total bilirubin 48 µmol/L (2–20)
- Alkaline phosphatase 137 U/L (40–135)
- Alanine aminotransferase 22 U/L (9–69)
- Aspartate aminotransferase 72 U/L (5–45).
He continued to have temperature spikes. His alkaline phosphatase level plateaued at 1,015 U/L on day 30, while his alanine aminotransferase and aspartate aminotransferase levels remained stable.
The patient’s ceftriaxone was continued, and the other antibiotics were replaced with doxycycline. Fluconazole was added when sputum culture grew Candida albicans. However, these drugs were later discontinued in view of worsening results on liver enzyme testing.
The evaluation continues
Sputum cultures were negative for acid-fast bacilli on 3 occasions.
Serologic testing was negative for:
- Hepatitis B surface antigen (but hepatitis B surface antibody was positive at > 1,000 IU/L)
- Hepatitis C virus antibody
- Cytomegalovirus immunoglobulin (Ig) G
- Toxoplasma gondii IgG
- Epstein-Barr virus viral capsid antigen IgM
- Rickettsia antibodies
- Antinuclear antibody
- Antineutrophil cytoplasmic antibody
- Antiglomerular basement membrane antibody.
Chest radiography showed blunting of both costophrenic angles and mild prominence of right perihilar interstitial markings and the right hilum.
Computed tomography of the chest, abdomen, and pelvis showed a subpleural density in the lower lobe of the right lung, small bilateral pleural effusions, right hilar lymphadenopathy, and splenomegaly with no specific hepatobiliary abnormality.
A white blood cell nuclear scan found no occult infection.
Abdominal ultrasonography showed a prominent liver and spleen. The liver parenchyma showed diffuse decreased echogenicity, suggestive of hepatitis.
Transesophageal echocardiography showed no vegetations or valvular abnormalities.
Bronchoscopy showed normal airways without evidence of pulmonary hemorrhage. No foci of infection were obtained. A focus of granuloma consisting of epithelioid histiocytes in tight clusters was seen on washings from the right lower lobe, but no malignant cells were seen.
Sections of pathologically enlarged right hilar and subcarinal lymph nodes obtained with transbronchial needle aspiration were sent for cytologic analysis and flow cytometry.
Cultures for tuberculous and fungal organisms were negative.
.")
A clue. On further inquiry, the patient said he had gone swimming in the natural pool, or cenote, under a rock formation at Cenote Maya Park in Mexico.
DIFFERENTIAL DIAGNOSIS
1. Which of the following is not in the differential diagnosis?
- Disseminated tuberculosis
- Coccidioidomycosis
- Subacute infective endocarditis
- Disseminated histoplasmosis
- Blastomycosis
Although the patient has a systemic disease, subacute infective endocarditis is not likely because of a lack of predisposing factors such as a history of endocarditis, abnormal or artificial heart valve, or intravenous drug abuse. Moreover, negative blood cultures and the absence of vegetations on echocardiography make endocarditis very unlikely.
Given that the patient is immunosuppressed, opportunistic infection must be at the top of the differential diagnosis. Histoplasmosis, coccidioidomycosis, and blastomycosis are endemic in Mexico. Disseminated histoplasmosis is the most likely diagnosis; coccidioidomycosis and blastomycosis are less likely, based on the history, signs, and symptoms. Disseminated tuberculosis must be excluded before other diagnostic possibilities are considered.
TUBERCULOSIS IN PATIENTS ON TNF-ALPHA ANTAGONISTS
Tuberculosis has been reported in patients taking TNF-alpha antagonists.1 The frequency of tuberculosis is much higher than that of other opportunistic infections, and over 50% of reported cases involve extrapulmonary tissues in patients treated with TNF-alpha antagonists.2
British Thoracic Society guidelines recommend screening for latent tuberculosis before starting treatment with a TNF-alpha antagonist; the screening should include a history of tuberculosis treatment, a clinical examination, chest radiography, and a tuberculin skin test.3 Patients found to have active tuberculosis should receive a minimum of 2 months of standard treatment before starting a TNF-alpha antagonist. Patients with evidence of past tuberculosis or a history of tuberculosis who received adequate treatment should be monitored regularly. Patients with prior tuberculosis not adequately treated should receive chemoprophylaxis before starting a TNF-alpha antagonist.
Fever, night sweats, and intrathoracic and intra-abdominal lymphadenopathy are common features of disseminated tuberculosis. Upper-lobe cavitary disease or miliary lesions may be seen on chest radiography, but atypical presentations with lower-lobe infiltrate are not uncommon in immunosuppressed patients.4
A negative tuberculin skin test and a normal chest radiograph 3 months ago, along with negative sputum and bronchial lavage fluid cultures and no history of tuberculosis contact, make tuberculosis unlikely in our patient.
COCCIDIOIDOMYCOSIS
Coccidioidomycosis (valley fever) is caused by the fungus Coccidioides immitis, which lives in the soil and is acquired by inhalation of airborne microscopic spores.
Fatigue, cough, fever, shortness of breath, headache, night sweats, muscle or joint pain, and a rash on the upper body or legs are common symptoms. It may cause a self-limiting flulike illness. From 5% to 10% of patients may develop serious long-term lung problems. In a small number of patients, the disease may progress beyond the lungs to involve the central nervous system, spinal cord, skin, bones, and joints.5
Serologic testing is highly useful for the diagnosis. Antigen testing has a sensitivity of 71% and a specificity of 98% for the diagnosis, but cross-reactivity occurs in 10% of patients with other types of mycosis. Respiratory secretions and tissue samples should undergo microscopic study and culture.
BLASTOMYCOSIS
Blastomycosis is caused by the fungus Blastomyces dermatitidis, which lives in soil and in association with decomposing organic matter such as wood and leaves. Inhalation of spores may cause a flulike illness or pneumonia. In serious cases, the disease can spread to skin and bone.
The diagnosis is established with fungal cultures of tissue samples or body fluids (bone marrow, liver tissue, skin, sputum, blood). Rapid diagnosis may be obtained by examination of the secretions under a microscope, where typical broad-based budding yeast can be seen in almost 90% of cases.6 Antigen may also be detected in urine and serum7; the sensitivity of antigen testing is 93% and the specificity is 98%. Serologic testing is not recommended for diagnosis of blastomycosis because of poor sensitivity and specificity.8
NARROWING THE DIFFERENTIAL
Both coccidioidomycosis and blastomycosis should be included in the differential diagnosis of a systemic disease with subacute onset and prominent lung involvement in a patient returning from travel to Mexico. The lack of involvement of the central nervous system, spinal cord, bones, or joints makes these infections less likely in our patient.
However, swimming in a cenote under a rock formation is an important clue to the diagnosis in our patient, as it puts him at risk of inhaling microconidia or hyphal elements of histoplasmosis. This, along with his immunocompromised status, fever, hemoptysis, night sweats, skin and lung features, and the generally subacute course of his illness, make disseminated histoplasmosis the most likely diagnosis.
Radiologic findings of pulmonary infiltrate with effusion and elevated lactate dehydrogenase, aminotransferases, and alkaline phosphatase increase the likelihood of disseminated histoplasmosis.
HISTOPLASMOSIS
Histoplasma capsulatum is a dimorphic fungus that thrives in the soil and caves of regions with moderate climate, especially in soil containing large amounts of bird excreta or bat guano.9 Bats are natural hosts of this organism, and it is endemic in North and Central America, including parts of Mexico. Air currents can carry the microconidia for miles, thus exposing people without direct contact with contaminated sites.
The infection is usually acquired by inhalation of microconidia or small hyphal elements or by reactivation of previously quiescent foci of infection in an immunosuppressed patient. Most patients exposed to H capsulatum remain asymptomatic or develop mild symptoms, which are self-limiting. A small number develop acute pulmonary histoplasmosis or chronic cavitary histoplasmosis. Disseminated disease usually occurs only in an immunosuppressed host.
Acute pulmonary histoplasmosis presents with fever, malaise, headache, weakness, substernal chest pain, and dry cough and may be associated with erythema nodosum, erythema multiforme, and arthralgias. It may be mistaken for sarcoidosis since enlarged hilar and mediastinal lymph nodes are often seen on chest radiography.10
Progressive disseminated histoplasmosis is defined as a clinical illness that does not improve after at least 3 weeks of observation and is associated with physical or radiographic findings with or without laboratory evidence of extrapulmonary involvement.11
Fever, malaise, anorexia, weight loss, night sweats, hepatosplenomegaly, and lymphadenopathy are features of progressive disseminated histoplasmosis.
Cutaneous manifestations of disseminated histoplasmosis occur in 10% to 25% of patients with acquired immunodeficiency syndrome and include papules, plaques with or without crust, pustules, nodules, lesions resembling molluscum contagiosum virus infection, acneiform eruptions, erythematous macules, and keratotic plaques.12
TESTING FOR HISTOPLASMOSIS
2. What investigation is least likely to help confirm the diagnosis of disseminated histoplasmosis?
- Polymerase chain reaction (PCR) testing of serum, cerebrospinal fluid, and bronchoalveolar lavage specimens
- Urinary Histoplasma antigen testing
- Serologic testing
- Blood and bronchoalveolar lavage cultures

Urinary Histoplasma antigen has a sensitivity of 90% for the diagnosis of disseminated histoplasmosis in patients with acquired immunodeficiency syndrome.18 It is less useful for pulmonary forms of histoplasmosis: the sensitivity is 75% and may even be less in milder or chronic forms of pneumonia.19 False-positive reactions may occur in patients with other fungal infections such as coccidioidomycosis, blastomycosis, paracoccidioidomycosis and penicilliosis.20 Urine antigen levels can also be used to monitor therapy, since levels decrease during therapy and increase in 90% of those who have a relapse.21
Our patient’s urinary Histoplasma antigen level was greater than 23.0 ng/mL (positive is > 0.50).
Serologic testing. Immunodiffusion immunoglobulin G (IgG) testing for Histoplasma and Blastomyces was negative, as was an enzyme immunoassay for Coccidioides IgG and IgM. However, antibody tests are less useful in immunosuppressed patients,22 and thus a negative result does not rule out histoplasmosis. A fourfold rise in complement fixation antibody titer is diagnostic of acute histoplasmosis. A single complement fixation titer of 1:32 is suggestive but not diagnostic of histoplasmosis. Cross-reactions may occur with other fungal infections like blastomycosis. The immunodiffusion assay has a greater specificity but slightly less sensitivity than the complement fixation assay.19
Culture of H capsulatum is the definitive test to establish a diagnosis of histoplasmosis. Culture can be performed on samples taken from blood, bone marrow, sputum, and bronchoalveolar lavage fluid, or from lung, liver, or lymph node tissue. Cultures are positive in 74% to 82% of cases of progressive disseminated histoplasmosis.13 However, treatment should not await culture results since the fungus may take several weeks to grow.
Back to our patient
Although Histoplasma serologic studies and cultures were negative, the diagnosis of disseminated histoplasmosis was made on the basis of the patient’s immunosuppressed status, travel history, clinical features, and positivity for urine Histoplasma antigen. Though urine histoplama antigen may be falsely positive in other fungal infections such as coccidioidomycosis, paracoccidioidomycosis, and blastomycosis, clinical features and the absence of central nervous system, joint, and bone involvement suggested disseminated histoplasmosis.
TREATMENT
3. What is the appropriate treatment for this patient?
- Amphotericin B followed by oral itraconozole
- Oral fluconazole
- Oral itraconazole
Liposomal amphotericin B or amphotericin B deoxycholate is recommended as initial therapy for moderately severe to severe and progressive disseminated histoplasmosis. It should be continued for 1 to 2 weeks, followed by oral itraconazole (200 mg 3 times daily for 3 days, then 200 mg 2 times daily for at least 12 months).
Monitoring itraconazole therapy through random serum levels is strongly recommended, and a random concentration of at least 1.0 mg/mL is recommended.23
Urine antigen levels should be measured before treatment is started, at 2 weeks, at 1 month, then every 3 months during therapy, continuing for 12 months after treatment is stopped.11
Lifelong suppressive therapy with itraconazole 200 mg daily may be required in immunosuppressed patients and patients who have a relapse despite appropriate therapy.11
While oral itraconazole is used as a sole agent for the treatment of mild to moderate acute pulmonary histoplasmosis and chronic cavitary pulmonary histoplasmosis, oral treatment alone with either fluconazole or itraconazole is not recommended for the treatment of progressive disseminated histoplasmosis.11
COMPLICATIONS OF HISTOPLASMOSIS
4. Which of the following is not a possible complication of histoplasmosis?
- Chronic cavitary pulmonary histoplasmosis
- Fibrosing mediastinitis
- Hypoadrenalism
- Hypothyroidism
Chronic cavitary pulmonary histoplasmosis usually develops in patients with underlying emphysema. Fatigue, night sweats, fever, anorexia, and weight loss are features of chronic cavitary pulmonary histoplasmosis. Progression of necrosis may lead to “marching cavity,” in which necrosis increases the size of the cavity and may consume an entire lobe.10
Fibrosing mediastinitis is an uncommon but often lethal complication of disseminated histoplasmosis. Increasing dyspnea, cough, hemoptysis, and signs of superior vena cava syndrome and right heart failure may develop. However, fibrosing mediastinitis is thought to be due to an exuberant immune response to past Histoplasma infection and would not be expected in an immunocompromised patient.17
Hypoadrenalism. Extensive destruction of the adrenal glands may lead to hypoadrenalism, manifesting as orthostatic hypotension, hyperkalemia, hyponatremia, and evidence of markedly enlarged adrenal glands with central necrosis on computed tomography.24
Hypothyroidism. Acute or disseminated histoplasmosis has not been reported to cause thyroid dysfunction.
CASE CONCLUSION
Our patient was treated with itraconazole 200 mg twice daily for 24 months. Although the literature supports lifelong itraconazole therapy in immunosuppressed patients, our patient was reluctant to do so. He agreed to close monitoring. If symptoms recur, itraconazole will be reinstituted and continued lifelong.
- Vergidis P, Avery RK, Wheat LJ, et al. Histoplasmosis complicating tumor necrosis factor-a blocker therapy: a retrospective analysis of 98 cases. Clin Infect Dis 2015; 61:409–417.
- Gardam MA, Keystone EC, Menzies R, et al. Anti-tumour necrosis factor agents and tuberculosis risk: mechanism of action and clinical management. Lancet Infect Dis 2003; 3:148–155.
- British Thoracic Society Standards of Care Committee. BTS recommendations for assessing risk and for managing Mycobacterium tuberculosis infection and disease in patients due to start anti-TNF-alpha treatment. Thorax 2005; 60:800–805.
- Case records of the Massachusetts General Hospital. Weekly clinicopathological exercises. Case 38-1998. A 19-year-old man with the acquired immunodeficiency syndrome and persistent fever. N Engl J Med 1998; 339:1835–1843.
- Galgiani JN, Ampel NM, Blair JE, et al; Infectious Diseases Society of America. Coccidioidomycosis. Clin Infect Dis 2005; 41:1217–1223.
- Lemos LB, Guo M, Baliga M. Blastomycosis: organ involvement and etiologic diagnosis. A review of 123 patients from Mississippi. Ann Diagn Pathol 2000; 4:391–406.
- Durkin M, Witt J, Lemonte A, Wheat B, Connolly P. Antigen assay with the potential to aid in diagnosis of blastomycosis. J Clin Micribiol 2004; 42:4873–4875.
- Wheat LJ. Approach to the diagnosis of the endemic mycoses. Clin Chest Med 2009; 30:379–389.
- Colombo AL, Tobón A, Restrepo A, Queiroz-Telles F, Nucci M. Epidemiology of endemic systemic fungal infections in Latin America. Med Mycol 2011; 49:785–798.
- Kauffman CA. Histoplasmosis: a clinical and laboratory update. Clin Microbiol Rev 2007; 20:115–132.
- Wheat LJ, Freifeld AG, Kleiman MB, et al; Infectious Diseases Society of America. Clinical practice guidelines for the management of patients with histoplasmosis: 2007 update by the Infectious Diseases Society of America. Clin Infect Dis 2007; 45:807–825.
- Chang P, Rodas C. Skin lesions in histoplasmosis. Clinics Dermatol 2012; 30:592–598.
- Wheat LJ. Improvements in diagnosis of histoplasmosis. Expert Opin Biol Ther 2006; 6:1207–1221.
- Connolly P, Hage CA, Bariola JR, et al. Blastomyces dermatitidis antigen detection by quantitative enzyme immunoassay. Clin Vaccine Immunol 2012; 19:53–56.
- Castillo CG, Kauffman CA, Miceli MH. Blastomycosis. Infect Dis Clin North Am 2016; 30:247–264.
- Stockamp NW, Thompson GR 3rd. Coccidioidomycosis. Infect Dis Clin North Am 2016; 30:229–246.
- Wheat LJ, Azar MM, Bahr NC, Spec A, Relich RF, Hage C. Histoplasmosis. Infect Dis Clin North Am 2016; 30:207–227.
- Wheat LJ, Garringer T, Drizendine E, Connolly P. Diagnosis of histoplasmosis by antigen detection based upon experience at the histoplasmosis reference laboratory. Diagn Microbiol Infect Dis 2002; 14:1389–1391.
- Kauffman CA. Diagnosis of histoplasmosis in immunosuppressed patients. Curr Opin Infect Dis 2008; 21:421–425.
- Wheat LJ. Improvements in diagnosis of histoplasmosis. Expert Opin Biol Ther 2006; 6:1207–1221.
- Wheat LJ, Connolly P, Haddad N, Le Monte A, Brizendine E, Hafner R. Antigen clearance during treatment of disseminated histoplasmosis with itraconazole versus fluconazole in patients with AIDS. Antimicrob Agents Chemother 2002; 46:248–250.
- Wheat LJ. Current diagnosis of histoplasmosis. Trends Microbiol 2003; 11:488–494.
- Poirier JM, Cheymol G. Optimisation of itraconazole therapy using target drug concentrations. Clin Pharmacokinet 1998; 35:461–473.
- Sarosi GA, Voth DW, Dahl BA, Doto IL, Tosh FE. Disseminated histoplasmosis: results of long-term follow-up. Ann Intern Med 1971; 75:511–516.
A 28-year-old man developed fever, night sweats, nausea, headache, reduced appetite, skin rash, and hemoptysis 2 weeks after returning to the United States from Mexico.
The patient had fistulizing Crohn disease and had been taking the tumor necrosis factor alpha (TNF-alpha) blocker adalimumab for the past 3 months. He had no risk factors for human immunodeficiency virus infection, and he had stopped smoking 1 year previously. Chest radiography and a tuberculin skin test before he started adalimumab therapy were negative. While in Mexico, he did not drink more than 1 alcoholic beverage a day.
He had presented recently to his local hospital with the same symptoms and had been prescribed ciprofloxacin, metronidazole, ceftriaxone, vancomycin, and ampicillin, which he was still taking but with no improvement of symptoms. Blood cultures drawn before the start of antibiotic therapy had been negative. Urinalysis, a screen for infectious mononucleosis, and lumbar puncture were also negative. Results of renal function testing were normal except for the anion gap, which was 20.8 mmol/L (reference range 10–20).
INITIAL EVALUATION
On presentation to this hospital, the patient was afebrile but continued to have temperature spikes up to 39.0°C (102.2°F). His heart rate was 90 per minute, blood pressure 104/61 mm Hg, respiratory rate 18 per minute, and oxygen saturation 95% on 2 L of oxygen via nasal cannula.
- White blood cell count 10.0 × 10⁹/L (reference range 4.0–10.0 × 10⁹/L)
- Lymphocyte count 6.1 × 10⁹/L (1.2–3.4)
- Hemoglobin level 13.6 g/dL (14.0–18.0)
- Platelet count 87 × 109/L (150–400), reaching a nadir of 62 on hospital day 23
- Albumin 47 g/L (35–50)
- Total bilirubin 48 µmol/L (2–20)
- Alkaline phosphatase 137 U/L (40–135)
- Alanine aminotransferase 22 U/L (9–69)
- Aspartate aminotransferase 72 U/L (5–45).
He continued to have temperature spikes. His alkaline phosphatase level plateaued at 1,015 U/L on day 30, while his alanine aminotransferase and aspartate aminotransferase levels remained stable.
The patient’s ceftriaxone was continued, and the other antibiotics were replaced with doxycycline. Fluconazole was added when sputum culture grew Candida albicans. However, these drugs were later discontinued in view of worsening results on liver enzyme testing.
The evaluation continues
Sputum cultures were negative for acid-fast bacilli on 3 occasions.
Serologic testing was negative for:
- Hepatitis B surface antigen (but hepatitis B surface antibody was positive at > 1,000 IU/L)
- Hepatitis C virus antibody
- Cytomegalovirus immunoglobulin (Ig) G
- Toxoplasma gondii IgG
- Epstein-Barr virus viral capsid antigen IgM
- Rickettsia antibodies
- Antinuclear antibody
- Antineutrophil cytoplasmic antibody
- Antiglomerular basement membrane antibody.
Chest radiography showed blunting of both costophrenic angles and mild prominence of right perihilar interstitial markings and the right hilum.
Computed tomography of the chest, abdomen, and pelvis showed a subpleural density in the lower lobe of the right lung, small bilateral pleural effusions, right hilar lymphadenopathy, and splenomegaly with no specific hepatobiliary abnormality.
A white blood cell nuclear scan found no occult infection.
Abdominal ultrasonography showed a prominent liver and spleen. The liver parenchyma showed diffuse decreased echogenicity, suggestive of hepatitis.
Transesophageal echocardiography showed no vegetations or valvular abnormalities.
Bronchoscopy showed normal airways without evidence of pulmonary hemorrhage. No foci of infection were obtained. A focus of granuloma consisting of epithelioid histiocytes in tight clusters was seen on washings from the right lower lobe, but no malignant cells were seen.
Sections of pathologically enlarged right hilar and subcarinal lymph nodes obtained with transbronchial needle aspiration were sent for cytologic analysis and flow cytometry.
Cultures for tuberculous and fungal organisms were negative.
A clue. On further inquiry, the patient said he had gone swimming in the natural pool, or cenote, under a rock formation at Cenote Maya Park in Mexico.
DIFFERENTIAL DIAGNOSIS
1. Which of the following is not in the differential diagnosis?
- Disseminated tuberculosis
- Coccidioidomycosis
- Subacute infective endocarditis
- Disseminated histoplasmosis
- Blastomycosis
Although the patient has a systemic disease, subacute infective endocarditis is not likely because of a lack of predisposing factors such as a history of endocarditis, abnormal or artificial heart valve, or intravenous drug abuse. Moreover, negative blood cultures and the absence of vegetations on echocardiography make endocarditis very unlikely.
Given that the patient is immunosuppressed, opportunistic infection must be at the top of the differential diagnosis. Histoplasmosis, coccidioidomycosis, and blastomycosis are endemic in Mexico. Disseminated histoplasmosis is the most likely diagnosis; coccidioidomycosis and blastomycosis are less likely, based on the history, signs, and symptoms. Disseminated tuberculosis must be excluded before other diagnostic possibilities are considered.
TUBERCULOSIS IN PATIENTS ON TNF-ALPHA ANTAGONISTS
Tuberculosis has been reported in patients taking TNF-alpha antagonists.1 The frequency of tuberculosis is much higher than that of other opportunistic infections, and over 50% of reported cases involve extrapulmonary tissues in patients treated with TNF-alpha antagonists.2
British Thoracic Society guidelines recommend screening for latent tuberculosis before starting treatment with a TNF-alpha antagonist; the screening should include a history of tuberculosis treatment, a clinical examination, chest radiography, and a tuberculin skin test.3 Patients found to have active tuberculosis should receive a minimum of 2 months of standard treatment before starting a TNF-alpha antagonist. Patients with evidence of past tuberculosis or a history of tuberculosis who received adequate treatment should be monitored regularly. Patients with prior tuberculosis not adequately treated should receive chemoprophylaxis before starting a TNF-alpha antagonist.
Fever, night sweats, and intrathoracic and intra-abdominal lymphadenopathy are common features of disseminated tuberculosis. Upper-lobe cavitary disease or miliary lesions may be seen on chest radiography, but atypical presentations with lower-lobe infiltrate are not uncommon in immunosuppressed patients.4
A negative tuberculin skin test and a normal chest radiograph 3 months ago, along with negative sputum and bronchial lavage fluid cultures and no history of tuberculosis contact, make tuberculosis unlikely in our patient.
COCCIDIOIDOMYCOSIS
Coccidioidomycosis (valley fever) is caused by the fungus Coccidioides immitis, which lives in the soil and is acquired by inhalation of airborne microscopic spores.
Fatigue, cough, fever, shortness of breath, headache, night sweats, muscle or joint pain, and a rash on the upper body or legs are common symptoms. It may cause a self-limiting flulike illness. From 5% to 10% of patients may develop serious long-term lung problems. In a small number of patients, the disease may progress beyond the lungs to involve the central nervous system, spinal cord, skin, bones, and joints.5
Serologic testing is highly useful for the diagnosis. Antigen testing has a sensitivity of 71% and a specificity of 98% for the diagnosis, but cross-reactivity occurs in 10% of patients with other types of mycosis. Respiratory secretions and tissue samples should undergo microscopic study and culture.
BLASTOMYCOSIS
Blastomycosis is caused by the fungus Blastomyces dermatitidis, which lives in soil and in association with decomposing organic matter such as wood and leaves. Inhalation of spores may cause a flulike illness or pneumonia. In serious cases, the disease can spread to skin and bone.
The diagnosis is established with fungal cultures of tissue samples or body fluids (bone marrow, liver tissue, skin, sputum, blood). Rapid diagnosis may be obtained by examination of the secretions under a microscope, where typical broad-based budding yeast can be seen in almost 90% of cases.6 Antigen may also be detected in urine and serum7; the sensitivity of antigen testing is 93% and the specificity is 98%. Serologic testing is not recommended for diagnosis of blastomycosis because of poor sensitivity and specificity.8
NARROWING THE DIFFERENTIAL
Both coccidioidomycosis and blastomycosis should be included in the differential diagnosis of a systemic disease with subacute onset and prominent lung involvement in a patient returning from travel to Mexico. The lack of involvement of the central nervous system, spinal cord, bones, or joints makes these infections less likely in our patient.
However, swimming in a cenote under a rock formation is an important clue to the diagnosis in our patient, as it puts him at risk of inhaling microconidia or hyphal elements of histoplasmosis. This, along with his immunocompromised status, fever, hemoptysis, night sweats, skin and lung features, and the generally subacute course of his illness, make disseminated histoplasmosis the most likely diagnosis.
Radiologic findings of pulmonary infiltrate with effusion and elevated lactate dehydrogenase, aminotransferases, and alkaline phosphatase increase the likelihood of disseminated histoplasmosis.
HISTOPLASMOSIS
Histoplasma capsulatum is a dimorphic fungus that thrives in the soil and caves of regions with moderate climate, especially in soil containing large amounts of bird excreta or bat guano.9 Bats are natural hosts of this organism, and it is endemic in North and Central America, including parts of Mexico. Air currents can carry the microconidia for miles, thus exposing people without direct contact with contaminated sites.
The infection is usually acquired by inhalation of microconidia or small hyphal elements or by reactivation of previously quiescent foci of infection in an immunosuppressed patient. Most patients exposed to H capsulatum remain asymptomatic or develop mild symptoms, which are self-limiting. A small number develop acute pulmonary histoplasmosis or chronic cavitary histoplasmosis. Disseminated disease usually occurs only in an immunosuppressed host.
Acute pulmonary histoplasmosis presents with fever, malaise, headache, weakness, substernal chest pain, and dry cough and may be associated with erythema nodosum, erythema multiforme, and arthralgias. It may be mistaken for sarcoidosis since enlarged hilar and mediastinal lymph nodes are often seen on chest radiography.10
Progressive disseminated histoplasmosis is defined as a clinical illness that does not improve after at least 3 weeks of observation and is associated with physical or radiographic findings with or without laboratory evidence of extrapulmonary involvement.11
Fever, malaise, anorexia, weight loss, night sweats, hepatosplenomegaly, and lymphadenopathy are features of progressive disseminated histoplasmosis.
Cutaneous manifestations of disseminated histoplasmosis occur in 10% to 25% of patients with acquired immunodeficiency syndrome and include papules, plaques with or without crust, pustules, nodules, lesions resembling molluscum contagiosum virus infection, acneiform eruptions, erythematous macules, and keratotic plaques.12
TESTING FOR HISTOPLASMOSIS
2. What investigation is least likely to help confirm the diagnosis of disseminated histoplasmosis?
- Polymerase chain reaction (PCR) testing of serum, cerebrospinal fluid, and bronchoalveolar lavage specimens
- Urinary Histoplasma antigen testing
- Serologic testing
- Blood and bronchoalveolar lavage cultures
Urinary Histoplasma antigen has a sensitivity of 90% for the diagnosis of disseminated histoplasmosis in patients with acquired immunodeficiency syndrome.18 It is less useful for pulmonary forms of histoplasmosis: the sensitivity is 75% and may even be less in milder or chronic forms of pneumonia.19 False-positive reactions may occur in patients with other fungal infections such as coccidioidomycosis, blastomycosis, paracoccidioidomycosis and penicilliosis.20 Urine antigen levels can also be used to monitor therapy, since levels decrease during therapy and increase in 90% of those who have a relapse.21
Our patient’s urinary Histoplasma antigen level was greater than 23.0 ng/mL (positive is > 0.50).
Serologic testing. Immunodiffusion immunoglobulin G (IgG) testing for Histoplasma and Blastomyces was negative, as was an enzyme immunoassay for Coccidioides IgG and IgM. However, antibody tests are less useful in immunosuppressed patients,22 and thus a negative result does not rule out histoplasmosis. A fourfold rise in complement fixation antibody titer is diagnostic of acute histoplasmosis. A single complement fixation titer of 1:32 is suggestive but not diagnostic of histoplasmosis. Cross-reactions may occur with other fungal infections like blastomycosis. The immunodiffusion assay has a greater specificity but slightly less sensitivity than the complement fixation assay.19
Culture of H capsulatum is the definitive test to establish a diagnosis of histoplasmosis. Culture can be performed on samples taken from blood, bone marrow, sputum, and bronchoalveolar lavage fluid, or from lung, liver, or lymph node tissue. Cultures are positive in 74% to 82% of cases of progressive disseminated histoplasmosis.13 However, treatment should not await culture results since the fungus may take several weeks to grow.
Back to our patient
Although Histoplasma serologic studies and cultures were negative, the diagnosis of disseminated histoplasmosis was made on the basis of the patient’s immunosuppressed status, travel history, clinical features, and positivity for urine Histoplasma antigen. Though urine histoplama antigen may be falsely positive in other fungal infections such as coccidioidomycosis, paracoccidioidomycosis, and blastomycosis, clinical features and the absence of central nervous system, joint, and bone involvement suggested disseminated histoplasmosis.
TREATMENT
3. What is the appropriate treatment for this patient?
- Amphotericin B followed by oral itraconozole
- Oral fluconazole
- Oral itraconazole
Liposomal amphotericin B or amphotericin B deoxycholate is recommended as initial therapy for moderately severe to severe and progressive disseminated histoplasmosis. It should be continued for 1 to 2 weeks, followed by oral itraconazole (200 mg 3 times daily for 3 days, then 200 mg 2 times daily for at least 12 months).
Monitoring itraconazole therapy through random serum levels is strongly recommended, and a random concentration of at least 1.0 mg/mL is recommended.23
Urine antigen levels should be measured before treatment is started, at 2 weeks, at 1 month, then every 3 months during therapy, continuing for 12 months after treatment is stopped.11
Lifelong suppressive therapy with itraconazole 200 mg daily may be required in immunosuppressed patients and patients who have a relapse despite appropriate therapy.11
While oral itraconazole is used as a sole agent for the treatment of mild to moderate acute pulmonary histoplasmosis and chronic cavitary pulmonary histoplasmosis, oral treatment alone with either fluconazole or itraconazole is not recommended for the treatment of progressive disseminated histoplasmosis.11
COMPLICATIONS OF HISTOPLASMOSIS
4. Which of the following is not a possible complication of histoplasmosis?
- Chronic cavitary pulmonary histoplasmosis
- Fibrosing mediastinitis
- Hypoadrenalism
- Hypothyroidism
Chronic cavitary pulmonary histoplasmosis usually develops in patients with underlying emphysema. Fatigue, night sweats, fever, anorexia, and weight loss are features of chronic cavitary pulmonary histoplasmosis. Progression of necrosis may lead to “marching cavity,” in which necrosis increases the size of the cavity and may consume an entire lobe.10
Fibrosing mediastinitis is an uncommon but often lethal complication of disseminated histoplasmosis. Increasing dyspnea, cough, hemoptysis, and signs of superior vena cava syndrome and right heart failure may develop. However, fibrosing mediastinitis is thought to be due to an exuberant immune response to past Histoplasma infection and would not be expected in an immunocompromised patient.17
Hypoadrenalism. Extensive destruction of the adrenal glands may lead to hypoadrenalism, manifesting as orthostatic hypotension, hyperkalemia, hyponatremia, and evidence of markedly enlarged adrenal glands with central necrosis on computed tomography.24
Hypothyroidism. Acute or disseminated histoplasmosis has not been reported to cause thyroid dysfunction.
CASE CONCLUSION
Our patient was treated with itraconazole 200 mg twice daily for 24 months. Although the literature supports lifelong itraconazole therapy in immunosuppressed patients, our patient was reluctant to do so. He agreed to close monitoring. If symptoms recur, itraconazole will be reinstituted and continued lifelong.
- Vergidis P, Avery RK, Wheat LJ, et al. Histoplasmosis complicating tumor necrosis factor-a blocker therapy: a retrospective analysis of 98 cases. Clin Infect Dis 2015; 61:409–417.
- Gardam MA, Keystone EC, Menzies R, et al. Anti-tumour necrosis factor agents and tuberculosis risk: mechanism of action and clinical management. Lancet Infect Dis 2003; 3:148–155.
- British Thoracic Society Standards of Care Committee. BTS recommendations for assessing risk and for managing Mycobacterium tuberculosis infection and disease in patients due to start anti-TNF-alpha treatment. Thorax 2005; 60:800–805.
- Case records of the Massachusetts General Hospital. Weekly clinicopathological exercises. Case 38-1998. A 19-year-old man with the acquired immunodeficiency syndrome and persistent fever. N Engl J Med 1998; 339:1835–1843.
- Galgiani JN, Ampel NM, Blair JE, et al; Infectious Diseases Society of America. Coccidioidomycosis. Clin Infect Dis 2005; 41:1217–1223.
- Lemos LB, Guo M, Baliga M. Blastomycosis: organ involvement and etiologic diagnosis. A review of 123 patients from Mississippi. Ann Diagn Pathol 2000; 4:391–406.
- Durkin M, Witt J, Lemonte A, Wheat B, Connolly P. Antigen assay with the potential to aid in diagnosis of blastomycosis. J Clin Micribiol 2004; 42:4873–4875.
- Wheat LJ. Approach to the diagnosis of the endemic mycoses. Clin Chest Med 2009; 30:379–389.
- Colombo AL, Tobón A, Restrepo A, Queiroz-Telles F, Nucci M. Epidemiology of endemic systemic fungal infections in Latin America. Med Mycol 2011; 49:785–798.
- Kauffman CA. Histoplasmosis: a clinical and laboratory update. Clin Microbiol Rev 2007; 20:115–132.
- Wheat LJ, Freifeld AG, Kleiman MB, et al; Infectious Diseases Society of America. Clinical practice guidelines for the management of patients with histoplasmosis: 2007 update by the Infectious Diseases Society of America. Clin Infect Dis 2007; 45:807–825.
- Chang P, Rodas C. Skin lesions in histoplasmosis. Clinics Dermatol 2012; 30:592–598.
- Wheat LJ. Improvements in diagnosis of histoplasmosis. Expert Opin Biol Ther 2006; 6:1207–1221.
- Connolly P, Hage CA, Bariola JR, et al. Blastomyces dermatitidis antigen detection by quantitative enzyme immunoassay. Clin Vaccine Immunol 2012; 19:53–56.
- Castillo CG, Kauffman CA, Miceli MH. Blastomycosis. Infect Dis Clin North Am 2016; 30:247–264.
- Stockamp NW, Thompson GR 3rd. Coccidioidomycosis. Infect Dis Clin North Am 2016; 30:229–246.
- Wheat LJ, Azar MM, Bahr NC, Spec A, Relich RF, Hage C. Histoplasmosis. Infect Dis Clin North Am 2016; 30:207–227.
- Wheat LJ, Garringer T, Drizendine E, Connolly P. Diagnosis of histoplasmosis by antigen detection based upon experience at the histoplasmosis reference laboratory. Diagn Microbiol Infect Dis 2002; 14:1389–1391.
- Kauffman CA. Diagnosis of histoplasmosis in immunosuppressed patients. Curr Opin Infect Dis 2008; 21:421–425.
- Wheat LJ. Improvements in diagnosis of histoplasmosis. Expert Opin Biol Ther 2006; 6:1207–1221.
- Wheat LJ, Connolly P, Haddad N, Le Monte A, Brizendine E, Hafner R. Antigen clearance during treatment of disseminated histoplasmosis with itraconazole versus fluconazole in patients with AIDS. Antimicrob Agents Chemother 2002; 46:248–250.
- Wheat LJ. Current diagnosis of histoplasmosis. Trends Microbiol 2003; 11:488–494.
- Poirier JM, Cheymol G. Optimisation of itraconazole therapy using target drug concentrations. Clin Pharmacokinet 1998; 35:461–473.
- Sarosi GA, Voth DW, Dahl BA, Doto IL, Tosh FE. Disseminated histoplasmosis: results of long-term follow-up. Ann Intern Med 1971; 75:511–516.
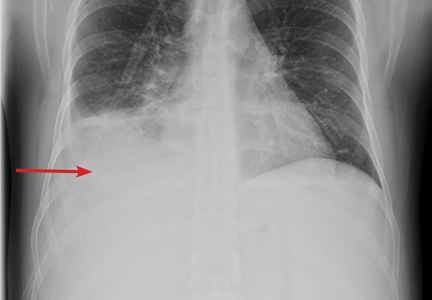
ADHD: Overdiagnosed and overtreated, or misdiagnosed and mistreated?
Pharmacotherapy and behavioral therapy are currently used with success in treating attention-deficit/hyperactivity disorder (ADHD) in children, adolescents, and adults. Ongoing changes in healthcare require physicians to improve the quality of care, reduce costs of treatment, and manage their patients’ health, not just their illnesses. Behavioral and pharmacologic studies provide us with an opportunity to maximize treatment of ADHD and adapt it to the needs of individuals.
This article identifies common problems in treating ADHD, discusses limits of care in pharmacotherapy and behavioral intervention, and offers practical recommendations for treating ADHD in the changing world of healthcare.
A CHANGING MEDICAL CLIMATE
The Affordable Care Act of 2010 sought to transform medical care in the United States from procedures to performance, from acute episodes of illness to integrated care across the lifespan, and from inefficient care to efficient and affordable care with measurable outcomes. At the time of this writing, nobody knows whether the Affordable Care Act will survive, but these are still good goals. Because ADHD is the most common behavioral disorder of childhood, value-based care is essential.1
ADHD ON THE RISE—WHY?
The prevalence of ADHD increased 42% from 2003 to 2011,2 with increases in nearly all demographic groups in the United States regardless of race, sex, and socioeconomic status. More than 1 in 10 school-age children (11%) in the United States now meet the criteria for the diagnosis of ADHD; among adolescents, 1 in 5 high school boys and 1 in 11 high school girls meet the criteria.2
Rates vary among states, from a low of 4.2% for children ages 4 to 17 in Nevada to a high of 14.6% in Arkansas.3 Worldwide estimates of ADHD prevalence range from 2.2% to 17.8%,4 with the most recent meta-analysis for North America and Europe indicating a 7.2% worldwide prevalence in people age 18 and younger.5
Such data have sparked criticism, with some saying that ADHD is overdiagnosed, others saying it is underdiagnosed, and most agreeing that it is misdiagnosed.
Changing definitions of ADHD may have had a small effect on the increase in prevalence,6 but the change is more likely a result of heightened awareness and recognition of symptoms. Even so, guidelines for diagnosing ADHD are still not rigorously applied, contributing to misdiagnosis. For example, in a study of 50 pediatric practices, only half of clinicians said they followed diagnostic guidelines to determine symptom criteria from at least 2 sources and across 2 settings, yet nearly all (93%) reported immediately prescribing medications for treatment.7
The Diagnostic and Statistical Manual of Mental Disorders, Fifth Edition,8 requires evidence of a persistent pattern of inattention or hyperactivity/impulsivity, or both, with a severity that interferes with developmental functioning in 2 or more settings; was present before age 12; and cannot be accounted for by another behavioral health disorder such as depression, anxiety, or trauma. The diagnosis should document the presence of at least 6 of 9 symptoms of inattention (or 5 symptoms for teens age 17 or older), or at least 6 of 9 symptoms of hyperactive/impulsive behavior (5 symptoms for teens age 17 and older). Symptoms are best documented when reported by at least 2 observers.
COSTS OF ADHD
ADHD is expensive to society. National yearly healthcare costs have ranged from $143 billion to $266 billion,9 with over half this amount assumed directly by families.10 Even in previous decades when prevalence rates hovered around 5%, the cost of workday loss in the United States was high for adult patients and for parents of young children with ADHD needing to take time off from work for doctors’ visits.11 Projections across 10 countries indicated that adults with ADHD lost more workdays than did workers without ADHD.12
There is also a trend toward visits that are more expensive. Between 2000 and 2010, the number of visits for ADHD to psychiatrists rose from 24% to 36%, while the number of less-costly visits to pediatricians decreased from 54% to 47%.13
Thus, over the past 15 years, symptoms of ADHD have become more readily recognized, prevalence rates in the population have increased significantly, and associated costs have increased dramatically, with costs extending beyond individual impairment to a loss of productivity at the workplace. And treatment, typically with drugs, has been used without sufficient application of current diagnostic criteria. What impact does this have on the practicing physician?
DRUG TREATMENT: GOLD STANDARD OR NATIONAL DISASTER?
Stimulants are considered the standard of medical care for the symptoms of ADHD, according to the 2011 practice guidelines of the American Academy of Pediatrics.14 They are efficacious and cost-effective when optimal dosing is achieved, since the patient usually manages treatment independently, requiring minimal physician input in the months and years after successful titration.
For these reasons, the use of stimulants to treat ADHD has increased dramatically in the last decade. According to the National Survey of Children’s Health, as a result of an increase in parent-reported ADHD, more US children were receiving medical treatment for the disorder in 2011 than in any previous year reported, and the prevalence of pharmacotherapy in children ages 14 to 17 increased 28% over the 4 years from 2007 to 2011.2
Dr. Keith Conners, an early advocate for recognition of ADHD, has called the staggering increase in the rates of diagnosis and drug treatment a “national disaster of dangerous proportions.”15 Nevertheless, many children and families have benefited in a cost-effective manner.
STRATEGIES FOR TITRATION
Physicians typically rely on 4 strategies to titrate stimulants,16 presented below in order of increasing complexity.
Prescribe-and-wait
Often, physicians write a prescription and direct the parent to call back or visit the office to relay the child’s response after a specified period, typically 1 week to 1 month.
This method is convenient in a busy practice and is informative to the physician in a general way. The drawback to this method is that it seldom results in optimal treatment. If the parent does not call back, the physician may assume the treatment was successful without being certain.
Dose-to-improvement
In this approach, the physician monitors titration more closely and increases the dose until a positive response is achieved, after which the dose is maintained. This method reduces symptoms but does not ensure optimal treatment, as there still may be room for improvement.
Forced-dose titration
This method is often used in clinical trials. The dose is ramped up until side effects occur and is then reduced until the side effects go away.
This method often results in optimal dosing, as a forced dose yields a greater reduction in symptoms. But it requires close monitoring by the physician, with multiple reports from parents and teachers after each dose increase to determine whether benefit at the higher dose outweighs the side effects and whether side effects can be managed.
Blinded placebo trial
Also often used in research, this method typically requires a research pharmacy to prepare capsules of stimulant medicine in low, moderate, high, and placebo doses.17 All doses are blinded and given over 4 weeks in a forced-dose titration—a placebo capsule with 3 active medication doses in escalating order, which is typical of outpatient pediatric practice. Placebo capsules are randomly assigned to 1 of the 4 weeks, and behavior is monitored over the 7 days of administration by teachers and parents.
This strategy has benefits similar to those of forced-dose titration, and it further delineates medicine response—both side effects and behavior change—by adding a no-medicine placebo condition. It is a systematic, monitored “experiment” for parents who are wary or distrustful of ADHD pharmacotherapy, and it has notable benefits.18 It is also useful for teenagers who are reluctant to use medicine to treat symptoms. It arrives at optimal treatment in a timely manner, usually about 4 to 5 weeks.
On the other hand, this approach requires diligence from families, teachers, and caregivers during the initiation phase, and it requires consistent engagement of the physician team.
Some pediatricians designate a caregiver to monitor titration with the parent; with each new weekly dose, the caregiver reports the child’s progress to the physician.
ENSURING ADHERENCE
Essential to effective stimulant treatment for ADHD is not whether the medicine works (it does),19 but whether the patient continues to use it.
In treatment studies and pharmacy database analyses, rates of inconsistent use or discontinuation of medication (both considered nonadherence) were 13.2% to 64% within the first year,20 and more than 95% of teenagers discontinue pharmacotherapy before age 21.21
Clinician engagement at the onset of stimulant titration is instrumental to treatment adherence.22,23 When pharmacotherapy is loosely monitored during initiation, adherence is highly inconsistent. Some physicians wait as long as 72 days after first prescribing a medication to contact the patient or family,7 and most children with ADHD who discontinue their medications do so within the first year.24
FACTORS THAT INHIBIT ADHERENCE
What factors inhibit adherence to successful pharmacotherapy for ADHD?
Treatment nonadherence is often associated with a parent’s perception that the medication is not working.25 Physicians can often overcome this perception by speaking with the parent, conveying that at the start of treatment titrating to the optimal dose takes time, and that it does not mean “something is wrong.” But without physician contact, parents do not have the occasion to discuss side effects and benefits and tend not to voice fears such as whether the medicine will affect the child’s physical development or result in drug abuse later in life.26
At the beginning of treatment, a child may become too focused, alarming the parent. This overfocused effect is often misunderstood and does not always persist. In addition, when a child better manages his or her own behavior, the contrast to previous behavior may look like something is wrong, when instead the child’s behavior is actually normalizing. Medicine-induced anxiety—in the child or, by association, in the parent—may be misunderstood, and subsequently the parent just stops the child’s treatment rather than seek physician guidance.
Nonadherence is also more prevalent with immediate-release than with extended-release formulations.27,28
Problems can be summarized as follows7:
- Systematic physician observation of response to stimulant titration is often missing at the onset of treatment
- “Best dose” is inconsistently achieved
- Patient adherence to treatment is inconsistently monitored.
The long-term consequences of nonadherence to therapy for ADHD have not been sufficiently examined,20 but some groups, especially adolescents, show problematic outcomes when treatment is not applied. For example, in one longitudinal study, substance use disorder was significantly higher in youths with ADHD who were never treated with medicine than in “neurotypical” youths and those with ADHD who were treated pharmacologically.29
BEHAVIORAL INTERVENTION
Although opinions vary as to the advantages of drug therapy vs behavioral intervention in ADHD, there is evidence that a combined approach is best.30–33 Pharmacotherapy works inside the skin to reduce symptoms of inattention and overactivity, and behavioral therapy works outside the skin to teach new skills.

A report from the US Centers for Disease Control and Prevention in 2016 stated that behavioral therapy should be the first treatment for young children with ADHD (ages 2 to 5), but noted that only 40% to 50% of young children with ADHD receive psychological services.36 At the same time, the use of pharmacotherapy has increased tremendously.
Beginning treatment with behavioral therapy rather than medicine has been found to be more cost-effective over time. For children ages 4 to 5, behavioral therapy is recommended as the first line by the clinical practice guidelines of the American Academy of Pediatrics.14 Beginning treatment with behavioral intervention has been shown to produce better outcomes overall than beginning with medication and indicates that lower doses may be used compared with pharmacotherapy that is not preceded by behavioral therapy.37 Findings also indicate that starting with behavioral therapy increases the cost-effectiveness of treatment for children with ADHD.38

Behavioral intervention has modest advantages over medicine for non-ADHD symptoms,42 as the practice satisfies the adage “pills don’t teach skills.”26 One advantage is that caregivers take an active role in managing child compliance, social interactions, and classroom deportment, as opposed to the relatively passive role of prescribing medicine only. Parents and teachers form collaborative partnerships to increase consistency and extend the reach of change. In the National Institute of Mental Health multimodal treatment study, the only children whose behavior normalized were those who used medicine and whose caregivers gave up negative, harsh, inconsistent, and ineffective discipline43; that is, parents changed their own behavior.
Parent training is important, as parents must often manage their children’s behavior on their own the best they can, with little coaching and assistance. Primary care physicians may often refer parents to established local programs for training, and ongoing coaching can ensure that skills acquired in such training programs continue to be systematically applied. Pharmacotherapy is focused almost solely on reducing symptoms, but reducing symptoms does not necessarily lead to improved functioning. A multimodal approach helps individuals adapt to demanding settings, achieve personal goals, and contribute to social relationships. Outcomes depend on teaching what to do as well as reducing what not to do. Behavioral therapy44 shaped by peers, caregivers, teachers, and other factors can be effectively remediate the difficulties of children with ADHD.
The disadvantages of behavioral therapy are that it is not readily available, adds initial cost to treatment, and requires parents to invest more time at the beginning of intervention. But behavioral therapy reduces costs over time, enhances ADHD pharmacotherapy, often reduces the need for higher dosing, reduces visits to the doctor’s office, maintains behavior improvement and symptom reduction in the long term, and significantly increases quality of care.42
A RECOMMENDED ADHD CARE PATH
How do we increase quality of care, reduce costs, and improve value of care for patients with ADHD? The treatment of ADHD as a chronic condition is collaborative. Several practices may be combined in a quality care path.
Follow up more frequently at the start of drug treatment
Physicians may give more frequent attention to the process of pharmacotherapy at the start of treatment. Pharmacotherapy is typically introduced by the prescribe-and-wait method, which often produces less than optimal dosing, limited treatment adherence, and inconsistent outcomes.45,46 Though the cost of giving a prescription is low, the cost for unsustained treatment is high, and this undermines the usefulness of medical therapy. The simple solution is systematic titration through frequent contact between the prescribing physician and the parents in the first few weeks of pharmacotherapy. Subsequent ongoing monitoring of adherence in the first year is likely to reduce costs over time.47
Achieve optimal dosing
Pharmacotherapy should be applied with a plan in mind to produce evidence that optimal dosing has been achieved, ie, improvement is consistently observed in school and home.48
If side effects occur, parents and physician must determine whether they outweigh the benefits. If the benefits outweigh the side effects, then the physician and parents should maintain treatment and manage side effects accordingly. If the side effects outweigh the benefits, the titration process should continue with different dosing or delivery until optimal dosing is achieved or until the physician determines that pharmacotherapy is no longer appropriate.
Though different procedures to measure optimal dosing are available, medication effectiveness can be determined in 7-day-per-dose exposure during a period when the child’s schedule is consistent. A consistent schedule is important, as medicine effects are difficult to determine during loosely defined schedules such as during school vacations or holidays. Involving multiple observers is important as well. Teachers, for example, are rarely consulted during titration49 though they are excellent observers and are with the child daily when medication is most effective.
Integrate behavioral therapy
Given the evidence that behavioral intervention enhances drug therapy,50 behavioral therapy should be integrated with drug therapy to create an inclusive context for change. Behavioral therapy is delivered in a variety of ways including individual and group parent training, home management consultation, daily school report cards, behavioral coaching, classroom behavior management, and peer interventions. Behavioral intervention enhances stimulant effectiveness51 to improve compliance, on-task behavior, academic performance, social relationships and family functioning.52
Behavioral therapy is now generally included in health insurance coverage. In addition, many clinics now offer shared medical appointments that combine close monitoring of drug therapy with behavioral coaching to small groups of parents in order to manage symptoms of ADHD at a minimal cost.
Measure outcomes
Measuring outcomes of ADHD treatment over time improves care. The primary care physician may use electronic medical record data management to track a patient’s progress related to ADHD features. The Clinical Global Improvement scale is a 7-point assessment that is easily done by parents and the physician at well visits and is ubiquitous in ADHD clinical trials.53 Change over time indicates when to suggest changes in treatment.
Finally, clinicians can demonstrate that appropriate, comprehensive care does not simply relieve ADHD symptoms, but also promotes quality of life. Healthcare providers can guide parents to improve existing abilities in children rather than leave parents with the notion that something is wrong with their child.
For example, research suggests that some patients with ADHD show enhanced creativity54,55; cognitive profiles with abilities in logical thinking, reasoning, and common sense56; and the capacity for intense focus in areas of interest.57 Some authors have even speculated that historical figures such as Thomas Edison and Albert Einstein would have been diagnosed with ADHD by today’s standards.58
MEETING THE DEMANDS OF AFFORDABLE CARE
Many children and youth diagnosed with ADHD still receive no or insufficient pharmacotherapy and behavioral therapy. More than one-third of children reported by their parents as not receiving treatment were also reported to have moderate or severe ADHD.59,60
At the same time, though more children today are being prescribed pharmacotherapy when ADHD is diagnosed, physician involvement is often limited during titration,7 and treatment usually consists of reducing symptoms without increasing adaptive behaviors with behavioral therapy.45 In addition, even though ADHD symptoms initially improve with pharmacotherapy, improvement is not sustained because of poor adherence.
The healthcare costs of ADHD are high because impairment extends beyond the patient to disrupt family life and even the workplace, as parents take time off to manage children. Because of uncertain costs of quality treatment, the best-practice treatment option for ADHD—ie, combined behavioral therapy and medicine—is increasingly accessible but still not as widely accessible as medication treatment. The value of care improves slowly while the number of patients continues to increase. However, caregivers have the opportunity to add value to the treatment of ADHD.
When we improve medication management, improve adherence to treatment, combine behavioral therapy and pharmacotherapy, consistently measure outcomes, and recognize positive traits of ADHD in our patients, we may turn the demands of affordable care into a breakthrough for many who live with the condition.
Acknowledgment: The authors wish to thank Ralph D’Alessio, BA, for his services in reference review and for his conscientious participation in the Cleveland Clinic Medication Monitoring Clinic, ADHD Center for Evaluation and Treatment.
- Rostain A, Jensen PS, Connor DF, Miesle LM, Faraone SV. Toward quality care in ADHD: defining the goals of treatment. J Atten Disord 2015; 19:99–117.
- Visser SN, Danielson ML, Bitsko RH, et al. Trends in the parent-report of health care provider-diagnosed and medicated attention-deficit/hyperactivity disorder: United States, 2003-2011. J Am Acad Child Adolesc Psychiatry 2014; 53:34–46.e2.
- Visser SN, Blumberg SJ, Danielson ML, Bitsko RH, Kogan MD. State-based and demographic variation in parent-reported medication rates for attention-deficit/hyperactivity disorder, 2007–2008. Prev Chronic Dis 2013; 10:E09.
- Skounti M, Philalithis A, Galanakis E. Variations in prevalence of attention deficit hyperactivity disorder worldwide. Eur J Pediatr 2007; 166:117–123.
- Thomas R, Sanders S, Doust J, Beller E, Glasziou P. Prevalence of attention-deficit/hyperactivity disorder: a systematic review and meta-analysis. Pediatrics 2015; 135:e994–1001.
- McKeown RE, Holbrook JR, Danielson ML, Cuffe SP, Wolraich ML, Visser SN. The impact of case definition on attention-deficit/hyperactivity disorder prevalence estimates in community-based samples of school-aged children. J Am Acad Child Adolesc Psychiatry 2015; 54:53–61.
- Epstein JN, Kelleher KJ, Baum R, et al. Variability in ADHD care in community-based pediatrics. Pediatrics 2014; 134:1136–1143.
- American Psychiatric Association. Diagnostic and Statistical Manual of Mental Disorders, Fifth Edition. Arlington VA: American Psychiatric Association Publishing, 2013.
- Doshi JA, Hodgkins P, Kahle J, et al. Economic impact of childhood and adult attention-deficit/hyperactivity disorder in the United States. J Am Acad Child Adolesc Psychiatry 2012; 51:990–1002.e2.
- Abright AR. Estimating the costs of attention-deficit/hyperactivity disorder. J Am Acad Child Adolesc Psychiatry 2012; 51:987–989.
- Birnbaum HG, Kessler RC, Lowe SW, et al. Costs of attention deficit-hyperactivity disorder (ADHD) in the US: excess costs of persons with ADHD and their family members in 2000. Curr Med Res Opin 2005; 21:195–206.
- de Graaf R, Kessler RC, Fayyad J, et al. The prevalence and effects of adult attention-deficit/hyperactivity disorder (ADHD) on the performance of workers: results from the WHO World Mental Health Survey Initiative. Occup Environ Med 2008; 65:835–842.
- Garfield CF, Dorsey ER, Zhu S, et al. Trends in attention deficit hyperactivity disorder ambulatory diagnosis and medical treatment in the United States, 2000–2010. Acad Pediatr 2012; 12:110–116.
- Subcommittee on Attention-Deficit/Hyperactivity Disorder, Steering Committee on Quality Improvement and Management, Wolraich M, Brown L, Brown RT, et al. ADHD: clinical practice guideline for the diagnosis, evaluation, and treatment of attention-deficit/hyperactivity disorder in children and adolescents. Pediatrics 2011; 128:1007–1022.
- Schwarz A. The selling of attention deficit disorder. New York Times December 14, 2013:A1.
- Manos MJ, Tom-Revzon C, Bukstein OG, Crismon ML. Changes and challenges: managing ADHD in a fast-paced world. J Manag Care Pharm 2007; 13(suppl B):S2–S16.
- Rapport MD, Denney C. Titrating methylphenidate in children with attention-deficit/hyperactivity disorder: is body mass predictive of clinical response? J Am Acad Child Adolesc Psychiatry 1997; 36:523–530.
- Sandler A, Glesne C, Geller G. Children’s and parents’ perspectives on open-label use of placebos in the treatment of ADHD. Child Care Health Dev 2008; 34:111–120.
- Faraone SV, Buitelaar J. Comparing the efficacy of stimulants for ADHD in children and adolescents using meta-analysis. Eur Child Adolesc Psychiatry 2010; 19:353–364.
- Adler LD, Nierenberg AA. Review of medication adherence in children and adults with ADHD. Postgrad Med 2010; 122:184–191.
- McCarthy S, Asherson P, Coghill D, et al. Attention-deficit hyperactivity disorder: treatment discontinuation in adolescents and young adults. Br J Psychiatry 2009; 194:273–277.
- Bussing R, Narwaney KJ, Winterstein AG, et al. Pharmacotherapy for incident attention-deficit/hyperactivity disorder: practice patterns and quality metrics. Curr Med Res Opin 2014; 30:1687–1699.
- O’Callaghan P. Adherence to stimulants in adult ADHD. Atten Defic Hyperact Disord 2014; 6:111–120.
- Toomey SL, Sox CM, Rusinak D, Finkelstein JA. Why do children with ADHD discontinue their medication? Clin Pediatr (Phila) 2012; 51:763–769.
- Bussing R, Koro-Ljungberg M, Noguchi K, Mason D, Mayerson G, Garvan CW. Willingness to use ADHD treatments: a mixed methods study of perceptions by adolescents, parents, health professionals and teachers. Soc Sci Med 2012; 74:92–100.
- Schoenfelder EN, Sasser T. Skills versus pills: psychosocial treatments for ADHD in childhood and adolescence. Pediatr Ann 2016; 45:e367–e372.
- López FA, Leroux JR. Long-acting stimulants for treatment of attention-deficit/hyperactivity disorder: a focus on extended-release formulations and the prodrug lisdexamfetamine dimesylate to address continuing clinical challenges. Atten Defic Hyperact Disord 2013; 5:249–265.
- Atzori P, Usala T, Carucci S, Danjou F, Zuddas A. Predictive factors for persistent use and compliance of immediate-release methylphenidate: a 36-month naturalistic study. J Child Adolesc Psychopharmacol 2009; 19:673–681.
- Yule AM, Martelon M, Faraone SV, Carrellas N, Wilens TE, Bierderman J. Examining the association between attention deficit hyperactivity disorder and substance use disorders: a familial risk analysis. J Psychiatr Res 2017; 85:49–55.
- Hauk L. AAP releases guideline on diagnosis, evaluation, and treatment of ADHD. Am Fam Physician 2013; 87:61–62.
- Arnold LE, Abikoff HB, Cantwell DP, et al. National Institute of Mental Health collaborative multimodal treatment study of children with ADHD (the MTA). Design challenges and choices. Arch Gen Psychiatry 1997; 54:865–870.
- Greenhill LL, Abikoff HB, Arnold LE, et al. Medication treatment strategies in the MTA study: relevance to clinicians and researchers. J Am Acad Child Adolesc Psychiatry 1996; 35:1304–1313.
- Richters JE, Arnold LE, Jensen PS, et al. NIMH collaborative multisite multimodal treatment study of children with ADHD: I. Background and rationale. J Am Acad Child Adolesc Psychiatry 1995; 34:987–1000.
- Manos MJ, Caserta DA, Short EJ, et al. Evaluation of the duration of action and comparative effectiveness of lisdexamfetamine dimesylate and behavioral treatment in youth with ADHD in a quasi-naturalistic setting. J Atten Disord 2015; 19:578–590.
- Evans SW, Owens JS, Bunford N. Evidence-based psychosocial treatments for children and adolescents with attention-deficit/hyperactivity disorder. J Clin Child Adolesc Psychol 2014; 43:527–551.
- Visser SN, Danielson ML, Wolraich ML, et al. Vital signs: national and state-specific patterns of attention deficit/hyperactivity disorder treatment among insured children aged 2–5 years—United States, 2008-2014. MMWR Morb Mortal Wkly Rep 2016; 65:443–450.
- Pelham WE Jr, Fabiano GA, Waxmonsky JG, et al. Treatment sequencing for childhood ADHD: a multiple-randomization study of adaptive medication and behavioral interventions. J Clin Child Adolesc Psychol 2016; 45:396–415.
- Page TF, Pelham WE 3rd, Fabiano GA, et al. Comparative cost analysis of sequential, adaptive, behavioral, pharmacological, and combined treatments for childhood ADHD. J Clin Child Adolesc Psychol 2016; 45:416–427.
- Fabiano GA, Schatz NK, Pelham WE Jr. Summer treatment programs for youth with ADHD. Child Adolesc Psychiatr Clin N Am 2014; 23:757–773.
- Pelham WE, Burrows-MacLean L, Gnagy EM, et al. A dose-ranging study of behavioral and pharmacological treatment in social settings for children with ADHD. J Abnorm Child Psychol 2014; 42:1019–1031.
- Fabiano GA, Pelham WE Jr, Gnagy EM, et al. The single and combined effects of multiple intensities of behavior modification and methylphenidate for children with attention deficit hyperactivity disorder in a classroom setting. School Psychology Rev 2007; 36:195–216.
- Reeves G, Anthony B. Multimodal treatments versus pharmacotherapy alone in children with psychiatric disorders: implications of access, effectiveness, and contextual treatment. Paediatr Drugs 2009; 11:165–169.
- Hinshaw SP. Moderators and mediators of treatment outcome for youth with ADHD: understanding for whom and how interventions work. J Pediatr Psychol 2007; 32:664–675.
- Hayes SC, Villatte M, Levin M, Hildebrandt M. Open, aware, and active: contextual approaches as an emerging trend in the behavioral and cognitive therapies. Annu Rev Clin Psychol 2011; 7:141–168.
- Epstein JN, Langberg JM, Lichtenstein PK, et al. Attention-deficit/hyperactivity disorder outcomes for children treated in community-based pediatric settings. Arch Pediatr Adolesc Med 2010; 164:160–165.
- Manos MJ. Pharmacologic treatment of ADHD: road conditions in driving patients to successful outcomes. Medscape J Med 2008; 10:5.
- Braun S, Russo L, Zeidler J, Linder R, Hodgkins P. Descriptive comparison of drug treatment-persistent, -nonpersistent, and nondrug treatment patients with newly diagnosed attention deficit/hyperactivity disorder in Germany. Clin Ther 2013; 35:673–685.
- Pliszka SR, Crismon ML, Hughes CW, et al; Texas Consensus Conference Panel on Pharmacotherapy of Childhood Attention Deficit Hyperactivity Disorder. The Texas Children’s Medication Algorithm Project: revision of the algorithm for pharmacotherapy of attention-deficit/hyperactivity disorder. J Am Acad Child Adolesc Psychiatry 2006; 45:642–657.
- Pelham WE Jr, Fabiano GA, Massetti GM. Evidence-based assessment of attention deficit hyperactivity disorder in children and adolescents. J Clin Child Adolesc Psychol 2005; 34:449–476.
- Fabiano GA, Pelham WE Jr, Coles EK, Gnagy EM, Chronis-Tuscano A, O’Connor BC. A meta-analysis of behavioral treatments for attention-deficit/hyperactivity disorder. Clin Psychol Rev 2009; 29:129–140.
- Pelham WE Jr, Fabiano GA. Evidence-based psychosocial treatments for attention-deficit/hyperactivity disorder. J Clin Child Adolesc Psychol 2008; 37:184–214.
- Knight LA, Rooney M, Chronis-Tuscano A. Psychosocial treatments for attention-deficit/hyperactivity disorder. Curr Psychiatry Rep 2008; 10:412–418.
- Reimherr FW, Williams ED, Strong RE, Mestas R, Soni P, Marchant BK. A double-blind, placebo-controlled, crossover study of osmotic release oral system methylphenidate in adults with ADHD with assessment of oppositional and emotional dimensions of the disorder. J Clin Psychiatry 2007; 68:93–101.
- Healey D, Rucklidge JJ. An investigation into the relationship among ADHD symptomatology, creativity, and neuropsychological functioning in children. Child Neuropsychol 2006; 12:421–438.
- Abraham A, Windmann S, Siefen R, Daum I, Güntürkün O. Creative thinking in adolescents with attention deficit hyperactivity disorder (ADHD). Child Neuropsychol 2006; 12:111–123.
- Ek U, Fernell E, Westerlund J, Holmberg K, Olsson PO, Gillberg C. Cognitive strengths and deficits in schoolchildren with ADHD. Acta Paediatr 2007; 96:756–761.
- Ozel-Kizil ET, Kokurcan A, Aksoy UM, et al. Hyperfocusing as a dimension of adult attention deficit hyperactivity disorder. Res Dev Disabil 2016; 59:351–358.
- Hartmann T. ADD Success Stories: A Guide to Fulfillment for Families With Attention Deficit Disorder. Nevada City, CA: Underwood Books, 1995.
- Visser SN, Danielson ML, Bitsko RH, Perou R, Blumberg SJ. Convergent validity of parent-reported attention-deficit/hyperactivity disorder diagnosis: a cross-study comparison. JAMA Pediatr 2013; 167:674–675.
- Visser SN, Lesesne CA, Perou R. National estimates and factors associated with medication treatment for childhood attention-deficit/hyperactivity disorder. Pediatrics 2007; 119(suppl 1):S99–S106.
Pharmacotherapy and behavioral therapy are currently used with success in treating attention-deficit/hyperactivity disorder (ADHD) in children, adolescents, and adults. Ongoing changes in healthcare require physicians to improve the quality of care, reduce costs of treatment, and manage their patients’ health, not just their illnesses. Behavioral and pharmacologic studies provide us with an opportunity to maximize treatment of ADHD and adapt it to the needs of individuals.
This article identifies common problems in treating ADHD, discusses limits of care in pharmacotherapy and behavioral intervention, and offers practical recommendations for treating ADHD in the changing world of healthcare.
A CHANGING MEDICAL CLIMATE
The Affordable Care Act of 2010 sought to transform medical care in the United States from procedures to performance, from acute episodes of illness to integrated care across the lifespan, and from inefficient care to efficient and affordable care with measurable outcomes. At the time of this writing, nobody knows whether the Affordable Care Act will survive, but these are still good goals. Because ADHD is the most common behavioral disorder of childhood, value-based care is essential.1
ADHD ON THE RISE—WHY?
The prevalence of ADHD increased 42% from 2003 to 2011,2 with increases in nearly all demographic groups in the United States regardless of race, sex, and socioeconomic status. More than 1 in 10 school-age children (11%) in the United States now meet the criteria for the diagnosis of ADHD; among adolescents, 1 in 5 high school boys and 1 in 11 high school girls meet the criteria.2
Rates vary among states, from a low of 4.2% for children ages 4 to 17 in Nevada to a high of 14.6% in Arkansas.3 Worldwide estimates of ADHD prevalence range from 2.2% to 17.8%,4 with the most recent meta-analysis for North America and Europe indicating a 7.2% worldwide prevalence in people age 18 and younger.5
Such data have sparked criticism, with some saying that ADHD is overdiagnosed, others saying it is underdiagnosed, and most agreeing that it is misdiagnosed.
Changing definitions of ADHD may have had a small effect on the increase in prevalence,6 but the change is more likely a result of heightened awareness and recognition of symptoms. Even so, guidelines for diagnosing ADHD are still not rigorously applied, contributing to misdiagnosis. For example, in a study of 50 pediatric practices, only half of clinicians said they followed diagnostic guidelines to determine symptom criteria from at least 2 sources and across 2 settings, yet nearly all (93%) reported immediately prescribing medications for treatment.7
The Diagnostic and Statistical Manual of Mental Disorders, Fifth Edition,8 requires evidence of a persistent pattern of inattention or hyperactivity/impulsivity, or both, with a severity that interferes with developmental functioning in 2 or more settings; was present before age 12; and cannot be accounted for by another behavioral health disorder such as depression, anxiety, or trauma. The diagnosis should document the presence of at least 6 of 9 symptoms of inattention (or 5 symptoms for teens age 17 or older), or at least 6 of 9 symptoms of hyperactive/impulsive behavior (5 symptoms for teens age 17 and older). Symptoms are best documented when reported by at least 2 observers.
COSTS OF ADHD
ADHD is expensive to society. National yearly healthcare costs have ranged from $143 billion to $266 billion,9 with over half this amount assumed directly by families.10 Even in previous decades when prevalence rates hovered around 5%, the cost of workday loss in the United States was high for adult patients and for parents of young children with ADHD needing to take time off from work for doctors’ visits.11 Projections across 10 countries indicated that adults with ADHD lost more workdays than did workers without ADHD.12
There is also a trend toward visits that are more expensive. Between 2000 and 2010, the number of visits for ADHD to psychiatrists rose from 24% to 36%, while the number of less-costly visits to pediatricians decreased from 54% to 47%.13
Thus, over the past 15 years, symptoms of ADHD have become more readily recognized, prevalence rates in the population have increased significantly, and associated costs have increased dramatically, with costs extending beyond individual impairment to a loss of productivity at the workplace. And treatment, typically with drugs, has been used without sufficient application of current diagnostic criteria. What impact does this have on the practicing physician?
DRUG TREATMENT: GOLD STANDARD OR NATIONAL DISASTER?
Stimulants are considered the standard of medical care for the symptoms of ADHD, according to the 2011 practice guidelines of the American Academy of Pediatrics.14 They are efficacious and cost-effective when optimal dosing is achieved, since the patient usually manages treatment independently, requiring minimal physician input in the months and years after successful titration.
For these reasons, the use of stimulants to treat ADHD has increased dramatically in the last decade. According to the National Survey of Children’s Health, as a result of an increase in parent-reported ADHD, more US children were receiving medical treatment for the disorder in 2011 than in any previous year reported, and the prevalence of pharmacotherapy in children ages 14 to 17 increased 28% over the 4 years from 2007 to 2011.2
Dr. Keith Conners, an early advocate for recognition of ADHD, has called the staggering increase in the rates of diagnosis and drug treatment a “national disaster of dangerous proportions.”15 Nevertheless, many children and families have benefited in a cost-effective manner.
STRATEGIES FOR TITRATION
Physicians typically rely on 4 strategies to titrate stimulants,16 presented below in order of increasing complexity.
Prescribe-and-wait
Often, physicians write a prescription and direct the parent to call back or visit the office to relay the child’s response after a specified period, typically 1 week to 1 month.
This method is convenient in a busy practice and is informative to the physician in a general way. The drawback to this method is that it seldom results in optimal treatment. If the parent does not call back, the physician may assume the treatment was successful without being certain.
Dose-to-improvement
In this approach, the physician monitors titration more closely and increases the dose until a positive response is achieved, after which the dose is maintained. This method reduces symptoms but does not ensure optimal treatment, as there still may be room for improvement.
Forced-dose titration
This method is often used in clinical trials. The dose is ramped up until side effects occur and is then reduced until the side effects go away.
This method often results in optimal dosing, as a forced dose yields a greater reduction in symptoms. But it requires close monitoring by the physician, with multiple reports from parents and teachers after each dose increase to determine whether benefit at the higher dose outweighs the side effects and whether side effects can be managed.
Blinded placebo trial
Also often used in research, this method typically requires a research pharmacy to prepare capsules of stimulant medicine in low, moderate, high, and placebo doses.17 All doses are blinded and given over 4 weeks in a forced-dose titration—a placebo capsule with 3 active medication doses in escalating order, which is typical of outpatient pediatric practice. Placebo capsules are randomly assigned to 1 of the 4 weeks, and behavior is monitored over the 7 days of administration by teachers and parents.
This strategy has benefits similar to those of forced-dose titration, and it further delineates medicine response—both side effects and behavior change—by adding a no-medicine placebo condition. It is a systematic, monitored “experiment” for parents who are wary or distrustful of ADHD pharmacotherapy, and it has notable benefits.18 It is also useful for teenagers who are reluctant to use medicine to treat symptoms. It arrives at optimal treatment in a timely manner, usually about 4 to 5 weeks.
On the other hand, this approach requires diligence from families, teachers, and caregivers during the initiation phase, and it requires consistent engagement of the physician team.
Some pediatricians designate a caregiver to monitor titration with the parent; with each new weekly dose, the caregiver reports the child’s progress to the physician.
ENSURING ADHERENCE
Essential to effective stimulant treatment for ADHD is not whether the medicine works (it does),19 but whether the patient continues to use it.
In treatment studies and pharmacy database analyses, rates of inconsistent use or discontinuation of medication (both considered nonadherence) were 13.2% to 64% within the first year,20 and more than 95% of teenagers discontinue pharmacotherapy before age 21.21
Clinician engagement at the onset of stimulant titration is instrumental to treatment adherence.22,23 When pharmacotherapy is loosely monitored during initiation, adherence is highly inconsistent. Some physicians wait as long as 72 days after first prescribing a medication to contact the patient or family,7 and most children with ADHD who discontinue their medications do so within the first year.24
FACTORS THAT INHIBIT ADHERENCE
What factors inhibit adherence to successful pharmacotherapy for ADHD?
Treatment nonadherence is often associated with a parent’s perception that the medication is not working.25 Physicians can often overcome this perception by speaking with the parent, conveying that at the start of treatment titrating to the optimal dose takes time, and that it does not mean “something is wrong.” But without physician contact, parents do not have the occasion to discuss side effects and benefits and tend not to voice fears such as whether the medicine will affect the child’s physical development or result in drug abuse later in life.26
At the beginning of treatment, a child may become too focused, alarming the parent. This overfocused effect is often misunderstood and does not always persist. In addition, when a child better manages his or her own behavior, the contrast to previous behavior may look like something is wrong, when instead the child’s behavior is actually normalizing. Medicine-induced anxiety—in the child or, by association, in the parent—may be misunderstood, and subsequently the parent just stops the child’s treatment rather than seek physician guidance.
Nonadherence is also more prevalent with immediate-release than with extended-release formulations.27,28
Problems can be summarized as follows7:
- Systematic physician observation of response to stimulant titration is often missing at the onset of treatment
- “Best dose” is inconsistently achieved
- Patient adherence to treatment is inconsistently monitored.
The long-term consequences of nonadherence to therapy for ADHD have not been sufficiently examined,20 but some groups, especially adolescents, show problematic outcomes when treatment is not applied. For example, in one longitudinal study, substance use disorder was significantly higher in youths with ADHD who were never treated with medicine than in “neurotypical” youths and those with ADHD who were treated pharmacologically.29
BEHAVIORAL INTERVENTION
Although opinions vary as to the advantages of drug therapy vs behavioral intervention in ADHD, there is evidence that a combined approach is best.30–33 Pharmacotherapy works inside the skin to reduce symptoms of inattention and overactivity, and behavioral therapy works outside the skin to teach new skills.
A report from the US Centers for Disease Control and Prevention in 2016 stated that behavioral therapy should be the first treatment for young children with ADHD (ages 2 to 5), but noted that only 40% to 50% of young children with ADHD receive psychological services.36 At the same time, the use of pharmacotherapy has increased tremendously.
Beginning treatment with behavioral therapy rather than medicine has been found to be more cost-effective over time. For children ages 4 to 5, behavioral therapy is recommended as the first line by the clinical practice guidelines of the American Academy of Pediatrics.14 Beginning treatment with behavioral intervention has been shown to produce better outcomes overall than beginning with medication and indicates that lower doses may be used compared with pharmacotherapy that is not preceded by behavioral therapy.37 Findings also indicate that starting with behavioral therapy increases the cost-effectiveness of treatment for children with ADHD.38
Behavioral intervention has modest advantages over medicine for non-ADHD symptoms,42 as the practice satisfies the adage “pills don’t teach skills.”26 One advantage is that caregivers take an active role in managing child compliance, social interactions, and classroom deportment, as opposed to the relatively passive role of prescribing medicine only. Parents and teachers form collaborative partnerships to increase consistency and extend the reach of change. In the National Institute of Mental Health multimodal treatment study, the only children whose behavior normalized were those who used medicine and whose caregivers gave up negative, harsh, inconsistent, and ineffective discipline43; that is, parents changed their own behavior.
Parent training is important, as parents must often manage their children’s behavior on their own the best they can, with little coaching and assistance. Primary care physicians may often refer parents to established local programs for training, and ongoing coaching can ensure that skills acquired in such training programs continue to be systematically applied. Pharmacotherapy is focused almost solely on reducing symptoms, but reducing symptoms does not necessarily lead to improved functioning. A multimodal approach helps individuals adapt to demanding settings, achieve personal goals, and contribute to social relationships. Outcomes depend on teaching what to do as well as reducing what not to do. Behavioral therapy44 shaped by peers, caregivers, teachers, and other factors can be effectively remediate the difficulties of children with ADHD.
The disadvantages of behavioral therapy are that it is not readily available, adds initial cost to treatment, and requires parents to invest more time at the beginning of intervention. But behavioral therapy reduces costs over time, enhances ADHD pharmacotherapy, often reduces the need for higher dosing, reduces visits to the doctor’s office, maintains behavior improvement and symptom reduction in the long term, and significantly increases quality of care.42
A RECOMMENDED ADHD CARE PATH
How do we increase quality of care, reduce costs, and improve value of care for patients with ADHD? The treatment of ADHD as a chronic condition is collaborative. Several practices may be combined in a quality care path.
Follow up more frequently at the start of drug treatment
Physicians may give more frequent attention to the process of pharmacotherapy at the start of treatment. Pharmacotherapy is typically introduced by the prescribe-and-wait method, which often produces less than optimal dosing, limited treatment adherence, and inconsistent outcomes.45,46 Though the cost of giving a prescription is low, the cost for unsustained treatment is high, and this undermines the usefulness of medical therapy. The simple solution is systematic titration through frequent contact between the prescribing physician and the parents in the first few weeks of pharmacotherapy. Subsequent ongoing monitoring of adherence in the first year is likely to reduce costs over time.47
Achieve optimal dosing
Pharmacotherapy should be applied with a plan in mind to produce evidence that optimal dosing has been achieved, ie, improvement is consistently observed in school and home.48
If side effects occur, parents and physician must determine whether they outweigh the benefits. If the benefits outweigh the side effects, then the physician and parents should maintain treatment and manage side effects accordingly. If the side effects outweigh the benefits, the titration process should continue with different dosing or delivery until optimal dosing is achieved or until the physician determines that pharmacotherapy is no longer appropriate.
Though different procedures to measure optimal dosing are available, medication effectiveness can be determined in 7-day-per-dose exposure during a period when the child’s schedule is consistent. A consistent schedule is important, as medicine effects are difficult to determine during loosely defined schedules such as during school vacations or holidays. Involving multiple observers is important as well. Teachers, for example, are rarely consulted during titration49 though they are excellent observers and are with the child daily when medication is most effective.
Integrate behavioral therapy
Given the evidence that behavioral intervention enhances drug therapy,50 behavioral therapy should be integrated with drug therapy to create an inclusive context for change. Behavioral therapy is delivered in a variety of ways including individual and group parent training, home management consultation, daily school report cards, behavioral coaching, classroom behavior management, and peer interventions. Behavioral intervention enhances stimulant effectiveness51 to improve compliance, on-task behavior, academic performance, social relationships and family functioning.52
Behavioral therapy is now generally included in health insurance coverage. In addition, many clinics now offer shared medical appointments that combine close monitoring of drug therapy with behavioral coaching to small groups of parents in order to manage symptoms of ADHD at a minimal cost.
Measure outcomes
Measuring outcomes of ADHD treatment over time improves care. The primary care physician may use electronic medical record data management to track a patient’s progress related to ADHD features. The Clinical Global Improvement scale is a 7-point assessment that is easily done by parents and the physician at well visits and is ubiquitous in ADHD clinical trials.53 Change over time indicates when to suggest changes in treatment.
Finally, clinicians can demonstrate that appropriate, comprehensive care does not simply relieve ADHD symptoms, but also promotes quality of life. Healthcare providers can guide parents to improve existing abilities in children rather than leave parents with the notion that something is wrong with their child.
For example, research suggests that some patients with ADHD show enhanced creativity54,55; cognitive profiles with abilities in logical thinking, reasoning, and common sense56; and the capacity for intense focus in areas of interest.57 Some authors have even speculated that historical figures such as Thomas Edison and Albert Einstein would have been diagnosed with ADHD by today’s standards.58
MEETING THE DEMANDS OF AFFORDABLE CARE
Many children and youth diagnosed with ADHD still receive no or insufficient pharmacotherapy and behavioral therapy. More than one-third of children reported by their parents as not receiving treatment were also reported to have moderate or severe ADHD.59,60
At the same time, though more children today are being prescribed pharmacotherapy when ADHD is diagnosed, physician involvement is often limited during titration,7 and treatment usually consists of reducing symptoms without increasing adaptive behaviors with behavioral therapy.45 In addition, even though ADHD symptoms initially improve with pharmacotherapy, improvement is not sustained because of poor adherence.
The healthcare costs of ADHD are high because impairment extends beyond the patient to disrupt family life and even the workplace, as parents take time off to manage children. Because of uncertain costs of quality treatment, the best-practice treatment option for ADHD—ie, combined behavioral therapy and medicine—is increasingly accessible but still not as widely accessible as medication treatment. The value of care improves slowly while the number of patients continues to increase. However, caregivers have the opportunity to add value to the treatment of ADHD.
When we improve medication management, improve adherence to treatment, combine behavioral therapy and pharmacotherapy, consistently measure outcomes, and recognize positive traits of ADHD in our patients, we may turn the demands of affordable care into a breakthrough for many who live with the condition.
Acknowledgment: The authors wish to thank Ralph D’Alessio, BA, for his services in reference review and for his conscientious participation in the Cleveland Clinic Medication Monitoring Clinic, ADHD Center for Evaluation and Treatment.
- Rostain A, Jensen PS, Connor DF, Miesle LM, Faraone SV. Toward quality care in ADHD: defining the goals of treatment. J Atten Disord 2015; 19:99–117.
- Visser SN, Danielson ML, Bitsko RH, et al. Trends in the parent-report of health care provider-diagnosed and medicated attention-deficit/hyperactivity disorder: United States, 2003-2011. J Am Acad Child Adolesc Psychiatry 2014; 53:34–46.e2.
- Visser SN, Blumberg SJ, Danielson ML, Bitsko RH, Kogan MD. State-based and demographic variation in parent-reported medication rates for attention-deficit/hyperactivity disorder, 2007–2008. Prev Chronic Dis 2013; 10:E09.
- Skounti M, Philalithis A, Galanakis E. Variations in prevalence of attention deficit hyperactivity disorder worldwide. Eur J Pediatr 2007; 166:117–123.
- Thomas R, Sanders S, Doust J, Beller E, Glasziou P. Prevalence of attention-deficit/hyperactivity disorder: a systematic review and meta-analysis. Pediatrics 2015; 135:e994–1001.
- McKeown RE, Holbrook JR, Danielson ML, Cuffe SP, Wolraich ML, Visser SN. The impact of case definition on attention-deficit/hyperactivity disorder prevalence estimates in community-based samples of school-aged children. J Am Acad Child Adolesc Psychiatry 2015; 54:53–61.
- Epstein JN, Kelleher KJ, Baum R, et al. Variability in ADHD care in community-based pediatrics. Pediatrics 2014; 134:1136–1143.
- American Psychiatric Association. Diagnostic and Statistical Manual of Mental Disorders, Fifth Edition. Arlington VA: American Psychiatric Association Publishing, 2013.
- Doshi JA, Hodgkins P, Kahle J, et al. Economic impact of childhood and adult attention-deficit/hyperactivity disorder in the United States. J Am Acad Child Adolesc Psychiatry 2012; 51:990–1002.e2.
- Abright AR. Estimating the costs of attention-deficit/hyperactivity disorder. J Am Acad Child Adolesc Psychiatry 2012; 51:987–989.
- Birnbaum HG, Kessler RC, Lowe SW, et al. Costs of attention deficit-hyperactivity disorder (ADHD) in the US: excess costs of persons with ADHD and their family members in 2000. Curr Med Res Opin 2005; 21:195–206.
- de Graaf R, Kessler RC, Fayyad J, et al. The prevalence and effects of adult attention-deficit/hyperactivity disorder (ADHD) on the performance of workers: results from the WHO World Mental Health Survey Initiative. Occup Environ Med 2008; 65:835–842.
- Garfield CF, Dorsey ER, Zhu S, et al. Trends in attention deficit hyperactivity disorder ambulatory diagnosis and medical treatment in the United States, 2000–2010. Acad Pediatr 2012; 12:110–116.
- Subcommittee on Attention-Deficit/Hyperactivity Disorder, Steering Committee on Quality Improvement and Management, Wolraich M, Brown L, Brown RT, et al. ADHD: clinical practice guideline for the diagnosis, evaluation, and treatment of attention-deficit/hyperactivity disorder in children and adolescents. Pediatrics 2011; 128:1007–1022.
- Schwarz A. The selling of attention deficit disorder. New York Times December 14, 2013:A1.
- Manos MJ, Tom-Revzon C, Bukstein OG, Crismon ML. Changes and challenges: managing ADHD in a fast-paced world. J Manag Care Pharm 2007; 13(suppl B):S2–S16.
- Rapport MD, Denney C. Titrating methylphenidate in children with attention-deficit/hyperactivity disorder: is body mass predictive of clinical response? J Am Acad Child Adolesc Psychiatry 1997; 36:523–530.
- Sandler A, Glesne C, Geller G. Children’s and parents’ perspectives on open-label use of placebos in the treatment of ADHD. Child Care Health Dev 2008; 34:111–120.
- Faraone SV, Buitelaar J. Comparing the efficacy of stimulants for ADHD in children and adolescents using meta-analysis. Eur Child Adolesc Psychiatry 2010; 19:353–364.
- Adler LD, Nierenberg AA. Review of medication adherence in children and adults with ADHD. Postgrad Med 2010; 122:184–191.
- McCarthy S, Asherson P, Coghill D, et al. Attention-deficit hyperactivity disorder: treatment discontinuation in adolescents and young adults. Br J Psychiatry 2009; 194:273–277.
- Bussing R, Narwaney KJ, Winterstein AG, et al. Pharmacotherapy for incident attention-deficit/hyperactivity disorder: practice patterns and quality metrics. Curr Med Res Opin 2014; 30:1687–1699.
- O’Callaghan P. Adherence to stimulants in adult ADHD. Atten Defic Hyperact Disord 2014; 6:111–120.
- Toomey SL, Sox CM, Rusinak D, Finkelstein JA. Why do children with ADHD discontinue their medication? Clin Pediatr (Phila) 2012; 51:763–769.
- Bussing R, Koro-Ljungberg M, Noguchi K, Mason D, Mayerson G, Garvan CW. Willingness to use ADHD treatments: a mixed methods study of perceptions by adolescents, parents, health professionals and teachers. Soc Sci Med 2012; 74:92–100.
- Schoenfelder EN, Sasser T. Skills versus pills: psychosocial treatments for ADHD in childhood and adolescence. Pediatr Ann 2016; 45:e367–e372.
- López FA, Leroux JR. Long-acting stimulants for treatment of attention-deficit/hyperactivity disorder: a focus on extended-release formulations and the prodrug lisdexamfetamine dimesylate to address continuing clinical challenges. Atten Defic Hyperact Disord 2013; 5:249–265.
- Atzori P, Usala T, Carucci S, Danjou F, Zuddas A. Predictive factors for persistent use and compliance of immediate-release methylphenidate: a 36-month naturalistic study. J Child Adolesc Psychopharmacol 2009; 19:673–681.
- Yule AM, Martelon M, Faraone SV, Carrellas N, Wilens TE, Bierderman J. Examining the association between attention deficit hyperactivity disorder and substance use disorders: a familial risk analysis. J Psychiatr Res 2017; 85:49–55.
- Hauk L. AAP releases guideline on diagnosis, evaluation, and treatment of ADHD. Am Fam Physician 2013; 87:61–62.
- Arnold LE, Abikoff HB, Cantwell DP, et al. National Institute of Mental Health collaborative multimodal treatment study of children with ADHD (the MTA). Design challenges and choices. Arch Gen Psychiatry 1997; 54:865–870.
- Greenhill LL, Abikoff HB, Arnold LE, et al. Medication treatment strategies in the MTA study: relevance to clinicians and researchers. J Am Acad Child Adolesc Psychiatry 1996; 35:1304–1313.
- Richters JE, Arnold LE, Jensen PS, et al. NIMH collaborative multisite multimodal treatment study of children with ADHD: I. Background and rationale. J Am Acad Child Adolesc Psychiatry 1995; 34:987–1000.
- Manos MJ, Caserta DA, Short EJ, et al. Evaluation of the duration of action and comparative effectiveness of lisdexamfetamine dimesylate and behavioral treatment in youth with ADHD in a quasi-naturalistic setting. J Atten Disord 2015; 19:578–590.
- Evans SW, Owens JS, Bunford N. Evidence-based psychosocial treatments for children and adolescents with attention-deficit/hyperactivity disorder. J Clin Child Adolesc Psychol 2014; 43:527–551.
- Visser SN, Danielson ML, Wolraich ML, et al. Vital signs: national and state-specific patterns of attention deficit/hyperactivity disorder treatment among insured children aged 2–5 years—United States, 2008-2014. MMWR Morb Mortal Wkly Rep 2016; 65:443–450.
- Pelham WE Jr, Fabiano GA, Waxmonsky JG, et al. Treatment sequencing for childhood ADHD: a multiple-randomization study of adaptive medication and behavioral interventions. J Clin Child Adolesc Psychol 2016; 45:396–415.
- Page TF, Pelham WE 3rd, Fabiano GA, et al. Comparative cost analysis of sequential, adaptive, behavioral, pharmacological, and combined treatments for childhood ADHD. J Clin Child Adolesc Psychol 2016; 45:416–427.
- Fabiano GA, Schatz NK, Pelham WE Jr. Summer treatment programs for youth with ADHD. Child Adolesc Psychiatr Clin N Am 2014; 23:757–773.
- Pelham WE, Burrows-MacLean L, Gnagy EM, et al. A dose-ranging study of behavioral and pharmacological treatment in social settings for children with ADHD. J Abnorm Child Psychol 2014; 42:1019–1031.
- Fabiano GA, Pelham WE Jr, Gnagy EM, et al. The single and combined effects of multiple intensities of behavior modification and methylphenidate for children with attention deficit hyperactivity disorder in a classroom setting. School Psychology Rev 2007; 36:195–216.
- Reeves G, Anthony B. Multimodal treatments versus pharmacotherapy alone in children with psychiatric disorders: implications of access, effectiveness, and contextual treatment. Paediatr Drugs 2009; 11:165–169.
- Hinshaw SP. Moderators and mediators of treatment outcome for youth with ADHD: understanding for whom and how interventions work. J Pediatr Psychol 2007; 32:664–675.
- Hayes SC, Villatte M, Levin M, Hildebrandt M. Open, aware, and active: contextual approaches as an emerging trend in the behavioral and cognitive therapies. Annu Rev Clin Psychol 2011; 7:141–168.
- Epstein JN, Langberg JM, Lichtenstein PK, et al. Attention-deficit/hyperactivity disorder outcomes for children treated in community-based pediatric settings. Arch Pediatr Adolesc Med 2010; 164:160–165.
- Manos MJ. Pharmacologic treatment of ADHD: road conditions in driving patients to successful outcomes. Medscape J Med 2008; 10:5.
- Braun S, Russo L, Zeidler J, Linder R, Hodgkins P. Descriptive comparison of drug treatment-persistent, -nonpersistent, and nondrug treatment patients with newly diagnosed attention deficit/hyperactivity disorder in Germany. Clin Ther 2013; 35:673–685.
- Pliszka SR, Crismon ML, Hughes CW, et al; Texas Consensus Conference Panel on Pharmacotherapy of Childhood Attention Deficit Hyperactivity Disorder. The Texas Children’s Medication Algorithm Project: revision of the algorithm for pharmacotherapy of attention-deficit/hyperactivity disorder. J Am Acad Child Adolesc Psychiatry 2006; 45:642–657.
- Pelham WE Jr, Fabiano GA, Massetti GM. Evidence-based assessment of attention deficit hyperactivity disorder in children and adolescents. J Clin Child Adolesc Psychol 2005; 34:449–476.
- Fabiano GA, Pelham WE Jr, Coles EK, Gnagy EM, Chronis-Tuscano A, O’Connor BC. A meta-analysis of behavioral treatments for attention-deficit/hyperactivity disorder. Clin Psychol Rev 2009; 29:129–140.
- Pelham WE Jr, Fabiano GA. Evidence-based psychosocial treatments for attention-deficit/hyperactivity disorder. J Clin Child Adolesc Psychol 2008; 37:184–214.
- Knight LA, Rooney M, Chronis-Tuscano A. Psychosocial treatments for attention-deficit/hyperactivity disorder. Curr Psychiatry Rep 2008; 10:412–418.
- Reimherr FW, Williams ED, Strong RE, Mestas R, Soni P, Marchant BK. A double-blind, placebo-controlled, crossover study of osmotic release oral system methylphenidate in adults with ADHD with assessment of oppositional and emotional dimensions of the disorder. J Clin Psychiatry 2007; 68:93–101.
- Healey D, Rucklidge JJ. An investigation into the relationship among ADHD symptomatology, creativity, and neuropsychological functioning in children. Child Neuropsychol 2006; 12:421–438.
- Abraham A, Windmann S, Siefen R, Daum I, Güntürkün O. Creative thinking in adolescents with attention deficit hyperactivity disorder (ADHD). Child Neuropsychol 2006; 12:111–123.
- Ek U, Fernell E, Westerlund J, Holmberg K, Olsson PO, Gillberg C. Cognitive strengths and deficits in schoolchildren with ADHD. Acta Paediatr 2007; 96:756–761.
- Ozel-Kizil ET, Kokurcan A, Aksoy UM, et al. Hyperfocusing as a dimension of adult attention deficit hyperactivity disorder. Res Dev Disabil 2016; 59:351–358.
- Hartmann T. ADD Success Stories: A Guide to Fulfillment for Families With Attention Deficit Disorder. Nevada City, CA: Underwood Books, 1995.
- Visser SN, Danielson ML, Bitsko RH, Perou R, Blumberg SJ. Convergent validity of parent-reported attention-deficit/hyperactivity disorder diagnosis: a cross-study comparison. JAMA Pediatr 2013; 167:674–675.
- Visser SN, Lesesne CA, Perou R. National estimates and factors associated with medication treatment for childhood attention-deficit/hyperactivity disorder. Pediatrics 2007; 119(suppl 1):S99–S106.
KEY POINTS
- Despite concerns about overdiagnosis and overtreatment, many children and youth diagnosed with ADHD still receive no treatment or insufficient treatment.
- Today, more children are prescribed drug therapy when ADHD is diagnosed, but the initial titration of medication is often done without sufficient physician supervision.
- ADHD symptoms improve with drug therapy, but improvement is inconsistently sustained due to poor treatment adherence.
- Drug therapy and behavioral therapy work together. Outcomes can be determined by measuring both improved behaviors and reduced symptoms.
