User login
CO2 Laser Ablative Fractional Resurfacing Photodynamic Therapy for Actinic Keratosis and Nonmelanoma Skin Cancer: A Randomized Split-Side Study
Actinic keratosis (AK) is the most common cutaneous lesion and is regarded as a precursor to nonmelanoma skin cancer (NMSC), particularly squamous cell carcinoma (SCC).1 Field cancerization refers to broad areas of chronically sun-exposed skin that show cumulative sun damage in the form of clinical and subclinical lesions. It is not feasible to treat large areas with multiple overt and subclinical lesions using surgical methods, and photodynamic therapy (PDT) has become a preferred method for treatment of field cancerization.2 Topical PDT uses the heme biosynthesis pathway precursors aminolevulinic acid (ALA) or methyl ALA (MAL), which localizes in the treatment area and is metabolized to protoporphyrin IX.3 After an incubation period, activation by a light source results in the formation of cytotoxic oxygen species,4 with reports of efficacy over large areas and excellent cosmetic outcomes.2
Laser ablative fractional resurfacing (AFR) also has been investigated as a treatment of AKs; CO2 laser AFR treatment resulted in a short-term reduction in the number of AK lesions and appeared to reduce the development of new lesions.5 However, case reports and small studies have indicated that pretreatment with laser AFR can increase the efficacy of PDT by creating microscopic vertical channels facilitating deeper penetration and uptake of the ALA.6 The use of erbium:YAG lasers in combination with PDT has demonstrated notable clinical and aesthetic improvements in treating basal cell carcinomas (BCCs)7 and AKs,8 with enhanced efficacy in moderate to thick AKs in particular. Hædersdal et al6 reported that CO2 laser AFR facilitated delivery of MAL into porcine skin, with AFR appearing to bypass the stratum corneum and deliver the treatment to the deep dermis.
The combination of CO2 laser AFR and PDT has shown statistically significant increases in efficacy for treatment of AKs compared to PDT alone (P<.001).9 In a small study, Alexiades10 reported a statistically significant improvement in AKs at 4 and 8 weeks posttreatment for 10 patients receiving CO2 laser AFR-PDT vs conventional PDT (P<.05). Studies of organ transplant recipients—who are at higher risk for AK and NMSC development—demonstrated favorable results for combined CO2 laser AFR and PDT vs either laser treatment11 or PDT9,12 alone, with significant reductions in the number of AKs (P=.002). Results were maintained for 3 to 4 months after treatment. Additional studies have shown that combining CO2 laser AFR and PDT may reduce the PDT incubation time or number of treatments required to achieve a response over conventional PDT.13,14
Our proof-of-concept study was designed to assess efficacy of CO2 laser AFR to enhance an approved drug delivery system in the treatment of AK and NMSC. The objective was to compare effect and durability of AFR-PDT vs standard ALA-PDT in the treatment of AK and NMSCs in a split-sided study of various body locations.
Methods
This randomized, split-sided study compared CO2 laser AFR-PDT to standard ALA-PDT for the treatment of AK and NMSC conducted at 1 site in Los Gatos, California. Patients who had a skin cancer screening and received a biopsy diagnosis of AK or NMSC were invited to attend an enrollment visit. Key inclusion criteria for enrollment were male or female patients aged 40 to 85 years with notable symmetrically comparable photodamage (at least 1 AK per square centimeter) in 1 or more skin areas—scalp, face, or distal extremities—with presence of clinically identifiable NMSCs proven by biopsy. Key exclusion criteria were patients who were pregnant; patients with epilepsy, seizures, or a photosensitive disorder; those taking photosensitizing medication (eg, doxycycline, hydrochlorothiazide); or immunocompromised patients. The study was approved by an institutional review board (Salus IRB [Austin, Texas]), and each participant underwent a complete and informed consent process.
Laterality for pretreatment with AFR followed by ALA-PDT vs ALA-PDT alone was determined at the time of treatment using a computer-based random number generator; even numbers resulted in pretreatment of the right side, and odd numbers resulted in pretreatment of the left side. Because of the difference in pretreatment methods for the 2 sides, it was not possible to perform the procedure under blinded conditions.
The treatment area was prepared by defatting the entire site with 70% isopropyl alcohol, followed by benzalkonium chloride antibacterial cleansing for the AFR pretreatment side. A 7% lidocaine/7% tetracaine ointment was applied under polyethylene wrap occlusion to the AFR pretreatment side for 20 minutes. Additionally, nerve blocks and field blocks with a mixture of 1.1% lidocaine with epinephrine/0.5% bupivacaine with epinephrine were performed wherever feasible. After 20 minutes, the lidocaine-tetracaine ointment was removed with isopropanol, and AFR treatment commenced immediately with the SmartXide DOT laser (DEKA)(1 pass of 25 W, 1200-microsecond duration at 500-µm spacing, 200-µm spot size, achieving 12% surface area ablation). Hyperkeratotic treated areas were debrided with saline and received a second pass with the laser. Aminolevulinic acid solution 20% (Levulan Kerastick; DUSA Pharmaceuticals, Inc)15 was applied to both sides of the treatment area and allowed to absorb for a 1-hour incubation period, which was followed by blue-light exposure at a power density of 10 mW/cm2 for 16 minutes and 40 seconds using the BLU-U Photodynamic Therapy Illuminator (DUSA Pharmaceuticals, Inc). Areas treated with AFR were then covered with a layer of Aquaphor ointment (Beiersdorf, Inc) and an absorptive hydrogel dressing for48 to 96 hours, with continued application of the ointment until resolution of all crusting. After treatment, patients were instructed to avoid direct sun exposure, wear a hat or visor for the first 2 weeks posttreatment when outdoors, and apply sunscreen with a sun protection factor greater than 30 once skin had healed.
Follow-up was conducted at 1 week, 1 month, 3 months, and 6 months after the PDT procedure. The primary end points were clinical clearance of NMSC lesions at 1, 3, and 6 months posttreatment and histological clearance at 6 months. Secondary end points assessed quality of life and functional improvements.
Results
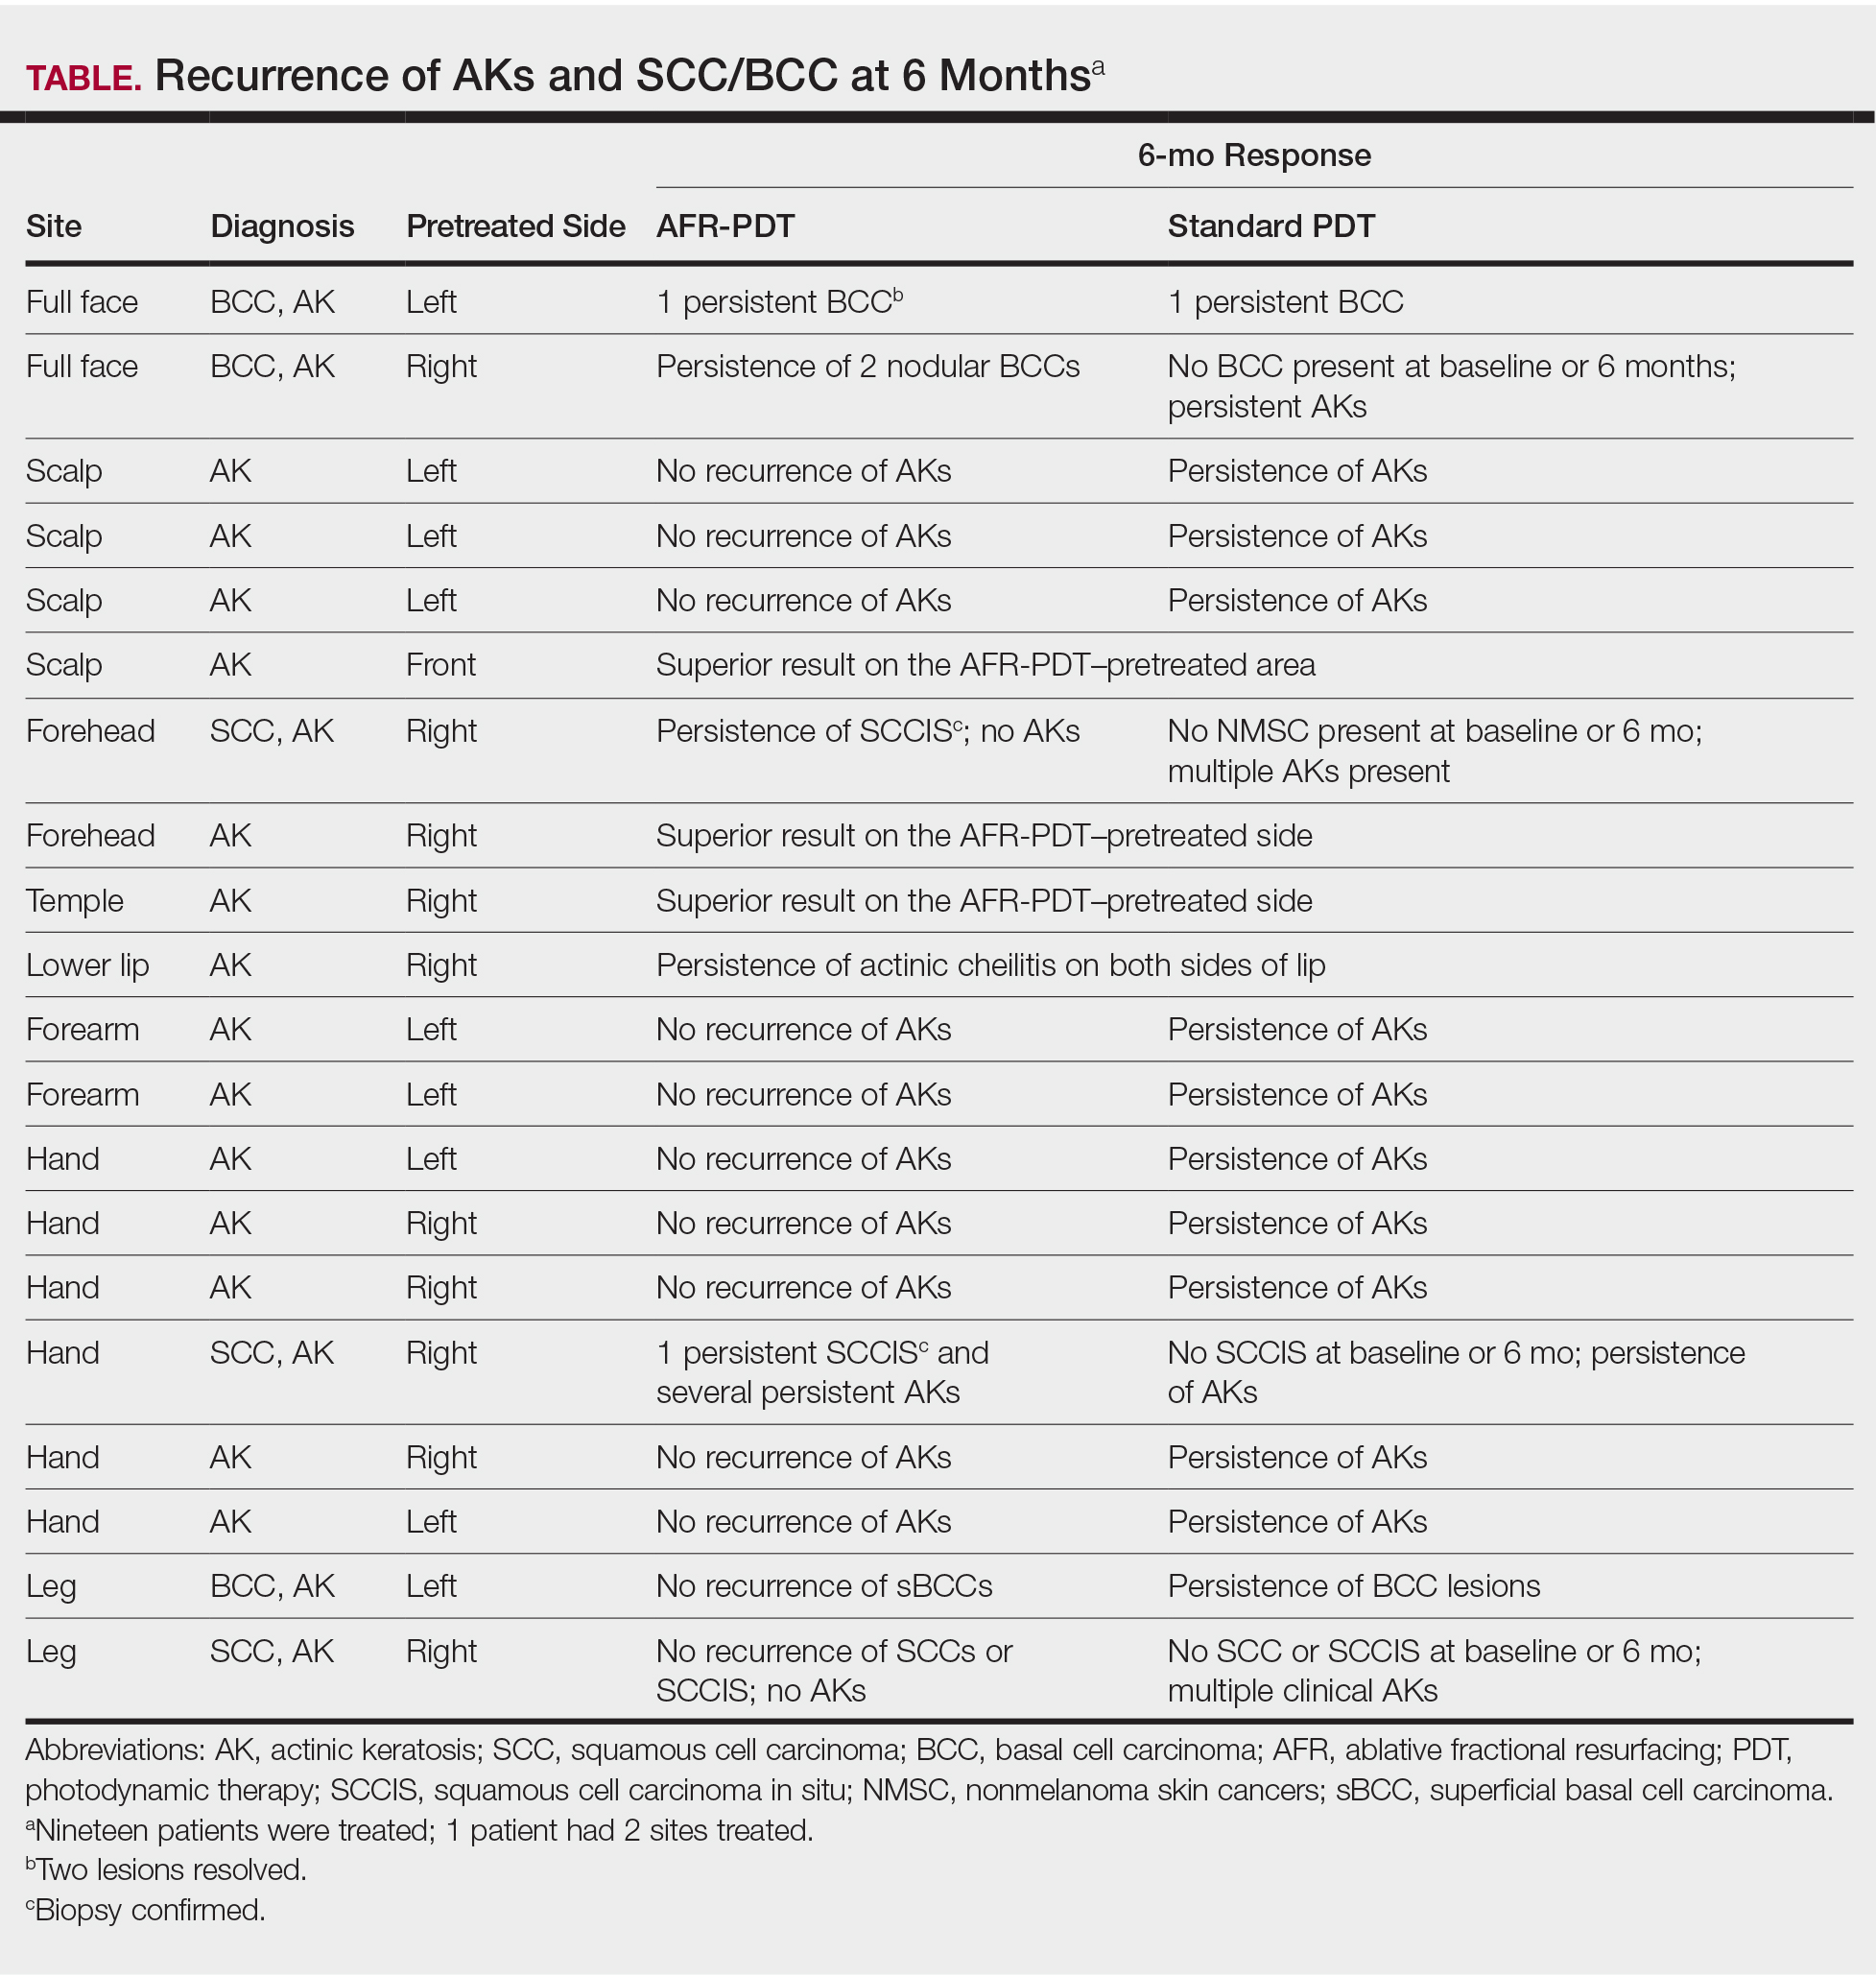
Twenty-four potential participants experiencing AKs and/or NMSCs were screened for the study, with 19 meeting inclusion criteria. All participants were white, non-Hispanic, and had Fitzpatrick skin types I or II. Treated areas for all participants had field cancerization defined as at least 1 AK per square centimeter. All 19 participants enrolled in the study completed the posttreatment evaluations up to 6 months. All AFR-pretreated sites showed superior results in reduction in number, size, or hyperkeratosis of AKs at all follow-up visits, with a complete absence of new AK formation at the 6-month follow-up (Table). Conversely, sites treated with standard PDT only showed some recurrence of AKs at 6 months. Of the 3 participants who had biopsy-confirmed BCCs on the AFR-pretreated side, there were 3 persistent lesions after treatment at the 6-month visit. Two participants experienced persistence of a confirmed SCC in situ that was on the laser-pretreated side only (1 on the forehead and 1 on the hand), whereas 1 participant with an SCC on the leg at baseline had no recurrence at 6 months. A participant who received treatment on the lower lip had persistence of actinic cheilitis on both the AFR- and non–AFR-treated sides of the lip.
Scalp and facial sites healed fully in an average of 7 days, whereas upper extremities—forearm and hands—took approximately 14 days to heal completely. Lower extremity AFR-pretreated sites exhibited substantial weeping, resulting in prolonged healing of approximately 21 days for resolution of all scabbing.
Comment
In this split-sided study in patients with field cancerization, the use of CO2 laser AFR before treatment with PDT increased AK lesion clearance compared to ALA-PDT alone. Prior studies of fractional laser–assisted drug delivery on porcine skin using topical MAL showed that laser channels approximately 3-mm apart were able to distribute protoporphyrin through the entire skin.6 The ablative nature of AFR theoretically provides deeper and more effusive penetration of the ALA solution than using conventional PDT or erbium:YAG lasers with PDT.7,8 Helsing et al11 applied CO2 laser AFR MAL-PDT to AKs in organ transplant recipients and obtained complete responses in 73% of patients compared to a complete response of 31% for AFR alone. The results reported in our study are consistent with Helsing et al,11 showing a complete clinical response for 14 of 19 patients (74%), of whom 4 (21%) had no recurrence of NMSC and 10 (53%) had no recurrence of AK on the AFR-PDT–treated side.
The pretreatment process required for the laser AFR added time to the initial visit compared to conventional PDT, which is balanced by a reduced PDT incubation time (1 hour vs the approved indication of 14–18 hours for face/scalp or 3 hours for upper extremities under occlusion). The use of microneedling as an alternative pretreatment procedure before PDT also has been investigated, with the aim of decreasing the optimum ALA absorption time. The mean reduction in AKs (89.3%) was significantly greater than for PDT alone (69.5%; P<.05) in a small study by Spencer and Freeman.18 Although microneedling is less time-intensive and labor-intensive than laser AFR, the photocoagulative effect and subsequent microhemorrhages resulting from AFR should result in much deeper penetration of ALA solution than for microneedling.
The limitations of this proof-of-concept study arose from the small sample size of 19 participants and the short follow-up period of 6 months. Furthermore, the unblinded nature of the study could create selection, detection, or reporting bias. Further follow-up appointments would aid in determining the longevity of results, which may encourage future use of this technique, despite the time-consuming preparation. A larger study with follow-up greater than 1 year would be beneficial, particularly for monitoring remission from SCCs and BCCs.
Conclusion
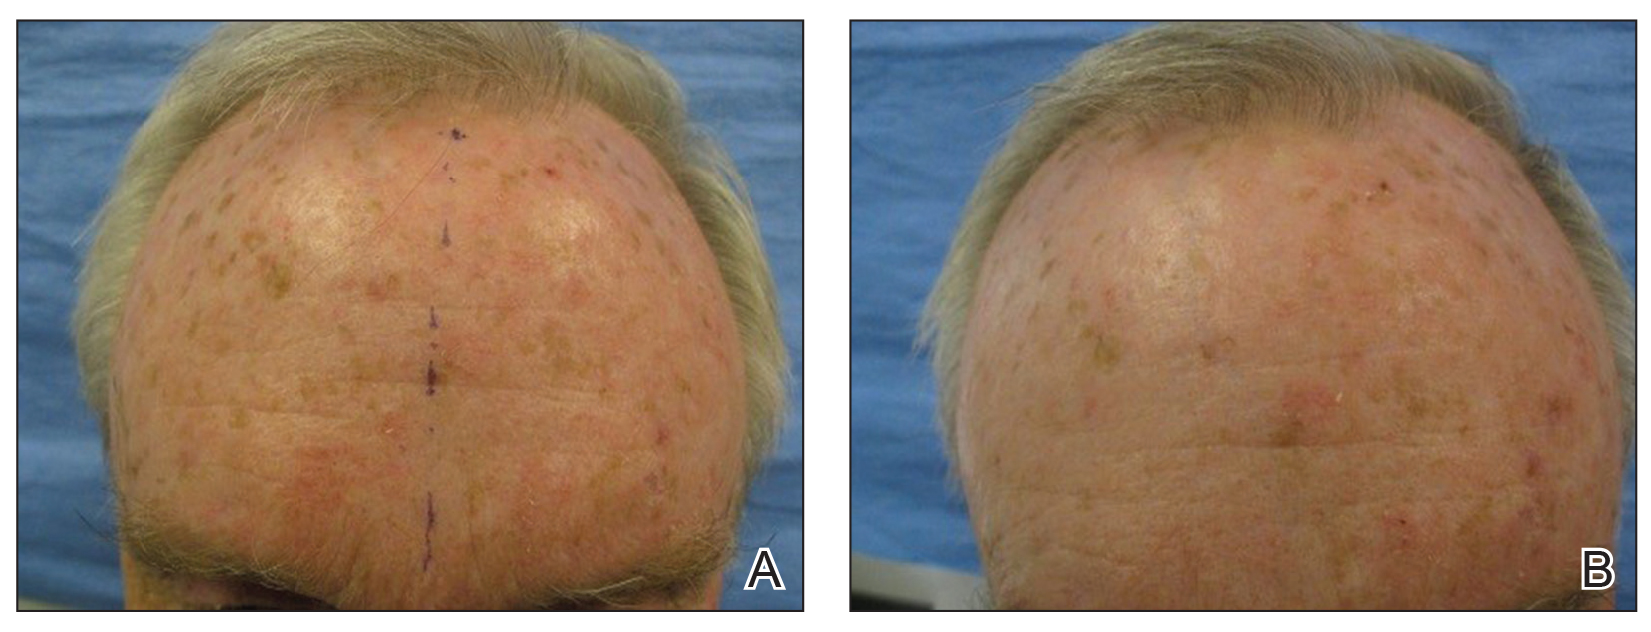
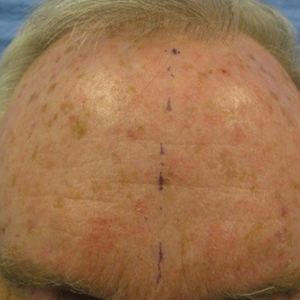
Pretreatment with CO2 laser AFR before ALA-PDT provided superior clearance of AKs and thin NMSCs at 6 months compared to ALA-PDT alone (Figure). Additionally, the incubation period for ALA absorption can be reduced before PDT, leading to a shorter treatment time overall. The benefits of AFR pretreatment on AK clearance demonstrated in this study warrant further investigation in a larger trial with a longer follow-up period to monitor maintenance of response.
Acknowledgments
The authors thank the patients who participated in this study. Editorial assistance was provided by Louise Gildea, PhD, of JK Associates Inc, part of the Fishawack Group of Companies (Fishawack, United Kingdom), funded by Sun Pharmaceutical Industries, Inc.
- Criscione VD, Weinstock MA, Naylor MF, et al. Actinic keratoses: natural history and risk of malignant transformation in the Veterans Affairs Topical Tretinoin Chemoprevention Trial. Cancer. 2009;115:2523-2530.
- Morton CA, McKenna KE, Rhodes LE. Guidelines for topical photodynamic therapy: update. Br J Dermatol. 2008;159:1245-1266.
- Casas A, Fukuda H, Di Venosa G, et al. Photosensitization and mechanism of cytotoxicity induced by the use of ALA derivatives in photodynamic therapy. Br J Cancer. 2001;85:279-284.
- Klotz LO, Fritsch C, Briviba K, et al. Activation of JNK and p38 but not ERK MAP kinases in human skin cells by 5-aminolevulinate-photodynamic therapy. Cancer Res. 1998;58:4297-4300.
- Gan SD, Hsu SH, Chuang G, et al. Ablative fractional laser therapy for the treatment of actinic keratosis: a split-face study. J Am Acad Dermatol. 2016;74:387-389.
- Hædersdal M, Sakamoto FH, Farinelli WA, et al. Fractional CO(2) laser-assisted drug delivery. Lasers Surg Med. 2010;42:113-122.
- Šmucler R, Vlk M. Combination of Er:YAG laser and photodynamic therapy in the treatment of nodular basal cell carcinoma. Lasers Surg Med. 2008;40:153-158.
- Ko DY, Jeon SY, Kim KH, et al. Fractional erbium:YAG laser-assisted photodynamic therapy for facial actinic keratoses: a randomized, comparative, prospective study. J Eur Acad Dermatol Venereol. 2014;28:1529-1539.
- Togsverd-Bo K, Lei U, Erlendsson AM, et al. Combination of ablative fractional laser and daylight-mediated photodynamic therapy for actinic keratosis in organ transplant recipients—a randomized controlled trial. Br J Dermatol. 2015;172:467-474.
- Alexiades M. Randomized, controlled trial of fractional carbon dioxide laser resurfacing followed by ultrashort incubation aminolevulinic acid blue light photodynamic therapy for actinic keratosis. Dermatol Surg. 2017;43:1053-1064.
- Helsing P, Togsverd-Bo K, Veierod MB, et al. Intensified fractional CO2 laser-assisted photodynamic therapy vs. laser alone for organ transplant recipients with multiple actinic keratoses and wart-like lesions: a randomized half-side comparative trial on dorsal hands. Br J Dermatol. 2013;169:1087-1092.
- Togsverd-Bo K, Haak CS, Thaysen-Petersen D, et al. Intensified photodynamic therapy of actinic keratoses with fractional CO2 laser: a randomized clinical trial. Br J Dermatol. 2012;166:1262-1269.
- Jang YH, Lee DJ, Shin J, et al. Photodynamic therapy with ablative carbon dioxide fractional laser in treatment of actinic keratosis. Ann Dermatol. 2013;25:417-422.
- Song HS, Jung SE, Jang YH, et al. Fractional carbon dioxide laser-assisted photodynamic therapy for patients with actinic keratosis. Photodermatol Photoimmunol Photomed. 2015;31:296-301.
- ALA Kerastick (aminolevulinic acid HCl) for topical solution, 20% [package insert]. Wilmington, MA: DUSA Pharmaceuticals; 2010.
- Data on file. Wilmington, MA: DUSA Pharmaceuticals; 2020.
- Campbell TM, Goldman MP. Adverse events of fractionated carbon dioxide laser: review of 373 treatments. Dermatol Surg. 2010;36:1645-1650.
- Spencer JM, Freeman SA. Microneedling prior to Levulan PDT for the treatment of actinic keratoses: a split-face, blinded trial. J Drugs Dermatol. 2016;15:1072-1074.
Actinic keratosis (AK) is the most common cutaneous lesion and is regarded as a precursor to nonmelanoma skin cancer (NMSC), particularly squamous cell carcinoma (SCC).1 Field cancerization refers to broad areas of chronically sun-exposed skin that show cumulative sun damage in the form of clinical and subclinical lesions. It is not feasible to treat large areas with multiple overt and subclinical lesions using surgical methods, and photodynamic therapy (PDT) has become a preferred method for treatment of field cancerization.2 Topical PDT uses the heme biosynthesis pathway precursors aminolevulinic acid (ALA) or methyl ALA (MAL), which localizes in the treatment area and is metabolized to protoporphyrin IX.3 After an incubation period, activation by a light source results in the formation of cytotoxic oxygen species,4 with reports of efficacy over large areas and excellent cosmetic outcomes.2
Laser ablative fractional resurfacing (AFR) also has been investigated as a treatment of AKs; CO2 laser AFR treatment resulted in a short-term reduction in the number of AK lesions and appeared to reduce the development of new lesions.5 However, case reports and small studies have indicated that pretreatment with laser AFR can increase the efficacy of PDT by creating microscopic vertical channels facilitating deeper penetration and uptake of the ALA.6 The use of erbium:YAG lasers in combination with PDT has demonstrated notable clinical and aesthetic improvements in treating basal cell carcinomas (BCCs)7 and AKs,8 with enhanced efficacy in moderate to thick AKs in particular. Hædersdal et al6 reported that CO2 laser AFR facilitated delivery of MAL into porcine skin, with AFR appearing to bypass the stratum corneum and deliver the treatment to the deep dermis.
The combination of CO2 laser AFR and PDT has shown statistically significant increases in efficacy for treatment of AKs compared to PDT alone (P<.001).9 In a small study, Alexiades10 reported a statistically significant improvement in AKs at 4 and 8 weeks posttreatment for 10 patients receiving CO2 laser AFR-PDT vs conventional PDT (P<.05). Studies of organ transplant recipients—who are at higher risk for AK and NMSC development—demonstrated favorable results for combined CO2 laser AFR and PDT vs either laser treatment11 or PDT9,12 alone, with significant reductions in the number of AKs (P=.002). Results were maintained for 3 to 4 months after treatment. Additional studies have shown that combining CO2 laser AFR and PDT may reduce the PDT incubation time or number of treatments required to achieve a response over conventional PDT.13,14
Our proof-of-concept study was designed to assess efficacy of CO2 laser AFR to enhance an approved drug delivery system in the treatment of AK and NMSC. The objective was to compare effect and durability of AFR-PDT vs standard ALA-PDT in the treatment of AK and NMSCs in a split-sided study of various body locations.
Methods
This randomized, split-sided study compared CO2 laser AFR-PDT to standard ALA-PDT for the treatment of AK and NMSC conducted at 1 site in Los Gatos, California. Patients who had a skin cancer screening and received a biopsy diagnosis of AK or NMSC were invited to attend an enrollment visit. Key inclusion criteria for enrollment were male or female patients aged 40 to 85 years with notable symmetrically comparable photodamage (at least 1 AK per square centimeter) in 1 or more skin areas—scalp, face, or distal extremities—with presence of clinically identifiable NMSCs proven by biopsy. Key exclusion criteria were patients who were pregnant; patients with epilepsy, seizures, or a photosensitive disorder; those taking photosensitizing medication (eg, doxycycline, hydrochlorothiazide); or immunocompromised patients. The study was approved by an institutional review board (Salus IRB [Austin, Texas]), and each participant underwent a complete and informed consent process.
Laterality for pretreatment with AFR followed by ALA-PDT vs ALA-PDT alone was determined at the time of treatment using a computer-based random number generator; even numbers resulted in pretreatment of the right side, and odd numbers resulted in pretreatment of the left side. Because of the difference in pretreatment methods for the 2 sides, it was not possible to perform the procedure under blinded conditions.
The treatment area was prepared by defatting the entire site with 70% isopropyl alcohol, followed by benzalkonium chloride antibacterial cleansing for the AFR pretreatment side. A 7% lidocaine/7% tetracaine ointment was applied under polyethylene wrap occlusion to the AFR pretreatment side for 20 minutes. Additionally, nerve blocks and field blocks with a mixture of 1.1% lidocaine with epinephrine/0.5% bupivacaine with epinephrine were performed wherever feasible. After 20 minutes, the lidocaine-tetracaine ointment was removed with isopropanol, and AFR treatment commenced immediately with the SmartXide DOT laser (DEKA)(1 pass of 25 W, 1200-microsecond duration at 500-µm spacing, 200-µm spot size, achieving 12% surface area ablation). Hyperkeratotic treated areas were debrided with saline and received a second pass with the laser. Aminolevulinic acid solution 20% (Levulan Kerastick; DUSA Pharmaceuticals, Inc)15 was applied to both sides of the treatment area and allowed to absorb for a 1-hour incubation period, which was followed by blue-light exposure at a power density of 10 mW/cm2 for 16 minutes and 40 seconds using the BLU-U Photodynamic Therapy Illuminator (DUSA Pharmaceuticals, Inc). Areas treated with AFR were then covered with a layer of Aquaphor ointment (Beiersdorf, Inc) and an absorptive hydrogel dressing for48 to 96 hours, with continued application of the ointment until resolution of all crusting. After treatment, patients were instructed to avoid direct sun exposure, wear a hat or visor for the first 2 weeks posttreatment when outdoors, and apply sunscreen with a sun protection factor greater than 30 once skin had healed.
Follow-up was conducted at 1 week, 1 month, 3 months, and 6 months after the PDT procedure. The primary end points were clinical clearance of NMSC lesions at 1, 3, and 6 months posttreatment and histological clearance at 6 months. Secondary end points assessed quality of life and functional improvements.
Results
Twenty-four potential participants experiencing AKs and/or NMSCs were screened for the study, with 19 meeting inclusion criteria. All participants were white, non-Hispanic, and had Fitzpatrick skin types I or II. Treated areas for all participants had field cancerization defined as at least 1 AK per square centimeter. All 19 participants enrolled in the study completed the posttreatment evaluations up to 6 months. All AFR-pretreated sites showed superior results in reduction in number, size, or hyperkeratosis of AKs at all follow-up visits, with a complete absence of new AK formation at the 6-month follow-up (Table). Conversely, sites treated with standard PDT only showed some recurrence of AKs at 6 months. Of the 3 participants who had biopsy-confirmed BCCs on the AFR-pretreated side, there were 3 persistent lesions after treatment at the 6-month visit. Two participants experienced persistence of a confirmed SCC in situ that was on the laser-pretreated side only (1 on the forehead and 1 on the hand), whereas 1 participant with an SCC on the leg at baseline had no recurrence at 6 months. A participant who received treatment on the lower lip had persistence of actinic cheilitis on both the AFR- and non–AFR-treated sides of the lip.
Scalp and facial sites healed fully in an average of 7 days, whereas upper extremities—forearm and hands—took approximately 14 days to heal completely. Lower extremity AFR-pretreated sites exhibited substantial weeping, resulting in prolonged healing of approximately 21 days for resolution of all scabbing.
Comment
In this split-sided study in patients with field cancerization, the use of CO2 laser AFR before treatment with PDT increased AK lesion clearance compared to ALA-PDT alone. Prior studies of fractional laser–assisted drug delivery on porcine skin using topical MAL showed that laser channels approximately 3-mm apart were able to distribute protoporphyrin through the entire skin.6 The ablative nature of AFR theoretically provides deeper and more effusive penetration of the ALA solution than using conventional PDT or erbium:YAG lasers with PDT.7,8 Helsing et al11 applied CO2 laser AFR MAL-PDT to AKs in organ transplant recipients and obtained complete responses in 73% of patients compared to a complete response of 31% for AFR alone. The results reported in our study are consistent with Helsing et al,11 showing a complete clinical response for 14 of 19 patients (74%), of whom 4 (21%) had no recurrence of NMSC and 10 (53%) had no recurrence of AK on the AFR-PDT–treated side.
The pretreatment process required for the laser AFR added time to the initial visit compared to conventional PDT, which is balanced by a reduced PDT incubation time (1 hour vs the approved indication of 14–18 hours for face/scalp or 3 hours for upper extremities under occlusion). The use of microneedling as an alternative pretreatment procedure before PDT also has been investigated, with the aim of decreasing the optimum ALA absorption time. The mean reduction in AKs (89.3%) was significantly greater than for PDT alone (69.5%; P<.05) in a small study by Spencer and Freeman.18 Although microneedling is less time-intensive and labor-intensive than laser AFR, the photocoagulative effect and subsequent microhemorrhages resulting from AFR should result in much deeper penetration of ALA solution than for microneedling.
The limitations of this proof-of-concept study arose from the small sample size of 19 participants and the short follow-up period of 6 months. Furthermore, the unblinded nature of the study could create selection, detection, or reporting bias. Further follow-up appointments would aid in determining the longevity of results, which may encourage future use of this technique, despite the time-consuming preparation. A larger study with follow-up greater than 1 year would be beneficial, particularly for monitoring remission from SCCs and BCCs.
Conclusion
Pretreatment with CO2 laser AFR before ALA-PDT provided superior clearance of AKs and thin NMSCs at 6 months compared to ALA-PDT alone (Figure). Additionally, the incubation period for ALA absorption can be reduced before PDT, leading to a shorter treatment time overall. The benefits of AFR pretreatment on AK clearance demonstrated in this study warrant further investigation in a larger trial with a longer follow-up period to monitor maintenance of response.
Acknowledgments
The authors thank the patients who participated in this study. Editorial assistance was provided by Louise Gildea, PhD, of JK Associates Inc, part of the Fishawack Group of Companies (Fishawack, United Kingdom), funded by Sun Pharmaceutical Industries, Inc.
- Criscione VD, Weinstock MA, Naylor MF, et al. Actinic keratoses: natural history and risk of malignant transformation in the Veterans Affairs Topical Tretinoin Chemoprevention Trial. Cancer. 2009;115:2523-2530.
- Morton CA, McKenna KE, Rhodes LE. Guidelines for topical photodynamic therapy: update. Br J Dermatol. 2008;159:1245-1266.
- Casas A, Fukuda H, Di Venosa G, et al. Photosensitization and mechanism of cytotoxicity induced by the use of ALA derivatives in photodynamic therapy. Br J Cancer. 2001;85:279-284.
- Klotz LO, Fritsch C, Briviba K, et al. Activation of JNK and p38 but not ERK MAP kinases in human skin cells by 5-aminolevulinate-photodynamic therapy. Cancer Res. 1998;58:4297-4300.
- Gan SD, Hsu SH, Chuang G, et al. Ablative fractional laser therapy for the treatment of actinic keratosis: a split-face study. J Am Acad Dermatol. 2016;74:387-389.
- Hædersdal M, Sakamoto FH, Farinelli WA, et al. Fractional CO(2) laser-assisted drug delivery. Lasers Surg Med. 2010;42:113-122.
- Šmucler R, Vlk M. Combination of Er:YAG laser and photodynamic therapy in the treatment of nodular basal cell carcinoma. Lasers Surg Med. 2008;40:153-158.
- Ko DY, Jeon SY, Kim KH, et al. Fractional erbium:YAG laser-assisted photodynamic therapy for facial actinic keratoses: a randomized, comparative, prospective study. J Eur Acad Dermatol Venereol. 2014;28:1529-1539.
- Togsverd-Bo K, Lei U, Erlendsson AM, et al. Combination of ablative fractional laser and daylight-mediated photodynamic therapy for actinic keratosis in organ transplant recipients—a randomized controlled trial. Br J Dermatol. 2015;172:467-474.
- Alexiades M. Randomized, controlled trial of fractional carbon dioxide laser resurfacing followed by ultrashort incubation aminolevulinic acid blue light photodynamic therapy for actinic keratosis. Dermatol Surg. 2017;43:1053-1064.
- Helsing P, Togsverd-Bo K, Veierod MB, et al. Intensified fractional CO2 laser-assisted photodynamic therapy vs. laser alone for organ transplant recipients with multiple actinic keratoses and wart-like lesions: a randomized half-side comparative trial on dorsal hands. Br J Dermatol. 2013;169:1087-1092.
- Togsverd-Bo K, Haak CS, Thaysen-Petersen D, et al. Intensified photodynamic therapy of actinic keratoses with fractional CO2 laser: a randomized clinical trial. Br J Dermatol. 2012;166:1262-1269.
- Jang YH, Lee DJ, Shin J, et al. Photodynamic therapy with ablative carbon dioxide fractional laser in treatment of actinic keratosis. Ann Dermatol. 2013;25:417-422.
- Song HS, Jung SE, Jang YH, et al. Fractional carbon dioxide laser-assisted photodynamic therapy for patients with actinic keratosis. Photodermatol Photoimmunol Photomed. 2015;31:296-301.
- ALA Kerastick (aminolevulinic acid HCl) for topical solution, 20% [package insert]. Wilmington, MA: DUSA Pharmaceuticals; 2010.
- Data on file. Wilmington, MA: DUSA Pharmaceuticals; 2020.
- Campbell TM, Goldman MP. Adverse events of fractionated carbon dioxide laser: review of 373 treatments. Dermatol Surg. 2010;36:1645-1650.
- Spencer JM, Freeman SA. Microneedling prior to Levulan PDT for the treatment of actinic keratoses: a split-face, blinded trial. J Drugs Dermatol. 2016;15:1072-1074.
Practice Points
- Pretreatment with CO2 laser ablative fractional resurfacing (AFR) before photodynamic therapy (PDT) provided efficient clearance of actinic keratosis (AK).
- Superior clearance of lesions was seen at 6 months for AK and thin nonmelanoma skin cancers (NMSCs) on pretreated sites compared to PDT alone, with no novel adverse events reported.
- A reduced incubation period for aminolevulinic acid (ALA) absorption before PDT was used, leading to a shorter overall treatment time.
Group Clinic for Chemoprevention of Squamous Cell Carcinoma: A Pilot Study
Squamous cell carcinoma (SCC) has an estimated incidence of more than 2.5 million cases per year in the United States.1 Its precursor lesion, actinic keratosis (AK), had an estimated prevalence of 39.5 million cases in the United States in 2004.2 The dermatology clinic at the Providence VA Medical Center in Rhode Island exerts consistent efforts to treat both SCC and AK by prescribing topical 5-fluorouracil (5-FU) and lifestyle changes that include avoiding sun exposure, wearing protective clothing, and using effective sunscreen.3 A single course of topical 5-FU in veterans has been shown to decrease the risk for SCC by 74% during the year after treatment and also improve AK clearance rates.4,5
Effectiveness of 5-FU for secondary prevention can be decreased by patient misunderstandings, such as applying 5-FU for too short a time or using the corticosteroid cream prematurely, as well as patient nonadherence due to expected adverse skin reactions to 5-FU.6 Education and reassurance before and during therapy maximize patient compliance but can be difficult to accomplish in clinics when time is in short supply. During standard 5-FU treatment at the Providence VA Medical Center, the provider prescribes 5-FU and posttherapy corticosteroid cream at a clinic visit after an informed consent process that includes reviewing with the patient a color handout depicting the expected adverse skin reaction. Patients who later experience severe inflammation and anxiety call the clinic and are overbooked as needed.
To address the practical obstacles to the patient experience with topical 5-FU therapy, we developed a group chemoprevention clinic based on the shared medical appointment (SMA) model. Shared medical appointments, during which multiple patients are scheduled at the same visit with 1 or more health care providers, promote patient risk reduction and guideline adherence in complex diseases, such as chronic heart failure and diabetes mellitus, through efficient resource use, improvement of access to care, and promotion of behavioral changes through group support.7-13 To increase efficiency in the group chemoprevention clinic, we integrated dermatology nurses and nurse practitioners from the chronic care model into the group medical visits, which ran from September 2016 through March 2017. Because veterans could interact with peers undergoing the same treatment, we hypothesized that use of the cream in a group setting would provide positive reinforcement during the course of therapy, resulting in a positive treatment experience. We conducted a retrospective review of medical records of the patients involved in this pilot study to evaluate this model.
Methods
Institutional review board approval was obtained from the Providence VA Medical Center. Informed consent was waived because this study was a retrospective review of medical records.
Study Population
We offered participation in a group chemoprevention clinic based on the SMA model for patients of the dermatology clinic at the Providence VA Medical Center who were planning to start 5-FU in the fall of 2016. Patients were asked if they were interested in participating in a group clinic to receive their 5-FU treatment. Patients who were established dermatology patients within the Veterans Affairs system and had scheduled annual full-body skin examinations were included; patients were not excluded if they had a prior diagnosis of AK but had not been previously treated with 5-FU.
Design
Each SMA group consisted of 3 to 4 patients who met initially to receive the 5-FU medication and attend a 10-minute live presentation that included information on the dangers and causes of SCC and AK, treatment options, directions for using 5-FU, expected spectrum of side effects, and how to minimize the discomfort of treatment side effects. Patients had field treatment limited to areas with clinically apparent AKs on the face and ears. They were prescribed 5-FU cream 5% twice daily.
One physician, one nurse practitioner, and one registered nurse were present at each 1-hour clinic. Patients arrived and were checked in individually by the providers. At check-in, the provider handed the patient a printout of his/her current medication list and a pen to make any necessary corrections. This list was reviewed privately with the patient so the provider could reconcile the medication list and review the patient’s medical history and so the patient could provide informed consent. After, the patient had the opportunity to select a seat from chairs arranged in a circle. There was a live PowerPoint presentation given at the beginning of the clinic with a question-and-answer session immediately following that contained information about the disease and medication process. Clinicians assisted the patients with the initial application of 5-FU in the large group room, and each patient received a handout with information about AKs and a 40-g tube of the 5-FU cream.
This same group then met again 2 weeks later, at which time most patients were experiencing expected adverse skin reactions. At that time, there was a 10-minute live presentation that congratulated the patients on their success in the treatment process, reviewed what to expect in the following weeks, and reinforced the importance of future sun-protective practices. At each visit, photographs and feedback about the group setting were obtained in the large group room. After photographing and rating each patient’s skin reaction severity, the clinicians advised each patient either to continue the 5-FU medication for another week or to discontinue it and apply the triamcinolone cream 0.1% up to 4 times daily as needed for up to 7 days. Each patient received the prescription corticosteroid cream and a gift, courtesy of the VA Voluntary Service Program, of a 360-degree brimmed hat and sunscreen. Time for questions or concerns was available at both sessions.
Data Collection
We reviewed medical records via the Computerized Patient Record System, a nationally accessible electronic health record system, for all patients who participated in the SMA visits from September 2016 through March 2017. Any patient who attended the initial visit but declined therapy at that time was excluded.
Outcomes included attendance at both appointments, stated completion of 14 days of 5-FU treatment, and evidence of 5-FU use according to a validated numeric scale of skin reaction severity.14 We recorded telephone calls and other dermatology clinic and teledermatology appointments during the 3 weeks after the first appointment and the number of dermatology clinic appointments 6 months before and after the SMA for side effects related to 5-FU treatment. Feedback about treatment in the group setting was obtained at both visits.
Results
A total of 16 male patients attended the SMAs, and 14 attended both sessions. Of the 2 patients who were excluded from the study, 1 declined to be scheduled for the second group appointment, and the other was scheduled and confirmed but did not come for his appointment. The mean age was 72 years.
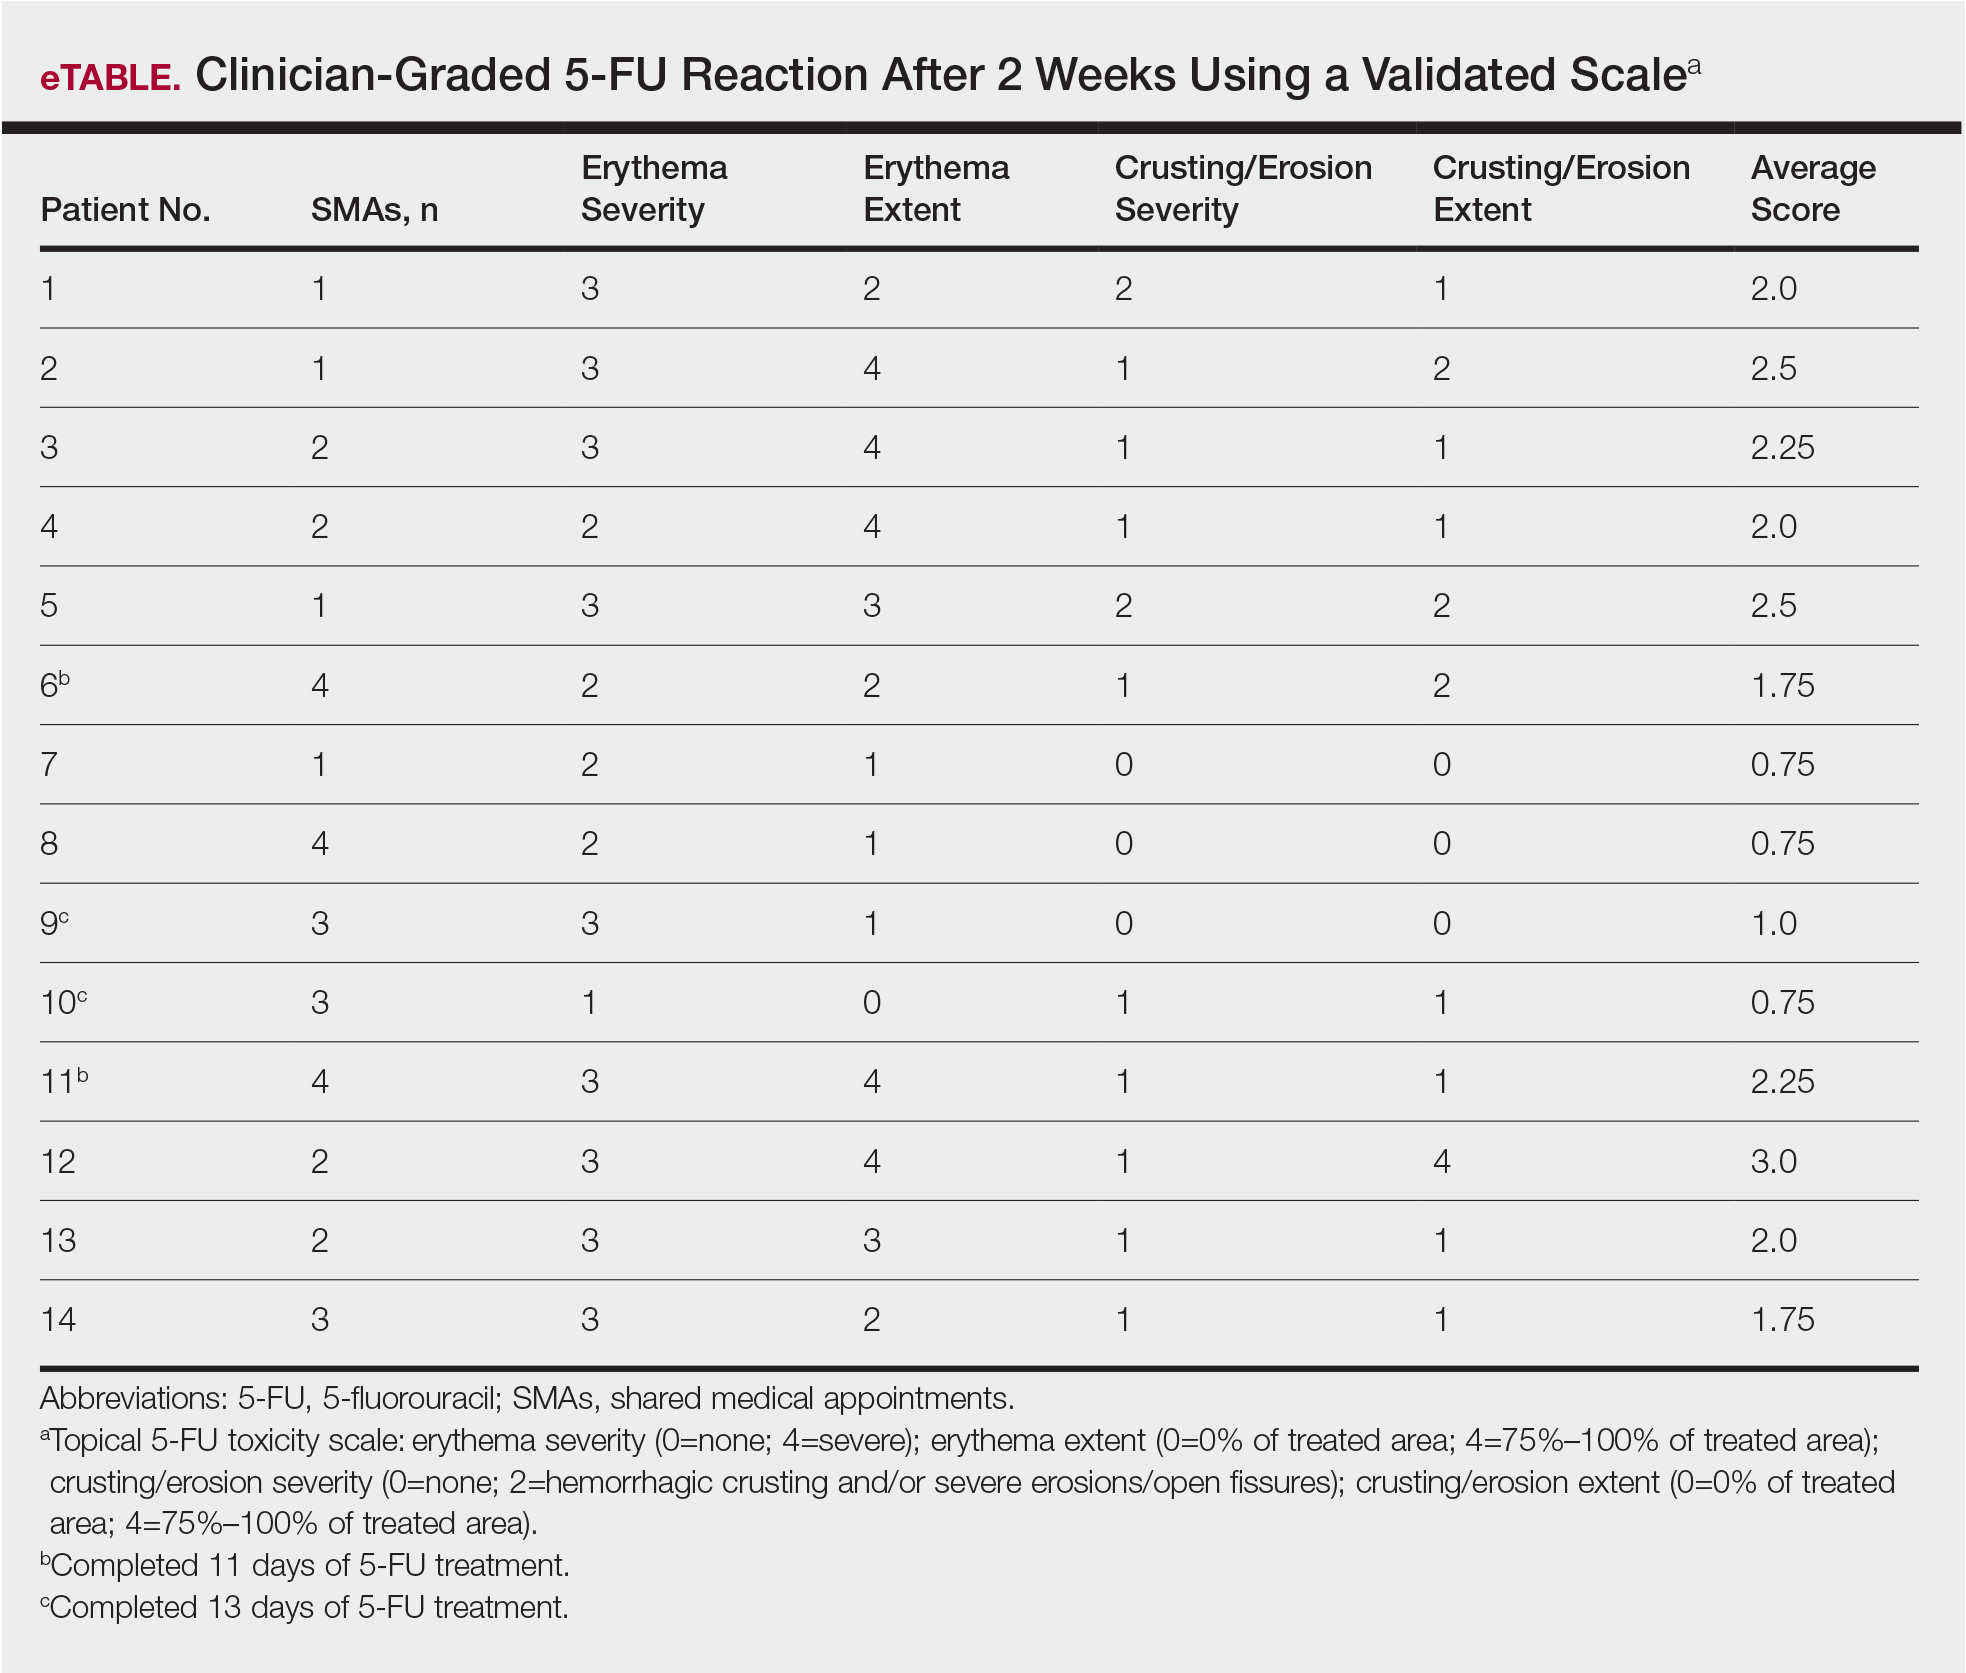
Of the 14 study patients who attended both sessions of the group clinic, 10 stated that they completed 2 weeks of 5-FU therapy, and the other 4 stated that they completed at least 11 days. Results of the validated scale used by clinicians during the second visit to grade the patients’ 5-FU reactions showed that all 14 patients demonstrated at least some expected adverse reactions (eTable). Eleven of 14 patients showed crusting and erosion; 13 showed grade 2 or higher erythema severity. One patient who stopped treatment after 11 days telephoned the dermatology clinic within 1 week of his second SMA. Another patient who stopped treatment after 11 days had a separate dermatology surgery clinic appointment within the 3-week period after starting 5-FU for a recent basal cell carcinoma excision. None of the 14 patients had a dermatology appointment scheduled within 6 months before or after for a 5-FU adverse reaction. One patient who completed the 14-day course was referred to teledermatology for insect bites within that period.
None of the patients were prophylaxed for herpes simplex virus during the treatment period, and none developed a herpes simplex virus eruption during this study. None of the patients required antibiotics for secondary impetiginization of the treatment site.
The verbal feedback about the group setting from patients who completed both appointments was uniformly positive, with specific appreciation for the normalization of the treatment process and opportunity to ask questions with their peers. At the conclusion of the second appointment, all of the patients reported an increased understanding of their condition and the importance of future sun-protective behaviors.
Comment
Shared medical appointments promote treatment adherence in patients with chronic heart failure and diabetes mellitus through efficient resource use, improvement of access to care, and promotion of behavioral change through group support.7-13 Within the dermatology literature, SMAs are more profitable than regular clinic appointments.15 In SMAs designed to improve patient education for preoperative consultations for Mohs micrographic surgery, patient satisfaction reported in postvisit surveys was high, with 84.7% of 149 patients reporting they found the session useful, highlighting how SMAs have potential as practical alternatives to regular medical appointments.16 Similarly, the feedback about the group setting from our patients who completed both appointments was uniformly positive, with specific appreciation for the normalization of the treatment process and opportunity to ask questions with their peers.
The group setting—where patients were interacting with peers undergoing the same treatment—provided an encouraging environment during the course of 5-FU therapy, resulting in a positive treatment experience. Additionally, at the conclusion of the second visit, patients reported an increased understanding of their condition and the importance of future sun-protective behaviors, further demonstrating the impact of this pilot initiative.
The Veterans Affairs’ Current Procedural Terminology code for a group clinic is 99078. Veterans Affairs medical centers and private practices have different approaches to billing and compensation. As more accountable care organizations are formed, there may be a different mixture of ways for handling these SMAs.
Limitations
Our study is limited by the small sample size, selection bias, and self-reported measure of adherence. Adherence to 5-FU is excellent without group support, and without a control group, it is unclear how beneficial the group setting was for adherence.17 The presence of the expected skin reactions at the 2-week return visit cannot account for adherence during the interval between the visits, and this close follow-up may be responsible for the high adherence in this group setting. The major side effects with 5-FU are short-term. Nonetheless, longer-term follow-up would be helpful and a worthy future endeavor.
Veterans share a common bond of military service that may not be shared in a typical private practice setting, which may have facilitated success of this pilot study. We recommend group clinics be evaluated independently in private practices and other systems. However, despite these limitations, the patients in the SMAs demonstrated positive reactions to 5-FU therapy, suggesting the potential for utilizing group clinics as a practical alternative to regular medical appointments.
Conclusion
Our pilot group clinics for AK treatment and chemoprevention of SCC with 5-FU suggest that this model is well received. The group format, which demonstrated uniformly positive reactions to 5-FU therapy, shows promise in battling an epidemic of skin cancer that demands cost-effective interventions.
- Rogers HW, Weinstock MA, Feldman SR, et al. Incidence estimate of nonmelanoma skin cancer (keratinocyte carcinomas) in the U.S. population, 2012. JAMA Dermatol. 2015;151:1081-1086.
- Bickers DR, Lim HW, Margolis D, et al. The burden of skin diseases: 2004 a joint project of the American Academy of Dermatology Association and the Society for Investigative Dermatology. J Am Acad Dermatol. 2006;55:490-500.
- Siegel JA, Korgavkar K, Weinstock MA. Current perspective on actinic keratosis: a review. Br J Dermatol. 2017;177:350-358.
- Weinstock MA, Thwin SS, Siegel JA, et al. Chemoprevention of basal and squamous cell carcinoma with a single course of fluorouracil, 5%, cream: a randomized clinical trial. JAMA Dermatol. 2018;154:167-174.
- Pomerantz H, Hogan D, Eilers D, et al. Long-term efficacy of topical fluorouracil cream, 5%, for treating actinic keratosis: a randomized clinical trial. JAMA Dermatol. 2015;151:952-960.
- Foley P, Stockfleth E, Peris K, et al. Adherence to topical therapies in actinic keratosis: a literature review. J Dermatolog Treat. 2016;27:538-545.
- Desouza CV, Rentschler L, Haynatzki G. The effect of group clinics in the control of diabetes. Prim Care Diabetes. 2010;4:251-254.
- Edelman D, McDuffie JR, Oddone E, et al. Shared Medical Appointments for Chronic Medical Conditions: A Systematic Review. Washington, DC: Department of Veterans Affairs; 2012.
- Edelman D, Gierisch JM, McDuffie JR, et al. Shared medical appointments for patients with diabetes mellitus: a systematic review. J Gen Intern Med. 2015;30:99-106.
- Trento M, Passera P, Tomalino M, et al. Group visits improve metabolic control in type 2 diabetes: a 2-year follow-up. Diabetes Care. 2001;24:995-1000.
- Wagner EH, Grothaus LC, Sandhu N, et al. Chronic care clinics for diabetes in primary care: a system-wide randomized trial. Diabetes Care. 2001;24:695-700.
- Harris MD, Kirsh S, Higgins PA. Shared medical appointments: impact on clinical and quality outcomes in veterans with diabetes. Qual Manag Health Care. 2016;25:176-180.
- Kirsh S, Watts S, Pascuzzi K, et al. Shared medical appointments based on the chronic care model: a quality improvement project to address the challenges of patients with diabetes with high cardiovascular risk. Qual Saf Health Care. 2007;16:349-353.
- Pomerantz H, Korgavkar K, Lee KC, et al. Validation of photograph-based toxicity score for topical 5-fluorouracil cream application. J Cutan Med Surg. 2016;20:458-466.
- Sidorsky T, Huang Z, Dinulos JG. A business case for shared medical appointments in dermatology: improving access and the bottom line. Arch Dermatol. 2010;146:374-381.
- Knackstedt TJ, Samie FH. Shared medical appointments for the preoperative consultation visit of Mohs micrographic surgery. J Am Acad Dermatol. 2015;72:340-344.
- Yentzer B, Hick J, Williams L, et al. Adherence to a topical regimen of 5-fluorouracil, 0.5%, cream for the treatment of actinic keratoses. JAMA Dermatol. 2009;145:203-205.
Squamous cell carcinoma (SCC) has an estimated incidence of more than 2.5 million cases per year in the United States.1 Its precursor lesion, actinic keratosis (AK), had an estimated prevalence of 39.5 million cases in the United States in 2004.2 The dermatology clinic at the Providence VA Medical Center in Rhode Island exerts consistent efforts to treat both SCC and AK by prescribing topical 5-fluorouracil (5-FU) and lifestyle changes that include avoiding sun exposure, wearing protective clothing, and using effective sunscreen.3 A single course of topical 5-FU in veterans has been shown to decrease the risk for SCC by 74% during the year after treatment and also improve AK clearance rates.4,5
Effectiveness of 5-FU for secondary prevention can be decreased by patient misunderstandings, such as applying 5-FU for too short a time or using the corticosteroid cream prematurely, as well as patient nonadherence due to expected adverse skin reactions to 5-FU.6 Education and reassurance before and during therapy maximize patient compliance but can be difficult to accomplish in clinics when time is in short supply. During standard 5-FU treatment at the Providence VA Medical Center, the provider prescribes 5-FU and posttherapy corticosteroid cream at a clinic visit after an informed consent process that includes reviewing with the patient a color handout depicting the expected adverse skin reaction. Patients who later experience severe inflammation and anxiety call the clinic and are overbooked as needed.
To address the practical obstacles to the patient experience with topical 5-FU therapy, we developed a group chemoprevention clinic based on the shared medical appointment (SMA) model. Shared medical appointments, during which multiple patients are scheduled at the same visit with 1 or more health care providers, promote patient risk reduction and guideline adherence in complex diseases, such as chronic heart failure and diabetes mellitus, through efficient resource use, improvement of access to care, and promotion of behavioral changes through group support.7-13 To increase efficiency in the group chemoprevention clinic, we integrated dermatology nurses and nurse practitioners from the chronic care model into the group medical visits, which ran from September 2016 through March 2017. Because veterans could interact with peers undergoing the same treatment, we hypothesized that use of the cream in a group setting would provide positive reinforcement during the course of therapy, resulting in a positive treatment experience. We conducted a retrospective review of medical records of the patients involved in this pilot study to evaluate this model.
Methods
Institutional review board approval was obtained from the Providence VA Medical Center. Informed consent was waived because this study was a retrospective review of medical records.
Study Population
We offered participation in a group chemoprevention clinic based on the SMA model for patients of the dermatology clinic at the Providence VA Medical Center who were planning to start 5-FU in the fall of 2016. Patients were asked if they were interested in participating in a group clinic to receive their 5-FU treatment. Patients who were established dermatology patients within the Veterans Affairs system and had scheduled annual full-body skin examinations were included; patients were not excluded if they had a prior diagnosis of AK but had not been previously treated with 5-FU.
Design
Each SMA group consisted of 3 to 4 patients who met initially to receive the 5-FU medication and attend a 10-minute live presentation that included information on the dangers and causes of SCC and AK, treatment options, directions for using 5-FU, expected spectrum of side effects, and how to minimize the discomfort of treatment side effects. Patients had field treatment limited to areas with clinically apparent AKs on the face and ears. They were prescribed 5-FU cream 5% twice daily.
One physician, one nurse practitioner, and one registered nurse were present at each 1-hour clinic. Patients arrived and were checked in individually by the providers. At check-in, the provider handed the patient a printout of his/her current medication list and a pen to make any necessary corrections. This list was reviewed privately with the patient so the provider could reconcile the medication list and review the patient’s medical history and so the patient could provide informed consent. After, the patient had the opportunity to select a seat from chairs arranged in a circle. There was a live PowerPoint presentation given at the beginning of the clinic with a question-and-answer session immediately following that contained information about the disease and medication process. Clinicians assisted the patients with the initial application of 5-FU in the large group room, and each patient received a handout with information about AKs and a 40-g tube of the 5-FU cream.
This same group then met again 2 weeks later, at which time most patients were experiencing expected adverse skin reactions. At that time, there was a 10-minute live presentation that congratulated the patients on their success in the treatment process, reviewed what to expect in the following weeks, and reinforced the importance of future sun-protective practices. At each visit, photographs and feedback about the group setting were obtained in the large group room. After photographing and rating each patient’s skin reaction severity, the clinicians advised each patient either to continue the 5-FU medication for another week or to discontinue it and apply the triamcinolone cream 0.1% up to 4 times daily as needed for up to 7 days. Each patient received the prescription corticosteroid cream and a gift, courtesy of the VA Voluntary Service Program, of a 360-degree brimmed hat and sunscreen. Time for questions or concerns was available at both sessions.
Data Collection
We reviewed medical records via the Computerized Patient Record System, a nationally accessible electronic health record system, for all patients who participated in the SMA visits from September 2016 through March 2017. Any patient who attended the initial visit but declined therapy at that time was excluded.
Outcomes included attendance at both appointments, stated completion of 14 days of 5-FU treatment, and evidence of 5-FU use according to a validated numeric scale of skin reaction severity.14 We recorded telephone calls and other dermatology clinic and teledermatology appointments during the 3 weeks after the first appointment and the number of dermatology clinic appointments 6 months before and after the SMA for side effects related to 5-FU treatment. Feedback about treatment in the group setting was obtained at both visits.
Results
A total of 16 male patients attended the SMAs, and 14 attended both sessions. Of the 2 patients who were excluded from the study, 1 declined to be scheduled for the second group appointment, and the other was scheduled and confirmed but did not come for his appointment. The mean age was 72 years.
Of the 14 study patients who attended both sessions of the group clinic, 10 stated that they completed 2 weeks of 5-FU therapy, and the other 4 stated that they completed at least 11 days. Results of the validated scale used by clinicians during the second visit to grade the patients’ 5-FU reactions showed that all 14 patients demonstrated at least some expected adverse reactions (eTable). Eleven of 14 patients showed crusting and erosion; 13 showed grade 2 or higher erythema severity. One patient who stopped treatment after 11 days telephoned the dermatology clinic within 1 week of his second SMA. Another patient who stopped treatment after 11 days had a separate dermatology surgery clinic appointment within the 3-week period after starting 5-FU for a recent basal cell carcinoma excision. None of the 14 patients had a dermatology appointment scheduled within 6 months before or after for a 5-FU adverse reaction. One patient who completed the 14-day course was referred to teledermatology for insect bites within that period.
None of the patients were prophylaxed for herpes simplex virus during the treatment period, and none developed a herpes simplex virus eruption during this study. None of the patients required antibiotics for secondary impetiginization of the treatment site.
The verbal feedback about the group setting from patients who completed both appointments was uniformly positive, with specific appreciation for the normalization of the treatment process and opportunity to ask questions with their peers. At the conclusion of the second appointment, all of the patients reported an increased understanding of their condition and the importance of future sun-protective behaviors.
Comment
Shared medical appointments promote treatment adherence in patients with chronic heart failure and diabetes mellitus through efficient resource use, improvement of access to care, and promotion of behavioral change through group support.7-13 Within the dermatology literature, SMAs are more profitable than regular clinic appointments.15 In SMAs designed to improve patient education for preoperative consultations for Mohs micrographic surgery, patient satisfaction reported in postvisit surveys was high, with 84.7% of 149 patients reporting they found the session useful, highlighting how SMAs have potential as practical alternatives to regular medical appointments.16 Similarly, the feedback about the group setting from our patients who completed both appointments was uniformly positive, with specific appreciation for the normalization of the treatment process and opportunity to ask questions with their peers.
The group setting—where patients were interacting with peers undergoing the same treatment—provided an encouraging environment during the course of 5-FU therapy, resulting in a positive treatment experience. Additionally, at the conclusion of the second visit, patients reported an increased understanding of their condition and the importance of future sun-protective behaviors, further demonstrating the impact of this pilot initiative.
The Veterans Affairs’ Current Procedural Terminology code for a group clinic is 99078. Veterans Affairs medical centers and private practices have different approaches to billing and compensation. As more accountable care organizations are formed, there may be a different mixture of ways for handling these SMAs.
Limitations
Our study is limited by the small sample size, selection bias, and self-reported measure of adherence. Adherence to 5-FU is excellent without group support, and without a control group, it is unclear how beneficial the group setting was for adherence.17 The presence of the expected skin reactions at the 2-week return visit cannot account for adherence during the interval between the visits, and this close follow-up may be responsible for the high adherence in this group setting. The major side effects with 5-FU are short-term. Nonetheless, longer-term follow-up would be helpful and a worthy future endeavor.
Veterans share a common bond of military service that may not be shared in a typical private practice setting, which may have facilitated success of this pilot study. We recommend group clinics be evaluated independently in private practices and other systems. However, despite these limitations, the patients in the SMAs demonstrated positive reactions to 5-FU therapy, suggesting the potential for utilizing group clinics as a practical alternative to regular medical appointments.
Conclusion
Our pilot group clinics for AK treatment and chemoprevention of SCC with 5-FU suggest that this model is well received. The group format, which demonstrated uniformly positive reactions to 5-FU therapy, shows promise in battling an epidemic of skin cancer that demands cost-effective interventions.
- Rogers HW, Weinstock MA, Feldman SR, et al. Incidence estimate of nonmelanoma skin cancer (keratinocyte carcinomas) in the U.S. population, 2012. JAMA Dermatol. 2015;151:1081-1086.
- Bickers DR, Lim HW, Margolis D, et al. The burden of skin diseases: 2004 a joint project of the American Academy of Dermatology Association and the Society for Investigative Dermatology. J Am Acad Dermatol. 2006;55:490-500.
- Siegel JA, Korgavkar K, Weinstock MA. Current perspective on actinic keratosis: a review. Br J Dermatol. 2017;177:350-358.
- Weinstock MA, Thwin SS, Siegel JA, et al. Chemoprevention of basal and squamous cell carcinoma with a single course of fluorouracil, 5%, cream: a randomized clinical trial. JAMA Dermatol. 2018;154:167-174.
- Pomerantz H, Hogan D, Eilers D, et al. Long-term efficacy of topical fluorouracil cream, 5%, for treating actinic keratosis: a randomized clinical trial. JAMA Dermatol. 2015;151:952-960.
- Foley P, Stockfleth E, Peris K, et al. Adherence to topical therapies in actinic keratosis: a literature review. J Dermatolog Treat. 2016;27:538-545.
- Desouza CV, Rentschler L, Haynatzki G. The effect of group clinics in the control of diabetes. Prim Care Diabetes. 2010;4:251-254.
- Edelman D, McDuffie JR, Oddone E, et al. Shared Medical Appointments for Chronic Medical Conditions: A Systematic Review. Washington, DC: Department of Veterans Affairs; 2012.
- Edelman D, Gierisch JM, McDuffie JR, et al. Shared medical appointments for patients with diabetes mellitus: a systematic review. J Gen Intern Med. 2015;30:99-106.
- Trento M, Passera P, Tomalino M, et al. Group visits improve metabolic control in type 2 diabetes: a 2-year follow-up. Diabetes Care. 2001;24:995-1000.
- Wagner EH, Grothaus LC, Sandhu N, et al. Chronic care clinics for diabetes in primary care: a system-wide randomized trial. Diabetes Care. 2001;24:695-700.
- Harris MD, Kirsh S, Higgins PA. Shared medical appointments: impact on clinical and quality outcomes in veterans with diabetes. Qual Manag Health Care. 2016;25:176-180.
- Kirsh S, Watts S, Pascuzzi K, et al. Shared medical appointments based on the chronic care model: a quality improvement project to address the challenges of patients with diabetes with high cardiovascular risk. Qual Saf Health Care. 2007;16:349-353.
- Pomerantz H, Korgavkar K, Lee KC, et al. Validation of photograph-based toxicity score for topical 5-fluorouracil cream application. J Cutan Med Surg. 2016;20:458-466.
- Sidorsky T, Huang Z, Dinulos JG. A business case for shared medical appointments in dermatology: improving access and the bottom line. Arch Dermatol. 2010;146:374-381.
- Knackstedt TJ, Samie FH. Shared medical appointments for the preoperative consultation visit of Mohs micrographic surgery. J Am Acad Dermatol. 2015;72:340-344.
- Yentzer B, Hick J, Williams L, et al. Adherence to a topical regimen of 5-fluorouracil, 0.5%, cream for the treatment of actinic keratoses. JAMA Dermatol. 2009;145:203-205.
Practice Points
- Shared medical appointments (SMAs) enhance patient experience with topical 5-fluorouracil (5-FU) treatment of actinic keratosis (AK).
- Dermatologists should consider utilizing the SMA model for their patients being treated with 5-FU, as patients demonstrated a positive emotional response to 5-FU therapy in the group clinic setting.

You Need a Plan: A Stepwise Protocol for Operating Room Preparedness During an Infectious Pandemic
The worldwide spread of SARS-CoV-2, the coronavirus that causes the syndrome designated COVID-19 by the World Health Organization (WHO), presents a challenge for emergency operative care in a global pandemic setting that is novel for modern surgical practice. The virulence of this new pathogen has raised concern for how to protect operating room (OR) staff and their environs in the event that an infected patient requires urgent surgical care. Because coronaviridae spread mainly through contact with contaminated respiratory droplets or aerosolized virion-containing particles, personal protective equipment (PPE) is vital to personnel involved in these cases, and proper utilization of these scarce resources poses an additional challenge. Establishment of a clear protocol that adheres to rigorous infection control measures while providing a safe system for intrafacility transport and operative care is an essential component of a successful surgical pandemic response.
The first case of COVID-19 disease identified in the US was diagnosed in Everett, Washington, on January 21, 2020.1 In the succeeding months, the Seattle region became an early epicenter of the epidemic in the US, with Washington State becoming the first state to see in excess of 1,000 cases by mid-March 2020. As hospitalizations for COVID-19 increased, emergency surge preparations were enacted at medical centers across the region. Recommendations for how to manage infected patients evolved rapidly. Anticipating the need to provide surgical services during this pandemic, starting in early March 2020, the perioperative services staff at the US Department of Veterans Affairs (VA) Puget Sound Health Care System (PSHCS) convened to develop the protocol described here through a process of literature review, multidisciplinary discussion, and practical trial runs and drills. VAPSHCS is an urban academic medical center affiliated with the University of Washington, Seattle. The result of this collaboration is a detailed, step-by-step protocol that establishes the roles and responsibilities of the various personnel who intersect in the OR and recruits their teamwork to prevent environmental contamination and health care worker transmission of SARS-CoV-2.
The protocol is divided into discrete practice recommendations for the preoperative, intraoperative, and postoperative management of patients with confirmed or suspected COVID-19 infection, with a focus on maintaining Centers of Disease Control and Prevention-defined respiratory droplet and airborne precautions throughout the period of patient contact and mitigating infectious contamination of the operating suite.2 It is acknowledged that no written protocol can encompass all the possible considerations that attend the vast diversity of surgical scenarios which can transpire in the operative setting. Patient acuity must sometimes mandate modifications to even the most thoroughly laid plans; for instance, the exsanguinating patient requiring emergent surgery for hemorrhage control will undoubtedly require an urgent appraisal of the relative risks and benefits of certain elements of the practices here described. Nevertheless, we believe that this protocol provides a useful framework for mitigating the infection and contamination risks of operative care in an epidemic environment, and should be readily adaptable to any facility that may perform surgery in patients infected with a high-risk contagious pathogen.
Preoperative Management
In addition to introducing the risk of viral transmission, surgery in the patient with COVID-19 also imposes a large consumption of vital PPE, supplies and can become dangerously low in health care centers coping with an influx of infected patients. Early in the pandemic, to reduce exposure, conserve the medical workforce and lessen the resource strain on the overall health care infrastructure, the American College of Surgeons (ACS), American College of Gastroenterology, and other professional societies recommended cancellation of elective procedures, confining operations to urgent or emergent procedures for high-acuity diseases that would negatively impact morbidity or mortality if delayed.3,4 In each case, physicians from the surgical and anesthesia services should discuss the rationale for the operation and secure agreement to commit resources to the endeavor prior to reserving the OR. These considerations should be shared with the patient prior to obtaining informed consent.
Preoperatively, the surgical team, consisting of surgeon, anesthesiologist, OR nurse, surgical technician, and assistants to the surgeon, anesthesiologist and nurse, convene for a preoperative “team huddle.” While assistants will aid in patient transport and supplying equipment to the team during the procedure, they should not be in the OR during the case, to minimize personnel exposure and PPE consumption. All members of the surgical team remove their personal effects, including wallets, phones, badges, and jewelry; any pagers are handed to other members of the care team for the duration of the surgery. During this preoperative team huddle, proper setup and accounting of the surgical equipment is confirmed, as well as the availability of all necessary anesthesia equipment and medications.
A specific OR with versatile characteristics was chosen to be the designated OR for procedures in patients with confirmed or suspected COVID-19. The COVID OR is on standby when no such cases are active, and it is not used for surgeries in noninfected patients. This is in accord with published recommendations of anesthesiologists who, throughout the COVID-19 epidemic in China, maintained designated ORs and anesthesia machines for only infected patients.5 Strong consideration should be given to performing procedures for which endotracheal intubation is not required in the patient’s own respiratory isolation room, rather than the OR to avoid room contamination and excessive use of PPE.5,6
The availability of adequate PPE is confirmed during the preoperative team huddle. At a minimum, powered air purifying respirator devices (PAPRs) with hoods must be available for the anesthesia provider, surgeon and surgical technician, recognizing the Anesthesia Patient Safety Foundation (APSF) recommendation that these devices confer superior protection for those with the highest risk and most proximate exposure to the patient throughout the case.7,8 An N95 respirator, at minimum, must be available for the circulating OR nurse. Patient condition, need for critical care transport, anesthetic plan (monitored anesthesia care or general anesthesia), and availability of negative pressure isolation rooms in the ward vs in the operating suite should help decide patient transport strategies and help determine the most suitable location to secure the airway. In case of an inadvertent tube disconnection, transporting intubated patients carries the risk of disseminating virus laden aerosols into the environment. Risks of pre-OR intubation should be balanced with the potential benefit of securing the airway prior to transport and decreased gross OR contamination with intubation in the operating suite. Airway manipulation and intubation are among the highest risk procedures for nosocomial transmission and performance of these procedures should utilize precautions described in current APSF recommendations.3,9,10
For patients not requiring critical care transport, and when conditions favor intubation in the OR, patients should be transported in a gurney while wearing a surgical mask. Verification of the operative site, surgical plan, and other components of the WHO universal surgical safety checklist or time out are performed in the OR prior to induction of anesthesia, and a conscious patient can be an active participant.
If critical care transport is deemed necessary and/or a decision is made to intubate the patient outside the OR, preferably in a negative airflow respiratory isolation room, the perioperative team will confirm the availability of the following equipment needed for patient transport:
- Portable transport monitor;
- Video laryngoscope;
- Airway supplies and medications for induction of general anesthesia;
- Self-inflating bag-mask apparatus attached to an oxygen source;
- High-quality HMEF (heat and moisture exchanging filter) rated to remove at least 99.97% of airborne particles ≥ 0.3 microns to filter out viral particles attached to the expiratory outlet; and
- PPE including impermeable disposable gowns, gloves, and shoe covers.
While the surgical technician remains in the OR, the rest of the team will proceed to the patient’s location with these supplies, along with the necessary number of PAPRs and N95 respirators.
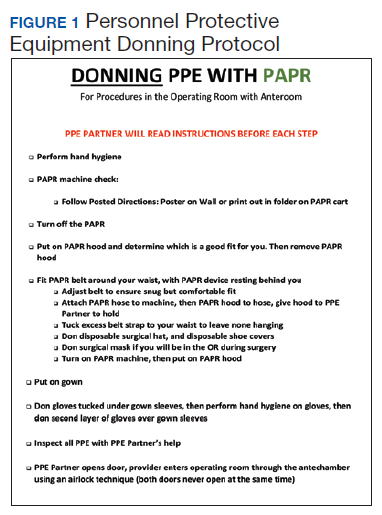
Outside the patient room, the team consisting of surgeon, anesthesia provider, OR nurse, and the assistant to each of these health care providers, gathers for the first time out, confirming the patient’s identification, intended procedure, surgical site, laterality, and informed consent. If the patient is verbal and has decision-making capacity, they confirm their identification, understanding of the planned procedure, and consent with the team over the phone from the confines of their room. If a patient lacks decision making capacity standard organization policies should be adhered to, most of which do not require direct patient contact and do not pose any unique infection control challenges. The anesthesia provider and surgeon don their PPE including PAPR devices with the aid of their assistants. Using a PPE checklist, the surgical team member dons with the assistance of a PPE partner, who is charged with reading the instructions on the checklist to the surgical team member step by step and inspecting the adequacy of the full PPE attire (Figure 1). A similar secondary check of appropriate PPE by an assistant during high risk encounters has also been advocated by other authors.6
Consideration should be given to intubating the patient prior to transport to the OR particularly if the patient originates in a respiratory isolation room with negative pressure airflow, being mindful that most operating suites are ventilated with positive airflow that could help disperse virus laden aerosols in the procedure area. It may also be beneficial to have a secure airway in a patient who is actively coughing, sneezing, and dispersing respiratory droplets to the surrounding environment prior to leaving respiratory isolation. When intubation prior to OR transport is chosen, the fully attired anesthesiologist enters the patient room first, with a video laryngoscope, medication, and other supplies needed to successfully induce general endotracheal tube anesthesia. The anesthesia and surgery assistants don droplet precaution PPE and remain outside the patient room. Whenever possible, a rapid sequence induction is performed with minimization of bag-mask ventilation. Video laryngoscopy is preferred over direct laryngoscopy in patients with COVID-19 as it enables a greater distance between the health care provider and the airway.5,6 The surgeon and OR nurse then enter the room, wearing PPE including PAPR, and assist with attaching the transport monitor and moving the patient bed out of the room. The OR nurse wipes the front face shield and PAPR hood of the anesthesia provider after intubation, to clean these presumably contaminated components prior to exiting the room. A second, clean disposable gown covers the one worn during intubation to minimize environmental contamination during transport.11,12
The patient is intubated, anesthetized, and, transported to the OR, with a self-inflating bag mask apparatus attached to an oxygen source and a second high-quality HMEF rated to remove at least 99.97% of airborne particles ≥ 0.3 microns is attached to the expiratory outlet, or a transport ventilator with HEPA filter attached to the expiratory limb. In the OR, the anesthesia provider, surgical technician, and OR nurse assist with moving the patient to the operating gurney and attaching the monitor. The surgeon remains outside the room in order to doff the gown and gloves worn during transport, disinfect their hands (preoperative scrubbing), and don sterile attire, all while continuing to wear the same PAPR and hood.
Intraoperative Management
Advance planning can help to ensure a safer intraoperative period when a COVID-19 patient is brought to the OR. Patient room airflow patterns and ventilation capacity should be considered when developing measures to prevent aerosol transmission of airborne infectious agents. Although negative pressure rooms are ideal for aerosol generating procedures such as intubation, most ORs are generally maintained at a positive pressure when compared with the surrounding areas. The feasibility of rapidly converting ORs into negative pressure rooms should be in facility planning for COVID-19; portable high-efficiency particulate air (HEPA) machines, for instance, can be set up to create negative pressure areas around the OR.13 We established a negative pressure anteroom outside our OR to be used for doffing and as an airlock, for use by staff who need to enter midcase or pass supplies or specimens into and out of the procedure room (Figure 2). By adding 2 portable HEPA filters and directing the HEPA-filtered exhaust into the OR ventilation return columns, we were able to establish negative pressure airflow in the OR (Figure 3).
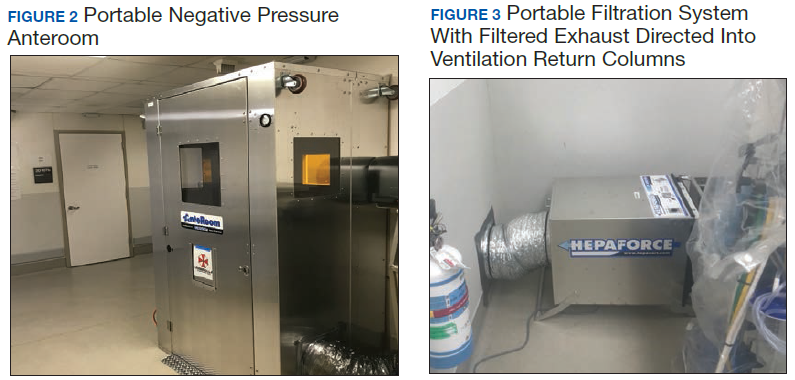
The protocol was devised with the current pandemic-associated shortage of PPE taken into consideration. We decided to minimize staffing across disciplines by excluding all nonessential personal from entering the OR. This includes observers, researchers, and medical students. Residents and fellows may participate if their presence is deemed vital to the patient’s intraoperative care. To further prevent resource consumption, equipment in the designated COVID OR was reduced to essential elements such as the anesthesia machine, a minimized anesthesia drug cart and general supply cabinet, all of which were covered with disposable transparent covers (Figure 4).14 After transfer of the patient to the OR table, the patient stretcher is kept in the OR (space permitting) to minimize contamination of areas immediately outside the OR.
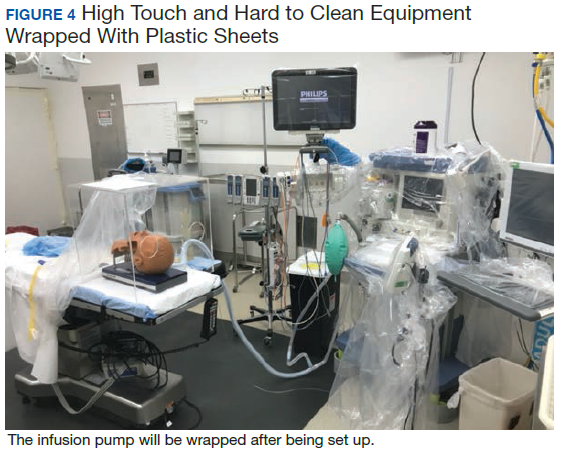
Prior to incision a second time out is performed to confirm the previously verified operative site and plan. During the case, the assistants to the OR nurse and anesthesia provider act as facilitators or “runners” for equipment retrieval and communication with the outside OR staff. These roles are assigned to personnel who are familiar with the layout and day-to-day functioning of the ORs, such as anesthesia technicians and OR circulating nurses. All staff agreed on a strategy of no breaks or alternations whenever possible to conserve PPEs.15 Near the conclusion of the surgical procedure, the receiving intensive care unit (ICU) is given a verbal report on patient status over the phone.
Postperative Management
Similar to intubation, extubation poses a risk of generating aerosolization of infectious airborne microbes.10 It is helpful for OR personnel to be aware of the airflow pattern in their ORs, whether it is positive, negative, or neutral. As the PSHCS ORs were originally engineered as positive pressure rooms, we elected to have to postoperative patients with COVID-19 transported intubated to a reverse airflow or negative pressure room in the ICU. Extubation is performed when the intensive care team has determined the patient meets extubation criteria and has passed a spontaneous breathing trial. When a negative pressure room in the ICU is not available for recovery, extubation may be performed in the OR.
In that circumstance, the patient remains in the OR for 30 minutes after extubation to allow for turnover of air in the room prior to the doors opening for patient transport to the ICU.16 A surgical mask is placed over the patient’s oxygenating face mask to reduce droplet spread during transport. Patients who are not intubated for the anesthetic may be first recovered in the operating room or transported under droplet precautions directly back to a negative pressure isolation room.
Prior to transport, the patient’s gurney is thoroughly cleaned with Environmental Protection Agency-approved disinfectant wipes, and a clean sheet is placed over the patient’s body below the head.17 The front face shield of the surgeon’s and anesthesiologist’s PAPR hood should be wiped down with an alcohol-based disinfectant. Both health care providers don a clean disposable gown as an outer layer to minimize contamination by their used attire during transport. Once the patient is transported out of the OR, all disposable items are discarded. Reusable medical equipment are cleaned and disinfected according to a thorough application of local environmental services standard operating procedures.18 The surgeon and anesthesia providers aid in transporting the patient to the ICU, along with their outside OR assistants. All personnel remaining in the OR exit and doff their PPE according to the doffing protocol, which is similar to the donning protocol, utilizes a PPE partner tasked with providing instructions to the surgical team member step by step (Figure 5).
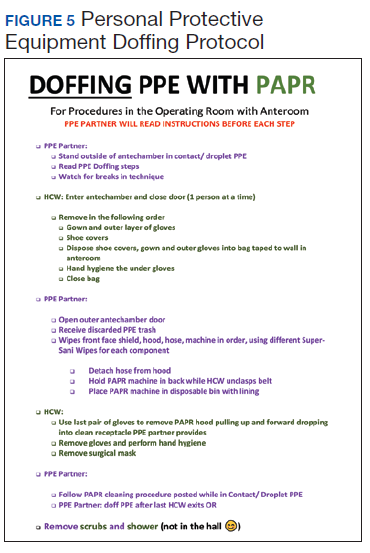
After leaving the OR, terminal cleaning must be performed by environmental services (EVS) personnel, but they should delay entry into the room until a sufficient amount of time has elapsed after the last aerosol-generating procedure in the OR. Time determination will depend on the air change per hour (ACH) in the OR that will achieve 99.9% removal of airborne contaminates. For example, ventilation in our operating rooms operate at approximately 15 to 20 ACH, which should attain that level of air clearance in 21 to 28 minutes.16 Once the stipulated time has elapsed EVS personnel may enter the room but should wear a gown and gloves when performing terminal cleaning. A face mask and eye protection should be added if splashes or sprays during cleaning and disinfection activities are anticipated, or otherwise required based on the selected cleaning products. Anesthesia technicians can now also enter the room to disinfect the anesthesia machines and set up all disposable supplies for any potential following case.
Conclusions
The outbreak of COVID-19 has resulted in an unprecedented modern health care crisis across the globe. Perioperative management of patients with COVID-19 pose unique challenges to all personnel working in the OR, where the risk of nosocomial transmission of infection is ever present. It is essential that hospitals consider their local resources, infrastructure and capabilities when devising policies to respond to the COVID-19 emergency. In all perioperative situations, meticulous attention should be given to both donning and doffing of PPE, crucial for the safety of everyone involved in the care of patients with COVID-19.
Our experience also highlighted the importance of treating a new protocol as an evolving document, which can be modified and improved through the conduct of training and simulation exercises with providers across disciplines (Figure 6). In gathering nurses, anesthesia staff, and surgeons to perform drills and simulate their roles in an imaginary scenario, we gained new insights, and made corrections and additions that ultimately generated the presently described process. Modifications to any protocol may be necessary depending on the unique circumstances of individual health care systems and hospitals, the characteristics of the patient population they cater to, and the resources and expertise they have available. As the pandemic continues, we are bound to learn more about the epidemiology and modes of transmission of SARS-CoV-2, which may demand further changes to our practice. It is crucial to remember that while emergency policies must be rapidly developed, they should be collaboratively improved and incorporate new knowledge when it becomes available. This is essential to ensure the ultimate protocol is useful, up-to-date, easy to follow and tailored to the unique local environment of each health care setting.
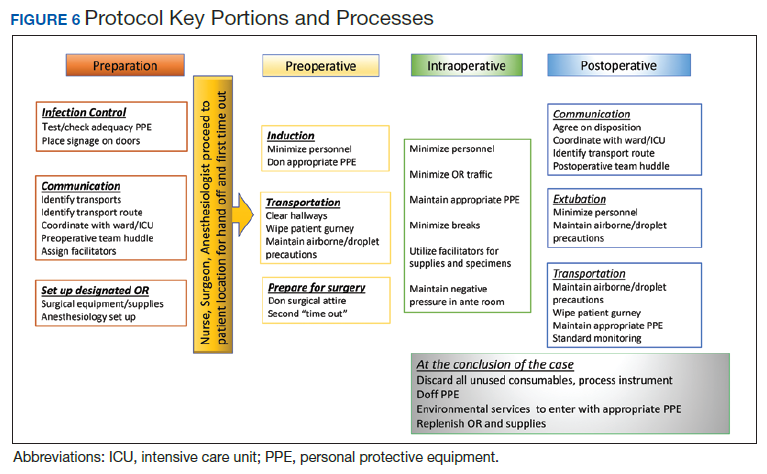
After the initial apprehensions and struggles that attended our confrontation with the crisis, it is our hope that the experience we share will be helpful to surgical staff at other institutions grappling with the challenges of operative care in the pandemic environment. While this protocol focuses on the current COVID-19 pandemic, these recommendations serve as a template for surgical preparedness that can be readily adapted to the next infectious disease crisis that will inevitably emerge.
1. Holshue ML, DeBolt C, Lindquist S, et al. First Case of 2019 Novel Coronavirus in the United States. N Engl J Med. 2020;382(10):929-936.
2. Siegel S RE, Jackson M, Chiarello L. Healthcare Infection Control Practices Advisory Committee; Guideline for Isolation Precautions. Centers For Disease Control and Prevention. https://www.cdc.gov/infectioncontrol/guidelines/isolation/index.html. Published 2007. Accessed March 28, 2020.
3. American College of Surgeons: COVID-19: Guidance for Triage of Non-Emergent Surgical Procedures. American College of Surgeons. https://www.facs.org/covid-19/clinical-guidance/triage. Published March 17, 2020. Accessed April 19, 2020.
4. American College of Gastroenterology. Gastroenterology professional society Guidance on endoscopic procedures During the covid-19 pandemic. American College of Gastroenterology. https://webfiles.gi.org/links/media/Joint_GI_Society_Guidance_on_Endoscopic_Procedure_During_COVID19_FINAL_impending_3312020.pdf. Published March 31, 2020. Accessed April 19, 2020.
5. Chen X, Liu Y, Gong Y, et al. Perioperative management of patients infected with the novel coronavirus: recommendation from the Joint Task Force of the Chinese Society of Anesthesiology and the Chinese Association of Anesthesiologists [published online ahead of print, 2020 Mar 26]. Anesthesiology. 2020;10.1097/ALN.0000000000003301.
6. Zhang HF, Bo L, Lin Y, et al. Response of Chinese anesthesiologists to the COVID-19 outbreak [published online ahead of print, 2020 Mar 30]. Anesthesiology. 2020;10.1097/ALN.0000000000003300.
7. Kamming D, Gardam M, Chung F. Anaesthesia and SARS. Br J Anaesth. 2003;90(6):715-718.
8. Zucco L LN, Ketchandji D, Aziz M, Ramachandran SK. Perioperative considerations for the 2019 novel coronavirus (COVID-19). https://www.apsf.org/news-updatesperioperative-considerations-for-the-2019-novel-coronavirus-covid-19/. Published Feb 12, 2020. Accessed March 30, 2020.
9. Caputo KM, Byrick R, Chapman MG, Orser BJ, Orser BA. Intubation of SARS patients: infection and perspectives of healthcare workers. Can J Anaesth. 2006;53(2):122-129.
10. Judson SD, Munster VJ. Nosocomial transmission of emerging viruses via aerosol-generating medical procedures. Viruses. 2019;11(10):940.
11. Peng PWH, Ho PL, Hota SS. Outbreak of a new coronavirus: what anaesthetists should know. Br J Anaesth. 2020;124(5):497‐501.
12. Ti LK, Ang LS, Foong TW, Ng BSW. What we do when a COVID-19 patient needs an operation: operating room preparation and guidance [published online ahead of print, 2020 Mar 6]. Can J Anaesth. 2020;1‐3.
13. Chow TT, Kwan A, Lin Z, Bai W. Conversion of operating theatre from positive to negative pressure environment. J Hosp Infect. 2006;64(4):371-378.
14. Clark C, Taenzer A, Charette K, Whitty M. Decreasing contamination of the anesthesia environment. Am J Infect Control. 2014;42(11):1223-1225.
15. Dexter F, Parra MC, Brown JR, Loftus RW. Perioperative COVID-19 defense: an evidence-based approach for optimization of infection control and operating room management [published online ahead of print, 2020 Mar 26]. Anesth Analg. 2020;10.1213/ANE.0000000000004829.
16. Jensen PA, Lambert LA, Iademarco MF, Ridzon R, CDC. Guidelines for preventing the transmission of Mycobacterium tuberculosis in health-care settings, 2005. MMWR Recomm Rep. 2005;54(RR-17):1-141.
17. US Environmental Protection Agency. List N: disinfectants for use against SARS-CoV-2. https://www.epa.gov/pesticide-registration/list-n-disinfectants-use-against-sars-cov-2. Updated April 16, 2020. Accessed April 19, 2020.
18. Munoz-Price LS, Bowdle A, Johnston BL, et al. Infection prevention in the operating room anesthesia work area [published correction appears in Infect Control Hosp Epidemiol. 2019 Apr;40(4):500]. Infect Control Hosp Epidemiol. 2018;1‐17.
The worldwide spread of SARS-CoV-2, the coronavirus that causes the syndrome designated COVID-19 by the World Health Organization (WHO), presents a challenge for emergency operative care in a global pandemic setting that is novel for modern surgical practice. The virulence of this new pathogen has raised concern for how to protect operating room (OR) staff and their environs in the event that an infected patient requires urgent surgical care. Because coronaviridae spread mainly through contact with contaminated respiratory droplets or aerosolized virion-containing particles, personal protective equipment (PPE) is vital to personnel involved in these cases, and proper utilization of these scarce resources poses an additional challenge. Establishment of a clear protocol that adheres to rigorous infection control measures while providing a safe system for intrafacility transport and operative care is an essential component of a successful surgical pandemic response.
The first case of COVID-19 disease identified in the US was diagnosed in Everett, Washington, on January 21, 2020.1 In the succeeding months, the Seattle region became an early epicenter of the epidemic in the US, with Washington State becoming the first state to see in excess of 1,000 cases by mid-March 2020. As hospitalizations for COVID-19 increased, emergency surge preparations were enacted at medical centers across the region. Recommendations for how to manage infected patients evolved rapidly. Anticipating the need to provide surgical services during this pandemic, starting in early March 2020, the perioperative services staff at the US Department of Veterans Affairs (VA) Puget Sound Health Care System (PSHCS) convened to develop the protocol described here through a process of literature review, multidisciplinary discussion, and practical trial runs and drills. VAPSHCS is an urban academic medical center affiliated with the University of Washington, Seattle. The result of this collaboration is a detailed, step-by-step protocol that establishes the roles and responsibilities of the various personnel who intersect in the OR and recruits their teamwork to prevent environmental contamination and health care worker transmission of SARS-CoV-2.
The protocol is divided into discrete practice recommendations for the preoperative, intraoperative, and postoperative management of patients with confirmed or suspected COVID-19 infection, with a focus on maintaining Centers of Disease Control and Prevention-defined respiratory droplet and airborne precautions throughout the period of patient contact and mitigating infectious contamination of the operating suite.2 It is acknowledged that no written protocol can encompass all the possible considerations that attend the vast diversity of surgical scenarios which can transpire in the operative setting. Patient acuity must sometimes mandate modifications to even the most thoroughly laid plans; for instance, the exsanguinating patient requiring emergent surgery for hemorrhage control will undoubtedly require an urgent appraisal of the relative risks and benefits of certain elements of the practices here described. Nevertheless, we believe that this protocol provides a useful framework for mitigating the infection and contamination risks of operative care in an epidemic environment, and should be readily adaptable to any facility that may perform surgery in patients infected with a high-risk contagious pathogen.
Preoperative Management
In addition to introducing the risk of viral transmission, surgery in the patient with COVID-19 also imposes a large consumption of vital PPE, supplies and can become dangerously low in health care centers coping with an influx of infected patients. Early in the pandemic, to reduce exposure, conserve the medical workforce and lessen the resource strain on the overall health care infrastructure, the American College of Surgeons (ACS), American College of Gastroenterology, and other professional societies recommended cancellation of elective procedures, confining operations to urgent or emergent procedures for high-acuity diseases that would negatively impact morbidity or mortality if delayed.3,4 In each case, physicians from the surgical and anesthesia services should discuss the rationale for the operation and secure agreement to commit resources to the endeavor prior to reserving the OR. These considerations should be shared with the patient prior to obtaining informed consent.
Preoperatively, the surgical team, consisting of surgeon, anesthesiologist, OR nurse, surgical technician, and assistants to the surgeon, anesthesiologist and nurse, convene for a preoperative “team huddle.” While assistants will aid in patient transport and supplying equipment to the team during the procedure, they should not be in the OR during the case, to minimize personnel exposure and PPE consumption. All members of the surgical team remove their personal effects, including wallets, phones, badges, and jewelry; any pagers are handed to other members of the care team for the duration of the surgery. During this preoperative team huddle, proper setup and accounting of the surgical equipment is confirmed, as well as the availability of all necessary anesthesia equipment and medications.
A specific OR with versatile characteristics was chosen to be the designated OR for procedures in patients with confirmed or suspected COVID-19. The COVID OR is on standby when no such cases are active, and it is not used for surgeries in noninfected patients. This is in accord with published recommendations of anesthesiologists who, throughout the COVID-19 epidemic in China, maintained designated ORs and anesthesia machines for only infected patients.5 Strong consideration should be given to performing procedures for which endotracheal intubation is not required in the patient’s own respiratory isolation room, rather than the OR to avoid room contamination and excessive use of PPE.5,6
The availability of adequate PPE is confirmed during the preoperative team huddle. At a minimum, powered air purifying respirator devices (PAPRs) with hoods must be available for the anesthesia provider, surgeon and surgical technician, recognizing the Anesthesia Patient Safety Foundation (APSF) recommendation that these devices confer superior protection for those with the highest risk and most proximate exposure to the patient throughout the case.7,8 An N95 respirator, at minimum, must be available for the circulating OR nurse. Patient condition, need for critical care transport, anesthetic plan (monitored anesthesia care or general anesthesia), and availability of negative pressure isolation rooms in the ward vs in the operating suite should help decide patient transport strategies and help determine the most suitable location to secure the airway. In case of an inadvertent tube disconnection, transporting intubated patients carries the risk of disseminating virus laden aerosols into the environment. Risks of pre-OR intubation should be balanced with the potential benefit of securing the airway prior to transport and decreased gross OR contamination with intubation in the operating suite. Airway manipulation and intubation are among the highest risk procedures for nosocomial transmission and performance of these procedures should utilize precautions described in current APSF recommendations.3,9,10
For patients not requiring critical care transport, and when conditions favor intubation in the OR, patients should be transported in a gurney while wearing a surgical mask. Verification of the operative site, surgical plan, and other components of the WHO universal surgical safety checklist or time out are performed in the OR prior to induction of anesthesia, and a conscious patient can be an active participant.
If critical care transport is deemed necessary and/or a decision is made to intubate the patient outside the OR, preferably in a negative airflow respiratory isolation room, the perioperative team will confirm the availability of the following equipment needed for patient transport:
- Portable transport monitor;
- Video laryngoscope;
- Airway supplies and medications for induction of general anesthesia;
- Self-inflating bag-mask apparatus attached to an oxygen source;
- High-quality HMEF (heat and moisture exchanging filter) rated to remove at least 99.97% of airborne particles ≥ 0.3 microns to filter out viral particles attached to the expiratory outlet; and
- PPE including impermeable disposable gowns, gloves, and shoe covers.
While the surgical technician remains in the OR, the rest of the team will proceed to the patient’s location with these supplies, along with the necessary number of PAPRs and N95 respirators.
Outside the patient room, the team consisting of surgeon, anesthesia provider, OR nurse, and the assistant to each of these health care providers, gathers for the first time out, confirming the patient’s identification, intended procedure, surgical site, laterality, and informed consent. If the patient is verbal and has decision-making capacity, they confirm their identification, understanding of the planned procedure, and consent with the team over the phone from the confines of their room. If a patient lacks decision making capacity standard organization policies should be adhered to, most of which do not require direct patient contact and do not pose any unique infection control challenges. The anesthesia provider and surgeon don their PPE including PAPR devices with the aid of their assistants. Using a PPE checklist, the surgical team member dons with the assistance of a PPE partner, who is charged with reading the instructions on the checklist to the surgical team member step by step and inspecting the adequacy of the full PPE attire (Figure 1). A similar secondary check of appropriate PPE by an assistant during high risk encounters has also been advocated by other authors.6
Consideration should be given to intubating the patient prior to transport to the OR particularly if the patient originates in a respiratory isolation room with negative pressure airflow, being mindful that most operating suites are ventilated with positive airflow that could help disperse virus laden aerosols in the procedure area. It may also be beneficial to have a secure airway in a patient who is actively coughing, sneezing, and dispersing respiratory droplets to the surrounding environment prior to leaving respiratory isolation. When intubation prior to OR transport is chosen, the fully attired anesthesiologist enters the patient room first, with a video laryngoscope, medication, and other supplies needed to successfully induce general endotracheal tube anesthesia. The anesthesia and surgery assistants don droplet precaution PPE and remain outside the patient room. Whenever possible, a rapid sequence induction is performed with minimization of bag-mask ventilation. Video laryngoscopy is preferred over direct laryngoscopy in patients with COVID-19 as it enables a greater distance between the health care provider and the airway.5,6 The surgeon and OR nurse then enter the room, wearing PPE including PAPR, and assist with attaching the transport monitor and moving the patient bed out of the room. The OR nurse wipes the front face shield and PAPR hood of the anesthesia provider after intubation, to clean these presumably contaminated components prior to exiting the room. A second, clean disposable gown covers the one worn during intubation to minimize environmental contamination during transport.11,12
The patient is intubated, anesthetized, and, transported to the OR, with a self-inflating bag mask apparatus attached to an oxygen source and a second high-quality HMEF rated to remove at least 99.97% of airborne particles ≥ 0.3 microns is attached to the expiratory outlet, or a transport ventilator with HEPA filter attached to the expiratory limb. In the OR, the anesthesia provider, surgical technician, and OR nurse assist with moving the patient to the operating gurney and attaching the monitor. The surgeon remains outside the room in order to doff the gown and gloves worn during transport, disinfect their hands (preoperative scrubbing), and don sterile attire, all while continuing to wear the same PAPR and hood.
Intraoperative Management
Advance planning can help to ensure a safer intraoperative period when a COVID-19 patient is brought to the OR. Patient room airflow patterns and ventilation capacity should be considered when developing measures to prevent aerosol transmission of airborne infectious agents. Although negative pressure rooms are ideal for aerosol generating procedures such as intubation, most ORs are generally maintained at a positive pressure when compared with the surrounding areas. The feasibility of rapidly converting ORs into negative pressure rooms should be in facility planning for COVID-19; portable high-efficiency particulate air (HEPA) machines, for instance, can be set up to create negative pressure areas around the OR.13 We established a negative pressure anteroom outside our OR to be used for doffing and as an airlock, for use by staff who need to enter midcase or pass supplies or specimens into and out of the procedure room (Figure 2). By adding 2 portable HEPA filters and directing the HEPA-filtered exhaust into the OR ventilation return columns, we were able to establish negative pressure airflow in the OR (Figure 3).
The protocol was devised with the current pandemic-associated shortage of PPE taken into consideration. We decided to minimize staffing across disciplines by excluding all nonessential personal from entering the OR. This includes observers, researchers, and medical students. Residents and fellows may participate if their presence is deemed vital to the patient’s intraoperative care. To further prevent resource consumption, equipment in the designated COVID OR was reduced to essential elements such as the anesthesia machine, a minimized anesthesia drug cart and general supply cabinet, all of which were covered with disposable transparent covers (Figure 4).14 After transfer of the patient to the OR table, the patient stretcher is kept in the OR (space permitting) to minimize contamination of areas immediately outside the OR.
Prior to incision a second time out is performed to confirm the previously verified operative site and plan. During the case, the assistants to the OR nurse and anesthesia provider act as facilitators or “runners” for equipment retrieval and communication with the outside OR staff. These roles are assigned to personnel who are familiar with the layout and day-to-day functioning of the ORs, such as anesthesia technicians and OR circulating nurses. All staff agreed on a strategy of no breaks or alternations whenever possible to conserve PPEs.15 Near the conclusion of the surgical procedure, the receiving intensive care unit (ICU) is given a verbal report on patient status over the phone.
Postperative Management
Similar to intubation, extubation poses a risk of generating aerosolization of infectious airborne microbes.10 It is helpful for OR personnel to be aware of the airflow pattern in their ORs, whether it is positive, negative, or neutral. As the PSHCS ORs were originally engineered as positive pressure rooms, we elected to have to postoperative patients with COVID-19 transported intubated to a reverse airflow or negative pressure room in the ICU. Extubation is performed when the intensive care team has determined the patient meets extubation criteria and has passed a spontaneous breathing trial. When a negative pressure room in the ICU is not available for recovery, extubation may be performed in the OR.
In that circumstance, the patient remains in the OR for 30 minutes after extubation to allow for turnover of air in the room prior to the doors opening for patient transport to the ICU.16 A surgical mask is placed over the patient’s oxygenating face mask to reduce droplet spread during transport. Patients who are not intubated for the anesthetic may be first recovered in the operating room or transported under droplet precautions directly back to a negative pressure isolation room.
Prior to transport, the patient’s gurney is thoroughly cleaned with Environmental Protection Agency-approved disinfectant wipes, and a clean sheet is placed over the patient’s body below the head.17 The front face shield of the surgeon’s and anesthesiologist’s PAPR hood should be wiped down with an alcohol-based disinfectant. Both health care providers don a clean disposable gown as an outer layer to minimize contamination by their used attire during transport. Once the patient is transported out of the OR, all disposable items are discarded. Reusable medical equipment are cleaned and disinfected according to a thorough application of local environmental services standard operating procedures.18 The surgeon and anesthesia providers aid in transporting the patient to the ICU, along with their outside OR assistants. All personnel remaining in the OR exit and doff their PPE according to the doffing protocol, which is similar to the donning protocol, utilizes a PPE partner tasked with providing instructions to the surgical team member step by step (Figure 5).
After leaving the OR, terminal cleaning must be performed by environmental services (EVS) personnel, but they should delay entry into the room until a sufficient amount of time has elapsed after the last aerosol-generating procedure in the OR. Time determination will depend on the air change per hour (ACH) in the OR that will achieve 99.9% removal of airborne contaminates. For example, ventilation in our operating rooms operate at approximately 15 to 20 ACH, which should attain that level of air clearance in 21 to 28 minutes.16 Once the stipulated time has elapsed EVS personnel may enter the room but should wear a gown and gloves when performing terminal cleaning. A face mask and eye protection should be added if splashes or sprays during cleaning and disinfection activities are anticipated, or otherwise required based on the selected cleaning products. Anesthesia technicians can now also enter the room to disinfect the anesthesia machines and set up all disposable supplies for any potential following case.
Conclusions
The outbreak of COVID-19 has resulted in an unprecedented modern health care crisis across the globe. Perioperative management of patients with COVID-19 pose unique challenges to all personnel working in the OR, where the risk of nosocomial transmission of infection is ever present. It is essential that hospitals consider their local resources, infrastructure and capabilities when devising policies to respond to the COVID-19 emergency. In all perioperative situations, meticulous attention should be given to both donning and doffing of PPE, crucial for the safety of everyone involved in the care of patients with COVID-19.
Our experience also highlighted the importance of treating a new protocol as an evolving document, which can be modified and improved through the conduct of training and simulation exercises with providers across disciplines (Figure 6). In gathering nurses, anesthesia staff, and surgeons to perform drills and simulate their roles in an imaginary scenario, we gained new insights, and made corrections and additions that ultimately generated the presently described process. Modifications to any protocol may be necessary depending on the unique circumstances of individual health care systems and hospitals, the characteristics of the patient population they cater to, and the resources and expertise they have available. As the pandemic continues, we are bound to learn more about the epidemiology and modes of transmission of SARS-CoV-2, which may demand further changes to our practice. It is crucial to remember that while emergency policies must be rapidly developed, they should be collaboratively improved and incorporate new knowledge when it becomes available. This is essential to ensure the ultimate protocol is useful, up-to-date, easy to follow and tailored to the unique local environment of each health care setting.
After the initial apprehensions and struggles that attended our confrontation with the crisis, it is our hope that the experience we share will be helpful to surgical staff at other institutions grappling with the challenges of operative care in the pandemic environment. While this protocol focuses on the current COVID-19 pandemic, these recommendations serve as a template for surgical preparedness that can be readily adapted to the next infectious disease crisis that will inevitably emerge.
1. Holshue ML, DeBolt C, Lindquist S, et al. First Case of 2019 Novel Coronavirus in the United States. N Engl J Med. 2020;382(10):929-936.
2. Siegel S RE, Jackson M, Chiarello L. Healthcare Infection Control Practices Advisory Committee; Guideline for Isolation Precautions. Centers For Disease Control and Prevention. https://www.cdc.gov/infectioncontrol/guidelines/isolation/index.html. Published 2007. Accessed March 28, 2020.
3. American College of Surgeons: COVID-19: Guidance for Triage of Non-Emergent Surgical Procedures. American College of Surgeons. https://www.facs.org/covid-19/clinical-guidance/triage. Published March 17, 2020. Accessed April 19, 2020.
4. American College of Gastroenterology. Gastroenterology professional society Guidance on endoscopic procedures During the covid-19 pandemic. American College of Gastroenterology. https://webfiles.gi.org/links/media/Joint_GI_Society_Guidance_on_Endoscopic_Procedure_During_COVID19_FINAL_impending_3312020.pdf. Published March 31, 2020. Accessed April 19, 2020.
5. Chen X, Liu Y, Gong Y, et al. Perioperative management of patients infected with the novel coronavirus: recommendation from the Joint Task Force of the Chinese Society of Anesthesiology and the Chinese Association of Anesthesiologists [published online ahead of print, 2020 Mar 26]. Anesthesiology. 2020;10.1097/ALN.0000000000003301.
6. Zhang HF, Bo L, Lin Y, et al. Response of Chinese anesthesiologists to the COVID-19 outbreak [published online ahead of print, 2020 Mar 30]. Anesthesiology. 2020;10.1097/ALN.0000000000003300.
7. Kamming D, Gardam M, Chung F. Anaesthesia and SARS. Br J Anaesth. 2003;90(6):715-718.
8. Zucco L LN, Ketchandji D, Aziz M, Ramachandran SK. Perioperative considerations for the 2019 novel coronavirus (COVID-19). https://www.apsf.org/news-updatesperioperative-considerations-for-the-2019-novel-coronavirus-covid-19/. Published Feb 12, 2020. Accessed March 30, 2020.
9. Caputo KM, Byrick R, Chapman MG, Orser BJ, Orser BA. Intubation of SARS patients: infection and perspectives of healthcare workers. Can J Anaesth. 2006;53(2):122-129.
10. Judson SD, Munster VJ. Nosocomial transmission of emerging viruses via aerosol-generating medical procedures. Viruses. 2019;11(10):940.
11. Peng PWH, Ho PL, Hota SS. Outbreak of a new coronavirus: what anaesthetists should know. Br J Anaesth. 2020;124(5):497‐501.
12. Ti LK, Ang LS, Foong TW, Ng BSW. What we do when a COVID-19 patient needs an operation: operating room preparation and guidance [published online ahead of print, 2020 Mar 6]. Can J Anaesth. 2020;1‐3.
13. Chow TT, Kwan A, Lin Z, Bai W. Conversion of operating theatre from positive to negative pressure environment. J Hosp Infect. 2006;64(4):371-378.
14. Clark C, Taenzer A, Charette K, Whitty M. Decreasing contamination of the anesthesia environment. Am J Infect Control. 2014;42(11):1223-1225.
15. Dexter F, Parra MC, Brown JR, Loftus RW. Perioperative COVID-19 defense: an evidence-based approach for optimization of infection control and operating room management [published online ahead of print, 2020 Mar 26]. Anesth Analg. 2020;10.1213/ANE.0000000000004829.
16. Jensen PA, Lambert LA, Iademarco MF, Ridzon R, CDC. Guidelines for preventing the transmission of Mycobacterium tuberculosis in health-care settings, 2005. MMWR Recomm Rep. 2005;54(RR-17):1-141.
17. US Environmental Protection Agency. List N: disinfectants for use against SARS-CoV-2. https://www.epa.gov/pesticide-registration/list-n-disinfectants-use-against-sars-cov-2. Updated April 16, 2020. Accessed April 19, 2020.
18. Munoz-Price LS, Bowdle A, Johnston BL, et al. Infection prevention in the operating room anesthesia work area [published correction appears in Infect Control Hosp Epidemiol. 2019 Apr;40(4):500]. Infect Control Hosp Epidemiol. 2018;1‐17.
Cardiovascular Effects of Tyrosine Kinase Inhibitors in Patients With Advanced Renal Cell Carcinoma at the VA San Diego Healthcare System (FULL)
Patients who have or are at high risk for developing cardiovascular disease and who are taking tyrosine kinase inhibitors for renal cell carcinoma should receive routine cardiovascular event monitoring during the first 4 months of therapy.
Targeted therapies have transformed the treatment of many malignant diseases by inhibiting molecular pathways involved in tumor growth and oncogenesis. Although these therapies can prevent disease progression, toxicities often result. Renal cell carcinoma (RCC) is one of many cancers that responds well to these therapies.
RCC accounts for 2% to 3% of all malignancies in adults worldwide. About 30% of patients with RCC present with metastatic or advanced disease.1 Cytokine therapy was the standard of care until multitargeted tyrosine kinase inhibitors (TKIs) were developed. Over the past 12 years, the US Food and Drug Administration (FDA) has approved 6 TKIs for the treatment of RCC: axitinib, cabozantinib, lenvatinib, pazopanib, sorafenib, and sunitinib. Vascular endothelial growth factor receptor (VEGFR) is one of many tyrosine kinase receptors targeted by these medications. This mechanism prevents angiogenesis and consequently increases the risk for hypertension, bleeding, and clot formation.
Given these risks, many patients were excluded from the initial clinical trials of these medications if they had a history of uncontrolled hypertension, advanced heart failure (HF), or a significant cardiovascular (CV) event within 6 months prior to study enrollment. Many of these studies did not report the incidence of CV events (other than hypertension) that occurred during the early trials.2 The recommended monitoring for TKI therapies is focused mainly on blood pressure. For patients on pazopanib and sunitinib therapy, baseline and periodic electrocardiograms (ECGs) are recommended; echocardiograms are recommended only for patients with a history of cardiac disease.3,4 In patients on sorafenib therapy, ECG is recommended for those at risk for corrected QT (QTc) intervalprolongation.5
According to a meta-analysis of the literature published between 1966 and 2013,many studies reported a CV toxicity risk associated with the TKIs used in RCC treatment.6 However, some studies have found modest, not clinically significant changes in cardiac function in patients with advanced disease. In 2013, Hall and colleagues found 73% of patients they studied experienced some type of CV toxicity, whereas only 33% of patients had CV toxicity when hypertension was excluded.7 Interestingly, Rini and colleagues found that RCC patients receiving sunitinib had better response rates and progression-free survival when they developed hypertension compared with those who did not develop hypertension.8
A review of several studies revealed similar numbers in patients on TKI therapy presenting with symptomatic HF, but Hall and colleagues found that 27% of patients developed asymptomatic left ventricular dysfunction.7,9,10 These results suggest routine monitoring may allow for appropriate preventive interventions. In patients receiving TKI therapy, CV events, including QTc prolongation, left ventricular HF, myocardial infarction (MI), hypertension, pulmonary hypertension, and stroke, were commonly reported by investigators.7,9,10 Currently, there are no studies of the incidence of CV events for the 5 TKIs (axitinib, cabozantinib, pazopanib, sorafenib, sunitinib) in this patient population.
TKI therapy may require cardiac monitoring of all patients, as studies have associated TKIs with CV toxicity in varying degrees. Therefore, the authors set out to determine the incidence of CV events as well as time to first CV event in patients with and without a history of CV disease (CVD) who received a TKI for advanced RCC. More frequent monitoring for CV toxicity may present opportunities for clinical interventions for all patients on TKI therapy—especially for those with HF or other diseases in which the goal of therapy is to prevent disease progression. As TKIs have emerged as the standard treatment option for advanced RCC, many patients will continue therapy until disease progression or intolerable toxicity. Identifying and using appropriate monitoring parameters can lead to preventive interventions that allow patients to benefit from TKI therapy longer. At the US Department of Veterans Affairs (VA) San Diego Healthcare System (VASDHS), patients undergo routine cardiac monitoring at the discretion of the provider.
In this retrospective study, the authors wanted to determine the incidence of CV events in patients with and without a history of CVD who were receiving TKIs for advanced RCC. The authors also wanted to evaluate time to CV event from start of therapy in order to determine how often monitoring may be needed. The outcomes of this study may lead to a change in practice and development of monitoring parameters to ensure appropriate and adequate management of TKI therapy in RCC.
Methods
Each year, the VASDHS oncology team diagnose 5 to 10 patients with RCC who begin TKI therapy. When sorafenib was approved by the FDA in 2005, VASDHS estimated that about 100 of its patients had an RCC diagnosis and would be treated with a TKI between December 2005 and July 2017.
The authors identified VASDHS patients with a diagnosis of advanced RCC who received axitinib, cabozantinib, pazopanib, sorafenib, or sunitinib between December 1, 2005 and July 31, 2017. Patients were included if they had been on therapy for at least 30 days. The VASDHS pharmacy informatics team assisted in extracting a list of patients with an ICD-9 or ICD-10 diagnosis of RCC and using prescription fills for any of the 5 TKIs previously noted. Medical records were reviewed for frequency of prescription fills, age, sex, Eastern Cooperative Oncology Group (ECOG) performance status, TKI treatment duration, previous history of CVD, ethnicity, and smoking status. If documented, the incidence of CV events was reviewed for each patient at 0, 1, 3, 6, and 12 months. Patients who received medications (Appendix) for their CVD were assessed for adherence based on history of prescription refills from their medical records. Adherence was evaluated for the duration that patients were concurrently taking an oral TKI. The institutional review board at VASDHS approved the study design.
All patients included in this study started TKI therapy since the December 2005 FDA approval of sorafenib, the first oral TKI for treatment of RCC. Each new start was recorded as a separate event, regardless of previous oral TKI therapy. Albiges and colleagues found that the approximate median time from starting TKI therapy to complete response was 12.6 months, and the median duration of TKI therapy after complete response was 10.3 months.11 Based on these results, the follow-up period for patients in this study was 2 years after the start of each TKI therapy. For data analysis, patients were stratified by CVD history (yes or no). In addition, composite outcomes were evaluated to identify a potential cumulative increased risk for CV events for patients who had been on multiple TKI therapies.
For this study, CV toxicities were characterized using Common Terminology Criteria for Adverse Events (CTCAE) version 4.03; severity of adverse events (AEs) was graded 1 to 5. CTCAE commonly has been used to assess AEs in oncology clinical trials. The CV AEs selected for this study included QTc prolongation, hypertension, left ventricular dysfunction, stroke, myocardial infarction (MI), and pulmonary arterial hypertension.
Primary outcomes included incidence of CV events and time to first CV event after initiation of TKI therapy. Secondary outcomes included changes in ECG or echocardiogram results at 0, 1, 3, 6, and 12 months. Secondary outcomes at scheduled time points were not readily available for every patient, but any available time points were gathered to aid in identifying an optimal period for cardiac monitoring. In addition, patients with a history of CVD were evaluated for adherence to common first-line therapies for each disease.
A Fischer exact test was used to compare the incidence of CV events in patients with and without a history of CVD (significance level, α = 0.05). A subgroup analysis was used to compare the incidence of CV events in patients who experienced a CV event (significance level, α = 0.05). A Kaplan-Meier survival curve was used to determine time to first CV event. A log-rank test with significance level set at α = 0.05 also was used.
Results
An initial database search identified 134 patients who received TKI therapy at VASDHS between December 1, 2005 and July 31, 2017. According to retrospective chart review, 54 patients met the inclusion criteria for the study (Table 1). 
Patients without a history of CVD (17%) did not experience any CV events while on TKI therapy. Of the patients with a history of CVD, 9 (20%) experienced ≥ 1 CV event. Fifty-five percent of the events experienced were hypertension. One patient experienced QTc prolongation, and 2 patients experienced MI. As already noted, each new start of TKI was recorded as a separate event, regardless of previous TKI therapy. Among patients with a history of CVD, 2 experienced 2 CV events. Overall, 11 CV events occurred among patients who received ≥ 1 TKI, corresponding to an overall incidence of 24% (Table 2). 


Of the 13 patients who were exposed to ≥ 2 TKI therapies, 2 experienced a CV event. Both patients were started on sunitinib and were switched to sorafenib. One of these used sunitinib for 7 months, experienced a partial response and was switched to sorafenib (with a 3-month break between therapies). The second patient was on sunitinib for 24 months, with multiple doses held because of low blood counts and diarrhea. While on sunitinib, this patient experienced a HF exacerbation, determined to be caused by the underlying disease. This event occurred 17 months after sunitinib was started, and therapy was continued for another 7 months. The patient was switched to sorafenib because of poor tolerability and disease progression. While on sorafenib, this patient experienced grade 1 QTc prolongation.
Discussion
Of the available oral TKI therapies for RCC, sunitinib and sorafenib have the most data associated with nonhypertensive CV toxicity.2,7-10,12 Instudies, the percentage of patients who experienced CV toxicity while on sunitinib or sorafenib has ranged widely, from 2.7% to 33.8%; the variance may be attributable to differences in how institutions report CV toxicities.7-9
According to the prescribing information for TKIs, hypertension is frequently reported as an AE for all 5 TKIs, and BP monitoring is recommended.3,4 However, the development of hypertension with these TKIs has been associated with response to therapy.7 With pazopanib, sorafenib, and sunitinib, there is a higher incidence of other AEs: edema, HF, MI, and QTc prolongation. Baseline ECG is recommended for all patients started on pazopanib and sunitinib and for patients with a history of CVD who are started on sorafenib. An ECG is recommended for patients with a history of CVD who are started on pazopanib and sunitinib.
Even with the medication prescribing information recommendations, it is unclear how frequently patients should be monitored. At VASDHS, CV monitoring for any patient started on a TKI remains at the discretion of the oncologist. There are concerns that ordering cardiac monitoring tests, which might be unnecessary, will change or guide therapy. In this study, data evaluation revealed 1 patient who experienced a CV event had a CVD history that was not documented in the patient’s medical history. It is important that providers obtain a detailed clinical assessment of patients CV history during each visit to determine whether CV monitoring should be considered. Patients also may benefit from additional counseling to emphasize the importance of adherence to CV medication therapy to reduce the incidence of these events.
Data from this study indicate that routine CV monitoring should be considered in patients with CVD, in keeping with current medication prescribing information recommendations. Of the patients who had a CV event, 54% experienced hypertension, 18% MI, and 28% stroke, QTc prolongation, or congestive HF. 
Limitations
This retrospective study had several limitations. Many patients did not have a baseline cardiac monitoring test or any monitoring during therapy. Often, a cardiac test was performed only when the patient was symptomatic or experiencing a CV event. In addition, because of intolerance or nonadherence to therapy, many patients discontinued treatment early, before completing 30 days. That axitinib and cabozantinib are newer therapies and not first-line at VASDHS during the data collection period accounts for the small number of patients on these therapies. Therapy was shorter for patients started on pazopanib, axitinib, and cabozantinib than it was for patients on sunitinib and sorafenib. Duration of therapy may affect treatment-related events, but the majority of patients in this study experienced an event within 4 months of therapy. About half of the patients who experienced an event were nonadherent to their CV medication regimen. Another potential limitation is that this study was conducted at VASDHS, where most patients are male (RCC incidence is 2:1 male:female).
Conclusion
In this study, CV events occurred in 24% of patients with a history of CVD; 11% of these events were nonhypertensive. Baseline cardiac monitoring was not performed for most patients started on TKI therapy, but tests were performed once patients became symptomatic. The study results suggest that high-risk patients should undergo routine cardiac monitoring during the first 4 months of TKI therapy, in keeping with medication package insert monitoring recommendations. Cardiac monitoring of high-risk patients will allow for earlier identification of cardiac decline and offer opportunities for interventions, such as pharmacist-driven protocols to start CV medications. Implementation of this study’s recommendations should be evaluated to determine whether outcomes improve with routine cardiac monitoring in these high-risk patients.

Author disclosures
The authors report no actual or potential conflicts of interest with regard to this article.
Disclaimer
The opinions expressed herein are those of the authors and do not necessarily reflect those of Federal Practitioner, FrontlineMedical Communications Inc., the US Government, or any of its agencies. This article may discuss unlabeled or investigational use of certain drugs. Please review the complete prescribing information for specific drugs or drug combinations—including indications, contraindications, warnings, and adverse effects— before administering pharmacologic therapy to patients.
1. Rini, BI, Escudier B, Tomczak P, et al. Comparative effectiveness of axitinib versus sorafenib in advanced renal cell carcinoma (AXIS): a randomised phase 3 trial. Lancet. 2011;378(9807):1931-1939.
2. Tolcher AW, Appleman LJ, Shapiro GI, et al. A phase I open-label study evaluating the cardiovascular safety of sorafenib in patients with advanced cancer. Cancer Chemother Pharmacol. 2011;67(4):751-764.
3. Votrient [package insert]. Research Triangle Park, NC: GlaxoSmithKline; 2017.
4. Sutent [package insert]. New York, NY: Pfizer Labs; 2018.
5. Nexavar [package insert]. Wayne, NJ; Bayer HealthCare Pharmaceuticals Inc; 2018.
6. Ghatalia P, Morgan CJ, Je Y, et al. Congestive heart failure with vascular endothelial growth factor receptor tyrosine kinase inhibitors. Crit Rev Oncol Hematol 2015;94:228–237.
7. Hall PS, Harshman LC, Srinivas S, Witteles RM. The frequency and severity of cardiovascular toxicity from targeted therapy in advanced renal cell carcinoma patients. JACC Heart Fail. 2013;1(1):72-78.
8. Rini BI, Cohen DP, Lu DR, et al. Hypertension as a biomarker of efficacy in patients with metastatic renal cell carcinoma treated with sunitinib. J Natl Cancer Inst. 2011;103(9):763-773.
9. Richards CJ, Je Y, Schutz FA, et al. Incidence and risk of congestive heart failure in patients with renal and nonrenal cell carcinoma treated with sunitinib. J Clin Oncol. 2011;29(25):3450-3456.
10. Schmidinger M, Zielinski CC, Vogl UM, et al. Cardiac toxicity of sunitinib and sorafenib in patients with metastatic renal cell carcinoma. J Clin Oncol. 2008;26(32):5204-5212.
11. Albiges L, Oudard S, Negrier S, et al. Complete remission with tyrosine kinase inhibitors in renal cell carcinoma. J Clin Oncol. 2012;30(5):482-487.
12. Jang S, Zheng C, Tsai HT, et al. Cardiovascular toxicity after antiangiogenic therapy in persons older than 65 years with advanced renal cell carcinoma. Cancer. 2016;122(1):124-130
13. James PA, Oparil S, Carter BL, et al. 2014 evidence-based guideline for the management of high blood pressure in adults: report from the panel members appointed to the eighth Joint National Committee (JNC 8). JAMA. 2014;311(5):507-520.
14. Yancy CW, Jessup M, Bozkurt B, et al. ACC/AHA/HFSA Focused Update of the 2013 ACCF/AHA Guideline for the Management of Heart Failure: A Report of the American College of Cardiology/American Heart Association Task Force on Clinical Practice Guidelines and the Heart Failure Society of America. JACC. 2017;70(6):776-803.
15. Kernan WN, Ovbiagele B, Black HR, et al; American Heart Association Stroke Council, Council on Cardiovascular and Stroke Nursing, Council on Clinical Cardiology, and Council on Peripheral Vascular Disease. Guidelines for the prevention of stroke in patients with stroke and transient ischemic attack: a guideline for healthcare professionals from the American Heart Association/American Stroke Association. Stroke. 2014;45(7):2160-2236.
16. O’Gara PT, Kushner FG, Ascheim DD, et al; American College of Cardiology Foundation/American Heart Association Task Force on Practice Guidelines. 2013 ACCF/AHA guideline for the management of ST-elevation myocardial infarction: a report of the American College of Cardiology Foundation/American Heart Association Task Force on Practice Guidelines. JACC. 2013;61(4):e78-e140.
17. Amsterdam EA, Wenger NK, Brindis RG, et al. 2014 AHA/ACC guideline for the management of patients with non–ST-elevation acute coronary syndromes: a report of the American College of Cardiology/American Heart Association Task Force on Practice Guidelines. J Am Coll Cardiol. 2014;64(24):e139-e228.
18. Galiè N, Humbert M, Vachiery JL, et al; ESC Scientific Document Group. 2015 ESC/ERS guidelines for the diagnosis and treatment of pulmonary hypertension: the Joint Task Force for the Diagnosis and Treatment of Pulmonary Hypertension of the European Society of Cardiology (ESC) and the European Respiratory Society (ERS): endorsed by: Association for European Paediatric and Congenital Cardiology (AEPC), International Society for Heart and Lung Transplantation (ISHLT). Eur Heart J. 2016;37(1):67-119.
Patients who have or are at high risk for developing cardiovascular disease and who are taking tyrosine kinase inhibitors for renal cell carcinoma should receive routine cardiovascular event monitoring during the first 4 months of therapy.
Patients who have or are at high risk for developing cardiovascular disease and who are taking tyrosine kinase inhibitors for renal cell carcinoma should receive routine cardiovascular event monitoring during the first 4 months of therapy.
Targeted therapies have transformed the treatment of many malignant diseases by inhibiting molecular pathways involved in tumor growth and oncogenesis. Although these therapies can prevent disease progression, toxicities often result. Renal cell carcinoma (RCC) is one of many cancers that responds well to these therapies.
RCC accounts for 2% to 3% of all malignancies in adults worldwide. About 30% of patients with RCC present with metastatic or advanced disease.1 Cytokine therapy was the standard of care until multitargeted tyrosine kinase inhibitors (TKIs) were developed. Over the past 12 years, the US Food and Drug Administration (FDA) has approved 6 TKIs for the treatment of RCC: axitinib, cabozantinib, lenvatinib, pazopanib, sorafenib, and sunitinib. Vascular endothelial growth factor receptor (VEGFR) is one of many tyrosine kinase receptors targeted by these medications. This mechanism prevents angiogenesis and consequently increases the risk for hypertension, bleeding, and clot formation.
Given these risks, many patients were excluded from the initial clinical trials of these medications if they had a history of uncontrolled hypertension, advanced heart failure (HF), or a significant cardiovascular (CV) event within 6 months prior to study enrollment. Many of these studies did not report the incidence of CV events (other than hypertension) that occurred during the early trials.2 The recommended monitoring for TKI therapies is focused mainly on blood pressure. For patients on pazopanib and sunitinib therapy, baseline and periodic electrocardiograms (ECGs) are recommended; echocardiograms are recommended only for patients with a history of cardiac disease.3,4 In patients on sorafenib therapy, ECG is recommended for those at risk for corrected QT (QTc) intervalprolongation.5
According to a meta-analysis of the literature published between 1966 and 2013,many studies reported a CV toxicity risk associated with the TKIs used in RCC treatment.6 However, some studies have found modest, not clinically significant changes in cardiac function in patients with advanced disease. In 2013, Hall and colleagues found 73% of patients they studied experienced some type of CV toxicity, whereas only 33% of patients had CV toxicity when hypertension was excluded.7 Interestingly, Rini and colleagues found that RCC patients receiving sunitinib had better response rates and progression-free survival when they developed hypertension compared with those who did not develop hypertension.8
A review of several studies revealed similar numbers in patients on TKI therapy presenting with symptomatic HF, but Hall and colleagues found that 27% of patients developed asymptomatic left ventricular dysfunction.7,9,10 These results suggest routine monitoring may allow for appropriate preventive interventions. In patients receiving TKI therapy, CV events, including QTc prolongation, left ventricular HF, myocardial infarction (MI), hypertension, pulmonary hypertension, and stroke, were commonly reported by investigators.7,9,10 Currently, there are no studies of the incidence of CV events for the 5 TKIs (axitinib, cabozantinib, pazopanib, sorafenib, sunitinib) in this patient population.
TKI therapy may require cardiac monitoring of all patients, as studies have associated TKIs with CV toxicity in varying degrees. Therefore, the authors set out to determine the incidence of CV events as well as time to first CV event in patients with and without a history of CV disease (CVD) who received a TKI for advanced RCC. More frequent monitoring for CV toxicity may present opportunities for clinical interventions for all patients on TKI therapy—especially for those with HF or other diseases in which the goal of therapy is to prevent disease progression. As TKIs have emerged as the standard treatment option for advanced RCC, many patients will continue therapy until disease progression or intolerable toxicity. Identifying and using appropriate monitoring parameters can lead to preventive interventions that allow patients to benefit from TKI therapy longer. At the US Department of Veterans Affairs (VA) San Diego Healthcare System (VASDHS), patients undergo routine cardiac monitoring at the discretion of the provider.
In this retrospective study, the authors wanted to determine the incidence of CV events in patients with and without a history of CVD who were receiving TKIs for advanced RCC. The authors also wanted to evaluate time to CV event from start of therapy in order to determine how often monitoring may be needed. The outcomes of this study may lead to a change in practice and development of monitoring parameters to ensure appropriate and adequate management of TKI therapy in RCC.
Methods
Each year, the VASDHS oncology team diagnose 5 to 10 patients with RCC who begin TKI therapy. When sorafenib was approved by the FDA in 2005, VASDHS estimated that about 100 of its patients had an RCC diagnosis and would be treated with a TKI between December 2005 and July 2017.
The authors identified VASDHS patients with a diagnosis of advanced RCC who received axitinib, cabozantinib, pazopanib, sorafenib, or sunitinib between December 1, 2005 and July 31, 2017. Patients were included if they had been on therapy for at least 30 days. The VASDHS pharmacy informatics team assisted in extracting a list of patients with an ICD-9 or ICD-10 diagnosis of RCC and using prescription fills for any of the 5 TKIs previously noted. Medical records were reviewed for frequency of prescription fills, age, sex, Eastern Cooperative Oncology Group (ECOG) performance status, TKI treatment duration, previous history of CVD, ethnicity, and smoking status. If documented, the incidence of CV events was reviewed for each patient at 0, 1, 3, 6, and 12 months. Patients who received medications (Appendix) for their CVD were assessed for adherence based on history of prescription refills from their medical records. Adherence was evaluated for the duration that patients were concurrently taking an oral TKI. The institutional review board at VASDHS approved the study design.
All patients included in this study started TKI therapy since the December 2005 FDA approval of sorafenib, the first oral TKI for treatment of RCC. Each new start was recorded as a separate event, regardless of previous oral TKI therapy. Albiges and colleagues found that the approximate median time from starting TKI therapy to complete response was 12.6 months, and the median duration of TKI therapy after complete response was 10.3 months.11 Based on these results, the follow-up period for patients in this study was 2 years after the start of each TKI therapy. For data analysis, patients were stratified by CVD history (yes or no). In addition, composite outcomes were evaluated to identify a potential cumulative increased risk for CV events for patients who had been on multiple TKI therapies.
For this study, CV toxicities were characterized using Common Terminology Criteria for Adverse Events (CTCAE) version 4.03; severity of adverse events (AEs) was graded 1 to 5. CTCAE commonly has been used to assess AEs in oncology clinical trials. The CV AEs selected for this study included QTc prolongation, hypertension, left ventricular dysfunction, stroke, myocardial infarction (MI), and pulmonary arterial hypertension.
Primary outcomes included incidence of CV events and time to first CV event after initiation of TKI therapy. Secondary outcomes included changes in ECG or echocardiogram results at 0, 1, 3, 6, and 12 months. Secondary outcomes at scheduled time points were not readily available for every patient, but any available time points were gathered to aid in identifying an optimal period for cardiac monitoring. In addition, patients with a history of CVD were evaluated for adherence to common first-line therapies for each disease.
A Fischer exact test was used to compare the incidence of CV events in patients with and without a history of CVD (significance level, α = 0.05). A subgroup analysis was used to compare the incidence of CV events in patients who experienced a CV event (significance level, α = 0.05). A Kaplan-Meier survival curve was used to determine time to first CV event. A log-rank test with significance level set at α = 0.05 also was used.
Results
An initial database search identified 134 patients who received TKI therapy at VASDHS between December 1, 2005 and July 31, 2017. According to retrospective chart review, 54 patients met the inclusion criteria for the study (Table 1).
Patients without a history of CVD (17%) did not experience any CV events while on TKI therapy. Of the patients with a history of CVD, 9 (20%) experienced ≥ 1 CV event. Fifty-five percent of the events experienced were hypertension. One patient experienced QTc prolongation, and 2 patients experienced MI. As already noted, each new start of TKI was recorded as a separate event, regardless of previous TKI therapy. Among patients with a history of CVD, 2 experienced 2 CV events. Overall, 11 CV events occurred among patients who received ≥ 1 TKI, corresponding to an overall incidence of 24% (Table 2).
Of the 13 patients who were exposed to ≥ 2 TKI therapies, 2 experienced a CV event. Both patients were started on sunitinib and were switched to sorafenib. One of these used sunitinib for 7 months, experienced a partial response and was switched to sorafenib (with a 3-month break between therapies). The second patient was on sunitinib for 24 months, with multiple doses held because of low blood counts and diarrhea. While on sunitinib, this patient experienced a HF exacerbation, determined to be caused by the underlying disease. This event occurred 17 months after sunitinib was started, and therapy was continued for another 7 months. The patient was switched to sorafenib because of poor tolerability and disease progression. While on sorafenib, this patient experienced grade 1 QTc prolongation.
Discussion
Of the available oral TKI therapies for RCC, sunitinib and sorafenib have the most data associated with nonhypertensive CV toxicity.2,7-10,12 Instudies, the percentage of patients who experienced CV toxicity while on sunitinib or sorafenib has ranged widely, from 2.7% to 33.8%; the variance may be attributable to differences in how institutions report CV toxicities.7-9
According to the prescribing information for TKIs, hypertension is frequently reported as an AE for all 5 TKIs, and BP monitoring is recommended.3,4 However, the development of hypertension with these TKIs has been associated with response to therapy.7 With pazopanib, sorafenib, and sunitinib, there is a higher incidence of other AEs: edema, HF, MI, and QTc prolongation. Baseline ECG is recommended for all patients started on pazopanib and sunitinib and for patients with a history of CVD who are started on sorafenib. An ECG is recommended for patients with a history of CVD who are started on pazopanib and sunitinib.
Even with the medication prescribing information recommendations, it is unclear how frequently patients should be monitored. At VASDHS, CV monitoring for any patient started on a TKI remains at the discretion of the oncologist. There are concerns that ordering cardiac monitoring tests, which might be unnecessary, will change or guide therapy. In this study, data evaluation revealed 1 patient who experienced a CV event had a CVD history that was not documented in the patient’s medical history. It is important that providers obtain a detailed clinical assessment of patients CV history during each visit to determine whether CV monitoring should be considered. Patients also may benefit from additional counseling to emphasize the importance of adherence to CV medication therapy to reduce the incidence of these events.
Data from this study indicate that routine CV monitoring should be considered in patients with CVD, in keeping with current medication prescribing information recommendations. Of the patients who had a CV event, 54% experienced hypertension, 18% MI, and 28% stroke, QTc prolongation, or congestive HF.
Limitations
This retrospective study had several limitations. Many patients did not have a baseline cardiac monitoring test or any monitoring during therapy. Often, a cardiac test was performed only when the patient was symptomatic or experiencing a CV event. In addition, because of intolerance or nonadherence to therapy, many patients discontinued treatment early, before completing 30 days. That axitinib and cabozantinib are newer therapies and not first-line at VASDHS during the data collection period accounts for the small number of patients on these therapies. Therapy was shorter for patients started on pazopanib, axitinib, and cabozantinib than it was for patients on sunitinib and sorafenib. Duration of therapy may affect treatment-related events, but the majority of patients in this study experienced an event within 4 months of therapy. About half of the patients who experienced an event were nonadherent to their CV medication regimen. Another potential limitation is that this study was conducted at VASDHS, where most patients are male (RCC incidence is 2:1 male:female).
Conclusion
In this study, CV events occurred in 24% of patients with a history of CVD; 11% of these events were nonhypertensive. Baseline cardiac monitoring was not performed for most patients started on TKI therapy, but tests were performed once patients became symptomatic. The study results suggest that high-risk patients should undergo routine cardiac monitoring during the first 4 months of TKI therapy, in keeping with medication package insert monitoring recommendations. Cardiac monitoring of high-risk patients will allow for earlier identification of cardiac decline and offer opportunities for interventions, such as pharmacist-driven protocols to start CV medications. Implementation of this study’s recommendations should be evaluated to determine whether outcomes improve with routine cardiac monitoring in these high-risk patients.
Author disclosures
The authors report no actual or potential conflicts of interest with regard to this article.
Disclaimer
The opinions expressed herein are those of the authors and do not necessarily reflect those of Federal Practitioner, FrontlineMedical Communications Inc., the US Government, or any of its agencies. This article may discuss unlabeled or investigational use of certain drugs. Please review the complete prescribing information for specific drugs or drug combinations—including indications, contraindications, warnings, and adverse effects— before administering pharmacologic therapy to patients.
1. Rini, BI, Escudier B, Tomczak P, et al. Comparative effectiveness of axitinib versus sorafenib in advanced renal cell carcinoma (AXIS): a randomised phase 3 trial. Lancet. 2011;378(9807):1931-1939.
2. Tolcher AW, Appleman LJ, Shapiro GI, et al. A phase I open-label study evaluating the cardiovascular safety of sorafenib in patients with advanced cancer. Cancer Chemother Pharmacol. 2011;67(4):751-764.
3. Votrient [package insert]. Research Triangle Park, NC: GlaxoSmithKline; 2017.
4. Sutent [package insert]. New York, NY: Pfizer Labs; 2018.
5. Nexavar [package insert]. Wayne, NJ; Bayer HealthCare Pharmaceuticals Inc; 2018.
6. Ghatalia P, Morgan CJ, Je Y, et al. Congestive heart failure with vascular endothelial growth factor receptor tyrosine kinase inhibitors. Crit Rev Oncol Hematol 2015;94:228–237.
7. Hall PS, Harshman LC, Srinivas S, Witteles RM. The frequency and severity of cardiovascular toxicity from targeted therapy in advanced renal cell carcinoma patients. JACC Heart Fail. 2013;1(1):72-78.
8. Rini BI, Cohen DP, Lu DR, et al. Hypertension as a biomarker of efficacy in patients with metastatic renal cell carcinoma treated with sunitinib. J Natl Cancer Inst. 2011;103(9):763-773.
9. Richards CJ, Je Y, Schutz FA, et al. Incidence and risk of congestive heart failure in patients with renal and nonrenal cell carcinoma treated with sunitinib. J Clin Oncol. 2011;29(25):3450-3456.
10. Schmidinger M, Zielinski CC, Vogl UM, et al. Cardiac toxicity of sunitinib and sorafenib in patients with metastatic renal cell carcinoma. J Clin Oncol. 2008;26(32):5204-5212.
11. Albiges L, Oudard S, Negrier S, et al. Complete remission with tyrosine kinase inhibitors in renal cell carcinoma. J Clin Oncol. 2012;30(5):482-487.
12. Jang S, Zheng C, Tsai HT, et al. Cardiovascular toxicity after antiangiogenic therapy in persons older than 65 years with advanced renal cell carcinoma. Cancer. 2016;122(1):124-130
13. James PA, Oparil S, Carter BL, et al. 2014 evidence-based guideline for the management of high blood pressure in adults: report from the panel members appointed to the eighth Joint National Committee (JNC 8). JAMA. 2014;311(5):507-520.
14. Yancy CW, Jessup M, Bozkurt B, et al. ACC/AHA/HFSA Focused Update of the 2013 ACCF/AHA Guideline for the Management of Heart Failure: A Report of the American College of Cardiology/American Heart Association Task Force on Clinical Practice Guidelines and the Heart Failure Society of America. JACC. 2017;70(6):776-803.
15. Kernan WN, Ovbiagele B, Black HR, et al; American Heart Association Stroke Council, Council on Cardiovascular and Stroke Nursing, Council on Clinical Cardiology, and Council on Peripheral Vascular Disease. Guidelines for the prevention of stroke in patients with stroke and transient ischemic attack: a guideline for healthcare professionals from the American Heart Association/American Stroke Association. Stroke. 2014;45(7):2160-2236.
16. O’Gara PT, Kushner FG, Ascheim DD, et al; American College of Cardiology Foundation/American Heart Association Task Force on Practice Guidelines. 2013 ACCF/AHA guideline for the management of ST-elevation myocardial infarction: a report of the American College of Cardiology Foundation/American Heart Association Task Force on Practice Guidelines. JACC. 2013;61(4):e78-e140.
17. Amsterdam EA, Wenger NK, Brindis RG, et al. 2014 AHA/ACC guideline for the management of patients with non–ST-elevation acute coronary syndromes: a report of the American College of Cardiology/American Heart Association Task Force on Practice Guidelines. J Am Coll Cardiol. 2014;64(24):e139-e228.
18. Galiè N, Humbert M, Vachiery JL, et al; ESC Scientific Document Group. 2015 ESC/ERS guidelines for the diagnosis and treatment of pulmonary hypertension: the Joint Task Force for the Diagnosis and Treatment of Pulmonary Hypertension of the European Society of Cardiology (ESC) and the European Respiratory Society (ERS): endorsed by: Association for European Paediatric and Congenital Cardiology (AEPC), International Society for Heart and Lung Transplantation (ISHLT). Eur Heart J. 2016;37(1):67-119.
Sharing Cancer Care Information Across VA Health Care Systems (FULL)
A telementoring program based on the Specialty Care Access Network Extension for Community Healthcare Outcomes model shared information about cancer care across VA health Care systems.
In 2016, the Cancer Care Coordinator at the US Department of Veterans Affairs (VA) Connecticut Healthcare System (VACT) in West Haven partnered with the VA New England Healthcare System to use its telementoring program. The VA Specialty Care Access Network Extension for Community Healthcare Outcomes (VA ECHO) was used to present a series of educational conferences on cancer care. This article describes our experience implementing the program and reviews participant feedback gathered from voluntary surveys.
Background
In 2011, the Veterans Health Administration (VHA) Office of Healthcare Transformation launched VA ECHO, a telementoring program for primary care providers (PCPs) and patient-aligned care team staff. VACT was selected as 1 of 7 hub sites across the US. The VA ECHO system uses video and online technology to provide PCPs with case-based specialist consultation and didactic education. The system enables providers at any VA location to participate in online and telephone conferences in real time. The presentations are recorded and made available online to VA providers through a secure site.
VA ECHO is based on the highly successful Project ECHO model established by Sanjeev Arora and the University of New Mexico in 2007.1 The rationale for Project ECHO was that patient care could be improved by increasing the competence of PCPs in the management of complex diseases by providing access to disease specialists through a case-based learning approach that used technology, which it termed knowledge networks, to connect the PCPs to specialists.
The original model addressed management of hepatitis C in a medically underserved area where half of the population was widely geographically dispersed, making the provision of specialty care challenging. Developers identified 6 characteristics that make a disease appropriate for treatment using the Project ECHO knowledge network model:
- The disease is common;
- Management of the disease is complex;
- Treatment for the disease is evolving;
- The disease has a high societal impact;
- There are serious outcomes if the disease is not treated; and
- Disease management improves outcomes.1
VA ECHO conferences are available to all VA personnel. Staff can subscribe to an e-mail group list to be alerted to conference times and topics. Participants can connect directly to the conference using Microsoft Outlook Lync or Skype (Redmond, WA) and see the slides in real time on their computer as they listen to the presentation. The presentations are recorded, and the slides with audio can be accessed easily on the VA ECHO SharePoint site for download, enabling VA staff to listen to conferences at their convenience (Figure). 
VA Cancer ECHO
The impetus to create a series of talks related to cancer care using VA ECHO was the frequent and often time-consuming requests we received from colleagues at other VA sites for information about areas of cancer care, such as survivorship and cancer care coordination. It was felt that presenting cancer care information as a VA ECHO series would make this information available to a large group of providers at one time, making the method more time effective than sharing the information via one-on-one conversations.
The cancer care coordinator originally conceived this as a 3-part, 1-time series to present work done at VACT in the areas of survivorship, psychosocial distress monitoring, and coordination of cancer care using the VA Cancer Care Tracking System, an online tracking tool. Information about the series was disseminated via VA group e-mail lists for oncology providers and via the existing VA ECHO subscriber invitation process. The 3-presentation series garnered positive feedback and had attendance that ranged from 49 to 75 participants (mean, 60). Participants expressed enthusiasm for the format via e-mail and phone feedback directly to the West Haven staff.
Expansion
The success of this original 3-part series led to a trial of an ongoing Cancer Care Conference series (Conference) using VA ECHO. This was a novel use of VA ECHO and was outside its traditional format, which is geared to discussion of individual cases and clinical knowledge. Nevertheless, this new style of communication has been embraced by a wide range of VA cancer care professionals.
One reason we considered expanding the program was that oncology fit the framework of the original Project ECHO knowledge network model. Cancer is common at the VA, which cares for 175,000 patients with cancer annually.2 The management of cancer is complex involving many disciplines working together, and treatments are constantly changing. In addition, cancer has a high societal impact; there are serious outcomes both in terms of patient survival and patient symptom burden. And lastly, outcomes are improved with proactive disease management that is informed by the most current, evidence-based medicine.
The Conference was conceived as a forum for providers across disciplines to share best practices and discuss common challenges in caring for veterans with cancer. We invited participants to submit proposals for presentations related to cancer care initiatives at their VA sites. Potential speakers across all areas of care for veterans with cancer were invited to submit possible topics for the conference. The submissions were reviewed by the moderators in an effort to create a series of talks on a variety of topics across all aspects of care for oncology patients in the VA. This process of effectively crowd-sourcing educational content inspires providers to think more creatively about their practice and quality improvement projects and has sparked an ongoing dialogue about quality initiatives among VA oncology providers across disciplines and geographic locations. As a result, this approach also has enabled participants to learn from colleagues who work at a wide range of rural and urban VA locations throughout the country and to network with colleagues who are working on similar quality initiatives and challenges related to caring for veterans with cancer.
Program
The first Conference talk was in October 2016. It encompassed ten 1-hour talks during the 2016 to 2017 academic year. Speakers were recruited from the VACT West Haven campus and from several other VA sites nationwide. Topics included survivorship, psychosocial distress, palliative care, cancer navigation, and establishing a clinical trials program.
In its first year, the Conference series had 260 unique attendees representing such disciplines as medicine, nursing, social work, pharmacy, psychology, and clinic administration and representing all 21 Veterans Integrated Services Networks (VISNs). Speakers including oncologists, hepatologists, cancer care coordinators, health psychologists, and a research coordinator gave presentations on psychosocial distress screening and issues, cognitive behavioral therapy for cancer pain, cancer navigation, cancer case tracking, VISN-based liver cancer tumor tracker and liver tumor board, starting a VA-based clinical trial, palliative care, and survivorship.
The Conference accounted for 508 continuing medical education (CME) hours, which accounted for one-third of the total CME hours generated by the VACT West Haven VA ECHO program. Highlights of the talks were presented at the 2017 Association of VA Hematology/Oncology annual meeting in Denver, Colorado.
During the second year of the Conference, speakers were recruited to address new American College of Surgeons Commission on Cancer (CoC) requirements regarding survivorship treatment summaries for a subset of cancer survivors.3 The focus on survivorship was driven by ongoing feedback from participants who were working on initiatives to implement this process at their VA sites and wanted to learn from peers involved in this process throughout the VA system. Several speakers gave talks on implementing survivorship care at their VA and specifically on the use of computerized patient record system templates to create survivorship treatment summaries for veterans in accordance with CoC standards.
Since the first Conference in 2016, the number of unique attendees grew by 20% to 327 in 2018. During its first 2 years, participants have earned a total of 1,095 CME credits through Yale University CME. Conferences are usually broadcast at noon eastern time so that providers can take advantage of sessions during lunch breaks.
Participant Surveys
Attendees were invited to participate in voluntary, anonymous surveys to obtain feedback on and to receive input on topics of interest for future talks. Participants also were asked to comment on resources that they utilized to be updated on practice changes (Table 1). 
The Conference has led to increased awareness of other continuing education opportunities available through VA ECHO-Connecticut. Of survey participants, 20% reported that they had attended other VA ECHO conferences.
The survey samples are self-selecting and may not necessarily be representative of the Conference participants or of the VA oncology interdisciplinary team as a whole; however, the relatively large number of survey participants provides some confidence that these survey results can help inform future planning for this and other continuing education opportunities for VA oncology providers.
An additional online survey was designed to elucidate whether participants were incorporating knowledge gained from the Conference in their cancer care practice. Half of the 32 participants strongly agreed with the following statement: “Participation in the VA Cancer Care Conference has added to my knowledge of information relevant to my practice,” and 13 more agreed with the statement for a total of 90.6% of those surveyed responding affirmatively. Only 3 participants neither agreed nor disagreed, and none disagreed with the statement. More than half of the participants reported that they made changes to their practice or plan to make changes as a result of the Conference.
Conculsion
The VA ECHO program established at the VACT West Haven campus in 2012 now offers regular monthly or bimonthly conferences in 9 specialties: pain, liver/hepatitis C, neurology, nephrology, cardiology, diabetes/endocrinology, mental health and addiction, nursing grand rounds, and cancer care. The VACT ECHO program is led by a medical director, and each specialty has a clinical director who conducts sessions and recruits other specialists from their department.
Teleconferencing can provide opportunities for colleagues living in distant locations to connect; share best practices, common goals, and challenges; and initiate ongoing and lasting relationships. The Conference draws the most diverse audience by discipline of all the VA ECHO conferences hosted at VACT (Table 2). 
Traditionally, the national VA ECHO program has been a forum for specialists to discuss clinical case presentations for the benefit of primary care providers and to deliver didactics about chronic clinical conditions. Our Cancer Care Management VA ECHO has explored new ground by discussing material that has helped sites set up and enhance cancer care clinics and disseminate best practices for cancer survivorship and other aspects of cancer care. As a result, this conference has attracted and provided a forum for the most diverse audience of staff among VA ECHO clinics, with participation from clinic administrators to social workers to primary care providers to tumor registrars.
Through the creation of the Conference, > 300 individuals who care for veterans with cancer have been provided with a regular forum at which to connect with colleagues, receive updates on new treatment options for their patients, and learn about and share best practices specific to VA oncology patients. The VA ECHO technology creates a resource that can be accessed by all VA staff from their desktop computer. The VA ECHO SharePoint saves the slides of the Conference presentations both with and without audio to enable staff who can’t participate in real time to access the information at their convenience.
The Conference has facilitated networking among VA oncology providers who have common interests. Conference participants also have participated in other VA ECHO conferences in disciplines beyond oncology. Participants in the Conference also are encouraged to participate as speakers by presenting quality improvement initiatives at their VA site. This novel approach to generating content for this educational series has led to a dynamic interchange of ideas and increased networking among VA providers related to their practice and quality improvement initiatives at their VA sites. The Conference provides a regular forum for VA staff across a wide range of disciplines to share personal experiences, successes, and frustrations and to get feedback from colleagues.
The Conference combines a structured approach to presenting VA-specific educational content related to cancer care and multiple mechanisms that encourage staff to participate in an ongoing dialogue related to quality initiatives both on the phone during the Conference, online using Outlook LYNC or Skype to ask questions during the Conference, and during conversations on group e-mail. The Conference promotes staff engagement at little or no extra cost to the VA. For more information about the VA ECHO Cancer Care Conference or to submit a presentation for consideration for a future session, please contact julie.beck@va.gov or pradeep.mutalik@va.gov.
1. Arora S, Geppert CM, Kalishman S, et al. Academic health center management of chronic diseases through knowledge networks: Project ECHO. Acad Med. 2007;82(2):154-160.
2. Hematology and oncology federal health care data trends. Fed Pract. 2017;33(suppl 5):S12-S15.
3. American College of Surgeons Commission on Cancer. Cancer Program Standards: Ensuring Patient Centered Care, 2016 Edition. https://www.facs.org/quality-programs/cancer/coc/standards. Accessed March 14, 2018.
A telementoring program based on the Specialty Care Access Network Extension for Community Healthcare Outcomes model shared information about cancer care across VA health Care systems.
A telementoring program based on the Specialty Care Access Network Extension for Community Healthcare Outcomes model shared information about cancer care across VA health Care systems.
In 2016, the Cancer Care Coordinator at the US Department of Veterans Affairs (VA) Connecticut Healthcare System (VACT) in West Haven partnered with the VA New England Healthcare System to use its telementoring program. The VA Specialty Care Access Network Extension for Community Healthcare Outcomes (VA ECHO) was used to present a series of educational conferences on cancer care. This article describes our experience implementing the program and reviews participant feedback gathered from voluntary surveys.
Background
In 2011, the Veterans Health Administration (VHA) Office of Healthcare Transformation launched VA ECHO, a telementoring program for primary care providers (PCPs) and patient-aligned care team staff. VACT was selected as 1 of 7 hub sites across the US. The VA ECHO system uses video and online technology to provide PCPs with case-based specialist consultation and didactic education. The system enables providers at any VA location to participate in online and telephone conferences in real time. The presentations are recorded and made available online to VA providers through a secure site.
VA ECHO is based on the highly successful Project ECHO model established by Sanjeev Arora and the University of New Mexico in 2007.1 The rationale for Project ECHO was that patient care could be improved by increasing the competence of PCPs in the management of complex diseases by providing access to disease specialists through a case-based learning approach that used technology, which it termed knowledge networks, to connect the PCPs to specialists.
The original model addressed management of hepatitis C in a medically underserved area where half of the population was widely geographically dispersed, making the provision of specialty care challenging. Developers identified 6 characteristics that make a disease appropriate for treatment using the Project ECHO knowledge network model:
- The disease is common;
- Management of the disease is complex;
- Treatment for the disease is evolving;
- The disease has a high societal impact;
- There are serious outcomes if the disease is not treated; and
- Disease management improves outcomes.1
VA ECHO conferences are available to all VA personnel. Staff can subscribe to an e-mail group list to be alerted to conference times and topics. Participants can connect directly to the conference using Microsoft Outlook Lync or Skype (Redmond, WA) and see the slides in real time on their computer as they listen to the presentation. The presentations are recorded, and the slides with audio can be accessed easily on the VA ECHO SharePoint site for download, enabling VA staff to listen to conferences at their convenience (Figure).
VA Cancer ECHO
The impetus to create a series of talks related to cancer care using VA ECHO was the frequent and often time-consuming requests we received from colleagues at other VA sites for information about areas of cancer care, such as survivorship and cancer care coordination. It was felt that presenting cancer care information as a VA ECHO series would make this information available to a large group of providers at one time, making the method more time effective than sharing the information via one-on-one conversations.
The cancer care coordinator originally conceived this as a 3-part, 1-time series to present work done at VACT in the areas of survivorship, psychosocial distress monitoring, and coordination of cancer care using the VA Cancer Care Tracking System, an online tracking tool. Information about the series was disseminated via VA group e-mail lists for oncology providers and via the existing VA ECHO subscriber invitation process. The 3-presentation series garnered positive feedback and had attendance that ranged from 49 to 75 participants (mean, 60). Participants expressed enthusiasm for the format via e-mail and phone feedback directly to the West Haven staff.
Expansion
The success of this original 3-part series led to a trial of an ongoing Cancer Care Conference series (Conference) using VA ECHO. This was a novel use of VA ECHO and was outside its traditional format, which is geared to discussion of individual cases and clinical knowledge. Nevertheless, this new style of communication has been embraced by a wide range of VA cancer care professionals.
One reason we considered expanding the program was that oncology fit the framework of the original Project ECHO knowledge network model. Cancer is common at the VA, which cares for 175,000 patients with cancer annually.2 The management of cancer is complex involving many disciplines working together, and treatments are constantly changing. In addition, cancer has a high societal impact; there are serious outcomes both in terms of patient survival and patient symptom burden. And lastly, outcomes are improved with proactive disease management that is informed by the most current, evidence-based medicine.
The Conference was conceived as a forum for providers across disciplines to share best practices and discuss common challenges in caring for veterans with cancer. We invited participants to submit proposals for presentations related to cancer care initiatives at their VA sites. Potential speakers across all areas of care for veterans with cancer were invited to submit possible topics for the conference. The submissions were reviewed by the moderators in an effort to create a series of talks on a variety of topics across all aspects of care for oncology patients in the VA. This process of effectively crowd-sourcing educational content inspires providers to think more creatively about their practice and quality improvement projects and has sparked an ongoing dialogue about quality initiatives among VA oncology providers across disciplines and geographic locations. As a result, this approach also has enabled participants to learn from colleagues who work at a wide range of rural and urban VA locations throughout the country and to network with colleagues who are working on similar quality initiatives and challenges related to caring for veterans with cancer.
Program
The first Conference talk was in October 2016. It encompassed ten 1-hour talks during the 2016 to 2017 academic year. Speakers were recruited from the VACT West Haven campus and from several other VA sites nationwide. Topics included survivorship, psychosocial distress, palliative care, cancer navigation, and establishing a clinical trials program.
In its first year, the Conference series had 260 unique attendees representing such disciplines as medicine, nursing, social work, pharmacy, psychology, and clinic administration and representing all 21 Veterans Integrated Services Networks (VISNs). Speakers including oncologists, hepatologists, cancer care coordinators, health psychologists, and a research coordinator gave presentations on psychosocial distress screening and issues, cognitive behavioral therapy for cancer pain, cancer navigation, cancer case tracking, VISN-based liver cancer tumor tracker and liver tumor board, starting a VA-based clinical trial, palliative care, and survivorship.
The Conference accounted for 508 continuing medical education (CME) hours, which accounted for one-third of the total CME hours generated by the VACT West Haven VA ECHO program. Highlights of the talks were presented at the 2017 Association of VA Hematology/Oncology annual meeting in Denver, Colorado.
During the second year of the Conference, speakers were recruited to address new American College of Surgeons Commission on Cancer (CoC) requirements regarding survivorship treatment summaries for a subset of cancer survivors.3 The focus on survivorship was driven by ongoing feedback from participants who were working on initiatives to implement this process at their VA sites and wanted to learn from peers involved in this process throughout the VA system. Several speakers gave talks on implementing survivorship care at their VA and specifically on the use of computerized patient record system templates to create survivorship treatment summaries for veterans in accordance with CoC standards.
Since the first Conference in 2016, the number of unique attendees grew by 20% to 327 in 2018. During its first 2 years, participants have earned a total of 1,095 CME credits through Yale University CME. Conferences are usually broadcast at noon eastern time so that providers can take advantage of sessions during lunch breaks.
Participant Surveys
Attendees were invited to participate in voluntary, anonymous surveys to obtain feedback on and to receive input on topics of interest for future talks. Participants also were asked to comment on resources that they utilized to be updated on practice changes (Table 1).
The Conference has led to increased awareness of other continuing education opportunities available through VA ECHO-Connecticut. Of survey participants, 20% reported that they had attended other VA ECHO conferences.
The survey samples are self-selecting and may not necessarily be representative of the Conference participants or of the VA oncology interdisciplinary team as a whole; however, the relatively large number of survey participants provides some confidence that these survey results can help inform future planning for this and other continuing education opportunities for VA oncology providers.
An additional online survey was designed to elucidate whether participants were incorporating knowledge gained from the Conference in their cancer care practice. Half of the 32 participants strongly agreed with the following statement: “Participation in the VA Cancer Care Conference has added to my knowledge of information relevant to my practice,” and 13 more agreed with the statement for a total of 90.6% of those surveyed responding affirmatively. Only 3 participants neither agreed nor disagreed, and none disagreed with the statement. More than half of the participants reported that they made changes to their practice or plan to make changes as a result of the Conference.
Conculsion
The VA ECHO program established at the VACT West Haven campus in 2012 now offers regular monthly or bimonthly conferences in 9 specialties: pain, liver/hepatitis C, neurology, nephrology, cardiology, diabetes/endocrinology, mental health and addiction, nursing grand rounds, and cancer care. The VACT ECHO program is led by a medical director, and each specialty has a clinical director who conducts sessions and recruits other specialists from their department.
Teleconferencing can provide opportunities for colleagues living in distant locations to connect; share best practices, common goals, and challenges; and initiate ongoing and lasting relationships. The Conference draws the most diverse audience by discipline of all the VA ECHO conferences hosted at VACT (Table 2).
Traditionally, the national VA ECHO program has been a forum for specialists to discuss clinical case presentations for the benefit of primary care providers and to deliver didactics about chronic clinical conditions. Our Cancer Care Management VA ECHO has explored new ground by discussing material that has helped sites set up and enhance cancer care clinics and disseminate best practices for cancer survivorship and other aspects of cancer care. As a result, this conference has attracted and provided a forum for the most diverse audience of staff among VA ECHO clinics, with participation from clinic administrators to social workers to primary care providers to tumor registrars.
Through the creation of the Conference, > 300 individuals who care for veterans with cancer have been provided with a regular forum at which to connect with colleagues, receive updates on new treatment options for their patients, and learn about and share best practices specific to VA oncology patients. The VA ECHO technology creates a resource that can be accessed by all VA staff from their desktop computer. The VA ECHO SharePoint saves the slides of the Conference presentations both with and without audio to enable staff who can’t participate in real time to access the information at their convenience.
The Conference has facilitated networking among VA oncology providers who have common interests. Conference participants also have participated in other VA ECHO conferences in disciplines beyond oncology. Participants in the Conference also are encouraged to participate as speakers by presenting quality improvement initiatives at their VA site. This novel approach to generating content for this educational series has led to a dynamic interchange of ideas and increased networking among VA providers related to their practice and quality improvement initiatives at their VA sites. The Conference provides a regular forum for VA staff across a wide range of disciplines to share personal experiences, successes, and frustrations and to get feedback from colleagues.
The Conference combines a structured approach to presenting VA-specific educational content related to cancer care and multiple mechanisms that encourage staff to participate in an ongoing dialogue related to quality initiatives both on the phone during the Conference, online using Outlook LYNC or Skype to ask questions during the Conference, and during conversations on group e-mail. The Conference promotes staff engagement at little or no extra cost to the VA. For more information about the VA ECHO Cancer Care Conference or to submit a presentation for consideration for a future session, please contact julie.beck@va.gov or pradeep.mutalik@va.gov.
1. Arora S, Geppert CM, Kalishman S, et al. Academic health center management of chronic diseases through knowledge networks: Project ECHO. Acad Med. 2007;82(2):154-160.
2. Hematology and oncology federal health care data trends. Fed Pract. 2017;33(suppl 5):S12-S15.
3. American College of Surgeons Commission on Cancer. Cancer Program Standards: Ensuring Patient Centered Care, 2016 Edition. https://www.facs.org/quality-programs/cancer/coc/standards. Accessed March 14, 2018.
Liver Imaging Reporting and Data System in Patients at High Risk for Hepatocellular Carcinoma in the Memphis Veterans Affairs Population (FULL)
Although hepatocellular carcinoma can be difficult to detect, use of the LI-RADS algorithm could lead to earlier identification in at-risk patients.
Hepatocellular carcinoma (HCC) is the third most common cause of death from cancer worldwide.1 Liver cancer is the fifth most common cancer in men and the seventh in women.2 The highest incidence rates are in sub-Saharan Africa and Southeast Asia where hepatitis B virus is endemic. The incidence of HCC in western countries is increasing, particularly due to the rise of hepatitis C virus (HCV) as well as alcoholic liver disease and nonalcoholic fatty liver disease. The incidence of HCC has tripled in the US in the past 2 decades.1-3
HCC can be diagnosed by radiographic images without the need for biopsy if the typical imaging features are present.3 The European Association for the Study of Liver Disease (EASL) and the American Association for the Study of Liver Diseases (AASLD) recommend screening abdominal ultrasonography at 6-month intervals for high-risk patients.3,4 High-risk patients include patients with cirrhosis, especially those with hepatitis B or C.3
If screening ultrasonography detects a nodule, size determines whether a follow-up ultrasound is needed vs obtaining a contrast-enhanced dynamic computed tomography (CT) scan or a magnetic resonance image (MRI).3 If ultrasonography detects a nodule > 1 cm in diameter, then a dynamic CT or MRI is performed. Characteristic hyperenhancement during later arterial phase and washout during the venous or delayed phase is associated with a nearly 100% specificity for HCC diagnosis.5 Arterial-enhancing contrast is required when using CT and MRI because HCC is a hypervascular lesion.6 The portal venous blood dilutes the majority of the liver’s arterial blood; therefore, the liver does not enhance during the arterial phase, while HCC will show maximum enhancement.7 Furthermore, HCC should demonstrate a “washout” of contrast during the venous phase on CT and MRI.4 Standard imaging protocol dictates that 4 phases are needed to properly diagnose HCC including unenhanced, arterial, venous, and delayed.4
Regular surveillance increases the likelihood of detecting HCC before the presentation of clinical symptoms and facilitates receipt of curative therapy.8-10 Patients with viral hepatitis and cirrhosis with HCC found on screening are more likely to have earlier-stage disease and survive longer from the time of diagnosis.11 Furthermore, it has been observed that HCC detected by surveillance is significantly more likely to undergo curative therapy compared with incidental or symptomatic detection of HCC.9
Technical improvements in imaging techniques include advancement in contrast agents, multidetector row helical CT, and the flexibility/range of pulse sequences available in MRI.7 Even with technical improvements in all modalities used in HCC imaging, detecting HCC remains difficult, especially when detecting the small (< 2 cm) lesions in a cirrhotic liver.7 Interpretation of imaging also remains a challenge as HCC does not always fit strict criteria: lack of “washout” in a hypervascular lesion, determining small HCC lesions from benign nodules, and hypovascular/isovascular HCC.5 Radiologic differentials in the diagnosis of HCC include transient hepatic intensity difference (THID)/transient hepatic attenuation difference (THAD), arterio-portal shunt, and regenerative nodules.12 In the common clinical setting, patients undergo multiple imaging studies that are interpreted by multiple radiologists, which can add to the difficulty in the diagnosis of HCC.13
The radiology community recognized the inconsistencies and complexities of HCC imaging. Therefore, the American College of Radiology endorsed the Liver Imaging Reporting and Data System (LI-RADS), which had the goal of reducing variability in lesion interpretation through standardization and improving communication with clinicians.14 LI-RADS uses a diagnostic algorithm for CT and MRI that categorizes observed liver findings in high-risk individuals based on the probability or relative risk of HCC without assigning a formal diagnosis.14 LI-RADS takes into account arterial phase enhancement, tumor size, washout appearance, the presence and nature of a capsule, and threshold growth.15 LI-RADS categorizes an observed liver finding on a scale of 1 to 5, with 1 corresponding to a definitely benign finding and 5 with definitive HCC.14 Furthermore, LI-RADS sought to limit the technical variabilities among institutions.
LI-RADS was launched in 2011 and has been utilized by many clinical practices while continuing to be expanded and updated.16 Recent studies examined the specificity of LI-RADS as well as interreader variability.17,18 For nodules viewed on MRI, both LI-RADS categories 4 and 5 had high specificity for HCC.17 When looking at interreader repeatability, LI-RADS showed moderate agreement among experts using the diagnostic algorithm.19 Further studies have compared LI-RADS with the AASLD guidelines and the Organ Procurement and Transplantation Network (OPTN) guidelines.16 When compared with other guidelines, LI-RADS expands the definition of indeterminate findings into probably benign, intermediate probability of HCC, and probably HCC, which corresponds to LI-RADS categories 2, 3, and 4.16
We looked retrospectively at a group of patients previously diagnosed with HCC to see whether utilizing the LI-RADS scoring system within our screening system might have allowed an earlier prediction of HCC and a timelier intervention. Prior to this investigation the LI-RADS system was not used for HCC screening at our US Department of Veterans Affairs (VA) facility. We examined screened patients at the Memphis VA Medical Center (MVAMC) in Tennessee who were subsequently diagnosed with HCC to see which LI-RADS category the last surveillance CT prior to diagnosis would fall into, 6 months to a year prior to the diagnosis of HCC. Our control population was a group of patients screened with CT for their liver nodules who were found not to have HCC.
Methods
Patients at MVAMC with cirrhosis and patients with chronic hepatitis B are routinely screened with ultrasound, CT, or MRI in accordance with the AASLD, EASL, and VA guidelines. Of 303 patients with HCV and cirrhosis under care in 2015, 242 (81%) received imaging to screen for HCC according to the VA National Hepatitis C Registry 2015 (Personal Communication, Population Health Service, Office of Patient Care Services).The LI-RADS scoring system was not applied as a standard screening methodology.
Under an institutional review board-approved protocol, we reviewed the charts of all patients diagnosed with HCC at MVAMC from 2009 to 2014, utilizing ICD-9 code of 155.0 for HCC. We identified within these charts patients who had a surveillance CT image performed within a 6- to 13-month period prior to the CTs that diagnosed HCC (prediagnostic HCC CT). Furthermore, we reviewed the charts of all patients diagnosed with benign liver nodules at MVAMC from 2009 to 2014, utilizing the ICD-9 code of 573.8 for other specified disorders of the liver.
Within these charts, we found patients who had a surveillance CT image performed and who were followed after that image with additional imaging for ≥ 2 years or who had a liver biopsy negative for HCC (benign surveillance CT). We compared these 2 sets of CTs utilizing LI-RADS criteria. Once these patients were identified, a list of the CTs to be examined were given to 2 MVAMC radiologists who specialize in CT.
No identifying information of the patients was included, and a 13-digit number unique to each CT exam identified the CTs to be reviewed. Radiologist 1 and 2 examined the CTs on the MVAMC Picture Archiving and Communication System (PACS). Both radiologists were asked to give each nodule a score according to LI-RADS v2014 diagnostic algorithm (Figure).
We hypothesized that the prediagnostic CT images of patients eventually determined to have HCC would have a LI-RADS score of 4 (LR4) or LR5. Furthermore, we hypothesized that the CT images of the benign liver nodule patients would have a score ≤ LR3. If there was a disagreement between the radiologists in terms of a malignant score (LR4 or LR5) vs a benign score (≤ LR3), then a third radiologist (radiologist 3) provided a score for these nodules. The third, tiebreaker radiologist was given the scores of both prior radiologists and asked to choose which score was correct.
Statistical analysis was then applied to the data to determine the sensitivity, specificity, and diagnostic accuracy in diagnosing eventual HCC, as well as the false-negative and false-positive rates of radiologists 1 and 2. Raw data also were used to determine the agreement between raters by calculating the κ statistic with a 95% CI.
Results
A total of 70 nodules were examined by radiologists 1 and 2 with 42 of the nodules in the prediagnostic HCC CTs and 28 of the nodules in the benign surveillance CTs. 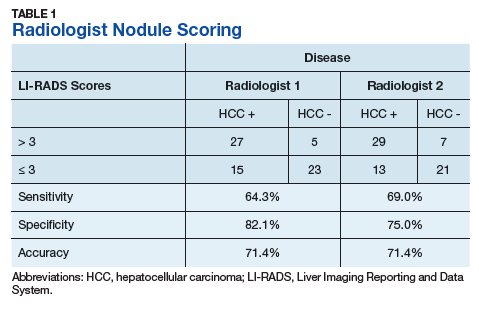
Radiologist 1 identified 11 patients with LR4 and 21 patients with LR5. His scores showed a sensitivity of 64.3% and specificity of 82.1% with accuracy of 71.4% for LI-RADS in identifying eventual HCC. The false-negative rate of the LI-RADS diagnostic algorithm for radiologist 1 was 35.7% and the false-positive rate was 17.9%. Radiologist 2 identified 17 patients LR4 and 19 patients with LR5. Radiologist 2’s scores showed a sensitivity of 69.0% and specificity of 75.0% with accuracy of 71.4% for LI-RADS in identifying eventual HCC.The false-negative rate of the LI-RADS diagnostic algorithm for radiologist 2 was 31.0% and false-positive rate of 25.0%. The κ statistic was calculated to determine the interrater agreement. The radiologists agreed on 58 of 70 samples; 15 without HCC and 43 with HCC. The κ statistic was 0.592, which indicates moderate agreement (Table 2). 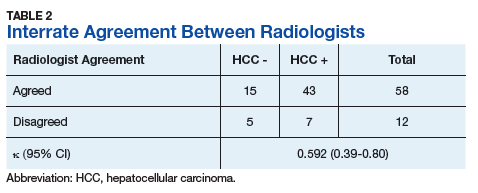
Discussion
If HCC is diagnosed late in the disease process based on symptomatology and not on surveillance imaging, the likelihood of receiving early and potential curative therapy greatly declines as was shown in a systemic literature review.9 Surveillance imaging and lesion interpretation by various radiologists has been difficult to standardize as new technologic advances continue to occur in the imaging of HCC.14 LI-RADS was initiated to help standardize CT and MRI interpretation and reporting of hepatic nodules. As a dynamic algorithm, it continues to adjust with new advances in imaging techniques with the most recent updates being made to the algorithm in 2014.14,19 LI-RADS applies to patients at high risk for HCC most often who are already enrolled in a surveillance program.19 The MVAMC has a high incidence of patients with cirrhosis who are at risk for HCC, which is why we chose it as our study population.
LI-RADS can be applied to both MRI and CT imaging. Much of the recent literature have looked at LI-RADS in terms of MRI. A group in China looked at 100 pathologically confirmed patients and assigned a LI-RADS score to the MRI at the time of diagnosis and showed that MRI LI-RADS scoring was highly sensitive and specific in the diagnosis of HCC.20 This study did note a numeric difference in the specificity of LI-RADS algorithm depending on how LR3 scores were viewed. If a LR3 score was considered negative rather than positive for HCC, then the specificity increased by almost 20%.20
Another study looked at patients with liver nodules ≤ 20 mm found on ultrasound and obtained MRIs and biopsies on these patients, assigning the MRI a LI-RADs score.17 Darnell and colleagues found that MRI LR4 and LR5 have a high specificity for HCC. However, 29 of the 42 LR3 lesions examined were found to be HCC.17 Furthermore, Choi and colleagues retrospectively looked at patients in a HCC surveillance program who had undergone MRI as part of the program and assigned LI-RADS scores to these MRIs.21 Their study showed that LR5 criteria on gadoxetate disodium-enhanced MRI has excellent positive predictive value (PPV) for diagnosing HCC, and LR4 showed good PPV.21
In our study, we chose to look at LI-RADS in terms of surveillance CT scans 6 to 13 months prior to the diagnosis of HCC to see whether this method would allow us to intervene earlier with more aggressive diagnostics or therapy in those suspected of having HCC. Although Choi and colleagues looked retrospectively at MRI surveillance imaging, most of the prior studies have looked at LI-RADS scoring in imaging at the time of diagnosis.17,20,21 By looking at surveillance CT scans, we sought to determine LI-RADS sensitivity, specificity, and diagnostic accuracy as a screening tool compared with CT evaluations without LI-RADS scoring.
We also chose to look at CT scans since most of the prior studies have looked at the more detailed and often more expensive MRIs. For both radiologists 1 and 2, the sensitivity was > 60% and specificity was > 70% with a diagnostic accuracy of 71.4% in predicting a diagnosis of HCC in future scans. Although there was high false negative of > 30% for both radiologists, we did consider LR3 as negative for HCC. As Darnell and colleagues’ study of MRI LI-RADS shows, LR3 may need to be revised in the future as its ambiguity can lead to false-negatives.17 Our results also showed moderate interreader agreement, which has been seen in previous studies with LI-RADS.18
Some studies have compared MRI with CT imaging in terms of LI-RADs classification of hepatic nodules to find out whether concordance was seen.22,23 Both studies found that there was substantial discordance between MRI and CT with CT often underscoring hepatic nodules.22,23 In Zhang and colleagues, interclass agreement between CT and MRI varied the most in terms of arterial enhancement with CT producing false-negative findings.22 CT also underestimated LI-RADS score by 16.9% for LR3, 37.3% for LR4, and 8.5% for LR5 in this study.22 Furthermore, Corwin and colleagues found a significant upgrade in terms of LI-RADS categorization with MRI for 42.5% of observations.23 In this study, upgraded LI-RADS scores on MRI included 2 upgraded to LR5V (Figure), 15 upgraded to LR5, and 12 upgraded to LR4.23 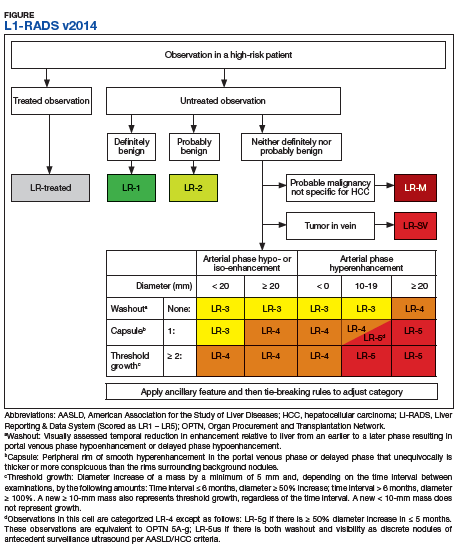
Our study shows that the LI-RADS algorithm has a good sensitivity, specificity, and diagnostic accuracy as a screening tool, predicting HCC in scans earlier than standard CT evaluation. In our study, the patients with HCC were shown to have higher LI-RADS scores on prediagnostic imaging, while the benign liver nodule patients were shown to have lower LI-RADS scores. This data would suggest that a LI-RADS score given to surveillance CT of LR4 or higher should recommend either a biopsy or follow-up imaging after a short interval. If LI-RADS is applied to surveillance CTs in patients at risk for HCC, a diagnosis of HCC may be arrived at earlier as compared with not using the LI-RADS algorithm. Earlier detection may lead to earlier intervention and improved treatment outcomes.
Limitations
Limitations to our study occurred because radiologist 3 did not review all of the images nor score them. Radiologist 3 was limited to 12 images where there was disagreement and was limited to 2 scores to choose from for each image. Further limitations include that this study was performed at a single center. Our study focused on one imaging modality and did not include ultrasounds or MRIs. We did not compare the demographics of our patients with those of other VA hospitals. The radiologists interpreted the images individually, and their subjectivity was another limitation.
Conclusion
In the MVAMC population, LI-RADS showed a good sensitivity, specificity, and diagnostic accuracy for CT surveillance scans in patient at high risk for HCC at an earlier time point than did standard evaluation by very experienced CT radiologists. Higher LI-RADS scores on surveillance CTs had good diagnostic accuracy for the probable future diagnosis of HCC, whereas lower LI-RADS scores had a good diagnostic accuracy for probable benign nodules. Utilizing the LI-RADS algorithm on all surveillance CTs in patients at high risk for HCC may lead to obtaining MRIs or follow-up CTs sooner for suspicious nodules, leading to an earlier diagnosis of HCC and possible earlier and more effective intervention.
1. El–Serag HB, Rudolph KL. Hepatocellular carcinoma: epidemiology and molecular carcinogenesis. Gastroenterology. 2007;132(7):2557-2576.
2. El-Serag HB. Hepatocellular carcinoma. N Engl J Med. 2011;365(12):1118-1127.
3. Bruix J, Sherman M; American Association for the Study of Liver Diseases. Management of hepatocellular carcinoma: an update. Hepatology. 2011;53(3):1020-1022.
4. Selvapatt N, House H, Brown A. Hepatocellular carcinoma surveillance: are we utilizing it? J Clin Gastroenterol. 2016;50(1):e8-e12.
5. Lee JM, Yoon JH, Joo I, Woo HS. Recent advances in CT and MR imaging for evaluation of hepatocellular carcinoma. Liver Cancer. 2012;1(1):22-40.
6. Chou R, Cuevas C, Fu R, et al. Imaging techniques for the diagnosis of hepatocellular carcinoma: a systemic review and meta-analysis. Ann Intern Med. 2015;162(10):697-711.
7. Ariff B, Lloyd CR, Khan S, et al. Imaging of liver cancer. World J Gastroenterol. 2009;15(11):1289-1300.
8. Yuen MF, Cheng CC, Lauder IJ, Lam SK, Ooi CG, Lai CL. Early detection of hepatocellular carcinoma increases the chance of treatment: Hong Kong experience. Hepatology. 2000;31(2):330-335.
9. Singal AG, Pillai A, Tiro J. Early detection, curative treatment, and survival rates for hepatocellular carcinoma surveillance in patients with cirrhosis: a meta-analysis. PLoS Med. 2014;11(4):e1001624.
10. Nusbaum, JD, Smirniotopoulos J, Wright HC, et al. The effect of hepatocellular carcinoma surveillance in an urban population with liver cirrhosis. J Clin Gastroenterol. 2015;49(10):e91-e95.
11. Kansagara D, Papak J, Pasha AS, et al. Screening for hepatocellular carcinoma in chronic liver disease: a systemic review. Ann Intern Med. 2014;161(4):261-269.
12. Shah S, Shukla A, Paunipagar B. Radiological features of hepatocellular carcinoma. J Clin Exp Hepatol. 2014;4(suppl 3):S63-S66.
13. You MW, Kim SY, Kim KW, et al. Recent advances in the imaging of hepatocellular carcinoma. Clin Mol Hepatol. 2015;21(1):95-103.
14. American College of Radiology. Liver reporting and data system (LI-RADS). https://www.acr.org/Clinical-Resources/Reporting-and-Data-Systems/LI-RADS. Accessed April 10, 2018.
15. Anis M. Imaging of hepatocellular carcinoma: new approaches to diagnosis. Clin Liver Dis. 2015;19(2):325-340.
16. Mitchell D, Bruix J, Sherman M, Sirlin CB. LI-RADS (Liver Imaging Reporting and Data System): summary, discussion, and consensus of the LI-RADS Management Working Group and future directions. Hepatology. 2015;61(3):1056-1065.
17. Darnell A, Forner A, Rimola J, et al. Liver imaging reporting and data system with MR imaging: evaluation in nodules 20 mm or smaller detected in cirrhosis at screening US. Radiology. 2015; 275(3):698-707.
18. Davenport MS, Khalatbari S, Liu PS, et al. Repeatability of diagnostic features and scoring systems for hepatocellular carcinoma by using MR imaging. Radiology. 2014;272(1):132-142.
19. An C, Rakhmonova G, Choi JY, Kim MJ. Liver imaging reporting and data system (LI-RADS) version 2014: understanding and application of the diagnostic algorithm. Clin Mol Hepatol. 2016;22(2):296-307.
20. Zhao W, Li W, Yi X, et al. [Diagnostic value of liver imaging reporting and data system on primary hepatocellular carcinoma] [in Chinese]. Zhong Nan Da Xue Xue Bao Yi Xue Ban. 2016;41(4):380-387.
21. Choi SH, Byun JH, Kim SY, et al. Liver imaging reporting and data system v2014 with gadoxetate disodium-enhanced magnetic resonance imaging: validation of LIRADS category 4 and 5 criteria. Invest Radiol. 2016;51(8):483-490.
22. Zhang YD, Zhu FP, Xu X, et al. Liver imaging reporting and data system: substantial discordance between CT and MR for imaging classification of hepatic nodules. Acad Radiol. 2016;23(3):344-352.
23. Corwin MT, Fananapazir G, Jin M, Lamba R, Bashir MR. Difference in liver imaging and reporting data system categorization between MRI and CT. Am J Roentgenol. 2016;206(2):307-312.
Although hepatocellular carcinoma can be difficult to detect, use of the LI-RADS algorithm could lead to earlier identification in at-risk patients.
Although hepatocellular carcinoma can be difficult to detect, use of the LI-RADS algorithm could lead to earlier identification in at-risk patients.
Hepatocellular carcinoma (HCC) is the third most common cause of death from cancer worldwide.1 Liver cancer is the fifth most common cancer in men and the seventh in women.2 The highest incidence rates are in sub-Saharan Africa and Southeast Asia where hepatitis B virus is endemic. The incidence of HCC in western countries is increasing, particularly due to the rise of hepatitis C virus (HCV) as well as alcoholic liver disease and nonalcoholic fatty liver disease. The incidence of HCC has tripled in the US in the past 2 decades.1-3
HCC can be diagnosed by radiographic images without the need for biopsy if the typical imaging features are present.3 The European Association for the Study of Liver Disease (EASL) and the American Association for the Study of Liver Diseases (AASLD) recommend screening abdominal ultrasonography at 6-month intervals for high-risk patients.3,4 High-risk patients include patients with cirrhosis, especially those with hepatitis B or C.3
If screening ultrasonography detects a nodule, size determines whether a follow-up ultrasound is needed vs obtaining a contrast-enhanced dynamic computed tomography (CT) scan or a magnetic resonance image (MRI).3 If ultrasonography detects a nodule > 1 cm in diameter, then a dynamic CT or MRI is performed. Characteristic hyperenhancement during later arterial phase and washout during the venous or delayed phase is associated with a nearly 100% specificity for HCC diagnosis.5 Arterial-enhancing contrast is required when using CT and MRI because HCC is a hypervascular lesion.6 The portal venous blood dilutes the majority of the liver’s arterial blood; therefore, the liver does not enhance during the arterial phase, while HCC will show maximum enhancement.7 Furthermore, HCC should demonstrate a “washout” of contrast during the venous phase on CT and MRI.4 Standard imaging protocol dictates that 4 phases are needed to properly diagnose HCC including unenhanced, arterial, venous, and delayed.4
Regular surveillance increases the likelihood of detecting HCC before the presentation of clinical symptoms and facilitates receipt of curative therapy.8-10 Patients with viral hepatitis and cirrhosis with HCC found on screening are more likely to have earlier-stage disease and survive longer from the time of diagnosis.11 Furthermore, it has been observed that HCC detected by surveillance is significantly more likely to undergo curative therapy compared with incidental or symptomatic detection of HCC.9
Technical improvements in imaging techniques include advancement in contrast agents, multidetector row helical CT, and the flexibility/range of pulse sequences available in MRI.7 Even with technical improvements in all modalities used in HCC imaging, detecting HCC remains difficult, especially when detecting the small (< 2 cm) lesions in a cirrhotic liver.7 Interpretation of imaging also remains a challenge as HCC does not always fit strict criteria: lack of “washout” in a hypervascular lesion, determining small HCC lesions from benign nodules, and hypovascular/isovascular HCC.5 Radiologic differentials in the diagnosis of HCC include transient hepatic intensity difference (THID)/transient hepatic attenuation difference (THAD), arterio-portal shunt, and regenerative nodules.12 In the common clinical setting, patients undergo multiple imaging studies that are interpreted by multiple radiologists, which can add to the difficulty in the diagnosis of HCC.13
The radiology community recognized the inconsistencies and complexities of HCC imaging. Therefore, the American College of Radiology endorsed the Liver Imaging Reporting and Data System (LI-RADS), which had the goal of reducing variability in lesion interpretation through standardization and improving communication with clinicians.14 LI-RADS uses a diagnostic algorithm for CT and MRI that categorizes observed liver findings in high-risk individuals based on the probability or relative risk of HCC without assigning a formal diagnosis.14 LI-RADS takes into account arterial phase enhancement, tumor size, washout appearance, the presence and nature of a capsule, and threshold growth.15 LI-RADS categorizes an observed liver finding on a scale of 1 to 5, with 1 corresponding to a definitely benign finding and 5 with definitive HCC.14 Furthermore, LI-RADS sought to limit the technical variabilities among institutions.
LI-RADS was launched in 2011 and has been utilized by many clinical practices while continuing to be expanded and updated.16 Recent studies examined the specificity of LI-RADS as well as interreader variability.17,18 For nodules viewed on MRI, both LI-RADS categories 4 and 5 had high specificity for HCC.17 When looking at interreader repeatability, LI-RADS showed moderate agreement among experts using the diagnostic algorithm.19 Further studies have compared LI-RADS with the AASLD guidelines and the Organ Procurement and Transplantation Network (OPTN) guidelines.16 When compared with other guidelines, LI-RADS expands the definition of indeterminate findings into probably benign, intermediate probability of HCC, and probably HCC, which corresponds to LI-RADS categories 2, 3, and 4.16
We looked retrospectively at a group of patients previously diagnosed with HCC to see whether utilizing the LI-RADS scoring system within our screening system might have allowed an earlier prediction of HCC and a timelier intervention. Prior to this investigation the LI-RADS system was not used for HCC screening at our US Department of Veterans Affairs (VA) facility. We examined screened patients at the Memphis VA Medical Center (MVAMC) in Tennessee who were subsequently diagnosed with HCC to see which LI-RADS category the last surveillance CT prior to diagnosis would fall into, 6 months to a year prior to the diagnosis of HCC. Our control population was a group of patients screened with CT for their liver nodules who were found not to have HCC.
Methods
Patients at MVAMC with cirrhosis and patients with chronic hepatitis B are routinely screened with ultrasound, CT, or MRI in accordance with the AASLD, EASL, and VA guidelines. Of 303 patients with HCV and cirrhosis under care in 2015, 242 (81%) received imaging to screen for HCC according to the VA National Hepatitis C Registry 2015 (Personal Communication, Population Health Service, Office of Patient Care Services).The LI-RADS scoring system was not applied as a standard screening methodology.
Under an institutional review board-approved protocol, we reviewed the charts of all patients diagnosed with HCC at MVAMC from 2009 to 2014, utilizing ICD-9 code of 155.0 for HCC. We identified within these charts patients who had a surveillance CT image performed within a 6- to 13-month period prior to the CTs that diagnosed HCC (prediagnostic HCC CT). Furthermore, we reviewed the charts of all patients diagnosed with benign liver nodules at MVAMC from 2009 to 2014, utilizing the ICD-9 code of 573.8 for other specified disorders of the liver.
Within these charts, we found patients who had a surveillance CT image performed and who were followed after that image with additional imaging for ≥ 2 years or who had a liver biopsy negative for HCC (benign surveillance CT). We compared these 2 sets of CTs utilizing LI-RADS criteria. Once these patients were identified, a list of the CTs to be examined were given to 2 MVAMC radiologists who specialize in CT.
No identifying information of the patients was included, and a 13-digit number unique to each CT exam identified the CTs to be reviewed. Radiologist 1 and 2 examined the CTs on the MVAMC Picture Archiving and Communication System (PACS). Both radiologists were asked to give each nodule a score according to LI-RADS v2014 diagnostic algorithm (Figure).
We hypothesized that the prediagnostic CT images of patients eventually determined to have HCC would have a LI-RADS score of 4 (LR4) or LR5. Furthermore, we hypothesized that the CT images of the benign liver nodule patients would have a score ≤ LR3. If there was a disagreement between the radiologists in terms of a malignant score (LR4 or LR5) vs a benign score (≤ LR3), then a third radiologist (radiologist 3) provided a score for these nodules. The third, tiebreaker radiologist was given the scores of both prior radiologists and asked to choose which score was correct.
Statistical analysis was then applied to the data to determine the sensitivity, specificity, and diagnostic accuracy in diagnosing eventual HCC, as well as the false-negative and false-positive rates of radiologists 1 and 2. Raw data also were used to determine the agreement between raters by calculating the κ statistic with a 95% CI.
Results
A total of 70 nodules were examined by radiologists 1 and 2 with 42 of the nodules in the prediagnostic HCC CTs and 28 of the nodules in the benign surveillance CTs.
Radiologist 1 identified 11 patients with LR4 and 21 patients with LR5. His scores showed a sensitivity of 64.3% and specificity of 82.1% with accuracy of 71.4% for LI-RADS in identifying eventual HCC. The false-negative rate of the LI-RADS diagnostic algorithm for radiologist 1 was 35.7% and the false-positive rate was 17.9%. Radiologist 2 identified 17 patients LR4 and 19 patients with LR5. Radiologist 2’s scores showed a sensitivity of 69.0% and specificity of 75.0% with accuracy of 71.4% for LI-RADS in identifying eventual HCC.The false-negative rate of the LI-RADS diagnostic algorithm for radiologist 2 was 31.0% and false-positive rate of 25.0%. The κ statistic was calculated to determine the interrater agreement. The radiologists agreed on 58 of 70 samples; 15 without HCC and 43 with HCC. The κ statistic was 0.592, which indicates moderate agreement (Table 2).
Discussion
If HCC is diagnosed late in the disease process based on symptomatology and not on surveillance imaging, the likelihood of receiving early and potential curative therapy greatly declines as was shown in a systemic literature review.9 Surveillance imaging and lesion interpretation by various radiologists has been difficult to standardize as new technologic advances continue to occur in the imaging of HCC.14 LI-RADS was initiated to help standardize CT and MRI interpretation and reporting of hepatic nodules. As a dynamic algorithm, it continues to adjust with new advances in imaging techniques with the most recent updates being made to the algorithm in 2014.14,19 LI-RADS applies to patients at high risk for HCC most often who are already enrolled in a surveillance program.19 The MVAMC has a high incidence of patients with cirrhosis who are at risk for HCC, which is why we chose it as our study population.
LI-RADS can be applied to both MRI and CT imaging. Much of the recent literature have looked at LI-RADS in terms of MRI. A group in China looked at 100 pathologically confirmed patients and assigned a LI-RADS score to the MRI at the time of diagnosis and showed that MRI LI-RADS scoring was highly sensitive and specific in the diagnosis of HCC.20 This study did note a numeric difference in the specificity of LI-RADS algorithm depending on how LR3 scores were viewed. If a LR3 score was considered negative rather than positive for HCC, then the specificity increased by almost 20%.20
Another study looked at patients with liver nodules ≤ 20 mm found on ultrasound and obtained MRIs and biopsies on these patients, assigning the MRI a LI-RADs score.17 Darnell and colleagues found that MRI LR4 and LR5 have a high specificity for HCC. However, 29 of the 42 LR3 lesions examined were found to be HCC.17 Furthermore, Choi and colleagues retrospectively looked at patients in a HCC surveillance program who had undergone MRI as part of the program and assigned LI-RADS scores to these MRIs.21 Their study showed that LR5 criteria on gadoxetate disodium-enhanced MRI has excellent positive predictive value (PPV) for diagnosing HCC, and LR4 showed good PPV.21
In our study, we chose to look at LI-RADS in terms of surveillance CT scans 6 to 13 months prior to the diagnosis of HCC to see whether this method would allow us to intervene earlier with more aggressive diagnostics or therapy in those suspected of having HCC. Although Choi and colleagues looked retrospectively at MRI surveillance imaging, most of the prior studies have looked at LI-RADS scoring in imaging at the time of diagnosis.17,20,21 By looking at surveillance CT scans, we sought to determine LI-RADS sensitivity, specificity, and diagnostic accuracy as a screening tool compared with CT evaluations without LI-RADS scoring.
We also chose to look at CT scans since most of the prior studies have looked at the more detailed and often more expensive MRIs. For both radiologists 1 and 2, the sensitivity was > 60% and specificity was > 70% with a diagnostic accuracy of 71.4% in predicting a diagnosis of HCC in future scans. Although there was high false negative of > 30% for both radiologists, we did consider LR3 as negative for HCC. As Darnell and colleagues’ study of MRI LI-RADS shows, LR3 may need to be revised in the future as its ambiguity can lead to false-negatives.17 Our results also showed moderate interreader agreement, which has been seen in previous studies with LI-RADS.18
Some studies have compared MRI with CT imaging in terms of LI-RADs classification of hepatic nodules to find out whether concordance was seen.22,23 Both studies found that there was substantial discordance between MRI and CT with CT often underscoring hepatic nodules.22,23 In Zhang and colleagues, interclass agreement between CT and MRI varied the most in terms of arterial enhancement with CT producing false-negative findings.22 CT also underestimated LI-RADS score by 16.9% for LR3, 37.3% for LR4, and 8.5% for LR5 in this study.22 Furthermore, Corwin and colleagues found a significant upgrade in terms of LI-RADS categorization with MRI for 42.5% of observations.23 In this study, upgraded LI-RADS scores on MRI included 2 upgraded to LR5V (Figure), 15 upgraded to LR5, and 12 upgraded to LR4.23
Our study shows that the LI-RADS algorithm has a good sensitivity, specificity, and diagnostic accuracy as a screening tool, predicting HCC in scans earlier than standard CT evaluation. In our study, the patients with HCC were shown to have higher LI-RADS scores on prediagnostic imaging, while the benign liver nodule patients were shown to have lower LI-RADS scores. This data would suggest that a LI-RADS score given to surveillance CT of LR4 or higher should recommend either a biopsy or follow-up imaging after a short interval. If LI-RADS is applied to surveillance CTs in patients at risk for HCC, a diagnosis of HCC may be arrived at earlier as compared with not using the LI-RADS algorithm. Earlier detection may lead to earlier intervention and improved treatment outcomes.
Limitations
Limitations to our study occurred because radiologist 3 did not review all of the images nor score them. Radiologist 3 was limited to 12 images where there was disagreement and was limited to 2 scores to choose from for each image. Further limitations include that this study was performed at a single center. Our study focused on one imaging modality and did not include ultrasounds or MRIs. We did not compare the demographics of our patients with those of other VA hospitals. The radiologists interpreted the images individually, and their subjectivity was another limitation.
Conclusion
In the MVAMC population, LI-RADS showed a good sensitivity, specificity, and diagnostic accuracy for CT surveillance scans in patient at high risk for HCC at an earlier time point than did standard evaluation by very experienced CT radiologists. Higher LI-RADS scores on surveillance CTs had good diagnostic accuracy for the probable future diagnosis of HCC, whereas lower LI-RADS scores had a good diagnostic accuracy for probable benign nodules. Utilizing the LI-RADS algorithm on all surveillance CTs in patients at high risk for HCC may lead to obtaining MRIs or follow-up CTs sooner for suspicious nodules, leading to an earlier diagnosis of HCC and possible earlier and more effective intervention.
1. El–Serag HB, Rudolph KL. Hepatocellular carcinoma: epidemiology and molecular carcinogenesis. Gastroenterology. 2007;132(7):2557-2576.
2. El-Serag HB. Hepatocellular carcinoma. N Engl J Med. 2011;365(12):1118-1127.
3. Bruix J, Sherman M; American Association for the Study of Liver Diseases. Management of hepatocellular carcinoma: an update. Hepatology. 2011;53(3):1020-1022.
4. Selvapatt N, House H, Brown A. Hepatocellular carcinoma surveillance: are we utilizing it? J Clin Gastroenterol. 2016;50(1):e8-e12.
5. Lee JM, Yoon JH, Joo I, Woo HS. Recent advances in CT and MR imaging for evaluation of hepatocellular carcinoma. Liver Cancer. 2012;1(1):22-40.
6. Chou R, Cuevas C, Fu R, et al. Imaging techniques for the diagnosis of hepatocellular carcinoma: a systemic review and meta-analysis. Ann Intern Med. 2015;162(10):697-711.
7. Ariff B, Lloyd CR, Khan S, et al. Imaging of liver cancer. World J Gastroenterol. 2009;15(11):1289-1300.
8. Yuen MF, Cheng CC, Lauder IJ, Lam SK, Ooi CG, Lai CL. Early detection of hepatocellular carcinoma increases the chance of treatment: Hong Kong experience. Hepatology. 2000;31(2):330-335.
9. Singal AG, Pillai A, Tiro J. Early detection, curative treatment, and survival rates for hepatocellular carcinoma surveillance in patients with cirrhosis: a meta-analysis. PLoS Med. 2014;11(4):e1001624.
10. Nusbaum, JD, Smirniotopoulos J, Wright HC, et al. The effect of hepatocellular carcinoma surveillance in an urban population with liver cirrhosis. J Clin Gastroenterol. 2015;49(10):e91-e95.
11. Kansagara D, Papak J, Pasha AS, et al. Screening for hepatocellular carcinoma in chronic liver disease: a systemic review. Ann Intern Med. 2014;161(4):261-269.
12. Shah S, Shukla A, Paunipagar B. Radiological features of hepatocellular carcinoma. J Clin Exp Hepatol. 2014;4(suppl 3):S63-S66.
13. You MW, Kim SY, Kim KW, et al. Recent advances in the imaging of hepatocellular carcinoma. Clin Mol Hepatol. 2015;21(1):95-103.
14. American College of Radiology. Liver reporting and data system (LI-RADS). https://www.acr.org/Clinical-Resources/Reporting-and-Data-Systems/LI-RADS. Accessed April 10, 2018.
15. Anis M. Imaging of hepatocellular carcinoma: new approaches to diagnosis. Clin Liver Dis. 2015;19(2):325-340.
16. Mitchell D, Bruix J, Sherman M, Sirlin CB. LI-RADS (Liver Imaging Reporting and Data System): summary, discussion, and consensus of the LI-RADS Management Working Group and future directions. Hepatology. 2015;61(3):1056-1065.
17. Darnell A, Forner A, Rimola J, et al. Liver imaging reporting and data system with MR imaging: evaluation in nodules 20 mm or smaller detected in cirrhosis at screening US. Radiology. 2015; 275(3):698-707.
18. Davenport MS, Khalatbari S, Liu PS, et al. Repeatability of diagnostic features and scoring systems for hepatocellular carcinoma by using MR imaging. Radiology. 2014;272(1):132-142.
19. An C, Rakhmonova G, Choi JY, Kim MJ. Liver imaging reporting and data system (LI-RADS) version 2014: understanding and application of the diagnostic algorithm. Clin Mol Hepatol. 2016;22(2):296-307.
20. Zhao W, Li W, Yi X, et al. [Diagnostic value of liver imaging reporting and data system on primary hepatocellular carcinoma] [in Chinese]. Zhong Nan Da Xue Xue Bao Yi Xue Ban. 2016;41(4):380-387.
21. Choi SH, Byun JH, Kim SY, et al. Liver imaging reporting and data system v2014 with gadoxetate disodium-enhanced magnetic resonance imaging: validation of LIRADS category 4 and 5 criteria. Invest Radiol. 2016;51(8):483-490.
22. Zhang YD, Zhu FP, Xu X, et al. Liver imaging reporting and data system: substantial discordance between CT and MR for imaging classification of hepatic nodules. Acad Radiol. 2016;23(3):344-352.
23. Corwin MT, Fananapazir G, Jin M, Lamba R, Bashir MR. Difference in liver imaging and reporting data system categorization between MRI and CT. Am J Roentgenol. 2016;206(2):307-312.
Improving Hand Hygiene Adherence in Healthcare Workers Before Patient Contact: A Multimodal Intervention in Four Tertiary Care Hospitals in Japan
In the era of multidrug resistant organisms spreading to healthcare facilities, as well as in the community, prevention of healthcare-associated infections (HAIs) has become one of the most important issues in the world. HAIs impact morbidity and mortality of patients, increase healthcare costs,1,2 and are associated with a longer length of stay in the hospital.3,4 In Japan, HAIs are a salient problem; more than 9% of patients admitted to the intensive care unit (ICU) developed an infection during their ICU stay,5 and the numbers of multidrug resistant organism isolates causing HAIs have been increasing annually.6
Hand hygiene is the most important strategy for preventing the spread of MDROs and reducing HAIs.7 Heightened attention to hand hygiene has occurred because of the recent global outbreak of coronavirus disease 2019 (COVID-19), which first appeared in Wuhan, China.8 Because no proven antiviral or vaccine is currently available for the disease, hand hygiene, appropriate cough etiquette, and physical distancing, including school closures, are the only way to prevent spread of the illness.9,10 The virus appears to be highly contagious and spread by droplet or contact routes. The spread of COVID-19 in healthcare facilities has been significant,11 and it could be a source of further spread of the disease in the community.
Unfortunately, hand hygiene adherence remains low in most settings.12 The World Health Organization (WHO) created a strategy to improve hand hygiene adherence,13 which has been implemented in many countries.14 This strategy consists of five key components: (1) system change, (2) training/education, (3) evaluation and feedback, (4) reminders in the workplace, and (5) institutional safety climate.13 Implementing a multimodal intervention including these five elements has increased hand hygiene adherence among healthcare workers (HCWs) and appears to reduce HAIs in different locations.15-17 Improving hand hygiene practice among HCWs is considered one of the most important ways to decrease the incidence of HAIs.15,18,19
There are two types of practice for hand hygiene: either hand washing with soap and water or using alcohol-based hand rub (AHR). The former requires water, soap, a sink, and paper towels, whereas the latter requires only hand rub, which is easy to use and requires one-third the length of time as the former.20 Therefore, AHR is strongly recommended, especially in acute and intensive care settings in hospitals, which require urgent care of patients. Importantly, previous studies demonstrated that greater use of AHR resulted in significant reductions in HAIs.7,14
In Japan, the data related to hand hygiene adherence is limited. Previous studies at four hospitals in different regions of Japan demonstrated that hand hygiene rates were suboptimal21 and lower than reported adherence rates from other international studies.14 One study at three hospitals showed rates could be improved by a multimodal intervention tailored by each institution.22 A 5-year follow-up study demonstrated the sustainability of the multimodal intervention23; however, hand hygiene adherence rates remained low at approximately 32%.
We hypothesized that perhaps focusing attention on just one single region (or prefecture) could boost hand hygiene rates. Niigata prefecture is located 200 miles north of Tokyo and is the largest prefecture facing the Japan Sea. There are five major tertiary hospitals in Niigata, and they communicate frequently and discuss infection control issues as a group. To investigate hand hygiene adherence before touching patients, and to evaluate the improvement of hand hygiene adherence induced by a multimodal intervention, we performed a pre- and postintervention study among HCWs at four of these tertiary care hospitals in Niigata.
METHODS
Participating hospitals
Four tertiary care hospitals in Niigata, Japan, volunteered to participate in the study. The characteristics of the four participating hospitals are summarized in Table 1. All hospitals are public or community based. Hospital A included two units, consisting of a cardiovascular-cerebral ICU and an emergency department (ED), and Hospitals B, C, and D included various units containing surgical or medical wards, an ICU, or an ED. All four hospitals have at least one designated infection-prevention nurse and an infection-prevention department. In addition, there is an infection control network system among the hospitals, and they communicate well to update the information related to local, domestic, or global infectious diseases through regular seminars and by distributing and exchanging electronic communication.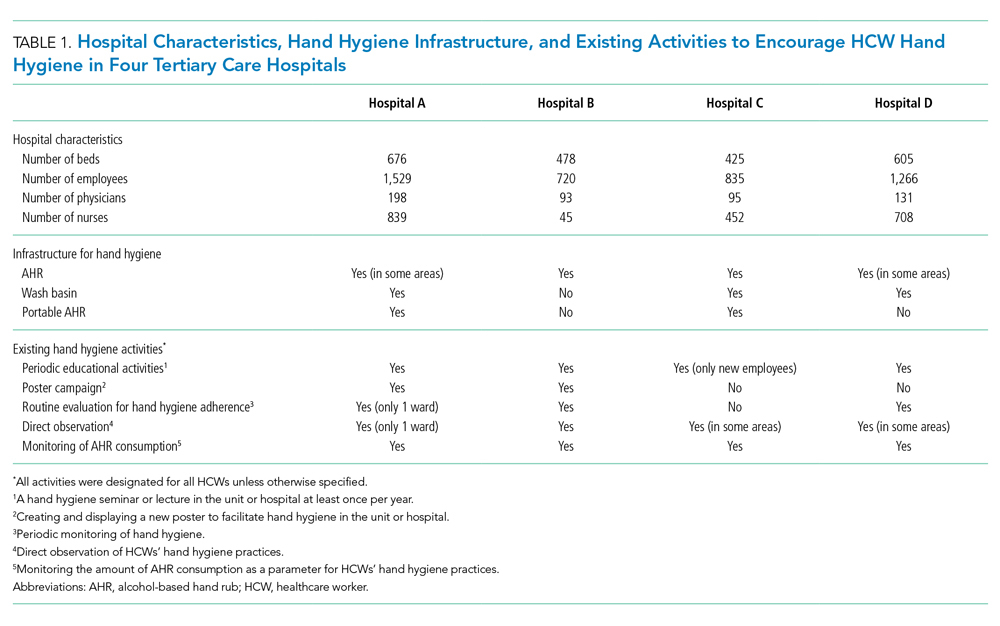
Preintervention
The preintervention infrastructure and existing activities to improve HCW hand hygiene in each hospital are summarized in Table 1. These activities were developed by each individual hospital and had been in place for at least 6 months before the study intervention. All hospitals used AHR and did direct observation for hand washing in designated wards or units and monitoring of AHR consumption; however, Hospital B did not have a wash basin in each room and no use of portable AHR. Preintervention hand hygiene data were collected from June to August 2018.
Intervention
To improve hand hygiene adherence, we initiated a multimodal intervention from September 2018 to February 2019 based on WHO recommendations13 and the findings from prior hand hygiene studies.22 Each facility was provided the same guidance on how to improve hand hygiene adherence and was asked to tailor their intervention to their settings (Table 2 and Appendix Figure). Suggested interventions included feedback regarding hand hygiene adherence observed during the preintervention period, interventions related to AHR, direct observation of and feedback regarding hand hygiene, new posters promoting hand hygiene in the workplace, a 1-month campaign for hand hygiene, seminars for HCWs related to hand hygiene, creation of a handbook for education/training, feedback regarding hand hygiene adherence during the intervention period, and others. The infection control team at each hospital designed the plans and strategies to improve hand hygiene adherence. Postintervention data were collected from February 2019 to March 2019.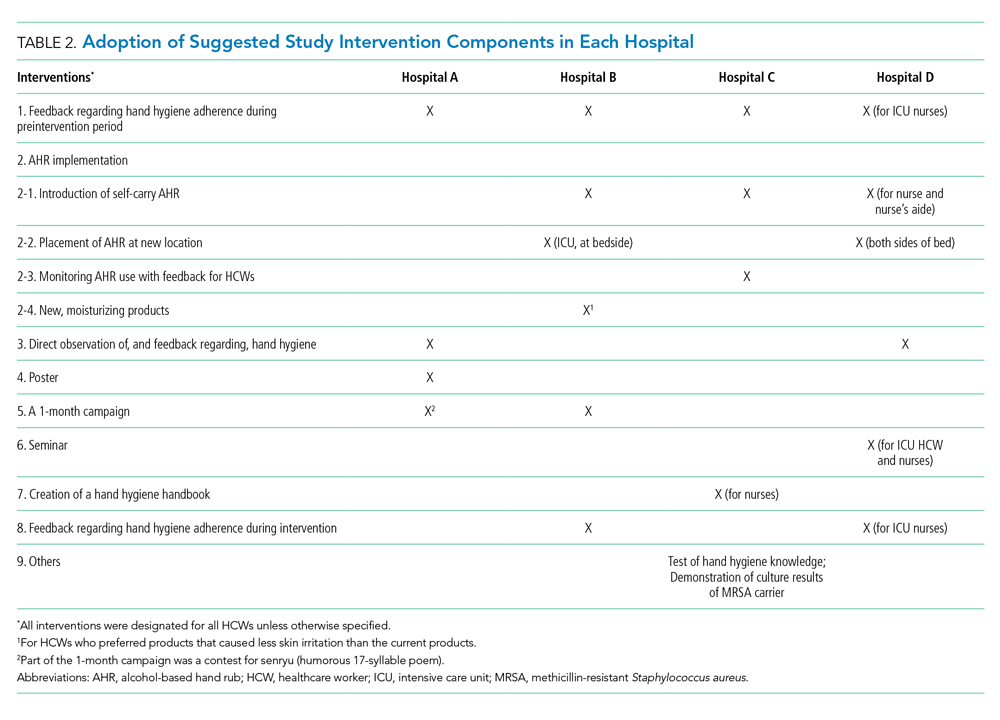
Observation of Hand Hygiene Adherence
Hand hygiene adherence before patient contact was evaluated by board-certified infection control nurses. To reduce observation bias, external nurses from other participating hospitals conducted the observations. To minimize intraobserver variation, the same training as the previous study in Japan21 was provided. Hand hygiene observations were usually performed during the day Monday to Friday from 8
Use of either AHR or soap and water before patient contact was defined as appropriate hand hygiene.24,25 Hand hygiene adherence before patient contact for each provider-patient encounter was observed and recorded using a data collection form used in the previous studies.19,26 The following information was obtained: unit name, time of initiation and completion of observations, HCW type (physician or nurse), and the type of hand hygiene (ie, AHR, hand washing with soap and water, or none). The observers kept an appropriate distance from the observed HCWs to avoid interfering with their regular clinical practice. In addition, we informed HCWs in the hospital that their clinical practices were going to be observed; however, they were not informed their hand hygiene adherence was going to be monitored.
Statistical Analysis
Overall hand hygiene adherence rates from the pre- and postintervention periods were compared based on hospitals and HCW subgroups. The Pearson’s chi-square test was used for the comparison of hand hygiene adherence rates between pre- and postintervention periods, and 95% CIs were estimated using binomial distribution. Poisson regression was used to look at changes in hand hygiene adherence with adjustment for HCW type. A two-tailed P value of <.05 was considered statistically significant. The study protocol was reviewed and approved by the ethics committees at all participating hospitals.
RESULTS
Overall Changes
In total, there were 2,018 and 1,630 observations of hand hygiene during the preintervention and postintervention periods, respectively. Most observations were of nurses: 1,643 of the 2,018 preintervention observations (81.4%) and 1,245 of the 1,630 postintervention observations (76.4%).
Findings from the HCW observations are summarized in Figure A. The overall postintervention hand hygiene adherence rate (548 of 1,630 observations; 33.6%; 95% CI, 31.3%-35.9%) was significantly higher than the preintervention rate (453 of 2,018 observations; 22.4%; 95% CI, 20.6%-24.3%; P < .001). This finding persisted after adjustment for the type of HCW (nurse vs physician), with proper hand hygiene adherence occurring 1.55 times more often after the intervention than before (95% CI, 1.37-1.76; P < .001). The overall improvement in hand hygiene adherence rates in the postintervention period was seen in all four hospitals (Figure B). However, the hand hygiene adherence rates of nurses in Hospitals C and D were lower than those in Hospitals A and B both before and after the intervention.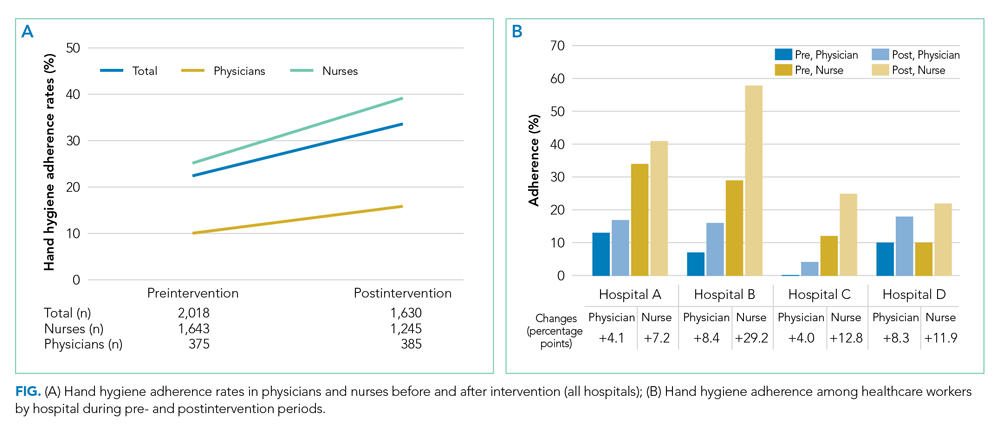
Use of AHR was the dominant appropriate hand hygiene practice vs hand washing with soap and water. Of those that practiced appropriate hand hygiene, the rate of AHR use was high and unchanged between preintervention (424 of 453; 93.6%) and postintervention periods (513 of 548; 93.6%; P = .99).
Changes by HCW Type
The rates of hand hygiene adherence in both physicians and nurses were higher in the postintervention period than in the preintervention period. However, the improvement of hand hygiene adherence among nurses—from 415 of 1,643 (25.2%) to 487 of 1,245 (39.1%) for an increase of 13.9 percentage points (95% CI,10.4-17.3)—was greater than that in physicians—from 38 of 375 (10.1%) to 61 of 385 (15.8%) for an increase of 5.7 percentage points (95% CI, 1.0-8.1; P < .001; Figure B). In general, nurse hand hygiene adherence was higher than that in physicians both in the preintervention period, with nurses at 25.2% (95% CI, 23.2%-27.4%) vs physicians at 10.1% (95% CI, 7.1%-13.2%; P < .001), and in the postintervention period, with nurses at 39.1% (95% CI, 36.4%-41.8%) vs physicians at 15.8% (95% CI, 12.2%-19.5%; P < .001).
Changes by Hospital
Overall, improvement of hand hygiene adherence was observed in all hospitals. However, the improvement rates differed in each hospital: They were 6.5 percentage points in Hospital A, 11.3 percentage points in Hospital C, 11.4 percentage points in Hospital D, and 18.4 percentage points in Hospital B. Hospital B achieved the highest postintervention adherence rates (42.6%), along with the highest improvement. The improvements of hand hygiene adherence in physicians were higher in Hospitals B (8.4 percentage points) and D (8.3 percentage points) than they were in Hospitals A (4.1 percentage points) and C (4.0 percentage points).
Interventions performed at each hospital to improve hand hygiene adherence are summarized in Table 2 and the Appendix Figure. All hospitals performed feedback of hand hygiene adherence after the preintervention period. Interventions related to AHR were frequently initiated; self-carry AHR was provided in two hospitals (Hospitals C and D), and location of AHR was moved (Hospitals B and D). In addition, new AHR products that caused less skin irritation were introduced in Hospital B. Direct observation by hospital staff (separate from our study observers) was also done as part of Hospital A and D’s improvement efforts. Other interventions included a 1-month campaign for hand hygiene including a contest for senryu (humorous 17-syllable poems; Table 2; Appendix Table), posters, seminars, and creation of a handbook related to hand hygiene. Posters emphasizing the importance of hand hygiene created by the local hospital infection control teams were put on the wall in several locations near wash basins. Seminars (1-hour lectures to emphasize the importance of hand hygiene) were provided to nurses. A 10-page hand hygiene handbook was created by one local infection control team and provided to nurses.
DISCUSSION
Our study demonstrated that the overall rate of hand hygiene adherence improved from 22.4% to 33.6% after multimodal intervention; however, the adherence rates even after intervention were suboptimal. The results were comparable with those of a previous study in Japan,22 which underscores how suboptimal HCW hand hygiene in Japan threatens patient safety. Hand hygiene among HCWs is one of the most important methods to prevent HAIs and to reduce spread of multidrug resistant organisms. High adherence has proven challenging because it requires behavior modification. We implemented WHO hand hygiene adherence strategies27 and evaluated the efficacy of a multimodal intervention in hopes of finding the specific factors that could be related to behavior modification for HCWs.
We observed several important relationships between the intervention components and their improvement in hand hygiene adherence. Among the four participating hospitals, Hospital B was the most successful with improvement of hand hygiene adherence from 24.2% to 42.6%. One unique intervention for Hospital B was the introduction of new AHR products for the people who had felt uncomfortable with current products. Frequent hand washing or the use of certain AHR products could irritate skin causing dry or rough hands, which could reduce hand hygiene practices. In Japan, there are several AHR products available. Among them, a few products contain skin moisturizing elements; these products are 10%-20% higher in cost than nonmoisturizing products. The HCWs in our study stated that the new products were more comfortable to use, and they requested to introduce them as daily use products. Thus, use of a product containing a hand moisturizer may reduce some factors negatively affecting hand hygiene practice and improve adherence rates.
Although this study was unable to determine which components are definitively associated with improving hand hygiene adherence, the findings suggest initiation of multiple intervention components simultaneously may provide more motivation for change than initiating only one or two components at a time. It is also possible that certain intervention components were more beneficial than others. Consistent with a previous study, improving hand hygiene adherence cannot be simply achieved by improving infrastructure (eg, introducing portable AHR) alone, but rather depends on altering the behavior of physicians and nurses.
This study was performed at four tertiary care hospitals in Niigata that are affiliated with Niigata University. They are located closely in the region, within 100 km, have quarterly conferences, and use a mutual monitoring system related to infection prevention. The members of infection control communicate regularly, which we thought would optimize improvements in hand hygiene adherence, compared with the circumstances of previous studies. In this setting, HCWs have similar education and share knowledge related to infection control, and the effects of interventions in each hospital were equally evaluated if similar interventions were implemented. In the current study, the interventions at each hospital were similar, and there was limited variety; therefore, specific, novel interventions that could affect hand hygiene adherence significantly were difficult to find.
There are a few possible reasons why hand hygiene adherence rates were low in the current study. First, part of this study was conducted during the summer so that the consciousness and caution for hand hygiene might be lower, compared with that in winter. In general, HCWs become more cautious for hand hygiene practice when they take care of patients diagnosed with influenza or respiratory syncytial virus infection. Second, the infrastructure for hand hygiene practice in the hospitals in Japan is inadequate and not well designed. Because of safety reasons, a single dispenser of AHR is placed at the entrance of each room in general and not at each bedside. The number of private rooms is limited, and most of the rooms in wards have multiple beds per room, with no access to AHR within the room. In fact, the interventions at all four hospitals included a change in the location and/or access of AHR. Easier access to AHR is likely a key step to improving hand hygiene adherence rates. Finally, there was not an active intervention to include hospital or unit leaders. This is important given the involvement of leaders in hand hygiene practice significantly changed the hand adherence rates in a previous study.19
Given the suboptimal hand hygiene adherence rates in Japan noted in this and previous Japanese studies,21,22 the spread of COVID-19 within the hospital setting is a concern. Transmission of COVID-19 by asymptomatic carriers has been suggested,11 which emphasizes the importance of regular standard precautions with good hand hygiene practice to prevent further transmission.
Although the hand hygiene rate was suboptimal, we were able to achieve a few sustainable, structural modifications in the clinical environment after the intervention. These include adding AHR in new locations, changing the location of existing AHR to more appropriate locations, and introducing new products. These will remain in the clinical environment and will contribute to hand hygiene adherence in the future.
This study has several limitations. First, the presence of external observers in their clinical settings might have affected the behavior of HCWs.28 Although they were not informed that their hand hygiene adherence was going to be monitored, the existence of an external observer in their clinical setting might have changed normal behavior. Second, the infrastructure and interventions for hand hygiene adherence before the intervention were different in each hospital, so there is a possibility that hospitals with less infrastructure for hand hygiene adherence had more room for improvement with the interventions. Third, we included observations at different units at each hospital, which might affect the results of the study because of the inclusion of different medical settings and HCWs. Fourth, the number of physician hand hygiene observations was limited: We conducted our observations between 8
In conclusion, a multimodal intervention to improve hand hygiene adherence successfully improved HCWs’ hand hygiene adherence in Niigata, Japan; however, the adherence rates are still relatively low compared with those reported from other countries. Further intervention is required to improve hand hygiene adherence.
1. Zimlichman E, Henderson D, Tamir O, et al. Health care-associated infections: a meta-analysis of costs and financial impact on the US health care system. JAMA Intern Med. 2013;173(22):2039-2046. https://doi.org/10.1001/jamainternmed.2013.9763.
2. Cassini A, Plachouras D, Eckmanns T, et al. Burden of six healthcare-associated infections on European population health: estimating incidence-based disability-adjusted life years through a population prevalence-based modelling study. PLoS Med. 2016;13(10):e1002150. https://doi.org/10.1371/journal.pmed.1002150.
3. Vrijens F, Hulstaert F, Van de Sande S, Devriese S, Morales I, Parmentier Y. Hospital-acquired, laboratory-confirmed bloodstream infections: linking national surveillance data to clinical and financial hospital data to estimate increased length of stay and healthcare costs. J Hosp Infect. 2010;75(3):158-162. https://doi.org/10.1016/j.jhin.2009.12.006.
4. de Lissovoy G, Fraeman K, Hutchins V, Murphy D, Song D, Vaughn BB. Surgical site infection: incidence and impact on hospital utilization and treatment costs. Am J Infect Control. 2009;37(5):387-397. https://doi.org/10.1016/j.ajic.2008.12.010.
5. Suka M, Yoshida K, Takezawa J. Epidemiological approach to nosocomial infection surveillance data: the Japanese Nosocomial Infection Surveillance System. Environ Health Prev Med. 2008;13(1):30-35. https:// doi.org/10.1007/s12199-007-0004-y.
6. Japan Nosocomial Infection Surveillance. JANIS Open Report. 2018. https://janis.mhlw.go.jp/english/report/open_report/2018/3/1/ken_Open_Report_Eng_201800_clsi2012.pdf. Accessed April 2, 2020.
7. Allegranzi B, Pittet D. Role of hand hygiene in healthcare-associated infection prevention. J Hosp Infect. 2009;73(4):305-315. https://doi.org/10.1016/j.jhin.2009.04.019.
8. Zhu N, Zhang D, Wang W, et al. A novel coronavirus from patients with pneumonia in China, 2019. N Engl J Med. 2020;382(8):727-733. https://doi.org/10.1056/NEJMoa2001017.
9. World Health Organization. Coronavirus disease (COVID-19) advice for the public. 2020. https://www.who.int/emergencies/diseases/novel-coronavirus-2019/advice-for-public. Accessed February 28, 2020.
10. Centers for Disease Control and Prevention. Interim Guidance for Preventing the Spread of Coronavirus Disease 2019 (COVID-19) in Homes and Residential Communities. 2020. https://www.cdc.gov/coronavirus/2019-ncov/hcp/guidance-prevent-spread.html. Accessed February 28, 2020.
11. Bai Y, Yao L, Wei T, et al. Presumed asymptomatic carrier transmission of COVID-19. JAMA. 2020;323(14):1406-1407. https://doi.org/10.1001/jama.2020.2565.
12. Burke JP. Infection control - a problem for patient safety. N Engl J Med. 2003;348(7):651-656. https://doi.org/10.1056/NEJMhpr020557.
13. World Health Organization. A Guide to the Implementation of the WHO Multimodal Hand Hygiene Improvement Strategy. 2013. https://www.who.int/gpsc/5may/Guide_to_Implementation.pdf. Accessed February 28, 2020.
14. Allegranzi B, Gayet-Ageron A, Damani N, et al. Global implementation of WHO’s multimodal strategy for improvement of hand hygiene: a quasi-experimental study. Lancet Infect Dis. 2013;13(10):843-851. https://doi.org/10.1016/S1473-3099(13)70163-4.
15. Pittet D, Hugonnet S, Harbarth S, et al. Effectiveness of a hospital-wide programme to improve compliance with hand hygiene. Infection Control Programme. Lancet. 2000;356(9238):1307-1312. https://doi.org/10.1016/s0140-6736(00)02814-2.
16. Rosenthal VD, Pawar M, Leblebicioglu H, et al. Impact of the International Nosocomial Infection Control Consortium (INICC) multidimensional hand hygiene approach over 13 years in 51 cities of 19 limited-resource countries from Latin America, Asia, the Middle East, and Europe. Infect Control Hosp Epidemiol. 2013;34(4):415-423. https://doi.org/10.1086/669860.
17. Pincock T, Bernstein P, Warthman S, Holst E. Bundling hand hygiene interventions and measurement to decrease health care-associated infections. Am J Infect Control. 2012;40(4 Suppl 1):S18-S27. https://doi.org/10.1016/j.ajic.2012.02.008.
18. Larson EL. APIC guideline for handwashing and hand antisepsis in health care settings. Am J Infect Control. 1995;23(4):251-269. https://doi.org/10.1016/0196-6553(95)90070-5.
19. Saint S, Conti A, Bartoloni A, et al. Improving healthcare worker hand hygiene adherence before patient contact: a before-and-after five-unit multimodal intervention in Tuscany. Qual Saf Health Care. 2009;18(6):429-433. https://doi.org/10.1136/qshc.2009.032771.
20. Bolon MK. Hand hygiene: an update. Infect Dis Clin North Am. 2016;30(3):591-607. https://doi.org/10.1016/j.idc.2016.04.007.
21. Sakihama T, Honda H, Saint S, et al. Hand hygiene adherence among health care workers at Japanese hospitals: a multicenter observational study in Japan. J Patient Saf. 2016;12(1):11-17. https://doi.org/10.1097/PTS.0000000000000108.
22. Sakihama T, Honda H, Saint S, et al. Improving healthcare worker hand hygiene adherence before patient contact: a multimodal intervention of hand hygiene practice in three Japanese tertiary care centers. J Hosp Med. 2016;11(3):199-205. https://doi.org/10.1002/jhm.2491.
23. Sakihama T, Kayauchi N, Kamiya T, et al. Assessing sustainability of hand hygiene adherence 5 years after a contest-based intervention in 3 Japanese hospitals. Am J Infect Control. 2020;48(1):77-81. https://doi.org/10.1016/j.ajic.2019.06.017.
24. World Health Organization. My 5 Moments for Hand Hygiene. https://www.who.int/infection-prevention/campaigns/clean-hands/5moments/en/. Accessed April 2, 2020.
25. World Health Organization. WHO Guidelines on Hand Hygiene in Health Care. 2009. https://www.who.int/gpsc/5may/tools/9789241597906/en/. Accessed February 28, 2020.
26. Saint S, Bartoloni A, Virgili G, et al. Marked variability in adherence to hand hygiene: a 5-unit observational study in Tuscany. Am J Infect Control. 2009;37(4):306-310. https://doi.org/10.1016/j.ajic.2008.08.004.
27. World Health Organization. WHO Guidelines on Hand Hygiene in Health Care: First Global Patient Safety Challenge Clean Care Is Safer Care. Geneva: World Health Organization; 2009. https://www.ncbi.nlm.nih.gov/books/NBK144013/pdf/Bookshelf_NBK144013.pdf. Accessed February 28, 2020.
28. Pan SC, Tien KL, Hung IC, et al. Compliance of health care workers with hand hygiene practices: independent advantages of overt and covert observers. PLoS One. 2013;8(1):e53746. https://doi.org/10.1371/journal.pone.0053746.
In the era of multidrug resistant organisms spreading to healthcare facilities, as well as in the community, prevention of healthcare-associated infections (HAIs) has become one of the most important issues in the world. HAIs impact morbidity and mortality of patients, increase healthcare costs,1,2 and are associated with a longer length of stay in the hospital.3,4 In Japan, HAIs are a salient problem; more than 9% of patients admitted to the intensive care unit (ICU) developed an infection during their ICU stay,5 and the numbers of multidrug resistant organism isolates causing HAIs have been increasing annually.6
Hand hygiene is the most important strategy for preventing the spread of MDROs and reducing HAIs.7 Heightened attention to hand hygiene has occurred because of the recent global outbreak of coronavirus disease 2019 (COVID-19), which first appeared in Wuhan, China.8 Because no proven antiviral or vaccine is currently available for the disease, hand hygiene, appropriate cough etiquette, and physical distancing, including school closures, are the only way to prevent spread of the illness.9,10 The virus appears to be highly contagious and spread by droplet or contact routes. The spread of COVID-19 in healthcare facilities has been significant,11 and it could be a source of further spread of the disease in the community.
Unfortunately, hand hygiene adherence remains low in most settings.12 The World Health Organization (WHO) created a strategy to improve hand hygiene adherence,13 which has been implemented in many countries.14 This strategy consists of five key components: (1) system change, (2) training/education, (3) evaluation and feedback, (4) reminders in the workplace, and (5) institutional safety climate.13 Implementing a multimodal intervention including these five elements has increased hand hygiene adherence among healthcare workers (HCWs) and appears to reduce HAIs in different locations.15-17 Improving hand hygiene practice among HCWs is considered one of the most important ways to decrease the incidence of HAIs.15,18,19
There are two types of practice for hand hygiene: either hand washing with soap and water or using alcohol-based hand rub (AHR). The former requires water, soap, a sink, and paper towels, whereas the latter requires only hand rub, which is easy to use and requires one-third the length of time as the former.20 Therefore, AHR is strongly recommended, especially in acute and intensive care settings in hospitals, which require urgent care of patients. Importantly, previous studies demonstrated that greater use of AHR resulted in significant reductions in HAIs.7,14
In Japan, the data related to hand hygiene adherence is limited. Previous studies at four hospitals in different regions of Japan demonstrated that hand hygiene rates were suboptimal21 and lower than reported adherence rates from other international studies.14 One study at three hospitals showed rates could be improved by a multimodal intervention tailored by each institution.22 A 5-year follow-up study demonstrated the sustainability of the multimodal intervention23; however, hand hygiene adherence rates remained low at approximately 32%.
We hypothesized that perhaps focusing attention on just one single region (or prefecture) could boost hand hygiene rates. Niigata prefecture is located 200 miles north of Tokyo and is the largest prefecture facing the Japan Sea. There are five major tertiary hospitals in Niigata, and they communicate frequently and discuss infection control issues as a group. To investigate hand hygiene adherence before touching patients, and to evaluate the improvement of hand hygiene adherence induced by a multimodal intervention, we performed a pre- and postintervention study among HCWs at four of these tertiary care hospitals in Niigata.
METHODS
Participating hospitals
Four tertiary care hospitals in Niigata, Japan, volunteered to participate in the study. The characteristics of the four participating hospitals are summarized in Table 1. All hospitals are public or community based. Hospital A included two units, consisting of a cardiovascular-cerebral ICU and an emergency department (ED), and Hospitals B, C, and D included various units containing surgical or medical wards, an ICU, or an ED. All four hospitals have at least one designated infection-prevention nurse and an infection-prevention department. In addition, there is an infection control network system among the hospitals, and they communicate well to update the information related to local, domestic, or global infectious diseases through regular seminars and by distributing and exchanging electronic communication.
Preintervention
The preintervention infrastructure and existing activities to improve HCW hand hygiene in each hospital are summarized in Table 1. These activities were developed by each individual hospital and had been in place for at least 6 months before the study intervention. All hospitals used AHR and did direct observation for hand washing in designated wards or units and monitoring of AHR consumption; however, Hospital B did not have a wash basin in each room and no use of portable AHR. Preintervention hand hygiene data were collected from June to August 2018.
Intervention
To improve hand hygiene adherence, we initiated a multimodal intervention from September 2018 to February 2019 based on WHO recommendations13 and the findings from prior hand hygiene studies.22 Each facility was provided the same guidance on how to improve hand hygiene adherence and was asked to tailor their intervention to their settings (Table 2 and Appendix Figure). Suggested interventions included feedback regarding hand hygiene adherence observed during the preintervention period, interventions related to AHR, direct observation of and feedback regarding hand hygiene, new posters promoting hand hygiene in the workplace, a 1-month campaign for hand hygiene, seminars for HCWs related to hand hygiene, creation of a handbook for education/training, feedback regarding hand hygiene adherence during the intervention period, and others. The infection control team at each hospital designed the plans and strategies to improve hand hygiene adherence. Postintervention data were collected from February 2019 to March 2019.
Observation of Hand Hygiene Adherence
Hand hygiene adherence before patient contact was evaluated by board-certified infection control nurses. To reduce observation bias, external nurses from other participating hospitals conducted the observations. To minimize intraobserver variation, the same training as the previous study in Japan21 was provided. Hand hygiene observations were usually performed during the day Monday to Friday from 8
Use of either AHR or soap and water before patient contact was defined as appropriate hand hygiene.24,25 Hand hygiene adherence before patient contact for each provider-patient encounter was observed and recorded using a data collection form used in the previous studies.19,26 The following information was obtained: unit name, time of initiation and completion of observations, HCW type (physician or nurse), and the type of hand hygiene (ie, AHR, hand washing with soap and water, or none). The observers kept an appropriate distance from the observed HCWs to avoid interfering with their regular clinical practice. In addition, we informed HCWs in the hospital that their clinical practices were going to be observed; however, they were not informed their hand hygiene adherence was going to be monitored.
Statistical Analysis
Overall hand hygiene adherence rates from the pre- and postintervention periods were compared based on hospitals and HCW subgroups. The Pearson’s chi-square test was used for the comparison of hand hygiene adherence rates between pre- and postintervention periods, and 95% CIs were estimated using binomial distribution. Poisson regression was used to look at changes in hand hygiene adherence with adjustment for HCW type. A two-tailed P value of <.05 was considered statistically significant. The study protocol was reviewed and approved by the ethics committees at all participating hospitals.
RESULTS
Overall Changes
In total, there were 2,018 and 1,630 observations of hand hygiene during the preintervention and postintervention periods, respectively. Most observations were of nurses: 1,643 of the 2,018 preintervention observations (81.4%) and 1,245 of the 1,630 postintervention observations (76.4%).
Findings from the HCW observations are summarized in Figure A. The overall postintervention hand hygiene adherence rate (548 of 1,630 observations; 33.6%; 95% CI, 31.3%-35.9%) was significantly higher than the preintervention rate (453 of 2,018 observations; 22.4%; 95% CI, 20.6%-24.3%; P < .001). This finding persisted after adjustment for the type of HCW (nurse vs physician), with proper hand hygiene adherence occurring 1.55 times more often after the intervention than before (95% CI, 1.37-1.76; P < .001). The overall improvement in hand hygiene adherence rates in the postintervention period was seen in all four hospitals (Figure B). However, the hand hygiene adherence rates of nurses in Hospitals C and D were lower than those in Hospitals A and B both before and after the intervention.
Use of AHR was the dominant appropriate hand hygiene practice vs hand washing with soap and water. Of those that practiced appropriate hand hygiene, the rate of AHR use was high and unchanged between preintervention (424 of 453; 93.6%) and postintervention periods (513 of 548; 93.6%; P = .99).
Changes by HCW Type
The rates of hand hygiene adherence in both physicians and nurses were higher in the postintervention period than in the preintervention period. However, the improvement of hand hygiene adherence among nurses—from 415 of 1,643 (25.2%) to 487 of 1,245 (39.1%) for an increase of 13.9 percentage points (95% CI,10.4-17.3)—was greater than that in physicians—from 38 of 375 (10.1%) to 61 of 385 (15.8%) for an increase of 5.7 percentage points (95% CI, 1.0-8.1; P < .001; Figure B). In general, nurse hand hygiene adherence was higher than that in physicians both in the preintervention period, with nurses at 25.2% (95% CI, 23.2%-27.4%) vs physicians at 10.1% (95% CI, 7.1%-13.2%; P < .001), and in the postintervention period, with nurses at 39.1% (95% CI, 36.4%-41.8%) vs physicians at 15.8% (95% CI, 12.2%-19.5%; P < .001).
Changes by Hospital
Overall, improvement of hand hygiene adherence was observed in all hospitals. However, the improvement rates differed in each hospital: They were 6.5 percentage points in Hospital A, 11.3 percentage points in Hospital C, 11.4 percentage points in Hospital D, and 18.4 percentage points in Hospital B. Hospital B achieved the highest postintervention adherence rates (42.6%), along with the highest improvement. The improvements of hand hygiene adherence in physicians were higher in Hospitals B (8.4 percentage points) and D (8.3 percentage points) than they were in Hospitals A (4.1 percentage points) and C (4.0 percentage points).
Interventions performed at each hospital to improve hand hygiene adherence are summarized in Table 2 and the Appendix Figure. All hospitals performed feedback of hand hygiene adherence after the preintervention period. Interventions related to AHR were frequently initiated; self-carry AHR was provided in two hospitals (Hospitals C and D), and location of AHR was moved (Hospitals B and D). In addition, new AHR products that caused less skin irritation were introduced in Hospital B. Direct observation by hospital staff (separate from our study observers) was also done as part of Hospital A and D’s improvement efforts. Other interventions included a 1-month campaign for hand hygiene including a contest for senryu (humorous 17-syllable poems; Table 2; Appendix Table), posters, seminars, and creation of a handbook related to hand hygiene. Posters emphasizing the importance of hand hygiene created by the local hospital infection control teams were put on the wall in several locations near wash basins. Seminars (1-hour lectures to emphasize the importance of hand hygiene) were provided to nurses. A 10-page hand hygiene handbook was created by one local infection control team and provided to nurses.
DISCUSSION
Our study demonstrated that the overall rate of hand hygiene adherence improved from 22.4% to 33.6% after multimodal intervention; however, the adherence rates even after intervention were suboptimal. The results were comparable with those of a previous study in Japan,22 which underscores how suboptimal HCW hand hygiene in Japan threatens patient safety. Hand hygiene among HCWs is one of the most important methods to prevent HAIs and to reduce spread of multidrug resistant organisms. High adherence has proven challenging because it requires behavior modification. We implemented WHO hand hygiene adherence strategies27 and evaluated the efficacy of a multimodal intervention in hopes of finding the specific factors that could be related to behavior modification for HCWs.
We observed several important relationships between the intervention components and their improvement in hand hygiene adherence. Among the four participating hospitals, Hospital B was the most successful with improvement of hand hygiene adherence from 24.2% to 42.6%. One unique intervention for Hospital B was the introduction of new AHR products for the people who had felt uncomfortable with current products. Frequent hand washing or the use of certain AHR products could irritate skin causing dry or rough hands, which could reduce hand hygiene practices. In Japan, there are several AHR products available. Among them, a few products contain skin moisturizing elements; these products are 10%-20% higher in cost than nonmoisturizing products. The HCWs in our study stated that the new products were more comfortable to use, and they requested to introduce them as daily use products. Thus, use of a product containing a hand moisturizer may reduce some factors negatively affecting hand hygiene practice and improve adherence rates.
Although this study was unable to determine which components are definitively associated with improving hand hygiene adherence, the findings suggest initiation of multiple intervention components simultaneously may provide more motivation for change than initiating only one or two components at a time. It is also possible that certain intervention components were more beneficial than others. Consistent with a previous study, improving hand hygiene adherence cannot be simply achieved by improving infrastructure (eg, introducing portable AHR) alone, but rather depends on altering the behavior of physicians and nurses.
This study was performed at four tertiary care hospitals in Niigata that are affiliated with Niigata University. They are located closely in the region, within 100 km, have quarterly conferences, and use a mutual monitoring system related to infection prevention. The members of infection control communicate regularly, which we thought would optimize improvements in hand hygiene adherence, compared with the circumstances of previous studies. In this setting, HCWs have similar education and share knowledge related to infection control, and the effects of interventions in each hospital were equally evaluated if similar interventions were implemented. In the current study, the interventions at each hospital were similar, and there was limited variety; therefore, specific, novel interventions that could affect hand hygiene adherence significantly were difficult to find.
There are a few possible reasons why hand hygiene adherence rates were low in the current study. First, part of this study was conducted during the summer so that the consciousness and caution for hand hygiene might be lower, compared with that in winter. In general, HCWs become more cautious for hand hygiene practice when they take care of patients diagnosed with influenza or respiratory syncytial virus infection. Second, the infrastructure for hand hygiene practice in the hospitals in Japan is inadequate and not well designed. Because of safety reasons, a single dispenser of AHR is placed at the entrance of each room in general and not at each bedside. The number of private rooms is limited, and most of the rooms in wards have multiple beds per room, with no access to AHR within the room. In fact, the interventions at all four hospitals included a change in the location and/or access of AHR. Easier access to AHR is likely a key step to improving hand hygiene adherence rates. Finally, there was not an active intervention to include hospital or unit leaders. This is important given the involvement of leaders in hand hygiene practice significantly changed the hand adherence rates in a previous study.19
Given the suboptimal hand hygiene adherence rates in Japan noted in this and previous Japanese studies,21,22 the spread of COVID-19 within the hospital setting is a concern. Transmission of COVID-19 by asymptomatic carriers has been suggested,11 which emphasizes the importance of regular standard precautions with good hand hygiene practice to prevent further transmission.
Although the hand hygiene rate was suboptimal, we were able to achieve a few sustainable, structural modifications in the clinical environment after the intervention. These include adding AHR in new locations, changing the location of existing AHR to more appropriate locations, and introducing new products. These will remain in the clinical environment and will contribute to hand hygiene adherence in the future.
This study has several limitations. First, the presence of external observers in their clinical settings might have affected the behavior of HCWs.28 Although they were not informed that their hand hygiene adherence was going to be monitored, the existence of an external observer in their clinical setting might have changed normal behavior. Second, the infrastructure and interventions for hand hygiene adherence before the intervention were different in each hospital, so there is a possibility that hospitals with less infrastructure for hand hygiene adherence had more room for improvement with the interventions. Third, we included observations at different units at each hospital, which might affect the results of the study because of the inclusion of different medical settings and HCWs. Fourth, the number of physician hand hygiene observations was limited: We conducted our observations between 8
In conclusion, a multimodal intervention to improve hand hygiene adherence successfully improved HCWs’ hand hygiene adherence in Niigata, Japan; however, the adherence rates are still relatively low compared with those reported from other countries. Further intervention is required to improve hand hygiene adherence.
1. Zimlichman E, Henderson D, Tamir O, et al. Health care-associated infections: a meta-analysis of costs and financial impact on the US health care system. JAMA Intern Med. 2013;173(22):2039-2046. https://doi.org/10.1001/jamainternmed.2013.9763.
2. Cassini A, Plachouras D, Eckmanns T, et al. Burden of six healthcare-associated infections on European population health: estimating incidence-based disability-adjusted life years through a population prevalence-based modelling study. PLoS Med. 2016;13(10):e1002150. https://doi.org/10.1371/journal.pmed.1002150.
3. Vrijens F, Hulstaert F, Van de Sande S, Devriese S, Morales I, Parmentier Y. Hospital-acquired, laboratory-confirmed bloodstream infections: linking national surveillance data to clinical and financial hospital data to estimate increased length of stay and healthcare costs. J Hosp Infect. 2010;75(3):158-162. https://doi.org/10.1016/j.jhin.2009.12.006.
4. de Lissovoy G, Fraeman K, Hutchins V, Murphy D, Song D, Vaughn BB. Surgical site infection: incidence and impact on hospital utilization and treatment costs. Am J Infect Control. 2009;37(5):387-397. https://doi.org/10.1016/j.ajic.2008.12.010.
5. Suka M, Yoshida K, Takezawa J. Epidemiological approach to nosocomial infection surveillance data: the Japanese Nosocomial Infection Surveillance System. Environ Health Prev Med. 2008;13(1):30-35. https:// doi.org/10.1007/s12199-007-0004-y.
6. Japan Nosocomial Infection Surveillance. JANIS Open Report. 2018. https://janis.mhlw.go.jp/english/report/open_report/2018/3/1/ken_Open_Report_Eng_201800_clsi2012.pdf. Accessed April 2, 2020.
7. Allegranzi B, Pittet D. Role of hand hygiene in healthcare-associated infection prevention. J Hosp Infect. 2009;73(4):305-315. https://doi.org/10.1016/j.jhin.2009.04.019.
8. Zhu N, Zhang D, Wang W, et al. A novel coronavirus from patients with pneumonia in China, 2019. N Engl J Med. 2020;382(8):727-733. https://doi.org/10.1056/NEJMoa2001017.
9. World Health Organization. Coronavirus disease (COVID-19) advice for the public. 2020. https://www.who.int/emergencies/diseases/novel-coronavirus-2019/advice-for-public. Accessed February 28, 2020.
10. Centers for Disease Control and Prevention. Interim Guidance for Preventing the Spread of Coronavirus Disease 2019 (COVID-19) in Homes and Residential Communities. 2020. https://www.cdc.gov/coronavirus/2019-ncov/hcp/guidance-prevent-spread.html. Accessed February 28, 2020.
11. Bai Y, Yao L, Wei T, et al. Presumed asymptomatic carrier transmission of COVID-19. JAMA. 2020;323(14):1406-1407. https://doi.org/10.1001/jama.2020.2565.
12. Burke JP. Infection control - a problem for patient safety. N Engl J Med. 2003;348(7):651-656. https://doi.org/10.1056/NEJMhpr020557.
13. World Health Organization. A Guide to the Implementation of the WHO Multimodal Hand Hygiene Improvement Strategy. 2013. https://www.who.int/gpsc/5may/Guide_to_Implementation.pdf. Accessed February 28, 2020.
14. Allegranzi B, Gayet-Ageron A, Damani N, et al. Global implementation of WHO’s multimodal strategy for improvement of hand hygiene: a quasi-experimental study. Lancet Infect Dis. 2013;13(10):843-851. https://doi.org/10.1016/S1473-3099(13)70163-4.
15. Pittet D, Hugonnet S, Harbarth S, et al. Effectiveness of a hospital-wide programme to improve compliance with hand hygiene. Infection Control Programme. Lancet. 2000;356(9238):1307-1312. https://doi.org/10.1016/s0140-6736(00)02814-2.
16. Rosenthal VD, Pawar M, Leblebicioglu H, et al. Impact of the International Nosocomial Infection Control Consortium (INICC) multidimensional hand hygiene approach over 13 years in 51 cities of 19 limited-resource countries from Latin America, Asia, the Middle East, and Europe. Infect Control Hosp Epidemiol. 2013;34(4):415-423. https://doi.org/10.1086/669860.
17. Pincock T, Bernstein P, Warthman S, Holst E. Bundling hand hygiene interventions and measurement to decrease health care-associated infections. Am J Infect Control. 2012;40(4 Suppl 1):S18-S27. https://doi.org/10.1016/j.ajic.2012.02.008.
18. Larson EL. APIC guideline for handwashing and hand antisepsis in health care settings. Am J Infect Control. 1995;23(4):251-269. https://doi.org/10.1016/0196-6553(95)90070-5.
19. Saint S, Conti A, Bartoloni A, et al. Improving healthcare worker hand hygiene adherence before patient contact: a before-and-after five-unit multimodal intervention in Tuscany. Qual Saf Health Care. 2009;18(6):429-433. https://doi.org/10.1136/qshc.2009.032771.
20. Bolon MK. Hand hygiene: an update. Infect Dis Clin North Am. 2016;30(3):591-607. https://doi.org/10.1016/j.idc.2016.04.007.
21. Sakihama T, Honda H, Saint S, et al. Hand hygiene adherence among health care workers at Japanese hospitals: a multicenter observational study in Japan. J Patient Saf. 2016;12(1):11-17. https://doi.org/10.1097/PTS.0000000000000108.
22. Sakihama T, Honda H, Saint S, et al. Improving healthcare worker hand hygiene adherence before patient contact: a multimodal intervention of hand hygiene practice in three Japanese tertiary care centers. J Hosp Med. 2016;11(3):199-205. https://doi.org/10.1002/jhm.2491.
23. Sakihama T, Kayauchi N, Kamiya T, et al. Assessing sustainability of hand hygiene adherence 5 years after a contest-based intervention in 3 Japanese hospitals. Am J Infect Control. 2020;48(1):77-81. https://doi.org/10.1016/j.ajic.2019.06.017.
24. World Health Organization. My 5 Moments for Hand Hygiene. https://www.who.int/infection-prevention/campaigns/clean-hands/5moments/en/. Accessed April 2, 2020.
25. World Health Organization. WHO Guidelines on Hand Hygiene in Health Care. 2009. https://www.who.int/gpsc/5may/tools/9789241597906/en/. Accessed February 28, 2020.
26. Saint S, Bartoloni A, Virgili G, et al. Marked variability in adherence to hand hygiene: a 5-unit observational study in Tuscany. Am J Infect Control. 2009;37(4):306-310. https://doi.org/10.1016/j.ajic.2008.08.004.
27. World Health Organization. WHO Guidelines on Hand Hygiene in Health Care: First Global Patient Safety Challenge Clean Care Is Safer Care. Geneva: World Health Organization; 2009. https://www.ncbi.nlm.nih.gov/books/NBK144013/pdf/Bookshelf_NBK144013.pdf. Accessed February 28, 2020.
28. Pan SC, Tien KL, Hung IC, et al. Compliance of health care workers with hand hygiene practices: independent advantages of overt and covert observers. PLoS One. 2013;8(1):e53746. https://doi.org/10.1371/journal.pone.0053746.
© 2020 Society of Hospital Medicine
Is There an Association Between Hidradenitis Suppurativa and Fibromyalgia?
To the Editor:
Hidradenitis suppurativa (HS) is a chronic inflammatory condition that affects approximately 1% to 4% of the worldwide population and is 3 times more common in females than in males.1 The condition is characterized by painful inflamed nodules in apocrine gland–bearing regions that can progress to abscesses, sinus tracts, and/or scarring. Hidradenitis suppurativa is associated with intense pain, work disability, and poor quality of life.1
Recent evidence has suggested that HS is an autoimmune disease resulting from dysregulation of the γ-secretase/Notch pathway, leading to stimulation of the toll-like receptor–mediated innate immunity that contributes to occlusion and inflammation of the hair follicle. Additionally, elevated levels of proinflammatory cytokines such as tumor necrosis factor α and IL-17 are seen in HS lesions.2 The autoimmune nature of HS may account for its increased association with other autoimmune disorders such as thyroid disease and potentially with other unexplored conditions such as fibromyalgia.3
Fibromyalgia is a chronic pain condition that primarily affects females and is commonly associated with other autoimmune conditions.4 The primary objective of this retrospective study was to determine the prevalence of fibromyalgia in HS patients and assess if there is an association between HS disease severity and development of fibromyalgia.
We conducted a retrospective chart review of patients at Wake Forest Baptist Medical Center (Winston-Salem, North Carolina) who were 18 years and older and had a diagnosis of both HS and fibromyalgia from January 2008 to November 2018. The primary end point was the prevalence of fibromyalgia in the HS population. The secondary end point was the association of HS disease severity with the development of fibromyalgia. Hidradenitis disease severity was defined according to the number of body areas affected by HS: mild disease involved 1 body area, moderate disease involved 2 body areas, and severe disease involved 3 or more body areas. Patient age, sex, and race also were recorded.
A total of 1356 patients were seen during this time period for HS. The prevalence of fibromyalgia in the HS population was 3.2% (n=44). Ninety-five percent (42/44) of patients with HS and fibromyalgia were women; 22 (50%) patients had severe disease, 12 (27%) had moderate disease, 7 (16%) had mild disease, and 3 (7%) had an unknown number of affected body areas. Fifty-seven percent (25/44) of patients were diagnosed with HS prior to the diagnosis of fibromyalgia (Table).

In our study, the prevalence of fibromyalgia in HS patients was lower than the overall prevalence estimates of up to 6% in the United States.5 Although fibromyalgia is associated with other autoimmune conditions, it does not appear that fibromyalgia occurs more frequently in the HS population than the general population. A limitation of this study was that we only included academic outpatient clinic visits at one institution, which may not be representative of the entire HS population. Fibromyalgia was one of the many pain disorders in this population of patients. In this population of HS patients, many had pain issues with diagnose
- Smith MK, Nichlson CL, Parks-Miller A, et al. Hidradenitis suppurativa: an update on connecting the tracts. F1000Res. 2017;6:1272.
- Napolitano M, Megna M, Timoshchuk EA, et al. Hidradenitis suppurativa: from pathogenesis to diagnosis and treatment. Clin Cosmet Investig Dermatol. 2017;10:105-115.
- Miller IM, Vinding G, Sorensen HA, et al. Thyroid function in hidradenitis suppurativa: a population-based cross-sectional study from Denmark. Clin Exp Dermatol. 2018;43:899-905.
- Giacomelli C, Talarico R, Bombardieri S, et al. The interaction between autoimmune diseases and fibromyalgia: risk, disease course and management. Expert Rev Clin Immunol. 2013;9:1069-1076.
- Queiroz LP. Worldwide epidemiology of fibromyalgia. Curr Pain Headache Rep. 2013;17:356.
To the Editor:
Hidradenitis suppurativa (HS) is a chronic inflammatory condition that affects approximately 1% to 4% of the worldwide population and is 3 times more common in females than in males.1 The condition is characterized by painful inflamed nodules in apocrine gland–bearing regions that can progress to abscesses, sinus tracts, and/or scarring. Hidradenitis suppurativa is associated with intense pain, work disability, and poor quality of life.1
Recent evidence has suggested that HS is an autoimmune disease resulting from dysregulation of the γ-secretase/Notch pathway, leading to stimulation of the toll-like receptor–mediated innate immunity that contributes to occlusion and inflammation of the hair follicle. Additionally, elevated levels of proinflammatory cytokines such as tumor necrosis factor α and IL-17 are seen in HS lesions.2 The autoimmune nature of HS may account for its increased association with other autoimmune disorders such as thyroid disease and potentially with other unexplored conditions such as fibromyalgia.3
Fibromyalgia is a chronic pain condition that primarily affects females and is commonly associated with other autoimmune conditions.4 The primary objective of this retrospective study was to determine the prevalence of fibromyalgia in HS patients and assess if there is an association between HS disease severity and development of fibromyalgia.
We conducted a retrospective chart review of patients at Wake Forest Baptist Medical Center (Winston-Salem, North Carolina) who were 18 years and older and had a diagnosis of both HS and fibromyalgia from January 2008 to November 2018. The primary end point was the prevalence of fibromyalgia in the HS population. The secondary end point was the association of HS disease severity with the development of fibromyalgia. Hidradenitis disease severity was defined according to the number of body areas affected by HS: mild disease involved 1 body area, moderate disease involved 2 body areas, and severe disease involved 3 or more body areas. Patient age, sex, and race also were recorded.
A total of 1356 patients were seen during this time period for HS. The prevalence of fibromyalgia in the HS population was 3.2% (n=44). Ninety-five percent (42/44) of patients with HS and fibromyalgia were women; 22 (50%) patients had severe disease, 12 (27%) had moderate disease, 7 (16%) had mild disease, and 3 (7%) had an unknown number of affected body areas. Fifty-seven percent (25/44) of patients were diagnosed with HS prior to the diagnosis of fibromyalgia (Table).
In our study, the prevalence of fibromyalgia in HS patients was lower than the overall prevalence estimates of up to 6% in the United States.5 Although fibromyalgia is associated with other autoimmune conditions, it does not appear that fibromyalgia occurs more frequently in the HS population than the general population. A limitation of this study was that we only included academic outpatient clinic visits at one institution, which may not be representative of the entire HS population. Fibromyalgia was one of the many pain disorders in this population of patients. In this population of HS patients, many had pain issues with diagnose
- Smith MK, Nichlson CL, Parks-Miller A, et al. Hidradenitis suppurativa: an update on connecting the tracts. F1000Res. 2017;6:1272.
- Napolitano M, Megna M, Timoshchuk EA, et al. Hidradenitis suppurativa: from pathogenesis to diagnosis and treatment. Clin Cosmet Investig Dermatol. 2017;10:105-115.
- Miller IM, Vinding G, Sorensen HA, et al. Thyroid function in hidradenitis suppurativa: a population-based cross-sectional study from Denmark. Clin Exp Dermatol. 2018;43:899-905.
- Giacomelli C, Talarico R, Bombardieri S, et al. The interaction between autoimmune diseases and fibromyalgia: risk, disease course and management. Expert Rev Clin Immunol. 2013;9:1069-1076.
- Queiroz LP. Worldwide epidemiology of fibromyalgia. Curr Pain Headache Rep. 2013;17:356.
Practice Point
- Although fibromyalgia does not occur more frequently in hidradenitis suppurativa (HS) patients, it is important to recognize that HS patients can have comorbidities that should be addressed when possible to improve overall quality of life.