User login
MDedge conference coverage features onsite reporting of the latest study results and expert perspectives from leading researchers.
Mothers’ diabetes linked to ADHD in their children
Children born to women who develop diabetes either before or during their pregnancy could be at risk for developing attention-deficit/hyperactivity disorder, data from a large multinational cohort study appear to show.
Considering more than 4.5 million mother-child pairs, it was found that children whose mothers had diabetes around the time of their pregnancy were 16% more likely to have ADHD diagnosed than were those whose mothers did not.
An increased risk was seen regardless of the type of diabetes, and regardless of whether or not the diabetes was present before or appeared during the pregnancy.
“We found a small increased risk of ADHD in children born to mothers with diabetes, including pregestational diabetes and gestational diabetes,” Carolyn Cesta, PhD, reported at the annual meeting of the European Association for the Study of Diabetes.
Dr. Cesta, a postdoctoral researcher in the Centre for Pharmacoepidemiology at the Karolinska Institutet in Stockholm noted that the effect sizes seen were lower than had been reported previously.
“This may be because we adjusted for a large number of covariates, including maternal ADHD and psychiatric disorders,” Dr. Cesta said.
ADHD and diabetes
“Previous studies have reported an increase in the risk of ADHD in children born to mothers with diabetes,” explained Dr. Cesta.
However, “these studies have been limited by the use of self-reported data, small sample sizes, lack of adjustment for important confounders, and they’re often limited to [White] populations,” she added. “There’s a lot of heterogeneity between these studies,” she said.
To try to iron out the differences seen in the prior studies, Dr. Cesta and associates looked at data from several databases based in Hong Kong (Clinical Data Analysis and Reporting System), four Nordic countries (Population Health Registers for Finland, Iceland, Norway, and Sweden), and Taiwan (National Health Insurance Database).
To create the matched mother-child pairs, the databases were searched to find women who had children born between 2001 and 2018, and who had follow-up data available up to 2020 on not only their diabetes status and child’s ADHD status, but also other parameters, such as other maternal diagnoses, maternal medications, and a host of sociodemographic factors.
More than 24 potentially confounding or covariates were considered in the analysis, which used Cox proportional hazard regression modeling and propensity score analysis to calculate hazard ratios with 95% confidence intervals.
“We looked at whether [mothers] had a diagnosis of ADHD themselves, or other psychiatric disorders, because there is high heritability for these disorders,” Dr. Cesta said, indicating that all bases had endeavored to be covered.
Main findings
Results showed some differences in the prevalence of diabetes and ADHD between the three cohorts used in the analysis. The prevalence of any maternal diabetes ranged from 8.8% in the Hong Kong cohort to 3.3% in the Taiwan cohort, with a prevalence of 6.8% for the Nordic cohort.
Rates of pregestational diabetes were lowest in the Taiwan and Hong Kong cohorts, at 0.2% and 0.5%, respectively, and 2.2% in the Nordic cohort. Gestational diabetes rates were a respective 3.1%, 7.8%, and 4.6%.
The highest rate of ADHD in children was seen in the Taiwan cohort, at 9.6%, followed by 4.2% for the Hong Kong cohort, and 2.6% for the Nordic cohort.
The hazard ratio for having childhood ADHD was 1.16 when comparing any maternal diabetes to no maternal diabetes, 1.40 comparing mothers with and without pregestational diabetes, and a respective 1.36 and 1.37 comparing those with and without type 1 diabetes, and those with and without type 2 diabetes.
The HR for childhood ADHD comparing mothers with and without gestational diabetes was 1.13.
“Within the analysis for gestational diabetes, we had enough numbers to look at siblings that are discordant for maternal gestational diabetes,” Dr. Cesta said. Essentially “we’re comparing two siblings from the same mother, one that was exposed to gestational diabetes, one that wasn’t,” she explained.
Interestingly there was no association between ADHD and maternal gestational diabetes in the sibling analysis (HR, 1.0).
“When it comes to gestational diabetes, the evidence from our sibling analysis indicate that the association may actually be confounded by shared genetics and environmental factors,” said Dr. Cesta.
“So, future studies should explore the role of specific genetic factors in glycemic control during pregnancy and the relationship between maternal diabetes and ADHD.”
Answering long-standing questions
These data will help a lot in answering questions that clinicians have been asking themselves a long time, commented Jardena Puder, MD, who chaired the session.
“It still remains a bit puzzling that genetic and environmental factors could be responsible, if you see the same effect in type 1 [diabetes], and in type 2 [diabetes], and gestational diabetes,” said Dr. Puder, who is an endocrinologist and diabetologist at the woman-mother-child department at the Vaud University Hospital Center, Lausanne, Switzerland.
Type 1 and type 2 are “very distinct” in terms of the genetic and environmental factors involved, “so, the fact that you see [the effect] in both remains a bit puzzling,” said Dr. Puder.
“I wish we had the numbers to be able to do the sibling analysis for type 1 and type 2, just to see if we could tease anything out,” said Dr. Cesta.
“I do think this is part of the bigger question of what the relationship is between, like, metabolic disorders and psychiatric disorders, because even outside of pregnancy, we see that there’s often a comorbidity with them. So, it’s a good point.”
The next step is to look at the role of treatment and what effects glycemic control might have on the small, but still apparent, association between maternal diabetes and ADHD.
The study had multiple funders including the Hong Kong Research Grant Council, NordForsk, the Research Council of Norway, the Norwegian ADHD Research Network, the Hong Kong Innovation and Technology Commission, and European Horizon 2020.
Dr. Cesta had no conflicts of interest to disclose. Dr. Puder chaired the session in which the findings were presented and made no specific disclosures.
FROM EASD 2022
Telehealth effective in managing patients with movement disorders
Researchers presented their findings at the International Congress of Parkinson’s Disease and Movement Disorders.
Serving the underserved
One of the studies – from Kenya, Africa – documented a 2-year experience with telemedicine in a rural patient population.
Kenya suffers from a dearth of neurologists and movement disorder specialists. Most are based in the capital city of Nairobi, “leaving regions with a population of more than 30 million without access to their care,” wrote the study’s investigators. Internists with an interest in neurology usually manage the bulk of these patients.
Telemedicine has helped to bridge gaps between providers in this part of Africa.
Investigators in their study reviewed all cases of movement disorders at Meru Teaching and Referral Hospital and an affiliated clinic, Oregon Health Services, Meru, Kenya, during 2020 and 2021.
They also reviewed WhatsApp messaging, video calls via WhatsApp, patient videos, and phone calls to see how final diagnoses were arrived at using these platforms.
“For instance, a relative would send a video of a patient experiencing a tremor,” explained lead study author Bundi Karau, MD, a consultant physician. “We also shared the diagnostic challenges with experienced neurologists in Kenya and abroad by forwarding WhatsApp and recorded videos of the patients,” he added.
Telemedicine bridged the gap between rural doctors and patients in several ways. It enabled physicians to discuss cases with neurologists in and out of Kenya. “We were able to advise on medical management or further investigations in a more structured pattern and without spending months to make a diagnosis,” said Dr. Karau.
Patients no longer had to travel to Nairobi for care. “Where a direct link could be expensive or out of reach, we bridged this and consequently brought care closer to the patient,” he added.
More than 100 patients were diagnosed with a movement disorder and enrolled in care and follow-up during this 2-year time. Patients averaged about 62 years of age and more than 60% were male. Parkinson’s disease was the most common diagnosed condition (38.9%) followed by drug-induced movement disorders (30.6%), dystonia (11.1%), and functional movement disorders (11.1%).
Investigators found 3 cases of diabetic striatopathy, 8 cases of myoclonus, and 2 cases of Sydenham’s chorea.
Looking ahead, Dr. Karau and colleagues plan to do a cost benefit analysis vis-a-vis traditional physician visits and a trial model for follow-up visits for other neurological diseases.
Wearable devices and apps improve care
Moving from Africa to Greece, investigators in another study assessed the feasibility of using wearable devices to monitor symptoms in patients with Parkinson’s disease.
Such devices may enhance physical exams during virtual visits. Studies have shown that patients can commit to using such devices or mobile apps. What’s lacking is real-world data from everyday device usage, noted lead author George Rigas, PhD, and colleagues.
Fifty-two private physicians instructed a total of 133 patients to wear a device for Parkinson’s disease motor symptom telemonitoring for 1 week per month during waking hours.
Patients used a mobile app to report symptoms, medication, and nutrition adherence and to message their doctor.
The study team noticed that adherence rates stayed above 70% over a 12-month period. Medication and nutrition were among the most popular app features, an encouraging finding given that patients averaged 67 years of age.
“The high adherence percentage is significant, considering the target population and the early stage of telemedicine in Greece,” they concluded. Additional real-world data could help better inform longer-term adherence.
“These studies from all over the world demonstrate that we are only scratching the surface of the telehealth’s potential to improve care and the lives of individuals with Parkinson’s disease,” said Ray Dorsey, MD, a professor of neurology with the Center for Health + Technology at the University of Rochester (N.Y.).
Dr. Dorsey was not involved with the studies but has written and researched extensively on this topic.
Dr. Dorsey is a consultant for and has equity interests in Mediflix and Included Health, two digital health companies.
From MDS 2022
Triple threat: Novel agent shows potent T2D weight loss in phase 1
STOCKHOLM – First came the GLP-1 receptor agonists as treatments for patients with type 2 diabetes, then came tirzepatide (Mounjaro) which added a second incretin agonism for the receptor to the glucose-dependent insulinotropic polypeptide (GIP). Now coming onto the clinical scene is a molecule with triple agonism to the GLP-1 receptor, the GIP receptor, and to the glucagon receptor.
That molecule, LY3437943, showed reasonable safety and tolerability and an apparent incremental uptick in weight loss compared with the approved incretin-based agents for people with type 2 diabetes in a 12-week, dose-ranging study involving a 52 patients with type 2 diabetes who received the new agent.

The 12 people who uptitrated for a total of 12 weeks and reached the highest tested dose of LY3437943, 12 mg, injected once weekly during the final 4 weeks, showed an average weight loss of 8.65 kg, while the 11 patients who maxed out at a weekly dose of 6 mg of LY3437943 had an average 12-week weight loss of 7.52 kg, Zvonko Milicevic, MD, reported at the annual meeting of the European Association for the Study of Diabetes.
Fifteen more participants received placebo and five received a comparator GLP-1 receptor agonist. All 72 patients in the study were also already on treatment with metformin when they entered, and they were maintained on metformin throughout the study period.
The new agent showed “greater weight loss efficacy than currently approved medications,” said Dr. Milicevic, a staff researcher who works in Vienna for Eli Lilly, the company developing LY3437943.
‘Really impressive’ weight loss
Martin Haluzik, MD, who chaired the session where Dr. Milicevic spoke, agreed. “The data, especially for weight reduction, were really impressive,” Dr. Haluzik said in an interview. “It looks stronger than the best we have at the moment,” the dual incretin agonist tirzepatide, he added.

Cross-study comparisons are very unreliable, but to put the weight loss seen with LY3437943 in perspective, the 12-week weight reduction that occurred with the highest dose of tirzepatide tested (15 mg/weekly) in the pivotal SURPASS-2 trial with 1,879 randomized patients with type 2 diabetes was an average of roughly 5 kg, while the comparator of 1 mg weekly of semaglutide (Ozempic) tested in the same study produced an average weight loss of about 4 kg.
Other notable efficacy results for LY3437943 after 12 weeks on treatment included an average reduction in hemoglobin A1c from baseline of 1.90%, achieved in the group that received 6 mg weekly as their maximum dose for 8 weeks after a 4-week run-in at a lower dose; a reduction in systolic blood pressure of 7.99 mm Hg on the 6-mg maximum weekly dose and of 12.06 mm Hg on the maximum 12-mg weekly dose; and “robust” reductions in lipids including cuts from baseline of about 40% for both triglycerides and very-LDL cholesterol, Dr. Milicevic reported.
Adverse effects resemble approved incretin-based agents
The study, which ran at four U.S. sites, had a primary objective of safety assessment, and Dr. Milicevic said the results showed acceptable safety and tolerability consistent with the glucagon-like peptide-1 (GLP-1) receptor agonists and tirzepatide. Like those agents, LY3437943 caused primarily mild gastrointestinal adverse effects such as nausea and diarrhea. Of the 52 patients in the study who received the triple agonist, 4 discontinued treatment because of a treatment-emergent adverse effect, including 1 patient in the subgroup who received the maximum dose.
The only concerning adverse effect noted by Dr. Haluzik was the average increase in heart rate from baseline of 10.26 beats/min in the subgroup that received the maximum dose, roughly twice the increase seen with tirzepatide and semaglutide in SURPASS-2. The average heart rate increase was about half that, 5.30 beats/min compared with baseline, in the subgroup that received a maximum weekly dose of 6 mg.
Overall, the results showed “no major adverse effects that might hamper use,” said Dr. Haluzik, an endocrinologist and professor at Charles University in Prague.
Two phase 2 studies of LY3437943 are underway and are scheduled to finish before the end of 2022. They include a study of about 300 people with type 2 diabetes that’s running at 43 U.S. sites, and a second study of about 500 people with overweight or obesity running at 28 U.S. sites.
The study was sponsored by Eli Lilly, the company developing LY3437943. Dr. Milicevic is an employee of and stockholder of Eli Lilly. Dr. Haluzik has been an adviser to, consultant to, and received honoraria and research support from Eli Lilly. He has had similar relationships with Amgen, AstraZeneca, Boehringer Ingelheim, BristolMyersSquibb, Janssen, Johnson & Johnson, Mundipharma, Novo Nordisk, and Sanofi.
STOCKHOLM – First came the GLP-1 receptor agonists as treatments for patients with type 2 diabetes, then came tirzepatide (Mounjaro) which added a second incretin agonism for the receptor to the glucose-dependent insulinotropic polypeptide (GIP). Now coming onto the clinical scene is a molecule with triple agonism to the GLP-1 receptor, the GIP receptor, and to the glucagon receptor.
That molecule, LY3437943, showed reasonable safety and tolerability and an apparent incremental uptick in weight loss compared with the approved incretin-based agents for people with type 2 diabetes in a 12-week, dose-ranging study involving a 52 patients with type 2 diabetes who received the new agent.
The 12 people who uptitrated for a total of 12 weeks and reached the highest tested dose of LY3437943, 12 mg, injected once weekly during the final 4 weeks, showed an average weight loss of 8.65 kg, while the 11 patients who maxed out at a weekly dose of 6 mg of LY3437943 had an average 12-week weight loss of 7.52 kg, Zvonko Milicevic, MD, reported at the annual meeting of the European Association for the Study of Diabetes.
Fifteen more participants received placebo and five received a comparator GLP-1 receptor agonist. All 72 patients in the study were also already on treatment with metformin when they entered, and they were maintained on metformin throughout the study period.
The new agent showed “greater weight loss efficacy than currently approved medications,” said Dr. Milicevic, a staff researcher who works in Vienna for Eli Lilly, the company developing LY3437943.
‘Really impressive’ weight loss
Martin Haluzik, MD, who chaired the session where Dr. Milicevic spoke, agreed. “The data, especially for weight reduction, were really impressive,” Dr. Haluzik said in an interview. “It looks stronger than the best we have at the moment,” the dual incretin agonist tirzepatide, he added.
Cross-study comparisons are very unreliable, but to put the weight loss seen with LY3437943 in perspective, the 12-week weight reduction that occurred with the highest dose of tirzepatide tested (15 mg/weekly) in the pivotal SURPASS-2 trial with 1,879 randomized patients with type 2 diabetes was an average of roughly 5 kg, while the comparator of 1 mg weekly of semaglutide (Ozempic) tested in the same study produced an average weight loss of about 4 kg.
Other notable efficacy results for LY3437943 after 12 weeks on treatment included an average reduction in hemoglobin A1c from baseline of 1.90%, achieved in the group that received 6 mg weekly as their maximum dose for 8 weeks after a 4-week run-in at a lower dose; a reduction in systolic blood pressure of 7.99 mm Hg on the 6-mg maximum weekly dose and of 12.06 mm Hg on the maximum 12-mg weekly dose; and “robust” reductions in lipids including cuts from baseline of about 40% for both triglycerides and very-LDL cholesterol, Dr. Milicevic reported.
Adverse effects resemble approved incretin-based agents
The study, which ran at four U.S. sites, had a primary objective of safety assessment, and Dr. Milicevic said the results showed acceptable safety and tolerability consistent with the glucagon-like peptide-1 (GLP-1) receptor agonists and tirzepatide. Like those agents, LY3437943 caused primarily mild gastrointestinal adverse effects such as nausea and diarrhea. Of the 52 patients in the study who received the triple agonist, 4 discontinued treatment because of a treatment-emergent adverse effect, including 1 patient in the subgroup who received the maximum dose.
The only concerning adverse effect noted by Dr. Haluzik was the average increase in heart rate from baseline of 10.26 beats/min in the subgroup that received the maximum dose, roughly twice the increase seen with tirzepatide and semaglutide in SURPASS-2. The average heart rate increase was about half that, 5.30 beats/min compared with baseline, in the subgroup that received a maximum weekly dose of 6 mg.
Overall, the results showed “no major adverse effects that might hamper use,” said Dr. Haluzik, an endocrinologist and professor at Charles University in Prague.
Two phase 2 studies of LY3437943 are underway and are scheduled to finish before the end of 2022. They include a study of about 300 people with type 2 diabetes that’s running at 43 U.S. sites, and a second study of about 500 people with overweight or obesity running at 28 U.S. sites.
The study was sponsored by Eli Lilly, the company developing LY3437943. Dr. Milicevic is an employee of and stockholder of Eli Lilly. Dr. Haluzik has been an adviser to, consultant to, and received honoraria and research support from Eli Lilly. He has had similar relationships with Amgen, AstraZeneca, Boehringer Ingelheim, BristolMyersSquibb, Janssen, Johnson & Johnson, Mundipharma, Novo Nordisk, and Sanofi.
AT EASD 2022
High BMI linked to better survival for cancer patients treated with ICI, but for men only
That is the conclusion of a new retrospective analysis presented during a poster session given at the annual meeting of the European Society for Medical Oncology. The study sought to better understand ICI outcomes. “These are complex new treatments and, because they harness the immune system, no two patients are likely to respond in the same way. BMI has previously been associated with improved survival in patients with advanced lung cancer treated with immunotherapy. However, the reasons behind this observation, and the implications for treatment are unknown, as is whether this observation is specific for patients with only certain types of cancers,” study author Dwight Owen, MD, said in an email.
He pointed out that the retrospective nature of the findings means that they have no immediate clinical implications. “The reason for the discrepancy in males remains unclear. Although our study included a relatively large number of patients, it is a heterogenous cohort and there may be confounding factors that we haven’t recognized, so these findings need to be replicated in larger cohorts,” said Dr. Owen, a medical oncologist with The Ohio State University Comprehensive Cancer Center, Columbus.
Asked if there is a potential biological explanation for a difference between males and females, Dr. Owen said that this is an area of intense research. One recent study examined whether androgen could help explain why men are more likely than women to both develop and have more aggressive nonreproductive cancers. They concluded that androgen receptor signaling may be leading to loss of effector and proliferative potential of CD8+ T cells in the tumor microenvironment. Once exhausted, these cells do not respond well to stimulation that can occur after ICI treatment.
On the opposite end of the spectrum, cancer cachexia is also a key subject of study. It is characterized by weight loss and is associated with worse clinical outcomes. A cachexia mouse model found that weight loss can lead to more clearance of immune checkpoint antibodies.
Still, much more work needs to be done. “For now, how BMI, obesity, and cachexia relate to other factors, for instance the microbiome and tumor immunogenicity, are still not fully understood,” Dr. Owen said.
The study data
The researchers analyzed data from 688 patients with metastatic cancer treated at their center between 2011 and 2017. 94% were White and 5% were Black. 41% were female and the mean age was 61.9 years. The mean BMI was 28.8 kg/m2; 40% of patients had melanoma, 23% had non–small cell lung cancer, 10% had renal cancer, and 27% had another form of cancer.
For every unit decrease in BMI, the researchers observed a 1.8% decrease in mortality (hazard ratio, 0.982; P = .007). Patients with a BMI of 40 or above had better survival than all other patients grouped by 5 BMI increments (that is, 35-40, 30-35, etc.). When separated by sex, males had a significant decrease in mortality for every increase in BMI unit (HR, 0.964; P = .004), but there was no significant difference among women (HR, 1.003; P = .706). The relationship in men held up after adjustment for Eastern Cooperative Oncology Group score, line of therapy, and cancer type (HR, 0.979; P = .0308). The researchers also looked at a separate cohort of 185 normal weight and 15 obese (BMI ≥ 40) NSCLC patients. Median survival was 27.5 months in the obese group and 9.1 months in the normal weight group (HR, 0.474; 95% CI, 0.232-0.969).
Dr. Owen has received research funding through his institution from Bristol-Myers Squibb, Genentech, Pfizer, Palobiofarma, and Onc.AI.
FROM ESMO CONGRESS 2022
Sotorasib superior to docetaxel in KRAS G12C–mutated NSCLC
PARIS – For patients with non–small cell lung cancers (NSCLC) bearing the KRAS G12C mutation that have progressed on prior therapies, the first-in-class KRAS G12C inhibitor sotorasib (Lumykras) was associated with better progression-free survival (PFS) and objective response rates than docetaxel in the randomized, phase 3 CodeBreaK 200 trial.
Among 345 patients who had experienced disease progression after prior platinum-based chemotherapy and an immune checkpoint inhibitor, 1-year PFS rates at a median follow-up of 17.7 months were 24.8% for patients randomized to receive sotorasib versus 10.1% for patients assigned to docetaxel, reported Melissa L, Johnson, MD, from the Sarah Cannon Research Institute at Tennessee Oncology in Nashville.
“In my opinion, this supports sotorasib as a new second-line standard for patients with KRAS G12C non–small cell lung cancer,” she said in a media briefing prior to her presentation of the data in an oral abstract session at the annual meeting of the European Society for Medical Oncology.
First phase 3, randomized, controlled trial
The trial is the first head-to-head, randomized comparison pitting a KRAS G12C inhibitor against the standard of care in patients with NSCLC.
Approximately 30% of patients with NSCLC have KRAS driver mutations, and KRAS G12C–mutant NSCLC comprises an estimated 13% of all NSCLC cases, Dr. Johnson said.
Sotorasib was hailed as “a triumph of drug discovery” when early results of the trial were reported at the 2020 ESMO annual meeting. It is a small-molecule, specific, and irreversible inhibitor of KRAS that interacts with a “pocket” on the gene’s surface that is present only in an inactive conformation of KRAS. The drug inhibits oncogenic signaling and tumorigenesis by preventing cycling of the oncogene into its active form.
CodeBreaK 200 details
A total of 345 patients from sites in the United States, Europe, Asia and Australia were enrolled and randomly assigned to receive either oral sotorasib 960 mg daily, or intravenous docetaxel 75 mg/m2 every 3 weeks.
As noted before, the trial met its primary endpoint of a statistically significant improvement in PFS with sotorasib as measured by independent central reviewers blinded to study assignment, with a hazard ratio of 0.66 (P = .002). Median PFS with sotorasib was 5.6 months, compared with 4.5 months for docetaxel.
The objective response rate was significantly improved for sotorasib versus docetaxel (28.1% vs. 13.2%, P < .001), as was the disease control rate at 82.5% for sotorasib versus 60.3% for docetaxel. Overall survival was not significantly different between treatment arms, though the study was not powered for this endpoint.
Sotorasib was also superior to docetaxel at forestalling deterioration of patients’ global health status, physical functioning, and cancer-related symptoms such as dyspnea and cough. There was no significant difference between the study arms in reported chest pain, however.
Grade 3 or greater treatment-related adverse events occurred in 33.1% of patients with sotorasib, compared with 40.4% of patients on docetaxel.
‘Tremendous advance’
“I think the conduct of this study is impressive, it’s well designed, it was well run, any imbalances really favored the control arm, and I think that this advance is relevant not just for performance status 0 and 1 KRAS G12C–mutant patients, but even beyond, to performance status 2 and perhaps even performance status 3,” commented Natasha Leighl, MD, MMSc, from the Princess Margaret Cancer Center, Toronto, the invited discussant.
Comparing the drug performance of the respective arms, Dr. Leighl said that “I don’t think I’ve ever seen such good outcomes in a randomized trial with the chemotherapy, but unfortunately sotorasib performed a little bit less well than we had hoped.”
Nonetheless, “I think CodeBreaK 200 is a tremendous advance for patients. It is a confirmatory positive trial, and I think sotorasib is the new standard of care in patients who have received chemo and immunotherapy for KRAS G12C–mutant lung cancer,” she said.
CodeBreaK 200 was supported by Amgen. Dr. Johnson disclosed a consulting and advisory role with payments to her institution from Amgen and others. Dr. Leighl disclosed institutional grant funding and personal honoraria from Amgen and others.
AT ESMO CONGRESS 2022
Medical cannabis appears safe for patients with movement disorders
, two Israeli research teams reported.
The practice calls for careful monitoring of patients and additional study, said the researchers, who presented their findings at the International Congress of Parkinson’s Disease and Movement Disorders.
Cannabis for Parkinson’s disease
One retrospective study focused on Parkinson’s disease, evaluating the safety and effects of long-term treatment with medical cannabis, which has become a widely available treatment for controlling symptoms in Parkinson’s disease and other pain disorders. Studies have demonstrated its efficacy in patients with Parkinson’s disease, but long-term safety has never been examined in Parkinson’s disease compared with untreated patients.
Their study included 152 patients with idiopathic Parkinson’s disease (mean age at diagnosis: 55.6 plus or minus 9.5 years) from the Sheba Medical Center Movement Disorders Institute who had been issued a license for medical cannabis. Seventy-six patients treated with cannabis were compared with 76 patients with similar characteristics who were not treated with cannabis.
Investigators collected data on patients who were followed at the institute between 2008 and 2022. Average follow-up period was 3.6 years.
Specifically, they collected data on levodopa equivalent daily dose (LEDD), Hoehn and Yahr scale progression, and patient-reported outcome measures on cognitive impairment, depressive, and psychotic symptoms, at baseline and at follow-up.
The Hoehn and Yahr scale allows for the quantification of different disease stages and LEDD provides a summary of the total daily medication a patient is receiving, explained Tomer Goldberg, BSc, the study’s lead author. Both are widely accepted motor severity and progression measures for Parkinson’s disease. “We wanted to check whether cannabis treatment influences these two motor parameters,” said Mr. Goldberg, who is affiliated with Tel Aviv University and the Movement Disorders Institute at Sheba Medical Center.
The medical cannabis–treated group and the untreated group had no significant differences in the mean annual change in LEDD or Hoehn and Yahr score. At 1, 2, and 3 years of follow-up, the treated group showed no signs of psychotic, depressive, or cognitive deterioration (P = .10-.68). The groups in Kaplan-Meier analyses also exhibited no differences in these nonmotor symptoms over time (P = .27-.93).
The findings suggest that cannabis treatment appears to be safe and has no negative effect on disease progression, said Mr. Goldberg. “It is important to note that we did not investigate all of the potential side effects of this treatment, and that prescribing medical cannabis for patients with Parkinson’s disease should be done with careful monitoring of each patient’s individual response to the treatment,” he added.
Cannabis for Huntington’s disease
Another study, targeting Huntington’s disease, drew similar conclusions. Psychiatric symptoms and cognitive decline are often present in Huntington’s disease patients, who have few treatment options. “An overall improvement in chorea and in neuropsychiatric symptoms was reported following cannabis treatment in several studies both in humans and in murine models,” wrote the study authors.
In this study, a certified Huntington’s disease specialist reviewed the medical records of 150 patients who were being followed in an Huntington’s disease clinic. Study metrics included the Unified Huntington’s Disease Rating Scale and Montreal Cognitive Assessment scores, indications for treatment, and adverse events related to treatment. Among the 150 patients, 19 had received cannabis treatment for indications such as sleep disorders, behavioral anomalies, and chorea. All but one patient reported an improvement in symptoms (94%). No adverse events were recorded, although one patient died from a COVID-19 infection.
Overall, medical cannabis appeared to safely relieve symptoms in patients with Huntington’s disease. A double-blind randomized controlled trial should further examine efficacy of these findings, the study authors recommended.
Mr. Goldberg had no disclosures or conflicts of interest in reporting his research.
FROM MDS 2022
Angiography in patients with prior CABG does better when planned with CT
BOSTON – Coronary angiography in patients who have previously undergone cardiac artery bypass grafting (CABG) is challenging, but the procedure can be streamlined and made safer when preprocedural CT coronary angiography (CTCA) is performed to plan the intervention, according to a randomized controlled trial.
In this study, all three endpoints, including a reduction in the incidence of contrast-induced nephropathy (CIN) and duration of the procedure, were met, according to Daniel Jones, MBBS, PhD.

Preprocedural CTCA was also associated with about a 40% improvement in patient satisfaction.
“When logistically possible, CTCA should be considered for any stable postbypass patient undergoing coronary angiography,” said Dr. Jones, who supported this assertion with data presented at the Transcatheter Cardiovascular Therapeutics annual meeting.
In this study, called BYPASS-CTCA, 688 patients with a prior CABG scheduled for invasive coronary angiography were randomized to a preprocedural CTCA or no preprocedural CTCA. Patients with stable angina and those with a non–ST elevated acute coronary syndrome were eligible. Those with ST-segment elevated MI or severe renal impairment (eGFR < 20 mL/min) were excluded.
All three co–primary endpoints favor CTCA
CTCA relative to no CTCA provided a significant advantage for all three of the coprimary endpoints, which were procedure duration, CIN as defined by KDIGO criteria, and patient satisfaction as measured by questionnaire.
The procedure duration was reduced by almost 21 minutes, cutting the time from nearly 39 minutes to less than 18 minutes (P < .001). This relative reduction was of similar magnitude across groups, such as those with or without acute coronary syndrome and procedures performed by a senior or a junior operator.
“Even when you include the preprocedural CTCA evaluation time, there was still a significant reduction [P < .001] in duration for those in the CTCA arm,” reported Dr. Jones, honorary consultant cardiologist, Barts Heart Centre, Queen Mary University, London.
The rates of CIN following the procedure in this study, which had a follow-up of 12 months, were 3.4% versus 27.9% (P < .0001) in the preprocedural CTCA and non-CTCA groups, respectively. Again, a sensitivity analysis showed a similar magnitude of risk reduction across all subgroups evaluated.
CTCA planning reduced contrast exposure
The reduced risk of CIN was consistent with a large reduction in contrast exposure for those in the CTCA group (77.4 vs. 173.0 mL; P < .001). The advantage narrowed substantially when adding in contrast exposure from CTCA, but still remained statistically significant (148.9 vs. 173.0 mL; P < .001).
Dr. Jones did not speculate about the specific reasons for the 40% improvement in patient satisfaction among those who underwent preprocedural CTCA relative to those who did not, but, again, a sensitivity analysis showed consistency across subgroups defined by race, operator experience, and underlying diagnosis.
Numerous secondary endpoints also favored CTCA over no CTCA. This included fewer catheters used to complete the procedure (three vs. four; P < .001), a greater likelihood that the procedure was performed with radial access (76.9% vs. 56.7%), and lower rates of procedural complications (2.3% vs. 10.8%; P < .001). This latter category included fewer vascular access complications such as bleeding (0.6 % vs. 4.4%; P = .007) and periprocedural MI (0.6% vs. 6.4%; P < 0.001).
In a graph of time to first major adverse cardiovascular event (MACE), the curves separated almost immediately with a consistently lower rate maintained in the CTCA arm over the 12 months of follow-up, but this is observational. Dr. Jones acknowledged that this trial was not powered to show a difference in MACE.
Study intriguing but not definitive
In a panel discussion that followed the presentation of these results at the meeting, sponsored by the Cardiovascular Research Foundation, some reservations with this study were expressed. In particular, several of the panelists, including Jeffrey W. Moses, MD, director of interventional cardiovascular therapeutics, Columbia University Medical Center, New York, expressed surprise at the 27% rate of CIN, which he considered uncommonly high even in a high-risk population.
The unusual rate of CIN was also considered problematic given that it was the most significant clinical outcome among the three co–primary endpoints. Procedural times and patient satisfaction, while valid endpoints, are important subjects of study, but Dr. Moses was not alone in suggesting this study deserves validation.
In particular, there appeared to be a consensus among panelists that a larger multicenter study looking at hard endpoints, such as MACE, would be more compelling. They indicated that even if CTCA poses a very low risk of meaningful complications, it does add expense and an extra step.
Dr. Jones reported no potential conflicts of interest. Dr. Moses reported financial relationships with Covanos, Orchestra Biomed, Ostial, and Xenter.
BOSTON – Coronary angiography in patients who have previously undergone cardiac artery bypass grafting (CABG) is challenging, but the procedure can be streamlined and made safer when preprocedural CT coronary angiography (CTCA) is performed to plan the intervention, according to a randomized controlled trial.
In this study, all three endpoints, including a reduction in the incidence of contrast-induced nephropathy (CIN) and duration of the procedure, were met, according to Daniel Jones, MBBS, PhD.
Preprocedural CTCA was also associated with about a 40% improvement in patient satisfaction.
“When logistically possible, CTCA should be considered for any stable postbypass patient undergoing coronary angiography,” said Dr. Jones, who supported this assertion with data presented at the Transcatheter Cardiovascular Therapeutics annual meeting.
In this study, called BYPASS-CTCA, 688 patients with a prior CABG scheduled for invasive coronary angiography were randomized to a preprocedural CTCA or no preprocedural CTCA. Patients with stable angina and those with a non–ST elevated acute coronary syndrome were eligible. Those with ST-segment elevated MI or severe renal impairment (eGFR < 20 mL/min) were excluded.
All three co–primary endpoints favor CTCA
CTCA relative to no CTCA provided a significant advantage for all three of the coprimary endpoints, which were procedure duration, CIN as defined by KDIGO criteria, and patient satisfaction as measured by questionnaire.
The procedure duration was reduced by almost 21 minutes, cutting the time from nearly 39 minutes to less than 18 minutes (P < .001). This relative reduction was of similar magnitude across groups, such as those with or without acute coronary syndrome and procedures performed by a senior or a junior operator.
“Even when you include the preprocedural CTCA evaluation time, there was still a significant reduction [P < .001] in duration for those in the CTCA arm,” reported Dr. Jones, honorary consultant cardiologist, Barts Heart Centre, Queen Mary University, London.
The rates of CIN following the procedure in this study, which had a follow-up of 12 months, were 3.4% versus 27.9% (P < .0001) in the preprocedural CTCA and non-CTCA groups, respectively. Again, a sensitivity analysis showed a similar magnitude of risk reduction across all subgroups evaluated.
CTCA planning reduced contrast exposure
The reduced risk of CIN was consistent with a large reduction in contrast exposure for those in the CTCA group (77.4 vs. 173.0 mL; P < .001). The advantage narrowed substantially when adding in contrast exposure from CTCA, but still remained statistically significant (148.9 vs. 173.0 mL; P < .001).
Dr. Jones did not speculate about the specific reasons for the 40% improvement in patient satisfaction among those who underwent preprocedural CTCA relative to those who did not, but, again, a sensitivity analysis showed consistency across subgroups defined by race, operator experience, and underlying diagnosis.
Numerous secondary endpoints also favored CTCA over no CTCA. This included fewer catheters used to complete the procedure (three vs. four; P < .001), a greater likelihood that the procedure was performed with radial access (76.9% vs. 56.7%), and lower rates of procedural complications (2.3% vs. 10.8%; P < .001). This latter category included fewer vascular access complications such as bleeding (0.6 % vs. 4.4%; P = .007) and periprocedural MI (0.6% vs. 6.4%; P < 0.001).
In a graph of time to first major adverse cardiovascular event (MACE), the curves separated almost immediately with a consistently lower rate maintained in the CTCA arm over the 12 months of follow-up, but this is observational. Dr. Jones acknowledged that this trial was not powered to show a difference in MACE.
Study intriguing but not definitive
In a panel discussion that followed the presentation of these results at the meeting, sponsored by the Cardiovascular Research Foundation, some reservations with this study were expressed. In particular, several of the panelists, including Jeffrey W. Moses, MD, director of interventional cardiovascular therapeutics, Columbia University Medical Center, New York, expressed surprise at the 27% rate of CIN, which he considered uncommonly high even in a high-risk population.
The unusual rate of CIN was also considered problematic given that it was the most significant clinical outcome among the three co–primary endpoints. Procedural times and patient satisfaction, while valid endpoints, are important subjects of study, but Dr. Moses was not alone in suggesting this study deserves validation.
In particular, there appeared to be a consensus among panelists that a larger multicenter study looking at hard endpoints, such as MACE, would be more compelling. They indicated that even if CTCA poses a very low risk of meaningful complications, it does add expense and an extra step.
Dr. Jones reported no potential conflicts of interest. Dr. Moses reported financial relationships with Covanos, Orchestra Biomed, Ostial, and Xenter.
AT TCT 2022
‘Amazing’ data for cheap beta-blocker gel for diabetic foot ulcers
STOCKHOLM – Esmolol hydrochloride gel (Galnobax, NovoLead) appears to be a safe and effective novel topical treatment option for diabetic foot ulcers, according to results from a new trial of the drug, which is widely available as a generic and is inexpensive.
Of note, the proportion of participants achieving target ulcer closure at 12 weeks with esmolol (plus standard of care) was around 60% compared with just over 40% in patients who received standard of care alone.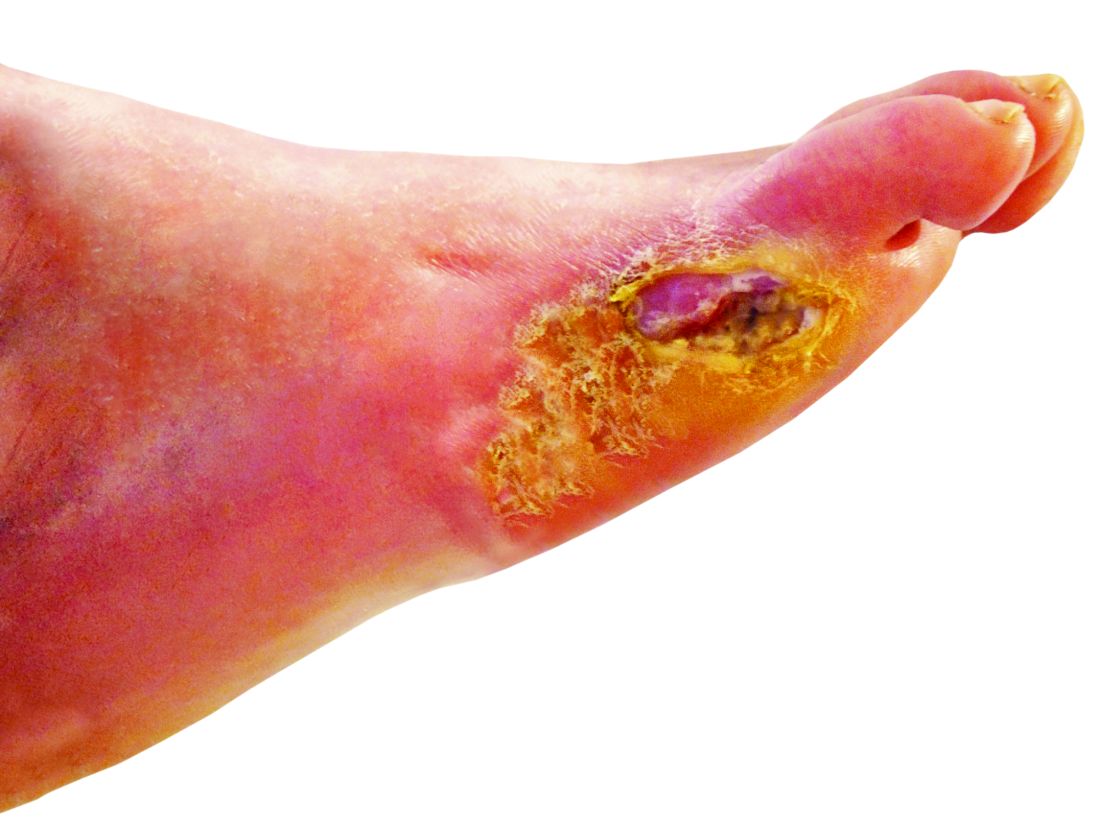
Presenting the findings at this year’s annual meeting of the European Association for the Study of Diabetes was Ashu Rastogi, MD, a professor of endocrinology at the Postgraduate Institute of Medical Education and Research in Chandigarh, India.
“Esmolol can be given topically as a 14% gel and is a novel treatment option in diabetic foot ulcer,” said Dr. Rastogi.
Esmolol, a short-acting beta-adrenergic blocker, is currently approved by the U.S. Food and Drug Administration for cardiac indications only, such as short-term use for controlling supraventricular tachycardia. Beta-blockers are also used to treat hypertension.
However, esmolol has also been repurposed and formulated as a topical gel for the treatment of hard-to-heal diabetic foot ulcers (mainly neuropathic grade 1).
Audience member Ketan Dhatariya, MBBS, MD, PhD, a National Health Service consultant in diabetes, endocrinology, and general medicine and honorary senior lecturer at Norfolk and Norwich University Hospitals, England, enthused about the findings.
“This is an amazing study. I’m part of a working group looking at the updating of a guideline for the International Working Group of the Diabetic Foot, reviewing all the studies on wound healing, specifically pharmacological interventions. This is way beyond anything shown to date in terms of medical intervention. [The authors] should be congratulated; this is really astounding,” he told this news organization.
“Right now, there is very little out there in terms of pharmacological interventions that have shown benefit,” he added. “Once this study has been peer-reviewed and is published properly, it is potentially game-changing because it is a generic, worldwide, cheap, and freely available medication.”
Study across 27 sites in India
Prior phase 1/2 data have shown that 60% of ulcers completely closed with esmolol (14% gel) compared with 39% with standard of care. Encouraged by these findings, a phase 3 randomized, double-blind placebo-controlled study was conducted across 27 sites in India.
Patients were a mean age of 56 years, and had a body mass index (BMI) of 25-26 kg/m2 and mean hemoglobin A1c of 8.4%-8.7%. Around 70% of participants were men. Mean ulcer area was approximately 460-500 mm2, two-thirds of the ulcers were plantar, and mean ulcer duration was 40-50 weeks.
After screening and discontinuations (39 participants), a 12-week treatment phase began with patients randomized to one of three groups: esmolol (14% gel) along with standard of care administered twice daily (57 completers); standard of care only (63 completers); or vehicle gel (placebo) along with standard of care administered twice daily (17 completers).
Standard of care comprised wound cleaning, debridement, maintenance of moist wound environment, twice-daily fresh bandages, and off-loading footwear as needed, and was provided to all participants irrespective of study group.
The 12-week treatment period was followed by an observation period of 12 weeks up to the 24-week study endpoint.
The primary efficacy endpoint was the proportion of participants achieving target ulcer closure (100% re-epithelialization without drainage or dressing requirement) within the 12-week treatment phase.
Secondary endpoints included time to target ulcer closure during the 12-week treatment phase and proportion of participants achieving target ulcer closure by 24 weeks (end of study). Investigators were blinded throughout.
Subanalyses were conducted based on ulcer location, size, and age, as well as estimated glomerular filtration rate less than 90 mL/min and ankle-brachial index under 0.9 but greater than 0.7.
50% more patients on esmolol had complete ulcer closure
The proportion of participants with complete ulcer closure at 12 weeks was 60.3% in the esmolol plus standard of care group, compared with 41.7% with standard of care only, a difference of 18.6% (odds ratio, 2.13; P = .0276).
“The 24-week end-of-study data show what happened in the 12 weeks following end of treatment,” said Dr. Rastogi, turning to results showing that by 24 weeks the proportion of participants with complete ulcer closure was 77.2% versus 55.6%, respectively, with a difference of 21.6% (OR, 2.71; P = .013).
Time to ulcer closure (a secondary endpoint) was similar between the esmolol plus standard of care vs. standard of care groups (74.3 vs. 72.5 days).
The impact of ulcer location on complete ulcer closure, a subanalysis, showed a higher proportion of patients experienced complete ulcer closure with esmolol plus standard of care versus standard of care. For example, in plantar-based ulcers, esmolol led to complete closure in 58.7% vs. 43.1%, while for nonplantar ulcers, complete closure was found in 63.6% vs. 38.1%.
In wounds less than 5 cm2, the proportion of complete closures was 66.0% vs. 50.0% for esmolol compared with standard of care alone, while in wounds over 5 cm2, these proportions were 47.6% vs. 26.9%.
Subanalyses also showed that esmolol was substantially better in patients with BMI greater than 25, ulcer duration over 12 weeks, and A1c above 8%.
Also, a subanalysis stratified by “real-life” situations favored esmolol, showing a 50.9% difference in the proportion of patients with diabetic foot ulcer healing in those with a history of hypertension and a 31.8% difference favoring esmolol in those with an abnormal electrocardiogram.
Overall, the proportions of patients who had an adverse event were 13.2%, 18.4%, and 37.5% in the esmolol plus standard of care, standard of care alone, and vehicle plus standard of care groups, respectively, and the vast majority were unrelated to study drug. There were no serious adverse events in the esmolol plus standard of care group.
A class effect of beta blockers?
The proposed mechanism of action of esmolol relates to a sequence of reducing inflammation (via vasodilation, fibroblast migration, and cytokine reduction); proliferation by beta-blockade (improves keratinocyte migration and epithelialization); and remodeling (increases collagen turnover).
Asked by an audience member if the observations were a class effect and systemic effect of beta-blockers, Dr. Rastogi said he could not say for sure that it was a class effect, but they deliberately used a beta-1 adrenergic receptor antagonist.
“It may not be a systemic effect because we have some patients who use beta-blockers systemically and they still have diabetic foot ulcers,” he said.
Dr. Rastogi and Dr. Dhatariya have reported no relevant financial relationships.
A version of this article first appeared on Medscape.com.
FROM EASD 2022
Could exercise improve bone health in youth with type 1 diabetes?
In a small cross-sectional study of 10- to 16-year-old girls with and without type 1 diabetes, both groups were equally physically active, based on their replies to the bone-specific physical activity questionnaire (BPAQ).
However, among the more sedentary girls (with BPAQ scores below the median), those with type 1 diabetes had worse markers of bone health in imaging tests compared with the girls without diabetes.
the researchers summarize in a poster presented at the annual meeting of the American Society of Bone and Mineral Research.
However, this is early research and further study is needed, the group cautions.
“Ongoing studies with objective measures of physical activity as well as interventional studies will clarify whether increasing physical activity may improve bone health and reduce fracture risk in this vulnerable group,” they conclude.
“If you look at the sedentary kids, there’s a big discrepancy between the kids who have diabetes and the control kids, and that’s if we’re looking at radius or tibia or trabecular bone density or estimated failure load,” senior author Deborah M. Mitchell, MD, said in an interview at the poster session.
However, “when we look at the kids who are more physically active, we’re really not seeing as much difference [in bone health] between the kids with and without diabetes,” said Dr. Mitchell, a pediatric endocrinologist at Massachusetts General Hospital and assistant professor at Harvard Medical School, Boston.
But she also acknowledged, “There’s all sorts of caveats, including that this is retrospective questionnaire data.”
However, if further, rigorous studies confirm these findings, “physical activity is potentially a really effective means of improving bone quality in kids with type 1 diabetes.”
“This study suggests that bone-loading physical activity can substantially improve skeletal health in children with [type 1 diabetes] and should provide hope for patients and their families that they can take some action to prevent or mitigate the effects of diabetes on bone,” coauthor and incoming ASBMR President Mary L. Bouxsein, PhD, told this news organization in an email.
“We interpret these data as an important reason to advocate for increased time in moderate to vigorous bone-loading activity,” said Dr. Bouxsein, professor, department of orthopedic surgery, Harvard Medical School, Boston, “though the ‘dose’ in terms of hours per day or episodes per week to promote optimal bone health is still to be determined.”
“Ongoing debate,” “need stronger proof”
Asked for comment, Laura K. Bachrach, MD, who was not involved with the research, noted: “Activity benefits the development of bone strength through effects on bone geometry more than ‘density,’ and conversely, lack of physical activity can compromise gains in cortical bone diameter and thickness.”
However, “there is ongoing debate about the impact of type 1 diabetes on bone health and the factor(s) determining risk,” Dr. Bachrach, a pediatric endocrinologist at Stanford Children’s Health, Palo Alto, Calif., told this news organization in an email.
The current findings suggest “that physical activity in adolescent girls provided protection against potential adverse effects of type 1 diabetes,” said Dr. Bachrach, who spoke about bone fragility in childhood in a video commentary in 2021.
Study strengths, she noted, “include the rigor and expertise of the investigators, use of multiple surrogate measures that capture bone geometry/microarchitecture, as well as the inclusion of healthy local controls.”
“The study is limited by the cross-sectional design and subjects who opted, or not, to be active,” she added. “Stronger proof of the protective effects of activity on bone health in type 1 diabetes would require a randomized longitudinal intervention study, as alluded to by the authors of the study.”
Hypothesis: Those with type 1 diabetes acquire less bone mass in early 20s
The excess fracture risk in children with type 1 diabetes has been previously reported and is 14%-35% higher than the fracture risk in children without diabetes, Dr. Bouxsein explained. And “between 30% to 50% of kids [with type 1 diabetes] will have a fracture before the age of 18, so the excess fracture risk in diabetes is not clinically obvious,” she added.
However, “several lines of evidence strongly suggest that bone mass and microarchitecture at the time of peak bone mass (early 20s) is a major determinant of fracture risk throughout the lifespan,” she noted.
“Our hypothesis,” Dr. Bouxsein said, “is that the metabolic disruptions of diabetes, when they are present during the acquisition of peak bone mass, interfere with optimal bone development, and therefore may contribute to increased fracture risk later in life.”
Dr. Bachrach agreed that “peak bone strength is achieved by early adulthood, making childhood and adolescence important times to optimize bone health,” and that “peak bone strength is a predictor of lifetime risk of osteoporosis.”
“The diagnosis of pediatric osteoporosis is made when a child or teen sustains a vertebral fracture or femur fracture with minimal or no trauma,” she explained. “The diagnosis can also be made in a pediatric patient with low BMD [bone mineral density] for age in combination with a history of several long-bone fractures.”
Dr. Mitchell noted that type 1 diabetes is associated with a higher risk of fractures, which is sixfold in adults. In another study, she said, the group showed that in 10- to 16-year-old girls who’ve only had diabetes for a few years, “trabecular bone density is lower, they have lower estimated failure load, and longitudinally when we follow them, at least at the radius, we’re seeing bone loss at a relatively young age when we wouldn’t be expecting to see bone loss.”
80 girls enrolled, half had type 1 diabetes
Researchers enrolled 36 girls with type 1 diabetes and 44 girls without type 1 diabetes (controls) who were a mean age of 14.7 years and most (92%) were White. The girls with and without diabetes had similar rates of previous fractures (44% and 51%).
Those with diabetes had been diagnosed at a mean age of 9 years and had had diabetes for a mean of 4.6 years.
Researchers calculated participants’ total BPAQ scores based on type, duration, and frequency of bone-loading activities.
Participants had dual-energy X-ray absorptiometry scans to determine areal bone mineral density (BMD) at the total hip, femoral neck, lumbar spine, and whole body less head.
They also had high-resolution peripheral quantitative computed tomography at the distal tibia and radius to determine volumetric BMD, bone microarchitecture, and estimated bone strength (calculated using microfinite element analysis).
The two groups had similar total BPAQ scores (57.3 and 64.6), with a median score of 49.
BPAQ scores were positively associated with areal BMD at all sites (whole body, lumbar spine, total hip, femoral neck, and 1/3 radius) and with trabecular BMD and estimated failure load at the distal radius and tibia (P < .05 for all, adjusted for bone age).
Among participants with low physical activity (BPAQ below the median), compared with controls, those with type 1 diabetes had 6.6% lower aerial BMD at the lumbar spine (0.868 vs. 0.929 g/cm3; P = .04), 8% lower trabecular volumetric BMD at the distal radius (128.5 vs. 156.8 mg/cm3; P = .01), and 12% lower estimated failure load. Results at the distal tibia were similar.
Next steps
“More observational studies in males and females across a broader age spectrum would be helpful,” Dr. Bachrach noted. “The ‘gold standard’ model would be a long-term randomized controlled activity intervention study.”
“Further studies are underway [in girls and boys] using objective measures of activity including accelerometry and longitudinal observation to help confirm the findings from the current study,” Dr. Bouxsein said. “Ultimately, trials of activity interventions in children with [type 1 diabetes] will be the gold standard to determine to what extent physical activity can mitigate bone disease in [type 1 diabetes],” she agreed.
The study authors and Dr. Bachrach have reported no relevant financial relationships.
A version of this article first appeared on Medscape.com.
FROM ASBMR 2022
Eat more dairy, less red meat to prevent type 2 diabetes
STOCKHOLM – Among animal protein foods, low-fat dairy consumption may minimize the risk of developing type 2 diabetes while red meat raises that risk, a new analysis finds.
“A plant-based dietary pattern with limited intake of meat, moderate intake of fish, eggs, and full-fat dairy, and habitual consumption of yogurt, milk, or low-fat dairy, might represent the most feasible, sustainable, and successful population strategy to optimize the prevention of type 2 diabetes,” lead author Annalisa Giosuè, MD, of the University of Naples (Italy) Federico II, told this news organization.
She presented the findings from an umbrella review of 13 dose-response meta-analyses of prospective cohort studies at the annual meeting of the European Association for the Study of Diabetes.
The study is believed to be the first comprehensive overview of the available evidence from all published meta-analyses on the relationship between well-defined amounts of animal-origin foods and the risk of type 2 diabetes.
Dr. Giosuè and colleagues focused on animal-based foods because they represent a gap in most guidelines for type 2 diabetes prevention, she explained.
“The existing evidence and dietary recommendations for type 2 diabetes prevention are mainly based on the appropriate consumption of plant foods: high amounts of the fiber-rich ones and low consumption of the refined ones as well as those rich in free sugars. And also on the adequate choice among fat sources – reduction of saturated fat sources like butter and cream and replacement with plant-based poly- and monounsaturated fat sources like nontropical vegetable oils. But not on the most suitable choices among different animal foods for the prevention of type 2 diabetes,” she explained.
The new findings are in line with the Mediterranean diet in that, while plant based, it also limits red-meat consumption, but not all animal-based foods, and has consistently been associated with a reduced risk of type 2 diabetes. Vegetarian diets have also been associated with a reduced risk of type 2 diabetes, but far less evidence is available for that, she said.
Asked for comment, session moderator Matthias Schulze, MD, head of the department of molecular epidemiology at the German Institute of Human Nutrition, Berlin, said: “Decreasing intake of red and processed meat is already a strong recommendation, and these data support that. You have to make choices for and against [certain] foods. So, if you decide to eat less red meat, then the question is what do you eat instead? This study shows that specifically other animal products, like dairy and ... fish or white meat sources ... are healthy among the animal-based foods. But you could also obviously look at plant-based foods as protein sources as well.”
And Dr. Schulze noted that the data suggest another dimension to type 2 diabetes prevention beyond simply focusing on weight loss.
“You can achieve weight loss with very different diets. Diet quality plays an important role. These data support that if you look at diabetes prevention, then you would focus on people with high intakes of specific animal-based foods, besides looking at overweight and obesity. Then you could intervene to reduce this intake, with potential substitutions with other animal foods like fish or white meat, or plant-based sources of proteins.”
Red meat damages, dairy protects
The 13 meta-analyses included 175 summary risk ratios for type 2 diabetes incidence for the consumption of total meat, red meat, white meat, processed meats, fish, total dairy, full-fat dairy, low-fat dairy, milk, cheese, yogurt, or eggs.
Significant increases in the risk of developing type 2 diabetes were found for consumption of 100 g/day of total meat (SRR, 1.20; 20% increase) and red meat (SRR, 1.22, 22% increase) and with 50 g/day of processed meats (SRR, 1.30; 30% increase). A borderline increased risk was also seen for 50 g/day of white meat (SRR, 1.04; 4% increase).
The opposite was found for dairy foods. Inverse associations for type 2 diabetes development were found for an intake of 200 g/day of total dairy (SRR, 0.95; 5% reduction), low-fat dairy (SRR, 0.96; 4% reduction), milk (SRR, 0.90; 10% reduction), and for 100 g/day of yogurt (SRR, 0.94, 6% reduction).
Neutral (nonsignificant) effects were found for 200 g/day of full-fat dairy (SRR, 0.98) and for 30 g/day of cheese (SRR, 0.97). Fish consumption also had a neutral association with type 2 diabetes risk (SRR, 1.04 for 100 g/day) as did one egg per day (SRR, 1.07), but evidence quality was low.
And, Dr. Giosuè noted during her presentation, these relationships could change with alterations in the amounts consumed.
Dr. Schulze commented: “Fish is more clearly related to reduced cardiovascular risk than for preventing type 2 diabetes, where we’ve had mixed results. They might not always be the same.”
What are the mechanisms?
The reasons for these positive and negative associations aren’t entirely clear, but Dr. Giosuè noted that dairy products contain several nutrients, vitamins, and other components, such as calcium and vitamin D, that have potential beneficial effects on glucose metabolism.
In particular, she said, “Whey proteins in milk have a well-known beneficial effect on the regulation of the rise of glucose levels in the blood after meals, and also on the control of appetite and body weight.”
Moreover, probiotics found in yogurt have been linked to protective effects against weight gain and obesity, which “may in part [explain] the beneficial role of yogurt in type 2 diabetes prevention.”
Meat, in contrast, is full of cholesterol, saturated fatty acids, and heme iron, which can promote subclinical inflammation and oxidative stress, which may in turn, affect insulin sensitivity, Dr. Giosuè explained. What’s more, “processed meats also contain nitrates, nitrites, and sodium that can contribute to pancreatic cell damage and vascular dysfunction, thus affecting insulin sensitivity.”
And white meat (poultry) has a lower fat content than red meats such as beef, lamb, and pork, as well as a more favorable fatty acid profile and a lower heme-iron content, she said in an interview.
What about vegan diets? The devil is in the details
Asked about the relative health benefits of diets that completely eliminate animal-based foods, Dr. Giosuè replied: “What is important to keep in mind when hearing about the potential of vegan diets to prevent, or manage, or induce the remission of type 2 diabetes, is that the inclusion in the diet of solely foods of plant origin does not mean ‘automatically’ to eat only foods that are good for diabetes prevention.”
“Just like the exclusion of all foods of animal origin is not equivalent to reduce the risk of type 2 diabetes ... Solid evidence has demonstrated that plant foods which are refined and/or rich in free sugars like white bread, biscuits, and sweetened beverages are as harmful as red and processed meats for diabetes incidence and progression.”
Dr. Giosuè and Dr. Schulze have reported no relevant financial relationships.
A version of this article first appeared on Medscape.com.
AT EASD 2022