User login
Hospital Safety Grade
The Institute of Medicine (IOM) reported over a decade ago that between 44,000 and 98,000 deaths occurred every year due to preventable medical errors.[1] The report sparked an intense interest in identifying, measuring, and reporting hospital performance in patient safety.[2] The report also sparked the implementation of many initiatives aiming to improve patient safety.[3] Despite these efforts, there is still much room for improvement in the area of patient safety.[4] As the public has become more aware of patient safety issues, there has been an increased demand for information on hospital safety. The Leapfrog Group, a leading organization that examines and reports on hospital performance in patient safety, cites the IOM report as providing the focus that their newly formed organization required.[5]
Using 26 national measures of safety, The Leapfrog Group calculates a numeric Hospital Safety Score for over 2,600 acute care hospitals in the United States.[6] The primary data used to calculate this score are collected through the Leapfrog Hospital Survey, the Agency for Healthcare Research and Quality, the Centers for Disease Control and Prevention, and the Centers for Medicare and Medicaid Services (CMS). The American Hospital Association's (AHA) Annual Survey is used as a secondary data source as necessary. The Leapfrog Group conducts the survey annually, and substantial efforts are put forth to invite hospital administrators to participate in the survey. Participation in the Leapfrog survey is optional and free of charge.
Leapfrog recently moved a step further in their evaluation of hospital safety by releasing the Hidden Surcharge Calculator to enable employers to estimate the hidden surcharge they pay for their employees and dependents because of hospital errors.[7] The calculation depends largely on the letter grade (AF) that the hospital received from Leapfrog's Hospital Safety Score. For example, Leapfrog estimated a commercially insured patient admitted to a hospital with a grade of C or lower would incur $1845 additional cost per admission than if the same patient was admitted to a hospital with a grade of A.[7] The Leapfrog group encourages employers and payers to use this information to adjust benefits structures so that employees are discouraged from using hospitals that receive lower hospital safety scores. Leapfrog also encourages payers to negotiate lower reimbursement rates for hospitals with lower hospital safety scores.
The accuracy of Leapfrog's hospital safety grades warrants attention because of the methodology used to score hospitals that do not participate in the Leapfrog Survey. One common barrier that prevents hospitals from participating is the amount of effort required to complete the annual survey, including extensive inputs from hospital executives and staff. According to Leapfrog, 4 to 6 days are required for a hospital to compile the necessary survey data.[8] Leapfrog estimates a 90‐minute commitment for the hospital chief executive officer or designated administrator to enter the information into the online questionnaire. This is a significant commitment for many hospitals. As a result, among the approximately 2600 acute care hospitals covered by Leapfrog's 2012 to 2013 safety grading, only 1100 (or 42.3%) actually participated in the Leapfrog hospital survey. This limits Leapfrog's ability to provide accurate scores and assign fair safety grades to many hospitals.
METHODS
Leapfrog Hospital Safety Score
Leapfrog's designated Hospital Safety Score is determined by 26 measures. The set of safety measures and their relative weight are determined by a 9‐member Leapfrog expert panel of patient safety experts.[9] The hospital safety score is divided equally into 2 domains of safety measures: process/structural and outcomes.[6] The process measures represent how often a hospital gives patients recommended treatment for a given medical condition or procedure, whereas structural measures represent the environment in which patients receive care.[10] The process/structural measures include computerized physician order entry (CPOE), intensive care unit (ICU) physician staffing (IPS), 8 Leapfrog safety practices, and 5 surgical care improvement project measures. The outcome measures represent what happens to a patient while receiving care. The outcomes domain includes 5 hospital‐acquired conditions and 6 patient safety indicators. A score is assigned and weighted for each measure. All scores are then summed to produce a single number denoting the safety performance score received by each hospital. Every hospital is assigned 1 of 5 letter grades depending on how the hospital's numeric score stands in safety performance relative to all other hospitals. The letter grade A denotes the best hospital safety performance, followed in order by letter grades B through F. The cutoffs for A and B grades represent the first and second quartile of hospital safety scores. The cutoff for the C grade represents the hospitals that were between the mean and 1.5 standard deviations below the mean. The cutoff for the D grade represents the hospitals that were between 1.5 and 3.0 standard deviations below the mean. F grades indicate safety scores more than 3.0 standard deviations below the mean.[11]
Nonparticipating Hospitals
The Leapfrog Survey contributes values for 11 of the 26 measures utilized to calculate the Hospital Safety Score. The score of a nonparticipating hospital will not reflect 8 of these 11 measures. For the 3 remaining measures, CPOE, IPS, and central line‐associated blood stream infection, secondary data from the AHA Survey, AHA Information Technology Supplement Survey, and CMS Hospital Compare were used as proxies, respectively (Table 1). The use of a proxy effectively limits the maximum score attainable by nonparticipating hospitals. For instance, 2 of these 3 measures, CPOE and IPS, are calculated on different scales depending on hospital survey participation status. For CPOE, nonparticipating hospitals are limited to a maximum of 65 out of 100 points; for IPS, they are limited to 85 out of 100 points.[6] Because the actual weight for each of these proxy measures is increased for nonparticipating hospitals in the calculation of the final score, their effective impact is exacerbated. The weight of CPOE and IPS measures in the overall weighted score are increased from 6.1% and 7.0% to 11.0% and 12.6%, respectively.
| Participants | Nonparticipants | |
|---|---|---|
| ||
| Process/structural measures (50% of score) | ||
| Computerized Physician Order Entry | 2012 Leapfrog Hospital Survey | 2010 IT Supplement (AHA) |
| ICU Physician Staffing (IPS) | 2012 Leapfrog Hospital Survey | 2011 AHA Annual Survey |
| Safe Practice 1: Leadership Structures and Systems | 2012 Leapfrog Hospital Survey | Excluded |
| Safe Practice 2: Culture Measurement, Feedback, and Intervention | 2012 Leapfrog Hospital Survey | Excluded |
| Safe Practice 3: Teamwork Training and Skill Building | 2012 Leapfrog Hospital Survey | Excluded |
| Safe Practice 4: Identification and Mitigation of Risks and Hazards | 2012 Leapfrog Hospital Survey | Excluded |
| Safe Practice 9: Nursing Workforce | 2012 Leapfrog Hospital Survey | Excluded |
| Safe Practice 17: Medication Reconciliation | 2012 Leapfrog Hospital Survey | Excluded |
| Safe Practice 19: Hand Hygiene | 2012 Leapfrog Hospital Survey | Excluded |
| Safe Practice 23: Care of the Ventilated Patient | 2012 Leapfrog Hospital Survey | Excluded |
| SCIP‐INF‐1: Antibiotic Within 1 Hour | CMS Hospital Compare | CMS Hospital Compare |
| SCIP‐INF‐2: Antibiotic Selection | CMS Hospital Compare | CMS Hospital Compare |
| SCIP‐INF‐3: Antibiotic Discontinued After 24 Hours | CMS Hospital Compare | CMS Hospital Compare |
| SCIP‐INF‐9: Catheter Removal | CMS Hospital Compare | CMS Hospital Compare |
| SCIP‐VTE‐2: VTE Prophylaxis | CMS Hospital Compare | CMS Hospital Compare |
| Outcome measures (50% of score) | ||
| HAC: Foreign Object Retained | CMS HACs | CMS HACs |
| HAC: Air Embolism | CMS HACs | CMS HACs |
| HAC: Pressure Ulcers | CMS HACs | CMS HACs |
| HAC: Falls and Trauma | CMS HACs | CMS HACs |
| Central Line‐Associated Bloodstream Infection | 2012 Leapfrog Hospital Survey | CMS HAIs |
| PSI 4: Death Among Surgical Inpatients With Serious Treatable Complications | CMS Hospital Compare | CMS Hospital Compare |
| PSI 6: Collapsed Lung Due to Medical Treatment | CMS Hospital Compare | CMS Hospital Compare |
| PSI 12: Postoperative PE/DVT | CMS Hospital Compare | CMS Hospital Compare |
| PSI 14: Wounds Split Open After Surgery | CMS Hospital Compare | CMS Hospital Compare |
| PSI 15: Accidental Cuts or Tears From Medical Treatment | CMS Hospital Compare | CMS Hospital Compare |
Study Sample
We examined the Leapfrog safety grades for top hospitals," as ranked by U.S. News & World Report. Included in this sample were the top 15 ranked hospitals in each of the specialties, excluding those specialties whose ranks are based solely on reputation. Hospitals ranked in more than 1 specialty were only included once in the sample. This resulted in a final study sample of 35 top hospitals. Eighteen of these top hospitals participated in the Leapfrog Survey, whereas 17 did not.
Utilizing Leapfrog's spring 2013 methodology,[6] the Hospital Safety Scores for the 35 top hospitals were calculated. The mean safety score for the 18 participating hospitals was then compared with the mean score for the 17 nonparticipating hospitals. Finally, the safety scores for each of the 17 nonparticipating hospitals, listed in Table 2, were estimated as if they had participated in the Leapfrog Survey. To do this, we assumed that the 17 nonparticipating hospitals could each earn average scores for the CPOE, IPS, and 8 process/structural Leapfrog measures as received by their 18 participating counterparts.
| Participants | Leapfrog Grade | Nonparticipants | Leapfrog Grade |
|---|---|---|---|
| |||
| Brigham and Women's Hospital, Boston, MA | A | Abbott Northwestern Hospital, Minneapolis, MN | A |
| Duke University Medical Center, Durham, NC | A | Barnes‐Jewish Hospital/Washington University, St. Louis, MO | C |
| Massachusetts General Hospital, Boston, MA | B | Baylor University Medical Center, Dallas, TX | C |
| Mayo Clinic, Rochester, MN | A | Cedars‐Sinai Medical Center, Los Angeles, CA | C |
| Methodist Hospital, Houston, TX | A | Cleveland Clinic, Cleveland, OH | C |
| Northwestern Memorial Hospital, Chicago, IL | A | Florida Hospital, Orlando, FL | B |
| Ronald Reagan UCLA Medical Center, Los Angeles, CA | D | Hospital of the University of Pennsylvania, Philadelphia, PA | A |
| Rush University Medical Center, Chicago, IL | A | Indiana University Health, Indianapolis, IN | A |
| St. Francis Hospital, Roslyn, NY | A | Mount Sinai Medical Center, New York, NY | B |
| St. Joseph's Hospital and Medical Center, Phoenix, AZ | B | New York‐Presbyterian Hospital, New York, NY | C |
| Stanford Hospital and Clinics, Stanford, CA | A | NYU Langone Medical Center, New York, NY | A |
| Thomas Jefferson University Hospital, Philadelphia, PA | C | Ochsner Medical Center, New Orleans, LA | A |
| UCSF Medical Center, San Francisco, CA | B | Tampa General Hospital, Tampa, FL | C |
| University Hospitals Case Medical Center, Cleveland, OH | A | University of Iowa Hospitals and Clinics, Iowa City, IA | C |
| University of Michigan Hospitals and Health Centers, Ann Arbor, MI | A | University of Kansas Hospital, Kansas City, KS | A |
| University of Washington Medical Center, Seattle, WA | C | UPMC, Pittsburgh, PA | B |
| Vanderbilt University Medical Center, Nashville, TN | A | Yale‐New Haven Hospital, New Haven, CT | B |
| Wake Forest Baptist Medical Center, Winston‐Salem, NC | A | ||
RESULTS
Out of these 35 top hospitals, those that participated in the Leapfrog Survey generally received higher scores than the nonparticipants (Table 2). The group of participating hospitals received an average grade of A (mean safety score, 3.165; standard error of the mean [SE], 0.081), whereas the nonparticipating hospitals received an average grade of B (mean safety score, 3.012; SE, 0.047). These grades were consistent whether mean or median scores were used.
To further examine the potential bias against nonparticipating hospitals, the safety scores for each of the 17 nonparticipating hospitals were estimated as if they had participated in the Leapfrog Survey. The letter grade of this group increased from an average of B (mean safety score, 3.012; SE, 0.047) to an average of A (mean safety score, 3.216; SE, 0.046). Among the 17 nonparticipating hospitals, 15 showed an increase in safety score, of which 8 hospitals rescored a change in score significant enough to receive 1 or 2 letter grades higher (Table 3). Only 2 hospitals had slight decreases in safety score, without any impact on letter grade.
| Hospital | Original Score (Grade) | Estimated Scorea (Grade) |
|---|---|---|
| ||
| Abbott Northwestern Hospital, Minneapolis, MN | 3.17 (A) | 3.44 (A) |
| Barnes‐Jewish Hospital/Washington University, St. Louis, MO | 2.83 (C) | 3.11 (B) |
| Baylor University Medical Center, Dallas, TX | 2.90 (C) | 3.25 (A) |
| Cedars‐Sinai Medical Center, Los Angeles, CA | 2.92 (C) | 3.30 (A) |
| Cleveland Clinic, Cleveland, OH | 2.76 (C) | 2.78 (C) |
| Florida Hospital, Orlando, FL | 2.98 (B) | 3.38 (A) |
| Hospital of the University of Pennsylvania, Philadelphia, PA | 3.29 (A) | 3.26 (A) |
| Indiana University Health, Indianapolis, IN | 3.14 (A) | 3.37 (A) |
| Mount Sinai Medical Center, New York, NY | 3.01 (B) | 3.02 (B) |
| New York‐Presbyterian Hospital, New York, NY | 2.76 (C) | 3.15 (A) |
| NYU Langone Medical Center, New York, NY | 3.26 (A) | 3.30 (A) |
| Ochsner Medical Center, New Orleans, LA | 3.19 (A) | 3.59 (A) |
| Tampa General Hospital, Tampa, FL | 2.86 (C) | 3.05 (B) |
| University of Iowa Hospitals and Clinics, Iowa City, IA | 2.70 (C) | 3.00 (B) |
| University of Kansas Hospital, Kansas City, KS | 3.29 (A) | 3.35 (A) |
| UPMC, Pittsburgh, PA | 3.04 (B) | 3.24 (A) |
| Yale‐New Haven Hospital, New Haven, CT | 3.10 (B) | 3.08 (B) |
We applied the same methods to test the top 17 Honor Roll Hospitals as designated by US News & World Report; among them, half are participating hospitals and another half nonparticipating hospitals. One hospital, Johns Hopkins Hospital was not scored by Leapfrog because no relevant Medicare data are available for Leapfrog to calculate its safety score. For this reason, Johns Hopkins was excluded from our comparison. The results persist even with this smaller sample of top hospitals. The group of 8 participating hospitals had an average grade of A (mean safety score, 3.145; SE, 0.146), whereas another 8 nonparticipating hospitals received an average grade of B (mean safety score, 3.011; SE, 0.075).
DISCUSSION
The Leapfrog Group's intent to provide patient safety information to patients, physicians, healthcare purchasers, and hospital executives should be commended. However, the current methodology may disadvantage nonparticipating hospitals. The combination of lower maximum scores and increased weight of the CPOE and IPS scores may result in a lower hospital safety score than is justified. Nonparticipating hospitals may also face more intensive pressure from employers and payors to lower their reimbursement rates due to the newly released Leapfrog Hidden Surcharge Calculator.
Leapfrog acknowledges that the more data points a hospital has to be scored on, the better its opportunity to achieve a higher score.[8] This justification may lead to bias against nonparticipating hospitals. On the other hand, it is possible that hospitals with good safety records are more likely to participate in the Leapfrog Survey than those with poorer safety records. Without detailed nonresponse analysis from Leapfrog, it is impossible to know if there is a selection bias. Regardless, the Leapfrog result can subsequently misguide the payment rate negotiation between insurers and hospitals.
With this consideration in mind, Leapfrog should explicitly acknowledge the limitations of its methodology and consider revising it in future studies. For example, Leapfrog could only report on those measures for which there are data available for both participating and nonparticipating hospitals. Pending this revision, every effort must be made to distinguish between participating and nonparticipating hospitals. The outcomes of Leapfrog's hospital safety grades are made available online to consumers without distinguishing between participating and nonparticipating hospitals. The only method to differentiate the categories is to examine the data sources in detail amid a large volume of data. It is unlikely that consumers comparing hospital safety grades will take note of this caveat. Thus, Leapfrog's grading system can drastically misrepresent many nonparticipating hospitals' patient safety performances.
This study of The Leapfrog Group's Hospital Safety Score is not without limitations. The small sample utilized in this study limited the power of statistical testing. The difference in mean scores between participating and nonparticipating hospitals is not statistically significant. However, The Leapfrog Group uses specific numerical cutoff points for each letter grade classification. In this classification system statistical significance is not considered when assigning hospitals with different letter grades. It was clear that nonparticipating hospitals were more likely to receive lower letter grades than participating hospitals.
The small sample also posed challenges when attempting to account for missing data when comparing participating hospitals versus nonparticipating hospitals. Although a multiple imputation approach may have been ideal to address this, the small sample size coupled with the large amount of missing data (58% of hospitals did not participate in the Leapfrog Survey) led us to question the accuracy of this approach in this situation.[12] Instead, a crude, mean imputation approach was utilized, relying on the assumption that nonresponding hospitals had the same mean performance as responding hospitals on those domains where data were missing. In this study, we purposely selected a sample of hospitals from U.S. News & World Report's top hospitals. We believe the mean imputation approach, although not perfect, is appropriate for this sample of hospitals. Future study, however, should examine if hospitals that anticipated lower performance scores would be less likely to participate in the Leapfrog Survey. This would help strengthen Leapfrog's methodology in dealing with nonresponsive hospitals.
ACKNOWLEDGMENTS
Disclosures: Harold Paz is the CEO of Penn State Hershey Medical Center, which did not participate in the Leapfrog Survey. The authors have no financial conflicts of interest to report.
- , , . To Err Is Human: Building a Safer Health System. Washington, DC: National Academy Press; 2000.
- , , , , . The “To Err is Human” report and the patient safety literature. Qual Saf Health Care. 2006;15(3):174–178.
- , . A call to excellence. Health Aff (Millwood). 2003;22(2):113–115.
- US Department of Health and Human Services. Adverse events in hospitals: national incidence among Medicare beneficiaries. Available at: http://oig.hhs.gov/oei/reports/oei‐06‐09‐00090.pdf. Published November 2010. Accessed on August 2, 2013.
- The Leapfrog Group. The Leapfrog Group—fact sheet 2013. Available at: https://leapfroghospitalsurvey.org/web/wp‐content/uploads/Fsleapfrog.pdf. Accessed October 9, 2013.
- The Leapfrog Group. Hospital Safety score scoring methodology. Available at: http://www.hospitalsafetyscore.org/media/file/HospitalSafetyScore_ScoringMethodology_May2013.pdf. Published May 2013. Accessed June 17, 2013.
- The Leapfrog Group. The Hidden Surcharge Americans Pay for Hospital Errors 2013. Available at: http://www.leapfroggroup.org/employers_purchasers/HiddenSurchargeCalculator. Accessed August 2, 2013.
- The Leapfrog Group. 2013 Leapfrog Hospital Survey Reference Book 2013. https://leapfroghospitalsurvey.org/web/wp‐content/uploads/reference.pdf. Published April 1, 2013. Accessed June 17, 2013.
- , , , et al. Safety in numbers: the development of Leapfrog's composite patient safety score for U.S. hospitals [published online ahead of print September 27, 2013]. J Patient Saf. doi: 10.1097/PTS.0b013e3182952644.
- The Leapfrog Group. Measures in detail. Available at: http://www. hospitalsafetyscore.org/about‐the‐score/measures‐in‐detail. Accessed June 17, 2013.
- The Leapfrog Group. Explanation of safety score grades. Available at: http://www.hospitalsafetyscore.org/media/file/ExplanationofSafety ScoreGrades_May2013.pdf. Published May 2013. Accessed June 17, 2013.
- , , , et al. Multiple imputation for missing data in epidemiological and clinical research: potential and pitfalls. BMJ. 2009;338:b2393.
The Institute of Medicine (IOM) reported over a decade ago that between 44,000 and 98,000 deaths occurred every year due to preventable medical errors.[1] The report sparked an intense interest in identifying, measuring, and reporting hospital performance in patient safety.[2] The report also sparked the implementation of many initiatives aiming to improve patient safety.[3] Despite these efforts, there is still much room for improvement in the area of patient safety.[4] As the public has become more aware of patient safety issues, there has been an increased demand for information on hospital safety. The Leapfrog Group, a leading organization that examines and reports on hospital performance in patient safety, cites the IOM report as providing the focus that their newly formed organization required.[5]
Using 26 national measures of safety, The Leapfrog Group calculates a numeric Hospital Safety Score for over 2,600 acute care hospitals in the United States.[6] The primary data used to calculate this score are collected through the Leapfrog Hospital Survey, the Agency for Healthcare Research and Quality, the Centers for Disease Control and Prevention, and the Centers for Medicare and Medicaid Services (CMS). The American Hospital Association's (AHA) Annual Survey is used as a secondary data source as necessary. The Leapfrog Group conducts the survey annually, and substantial efforts are put forth to invite hospital administrators to participate in the survey. Participation in the Leapfrog survey is optional and free of charge.
Leapfrog recently moved a step further in their evaluation of hospital safety by releasing the Hidden Surcharge Calculator to enable employers to estimate the hidden surcharge they pay for their employees and dependents because of hospital errors.[7] The calculation depends largely on the letter grade (AF) that the hospital received from Leapfrog's Hospital Safety Score. For example, Leapfrog estimated a commercially insured patient admitted to a hospital with a grade of C or lower would incur $1845 additional cost per admission than if the same patient was admitted to a hospital with a grade of A.[7] The Leapfrog group encourages employers and payers to use this information to adjust benefits structures so that employees are discouraged from using hospitals that receive lower hospital safety scores. Leapfrog also encourages payers to negotiate lower reimbursement rates for hospitals with lower hospital safety scores.
The accuracy of Leapfrog's hospital safety grades warrants attention because of the methodology used to score hospitals that do not participate in the Leapfrog Survey. One common barrier that prevents hospitals from participating is the amount of effort required to complete the annual survey, including extensive inputs from hospital executives and staff. According to Leapfrog, 4 to 6 days are required for a hospital to compile the necessary survey data.[8] Leapfrog estimates a 90‐minute commitment for the hospital chief executive officer or designated administrator to enter the information into the online questionnaire. This is a significant commitment for many hospitals. As a result, among the approximately 2600 acute care hospitals covered by Leapfrog's 2012 to 2013 safety grading, only 1100 (or 42.3%) actually participated in the Leapfrog hospital survey. This limits Leapfrog's ability to provide accurate scores and assign fair safety grades to many hospitals.
METHODS
Leapfrog Hospital Safety Score
Leapfrog's designated Hospital Safety Score is determined by 26 measures. The set of safety measures and their relative weight are determined by a 9‐member Leapfrog expert panel of patient safety experts.[9] The hospital safety score is divided equally into 2 domains of safety measures: process/structural and outcomes.[6] The process measures represent how often a hospital gives patients recommended treatment for a given medical condition or procedure, whereas structural measures represent the environment in which patients receive care.[10] The process/structural measures include computerized physician order entry (CPOE), intensive care unit (ICU) physician staffing (IPS), 8 Leapfrog safety practices, and 5 surgical care improvement project measures. The outcome measures represent what happens to a patient while receiving care. The outcomes domain includes 5 hospital‐acquired conditions and 6 patient safety indicators. A score is assigned and weighted for each measure. All scores are then summed to produce a single number denoting the safety performance score received by each hospital. Every hospital is assigned 1 of 5 letter grades depending on how the hospital's numeric score stands in safety performance relative to all other hospitals. The letter grade A denotes the best hospital safety performance, followed in order by letter grades B through F. The cutoffs for A and B grades represent the first and second quartile of hospital safety scores. The cutoff for the C grade represents the hospitals that were between the mean and 1.5 standard deviations below the mean. The cutoff for the D grade represents the hospitals that were between 1.5 and 3.0 standard deviations below the mean. F grades indicate safety scores more than 3.0 standard deviations below the mean.[11]
Nonparticipating Hospitals
The Leapfrog Survey contributes values for 11 of the 26 measures utilized to calculate the Hospital Safety Score. The score of a nonparticipating hospital will not reflect 8 of these 11 measures. For the 3 remaining measures, CPOE, IPS, and central line‐associated blood stream infection, secondary data from the AHA Survey, AHA Information Technology Supplement Survey, and CMS Hospital Compare were used as proxies, respectively (Table 1). The use of a proxy effectively limits the maximum score attainable by nonparticipating hospitals. For instance, 2 of these 3 measures, CPOE and IPS, are calculated on different scales depending on hospital survey participation status. For CPOE, nonparticipating hospitals are limited to a maximum of 65 out of 100 points; for IPS, they are limited to 85 out of 100 points.[6] Because the actual weight for each of these proxy measures is increased for nonparticipating hospitals in the calculation of the final score, their effective impact is exacerbated. The weight of CPOE and IPS measures in the overall weighted score are increased from 6.1% and 7.0% to 11.0% and 12.6%, respectively.
| Participants | Nonparticipants | |
|---|---|---|
| ||
| Process/structural measures (50% of score) | ||
| Computerized Physician Order Entry | 2012 Leapfrog Hospital Survey | 2010 IT Supplement (AHA) |
| ICU Physician Staffing (IPS) | 2012 Leapfrog Hospital Survey | 2011 AHA Annual Survey |
| Safe Practice 1: Leadership Structures and Systems | 2012 Leapfrog Hospital Survey | Excluded |
| Safe Practice 2: Culture Measurement, Feedback, and Intervention | 2012 Leapfrog Hospital Survey | Excluded |
| Safe Practice 3: Teamwork Training and Skill Building | 2012 Leapfrog Hospital Survey | Excluded |
| Safe Practice 4: Identification and Mitigation of Risks and Hazards | 2012 Leapfrog Hospital Survey | Excluded |
| Safe Practice 9: Nursing Workforce | 2012 Leapfrog Hospital Survey | Excluded |
| Safe Practice 17: Medication Reconciliation | 2012 Leapfrog Hospital Survey | Excluded |
| Safe Practice 19: Hand Hygiene | 2012 Leapfrog Hospital Survey | Excluded |
| Safe Practice 23: Care of the Ventilated Patient | 2012 Leapfrog Hospital Survey | Excluded |
| SCIP‐INF‐1: Antibiotic Within 1 Hour | CMS Hospital Compare | CMS Hospital Compare |
| SCIP‐INF‐2: Antibiotic Selection | CMS Hospital Compare | CMS Hospital Compare |
| SCIP‐INF‐3: Antibiotic Discontinued After 24 Hours | CMS Hospital Compare | CMS Hospital Compare |
| SCIP‐INF‐9: Catheter Removal | CMS Hospital Compare | CMS Hospital Compare |
| SCIP‐VTE‐2: VTE Prophylaxis | CMS Hospital Compare | CMS Hospital Compare |
| Outcome measures (50% of score) | ||
| HAC: Foreign Object Retained | CMS HACs | CMS HACs |
| HAC: Air Embolism | CMS HACs | CMS HACs |
| HAC: Pressure Ulcers | CMS HACs | CMS HACs |
| HAC: Falls and Trauma | CMS HACs | CMS HACs |
| Central Line‐Associated Bloodstream Infection | 2012 Leapfrog Hospital Survey | CMS HAIs |
| PSI 4: Death Among Surgical Inpatients With Serious Treatable Complications | CMS Hospital Compare | CMS Hospital Compare |
| PSI 6: Collapsed Lung Due to Medical Treatment | CMS Hospital Compare | CMS Hospital Compare |
| PSI 12: Postoperative PE/DVT | CMS Hospital Compare | CMS Hospital Compare |
| PSI 14: Wounds Split Open After Surgery | CMS Hospital Compare | CMS Hospital Compare |
| PSI 15: Accidental Cuts or Tears From Medical Treatment | CMS Hospital Compare | CMS Hospital Compare |
Study Sample
We examined the Leapfrog safety grades for top hospitals," as ranked by U.S. News & World Report. Included in this sample were the top 15 ranked hospitals in each of the specialties, excluding those specialties whose ranks are based solely on reputation. Hospitals ranked in more than 1 specialty were only included once in the sample. This resulted in a final study sample of 35 top hospitals. Eighteen of these top hospitals participated in the Leapfrog Survey, whereas 17 did not.
Utilizing Leapfrog's spring 2013 methodology,[6] the Hospital Safety Scores for the 35 top hospitals were calculated. The mean safety score for the 18 participating hospitals was then compared with the mean score for the 17 nonparticipating hospitals. Finally, the safety scores for each of the 17 nonparticipating hospitals, listed in Table 2, were estimated as if they had participated in the Leapfrog Survey. To do this, we assumed that the 17 nonparticipating hospitals could each earn average scores for the CPOE, IPS, and 8 process/structural Leapfrog measures as received by their 18 participating counterparts.
| Participants | Leapfrog Grade | Nonparticipants | Leapfrog Grade |
|---|---|---|---|
| |||
| Brigham and Women's Hospital, Boston, MA | A | Abbott Northwestern Hospital, Minneapolis, MN | A |
| Duke University Medical Center, Durham, NC | A | Barnes‐Jewish Hospital/Washington University, St. Louis, MO | C |
| Massachusetts General Hospital, Boston, MA | B | Baylor University Medical Center, Dallas, TX | C |
| Mayo Clinic, Rochester, MN | A | Cedars‐Sinai Medical Center, Los Angeles, CA | C |
| Methodist Hospital, Houston, TX | A | Cleveland Clinic, Cleveland, OH | C |
| Northwestern Memorial Hospital, Chicago, IL | A | Florida Hospital, Orlando, FL | B |
| Ronald Reagan UCLA Medical Center, Los Angeles, CA | D | Hospital of the University of Pennsylvania, Philadelphia, PA | A |
| Rush University Medical Center, Chicago, IL | A | Indiana University Health, Indianapolis, IN | A |
| St. Francis Hospital, Roslyn, NY | A | Mount Sinai Medical Center, New York, NY | B |
| St. Joseph's Hospital and Medical Center, Phoenix, AZ | B | New York‐Presbyterian Hospital, New York, NY | C |
| Stanford Hospital and Clinics, Stanford, CA | A | NYU Langone Medical Center, New York, NY | A |
| Thomas Jefferson University Hospital, Philadelphia, PA | C | Ochsner Medical Center, New Orleans, LA | A |
| UCSF Medical Center, San Francisco, CA | B | Tampa General Hospital, Tampa, FL | C |
| University Hospitals Case Medical Center, Cleveland, OH | A | University of Iowa Hospitals and Clinics, Iowa City, IA | C |
| University of Michigan Hospitals and Health Centers, Ann Arbor, MI | A | University of Kansas Hospital, Kansas City, KS | A |
| University of Washington Medical Center, Seattle, WA | C | UPMC, Pittsburgh, PA | B |
| Vanderbilt University Medical Center, Nashville, TN | A | Yale‐New Haven Hospital, New Haven, CT | B |
| Wake Forest Baptist Medical Center, Winston‐Salem, NC | A | ||
RESULTS
Out of these 35 top hospitals, those that participated in the Leapfrog Survey generally received higher scores than the nonparticipants (Table 2). The group of participating hospitals received an average grade of A (mean safety score, 3.165; standard error of the mean [SE], 0.081), whereas the nonparticipating hospitals received an average grade of B (mean safety score, 3.012; SE, 0.047). These grades were consistent whether mean or median scores were used.
To further examine the potential bias against nonparticipating hospitals, the safety scores for each of the 17 nonparticipating hospitals were estimated as if they had participated in the Leapfrog Survey. The letter grade of this group increased from an average of B (mean safety score, 3.012; SE, 0.047) to an average of A (mean safety score, 3.216; SE, 0.046). Among the 17 nonparticipating hospitals, 15 showed an increase in safety score, of which 8 hospitals rescored a change in score significant enough to receive 1 or 2 letter grades higher (Table 3). Only 2 hospitals had slight decreases in safety score, without any impact on letter grade.
| Hospital | Original Score (Grade) | Estimated Scorea (Grade) |
|---|---|---|
| ||
| Abbott Northwestern Hospital, Minneapolis, MN | 3.17 (A) | 3.44 (A) |
| Barnes‐Jewish Hospital/Washington University, St. Louis, MO | 2.83 (C) | 3.11 (B) |
| Baylor University Medical Center, Dallas, TX | 2.90 (C) | 3.25 (A) |
| Cedars‐Sinai Medical Center, Los Angeles, CA | 2.92 (C) | 3.30 (A) |
| Cleveland Clinic, Cleveland, OH | 2.76 (C) | 2.78 (C) |
| Florida Hospital, Orlando, FL | 2.98 (B) | 3.38 (A) |
| Hospital of the University of Pennsylvania, Philadelphia, PA | 3.29 (A) | 3.26 (A) |
| Indiana University Health, Indianapolis, IN | 3.14 (A) | 3.37 (A) |
| Mount Sinai Medical Center, New York, NY | 3.01 (B) | 3.02 (B) |
| New York‐Presbyterian Hospital, New York, NY | 2.76 (C) | 3.15 (A) |
| NYU Langone Medical Center, New York, NY | 3.26 (A) | 3.30 (A) |
| Ochsner Medical Center, New Orleans, LA | 3.19 (A) | 3.59 (A) |
| Tampa General Hospital, Tampa, FL | 2.86 (C) | 3.05 (B) |
| University of Iowa Hospitals and Clinics, Iowa City, IA | 2.70 (C) | 3.00 (B) |
| University of Kansas Hospital, Kansas City, KS | 3.29 (A) | 3.35 (A) |
| UPMC, Pittsburgh, PA | 3.04 (B) | 3.24 (A) |
| Yale‐New Haven Hospital, New Haven, CT | 3.10 (B) | 3.08 (B) |
We applied the same methods to test the top 17 Honor Roll Hospitals as designated by US News & World Report; among them, half are participating hospitals and another half nonparticipating hospitals. One hospital, Johns Hopkins Hospital was not scored by Leapfrog because no relevant Medicare data are available for Leapfrog to calculate its safety score. For this reason, Johns Hopkins was excluded from our comparison. The results persist even with this smaller sample of top hospitals. The group of 8 participating hospitals had an average grade of A (mean safety score, 3.145; SE, 0.146), whereas another 8 nonparticipating hospitals received an average grade of B (mean safety score, 3.011; SE, 0.075).
DISCUSSION
The Leapfrog Group's intent to provide patient safety information to patients, physicians, healthcare purchasers, and hospital executives should be commended. However, the current methodology may disadvantage nonparticipating hospitals. The combination of lower maximum scores and increased weight of the CPOE and IPS scores may result in a lower hospital safety score than is justified. Nonparticipating hospitals may also face more intensive pressure from employers and payors to lower their reimbursement rates due to the newly released Leapfrog Hidden Surcharge Calculator.
Leapfrog acknowledges that the more data points a hospital has to be scored on, the better its opportunity to achieve a higher score.[8] This justification may lead to bias against nonparticipating hospitals. On the other hand, it is possible that hospitals with good safety records are more likely to participate in the Leapfrog Survey than those with poorer safety records. Without detailed nonresponse analysis from Leapfrog, it is impossible to know if there is a selection bias. Regardless, the Leapfrog result can subsequently misguide the payment rate negotiation between insurers and hospitals.
With this consideration in mind, Leapfrog should explicitly acknowledge the limitations of its methodology and consider revising it in future studies. For example, Leapfrog could only report on those measures for which there are data available for both participating and nonparticipating hospitals. Pending this revision, every effort must be made to distinguish between participating and nonparticipating hospitals. The outcomes of Leapfrog's hospital safety grades are made available online to consumers without distinguishing between participating and nonparticipating hospitals. The only method to differentiate the categories is to examine the data sources in detail amid a large volume of data. It is unlikely that consumers comparing hospital safety grades will take note of this caveat. Thus, Leapfrog's grading system can drastically misrepresent many nonparticipating hospitals' patient safety performances.
This study of The Leapfrog Group's Hospital Safety Score is not without limitations. The small sample utilized in this study limited the power of statistical testing. The difference in mean scores between participating and nonparticipating hospitals is not statistically significant. However, The Leapfrog Group uses specific numerical cutoff points for each letter grade classification. In this classification system statistical significance is not considered when assigning hospitals with different letter grades. It was clear that nonparticipating hospitals were more likely to receive lower letter grades than participating hospitals.
The small sample also posed challenges when attempting to account for missing data when comparing participating hospitals versus nonparticipating hospitals. Although a multiple imputation approach may have been ideal to address this, the small sample size coupled with the large amount of missing data (58% of hospitals did not participate in the Leapfrog Survey) led us to question the accuracy of this approach in this situation.[12] Instead, a crude, mean imputation approach was utilized, relying on the assumption that nonresponding hospitals had the same mean performance as responding hospitals on those domains where data were missing. In this study, we purposely selected a sample of hospitals from U.S. News & World Report's top hospitals. We believe the mean imputation approach, although not perfect, is appropriate for this sample of hospitals. Future study, however, should examine if hospitals that anticipated lower performance scores would be less likely to participate in the Leapfrog Survey. This would help strengthen Leapfrog's methodology in dealing with nonresponsive hospitals.
ACKNOWLEDGMENTS
Disclosures: Harold Paz is the CEO of Penn State Hershey Medical Center, which did not participate in the Leapfrog Survey. The authors have no financial conflicts of interest to report.
- , , . To Err Is Human: Building a Safer Health System. Washington, DC: National Academy Press; 2000.
- , , , , . The “To Err is Human” report and the patient safety literature. Qual Saf Health Care. 2006;15(3):174–178.
- , . A call to excellence. Health Aff (Millwood). 2003;22(2):113–115.
- US Department of Health and Human Services. Adverse events in hospitals: national incidence among Medicare beneficiaries. Available at: http://oig.hhs.gov/oei/reports/oei‐06‐09‐00090.pdf. Published November 2010. Accessed on August 2, 2013.
- The Leapfrog Group. The Leapfrog Group—fact sheet 2013. Available at: https://leapfroghospitalsurvey.org/web/wp‐content/uploads/Fsleapfrog.pdf. Accessed October 9, 2013.
- The Leapfrog Group. Hospital Safety score scoring methodology. Available at: http://www.hospitalsafetyscore.org/media/file/HospitalSafetyScore_ScoringMethodology_May2013.pdf. Published May 2013. Accessed June 17, 2013.
- The Leapfrog Group. The Hidden Surcharge Americans Pay for Hospital Errors 2013. Available at: http://www.leapfroggroup.org/employers_purchasers/HiddenSurchargeCalculator. Accessed August 2, 2013.
- The Leapfrog Group. 2013 Leapfrog Hospital Survey Reference Book 2013. https://leapfroghospitalsurvey.org/web/wp‐content/uploads/reference.pdf. Published April 1, 2013. Accessed June 17, 2013.
- , , , et al. Safety in numbers: the development of Leapfrog's composite patient safety score for U.S. hospitals [published online ahead of print September 27, 2013]. J Patient Saf. doi: 10.1097/PTS.0b013e3182952644.
- The Leapfrog Group. Measures in detail. Available at: http://www. hospitalsafetyscore.org/about‐the‐score/measures‐in‐detail. Accessed June 17, 2013.
- The Leapfrog Group. Explanation of safety score grades. Available at: http://www.hospitalsafetyscore.org/media/file/ExplanationofSafety ScoreGrades_May2013.pdf. Published May 2013. Accessed June 17, 2013.
- , , , et al. Multiple imputation for missing data in epidemiological and clinical research: potential and pitfalls. BMJ. 2009;338:b2393.
Suicide on Medical Units
Suicide is the tenth leading cause of death in the United States,[1] resulting in the deaths of over 34,000 people each year.[2] In 2007, 165,997 individuals were hospitalized for self‐inflicted injuries, and 395,320 people were treated for self‐harm in emergency departments.[2] In 2003, the American Psychiatric Association reported that approximately 1500 suicides take place within hospital facilities in the United States each year.[3]
Although a number of studies have examined inpatient suicides that occurred on psychiatric units,[4, 5, 6, 7, 8] fewer have focused on suicides occurring on medical units. A Joint Commission review of inpatient suicide on medical/surgical units[9] found that 14.25% of all inpatient suicides occurred while the patient was on a medical unit, and now recommends that all hospitals identify individuals at risk for suicide, develop interventions for suicidal patients, and educate staff about the risk factors of suicide. Bostwick and Rackley[10] reviewed studies of suicide on medical/surgical units and found that few of the patients had histories of mental illness or suicidal ideation and recommend close attention to agitated patients, aggressively treating depression and pain, modifying the environment where possible, and observation of patients thought to be at risk. Wint and Alil[5] also report a high level of depression in patients who commit suicide in general hospitals and suggest that improved recognition of depression in general hospital patients will reduce suicide.
GOALS FOR THIS STUDY
Few studies have examined suicide on acute medical and surgical and intensive care units (ICUs), and there are no large studies conducted in the United States. The goal of this study was to describe suicide attempts and completions in the medical setting using Root Cause Analysis (RCA) reports of these events in the Veterans Health Administration (VHA).
METHODS
Study Design and Theoretical Model
This is an observational review of all RCA reports of suicide attempts or completions on the medical‐surgical wards and ICUs in the VHA system between December 1, 1999 (when the RCA system started) and December 31, 2012. The Committee for the Protection of Human Subjects, Dartmouth College considered this project exempt.
The VHA provides comprehensive healthcare services to over 6 million veterans across the United States through 152 VHA medical centers. Over the study period there were approximately 7,289,770 admissions to medical‐surgical wards and ICUs in the VHA (average number of admissions per year between 2000 and 2012=560,771.5, standard deviation=25,535.7).
The VHA National Center for Patient Safety RCA Program
Patient safety including the investigation of adverse events is coordinated by the National Center for Patient Safety (NCPS). The NCPS has instituted a systematic and structured RCA program to individually and collectively analyze adverse events.[11, 12]
RCA is a method for examining the underlying causes of an adverse event such as a hospital related death, surgical error, or suicide. The focus of an RCA is on the systemic and organizational factors that may have contributed to an adverse event.[11, 12] The RCA process within the VHA is conducted by multidisciplinary teams organized by the hospital's patient safety manager. In general, an RCA describes what happened, how it happened, and what should be done to avoid the same event happening again.[11]
Because of the focus on the system, the information contained in the RCA reports does not include detailed demographic data about the patients involved in the events. RCA reports that are submitted to NCPS include narrative descriptions of the event, all contributing factors, a final understanding of the event, and a specific action plan for addressing underlying causes of the event.
Analysis of RCA Reports
Our goal was to identify suicide attempts and completed suicides that occurred on acute care medical‐surgical wards or ICUs. The search was completed through use of event codes for suicide or suicide attempts entered in the RCA and through the use of natural language processing software to identify the terms related to suicide or suicide attempts anywhere in the RCA text (PolyAnalyst; Megaputer, Bloomington, IN).
Data Processing
Each RCA report was coded for the location of the event, method of self‐harm, and root causes; where possible, we also coded medical diagnosis, reason for admission, history of suicidal behavior, age, and gender. The coding system was developed in a previous study of RCA reports of suicide.[13]
RESULTS
Our search resulted in 525 RCA reports of inpatient suicide attempts and completions. These were obtained from the 14,851 total RCA reports in the RCA dataset. Of the 525, we identified 50 cases that occurred while the patient was on the acute medical‐surgical unit (43 cases) or ICU (7 cases). Other cases occurred on mental health units, emergency department, or other areas of the hospital. Five cases were completed suicides, and 45 were suicide attempts. Based on the number of admissions per year reported above, the approximate rate of completed inpatient suicides on medical‐surgical and ICUs is 0.6 per million admissions. (For comparison, the rate of completed suicide on psychiatric units in the VA has been estimated to be 8.7 per million admissions.[14] Table 1 displays the admitting diagnosis and demographic data for those RCA reports that contained this information. The most common admitting diagnoses were alcohol detoxification and chest pain or rule out myocardial infarction (MI); note that 12 reports did not contain an admitting diagnosis. Table 2 displays the methods and root causes for the 50 cases; there were 118 root causes generated. The most common methods were cutting, overdose, and hanging; and the most common root causes were poor communication, need for staff training in suicide assessment, and need to improve suicide risk assessment.
| Medical‐Surgical | ICU | |||
|---|---|---|---|---|
| Attempts | Completions | Attempts | Completions | |
| ||||
| Admitting diagnosis, N=50 | ||||
| Alcohol detox | 3 | 2 | 2 | 0 |
| Chest pain or rule out MI | 5 | 0 | 0 | 0 |
| Delirium | 1 | 0 | 0 | 0 |
| Peripheral infection/cellulitis | 2 | 1 | 0 | 0 |
| Spine surgery or spine issue | 2 | 0 | 0 | 0 |
| Lung CA | 1 | 1 | 0 | 0 |
| Cystopy (bladder surgery) | 2 | 0 | 0 | 0 |
| Head and neck CA | 1 | 0 | 1 | 0 |
| Other | 4 | 0 | 0 | 0 |
| Respiratory (COPD) | 2 | 0 | 1 | 0 |
| Suicide attempt by overdose | 2 | 0 | 0 | 0 |
| Lung infection | 1 | 0 | 1 | 0 |
| CVA | 0 | 1 | 0 | 0 |
| Unknown | 12 | 0 | 2 | 0 |
| Demographics N =50 | ||||
| % male | 91.40% | 100% | 80% | NA |
| Average age, y | 56 | 53 | 47 | NA |
| History of suicidal thoughts or behaviors | 16 | 2 | 3 | 0 |
| Medical‐Surgical | ICU | |||
|---|---|---|---|---|
| Attempts | Completions | Attempts | Completions | |
| ||||
| Methods | ||||
| Cutting with a sharp object | 29% | 0% | 43% | None |
| Overdose | 26% | 20% | 0% | None |
| Hanging | 18% | 40% | 29% | None |
| Strangulation | 8% | 0% | 0% | None |
| Jumping | 5% | 0% | 14% | None |
| Asphyxiation | 8% | 0% | 0% | None |
| Removed lines or equipment | 5% | 0% | 14% | None |
| Gun shot | 0% | 40% | 0% | None |
| Column total | 100% | 100% | 100% | None |
| Root causes | ||||
| Poor communication between providers or services | 22% | 9% | 7% | None |
| Need for staff training in suicide assessment | 14% | 0% | 20% | None |
| Need to improve process of suicide assessment | 13% | 9% | 13% | None |
| Need for improvement of risk documentation | 9% | 0% | 7% | None |
| Physical environment is a risk factor | 7% | 0% | 20% | None |
| Contraband search needs improvement | 7% | 18% | 0% | None |
| Problems with treatment for suicidal patients | 7% | 27% | 7% | None |
| Not following existing policies | 5% | 0% | 0% | None |
| Medical assess or treatment delayed or incomplete | 5% | 0% | 0% | None |
| Easy access to medication for overdose | 4% | 9% | 0% | None |
| Stressed by medical/mental health/pain problems | 5% | 18% | 20% | None |
| Other root causes | 1% | 0% | 7% | None |
| No root cause | 1% | 9% | 0% | None |
| Column totals | 100% | 100% | 100% | None |
DISCUSSION
This study examined the specific systemic factors involved in suicide attempts and completions in medical‐surgical and intensive care units in a large, national hospital sample. Overall, the number of completed suicides over the 13‐year period was small (5 in total). The most common reason for admission was alcohol detoxification. Many patients going through alcohol detoxification experience agitation, which is a risk factor for suicide among medical patients.[10] This hypothesis is further supported by the fact that 2 of the 5 completed suicides were admitted for alcohol detoxification. Interestingly, only 2 of the patients who attempted suicide in the hospital were also admitted for medical conditions related to a prior suicide attempt. It is likely the case that patients admitted for a suicide attempt are closely watched throughout the admission and so may have fewer opportunities to repeat the suicide attempt.
The most common method of suicide attempts was cutting with a sharp object. However, cutting did not result in death, whereas overdose, hanging, and gunshot did. As a precaution, especially with patients with a known history of suicidal ideation, removing sharp objects such as razor blades and knives as well as extra medications is a reasonable first step. It may also be possible to create safer bathroom environments, at least in some medical rooms for potentially suicidal patients, which have break‐away shower curtains, sealed grab‐bars, and a general reduction of anchor points for hanging (see
As with other studies of RCAs,[15, 16] we found that problems communicating risk was the most common identified root cause for suicide attempts and completions. Problems communicating risk most often involved knowledge of suicide risk or specific suicide mitigation plans that were not shared by the treatment team or communicated during handoffs. Most frequently, this communication problem involved team members assessing a patient to be at high risk for suicide, but that information was not provided to other care team members. This root cause also included situations in which the treatment plan for suicide prevention was inadequately disseminated to the entire treatment team. It is critical that good systems are in place so that staff members have the time to communicate critical information about patients. In addition, the system should be standardized so that the same information is communicated each time there is a handoff. The lack of clear steps to mitigate suicide risk when a patient was identified at high risk was also a commonly cited root cause. The most extreme examples involved completed suicides occurring with a patient receiving 1‐on‐1 staffing. This 1‐on‐1 staffing did not include specific guidance for the sitters such as the need to remove personal items that could be used for self‐harm. We also saw that staff on medical units needed to learn more about risk factors for suicide and how to conduct a suicide assessment with their patients. Another root cause was the stress caused by the medical and psychiatric conditions of the patients. It is notable that no completed suicides occurred in ICUs, suggesting that closer observation and/or a higher level of medical incapacitation can reduce the risk of completed suicides.
To address these root causes, staff should be educated about risk factors for suicide, and standardized high‐risk for suicide order sets and checklists should be used to ensure staff execute the desired care processes and communicate them to all staff. In addition, specific training in suicide prevention should be provided to staff involved in 1‐on‐1 observation for high‐risk patients. Again, this may be aided by a checklist to help staff remember the protocol for what may be a low‐frequency event. A high risk suicide care process may include:
- Conducting contraband searches for items that could be used for self‐harm, modifying the environment of a small percentage of toilet rooms on medical floors to reduce anchor points for hanging. A high risk patient could then be moved to these rooms.
- Regular psychiatric input into the treatment plan.
- Discharge planning that includes attention to the potential for depression and suicidal ideation upon discharge.
Limitations
This study has several limitations. First, our data only contained suicide attempts and completions that were reported through our patient safety system in the VHA, and only completed suicides require an RCA, thus there are likely some events that were not included. Second, the RCA reports focus on the systemic vulnerabilities in medical‐surgical units and ICUs that may have contributed to the adverse event rather than the specific characteristics of the patients involved, so we do not have complete demographic information about these individual patients. Third, our sample was mostly male, so the results may not generalize well to units with a higher percentage of female patients.
These limitations notwithstanding, we know of no other study to present data on suicide attempts and completions in medical‐surgical and ICUs in a large national medical system.
Disclosures: This material is the result of work supported with resources and the use of facilities at the Department of Veterans Affairs National Center for Patient Safety at Ann Arbor, Michigan, and the Veterans Affairs Medical Centers, White River Junction, Vermont. The Research and Development Committee, White River Junction VA Medical Center approved this project, and the Committee for the Protection of Human Subjects, Dartmouth College considered this project exempt. The views expressed in this article do not necessarily represent the views of the Department of Veterans Affairs or the United States government. The authors report no conflicts of interest.
- Centers for Disease Control and Prevention. National Center for Injury and Prevention Control. WISQARS (Web‐based Injury Statistics Query and Reporting System). Available at: http://www.cdc.gov/injury/wisqars/index.html. Accessed September 27, 2012.
- Centers for Disease Control and Prevention. Suicide: facts at a glance. Available at: http://www.cdc.gov/ViolencePrevention/pdf/Suicide_DataSheet‐a.pdf. Accessed September 27, 2012.
- American Psychiatric Association. Practice guideline for the assessment and treatment of patients with suicidal behaviors. Am J Psychiatry. 2003;160:1–60.
- , . Inpatient suicide: preventing a common sentinel event. Gen Hosp Psychiatry. 2009;31:103–109.
- , . Suicidality in the general hospitalized patient. Hosp Physician. 2006;42(1):13–18.
- , , . Suicide inside: a systematic review of inpatient suicides. J Nervous and Ment Dis. 2010;198(5):315–328.
- , , . Environmental risk factors in hospital suicide. Suicide Life Threat Behav. 2004;34(4):448–453.
- , , . Clinical correlates of inpatient suicide. J Clin Psychiatry. 2003;64(1):14–19.
- A follow‐up report on preventing suicide: focus on medical/surgical units and the emergency department. Sentinel Event Alert. 2010;(46):1–4.
- , . Completed suicide in medical/surgical patients: who is at risk? Curr Psychiatry Rep. 2007;9(3):242–246.
- , , , , , , et al. Developing and deploying a patient safety program in a large health care system: you can't fix what you don't know about. Jt Comm J Qual Improv. 2001;27:522–532.
- , . Developing a culture of safety in the Veterans Health Administration. Eff Clin Pract. 2007;3:270–276.
- , , , , . Actions and Implementation Strategies to Reduce Suicidal Events in the VHA. Jt Comm J on Qual and Safe. 2006:32(3):130–141.
- , , , et al. An examination of the effectiveness of a mental health environment of care checklist in reducing suicide on inpatient mental health units. Arch GenPsychiatry. 2012:69(6):588–592.
- , , , , . Helping elderly patients to avoid suicide: a review of case reports from a national Veterans Affairs database. J Nerv Ment Dis. 2013;201(1):12–16.
- , , , , . Suicide attempts and completions in the emergency department in Veterans Affairs hospitals. Emerg Med J. 2012;29(5):399–403.
Suicide is the tenth leading cause of death in the United States,[1] resulting in the deaths of over 34,000 people each year.[2] In 2007, 165,997 individuals were hospitalized for self‐inflicted injuries, and 395,320 people were treated for self‐harm in emergency departments.[2] In 2003, the American Psychiatric Association reported that approximately 1500 suicides take place within hospital facilities in the United States each year.[3]
Although a number of studies have examined inpatient suicides that occurred on psychiatric units,[4, 5, 6, 7, 8] fewer have focused on suicides occurring on medical units. A Joint Commission review of inpatient suicide on medical/surgical units[9] found that 14.25% of all inpatient suicides occurred while the patient was on a medical unit, and now recommends that all hospitals identify individuals at risk for suicide, develop interventions for suicidal patients, and educate staff about the risk factors of suicide. Bostwick and Rackley[10] reviewed studies of suicide on medical/surgical units and found that few of the patients had histories of mental illness or suicidal ideation and recommend close attention to agitated patients, aggressively treating depression and pain, modifying the environment where possible, and observation of patients thought to be at risk. Wint and Alil[5] also report a high level of depression in patients who commit suicide in general hospitals and suggest that improved recognition of depression in general hospital patients will reduce suicide.
GOALS FOR THIS STUDY
Few studies have examined suicide on acute medical and surgical and intensive care units (ICUs), and there are no large studies conducted in the United States. The goal of this study was to describe suicide attempts and completions in the medical setting using Root Cause Analysis (RCA) reports of these events in the Veterans Health Administration (VHA).
METHODS
Study Design and Theoretical Model
This is an observational review of all RCA reports of suicide attempts or completions on the medical‐surgical wards and ICUs in the VHA system between December 1, 1999 (when the RCA system started) and December 31, 2012. The Committee for the Protection of Human Subjects, Dartmouth College considered this project exempt.
The VHA provides comprehensive healthcare services to over 6 million veterans across the United States through 152 VHA medical centers. Over the study period there were approximately 7,289,770 admissions to medical‐surgical wards and ICUs in the VHA (average number of admissions per year between 2000 and 2012=560,771.5, standard deviation=25,535.7).
The VHA National Center for Patient Safety RCA Program
Patient safety including the investigation of adverse events is coordinated by the National Center for Patient Safety (NCPS). The NCPS has instituted a systematic and structured RCA program to individually and collectively analyze adverse events.[11, 12]
RCA is a method for examining the underlying causes of an adverse event such as a hospital related death, surgical error, or suicide. The focus of an RCA is on the systemic and organizational factors that may have contributed to an adverse event.[11, 12] The RCA process within the VHA is conducted by multidisciplinary teams organized by the hospital's patient safety manager. In general, an RCA describes what happened, how it happened, and what should be done to avoid the same event happening again.[11]
Because of the focus on the system, the information contained in the RCA reports does not include detailed demographic data about the patients involved in the events. RCA reports that are submitted to NCPS include narrative descriptions of the event, all contributing factors, a final understanding of the event, and a specific action plan for addressing underlying causes of the event.
Analysis of RCA Reports
Our goal was to identify suicide attempts and completed suicides that occurred on acute care medical‐surgical wards or ICUs. The search was completed through use of event codes for suicide or suicide attempts entered in the RCA and through the use of natural language processing software to identify the terms related to suicide or suicide attempts anywhere in the RCA text (PolyAnalyst; Megaputer, Bloomington, IN).
Data Processing
Each RCA report was coded for the location of the event, method of self‐harm, and root causes; where possible, we also coded medical diagnosis, reason for admission, history of suicidal behavior, age, and gender. The coding system was developed in a previous study of RCA reports of suicide.[13]
RESULTS
Our search resulted in 525 RCA reports of inpatient suicide attempts and completions. These were obtained from the 14,851 total RCA reports in the RCA dataset. Of the 525, we identified 50 cases that occurred while the patient was on the acute medical‐surgical unit (43 cases) or ICU (7 cases). Other cases occurred on mental health units, emergency department, or other areas of the hospital. Five cases were completed suicides, and 45 were suicide attempts. Based on the number of admissions per year reported above, the approximate rate of completed inpatient suicides on medical‐surgical and ICUs is 0.6 per million admissions. (For comparison, the rate of completed suicide on psychiatric units in the VA has been estimated to be 8.7 per million admissions.[14] Table 1 displays the admitting diagnosis and demographic data for those RCA reports that contained this information. The most common admitting diagnoses were alcohol detoxification and chest pain or rule out myocardial infarction (MI); note that 12 reports did not contain an admitting diagnosis. Table 2 displays the methods and root causes for the 50 cases; there were 118 root causes generated. The most common methods were cutting, overdose, and hanging; and the most common root causes were poor communication, need for staff training in suicide assessment, and need to improve suicide risk assessment.
| Medical‐Surgical | ICU | |||
|---|---|---|---|---|
| Attempts | Completions | Attempts | Completions | |
| ||||
| Admitting diagnosis, N=50 | ||||
| Alcohol detox | 3 | 2 | 2 | 0 |
| Chest pain or rule out MI | 5 | 0 | 0 | 0 |
| Delirium | 1 | 0 | 0 | 0 |
| Peripheral infection/cellulitis | 2 | 1 | 0 | 0 |
| Spine surgery or spine issue | 2 | 0 | 0 | 0 |
| Lung CA | 1 | 1 | 0 | 0 |
| Cystopy (bladder surgery) | 2 | 0 | 0 | 0 |
| Head and neck CA | 1 | 0 | 1 | 0 |
| Other | 4 | 0 | 0 | 0 |
| Respiratory (COPD) | 2 | 0 | 1 | 0 |
| Suicide attempt by overdose | 2 | 0 | 0 | 0 |
| Lung infection | 1 | 0 | 1 | 0 |
| CVA | 0 | 1 | 0 | 0 |
| Unknown | 12 | 0 | 2 | 0 |
| Demographics N =50 | ||||
| % male | 91.40% | 100% | 80% | NA |
| Average age, y | 56 | 53 | 47 | NA |
| History of suicidal thoughts or behaviors | 16 | 2 | 3 | 0 |
| Medical‐Surgical | ICU | |||
|---|---|---|---|---|
| Attempts | Completions | Attempts | Completions | |
| ||||
| Methods | ||||
| Cutting with a sharp object | 29% | 0% | 43% | None |
| Overdose | 26% | 20% | 0% | None |
| Hanging | 18% | 40% | 29% | None |
| Strangulation | 8% | 0% | 0% | None |
| Jumping | 5% | 0% | 14% | None |
| Asphyxiation | 8% | 0% | 0% | None |
| Removed lines or equipment | 5% | 0% | 14% | None |
| Gun shot | 0% | 40% | 0% | None |
| Column total | 100% | 100% | 100% | None |
| Root causes | ||||
| Poor communication between providers or services | 22% | 9% | 7% | None |
| Need for staff training in suicide assessment | 14% | 0% | 20% | None |
| Need to improve process of suicide assessment | 13% | 9% | 13% | None |
| Need for improvement of risk documentation | 9% | 0% | 7% | None |
| Physical environment is a risk factor | 7% | 0% | 20% | None |
| Contraband search needs improvement | 7% | 18% | 0% | None |
| Problems with treatment for suicidal patients | 7% | 27% | 7% | None |
| Not following existing policies | 5% | 0% | 0% | None |
| Medical assess or treatment delayed or incomplete | 5% | 0% | 0% | None |
| Easy access to medication for overdose | 4% | 9% | 0% | None |
| Stressed by medical/mental health/pain problems | 5% | 18% | 20% | None |
| Other root causes | 1% | 0% | 7% | None |
| No root cause | 1% | 9% | 0% | None |
| Column totals | 100% | 100% | 100% | None |
DISCUSSION
This study examined the specific systemic factors involved in suicide attempts and completions in medical‐surgical and intensive care units in a large, national hospital sample. Overall, the number of completed suicides over the 13‐year period was small (5 in total). The most common reason for admission was alcohol detoxification. Many patients going through alcohol detoxification experience agitation, which is a risk factor for suicide among medical patients.[10] This hypothesis is further supported by the fact that 2 of the 5 completed suicides were admitted for alcohol detoxification. Interestingly, only 2 of the patients who attempted suicide in the hospital were also admitted for medical conditions related to a prior suicide attempt. It is likely the case that patients admitted for a suicide attempt are closely watched throughout the admission and so may have fewer opportunities to repeat the suicide attempt.
The most common method of suicide attempts was cutting with a sharp object. However, cutting did not result in death, whereas overdose, hanging, and gunshot did. As a precaution, especially with patients with a known history of suicidal ideation, removing sharp objects such as razor blades and knives as well as extra medications is a reasonable first step. It may also be possible to create safer bathroom environments, at least in some medical rooms for potentially suicidal patients, which have break‐away shower curtains, sealed grab‐bars, and a general reduction of anchor points for hanging (see
As with other studies of RCAs,[15, 16] we found that problems communicating risk was the most common identified root cause for suicide attempts and completions. Problems communicating risk most often involved knowledge of suicide risk or specific suicide mitigation plans that were not shared by the treatment team or communicated during handoffs. Most frequently, this communication problem involved team members assessing a patient to be at high risk for suicide, but that information was not provided to other care team members. This root cause also included situations in which the treatment plan for suicide prevention was inadequately disseminated to the entire treatment team. It is critical that good systems are in place so that staff members have the time to communicate critical information about patients. In addition, the system should be standardized so that the same information is communicated each time there is a handoff. The lack of clear steps to mitigate suicide risk when a patient was identified at high risk was also a commonly cited root cause. The most extreme examples involved completed suicides occurring with a patient receiving 1‐on‐1 staffing. This 1‐on‐1 staffing did not include specific guidance for the sitters such as the need to remove personal items that could be used for self‐harm. We also saw that staff on medical units needed to learn more about risk factors for suicide and how to conduct a suicide assessment with their patients. Another root cause was the stress caused by the medical and psychiatric conditions of the patients. It is notable that no completed suicides occurred in ICUs, suggesting that closer observation and/or a higher level of medical incapacitation can reduce the risk of completed suicides.
To address these root causes, staff should be educated about risk factors for suicide, and standardized high‐risk for suicide order sets and checklists should be used to ensure staff execute the desired care processes and communicate them to all staff. In addition, specific training in suicide prevention should be provided to staff involved in 1‐on‐1 observation for high‐risk patients. Again, this may be aided by a checklist to help staff remember the protocol for what may be a low‐frequency event. A high risk suicide care process may include:
- Conducting contraband searches for items that could be used for self‐harm, modifying the environment of a small percentage of toilet rooms on medical floors to reduce anchor points for hanging. A high risk patient could then be moved to these rooms.
- Regular psychiatric input into the treatment plan.
- Discharge planning that includes attention to the potential for depression and suicidal ideation upon discharge.
Limitations
This study has several limitations. First, our data only contained suicide attempts and completions that were reported through our patient safety system in the VHA, and only completed suicides require an RCA, thus there are likely some events that were not included. Second, the RCA reports focus on the systemic vulnerabilities in medical‐surgical units and ICUs that may have contributed to the adverse event rather than the specific characteristics of the patients involved, so we do not have complete demographic information about these individual patients. Third, our sample was mostly male, so the results may not generalize well to units with a higher percentage of female patients.
These limitations notwithstanding, we know of no other study to present data on suicide attempts and completions in medical‐surgical and ICUs in a large national medical system.
Disclosures: This material is the result of work supported with resources and the use of facilities at the Department of Veterans Affairs National Center for Patient Safety at Ann Arbor, Michigan, and the Veterans Affairs Medical Centers, White River Junction, Vermont. The Research and Development Committee, White River Junction VA Medical Center approved this project, and the Committee for the Protection of Human Subjects, Dartmouth College considered this project exempt. The views expressed in this article do not necessarily represent the views of the Department of Veterans Affairs or the United States government. The authors report no conflicts of interest.
- Centers for Disease Control and Prevention. National Center for Injury and Prevention Control. WISQARS (Web‐based Injury Statistics Query and Reporting System). Available at: http://www.cdc.gov/injury/wisqars/index.html. Accessed September 27, 2012.
- Centers for Disease Control and Prevention. Suicide: facts at a glance. Available at: http://www.cdc.gov/ViolencePrevention/pdf/Suicide_DataSheet‐a.pdf. Accessed September 27, 2012.
- American Psychiatric Association. Practice guideline for the assessment and treatment of patients with suicidal behaviors. Am J Psychiatry. 2003;160:1–60.
- , . Inpatient suicide: preventing a common sentinel event. Gen Hosp Psychiatry. 2009;31:103–109.
- , . Suicidality in the general hospitalized patient. Hosp Physician. 2006;42(1):13–18.
- , , . Suicide inside: a systematic review of inpatient suicides. J Nervous and Ment Dis. 2010;198(5):315–328.
- , , . Environmental risk factors in hospital suicide. Suicide Life Threat Behav. 2004;34(4):448–453.
- , , . Clinical correlates of inpatient suicide. J Clin Psychiatry. 2003;64(1):14–19.
- A follow‐up report on preventing suicide: focus on medical/surgical units and the emergency department. Sentinel Event Alert. 2010;(46):1–4.
- , . Completed suicide in medical/surgical patients: who is at risk? Curr Psychiatry Rep. 2007;9(3):242–246.
- , , , , , , et al. Developing and deploying a patient safety program in a large health care system: you can't fix what you don't know about. Jt Comm J Qual Improv. 2001;27:522–532.
- , . Developing a culture of safety in the Veterans Health Administration. Eff Clin Pract. 2007;3:270–276.
- , , , , . Actions and Implementation Strategies to Reduce Suicidal Events in the VHA. Jt Comm J on Qual and Safe. 2006:32(3):130–141.
- , , , et al. An examination of the effectiveness of a mental health environment of care checklist in reducing suicide on inpatient mental health units. Arch GenPsychiatry. 2012:69(6):588–592.
- , , , , . Helping elderly patients to avoid suicide: a review of case reports from a national Veterans Affairs database. J Nerv Ment Dis. 2013;201(1):12–16.
- , , , , . Suicide attempts and completions in the emergency department in Veterans Affairs hospitals. Emerg Med J. 2012;29(5):399–403.
(Re)turning the Pages of Residency
It's hard to imagine a busy urban hospital without its chorus of beepers.[1] This statement, the first sentence of an article published in 1988, rings (or beeps or buzzes) true to any resident physician today. At that time, pagers had replaced overhead paging, and provided a rapid method to contact physicians who were often scattered throughout the hospital. Still, it was an imperfect solution as the ubiquitous pager constantly interrupted patient care and other tasks, failed to prioritize information, and added to an already stressful working environment. Notably, interns were paged on average once per hour, and occasionally 5 or more times per hour, a frequency that was felt to be detrimental to patient care and to the working environment of resident physicians.[1]
Little has changed. Despite the instant, multidirectional communication platforms available today, alphanumeric paging remains a mainstay of communication between physicians and other members of the care team. Importantly, paging contributes to communication errors (eg, by failing to convey urgency, having incomplete information, or being missed entirely by coverage gaps),[2, 3] and interrupts resident workflow, thereby negatively affecting work efficiency and educational activities, and adding to perceived workload.[4, 5]
In this era of duty hour restrictions, there has been concern that residents experience increased workload due to having fewer hours to do the same amount of work.[6, 7] As such, the Accreditation Council of Graduate Medical Education emphasizes the quality of those hours, with a focus on several aspects of the resident working environment as key to improved educational and patient safety outcomes.[8, 9, 10]
Geographic localization of physicians to patient care units has been proposed as a means to improve communication and agreement on plans of care,[11, 12] and also to reduce resident workload by decreasing inefficiencies attributable to traveling throughout the hospital.[13] O'Leary, et al. (2009) found that when physicians were localized to 1 hospital unit, there was greater agreement between physicians and nurses on various aspects of care, such as planned tests and anticipated length of stay. In addition, members of the patient care team were better able to identify one another, and there was a perceived increase in face‐to‐face communication, and a perceived decrease in text paging.[11]
In consideration of these factors, in July 2011, at New YorkPresbyterian Hospital/Weill Cornell (NYPH/WC), an 800‐bed tertiary care teaching hospital in New York, New York, we geographically localized 2 internal medicine resident teams, and partially localized 2 additional teams. We investigated whether interns on teams that were geographically localized received fewer pages than interns on teams that were not localized. This study was reviewed by the institutional review board of Weill Cornell Medical College and met the requirements for exemption.
METHODS
We conducted a retrospective analysis of the number of pages received by interns during the day (7:00 am to 7:00 pm) on 5 general internal medicine teams during a 1‐month ward rotation between October 17, 2011 and November 13, 2011 at NYPH/WC. The general medicine teams were composed of 1 attending, 1 resident, and 2 interns each. Two teams were geographically localized to a 32‐bed unit (geographic localization model [GLM]). Two teams were partially localized to a 26‐bed unit, which included a respiratory care step‐down unit (partial localization model [PLM]). A fifth and final team admitted patients irrespective of their assigned bed location (standard model [SM]). Both the GLM and the PLM occasionally carried patients on other units to allow for overall census management and patient throughput. The total number of pages received by each intern over the study period was collected by retrospective analysis of electronic paging logs. Night pages (7 pm7 am) were excluded because of night float coverage. Weekend pages were excluded because data were inaccurate due to coverage for days off.
The daily number of admissions and daily census per team were recorded by physician assistants, who also assigned new patients to appropriate teams according to an admissions algorithm (see Supporting Figure 1 in the online version of this article). The percent of geographically localized patients on each team was estimated from the percentage of localized patients on the day of discharge averaged over the study period. For the SM team, percent localization was defined as the number of patients on the patient care unit that contained the team's work area.

Standard multivariate linear regression techniques were used to analyze the relationship between the number of pages received per intern and the type of team, controlling for the potential effect of total census and number of admissions. The regression model was used to determine adjusted marginal point estimates and 95% confidence intervals (CIs) for the average number of pages per intern per hour for each type of team. All statistical analyses were conducted using Stata version 12 (StataCorp, College Station, TX).
RESULTS
Over the 28‐day study period, a total of 6652 pages were received by 10 interns on 5 general internal medicine teams from 7 am to 7 pm Monday through Friday. The average daily census, average daily admissions, and percent of patients localized to patient care units for the individual teams are shown in Table 1. In univariate analysis, the mean daily pages per intern were not significantly different between the 2 teams within the GLM, nor between the 2 teams in the PLM, allowing them to be combined in multivariate analysis (data not shown). The number of pages received per intern per hour, adjusted for team census and number of admissions, was 2.2 (95% CI: 2.02.4) in the GLM, 2.8 (95% CI: 2.6‐3.0) in the PLM, and 3.9 (95% CI: 3.6‐4.2) in the SM (Table 1). All of these differences were statistically significant (P0.001).
| Standard Model* | Partial Localization Model | Geographically Localized Model | |
|---|---|---|---|
| |||
| Percent of patients localized | 37% | 45% | 85% |
| Team census, mean (range per day) | 16.1 (1320) | 15.9 (1120) | 15.6 (1119) |
| Team admissions, mean (range per day) | 2.7 (15) | 2.9 (06) | 3.5 (07) |
| Pages per hour per intern, unadjusted, mean (95% CI) | 3.9 (3.6‐4.1) | 2.8 (2.6‐3.0) | 2.2 (2.02.4) |
| Pages per hour per intern, adjusted for census and admissions, mean (95% CI) | 3.9 (3.6‐4.2) | 2.8 (2.6‐3.0) | 2.2 (2.02.4) |
Figure 1 shows the pattern of daytime paging for each model. The GLM and PLM had a similar pattern, with an initial ramp up in the first 2 hours of the day, holding steady until approximately 4 pm, and then decrease until 7 pm. The SM had a steeper initial rise, and then continued to increase slowly until a peak at 4 pm.
DISCUSSION
This study corroborates that of Singh et al. (2012), who found that geographic localization led to significantly fewer pages.[14] Our results strengthen the evidence by demonstrating that even modest differences between the percent of patients localized to a care unit led to a significant decrease in the number of pages, indicating a dose‐response effect. The paging frequency we measured is higher than described in Singh et al. (1.4 pages per hour for localized teams), yet our average census appears to be 4 patients higher, which may account for some of that difference. We also show that interns on teams whose patients are more widely scattered throughout the hospital may experience upward of 5 pages per hour, an interruption by pager every 12 minutes, all day long.
A pager interruption is not solely limited to a disruption by noxious sound or vibration. The page recipient must then read the page and respond accordingly, which may involve a phone call, placing an order, walking to another location, or other work tasks. Although some of these interruptions must be handled immediately, such as a clinically deteriorating patient, many are not urgent, and could wait until the physician's current task or thought process is complete. There is also the potentially risky assumption on the part of the sender that the message has been received and will be acted upon. Furthermore, frequent paging is a common interruption to physician workflow; interruptions contribute to increased perceived physician workload[4, 5] and are likely detrimental to patient safety.[15, 16]
The most common metrics used to measure resident workload are patient census and number of admissions,[13] but these metrics have provided a mixed and likely incomplete picture. Recent research suggests that other factors, such as work efficiency (including interruptions, time spent obtaining test results, and time in transit) and work intensity (such as the acuity and complexity of patients), contribute significantly to actual and perceived resident workload.[13]
Our analysis was a single‐site, retrospective study, which occurred over 1 month and was limited to internal medicine teams. Additionally, geographic localization logically should lead to increased face‐to‐face interruptions, which we were unable to measure with this project, but direct communication is more efficient and less prone to error, which would likely lead to fewer overall interruptions. Although we anticipate that our findings are applicable to geographically localized patient care units in other hospitals, further investigation is warranted.
The paging chorus has only grown louder over the last 25 years, with likely downstream effects on patient safety and resident education. To mitigate these effects, it is incumbent upon us to approach our training and patient care environments with a critical and creative lens, and to explore opportunities to decrease interruptions and streamline our communication systems.
Acknowledgements
The authors acknowledge the assistance with data analysis of Arthur Evans, MD, MPH, and review of the manuscript by Brendan Reilly, MD.
Disclosures: Dr. Fanucchi and Ms. Unterbrink have no conflicts of interest to disclose. Dr. Logio reports receiving royalties from McGraw‐Hill for Core Concepts in Patient Safety online modules.
- , . The sounds of the hospital. Paging patterns in three teaching hospitals. N Engl J Med. 1988;319(24):1585–1589.
- , , . Communication failures: an insidious contributor to medical mishaps. Acad Med. 2004;79(2):186–194.
- , , . Alphanumeric paging: a potential source of problems in patient care and communication. J Surg Educ. 2011;68(6):447–451.
- , , , , . Hospital doctors' workflow interruptions and activities: an observation study. BMJ Qual Saf. 2011;20(6):491–497.
- , , , , . The association of workflow interruptions and hospital doctors' workload: a prospective observational study. BMJ Qual Saf. 2012;21(5):399–407.
- , . Resident workload—let's treat the disease, not just the symptom. Comment on: Effect of the 2011 vs 2003 duty hour regulation‐compliant models on sleep duration, trainee education, and continuity of patient care among internal medicine house staff. JAMA Intern Med. 2013;173(8):655–656.
- , , , et al. Effect of the 2011 vs 2003 duty hour regulation‐compliant models on sleep duration, trainee education, and continuity of patient care among internal medicine house staff: a randomized trial. JAMA Intern Med. 2013;173(8):649–655.
- , . The ACGME 2011 Duty Hour Standards: Enhancing Quality of Care, Supervision, and Resident Professional Development. Chicago, IL: Accreditation Council for Graduate Medical Education; 2011.
- , , , . Institute of Medicine Resident Duty Hours: Enhancing Sleep, Supervision, and Safety. Washington, DC: National Academies Press; 2009.
- , , , , , . Perspective: beyond counting hours: the importance of supervision, professionalism, transitions of care, and workload in residency training. Acad Med. 2012;87(7):883–888.
- , , , et al. Impact of localizing physicians to hospital units on nurse‐physician communication and agreement on the plan of care. J Gen Intern Med. 2009;24(11):1223–1227.
- , , , et al. Unit‐based care teams and the frequency and quality of physician‐nurse communications. Arch Pediatr Adolesc Med. 2011;165(5):424–428.
- , , , et al. Service census caps and unit‐based admissions: resident workload, conference attendance, duty hour compliance, and patient safety. Mayo Clin Proc. 2012;87(4):320–327.
- , , , et al. Impact of localizing general medical teams to a single nursing unit. J Hosp Med. 2012;7(7):551–556.
- . The science of interruption. BMJ Qual Saf. 2012;21(5):357–360.
- , , , et al. The impact of interruptions on clinical task completion. Qual Saf Health Care. 2010;19(4):284–289.
It's hard to imagine a busy urban hospital without its chorus of beepers.[1] This statement, the first sentence of an article published in 1988, rings (or beeps or buzzes) true to any resident physician today. At that time, pagers had replaced overhead paging, and provided a rapid method to contact physicians who were often scattered throughout the hospital. Still, it was an imperfect solution as the ubiquitous pager constantly interrupted patient care and other tasks, failed to prioritize information, and added to an already stressful working environment. Notably, interns were paged on average once per hour, and occasionally 5 or more times per hour, a frequency that was felt to be detrimental to patient care and to the working environment of resident physicians.[1]
Little has changed. Despite the instant, multidirectional communication platforms available today, alphanumeric paging remains a mainstay of communication between physicians and other members of the care team. Importantly, paging contributes to communication errors (eg, by failing to convey urgency, having incomplete information, or being missed entirely by coverage gaps),[2, 3] and interrupts resident workflow, thereby negatively affecting work efficiency and educational activities, and adding to perceived workload.[4, 5]
In this era of duty hour restrictions, there has been concern that residents experience increased workload due to having fewer hours to do the same amount of work.[6, 7] As such, the Accreditation Council of Graduate Medical Education emphasizes the quality of those hours, with a focus on several aspects of the resident working environment as key to improved educational and patient safety outcomes.[8, 9, 10]
Geographic localization of physicians to patient care units has been proposed as a means to improve communication and agreement on plans of care,[11, 12] and also to reduce resident workload by decreasing inefficiencies attributable to traveling throughout the hospital.[13] O'Leary, et al. (2009) found that when physicians were localized to 1 hospital unit, there was greater agreement between physicians and nurses on various aspects of care, such as planned tests and anticipated length of stay. In addition, members of the patient care team were better able to identify one another, and there was a perceived increase in face‐to‐face communication, and a perceived decrease in text paging.[11]
In consideration of these factors, in July 2011, at New YorkPresbyterian Hospital/Weill Cornell (NYPH/WC), an 800‐bed tertiary care teaching hospital in New York, New York, we geographically localized 2 internal medicine resident teams, and partially localized 2 additional teams. We investigated whether interns on teams that were geographically localized received fewer pages than interns on teams that were not localized. This study was reviewed by the institutional review board of Weill Cornell Medical College and met the requirements for exemption.
METHODS
We conducted a retrospective analysis of the number of pages received by interns during the day (7:00 am to 7:00 pm) on 5 general internal medicine teams during a 1‐month ward rotation between October 17, 2011 and November 13, 2011 at NYPH/WC. The general medicine teams were composed of 1 attending, 1 resident, and 2 interns each. Two teams were geographically localized to a 32‐bed unit (geographic localization model [GLM]). Two teams were partially localized to a 26‐bed unit, which included a respiratory care step‐down unit (partial localization model [PLM]). A fifth and final team admitted patients irrespective of their assigned bed location (standard model [SM]). Both the GLM and the PLM occasionally carried patients on other units to allow for overall census management and patient throughput. The total number of pages received by each intern over the study period was collected by retrospective analysis of electronic paging logs. Night pages (7 pm7 am) were excluded because of night float coverage. Weekend pages were excluded because data were inaccurate due to coverage for days off.
The daily number of admissions and daily census per team were recorded by physician assistants, who also assigned new patients to appropriate teams according to an admissions algorithm (see Supporting Figure 1 in the online version of this article). The percent of geographically localized patients on each team was estimated from the percentage of localized patients on the day of discharge averaged over the study period. For the SM team, percent localization was defined as the number of patients on the patient care unit that contained the team's work area.
Standard multivariate linear regression techniques were used to analyze the relationship between the number of pages received per intern and the type of team, controlling for the potential effect of total census and number of admissions. The regression model was used to determine adjusted marginal point estimates and 95% confidence intervals (CIs) for the average number of pages per intern per hour for each type of team. All statistical analyses were conducted using Stata version 12 (StataCorp, College Station, TX).
RESULTS
Over the 28‐day study period, a total of 6652 pages were received by 10 interns on 5 general internal medicine teams from 7 am to 7 pm Monday through Friday. The average daily census, average daily admissions, and percent of patients localized to patient care units for the individual teams are shown in Table 1. In univariate analysis, the mean daily pages per intern were not significantly different between the 2 teams within the GLM, nor between the 2 teams in the PLM, allowing them to be combined in multivariate analysis (data not shown). The number of pages received per intern per hour, adjusted for team census and number of admissions, was 2.2 (95% CI: 2.02.4) in the GLM, 2.8 (95% CI: 2.6‐3.0) in the PLM, and 3.9 (95% CI: 3.6‐4.2) in the SM (Table 1). All of these differences were statistically significant (P0.001).
| Standard Model* | Partial Localization Model | Geographically Localized Model | |
|---|---|---|---|
| |||
| Percent of patients localized | 37% | 45% | 85% |
| Team census, mean (range per day) | 16.1 (1320) | 15.9 (1120) | 15.6 (1119) |
| Team admissions, mean (range per day) | 2.7 (15) | 2.9 (06) | 3.5 (07) |
| Pages per hour per intern, unadjusted, mean (95% CI) | 3.9 (3.6‐4.1) | 2.8 (2.6‐3.0) | 2.2 (2.02.4) |
| Pages per hour per intern, adjusted for census and admissions, mean (95% CI) | 3.9 (3.6‐4.2) | 2.8 (2.6‐3.0) | 2.2 (2.02.4) |
Figure 1 shows the pattern of daytime paging for each model. The GLM and PLM had a similar pattern, with an initial ramp up in the first 2 hours of the day, holding steady until approximately 4 pm, and then decrease until 7 pm. The SM had a steeper initial rise, and then continued to increase slowly until a peak at 4 pm.
DISCUSSION
This study corroborates that of Singh et al. (2012), who found that geographic localization led to significantly fewer pages.[14] Our results strengthen the evidence by demonstrating that even modest differences between the percent of patients localized to a care unit led to a significant decrease in the number of pages, indicating a dose‐response effect. The paging frequency we measured is higher than described in Singh et al. (1.4 pages per hour for localized teams), yet our average census appears to be 4 patients higher, which may account for some of that difference. We also show that interns on teams whose patients are more widely scattered throughout the hospital may experience upward of 5 pages per hour, an interruption by pager every 12 minutes, all day long.
A pager interruption is not solely limited to a disruption by noxious sound or vibration. The page recipient must then read the page and respond accordingly, which may involve a phone call, placing an order, walking to another location, or other work tasks. Although some of these interruptions must be handled immediately, such as a clinically deteriorating patient, many are not urgent, and could wait until the physician's current task or thought process is complete. There is also the potentially risky assumption on the part of the sender that the message has been received and will be acted upon. Furthermore, frequent paging is a common interruption to physician workflow; interruptions contribute to increased perceived physician workload[4, 5] and are likely detrimental to patient safety.[15, 16]
The most common metrics used to measure resident workload are patient census and number of admissions,[13] but these metrics have provided a mixed and likely incomplete picture. Recent research suggests that other factors, such as work efficiency (including interruptions, time spent obtaining test results, and time in transit) and work intensity (such as the acuity and complexity of patients), contribute significantly to actual and perceived resident workload.[13]
Our analysis was a single‐site, retrospective study, which occurred over 1 month and was limited to internal medicine teams. Additionally, geographic localization logically should lead to increased face‐to‐face interruptions, which we were unable to measure with this project, but direct communication is more efficient and less prone to error, which would likely lead to fewer overall interruptions. Although we anticipate that our findings are applicable to geographically localized patient care units in other hospitals, further investigation is warranted.
The paging chorus has only grown louder over the last 25 years, with likely downstream effects on patient safety and resident education. To mitigate these effects, it is incumbent upon us to approach our training and patient care environments with a critical and creative lens, and to explore opportunities to decrease interruptions and streamline our communication systems.
Acknowledgements
The authors acknowledge the assistance with data analysis of Arthur Evans, MD, MPH, and review of the manuscript by Brendan Reilly, MD.
Disclosures: Dr. Fanucchi and Ms. Unterbrink have no conflicts of interest to disclose. Dr. Logio reports receiving royalties from McGraw‐Hill for Core Concepts in Patient Safety online modules.
- , . The sounds of the hospital. Paging patterns in three teaching hospitals. N Engl J Med. 1988;319(24):1585–1589.
- , , . Communication failures: an insidious contributor to medical mishaps. Acad Med. 2004;79(2):186–194.
- , , . Alphanumeric paging: a potential source of problems in patient care and communication. J Surg Educ. 2011;68(6):447–451.
- , , , , . Hospital doctors' workflow interruptions and activities: an observation study. BMJ Qual Saf. 2011;20(6):491–497.
- , , , , . The association of workflow interruptions and hospital doctors' workload: a prospective observational study. BMJ Qual Saf. 2012;21(5):399–407.
- , . Resident workload—let's treat the disease, not just the symptom. Comment on: Effect of the 2011 vs 2003 duty hour regulation‐compliant models on sleep duration, trainee education, and continuity of patient care among internal medicine house staff. JAMA Intern Med. 2013;173(8):655–656.
- , , , et al. Effect of the 2011 vs 2003 duty hour regulation‐compliant models on sleep duration, trainee education, and continuity of patient care among internal medicine house staff: a randomized trial. JAMA Intern Med. 2013;173(8):649–655.
- , . The ACGME 2011 Duty Hour Standards: Enhancing Quality of Care, Supervision, and Resident Professional Development. Chicago, IL: Accreditation Council for Graduate Medical Education; 2011.
- , , , . Institute of Medicine Resident Duty Hours: Enhancing Sleep, Supervision, and Safety. Washington, DC: National Academies Press; 2009.
- , , , , , . Perspective: beyond counting hours: the importance of supervision, professionalism, transitions of care, and workload in residency training. Acad Med. 2012;87(7):883–888.
- , , , et al. Impact of localizing physicians to hospital units on nurse‐physician communication and agreement on the plan of care. J Gen Intern Med. 2009;24(11):1223–1227.
- , , , et al. Unit‐based care teams and the frequency and quality of physician‐nurse communications. Arch Pediatr Adolesc Med. 2011;165(5):424–428.
- , , , et al. Service census caps and unit‐based admissions: resident workload, conference attendance, duty hour compliance, and patient safety. Mayo Clin Proc. 2012;87(4):320–327.
- , , , et al. Impact of localizing general medical teams to a single nursing unit. J Hosp Med. 2012;7(7):551–556.
- . The science of interruption. BMJ Qual Saf. 2012;21(5):357–360.
- , , , et al. The impact of interruptions on clinical task completion. Qual Saf Health Care. 2010;19(4):284–289.
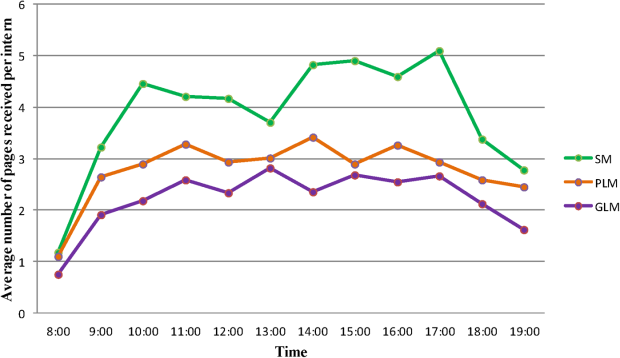
Measuring the MEWS and the Rothman Index
Bedside calculation of early warning system (EWS) scores is standard practice in many hospitals to predict clinical deterioration. These systems were designed for periodic hand‐scoring, typically using a half‐dozen variables dominated by vital signs. Most derive from the Modified Early Warning Score (MEWS).[1, 2] Despite years of modification, EWSs have had only modest impact on outcomes.[3, 4] Major improvement is possible only by adding more information than is contained in vital signs. Thus, the next generation of EWSs must analyze electronic medical records (EMRs). Analysis would be performed by computer, displayed automatically, and updated whenever new data are entered into the EMR. Such systems could deliver timely, accurate, longitudinally trended acuity information that could aid in earlier detection of declining patient condition as well as improving sensitivity and specificity of EWS alarms.
Advancing this endeavor along with others,[5, 6] we previously published a patient acuity metric, the Rothman Index (RI), which automatically updates when asynchronous vital signs, laboratory test results, Braden Scale,[7] cardiac rhythm, and nursing assessments are entered into the EMR.[8] Our goal was to enable clinicians to visualize changes in acuity by simple line graphs personalized to each patient at any point in time across the trajectory of care. In our model validation studies,[8] we made no attempt to identify generalizable thresholds, though others[9] have defined decision cut points for RI in a nonemergent context. To examine decision support feasibility in an emergent context, and to compare RI with a general EWS standard, we compare the accuracy of the RI with the MEWS in predicting hospital death within 24 hours.
METHODS
Site Description and Ethics
The institutional review board of Abington Memorial Hospital (Abington, PA) approved collection of retrospective data obtained from their 665‐bed, regional referral center and teaching hospital. Handling of patient information complied with the Health Insurance Portability and Accountability Act of 1996 regulations.
Patient Inclusion
The analysis included all patients, aged 18 years or older, admitted from July 2009 through June 2010, when there were sufficient data in the EMR to compute the RI. Obstetric and psychiatric patients were excluded because nursing documentation is insufficient in this dataset.
Data Collection/Data Sources
Clinical variables were extracted from the EMR (AllScripts Sunrise Clinical Manager, Chicago, IL) by SQL query and placed into a database. RI[8] and MEWS[1] were computed according to published methods. Table 1 shows definitions of standards for each nursing assessment,[8] and Table 2 identifies all clinical variables employed for each system. Briefly, RI utilizes 26 variables related to clinical care and routinely available in the EMR. These include vital signs, laboratory results, cardiac rhythms, and nursing assessments. Excess risk associated with any value of a variable is defined as percent absolute increase in 1‐year mortality relative to minimum 1‐year mortality identified for that variable. Excess risk is summed on a linear scale to reflect cumulative risk for individual patients at any given time. RI was computed at every new observation during a patient visit, when input values were available. Laboratory results are included when measured, but after 24 hours their weighting is reduced by 50%, and after 48 hours they are excluded. Data input intervals were a function of institutional patient care protocols and physician orders. All observations during a patient's stay were included in the analysis, per the method of Prytherch et al.[4] Because data did not contain the simplified alert/voice/pain/unresponsive (A/V/P/U) score, computation of MEWS used appropriate mapping of the Glasgow Coma Scale.[10] A corresponding MEWS was calculated for each RI. The relationship between RI and MEWS is inverse. RI ranges from 91 to 100, with lower scores indicating increasing acuity. MEWS ranges from 0 to 14, with higher scores indicating increasing acuity.
| |
| Cardiac | Pulse regular, rate 60100 bpm, skin warm and dry. Blood pressure 140/90 and no symptoms of hypotension. |
| Food/nutrition | No difficulty with chewing, swallowing, or manual dexterity. Patient consuming >50% of daily diet ordered as observed or stated. |
| Gastrointestinal | Abdomen soft and nontender. Bowel sounds present. No nausea or vomiting. Continent. Bowel pattern normal as observed or stated. |
| Genitourinary | Voids without difficulty. Continent. Urine clear, yellow to amber as observed or stated. Urinary catheter patent if present. |
| Musculoskeletal | Independently able to move all extremities and perform functional activities as observed or stated (includes assistive devices). |
| Neurological | Alert and oriented to person, place, time, situation. Speech is coherent. |
| Peripheral‐vascular | Extremities are normal or pink and warm. Peripheral pulses palpable. Capillary refill 3 seconds. No edema, numbness or tingling. |
| Psychosocial | Behavior appropriate to situation. Expressed concerns and fears being addressed. Adequate support system. |
| Respiratory | Respiration 1224/minute at rest, quiet and regular. Bilateral breath sounds clear. Nail beds and mucous membranes pink. Sputum clear, if present. |
| Safety/fall risk | Safety/fall risk factors not present. Not a risk to self or others. |
| Skin/tissue | Skin clean, dry, and intact with no reddened areas. Patient is alert, cooperative and able to reposition self independently. Braden Scale >15. |
| Input Variable | A: Alive in 24 Hours, Mean (SD) | B: Dead Within 24 Hours, Mean (SD) | P Value |
|---|---|---|---|
| |||
| Diastolic blood pressure, mm Hg | 66.8 (13.5) | 56.6 (16.8) | 0.0001 |
| Systolic blood pressure, mm Hga | 127.3 (23.8) | 105.2 (29.4) | 0.0001 |
| Temperature, Fa | 98.2 (1.1) | 98.2 (2.0) | 0.1165 |
| Respiration, breaths per minutea | 20.1 (4.7) | 23.6 (9.1) | 0.0001 |
| Heart rate, bpma | 81.1 (16.5) | 96.9 (22.2) | 0.0001 |
| Pulse oximetry, % O2 saturation | 96.3 (3.3) | 93.8 (10.1) | 0.0001 |
| Creatinine, mg/dL | 1.2 (1.2) | 1.8 (1.5) | 0.0001 |
| Blood urea nitrogen, mg/dL | 23.9 (17.9) | 42.1 (26.4) | 0.0001 |
| Serum chloride, mmol/L | 104.3 (5.4) | 106.9 (9.7) | 0.0001 |
| Serum potassium, mmol/L | 4.2 (0.5) | 4.4 (0.8) | 0.0001 |
| Serum sodium, mmol/L | 139.0 (4.1) | 140.7 (8.5) | 0.0001 |
| Hemoglobin, gm/dL | 11.2 (2.1) | 10.6 (2.1) | 0.0001 |
| White blood cell count, 103 cell/L | 9.9 (6.3) | 15.0 (10.9) | 0.0001 |
| Braden Scale, total points | 17.7 (3.4) | 12.2 (3.1) | 0.0001 |
| NURSING ASSESSMENTS | A: Alive in 24 Hours and Failed Standard | B: Dead Within 24 Hours and Failed Standard | P Value |
| Neurological | 38.7% | 91.4% | 0.0001 |
| Genitourinary | 46.6% | 90.0% | 0.0001 |
| Respiratory | 55.6% | 89.0% | 0.0001 |
| Peripheral vascular | 54.1% | 86.9% | 0.0001 |
| Food | 28.3% | 80.6% | 0.0001 |
| Skin | 56.3% | 75.0% | 0.0001 |
| Gastrointestinal | 49.3% | 75.0% | 0.0001 |
| Musculoskeletal | 50.3% | 72.4% | 0.0001 |
| Cardiac | 30.4% | 59.8% | 0.0001 |
| Psychosocial | 24.6% | 40.9% | 0.0001 |
| Safety | 25.5% | 29.0% | 0.0001 |
| A/V/P/U scorea | 96.3/2.1/1.4/0.2% | 88.6/21.6/4.6/5.3% | 0.0001 |
| Sinus rhythm (absent)b | 34.9% | 53.3% | 0.0001 |
Outcome Ascertainment
In‐hospital death was determined by merging the date and time of discharge with clinical inputs from the hospital's EMR. Data points were judged to be within 24 hours of death if the timestamp of the data point collection was within 24 hours of the discharge time with expired as the discharge disposition.
Statistical Methods
Demographics and input variables from the 2 groups of observations, those who were within 24 hours of death and those who were not, were compared using a t test with a Cochran and Cox[11] approximation of the probability level of the approximate t statistic for unequal variances. Mean, standard deviation, and P values are reported. Discrimination of RI and MEWS to predict 24‐hour mortality was estimated using area under the receiver operating characteristic (ROC) curve (AUC), and null hypothesis was tested using 2. Sensitivity, specificity, positive predictive value (PPV), negative predictive value (NPV), positive and negative likelihood ratios (LR+, LR) were computed. Analyses were performed with SAS 9.3 (procedures ttest, freq, logistic, nlmixed; SAS Institute, Cary, NC). Typically MEWS=4 triggers a protocol to increase level of assessment and/or care, often a transfer to the intensive care unit (ICU). We denoted the point on ROC curve where MEWS=4 and identified an RI point of similar LR and sensitivity to compare false alarm rate. Then we identified an RI point of similar LR+ for comparison of LR and sensitivity.
RESULTS
A total of 1,794,910 observations during 32,472 patient visits were included; 617 patients died (1.9%). Physiological characteristics for all input variables used by RI or MEWS are shown in Table 2, comparing observations taken within 24 hours of death to all other observations.
RI versus MEWS demonstrated superior discrimination of 24‐hour mortality (AUC was 0.93 [95% confidence interval {CI}: 0.92‐0.93] vs 0.82 [95% CI: 0.82‐0.83]; difference, 0.11 [95% CI: 0.10‐0.11]; P0.0001). ROC curves for RI and MEWS are shown in Figure 1; the MEWS is subsumed by RI across the entire range. Further, paired comparisons at points of clinical importance are presented in Table 3 for LR+, LR, sensitivity, specificity, PPV, and NPV. In the first pair of columns, MEWS=4 (typical trigger point for alarms) is matched to RI using sensitivity or LR; the corresponding point is RI=16, which generates twice the LR+ and reduces false alarms by 53%. In the second pair of columns, MEWS=4 is matched to RI using PPV or LR+; the corresponding point is RI=30, which captures 54% more of those patients who will die within 24 hours.
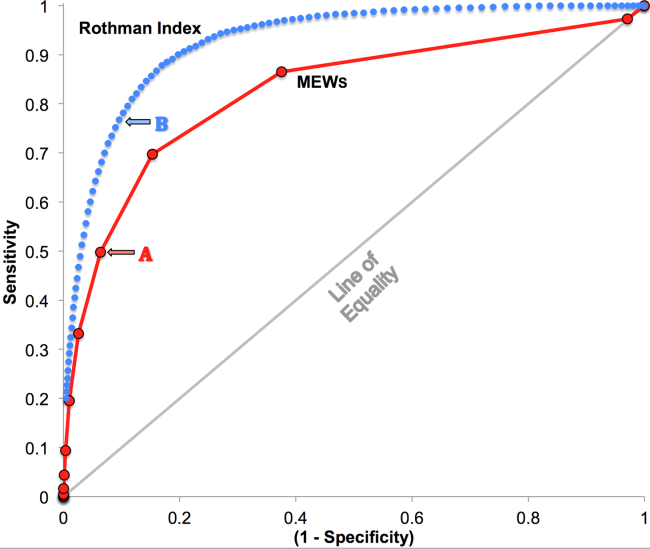
| Cut Points | MEWS=4 | RI=16a | MEWS=4 | RI=30b |
|---|---|---|---|---|
| ||||
| Likelihood ratio, positive | 7.8 | 16.9 | 7.8c | 7.9c |
| Likelihood ratio, negative | 0.54c | 0.53c | 0.54 | 0.26 |
| Sensitivity | 49.8% | 48.9% | 49.8% | 76.8% |
| Specificity | 93.6% | 97.1% | 93.6% | 90.4% |
| Positive predictive value | 5.2% | 10.6% | 5.2% | 5.3% |
| Negative predictive value | 99.6% | 99.6% | 99.6% | 99.8% |
DISCUSSION
We have shown that a general acuity metric (RI) computed using data routinely entered into an EMR outperforms MEWS in identifying hospitalized patients likely to die within 24 hours. At similar sensitivity, RI yields an LR+ more than 2‐fold greater, at a value often considered conclusive. MEWS is derived using 4 vital signs and a neurologic assessment. Such a focus on vital signs may limit responsiveness to changes in acuity, especially during early clinical deterioration. Indeed, threshold breach tools may inadvertently induce a false sense of an individual patient's condition and safety.[12] The present findings suggest the performance of RI over MEWS may be due to inclusion of nursing assessments, laboratory test results, and heart rhythm. Relative contributions of each category are: vital signs (35%), nursing assessments (34%), and laboratory test results (31%). We found in previous work that failed nursing assessments strongly correlate with mortality,[13] as illustrated in Table 2 by sharp differences between patients dying within 24 hours and those who did not.
Sensitivity to detect early deterioration, especially when not evidenced by compromised vital signs, is crucial for acuity vigilance and preemptive interventions. Others[14] have demonstrated that our approach to longitudinal modeling of the acuity continuum is well positioned to investigate clinical pathophysiology preceding adverse events and to identify actionable trends in patients at high risk of complications and sepsis after colorectal operations. Future research may reveal both clinical and administrative advantages to having this real‐time acuity measure available for all patients during the entire hospital visit, with efficacy in applications beyond use as a trigger for EWS alarms.
Study limitations include retrospective design, single‐center cohort, no exclusion of expected hospital deaths, and EMR requirement. For MEWS, the Glasgow Coma Scale was mapped to A/V/P/U, which does not appear to affect results, as our c‐statistic is identical to the literature.[4] Any hospital with an EMR collects the data necessary for computation of RI values. The RI algorithms are available in software compatible with systems from numerous EMR manufacturers (eg, Epic, Cerner, McKesson, Siemens, AllScripts, Phillips).
The advent of the EMR in hospitals marries well with an EWS that leverages from additional data more information than is contained in vital signs, permitting complex numeric computations of acuity scores, a process simply not possible with paper systems. Further, the automatic recalculation of the score reduces the burden on clinicians, and broadens potential use over a wide range, from minute‐by‐minute recalculations when attached to sensors in the ICU, to comparative metrics of hospital performance, to nonclinical financial resource applications. This new information technology is guiding methods to achieve a significant performance increment over current EWS and may assist earlier detection of deterioration, providing a chance to avoid medical crises.[15]
Acknowledgements
The authors express their appreciation to Abington Memorial Hospital. Particular thanks are extended to Steven I. Rothman, MSEM, for extensive discussions and technical support. The authors thank Alan Solinger, PhD, for his assistance in reviewing the manuscript.
Disclosures: One author (RAS) declares no conflict of interest. Two authors (GDF, MJR) are employees and shareholders in PeraHealth, Inc. of Charlotte, North Carolina, a health information technology company that offers products utilizing the Rothman Index. All of the original research defining the Rothman Index was performed prior to the formation of the company and is now published in peer‐reviewed journals. The index is freely available to all qualified researchers and is currently installed at several major medical research centers and hospital systems. This present work is under the auspices and partly funded by an independent foundation, F.A.R. Institute of Sarasota, Florida. Early research defining the Rothman Index was funded by grants from Sarasota Memorial Healthcare Foundation and the Goldsmith Fund of Greenfield Foundation. Continuing research has been funded by the F.A.R. Institute.
- , , , . Validation of a modified Early Warning Score in medical admissions. QJM Mon J Assoc Physicians. 2001;94:521–526.
- , , . Monitoring vital signs using early warning scoring systems: a review of the literature. J Nurs Manag. 2011;19:311–330.
- , , , et al. A clinical deterioration prediction tool for internal medicine patients. Am J Med Qual. 2013;28:135–142.
- , , , . ViEWS—towards a national early warning score for detecting adult inpatient deterioration. Resuscitation. 2010;81:932–937.
- , , , , , . Early detection of impending physiologic deterioration among patients who are not in intensive care: development of predictive models using data from an automated electronic medical record. J Hosp Med. 2012;7:388–395.
- , , , et al. Predicting out of intensive care unit cardiopulmonary arrest or death using electronic medical record data. BMC Med Inform Decis Mak. 2013;13:28.
- , , , The Braden Scale for predicting pressure sore risk. Nurs Res. 1987;36:205–210.
- , , . Development and validation of a continuous measure of patient condition using the electronic medical record. J Biomed Inform. 2013;46:837–848.
- , , , , . Identifying patients at increased risk for unplanned readmission. Med Care. 2013;51:761–766.
- , , . Comparison of consciousness level assessment in the poisoned patient using the alert/verbal/painful/unresponsive scale and the Glasgow Coma Scale. Ann Emerg Med. 2004;44:108–113.
- , . Experimental Design. New York, NY: John Wiley 1950.
- , . Patterns of unexpected in‐hospital deaths: a root cause analysis. Patient Saf Surg. 2011;5:3.
- , , , . Clinical implications and validity of nursing assessments: a longitudinal measure of patient condition from analysis of the Electronic Medical Record. BMJ Open. 2012;2(4):pii: e000646.
- , , , . Automated analysis of electronic medical record data reflects the pathophysiology of operative complications. Surgery. 2013;154:918–926.
- , , Not getting better means getting worse—trends in Early Warning Scores suggest that there might only be a short time span to rescue those threatening to fall off a “physiological” cliff? Resuscitation. 2013;84:409–410.
Bedside calculation of early warning system (EWS) scores is standard practice in many hospitals to predict clinical deterioration. These systems were designed for periodic hand‐scoring, typically using a half‐dozen variables dominated by vital signs. Most derive from the Modified Early Warning Score (MEWS).[1, 2] Despite years of modification, EWSs have had only modest impact on outcomes.[3, 4] Major improvement is possible only by adding more information than is contained in vital signs. Thus, the next generation of EWSs must analyze electronic medical records (EMRs). Analysis would be performed by computer, displayed automatically, and updated whenever new data are entered into the EMR. Such systems could deliver timely, accurate, longitudinally trended acuity information that could aid in earlier detection of declining patient condition as well as improving sensitivity and specificity of EWS alarms.
Advancing this endeavor along with others,[5, 6] we previously published a patient acuity metric, the Rothman Index (RI), which automatically updates when asynchronous vital signs, laboratory test results, Braden Scale,[7] cardiac rhythm, and nursing assessments are entered into the EMR.[8] Our goal was to enable clinicians to visualize changes in acuity by simple line graphs personalized to each patient at any point in time across the trajectory of care. In our model validation studies,[8] we made no attempt to identify generalizable thresholds, though others[9] have defined decision cut points for RI in a nonemergent context. To examine decision support feasibility in an emergent context, and to compare RI with a general EWS standard, we compare the accuracy of the RI with the MEWS in predicting hospital death within 24 hours.
METHODS
Site Description and Ethics
The institutional review board of Abington Memorial Hospital (Abington, PA) approved collection of retrospective data obtained from their 665‐bed, regional referral center and teaching hospital. Handling of patient information complied with the Health Insurance Portability and Accountability Act of 1996 regulations.
Patient Inclusion
The analysis included all patients, aged 18 years or older, admitted from July 2009 through June 2010, when there were sufficient data in the EMR to compute the RI. Obstetric and psychiatric patients were excluded because nursing documentation is insufficient in this dataset.
Data Collection/Data Sources
Clinical variables were extracted from the EMR (AllScripts Sunrise Clinical Manager, Chicago, IL) by SQL query and placed into a database. RI[8] and MEWS[1] were computed according to published methods. Table 1 shows definitions of standards for each nursing assessment,[8] and Table 2 identifies all clinical variables employed for each system. Briefly, RI utilizes 26 variables related to clinical care and routinely available in the EMR. These include vital signs, laboratory results, cardiac rhythms, and nursing assessments. Excess risk associated with any value of a variable is defined as percent absolute increase in 1‐year mortality relative to minimum 1‐year mortality identified for that variable. Excess risk is summed on a linear scale to reflect cumulative risk for individual patients at any given time. RI was computed at every new observation during a patient visit, when input values were available. Laboratory results are included when measured, but after 24 hours their weighting is reduced by 50%, and after 48 hours they are excluded. Data input intervals were a function of institutional patient care protocols and physician orders. All observations during a patient's stay were included in the analysis, per the method of Prytherch et al.[4] Because data did not contain the simplified alert/voice/pain/unresponsive (A/V/P/U) score, computation of MEWS used appropriate mapping of the Glasgow Coma Scale.[10] A corresponding MEWS was calculated for each RI. The relationship between RI and MEWS is inverse. RI ranges from 91 to 100, with lower scores indicating increasing acuity. MEWS ranges from 0 to 14, with higher scores indicating increasing acuity.
| |
| Cardiac | Pulse regular, rate 60100 bpm, skin warm and dry. Blood pressure 140/90 and no symptoms of hypotension. |
| Food/nutrition | No difficulty with chewing, swallowing, or manual dexterity. Patient consuming >50% of daily diet ordered as observed or stated. |
| Gastrointestinal | Abdomen soft and nontender. Bowel sounds present. No nausea or vomiting. Continent. Bowel pattern normal as observed or stated. |
| Genitourinary | Voids without difficulty. Continent. Urine clear, yellow to amber as observed or stated. Urinary catheter patent if present. |
| Musculoskeletal | Independently able to move all extremities and perform functional activities as observed or stated (includes assistive devices). |
| Neurological | Alert and oriented to person, place, time, situation. Speech is coherent. |
| Peripheral‐vascular | Extremities are normal or pink and warm. Peripheral pulses palpable. Capillary refill 3 seconds. No edema, numbness or tingling. |
| Psychosocial | Behavior appropriate to situation. Expressed concerns and fears being addressed. Adequate support system. |
| Respiratory | Respiration 1224/minute at rest, quiet and regular. Bilateral breath sounds clear. Nail beds and mucous membranes pink. Sputum clear, if present. |
| Safety/fall risk | Safety/fall risk factors not present. Not a risk to self or others. |
| Skin/tissue | Skin clean, dry, and intact with no reddened areas. Patient is alert, cooperative and able to reposition self independently. Braden Scale >15. |
| Input Variable | A: Alive in 24 Hours, Mean (SD) | B: Dead Within 24 Hours, Mean (SD) | P Value |
|---|---|---|---|
| |||
| Diastolic blood pressure, mm Hg | 66.8 (13.5) | 56.6 (16.8) | 0.0001 |
| Systolic blood pressure, mm Hga | 127.3 (23.8) | 105.2 (29.4) | 0.0001 |
| Temperature, Fa | 98.2 (1.1) | 98.2 (2.0) | 0.1165 |
| Respiration, breaths per minutea | 20.1 (4.7) | 23.6 (9.1) | 0.0001 |
| Heart rate, bpma | 81.1 (16.5) | 96.9 (22.2) | 0.0001 |
| Pulse oximetry, % O2 saturation | 96.3 (3.3) | 93.8 (10.1) | 0.0001 |
| Creatinine, mg/dL | 1.2 (1.2) | 1.8 (1.5) | 0.0001 |
| Blood urea nitrogen, mg/dL | 23.9 (17.9) | 42.1 (26.4) | 0.0001 |
| Serum chloride, mmol/L | 104.3 (5.4) | 106.9 (9.7) | 0.0001 |
| Serum potassium, mmol/L | 4.2 (0.5) | 4.4 (0.8) | 0.0001 |
| Serum sodium, mmol/L | 139.0 (4.1) | 140.7 (8.5) | 0.0001 |
| Hemoglobin, gm/dL | 11.2 (2.1) | 10.6 (2.1) | 0.0001 |
| White blood cell count, 103 cell/L | 9.9 (6.3) | 15.0 (10.9) | 0.0001 |
| Braden Scale, total points | 17.7 (3.4) | 12.2 (3.1) | 0.0001 |
| NURSING ASSESSMENTS | A: Alive in 24 Hours and Failed Standard | B: Dead Within 24 Hours and Failed Standard | P Value |
| Neurological | 38.7% | 91.4% | 0.0001 |
| Genitourinary | 46.6% | 90.0% | 0.0001 |
| Respiratory | 55.6% | 89.0% | 0.0001 |
| Peripheral vascular | 54.1% | 86.9% | 0.0001 |
| Food | 28.3% | 80.6% | 0.0001 |
| Skin | 56.3% | 75.0% | 0.0001 |
| Gastrointestinal | 49.3% | 75.0% | 0.0001 |
| Musculoskeletal | 50.3% | 72.4% | 0.0001 |
| Cardiac | 30.4% | 59.8% | 0.0001 |
| Psychosocial | 24.6% | 40.9% | 0.0001 |
| Safety | 25.5% | 29.0% | 0.0001 |
| A/V/P/U scorea | 96.3/2.1/1.4/0.2% | 88.6/21.6/4.6/5.3% | 0.0001 |
| Sinus rhythm (absent)b | 34.9% | 53.3% | 0.0001 |
Outcome Ascertainment
In‐hospital death was determined by merging the date and time of discharge with clinical inputs from the hospital's EMR. Data points were judged to be within 24 hours of death if the timestamp of the data point collection was within 24 hours of the discharge time with expired as the discharge disposition.
Statistical Methods
Demographics and input variables from the 2 groups of observations, those who were within 24 hours of death and those who were not, were compared using a t test with a Cochran and Cox[11] approximation of the probability level of the approximate t statistic for unequal variances. Mean, standard deviation, and P values are reported. Discrimination of RI and MEWS to predict 24‐hour mortality was estimated using area under the receiver operating characteristic (ROC) curve (AUC), and null hypothesis was tested using 2. Sensitivity, specificity, positive predictive value (PPV), negative predictive value (NPV), positive and negative likelihood ratios (LR+, LR) were computed. Analyses were performed with SAS 9.3 (procedures ttest, freq, logistic, nlmixed; SAS Institute, Cary, NC). Typically MEWS=4 triggers a protocol to increase level of assessment and/or care, often a transfer to the intensive care unit (ICU). We denoted the point on ROC curve where MEWS=4 and identified an RI point of similar LR and sensitivity to compare false alarm rate. Then we identified an RI point of similar LR+ for comparison of LR and sensitivity.
RESULTS
A total of 1,794,910 observations during 32,472 patient visits were included; 617 patients died (1.9%). Physiological characteristics for all input variables used by RI or MEWS are shown in Table 2, comparing observations taken within 24 hours of death to all other observations.
RI versus MEWS demonstrated superior discrimination of 24‐hour mortality (AUC was 0.93 [95% confidence interval {CI}: 0.92‐0.93] vs 0.82 [95% CI: 0.82‐0.83]; difference, 0.11 [95% CI: 0.10‐0.11]; P0.0001). ROC curves for RI and MEWS are shown in Figure 1; the MEWS is subsumed by RI across the entire range. Further, paired comparisons at points of clinical importance are presented in Table 3 for LR+, LR, sensitivity, specificity, PPV, and NPV. In the first pair of columns, MEWS=4 (typical trigger point for alarms) is matched to RI using sensitivity or LR; the corresponding point is RI=16, which generates twice the LR+ and reduces false alarms by 53%. In the second pair of columns, MEWS=4 is matched to RI using PPV or LR+; the corresponding point is RI=30, which captures 54% more of those patients who will die within 24 hours.
| Cut Points | MEWS=4 | RI=16a | MEWS=4 | RI=30b |
|---|---|---|---|---|
| ||||
| Likelihood ratio, positive | 7.8 | 16.9 | 7.8c | 7.9c |
| Likelihood ratio, negative | 0.54c | 0.53c | 0.54 | 0.26 |
| Sensitivity | 49.8% | 48.9% | 49.8% | 76.8% |
| Specificity | 93.6% | 97.1% | 93.6% | 90.4% |
| Positive predictive value | 5.2% | 10.6% | 5.2% | 5.3% |
| Negative predictive value | 99.6% | 99.6% | 99.6% | 99.8% |
DISCUSSION
We have shown that a general acuity metric (RI) computed using data routinely entered into an EMR outperforms MEWS in identifying hospitalized patients likely to die within 24 hours. At similar sensitivity, RI yields an LR+ more than 2‐fold greater, at a value often considered conclusive. MEWS is derived using 4 vital signs and a neurologic assessment. Such a focus on vital signs may limit responsiveness to changes in acuity, especially during early clinical deterioration. Indeed, threshold breach tools may inadvertently induce a false sense of an individual patient's condition and safety.[12] The present findings suggest the performance of RI over MEWS may be due to inclusion of nursing assessments, laboratory test results, and heart rhythm. Relative contributions of each category are: vital signs (35%), nursing assessments (34%), and laboratory test results (31%). We found in previous work that failed nursing assessments strongly correlate with mortality,[13] as illustrated in Table 2 by sharp differences between patients dying within 24 hours and those who did not.
Sensitivity to detect early deterioration, especially when not evidenced by compromised vital signs, is crucial for acuity vigilance and preemptive interventions. Others[14] have demonstrated that our approach to longitudinal modeling of the acuity continuum is well positioned to investigate clinical pathophysiology preceding adverse events and to identify actionable trends in patients at high risk of complications and sepsis after colorectal operations. Future research may reveal both clinical and administrative advantages to having this real‐time acuity measure available for all patients during the entire hospital visit, with efficacy in applications beyond use as a trigger for EWS alarms.
Study limitations include retrospective design, single‐center cohort, no exclusion of expected hospital deaths, and EMR requirement. For MEWS, the Glasgow Coma Scale was mapped to A/V/P/U, which does not appear to affect results, as our c‐statistic is identical to the literature.[4] Any hospital with an EMR collects the data necessary for computation of RI values. The RI algorithms are available in software compatible with systems from numerous EMR manufacturers (eg, Epic, Cerner, McKesson, Siemens, AllScripts, Phillips).
The advent of the EMR in hospitals marries well with an EWS that leverages from additional data more information than is contained in vital signs, permitting complex numeric computations of acuity scores, a process simply not possible with paper systems. Further, the automatic recalculation of the score reduces the burden on clinicians, and broadens potential use over a wide range, from minute‐by‐minute recalculations when attached to sensors in the ICU, to comparative metrics of hospital performance, to nonclinical financial resource applications. This new information technology is guiding methods to achieve a significant performance increment over current EWS and may assist earlier detection of deterioration, providing a chance to avoid medical crises.[15]
Acknowledgements
The authors express their appreciation to Abington Memorial Hospital. Particular thanks are extended to Steven I. Rothman, MSEM, for extensive discussions and technical support. The authors thank Alan Solinger, PhD, for his assistance in reviewing the manuscript.
Disclosures: One author (RAS) declares no conflict of interest. Two authors (GDF, MJR) are employees and shareholders in PeraHealth, Inc. of Charlotte, North Carolina, a health information technology company that offers products utilizing the Rothman Index. All of the original research defining the Rothman Index was performed prior to the formation of the company and is now published in peer‐reviewed journals. The index is freely available to all qualified researchers and is currently installed at several major medical research centers and hospital systems. This present work is under the auspices and partly funded by an independent foundation, F.A.R. Institute of Sarasota, Florida. Early research defining the Rothman Index was funded by grants from Sarasota Memorial Healthcare Foundation and the Goldsmith Fund of Greenfield Foundation. Continuing research has been funded by the F.A.R. Institute.
- , , , . Validation of a modified Early Warning Score in medical admissions. QJM Mon J Assoc Physicians. 2001;94:521–526.
- , , . Monitoring vital signs using early warning scoring systems: a review of the literature. J Nurs Manag. 2011;19:311–330.
- , , , et al. A clinical deterioration prediction tool for internal medicine patients. Am J Med Qual. 2013;28:135–142.
- , , , . ViEWS—towards a national early warning score for detecting adult inpatient deterioration. Resuscitation. 2010;81:932–937.
- , , , , , . Early detection of impending physiologic deterioration among patients who are not in intensive care: development of predictive models using data from an automated electronic medical record. J Hosp Med. 2012;7:388–395.
- , , , et al. Predicting out of intensive care unit cardiopulmonary arrest or death using electronic medical record data. BMC Med Inform Decis Mak. 2013;13:28.
- , , , The Braden Scale for predicting pressure sore risk. Nurs Res. 1987;36:205–210.
- , , . Development and validation of a continuous measure of patient condition using the electronic medical record. J Biomed Inform. 2013;46:837–848.
- , , , , . Identifying patients at increased risk for unplanned readmission. Med Care. 2013;51:761–766.
- , , . Comparison of consciousness level assessment in the poisoned patient using the alert/verbal/painful/unresponsive scale and the Glasgow Coma Scale. Ann Emerg Med. 2004;44:108–113.
- , . Experimental Design. New York, NY: John Wiley 1950.
- , . Patterns of unexpected in‐hospital deaths: a root cause analysis. Patient Saf Surg. 2011;5:3.
- , , , . Clinical implications and validity of nursing assessments: a longitudinal measure of patient condition from analysis of the Electronic Medical Record. BMJ Open. 2012;2(4):pii: e000646.
- , , , . Automated analysis of electronic medical record data reflects the pathophysiology of operative complications. Surgery. 2013;154:918–926.
- , , Not getting better means getting worse—trends in Early Warning Scores suggest that there might only be a short time span to rescue those threatening to fall off a “physiological” cliff? Resuscitation. 2013;84:409–410.

Upper Extremity DVT in Hospitalized Patients
Increasingly, there is a focus on prevention of hospital‐acquired conditions including venous thromboembolism (VTE). Many studies have evaluated pulmonary embolism (PE) and lower extremity deep vein thrombosis (LEDVT), but despite increasing recognition of upper extremity deep vein thrombosis (UEDVT),[1, 2, 3, 4] less is known about this condition in hospitalized patients.
UEDVTs may be classified as primary, including disorders such as Paget‐Schroetter syndrome or other structural abnormality, or may be idiopathic; the majority are secondary clots.[5] Conventional risk factors for LEDVT including older age and obesity have been found to be less commonly associated,[1, 2, 5, 6, 7] and patients with UEDVT are generally younger, leaner, and a higher proportion are men. They are more likely to have malignancy or history of VTE and have undergone recent surgery or intensive care unit stay.[1, 2, 6] Central venous catheters (CVCs), often used in hospitalized patients, remain among the biggest known risks for UEDVT[1, 2, 3, 7, 8, 9, 10]; concomitant malignancy, VTE history, severe infection, surgery lasting >1 hour, and length of stay (LOS) >10 days confer additional risks with CVCs.[6, 7, 8, 11]
UEDVTs, once thought to be relatively benign, are now recognized to result in complications including PE, progression, recurrence, and post‐thrombotic syndrome.[2, 4, 12, 13] Despite extensive efforts to increase appropriate VTE prophylaxis in inpatients,[14] the role of chemoprophylaxis to prevent UEDVT remains undefined. Current guidelines recommend anticoagulation for treatment and complication prevention,[13, 15] but to date the evidence derives largely from observational studies or is extrapolated from the LEDVT literature.[2, 13]
To improve understanding of UEDVT at our institution, we set out to (1) determine UEDVT incidence in hospitalized patients, (2) describe associated risks and outcomes, and (3) assess management during hospitalization and at discharge.
METHODS
We identified all consecutive adult patients diagnosed with Doppler ultrasound‐confirmed UEDVT during hospitalization at Harborview Medical Center between September 2011 and November 2012. For patients who were readmitted during the study period, the first of their hospitalizations was used to describe associated factors, management, and outcomes. We present characteristics of all other hospitalizations during this time period for comparison. Harborview is a 413‐bed academic tertiary referral center and the only level 1 trauma center in a 5‐state area. Patients with UEDVT were identified using an information technology (IT) tool (the Harborview VTE tool) (Figure 1), which captures VTE events from vascular laboratory and radiology studies using natural language processing. Doppler ultrasound to assess for deep vein thrombosis (DVT) and computed tomographic scans to diagnose PE were ordered by inpatient physicians for symptomatic patients. The reason for obtaining the study is included in the ultrasound reports. We do not routinely screen for UEDVT at our institution. UEDVT included clots in the deep veins of the upper extremities including internal jugular, subclavian, axillary, and brachial veins. Superficial thrombosis and thrombophlebitis were excluded. We previously compared VTE events captured by this tool with administrative billing data and found that all VTE events that were coded were captured with the tool.

The VTE tool (Figure 1) displays imaging results together with demographic, clinical, and medication data and links this information with admission, discharge, and death summaries as well as CVC insertion procedure notes from the electronic health record (EHR). Additional data, including comorbid conditions, primary reason for hospitalization, past medical history such as prior VTE events, and cause of death (if not available in the admission note or discharge/death summaries), were obtained from EHR abstraction by 1 of the investigators. A 10% random sample of charts was rereviewed by another investigator with complete concordance. Supplementary data about date of CVC insertion if placed at an outside facility, date of CVC removal if applicable, clinical assessments regarding whether a clot was CVC‐associated, and contraindications to therapeutic anticoagulation were also abstracted directly from the EHR. Administrative data were used to identify the case mix index, an indicator of severity of illness.
Pharmacologic VTE prophylaxis included all chemical prophylaxis specified on our institutional guideline, most commonly subcutaneous unfractionated heparin 5000 units every 8 hours or low molecular weight heparin (LMWH), either enoxaparin 40 mg every 12 or 24 hours or dalteparin 5000 units every 24 hours. Mechanical prophylaxis was defined as use of sequential compression devices (SCDs) when pharmacologic prophylaxis was contraindicated. Prophylaxis was considered to be appropriate if it was applied according to our guideline for >90% of hospital days prior to UEDVT diagnosis. Therapeutic anticoagulation included heparin bridging (most commonly continuous heparin infusion, LMWH 1 mg/kg or dalteparin) as well as oral vitamin K antagonists. The VTE tool (Figure 1) allows identification of pharmacologic prophylaxis and therapy that is actually administered (not just ordered) directly from our pharmacy IT system. SCD application (not just ordered SCDs) is electronically integrated into the tool from nursing documentation.
CVCs included internal jugular or subclavian triple lumen catheters, tunneled dialysis catheters, or peripherally inserted central catheters (PICCs), single or double lumen. Criteria used to identify that a UEDVT was CVC‐associated included temporal relationship (CVC was placed prior to clot diagnosis), plausibility (ipsilateral clot), evidence of clot surrounding CVC on ultrasound, and physician designation of association (as documented in progress notes or discharge summary).
Simple percentages of patient characteristics, associated factors, management, and outcomes were calculated using counts as the numerator and number of patients as the denominator. For information about UEDVTs, we used total number of UEDVTs as the denominator. Line days were day counts from insertion until removal if applicable. The CVC placement date was available in our mandated central line placement procedure notes (directly accessed from the VTE tool) for all lines placed at our institution; date of removal (if applicable) was determined from chart abstraction. For the vast majority of patients whose CVCs were placed at outside facilities, date of placement was available in the EHR (often in the admission note or in the ultrasound report/reason for study). If date of line placement at an outside facility was not known, date of admission was used. The University of Washington Human Subjects Board approved this review.
RESULTS
General Characteristics
Fifty inpatients were diagnosed with 76 UEDVTs during 53 hospitalizations. Three patients were admitted twice during the study period. Their first admission is used for the purposes of this review. None of these 3 patients had new UEDVTs diagnosed during their second admission.
The patients' mean age was 49 years (standard deviation [SD] 15.6; range, 2482 years) vs 50.9 years (SD 17.49; range, 18112 years) among all other hospitalizations during this time (Table 1). Seventy percent (35) of patients with UEDVT were men. Sixteen percent (8) of patients with UEDVT had known VTE history, 20% (10) of patients had malignancy, and 22% (11) of patients had stage V chronic kidney disease or were hemodialysis dependent.
| Characteristic | Patients With UEDVT, N=50 | All Hospitalizations, N=23,407a |
|---|---|---|
| ||
| Age, y, mean (range) | 49 (2482) | 51 (18112) |
| Sex, % male (no.) | 70% (35) | 63% (14,746) |
| Case mix index, mean (range) | 4.78 (0.6917.99) | 1.87 (0.1626.34) |
| Length of stay, d, mean (range) | 24.6 (291) | 7.2 (1178) |
| Transfer from outside hospital (no.) | 50% (25) | 25% (5,866) |
| Intensive care unit stay (no.) | 46% (23) | 36% (8,356) |
| Operative procedure (no.) | 46% (23) | 41% (9,706) |
| In‐hospital mortality (no.) | 10% (5) | 4% (842) |
| Discharge to skilled nursing facility or other hospital, n=45 surviving patients (no.) | 62% (28) | 13% (3,095) |
| 30‐day readmission, n=45 surviving patients (no.) | 18% (8) | 5% (1,167) |
Patients diagnosed with UEDVT had complex illness, long LOS, and were often transferred from outside hospitals relative to other hospitalizations during this time period (Table 1). Slightly more required intensive care and underwent surgery. Eighty‐four percent (42) of patients with UEDVT required CVCs during hospitalization. Among patients whose UEDVT was not present on admission, 94% received appropriate VTE prophylaxis prior to UEDVT diagnosis.
In patients with UEDVT, the most common reasons for hospitalization were sepsis/severe infection (43%), cerebral hemorrhage (16%), and trauma (8%). Primary service at diagnosis was medicine 56.9%, surgery 25.5%, and neurosciences 17.6%.
Upper Extremity Deep Vein Thromboses
Fifty patients were diagnosed with 76 UEDVTs during their hospitalizations. In 40% (20) of patients, UEDVTs were present in >1 upper extremity deep vein; concurrent LEDVT was present in 26% (13) and PE in 10% (5). The majority of UEDVTs were found in internal jugular veins, followed by brachial and axillary veins. Seventeen percent were present on admission. Upper extremity swelling was the most common sign/symptom and reason for study. Characteristics of UEDVTs diagnosed are listed in Table 2.
| Characteristic | % UEDVTs (No.), n=76 |
|---|---|
| |
| Anatomic site | |
| Internal jugular | 38% (29) |
| Axillary | 21% (16) |
| Subclavian/axillary | 9% (7) |
| Subclavian | 7% (5) |
| Brachial | 25% (19) |
| Hospital day of diagnosis, d, mean (range) | 9.2 (044) |
| Present on admission | 17% (13) |
| Diagnosed at outside hospital or within 24 hours of transfer | 54% (7) |
| Diagnosed during prior hospitalization at our institution | 15% (2) |
| Diagnosed within 24 hours of admission via our emergency department | 23% (3) |
| Patient‐reported chronic UEDVT | 8% (1) |
| Primary UEDVT/anatomic anomaly | 0% (0) |
| Signs and symptoms (reasons for obtaining study) | |
| Upper extremity swelling | 71% (54) |
| Presence of clot elsewhere (eg, pulmonary embolism) | 9% (7) |
| Inability to place central venous access | 8% (6) |
| Assessment of clot propagation (known clot) | 8% (6) |
| Pain | 3% (2) |
| Patient‐reported history | 1% (1) |
Of the 50 patients diagnosed with UEDVT during hospitalization, 44% (22) were found to have UEDVTs directly associated with a CVC. Forty‐two of the 50 patients had a CVC; 52% (22 of 42) had CVC‐associated UEDVTs. Fifty percent (11) of these CVCs were triple lumen catheters, 32% (7) were PICCs, and 18% (4) were tunneled dialysis lines. Three of 42 patients with CVCs and line‐associated clots were had a malignancy. For patients with CVC‐associated clot, lines were in place for an average of 14.3 days (range, 273 days) prior to UEDVT diagnosis.
Treatment and Management
Seventy‐eight percent (39) of patients with UEDVT received in‐hospital treatment with heparin/LMWH bridging and oral anticoagulation. Of the 45 patients who survived hospitalization, 75% (34) were prescribed anticoagulation for 3+ months at discharge; 23% (10) had documented contraindications to anticoagulation, most commonly recent gastrointestinal or intracranial bleeding. Two percent of patients (1) was not prescribed pharmacologic treatment at discharge and had no contraindications documented. No patients underwent thrombolysis or had superior vena cava filters placed. Sixty‐four percent (14 of 22) of CVCs that were thought to be directly associated with UEDVT were removed at diagnosis.
Outcomes
Five patients (10%) died during hospitalization, none because of VTE or complications thereof. Cause of death included septic shock, cancer, intracranial hemorrhage, heart failure, and recurrent gastrointestinal bleeding. Of the 45 surviving patients, only 38% (17) were discharged to self‐care; more than half (62%[28]) were discharged to skilled nursing facilities, other hospitals, or rehabilitation centers. Eight patients (18%) were readmitted to our institution within 30 days; none for recurrent or new DVT or PE. No additional patients died at our medical center within 30 days of discharge.
DISCUSSION
UEDVT is increasingly recognized in hospitalized patients.[3, 9] At our medical center, 0.2% of symptomatic inpatients were diagnosed with UEDVT over 14 months. These patients were predominantly men with high rates of CVCs, malignancy, VTE history, severe infection, and renal disease. Interestingly, although the literature suggests that some proportion of patients with UEDVT have anatomic abnormalities, such as Paget‐Schroetter syndrome,[15] none of the patients in our study were found to have these anomalies. In our review, hospitalized patients with UEDVT were critically ill, with a long LOS and high morbidity and mortality, suggesting that in addition to just being a complication of hospitalization,[1, 6] UEDVT may be a marker of severe illness.
In our institution, clinical presentation was consistent with what has been described with the majority of patients presenting with upper extremity swelling.[1, 3] The internal jugular veins were the most common anatomic UEDVT site, followed by brachial then axillary veins. In other series including both in‐ and outpatients, subclavian clots were most commonly diagnosed, reflecting in part higher rates of CVC association and CVC location in those studies.[3, 9] Concurrent DVT and PE rates were similar to those reported.[1, 3, 10]
Although many studies have focused on prevention of LEDVT and PE, few trials have specifically targeted UEDVT. Among our patients with UEDVTs that were not present on admission, VTE prophylaxis rates were considerably higher than what has been reported,[1, 6] suggesting that in these critically ill patients' prophylaxis may not prevent symptomatic UEDVT. It is unknown how many UEDVTs were prevented with prophylaxis, as only patients with symptomatic UEDVT were included. Adequacy of prophylaxis at outside hospitals for patients transferred in could not be assessed. Nonetheless, low numbers of UEDVT at a trauma referral center with many high‐risk patients raise the question of whether prophylaxis makes a difference. Additional study is needed to further define the role of chemoprophylaxis to prevent UEDVT in hospitalized patients.
In our inpatient group, 84% required CVCs; 44% of patients were thought to have CVC‐associated UEDVTs. Careful patient selection and attention to potentially modifiable risks, such as insertion site, catheter type, and tip position, may need further examination in this population.[3, 11, 16] Catheter duration was long; focus on removing CVCs when no longer necessary is important. Interestingly, almost 10% in our study underwent diagnostic ultrasound because a new CVC could not be successfully placed suggesting that UEDVT may develop in critically ill patients regardless of CVCs.
In our study, there were high rates of guideline‐recommended pharmacologic treatment; surprisingly the majority of CVCs with associated clot were removed. Guidelines currently support 3 months of anticoagulation for treatment of UEDVT[2, 13, 17]; evidence derives from observational trials or is largely extrapolated from LEDVT literature.[2, 13] Routine CVC removal is not specifically recommended for CVC‐associated UEDVT, particularly if lines remain functional and medically necessary; systemic anticoagulation should be provided.[13]
In our review, no hospitalized patients with UEDVT developed complications or were readmitted to our medical center within 30 days for clot progression, new PE, or post‐thrombotic syndrome, which is lower than rates reported over longer time periods.[2, 6, 10, 12] Ten percent died during hospitalization, all from their primary disease rather than from complications of VTE or VTE treatment, and no additional patients died at our institution within 30 days. Although these rates are lower than have been otherwise reported,[2, 10] the inpatient mortality rate is similar to a recent study that included inpatients; however, all patients who died in that study had cancer and CVCs.[3] In the latter study, 6.4% died within 30 days of discharge.
Limitations
There are several limitations to this study. It was conducted at a single academic referral center with a large and critically ill trauma and neurosciences population, thereby limiting generalizability. This study describes hospitalized patients at a tertiary care center who were diagnosed with UEDVT. For comparison, we obtained information regarding characteristics of hospitalization for all other inpatients during this time frame. Individuals may have had multiple hospitalizations during the study period, but because we were unable to identify information about individuals, direct statistical comparisons could not be made. However, in general, inpatients with UEDVT appeared to be sicker, with prolonged LOS and high in‐hospital mortality relative to other hospitalized patients.
Only symptomatic UEDVT events were captured, likely underestimating true UEDVT incidence. In addition, we defined UEDVTs as those diagnosed by Doppler ultrasound; therefore theoretically, UEDVTs that were more centrally located or diagnosed using another modality would not be represented here. However, in a prior internal review we found that all VTE events coded in billing data during this time period were identified using our operational definition.
In our study, VTE prophylaxis was administered in accordance with an institutional guideline. We did not have information regarding adequacy of prophylaxis at outside institutions for patients transferred in, and patients admitted through the emergency department likely were not on prophylaxis. Therefore, information about prophylaxis is limited to prophylaxis administered at our medical center for hospitalized patients who had UEDVTs not present on admission.
Information regarding CVC insertion date and CVC type for CVCs placed in our institution is accurate based on our internal reviews. Although we had reasonable capture of information about CVC placement at outside facilities, these data may be incomplete, thereby underestimating potential association of CVCs with UEDVTs identified in our hospitalized patients. Additionally, criteria used to assess association of a CVC with UEDVT may have led to underrepresentation of CVC‐associated UEDVT.
Management of UEDVT in this study was determined by the treating physicians, and patients were only followed for 30 days after discharge. Information about readmission or death within 30 days of discharge was limited to patient contact with our medical center only. Treatment at discharge was determined from the discharge summary. Therefore, compliance with treatment cannot be assessed. Although these factors may limit the nature of the conclusions, data reflect actual practice and experience in hospitalized patients with UEDVT and may be hypothesis generating.
CONCLUSIONS
Among hospitalized patients, UEDVT is increasingly recognized. In our medical center, hospitalized patients diagnosed with UEDVT were more likely to have CVCs, malignancy, renal disease, and severe infection. Many of these patients were transferred critically ill, had prolonged LOS, and had high in‐hospital mortality. Most developed UEDVT despite prophylaxis, and the majority of UEDVTs were treated even in the absence of concurrent LEDVT or PE. As we move toward an era of increasing accountability, with a focus on preventing hospital‐acquired conditions including VTE, additional research is needed to identify modifiable risks, explore opportunities for effective prevention, and optimize outcomes such as prevention of complications or readmissions, particularly in critically ill patients with UEDVT.
Acknowledgements
The authors would like to thank Ronald Pergamit and Kevin Middleton for their extraordinary creativity and expert programming.
- , , , . Upper‐extremity deep vein thrombosis: a prospective registry of 592 patients. Circulation. 2004;110(12):1605–1611.
- , , , et al. Clinical outcome of patients with upper‐extremity deep vein thrombosis: results from the RIETE Registry. Chest. 2008;133(1):143–148.
- , , . The risk factors and clinical outcomes of upper extremity deep vein thrombosis. Vasc Endovascular Surg. 2012;46(2):139–144.
- , , , et al. Upper extremity versus lower extremity deep venous thrombosis. Am J Surg. 1997;174(2):214–217.
- , . Upper‐extremity deep vein thrombosis. Circulation. 2002;106(14):1874–1880.
- , , , . Upper extremity deep vein thrombosis: a community‐based perspective. Am J Med. 2007;120(8):678–684.
- , , , et al. Derivation and validation of a simple model to identify venous thromboembolism risk in medical patients. Am J Med. 2011;124(10):947–954.e2.
- , , , , . Risk of venous thromboembolism in hospitalized patients with peripherally inserted central catheters. J Hosp Med. 2009;4(7):417–422.
- , , , , . Characterization and probability of upper extremity deep venous thrombosis. Ann Vasc Surg. 2004;18(5):552–557.
- , , , et al. Risk factors for mortality in patients with upper extremity and internal jugular deep venous thrombosis. J Vasc Surg. 2005;41(3):476–478.
- , , , et al. Risk of symptomatic DVT associated with peripherally inserted central catheters. Chest. 2010;138(4):803–810.
- , , , et al. The long term clinical course of acute deep vein thrombosis of the arm: prospective cohort study. BMJ. 2004;329(7464):484–485.
- , , , et al. Antithrombotic therapy for VTE disease: Antithrombotic Therapy and Prevention of Thrombosis, 9th ed: American College of Chest Physicians Evidence‐Based Clinical Practice Guidelines. Chest. 2012;141(2 suppl):e419S–e494S.
- , , , , , . Introduction to the ninth edition: Antithrombotic Therapy and Prevention of Thrombosis, 9th ed: American College of Chest Physicians Evidence‐Based Clinical Practice Guidelines. Chest. 2012;141(2 suppl):48S–52S.
- . Clinical practice. Deep‐vein thrombosis of the upper extremities. N Engl J Med. 2011;364(9):861–869.
- , , , et al. Diagnosis and management of upper extremity deep‐vein thrombosis in adults. Thromb Haemost. 2012;108(6):1097–1108.
- , , . Treatment of upper‐extremity deep vein thrombosis. J Thromb Haemost. 2011;9(10):1924–1930.
Increasingly, there is a focus on prevention of hospital‐acquired conditions including venous thromboembolism (VTE). Many studies have evaluated pulmonary embolism (PE) and lower extremity deep vein thrombosis (LEDVT), but despite increasing recognition of upper extremity deep vein thrombosis (UEDVT),[1, 2, 3, 4] less is known about this condition in hospitalized patients.
UEDVTs may be classified as primary, including disorders such as Paget‐Schroetter syndrome or other structural abnormality, or may be idiopathic; the majority are secondary clots.[5] Conventional risk factors for LEDVT including older age and obesity have been found to be less commonly associated,[1, 2, 5, 6, 7] and patients with UEDVT are generally younger, leaner, and a higher proportion are men. They are more likely to have malignancy or history of VTE and have undergone recent surgery or intensive care unit stay.[1, 2, 6] Central venous catheters (CVCs), often used in hospitalized patients, remain among the biggest known risks for UEDVT[1, 2, 3, 7, 8, 9, 10]; concomitant malignancy, VTE history, severe infection, surgery lasting >1 hour, and length of stay (LOS) >10 days confer additional risks with CVCs.[6, 7, 8, 11]
UEDVTs, once thought to be relatively benign, are now recognized to result in complications including PE, progression, recurrence, and post‐thrombotic syndrome.[2, 4, 12, 13] Despite extensive efforts to increase appropriate VTE prophylaxis in inpatients,[14] the role of chemoprophylaxis to prevent UEDVT remains undefined. Current guidelines recommend anticoagulation for treatment and complication prevention,[13, 15] but to date the evidence derives largely from observational studies or is extrapolated from the LEDVT literature.[2, 13]
To improve understanding of UEDVT at our institution, we set out to (1) determine UEDVT incidence in hospitalized patients, (2) describe associated risks and outcomes, and (3) assess management during hospitalization and at discharge.
METHODS
We identified all consecutive adult patients diagnosed with Doppler ultrasound‐confirmed UEDVT during hospitalization at Harborview Medical Center between September 2011 and November 2012. For patients who were readmitted during the study period, the first of their hospitalizations was used to describe associated factors, management, and outcomes. We present characteristics of all other hospitalizations during this time period for comparison. Harborview is a 413‐bed academic tertiary referral center and the only level 1 trauma center in a 5‐state area. Patients with UEDVT were identified using an information technology (IT) tool (the Harborview VTE tool) (Figure 1), which captures VTE events from vascular laboratory and radiology studies using natural language processing. Doppler ultrasound to assess for deep vein thrombosis (DVT) and computed tomographic scans to diagnose PE were ordered by inpatient physicians for symptomatic patients. The reason for obtaining the study is included in the ultrasound reports. We do not routinely screen for UEDVT at our institution. UEDVT included clots in the deep veins of the upper extremities including internal jugular, subclavian, axillary, and brachial veins. Superficial thrombosis and thrombophlebitis were excluded. We previously compared VTE events captured by this tool with administrative billing data and found that all VTE events that were coded were captured with the tool.
The VTE tool (Figure 1) displays imaging results together with demographic, clinical, and medication data and links this information with admission, discharge, and death summaries as well as CVC insertion procedure notes from the electronic health record (EHR). Additional data, including comorbid conditions, primary reason for hospitalization, past medical history such as prior VTE events, and cause of death (if not available in the admission note or discharge/death summaries), were obtained from EHR abstraction by 1 of the investigators. A 10% random sample of charts was rereviewed by another investigator with complete concordance. Supplementary data about date of CVC insertion if placed at an outside facility, date of CVC removal if applicable, clinical assessments regarding whether a clot was CVC‐associated, and contraindications to therapeutic anticoagulation were also abstracted directly from the EHR. Administrative data were used to identify the case mix index, an indicator of severity of illness.
Pharmacologic VTE prophylaxis included all chemical prophylaxis specified on our institutional guideline, most commonly subcutaneous unfractionated heparin 5000 units every 8 hours or low molecular weight heparin (LMWH), either enoxaparin 40 mg every 12 or 24 hours or dalteparin 5000 units every 24 hours. Mechanical prophylaxis was defined as use of sequential compression devices (SCDs) when pharmacologic prophylaxis was contraindicated. Prophylaxis was considered to be appropriate if it was applied according to our guideline for >90% of hospital days prior to UEDVT diagnosis. Therapeutic anticoagulation included heparin bridging (most commonly continuous heparin infusion, LMWH 1 mg/kg or dalteparin) as well as oral vitamin K antagonists. The VTE tool (Figure 1) allows identification of pharmacologic prophylaxis and therapy that is actually administered (not just ordered) directly from our pharmacy IT system. SCD application (not just ordered SCDs) is electronically integrated into the tool from nursing documentation.
CVCs included internal jugular or subclavian triple lumen catheters, tunneled dialysis catheters, or peripherally inserted central catheters (PICCs), single or double lumen. Criteria used to identify that a UEDVT was CVC‐associated included temporal relationship (CVC was placed prior to clot diagnosis), plausibility (ipsilateral clot), evidence of clot surrounding CVC on ultrasound, and physician designation of association (as documented in progress notes or discharge summary).
Simple percentages of patient characteristics, associated factors, management, and outcomes were calculated using counts as the numerator and number of patients as the denominator. For information about UEDVTs, we used total number of UEDVTs as the denominator. Line days were day counts from insertion until removal if applicable. The CVC placement date was available in our mandated central line placement procedure notes (directly accessed from the VTE tool) for all lines placed at our institution; date of removal (if applicable) was determined from chart abstraction. For the vast majority of patients whose CVCs were placed at outside facilities, date of placement was available in the EHR (often in the admission note or in the ultrasound report/reason for study). If date of line placement at an outside facility was not known, date of admission was used. The University of Washington Human Subjects Board approved this review.
RESULTS
General Characteristics
Fifty inpatients were diagnosed with 76 UEDVTs during 53 hospitalizations. Three patients were admitted twice during the study period. Their first admission is used for the purposes of this review. None of these 3 patients had new UEDVTs diagnosed during their second admission.
The patients' mean age was 49 years (standard deviation [SD] 15.6; range, 2482 years) vs 50.9 years (SD 17.49; range, 18112 years) among all other hospitalizations during this time (Table 1). Seventy percent (35) of patients with UEDVT were men. Sixteen percent (8) of patients with UEDVT had known VTE history, 20% (10) of patients had malignancy, and 22% (11) of patients had stage V chronic kidney disease or were hemodialysis dependent.
| Characteristic | Patients With UEDVT, N=50 | All Hospitalizations, N=23,407a |
|---|---|---|
| ||
| Age, y, mean (range) | 49 (2482) | 51 (18112) |
| Sex, % male (no.) | 70% (35) | 63% (14,746) |
| Case mix index, mean (range) | 4.78 (0.6917.99) | 1.87 (0.1626.34) |
| Length of stay, d, mean (range) | 24.6 (291) | 7.2 (1178) |
| Transfer from outside hospital (no.) | 50% (25) | 25% (5,866) |
| Intensive care unit stay (no.) | 46% (23) | 36% (8,356) |
| Operative procedure (no.) | 46% (23) | 41% (9,706) |
| In‐hospital mortality (no.) | 10% (5) | 4% (842) |
| Discharge to skilled nursing facility or other hospital, n=45 surviving patients (no.) | 62% (28) | 13% (3,095) |
| 30‐day readmission, n=45 surviving patients (no.) | 18% (8) | 5% (1,167) |
Patients diagnosed with UEDVT had complex illness, long LOS, and were often transferred from outside hospitals relative to other hospitalizations during this time period (Table 1). Slightly more required intensive care and underwent surgery. Eighty‐four percent (42) of patients with UEDVT required CVCs during hospitalization. Among patients whose UEDVT was not present on admission, 94% received appropriate VTE prophylaxis prior to UEDVT diagnosis.
In patients with UEDVT, the most common reasons for hospitalization were sepsis/severe infection (43%), cerebral hemorrhage (16%), and trauma (8%). Primary service at diagnosis was medicine 56.9%, surgery 25.5%, and neurosciences 17.6%.
Upper Extremity Deep Vein Thromboses
Fifty patients were diagnosed with 76 UEDVTs during their hospitalizations. In 40% (20) of patients, UEDVTs were present in >1 upper extremity deep vein; concurrent LEDVT was present in 26% (13) and PE in 10% (5). The majority of UEDVTs were found in internal jugular veins, followed by brachial and axillary veins. Seventeen percent were present on admission. Upper extremity swelling was the most common sign/symptom and reason for study. Characteristics of UEDVTs diagnosed are listed in Table 2.
| Characteristic | % UEDVTs (No.), n=76 |
|---|---|
| |
| Anatomic site | |
| Internal jugular | 38% (29) |
| Axillary | 21% (16) |
| Subclavian/axillary | 9% (7) |
| Subclavian | 7% (5) |
| Brachial | 25% (19) |
| Hospital day of diagnosis, d, mean (range) | 9.2 (044) |
| Present on admission | 17% (13) |
| Diagnosed at outside hospital or within 24 hours of transfer | 54% (7) |
| Diagnosed during prior hospitalization at our institution | 15% (2) |
| Diagnosed within 24 hours of admission via our emergency department | 23% (3) |
| Patient‐reported chronic UEDVT | 8% (1) |
| Primary UEDVT/anatomic anomaly | 0% (0) |
| Signs and symptoms (reasons for obtaining study) | |
| Upper extremity swelling | 71% (54) |
| Presence of clot elsewhere (eg, pulmonary embolism) | 9% (7) |
| Inability to place central venous access | 8% (6) |
| Assessment of clot propagation (known clot) | 8% (6) |
| Pain | 3% (2) |
| Patient‐reported history | 1% (1) |
Of the 50 patients diagnosed with UEDVT during hospitalization, 44% (22) were found to have UEDVTs directly associated with a CVC. Forty‐two of the 50 patients had a CVC; 52% (22 of 42) had CVC‐associated UEDVTs. Fifty percent (11) of these CVCs were triple lumen catheters, 32% (7) were PICCs, and 18% (4) were tunneled dialysis lines. Three of 42 patients with CVCs and line‐associated clots were had a malignancy. For patients with CVC‐associated clot, lines were in place for an average of 14.3 days (range, 273 days) prior to UEDVT diagnosis.
Treatment and Management
Seventy‐eight percent (39) of patients with UEDVT received in‐hospital treatment with heparin/LMWH bridging and oral anticoagulation. Of the 45 patients who survived hospitalization, 75% (34) were prescribed anticoagulation for 3+ months at discharge; 23% (10) had documented contraindications to anticoagulation, most commonly recent gastrointestinal or intracranial bleeding. Two percent of patients (1) was not prescribed pharmacologic treatment at discharge and had no contraindications documented. No patients underwent thrombolysis or had superior vena cava filters placed. Sixty‐four percent (14 of 22) of CVCs that were thought to be directly associated with UEDVT were removed at diagnosis.
Outcomes
Five patients (10%) died during hospitalization, none because of VTE or complications thereof. Cause of death included septic shock, cancer, intracranial hemorrhage, heart failure, and recurrent gastrointestinal bleeding. Of the 45 surviving patients, only 38% (17) were discharged to self‐care; more than half (62%[28]) were discharged to skilled nursing facilities, other hospitals, or rehabilitation centers. Eight patients (18%) were readmitted to our institution within 30 days; none for recurrent or new DVT or PE. No additional patients died at our medical center within 30 days of discharge.
DISCUSSION
UEDVT is increasingly recognized in hospitalized patients.[3, 9] At our medical center, 0.2% of symptomatic inpatients were diagnosed with UEDVT over 14 months. These patients were predominantly men with high rates of CVCs, malignancy, VTE history, severe infection, and renal disease. Interestingly, although the literature suggests that some proportion of patients with UEDVT have anatomic abnormalities, such as Paget‐Schroetter syndrome,[15] none of the patients in our study were found to have these anomalies. In our review, hospitalized patients with UEDVT were critically ill, with a long LOS and high morbidity and mortality, suggesting that in addition to just being a complication of hospitalization,[1, 6] UEDVT may be a marker of severe illness.
In our institution, clinical presentation was consistent with what has been described with the majority of patients presenting with upper extremity swelling.[1, 3] The internal jugular veins were the most common anatomic UEDVT site, followed by brachial then axillary veins. In other series including both in‐ and outpatients, subclavian clots were most commonly diagnosed, reflecting in part higher rates of CVC association and CVC location in those studies.[3, 9] Concurrent DVT and PE rates were similar to those reported.[1, 3, 10]
Although many studies have focused on prevention of LEDVT and PE, few trials have specifically targeted UEDVT. Among our patients with UEDVTs that were not present on admission, VTE prophylaxis rates were considerably higher than what has been reported,[1, 6] suggesting that in these critically ill patients' prophylaxis may not prevent symptomatic UEDVT. It is unknown how many UEDVTs were prevented with prophylaxis, as only patients with symptomatic UEDVT were included. Adequacy of prophylaxis at outside hospitals for patients transferred in could not be assessed. Nonetheless, low numbers of UEDVT at a trauma referral center with many high‐risk patients raise the question of whether prophylaxis makes a difference. Additional study is needed to further define the role of chemoprophylaxis to prevent UEDVT in hospitalized patients.
In our inpatient group, 84% required CVCs; 44% of patients were thought to have CVC‐associated UEDVTs. Careful patient selection and attention to potentially modifiable risks, such as insertion site, catheter type, and tip position, may need further examination in this population.[3, 11, 16] Catheter duration was long; focus on removing CVCs when no longer necessary is important. Interestingly, almost 10% in our study underwent diagnostic ultrasound because a new CVC could not be successfully placed suggesting that UEDVT may develop in critically ill patients regardless of CVCs.
In our study, there were high rates of guideline‐recommended pharmacologic treatment; surprisingly the majority of CVCs with associated clot were removed. Guidelines currently support 3 months of anticoagulation for treatment of UEDVT[2, 13, 17]; evidence derives from observational trials or is largely extrapolated from LEDVT literature.[2, 13] Routine CVC removal is not specifically recommended for CVC‐associated UEDVT, particularly if lines remain functional and medically necessary; systemic anticoagulation should be provided.[13]
In our review, no hospitalized patients with UEDVT developed complications or were readmitted to our medical center within 30 days for clot progression, new PE, or post‐thrombotic syndrome, which is lower than rates reported over longer time periods.[2, 6, 10, 12] Ten percent died during hospitalization, all from their primary disease rather than from complications of VTE or VTE treatment, and no additional patients died at our institution within 30 days. Although these rates are lower than have been otherwise reported,[2, 10] the inpatient mortality rate is similar to a recent study that included inpatients; however, all patients who died in that study had cancer and CVCs.[3] In the latter study, 6.4% died within 30 days of discharge.
Limitations
There are several limitations to this study. It was conducted at a single academic referral center with a large and critically ill trauma and neurosciences population, thereby limiting generalizability. This study describes hospitalized patients at a tertiary care center who were diagnosed with UEDVT. For comparison, we obtained information regarding characteristics of hospitalization for all other inpatients during this time frame. Individuals may have had multiple hospitalizations during the study period, but because we were unable to identify information about individuals, direct statistical comparisons could not be made. However, in general, inpatients with UEDVT appeared to be sicker, with prolonged LOS and high in‐hospital mortality relative to other hospitalized patients.
Only symptomatic UEDVT events were captured, likely underestimating true UEDVT incidence. In addition, we defined UEDVTs as those diagnosed by Doppler ultrasound; therefore theoretically, UEDVTs that were more centrally located or diagnosed using another modality would not be represented here. However, in a prior internal review we found that all VTE events coded in billing data during this time period were identified using our operational definition.
In our study, VTE prophylaxis was administered in accordance with an institutional guideline. We did not have information regarding adequacy of prophylaxis at outside institutions for patients transferred in, and patients admitted through the emergency department likely were not on prophylaxis. Therefore, information about prophylaxis is limited to prophylaxis administered at our medical center for hospitalized patients who had UEDVTs not present on admission.
Information regarding CVC insertion date and CVC type for CVCs placed in our institution is accurate based on our internal reviews. Although we had reasonable capture of information about CVC placement at outside facilities, these data may be incomplete, thereby underestimating potential association of CVCs with UEDVTs identified in our hospitalized patients. Additionally, criteria used to assess association of a CVC with UEDVT may have led to underrepresentation of CVC‐associated UEDVT.
Management of UEDVT in this study was determined by the treating physicians, and patients were only followed for 30 days after discharge. Information about readmission or death within 30 days of discharge was limited to patient contact with our medical center only. Treatment at discharge was determined from the discharge summary. Therefore, compliance with treatment cannot be assessed. Although these factors may limit the nature of the conclusions, data reflect actual practice and experience in hospitalized patients with UEDVT and may be hypothesis generating.
CONCLUSIONS
Among hospitalized patients, UEDVT is increasingly recognized. In our medical center, hospitalized patients diagnosed with UEDVT were more likely to have CVCs, malignancy, renal disease, and severe infection. Many of these patients were transferred critically ill, had prolonged LOS, and had high in‐hospital mortality. Most developed UEDVT despite prophylaxis, and the majority of UEDVTs were treated even in the absence of concurrent LEDVT or PE. As we move toward an era of increasing accountability, with a focus on preventing hospital‐acquired conditions including VTE, additional research is needed to identify modifiable risks, explore opportunities for effective prevention, and optimize outcomes such as prevention of complications or readmissions, particularly in critically ill patients with UEDVT.
Acknowledgements
The authors would like to thank Ronald Pergamit and Kevin Middleton for their extraordinary creativity and expert programming.
- , , , . Upper‐extremity deep vein thrombosis: a prospective registry of 592 patients. Circulation. 2004;110(12):1605–1611.
- , , , et al. Clinical outcome of patients with upper‐extremity deep vein thrombosis: results from the RIETE Registry. Chest. 2008;133(1):143–148.
- , , . The risk factors and clinical outcomes of upper extremity deep vein thrombosis. Vasc Endovascular Surg. 2012;46(2):139–144.
- , , , et al. Upper extremity versus lower extremity deep venous thrombosis. Am J Surg. 1997;174(2):214–217.
- , . Upper‐extremity deep vein thrombosis. Circulation. 2002;106(14):1874–1880.
- , , , . Upper extremity deep vein thrombosis: a community‐based perspective. Am J Med. 2007;120(8):678–684.
- , , , et al. Derivation and validation of a simple model to identify venous thromboembolism risk in medical patients. Am J Med. 2011;124(10):947–954.e2.
- , , , , . Risk of venous thromboembolism in hospitalized patients with peripherally inserted central catheters. J Hosp Med. 2009;4(7):417–422.
- , , , , . Characterization and probability of upper extremity deep venous thrombosis. Ann Vasc Surg. 2004;18(5):552–557.
- , , , et al. Risk factors for mortality in patients with upper extremity and internal jugular deep venous thrombosis. J Vasc Surg. 2005;41(3):476–478.
- , , , et al. Risk of symptomatic DVT associated with peripherally inserted central catheters. Chest. 2010;138(4):803–810.
- , , , et al. The long term clinical course of acute deep vein thrombosis of the arm: prospective cohort study. BMJ. 2004;329(7464):484–485.
- , , , et al. Antithrombotic therapy for VTE disease: Antithrombotic Therapy and Prevention of Thrombosis, 9th ed: American College of Chest Physicians Evidence‐Based Clinical Practice Guidelines. Chest. 2012;141(2 suppl):e419S–e494S.
- , , , , , . Introduction to the ninth edition: Antithrombotic Therapy and Prevention of Thrombosis, 9th ed: American College of Chest Physicians Evidence‐Based Clinical Practice Guidelines. Chest. 2012;141(2 suppl):48S–52S.
- . Clinical practice. Deep‐vein thrombosis of the upper extremities. N Engl J Med. 2011;364(9):861–869.
- , , , et al. Diagnosis and management of upper extremity deep‐vein thrombosis in adults. Thromb Haemost. 2012;108(6):1097–1108.
- , , . Treatment of upper‐extremity deep vein thrombosis. J Thromb Haemost. 2011;9(10):1924–1930.
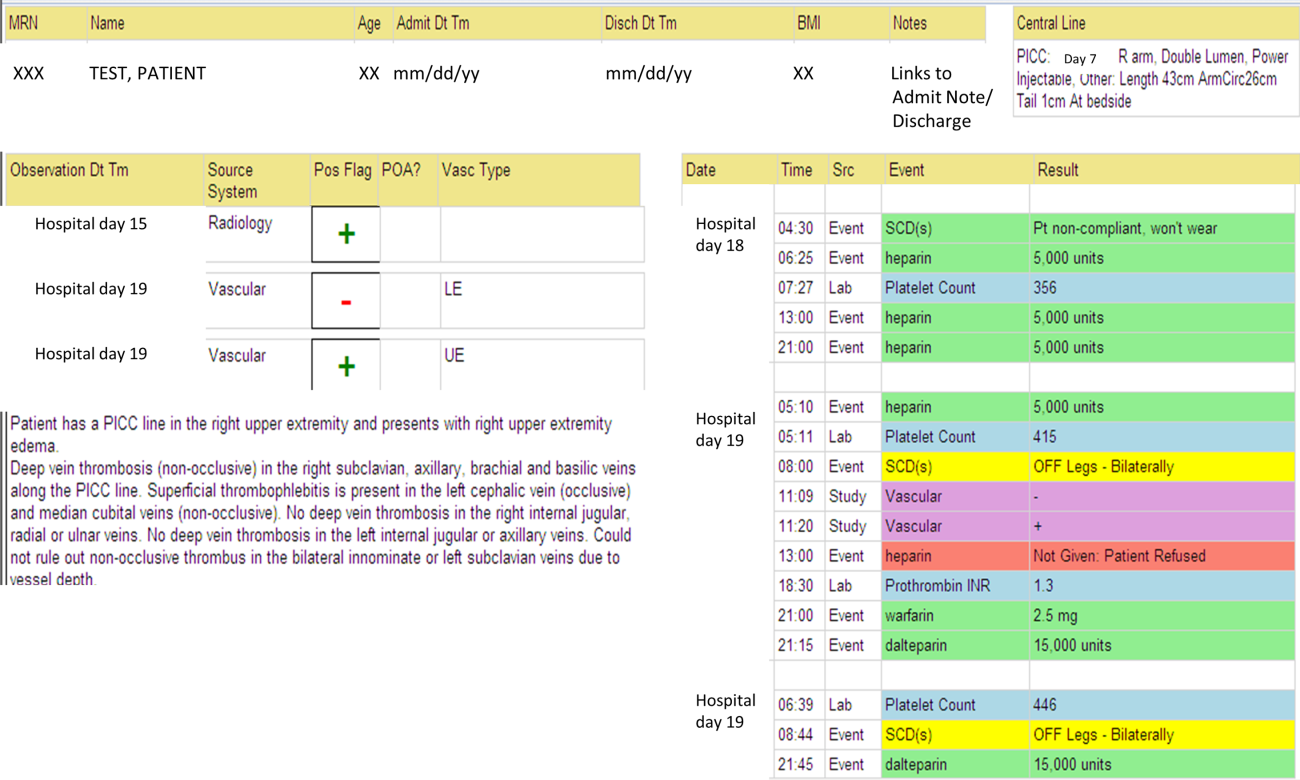
Face Sheet and Provider Identification
Acute illness requiring hospitalization can be overwhelming for children and their families who are coping with illness and the synthesis of information from a variety of healthcare providers.[1] Patient and family centeredness is endorsed by the Institute of Medicine and the American Academy of Pediatrics[2, 3] as central to quality healthcare. In academic institutions, the presence of medical students and residents adds to the number of providers families encounter. In July 2011, the Accreditation Council for Graduate Medical Education implemented new duty hour restrictions, limiting first year residents to a maximum of 16 hour shifts.[4] Consequently, caregivers and patients may be in contact with more healthcare providers; this fractured care may confuse patients and caregivers, and increase dissatisfaction with care.[5]
The primary objective of our study was to determine the effect of a face sheet tool on the percentage of medical team members correctly identified by caregivers. The secondary objective was to determine the effect of a face sheet tool on the evaluation and satisfaction rating of the medical team by caregivers. We hypothesized that caregivers who receive the face sheet tool will correctly identify a greater percentage of team members by name and role and have higher overall satisfaction with their hospital stay.
METHODS
We performed a prospective controlled study on 2 general pediatric units at Cincinnati Children's Hospital Medical Center (CCHMC). Patients on the intervention unit received the face sheet tool, whereas the concurrent control unit maintained usual procedures. Both units have 24 beds and care for general pediatric patients primarily covered by 4 resident teams and the hospital medicine faculty. Two paired resident teams composed of 2 senior residents, 3 to 4 interns, and 4 medical students primarily admit to each general pediatric unit. Team members rotate through day and night shifts. All employees and rotating students are required to wear the hospital issued identification badge that includes their names, photos, credentials, and role. The study was conducted from November 1, 2011 to November 30, 2011.
Included patients were admitted to the study units by the usual protocol at our hospital, in which nurse patient‐flow coordinators determine bed assignments. We excluded families whose children had an inpatient hospital stay of 12 hours and families who did not speak English. All patient families scheduled to be discharged later in the day on weekday mornings from the 2 study units were approached for study participation. Families were not compensated for their participation.
A face sheet tool, which is a sheet of paper with pictures and names of the intervention team attendings, senior residents, interns, and medical students as well as a description of team member roles, was distributed to patients and their caregivers. The face sheet tools were created using Microsoft Publisher (Microsoft Corp., Redmond, WA). Neither families nor providers were blinded to the intervention, and the residents assumed responsibility for introducing the face sheet tool to families.
For our primary outcome measure, the research coordinator asked participating caregivers to match provider photographs with names and roles by placing laminated pictures backed with Velcro tape in the appropriate position on a laminated poster sheet. Initially, we collected overall accuracy of identification by name and role. In the second week, we began collecting specific data on the attending physician.
The satisfaction survey consisted of the American Board of Internal Medicine (ABIM) patient satisfaction questionnaire, composed of 10, 5‐point Likert scale questions,[6, 7] and an overall rating of hospital question, On a scale from 1 to 10, with 1 being the worst possible hospital and 10 being the best possible hospital, what number would you rate this hospital? from the Hospital Consumer Assessment of Health Plans Survey.[8] Questions were asked aloud and families responded to the questions orally. A written list was also provided to families. We collected data on length of stay (LOS) at the time of outcome assessment as well as previous hospitalizations.
Data Analysis
Differences between the intervention and control groups for relationship of survey respondent to child, prior hospitalization, and LOS were evaluated using the Fisher exact, 2, and 2‐sample t test, respectively. Hospital LOS was log‐transformed prior to analysis. The effect of the face sheet tool was evaluated by analyzing the differences between the intervention and control groups in the proportion of correctly identified names and roles using the Wilcoxon rank sum test and using the Fisher exact test for attending identification. Skewed Likert scale satisfaction ratings and overall hospital ratings were dichotomized at the highest score possible and analyzed using the 2 test. An analysis adjusting for prior hospitalization and LOS was done using generalized linear models, with a Poisson link for the number of correctly identified names/roles and an offset for the number of names/roles given.
Our research was reviewed by the CCHMC institutional review board and deemed exempt.
RESULTS
A total of 96 families were approached for enrollment (50 in the intervention and 46 in the control). Of these, 86 families agreed to participate. Three families in the intervention group did not receive the face sheet tool and were excluded from analysis, leaving an analytic cohort of 83 (41 in intervention and 42 in control). Attending recognition by role was collected from 54 families (28 in intervention group and 26 in control group) and by name from 34 families (15 in intervention group and 19 in control group). Table 1 displays characteristics of each group. Among the 83 study participants, LOS at time of outcome assessment ranged from 0.4 to 12.0 days, and the number of medical team members that cared for these patients ranged from 3 to 14.
| Intervention, n=41 | Control, n=42 | P Valuea | |
|---|---|---|---|
| |||
| Relationship to patient | 0.67 | ||
| Mother | 33 (80%) | 35 (83%) | |
| Father | 5 (12%) | 6 (14%) | |
| Grandmother/legal guardian | 3 (7%) | 1 (2%) | |
| Prior hospitalization, yes | 12 (29%) | 24 (57%) | 0.01 |
| Length of stay (days) | 1.07 (0.861.34) | 1.32 (1.051.67) | 0.20 |
Families in the intervention group had a higher percentage of correctly identified members of the medical team by name and role as compared to the control group (Table 2). These findings remained significant after adjusting for LOS and prior hospitalization. In addition, in a subset of families with attending data available, more families accurately identified attending name and attending role in the intervention as compared to control group.
| Intervention | Control | P Valuea | |
|---|---|---|---|
| |||
| Medical team, proportion correctly identified: | N=41 | N=41 | |
| Medical team names | 25% (14, 58) | 11% (0, 25) | 0.01b |
| Medical team roles | 50% (37, 67) | 25% (12, 44) | 0.01b |
| Attending, correctly identified: | |||
| Attending's name | N=15 | N=19 | |
| 14 (93%), | 10 (53%), | 0.02c | |
| Attending's role | N=28 | N=26 | |
| 26 (93%) | 16 (62%) | 0.01 | |
| Patient satisfaction, best possible score for: | N=41 | N=42 | |
| Q1: Telling you everything, being truthful | 21 (51%) | 21 (50%) | 0.91 |
| Q2: Greeting you warmly, being friendly | 26 (63%) | 25 (60%) | 0.72 |
| Q3: Treating you like you're on the same level | 29 (71%) | 25 (60%) | 0.28 |
| Q4: Letting you tell your story, listening | 27 (66%) | 23 (55%) | 0.30 |
| Q5: Showing interest in you as a person | 26 (63%) | 23 (55%) | 0.42 |
| Q6: Warning your child during the physical exam | 21 (51%) | 21 (50%) | 0.91 |
| Q7: Discussing options, asking your opinion | 20 (49%) | 17 (40%) | 0.45 |
| Q8: Encouraging questions, answering clearly | 23 (56%) | 19 (45%) | 0.32 |
| Q9: Explaining what you need to know | 22 (54%) | 18 (43%) | 0.32 |
| Q10: Using words you can understand | 26 (63%) | 18 (43%) | 0.06 |
| Overall hospital rating | 27 (66%) | 26 (62%) | 0.71 |
No significant differences were noted between the groups when comparing all individual ABIM survey question scores or the overall hospital satisfaction rating (Table 2). Scores in both intervention and control groups were high in all categories.
DISCUSSION
Caregivers given the face sheet tool were better able to identify medical team members by name and role than caregivers in the control group. Previous studies have shown similar results.[9, 10] Families encountered a large number of providers (median of 8) during stays that were on average quite brief (median LOS of 23.6 hours). Despite the significant increase in caregivers' ability to identify providers, the effect was modest.
Our findings add to prior work on face sheet tools in pediatrics and internal medicine.[9, 10, 11] Our study occurred after the residency duty hour restrictions. We described the high number of providers that families encounter in this context. It is the first study to our knowledge to quantify the number of providers that families encounter after these changes and to report on how well families can identify these clinicians by name and role. Unlike other studies, satisfaction scores were not improved.[9] Potential reasons for this include: (1) caregiver knowledge of 2 to 4 key members of the team and not the whole team may be the primary driver of satisfaction, (2) caregiver activation or empowerment may be a more responsive measure than overall satisfaction, and (3) our satisfaction measures may have ceiling effects and/or be elevated in both groups by social desirability bias.
Our study highlights the need for further investigation of quality outcomes associated with residency work hour changes.[12, 13, 14] Specifically, exposure to large numbers of providers may hinder families from accurately identifying those entrusted with the care of their loved one. Of note, our research coordinator needed to present as many as 14 provider pictures to 1 family with a hospital stay of 24 hours. Large numbers of providers may create challenges in building rapport, ensuring effective communication and developing trust with families. We chose to evaluate identification of each team member by caregivers; our findings are suggestive of the need for alternative strategies. A more valuable intervention might target identification of key team members (eg, attending, primary intern, primary senior resident). A policy statement regarding transitions of care recommended the establishment of mechanisms to ensure patients and their families know who is responsible for their care.[15] Efforts toward achieving this goal are essential.
This study has several limitations. The study was completed at a single institution, and thus generalizability may be limited. Although the intervention and control units have similar characteristics, randomization did not occur at the patient level. The control group had significantly more patients who had greater than 1 admission compared to the intervention group. Patients enrolled in the study were from a weekday convenience sample; therefore, potential differences in results based on weekend admissions were unable to be assessed. The exclusion of nonEnglish‐speaking families could limit generalizability to this population. Social desirability bias may have elevated the scores in both groups. Providers tasked with the responsibility of introducing the face sheet tool to families did so in a nonstandardized way and may have interacted differently with families compared to the control team. Finally, our project's aim was focused on the effect of a face sheet tool on the identification and satisfaction rating of the medical team by caregivers. Truly family‐centered care would include efforts to improve families' knowledge of and satisfaction with all members of the healthcare team.
A photo‐based face sheet tool helped caregivers better identify their child's care providers by name and role in the hospital. Satisfaction scores were similar in both groups.
Acknowledgements
The authors thank the Pediatric Research in Inpatient Settings network, and specifically Drs. Karen Wilson and Samir Shah, for their assistance during a workshop at the Pediatric Hospital Medicine 2012 meeting in July 2012, during which a first draft of this manuscript was produced.
Disclosure: Nothing to report.
- , , , , . A child's admission to hospital: a qualitative study examining the experiences of parents. Intensive Care Med. 2005;31(9):1248–1254.
- Committee on Quality of Health Care in America. Institute of Medicine. Crossing the Quality Chasm: A New Health System for the 21st Century. Washington, DC: National Academy Press; 2001.
- Committee on Hospital Care and Institute for Patient‐ and Family‐Centered Care. Patient‐ and family‐centered care and the pediatrician's role. Pediatrics. 2012;129(2):394–404.
- , , . The new recommendations on duty hours from the ACGME Task Force. N Engl J Med. 2010;363(2):e3.
- , , , . Parental responses to involvement in rounds on a pediatric inpatient unit at a teaching hospital: a qualitative study. Acad Med. 2008;83(3):292–297.
- PSQ Project Co‐Investigators. Final Report on the Patient Satisfaction Questionnaire Project. Philadelphia, PA: American Board of Internal Medicine; 1989.
- , , , et al. Effect of multisource feedback on resident communication skills and professionalism: a randomized controlled trial. Arch Pediatr Adolesc Med. 2007;161(1):44–49.
- , , , , . Development, implementation, and public reporting of the HCAHPS survey. Med Care Res Rev. 2010;67(1):27–37.
- , , , . PHACES (Photographs of Academic Clinicians and Their Educational Status): a tool to improve delivery of family‐centered care. Acad Pediatr. 2010;10(2):138–145.
- , , , et al. Improving inpatients' identification of their doctors: use of FACE cards. Jt Comm J Qual Patient Saf. 2009;35(12):613–619.
- , . “Don't call me ‘mom’: how parents want to be greeted by their pediatrician. Clin Pediatr. 2009;48(7):720–722.
- , , , , , . Better rested, but more stressed? Evidence of the effects of resident work hour restrictions. Acad Pediatr. 2012;12(4):335–343.
- , , , et al. Pediatric residents' perspectives on reducing work hours and lengthening residency: a national survey. Pediatrics. 2012;130(1):99–107.
- , , , . Inpatient staffing within pediatric residency programs: work hour restrictions and the evolving role of the pediatric hospitalist. J Hosp Med. 2012;7(4):299–303.
- , , , et al. Transitions of Care Consensus policy statement: American College of Physicians, Society of General Internal Medicine, Society of Hospital Medicine, American Geriatrics Society, American College of Emergency Physicians, and Society for Academic Emergency Medicine. J Hosp Med. 2009;4(6):364–370.
Acute illness requiring hospitalization can be overwhelming for children and their families who are coping with illness and the synthesis of information from a variety of healthcare providers.[1] Patient and family centeredness is endorsed by the Institute of Medicine and the American Academy of Pediatrics[2, 3] as central to quality healthcare. In academic institutions, the presence of medical students and residents adds to the number of providers families encounter. In July 2011, the Accreditation Council for Graduate Medical Education implemented new duty hour restrictions, limiting first year residents to a maximum of 16 hour shifts.[4] Consequently, caregivers and patients may be in contact with more healthcare providers; this fractured care may confuse patients and caregivers, and increase dissatisfaction with care.[5]
The primary objective of our study was to determine the effect of a face sheet tool on the percentage of medical team members correctly identified by caregivers. The secondary objective was to determine the effect of a face sheet tool on the evaluation and satisfaction rating of the medical team by caregivers. We hypothesized that caregivers who receive the face sheet tool will correctly identify a greater percentage of team members by name and role and have higher overall satisfaction with their hospital stay.
METHODS
We performed a prospective controlled study on 2 general pediatric units at Cincinnati Children's Hospital Medical Center (CCHMC). Patients on the intervention unit received the face sheet tool, whereas the concurrent control unit maintained usual procedures. Both units have 24 beds and care for general pediatric patients primarily covered by 4 resident teams and the hospital medicine faculty. Two paired resident teams composed of 2 senior residents, 3 to 4 interns, and 4 medical students primarily admit to each general pediatric unit. Team members rotate through day and night shifts. All employees and rotating students are required to wear the hospital issued identification badge that includes their names, photos, credentials, and role. The study was conducted from November 1, 2011 to November 30, 2011.
Included patients were admitted to the study units by the usual protocol at our hospital, in which nurse patient‐flow coordinators determine bed assignments. We excluded families whose children had an inpatient hospital stay of 12 hours and families who did not speak English. All patient families scheduled to be discharged later in the day on weekday mornings from the 2 study units were approached for study participation. Families were not compensated for their participation.
A face sheet tool, which is a sheet of paper with pictures and names of the intervention team attendings, senior residents, interns, and medical students as well as a description of team member roles, was distributed to patients and their caregivers. The face sheet tools were created using Microsoft Publisher (Microsoft Corp., Redmond, WA). Neither families nor providers were blinded to the intervention, and the residents assumed responsibility for introducing the face sheet tool to families.
For our primary outcome measure, the research coordinator asked participating caregivers to match provider photographs with names and roles by placing laminated pictures backed with Velcro tape in the appropriate position on a laminated poster sheet. Initially, we collected overall accuracy of identification by name and role. In the second week, we began collecting specific data on the attending physician.
The satisfaction survey consisted of the American Board of Internal Medicine (ABIM) patient satisfaction questionnaire, composed of 10, 5‐point Likert scale questions,[6, 7] and an overall rating of hospital question, On a scale from 1 to 10, with 1 being the worst possible hospital and 10 being the best possible hospital, what number would you rate this hospital? from the Hospital Consumer Assessment of Health Plans Survey.[8] Questions were asked aloud and families responded to the questions orally. A written list was also provided to families. We collected data on length of stay (LOS) at the time of outcome assessment as well as previous hospitalizations.
Data Analysis
Differences between the intervention and control groups for relationship of survey respondent to child, prior hospitalization, and LOS were evaluated using the Fisher exact, 2, and 2‐sample t test, respectively. Hospital LOS was log‐transformed prior to analysis. The effect of the face sheet tool was evaluated by analyzing the differences between the intervention and control groups in the proportion of correctly identified names and roles using the Wilcoxon rank sum test and using the Fisher exact test for attending identification. Skewed Likert scale satisfaction ratings and overall hospital ratings were dichotomized at the highest score possible and analyzed using the 2 test. An analysis adjusting for prior hospitalization and LOS was done using generalized linear models, with a Poisson link for the number of correctly identified names/roles and an offset for the number of names/roles given.
Our research was reviewed by the CCHMC institutional review board and deemed exempt.
RESULTS
A total of 96 families were approached for enrollment (50 in the intervention and 46 in the control). Of these, 86 families agreed to participate. Three families in the intervention group did not receive the face sheet tool and were excluded from analysis, leaving an analytic cohort of 83 (41 in intervention and 42 in control). Attending recognition by role was collected from 54 families (28 in intervention group and 26 in control group) and by name from 34 families (15 in intervention group and 19 in control group). Table 1 displays characteristics of each group. Among the 83 study participants, LOS at time of outcome assessment ranged from 0.4 to 12.0 days, and the number of medical team members that cared for these patients ranged from 3 to 14.
| Intervention, n=41 | Control, n=42 | P Valuea | |
|---|---|---|---|
| |||
| Relationship to patient | 0.67 | ||
| Mother | 33 (80%) | 35 (83%) | |
| Father | 5 (12%) | 6 (14%) | |
| Grandmother/legal guardian | 3 (7%) | 1 (2%) | |
| Prior hospitalization, yes | 12 (29%) | 24 (57%) | 0.01 |
| Length of stay (days) | 1.07 (0.861.34) | 1.32 (1.051.67) | 0.20 |
Families in the intervention group had a higher percentage of correctly identified members of the medical team by name and role as compared to the control group (Table 2). These findings remained significant after adjusting for LOS and prior hospitalization. In addition, in a subset of families with attending data available, more families accurately identified attending name and attending role in the intervention as compared to control group.
| Intervention | Control | P Valuea | |
|---|---|---|---|
| |||
| Medical team, proportion correctly identified: | N=41 | N=41 | |
| Medical team names | 25% (14, 58) | 11% (0, 25) | 0.01b |
| Medical team roles | 50% (37, 67) | 25% (12, 44) | 0.01b |
| Attending, correctly identified: | |||
| Attending's name | N=15 | N=19 | |
| 14 (93%), | 10 (53%), | 0.02c | |
| Attending's role | N=28 | N=26 | |
| 26 (93%) | 16 (62%) | 0.01 | |
| Patient satisfaction, best possible score for: | N=41 | N=42 | |
| Q1: Telling you everything, being truthful | 21 (51%) | 21 (50%) | 0.91 |
| Q2: Greeting you warmly, being friendly | 26 (63%) | 25 (60%) | 0.72 |
| Q3: Treating you like you're on the same level | 29 (71%) | 25 (60%) | 0.28 |
| Q4: Letting you tell your story, listening | 27 (66%) | 23 (55%) | 0.30 |
| Q5: Showing interest in you as a person | 26 (63%) | 23 (55%) | 0.42 |
| Q6: Warning your child during the physical exam | 21 (51%) | 21 (50%) | 0.91 |
| Q7: Discussing options, asking your opinion | 20 (49%) | 17 (40%) | 0.45 |
| Q8: Encouraging questions, answering clearly | 23 (56%) | 19 (45%) | 0.32 |
| Q9: Explaining what you need to know | 22 (54%) | 18 (43%) | 0.32 |
| Q10: Using words you can understand | 26 (63%) | 18 (43%) | 0.06 |
| Overall hospital rating | 27 (66%) | 26 (62%) | 0.71 |
No significant differences were noted between the groups when comparing all individual ABIM survey question scores or the overall hospital satisfaction rating (Table 2). Scores in both intervention and control groups were high in all categories.
DISCUSSION
Caregivers given the face sheet tool were better able to identify medical team members by name and role than caregivers in the control group. Previous studies have shown similar results.[9, 10] Families encountered a large number of providers (median of 8) during stays that were on average quite brief (median LOS of 23.6 hours). Despite the significant increase in caregivers' ability to identify providers, the effect was modest.
Our findings add to prior work on face sheet tools in pediatrics and internal medicine.[9, 10, 11] Our study occurred after the residency duty hour restrictions. We described the high number of providers that families encounter in this context. It is the first study to our knowledge to quantify the number of providers that families encounter after these changes and to report on how well families can identify these clinicians by name and role. Unlike other studies, satisfaction scores were not improved.[9] Potential reasons for this include: (1) caregiver knowledge of 2 to 4 key members of the team and not the whole team may be the primary driver of satisfaction, (2) caregiver activation or empowerment may be a more responsive measure than overall satisfaction, and (3) our satisfaction measures may have ceiling effects and/or be elevated in both groups by social desirability bias.
Our study highlights the need for further investigation of quality outcomes associated with residency work hour changes.[12, 13, 14] Specifically, exposure to large numbers of providers may hinder families from accurately identifying those entrusted with the care of their loved one. Of note, our research coordinator needed to present as many as 14 provider pictures to 1 family with a hospital stay of 24 hours. Large numbers of providers may create challenges in building rapport, ensuring effective communication and developing trust with families. We chose to evaluate identification of each team member by caregivers; our findings are suggestive of the need for alternative strategies. A more valuable intervention might target identification of key team members (eg, attending, primary intern, primary senior resident). A policy statement regarding transitions of care recommended the establishment of mechanisms to ensure patients and their families know who is responsible for their care.[15] Efforts toward achieving this goal are essential.
This study has several limitations. The study was completed at a single institution, and thus generalizability may be limited. Although the intervention and control units have similar characteristics, randomization did not occur at the patient level. The control group had significantly more patients who had greater than 1 admission compared to the intervention group. Patients enrolled in the study were from a weekday convenience sample; therefore, potential differences in results based on weekend admissions were unable to be assessed. The exclusion of nonEnglish‐speaking families could limit generalizability to this population. Social desirability bias may have elevated the scores in both groups. Providers tasked with the responsibility of introducing the face sheet tool to families did so in a nonstandardized way and may have interacted differently with families compared to the control team. Finally, our project's aim was focused on the effect of a face sheet tool on the identification and satisfaction rating of the medical team by caregivers. Truly family‐centered care would include efforts to improve families' knowledge of and satisfaction with all members of the healthcare team.
A photo‐based face sheet tool helped caregivers better identify their child's care providers by name and role in the hospital. Satisfaction scores were similar in both groups.
Acknowledgements
The authors thank the Pediatric Research in Inpatient Settings network, and specifically Drs. Karen Wilson and Samir Shah, for their assistance during a workshop at the Pediatric Hospital Medicine 2012 meeting in July 2012, during which a first draft of this manuscript was produced.
Disclosure: Nothing to report.
- , , , , . A child's admission to hospital: a qualitative study examining the experiences of parents. Intensive Care Med. 2005;31(9):1248–1254.
- Committee on Quality of Health Care in America. Institute of Medicine. Crossing the Quality Chasm: A New Health System for the 21st Century. Washington, DC: National Academy Press; 2001.
- Committee on Hospital Care and Institute for Patient‐ and Family‐Centered Care. Patient‐ and family‐centered care and the pediatrician's role. Pediatrics. 2012;129(2):394–404.
- , , . The new recommendations on duty hours from the ACGME Task Force. N Engl J Med. 2010;363(2):e3.
- , , , . Parental responses to involvement in rounds on a pediatric inpatient unit at a teaching hospital: a qualitative study. Acad Med. 2008;83(3):292–297.
- PSQ Project Co‐Investigators. Final Report on the Patient Satisfaction Questionnaire Project. Philadelphia, PA: American Board of Internal Medicine; 1989.
- , , , et al. Effect of multisource feedback on resident communication skills and professionalism: a randomized controlled trial. Arch Pediatr Adolesc Med. 2007;161(1):44–49.
- , , , , . Development, implementation, and public reporting of the HCAHPS survey. Med Care Res Rev. 2010;67(1):27–37.
- , , , . PHACES (Photographs of Academic Clinicians and Their Educational Status): a tool to improve delivery of family‐centered care. Acad Pediatr. 2010;10(2):138–145.
- , , , et al. Improving inpatients' identification of their doctors: use of FACE cards. Jt Comm J Qual Patient Saf. 2009;35(12):613–619.
- , . “Don't call me ‘mom’: how parents want to be greeted by their pediatrician. Clin Pediatr. 2009;48(7):720–722.
- , , , , , . Better rested, but more stressed? Evidence of the effects of resident work hour restrictions. Acad Pediatr. 2012;12(4):335–343.
- , , , et al. Pediatric residents' perspectives on reducing work hours and lengthening residency: a national survey. Pediatrics. 2012;130(1):99–107.
- , , , . Inpatient staffing within pediatric residency programs: work hour restrictions and the evolving role of the pediatric hospitalist. J Hosp Med. 2012;7(4):299–303.
- , , , et al. Transitions of Care Consensus policy statement: American College of Physicians, Society of General Internal Medicine, Society of Hospital Medicine, American Geriatrics Society, American College of Emergency Physicians, and Society for Academic Emergency Medicine. J Hosp Med. 2009;4(6):364–370.
IVC Ultrasound Imaging Training
The use of hand‐carried ultrasound by nonspecialists is increasing. Of particular interest to hospitalists is bedside ultrasound assessment of the inferior vena cava (IVC), which more accurately estimates left atrial pressure than does assessment of jugular venous pressure by physical examination.[1] Invasively measured central venous pressure (CVP) also correlates closely with estimates from IVC imaging.[1, 2, 3, 4] Although quick, accurate bedside determination of CVP may have broad potential applications in hospital medicine,[5, 6, 7, 8] of particular interest to patients and their advocates is whether hospitalists are sufficiently skilled to perform this procedure. Lucas et al. found that 8 hospitalists trained to perform 6 cardiac assessments by hand‐carried ultrasound could identify an enlarged IVC with moderate accuracy (sensitivity 56%, specificity 86%).[9] To our knowledge, no other study has examined whether hospitalists can readily develop the skills to accurately assess the IVC by ultrasound. We therefore studied whether the skills needed to acquire and interpret IVC images by ultrasound could be acquired by hospitalists after a brief training program.
METHODS
Study Populations
Hospitalists and volunteer subjects both provided informed consent to participate in this study, which was approved by the Johns Hopkins University School of Medicine Institutional Review Board. Nonpregnant volunteer subjects at least 18 years of age who agreed to attend training sessions were solicited from the investigators' ambulatory clinic patient population (see Supporting Information, Appendix A, in the online version of this article) and were compensated for their time. Volunteer subjects were solicited to represent a range of cardiac pathology. Hospitalists were solicited from among 28 members of the Johns Hopkins Bayview Medical Center's Division of Hospital Medicine, a nationally renowned academic hospitalist program comprising tenure‐track faculty who dedicate at least 30% of their time to academic endeavors.
Image Acquisition and Interpretation
A pocket‐sized portable hand‐carried ultrasound device was used for all IVC images (Vscan; GE Healthcare, Milwaukee, WI). All IVC images were acquired using the conventional methods with a subcostal view while the patient is supine. Cine loops of the IVC with respiration were captured in the longitudinal axis. Diameters were obtained approximately and by convention, approximately 2 cm from the IVC and right atrial junction. The IVC minimum diameter was measured during a cine loop of a patient performing a nasal sniff. The IVC collapsibility was determined by the formula: IVC Collapsibility Index=(IVCmaxIVCmin/IVCmax), where IVCmax and IVCmin represent the maximum and minimum IVC diameters respectively.[2] The IVC maximum diameters and collapsibility measurements that were used to estimate CVP are shown in the Supporting Information, Appendix B, in the online version of this article.
Educational Intervention and Skills Performance Assessment
One to 2 days prior to the in‐person training session, hospitalists were provided a brief introductory online curriculum (see Supporting Information, Appendix B, in the online version of this article). Groups of 3 to 4 hospitalists then completed an in‐person training and testing session (7 hours total time), which consisted of a precourse survey, a didactic session, and up to 4 hours of practice time with 10 volunteer subjects supervised by an experienced board‐certified cardiologist (G.A.H.) and a research echocardiography technician (C.M.). The survey included details on medical training, years in practice, prior ultrasound experience, and confidence in obtaining and interpreting IVC images. Confidence was rated on a Likert scale from 1=strongly confident to 5=not confident (3=neutral).
Next, each hospitalist's skills were assessed on 5 volunteer subjects selected by the cardiologist to represent a range of IVC appearance and body mass index (BMI). After appropriately identifying the IVC, they were first asked to make a visual qualitative judgement whether the IVC collapsed more than 50% during rapid inspiration or a sniff maneuver. Then hospitalists measured IVC diameter in a longitudinal view and calculated IVC collapsibility. Performance was evaluated by an experienced cardiologist (G.A.H.), who directly observed each hospitalist acquire and interpret IVC images and judged them relative to his own hand‐carried ultrasound assessments on the same subjects performed just before the hospitalists' scans. For each volunteer imaged, hospitalists had to acquire a technically adequate image of the IVC and correctly measure the inspiratory and expiratory IVC diameters. Hospitalists then had to estimate CVP by interpreting IVC diameters and collapsibility in 10 previously acquired sets of IVC video and still images. First, the hospitalists performed visual IVC collapsibility assessments (IVC collapse more than 50%) of video clips showing IVC appearance at baseline and during a rapid inspiration or sniff, without any measurements provided. Then, using still images showing premeasured maximum and minimum IVC diameters, they estimated CVP based on calculating IVC collapsibility (see Supporting Information, Appendix B, in the online version of this article for correlation of CVP to IVC maximum diameter and collapsibility). At the end of initial training hospitalists were again surveyed on confidence and also rated level of agreement (Likert scale, 1=strongly agree to 5=strongly disagree) regarding their ability to adequately obtain and accurately interpret IVC images and measurements. The post‐training survey also reviewed the training curriculum and asked hospitalists to identify potential barriers to clinical use of IVC ultrasound.
Following initial training, hospitalists were provided with a hand‐carried ultrasound device and allowed to use the device for IVC imaging on their general medical inpatients; the hospitalists could access the research echocardiography technician (C.M.) for assistance if desired. The number of additional patients imaged and whether scans were assisted was recorded for the study. At least 6 weeks after initial training, the hospitalists' IVC image acquisition and interpretation skills were again assessed on 5 volunteer subjects. At the follow‐up assessment, 4 of the 5 volunteers were new volunteers compared to the hospitalists' initial skills testing.
Statistics
The mean and standard deviations were used to describe continuous variables and percentages to describe proportions, and survey responses were described using medians and the interquartile ranges (25th percentile, 75th percentile). Wilcoxon rank sum tests were used to measure the pre‐ and post‐training differences in the individual survey responses (Stata Statistical Software: Release 12; StataCorp, College Station, TX).
RESULTS
From among 18 hospitalist volunteers, the 10 board‐certified hospitalists who could attend 1 of the scheduled training sessions were enrolled and completed the study. Hospitalists' demographic information and performance are summarized in Table 1. Hospitalists completed the initial online curriculum in an average of 18.37 minutes. After the in‐person training session, 8 of 10 hospitalists acquired adequate IVC images on all 5 volunteer subjects. One hospitalist obtained adequate images in 4 of 5 patients. Another hospitalist only obtained adequate images in 3 of 5 patients; a hepatic vein and the abdominal aorta were erroneously measured instead of the IVC in 1 subject each. This hospitalist later performed supervised IVC imaging on 7 additional hospital inpatients and was the only hospitalist to request additional direct supervision by the research echocardiography technician. All hospitalists were able to accurately quantify the IVC collapsibility index and estimate the CVP from all 10 prerecorded cases showing still images and video clips of the IVC. Based on IVC images, 1 of the 5 volunteers used in testing each day had a very elevated CVP, and the other 4 had CVPs ranging from low to normal. The volunteer's average BMI was overweight at 27.4, with a range from 15.4 to 37.1.
| Hospitalist | Years in Practice | Previous Ultrasound Training (Hours)a | No. of Subjects Adequately Imaged and Correctly Interpreted After First Session (5 Maximum) | No. of Subjects Adequately Imaged and Correctly Interpreted at Follow‐up (5 Maximum) | After Study Completion Felt Training Was Adequate to Perform IVC Imagingb |
|---|---|---|---|---|---|
| |||||
| 1 | 5.5 | 10 | 5 | 5 | 4 |
| 2 | 0.8 | 0 | 5 | 5 | 5 |
| 3 | 1.8 | 4.5 | 3 | 4 | 2 |
| 4 | 1.8 | 0 | 5 | 5 | 5 |
| 5 | 10.5 | 6 | 5 | 5 | 5 |
| 6 | 1.7 | 1 | 5 | 5 | 5 |
| 7 | 0.6 | 0 | 5 | 5 | 5 |
| 8 | 2.6 | 0 | 4 | 5 | 4 |
| 9 | 1.7 | 0 | 5 | 5 | 5 |
| 10 | 5.5 | 10 | 5 | 5 | 5 |
At 7.40.7 weeks (range, 6.98.6 weeks) follow‐up, 9 of 10 hospitalists obtained adequate IVC images in all 5 volunteer subjects and interpreted them correctly for estimating CVP. The hospitalist who performed most poorly at the initial assessment acquired adequate images and interpreted them correctly in 4 of 5 patients at follow‐up. Overall, hospitalists' visual assessment of IVC collapsibility index agreed with the quantitative collapsibility index calculation in 180 of 198 (91%) of the interpretable encounters. By the time of the follow‐up assessment, hospitalists had performed IVC imaging on 3.93.0 additional hospital inpatients (range, 011 inpatients). Lack of time assigned to the clinical service was the main barrier limiting further IVC imaging during that interval. Hospitalists also identified time constraints and need for secure yet accessible device storage as other barriers.
None of the hospitalists had previous experience imaging the IVC, and prior to training they rated their average confidence to acquire an IVC image and interpret it by the hand‐carried ultrasound device at 3 (3, 4) and 3 (3, 4), respectively. After the initial training session, 9 of 10 hospitalists believed they had received adequate online and in‐person training and were confident in their ability to acquire and interpret IVC images. After all training sessions the hospitalists on average rated their confidence statistically significantly better for acquiring and interpreting IVC images at 2 (1, 2) (P=0.005) and 2 (1, 2) (P=0.004), respectively compared to baseline.
DISCUSSION
This study shows that after a relatively brief training intervention, hospitalists can develop and over a short term retain important skills in the acquisition and interpretation of IVC images to estimate CVP. Estimating CVP is key to the care of many patients, but cannot be done accurately by most physicians.[10] Although our study has a number of limitations, the ability to estimate CVP acquired after only a brief training intervention could have important effects on patient care. Given that a dilated IVC with reduced respiratory collapsibility was found to be a statistically significant predictor of 30‐day readmission for heart failure,11 key clinical outcomes to measure in future work include whether IVC ultrasound assessment can help guide diuresis, limit complications, and ultimately reduce rehospitalizations for heart failure, the most expensive diagnosis for Medicare.[12]
Because hand‐carried ultrasound is a point‐of‐care diagnostic tool, we also examined the ability of hospitalists to visually approximate the IVC collapsibility index. Hospitalists' qualitative performance (IVC collapsibility judged correctly 91% of the time without performing formal measurements) is consistent with studies involving emergency medicine physicians and suggests that CVP may be rapidly and accurately estimated in most instances.[13] There may be, however, value to formally measuring the IVC maximum diameter, because it may be inaccurately visually estimated due to changes in scale when the imaging depth is adjusted. Accurately measuring the IVC maximum diameter is important because a maximum diameter of more than 2.0 cm is evidence of an elevated right atrial pressure (82% sensitivity and 84% specificity for predicting right atrial pressure of 10 mm Hg or above) and an elevated pulmonary capillary wedge pressure (75% sensitivity and 83% specificity for pulmonary capillary wedge pressure of 15 mm Hg or more).[14]
Limitations
Our findings should be interpreted cautiously given the relatively small number of hospitalists and subjects used for hand‐carried ultrasound imaging. Although our direct observations of hospitalist performance in IVC imaging were based on objective measurements performed and interpreted accurately, we did not record the images, which would have allowed separate analyses of inter‐rater reliability measures. The majority of volunteer subjects were chronically ill, but they were nonetheless stable outpatients and may have been easier to position and image relative to acutely ill inpatients. Hospitalist self‐selected participation may introduce a bias favoring hospitalists interested in learning hand‐carried ultrasound skills; however, nearly half of the hospitalist group volunteered and enrollments in the study were based only on their availability for the previously scheduled study dates.
IMPLICATIONS FOR TRAINING
Our study, especially the assessment of the hospitalists' ability to retain their skills, adds to what is known about training hospitalists in hand‐carried ultrasound and may help inform deliberations among hospitalists as to whether to join other professional societies in defining specialty‐specific bedside ultrasound indications and training protocols.[9, 15] As individuals acquire new skills at variable rates, training cannot be defined by the number of procedures performed, but rather by the need to provide objective evidence of acquired procedural skills. Thus, going forward there is also a need to develop and validate tools for assessment of competence in IVC imaging skills.
Disclosures
This project was funded as an investigator‐sponsored research project by General Electric (GE) Medical Systems Ultrasound and Primary Care Diagnostics, LLC. The devices used in this training were supplied by GE. All authors had access to the data and contributed to the preparation of the manuscript. GE was not involved in the study design, analysis, or preparation of the manuscript. All authors received research support to perform this study from the funding source.
- , , , et al. A comparison by medicine residents of physical examination versus hand‐carried ultrasound for estimation of right atrial pressure. Am J Cardiol. 2007;99(11):1614–1616.
- , , . Noninvasive estimation of right atrial pressure from the inspiratory collapse of the inferior vena cava. Am J Cardiol. 1990;66:493–496.
- , , , et al. Reappraisal of the use of inferior vena cava for estimating right atrial pressure. J Am Soc Echocardiogr. 2007;20:857–861.
- , , , et al. Use of hand‐carried ultrasound, B‐type natriuretic peptide, and clinical assessment in identifying abnormal left ventricular filling pressures in patients referred for right heart catheterization. J Cardiac Fail. 2010;16:69–75.
- , , . Identification of congestive heart failure via respiratory variation of inferior vena cava diameter. Am J Emerg Med. 2009;27:71–75.
- , , , . Role of inferior vena cava diameter in assessment of volume status: a meta‐analysis. Am J Emerg Med. 2012;30(8):1414–1419.e1.
- , , , et al. Qualitative assessment of the inferior vena cava: useful tool for the evaluation of fluid status in critically ill patients. Am Surg. 2012;78(4):468–470.
- , , , et al. Inferior vena cava collapsibility to guide fluid removal in slow continuous ultrafiltration: a pilot study. Intensive Care Med 2010;36:692–696.
- , , , et al. Diagnostic accuracy of hospitalist‐performed hand‐carried ultrasound echocardiography after a brief training program. J Hosp Med. 2009;4(6):340–349.
- , , . Can the clinical examination diagnose left‐sided heart failure in adults? JAMA. 1997;277:1712–1719.
- , , , et al. Comparison of hand‐carried ultrasound assessment of the inferior vena cava and N‐terminal pro‐brain natriuretic peptide for predicting readmission after hospitalization for acute decompensated heart failure. JACC Cardiovasc Imaging. 2008;1:595–601.
- , , . Rehospitalizations among patients in the Medicare Fee‐for‐Service Program. N Engl J Med. 2009;360:1418–1428.
- , , , et al. The interrater reliability of inferior vena cava ultrasound by bedside clinician sonographers in emergency department patients. Acad Emerg Med. 2011;18:98–101.
- , , , et al. Usefulness of hand‐carried ultrasound to predict elevated left ventricular filling pressure. Am J Cardiol. 2009;103:246–247.
- , , , et al. Hospitalist performance of cardiac hand‐carried ultrasound after focused training. Am J Med. 2007;120(11):1000–1004.
The use of hand‐carried ultrasound by nonspecialists is increasing. Of particular interest to hospitalists is bedside ultrasound assessment of the inferior vena cava (IVC), which more accurately estimates left atrial pressure than does assessment of jugular venous pressure by physical examination.[1] Invasively measured central venous pressure (CVP) also correlates closely with estimates from IVC imaging.[1, 2, 3, 4] Although quick, accurate bedside determination of CVP may have broad potential applications in hospital medicine,[5, 6, 7, 8] of particular interest to patients and their advocates is whether hospitalists are sufficiently skilled to perform this procedure. Lucas et al. found that 8 hospitalists trained to perform 6 cardiac assessments by hand‐carried ultrasound could identify an enlarged IVC with moderate accuracy (sensitivity 56%, specificity 86%).[9] To our knowledge, no other study has examined whether hospitalists can readily develop the skills to accurately assess the IVC by ultrasound. We therefore studied whether the skills needed to acquire and interpret IVC images by ultrasound could be acquired by hospitalists after a brief training program.
METHODS
Study Populations
Hospitalists and volunteer subjects both provided informed consent to participate in this study, which was approved by the Johns Hopkins University School of Medicine Institutional Review Board. Nonpregnant volunteer subjects at least 18 years of age who agreed to attend training sessions were solicited from the investigators' ambulatory clinic patient population (see Supporting Information, Appendix A, in the online version of this article) and were compensated for their time. Volunteer subjects were solicited to represent a range of cardiac pathology. Hospitalists were solicited from among 28 members of the Johns Hopkins Bayview Medical Center's Division of Hospital Medicine, a nationally renowned academic hospitalist program comprising tenure‐track faculty who dedicate at least 30% of their time to academic endeavors.
Image Acquisition and Interpretation
A pocket‐sized portable hand‐carried ultrasound device was used for all IVC images (Vscan; GE Healthcare, Milwaukee, WI). All IVC images were acquired using the conventional methods with a subcostal view while the patient is supine. Cine loops of the IVC with respiration were captured in the longitudinal axis. Diameters were obtained approximately and by convention, approximately 2 cm from the IVC and right atrial junction. The IVC minimum diameter was measured during a cine loop of a patient performing a nasal sniff. The IVC collapsibility was determined by the formula: IVC Collapsibility Index=(IVCmaxIVCmin/IVCmax), where IVCmax and IVCmin represent the maximum and minimum IVC diameters respectively.[2] The IVC maximum diameters and collapsibility measurements that were used to estimate CVP are shown in the Supporting Information, Appendix B, in the online version of this article.
Educational Intervention and Skills Performance Assessment
One to 2 days prior to the in‐person training session, hospitalists were provided a brief introductory online curriculum (see Supporting Information, Appendix B, in the online version of this article). Groups of 3 to 4 hospitalists then completed an in‐person training and testing session (7 hours total time), which consisted of a precourse survey, a didactic session, and up to 4 hours of practice time with 10 volunteer subjects supervised by an experienced board‐certified cardiologist (G.A.H.) and a research echocardiography technician (C.M.). The survey included details on medical training, years in practice, prior ultrasound experience, and confidence in obtaining and interpreting IVC images. Confidence was rated on a Likert scale from 1=strongly confident to 5=not confident (3=neutral).
Next, each hospitalist's skills were assessed on 5 volunteer subjects selected by the cardiologist to represent a range of IVC appearance and body mass index (BMI). After appropriately identifying the IVC, they were first asked to make a visual qualitative judgement whether the IVC collapsed more than 50% during rapid inspiration or a sniff maneuver. Then hospitalists measured IVC diameter in a longitudinal view and calculated IVC collapsibility. Performance was evaluated by an experienced cardiologist (G.A.H.), who directly observed each hospitalist acquire and interpret IVC images and judged them relative to his own hand‐carried ultrasound assessments on the same subjects performed just before the hospitalists' scans. For each volunteer imaged, hospitalists had to acquire a technically adequate image of the IVC and correctly measure the inspiratory and expiratory IVC diameters. Hospitalists then had to estimate CVP by interpreting IVC diameters and collapsibility in 10 previously acquired sets of IVC video and still images. First, the hospitalists performed visual IVC collapsibility assessments (IVC collapse more than 50%) of video clips showing IVC appearance at baseline and during a rapid inspiration or sniff, without any measurements provided. Then, using still images showing premeasured maximum and minimum IVC diameters, they estimated CVP based on calculating IVC collapsibility (see Supporting Information, Appendix B, in the online version of this article for correlation of CVP to IVC maximum diameter and collapsibility). At the end of initial training hospitalists were again surveyed on confidence and also rated level of agreement (Likert scale, 1=strongly agree to 5=strongly disagree) regarding their ability to adequately obtain and accurately interpret IVC images and measurements. The post‐training survey also reviewed the training curriculum and asked hospitalists to identify potential barriers to clinical use of IVC ultrasound.
Following initial training, hospitalists were provided with a hand‐carried ultrasound device and allowed to use the device for IVC imaging on their general medical inpatients; the hospitalists could access the research echocardiography technician (C.M.) for assistance if desired. The number of additional patients imaged and whether scans were assisted was recorded for the study. At least 6 weeks after initial training, the hospitalists' IVC image acquisition and interpretation skills were again assessed on 5 volunteer subjects. At the follow‐up assessment, 4 of the 5 volunteers were new volunteers compared to the hospitalists' initial skills testing.
Statistics
The mean and standard deviations were used to describe continuous variables and percentages to describe proportions, and survey responses were described using medians and the interquartile ranges (25th percentile, 75th percentile). Wilcoxon rank sum tests were used to measure the pre‐ and post‐training differences in the individual survey responses (Stata Statistical Software: Release 12; StataCorp, College Station, TX).
RESULTS
From among 18 hospitalist volunteers, the 10 board‐certified hospitalists who could attend 1 of the scheduled training sessions were enrolled and completed the study. Hospitalists' demographic information and performance are summarized in Table 1. Hospitalists completed the initial online curriculum in an average of 18.37 minutes. After the in‐person training session, 8 of 10 hospitalists acquired adequate IVC images on all 5 volunteer subjects. One hospitalist obtained adequate images in 4 of 5 patients. Another hospitalist only obtained adequate images in 3 of 5 patients; a hepatic vein and the abdominal aorta were erroneously measured instead of the IVC in 1 subject each. This hospitalist later performed supervised IVC imaging on 7 additional hospital inpatients and was the only hospitalist to request additional direct supervision by the research echocardiography technician. All hospitalists were able to accurately quantify the IVC collapsibility index and estimate the CVP from all 10 prerecorded cases showing still images and video clips of the IVC. Based on IVC images, 1 of the 5 volunteers used in testing each day had a very elevated CVP, and the other 4 had CVPs ranging from low to normal. The volunteer's average BMI was overweight at 27.4, with a range from 15.4 to 37.1.
| Hospitalist | Years in Practice | Previous Ultrasound Training (Hours)a | No. of Subjects Adequately Imaged and Correctly Interpreted After First Session (5 Maximum) | No. of Subjects Adequately Imaged and Correctly Interpreted at Follow‐up (5 Maximum) | After Study Completion Felt Training Was Adequate to Perform IVC Imagingb |
|---|---|---|---|---|---|
| |||||
| 1 | 5.5 | 10 | 5 | 5 | 4 |
| 2 | 0.8 | 0 | 5 | 5 | 5 |
| 3 | 1.8 | 4.5 | 3 | 4 | 2 |
| 4 | 1.8 | 0 | 5 | 5 | 5 |
| 5 | 10.5 | 6 | 5 | 5 | 5 |
| 6 | 1.7 | 1 | 5 | 5 | 5 |
| 7 | 0.6 | 0 | 5 | 5 | 5 |
| 8 | 2.6 | 0 | 4 | 5 | 4 |
| 9 | 1.7 | 0 | 5 | 5 | 5 |
| 10 | 5.5 | 10 | 5 | 5 | 5 |
At 7.40.7 weeks (range, 6.98.6 weeks) follow‐up, 9 of 10 hospitalists obtained adequate IVC images in all 5 volunteer subjects and interpreted them correctly for estimating CVP. The hospitalist who performed most poorly at the initial assessment acquired adequate images and interpreted them correctly in 4 of 5 patients at follow‐up. Overall, hospitalists' visual assessment of IVC collapsibility index agreed with the quantitative collapsibility index calculation in 180 of 198 (91%) of the interpretable encounters. By the time of the follow‐up assessment, hospitalists had performed IVC imaging on 3.93.0 additional hospital inpatients (range, 011 inpatients). Lack of time assigned to the clinical service was the main barrier limiting further IVC imaging during that interval. Hospitalists also identified time constraints and need for secure yet accessible device storage as other barriers.
None of the hospitalists had previous experience imaging the IVC, and prior to training they rated their average confidence to acquire an IVC image and interpret it by the hand‐carried ultrasound device at 3 (3, 4) and 3 (3, 4), respectively. After the initial training session, 9 of 10 hospitalists believed they had received adequate online and in‐person training and were confident in their ability to acquire and interpret IVC images. After all training sessions the hospitalists on average rated their confidence statistically significantly better for acquiring and interpreting IVC images at 2 (1, 2) (P=0.005) and 2 (1, 2) (P=0.004), respectively compared to baseline.
DISCUSSION
This study shows that after a relatively brief training intervention, hospitalists can develop and over a short term retain important skills in the acquisition and interpretation of IVC images to estimate CVP. Estimating CVP is key to the care of many patients, but cannot be done accurately by most physicians.[10] Although our study has a number of limitations, the ability to estimate CVP acquired after only a brief training intervention could have important effects on patient care. Given that a dilated IVC with reduced respiratory collapsibility was found to be a statistically significant predictor of 30‐day readmission for heart failure,11 key clinical outcomes to measure in future work include whether IVC ultrasound assessment can help guide diuresis, limit complications, and ultimately reduce rehospitalizations for heart failure, the most expensive diagnosis for Medicare.[12]
Because hand‐carried ultrasound is a point‐of‐care diagnostic tool, we also examined the ability of hospitalists to visually approximate the IVC collapsibility index. Hospitalists' qualitative performance (IVC collapsibility judged correctly 91% of the time without performing formal measurements) is consistent with studies involving emergency medicine physicians and suggests that CVP may be rapidly and accurately estimated in most instances.[13] There may be, however, value to formally measuring the IVC maximum diameter, because it may be inaccurately visually estimated due to changes in scale when the imaging depth is adjusted. Accurately measuring the IVC maximum diameter is important because a maximum diameter of more than 2.0 cm is evidence of an elevated right atrial pressure (82% sensitivity and 84% specificity for predicting right atrial pressure of 10 mm Hg or above) and an elevated pulmonary capillary wedge pressure (75% sensitivity and 83% specificity for pulmonary capillary wedge pressure of 15 mm Hg or more).[14]
Limitations
Our findings should be interpreted cautiously given the relatively small number of hospitalists and subjects used for hand‐carried ultrasound imaging. Although our direct observations of hospitalist performance in IVC imaging were based on objective measurements performed and interpreted accurately, we did not record the images, which would have allowed separate analyses of inter‐rater reliability measures. The majority of volunteer subjects were chronically ill, but they were nonetheless stable outpatients and may have been easier to position and image relative to acutely ill inpatients. Hospitalist self‐selected participation may introduce a bias favoring hospitalists interested in learning hand‐carried ultrasound skills; however, nearly half of the hospitalist group volunteered and enrollments in the study were based only on their availability for the previously scheduled study dates.
IMPLICATIONS FOR TRAINING
Our study, especially the assessment of the hospitalists' ability to retain their skills, adds to what is known about training hospitalists in hand‐carried ultrasound and may help inform deliberations among hospitalists as to whether to join other professional societies in defining specialty‐specific bedside ultrasound indications and training protocols.[9, 15] As individuals acquire new skills at variable rates, training cannot be defined by the number of procedures performed, but rather by the need to provide objective evidence of acquired procedural skills. Thus, going forward there is also a need to develop and validate tools for assessment of competence in IVC imaging skills.
Disclosures
This project was funded as an investigator‐sponsored research project by General Electric (GE) Medical Systems Ultrasound and Primary Care Diagnostics, LLC. The devices used in this training were supplied by GE. All authors had access to the data and contributed to the preparation of the manuscript. GE was not involved in the study design, analysis, or preparation of the manuscript. All authors received research support to perform this study from the funding source.
- , , , et al. A comparison by medicine residents of physical examination versus hand‐carried ultrasound for estimation of right atrial pressure. Am J Cardiol. 2007;99(11):1614–1616.
- , , . Noninvasive estimation of right atrial pressure from the inspiratory collapse of the inferior vena cava. Am J Cardiol. 1990;66:493–496.
- , , , et al. Reappraisal of the use of inferior vena cava for estimating right atrial pressure. J Am Soc Echocardiogr. 2007;20:857–861.
- , , , et al. Use of hand‐carried ultrasound, B‐type natriuretic peptide, and clinical assessment in identifying abnormal left ventricular filling pressures in patients referred for right heart catheterization. J Cardiac Fail. 2010;16:69–75.
- , , . Identification of congestive heart failure via respiratory variation of inferior vena cava diameter. Am J Emerg Med. 2009;27:71–75.
- , , , . Role of inferior vena cava diameter in assessment of volume status: a meta‐analysis. Am J Emerg Med. 2012;30(8):1414–1419.e1.
- , , , et al. Qualitative assessment of the inferior vena cava: useful tool for the evaluation of fluid status in critically ill patients. Am Surg. 2012;78(4):468–470.
- , , , et al. Inferior vena cava collapsibility to guide fluid removal in slow continuous ultrafiltration: a pilot study. Intensive Care Med 2010;36:692–696.
- , , , et al. Diagnostic accuracy of hospitalist‐performed hand‐carried ultrasound echocardiography after a brief training program. J Hosp Med. 2009;4(6):340–349.
- , , . Can the clinical examination diagnose left‐sided heart failure in adults? JAMA. 1997;277:1712–1719.
- , , , et al. Comparison of hand‐carried ultrasound assessment of the inferior vena cava and N‐terminal pro‐brain natriuretic peptide for predicting readmission after hospitalization for acute decompensated heart failure. JACC Cardiovasc Imaging. 2008;1:595–601.
- , , . Rehospitalizations among patients in the Medicare Fee‐for‐Service Program. N Engl J Med. 2009;360:1418–1428.
- , , , et al. The interrater reliability of inferior vena cava ultrasound by bedside clinician sonographers in emergency department patients. Acad Emerg Med. 2011;18:98–101.
- , , , et al. Usefulness of hand‐carried ultrasound to predict elevated left ventricular filling pressure. Am J Cardiol. 2009;103:246–247.
- , , , et al. Hospitalist performance of cardiac hand‐carried ultrasound after focused training. Am J Med. 2007;120(11):1000–1004.
Hospitalist Experiences With PICCs
Peripherally inserted central catheters (PICCs) are central venous catheters that are inserted through peripheral veins of the upper extremities in adults. Because they are safer to insert than central venous catheters (CVCs) and have become increasingly available at the bedside through the advent of specially trained vascular access nurses,[1] the use of PICCs in hospitalized patients has risen across the United States.[2] As the largest group of inpatient providers, hospitalists play a key role in the decision to insert and subsequently manage PICCs in hospitalized patients. Unfortunately, little is known about national hospitalist experiences, practice patterns, or knowledge when it comes to these commonly used devices. Therefore, we designed a 10‐question survey to investigate PICC‐related practices and knowledge among adult hospitalists practicing throughout the United States.
PATIENTS AND METHODS
Questions for this survey were derived from a previously published study conducted across 10 hospitals in the state of Michigan.[3] To assess external validity and test specific hypotheses formulated from the Michigan study, those questions with the greatest variation in response or those most amenable to interventions were chosen for inclusion in this survey.
To reach a national audience of practicing adult hospitalists, we submitted a survey proposal to the Society of Hospital Medicine's (SHM) Research Committee. The SHM Research Committee reviews such proposals using a peer‐review process to ensure both scientific integrity and validity of the survey instrument. Because the survey was already distributed to many hospitalists in Michigan, we requested that only hospitalists outside of Michigan be invited to participate in the national survey. All responses were collected anonymously, and no identifiable data were collected from respondents. Between February 1, 2013 and March 15, 2013, data were collected via an e‐mail sent directly from the SHM to members that contained a link to the study survey administered using SurveyMonkey. To augment data collection, nonresponders to the original e‐mail invitation were sent a second reminder e‐mail midway through the study. Descriptive statistics (percentages) were used to tabulate responses. The institutional review board at the University of Michigan Health System provided ethical and regulatory approval for this study.
RESULTS
A total of 2112 electronic survey invitations were sent to non‐Michigan adult hospitalists, with 381 completing the online survey (response rate 18%). Among respondents to the national survey, 86% reported having placed a PICC solely to obtain venous access in a hospitalized patient (rather than for specific indications such as long‐term intravenous antibiotics, chemotherapy, or parenteral nutrition), whereas 82% reported having cared for a patient who specifically requested a PICC (Table 1). PICC‐related deep vein thrombosis (DVT) and bloodstream infections were reported as being the most frequent PICC complications encountered by hospitalists, followed by superficial thrombophlebitis and mechanical complications such as coiling, kinking, and migration of the PICC tip.
| Total (N=381) | |
|---|---|
| |
| Hospitalist experiences related to PICCs | |
| Among hospitalized patients you have cared for, have any of your patients ever had a PICC placed solely to obtain venous access (eg, not for an indication such as long‐term IV antibiotics, chemotherapy, or TPN)? | |
| Yes | 328 (86.1%) |
| No | 53 (13.9%) |
| Have you ever cared for a patient who specifically requested a PICC because of prior experience with this device? | |
| Yes | 311 (81.6%) |
| No | 70 (18.4%) |
| Most frequently encountered PICC complications | |
| Upper‐extremity DVT or PE | 48 (12.6%) |
| Bloodstream infection | 41 (10.8%) |
| Superficial thrombophlebitis | 34 (8.9%) |
| Cellulitis/exit site erythema | 26 (6.8%) |
| Coiling, kinking of the PICC | 14 (3.7%) |
| Migration of the PICC tip | 9 (2.4%) |
| Breakage of PICC (anywhere) | 6 (1.6%) |
| Hospitalist practice related to PICCs | |
| During patient rounds, do you routinely examine PICCs for external problems (eg, cracks, breaks, leaks, or redness at the insertion site)? | |
| Yes, daily | 97 (25.5%) |
| Yes, but only if the nurse or patient alerts me to a problem with the PICC | 190 (49.9%) |
| No, I don't routinely examine the PICC for external problems | 94 (24.7%) |
| Have you ever forgotten or been unaware of the presence of a PICC? | |
| Yes | 216 (56.7%) |
| No | 165 (43.3%) |
| Assuming no contraindications exist, do you anticoagulate patients who develop a PICC‐associated DVT? | |
| Yes, for at least 1 month | 41(10.8%) |
| Yes, for at least 3 months* | 198 (52.0%) |
| Yes, for at least 6 months | 11 (2.9%) |
| Yes, I anticoagulate for as long as the line remains in place. Once the line is removed, I stop anticoagulation | 30 (7.9%) |
| Yes, I anticoagulate for as long as the line remains in place followed by another 4 weeks of therapy | 72 (18.9%) |
| I don't usually anticoagulate patients who develop a PICC‐related DVT | 29 (7.6%) |
| When a hospitalized patient develops a PICC‐related DVT, do you routinely remove the PICC? | |
| Yes | 271 (71.1%) |
| No | 110 (28.9%) |
| Hospitalist opinions related to PICCs | |
| Thinking about your hospital and your experiences, what percentage of PICC insertions may represent inappropriate use (eg, PICC placed for short‐term venous access for a presumed infection that could be treated with oral antibiotic or PICCs that were promptly removed as the patient no longer needed it for clinical management)? | |
| 10% | 192 (50.4%) |
| 10%25% | 160 (42.0%) |
| 26%50% | 22 (5.8%) |
| >50% | 7 (1.8%) |
| Do you think hospitalists should be trained to insert PICCs? | |
| Yes | 162 (42.5%) |
| No | 219 (57.5%) |
| Hospitalist knowledge related to PICCs | |
| Why is the position of the PICC‐tip checked following bedside PICC insertion? | |
| To decrease the risk of arrhythmia from tip placement in the right atrial | 267 (70.1%) |
| To ensure it is not accidentally placed into an artery | 44 (11.5%) |
| To minimize the risk of venous thrombosis* | 33 (8.7%) |
| For documentation purposes (to reduce the risk of lawsuits related tocomplications) | 16 (4.2%) |
| I don't know | 21 (5.5%) |
Several potentially important safety concerns regarding hospitalist PICC practices were observed in this survey. For instance, only 25% of hospitalists reported examining PICCs on daily rounds for external problems. When alerted by nurses or patients about problems with the device, this number doubled to 50%. In addition, 57% of respondents admitted to having at least once forgotten about the presence of a PICC in their hospitalized patient.
Participants also reported significant variation in duration of anticoagulation therapy for PICC‐related DVT, with only half of all respondents selecting the guideline‐recommended 3 months of anticoagulation.[4, 5] With respect to knowledge regarding PICCs, only 9% of respondents recognized that tip verification performed after PICC insertion was conducted to lower risk of venous thromboembolism, not that of arrhythmia.[6] Hospitalists were ambivalent about being trained on how to place PICCs, with only 43% indicating this skill was necessary. Finally, as many as 10% to 25% of PICCs inserted in their hospitals were felt to be inappropriately placed and/or avoidable by 42% of those surveyed.
DISCUSSION
As the use of PICCs rises in hospitalized patients, variability in practices associated with the use of these indwelling vascular catheters is being increasingly recognized. For instance, Tejedor and colleagues reported that PICCs placed in hospitalized patients at their academic medical center were often idle or inserted in patients who simultaneously have peripheral intravenous catheters.[7] Recent data from a tertiary care pediatric center found significantly greater PICC utilization rates over the past decade in association with shorter dwell times, suggesting important and dynamic changes in patterns of use of these devices.[2] Our prior survey of hospitalists in 10 Michigan hospitals also found variations in reported hospitalist practices, knowledge, and experiences related to PICCs.[3] However, the extent to which the Michigan experience portrayed a national trend remained unclear and was the impetus behind this survey. Results from this study appear to support findings from Michigan and highlight several potential opportunities to improve hospitalist PICC practices on a national scale.
In particular, 57% of respondents in this study (compared to 51% of Michigan hospitalists) stated they had at least once forgotten that their patient had a PICC. As early removal of PICCs that are clinically no longer necessary is a cornerstone to preventing thrombosis and infection,[4, 5, 6, 8] the potential impact of such forgetfulness on clinical outcomes and patient safety is of concern. Notably, PICC‐related DVT and bloodstream infection remained the 2 most commonly encountered complications in this survey, just as in the Michigan study.
Reported variations in treatment duration for PICC‐related DVT were also common in this study, with only half of all respondents in both surveys selecting the guideline‐recommended minimum of 3 months of anticoagulation. Finally, a substantial proportion (42%) of participants felt that 10% to 25% of PICCs placed in their hospitals might be inappropriately placed and avoidable, again echoing the sentiments of 51% of the participants in the Michigan survey. These findings strengthen the call to develop a research agenda focused on PICC use in hospitalized patients across the United States.
Why may hospitalists across the country demonstrate such variability when it comes to these indwelling vascular devices? PICCs have historically been viewed as safer with respect to complications such as infection and thrombosis than other central venous catheters, a viewpoint that has likely promulgated their use in the inpatient setting. However, as we and others have shown,[8, 9, 10, 11, 12] this notion is rapidly vanishing and being replaced by the recognition that severity of illness and patient comorbidities are more important determinants of complications than the device itself. Additionally, important knowledge gaps exist when it comes to the safe use of PICCs in hospitalized patients, contributing to variation in indications for insertion, removal, and treatment of complications related to these devices.
Our study is notably limited by a low response rate. Because the survey was administered directly by SHM without collection of respondent data (eg, practice location, years in practice), we are unable to adjust or weight these data to represent a national cohort of adult hospitalists. However, as responses to questions are consistent with our findings from Michigan, and the response rates of this survey are comparable to observed response rates from prior SHM‐administered nationwide surveys (10%40%),[13, 14, 15] we do not believe our findings necessarily represent systematic deviations from the truth and assumed that these responses were missing at random. In addition, owing to use of a survey‐based design, our study is inherently limited by a number of biases, including the use of a convenience sample of SHM members, nonresponse bias, and recall bias. Given these limitations, the association between the available responses and real‐world clinical practice is unclear and deserving of further investigation.
These limitations notwithstanding, our study has several strengths. We found important national variations in reported practices and knowledge related to PICCs, affirming the need to develop a research agenda to improve practice. Further, because a significant proportion of hospitalists may forget their patients have PICCs, our study supports the role of technologies such as catheter reminder systems, computerized decision aids, and automatic stop orders to improve PICC use. These technologies, if utilized in a workflow‐sensitive fashion, could improve PICC safety in hospitalized settings and merit exploration. In addition, our study highlights the growing need for criteria to guide the use of PICCs in hospital settings. Although the Infusion Nursing Society of America has published indications and guidelines for use of vascular devices,[6] these do not always incorporate clinical nuances such as necessity of intravenous therapy or duration of treatment in decision making. The development of evidence‐based appropriateness criteria to guide clinical decision making is thus critical to improving use of PICCs in inpatient settings.[16]
With growing recognition of PICC‐related complications in hospitalized patients, an urgent need to improve practice related to these devices exists. This study begins to define the scope of such work across the United States. Until more rigorous evidence becomes available to guide clinical practice, hospitals and hospitalists should begin to carefully monitor PICC use to safeguard and improve patient safety.
Disclosures
The Blue Cross/Blue Shield of Michigan Foundation funded this study through an investigator‐initiated research proposal (1931‐PIRAP to Dr. Chopra). The funding source played no role in study design, acquisition of data, data analysis, or reporting of these results. The authors report no conflicts of interest.
- , . Peripherally inserted central catheter: compliance with evidence‐based indications for insertion in an inpatient setting. J Infus Nurs. 2013;36(4):291–296.
- , , , , , . Peripherally inserted central catheters: use at a tertiary care pediatric center. J Vasc Interv Radiol. 2013;24(9):1323–1331.
- , , , et al. Hospitalist experiences, practice, opinions, and knowledge regarding peripherally inserted central catheters: a Michigan survey. J Hosp Med. 2013;8(6):309–314.
- , , , et al. Executive summary: antithrombotic therapy and prevention of thrombosis, 9th ed: American College of Chest Physicians evidence‐based clinical practice guidelines. Chest. 2012;141(2 suppl):7S–47S.
- , , , et al. Quality improvement guidelines for central venous access. J Vasc Interv Radiol. 2010;21(7):976–981.
- , , , et al. Infusion nursing standards of practice. J Infus Nurs. 2011;34(1S):1–115.
- , , , et al. Temporary central venous catheter utilization patterns in a large tertiary care center: tracking the “idle central venous catheter”. Infect Control Hosp Epidemiol. 2012;33(1):50–57.
- , , , et al. Risk of venous thromboembolism associated with peripherally inserted central catheters: a systematic review and meta‐analysis. Lancet. 2013;382(9889):311–325.
- , , , , . Risk factors for peripherally inserted central venous catheter complications in children. JAMA Pediatr. 2013;167(5):429–435.
- , , , et al. Patient‐ and device‐specific risk factors for peripherally inserted central venous catheter‐related bloodstream infections. Infect Control Hosp Epidemiol. 2013;34(2):184–189.
- , , , , . The risk of bloodstream infection associated with peripherally inserted central catheters compared with central venous catheters in adults: a systematic review and meta‐analysis. Infect Control Hosp Epidemiol. 2013;34(9):908–918.
- , . Risk of catheter‐related bloodstream infection with peripherally inserted central venous catheters used in hospitalized patients. Chest. 2005;128(2):489–495.
- , , , , ; Society of Hospital Medicine Career Satisfaction Task Force. Job characteristics, satisfaction, and burnout across hospitalist practice models. J Hosp Med. 2012;7(5):402–410.
- , . Clinical hospital medicine fellowships: perspectives of employers, hospitalists, and medicine residents. J Hosp Med. 2008;3(1):28–34.
- , , , . Survey of US academic hospitalist leaders about mentorship and academic activities in hospitalist groups. J Hosp Med. 2011;6(1):5–9.
- , , . The problem with peripherally inserted central catheters. JAMA. 2012;308(15):1527–1528.
Peripherally inserted central catheters (PICCs) are central venous catheters that are inserted through peripheral veins of the upper extremities in adults. Because they are safer to insert than central venous catheters (CVCs) and have become increasingly available at the bedside through the advent of specially trained vascular access nurses,[1] the use of PICCs in hospitalized patients has risen across the United States.[2] As the largest group of inpatient providers, hospitalists play a key role in the decision to insert and subsequently manage PICCs in hospitalized patients. Unfortunately, little is known about national hospitalist experiences, practice patterns, or knowledge when it comes to these commonly used devices. Therefore, we designed a 10‐question survey to investigate PICC‐related practices and knowledge among adult hospitalists practicing throughout the United States.
PATIENTS AND METHODS
Questions for this survey were derived from a previously published study conducted across 10 hospitals in the state of Michigan.[3] To assess external validity and test specific hypotheses formulated from the Michigan study, those questions with the greatest variation in response or those most amenable to interventions were chosen for inclusion in this survey.
To reach a national audience of practicing adult hospitalists, we submitted a survey proposal to the Society of Hospital Medicine's (SHM) Research Committee. The SHM Research Committee reviews such proposals using a peer‐review process to ensure both scientific integrity and validity of the survey instrument. Because the survey was already distributed to many hospitalists in Michigan, we requested that only hospitalists outside of Michigan be invited to participate in the national survey. All responses were collected anonymously, and no identifiable data were collected from respondents. Between February 1, 2013 and March 15, 2013, data were collected via an e‐mail sent directly from the SHM to members that contained a link to the study survey administered using SurveyMonkey. To augment data collection, nonresponders to the original e‐mail invitation were sent a second reminder e‐mail midway through the study. Descriptive statistics (percentages) were used to tabulate responses. The institutional review board at the University of Michigan Health System provided ethical and regulatory approval for this study.
RESULTS
A total of 2112 electronic survey invitations were sent to non‐Michigan adult hospitalists, with 381 completing the online survey (response rate 18%). Among respondents to the national survey, 86% reported having placed a PICC solely to obtain venous access in a hospitalized patient (rather than for specific indications such as long‐term intravenous antibiotics, chemotherapy, or parenteral nutrition), whereas 82% reported having cared for a patient who specifically requested a PICC (Table 1). PICC‐related deep vein thrombosis (DVT) and bloodstream infections were reported as being the most frequent PICC complications encountered by hospitalists, followed by superficial thrombophlebitis and mechanical complications such as coiling, kinking, and migration of the PICC tip.
| Total (N=381) | |
|---|---|
| |
| Hospitalist experiences related to PICCs | |
| Among hospitalized patients you have cared for, have any of your patients ever had a PICC placed solely to obtain venous access (eg, not for an indication such as long‐term IV antibiotics, chemotherapy, or TPN)? | |
| Yes | 328 (86.1%) |
| No | 53 (13.9%) |
| Have you ever cared for a patient who specifically requested a PICC because of prior experience with this device? | |
| Yes | 311 (81.6%) |
| No | 70 (18.4%) |
| Most frequently encountered PICC complications | |
| Upper‐extremity DVT or PE | 48 (12.6%) |
| Bloodstream infection | 41 (10.8%) |
| Superficial thrombophlebitis | 34 (8.9%) |
| Cellulitis/exit site erythema | 26 (6.8%) |
| Coiling, kinking of the PICC | 14 (3.7%) |
| Migration of the PICC tip | 9 (2.4%) |
| Breakage of PICC (anywhere) | 6 (1.6%) |
| Hospitalist practice related to PICCs | |
| During patient rounds, do you routinely examine PICCs for external problems (eg, cracks, breaks, leaks, or redness at the insertion site)? | |
| Yes, daily | 97 (25.5%) |
| Yes, but only if the nurse or patient alerts me to a problem with the PICC | 190 (49.9%) |
| No, I don't routinely examine the PICC for external problems | 94 (24.7%) |
| Have you ever forgotten or been unaware of the presence of a PICC? | |
| Yes | 216 (56.7%) |
| No | 165 (43.3%) |
| Assuming no contraindications exist, do you anticoagulate patients who develop a PICC‐associated DVT? | |
| Yes, for at least 1 month | 41(10.8%) |
| Yes, for at least 3 months* | 198 (52.0%) |
| Yes, for at least 6 months | 11 (2.9%) |
| Yes, I anticoagulate for as long as the line remains in place. Once the line is removed, I stop anticoagulation | 30 (7.9%) |
| Yes, I anticoagulate for as long as the line remains in place followed by another 4 weeks of therapy | 72 (18.9%) |
| I don't usually anticoagulate patients who develop a PICC‐related DVT | 29 (7.6%) |
| When a hospitalized patient develops a PICC‐related DVT, do you routinely remove the PICC? | |
| Yes | 271 (71.1%) |
| No | 110 (28.9%) |
| Hospitalist opinions related to PICCs | |
| Thinking about your hospital and your experiences, what percentage of PICC insertions may represent inappropriate use (eg, PICC placed for short‐term venous access for a presumed infection that could be treated with oral antibiotic or PICCs that were promptly removed as the patient no longer needed it for clinical management)? | |
| 10% | 192 (50.4%) |
| 10%25% | 160 (42.0%) |
| 26%50% | 22 (5.8%) |
| >50% | 7 (1.8%) |
| Do you think hospitalists should be trained to insert PICCs? | |
| Yes | 162 (42.5%) |
| No | 219 (57.5%) |
| Hospitalist knowledge related to PICCs | |
| Why is the position of the PICC‐tip checked following bedside PICC insertion? | |
| To decrease the risk of arrhythmia from tip placement in the right atrial | 267 (70.1%) |
| To ensure it is not accidentally placed into an artery | 44 (11.5%) |
| To minimize the risk of venous thrombosis* | 33 (8.7%) |
| For documentation purposes (to reduce the risk of lawsuits related tocomplications) | 16 (4.2%) |
| I don't know | 21 (5.5%) |
Several potentially important safety concerns regarding hospitalist PICC practices were observed in this survey. For instance, only 25% of hospitalists reported examining PICCs on daily rounds for external problems. When alerted by nurses or patients about problems with the device, this number doubled to 50%. In addition, 57% of respondents admitted to having at least once forgotten about the presence of a PICC in their hospitalized patient.
Participants also reported significant variation in duration of anticoagulation therapy for PICC‐related DVT, with only half of all respondents selecting the guideline‐recommended 3 months of anticoagulation.[4, 5] With respect to knowledge regarding PICCs, only 9% of respondents recognized that tip verification performed after PICC insertion was conducted to lower risk of venous thromboembolism, not that of arrhythmia.[6] Hospitalists were ambivalent about being trained on how to place PICCs, with only 43% indicating this skill was necessary. Finally, as many as 10% to 25% of PICCs inserted in their hospitals were felt to be inappropriately placed and/or avoidable by 42% of those surveyed.
DISCUSSION
As the use of PICCs rises in hospitalized patients, variability in practices associated with the use of these indwelling vascular catheters is being increasingly recognized. For instance, Tejedor and colleagues reported that PICCs placed in hospitalized patients at their academic medical center were often idle or inserted in patients who simultaneously have peripheral intravenous catheters.[7] Recent data from a tertiary care pediatric center found significantly greater PICC utilization rates over the past decade in association with shorter dwell times, suggesting important and dynamic changes in patterns of use of these devices.[2] Our prior survey of hospitalists in 10 Michigan hospitals also found variations in reported hospitalist practices, knowledge, and experiences related to PICCs.[3] However, the extent to which the Michigan experience portrayed a national trend remained unclear and was the impetus behind this survey. Results from this study appear to support findings from Michigan and highlight several potential opportunities to improve hospitalist PICC practices on a national scale.
In particular, 57% of respondents in this study (compared to 51% of Michigan hospitalists) stated they had at least once forgotten that their patient had a PICC. As early removal of PICCs that are clinically no longer necessary is a cornerstone to preventing thrombosis and infection,[4, 5, 6, 8] the potential impact of such forgetfulness on clinical outcomes and patient safety is of concern. Notably, PICC‐related DVT and bloodstream infection remained the 2 most commonly encountered complications in this survey, just as in the Michigan study.
Reported variations in treatment duration for PICC‐related DVT were also common in this study, with only half of all respondents in both surveys selecting the guideline‐recommended minimum of 3 months of anticoagulation. Finally, a substantial proportion (42%) of participants felt that 10% to 25% of PICCs placed in their hospitals might be inappropriately placed and avoidable, again echoing the sentiments of 51% of the participants in the Michigan survey. These findings strengthen the call to develop a research agenda focused on PICC use in hospitalized patients across the United States.
Why may hospitalists across the country demonstrate such variability when it comes to these indwelling vascular devices? PICCs have historically been viewed as safer with respect to complications such as infection and thrombosis than other central venous catheters, a viewpoint that has likely promulgated their use in the inpatient setting. However, as we and others have shown,[8, 9, 10, 11, 12] this notion is rapidly vanishing and being replaced by the recognition that severity of illness and patient comorbidities are more important determinants of complications than the device itself. Additionally, important knowledge gaps exist when it comes to the safe use of PICCs in hospitalized patients, contributing to variation in indications for insertion, removal, and treatment of complications related to these devices.
Our study is notably limited by a low response rate. Because the survey was administered directly by SHM without collection of respondent data (eg, practice location, years in practice), we are unable to adjust or weight these data to represent a national cohort of adult hospitalists. However, as responses to questions are consistent with our findings from Michigan, and the response rates of this survey are comparable to observed response rates from prior SHM‐administered nationwide surveys (10%40%),[13, 14, 15] we do not believe our findings necessarily represent systematic deviations from the truth and assumed that these responses were missing at random. In addition, owing to use of a survey‐based design, our study is inherently limited by a number of biases, including the use of a convenience sample of SHM members, nonresponse bias, and recall bias. Given these limitations, the association between the available responses and real‐world clinical practice is unclear and deserving of further investigation.
These limitations notwithstanding, our study has several strengths. We found important national variations in reported practices and knowledge related to PICCs, affirming the need to develop a research agenda to improve practice. Further, because a significant proportion of hospitalists may forget their patients have PICCs, our study supports the role of technologies such as catheter reminder systems, computerized decision aids, and automatic stop orders to improve PICC use. These technologies, if utilized in a workflow‐sensitive fashion, could improve PICC safety in hospitalized settings and merit exploration. In addition, our study highlights the growing need for criteria to guide the use of PICCs in hospital settings. Although the Infusion Nursing Society of America has published indications and guidelines for use of vascular devices,[6] these do not always incorporate clinical nuances such as necessity of intravenous therapy or duration of treatment in decision making. The development of evidence‐based appropriateness criteria to guide clinical decision making is thus critical to improving use of PICCs in inpatient settings.[16]
With growing recognition of PICC‐related complications in hospitalized patients, an urgent need to improve practice related to these devices exists. This study begins to define the scope of such work across the United States. Until more rigorous evidence becomes available to guide clinical practice, hospitals and hospitalists should begin to carefully monitor PICC use to safeguard and improve patient safety.
Disclosures
The Blue Cross/Blue Shield of Michigan Foundation funded this study through an investigator‐initiated research proposal (1931‐PIRAP to Dr. Chopra). The funding source played no role in study design, acquisition of data, data analysis, or reporting of these results. The authors report no conflicts of interest.
- , . Peripherally inserted central catheter: compliance with evidence‐based indications for insertion in an inpatient setting. J Infus Nurs. 2013;36(4):291–296.
- , , , , , . Peripherally inserted central catheters: use at a tertiary care pediatric center. J Vasc Interv Radiol. 2013;24(9):1323–1331.
- , , , et al. Hospitalist experiences, practice, opinions, and knowledge regarding peripherally inserted central catheters: a Michigan survey. J Hosp Med. 2013;8(6):309–314.
- , , , et al. Executive summary: antithrombotic therapy and prevention of thrombosis, 9th ed: American College of Chest Physicians evidence‐based clinical practice guidelines. Chest. 2012;141(2 suppl):7S–47S.
- , , , et al. Quality improvement guidelines for central venous access. J Vasc Interv Radiol. 2010;21(7):976–981.
- , , , et al. Infusion nursing standards of practice. J Infus Nurs. 2011;34(1S):1–115.
- , , , et al. Temporary central venous catheter utilization patterns in a large tertiary care center: tracking the “idle central venous catheter”. Infect Control Hosp Epidemiol. 2012;33(1):50–57.
- , , , et al. Risk of venous thromboembolism associated with peripherally inserted central catheters: a systematic review and meta‐analysis. Lancet. 2013;382(9889):311–325.
- , , , , . Risk factors for peripherally inserted central venous catheter complications in children. JAMA Pediatr. 2013;167(5):429–435.
- , , , et al. Patient‐ and device‐specific risk factors for peripherally inserted central venous catheter‐related bloodstream infections. Infect Control Hosp Epidemiol. 2013;34(2):184–189.
- , , , , . The risk of bloodstream infection associated with peripherally inserted central catheters compared with central venous catheters in adults: a systematic review and meta‐analysis. Infect Control Hosp Epidemiol. 2013;34(9):908–918.
- , . Risk of catheter‐related bloodstream infection with peripherally inserted central venous catheters used in hospitalized patients. Chest. 2005;128(2):489–495.
- , , , , ; Society of Hospital Medicine Career Satisfaction Task Force. Job characteristics, satisfaction, and burnout across hospitalist practice models. J Hosp Med. 2012;7(5):402–410.
- , . Clinical hospital medicine fellowships: perspectives of employers, hospitalists, and medicine residents. J Hosp Med. 2008;3(1):28–34.
- , , , . Survey of US academic hospitalist leaders about mentorship and academic activities in hospitalist groups. J Hosp Med. 2011;6(1):5–9.
- , , . The problem with peripherally inserted central catheters. JAMA. 2012;308(15):1527–1528.
Etiquette‐Based Medicine Among Interns
Patient‐centered communication may impact several aspects of the patientdoctor relationship including patient disclosure of illness‐related information, patient satisfaction, anxiety, and compliance with medical recommendations.[1, 2, 3, 4] Etiquette‐based medicine, a term coined by Kahn, involves simple patient‐centered communication strategies that convey professionalism and respect to patients.[5] Studies have confirmed that patients prefer physicians who practice etiquette‐based medicine behaviors, including sitting down and introducing one's self.[6, 7, 8, 9] Performance of etiquette‐based medicine is associated with higher Press Ganey patient satisfaction scores. However, these easy‐to‐practice behaviors may not be modeled commonly in the inpatient setting.[10] We sought to understand whether etiquette‐based communication behaviors are practiced by trainees on inpatient medicine rotations.
METHODS
Design
This was a prospective study incorporating direct observation of intern interactions with patients during January 2012 at 2 internal medicine residency programs in Baltimore Maryland, Johns Hopkins Hospital (JHH) and the University of Maryland Medical Center (UMMC). We then surveyed participants from JHH in June 2012 to assess perceptions of their practice of etiquette‐based communication.
Participants and Setting
We observed a convenience sample of 29 internal medicine interns from the 2 institutions. We sought to observe interns over an equal number of hours at both sites and to sample shifts in proportion to the amount of time interns spend on each of these shifts. All interns who were asked to participate in the study agreed and comprised a total of 27% of the 108 interns in the 2 programs. The institutional review board at Johns Hopkins School of Medicine approved the study; the University of Maryland institutional review board deemed it not human subjects research. All observed interns provided informed consent to be observed during 1 to 4 inpatient shifts.
Observers
Twenty‐two undergraduate university students served as the observers for the study and were trained to collect data with the iPod Touch (Apple, Cupertino, CA) without interrupting patient care. We then tested the observers to ensure 85% concordance rate with the researchers in mock observation. Four hours of quality assurance were completed at both institutions during the study. Congruence between observer and research team member was >85% for each hour of observation.
Observation
Observers recorded intern activities on the iPod Touch spreadsheet application. The application allowed for real‐time data entry and direct export of results. The primary dependent variables for this study were 5 behaviors that were assessed each time an intern went into a patient's room. The 5 observed behaviors included (1) introducing one's self, (2) introducing one's role on the medical team, (3) touching the patient, (4) sitting down, and (5) asking the patient at least 1 open‐ended question. These behaviors were chosen for observation because they are central to Kahn's framework of etiquette‐based medicine, applicable to each inpatient encounter, and readily observed by trained nonmedical observers. These behaviors are defined in Table 1. Use of open‐ended questions was observed as a more general form of Kahn's recommendation to ask how the patient is feeling. Interns were not aware of which behaviors were being evaluated.
| Behavior | Definition |
|---|---|
| Introduced self | Providing a name |
| Introduced role | Uses term doctor, resident, intern, or medical team |
| Sat down | Sitting on the bed, in a chair, or crouching if no chair was available during at least part of the encounter |
| Touched the patient | Any form of physical contact that occurred at least once during the encounter including shaking a patient's hand, touching a patient on the shoulder, or performing any part of the physical exam |
| Asked open‐ended question | Asked the patient any question that required more than a yes/no answer |
Each time an observed intern entered a patient room, the observer recorded whether or not each of the 5 behaviors was performed, coded as a dichotomous variable. Although data collection was anonymous, observers recorded the team, hospital site, gender of the intern, and whether the intern was admitting new patients during the shift.
Survey
Following the observational portion of the study, participants at JHH completed a cross‐sectional, anonymous survey that asked them to estimate how frequently they currently performed each of the behaviors observed in this study. Response options included the following categories: 20%, 20% to 40%, 40% to 60%, 60% to 80%, or 80% to 100%.
Data Analysis
We determined the percent of patient visits during which each behavior was performed. Data were analyzed using Student t and [2] tests evaluating differences by hospital, intern gender, type of shift, and time of day. To account for correlation within subjects and observers, we performed multilevel logistic regression analysis adjusted for clustering at the intern and observer levels. For the survey analysis, the mean of the response category was used as the basis for comparison. All quantitative analyses were performed in Excel 2010 (Microsoft Corp., Redmond, WA) and Stata/IC version 11 (StataCorp, College Station, TX).
RESULTS
A total of 732 inpatient encounters were observed during 118 intern shifts. Interns were observed for a mean of 25 patient encounters each (range, 361; standard deviation [SD] 17). Overall, interns introduced themselves 40% of the time and stated their role 37% of the time (Table 2). Interns touched patients on 65% of visits, sat down with patients during 9% of visits, and asked open‐ended questions on 75% of visits. Interns performed all 5 of the behaviors during 4% of the total encounters. The percentage of the 5 behaviors performed by each intern during all observed visits ranged from 24% to 100%, with a mean of 51% (SD 17%) per intern.
| Total Encounters, N (%) | Introduced Self (%) | Introduced Role (%) | Touched Patient (%) | Sat Down (%) | Open‐Ended Question (%) | |
|---|---|---|---|---|---|---|
| ||||||
| Overall | 732 | 40 | 37 | 65 | 9 | 75 |
| JHH | 373 (51) | 35ab | 29ab | 62a | 10 | 70a |
| UMMC | 359 (49) | 45 | 44 | 69 | 8 | 81 |
| Male | 284 (39) | 39 | 35 | 64 | 9 | 74 |
| Female | 448 (61) | 41 | 38 | 67 | 10 | 76 |
| Day shift | 551 (75) | 37a | 34a | 65 | 9 | 77 |
| Night shift | 181 (25) | 48 | 45 | 67 | 12 | 71 |
| Admitting shift | 377 (52) | 46a | 42a | 63 | 10 | 75 |
| Nonadmitting shift | 355 (48) | 34 | 30 | 69 | 9 | 76 |
During night shifts as compared to day shifts, interns were more likely to introduce themselves (48% vs 37%, P=0.01) and their role (45% vs 34%, P0.01). During shifts in which they admitted patients as compared to coverage shifts, interns were more likely to introduce themselves (46% vs 34%, P0.01) and their role (42% vs 30%, P0.01). Interns at UMMC as compared to JHH interns were more likely to introduce themselves (45% vs 35%, P0.01) and describe their role to patients (44% vs 29%, P0.01). Interns at UMMC were also more likely to ask open‐ended questions (81% vs 70%, P0.01) and to touch patients (69% vs 62%, P=0.04). Performance of these behaviors did not vary significantly by gender, time of day, or shift. After adjustment for clustering at the observer and intern levels, differences by institution persisted in the rate of introducing oneself and one's role.
We performed a sensitivity analysis examining the first patient encounters of the day, and found that interns were somewhat more likely to introduce themselves (50% vs 40%, P=0.03) but were not significantly more likely to introduce their role, sit down, ask open‐ended questions, or touch the patient.
Nine of the 10 interns at JHH who participated in the study completed the survey (response rate=90%). Interns estimated introducing themselves and their role and sitting with patients significantly more frequently than was observed (80% vs 40%, P0.01; 80% vs 37%, P0.01; and 58% vs 9%, P0.01, respectively) (Figure 1).

DISCUSSION
The interns we observed in 2 urban academic internal medicine residency programs did not routinely practice etiquette‐based communication. Interns surveyed tended to overestimate their performance of these behaviors. These behaviors are simple to perform and are each associated with improved patient experiences of hospital care. Tackett et al. recently demonstrated that interns are not alone. Hospitalist physicians do not universally practice etiquette‐based medicine, even though these behaviors correlate with patient satisfaction scores.[10]
Introducing oneself to patients may improve patient satisfaction and acceptance of trainee involvement in care.[6] However, only 10% of hospitalized patients in 1 study correctly identified a physician on their inpatient team, demonstrating the need for introductions during each and every inpatient encounter.[11] The interns we observed introduced themselves to patients in only 40% of encounters. During admitting shifts, when the first encounter with a patient likely took place, interns introduced themselves during 46% of encounters.
A comforting touch has been shown to reduce anxiety levels among patients and improve compliance with treatment regimens, but the interns did not touch patients in one‐third of visits, including during admitting shifts. Sixty‐six percent of patients consider a physician's touch comforting, and 58% believe it to be healing.[8]
A randomized trial found that most patients preferred a sitting physician, and believed that practitioners who sat were more compassionate and spent more time with them.[9] Unfortunately, interns sat down with patients in fewer than 10% of encounters.
We do not know why interns do not engage in these simple behaviors, but it is not surprising given that their role models, including hospitalist physicians, do not practice them universally.[10] Personality differences, medical school experiences, and hospital factors such as patient volume and complexity may explain variability in performance.
Importantly, we know that habits learned in residency tend to be retained when physicians enter independent practice.[12] If we want attending physicians to practice etiquette‐based communication, then it must be role modeled, taught, and evaluated during residency by clinical educators and hospitalist physicians. The gap between intern perceptions and actual practice of these behaviors provides a window of opportunity for education and feedback in bedside communication. Attending physicians rate communication skills as 1 of the top values they seek to pass on to house officers.[13] Curricula on communication skills improve physician attitudes and beliefs about the importance of good communication as well as long‐term performance of communication skills.[14]
Our study had several limitations. First, all 732 patient encounters were assessed, regardless of whether the intern had seen the patient previously. This differed slightly from Kahn's assertion that these behaviors be performed at least on the first encounter with the patient. We believe that the need for common courtesy does not diminish after the first visit, and although certain behaviors may not be indicated on 100% of visits, our sensitivity analysis indicated performance of these behaviors was not likely even on the first visit of the day.
Second, our observations were limited to medicine interns at 2 programs in Baltimore during a single month, limiting generalizability. A convenience sample of interns was chosen for recruitment based on rotation on a general medicine rotation during the study month. We observed interns over the course of several shifts and throughout various positions in the call cycle.
Third, in any observational study, the Hawthorne effect is a potential limitation. We attempted to limit this bias by collecting information anonymously and not indicating to the interns which aspects of the patient encounter were being recorded.
Fourth, we defined the behaviors broadly in an attempt to measure the outcomes conservatively and maximize inter‐rater reliability. For instance, we did not differentiate in data collection between comforting touch and physical examination. Because chairs may not be readily available in all patient rooms, we included sitting on the patient's bed or crouching next to the bed as sitting with the patient. Use of open‐ended questions was observed as a more general form of Kahn's recommendation to ask how the patient is feeling.
Fifth, our poststudy survey was conducted 6 months after the observations were performed, used an ordinal rather than continuous response scale, and was limited to only 1 of the 2 programs and 9 of the 29 participants. Given this small sample size, generalizability of the results is limited. Additionally, intern practice of etiquette‐based communication may have improved between the observations and survey that took place 6 months later.
As hospital admissions are a time of vulnerability for patients, physicians can take a basic etiquette‐based communication approach to comfort patients and help them feel more secure. We found that even though interns believed they were practicing Kahn's recommended etiquette‐based communication, only a minority actually were. Curricula on communication styles or environmental changes, such as providing chairs in patient rooms or photographs identifying members of the medical team, may encourage performance of these behaviors.[15]
Acknowledgments
The authors acknowledge Dr. Lisa Cooper, MD, MPH, and Dr. Mary Catherine Beach, MD, MPH, who provided tremendous help in editing. The authors also thank Kevin Wang, whose assistance with observer hiring, training, and management was essential.
Disclosures: The Osler Center for Clinical Excellence at Johns Hopkins and the Johns Hopkins Hospitalist Scholars Fund provided stipends for our observers as well as transportation and logistical costs of the study. The authors report no conflicts of interest.
- , , . Physician‐patient communication in the primary care office: a systematic review. J Am Board Fam Pract. 2002;15:25–38.
- , . Physicians' nonverbal rapport building and patients' talk about the subjective component of illness. Hum Commun Res. 2001;27:299–311.
- , , , , . Can 40 seconds of compassion reduce patient anxiety? J Clin Oncol. 1999;17:371–379.
- , , , . House staff nonverbal communication skills and patient satisfaction. J Gen Intern Med. 2003;18:170–174.
- . Etiquette‐based medicine. N Engl J Med. 2008;358:1988–1989.
- , , . Patient satisfaction associated with correct identification of physician's photographs. Mayo Clin Proc. 2001;76:604–608.
- . Effective physician‐patient communication and health outcomes: a review. CMAJ. 1995;152:1423–1433.
- , , , . Patients' attitudes to comforting touch in family practice. Can Fam Physician. 2000;46:2411–2416.
- , , , et al. Impact of physician sitting versus standing during inpatient oncology consultations: patients' preference and perception of compassion and duration. A randomized controlled trial. J Pain Symptom Manage. 2005;29:489–497.
- , , , , . Appraising the practice of etiquette‐based medicine in the inpatient setting. J Gen Intern Med. 2013;28(7):908–913.
- , , , , , . Ability of hospitalized patients to identify their in‐hospital physicians. Arch Intern Med. 2009;169:199–201.
- , , . The content of internal medicine residency training and its relevance to the practice of medicine. J Gen Intern Med. 1989;4:304–308.
- , . Which values to attending physicians try to pass on to house officers? Med Educ. 2001;35:941–945.
- , , , , , . Relationship of resident characteristics, attitudes, prior training, and clinical knowledge to communication skills performance. Med Educ. 2006;40:18–25.
- , , , . PHACES (Photographs of academic clinicians and their educational status): a tool to improve delivery of family‐centered care. Acad Pediatr. 2010;10:138–145.
Patient‐centered communication may impact several aspects of the patientdoctor relationship including patient disclosure of illness‐related information, patient satisfaction, anxiety, and compliance with medical recommendations.[1, 2, 3, 4] Etiquette‐based medicine, a term coined by Kahn, involves simple patient‐centered communication strategies that convey professionalism and respect to patients.[5] Studies have confirmed that patients prefer physicians who practice etiquette‐based medicine behaviors, including sitting down and introducing one's self.[6, 7, 8, 9] Performance of etiquette‐based medicine is associated with higher Press Ganey patient satisfaction scores. However, these easy‐to‐practice behaviors may not be modeled commonly in the inpatient setting.[10] We sought to understand whether etiquette‐based communication behaviors are practiced by trainees on inpatient medicine rotations.
METHODS
Design
This was a prospective study incorporating direct observation of intern interactions with patients during January 2012 at 2 internal medicine residency programs in Baltimore Maryland, Johns Hopkins Hospital (JHH) and the University of Maryland Medical Center (UMMC). We then surveyed participants from JHH in June 2012 to assess perceptions of their practice of etiquette‐based communication.
Participants and Setting
We observed a convenience sample of 29 internal medicine interns from the 2 institutions. We sought to observe interns over an equal number of hours at both sites and to sample shifts in proportion to the amount of time interns spend on each of these shifts. All interns who were asked to participate in the study agreed and comprised a total of 27% of the 108 interns in the 2 programs. The institutional review board at Johns Hopkins School of Medicine approved the study; the University of Maryland institutional review board deemed it not human subjects research. All observed interns provided informed consent to be observed during 1 to 4 inpatient shifts.
Observers
Twenty‐two undergraduate university students served as the observers for the study and were trained to collect data with the iPod Touch (Apple, Cupertino, CA) without interrupting patient care. We then tested the observers to ensure 85% concordance rate with the researchers in mock observation. Four hours of quality assurance were completed at both institutions during the study. Congruence between observer and research team member was >85% for each hour of observation.
Observation
Observers recorded intern activities on the iPod Touch spreadsheet application. The application allowed for real‐time data entry and direct export of results. The primary dependent variables for this study were 5 behaviors that were assessed each time an intern went into a patient's room. The 5 observed behaviors included (1) introducing one's self, (2) introducing one's role on the medical team, (3) touching the patient, (4) sitting down, and (5) asking the patient at least 1 open‐ended question. These behaviors were chosen for observation because they are central to Kahn's framework of etiquette‐based medicine, applicable to each inpatient encounter, and readily observed by trained nonmedical observers. These behaviors are defined in Table 1. Use of open‐ended questions was observed as a more general form of Kahn's recommendation to ask how the patient is feeling. Interns were not aware of which behaviors were being evaluated.
| Behavior | Definition |
|---|---|
| Introduced self | Providing a name |
| Introduced role | Uses term doctor, resident, intern, or medical team |
| Sat down | Sitting on the bed, in a chair, or crouching if no chair was available during at least part of the encounter |
| Touched the patient | Any form of physical contact that occurred at least once during the encounter including shaking a patient's hand, touching a patient on the shoulder, or performing any part of the physical exam |
| Asked open‐ended question | Asked the patient any question that required more than a yes/no answer |
Each time an observed intern entered a patient room, the observer recorded whether or not each of the 5 behaviors was performed, coded as a dichotomous variable. Although data collection was anonymous, observers recorded the team, hospital site, gender of the intern, and whether the intern was admitting new patients during the shift.
Survey
Following the observational portion of the study, participants at JHH completed a cross‐sectional, anonymous survey that asked them to estimate how frequently they currently performed each of the behaviors observed in this study. Response options included the following categories: 20%, 20% to 40%, 40% to 60%, 60% to 80%, or 80% to 100%.
Data Analysis
We determined the percent of patient visits during which each behavior was performed. Data were analyzed using Student t and [2] tests evaluating differences by hospital, intern gender, type of shift, and time of day. To account for correlation within subjects and observers, we performed multilevel logistic regression analysis adjusted for clustering at the intern and observer levels. For the survey analysis, the mean of the response category was used as the basis for comparison. All quantitative analyses were performed in Excel 2010 (Microsoft Corp., Redmond, WA) and Stata/IC version 11 (StataCorp, College Station, TX).
RESULTS
A total of 732 inpatient encounters were observed during 118 intern shifts. Interns were observed for a mean of 25 patient encounters each (range, 361; standard deviation [SD] 17). Overall, interns introduced themselves 40% of the time and stated their role 37% of the time (Table 2). Interns touched patients on 65% of visits, sat down with patients during 9% of visits, and asked open‐ended questions on 75% of visits. Interns performed all 5 of the behaviors during 4% of the total encounters. The percentage of the 5 behaviors performed by each intern during all observed visits ranged from 24% to 100%, with a mean of 51% (SD 17%) per intern.
| Total Encounters, N (%) | Introduced Self (%) | Introduced Role (%) | Touched Patient (%) | Sat Down (%) | Open‐Ended Question (%) | |
|---|---|---|---|---|---|---|
| ||||||
| Overall | 732 | 40 | 37 | 65 | 9 | 75 |
| JHH | 373 (51) | 35ab | 29ab | 62a | 10 | 70a |
| UMMC | 359 (49) | 45 | 44 | 69 | 8 | 81 |
| Male | 284 (39) | 39 | 35 | 64 | 9 | 74 |
| Female | 448 (61) | 41 | 38 | 67 | 10 | 76 |
| Day shift | 551 (75) | 37a | 34a | 65 | 9 | 77 |
| Night shift | 181 (25) | 48 | 45 | 67 | 12 | 71 |
| Admitting shift | 377 (52) | 46a | 42a | 63 | 10 | 75 |
| Nonadmitting shift | 355 (48) | 34 | 30 | 69 | 9 | 76 |
During night shifts as compared to day shifts, interns were more likely to introduce themselves (48% vs 37%, P=0.01) and their role (45% vs 34%, P0.01). During shifts in which they admitted patients as compared to coverage shifts, interns were more likely to introduce themselves (46% vs 34%, P0.01) and their role (42% vs 30%, P0.01). Interns at UMMC as compared to JHH interns were more likely to introduce themselves (45% vs 35%, P0.01) and describe their role to patients (44% vs 29%, P0.01). Interns at UMMC were also more likely to ask open‐ended questions (81% vs 70%, P0.01) and to touch patients (69% vs 62%, P=0.04). Performance of these behaviors did not vary significantly by gender, time of day, or shift. After adjustment for clustering at the observer and intern levels, differences by institution persisted in the rate of introducing oneself and one's role.
We performed a sensitivity analysis examining the first patient encounters of the day, and found that interns were somewhat more likely to introduce themselves (50% vs 40%, P=0.03) but were not significantly more likely to introduce their role, sit down, ask open‐ended questions, or touch the patient.
Nine of the 10 interns at JHH who participated in the study completed the survey (response rate=90%). Interns estimated introducing themselves and their role and sitting with patients significantly more frequently than was observed (80% vs 40%, P0.01; 80% vs 37%, P0.01; and 58% vs 9%, P0.01, respectively) (Figure 1).
DISCUSSION
The interns we observed in 2 urban academic internal medicine residency programs did not routinely practice etiquette‐based communication. Interns surveyed tended to overestimate their performance of these behaviors. These behaviors are simple to perform and are each associated with improved patient experiences of hospital care. Tackett et al. recently demonstrated that interns are not alone. Hospitalist physicians do not universally practice etiquette‐based medicine, even though these behaviors correlate with patient satisfaction scores.[10]
Introducing oneself to patients may improve patient satisfaction and acceptance of trainee involvement in care.[6] However, only 10% of hospitalized patients in 1 study correctly identified a physician on their inpatient team, demonstrating the need for introductions during each and every inpatient encounter.[11] The interns we observed introduced themselves to patients in only 40% of encounters. During admitting shifts, when the first encounter with a patient likely took place, interns introduced themselves during 46% of encounters.
A comforting touch has been shown to reduce anxiety levels among patients and improve compliance with treatment regimens, but the interns did not touch patients in one‐third of visits, including during admitting shifts. Sixty‐six percent of patients consider a physician's touch comforting, and 58% believe it to be healing.[8]
A randomized trial found that most patients preferred a sitting physician, and believed that practitioners who sat were more compassionate and spent more time with them.[9] Unfortunately, interns sat down with patients in fewer than 10% of encounters.
We do not know why interns do not engage in these simple behaviors, but it is not surprising given that their role models, including hospitalist physicians, do not practice them universally.[10] Personality differences, medical school experiences, and hospital factors such as patient volume and complexity may explain variability in performance.
Importantly, we know that habits learned in residency tend to be retained when physicians enter independent practice.[12] If we want attending physicians to practice etiquette‐based communication, then it must be role modeled, taught, and evaluated during residency by clinical educators and hospitalist physicians. The gap between intern perceptions and actual practice of these behaviors provides a window of opportunity for education and feedback in bedside communication. Attending physicians rate communication skills as 1 of the top values they seek to pass on to house officers.[13] Curricula on communication skills improve physician attitudes and beliefs about the importance of good communication as well as long‐term performance of communication skills.[14]
Our study had several limitations. First, all 732 patient encounters were assessed, regardless of whether the intern had seen the patient previously. This differed slightly from Kahn's assertion that these behaviors be performed at least on the first encounter with the patient. We believe that the need for common courtesy does not diminish after the first visit, and although certain behaviors may not be indicated on 100% of visits, our sensitivity analysis indicated performance of these behaviors was not likely even on the first visit of the day.
Second, our observations were limited to medicine interns at 2 programs in Baltimore during a single month, limiting generalizability. A convenience sample of interns was chosen for recruitment based on rotation on a general medicine rotation during the study month. We observed interns over the course of several shifts and throughout various positions in the call cycle.
Third, in any observational study, the Hawthorne effect is a potential limitation. We attempted to limit this bias by collecting information anonymously and not indicating to the interns which aspects of the patient encounter were being recorded.
Fourth, we defined the behaviors broadly in an attempt to measure the outcomes conservatively and maximize inter‐rater reliability. For instance, we did not differentiate in data collection between comforting touch and physical examination. Because chairs may not be readily available in all patient rooms, we included sitting on the patient's bed or crouching next to the bed as sitting with the patient. Use of open‐ended questions was observed as a more general form of Kahn's recommendation to ask how the patient is feeling.
Fifth, our poststudy survey was conducted 6 months after the observations were performed, used an ordinal rather than continuous response scale, and was limited to only 1 of the 2 programs and 9 of the 29 participants. Given this small sample size, generalizability of the results is limited. Additionally, intern practice of etiquette‐based communication may have improved between the observations and survey that took place 6 months later.
As hospital admissions are a time of vulnerability for patients, physicians can take a basic etiquette‐based communication approach to comfort patients and help them feel more secure. We found that even though interns believed they were practicing Kahn's recommended etiquette‐based communication, only a minority actually were. Curricula on communication styles or environmental changes, such as providing chairs in patient rooms or photographs identifying members of the medical team, may encourage performance of these behaviors.[15]
Acknowledgments
The authors acknowledge Dr. Lisa Cooper, MD, MPH, and Dr. Mary Catherine Beach, MD, MPH, who provided tremendous help in editing. The authors also thank Kevin Wang, whose assistance with observer hiring, training, and management was essential.
Disclosures: The Osler Center for Clinical Excellence at Johns Hopkins and the Johns Hopkins Hospitalist Scholars Fund provided stipends for our observers as well as transportation and logistical costs of the study. The authors report no conflicts of interest.
- , , . Physician‐patient communication in the primary care office: a systematic review. J Am Board Fam Pract. 2002;15:25–38.
- , . Physicians' nonverbal rapport building and patients' talk about the subjective component of illness. Hum Commun Res. 2001;27:299–311.
- , , , , . Can 40 seconds of compassion reduce patient anxiety? J Clin Oncol. 1999;17:371–379.
- , , , . House staff nonverbal communication skills and patient satisfaction. J Gen Intern Med. 2003;18:170–174.
- . Etiquette‐based medicine. N Engl J Med. 2008;358:1988–1989.
- , , . Patient satisfaction associated with correct identification of physician's photographs. Mayo Clin Proc. 2001;76:604–608.
- . Effective physician‐patient communication and health outcomes: a review. CMAJ. 1995;152:1423–1433.
- , , , . Patients' attitudes to comforting touch in family practice. Can Fam Physician. 2000;46:2411–2416.
- , , , et al. Impact of physician sitting versus standing during inpatient oncology consultations: patients' preference and perception of compassion and duration. A randomized controlled trial. J Pain Symptom Manage. 2005;29:489–497.
- , , , , . Appraising the practice of etiquette‐based medicine in the inpatient setting. J Gen Intern Med. 2013;28(7):908–913.
- , , , , , . Ability of hospitalized patients to identify their in‐hospital physicians. Arch Intern Med. 2009;169:199–201.
- , , . The content of internal medicine residency training and its relevance to the practice of medicine. J Gen Intern Med. 1989;4:304–308.
- , . Which values to attending physicians try to pass on to house officers? Med Educ. 2001;35:941–945.
- , , , , , . Relationship of resident characteristics, attitudes, prior training, and clinical knowledge to communication skills performance. Med Educ. 2006;40:18–25.
- , , , . PHACES (Photographs of academic clinicians and their educational status): a tool to improve delivery of family‐centered care. Acad Pediatr. 2010;10:138–145.
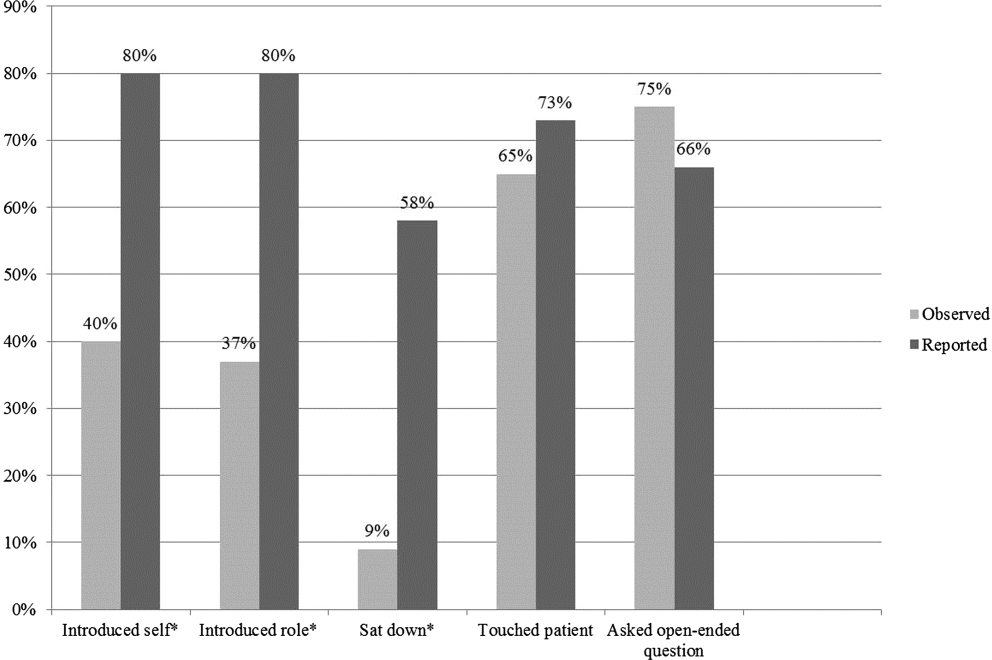
Pediatric to Adult‐Care Transitions
Over the last 40 years, innovations in medical care have dramatically improved the survival rates of children born with chronic illness or disabling health conditions; more than 90% are now expected to live beyond age 20 years, with approximately 500,000 reaching age 18 years every year.[1] The subset of these children with complex chronic disease use significant inpatient resources, accounting for 19.2% of pediatric inpatients, 48.9% of total pediatric hospital days, and 53.2% of pediatric hospital charges.[2, 3] This trend for high inpatient utilization and cost continues as the population ages, posing a potentially significant burden on pediatric hospitals.[4, 5] To reserve their specialized services for children, many pediatric hospitals impose age cutoffs for inpatient care; a national survey showed that 67% to 75% of patients over age 18 years with 4 specific chronic conditions (congenital heart disease [CHD], cystic fibrosis [CF], sickle cell disease [SCD], and spina bifida) were admitted to adult‐centered hospitals, as opposed to those providing exclusively pediatric or mixed services.[6] Admission rates for some conditions are growing faster in adults than in children, possibly due to increasing comorbidities with age.[7]
Although outpatient general internists indicated agreement that young adults with chronic diseases of childhood onset (CDoCO) should receive adult‐centered care, a majority did not feel comfortable providing it, or indicated a subspecialist should serve as the primary care provider.[8] Internal medicine residents also cite discomfort both with inpatient and outpatient management of patients with childhood onset illnesses and developmental disabilities.[9]
Due to their practice focus and the high inpatient utilization of this transitioning population, hospitalists will increasingly care for these adults. Academic hospitalists play an important role in medical education on the wards and can facilitate internal medicine residents learning about these patients. To date, no needs assessment has been completed regarding adult‐centered hospitalist perspectives regarding this population. This exploratory survey was designed to investigate adult hospitalist comfort level and concerns in caring for adults with CDoCO to guide potential educational interventions and improve care for this vulnerable population.
METHODS
Participants
We developed a survey for adult‐centered hospitalists to investigate comfort level with caring for adults with CDoCO and barriers to care that could be targets of educational and policy intervention. It was piloted with a small group of internal medicine (IM)‐trained and combined medicinepediatrics (MP)‐trained hospitalists for feedback regarding question clarity. The on‐line survey was emailed during July/August 2012 to the Society of Hospital Medicine (SHM) membership, which consisted of 11,218 hospital‐based providers and staff, of whom 61.7% identify as IM, 2.9% MP, 7.9% family medicine (FM), 3.4% pediatrics, and 24.1% other/no information. The survey was approved by our institutional review board, and was voluntary and anonymous with consent implied by participation; it was reintroduced twice to maximize response rates.
Survey
To gauge comfort level and support for hospitalists caring for adults with CDoCO, hospitalists rated their agreement with the statements I feel comfortable caring for adults with CDoCO and If I have a disease‐specific question on an adult with a CDoCO, I know who to call on a 4‐point Likert scale. They rated 14 potential barriers related to caring for this population on a 4‐point Likert scale as having no impact on ability to provide care to having great impact on care. The barriers were categorized into 3 areas: medical competence, care coordination, and psychosocial issues. Potential barriers were adapted from an outpatient survey of general internists and tailored for inpatient practice.[10] Respondents estimated the number of adults with CDoCO they had cared for in the prior 6‐month period and how often this population had a primary care provider.
RESULTS
Of the email requests delivered, 2713 were opened during the initial wave and 2535 during the second wave. A total of 179 respondents completed the survey.
Demographics
The specialty distribution represents similar proportion of IM‐ but higher FM‐ and MP‐trained providers than the general SHM membership. Two percent noted primary pediatric training; these responses were excluded given the survey focus on providers with some adult‐centered training. Just over 60% identified their primary practice as community‐based, with the remainder in academic practice (Table 1).
| Demographic | No. of Respondents (%)a |
|---|---|
| |
| Gender | |
| Male | 71 (40) |
| Female | 106 (60) |
| Residency training | |
| Internal medicine | 122 (68) |
| Family medicine | 30 (17) |
| Medicine‐pediatrics | 22 (12) |
| Pediatrics | 2 (1) |
| Provider type | |
| Physician | 176 (98) |
| NP/PA | 3 (2) |
| Practice type | |
| Academic | 68 (39) |
| Community | 107 (61) |
| Fellowship | |
| Yes | 30 (17) |
| No | 147 (83) |
| Years in practice | |
| 6 or less | 90 (50) |
| 7 or more | 89 (50) |
| Nearest pediatric hospital | |
| At site of practice | 87 (49) |
| 20 miles away | 58 (33) |
| >20 miles away | 32 (18) |
| Unsure | 1 (1) |
Experience, Comfort Level, and Support
Nearly 60% of all respondents saw 5 or more adults with CDoCO over a 6‐month period, with 16% of IM respondents, 31% of MP respondents, and 23% of FM respondents seeing more than 15 patients. Among IM respondents, 40% reported that they did not feel comfortable caring for this population, compared to 5% of MP and 14% of FM respondents; overall 20% of respondents strongly agreed they were comfortable caring for these patients. Respondents with 6 or less years in practice reported less discomfort (25%) than those practicing 7 years or more (40%). Community‐based providers reported high exposure, with 59% seeing more than 15 patients in 6 months, but similar discomfort levels, with 38% not feeling comfortable providing care. Additionally, 30% of all respondents did not know who to contact with a disease‐specific question.
Barriers to Care
Among IM providers, lack of familiarity with the literature, lack of training in CDoCO, coordinating with multiple specialists, and lack of training in adolescent development and behavior ranked as the most significant barriers to care (Table 2). Difficulty finding outpatient providers was also noted as a concern by all respondents, and 44% reported that these patients had an identified primary care provider less than half of the time.
| Statement | Average Likert(IM Only) | Average Likert (Overall) | Category |
|---|---|---|---|
| |||
| Lack of familiarity with the latest literature on specific illnesses | 2.82 | 2.67 | MC |
| Lack of training in CDoCO | 2.64 | 2.45 | MC |
| Difficulty meeting psychosocial needs of young adults with CDoCO | 2.53 | 2.46 | PS |
| Lack of training in adolescent development and behavior | 2.53 | 2.26 | MC |
| Difficulty coordinating with multiple specialists to manage complex problem | 2.52 | 2.47 | MC/CC |
| Difficulty finding outpatient providers to follow up | 2.50 | 2.50 | CC |
| Expectations for significant time/attention needed for proper care | 2.41 | 2.36 | PS |
| Lack of patients'/families' familiarity with adult healthcare systems | 2.40 | 2.37 | CC |
| Lack of physician and patients'/families' familiarity with available outpatient providers to follow up | 2.40 | 2.45 | CC |
| Difficulty assessing patient readiness to assume responsibility for medical plan | 2.38 | 2.20 | PS |
| Difficulty coordinating transitions from pediatric caregivers | 2.37 | 2.40 | CC |
| Difficulty balancing family involvement and patient independence/privacy | 2.36 | 2.27 | PS |
| Difficulty facing severe disability in young patients | 2.18 | 2.02 | PS |
| Reluctance of pediatricians to let go of their patients | 1.68 | 1.73 | CC |
Whereas the majority of respondents cited meeting psychosocial needs as impacting their ability to provide care, additional questions addressing specific psychosocial tasks were not highly ranked.
DISCUSSION
In keeping with the increasing survival of children with chronic disease, a majority of hospitalists participating in adult‐centered settings were caring for adults with CDoCO. Despite their responsibility for these patients, a large proportion of both IM‐trained and community‐based providers in all specialties did not feel comfortable caring for them. These results correlate with an outpatient survey that showed less than a third of IM providers felt comfortable caring for specific CDoCO (CHD, SCD, CF).[8] The increased comfort of FM and MP hospitalists is consistent with their additional training in pediatric disease and development; however, a majority of hospitalists continue to be IM trained, highlighting the need for intervention for these providers. Increased comfort among providers closer to residency may reflect increased exposure to this growing population during training or fledgling educational initiatives.
Among IM providers, medical competence in adolescent development, behavior, and disease‐specific issues emerged as major concerns, likely compounded by insufficient subspecialty access. Outpatient internists similarly report insufficient training as a top barrier, although clinic‐based issues, such as lack of appointment time and reimbursement, were also highly rated.[10, 11] This survey indicates that educational initiatives should include hospitalists and highlights access to a medical knowledge base and disease‐specific support. Although specific training in all conditions would be out of the scope for most busy practitioners, targeting common conditions and issues, such as developmental disability and supportive devices, would be high yield. Extending educational interventions into trainee education has been postulated and well received by IM residents, who favor a multidimensional curricula in which hospitalists can play an important part.[12]
IM providers cited identifying partnering providers, both subspecialists and outpatient providers, to support ongoing care as a secondary theme. An outpatient survey of pediatric and IM providers showed at least half felt identifying an adult‐centered primary care provider would be difficult and care coordination inadequate; poor outpatient subspecialty access for common conditions was less prevalent.[11] The discomfort of outpatient IM providers may be limiting; however, early identification of need, improved coordination throughout inpatient stay, and discharge planning could ease this transition for all providers. Care coordination support staff would benefit from familiarizing themselves with this population's needs, which are different from typical adult inpatients. Even though meeting psychosocial needs was a highly rated barrier, clarifying questions about those needs did not show a pattern in this or prior outpatient surveys, limiting targeted interventions.
Engaging the community of adult‐centered providers is key to providing appropriate health care services that continue uninterrupted as the individual moves from adolescence to adulthood as charged by a joint consensus statement on transition of patients with CDoCO.[13] Overall comfort level is likely affected by the interaction between insufficient knowledge base on CDoCO and perception of insufficient subspecialty support or unclear outpatient follow‐up. Future directions should center on curricular development surrounding high‐yield CDoCO topics and improved inpatient care coordination.
Limitations
This survey is limited by the low response rate, raising the possibility that responses may not be fully representative of the national sample. Low response rate was likely due in part to email alert fatigue, as the number of survey requests opened represented a significant drop from those delivered. Poor response may also be due to low recognition for this population, another indicator that education and increased awareness are needed. Although decreased responses by providers who are comfortable with this population could also play a role, the correlation between our survey findings and those of prior outpatient surveys support our findings.
CONCLUSIONS
The steadily growing population of adults with CDoCO and their high inpatient utilization have lead to increased care by adult‐centered hospitalists, many of whom do not feel comfortable caring for them. Educational initiatives aimed at increasing the medical knowledge base for common issues, training in adolescent development, increased care coordination, and access to address psychosocial issues would improve hospitalist comfort and patient care for this vulnerable population.
- , . Health care transition: destinations unknown. Pediatrics. 2002;110:1307–1314.
- , , , et al. Trends in resource utilization by children with neurological impairment in the United States inpatient health care system: a repeat cross‐sectional study. PLoS Med. 2012;9(1):e1001158.
- , , , et al Effect of hospital‐based comprehensive care clinic on health costs for Medicaid‐insured medically complex children. Arch Pediatr Adolesc Med. 2011;165(5):392–398.
- , , , , . Acute care utilization and rehospitalizations for sickle cell disease. JAMA. 2010;303(13):1288–1294.
- , , , . Adult survivors of pediatric illness: the impact on pediatric hospitals. Pediatrics. 2002;110(3):583–589.
- , , , . Inpatient health care use among adult survivors of chronic childhood illnesses in the United States. Arch Pediatr Adolesc Med. 2006;160:1054–1060.
- , , , , . The changing demographics of congenital heart disease hospitalizations in the United States, 1998 through 2010. JAMA. 2013;309(10):984–986.
- , , , , , . Comfort of general internists and general pediatricians in providing care for young adults with chronic illnesses of childhood. J Gen Intern Med. 2008;23(10):1621–1627.
- , . Residency training in transition of youth with childhood‐onset chronic disease. Pediatrics. 2010;126:S190–S193.
- , , , . Transition from pediatric to adult care: internist's perspectives. Pediatrics. 2009;123:417–423.
- , , , , , . Physician views on barriers to primary care for young adults with childhood‐onset chronic disease. Pediatrics. 2010;125:e748.
- . Resident preferences for a curriculum in health care transitions for young adults. South Med J. 2012;105(9):462–466.
- American Academy of Pediatrics, American Academy of Family Physicians, American College of Physicians–American Society of Internal Medicine. A consensus statement on health care transitions for young adults with special health care needs. Pediatrics. 2002;110(6 pt 2):1304–1306.
Over the last 40 years, innovations in medical care have dramatically improved the survival rates of children born with chronic illness or disabling health conditions; more than 90% are now expected to live beyond age 20 years, with approximately 500,000 reaching age 18 years every year.[1] The subset of these children with complex chronic disease use significant inpatient resources, accounting for 19.2% of pediatric inpatients, 48.9% of total pediatric hospital days, and 53.2% of pediatric hospital charges.[2, 3] This trend for high inpatient utilization and cost continues as the population ages, posing a potentially significant burden on pediatric hospitals.[4, 5] To reserve their specialized services for children, many pediatric hospitals impose age cutoffs for inpatient care; a national survey showed that 67% to 75% of patients over age 18 years with 4 specific chronic conditions (congenital heart disease [CHD], cystic fibrosis [CF], sickle cell disease [SCD], and spina bifida) were admitted to adult‐centered hospitals, as opposed to those providing exclusively pediatric or mixed services.[6] Admission rates for some conditions are growing faster in adults than in children, possibly due to increasing comorbidities with age.[7]
Although outpatient general internists indicated agreement that young adults with chronic diseases of childhood onset (CDoCO) should receive adult‐centered care, a majority did not feel comfortable providing it, or indicated a subspecialist should serve as the primary care provider.[8] Internal medicine residents also cite discomfort both with inpatient and outpatient management of patients with childhood onset illnesses and developmental disabilities.[9]
Due to their practice focus and the high inpatient utilization of this transitioning population, hospitalists will increasingly care for these adults. Academic hospitalists play an important role in medical education on the wards and can facilitate internal medicine residents learning about these patients. To date, no needs assessment has been completed regarding adult‐centered hospitalist perspectives regarding this population. This exploratory survey was designed to investigate adult hospitalist comfort level and concerns in caring for adults with CDoCO to guide potential educational interventions and improve care for this vulnerable population.
METHODS
Participants
We developed a survey for adult‐centered hospitalists to investigate comfort level with caring for adults with CDoCO and barriers to care that could be targets of educational and policy intervention. It was piloted with a small group of internal medicine (IM)‐trained and combined medicinepediatrics (MP)‐trained hospitalists for feedback regarding question clarity. The on‐line survey was emailed during July/August 2012 to the Society of Hospital Medicine (SHM) membership, which consisted of 11,218 hospital‐based providers and staff, of whom 61.7% identify as IM, 2.9% MP, 7.9% family medicine (FM), 3.4% pediatrics, and 24.1% other/no information. The survey was approved by our institutional review board, and was voluntary and anonymous with consent implied by participation; it was reintroduced twice to maximize response rates.
Survey
To gauge comfort level and support for hospitalists caring for adults with CDoCO, hospitalists rated their agreement with the statements I feel comfortable caring for adults with CDoCO and If I have a disease‐specific question on an adult with a CDoCO, I know who to call on a 4‐point Likert scale. They rated 14 potential barriers related to caring for this population on a 4‐point Likert scale as having no impact on ability to provide care to having great impact on care. The barriers were categorized into 3 areas: medical competence, care coordination, and psychosocial issues. Potential barriers were adapted from an outpatient survey of general internists and tailored for inpatient practice.[10] Respondents estimated the number of adults with CDoCO they had cared for in the prior 6‐month period and how often this population had a primary care provider.
RESULTS
Of the email requests delivered, 2713 were opened during the initial wave and 2535 during the second wave. A total of 179 respondents completed the survey.
Demographics
The specialty distribution represents similar proportion of IM‐ but higher FM‐ and MP‐trained providers than the general SHM membership. Two percent noted primary pediatric training; these responses were excluded given the survey focus on providers with some adult‐centered training. Just over 60% identified their primary practice as community‐based, with the remainder in academic practice (Table 1).
| Demographic | No. of Respondents (%)a |
|---|---|
| |
| Gender | |
| Male | 71 (40) |
| Female | 106 (60) |
| Residency training | |
| Internal medicine | 122 (68) |
| Family medicine | 30 (17) |
| Medicine‐pediatrics | 22 (12) |
| Pediatrics | 2 (1) |
| Provider type | |
| Physician | 176 (98) |
| NP/PA | 3 (2) |
| Practice type | |
| Academic | 68 (39) |
| Community | 107 (61) |
| Fellowship | |
| Yes | 30 (17) |
| No | 147 (83) |
| Years in practice | |
| 6 or less | 90 (50) |
| 7 or more | 89 (50) |
| Nearest pediatric hospital | |
| At site of practice | 87 (49) |
| 20 miles away | 58 (33) |
| >20 miles away | 32 (18) |
| Unsure | 1 (1) |
Experience, Comfort Level, and Support
Nearly 60% of all respondents saw 5 or more adults with CDoCO over a 6‐month period, with 16% of IM respondents, 31% of MP respondents, and 23% of FM respondents seeing more than 15 patients. Among IM respondents, 40% reported that they did not feel comfortable caring for this population, compared to 5% of MP and 14% of FM respondents; overall 20% of respondents strongly agreed they were comfortable caring for these patients. Respondents with 6 or less years in practice reported less discomfort (25%) than those practicing 7 years or more (40%). Community‐based providers reported high exposure, with 59% seeing more than 15 patients in 6 months, but similar discomfort levels, with 38% not feeling comfortable providing care. Additionally, 30% of all respondents did not know who to contact with a disease‐specific question.
Barriers to Care
Among IM providers, lack of familiarity with the literature, lack of training in CDoCO, coordinating with multiple specialists, and lack of training in adolescent development and behavior ranked as the most significant barriers to care (Table 2). Difficulty finding outpatient providers was also noted as a concern by all respondents, and 44% reported that these patients had an identified primary care provider less than half of the time.
| Statement | Average Likert(IM Only) | Average Likert (Overall) | Category |
|---|---|---|---|
| |||
| Lack of familiarity with the latest literature on specific illnesses | 2.82 | 2.67 | MC |
| Lack of training in CDoCO | 2.64 | 2.45 | MC |
| Difficulty meeting psychosocial needs of young adults with CDoCO | 2.53 | 2.46 | PS |
| Lack of training in adolescent development and behavior | 2.53 | 2.26 | MC |
| Difficulty coordinating with multiple specialists to manage complex problem | 2.52 | 2.47 | MC/CC |
| Difficulty finding outpatient providers to follow up | 2.50 | 2.50 | CC |
| Expectations for significant time/attention needed for proper care | 2.41 | 2.36 | PS |
| Lack of patients'/families' familiarity with adult healthcare systems | 2.40 | 2.37 | CC |
| Lack of physician and patients'/families' familiarity with available outpatient providers to follow up | 2.40 | 2.45 | CC |
| Difficulty assessing patient readiness to assume responsibility for medical plan | 2.38 | 2.20 | PS |
| Difficulty coordinating transitions from pediatric caregivers | 2.37 | 2.40 | CC |
| Difficulty balancing family involvement and patient independence/privacy | 2.36 | 2.27 | PS |
| Difficulty facing severe disability in young patients | 2.18 | 2.02 | PS |
| Reluctance of pediatricians to let go of their patients | 1.68 | 1.73 | CC |
Whereas the majority of respondents cited meeting psychosocial needs as impacting their ability to provide care, additional questions addressing specific psychosocial tasks were not highly ranked.
DISCUSSION
In keeping with the increasing survival of children with chronic disease, a majority of hospitalists participating in adult‐centered settings were caring for adults with CDoCO. Despite their responsibility for these patients, a large proportion of both IM‐trained and community‐based providers in all specialties did not feel comfortable caring for them. These results correlate with an outpatient survey that showed less than a third of IM providers felt comfortable caring for specific CDoCO (CHD, SCD, CF).[8] The increased comfort of FM and MP hospitalists is consistent with their additional training in pediatric disease and development; however, a majority of hospitalists continue to be IM trained, highlighting the need for intervention for these providers. Increased comfort among providers closer to residency may reflect increased exposure to this growing population during training or fledgling educational initiatives.
Among IM providers, medical competence in adolescent development, behavior, and disease‐specific issues emerged as major concerns, likely compounded by insufficient subspecialty access. Outpatient internists similarly report insufficient training as a top barrier, although clinic‐based issues, such as lack of appointment time and reimbursement, were also highly rated.[10, 11] This survey indicates that educational initiatives should include hospitalists and highlights access to a medical knowledge base and disease‐specific support. Although specific training in all conditions would be out of the scope for most busy practitioners, targeting common conditions and issues, such as developmental disability and supportive devices, would be high yield. Extending educational interventions into trainee education has been postulated and well received by IM residents, who favor a multidimensional curricula in which hospitalists can play an important part.[12]
IM providers cited identifying partnering providers, both subspecialists and outpatient providers, to support ongoing care as a secondary theme. An outpatient survey of pediatric and IM providers showed at least half felt identifying an adult‐centered primary care provider would be difficult and care coordination inadequate; poor outpatient subspecialty access for common conditions was less prevalent.[11] The discomfort of outpatient IM providers may be limiting; however, early identification of need, improved coordination throughout inpatient stay, and discharge planning could ease this transition for all providers. Care coordination support staff would benefit from familiarizing themselves with this population's needs, which are different from typical adult inpatients. Even though meeting psychosocial needs was a highly rated barrier, clarifying questions about those needs did not show a pattern in this or prior outpatient surveys, limiting targeted interventions.
Engaging the community of adult‐centered providers is key to providing appropriate health care services that continue uninterrupted as the individual moves from adolescence to adulthood as charged by a joint consensus statement on transition of patients with CDoCO.[13] Overall comfort level is likely affected by the interaction between insufficient knowledge base on CDoCO and perception of insufficient subspecialty support or unclear outpatient follow‐up. Future directions should center on curricular development surrounding high‐yield CDoCO topics and improved inpatient care coordination.
Limitations
This survey is limited by the low response rate, raising the possibility that responses may not be fully representative of the national sample. Low response rate was likely due in part to email alert fatigue, as the number of survey requests opened represented a significant drop from those delivered. Poor response may also be due to low recognition for this population, another indicator that education and increased awareness are needed. Although decreased responses by providers who are comfortable with this population could also play a role, the correlation between our survey findings and those of prior outpatient surveys support our findings.
CONCLUSIONS
The steadily growing population of adults with CDoCO and their high inpatient utilization have lead to increased care by adult‐centered hospitalists, many of whom do not feel comfortable caring for them. Educational initiatives aimed at increasing the medical knowledge base for common issues, training in adolescent development, increased care coordination, and access to address psychosocial issues would improve hospitalist comfort and patient care for this vulnerable population.
- , . Health care transition: destinations unknown. Pediatrics. 2002;110:1307–1314.
- , , , et al. Trends in resource utilization by children with neurological impairment in the United States inpatient health care system: a repeat cross‐sectional study. PLoS Med. 2012;9(1):e1001158.
- , , , et al Effect of hospital‐based comprehensive care clinic on health costs for Medicaid‐insured medically complex children. Arch Pediatr Adolesc Med. 2011;165(5):392–398.
- , , , , . Acute care utilization and rehospitalizations for sickle cell disease. JAMA. 2010;303(13):1288–1294.
- , , , . Adult survivors of pediatric illness: the impact on pediatric hospitals. Pediatrics. 2002;110(3):583–589.
- , , , . Inpatient health care use among adult survivors of chronic childhood illnesses in the United States. Arch Pediatr Adolesc Med. 2006;160:1054–1060.
- , , , , . The changing demographics of congenital heart disease hospitalizations in the United States, 1998 through 2010. JAMA. 2013;309(10):984–986.
- , , , , , . Comfort of general internists and general pediatricians in providing care for young adults with chronic illnesses of childhood. J Gen Intern Med. 2008;23(10):1621–1627.
- , . Residency training in transition of youth with childhood‐onset chronic disease. Pediatrics. 2010;126:S190–S193.
- , , , . Transition from pediatric to adult care: internist's perspectives. Pediatrics. 2009;123:417–423.
- , , , , , . Physician views on barriers to primary care for young adults with childhood‐onset chronic disease. Pediatrics. 2010;125:e748.
- . Resident preferences for a curriculum in health care transitions for young adults. South Med J. 2012;105(9):462–466.
- American Academy of Pediatrics, American Academy of Family Physicians, American College of Physicians–American Society of Internal Medicine. A consensus statement on health care transitions for young adults with special health care needs. Pediatrics. 2002;110(6 pt 2):1304–1306.