User login
HCAHPS Patient Satisfaction Scores
Patient satisfaction surveys are widely used to empower patients to voice their concerns and point out areas of deficiency or excellence in the patient‐physician partnership and in the delivery of healthcare services.[1] In 2002, the Centers for Medicare and Medicaid Service (CMS) led an initiative to develop the Hospital Consumer Assessment of Healthcare Providers and Systems (HCAHPS) survey questionnaire.[2] This survey is sent to a randomly selected subset of patients after hospital discharge. The HCAHPS instrument assesses patient ratings of physician communication, nursing communication, pain control, responsiveness, room cleanliness and quietness, discharge process, and overall satisfaction. Over 4500 acute‐care facilities routinely use this survey.[3] HCAHPS scores are publicly reported, and patients can utilize these scores to compare hospitals and make informed choices about where to get care. At an institutional level, scores are used as a tool to identify and improve deficiencies in care delivery. Additionally, HCAHPS survey data results have been analyzed in numerous research studies.[4, 5, 6]
Specialty hospitals are a subset of acute‐care hospitals that provide a narrower set of services than general medical hospitals (GMHs), predominantly in a few specialty areas such as cardiac disease and surgical fields. Many specialty hospitals advertise high rates of patient satisfaction.[7, 8, 9, 10, 11] However, specialty hospitals differ from GMHs in significant ways. Patients at specialty hospitals may be less severely ill[10, 12] and may have more generous insurance coverage.[13] Many specialty hospitals do not have an emergency department (ED), and their outcomes may reflect care of relatively stable patients.[14] A significant number of the specialty hospitals are physician‐owned, which may provide an opportunity for physicians to deliver more patient‐focused healthcare.[14] It is also thought that specialty hospitals can provide high‐quality care by designing their facilities and service structure entirely to meet the needs of a narrow set of medical conditions.
HCAHPS survey results provide an opportunity to compare satisfaction scores among various types of hospitals. We analyzed national HCAHPS data to compare satisfaction scores of specialty hospitals and GMHs and identify factors that may be responsible for this difference.
METHODS
This was a cross‐sectional analysis of national HCAHPS survey data. The methods for administration and reporting of the HCAHPS survey have been described.[15] HCAHPS patient satisfaction data and hospital characteristics, such as location, presence of an ED, and for‐profit status, were obtained from Hospital Compare database. Teaching hospital status was identified using the CMS 2013 Open Payment teaching hospital listing.[16]
For this study, we defined specialty hospitals as acute‐care hospitals that predominantly provide care in a medical or surgical specialty and do not provide care to general medical patients. Based on this definition, specialty hospitals include cardiac hospitals, orthopedic and spine hospitals, oncology hospitals, and hospitals providing multispecialty surgical and procedure‐based services. Children's hospitals, long‐term acute‐care hospitals, and psychiatry hospitals were excluded.
Specialty hospitals were identified using hospital name searches in the HCAHPS database, the American Hospital Association 2013 Annual Survey, the Physician Hospital Association hospitals directory, and through contact with experts. The specialty hospital status of hospitals was further confirmed by checking hospital websites or by directly contacting the hospital.
We analyzed 3‐year HCAHPS patient satisfaction data that included the reporting period from July 2007 to June 2010. HCAHPS data are reported for 12‐month periods at a time. Hospital information, such as address, presence of an ED, and for‐profit status were obtained from the CMS Hospital Compare 2010 dataset. Teaching hospital status was identified using the CMS 2013 Open Payment teaching hospital listing.[16] For the purpose of this study, scores on the HCAHPS survey item definitely recommend the hospital was considered to represent overall satisfaction for the hospital. This is consistent with use of this measure in other sectors in the service industry.[17, 18] Other survey items were considered subdomains of satisfaction. For each hospital, the simple mean of satisfaction scores for overall satisfaction and each of the subdomains for the three 12‐month periods was calculated. Data were summarized using frequencies and meanstandard deviation. The primary dependent variable was overall satisfaction. The main independent variables were specialty hospital status (yes or no), teaching hospital status (yes or no), for‐profit status (yes or no), and the presence of an ED (yes or no). Multiple linear regression analysis was used to adjust for the above‐noted independent variables. A P value0.05 was considered significant. All analyses were performed on Stata 10.1 IC (StataCorp, College Station, TX).
RESULTS
We identified 188 specialty hospitals and 4638 GMHs within the HCAHPS dataset. Fewer specialty hospitals had emergency care services when compared with GMHs (53.2% for specialty hospitals vs 93.6% for GMHs, P0.0001), and 47.9% of all specialty hospitals were in states that do not require a Certificate of Need, whereas only 25% of all GMHs were present in these states. For example, Texas, which has 7.2% of all GMHs across the nation, has 24.7% of all specialty hospitals. As compared to GMHs, a majority of specialty hospitals were for profit (14.5% vs 66.9%).
In unadjusted analyses, specialty hospitals had significantly higher patient satisfaction scores compared with GMHs. Overall satisfaction, as measured by the proportion of patients that will definitely recommend that hospital, was 18.8% higher for specialty hospitals than GMHs (86.6% vs 67.8%, P0.0001). This was also true for subdomains of satisfaction including physician communication, nursing communication, and cleanliness (Table 1).
| Satisfaction Domains | GMH, Mean, n=4,638* | Specialty Hospital, Mean, n=188* | Unadjusted Mean Difference in Satisfaction (95% CI) | Mean Difference in Satisfaction Adjusted for Survey Response Rate (95% CI) | Mean Difference in Satisfaction for Full Adjusted Model (95% CI) |
|---|---|---|---|---|---|
| |||||
| Nurses always communicated well | 75.0% | 84.4% | 9.4% (8.310.5) | 4.0% (2.9‐5.0) | 5.0% (3.8‐6.2) |
| Doctors always communicated well | 80.0% | 86.5% | 6.5% (5.67.6) | 3.8% (2.8‐4.8) | 4.1% (3.05.2) |
| Pain always well controlled | 68.7% | 77.1% | 8.6% (7.79.6) | 4.5% (3.5‐4.5) | 4.6% (3.5‐5.6) |
| Always received help as soon as they wanted | 62.9% | 78.6% | 15.7% (14.117.4) | 7.8% (6.19.4) | 8.0% (6.39.7) |
| Room and bathroom always clean | 70.1% | 81.1% | 11.0% (9.612.4) | 5.5% (4.06.9) | 6.2% (4.7‐7.8) |
| Staff always explained about the medicines | 59.4% | 69.8% | 10.4 (9.211.5) | 5.8% (4.7‐6.9) | 6.5% (5.37.8) |
| Yes, were given information about what to do during recovery at home | 80.9% | 87.1% | 6.2% (5.57.0) | 1.4% (0.7‐2.1) | 2.0% (1.13.0) |
| Overall satisfaction (yes, patients would definitely recommend the hospital) | 67.8% | 86.6% | 18.8%(17.020.6) | 8.5% (6.910.2) | 8.6% (6.710.5) |
| Survey response rate | 32.2% | 49.6% | 17.4% (16.018.9) | ||
We next examined the effect of survey response rate. The survey response rate for specialty hospitals was on average 17.4 percentage points higher than that of GMHs (49.6% vs 32.2%, P0.0001). When adjusted for survey response rate, the difference in overall satisfaction for specialty hospitals was reduced to 8.6% (6.7%10.5%, P0.0001). Similarly, the differences in score for subdomains of satisfaction were more modest when adjusted for higher survey response rate. In the multiple regression models, specialty hospital status, survey response rate, for‐profit status, and the presence of an ED were independently associated with higher overall satisfaction, whereas teaching hospital status was not associated with overall satisfaction. Addition of for‐profit status and presence of an ED in the regression model did not change our results. Further, the satisfaction subdomain scores for specialty hospitals remained significantly higher than for GMHs in the regression models (Table 1).
DISCUSSION
In this national study, we found that specialty hospitals had significantly higher overall satisfaction scores on the HCAHPS satisfaction survey. Similarly, significantly higher satisfaction was noted across all the satisfaction subdomains. We found that a large proportion of the difference between specialty hospitals and GMHs in overall satisfaction and subdomains of satisfaction could be explained by a higher survey response rate in specialty hospitals. After adjusting for survey response rate, the differences were comparatively modest, although remained statistically significant. Adjustment for additional confounding variables did not change our results.
Studies have shown that specialty hospitals, when compared to GMHs, may treat more patients in their area of specialization, care for fewer sick and Medicaid patients, have greater physician ownership, and are less likely to have ED services.[11, 12, 13, 14] Two small studies comparing specialty hospitals to GMHs suggest that higher satisfaction with specialty hospitals was attributable to the presence of private rooms, quiet environment, accommodation for family members, and accessible, attentive, and well‐trained nursing staff.[10, 11] Although our analysis did not account for various other hospital and patient characteristics, we expect that these factors likely play a significant role in the observed differences in patient satisfaction.
Survey response rate can be an important determinant of the validity of survey results, and a response rate >70% is often considered desirable.[19, 20] However, the mean survey response rate for the HCAHPS survey was only 32.8% for all hospitals during the survey period. In the outpatient setting, a higher survey response rate has been shown to be associated with higher satisfaction rates.[21] In the hospital setting, a randomized study of a HCAHPS survey for 45 hospitals found that patient mix explained the nonresponse bias. However, this study did not examine the roles of severity of illness or insurance status, which may account for the differences in satisfaction seen between specialty hospitals and GMHs.[22] In contrast, we found that in the hospital setting, higher survey response rate was associated with higher patient satisfaction scores.
Our study has some limitations. First, it was not possible to determine from the dataset whether higher response rate is a result of differences in the patient population characteristics between specialty hospitals and GMHs or it represents the association between higher satisfaction and higher response rate noted by other investigators. Although we used various resources to identify all specialty hospitals, we may have missed some or misclassified others due to lack of a standardized definition.[10, 12, 13] However, the total number of specialty hospitals and their distribution across various states in the current study are consistent with previous studies, supporting our belief that few, if any, hospitals were misclassified.[13]
In summary, we found significant difference in satisfaction rates reported on HCAHPS in a national study of patients attending specialty hospitals versus GMHs. However, the observed differences in satisfaction scores were sensitive to differences in survey response rates among hospitals. Teaching hospital status, for‐profit status, and the presence of an ED did not appear to further explain the differences. Additional studies incorporating other hospital and patient characteristics are needed to fully understand factors associated with differences in the observed patient satisfaction between specialty hospitals and GMHs. Additionally, strategies to increase survey HCAHPS response rates should be a priority.
- About Picker Institute. Available at: http://pickerinstitute.org/about. Accessed September 24, 2012.
- HCAHPS Hospital Survey. Centers for Medicare 45(4):1024–1040.
- , . Consumers' use of HCAHPS ratings and word‐of‐mouth in hospital choice. Health Serv Res. 2010;45(6 pt 1):1602–1613.
- , , . Improving patient satisfaction in hospital care settings. Health Serv Manage Res. 2011;24(4):163–169.
- Live the life you want. Arkansas Surgical Hospital website. Available at: http://www.arksurgicalhospital.com/ash. Accessed September 24, 2012.
- Patient satisfaction—top 60 hospitals. Hoag Orthopedic Institute website. Available at: http://orthopedichospital.com/2012/06/patient‐satisfaction‐top‐60‐hospital. Accessed September 24, 2012.
- Northwest Specialty Hospital website. Available at: http://www.northwestspecialtyhospital.com/our‐services. Accessed September 24, 2012.
- , , , et al. Specialty versus community hospitals: referrals, quality, and community benefits. Health Affairs. 2006;25(1):106–118.
- Study of Physician‐Owned Specialty Hospitals Required in Section 507(c)(2) of the Medicare Prescription Drug, Improvement, and Modernization Act of 2003, May 2005. Available at: http://www.cms.gov/Medicare/Fraud‐and‐Abuse/PhysicianSelfReferral/Downloads/RTC‐StudyofPhysOwnedSpecHosp.pdf. Accessed June 16, 2014.
- Specialty Hospitals: Information on National Market Share, Physician Ownership and Patients Served. GAO: 03–683R. Washington, DC: General Accounting Office; 2003:1–20. Available at: http://www.gao.gov/new.items/d03683r.pdf. Accessed September 24, 2012.
- , , , . Insurance status of patients admitted to specialty cardiac and competing general hospitals: are accusations of cherry picking justified? Med Care. 2008;46:467–475.
- Specialty Hospitals: Geographic Location, Services Provided and Financial Performance: GAO‐04–167. Washington, DC: General Accounting Office; 2003:1–41. Available at: http://www.gao.gov/new.items/d04167.pdf. Accessed September 24, 2012.
- Centers for Medicare 9(4):5–17.
- , , . The relationship between customer satisfaction and loyalty: cross‐industry differences. Total Qual Manage. 2000;11(4‐6):509–514.
- , . Survey response rate levels and trends in organizational research. Hum Relat. 2008;61:1139–1160.
- , . Survey, cohort and case‐control studies. In: Design of Studies for Medical Research. Hoboken, NJ: John Wiley 2005:118–120.
- , , , , . A demonstration of the impact of response bias on the results of patient satisfaction surveys. Health Serv Res. 2002;37(5):1403–1417.
- , , , et al. Effects of survey mode, patient mix and nonresponse on CAHPS hospital survey scores. Health Serv Res. 2009;44:501–518.
Patient satisfaction surveys are widely used to empower patients to voice their concerns and point out areas of deficiency or excellence in the patient‐physician partnership and in the delivery of healthcare services.[1] In 2002, the Centers for Medicare and Medicaid Service (CMS) led an initiative to develop the Hospital Consumer Assessment of Healthcare Providers and Systems (HCAHPS) survey questionnaire.[2] This survey is sent to a randomly selected subset of patients after hospital discharge. The HCAHPS instrument assesses patient ratings of physician communication, nursing communication, pain control, responsiveness, room cleanliness and quietness, discharge process, and overall satisfaction. Over 4500 acute‐care facilities routinely use this survey.[3] HCAHPS scores are publicly reported, and patients can utilize these scores to compare hospitals and make informed choices about where to get care. At an institutional level, scores are used as a tool to identify and improve deficiencies in care delivery. Additionally, HCAHPS survey data results have been analyzed in numerous research studies.[4, 5, 6]
Specialty hospitals are a subset of acute‐care hospitals that provide a narrower set of services than general medical hospitals (GMHs), predominantly in a few specialty areas such as cardiac disease and surgical fields. Many specialty hospitals advertise high rates of patient satisfaction.[7, 8, 9, 10, 11] However, specialty hospitals differ from GMHs in significant ways. Patients at specialty hospitals may be less severely ill[10, 12] and may have more generous insurance coverage.[13] Many specialty hospitals do not have an emergency department (ED), and their outcomes may reflect care of relatively stable patients.[14] A significant number of the specialty hospitals are physician‐owned, which may provide an opportunity for physicians to deliver more patient‐focused healthcare.[14] It is also thought that specialty hospitals can provide high‐quality care by designing their facilities and service structure entirely to meet the needs of a narrow set of medical conditions.
HCAHPS survey results provide an opportunity to compare satisfaction scores among various types of hospitals. We analyzed national HCAHPS data to compare satisfaction scores of specialty hospitals and GMHs and identify factors that may be responsible for this difference.
METHODS
This was a cross‐sectional analysis of national HCAHPS survey data. The methods for administration and reporting of the HCAHPS survey have been described.[15] HCAHPS patient satisfaction data and hospital characteristics, such as location, presence of an ED, and for‐profit status, were obtained from Hospital Compare database. Teaching hospital status was identified using the CMS 2013 Open Payment teaching hospital listing.[16]
For this study, we defined specialty hospitals as acute‐care hospitals that predominantly provide care in a medical or surgical specialty and do not provide care to general medical patients. Based on this definition, specialty hospitals include cardiac hospitals, orthopedic and spine hospitals, oncology hospitals, and hospitals providing multispecialty surgical and procedure‐based services. Children's hospitals, long‐term acute‐care hospitals, and psychiatry hospitals were excluded.
Specialty hospitals were identified using hospital name searches in the HCAHPS database, the American Hospital Association 2013 Annual Survey, the Physician Hospital Association hospitals directory, and through contact with experts. The specialty hospital status of hospitals was further confirmed by checking hospital websites or by directly contacting the hospital.
We analyzed 3‐year HCAHPS patient satisfaction data that included the reporting period from July 2007 to June 2010. HCAHPS data are reported for 12‐month periods at a time. Hospital information, such as address, presence of an ED, and for‐profit status were obtained from the CMS Hospital Compare 2010 dataset. Teaching hospital status was identified using the CMS 2013 Open Payment teaching hospital listing.[16] For the purpose of this study, scores on the HCAHPS survey item definitely recommend the hospital was considered to represent overall satisfaction for the hospital. This is consistent with use of this measure in other sectors in the service industry.[17, 18] Other survey items were considered subdomains of satisfaction. For each hospital, the simple mean of satisfaction scores for overall satisfaction and each of the subdomains for the three 12‐month periods was calculated. Data were summarized using frequencies and meanstandard deviation. The primary dependent variable was overall satisfaction. The main independent variables were specialty hospital status (yes or no), teaching hospital status (yes or no), for‐profit status (yes or no), and the presence of an ED (yes or no). Multiple linear regression analysis was used to adjust for the above‐noted independent variables. A P value0.05 was considered significant. All analyses were performed on Stata 10.1 IC (StataCorp, College Station, TX).
RESULTS
We identified 188 specialty hospitals and 4638 GMHs within the HCAHPS dataset. Fewer specialty hospitals had emergency care services when compared with GMHs (53.2% for specialty hospitals vs 93.6% for GMHs, P0.0001), and 47.9% of all specialty hospitals were in states that do not require a Certificate of Need, whereas only 25% of all GMHs were present in these states. For example, Texas, which has 7.2% of all GMHs across the nation, has 24.7% of all specialty hospitals. As compared to GMHs, a majority of specialty hospitals were for profit (14.5% vs 66.9%).
In unadjusted analyses, specialty hospitals had significantly higher patient satisfaction scores compared with GMHs. Overall satisfaction, as measured by the proportion of patients that will definitely recommend that hospital, was 18.8% higher for specialty hospitals than GMHs (86.6% vs 67.8%, P0.0001). This was also true for subdomains of satisfaction including physician communication, nursing communication, and cleanliness (Table 1).
| Satisfaction Domains | GMH, Mean, n=4,638* | Specialty Hospital, Mean, n=188* | Unadjusted Mean Difference in Satisfaction (95% CI) | Mean Difference in Satisfaction Adjusted for Survey Response Rate (95% CI) | Mean Difference in Satisfaction for Full Adjusted Model (95% CI) |
|---|---|---|---|---|---|
| |||||
| Nurses always communicated well | 75.0% | 84.4% | 9.4% (8.310.5) | 4.0% (2.9‐5.0) | 5.0% (3.8‐6.2) |
| Doctors always communicated well | 80.0% | 86.5% | 6.5% (5.67.6) | 3.8% (2.8‐4.8) | 4.1% (3.05.2) |
| Pain always well controlled | 68.7% | 77.1% | 8.6% (7.79.6) | 4.5% (3.5‐4.5) | 4.6% (3.5‐5.6) |
| Always received help as soon as they wanted | 62.9% | 78.6% | 15.7% (14.117.4) | 7.8% (6.19.4) | 8.0% (6.39.7) |
| Room and bathroom always clean | 70.1% | 81.1% | 11.0% (9.612.4) | 5.5% (4.06.9) | 6.2% (4.7‐7.8) |
| Staff always explained about the medicines | 59.4% | 69.8% | 10.4 (9.211.5) | 5.8% (4.7‐6.9) | 6.5% (5.37.8) |
| Yes, were given information about what to do during recovery at home | 80.9% | 87.1% | 6.2% (5.57.0) | 1.4% (0.7‐2.1) | 2.0% (1.13.0) |
| Overall satisfaction (yes, patients would definitely recommend the hospital) | 67.8% | 86.6% | 18.8%(17.020.6) | 8.5% (6.910.2) | 8.6% (6.710.5) |
| Survey response rate | 32.2% | 49.6% | 17.4% (16.018.9) | ||
We next examined the effect of survey response rate. The survey response rate for specialty hospitals was on average 17.4 percentage points higher than that of GMHs (49.6% vs 32.2%, P0.0001). When adjusted for survey response rate, the difference in overall satisfaction for specialty hospitals was reduced to 8.6% (6.7%10.5%, P0.0001). Similarly, the differences in score for subdomains of satisfaction were more modest when adjusted for higher survey response rate. In the multiple regression models, specialty hospital status, survey response rate, for‐profit status, and the presence of an ED were independently associated with higher overall satisfaction, whereas teaching hospital status was not associated with overall satisfaction. Addition of for‐profit status and presence of an ED in the regression model did not change our results. Further, the satisfaction subdomain scores for specialty hospitals remained significantly higher than for GMHs in the regression models (Table 1).
DISCUSSION
In this national study, we found that specialty hospitals had significantly higher overall satisfaction scores on the HCAHPS satisfaction survey. Similarly, significantly higher satisfaction was noted across all the satisfaction subdomains. We found that a large proportion of the difference between specialty hospitals and GMHs in overall satisfaction and subdomains of satisfaction could be explained by a higher survey response rate in specialty hospitals. After adjusting for survey response rate, the differences were comparatively modest, although remained statistically significant. Adjustment for additional confounding variables did not change our results.
Studies have shown that specialty hospitals, when compared to GMHs, may treat more patients in their area of specialization, care for fewer sick and Medicaid patients, have greater physician ownership, and are less likely to have ED services.[11, 12, 13, 14] Two small studies comparing specialty hospitals to GMHs suggest that higher satisfaction with specialty hospitals was attributable to the presence of private rooms, quiet environment, accommodation for family members, and accessible, attentive, and well‐trained nursing staff.[10, 11] Although our analysis did not account for various other hospital and patient characteristics, we expect that these factors likely play a significant role in the observed differences in patient satisfaction.
Survey response rate can be an important determinant of the validity of survey results, and a response rate >70% is often considered desirable.[19, 20] However, the mean survey response rate for the HCAHPS survey was only 32.8% for all hospitals during the survey period. In the outpatient setting, a higher survey response rate has been shown to be associated with higher satisfaction rates.[21] In the hospital setting, a randomized study of a HCAHPS survey for 45 hospitals found that patient mix explained the nonresponse bias. However, this study did not examine the roles of severity of illness or insurance status, which may account for the differences in satisfaction seen between specialty hospitals and GMHs.[22] In contrast, we found that in the hospital setting, higher survey response rate was associated with higher patient satisfaction scores.
Our study has some limitations. First, it was not possible to determine from the dataset whether higher response rate is a result of differences in the patient population characteristics between specialty hospitals and GMHs or it represents the association between higher satisfaction and higher response rate noted by other investigators. Although we used various resources to identify all specialty hospitals, we may have missed some or misclassified others due to lack of a standardized definition.[10, 12, 13] However, the total number of specialty hospitals and their distribution across various states in the current study are consistent with previous studies, supporting our belief that few, if any, hospitals were misclassified.[13]
In summary, we found significant difference in satisfaction rates reported on HCAHPS in a national study of patients attending specialty hospitals versus GMHs. However, the observed differences in satisfaction scores were sensitive to differences in survey response rates among hospitals. Teaching hospital status, for‐profit status, and the presence of an ED did not appear to further explain the differences. Additional studies incorporating other hospital and patient characteristics are needed to fully understand factors associated with differences in the observed patient satisfaction between specialty hospitals and GMHs. Additionally, strategies to increase survey HCAHPS response rates should be a priority.
- About Picker Institute. Available at: http://pickerinstitute.org/about. Accessed September 24, 2012.
- HCAHPS Hospital Survey. Centers for Medicare 45(4):1024–1040.
- , . Consumers' use of HCAHPS ratings and word‐of‐mouth in hospital choice. Health Serv Res. 2010;45(6 pt 1):1602–1613.
- , , . Improving patient satisfaction in hospital care settings. Health Serv Manage Res. 2011;24(4):163–169.
- Live the life you want. Arkansas Surgical Hospital website. Available at: http://www.arksurgicalhospital.com/ash. Accessed September 24, 2012.
- Patient satisfaction—top 60 hospitals. Hoag Orthopedic Institute website. Available at: http://orthopedichospital.com/2012/06/patient‐satisfaction‐top‐60‐hospital. Accessed September 24, 2012.
- Northwest Specialty Hospital website. Available at: http://www.northwestspecialtyhospital.com/our‐services. Accessed September 24, 2012.
- , , , et al. Specialty versus community hospitals: referrals, quality, and community benefits. Health Affairs. 2006;25(1):106–118.
- Study of Physician‐Owned Specialty Hospitals Required in Section 507(c)(2) of the Medicare Prescription Drug, Improvement, and Modernization Act of 2003, May 2005. Available at: http://www.cms.gov/Medicare/Fraud‐and‐Abuse/PhysicianSelfReferral/Downloads/RTC‐StudyofPhysOwnedSpecHosp.pdf. Accessed June 16, 2014.
- Specialty Hospitals: Information on National Market Share, Physician Ownership and Patients Served. GAO: 03–683R. Washington, DC: General Accounting Office; 2003:1–20. Available at: http://www.gao.gov/new.items/d03683r.pdf. Accessed September 24, 2012.
- , , , . Insurance status of patients admitted to specialty cardiac and competing general hospitals: are accusations of cherry picking justified? Med Care. 2008;46:467–475.
- Specialty Hospitals: Geographic Location, Services Provided and Financial Performance: GAO‐04–167. Washington, DC: General Accounting Office; 2003:1–41. Available at: http://www.gao.gov/new.items/d04167.pdf. Accessed September 24, 2012.
- Centers for Medicare 9(4):5–17.
- , , . The relationship between customer satisfaction and loyalty: cross‐industry differences. Total Qual Manage. 2000;11(4‐6):509–514.
- , . Survey response rate levels and trends in organizational research. Hum Relat. 2008;61:1139–1160.
- , . Survey, cohort and case‐control studies. In: Design of Studies for Medical Research. Hoboken, NJ: John Wiley 2005:118–120.
- , , , , . A demonstration of the impact of response bias on the results of patient satisfaction surveys. Health Serv Res. 2002;37(5):1403–1417.
- , , , et al. Effects of survey mode, patient mix and nonresponse on CAHPS hospital survey scores. Health Serv Res. 2009;44:501–518.
Impact of Pocket Ultrasound Use
Applications of point‐of‐care ultrasonography (POC‐US) have grown rapidly over the past 20 years. POC‐US training is required by the Accreditation Council for Graduate Medical Education for several graduate medical education training programs, including emergency medicine residency and pulmonary/critical care fellowships.[1] Recent efforts have examined the utility of ultrasound in the education of medical students[2] and the diagnostic and procedural applications performed by residents.[3] One powerful application of POC‐US is the use of lung ultrasound to diagnose causes of respiratory failure at the bedside.[4] Although lung ultrasound has been shown to have superior diagnostic accuracy to chest x‐rays,[5] limited availability of expert physicians and ultrasound equipment have presented barriers to wider application. The advent of lower cost pocket ultrasounds may present a solution given the early reports of similar efficacy to traditional devices in the assessment of left ventricular dysfunction, acute decompensated heart failure,[6] and focused assessment with sonography for trauma.[7] We assessed the feasibility and diagnostic accuracy of residents trained in lung ultrasound with a pocket device for evaluating patients with dyspnea.
MATERIALS AND METHODS
Study Design
We performed a prospective, observational study of internal medicine residents performing lung ultrasound with a pocket ultrasound from September 2012 to August 2013 at Beth Israel Medical Center, an 856‐bed teaching hospital in New York City. This study was approved by the Committee of Scientific Affairs of Beth Israel Medical Center, which waived the requirement for informed consent (institutional review board #016‐10). Ten pocket ultrasounds (Vscan; GE Vingmed Ultrasound, Horten, Norway) were acquired through an educational grant from General Electric Company. Grant sponsors were not involved in any aspect of the study.
Recruitment and Training
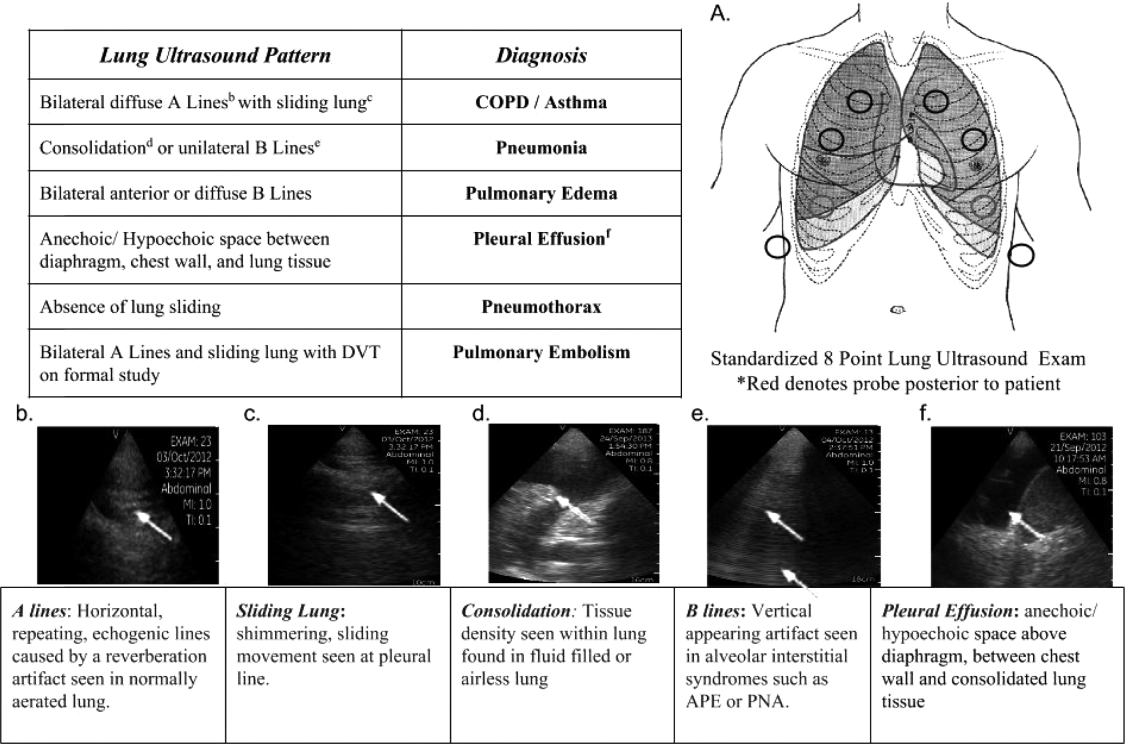
One hundred nineteen internal medicine residents were offered training on lung ultrasound in return for participating in the study. Initially, 10 residents from 3 postgraduate years with no previous lung ultrasound experience volunteered for the study and received a pocket ultrasound along with either focused or extended training. Focused and extended training groups both received 2 sessions of 90 minutes that included didactics covering image creation of the 5 main diagnostic lung ultrasound patterns and their pathological correlates. Sessions also included training in the operation of a pocket ultrasound along with bedside instruction in image acquisition using an 8‐point exam protocol (Figure 1A). All residents were required to demonstrate competency in this 8‐point protocol with proper image acquisition and interpretation of 3 lung ultrasound exams under direct supervision by an expert practitioner (P.K.). Only 5 residents completed the training due mostly to other commitments. Two extended training residents, both authors of this article, who plan to continue training in pulmonary and critical care medicine, volunteered for an additional 2‐week general critical care ultrasound elective. This elective included daily bedside supervised performance and interpretation of lung ultrasound patterns on at least 15 patients admitted during intensive care unit rounds.
Patient Selection
Patients admitted to a resident's service were considered for inclusion at their convenience if the patient reported a chief complaint of dyspnea.
Diagnostic Protocol
Upon admission, residents recorded a clinical diagnosis of dyspnea based on a standard diagnostic evaluation including complete history, physical exam, and all relevant laboratory and imaging studies, including chest x‐ray and computed tomography (CT) scans. A diagnosis of dyspnea after lung ultrasound was then recorded based on the lung ultrasound findings and integrated with all other clinical information available. Standard lung ultrasound patterns and diagnostic correlates are shown in Figure 1. Diagnoses of dyspnea were recorded as one of 7 possibilities; 1) exacerbation of chronic obstructive pulmonary disease or asthma (COPD/asthma), 2) acute pulmonary edema (APE), 3) pneumonia (PNA), 4) pulmonary embolus (PE), 5) pneumothorax (PTX), 6) pleural effusion (PLEFF), and 7) other (OTH), namely anemia, ascites, and dehydration.
Data Collection
Patient demographics, comorbidities, lung ultrasound findings, and both clinical and ultrasound diagnosis were recorded on a standardized form. A final diagnosis based on the attending physicians' diagnosis of dyspnea was determined through chart review by 3 investigators blinded to the clinical and ultrasound diagnoses. Discordant findings were resolved by consensus. Attending physicians were blinded to the lung ultrasound exam results.
Statistical Analysis
Sensitivity and specificity of the clinical and ultrasound diagnoses for focused and extended training groups were calculated for each diagnosis using final attending diagnosis as the gold standard. Causes of dyspnea were often deemed multifactorial, leading to more than 1 diagnosis recorded per patient exam. Overall diagnostic accuracy was calculated for each group using the reported clinical, ultrasound, and final diagnoses. Receiver operating curve (ROC) analysis was performed with Stata 12.1 (StataCorp, College Station, TX).
RESULTS
Five residents performed lung ultrasound on a convenience sample of 69 newly admitted patients. Patient baseline characteristics are shown in Table 1. Three residents made up the focused training group and examined 21 patients, resulting in 27 clinical diagnoses, 27 ultrasound diagnoses, and 31 final attending diagnoses. Two residents made up the extended training group and examined 48 patients, resulting in 61 clinical diagnoses, 60 ultrasound diagnoses, and 60 final attending diagnoses. Improvements in sensitivity and specificity using lung ultrasound were more pronounced for the extended training group and are shown for each diagnosis in Table 2.
| Age, y, mean | 69 |
|---|---|
| |
| Sex, male, % | 52.2 |
| BMI, mean, kg/m2 | 25.7 |
| Comorbidities, % | |
| COPD | 43.3 |
| CHF | 23.9 |
| Hypertension | 59.4 |
| Diabetes mellitus | 29 |
| Atrial fibrillation | 18.9 |
| DVT/PE | 1.5 |
| Lung cancer | 5.9 |
| Finding on admission, % | |
| CXR available | 94 |
| Chest CT available | 22.4 |
| WBC >10.4 K/L | 36.2 |
| BNP >400 pg/mL | 27.5 |
| Temperature >100.9F | 6 |
| Heart rate >90 bpm | 47.8 |
| Desaturation* | 32 |
| Focused Training Group | Extended Training Group | |||||||
|---|---|---|---|---|---|---|---|---|
| CLINDIAG, N=27 | USDIAG, N=27 | CLINDIAG, N=61 | USDIAG, N=20 | |||||
| Diagnosis | Sens, % | Spec, % | Sens, % | Spec, % | Sens, % | Spec, % | Sens, % | Spec, % |
| ||||||||
| COPD/asthma | 60 | 96 | 60 | 96 | 55 | 96 | 91 | 96 |
| Pneumonia | 45 | 90 | 36 | 100 | 93 | 88 | 96 | 100 |
| Pulmonary edema | 100 | 85 | 100 | 86 | 89 | 96 | 89 | 100 |
| Pleural effusion | 57 | 100 | 86 | 96 | 57 | 96 | 100 | 96 |
| Other | 50 | 100 | 75 | 96 | 80 | 96 | 80 | 100 |
Overall diagnostic accuracy using lung ultrasound improved only for the extended training group (clinical 92% vs ultrasound 97%), whereas the focused training group's accuracy was unchanged (clinical 87% vs ultrasound 88%).
ROC analysis demonstrated a superior diagnostic performance of ultrasound when compared to clinical diagnosis (Table 3).
| Diagnosis | CLINDIAG AUC, N=69 | USDIAG AUC, N=69 | P Value |
|---|---|---|---|
| |||
| COPD/asthma | 0.73 | 0.85 | 0.06 |
| Pulmonary edema | 0.85 | 0.89 | 0.49 |
| Pneumonia | 0.77 | 0.88 | 0.01 |
| Pleural effusion | 0.76 | 0.96 | 0.002 |
| Other* | 0.78 | 0.69 | 0.01 |
| All causes, n=69 | 0.81 | 0.87 | 0.01 |
DISCUSSION
In this prospective, observational study of residents performing lung ultrasound of patients with dyspnea, the diagnostic accuracy incorporating ultrasound increased compared to a standard diagnostic approach relying on history, physical exam, blood tests, and radiography. To our knowledge, this is the first study of residents independently performing lung ultrasound with a pocket ultrasound to diagnose dyspnea. Receiver operating curve analysis shows improvements in diagnostic accuracy for causes such as PNA, pleural effusion and COPD/asthma and demonstrates the feasibility and clinical utility of residents using pocket ultrasounds. The finding that improvements in sensitivity and specificity were larger in the extended training group highlights the need for sufficient training to demonstrate increased utility. Although a 2‐week critical care ultrasound elective may not be possible for all residents, perhaps training of intensity somewhere in between these 2 levels would be most feasible.
Challenges in diagnosing dyspnea have been well described, attributed to a lack of accurate history combined with often insensitive and nonspecific physical exam findings, blood tests, and radiographs.[8, 9] Further, patients often present with multiple contributing causes as was evidenced in this study.[10] Lack of initial, accurate diagnoses often leads to the provision of multiple, incorrect treatment regimens that may increase mortality.[11] The high accuracy of lung ultrasound in defining causes of respiratory failure suggests potential as a low‐cost solution.[12]
This study design differed from prior work in several respects. First, it included patients presenting with dyspnea to a hospital ward rather than acute respiratory failure to an intensive care unit (ICU), suggesting its diagnostic potential in a broader population of patients and settings. Second, the lung ultrasound was integrated with traditional clinical information rather than relied upon alone, a situation mimicking real‐world application of POC‐US. Third, operators were residents with limited amounts of training rather than highly trained experts. Finally, the lung ultrasound exams were performed using a pocket ultrasound with inferior imaging capability than larger, more established ultrasound devices. Despite these constraints, the utility of lung ultrasound was still evident, particularly in the diagnosis or exclusion of pneumonia and PLEFF.
Limitations include reliance on a small cohort of highly motivated residents with an interest in pulmonary and critical care, 2 who are authors of this article, making reproducibility a concern. Although convenience sampling may more closely mimic real world practices of POC‐US, a bias toward less challenging patients is possible and may limit conclusions regarding utility. Over‐reading and feedback were not provided to residents to improve their performance of lung ultrasound exams. Also, because chest CT is considered the gold standard in most studies examining the diagnostic accuracy of lung ultrasound, all residents aware of these data may underestimate the potential impact of integrating lung ultrasound with all clinical findings. Finally, the high cost of pocket ultrasounds is a barrier to general use. Recent studies on the significant cost savings associated with POC‐US make a further analysis of cost‐benefit ratios mandatory before broad use can be recommended.[13]
CONCLUSIONS
Residents participating in lung ultrasound training with a pocket ultrasound device showed improved diagnostic accuracy in their evaluation of patients with dyspnea. Those who received extended training had greater improvements across all causes of dyspnea. Training residents to apply lung ultrasound in non‐ICU settings appears to be feasible. Further study with a larger cohort of internal medicine residents and perhaps training duration that lies in between the focused and extended training groups is warranted.
Acknowledgements
The authors thank Dr. David Lucido for guidance on statistical analysis and Stephane Gatesoupe and the Vscan team at General Electric.
Disclosure: Ten Vscan pocket ultrasounds (General Electric) were provided free of cost solely for the purpose of conducting the clinical research study. This represented their sole participation in any stage of the research. The authors have no conflicts of interest to disclose.
- , , , . Barriers to ultrasound training in critical care medicine fellowships: a survey of program directors. Crit Care Med. 2010;38(10):1978–1983.
- , , , et al. Comparison of effectiveness of hand‐carried ultrasound to bedside cardiovascular physical examination. Am J Cardiol. 2005;96(7):1002–1006.
- , , . Diagnosing pulmonary edema: lung ultrasound versus chest radiography. Eur J Emerg Med. 2013;20(5):356–360.
- , . Relevance of lung ultrasound in the diagnosis of acute respiratory failure: the BLUE protocol. Chest. 2008;134(1):117–125.
- , , , et al. Lung ultrasound in the diagnosis and follow‐up of community‐acquired pneumonia: a prospective, multicenter, diagnostic accuracy study. Chest. 2012;142(4):965–972.
- , , , , , . Evaluation of a new pocket echoscopic device for focused cardiac ultrasonography in an emergency setting. Crit Care. 2012;16(3):R82.
- , , , . Our new stethoscope in the emergency department: handheld ultrasound. Ulus Travma Acil Cerrahi Derg. 2011;17(6):488–492.
- , , . Discriminating causes of dyspnea through clinical examination. J Gen Intern Med. 1993;8(7):383–392.
- , , . Does this patient have community‐acquired pneumonia? Diagnosing pneumonia by history and physical examination. JAMA. 1997;278(17):1440–1445.
- , , , et al. Acute respiratory failure in the elderly: etiology, emergency diagnosis and prognosis. Crit Care. 2006;10(3):R82.
- , , , et al. Early interventions in severe sepsis and septic shock: a review of the evidence one decade later. Minerva Anestesiol. 2012;78(6):712–724.
- , , , . Ultrasound diagnosis of alveolar consolidation in the critically ill. Intensive Care Med. 2004;30(2):276–281.
- , , , , , . Ultrasound assessment of pulmonary embolism in patients receiving computerized tomography pulmonary angiography. Chest. 2014;145(4):818–823.
Applications of point‐of‐care ultrasonography (POC‐US) have grown rapidly over the past 20 years. POC‐US training is required by the Accreditation Council for Graduate Medical Education for several graduate medical education training programs, including emergency medicine residency and pulmonary/critical care fellowships.[1] Recent efforts have examined the utility of ultrasound in the education of medical students[2] and the diagnostic and procedural applications performed by residents.[3] One powerful application of POC‐US is the use of lung ultrasound to diagnose causes of respiratory failure at the bedside.[4] Although lung ultrasound has been shown to have superior diagnostic accuracy to chest x‐rays,[5] limited availability of expert physicians and ultrasound equipment have presented barriers to wider application. The advent of lower cost pocket ultrasounds may present a solution given the early reports of similar efficacy to traditional devices in the assessment of left ventricular dysfunction, acute decompensated heart failure,[6] and focused assessment with sonography for trauma.[7] We assessed the feasibility and diagnostic accuracy of residents trained in lung ultrasound with a pocket device for evaluating patients with dyspnea.
MATERIALS AND METHODS
Study Design
We performed a prospective, observational study of internal medicine residents performing lung ultrasound with a pocket ultrasound from September 2012 to August 2013 at Beth Israel Medical Center, an 856‐bed teaching hospital in New York City. This study was approved by the Committee of Scientific Affairs of Beth Israel Medical Center, which waived the requirement for informed consent (institutional review board #016‐10). Ten pocket ultrasounds (Vscan; GE Vingmed Ultrasound, Horten, Norway) were acquired through an educational grant from General Electric Company. Grant sponsors were not involved in any aspect of the study.
Recruitment and Training
One hundred nineteen internal medicine residents were offered training on lung ultrasound in return for participating in the study. Initially, 10 residents from 3 postgraduate years with no previous lung ultrasound experience volunteered for the study and received a pocket ultrasound along with either focused or extended training. Focused and extended training groups both received 2 sessions of 90 minutes that included didactics covering image creation of the 5 main diagnostic lung ultrasound patterns and their pathological correlates. Sessions also included training in the operation of a pocket ultrasound along with bedside instruction in image acquisition using an 8‐point exam protocol (Figure 1A). All residents were required to demonstrate competency in this 8‐point protocol with proper image acquisition and interpretation of 3 lung ultrasound exams under direct supervision by an expert practitioner (P.K.). Only 5 residents completed the training due mostly to other commitments. Two extended training residents, both authors of this article, who plan to continue training in pulmonary and critical care medicine, volunteered for an additional 2‐week general critical care ultrasound elective. This elective included daily bedside supervised performance and interpretation of lung ultrasound patterns on at least 15 patients admitted during intensive care unit rounds.
Patient Selection
Patients admitted to a resident's service were considered for inclusion at their convenience if the patient reported a chief complaint of dyspnea.
Diagnostic Protocol
Upon admission, residents recorded a clinical diagnosis of dyspnea based on a standard diagnostic evaluation including complete history, physical exam, and all relevant laboratory and imaging studies, including chest x‐ray and computed tomography (CT) scans. A diagnosis of dyspnea after lung ultrasound was then recorded based on the lung ultrasound findings and integrated with all other clinical information available. Standard lung ultrasound patterns and diagnostic correlates are shown in Figure 1. Diagnoses of dyspnea were recorded as one of 7 possibilities; 1) exacerbation of chronic obstructive pulmonary disease or asthma (COPD/asthma), 2) acute pulmonary edema (APE), 3) pneumonia (PNA), 4) pulmonary embolus (PE), 5) pneumothorax (PTX), 6) pleural effusion (PLEFF), and 7) other (OTH), namely anemia, ascites, and dehydration.
Data Collection
Patient demographics, comorbidities, lung ultrasound findings, and both clinical and ultrasound diagnosis were recorded on a standardized form. A final diagnosis based on the attending physicians' diagnosis of dyspnea was determined through chart review by 3 investigators blinded to the clinical and ultrasound diagnoses. Discordant findings were resolved by consensus. Attending physicians were blinded to the lung ultrasound exam results.
Statistical Analysis
Sensitivity and specificity of the clinical and ultrasound diagnoses for focused and extended training groups were calculated for each diagnosis using final attending diagnosis as the gold standard. Causes of dyspnea were often deemed multifactorial, leading to more than 1 diagnosis recorded per patient exam. Overall diagnostic accuracy was calculated for each group using the reported clinical, ultrasound, and final diagnoses. Receiver operating curve (ROC) analysis was performed with Stata 12.1 (StataCorp, College Station, TX).
RESULTS
Five residents performed lung ultrasound on a convenience sample of 69 newly admitted patients. Patient baseline characteristics are shown in Table 1. Three residents made up the focused training group and examined 21 patients, resulting in 27 clinical diagnoses, 27 ultrasound diagnoses, and 31 final attending diagnoses. Two residents made up the extended training group and examined 48 patients, resulting in 61 clinical diagnoses, 60 ultrasound diagnoses, and 60 final attending diagnoses. Improvements in sensitivity and specificity using lung ultrasound were more pronounced for the extended training group and are shown for each diagnosis in Table 2.
| Age, y, mean | 69 |
|---|---|
| |
| Sex, male, % | 52.2 |
| BMI, mean, kg/m2 | 25.7 |
| Comorbidities, % | |
| COPD | 43.3 |
| CHF | 23.9 |
| Hypertension | 59.4 |
| Diabetes mellitus | 29 |
| Atrial fibrillation | 18.9 |
| DVT/PE | 1.5 |
| Lung cancer | 5.9 |
| Finding on admission, % | |
| CXR available | 94 |
| Chest CT available | 22.4 |
| WBC >10.4 K/L | 36.2 |
| BNP >400 pg/mL | 27.5 |
| Temperature >100.9F | 6 |
| Heart rate >90 bpm | 47.8 |
| Desaturation* | 32 |
| Focused Training Group | Extended Training Group | |||||||
|---|---|---|---|---|---|---|---|---|
| CLINDIAG, N=27 | USDIAG, N=27 | CLINDIAG, N=61 | USDIAG, N=20 | |||||
| Diagnosis | Sens, % | Spec, % | Sens, % | Spec, % | Sens, % | Spec, % | Sens, % | Spec, % |
| ||||||||
| COPD/asthma | 60 | 96 | 60 | 96 | 55 | 96 | 91 | 96 |
| Pneumonia | 45 | 90 | 36 | 100 | 93 | 88 | 96 | 100 |
| Pulmonary edema | 100 | 85 | 100 | 86 | 89 | 96 | 89 | 100 |
| Pleural effusion | 57 | 100 | 86 | 96 | 57 | 96 | 100 | 96 |
| Other | 50 | 100 | 75 | 96 | 80 | 96 | 80 | 100 |
Overall diagnostic accuracy using lung ultrasound improved only for the extended training group (clinical 92% vs ultrasound 97%), whereas the focused training group's accuracy was unchanged (clinical 87% vs ultrasound 88%).
ROC analysis demonstrated a superior diagnostic performance of ultrasound when compared to clinical diagnosis (Table 3).
| Diagnosis | CLINDIAG AUC, N=69 | USDIAG AUC, N=69 | P Value |
|---|---|---|---|
| |||
| COPD/asthma | 0.73 | 0.85 | 0.06 |
| Pulmonary edema | 0.85 | 0.89 | 0.49 |
| Pneumonia | 0.77 | 0.88 | 0.01 |
| Pleural effusion | 0.76 | 0.96 | 0.002 |
| Other* | 0.78 | 0.69 | 0.01 |
| All causes, n=69 | 0.81 | 0.87 | 0.01 |
DISCUSSION
In this prospective, observational study of residents performing lung ultrasound of patients with dyspnea, the diagnostic accuracy incorporating ultrasound increased compared to a standard diagnostic approach relying on history, physical exam, blood tests, and radiography. To our knowledge, this is the first study of residents independently performing lung ultrasound with a pocket ultrasound to diagnose dyspnea. Receiver operating curve analysis shows improvements in diagnostic accuracy for causes such as PNA, pleural effusion and COPD/asthma and demonstrates the feasibility and clinical utility of residents using pocket ultrasounds. The finding that improvements in sensitivity and specificity were larger in the extended training group highlights the need for sufficient training to demonstrate increased utility. Although a 2‐week critical care ultrasound elective may not be possible for all residents, perhaps training of intensity somewhere in between these 2 levels would be most feasible.
Challenges in diagnosing dyspnea have been well described, attributed to a lack of accurate history combined with often insensitive and nonspecific physical exam findings, blood tests, and radiographs.[8, 9] Further, patients often present with multiple contributing causes as was evidenced in this study.[10] Lack of initial, accurate diagnoses often leads to the provision of multiple, incorrect treatment regimens that may increase mortality.[11] The high accuracy of lung ultrasound in defining causes of respiratory failure suggests potential as a low‐cost solution.[12]
This study design differed from prior work in several respects. First, it included patients presenting with dyspnea to a hospital ward rather than acute respiratory failure to an intensive care unit (ICU), suggesting its diagnostic potential in a broader population of patients and settings. Second, the lung ultrasound was integrated with traditional clinical information rather than relied upon alone, a situation mimicking real‐world application of POC‐US. Third, operators were residents with limited amounts of training rather than highly trained experts. Finally, the lung ultrasound exams were performed using a pocket ultrasound with inferior imaging capability than larger, more established ultrasound devices. Despite these constraints, the utility of lung ultrasound was still evident, particularly in the diagnosis or exclusion of pneumonia and PLEFF.
Limitations include reliance on a small cohort of highly motivated residents with an interest in pulmonary and critical care, 2 who are authors of this article, making reproducibility a concern. Although convenience sampling may more closely mimic real world practices of POC‐US, a bias toward less challenging patients is possible and may limit conclusions regarding utility. Over‐reading and feedback were not provided to residents to improve their performance of lung ultrasound exams. Also, because chest CT is considered the gold standard in most studies examining the diagnostic accuracy of lung ultrasound, all residents aware of these data may underestimate the potential impact of integrating lung ultrasound with all clinical findings. Finally, the high cost of pocket ultrasounds is a barrier to general use. Recent studies on the significant cost savings associated with POC‐US make a further analysis of cost‐benefit ratios mandatory before broad use can be recommended.[13]
CONCLUSIONS
Residents participating in lung ultrasound training with a pocket ultrasound device showed improved diagnostic accuracy in their evaluation of patients with dyspnea. Those who received extended training had greater improvements across all causes of dyspnea. Training residents to apply lung ultrasound in non‐ICU settings appears to be feasible. Further study with a larger cohort of internal medicine residents and perhaps training duration that lies in between the focused and extended training groups is warranted.
Acknowledgements
The authors thank Dr. David Lucido for guidance on statistical analysis and Stephane Gatesoupe and the Vscan team at General Electric.
Disclosure: Ten Vscan pocket ultrasounds (General Electric) were provided free of cost solely for the purpose of conducting the clinical research study. This represented their sole participation in any stage of the research. The authors have no conflicts of interest to disclose.
- , , , . Barriers to ultrasound training in critical care medicine fellowships: a survey of program directors. Crit Care Med. 2010;38(10):1978–1983.
- , , , et al. Comparison of effectiveness of hand‐carried ultrasound to bedside cardiovascular physical examination. Am J Cardiol. 2005;96(7):1002–1006.
- , , . Diagnosing pulmonary edema: lung ultrasound versus chest radiography. Eur J Emerg Med. 2013;20(5):356–360.
- , . Relevance of lung ultrasound in the diagnosis of acute respiratory failure: the BLUE protocol. Chest. 2008;134(1):117–125.
- , , , et al. Lung ultrasound in the diagnosis and follow‐up of community‐acquired pneumonia: a prospective, multicenter, diagnostic accuracy study. Chest. 2012;142(4):965–972.
- , , , , , . Evaluation of a new pocket echoscopic device for focused cardiac ultrasonography in an emergency setting. Crit Care. 2012;16(3):R82.
- , , , . Our new stethoscope in the emergency department: handheld ultrasound. Ulus Travma Acil Cerrahi Derg. 2011;17(6):488–492.
- , , . Discriminating causes of dyspnea through clinical examination. J Gen Intern Med. 1993;8(7):383–392.
- , , . Does this patient have community‐acquired pneumonia? Diagnosing pneumonia by history and physical examination. JAMA. 1997;278(17):1440–1445.
- , , , et al. Acute respiratory failure in the elderly: etiology, emergency diagnosis and prognosis. Crit Care. 2006;10(3):R82.
- , , , et al. Early interventions in severe sepsis and septic shock: a review of the evidence one decade later. Minerva Anestesiol. 2012;78(6):712–724.
- , , , . Ultrasound diagnosis of alveolar consolidation in the critically ill. Intensive Care Med. 2004;30(2):276–281.
- , , , , , . Ultrasound assessment of pulmonary embolism in patients receiving computerized tomography pulmonary angiography. Chest. 2014;145(4):818–823.

Hospitalist Minority Mentoring Program
The fraction of the US population identifying themselves as ethnic minorities was 36% in 2010 and will exceed 50% by 2050.[1, 2] This has resulted in an increasing gap in healthcare, as minorities have well‐documented disparities in access to healthcare and a disproportionately high morbidity and mortality.[3] In 2008, only 12.3% of US physicians were from under‐represented minority (URM) groups (see Figure in Castillo‐Page 4) (ie, those racial and ethnic populations that are underrepresented in the medical profession relative to their numbers in the general population as defined by the American Association of Medical Colleges[4, 5]). Diversifying the healthcare workforce may be an effective approach to reducing healthcare disparities, as URM physicians are more likely to choose primary care specialties,[6] work in underserved communities with socioeconomic or racial mixes similar to their own, thereby increasing access to care,[6, 7, 8] increasing minority patient satisfaction, and improving the quality of care received by minorities.[9, 10, 11]
The number of URM students attending medical school is slowly increasing, but in 2011, only 15% of the matriculating medical school students were URMs (see Figure 12 and Table 10 in Castillo‐Page[12]), and medical schools actively compete for this limited number of applicants. To increase the pool of qualified candidates, more URM students need to graduate college and pursue postgraduate healthcare training.[12]
URM undergraduate freshmen with intentions to enter medical school are 50% less likely to apply to medical school by the time they are seniors than their non‐Latino, white, and Asian counterparts.[13] Higher attrition rates have been linked to students having negative experiences in the basic science courses and with a lack of role models and exposure to careers in healthcare.[13, 14, 15, 16] We developed a hospitalist‐led mentoring program that was focused on overcoming these perceived limitations. This report describes the program and follow‐up data from our first year cohort documenting its success.
METHODS
The Healthcare Interest Program (HIP) was developed by 2 hospitalists (L. C., E. C.) and a physician's assistant (C. N.) who worked at Denver Health (DH), a university‐affiliated public hospital. We worked in conjunction with the chief diversity officer of the University of Colorado, Denver (UCD), primarily a commuter university in metropolitan Denver, where URMs composed 51% of the 2011 freshmen class. We reviewed articles describing mentoring programs for undergraduate students, and by consensus, designed a 7‐component program, each of which was intended to address a specific barrier identified in the literature as possibly contributing to reduced interest of minority students in pursuing medical careers (Table 1).[13, 14, 15, 16]
| Component | Goal |
|---|---|
| Clinical shadowing | |
| Student meets with their mentor and/or with other healthcare providers (eg, pharmacist, nurse) 4 hours per day, 1 or 2 times per month. | Expose students to various healthcare careers and to care for underserved patients. |
| Mentoring | |
| Student meets with their mentor for life coaching, career counseling, and to learn interviewing techniques 4 hours per month | Expand ideas of opportunity, address barriers or concerns before they affect grades, write letter of recommendation |
| Books to Bedside lectures | |
| One lecture per month designed to integrate clinical medicine with the undergraduate basic sciences. Sample lectures include: The Physics of Electrocardiograms and The Biochemistry of Diabetic Ketoacidosis | Improve the undergraduate experience in the basic science courses |
| Book club | |
| Group discussions of books selected for their focus on healthcare disparities and cultural diversity; 2 or 3 books per year (eg, The Spirit Catches You and You Fall Down by Ann Fadiman, Just Like Us by Helen Thorpe) | Socialize, begin to understand and discuss health disparities and caring for the underserved. |
| Diversity lectures | |
| Three speakers per term, each discussing different aspects of health disparities research being conducted in the Denver metropolitan area | Understand the disparities affecting the students' communities. Inspire interest in becoming involved with research. |
| Social events | |
| Kickoff, winter, and end‐of‐year gatherings | Socializing, peer group support |
| Journaling and reflection essay | |
| Summary of hospital experience with mentor and thoughts regarding healthcare career goals and plans. | Formalize career goals |
During the 2009 to 2010 academic year, information about the program, together with an application, was e‐mailed to all students at UCD who self‐identified as having interest in healthcare careers. This information was also distributed at all prehealth clubs and gatherings (ie, to students expressing interest in graduate and professional programs in healthcare‐related fields). All sophomore and junior students who submitted an application and had grade point averages (GPA) 2.8 were interviewed by the program director. Twenty‐three students were selected on the basis of their GPAs (attempting to include those with a range of GPAs), interviews, and the essays prepared as part of their applications.
An e‐mail soliciting mentors was sent to all hospitalists physicians and midlevels working at DH; 25/30 volunteered, and 20 were selected on the basis of their gender (as mentors were matched to students based on gender). The HIP director met with the mentors in person to introduce the program and its goals. All mentors had been practicing hospital medicine for 10 years after their training, and all but 3 were non‐Latino white. Each student accepted into the program was paired with a hospitalist who served as their mentor for the year.
The mentors were instructed in life coaching in both e‐mails and individual discussions. Every 2 or 3 months each hospitalist was contacted by e‐mail to see if questions or problems had arisen and to emphasize the need to meet with their mentees monthly.
Students filled out a written survey after each Books‐to‐Bedside (described in Table 1) discussion. The HIP director met with each student for at least 1 hour per semester and gathered feedback regarding mentor‐mentee success, shadowing experience, and the quality of the book club. At the end of the academic year, students completed a written, anonymous survey assessing their impressions of the program and their intentions of pursuing additional training in healthcare careers (Table 2). We used descriptive statistics to analyze the data including frequencies and mean tests.
|
| Open‐ended questions: |
| 1. How did HIP or your HIP mentor affect your application to your healthcare field of interest (eg, letter of recommendation, clinical hours, change in healthcare career of interest)? |
| 2. How did the Books to Bedside presentation affect you? |
| 3. My healthcare professional school of interest is (eg, medical school, nursing school, physician assistant school, pharmacy school, physical therapy school, dental school). |
| 4. How many times per month were you able to shadow at Denver Health? |
| 5. How would you revise the program to improve it? |
| Yes/no questions: |
| 1. English is my primary language. |
| 2. I am the first in my immediate family to attend college |
| 3. Did you work while in school? |
| 4. Did you receive scholarships while in school? |
| 5. Prior to participating in this program, I had a role model in my healthcare field of interest. |
| 6. My role model is my HIP mentor. |
| 7. May we contact you in 2 to 3 years to obtain information regarding your acceptance into your healthcare field of interest? |
| Likert 5‐point questions: |
| 1. Participation in HIP expanded my perceptions of what I could accomplish in the healthcare field. |
| 2. Participation in HIP has increased my confidence that I will be accepted into my healthcare field of choice. |
| 3. I intend to go to my healthcare school in the state of Colorado. |
| 4. One of my long‐term goals is to work with people with health disparities (eg, underserved). |
| 5. One of my long‐term goals is to work in a rural environment. |
| 6. I have access to my prehealth advisors. |
| 7. I have access to my HIP mentor. |
| 8. Outside of the HIP, I have had access to clinical experience shadowing with a physician or physician assistant. |
| 9. If not accepted the first time, I will reapply to my healthcare field of interest. |
| 10. I would recommend HIP to my colleagues. |
Two years after completing the program, each student was contacted via e‐mail and/or phone to determine whether they were still pursuing healthcare careers.
RESULTS
Twenty‐three students were accepted into the program (14 female, 9 male, mean age 19 [standard deviation1]). Their GPAs ranged from 2.8 to 4.0. Eleven (48%) were the first in their family to attend college, 6 (26%) indicated that English was not their primary language, and 16 (70%) were working while attending school. All 23 students stayed in the HIP program for the full academic year.
Nineteen of the 23 students (83%) completed the survey at the end of the year. Of these, 19 (100%) strongly agreed that the HIP expanded their perceptions of what they might accomplish and increased their confidence in being able to succeed in a healthcare profession. All 19 (100%) stated that they hoped to care for underserved minority patients in the future. Sixteen (84%) strongly agreed that their role model in life was their HIP mentor. These findings suggest that many of the HIP components successfully accomplished their goals (Table 1).
Two‐year follow‐up was available for 21 of the 23 students (91%). Twenty (95%) remained committed to a career in healthcare, 18 (86%) had graduated college, 6 (29%) were enrolled in graduate training in the healthcare professions (2 in medical school, 1 in nursing school, and 3 in a master's programs in public health, counseling, and medical science, respectively), and 9 (43%) were in the process of applying to postgraduate healthcare training programs (7 to medical school, 1 to dental school, and 1 to nursing school, respectively). Five students were preparing to take the Medical College Admissions Test, and 7 were working at various jobs in the healthcare field (eg, phlebotomists, certified nurse assistants, research assistants). Of the 16 students who expressed an interest in attending medical school at the beginning of the program, 15 (94%) maintained that interest.
DISCUSSION
HIP was extremely well‐received by the participating students, the majority graduated college and remained committed to a career in healthcare, and 29% were enrolled in postgraduate training in healthcare professions 2 years after graduation.
The 86% graduation rate that we observed compares highly favorably to the UCD campus‐wide graduation rates for minority students of 12.5% at 4 years and 30.8% at 5 years. Although there may be selection bias in the students participating in HIP, the extremely high graduation rate is consistent with HIP meeting 1 or more of its stated objectives.
Many universities have prehealthcare pipeline programs that are designed to provide short‐term summer medical experiences, research opportunities, and assistance with the Medical College Admissions Test.[17, 18, 19] We believe, however, that several aspects of our program are unique. First, we designed HIP to be year‐long, rather than a summertime program. Continuing the mentoring and life coaching throughout the year may allow stronger relationships to develop between the mentor and the student. In addition, ongoing student‐mentor interactions during the time when a student may be encountering problems with their undergraduate basic science courses may be beneficial. Second, the Books‐to‐Bedside lectures series, which was designed to link the students' basic science training with clinical medicine, has not previously been described and may contribute to a higher rate of completion of their basic science training. Third, those aspects of the program resulting in increased peer interactions (eg, book club discussions, diversity lectures, and social gatherings) provided an important venue for students with similar interests to interact, an opportunity that is limited at UCD as it is primarily a commuter university.
A number of lessons were learned during the first year of the program. First, a program such as ours must include rigorous evaluation from the start to make a case for support to the university and key stakeholders. With this in mind, it is possible to obtain funding and ensure long‐term sustainability. Second, by involving UCD's chief diversity officer in the development, the program fostered a strong partnership between DH and UCD and facilitated growing the program. Third, the hospitalists who attended the diversity‐training aspects of the program stated through informal feedback that they felt better equipped to care for the underserved and felt that providing mentorship increased their personal job satisfaction. Fourth, the students requested more opportunities for them to participate in health disparities research and in shadowing in subspecialties in addition to internal medicine. In response to this feedback, we now offer research opportunities, lectures on health disparities research, and interactions with community leaders working in improving healthcare for the underserved.
Although influencing the graduation rate from graduate level schooling is beyond the scope of HIP, we can conclude that the large majority of students participating in HIP maintained their interest in the healthcare professions, graduated college, and that many went on to postgraduate healthcare training. The data we present pertain to the cohort of students in the first year of the HIP. As the program matures, we will continue to evaluate the long‐term outcomes of our students and hospitalist mentors. This may provide opportunities for other academic hospitalists to replicate our program in their own communities.
ACKNOWLEDGMENTS
Disclosure: The authors report no conflicts of interest.
- United States Census Bureau. An older and more diverse nation by midcentury. Available at: https://www.census.gov/newsroom/releases/archives/population/cb08–123.html. Accessed February 28, 2013.
- United States Census Bureau. State and county quick facts. Available at: http://quickfacts.census.gov/qfd/states/00000.html. Accessed February 28, 2013.
- Centers for Disease Control and Prevention. Surveillance of health status in minority communities—racial and ethnic approaches to community health across the U.S. (REACH US) risk factor survey, United States, 2009. Available at: http://cdc.gov/mmwr/preview/mmwrhtml/ss6006a1.htm. Accessed February 28, 2013.
- Association of American Medical Colleges. Diversity in the physician workforce: facts and figures 2010. Available at: https://members.aamc.org/eweb/upload/Diversity%20in%20the%20 Physician%20Workforce%20Facts%20and%20Figures%202010.pdf. Accessed April 29, 2014.
- Association of American Medical Colleges Executive Committee. The status of the new AAMC definition of “underrepresented in medicine” following the Supreme Court's decision in Grutter. Available at: https://www.aamc.org/download/54278/data/urm.pdf. Accessed May 25, 2014.
- . Physician Characteristics and Distribution in the US. 2013 ed. Chicago, IL: American Medical Association; 2013.
- , , , et al. The role of black and Hispanic physicians in providing health care for underserved populations. N Engl J Med. 1996;334:1305–1310.
- , , . The association among specialty, race, ethnicity, and practice location among California physicians in diverse Specialties. J Natl Med Assoc. 2012;104:46–52.
- , , , , Patient‐physician racial concordance and the perceived quality and use of health care. Arch Intern Med. 1999;159:997–1004.
- , . Race of physician and satisfaction with care among African‐American patients. J Natl Med Assoc. 2002;94:937–943.
- U.S. Department of Health and Human Services Health Resources and Services Administration Bureau of Health Professions. The rational for diversity in health professions: a review of the evidence. 2006. Available at: http://bhpr.hrsa.gov/healthworkforce/reports/diversityreviewevidence.pdf. Accessed March 30, 2014.
- . Association of American Medical Colleges. Diversity in medical education: facts and figures 2012. Available at: https://members.aamc.org/eweb/upload/Diversity%20in%20Medical%20Ed ucation%20Facts%20and%20Figures%202012.pdf. Accessed February 28, 2013.
- , , . The leaky pipeline: factors associated with early decline in interest in premedical studies among underrepresented minority undergraduate students. Acad Med. 2008;83:503–511.
- , . Perspective: adopting an asset bundles model to support and advance minority students' careers in academic medicine and the scientific pipeline. Acad Med. 2012;87:1488–1495.
- , , , . Contributors of black men's success in admission to and graduation from medical school. Acad Med. 2011;86:892–900.
- , . Premed survival: understanding the culling process in premedical undergraduate education. Acad Med. 2002;77:719–724.
- , , , . A novel enrichment program using cascading mentorship to increase diversity in the health care professions. Acad Med. 2013;88:1232–1238.
- , . A social and academic enrichment program promotes medical school matriculation and graduation for disadvantaged students. Educ Health. 2012;25:55–63.
- , , , . Addressing medical school diversity through an undergraduate partnership at Texas A83:512–515.
The fraction of the US population identifying themselves as ethnic minorities was 36% in 2010 and will exceed 50% by 2050.[1, 2] This has resulted in an increasing gap in healthcare, as minorities have well‐documented disparities in access to healthcare and a disproportionately high morbidity and mortality.[3] In 2008, only 12.3% of US physicians were from under‐represented minority (URM) groups (see Figure in Castillo‐Page 4) (ie, those racial and ethnic populations that are underrepresented in the medical profession relative to their numbers in the general population as defined by the American Association of Medical Colleges[4, 5]). Diversifying the healthcare workforce may be an effective approach to reducing healthcare disparities, as URM physicians are more likely to choose primary care specialties,[6] work in underserved communities with socioeconomic or racial mixes similar to their own, thereby increasing access to care,[6, 7, 8] increasing minority patient satisfaction, and improving the quality of care received by minorities.[9, 10, 11]
The number of URM students attending medical school is slowly increasing, but in 2011, only 15% of the matriculating medical school students were URMs (see Figure 12 and Table 10 in Castillo‐Page[12]), and medical schools actively compete for this limited number of applicants. To increase the pool of qualified candidates, more URM students need to graduate college and pursue postgraduate healthcare training.[12]
URM undergraduate freshmen with intentions to enter medical school are 50% less likely to apply to medical school by the time they are seniors than their non‐Latino, white, and Asian counterparts.[13] Higher attrition rates have been linked to students having negative experiences in the basic science courses and with a lack of role models and exposure to careers in healthcare.[13, 14, 15, 16] We developed a hospitalist‐led mentoring program that was focused on overcoming these perceived limitations. This report describes the program and follow‐up data from our first year cohort documenting its success.
METHODS
The Healthcare Interest Program (HIP) was developed by 2 hospitalists (L. C., E. C.) and a physician's assistant (C. N.) who worked at Denver Health (DH), a university‐affiliated public hospital. We worked in conjunction with the chief diversity officer of the University of Colorado, Denver (UCD), primarily a commuter university in metropolitan Denver, where URMs composed 51% of the 2011 freshmen class. We reviewed articles describing mentoring programs for undergraduate students, and by consensus, designed a 7‐component program, each of which was intended to address a specific barrier identified in the literature as possibly contributing to reduced interest of minority students in pursuing medical careers (Table 1).[13, 14, 15, 16]
| Component | Goal |
|---|---|
| Clinical shadowing | |
| Student meets with their mentor and/or with other healthcare providers (eg, pharmacist, nurse) 4 hours per day, 1 or 2 times per month. | Expose students to various healthcare careers and to care for underserved patients. |
| Mentoring | |
| Student meets with their mentor for life coaching, career counseling, and to learn interviewing techniques 4 hours per month | Expand ideas of opportunity, address barriers or concerns before they affect grades, write letter of recommendation |
| Books to Bedside lectures | |
| One lecture per month designed to integrate clinical medicine with the undergraduate basic sciences. Sample lectures include: The Physics of Electrocardiograms and The Biochemistry of Diabetic Ketoacidosis | Improve the undergraduate experience in the basic science courses |
| Book club | |
| Group discussions of books selected for their focus on healthcare disparities and cultural diversity; 2 or 3 books per year (eg, The Spirit Catches You and You Fall Down by Ann Fadiman, Just Like Us by Helen Thorpe) | Socialize, begin to understand and discuss health disparities and caring for the underserved. |
| Diversity lectures | |
| Three speakers per term, each discussing different aspects of health disparities research being conducted in the Denver metropolitan area | Understand the disparities affecting the students' communities. Inspire interest in becoming involved with research. |
| Social events | |
| Kickoff, winter, and end‐of‐year gatherings | Socializing, peer group support |
| Journaling and reflection essay | |
| Summary of hospital experience with mentor and thoughts regarding healthcare career goals and plans. | Formalize career goals |
During the 2009 to 2010 academic year, information about the program, together with an application, was e‐mailed to all students at UCD who self‐identified as having interest in healthcare careers. This information was also distributed at all prehealth clubs and gatherings (ie, to students expressing interest in graduate and professional programs in healthcare‐related fields). All sophomore and junior students who submitted an application and had grade point averages (GPA) 2.8 were interviewed by the program director. Twenty‐three students were selected on the basis of their GPAs (attempting to include those with a range of GPAs), interviews, and the essays prepared as part of their applications.
An e‐mail soliciting mentors was sent to all hospitalists physicians and midlevels working at DH; 25/30 volunteered, and 20 were selected on the basis of their gender (as mentors were matched to students based on gender). The HIP director met with the mentors in person to introduce the program and its goals. All mentors had been practicing hospital medicine for 10 years after their training, and all but 3 were non‐Latino white. Each student accepted into the program was paired with a hospitalist who served as their mentor for the year.
The mentors were instructed in life coaching in both e‐mails and individual discussions. Every 2 or 3 months each hospitalist was contacted by e‐mail to see if questions or problems had arisen and to emphasize the need to meet with their mentees monthly.
Students filled out a written survey after each Books‐to‐Bedside (described in Table 1) discussion. The HIP director met with each student for at least 1 hour per semester and gathered feedback regarding mentor‐mentee success, shadowing experience, and the quality of the book club. At the end of the academic year, students completed a written, anonymous survey assessing their impressions of the program and their intentions of pursuing additional training in healthcare careers (Table 2). We used descriptive statistics to analyze the data including frequencies and mean tests.
|
| Open‐ended questions: |
| 1. How did HIP or your HIP mentor affect your application to your healthcare field of interest (eg, letter of recommendation, clinical hours, change in healthcare career of interest)? |
| 2. How did the Books to Bedside presentation affect you? |
| 3. My healthcare professional school of interest is (eg, medical school, nursing school, physician assistant school, pharmacy school, physical therapy school, dental school). |
| 4. How many times per month were you able to shadow at Denver Health? |
| 5. How would you revise the program to improve it? |
| Yes/no questions: |
| 1. English is my primary language. |
| 2. I am the first in my immediate family to attend college |
| 3. Did you work while in school? |
| 4. Did you receive scholarships while in school? |
| 5. Prior to participating in this program, I had a role model in my healthcare field of interest. |
| 6. My role model is my HIP mentor. |
| 7. May we contact you in 2 to 3 years to obtain information regarding your acceptance into your healthcare field of interest? |
| Likert 5‐point questions: |
| 1. Participation in HIP expanded my perceptions of what I could accomplish in the healthcare field. |
| 2. Participation in HIP has increased my confidence that I will be accepted into my healthcare field of choice. |
| 3. I intend to go to my healthcare school in the state of Colorado. |
| 4. One of my long‐term goals is to work with people with health disparities (eg, underserved). |
| 5. One of my long‐term goals is to work in a rural environment. |
| 6. I have access to my prehealth advisors. |
| 7. I have access to my HIP mentor. |
| 8. Outside of the HIP, I have had access to clinical experience shadowing with a physician or physician assistant. |
| 9. If not accepted the first time, I will reapply to my healthcare field of interest. |
| 10. I would recommend HIP to my colleagues. |
Two years after completing the program, each student was contacted via e‐mail and/or phone to determine whether they were still pursuing healthcare careers.
RESULTS
Twenty‐three students were accepted into the program (14 female, 9 male, mean age 19 [standard deviation1]). Their GPAs ranged from 2.8 to 4.0. Eleven (48%) were the first in their family to attend college, 6 (26%) indicated that English was not their primary language, and 16 (70%) were working while attending school. All 23 students stayed in the HIP program for the full academic year.
Nineteen of the 23 students (83%) completed the survey at the end of the year. Of these, 19 (100%) strongly agreed that the HIP expanded their perceptions of what they might accomplish and increased their confidence in being able to succeed in a healthcare profession. All 19 (100%) stated that they hoped to care for underserved minority patients in the future. Sixteen (84%) strongly agreed that their role model in life was their HIP mentor. These findings suggest that many of the HIP components successfully accomplished their goals (Table 1).
Two‐year follow‐up was available for 21 of the 23 students (91%). Twenty (95%) remained committed to a career in healthcare, 18 (86%) had graduated college, 6 (29%) were enrolled in graduate training in the healthcare professions (2 in medical school, 1 in nursing school, and 3 in a master's programs in public health, counseling, and medical science, respectively), and 9 (43%) were in the process of applying to postgraduate healthcare training programs (7 to medical school, 1 to dental school, and 1 to nursing school, respectively). Five students were preparing to take the Medical College Admissions Test, and 7 were working at various jobs in the healthcare field (eg, phlebotomists, certified nurse assistants, research assistants). Of the 16 students who expressed an interest in attending medical school at the beginning of the program, 15 (94%) maintained that interest.
DISCUSSION
HIP was extremely well‐received by the participating students, the majority graduated college and remained committed to a career in healthcare, and 29% were enrolled in postgraduate training in healthcare professions 2 years after graduation.
The 86% graduation rate that we observed compares highly favorably to the UCD campus‐wide graduation rates for minority students of 12.5% at 4 years and 30.8% at 5 years. Although there may be selection bias in the students participating in HIP, the extremely high graduation rate is consistent with HIP meeting 1 or more of its stated objectives.
Many universities have prehealthcare pipeline programs that are designed to provide short‐term summer medical experiences, research opportunities, and assistance with the Medical College Admissions Test.[17, 18, 19] We believe, however, that several aspects of our program are unique. First, we designed HIP to be year‐long, rather than a summertime program. Continuing the mentoring and life coaching throughout the year may allow stronger relationships to develop between the mentor and the student. In addition, ongoing student‐mentor interactions during the time when a student may be encountering problems with their undergraduate basic science courses may be beneficial. Second, the Books‐to‐Bedside lectures series, which was designed to link the students' basic science training with clinical medicine, has not previously been described and may contribute to a higher rate of completion of their basic science training. Third, those aspects of the program resulting in increased peer interactions (eg, book club discussions, diversity lectures, and social gatherings) provided an important venue for students with similar interests to interact, an opportunity that is limited at UCD as it is primarily a commuter university.
A number of lessons were learned during the first year of the program. First, a program such as ours must include rigorous evaluation from the start to make a case for support to the university and key stakeholders. With this in mind, it is possible to obtain funding and ensure long‐term sustainability. Second, by involving UCD's chief diversity officer in the development, the program fostered a strong partnership between DH and UCD and facilitated growing the program. Third, the hospitalists who attended the diversity‐training aspects of the program stated through informal feedback that they felt better equipped to care for the underserved and felt that providing mentorship increased their personal job satisfaction. Fourth, the students requested more opportunities for them to participate in health disparities research and in shadowing in subspecialties in addition to internal medicine. In response to this feedback, we now offer research opportunities, lectures on health disparities research, and interactions with community leaders working in improving healthcare for the underserved.
Although influencing the graduation rate from graduate level schooling is beyond the scope of HIP, we can conclude that the large majority of students participating in HIP maintained their interest in the healthcare professions, graduated college, and that many went on to postgraduate healthcare training. The data we present pertain to the cohort of students in the first year of the HIP. As the program matures, we will continue to evaluate the long‐term outcomes of our students and hospitalist mentors. This may provide opportunities for other academic hospitalists to replicate our program in their own communities.
ACKNOWLEDGMENTS
Disclosure: The authors report no conflicts of interest.
- United States Census Bureau. An older and more diverse nation by midcentury. Available at: https://www.census.gov/newsroom/releases/archives/population/cb08–123.html. Accessed February 28, 2013.
- United States Census Bureau. State and county quick facts. Available at: http://quickfacts.census.gov/qfd/states/00000.html. Accessed February 28, 2013.
- Centers for Disease Control and Prevention. Surveillance of health status in minority communities—racial and ethnic approaches to community health across the U.S. (REACH US) risk factor survey, United States, 2009. Available at: http://cdc.gov/mmwr/preview/mmwrhtml/ss6006a1.htm. Accessed February 28, 2013.
- Association of American Medical Colleges. Diversity in the physician workforce: facts and figures 2010. Available at: https://members.aamc.org/eweb/upload/Diversity%20in%20the%20 Physician%20Workforce%20Facts%20and%20Figures%202010.pdf. Accessed April 29, 2014.
- Association of American Medical Colleges Executive Committee. The status of the new AAMC definition of “underrepresented in medicine” following the Supreme Court's decision in Grutter. Available at: https://www.aamc.org/download/54278/data/urm.pdf. Accessed May 25, 2014.
- . Physician Characteristics and Distribution in the US. 2013 ed. Chicago, IL: American Medical Association; 2013.
- , , , et al. The role of black and Hispanic physicians in providing health care for underserved populations. N Engl J Med. 1996;334:1305–1310.
- , , . The association among specialty, race, ethnicity, and practice location among California physicians in diverse Specialties. J Natl Med Assoc. 2012;104:46–52.
- , , , , Patient‐physician racial concordance and the perceived quality and use of health care. Arch Intern Med. 1999;159:997–1004.
- , . Race of physician and satisfaction with care among African‐American patients. J Natl Med Assoc. 2002;94:937–943.
- U.S. Department of Health and Human Services Health Resources and Services Administration Bureau of Health Professions. The rational for diversity in health professions: a review of the evidence. 2006. Available at: http://bhpr.hrsa.gov/healthworkforce/reports/diversityreviewevidence.pdf. Accessed March 30, 2014.
- . Association of American Medical Colleges. Diversity in medical education: facts and figures 2012. Available at: https://members.aamc.org/eweb/upload/Diversity%20in%20Medical%20Ed ucation%20Facts%20and%20Figures%202012.pdf. Accessed February 28, 2013.
- , , . The leaky pipeline: factors associated with early decline in interest in premedical studies among underrepresented minority undergraduate students. Acad Med. 2008;83:503–511.
- , . Perspective: adopting an asset bundles model to support and advance minority students' careers in academic medicine and the scientific pipeline. Acad Med. 2012;87:1488–1495.
- , , , . Contributors of black men's success in admission to and graduation from medical school. Acad Med. 2011;86:892–900.
- , . Premed survival: understanding the culling process in premedical undergraduate education. Acad Med. 2002;77:719–724.
- , , , . A novel enrichment program using cascading mentorship to increase diversity in the health care professions. Acad Med. 2013;88:1232–1238.
- , . A social and academic enrichment program promotes medical school matriculation and graduation for disadvantaged students. Educ Health. 2012;25:55–63.
- , , , . Addressing medical school diversity through an undergraduate partnership at Texas A83:512–515.
Blood Cultures in Nonpneumonia Illness
In 2002, based on consensus practice guidelines,[1] the Centers for Medicare and Medicaid Services (CMS) and the Joint Commission on Accreditation of Healthcare Organizations (JCAHO) announced a core measure mandating the collection of routine blood cultures in the emergency department (ED) for all patients hospitalized with community‐acquired pneumonia (CAP) to benchmark the quality of hospital care. However, due to the limited utility and false‐positive results of routine blood cultures,[2, 3, 4, 5, 6] performance measures and practice guidelines were modified in 2005 and 2007, respectively, to recommend routine collection in only the sickest patients with CAP.[2, 7] Despite recommendations for a more narrow set of indications, the collection of blood cultures in patients hospitalized with CAP continued to increase.[8]
Distinguishing CAP from other respiratory illnesses may be challenging. Among patients presenting to the ED with an acute respiratory illness, only a minority of patients (10%30%) are diagnosed with pneumonia.[9] Therefore, the harms and costs of inappropriate diagnostic tests for CAP may be further magnified if applied to a larger population of patients who present to the ED with similar clinical signs and symptoms as pneumonia. Using a national sample of ED visits, we examined whether there was a similar increase in the frequency of blood culture collection among patients who were hospitalized with respiratory symptoms due to an illness other than pneumonia.
METHOD
Study Design, Setting, and Participants
We performed a cross‐sectional analysis using data from the 2002 to 2010 National Hospital Ambulatory Medical Care Surveys (NHAMCS), a probability sample of visits to EDs of noninstitutional general and short‐stay hospitals in the United States, excluding federal, military, and Veterans Administration hospitals.[10] The NHAMCS data are derived through multistage sampling and estimation procedures that produce unbiased national estimates.[11] Further details regarding the sampling and estimation procedures can be found on the US Centers for Disease Control and Prevention website.[10, 11] Years 2005 and 2006 are omitted because NHAMCS did not collect blood culture use during this period. We included all visits by patients aged 18 years or older who were subsequently hospitalized.
Measurements
Trained hospital staff collected data with oversight from US Census Bureau field representatives.[12] Blood culture collection during the visit was recorded as a checkbox on the NHAMCS data collection form if at least 1 culture was ordered or collected in the ED. Visits for conditions that may resemble pneumonia were defined as visits with a respiratory symptom listed for at least 1 of the 3 reason for visit fields, excluding those visits admitted with a diagnosis of pneumonia (International Classification of Diseases, 9th Revision, Clinical Modification [ICD‐9‐CM] codes 481.xx‐486.xx). The reason for visit field captures the patient's complaints, symptoms, or other reasons for the visit in the patient's own words. CAP was defined by having 1 of the 3 ED provider's diagnosis fields coded as pneumonia (ICD‐9‐CM 481486), excluding patients with suspected hospital‐acquired pneumonia (nursing home or institutionalized resident, seen in the ED in the past 72 hours, or discharged from any hospital within the past 7 days) or those with a follow‐up visit for the same problem.[8]
Data Analysis
All analyses accounted for the complex survey design, including weights, to reflect national estimates. To examine for potential spillover effects of the blood culture recommendations for CAP on other conditions that may present similarly, we used linear regression to examine the trend in collecting blood cultures in patients admitted to the hospital with respiratory symptoms due to a nonpneumonia illness.
The data were analyzed using Stata statistical software, version 12.0 (StataCorp, College Station, TX). This study was exempt from review by the institutional review board of the University of California, San Francisco and the San Francisco Veterans Affairs Medical Center.
RESULTS
This study included 4854 ED visits, representing approximately 17 million visits by adult patients hospitalized with respiratory symptoms due to a nonpneumonia illness. The most common primary ED provider's diagnoses for these visits included heart failure (15.9%), chronic obstructive pulmonary disease (12.6%), chest pain (11.9%), respiratory insufficiency or failure (8.8%), and asthma (5.5%). The characteristics of these visits are shown in Table 1.
| Years 20022004, Weighted % (Unweighted N=2,175)b | Years 20072008, Weighted % (Unweighted N=1,346)b | Years 20092010, Weighted % (Unweighted N=1,333)b | |
|---|---|---|---|
| |||
| Blood culture collected | 9.8 | 14.4 | 19.9 |
| Demographics | |||
| Age 65 years | 56.9 | 55.1 | 50.9 |
| Female | 54.0 | 57.5 | 51.3 |
| Race/ethnicity | |||
| White, non‐Hispanic | 71.5c | 69.5 | 67.2 |
| Black, non‐Hispanic | 17.1c | 20.8 | 22.2 |
| Other | 11.3c | 9.7 | 10.6 |
| Primary payer | |||
| Private insurance | 23.4 | 19.1 | 19.1 |
| Medicare | 55.2 | 58.0 | 54.2 |
| Medicaid | 10.0 | 10.5 | 13.8 |
| Other/unknown | 11.4 | 12.4 | 13.0 |
| Visit characteristics | |||
| Disposition status | |||
| Non‐ICU | 86.8 | 85.5 | 83.3 |
| ICU | 13.2 | 14.5 | 16.7 |
| Fever (38.0C) | 6.1 | 5.3 | 4.8 |
| Hypoxia (90%)d | 11.5 | 10.9 | |
| Emergent status by triage | 46.1 | 44.5 | 35.8 |
| Administered antibiotics | 19.6 | 24.6 | 24.8 |
| Tests/services ordered in ED | |||
| 05 | 29.9 | 29.1 | 22.3 |
| 610 | 43.5 | 58.3 | 56.1 |
| >10 | 26.6 | 12.6 | 21.6 |
| ED characteristics | |||
| Region | |||
| West | 16.6 | 18.2 | 15.8 |
| Midwest | 27.1 | 25.2 | 22.8 |
| South | 32.8 | 36.4 | 38.6 |
| Northeast | 23.5 | 20.2 | 22.7 |
| Hospital owner | |||
| Nonprofit | 80.6 | 84.6 | 80.7 |
| Government | 12.1 | 6.4 | 13.0 |
| Private | 7.4 | 9.0 | 6.3 |
The proportion of blood cultures collected in the ED for patients hospitalized with respiratory symptoms due to a nonpneumonia illness increased from 9.9% (95% confidence interval [CI]: 7.1%‐13.5%) in 2002 to 20.4% (95% CI: 16.1%‐25.6%) in 2010 (P0.001 for the trend). This observed increase paralleled the increase in the frequency of culture collection in patients hospitalized with CAP (P=0.12 for the difference in temporal trends). The estimated absolute number of visits for respiratory symptoms due a nonpneumonia illness with a blood culture collected increased from 211,000 (95% CI: 126,000296,000) in 2002 to 526,000 (95% CI: 361,000692,000) in 2010, which was similar in magnitude to the estimated number of visits for CAP with a culture collected (Table 2).
| National Weighted Estimates (95% CI) | ||||||||
|---|---|---|---|---|---|---|---|---|
| ||||||||
| Condition | 2002 | 2003 | 2004 | 2007 | 2008 | 2009 | 2010 | P Valueb |
| Respiratory symptomc | ||||||||
| % | 9.9 (7.113.5) | 9.2 (6.912.2) | 10.6 (7.914.1) | 13.5 (10.117.8) | 15.2 (12.118.8) | 19.4 (15.923.5) | 20.4 (16.125.6) | 0.001 |
| No., thousands | 211 (126296) | 229 (140319) | 212 (140285) | 287 (191382) | 418 (288548) | 486 (344627) | 526 (361692) | |
| CAP | ||||||||
| % | 29.4 (21.938.3) | 34.2 (25.943.6) | 38.4 (31.045.4) | 45.7 (35.456.4) | 44.1 (34.154.6) | 46.7 (37.456.1) | 51.1 (41.860.3) | 0.027 |
| No., thousands | 155 (100210) | 287 (177397) | 276 (192361) | 277 (173381) | 361 (255467) | 350 (237464) | 428 (283574) | |
DISCUSSION
In this national study of ED visits, we found that the collection of blood cultures in patients hospitalized with respiratory symptoms due to an illness other than pneumonia continued to increase from 2002 to 2010 in a parallel fashion to the trend observed for patients hospitalized with CAP. Our findings suggest that the heightened attention of collecting blood cultures for suspected pneumonia had unintended consequences, which led to an increase in the collection of blood cultures in patients hospitalized with conditions that mimic pneumonia in the ED.
There can be a great deal of diagnostic uncertainty when treating patients in the ED who present with acute respiratory symptoms. Unfortunately, the initial history and physical exam are often insufficient to effectively rule in CAP.[13] Furthermore, the challenge of diagnosing pneumonia is amplified in the subset of patients who present with evolving, atypical, or occult disease. Faced with this diagnostic uncertainty, ED providers may feel pressured to comply with performance measures for CAP, promoting the overuse of inappropriate diagnostic tests and treatments. For instance, efforts to comply with early antibiotic administration in patients with CAP have led to an increase in unnecessary antibiotic use among patients with a diagnosis other than CAP.[14] Due to concerns for these unintended consequences, the core measure for early antibiotic administration was effectively retired in 2012.
Although a smaller percentage of ED visits for respiratory symptoms had a blood culture collected compared to CAP visits, there was a similar absolute number of visits with a blood culture collected during the study period. While a fraction of these patients may present with an infectious etiology aside from pneumonia, the majority of these cases likely represent situations where blood cultures add little diagnostic value at the expense of potentially longer hospital stays and broad spectrum antimicrobial use due to false‐positive results,[5, 15] as well as higher costs incurred by the test itself.[15, 16]
Although recommendations for routine culture collection for all patients hospitalized with CAP have been revised, the JCAHO/CMS core measure (PN‐3b) announced in 2002 mandates that if a culture is collected in the ED, it should be collected prior to antibiotic administration. Due to inherent uncertainty and challenges in making a timely diagnosis of pneumonia, this measure may encourage providers to reflexively order cultures in all patients presenting with respiratory symptoms in whom antibiotic administration is anticipated. The observed increasing trend in culture collection in patients hospitalized with respiratory symptoms due to a nonpneumonia illness should prompt JCAHO and CMS to reevaluate the risks and benefits of this core measure, with consideration of eliminating it altogether to discourage overuse in this population.
Our study had certain limitations. First, the omission of 2005 and 2006 data prohibited an evaluation of whether culture rates slowed down among patients hospitalized with respiratory symptoms due to a nonpneumonia illness after revisions in recommendations for obtaining cultures in patients with CAP. Second, there may have been misclassification of culture collection due to errors in chart abstraction. However, abstraction errors in the NHAMCS typically result in undercoding.[17] Therefore, our findings likely underestimate the magnitude and frequency of culture collection in this population.
In conclusion, collecting blood cultures in the ED for patients hospitalized with respiratory symptoms due to a nonpneumonia illness has increased in a parallel fashion compared to the trend in culture collection in patients hospitalized with CAP from 2002 to 2010. This suggests an important potential unintended consequence of blood culture recommendations for CAP on patients who present with conditions that resemble pneumonia. More attention to the judicious use of blood cultures in these patients to reduce harm and costs is needed.
ACKNOWLEDGEMENT
Disclosures: Dr. Makam's work on this project was completed while he was a Primary Care Research Fellow at the University of California San Francisco, funded by an NRSA training grant (T32HP19025‐07‐00). The authors report no conflicts of interest.
- , , , , , . Practice guidelines for the management of community‐acquired pneumonia in adults. Infectious Diseases Society of America. Clin Infect Dis. 2000;31(2):347–382.
- , , , et al. Infectious Diseases Society of America/American Thoracic Society consensus guidelines on the management of community‐acquired pneumonia in adults. Clin Infect Dis. 2007;44(suppl 2):S27–S72.
- , , , , . The contribution of blood cultures to the clinical management of adult patients admitted to the hospital with community‐acquired pneumonia: a prospective observational study. Chest. 2003;123(4):1142–1150.
- , , , , , . Do emergency department blood cultures change practice in patients with pneumonia? Ann Emerg Med. 2005;46(5):393–400.
- , , , . Predicting bacteremia in patients with community‐acquired pneumonia. Am J Respir Crit Care Med. 2004;169(3):342–347.
- , . The influence of the severity of community‐acquired pneumonia on the usefulness of blood cultures. Respir Med. 2001;95(1):78–82.
- , . The Joint Commission on Accreditation of Healthcare Organizations and Center for Medicare and Medicaid Services community‐acquired pneumonia initiative: what went wrong? Ann Emerg Med. 2005;46(5):409–411.
- , , . Blood culture use in the emergency department in patients hospitalized for community‐acquired pneumonia [published online ahead of print March 10, 2014]. JAMA Intern Med. doi: 10.1001/jamainternmed.2013.13808.
- , , , et al. Clinical prediction rule for pulmonary infiltrates. Ann Intern Med. 1990;113(9):664–670.
- Centers for Disease Control and Prevention. NHAMCS scope and sample design. Available at: http://www.cdc.gov/nchs/ahcd/ahcd_scope.htm#nhamcs_scope. Accessed May 27, 2013.
- Centers for Disease Control and Prevention. NHAMCS estimation procedures. http://www.cdc.gov/nchs/ahcd/ahcd_estimation_procedures.htm#nhamcs_procedures. Updated January 15, 2010. Accessed May 27, 2013.
- , , , et al. NHAMCS: does it hold up to scrutiny? Ann Emerg Med. 2013;62(5):549–551.
- , , . Does this patient have community‐acquired pneumonia? Diagnosing pneumonia by history and physical examination. JAMA. 1997;278(17):1440–1445.
- , , , . Misdiagnosis of community‐acquired pneumonia and inappropriate utilization of antibiotics: side effects of the 4‐h antibiotic administration rule. Chest. 2007;131(6):1865–1869.
- , , . Contaminant blood cultures and resource utilization. The true consequences of false‐positive results. JAMA. 1991;265(3):365–369.
- , . Analysis of strategies to improve cost effectiveness of blood cultures. J Hosp Med. 2006;1(5):272–276.
- . NHAMCS: does it hold up to scrutiny? Ann Emerg Med. 2012;60(6):722–725.
In 2002, based on consensus practice guidelines,[1] the Centers for Medicare and Medicaid Services (CMS) and the Joint Commission on Accreditation of Healthcare Organizations (JCAHO) announced a core measure mandating the collection of routine blood cultures in the emergency department (ED) for all patients hospitalized with community‐acquired pneumonia (CAP) to benchmark the quality of hospital care. However, due to the limited utility and false‐positive results of routine blood cultures,[2, 3, 4, 5, 6] performance measures and practice guidelines were modified in 2005 and 2007, respectively, to recommend routine collection in only the sickest patients with CAP.[2, 7] Despite recommendations for a more narrow set of indications, the collection of blood cultures in patients hospitalized with CAP continued to increase.[8]
Distinguishing CAP from other respiratory illnesses may be challenging. Among patients presenting to the ED with an acute respiratory illness, only a minority of patients (10%30%) are diagnosed with pneumonia.[9] Therefore, the harms and costs of inappropriate diagnostic tests for CAP may be further magnified if applied to a larger population of patients who present to the ED with similar clinical signs and symptoms as pneumonia. Using a national sample of ED visits, we examined whether there was a similar increase in the frequency of blood culture collection among patients who were hospitalized with respiratory symptoms due to an illness other than pneumonia.
METHOD
Study Design, Setting, and Participants
We performed a cross‐sectional analysis using data from the 2002 to 2010 National Hospital Ambulatory Medical Care Surveys (NHAMCS), a probability sample of visits to EDs of noninstitutional general and short‐stay hospitals in the United States, excluding federal, military, and Veterans Administration hospitals.[10] The NHAMCS data are derived through multistage sampling and estimation procedures that produce unbiased national estimates.[11] Further details regarding the sampling and estimation procedures can be found on the US Centers for Disease Control and Prevention website.[10, 11] Years 2005 and 2006 are omitted because NHAMCS did not collect blood culture use during this period. We included all visits by patients aged 18 years or older who were subsequently hospitalized.
Measurements
Trained hospital staff collected data with oversight from US Census Bureau field representatives.[12] Blood culture collection during the visit was recorded as a checkbox on the NHAMCS data collection form if at least 1 culture was ordered or collected in the ED. Visits for conditions that may resemble pneumonia were defined as visits with a respiratory symptom listed for at least 1 of the 3 reason for visit fields, excluding those visits admitted with a diagnosis of pneumonia (International Classification of Diseases, 9th Revision, Clinical Modification [ICD‐9‐CM] codes 481.xx‐486.xx). The reason for visit field captures the patient's complaints, symptoms, or other reasons for the visit in the patient's own words. CAP was defined by having 1 of the 3 ED provider's diagnosis fields coded as pneumonia (ICD‐9‐CM 481486), excluding patients with suspected hospital‐acquired pneumonia (nursing home or institutionalized resident, seen in the ED in the past 72 hours, or discharged from any hospital within the past 7 days) or those with a follow‐up visit for the same problem.[8]
Data Analysis
All analyses accounted for the complex survey design, including weights, to reflect national estimates. To examine for potential spillover effects of the blood culture recommendations for CAP on other conditions that may present similarly, we used linear regression to examine the trend in collecting blood cultures in patients admitted to the hospital with respiratory symptoms due to a nonpneumonia illness.
The data were analyzed using Stata statistical software, version 12.0 (StataCorp, College Station, TX). This study was exempt from review by the institutional review board of the University of California, San Francisco and the San Francisco Veterans Affairs Medical Center.
RESULTS
This study included 4854 ED visits, representing approximately 17 million visits by adult patients hospitalized with respiratory symptoms due to a nonpneumonia illness. The most common primary ED provider's diagnoses for these visits included heart failure (15.9%), chronic obstructive pulmonary disease (12.6%), chest pain (11.9%), respiratory insufficiency or failure (8.8%), and asthma (5.5%). The characteristics of these visits are shown in Table 1.
| Years 20022004, Weighted % (Unweighted N=2,175)b | Years 20072008, Weighted % (Unweighted N=1,346)b | Years 20092010, Weighted % (Unweighted N=1,333)b | |
|---|---|---|---|
| |||
| Blood culture collected | 9.8 | 14.4 | 19.9 |
| Demographics | |||
| Age 65 years | 56.9 | 55.1 | 50.9 |
| Female | 54.0 | 57.5 | 51.3 |
| Race/ethnicity | |||
| White, non‐Hispanic | 71.5c | 69.5 | 67.2 |
| Black, non‐Hispanic | 17.1c | 20.8 | 22.2 |
| Other | 11.3c | 9.7 | 10.6 |
| Primary payer | |||
| Private insurance | 23.4 | 19.1 | 19.1 |
| Medicare | 55.2 | 58.0 | 54.2 |
| Medicaid | 10.0 | 10.5 | 13.8 |
| Other/unknown | 11.4 | 12.4 | 13.0 |
| Visit characteristics | |||
| Disposition status | |||
| Non‐ICU | 86.8 | 85.5 | 83.3 |
| ICU | 13.2 | 14.5 | 16.7 |
| Fever (38.0C) | 6.1 | 5.3 | 4.8 |
| Hypoxia (90%)d | 11.5 | 10.9 | |
| Emergent status by triage | 46.1 | 44.5 | 35.8 |
| Administered antibiotics | 19.6 | 24.6 | 24.8 |
| Tests/services ordered in ED | |||
| 05 | 29.9 | 29.1 | 22.3 |
| 610 | 43.5 | 58.3 | 56.1 |
| >10 | 26.6 | 12.6 | 21.6 |
| ED characteristics | |||
| Region | |||
| West | 16.6 | 18.2 | 15.8 |
| Midwest | 27.1 | 25.2 | 22.8 |
| South | 32.8 | 36.4 | 38.6 |
| Northeast | 23.5 | 20.2 | 22.7 |
| Hospital owner | |||
| Nonprofit | 80.6 | 84.6 | 80.7 |
| Government | 12.1 | 6.4 | 13.0 |
| Private | 7.4 | 9.0 | 6.3 |
The proportion of blood cultures collected in the ED for patients hospitalized with respiratory symptoms due to a nonpneumonia illness increased from 9.9% (95% confidence interval [CI]: 7.1%‐13.5%) in 2002 to 20.4% (95% CI: 16.1%‐25.6%) in 2010 (P0.001 for the trend). This observed increase paralleled the increase in the frequency of culture collection in patients hospitalized with CAP (P=0.12 for the difference in temporal trends). The estimated absolute number of visits for respiratory symptoms due a nonpneumonia illness with a blood culture collected increased from 211,000 (95% CI: 126,000296,000) in 2002 to 526,000 (95% CI: 361,000692,000) in 2010, which was similar in magnitude to the estimated number of visits for CAP with a culture collected (Table 2).
| National Weighted Estimates (95% CI) | ||||||||
|---|---|---|---|---|---|---|---|---|
| ||||||||
| Condition | 2002 | 2003 | 2004 | 2007 | 2008 | 2009 | 2010 | P Valueb |
| Respiratory symptomc | ||||||||
| % | 9.9 (7.113.5) | 9.2 (6.912.2) | 10.6 (7.914.1) | 13.5 (10.117.8) | 15.2 (12.118.8) | 19.4 (15.923.5) | 20.4 (16.125.6) | 0.001 |
| No., thousands | 211 (126296) | 229 (140319) | 212 (140285) | 287 (191382) | 418 (288548) | 486 (344627) | 526 (361692) | |
| CAP | ||||||||
| % | 29.4 (21.938.3) | 34.2 (25.943.6) | 38.4 (31.045.4) | 45.7 (35.456.4) | 44.1 (34.154.6) | 46.7 (37.456.1) | 51.1 (41.860.3) | 0.027 |
| No., thousands | 155 (100210) | 287 (177397) | 276 (192361) | 277 (173381) | 361 (255467) | 350 (237464) | 428 (283574) | |
DISCUSSION
In this national study of ED visits, we found that the collection of blood cultures in patients hospitalized with respiratory symptoms due to an illness other than pneumonia continued to increase from 2002 to 2010 in a parallel fashion to the trend observed for patients hospitalized with CAP. Our findings suggest that the heightened attention of collecting blood cultures for suspected pneumonia had unintended consequences, which led to an increase in the collection of blood cultures in patients hospitalized with conditions that mimic pneumonia in the ED.
There can be a great deal of diagnostic uncertainty when treating patients in the ED who present with acute respiratory symptoms. Unfortunately, the initial history and physical exam are often insufficient to effectively rule in CAP.[13] Furthermore, the challenge of diagnosing pneumonia is amplified in the subset of patients who present with evolving, atypical, or occult disease. Faced with this diagnostic uncertainty, ED providers may feel pressured to comply with performance measures for CAP, promoting the overuse of inappropriate diagnostic tests and treatments. For instance, efforts to comply with early antibiotic administration in patients with CAP have led to an increase in unnecessary antibiotic use among patients with a diagnosis other than CAP.[14] Due to concerns for these unintended consequences, the core measure for early antibiotic administration was effectively retired in 2012.
Although a smaller percentage of ED visits for respiratory symptoms had a blood culture collected compared to CAP visits, there was a similar absolute number of visits with a blood culture collected during the study period. While a fraction of these patients may present with an infectious etiology aside from pneumonia, the majority of these cases likely represent situations where blood cultures add little diagnostic value at the expense of potentially longer hospital stays and broad spectrum antimicrobial use due to false‐positive results,[5, 15] as well as higher costs incurred by the test itself.[15, 16]
Although recommendations for routine culture collection for all patients hospitalized with CAP have been revised, the JCAHO/CMS core measure (PN‐3b) announced in 2002 mandates that if a culture is collected in the ED, it should be collected prior to antibiotic administration. Due to inherent uncertainty and challenges in making a timely diagnosis of pneumonia, this measure may encourage providers to reflexively order cultures in all patients presenting with respiratory symptoms in whom antibiotic administration is anticipated. The observed increasing trend in culture collection in patients hospitalized with respiratory symptoms due to a nonpneumonia illness should prompt JCAHO and CMS to reevaluate the risks and benefits of this core measure, with consideration of eliminating it altogether to discourage overuse in this population.
Our study had certain limitations. First, the omission of 2005 and 2006 data prohibited an evaluation of whether culture rates slowed down among patients hospitalized with respiratory symptoms due to a nonpneumonia illness after revisions in recommendations for obtaining cultures in patients with CAP. Second, there may have been misclassification of culture collection due to errors in chart abstraction. However, abstraction errors in the NHAMCS typically result in undercoding.[17] Therefore, our findings likely underestimate the magnitude and frequency of culture collection in this population.
In conclusion, collecting blood cultures in the ED for patients hospitalized with respiratory symptoms due to a nonpneumonia illness has increased in a parallel fashion compared to the trend in culture collection in patients hospitalized with CAP from 2002 to 2010. This suggests an important potential unintended consequence of blood culture recommendations for CAP on patients who present with conditions that resemble pneumonia. More attention to the judicious use of blood cultures in these patients to reduce harm and costs is needed.
ACKNOWLEDGEMENT
Disclosures: Dr. Makam's work on this project was completed while he was a Primary Care Research Fellow at the University of California San Francisco, funded by an NRSA training grant (T32HP19025‐07‐00). The authors report no conflicts of interest.
- , , , , , . Practice guidelines for the management of community‐acquired pneumonia in adults. Infectious Diseases Society of America. Clin Infect Dis. 2000;31(2):347–382.
- , , , et al. Infectious Diseases Society of America/American Thoracic Society consensus guidelines on the management of community‐acquired pneumonia in adults. Clin Infect Dis. 2007;44(suppl 2):S27–S72.
- , , , , . The contribution of blood cultures to the clinical management of adult patients admitted to the hospital with community‐acquired pneumonia: a prospective observational study. Chest. 2003;123(4):1142–1150.
- , , , , , . Do emergency department blood cultures change practice in patients with pneumonia? Ann Emerg Med. 2005;46(5):393–400.
- , , , . Predicting bacteremia in patients with community‐acquired pneumonia. Am J Respir Crit Care Med. 2004;169(3):342–347.
- , . The influence of the severity of community‐acquired pneumonia on the usefulness of blood cultures. Respir Med. 2001;95(1):78–82.
- , . The Joint Commission on Accreditation of Healthcare Organizations and Center for Medicare and Medicaid Services community‐acquired pneumonia initiative: what went wrong? Ann Emerg Med. 2005;46(5):409–411.
- , , . Blood culture use in the emergency department in patients hospitalized for community‐acquired pneumonia [published online ahead of print March 10, 2014]. JAMA Intern Med. doi: 10.1001/jamainternmed.2013.13808.
- , , , et al. Clinical prediction rule for pulmonary infiltrates. Ann Intern Med. 1990;113(9):664–670.
- Centers for Disease Control and Prevention. NHAMCS scope and sample design. Available at: http://www.cdc.gov/nchs/ahcd/ahcd_scope.htm#nhamcs_scope. Accessed May 27, 2013.
- Centers for Disease Control and Prevention. NHAMCS estimation procedures. http://www.cdc.gov/nchs/ahcd/ahcd_estimation_procedures.htm#nhamcs_procedures. Updated January 15, 2010. Accessed May 27, 2013.
- , , , et al. NHAMCS: does it hold up to scrutiny? Ann Emerg Med. 2013;62(5):549–551.
- , , . Does this patient have community‐acquired pneumonia? Diagnosing pneumonia by history and physical examination. JAMA. 1997;278(17):1440–1445.
- , , , . Misdiagnosis of community‐acquired pneumonia and inappropriate utilization of antibiotics: side effects of the 4‐h antibiotic administration rule. Chest. 2007;131(6):1865–1869.
- , , . Contaminant blood cultures and resource utilization. The true consequences of false‐positive results. JAMA. 1991;265(3):365–369.
- , . Analysis of strategies to improve cost effectiveness of blood cultures. J Hosp Med. 2006;1(5):272–276.
- . NHAMCS: does it hold up to scrutiny? Ann Emerg Med. 2012;60(6):722–725.
Crowdsourcing Medical Expertise
The volume of existing knowledge and the pace of discovery in medical science challenge a clinician's ability to access relevant information at the point of care. Knowledge gaps that arise in practice usually involve matters related to diagnosis, drug therapy, or treatment.[1] In the clinical setting, healthcare providers (HCPs) answer questions using a variety of online and print resources. Ironically, HCPs often lack the training required to find details regarding uncommon disorders or complex medical decisions that are not easily found or well represented in the published literature.[2] Instead, HCPs turn to trusted colleagues who possess the necessary expertise.[3]
Closing the knowledge‐to‐practice gap involves a range of factual information and data derived from published evidence, anecdotal experience, as well as organization‐ and region‐specific practices.[4] The inability to codify both explicit and tacit information has been linked to variability in prescription practices, excessive use of surgical services, and delayed decisions involving the appropriate provision of end‐of‐life care.[5] Although electronic medical record systems are not configured to support peer collaboration,[6] alternative strategies including crowdsourcing has been used successfully in other domains to tap collective intelligence of skilled workers.[7] Crowdsourcing allows organizations to explore problems at low cost, gain access a wide range of complementary expertise, and capture large amounts of data for analysis.[8, 9] Although an increasing number of physicians use either smartphones or tablets on the job,[10] peer‐to‐peer medical crowdsourcing has not been investigated, despite the fact that processes involving team‐based clinical decision making are associated with better outcomes.[11] Here we field tested the mobile crowdsourcing application DocCHIRP (Crowdsourcing Health Information Retrieval Protocol for Doctors) and assessed user opinion regarding its utility in the clinical setting.
MATERIALS AND METHODS
DocCHIRP Program Design
The authors (M.W.H., J.B., H.K.) conceptualized and designed DocCHIRP for mobile (iOS [Apple Inc., Cupertino, CA] and Android [Google Inc., Mountain View, CA]) and desktop use. Email prompts and push notifications, which were modeled after the application VizWiz (Rochester Human Computer Interaction Group, University of Rochester, Rochester, NY), supported near real‐time communication between HCPs. According to recent US Food and Drug Administration guidelines, DocCHIRP is considered a medical reference,[12] intended to share domain‐specific knowledge on diagnosis, therapy, and other medically relevant topics. Devices were password protected and encrypted according to university standards. A typical workflow involves an index provider faced with a clinical question that sends a consult question to 1 or more trusted providers. The crowd receiving the notification responds when available using either free‐text responses or agree/disagree prompts (Figure 1A,B). Providers use preference settings to manage crowd membership, notification settings, and demographics describing their expertise.
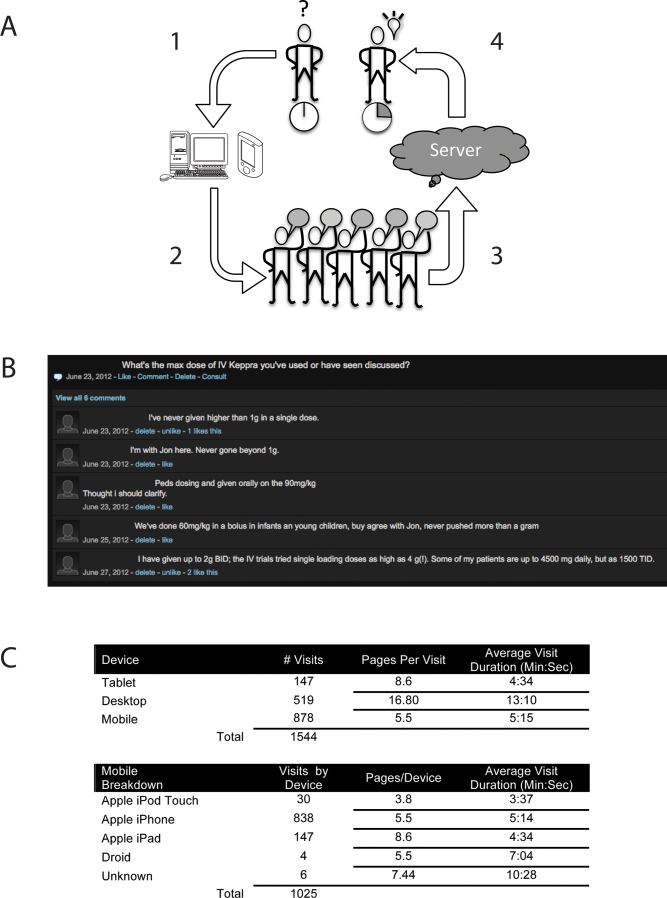
Trial Recruitment
The University of Rochester Research Subjects Review Board approved the study, in which prospective users were required to review and agree to a statement regarding potential liability as part of the consent process. In this pilot study, we invited a cross‐section of providers (n = 145) from the Departments of Neurology (including the Division of Pediatric Neurology), Pediatrics, Neuroradiology, Psychiatry, Orthopedics, Emergency Medicine, Internal Medicine, and Family Medicine to participate. E‐mail invitations were sent to HCPs in 3 phases in April (phase I), June (phase II), and August (phase III) over 244 consecutive days. At the conclusion of the trial, 85 HCPs (59%) had created accounts including attending physicians (n = 63), residents (n = 13), fellows (n = 1), and nurse practitioners (n = 8). We did not seek parity in either age or gender representation.
Data Analysis
Mobile device and network usage data, question and response strings, as well as data regarding hardware and browser identity were collected using Google Analytics (Google Inc.,
RESULTS
Attending and resident physicians represented the majority of DocCHIRP account holders (91%), with nurse practitioners accounting for the remaining sample (9%). There were 50 male and 35 female participants, with an age range of 28 to 78 years (median age, 43 years). Departmental affiliations included Pediatrics (n = 28, 33%), Neurology (n = 27, 32%), Internal Medicine (n = 10, 12%), Psychiatry (n = 4, 5%), the Division of Pediatric Neurology (n = 11, 13%), and others (n = 5, 6%). Of the 1544 total visits to the DocCHIRP site, providers favored using smart phones (56.8%) and tablets (9.5%) over the desktop interface (33.6%; Figure 1C). iPhone use (81.7%) surpassed the other platforms combined. Desktop users visited twice as many pages (16.8 pages/visit) compared to those using smart phones (5.5 pages/visit) or tablets (8.6 pages/visit). Desktop users remained engaged longer than mobile users (13 vs 5 minutes). In the post‐trial user survey, we received 72 valid surveys from 85 potential participants (85% response rate).
We used a tiered enrollment design, sending invitations to potential participants in 3 phases to study the relationship between the size of the HCP crowd and sustained use as reported in other social networks.[13] Using a cutoff of >3 visits per week to demarcate active periods of use, we saw during the initial phase of enrollment that 20 providers generated a total of 170 visits over 22 days (Figure 2A). The addition of 28 members (phase II, n = 48 total) extended active use by 28 days, with a total of 476 page visits. The addition of 32 members (phase III, n = 85 total) resulted in 56 days of active participation with 612 visits to the site. When plotted (Figure 2B), the relationship between crowd size (total number of registered users) and cumulative visits (R2 = 0.951), as well as crowd size and days of high activity (R2 = 0.953) were linear and direct. We also investigated the timing of user engagement by pooling the data and breaking down use by time of day and day of the week (Figure 3A,B). In addition to observing peak engagement during the midmorning and afternoon, times of anticipated physician‐patient contact, we observed a third use peak in the evening. With the exception of sporadic weekend use, DocCHIRP use clustered during midweek.
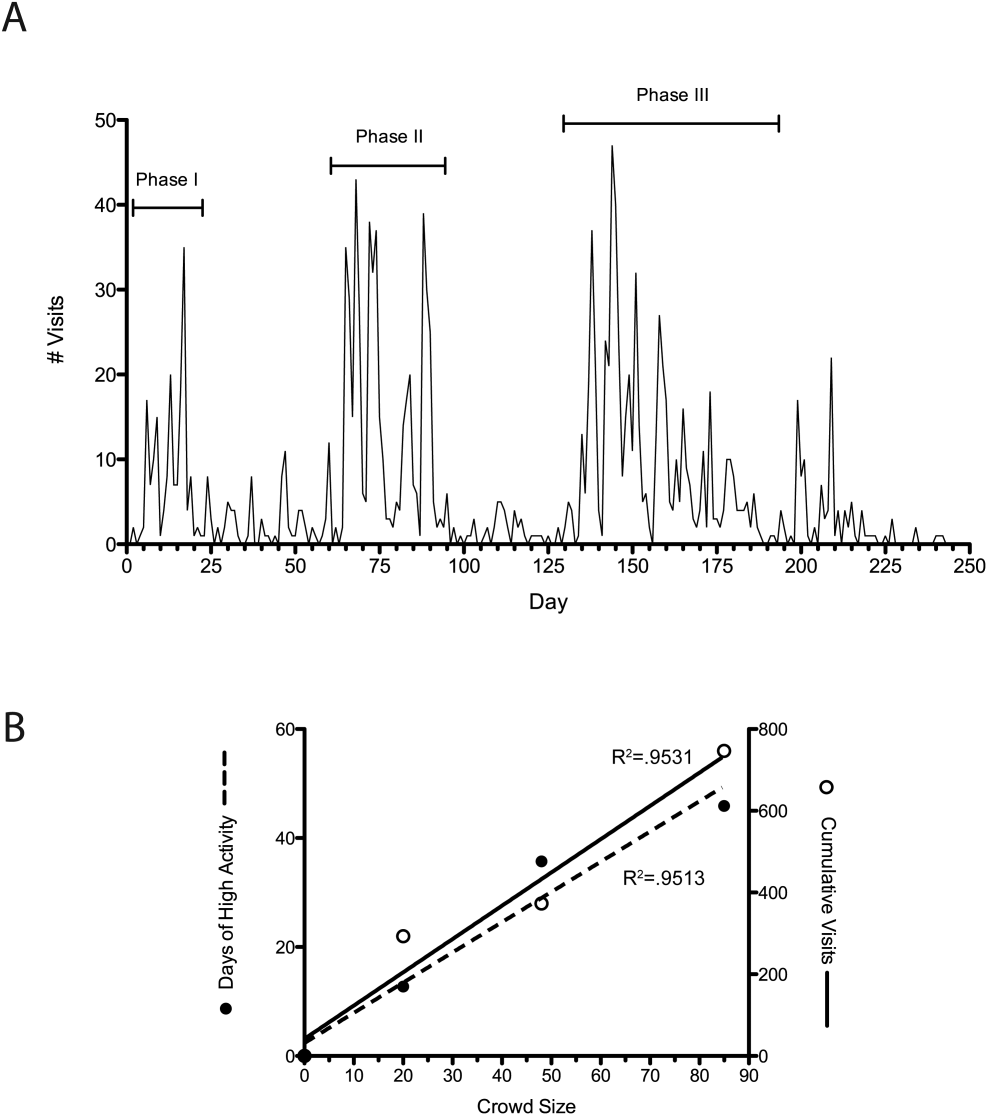
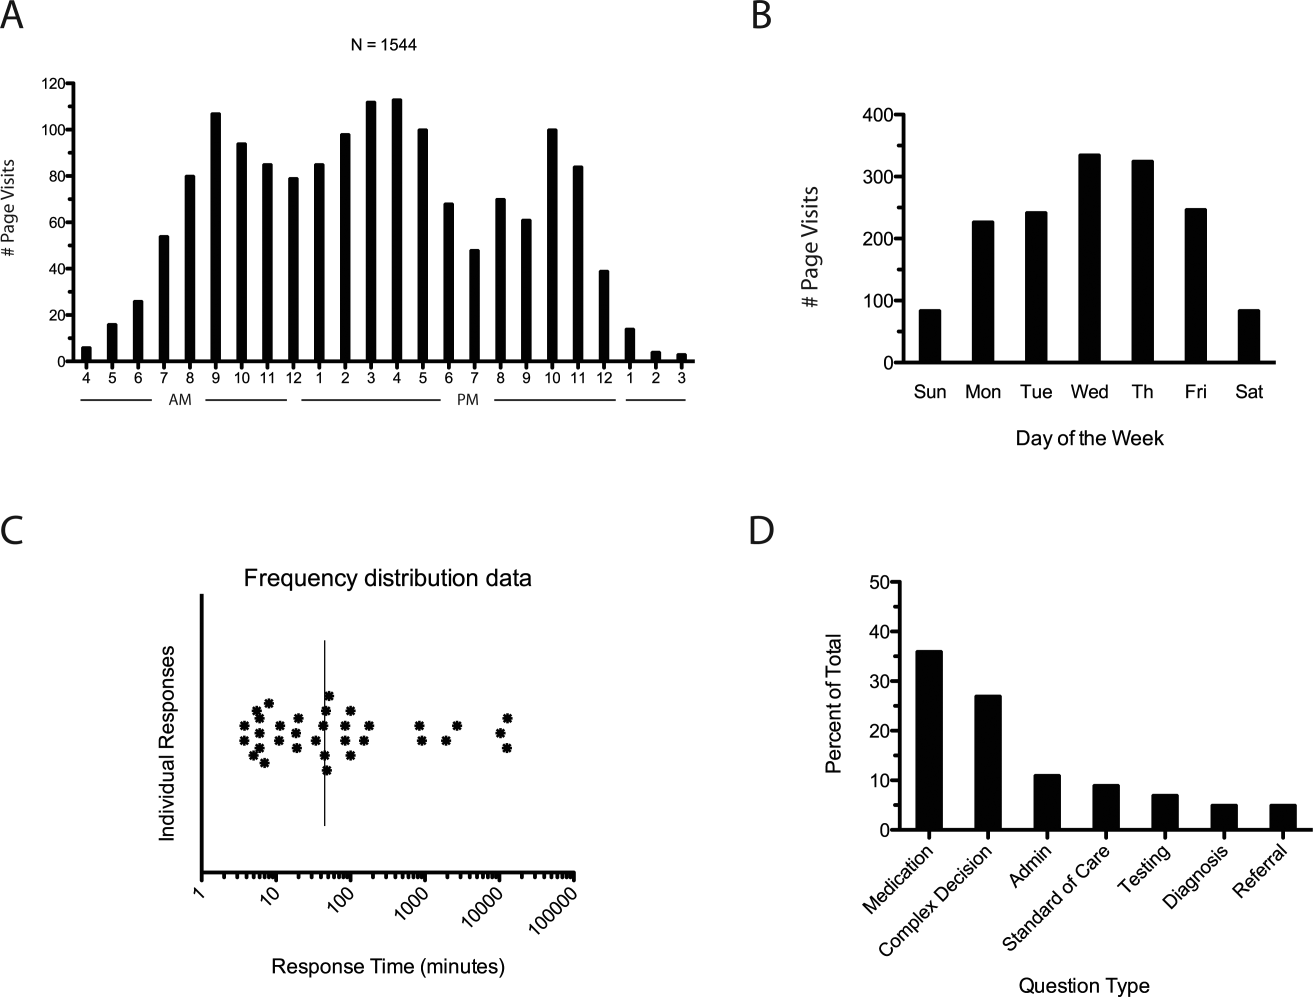
DocCHIRP users generated 45 questions. The fastest first response was returned in less than 4 minutes, with a median first response time of 19 minutes (Figure 3C). Analysis of the consult requests received revealed a clustering of 7 principal question‐response groups: (1) the effective use of medications, (2) complex medical decision making, (3) use of the application itself, (4) guidance regarding the standard of care, (5) selection and interpretation of diagnostic tests, (6) differential diagnosis, and (7) patient referral (Figure 3D). Consults regarding medication use and complex decision making were dominant themes (63%). Several consults generated multiple responses, broadening the scope of the original query or requesting additional information (Table 1).
| Question Type | Consult | Response(s) |
|---|---|---|
| ||
| Medication | How do you treat headache from viral meningitis? | R1: Any analgesic will work; need to clarify that the headache is not post‐LP, which may require blood patch. |
| Anyone know how oral fluconazole (liquid) tastes? We needed to prescribe for a young 13 year old. | R1: We should get a pharmacist on the chat. I would call the pharmacy and see if they can compound it with flavoring. | |
| How frequently do your patients complain of myalgias on statins? Have you prescribed coenzyme Q in this situation? | R1: Did you see the editorial in the Green Journal yesterday?Took the position that statins were not to blame. I usually give a trial off to make sure symptoms resolve. Usually I try them on a different statin.Have not routinely rx'd Q10. | |
| Complex medical decision making | Has anyone seen tapeworm infection from raw pork? Do we need to report this? We treated with mebendazole. | R1: You can check with CDC here: |
| R2: First‐line treatment for Tsolium is praziquantel or albendazole.However, mebendazole has also been used to successfully treat T solium. | ||
| R3: Whipworm is another common pork tapeworm.It is also covered by mebendazole | ||
| What are the current guidelines regarding the use of statins in patients with a history of lobar hemorrhage. | R1: Larger studies (SPARCL, HPS) both showed higher hemorrhage risks in statin treated patients.Cohort studies generally don't show an obvious risk to statins. I've generally taken patients off their statins when they come in with lobar ICH, and more neutral when it's a hypertensive bleed. | |
| Standard of care | How often would someone have to fall before you felt uncomfortable anticoagulating for AFib? | R1: The risk of falls alone should not automatically disqualify a person from being treated with warfarin. |
| R2: I recall reading a meta‐analysis that suggested 300 falls/year would start to favor not anticoagulating, but short of that, falls were not an important factor. | ||
| Anyone used IVIG for any of the following: autoimmune encephalopathy, NMO, paraneoplastic limbic encephalitis, PANDAS? | R1: We had a patient recently with a history of autoimmune encephalopathy who was treated with IVIG. | |
| Administrative | What medical apps do you have on your phone? | R1: DocCHIRP, Epocrates, NIH stroke calculator. |
| R2: I have Merck Medicus, Micromedex drugs, growth charts, and shotsall those are free.I also have Red Book from AAPand Sanford Guide, which I paid for. | ||
| R3: Instant ECG, ACLS Advisor, 10‐Second EM. | ||
| Testing | What would be considered a normal vitamin D level in a 2 year old? | R1: We typically treat at a level less than 30, with likely greater treatment if less than 21. I'm sure our phone nurses would be willing to share [our protocol]. |
| I have an obese 13‐year‐old AA girl with acanthosis nigricans. Do you check HbA1c? | R1: Yes. Sign of insulin resistance. HbA1c along with fasting blood glucose are a good start.Close monitoring indicated regardless. Endo may have more insight as to whether or not other labs are useful, such as fasting C‐peptide. | |
| Referral | Has anyone ever seen preteen or teen patients with ADHD‐like symptoms and poor sleep referred for a sleep study for possible restless leg syndrome? | R1: RLS seen in kids, but criteria are different for children than adults.Sleep studies may be warranted. |
| R2: I've also heard about a link between restless leg and iron deficiency. Is it a girl? | ||
| R3: Checking CBC, ferritin, and iron is a good start. | ||
To better understand factors influencing use of the mobile crowdsourcing application, we surveyed users, receiving 68 comments related to the overall approach and barriers to adoption among other aspects (Table 2). The 40 comments regarding the use of medical crowdsourcing were divided evenly between supporters and critics. Enthusiasm for cross‐discipline collaboration, having tools to codify expert knowledge, and discovering consensus opinion from the expert crowd was offset by concerns that push notifications would distract providers, compromise efficiency, and potentially lead providers to act on inaccurate information.
| Category | Comments | |
|---|---|---|
| Overall approach | Pro | This is a process whose time has come; we need it to adapt to the exponential increase in information content that impacts our clinical decisionmaking |
| I found [the application] it to be both useful and interesting. | ||
| Con | I just don't like these types of thingsemail already takes up too much time. | |
| Curbside consults result in worse outcomes for the patient and the physician. I found myself uncomfortable using this approach. | ||
| My biggest concern is the interruption in one's thinking.distractions are becoming increasingly common. | ||
| I do appreciate colleagues input; but ask for it verbally.I am struggling to learn even texting. | ||
| Barriers to adoption | Pro | I think premise is great, it is just a matter of enough people participating to make it worthwhile to use. |
| There is power in numbers here‐people won't use it unless there is lots of activity or feedback. | ||
| I think it will be very useful if the whole department or sections are involved in promoting and participating. | ||
| Con | I did not test it much since the posts were not very frequent at the time that I tried it. | |
| The barrier to use is quality control; how to substantiate the quality of input provided is key. | ||
| Anonymous posting | Pro | I would not have [posts] always be anonymous, but allow the user the option. |
| Anonymity would be greatI was concerned that some of my questions were "dumb." | ||
| Con | Anonymous posting would increase the risk of trolling. | |
| Suggested uses | I see a role for this app in relaying questions to subspecialty groups for judgment call questions. | |
| Best place to talk about weird cases, odd presentations; to ask have you ever seen anything like this before. | ||
| Consider rolling it out to entire family medicine department and/or primary care network. |
DISCUSSION
In the current study, we developed and field‐tested the application DocCHIRP, which helps HCPs crowdsource information from each other in near real time. The average response latency in this pilot trial was 20 minutes, which was unexpectedly fast given the relatively small size of the participating crowd. Additionally, nearly one‐third of users accessed the server in the evening using the web interface rather than their mobile phone. This suggests that although HCPs liked having direct access to colleagues in near real time, the also valued the opportunity to connect asynchronously after hours.
Relative to the total number of page views, the number of HCPs using the technology for peer‐to‐peer consultation was low. Feedback provided in the post‐trial survey suggested several reasons for this effect. Some providers viewed the application without posting because they were reluctant to disclose knowledge gaps to their peers. Several users suggested implementing a system that supports anonymous posting, but others thought this would undermine the value of the information provided. Additionally, users recognized the potential for crowdsourcing to adversely effect HCP's productivity and daily workflow. This is relevant given growing concerns about distracted doctoring and association with reduced safety and quality of medical care.[14] This concept is further echoed in a paper by Wu et al. demonstrating that frequent interruptions offset the perceived benefit of increased mobility afforded by the use of mobile technology.[15] However, it is worth considering that if implemented properly, study participants believe crowdsourcing could have a net neutral impact on clinical workflow by improving the efficiency of provider communication and saving time otherwise spent problem solving. Participants also felt the approach could infringe on an already threatened work‐life boundary, and could also lead to unprofessional and antisocial behaviors.[16] Collectively, these problems are not unique to medical crowdsourcing, and prior experience in this area may offer several viable solutions. First, because crowd burnout is inversely proportional to crowd size, successful adoption in practice will require growing a provider base of sufficient depth and expertise to handle the consult demand. With the expansion of accountable care organizations across the United States, this will not likely be a limiting factor. And although not implemented here, flexible notification settings, user‐defined identity rules, and other higher‐level software design elements should alleviate the issues related to provider reputation and workflow interruptions.
Overall, HCPs are optimistic that mobile handheld technologies will benefit their practice.[17] Yet, software‐based approaches including expert decision support systems must overcome particular hurdles including lack of provider trust in the algorithms used in these approaches.[18] In the end, trust is ultimately a human phenomena; users will only trust the system if they know the information came from a trusted and highly reputable individual or institution. By tapping the expertise of a network of institutional colleagues, crowdsourcing addresses this issue of trust. Appropriately, providers were also concerned about the legality and personal risk of using crowdsourcing to discuss matters related to patient care. The technology was not intended to share protected health information, and as with other forms of digital communication, providers were cautioned during the consent process to monitor their behavior in this regard. Although soliciting advice from the medical crowd has an inherently higher level of risk compared to the use of crowdsourcing in education, research, or business, the index provider is ultimately responsible for considering all available information before making any treatment decision.
Though our pilot trial was not designed to assess effects on HCP efficiency or on the quality of care delivered, our work provides a unique window on the information‐seeking behaviors HCPs and highlights potential modifications that could enhance the utility of future crowdsourcing programs. Because the trial was performed within the context of an academic health center, it remains to be seen how medical crowdsourcing will translate in private practice, rural clinics, and other clinical environments where peer‐to‐peer consultation is sought. Given the potential for high‐stakes information exchanges, further study regarding the use of medical crowdsourcing in a controlled environment will be required before the technology can be disseminated to a broader audience. If future iterations of the mobile crowdsourcing application can address the aforementioned adoption barriers and support the organic growth of the crowd of HCPs, we believe the approach could have a positive and transformative effect on how providers acquire relevant knowledge and care for patients.
Acknowledgements
The authors thank the physicians and nurse practitioners at the University of Rochester who participated in the trial. The authors also acknowledge Dr. Dan Goldstein at the Microsoft Research Group (New York, NY) for many helpful discussions.
Disclosures: This study was funded in part by grant support from the University of Rochester Robert B. Goergen Reach Fund (M.H.S.). Collaborative Informatics, LLC provided integrated mobile and server software used in this study. Dr. Halterman is co‐owner of Collaborative Informatics, LLC and oversaw the specifications and construction of the software used in this study. Dr. Halterman has provided the necessary conflict of interest documentation in keeping with the requirements of the University of Rochester. The DocCHIRP study was reviewed by the institutional review board at the University of Rochester and received approval posing minimal risk.
- , . The information‐seeking behaviour of doctors: a review of the evidence. Health Info Libr J. 2007;24(2):78–94.
- , , , . Information‐seeking behaviors of practitioners in a primary care practice‐based research network (PBRN). J Med Libr Assoc. 2005;93(2):206–212.
- . Physician use of the curbside consultation to address information needs: report on a collective case study. J Med Libr Assoc. 2006;94(2):137–144.
- , , , , . Uncovering tacit knowledge: a pilot study to broaden the concept of knowledge in knowledge translation. BMC Health Serv Res. 2011;11:198.
- , , , et al. Hospital variation and temporal trends in palliative and end‐of‐life care in the ICU. Crit Care Med. 2013;41(6):1405–1411.
- , , , et al. Comparison of user groups' perspectives of barriers and facilitators to implementing electronic health records: a systematic review. BMC Med. 2011;9:46.
- . The Rise of Crowdsourcing. Wired magazine. 2006;14(6):1–4.
- , , , , , . Novel web‐based tools combining chemistry informatics, biology and social networks for drug discovery. Drug Discov Today. 2009;14(5–6):261–270.
- , , , et al. Crowdsourcing—harnessing the masses to advance health and medicine: a systematic review. J Gen Intern Med. 2014;29(1):187–203.
- , , , . Smartphone use during inpatient attending rounds: prevalence, patterns and potential for distraction. J Hosp Med. 2012;7(8):595–599.
- . Biomedical informatics in the education of physicians. JAMA. 2010;304(11):1227–1228.
- . Mobile medical applications: guidance for industry and Food and Drug Administration staff. Washington, DC: U.S. Department of Health and Human Services, Food and Drug Administration; 2013.
- , , , , , . Limits of social mobilization. Proc Natl Acad Sci U S A. 2013;110(16):6281–6286.
- . the rise of electronic distraction in health care is addiction to devices contributing. J Anesth Clin Res. 2013;4:e112.
- , , , et al. An evaluation of the use of smartphones to communicate between clinicians: a mixed‐methods study. J Med Internet Res. 2011;13(3):e59.
- , . Instant mobile communication, efficiency, and quality of life. JAMA. 2008;299(10):1179–1181.
- , , . The impact of mobile handheld technology on hospital physicians' work practices and patient care: a systematic review. J Am Med Inform Assoc. 2009;16(6):792–801.
- . Issues of trust and ethics in computerized clinical decision support systems. Nurs Adm Q. 2006;30(1):21–29.
The volume of existing knowledge and the pace of discovery in medical science challenge a clinician's ability to access relevant information at the point of care. Knowledge gaps that arise in practice usually involve matters related to diagnosis, drug therapy, or treatment.[1] In the clinical setting, healthcare providers (HCPs) answer questions using a variety of online and print resources. Ironically, HCPs often lack the training required to find details regarding uncommon disorders or complex medical decisions that are not easily found or well represented in the published literature.[2] Instead, HCPs turn to trusted colleagues who possess the necessary expertise.[3]
Closing the knowledge‐to‐practice gap involves a range of factual information and data derived from published evidence, anecdotal experience, as well as organization‐ and region‐specific practices.[4] The inability to codify both explicit and tacit information has been linked to variability in prescription practices, excessive use of surgical services, and delayed decisions involving the appropriate provision of end‐of‐life care.[5] Although electronic medical record systems are not configured to support peer collaboration,[6] alternative strategies including crowdsourcing has been used successfully in other domains to tap collective intelligence of skilled workers.[7] Crowdsourcing allows organizations to explore problems at low cost, gain access a wide range of complementary expertise, and capture large amounts of data for analysis.[8, 9] Although an increasing number of physicians use either smartphones or tablets on the job,[10] peer‐to‐peer medical crowdsourcing has not been investigated, despite the fact that processes involving team‐based clinical decision making are associated with better outcomes.[11] Here we field tested the mobile crowdsourcing application DocCHIRP (Crowdsourcing Health Information Retrieval Protocol for Doctors) and assessed user opinion regarding its utility in the clinical setting.
MATERIALS AND METHODS
DocCHIRP Program Design
The authors (M.W.H., J.B., H.K.) conceptualized and designed DocCHIRP for mobile (iOS [Apple Inc., Cupertino, CA] and Android [Google Inc., Mountain View, CA]) and desktop use. Email prompts and push notifications, which were modeled after the application VizWiz (Rochester Human Computer Interaction Group, University of Rochester, Rochester, NY), supported near real‐time communication between HCPs. According to recent US Food and Drug Administration guidelines, DocCHIRP is considered a medical reference,[12] intended to share domain‐specific knowledge on diagnosis, therapy, and other medically relevant topics. Devices were password protected and encrypted according to university standards. A typical workflow involves an index provider faced with a clinical question that sends a consult question to 1 or more trusted providers. The crowd receiving the notification responds when available using either free‐text responses or agree/disagree prompts (Figure 1A,B). Providers use preference settings to manage crowd membership, notification settings, and demographics describing their expertise.
Trial Recruitment
The University of Rochester Research Subjects Review Board approved the study, in which prospective users were required to review and agree to a statement regarding potential liability as part of the consent process. In this pilot study, we invited a cross‐section of providers (n = 145) from the Departments of Neurology (including the Division of Pediatric Neurology), Pediatrics, Neuroradiology, Psychiatry, Orthopedics, Emergency Medicine, Internal Medicine, and Family Medicine to participate. E‐mail invitations were sent to HCPs in 3 phases in April (phase I), June (phase II), and August (phase III) over 244 consecutive days. At the conclusion of the trial, 85 HCPs (59%) had created accounts including attending physicians (n = 63), residents (n = 13), fellows (n = 1), and nurse practitioners (n = 8). We did not seek parity in either age or gender representation.
Data Analysis
Mobile device and network usage data, question and response strings, as well as data regarding hardware and browser identity were collected using Google Analytics (Google Inc.,
RESULTS
Attending and resident physicians represented the majority of DocCHIRP account holders (91%), with nurse practitioners accounting for the remaining sample (9%). There were 50 male and 35 female participants, with an age range of 28 to 78 years (median age, 43 years). Departmental affiliations included Pediatrics (n = 28, 33%), Neurology (n = 27, 32%), Internal Medicine (n = 10, 12%), Psychiatry (n = 4, 5%), the Division of Pediatric Neurology (n = 11, 13%), and others (n = 5, 6%). Of the 1544 total visits to the DocCHIRP site, providers favored using smart phones (56.8%) and tablets (9.5%) over the desktop interface (33.6%; Figure 1C). iPhone use (81.7%) surpassed the other platforms combined. Desktop users visited twice as many pages (16.8 pages/visit) compared to those using smart phones (5.5 pages/visit) or tablets (8.6 pages/visit). Desktop users remained engaged longer than mobile users (13 vs 5 minutes). In the post‐trial user survey, we received 72 valid surveys from 85 potential participants (85% response rate).
We used a tiered enrollment design, sending invitations to potential participants in 3 phases to study the relationship between the size of the HCP crowd and sustained use as reported in other social networks.[13] Using a cutoff of >3 visits per week to demarcate active periods of use, we saw during the initial phase of enrollment that 20 providers generated a total of 170 visits over 22 days (Figure 2A). The addition of 28 members (phase II, n = 48 total) extended active use by 28 days, with a total of 476 page visits. The addition of 32 members (phase III, n = 85 total) resulted in 56 days of active participation with 612 visits to the site. When plotted (Figure 2B), the relationship between crowd size (total number of registered users) and cumulative visits (R2 = 0.951), as well as crowd size and days of high activity (R2 = 0.953) were linear and direct. We also investigated the timing of user engagement by pooling the data and breaking down use by time of day and day of the week (Figure 3A,B). In addition to observing peak engagement during the midmorning and afternoon, times of anticipated physician‐patient contact, we observed a third use peak in the evening. With the exception of sporadic weekend use, DocCHIRP use clustered during midweek.
DocCHIRP users generated 45 questions. The fastest first response was returned in less than 4 minutes, with a median first response time of 19 minutes (Figure 3C). Analysis of the consult requests received revealed a clustering of 7 principal question‐response groups: (1) the effective use of medications, (2) complex medical decision making, (3) use of the application itself, (4) guidance regarding the standard of care, (5) selection and interpretation of diagnostic tests, (6) differential diagnosis, and (7) patient referral (Figure 3D). Consults regarding medication use and complex decision making were dominant themes (63%). Several consults generated multiple responses, broadening the scope of the original query or requesting additional information (Table 1).
| Question Type | Consult | Response(s) |
|---|---|---|
| ||
| Medication | How do you treat headache from viral meningitis? | R1: Any analgesic will work; need to clarify that the headache is not post‐LP, which may require blood patch. |
| Anyone know how oral fluconazole (liquid) tastes? We needed to prescribe for a young 13 year old. | R1: We should get a pharmacist on the chat. I would call the pharmacy and see if they can compound it with flavoring. | |
| How frequently do your patients complain of myalgias on statins? Have you prescribed coenzyme Q in this situation? | R1: Did you see the editorial in the Green Journal yesterday?Took the position that statins were not to blame. I usually give a trial off to make sure symptoms resolve. Usually I try them on a different statin.Have not routinely rx'd Q10. | |
| Complex medical decision making | Has anyone seen tapeworm infection from raw pork? Do we need to report this? We treated with mebendazole. | R1: You can check with CDC here: |
| R2: First‐line treatment for Tsolium is praziquantel or albendazole.However, mebendazole has also been used to successfully treat T solium. | ||
| R3: Whipworm is another common pork tapeworm.It is also covered by mebendazole | ||
| What are the current guidelines regarding the use of statins in patients with a history of lobar hemorrhage. | R1: Larger studies (SPARCL, HPS) both showed higher hemorrhage risks in statin treated patients.Cohort studies generally don't show an obvious risk to statins. I've generally taken patients off their statins when they come in with lobar ICH, and more neutral when it's a hypertensive bleed. | |
| Standard of care | How often would someone have to fall before you felt uncomfortable anticoagulating for AFib? | R1: The risk of falls alone should not automatically disqualify a person from being treated with warfarin. |
| R2: I recall reading a meta‐analysis that suggested 300 falls/year would start to favor not anticoagulating, but short of that, falls were not an important factor. | ||
| Anyone used IVIG for any of the following: autoimmune encephalopathy, NMO, paraneoplastic limbic encephalitis, PANDAS? | R1: We had a patient recently with a history of autoimmune encephalopathy who was treated with IVIG. | |
| Administrative | What medical apps do you have on your phone? | R1: DocCHIRP, Epocrates, NIH stroke calculator. |
| R2: I have Merck Medicus, Micromedex drugs, growth charts, and shotsall those are free.I also have Red Book from AAPand Sanford Guide, which I paid for. | ||
| R3: Instant ECG, ACLS Advisor, 10‐Second EM. | ||
| Testing | What would be considered a normal vitamin D level in a 2 year old? | R1: We typically treat at a level less than 30, with likely greater treatment if less than 21. I'm sure our phone nurses would be willing to share [our protocol]. |
| I have an obese 13‐year‐old AA girl with acanthosis nigricans. Do you check HbA1c? | R1: Yes. Sign of insulin resistance. HbA1c along with fasting blood glucose are a good start.Close monitoring indicated regardless. Endo may have more insight as to whether or not other labs are useful, such as fasting C‐peptide. | |
| Referral | Has anyone ever seen preteen or teen patients with ADHD‐like symptoms and poor sleep referred for a sleep study for possible restless leg syndrome? | R1: RLS seen in kids, but criteria are different for children than adults.Sleep studies may be warranted. |
| R2: I've also heard about a link between restless leg and iron deficiency. Is it a girl? | ||
| R3: Checking CBC, ferritin, and iron is a good start. | ||
To better understand factors influencing use of the mobile crowdsourcing application, we surveyed users, receiving 68 comments related to the overall approach and barriers to adoption among other aspects (Table 2). The 40 comments regarding the use of medical crowdsourcing were divided evenly between supporters and critics. Enthusiasm for cross‐discipline collaboration, having tools to codify expert knowledge, and discovering consensus opinion from the expert crowd was offset by concerns that push notifications would distract providers, compromise efficiency, and potentially lead providers to act on inaccurate information.
| Category | Comments | |
|---|---|---|
| Overall approach | Pro | This is a process whose time has come; we need it to adapt to the exponential increase in information content that impacts our clinical decisionmaking |
| I found [the application] it to be both useful and interesting. | ||
| Con | I just don't like these types of thingsemail already takes up too much time. | |
| Curbside consults result in worse outcomes for the patient and the physician. I found myself uncomfortable using this approach. | ||
| My biggest concern is the interruption in one's thinking.distractions are becoming increasingly common. | ||
| I do appreciate colleagues input; but ask for it verbally.I am struggling to learn even texting. | ||
| Barriers to adoption | Pro | I think premise is great, it is just a matter of enough people participating to make it worthwhile to use. |
| There is power in numbers here‐people won't use it unless there is lots of activity or feedback. | ||
| I think it will be very useful if the whole department or sections are involved in promoting and participating. | ||
| Con | I did not test it much since the posts were not very frequent at the time that I tried it. | |
| The barrier to use is quality control; how to substantiate the quality of input provided is key. | ||
| Anonymous posting | Pro | I would not have [posts] always be anonymous, but allow the user the option. |
| Anonymity would be greatI was concerned that some of my questions were "dumb." | ||
| Con | Anonymous posting would increase the risk of trolling. | |
| Suggested uses | I see a role for this app in relaying questions to subspecialty groups for judgment call questions. | |
| Best place to talk about weird cases, odd presentations; to ask have you ever seen anything like this before. | ||
| Consider rolling it out to entire family medicine department and/or primary care network. |
DISCUSSION
In the current study, we developed and field‐tested the application DocCHIRP, which helps HCPs crowdsource information from each other in near real time. The average response latency in this pilot trial was 20 minutes, which was unexpectedly fast given the relatively small size of the participating crowd. Additionally, nearly one‐third of users accessed the server in the evening using the web interface rather than their mobile phone. This suggests that although HCPs liked having direct access to colleagues in near real time, the also valued the opportunity to connect asynchronously after hours.
Relative to the total number of page views, the number of HCPs using the technology for peer‐to‐peer consultation was low. Feedback provided in the post‐trial survey suggested several reasons for this effect. Some providers viewed the application without posting because they were reluctant to disclose knowledge gaps to their peers. Several users suggested implementing a system that supports anonymous posting, but others thought this would undermine the value of the information provided. Additionally, users recognized the potential for crowdsourcing to adversely effect HCP's productivity and daily workflow. This is relevant given growing concerns about distracted doctoring and association with reduced safety and quality of medical care.[14] This concept is further echoed in a paper by Wu et al. demonstrating that frequent interruptions offset the perceived benefit of increased mobility afforded by the use of mobile technology.[15] However, it is worth considering that if implemented properly, study participants believe crowdsourcing could have a net neutral impact on clinical workflow by improving the efficiency of provider communication and saving time otherwise spent problem solving. Participants also felt the approach could infringe on an already threatened work‐life boundary, and could also lead to unprofessional and antisocial behaviors.[16] Collectively, these problems are not unique to medical crowdsourcing, and prior experience in this area may offer several viable solutions. First, because crowd burnout is inversely proportional to crowd size, successful adoption in practice will require growing a provider base of sufficient depth and expertise to handle the consult demand. With the expansion of accountable care organizations across the United States, this will not likely be a limiting factor. And although not implemented here, flexible notification settings, user‐defined identity rules, and other higher‐level software design elements should alleviate the issues related to provider reputation and workflow interruptions.
Overall, HCPs are optimistic that mobile handheld technologies will benefit their practice.[17] Yet, software‐based approaches including expert decision support systems must overcome particular hurdles including lack of provider trust in the algorithms used in these approaches.[18] In the end, trust is ultimately a human phenomena; users will only trust the system if they know the information came from a trusted and highly reputable individual or institution. By tapping the expertise of a network of institutional colleagues, crowdsourcing addresses this issue of trust. Appropriately, providers were also concerned about the legality and personal risk of using crowdsourcing to discuss matters related to patient care. The technology was not intended to share protected health information, and as with other forms of digital communication, providers were cautioned during the consent process to monitor their behavior in this regard. Although soliciting advice from the medical crowd has an inherently higher level of risk compared to the use of crowdsourcing in education, research, or business, the index provider is ultimately responsible for considering all available information before making any treatment decision.
Though our pilot trial was not designed to assess effects on HCP efficiency or on the quality of care delivered, our work provides a unique window on the information‐seeking behaviors HCPs and highlights potential modifications that could enhance the utility of future crowdsourcing programs. Because the trial was performed within the context of an academic health center, it remains to be seen how medical crowdsourcing will translate in private practice, rural clinics, and other clinical environments where peer‐to‐peer consultation is sought. Given the potential for high‐stakes information exchanges, further study regarding the use of medical crowdsourcing in a controlled environment will be required before the technology can be disseminated to a broader audience. If future iterations of the mobile crowdsourcing application can address the aforementioned adoption barriers and support the organic growth of the crowd of HCPs, we believe the approach could have a positive and transformative effect on how providers acquire relevant knowledge and care for patients.
Acknowledgements
The authors thank the physicians and nurse practitioners at the University of Rochester who participated in the trial. The authors also acknowledge Dr. Dan Goldstein at the Microsoft Research Group (New York, NY) for many helpful discussions.
Disclosures: This study was funded in part by grant support from the University of Rochester Robert B. Goergen Reach Fund (M.H.S.). Collaborative Informatics, LLC provided integrated mobile and server software used in this study. Dr. Halterman is co‐owner of Collaborative Informatics, LLC and oversaw the specifications and construction of the software used in this study. Dr. Halterman has provided the necessary conflict of interest documentation in keeping with the requirements of the University of Rochester. The DocCHIRP study was reviewed by the institutional review board at the University of Rochester and received approval posing minimal risk.
- , . The information‐seeking behaviour of doctors: a review of the evidence. Health Info Libr J. 2007;24(2):78–94.
- , , , . Information‐seeking behaviors of practitioners in a primary care practice‐based research network (PBRN). J Med Libr Assoc. 2005;93(2):206–212.
- . Physician use of the curbside consultation to address information needs: report on a collective case study. J Med Libr Assoc. 2006;94(2):137–144.
- , , , , . Uncovering tacit knowledge: a pilot study to broaden the concept of knowledge in knowledge translation. BMC Health Serv Res. 2011;11:198.
- , , , et al. Hospital variation and temporal trends in palliative and end‐of‐life care in the ICU. Crit Care Med. 2013;41(6):1405–1411.
- , , , et al. Comparison of user groups' perspectives of barriers and facilitators to implementing electronic health records: a systematic review. BMC Med. 2011;9:46.
- . The Rise of Crowdsourcing. Wired magazine. 2006;14(6):1–4.
- , , , , , . Novel web‐based tools combining chemistry informatics, biology and social networks for drug discovery. Drug Discov Today. 2009;14(5–6):261–270.
- , , , et al. Crowdsourcing—harnessing the masses to advance health and medicine: a systematic review. J Gen Intern Med. 2014;29(1):187–203.
- , , , . Smartphone use during inpatient attending rounds: prevalence, patterns and potential for distraction. J Hosp Med. 2012;7(8):595–599.
- . Biomedical informatics in the education of physicians. JAMA. 2010;304(11):1227–1228.
- . Mobile medical applications: guidance for industry and Food and Drug Administration staff. Washington, DC: U.S. Department of Health and Human Services, Food and Drug Administration; 2013.
- , , , , , . Limits of social mobilization. Proc Natl Acad Sci U S A. 2013;110(16):6281–6286.
- . the rise of electronic distraction in health care is addiction to devices contributing. J Anesth Clin Res. 2013;4:e112.
- , , , et al. An evaluation of the use of smartphones to communicate between clinicians: a mixed‐methods study. J Med Internet Res. 2011;13(3):e59.
- , . Instant mobile communication, efficiency, and quality of life. JAMA. 2008;299(10):1179–1181.
- , , . The impact of mobile handheld technology on hospital physicians' work practices and patient care: a systematic review. J Am Med Inform Assoc. 2009;16(6):792–801.
- . Issues of trust and ethics in computerized clinical decision support systems. Nurs Adm Q. 2006;30(1):21–29.

Chest CT in Patients with Pneumonia
Pneumonia remains one of the most common indications for hospital admissions. In the United States in 2010, more than 1 million patients were discharged with a diagnosis of pneumonia.[1] A diagnosis of pneumonia is based on typical clinical findings with recommendations to identify a demonstrable infiltrate on appropriate imaging modalities.[2] Although computed tomography (CT) imaging of the chest is much more sensitive than plain radiography at detecting infiltrates, the greater cost and higher radiation exposure limits its use as a screening modality.[3, 4] Additional imaging studies are recommended for patients who fail to respond to therapy.[2] There are, however, no published studies to determine the exact impact of chest CT scans on the management of pneumonia.
We conducted a retrospective assessment of CT scan use in patients admitted with a diagnosis of pneumonia. The study was designed to assess (1) the overall utilization rate of chest CT scans at our institution and (2) the impact of CT findings on patient management.
METHODS
This retrospective study was conducted at St. John Hospital and Medical Center, an 808‐bed tertiary care community teaching hospital in Detroit. The study was approved by the St. John Hospital and Medical Center's institutional review board.
Patients admitted to our institution between January 1, 2008 and November 1, 2011 were evaluated for study inclusion by searching the hospital's computer database using the discharge International Classification of Diseases, 9th Revision, Clinical Modification (ICD‐9‐CM) codes for pneumonia, pleural effusion, and empyema. Patients were included for initial review if the appropriate ICD‐9‐CM codes were included within the list of discharge diagnoses and were not restricted based on hierarchy within that list. Patients were included in further analysis if they were 18 years of age, a diagnosis of pneumonia was made within 48 hours of admission, and records were available for review. Patients were excluded if they did not meet the above criteria or a diagnosis of pneumonia could not be confirmed by chart review. The electronic medical record was reviewed and patient demographics, hospital admission source, microbiology results, radiographic findings, and outcomes were recorded. Additional procedures such as thoracentesis, open lung biopsy and/or chest tube placement were recorded for patients if performed. The Charlson Weighted Index of Comorbidity and Confusion, Urea, Respiratory rate, Blood pressure, Age > 65 (CURB 65) scores were calculated as described elsewhere.[5, 6] CT scans were assessed for time and date of study after admission along with all relevant findings.
Data Analysis
Descriptive statistics were generated for the overall population. The associations between categorical variables and whether or not a CT scan was performed were assessed using the 2 test. Student t test or analysis of variance, followed by the Bonferroni correction of the P value, were used to compare mean values. Logistic regression was used to predict the probability of having a chest CT done, given the variables found to be related on univariate analysis. All data were analyzed using SPSS version 22.0 (IBM, Armonk, NY), and a P value of 0.05 or less was considered to indicate statistical significance.
RESULTS
A total of 264 patients were identified by discharge diagnosis, and 195 (73.9%) patients met the inclusion criteria. Among the 69 patients who were excluded, 37 patients were diagnosed more than 48 hours after admission, 19 patients did not have a radiographically demonstrable abnormality, 5 patients had an incomplete medical record, and 8 patients received no antibiotics. The overall mean age of the cases was 63.4 19.1 years, with an average length of stay of 7.4 5.7 days. Sixty‐nine (35.3%) of the case patients had a chest CT scan performed. A CT scan was performed more often in younger patients (58.1 19.0 vs 66.8 18.6, P = 0.002) and in patients with lower CURB 65 scores (1.7 1.4 vs 2.2 1.4, P = 0.037). A CT scan was also performed more often in patients with no infiltrates or consolidation on plain radiographs (26.9% vs 7.1%, P 0.0001). Patients were also more likely to have a procedure performed if they had a CT performed (21.7% vs 3.1%, P 0.0001) and were admitted from home versus a long‐term care facility or other healthcare institution (92.8% vs 78.6%, P = 0.011). Comparisons are shown in Table 1. After controlling for age, CURB 65 score on admission, admission source, and the presence of consolidation or infiltrates on initial chest radiograph (CXR), individuals were 4.76 times less likely to have a CT scan performed if the CXR showed consolidation and/or infiltrates (odds ratio: 0.21, P = 0.001; 95% confidence interval: 0.08‐0.53) (Table 2).
| Characteristics | Chest CT Scan Performed, n = 69 (35.4%) | Chest CT Scan Not Performed, n = 126 (64.6%) | P Value |
|---|---|---|---|
| |||
| Mean age, y SD | 58.1 19.0 | 66.8 18.6 | 0.002 |
| Gender, male | 52.2% (36) | 45.2% (57) | 0.35 |
| Average length of stay, d SD | 8.6 7.4 | 6.9 4.5 | 0.08 |
| Charlson Comorbidity Index SD | 1.77 2.0 | 2.02 1.89 | 0.38 |
| CURB 65 score on admission SD | 1.7 1.4 | 2.2 1.4 | 0.037 |
| Fever on admission | 34.8% (24) | 36.5% (46) | 0.81 |
| Sepsis within 48 hours of CT | 81.2% (56) | 78.6% (99) | 0.67 |
| ICU admission within 48 hours of admission | 21.7% (15) | 15.1% (19) | 0.24 |
| No consolidation or infiltrates on CXR, n = 67a | 26.9% (18) | 7.1% (9) | 0.0001 |
| Procedure performed | 21.7% (15) | 3.1% (4) | 0.0001 |
| Source of admission | |||
| Home | 92.8% (64) | 78.6% (99) | 0.011 |
| Extended care facility | 7.2% (5) | 21.4% (27) | |
| Positive blood cultureb | 4.1% (2) | 8.9% (7) | 0.30 |
| Positive sputum culturec | 11.1% (3) | 11.4% (4) | 0.97 |
| Discharged alived | 91.3% (63) | 88.9% (112) | 0.60 |
| Characteristic | Odds Ratio | P Value | 95% CI |
|---|---|---|---|
| |||
| Age | 0.99 | 0.29 | 0.971.01 |
| CURB 65 at admission | 0.89 | 0.41 | 0.671.18 |
| Admission source (healthcare facility) | 0.36 | 0.07 | 0.121.09 |
| Consolidation or infiltrates | 0.21 | 0.001 | 0.080.53 |
Procedure Performed
Among the 195 patients, pneumonia‐related procedures were performed on only 19 (9.7%) patients. The procedures performed included bronchoscopy (n = 4), percutaneous biopsy (n = 3), thoracentesis (n = 7), and open lung biopsy (n = 5). Fifteen (78.9%) of the patients who had a pneumonia‐related procedure had a CT scan. Table 3 shows the characteristics of patients who had a procedure performed compared to those patients who did not have a procedure performed among all individuals who had a CT scan. Only average length of stay differed significantly between these 2 groups of patients (15.3 11.9 vs 6.8 4.1, P = 0.016).
| Characteristic | Procedure Performed, n = 15 (21.7%) | Procedure Not Performed, n = 54 (78.3%) | P Value |
|---|---|---|---|
| |||
| Mean age, y SD | 56.9 19.5 | 58.5 19.1 | 0.77 |
| Male gender | 53.3% (8) | 51.1% (28) | 0.92 |
| Average length of stay, d SD | 15.3 11.9 | 6.8 4.1 | 0.016 |
| Admission CURB 65 score, mean SD | 1.7 1.4 | 1.7 1.5 | 0.98 |
| Fever on admission | 40% (6) | 33.3% (18) | 0.63 |
| Sepsis within 48 hours of procedure | 93.3% (14) | 77.8% (42) | 0.17 |
| ICU admit within 48 hours of admission | 26.7% (4) | 20.4% (11) | 0.60 |
| No consolidation or infiltrates on CXR | 21.4% (3) | 7.8% (4) | 0.65 |
| Source of admission | |||
| Home | 15% (100) | 90.7% (49) | NSa |
| Extended care facility | 0% (0) | 9.3% (5) | |
| Discharge aliveb | 80% (12) | 94.4% (51) | 0.08 |
DISCUSSION
Chest radiography plays an essential role in diagnosing pneumonia. Chest CT scans are more sensitive in diagnosing pneumonia and may be more specific for certain pathogens, but objective indicators or guidelines regarding test performance are lacking.[7] There are few available studies that evaluate the benefit of chest CT scans in adults with pneumonia. Beall et al. noted 57% of immunocompetent hosts, 22% of human immunodeficiency virus (HIV) patients, and 45% of immunocompromised hosts had a new finding on CT.[8] In 40% of the cases, there was an overall change in management based on the findings. Nyamande et al. showed that high‐resolution CT scans identified abnormalities missed on plain radiographs in 82% (n = 40) of HIV patients in sub‐Saharan Africa.[9] A study by Syrjl et al. highlights the fact that high‐resolution CT scanning improves the diagnosis of community‐acquired pneumonia in patients with negative chest radiographs.[10] In the right clinical setting, additional imaging, such as high‐resolution CT scanning, is more sensitive at detecting abnormalities consistent with pneumonia.[10] We found that a CT scan was more likely to be performed in patients with no infiltrates or consolidation consistent with that finding. However, the authors did not attempt to evaluate improved clinical outcomes or management changes. Other investigators have tried to demonstrate unique or specific findings on CT scans compared to plain radiography for particular pathogens.[11, 12, 13]
We attempted to identify specific features of patients presenting with pneumonia that could assist clinicians in the decision‐making process as it relates to ordering a CT scan. CT scans were performed more frequently on subjects who were younger, had lower severity of illness, and were admitted from the community. We were unable to assess the radiographic and/or clinical findings that led the providers to order the CT scans. It is interesting to note, however, that Metlay et al. demonstrated a decreasing prevalence of pneumonia‐associated symptoms with increasing age.[14] One could speculate that patients who are younger and tend to have more symptoms may be more likely to get ancillary testing.
In our study, 35% of patients admitted with pneumonia had a CT scan performed that led to an additional procedure 22% of the time. We were unable to accurately evaluate the impact of CT on antibiotic modification, duration, or some outcomes. Although a number of studies demonstrated new or missed findings by CT compared to plain radiography, only Beall et al. reported outcome changes.[8, 9, 10, 12] They found that 39% (21/54) of patients had a change in their treatment plan including antibiotic alterations.
A number of factors impact outcomes such as length of stay and mortality in patients admitted with community‐acquired pneumonia. Empyema contributes to additional length of stay and pleural effusions are new findings identified by CT scans.[8, 9, 15, 16] Unfortunately, the number of patients with pleural effusions and even empyema (data not shown) was too small for us to analyze. Better prospective observational studies will be necessary to define specific CT findings leading to actual changes in management. The optimal timing of CT scanning could also be determined from these studies. The retrospective nature of our study is a key limitation to our results. It is difficult to determine retrospectively the clinical decision‐making process used when ordering additional diagnostic tests or procedures. Whether the CT scans ordered on our patients truly resulted in additional procedures or whether the procedures were preplanned cannot be elucidated. Our current electronic medical record and ordering process has significant drop‐down list selection bias for test indications. A postorder research‐based survey tool would be required to further evaluate the clinician's decision‐making process. In addition, as a single center study, the decision to perform CT scans and pneumonia‐related procedures reflects only the practice patterns among a relatively small number of physicians with a wide variety of practice levels and specialties. Although length of stay was not affected by performing a CT scan, patients who had a procedure did have a prolonged hospital stay consistent with a complicated course as confirmed by others.[16]
Our study results could be the first step in developing prospective studies to evaluate the indications and utility of ancillary imaging in patients with pneumonia. Prospective, multicenter observational studies, which include a clinical decision‐making survey tool as noted above, would be tremendously beneficial. Pathogen‐specific indications and outcomes will be facilitated by the deployment of more rapid and effective molecular diagnostic capabilities. Furthermore, the cost of the test, radiation exposure, impact on clinical outcomes, and overall risk/benefit would need to be calculated from these future studies.
- National Hospital Discharge Survey. National Center for Health Statistics. Available at: http://www.cdc.gov/nchs/data/nhds/2average/ 2010ave2_firstlist.pdf. Accessed December 10, 2013.
- , , , et al. Infectious Diseases Society of America/American Thoracic Society consensus guidelines on the management of community‐acquired pneumonia in adults. Clin Infect Dis. 2007;44(suppl 2):S27–S72.
- , . Chest radiograph vs. computed tomography scan in the evaluation for pneumonia. J Emerg Med. 2009;36(3):266–270.
- American College of Radiology. RadiologyInfo.org website. Radiation dose in x‐ray and CT exams. Available at: http://www.radiologyinfo.org/en/safety/?pg=sfty_xray. Accessed February 24, 2014.
- , , , et al. Prospective comparison of three validated prediction rules for prognosis in community‐acquired pneumonia. Am J Med. 2005;118(4):384–392.
- , , , et al. Updating and validating the Charlson comorbidity index and score for risk adjustment in hospital discharge abstracts using data from 6 countries. Am J Epidemiol. 2011;173(6):676–682.
- , . Imaging pneumonia in immunocompetent and immunocompromised individuals. Curr Opin Pulm Med. 2012;18(3):194–201.
- , , , , , . Utilization of computed tomography in patients hospitalized with community‐acquired pneumonia. Md Med J. 1998;47(4):182–187.
- , , . Comparison of plain chest radiography and high‐resolution CT in human immunodeficiency virus infected patients with community‐acquired pneumonia: a sub‐Saharan Africa study. Br J Radiol. 2007;80(953):302–306.
- , , , , . High‐resolution computed tomography for the diagnosis of community‐acquired pneumonia. Clin Infect Dis. 1998;27(2):358–363.
- , , , et al. Pulmonary computed tomography findings in 39 cases of Streptococcus pneumoniae pneumonia. Intern Med. 2012;51(24):3343–3349.
- , , , et al. High‐resolution CT findings in Streptococcus milleri pulmonary infection. Clin Radiol. 2013;68(6):e331–e337.
- , , , et al. Thin‐section CT findings in Pseudomonas aeruginosa pulmonary infection. Br J Radiol. 2012;85(1020):1533–1538.
- , , , et al. Influence of age on symptoms at presentation in patients with community‐acquired pneumonia. Arch Intern Med. 1997;157(13):1453–1459.
- , , . Factors associated with length of stay in hospital for suspected community‐acquired pneumonia. Can Respir J. 2006;13(6):317–324.
- , , , , , . Predictors for length of hospital stay in patients with community‐acquired pneumonia: results from a Swiss multicenter study. BMC Pulm Med. 2012;12:21.
Pneumonia remains one of the most common indications for hospital admissions. In the United States in 2010, more than 1 million patients were discharged with a diagnosis of pneumonia.[1] A diagnosis of pneumonia is based on typical clinical findings with recommendations to identify a demonstrable infiltrate on appropriate imaging modalities.[2] Although computed tomography (CT) imaging of the chest is much more sensitive than plain radiography at detecting infiltrates, the greater cost and higher radiation exposure limits its use as a screening modality.[3, 4] Additional imaging studies are recommended for patients who fail to respond to therapy.[2] There are, however, no published studies to determine the exact impact of chest CT scans on the management of pneumonia.
We conducted a retrospective assessment of CT scan use in patients admitted with a diagnosis of pneumonia. The study was designed to assess (1) the overall utilization rate of chest CT scans at our institution and (2) the impact of CT findings on patient management.
METHODS
This retrospective study was conducted at St. John Hospital and Medical Center, an 808‐bed tertiary care community teaching hospital in Detroit. The study was approved by the St. John Hospital and Medical Center's institutional review board.
Patients admitted to our institution between January 1, 2008 and November 1, 2011 were evaluated for study inclusion by searching the hospital's computer database using the discharge International Classification of Diseases, 9th Revision, Clinical Modification (ICD‐9‐CM) codes for pneumonia, pleural effusion, and empyema. Patients were included for initial review if the appropriate ICD‐9‐CM codes were included within the list of discharge diagnoses and were not restricted based on hierarchy within that list. Patients were included in further analysis if they were 18 years of age, a diagnosis of pneumonia was made within 48 hours of admission, and records were available for review. Patients were excluded if they did not meet the above criteria or a diagnosis of pneumonia could not be confirmed by chart review. The electronic medical record was reviewed and patient demographics, hospital admission source, microbiology results, radiographic findings, and outcomes were recorded. Additional procedures such as thoracentesis, open lung biopsy and/or chest tube placement were recorded for patients if performed. The Charlson Weighted Index of Comorbidity and Confusion, Urea, Respiratory rate, Blood pressure, Age > 65 (CURB 65) scores were calculated as described elsewhere.[5, 6] CT scans were assessed for time and date of study after admission along with all relevant findings.
Data Analysis
Descriptive statistics were generated for the overall population. The associations between categorical variables and whether or not a CT scan was performed were assessed using the 2 test. Student t test or analysis of variance, followed by the Bonferroni correction of the P value, were used to compare mean values. Logistic regression was used to predict the probability of having a chest CT done, given the variables found to be related on univariate analysis. All data were analyzed using SPSS version 22.0 (IBM, Armonk, NY), and a P value of 0.05 or less was considered to indicate statistical significance.
RESULTS
A total of 264 patients were identified by discharge diagnosis, and 195 (73.9%) patients met the inclusion criteria. Among the 69 patients who were excluded, 37 patients were diagnosed more than 48 hours after admission, 19 patients did not have a radiographically demonstrable abnormality, 5 patients had an incomplete medical record, and 8 patients received no antibiotics. The overall mean age of the cases was 63.4 19.1 years, with an average length of stay of 7.4 5.7 days. Sixty‐nine (35.3%) of the case patients had a chest CT scan performed. A CT scan was performed more often in younger patients (58.1 19.0 vs 66.8 18.6, P = 0.002) and in patients with lower CURB 65 scores (1.7 1.4 vs 2.2 1.4, P = 0.037). A CT scan was also performed more often in patients with no infiltrates or consolidation on plain radiographs (26.9% vs 7.1%, P 0.0001). Patients were also more likely to have a procedure performed if they had a CT performed (21.7% vs 3.1%, P 0.0001) and were admitted from home versus a long‐term care facility or other healthcare institution (92.8% vs 78.6%, P = 0.011). Comparisons are shown in Table 1. After controlling for age, CURB 65 score on admission, admission source, and the presence of consolidation or infiltrates on initial chest radiograph (CXR), individuals were 4.76 times less likely to have a CT scan performed if the CXR showed consolidation and/or infiltrates (odds ratio: 0.21, P = 0.001; 95% confidence interval: 0.08‐0.53) (Table 2).
| Characteristics | Chest CT Scan Performed, n = 69 (35.4%) | Chest CT Scan Not Performed, n = 126 (64.6%) | P Value |
|---|---|---|---|
| |||
| Mean age, y SD | 58.1 19.0 | 66.8 18.6 | 0.002 |
| Gender, male | 52.2% (36) | 45.2% (57) | 0.35 |
| Average length of stay, d SD | 8.6 7.4 | 6.9 4.5 | 0.08 |
| Charlson Comorbidity Index SD | 1.77 2.0 | 2.02 1.89 | 0.38 |
| CURB 65 score on admission SD | 1.7 1.4 | 2.2 1.4 | 0.037 |
| Fever on admission | 34.8% (24) | 36.5% (46) | 0.81 |
| Sepsis within 48 hours of CT | 81.2% (56) | 78.6% (99) | 0.67 |
| ICU admission within 48 hours of admission | 21.7% (15) | 15.1% (19) | 0.24 |
| No consolidation or infiltrates on CXR, n = 67a | 26.9% (18) | 7.1% (9) | 0.0001 |
| Procedure performed | 21.7% (15) | 3.1% (4) | 0.0001 |
| Source of admission | |||
| Home | 92.8% (64) | 78.6% (99) | 0.011 |
| Extended care facility | 7.2% (5) | 21.4% (27) | |
| Positive blood cultureb | 4.1% (2) | 8.9% (7) | 0.30 |
| Positive sputum culturec | 11.1% (3) | 11.4% (4) | 0.97 |
| Discharged alived | 91.3% (63) | 88.9% (112) | 0.60 |
| Characteristic | Odds Ratio | P Value | 95% CI |
|---|---|---|---|
| |||
| Age | 0.99 | 0.29 | 0.971.01 |
| CURB 65 at admission | 0.89 | 0.41 | 0.671.18 |
| Admission source (healthcare facility) | 0.36 | 0.07 | 0.121.09 |
| Consolidation or infiltrates | 0.21 | 0.001 | 0.080.53 |
Procedure Performed
Among the 195 patients, pneumonia‐related procedures were performed on only 19 (9.7%) patients. The procedures performed included bronchoscopy (n = 4), percutaneous biopsy (n = 3), thoracentesis (n = 7), and open lung biopsy (n = 5). Fifteen (78.9%) of the patients who had a pneumonia‐related procedure had a CT scan. Table 3 shows the characteristics of patients who had a procedure performed compared to those patients who did not have a procedure performed among all individuals who had a CT scan. Only average length of stay differed significantly between these 2 groups of patients (15.3 11.9 vs 6.8 4.1, P = 0.016).
| Characteristic | Procedure Performed, n = 15 (21.7%) | Procedure Not Performed, n = 54 (78.3%) | P Value |
|---|---|---|---|
| |||
| Mean age, y SD | 56.9 19.5 | 58.5 19.1 | 0.77 |
| Male gender | 53.3% (8) | 51.1% (28) | 0.92 |
| Average length of stay, d SD | 15.3 11.9 | 6.8 4.1 | 0.016 |
| Admission CURB 65 score, mean SD | 1.7 1.4 | 1.7 1.5 | 0.98 |
| Fever on admission | 40% (6) | 33.3% (18) | 0.63 |
| Sepsis within 48 hours of procedure | 93.3% (14) | 77.8% (42) | 0.17 |
| ICU admit within 48 hours of admission | 26.7% (4) | 20.4% (11) | 0.60 |
| No consolidation or infiltrates on CXR | 21.4% (3) | 7.8% (4) | 0.65 |
| Source of admission | |||
| Home | 15% (100) | 90.7% (49) | NSa |
| Extended care facility | 0% (0) | 9.3% (5) | |
| Discharge aliveb | 80% (12) | 94.4% (51) | 0.08 |
DISCUSSION
Chest radiography plays an essential role in diagnosing pneumonia. Chest CT scans are more sensitive in diagnosing pneumonia and may be more specific for certain pathogens, but objective indicators or guidelines regarding test performance are lacking.[7] There are few available studies that evaluate the benefit of chest CT scans in adults with pneumonia. Beall et al. noted 57% of immunocompetent hosts, 22% of human immunodeficiency virus (HIV) patients, and 45% of immunocompromised hosts had a new finding on CT.[8] In 40% of the cases, there was an overall change in management based on the findings. Nyamande et al. showed that high‐resolution CT scans identified abnormalities missed on plain radiographs in 82% (n = 40) of HIV patients in sub‐Saharan Africa.[9] A study by Syrjl et al. highlights the fact that high‐resolution CT scanning improves the diagnosis of community‐acquired pneumonia in patients with negative chest radiographs.[10] In the right clinical setting, additional imaging, such as high‐resolution CT scanning, is more sensitive at detecting abnormalities consistent with pneumonia.[10] We found that a CT scan was more likely to be performed in patients with no infiltrates or consolidation consistent with that finding. However, the authors did not attempt to evaluate improved clinical outcomes or management changes. Other investigators have tried to demonstrate unique or specific findings on CT scans compared to plain radiography for particular pathogens.[11, 12, 13]
We attempted to identify specific features of patients presenting with pneumonia that could assist clinicians in the decision‐making process as it relates to ordering a CT scan. CT scans were performed more frequently on subjects who were younger, had lower severity of illness, and were admitted from the community. We were unable to assess the radiographic and/or clinical findings that led the providers to order the CT scans. It is interesting to note, however, that Metlay et al. demonstrated a decreasing prevalence of pneumonia‐associated symptoms with increasing age.[14] One could speculate that patients who are younger and tend to have more symptoms may be more likely to get ancillary testing.
In our study, 35% of patients admitted with pneumonia had a CT scan performed that led to an additional procedure 22% of the time. We were unable to accurately evaluate the impact of CT on antibiotic modification, duration, or some outcomes. Although a number of studies demonstrated new or missed findings by CT compared to plain radiography, only Beall et al. reported outcome changes.[8, 9, 10, 12] They found that 39% (21/54) of patients had a change in their treatment plan including antibiotic alterations.
A number of factors impact outcomes such as length of stay and mortality in patients admitted with community‐acquired pneumonia. Empyema contributes to additional length of stay and pleural effusions are new findings identified by CT scans.[8, 9, 15, 16] Unfortunately, the number of patients with pleural effusions and even empyema (data not shown) was too small for us to analyze. Better prospective observational studies will be necessary to define specific CT findings leading to actual changes in management. The optimal timing of CT scanning could also be determined from these studies. The retrospective nature of our study is a key limitation to our results. It is difficult to determine retrospectively the clinical decision‐making process used when ordering additional diagnostic tests or procedures. Whether the CT scans ordered on our patients truly resulted in additional procedures or whether the procedures were preplanned cannot be elucidated. Our current electronic medical record and ordering process has significant drop‐down list selection bias for test indications. A postorder research‐based survey tool would be required to further evaluate the clinician's decision‐making process. In addition, as a single center study, the decision to perform CT scans and pneumonia‐related procedures reflects only the practice patterns among a relatively small number of physicians with a wide variety of practice levels and specialties. Although length of stay was not affected by performing a CT scan, patients who had a procedure did have a prolonged hospital stay consistent with a complicated course as confirmed by others.[16]
Our study results could be the first step in developing prospective studies to evaluate the indications and utility of ancillary imaging in patients with pneumonia. Prospective, multicenter observational studies, which include a clinical decision‐making survey tool as noted above, would be tremendously beneficial. Pathogen‐specific indications and outcomes will be facilitated by the deployment of more rapid and effective molecular diagnostic capabilities. Furthermore, the cost of the test, radiation exposure, impact on clinical outcomes, and overall risk/benefit would need to be calculated from these future studies.
- National Hospital Discharge Survey. National Center for Health Statistics. Available at: http://www.cdc.gov/nchs/data/nhds/2average/ 2010ave2_firstlist.pdf. Accessed December 10, 2013.
- , , , et al. Infectious Diseases Society of America/American Thoracic Society consensus guidelines on the management of community‐acquired pneumonia in adults. Clin Infect Dis. 2007;44(suppl 2):S27–S72.
- , . Chest radiograph vs. computed tomography scan in the evaluation for pneumonia. J Emerg Med. 2009;36(3):266–270.
- American College of Radiology. RadiologyInfo.org website. Radiation dose in x‐ray and CT exams. Available at: http://www.radiologyinfo.org/en/safety/?pg=sfty_xray. Accessed February 24, 2014.
- , , , et al. Prospective comparison of three validated prediction rules for prognosis in community‐acquired pneumonia. Am J Med. 2005;118(4):384–392.
- , , , et al. Updating and validating the Charlson comorbidity index and score for risk adjustment in hospital discharge abstracts using data from 6 countries. Am J Epidemiol. 2011;173(6):676–682.
- , . Imaging pneumonia in immunocompetent and immunocompromised individuals. Curr Opin Pulm Med. 2012;18(3):194–201.
- , , , , , . Utilization of computed tomography in patients hospitalized with community‐acquired pneumonia. Md Med J. 1998;47(4):182–187.
- , , . Comparison of plain chest radiography and high‐resolution CT in human immunodeficiency virus infected patients with community‐acquired pneumonia: a sub‐Saharan Africa study. Br J Radiol. 2007;80(953):302–306.
- , , , , . High‐resolution computed tomography for the diagnosis of community‐acquired pneumonia. Clin Infect Dis. 1998;27(2):358–363.
- , , , et al. Pulmonary computed tomography findings in 39 cases of Streptococcus pneumoniae pneumonia. Intern Med. 2012;51(24):3343–3349.
- , , , et al. High‐resolution CT findings in Streptococcus milleri pulmonary infection. Clin Radiol. 2013;68(6):e331–e337.
- , , , et al. Thin‐section CT findings in Pseudomonas aeruginosa pulmonary infection. Br J Radiol. 2012;85(1020):1533–1538.
- , , , et al. Influence of age on symptoms at presentation in patients with community‐acquired pneumonia. Arch Intern Med. 1997;157(13):1453–1459.
- , , . Factors associated with length of stay in hospital for suspected community‐acquired pneumonia. Can Respir J. 2006;13(6):317–324.
- , , , , , . Predictors for length of hospital stay in patients with community‐acquired pneumonia: results from a Swiss multicenter study. BMC Pulm Med. 2012;12:21.
Tablet Computers to Engage Patients
BACKGROUND
Many hospitals have initiated intense efforts to improve transitions of care[1] such as discharge coordinators or transition coaches,[2, 3] but use of mobile devices as approaches to add or extend the value of human interventions have been understudied.[4] Additionally, many hospitalized patients experience substantial inactive time between provider visits, tests, and treatments. This time could be used to engage patients in their care through interactive health education modules and by learning to use their PHR to manage medications and postdischarge appointments.
Greater understanding of the advantages and limitations of mobile devices may be important for improving transitions of care and may help leverage existing hospital personnel resources. However, prior studies have focused on healthcare provider uses of tablet computers for medical education,[5] to collect clinical registration data,[6] or to do clinical work (eg, check labs, write notes)[7, 8, 9] primarily in outpatient settings; few studies have focused on patient uses for this technology in hospital settings.[10, 11] To address these knowledge gaps, we conducted a pilot project to explore inpatient satisfaction with bedside tablets and barriers to usability. Additionally, we evaluated use of these devices to deliver 2 specific Web‐based programs: (1) an interactive video to improve inpatient education about hospital safety, and (2) PHR access to promote inpatient engagement in discharge planning.
METHODS
Study Design, Patient Selection, and Devices/Programs
We conducted a prospective study of tablet computers to engage patients in their care and discharge planning through Web‐based interactive health education modules and use of PHRs. We used 2 tablets, distributed daily by research assistants (RAs) to eligible patients after morning rounds. Inclusion criteria for patients were ability to speak English and admission to the medical (hospitalist) service at University of California San Francisco (UCSF) Medical Center. Exclusion criteria were intensive care unit admission, contact isolation, or inability to complete the consent process due to altered mental status or cognitive impairment.
RAs screened patients for inclusion/exclusion via the electronic medical record and then approached them after rounds for enrollment (11:00 am1:00 pm). RAs then performed a tiered orientation tailored to individual patient experience and needs. First, they delivered a brief tutorial focused on the tablet itself and its basic functions (touchscreen, keypad, and Internet browser use). Second, RAs showed patients how to access the online educational health module and how to navigate content within the module. RAs next explained what the PHR is and demonstrated how to login, how to navigate tabs within the PHR, and how to perform basic tasks (view/refill medications, view/modify appointments, and view/send messages to providers). The RAs left devices with patients for 3 to 5 hours and returned to collect them and perform debriefing interviews. After each device was returned, RAs cleaned devices with disinfectant wipes available in patient rooms and checked for physical damage or software malfunctions (eg, unable to turn on or unlock). Finally, RAs used the reset function to erase any personal data or setting modifications made by patients and docked the devices overnight to resynchronize the original settings and recharge the batteries.
We used the 16 gigabyte Apple iPad2 (Apple Inc., Cupertino, CA) without any enclosures, cases, or security devices. Our educational health module was Patient Safety in the Hospital, which was professionally developed by Emmi Solutions (
Survey Instruments and Data Collection
We developed pre‐ and postintervention surveys to characterize patients' demographics, device ownership, and health‐related Internet activities in the last year based on questions used in the Centers for Disease Control and Prevention National Health Interview Study (
Analyses
We used frequency analysis to describe patient demographics, ability to complete online health educational modules, and utilization of their PHR. We performed bivariate analyses (Fisher exact test) to assess correlations between demographics (age, device ownership, Internet use) and key pilot program performance measures (orientation time 15 minutes, online health module completion, and completion of 1 essential function in the PHR). All analyses were performed in SAS 9.2 (SAS Institute Inc., Cary, NC). The institutional review board of record for UCSF approved this study.
RESULTS
As shown in Table 1, we enrolled 30 patients. Most participants (60%) were aged 40 years or older, and most (87%) owned a mobile device; 70% owned a laptop and 60% owned a smartphone, but few (22%) owned a computer tablet. Most participants accessed the Internet daily, but fewer reported Internet use for health tasks; about half (52%) communicated with a provider, but few refilled a prescription (27%) or scheduled an appointment (21%) online over the last year.
| Characteristic | No. (%) |
|---|---|
| Age, y | |
| 1839 | 11 (38%) |
| 4049 | 5 (18%) |
| 5059 | 4 (14%) |
| 6069 | 5 (18%) |
| 7079 | 3 (10%) |
| Gender, female | 17 (60%) |
| Device ownership | |
| Desktop computer | 12 (44%) |
| Laptop computer | 19 (70%) |
| Smart phone | 17 (60%) |
| Tablet computer | 6 (22%) |
| Any mobile device (laptop, smartphone, or tablet) | 26 (87%) |
| Internet use | |
| Daily | 21 (72%) |
| Several times a week | 3 (10%) |
| Once a week or less | 5 (18%) |
| Prestudy online health tasks | |
| Looked up health information | 21 (72%) |
| Communicated with provider | 15 (52%) |
| Refilled prescription | 8 (27%) |
| Scheduled medical appointment | 6 (21%) |
Nearly all participants (90%) were satisfied or very satisfied with their experience using the tablet in the hospital (Figure 1). Most (87%) required 30 minutes or less for basic orientation, and 70% required only 15 minutes or less. Most participants (83%) were able to independently complete an interactive health education module on hospital safety and were highly satisfied with the module. Despite the fact that 73% of participants were first‐time users of our PHR, the majority were able to login and independently access their medication list, verify scheduled appointments, or send a secure message to their primary care provider.
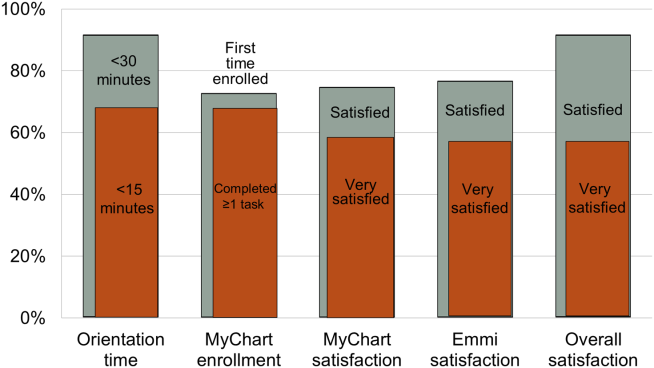
Participants aged 50 years or older were less likely to complete orientation in 15 minutes or less compared to those under 50 years old (25% vs 79%, P=0.025); however, age was not a significant factor in ability to complete the online health educational module or perform at least 1 essential PHR function. Other demographic features, such as device ownership and daily Internet use, did not correlate with shorter orientation time, educational module completion, or PHR use (data available on request).
Participants also made suggestions for improvement during the debrief interviews. Several suggested applications for entertainment (gaming, magazines, or music) and 2 suggested that all patients should be introduced to their PHR during hospitalization (data available on request). No device software malfunction (eg, device freezes, Internet connection failures), hardware issues (eg, damage from falls, wetness, or repeated disinfectant exposure), or theft or misappropriation were reported by patients or observed by the RAs to date.
DISCUSSION
Our pilot study suggests that tablet‐based access to educational modules and PHRs can increase inpatient engagement in care with high satisfaction and minimal time for orientation. Surprisingly, even older patients and those who might be considered less tech savvy in terms of Internet use and device ownership were equally able to utilize our tablet interventions. Furthermore, we did not experience any hardware issues in the harsh physical environment of inpatient wards. These preliminary findings suggest the potential utility of tablets for clinically meaningful tasks by inpatients with a low rate of technical issues.
From a technical standpoint, our experience suggests several next steps. First, although orientation time was minimal, it might be even less if patients used their own mobile devices because most patients already owned one. This bring your own device (BYOD) approach could also promote postdischarge patient engagement. Second, the flexibility of a BYOD approach raises the question of whether to also allow patients a choice of application‐based versus browser‐based platforms for specific programs such as the PHR and educational video we used. Indeed, although we used a browser‐based approach, several other teams have developed patient‐facing engagement applications (or apps) for mobile devices,[4, 12] and hospitalists could prescribe apps at discharge as a more providers are now doing in outpatient settings.[13] Of course, maximizing flexibility for BYOD and Web‐based versus app‐based approaches would likely increase patient engagement but would come at the cost of more time and effort for hospital providers to vet apps/websites and educate patients about their use. Third, regardless of the devices and programs used, broader engagement of patients, nurses, hospitalists, and other providers will be needed in the future to identify key areas for development to avoid overburdening patients and providers.
From a quality‐improvement perspective, recent literature has considered broad clinical uses for tablets by hospital providers,[14, 15] but our experience suggests more specific opportunities to improve transitions of care though direct patient engagement. Tablets and other mobile devices may help improve discharge education for patients taking high‐risk medications such as warfarin or insulin using interactive educational modules similar to the hospital safety modules we used. Additionally, clinical staff, such as nurses and pharmacists, can be trained to deliver mobile device interventions such as education on high‐risk medications.[16] Ultimately, scale up for our intervention will require that mobile devices and content eventually improve and replace current practices by hospital staff (especially nurses) in a way that streamlines, rather than compounds, current workflow. This could increase efficiency in these discharge tasks and extend contributions of these providers to high‐quality transitions.
Our study has several limitations. First, although this is a pilot study with only 30 patients, it adds needed scale to much smaller (N=58) published feasibility studies of tablet computer use by inpatients.[11, 12] Beyond more robust feasibility testing, our study adds new data about mobile device use for specific clinical tasks in the hospital such as patient education and PHR use. Second, we did not track postdischarge outcomes to test the effects of our intervention on transition care quality; this will be a focus of our future research. Third, we used existing platforms for interactive educational modules and PHR access at our site; participant satisfaction in our study may not generalize to other platforms. Furthermore, most PHR platforms (including ours) are not optimally configured to engage patients during transitions of care, but we plan to integrate existing functions (such as ability to refill medications or change appointments) into discharge education and planning. Finally, we have not engaged caregivers as surrogates for cognitively impaired patients or adapted our platform for non‐English speakers; these are areas for development in our ongoing work. Overall, our pilot results help set the stage to deploy mobile devices for better patient monitoring, engagement, and quality of care in the inpatient setting.[17]
In conclusion, our pilot project demonstrates that tablet computers can be used to improve inpatient education and patient engagement in discharge planning. Inpatients are highly satisfied with the use of tablets to complete health education modules and access their PHR, with minimal time required for patient training and device management by hospital staff. Tablets and other mobile devices have significant potential to improve patients' education and engagement in their hospital care.
Acknowledgements
The authors thank the UCSF mHealth group and Center for Digital Health Innovation for advice and for providing tablet computers for this pilot project.
Disclosures: This article was presented as a finalist in the Research, Innovations, and Clinical Vignettes competition (Innovations category) at the 2013 Annual Meeting of the Society for Hospital Medicine. Dr. Auerbach was supported by grant K24HL098372 (NHLBI). Dr. Greysen was supported by a career development award (KL‐2) from the UCSF Clinical Translational Sciences Institute. The authors have declared they have no financial, personal, or other conflicts of interest relevant to this study.
- , . Hospital readmissions and the Affordable Care Act: paying for coordinated quality care. JAMA. 2011;306(16):1794–1795.
- , , , et al. A reengineered hospital discharge program to decrease re‐hospitalization. Ann Intern Med. 2009;150:178–187.
- , , , . The care transitions intervention: results of a randomized controlled trial. Arch Intern Med. 2006;166:1822–1828.
- Project RED. Meet Louise…and virtual patient advocates. Available at: http://www.bu.edu/fammed/projectred/publications/VirtualPatientAdvocateWebsiteInfo2.pdf. Accessed July 12, 2013.
- , , , . Use of handheld computers in medical education. A systematic review. J Gen Intern Med. 2006;21(5):531–537.
- , , , . Ongoing evaluation of ease‐of‐use and usefulness of wireless tablet computers within an ambulatory care unit. Stud Health Tech Inform. 2009;143:459–464.
- . Use of a tablet personal computer to enhance patient care on multidisciplinary rounds. Am J Health Syst Pharm. 2009;66(21):1909–1911.
- , . Experiences incorporating Tablet PCs into clinical pharmacists' workflow. J Healthc Inf Manag. 2005;19(4):32–37.
- , , . The impact of mobile handheld technology on hospital physicians' work practices and patient care: a systematic review. J Am Med Inform Assoc. 2009;16(6):792–801.
- , , , et al. An investigation of the efficacy of electronic consenting interfaces of research permissions management system in a hospital setting. Int J Med Inform. 2013;82(9):854–863.
- , , , et al. A tablet computer application for patients to participate in their hospital care. AMIA Annu Symp Proc. 2011;2011:1428–1435.
- , , , et al. Building and testing a patient‐centric electronic bedside communication center. J Gerontol Nurs. 2013;39(1):15–19.
- . How apps are changing family medicine. J Fam Pract. 2013Jul;62(7):362–367.
- . The iPad: gadget or medical godsend? Ann Emerg Med. 2010;56(1):A21–A22.
- , , , et al. How might the iPad change healthcare? J R Soc Med. 2012;105(6):233–241.
- . Keeping the patient focus: using tablet technology to enhance education and practice. J Contin Educ Nurs. 2012;43(6):249–250.
- , , , et al. Advancing the science of mHealth. J Health Commun. 2012;17(suppl 1):5–10.
BACKGROUND
Many hospitals have initiated intense efforts to improve transitions of care[1] such as discharge coordinators or transition coaches,[2, 3] but use of mobile devices as approaches to add or extend the value of human interventions have been understudied.[4] Additionally, many hospitalized patients experience substantial inactive time between provider visits, tests, and treatments. This time could be used to engage patients in their care through interactive health education modules and by learning to use their PHR to manage medications and postdischarge appointments.
Greater understanding of the advantages and limitations of mobile devices may be important for improving transitions of care and may help leverage existing hospital personnel resources. However, prior studies have focused on healthcare provider uses of tablet computers for medical education,[5] to collect clinical registration data,[6] or to do clinical work (eg, check labs, write notes)[7, 8, 9] primarily in outpatient settings; few studies have focused on patient uses for this technology in hospital settings.[10, 11] To address these knowledge gaps, we conducted a pilot project to explore inpatient satisfaction with bedside tablets and barriers to usability. Additionally, we evaluated use of these devices to deliver 2 specific Web‐based programs: (1) an interactive video to improve inpatient education about hospital safety, and (2) PHR access to promote inpatient engagement in discharge planning.
METHODS
Study Design, Patient Selection, and Devices/Programs
We conducted a prospective study of tablet computers to engage patients in their care and discharge planning through Web‐based interactive health education modules and use of PHRs. We used 2 tablets, distributed daily by research assistants (RAs) to eligible patients after morning rounds. Inclusion criteria for patients were ability to speak English and admission to the medical (hospitalist) service at University of California San Francisco (UCSF) Medical Center. Exclusion criteria were intensive care unit admission, contact isolation, or inability to complete the consent process due to altered mental status or cognitive impairment.
RAs screened patients for inclusion/exclusion via the electronic medical record and then approached them after rounds for enrollment (11:00 am1:00 pm). RAs then performed a tiered orientation tailored to individual patient experience and needs. First, they delivered a brief tutorial focused on the tablet itself and its basic functions (touchscreen, keypad, and Internet browser use). Second, RAs showed patients how to access the online educational health module and how to navigate content within the module. RAs next explained what the PHR is and demonstrated how to login, how to navigate tabs within the PHR, and how to perform basic tasks (view/refill medications, view/modify appointments, and view/send messages to providers). The RAs left devices with patients for 3 to 5 hours and returned to collect them and perform debriefing interviews. After each device was returned, RAs cleaned devices with disinfectant wipes available in patient rooms and checked for physical damage or software malfunctions (eg, unable to turn on or unlock). Finally, RAs used the reset function to erase any personal data or setting modifications made by patients and docked the devices overnight to resynchronize the original settings and recharge the batteries.
We used the 16 gigabyte Apple iPad2 (Apple Inc., Cupertino, CA) without any enclosures, cases, or security devices. Our educational health module was Patient Safety in the Hospital, which was professionally developed by Emmi Solutions (
Survey Instruments and Data Collection
We developed pre‐ and postintervention surveys to characterize patients' demographics, device ownership, and health‐related Internet activities in the last year based on questions used in the Centers for Disease Control and Prevention National Health Interview Study (
Analyses
We used frequency analysis to describe patient demographics, ability to complete online health educational modules, and utilization of their PHR. We performed bivariate analyses (Fisher exact test) to assess correlations between demographics (age, device ownership, Internet use) and key pilot program performance measures (orientation time 15 minutes, online health module completion, and completion of 1 essential function in the PHR). All analyses were performed in SAS 9.2 (SAS Institute Inc., Cary, NC). The institutional review board of record for UCSF approved this study.
RESULTS
As shown in Table 1, we enrolled 30 patients. Most participants (60%) were aged 40 years or older, and most (87%) owned a mobile device; 70% owned a laptop and 60% owned a smartphone, but few (22%) owned a computer tablet. Most participants accessed the Internet daily, but fewer reported Internet use for health tasks; about half (52%) communicated with a provider, but few refilled a prescription (27%) or scheduled an appointment (21%) online over the last year.
| Characteristic | No. (%) |
|---|---|
| Age, y | |
| 1839 | 11 (38%) |
| 4049 | 5 (18%) |
| 5059 | 4 (14%) |
| 6069 | 5 (18%) |
| 7079 | 3 (10%) |
| Gender, female | 17 (60%) |
| Device ownership | |
| Desktop computer | 12 (44%) |
| Laptop computer | 19 (70%) |
| Smart phone | 17 (60%) |
| Tablet computer | 6 (22%) |
| Any mobile device (laptop, smartphone, or tablet) | 26 (87%) |
| Internet use | |
| Daily | 21 (72%) |
| Several times a week | 3 (10%) |
| Once a week or less | 5 (18%) |
| Prestudy online health tasks | |
| Looked up health information | 21 (72%) |
| Communicated with provider | 15 (52%) |
| Refilled prescription | 8 (27%) |
| Scheduled medical appointment | 6 (21%) |
Nearly all participants (90%) were satisfied or very satisfied with their experience using the tablet in the hospital (Figure 1). Most (87%) required 30 minutes or less for basic orientation, and 70% required only 15 minutes or less. Most participants (83%) were able to independently complete an interactive health education module on hospital safety and were highly satisfied with the module. Despite the fact that 73% of participants were first‐time users of our PHR, the majority were able to login and independently access their medication list, verify scheduled appointments, or send a secure message to their primary care provider.
Participants aged 50 years or older were less likely to complete orientation in 15 minutes or less compared to those under 50 years old (25% vs 79%, P=0.025); however, age was not a significant factor in ability to complete the online health educational module or perform at least 1 essential PHR function. Other demographic features, such as device ownership and daily Internet use, did not correlate with shorter orientation time, educational module completion, or PHR use (data available on request).
Participants also made suggestions for improvement during the debrief interviews. Several suggested applications for entertainment (gaming, magazines, or music) and 2 suggested that all patients should be introduced to their PHR during hospitalization (data available on request). No device software malfunction (eg, device freezes, Internet connection failures), hardware issues (eg, damage from falls, wetness, or repeated disinfectant exposure), or theft or misappropriation were reported by patients or observed by the RAs to date.
DISCUSSION
Our pilot study suggests that tablet‐based access to educational modules and PHRs can increase inpatient engagement in care with high satisfaction and minimal time for orientation. Surprisingly, even older patients and those who might be considered less tech savvy in terms of Internet use and device ownership were equally able to utilize our tablet interventions. Furthermore, we did not experience any hardware issues in the harsh physical environment of inpatient wards. These preliminary findings suggest the potential utility of tablets for clinically meaningful tasks by inpatients with a low rate of technical issues.
From a technical standpoint, our experience suggests several next steps. First, although orientation time was minimal, it might be even less if patients used their own mobile devices because most patients already owned one. This bring your own device (BYOD) approach could also promote postdischarge patient engagement. Second, the flexibility of a BYOD approach raises the question of whether to also allow patients a choice of application‐based versus browser‐based platforms for specific programs such as the PHR and educational video we used. Indeed, although we used a browser‐based approach, several other teams have developed patient‐facing engagement applications (or apps) for mobile devices,[4, 12] and hospitalists could prescribe apps at discharge as a more providers are now doing in outpatient settings.[13] Of course, maximizing flexibility for BYOD and Web‐based versus app‐based approaches would likely increase patient engagement but would come at the cost of more time and effort for hospital providers to vet apps/websites and educate patients about their use. Third, regardless of the devices and programs used, broader engagement of patients, nurses, hospitalists, and other providers will be needed in the future to identify key areas for development to avoid overburdening patients and providers.
From a quality‐improvement perspective, recent literature has considered broad clinical uses for tablets by hospital providers,[14, 15] but our experience suggests more specific opportunities to improve transitions of care though direct patient engagement. Tablets and other mobile devices may help improve discharge education for patients taking high‐risk medications such as warfarin or insulin using interactive educational modules similar to the hospital safety modules we used. Additionally, clinical staff, such as nurses and pharmacists, can be trained to deliver mobile device interventions such as education on high‐risk medications.[16] Ultimately, scale up for our intervention will require that mobile devices and content eventually improve and replace current practices by hospital staff (especially nurses) in a way that streamlines, rather than compounds, current workflow. This could increase efficiency in these discharge tasks and extend contributions of these providers to high‐quality transitions.
Our study has several limitations. First, although this is a pilot study with only 30 patients, it adds needed scale to much smaller (N=58) published feasibility studies of tablet computer use by inpatients.[11, 12] Beyond more robust feasibility testing, our study adds new data about mobile device use for specific clinical tasks in the hospital such as patient education and PHR use. Second, we did not track postdischarge outcomes to test the effects of our intervention on transition care quality; this will be a focus of our future research. Third, we used existing platforms for interactive educational modules and PHR access at our site; participant satisfaction in our study may not generalize to other platforms. Furthermore, most PHR platforms (including ours) are not optimally configured to engage patients during transitions of care, but we plan to integrate existing functions (such as ability to refill medications or change appointments) into discharge education and planning. Finally, we have not engaged caregivers as surrogates for cognitively impaired patients or adapted our platform for non‐English speakers; these are areas for development in our ongoing work. Overall, our pilot results help set the stage to deploy mobile devices for better patient monitoring, engagement, and quality of care in the inpatient setting.[17]
In conclusion, our pilot project demonstrates that tablet computers can be used to improve inpatient education and patient engagement in discharge planning. Inpatients are highly satisfied with the use of tablets to complete health education modules and access their PHR, with minimal time required for patient training and device management by hospital staff. Tablets and other mobile devices have significant potential to improve patients' education and engagement in their hospital care.
Acknowledgements
The authors thank the UCSF mHealth group and Center for Digital Health Innovation for advice and for providing tablet computers for this pilot project.
Disclosures: This article was presented as a finalist in the Research, Innovations, and Clinical Vignettes competition (Innovations category) at the 2013 Annual Meeting of the Society for Hospital Medicine. Dr. Auerbach was supported by grant K24HL098372 (NHLBI). Dr. Greysen was supported by a career development award (KL‐2) from the UCSF Clinical Translational Sciences Institute. The authors have declared they have no financial, personal, or other conflicts of interest relevant to this study.
- , . Hospital readmissions and the Affordable Care Act: paying for coordinated quality care. JAMA. 2011;306(16):1794–1795.
- , , , et al. A reengineered hospital discharge program to decrease re‐hospitalization. Ann Intern Med. 2009;150:178–187.
- , , , . The care transitions intervention: results of a randomized controlled trial. Arch Intern Med. 2006;166:1822–1828.
- Project RED. Meet Louise…and virtual patient advocates. Available at: http://www.bu.edu/fammed/projectred/publications/VirtualPatientAdvocateWebsiteInfo2.pdf. Accessed July 12, 2013.
- , , , . Use of handheld computers in medical education. A systematic review. J Gen Intern Med. 2006;21(5):531–537.
- , , , . Ongoing evaluation of ease‐of‐use and usefulness of wireless tablet computers within an ambulatory care unit. Stud Health Tech Inform. 2009;143:459–464.
- . Use of a tablet personal computer to enhance patient care on multidisciplinary rounds. Am J Health Syst Pharm. 2009;66(21):1909–1911.
- , . Experiences incorporating Tablet PCs into clinical pharmacists' workflow. J Healthc Inf Manag. 2005;19(4):32–37.
- , , . The impact of mobile handheld technology on hospital physicians' work practices and patient care: a systematic review. J Am Med Inform Assoc. 2009;16(6):792–801.
- , , , et al. An investigation of the efficacy of electronic consenting interfaces of research permissions management system in a hospital setting. Int J Med Inform. 2013;82(9):854–863.
- , , , et al. A tablet computer application for patients to participate in their hospital care. AMIA Annu Symp Proc. 2011;2011:1428–1435.
- , , , et al. Building and testing a patient‐centric electronic bedside communication center. J Gerontol Nurs. 2013;39(1):15–19.
- . How apps are changing family medicine. J Fam Pract. 2013Jul;62(7):362–367.
- . The iPad: gadget or medical godsend? Ann Emerg Med. 2010;56(1):A21–A22.
- , , , et al. How might the iPad change healthcare? J R Soc Med. 2012;105(6):233–241.
- . Keeping the patient focus: using tablet technology to enhance education and practice. J Contin Educ Nurs. 2012;43(6):249–250.
- , , , et al. Advancing the science of mHealth. J Health Commun. 2012;17(suppl 1):5–10.

Inpatient Questionnaire for Frail Elders
Patient‐reported quality of care is currently an important outcome measure. Ideally, quality of care is assessed by measuring patient's experiences rather than patient satisfaction, as most patients are satisfied with the care they receive, even if the quality is poor.[1] Within the study of the CareWell in Hospital (CWH) program[2]which aims to improve quality of care for frail inpatients age 70 yearswe aimed to assess experiences using a questionnaire to determine the quality of hospital care from the perspective of elderly inpatients. This questionnaire should specifically address whether individualized, integrated care is delivered, with an emphasis on autonomy and maintaining patient independence as well as integrating well‐being into hospital care, all of which are aims of the CWH program. In this, it follows the perspective of integrated care as enabling the achievement of common goals and optimal care results from the patients' view: Care should be sensitive to the characteristics and needs of individual patients.[3]
In the Netherlands, a patient questionnaire to measure experiences with hospital care was carefully developed (partially based on the Consumer Assessment of Healthcare Providers and Systems) and is used to obtain information for national benchmarking: the Consumer Quality Index (CQI).[4] However, we considered this questionnaire containing 78 core questions as well as the time between discharge and measurement (often several months) too long for frail elderly patients, as they have complex, multidisciplinary needs and may have difficulty communicating their needs and reporting their experienced quality of care.
Here, we report on the development and validation of a questionnaire that is based on the CQI and can be used to measure the quality of individualized and integrated hospital care as experienced by inpatients age 70 years.
METHODS
Development
The predefined criteria for the questionnaire were that it should be brief, thereby reducing the burden placed on frail elderly persons; cover the aims of CWH; and measure experiences rather than satisfaction.
Ten categories were initially formulated to match CWH's goals of autonomy, independence, well‐being, individualized care, communication, coordination of care, continuity of care, patient safety, and competence of physicians and nurses. Items from the CQI questionnaire database[5] were selected for each category. Ten members of a panel representing the elderly target group were invited to select the 3 most important questions in each category (first Delphi round). This panel is an important party within a regional network of care and well‐being organizations and involved in discussing the various regional care and/or well‐being projects when it concerns their content and value for elderly persons. They represent elderly persons through their position in elderly‐care or informal care organizations or from personal experiences. During a second Delphi round, they determined whether the individual items of the concept questionnaire were clearly stated, comprehensible to frail elderly patients, represent quality of care, have appropriate answer categories, and so forth. The final questionnaire was edited to match the reading level of a 12‐year‐old and approved by the panel in a face‐to‐face meeting. By this process, content validity was ensured.[6]
Data Collection
The final questionnaire was mailed to both frail and nonfrail medical and surgical inpatients who were included in the CWH before‐after study (January 2011 to July 2012) 1 week after their discharge, by a research assistant (see Supporting Information, Appendix A, in the online version of this article for a description of the study and CWH program).
Patients in the CWH study who returned the questionnaire during the postimplementation measurement period were asked to participate in the test‐retest reliability study until a predetermined sample size of 75 was reached (March 2012 to November 2012). The target interval between returning the first and second questionnaire was 2 to 14 days.[7]
In addition, patients admitted to the geriatrics departmentand therefore assumed to be frailreceived the questionnaire upon discharge (February 2012 to April 2013). The geriatrics department administered the questionnaire anonymously for evaluation and quality‐improvement purposes, as part of usual care. The secretary included the questionnaire in all patient files, and a nurse provided the questionnaire to patients together with other important discharge documents. This questionnaire also included a question regarding goal attainment, as this reflects whether what is important to the most frail elderly patients was accomplished.
Validation and Analysis
Data were analyzed using the statistical software program SPSS version 18.0 (SPSS Inc., Chicago, IL.).
Data
Characteristics of (non)responders, levels of missing data, and measurement range were assessed using descriptive statistics.
Reliability
Internal consistency was assessed by calculating Cronbach's for all available questionnaires with complete data. The answer categories were recoded to a 010 scale; 10 represents the highest quality of care. Test‐retest reliability[6] was assessed by calculating Cohen's for individual questions and intraclass correlation (ICC) for the questionnaire's mean score.
Validity
The following hypotheses were tested in order to assess construct validity: lower scores for female patients[8] and for patients who rate their health lower,[9] and with higher education[8, 9]; higher scores for patients who had an elective admission[8] and whose treatment goals were achieved (own reasoning). Finally, whether patients answered the questionnaire independently or with help should not affect scores (own reasoning). The Spearman was calculated for nonparametric and ordinal data.
In addition, we performed a Kruskal‐Wallis analysis to test the hypothesis that patients admitted to different departments have different scores. Second, we used the Mann‐Whitney U test to detect differences before and after implementation of the CWH program.
For all these analyses, only questionnaires with complete data were included.
RESULTS
Development
The selected answers within the categories communication and competence of nurses and physicians by the panel overlapped with questions from the other 8 categories; thus, the final questionnaire contains 8 core questions (Table 1) (see Supporting Information, Appendix B, in the online version of this article).
| Question |
|---|
|
| 1. Were you informed sufficiently by your doctor regarding the various options for treating your health problems? |
| 2. Were you able to indicate which treatment and/or care you preferred? |
| 3. During your hospital stay, could you co‐decide what was important to your care? |
| 4. During your hospital stay, were you supported in keeping busy and finding social contacts and activities? |
| 5. Did you know to whom you can go within the hospital with questions, problems, or complaints? |
| 6. Before discharge, did you talk with a member of the hospital staff regarding the care you would need after discharge? |
| 7. Did a member of the hospital staff inform the key people and/or care providers of your discharge from the hospital? |
| 8. During your hospital stay, did you experience 1 or more of the following events? |
| Did you fall? |
| Did you become confused? |
| Did you develop pressure ulcers? |
| Did medication errors occur? |
| Did you develop a urinary tract infection? |
| Did you develop a wound infection? |
| Did you experience complications with your surgery and/or treatment? |
Data Collection
Figure 1 shows a flowchart of the questionnaires.

Table 2 presents data of responders compared with nonresponders who were included in the CWH study (N = 293). Patients were age 70 years and admitted 48 hours. Patients responded 14.8 11.3 days after discharge (n = 265). Response rate was 75.8%. From 18 responders no baseline characteristics were available, as only the questionnaire was collected from them to reach n = 75 for test‐retest purposes.
| No. | Responders | No. | Nonresponders | P Value | |
|---|---|---|---|---|---|
| |||||
| Age, y SD | 275 | 76.9 5.2 | 88 | 77.3 5.5 | 0.701 |
| Male sex, n (%) | 275 | 156 (56.7) | 88 | 52 (59.1) | 0.696 |
| CIRS‐G, score SD | 274 | 12.8 5.0 | 88 | 13.9 5.0 | 0.071 |
| MMSE admission, score SD | 264 | 26.7 3.7 | 82 | 25.1 4.8 | 0.001 |
| MMSE discharge, score SD | 230 | 26.9 3.7 | 66 | 25.8 4.4 | 0.026 |
| Length of stay, days SD | 275 | 8.2 7.4 | 88 | 9.6 9.7 | 0.322 |
| Department, surgical (%) | 275 | 170 (61.8) | 88 | 56 (63.6) | 0.759 |
| Admission type, n (%) | 275 | 88 | 0.343 | ||
| Emergency | 82 (29.8) | 22 (25.0) | |||
| Elective | 138 (50.2) | 52 (59.1) | |||
| From other hospital or other department | 55 (20.0) | 14 (15.9) | |||
| Marital status, alone (%) | 273 | 187 (68.5) | 84 | 50 (59.5) | 0.128 |
| Discharge destination, n (%) | 275 | 88 | 0.000 | ||
| Home | 197 (71.6) | 54 (61.4) | |||
| Other hospital | 69 (25.1) | 20 (22.7) | |||
| Care facility | 9 (3.3) | 14 (15.9) | |||
| Readmission, n (%) | 275 | 38 (13.8) | 88 | 7 (8.0) | 0.146 |
| Readmission 1 mo, n (%) | 275 | 28 (10.2) | 88 | 14 (15.9) | 0.144 |
| Death 3 mo following discharge, n (%) | 274 | 9 (3.3) | 86 | 5 (5.8) | 0.233 |
| Received CWH intervention | 149 | 43 (28.9) | 33 | 15 (45.5) | 0.064 |
Patients in the geriatrics department responded in 10.5 15.0 days (n = 111). Mean length of stay was 9.0 7.2 days (n = 116). Data regarding other baseline characteristics and response rate were unavailable due to privacy concerns.
Data Characteristics
Table 3 summarizes data of all 470 questionnaires. Response rates to the answer options ranged from 3.8% to 66.8%. Missing data among the questions ranged from 1.7% within question 8 to 7.0% within question 4. Upon combining the answer categories I don't know and missing, 7/8 questions had >10% missing data; the questions 2 and 3 had the highest percentage of missing data due to the I don't know answer option. The reasons stated by the respondents for why they could not answer these questions included cognitive disabilities; the perception that, because there was only one option (eg, in case of emergency admissions), the question did not apply to them; and/or that the patients preferred not to co‐decide because they felt that the physician knows best and can decide what is best.
| Data (n = 470) | Test‐Retest (n = 78) | |||
|---|---|---|---|---|
| No. | % | No. | ||
| ||||
| Sufficiently informed regarding treatment options | 65 | 0.278 | ||
| Not at all | 23 | 4.9 | ||
| Sometimes | 90 | 19.1 | ||
| Often | 115 | 24.5 | ||
| Every time | 191 | 40.6 | ||
| Don't know | 29 | 6.2 | ||
| Missing | 21 | 4.7 | ||
| Treatment and care preferences discussed | 59 | 0.415 | ||
| Not at all | 89 | 18.9 | ||
| Sometimes | 78 | 16.6 | ||
| Often | 61 | 13.0 | ||
| Every time | 111 | 23.6 | ||
| Don't know | 103 | 21.9 | ||
| Missing | 28 | 6.0 | ||
| Co‐decide regarding important issues | 56 | 0.295 | ||
| Not at all | 75 | 16.0 | ||
| Sometimes | 86 | 18.3 | ||
| Often | 67 | 14.3 | ||
| Every time | 112 | 23.8 | ||
| Don't know | 98 | 20.9 | ||
| Missing | 32 | 6.8 | ||
| Supported in finding (social) activities | 73 | 0.533 | ||
| Not at all | 72 | 15.3 | ||
| A little | 66 | 14.0 | ||
| Good | 109 | 23.2 | ||
| Very good | 36 | 7.7 | ||
| Not applicable | 130 | 27.7 | ||
| Don't know | 24 | 5.1 | ||
| Missing | 33 | 7.0 | ||
| Knows relevant person for questions, problems, complaints | 77 | 0.652 | ||
| Yes | 279 | 59.4 | ||
| No | 107 | 22.8 | ||
| Don't know | 67 | 14.3 | ||
| Missing | 17 | 3.6 | ||
| Discussed postdischarge care needs | 75 | 0.574 | ||
| Yes, sufficient | 311 | 66.2 | ||
| Yes, but insufficient | 26 | 5.5 | ||
| No | 99 | 20.3 | ||
| I don't know/I don't remember | 18 | 3.8 | ||
| Missing | 19 | 4.0 | ||
| Hospital informed other important people/providers of discharge | 69 | 0.405 | ||
| No | 45 | 9.6 | ||
| Some were informed | 54 | 11.5 | ||
| Yes | 314 | 66.8 | ||
| Don't know | 38 | 8.1 | ||
| Missing | 19 | 4.0 | ||
| Adverse events during hospital admission | DK | MIS | 78 | 0.816 |
| Fall, confusion, pressure ulcer, medication error, bladder infection, wound infection, complication of surgery/treatment | Max 9.1% | Max 4.3% | ||
| Sum | Mean | No. | ICC | |
| Mean score on the total questionnaire, complete cases (n = 222) | 51.9 18.3 | 6.5 2.3 | 39 | 0.745 |
Reliability
Of the 470 questionnaires, 222 (47.2%) had complete data and were used to analyze internal consistency. Cronbach's for the 8‐item questionnaire was 0.70 (good internal consistency).
Seventy‐eight questionnaires were available to measure test‐retest reliability. The interval between test‐retest was 8.7 4.8 days; 94.7% was returned within the targeted 14 days. Thirty‐eight patients had complete data for both measurements: ICC on the mean score of the questionnaire was 0.75 (95% confidence interval [CI]: 0.56‐0.86), which indicates good test‐retest reliability (Table 3). Including patients with incomplete data (1 to 2 missing items) yielded an ICC >0.70. Among the individual questions, Cohen's ranged from 0.28 to 0.82.
Validity
The mean questionnaire score was significantly correlated with goals achieved while hospitalized (Table 4).
| Variable | Response | No.a | Score SD | Correlation |
|---|---|---|---|---|
| ||||
| Sex | M | 114 | 6.3 2.3 | 0.080 |
| F | 108 | 6.7 2.3 | ||
| Health status | Excellent | 1 | 0.071 | |
| Very good | 5 | 7.9 2.0 | ||
| Good | 52 | 6.7 2.4 | ||
| Fair | 120 | 6.5 2.2 | ||
| Poor | 28 | 6.2 2.1 | ||
| Education level | 6 grades primary school | 4 | 4.9 1.2 | 0.068 |
| Primary school | 19 | 6.4 2.5 | ||
| Higher than primary school | 6 | 7.6 1.2 | ||
| Practical training | 27 | 6.0 2.2 | ||
| Secondary vocational training | 41 | 6.1 2.5 | ||
| Pre‐university education | 2 | 7.2 4.0 | ||
| University/higher education | 20 | 6.8 2.2 | ||
| Admission type | Emergency | 31 | 6.5 2.6 | 0.015 |
| Elective | 61 | 6.6 2.0 | ||
| Goal of admission achieved | Yes | 33 | 7.6 1.7 | 0.319b |
| Partially | 24 | 6.6 2.1 | ||
| No | 6 | 4.7 2.8 | ||
| Respondent | Patient only | 117 | 6.7 2.2 | 0.063 |
| Patient with help | 59 | 5.9 2.3 | ||
| Other person | 41 | 6.7 2.4 | ||
Mean scores did not differ significantly between departments (geriatrics: 6.8 2.2, n = 88; cardiothoracic surgery and lung diseases: 6.5 2.4, n = 54; internal medicine: 6.3 2.5, n = 30; general surgery: 6.0 2.2, n = 50; P = 0.234).
In addition, mean scores did not differ significantly before (6.5 2.2, n = 53) and after (6.1 2.4, n = 67) implementation of the CWH study (P = 0.320).
DISCUSSION
The CareWell in Hospital patient questionnaire is a brief 8‐item questionnaire to assess the experiences of elderly patients regarding integrated hospital care. It showed good internal consistency and test‐retest reliability, and low responsiveness. Here we discuss some issues related to the preset criteria of the questionnaire.
First, a panel representing the elderly target population was used to develop the questionnaire in order to ensure content validity, which was confirmed by good internal consistency. Yet, with respect to individualized, integrated care for frail elderly patients, we recommend including a question regarding the involvement of informal caregivers during the hospital stay, as they are important partners in healthcare.[10]
Second, the questionnaire was kept short because it should not be a burden and feasible for frail patients to complete. Nonetheless, some of the questions had a high nonresponse rate, and many patients answered I don't know, particularly to the questions 2 and 3. It does not necessarily mean that these questions are poor in quality; it could also indicate that offering individualized care is not yet embedded in the culture of elderly patients and care professionals, such that patients consider such questions to be irrelevant.[11, 12] Nevertheless, we suggest to further explore the feasibility of the questionnaire and potential additional methods for the most frail elderly,[13] who might have been excluded from the CWH study sample at this point (Table 2).
Third, the questionnaire measures experiences rather than satisfaction. Patient‐satisfaction scores are generally tightly correlated with the age, sex, education level, health status, and the person completing the questionnaire.[8] In our study, the correlation did not reach statistical significance. Nevertheless, the achievement of preset goals was correlated significantly with mean CWH scores (Table 4). These findings may indicate that individualized care experiences can indeed be assessed better using this questionnaire. Test‐retest reliability also supports validity, as we expectedand, indeed, sawhigher reliability among the more objective questions (eg, question 8). The most valuing question is question 1, which also had the lowest reliability; the word sufficiently should perhaps be removed in the next version in order to increase its reliability and objectivity.
Finally, scores did not differ between before and after implementation of the CWH program, which suggests either that the questionnaire is unable to detect change or that the program was not sufficiently effective to invoke change yet. The latter option seems plausible, as changes in the provision of individualized care were ongoing. In addition, the items on which favorable differences can be seen for CWH are in fact the items that could be most directly influenced by the CWH interventionists, questions 4, 6, and 7 (see Supporting Information, Appendix C, in the online version of this article). Lastly, we performed an extra analysis concerning the discriminating property of the questionnaire in a subgroup of frail elderly patients; we do see a significant difference in scores between the frail patients in the geriatrics department and the frail patients who received the CWH intervention: 6.8 (n = 88) vs 4.8 (n = 13) for complete data, respectively, P = 0.013; and 6.8 (n = 155) vs 5.7 (n = 37) for incomplete data (2 items missing), P = 0.017 (Mann‐Whitney U test). This may indicate that the questionnaire can measure differences in quality of care for specifically the frail elderly patients between departments. However, these issuesincluding validity and reliability characteristics per specific patient subgroupwarrant further research using a larger sample.
CONCLUSIONS
In conclusion, the CareWell in Hospital patient questionnaire is a feasible and reliable tool for assessing experiences of frail elderly inpatients in the provision of individualized, integrated care. To improve the questionnaire, we recommend to add a question regarding the participation of informal caregivers during the hospital stay, investigate the response rate to questions regarding participation and shared decision‐making, and study responsiveness issues further.
Acknowledgements
The authors thank Gerda van Straaten, Anne Kuijpers, and Thijs Cauven for their support with data collection. We thank all members of the ZOWEL Study Group and the panel representing the elderly target group.
Disclosures: The work was made possible by grant 60‐6190‐098‐272 and grant 60‐61900‐98‐129 of the National Programme for Elderly Care, coordinated and sponsored by ZonMw, The Netherlands, Organization of Health Research and Development. The authors report no conflicts of interest.
- , , . Patient Experience of Health Care Performance. Adelaide, Australia: Primary Health Care Research November 2009. Available at: http://dspace.flinders.edu.au/jspui/bitstream/2328/26594/1/PIR NOV 09 Full.pdf.
- , , , . Hospital Elder Life Program integrated in Dutch hospital care: a pilot study. J Am Geriatr Soc. 2013;61(4):641–642.
- , . Integrated care: meaning, logic, applications, and implications—a discussion paper. Int J Integr Care. 2002;2:e12.
- , , , . CQ‐index Ziekenhuisopname: meetinstrumentontwikkeling. Kwaliteit van de zorg tijdens ziekenhuisopnames vanuit het perspectief van patiënten. De ontwikkeling van het instrument, de psychometrische eigenschappen en het discriminerend vermogen [in Dutch]. Utrecht, The Netherlands: NIVEL (Netherlands Institute for Health Services Research), 2009.
- Centrum Klantervaring Zorg.CQI vragenbank (CQI questionnaire database). Available at: http://nvl002.nivel.nl/CQI. Accessed May–June 2010.
- , , , et al. Quality criteria were proposed for measurement properties of health status questionnaires. J Clin Epidemiol. 2007;60(1):34–42.
- , . Health Measurement Scales: A Practical Guide to Their Development and Use. 4th ed. Oxford, UK: Oxford University Press; 2008:182–183.
- , , , . Assessing patient satisfaction: implications for South Australian public hospitals. Aust Health Rev. 2005;29(4):439–446.
- , , , , . Patient satisfaction revisited: a multilevel approach. Soc Sci Med. 2009;69(1):68–75.
- , , , et al. Relatives' perspective on the quality of geriatric care and rehabilitation—development and testing of a questionnaire. Scand J Caring Sci. 2008;22(4):590–595.
- , , , . Are elderly people with co‐morbidities involved adequately in medical decision making when hospitalised? A cross‐sectional survey. BMC Geriatr. 2011;11:46.
- , , , , . Preferences of acutely ill patients for participation in medical decision‐making. Qual Saf Health Care. 2008;17(2):97–100.
- , . Experience of general hospital care in older patients with cognitive impairment: are we measuring the most vulnerable patients' experience? BMJ Qual Saf. 2013;doi:10.1136/bmjqs‐2013‐001961.
- , . A Manual of Guidelines for Scoring the Cumulative Illness Rating Scale for Geriatrics (CIRS‐G). Pittsburgh, PA: University of Pittsburgh School of Medicine, Department of Geriatric Psychiatry; 1991.
Patient‐reported quality of care is currently an important outcome measure. Ideally, quality of care is assessed by measuring patient's experiences rather than patient satisfaction, as most patients are satisfied with the care they receive, even if the quality is poor.[1] Within the study of the CareWell in Hospital (CWH) program[2]which aims to improve quality of care for frail inpatients age 70 yearswe aimed to assess experiences using a questionnaire to determine the quality of hospital care from the perspective of elderly inpatients. This questionnaire should specifically address whether individualized, integrated care is delivered, with an emphasis on autonomy and maintaining patient independence as well as integrating well‐being into hospital care, all of which are aims of the CWH program. In this, it follows the perspective of integrated care as enabling the achievement of common goals and optimal care results from the patients' view: Care should be sensitive to the characteristics and needs of individual patients.[3]
In the Netherlands, a patient questionnaire to measure experiences with hospital care was carefully developed (partially based on the Consumer Assessment of Healthcare Providers and Systems) and is used to obtain information for national benchmarking: the Consumer Quality Index (CQI).[4] However, we considered this questionnaire containing 78 core questions as well as the time between discharge and measurement (often several months) too long for frail elderly patients, as they have complex, multidisciplinary needs and may have difficulty communicating their needs and reporting their experienced quality of care.
Here, we report on the development and validation of a questionnaire that is based on the CQI and can be used to measure the quality of individualized and integrated hospital care as experienced by inpatients age 70 years.
METHODS
Development
The predefined criteria for the questionnaire were that it should be brief, thereby reducing the burden placed on frail elderly persons; cover the aims of CWH; and measure experiences rather than satisfaction.
Ten categories were initially formulated to match CWH's goals of autonomy, independence, well‐being, individualized care, communication, coordination of care, continuity of care, patient safety, and competence of physicians and nurses. Items from the CQI questionnaire database[5] were selected for each category. Ten members of a panel representing the elderly target group were invited to select the 3 most important questions in each category (first Delphi round). This panel is an important party within a regional network of care and well‐being organizations and involved in discussing the various regional care and/or well‐being projects when it concerns their content and value for elderly persons. They represent elderly persons through their position in elderly‐care or informal care organizations or from personal experiences. During a second Delphi round, they determined whether the individual items of the concept questionnaire were clearly stated, comprehensible to frail elderly patients, represent quality of care, have appropriate answer categories, and so forth. The final questionnaire was edited to match the reading level of a 12‐year‐old and approved by the panel in a face‐to‐face meeting. By this process, content validity was ensured.[6]
Data Collection
The final questionnaire was mailed to both frail and nonfrail medical and surgical inpatients who were included in the CWH before‐after study (January 2011 to July 2012) 1 week after their discharge, by a research assistant (see Supporting Information, Appendix A, in the online version of this article for a description of the study and CWH program).
Patients in the CWH study who returned the questionnaire during the postimplementation measurement period were asked to participate in the test‐retest reliability study until a predetermined sample size of 75 was reached (March 2012 to November 2012). The target interval between returning the first and second questionnaire was 2 to 14 days.[7]
In addition, patients admitted to the geriatrics departmentand therefore assumed to be frailreceived the questionnaire upon discharge (February 2012 to April 2013). The geriatrics department administered the questionnaire anonymously for evaluation and quality‐improvement purposes, as part of usual care. The secretary included the questionnaire in all patient files, and a nurse provided the questionnaire to patients together with other important discharge documents. This questionnaire also included a question regarding goal attainment, as this reflects whether what is important to the most frail elderly patients was accomplished.
Validation and Analysis
Data were analyzed using the statistical software program SPSS version 18.0 (SPSS Inc., Chicago, IL.).
Data
Characteristics of (non)responders, levels of missing data, and measurement range were assessed using descriptive statistics.
Reliability
Internal consistency was assessed by calculating Cronbach's for all available questionnaires with complete data. The answer categories were recoded to a 010 scale; 10 represents the highest quality of care. Test‐retest reliability[6] was assessed by calculating Cohen's for individual questions and intraclass correlation (ICC) for the questionnaire's mean score.
Validity
The following hypotheses were tested in order to assess construct validity: lower scores for female patients[8] and for patients who rate their health lower,[9] and with higher education[8, 9]; higher scores for patients who had an elective admission[8] and whose treatment goals were achieved (own reasoning). Finally, whether patients answered the questionnaire independently or with help should not affect scores (own reasoning). The Spearman was calculated for nonparametric and ordinal data.
In addition, we performed a Kruskal‐Wallis analysis to test the hypothesis that patients admitted to different departments have different scores. Second, we used the Mann‐Whitney U test to detect differences before and after implementation of the CWH program.
For all these analyses, only questionnaires with complete data were included.
RESULTS
Development
The selected answers within the categories communication and competence of nurses and physicians by the panel overlapped with questions from the other 8 categories; thus, the final questionnaire contains 8 core questions (Table 1) (see Supporting Information, Appendix B, in the online version of this article).
| Question |
|---|
|
| 1. Were you informed sufficiently by your doctor regarding the various options for treating your health problems? |
| 2. Were you able to indicate which treatment and/or care you preferred? |
| 3. During your hospital stay, could you co‐decide what was important to your care? |
| 4. During your hospital stay, were you supported in keeping busy and finding social contacts and activities? |
| 5. Did you know to whom you can go within the hospital with questions, problems, or complaints? |
| 6. Before discharge, did you talk with a member of the hospital staff regarding the care you would need after discharge? |
| 7. Did a member of the hospital staff inform the key people and/or care providers of your discharge from the hospital? |
| 8. During your hospital stay, did you experience 1 or more of the following events? |
| Did you fall? |
| Did you become confused? |
| Did you develop pressure ulcers? |
| Did medication errors occur? |
| Did you develop a urinary tract infection? |
| Did you develop a wound infection? |
| Did you experience complications with your surgery and/or treatment? |
Data Collection
Figure 1 shows a flowchart of the questionnaires.
Table 2 presents data of responders compared with nonresponders who were included in the CWH study (N = 293). Patients were age 70 years and admitted 48 hours. Patients responded 14.8 11.3 days after discharge (n = 265). Response rate was 75.8%. From 18 responders no baseline characteristics were available, as only the questionnaire was collected from them to reach n = 75 for test‐retest purposes.
| No. | Responders | No. | Nonresponders | P Value | |
|---|---|---|---|---|---|
| |||||
| Age, y SD | 275 | 76.9 5.2 | 88 | 77.3 5.5 | 0.701 |
| Male sex, n (%) | 275 | 156 (56.7) | 88 | 52 (59.1) | 0.696 |
| CIRS‐G, score SD | 274 | 12.8 5.0 | 88 | 13.9 5.0 | 0.071 |
| MMSE admission, score SD | 264 | 26.7 3.7 | 82 | 25.1 4.8 | 0.001 |
| MMSE discharge, score SD | 230 | 26.9 3.7 | 66 | 25.8 4.4 | 0.026 |
| Length of stay, days SD | 275 | 8.2 7.4 | 88 | 9.6 9.7 | 0.322 |
| Department, surgical (%) | 275 | 170 (61.8) | 88 | 56 (63.6) | 0.759 |
| Admission type, n (%) | 275 | 88 | 0.343 | ||
| Emergency | 82 (29.8) | 22 (25.0) | |||
| Elective | 138 (50.2) | 52 (59.1) | |||
| From other hospital or other department | 55 (20.0) | 14 (15.9) | |||
| Marital status, alone (%) | 273 | 187 (68.5) | 84 | 50 (59.5) | 0.128 |
| Discharge destination, n (%) | 275 | 88 | 0.000 | ||
| Home | 197 (71.6) | 54 (61.4) | |||
| Other hospital | 69 (25.1) | 20 (22.7) | |||
| Care facility | 9 (3.3) | 14 (15.9) | |||
| Readmission, n (%) | 275 | 38 (13.8) | 88 | 7 (8.0) | 0.146 |
| Readmission 1 mo, n (%) | 275 | 28 (10.2) | 88 | 14 (15.9) | 0.144 |
| Death 3 mo following discharge, n (%) | 274 | 9 (3.3) | 86 | 5 (5.8) | 0.233 |
| Received CWH intervention | 149 | 43 (28.9) | 33 | 15 (45.5) | 0.064 |
Patients in the geriatrics department responded in 10.5 15.0 days (n = 111). Mean length of stay was 9.0 7.2 days (n = 116). Data regarding other baseline characteristics and response rate were unavailable due to privacy concerns.
Data Characteristics
Table 3 summarizes data of all 470 questionnaires. Response rates to the answer options ranged from 3.8% to 66.8%. Missing data among the questions ranged from 1.7% within question 8 to 7.0% within question 4. Upon combining the answer categories I don't know and missing, 7/8 questions had >10% missing data; the questions 2 and 3 had the highest percentage of missing data due to the I don't know answer option. The reasons stated by the respondents for why they could not answer these questions included cognitive disabilities; the perception that, because there was only one option (eg, in case of emergency admissions), the question did not apply to them; and/or that the patients preferred not to co‐decide because they felt that the physician knows best and can decide what is best.
| Data (n = 470) | Test‐Retest (n = 78) | |||
|---|---|---|---|---|
| No. | % | No. | ||
| ||||
| Sufficiently informed regarding treatment options | 65 | 0.278 | ||
| Not at all | 23 | 4.9 | ||
| Sometimes | 90 | 19.1 | ||
| Often | 115 | 24.5 | ||
| Every time | 191 | 40.6 | ||
| Don't know | 29 | 6.2 | ||
| Missing | 21 | 4.7 | ||
| Treatment and care preferences discussed | 59 | 0.415 | ||
| Not at all | 89 | 18.9 | ||
| Sometimes | 78 | 16.6 | ||
| Often | 61 | 13.0 | ||
| Every time | 111 | 23.6 | ||
| Don't know | 103 | 21.9 | ||
| Missing | 28 | 6.0 | ||
| Co‐decide regarding important issues | 56 | 0.295 | ||
| Not at all | 75 | 16.0 | ||
| Sometimes | 86 | 18.3 | ||
| Often | 67 | 14.3 | ||
| Every time | 112 | 23.8 | ||
| Don't know | 98 | 20.9 | ||
| Missing | 32 | 6.8 | ||
| Supported in finding (social) activities | 73 | 0.533 | ||
| Not at all | 72 | 15.3 | ||
| A little | 66 | 14.0 | ||
| Good | 109 | 23.2 | ||
| Very good | 36 | 7.7 | ||
| Not applicable | 130 | 27.7 | ||
| Don't know | 24 | 5.1 | ||
| Missing | 33 | 7.0 | ||
| Knows relevant person for questions, problems, complaints | 77 | 0.652 | ||
| Yes | 279 | 59.4 | ||
| No | 107 | 22.8 | ||
| Don't know | 67 | 14.3 | ||
| Missing | 17 | 3.6 | ||
| Discussed postdischarge care needs | 75 | 0.574 | ||
| Yes, sufficient | 311 | 66.2 | ||
| Yes, but insufficient | 26 | 5.5 | ||
| No | 99 | 20.3 | ||
| I don't know/I don't remember | 18 | 3.8 | ||
| Missing | 19 | 4.0 | ||
| Hospital informed other important people/providers of discharge | 69 | 0.405 | ||
| No | 45 | 9.6 | ||
| Some were informed | 54 | 11.5 | ||
| Yes | 314 | 66.8 | ||
| Don't know | 38 | 8.1 | ||
| Missing | 19 | 4.0 | ||
| Adverse events during hospital admission | DK | MIS | 78 | 0.816 |
| Fall, confusion, pressure ulcer, medication error, bladder infection, wound infection, complication of surgery/treatment | Max 9.1% | Max 4.3% | ||
| Sum | Mean | No. | ICC | |
| Mean score on the total questionnaire, complete cases (n = 222) | 51.9 18.3 | 6.5 2.3 | 39 | 0.745 |
Reliability
Of the 470 questionnaires, 222 (47.2%) had complete data and were used to analyze internal consistency. Cronbach's for the 8‐item questionnaire was 0.70 (good internal consistency).
Seventy‐eight questionnaires were available to measure test‐retest reliability. The interval between test‐retest was 8.7 4.8 days; 94.7% was returned within the targeted 14 days. Thirty‐eight patients had complete data for both measurements: ICC on the mean score of the questionnaire was 0.75 (95% confidence interval [CI]: 0.56‐0.86), which indicates good test‐retest reliability (Table 3). Including patients with incomplete data (1 to 2 missing items) yielded an ICC >0.70. Among the individual questions, Cohen's ranged from 0.28 to 0.82.
Validity
The mean questionnaire score was significantly correlated with goals achieved while hospitalized (Table 4).
| Variable | Response | No.a | Score SD | Correlation |
|---|---|---|---|---|
| ||||
| Sex | M | 114 | 6.3 2.3 | 0.080 |
| F | 108 | 6.7 2.3 | ||
| Health status | Excellent | 1 | 0.071 | |
| Very good | 5 | 7.9 2.0 | ||
| Good | 52 | 6.7 2.4 | ||
| Fair | 120 | 6.5 2.2 | ||
| Poor | 28 | 6.2 2.1 | ||
| Education level | 6 grades primary school | 4 | 4.9 1.2 | 0.068 |
| Primary school | 19 | 6.4 2.5 | ||
| Higher than primary school | 6 | 7.6 1.2 | ||
| Practical training | 27 | 6.0 2.2 | ||
| Secondary vocational training | 41 | 6.1 2.5 | ||
| Pre‐university education | 2 | 7.2 4.0 | ||
| University/higher education | 20 | 6.8 2.2 | ||
| Admission type | Emergency | 31 | 6.5 2.6 | 0.015 |
| Elective | 61 | 6.6 2.0 | ||
| Goal of admission achieved | Yes | 33 | 7.6 1.7 | 0.319b |
| Partially | 24 | 6.6 2.1 | ||
| No | 6 | 4.7 2.8 | ||
| Respondent | Patient only | 117 | 6.7 2.2 | 0.063 |
| Patient with help | 59 | 5.9 2.3 | ||
| Other person | 41 | 6.7 2.4 | ||
Mean scores did not differ significantly between departments (geriatrics: 6.8 2.2, n = 88; cardiothoracic surgery and lung diseases: 6.5 2.4, n = 54; internal medicine: 6.3 2.5, n = 30; general surgery: 6.0 2.2, n = 50; P = 0.234).
In addition, mean scores did not differ significantly before (6.5 2.2, n = 53) and after (6.1 2.4, n = 67) implementation of the CWH study (P = 0.320).
DISCUSSION
The CareWell in Hospital patient questionnaire is a brief 8‐item questionnaire to assess the experiences of elderly patients regarding integrated hospital care. It showed good internal consistency and test‐retest reliability, and low responsiveness. Here we discuss some issues related to the preset criteria of the questionnaire.
First, a panel representing the elderly target population was used to develop the questionnaire in order to ensure content validity, which was confirmed by good internal consistency. Yet, with respect to individualized, integrated care for frail elderly patients, we recommend including a question regarding the involvement of informal caregivers during the hospital stay, as they are important partners in healthcare.[10]
Second, the questionnaire was kept short because it should not be a burden and feasible for frail patients to complete. Nonetheless, some of the questions had a high nonresponse rate, and many patients answered I don't know, particularly to the questions 2 and 3. It does not necessarily mean that these questions are poor in quality; it could also indicate that offering individualized care is not yet embedded in the culture of elderly patients and care professionals, such that patients consider such questions to be irrelevant.[11, 12] Nevertheless, we suggest to further explore the feasibility of the questionnaire and potential additional methods for the most frail elderly,[13] who might have been excluded from the CWH study sample at this point (Table 2).
Third, the questionnaire measures experiences rather than satisfaction. Patient‐satisfaction scores are generally tightly correlated with the age, sex, education level, health status, and the person completing the questionnaire.[8] In our study, the correlation did not reach statistical significance. Nevertheless, the achievement of preset goals was correlated significantly with mean CWH scores (Table 4). These findings may indicate that individualized care experiences can indeed be assessed better using this questionnaire. Test‐retest reliability also supports validity, as we expectedand, indeed, sawhigher reliability among the more objective questions (eg, question 8). The most valuing question is question 1, which also had the lowest reliability; the word sufficiently should perhaps be removed in the next version in order to increase its reliability and objectivity.
Finally, scores did not differ between before and after implementation of the CWH program, which suggests either that the questionnaire is unable to detect change or that the program was not sufficiently effective to invoke change yet. The latter option seems plausible, as changes in the provision of individualized care were ongoing. In addition, the items on which favorable differences can be seen for CWH are in fact the items that could be most directly influenced by the CWH interventionists, questions 4, 6, and 7 (see Supporting Information, Appendix C, in the online version of this article). Lastly, we performed an extra analysis concerning the discriminating property of the questionnaire in a subgroup of frail elderly patients; we do see a significant difference in scores between the frail patients in the geriatrics department and the frail patients who received the CWH intervention: 6.8 (n = 88) vs 4.8 (n = 13) for complete data, respectively, P = 0.013; and 6.8 (n = 155) vs 5.7 (n = 37) for incomplete data (2 items missing), P = 0.017 (Mann‐Whitney U test). This may indicate that the questionnaire can measure differences in quality of care for specifically the frail elderly patients between departments. However, these issuesincluding validity and reliability characteristics per specific patient subgroupwarrant further research using a larger sample.
CONCLUSIONS
In conclusion, the CareWell in Hospital patient questionnaire is a feasible and reliable tool for assessing experiences of frail elderly inpatients in the provision of individualized, integrated care. To improve the questionnaire, we recommend to add a question regarding the participation of informal caregivers during the hospital stay, investigate the response rate to questions regarding participation and shared decision‐making, and study responsiveness issues further.
Acknowledgements
The authors thank Gerda van Straaten, Anne Kuijpers, and Thijs Cauven for their support with data collection. We thank all members of the ZOWEL Study Group and the panel representing the elderly target group.
Disclosures: The work was made possible by grant 60‐6190‐098‐272 and grant 60‐61900‐98‐129 of the National Programme for Elderly Care, coordinated and sponsored by ZonMw, The Netherlands, Organization of Health Research and Development. The authors report no conflicts of interest.
- , , . Patient Experience of Health Care Performance. Adelaide, Australia: Primary Health Care Research November 2009. Available at: http://dspace.flinders.edu.au/jspui/bitstream/2328/26594/1/PIR NOV 09 Full.pdf.
- , , , . Hospital Elder Life Program integrated in Dutch hospital care: a pilot study. J Am Geriatr Soc. 2013;61(4):641–642.
- , . Integrated care: meaning, logic, applications, and implications—a discussion paper. Int J Integr Care. 2002;2:e12.
- , , , . CQ‐index Ziekenhuisopname: meetinstrumentontwikkeling. Kwaliteit van de zorg tijdens ziekenhuisopnames vanuit het perspectief van patiënten. De ontwikkeling van het instrument, de psychometrische eigenschappen en het discriminerend vermogen [in Dutch]. Utrecht, The Netherlands: NIVEL (Netherlands Institute for Health Services Research), 2009.
- Centrum Klantervaring Zorg.CQI vragenbank (CQI questionnaire database). Available at: http://nvl002.nivel.nl/CQI. Accessed May–June 2010.
- , , , et al. Quality criteria were proposed for measurement properties of health status questionnaires. J Clin Epidemiol. 2007;60(1):34–42.
- , . Health Measurement Scales: A Practical Guide to Their Development and Use. 4th ed. Oxford, UK: Oxford University Press; 2008:182–183.
- , , , . Assessing patient satisfaction: implications for South Australian public hospitals. Aust Health Rev. 2005;29(4):439–446.
- , , , , . Patient satisfaction revisited: a multilevel approach. Soc Sci Med. 2009;69(1):68–75.
- , , , et al. Relatives' perspective on the quality of geriatric care and rehabilitation—development and testing of a questionnaire. Scand J Caring Sci. 2008;22(4):590–595.
- , , , . Are elderly people with co‐morbidities involved adequately in medical decision making when hospitalised? A cross‐sectional survey. BMC Geriatr. 2011;11:46.
- , , , , . Preferences of acutely ill patients for participation in medical decision‐making. Qual Saf Health Care. 2008;17(2):97–100.
- , . Experience of general hospital care in older patients with cognitive impairment: are we measuring the most vulnerable patients' experience? BMJ Qual Saf. 2013;doi:10.1136/bmjqs‐2013‐001961.
- , . A Manual of Guidelines for Scoring the Cumulative Illness Rating Scale for Geriatrics (CIRS‐G). Pittsburgh, PA: University of Pittsburgh School of Medicine, Department of Geriatric Psychiatry; 1991.
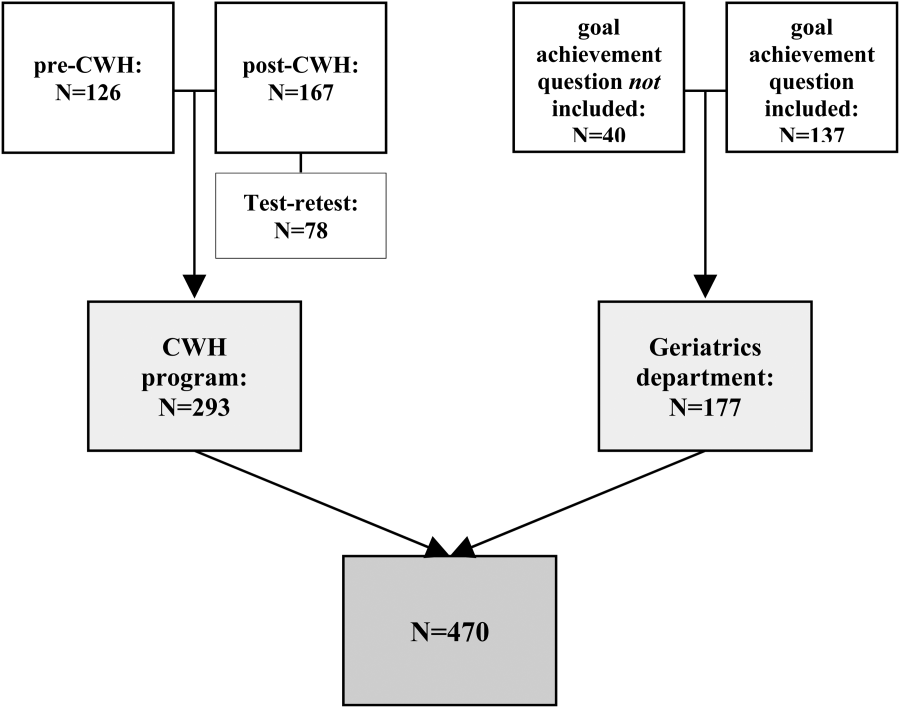
Aging and Inpatient Demand
The number of older people in the United States is expected to increase, due to the aging of the post‐World War II baby boomers.[1] For example, those aged 65 years are expected to number 88.5 million in 2050, more than double the number in 2010 of 40.2 million. This demographic shift has raised concerns about future hospital capacity, but the scope of the problem has not been quantified.[2]
A recent analysis calculated the number and length of emergency department visits expected to occur based on the aging of the US population.[3] One finding was that hospital admissions would increase 23% faster than population growth. However, this considered only hospitalizations originating in the emergency department and did not consider all‐source hospitalizations. We obtained data on all‐source hospitalizations and applied them to the US Census Bureau's demographic projections for the future through 2050. This provides a base‐case estimate for how inpatient demand would change if all other influences remained equal. The goal was to isolate the effect of population age makeup on inpatient requirements while holding other influences constant.
METHODS
We used the method of actuarial life table adjustment as described previously.[3] To calculate age‐specific hospitalization rates, we estimated age‐specific hospitalization frequencies (counts) in the United States for 2011 from the Nationwide Inpatient Sample (NIS).[4] This is a stratified probability sample of US community hospitals, defined as all nonfederal, short term, general, and other specialty hospitals, excluding hospital units of institutions. Veterans hospitals and other federal facilities, short‐term rehabilitation hospitals, long‐term non‐acute care hospitals, psychiatric hospitals, and alcoholism/chemical dependency treatment facilities were excluded from NIS 2011. Of hospitals in the sample, 21% are government (nonfederal) owned.
We converted age‐specific hospitalization frequencies derived from this sample into rates by dividing each stratum‐specific admission count by the 2011 population count in each age stratum from the US Census Bureau.[5] The Census Bureau provides detailed predictions of the US population through 2050. Births, deaths, and net international migration are projected for each birth cohort. Using 2011 as the origin, we applied baseline age‐specific hospitalization rates stratum‐wise to the general population expected by the Census Bureau in future years. This gave us stratum‐specific hospitalization frequencies for each future year. We summed these to arrive at the aggregate anticipated hospitalization frequency in each year. For our main outcome measure, we calculated the ratio of change in hospitalization frequency to change in population, comparing each future year to the 2011 baseline. We also calculated aggregate inpatient days, using the same data sources and methods. Our institutional review board exempted this study from review. We used Stata 13.0 (StataCorp, College Station, TX), and Microsoft Excel (Microsoft, Redmond, WA) for all analyses.
RESULTS
Baseline data are displayed in Figure 1. In 2011, there were 0.23 hospitalizations per US resident aged 0 to 4 years, and 0.01 per resident aged 5 to 9 years. From this age forward, hospitalization rates increased steadily with advancing age, reaching 0.63 per resident aged 90 to 94 years. Length of stay also was generally associated with age, though there was a peak among older children.

Projections through 2050 are shown in Table 1 and Figure 2. Table 1 displays the population projections of the US Census Bureau, which expects the US population to increase by 41% between now and 2050. Also shown in the table are our projections, which indicate that, all other things being equal, the annual number of inpatient admissions in the US will increase by 67%. The ratio of 67% to 41% is 1.18, meaning that the frequency of inpatient admissions will grow 18% more than population growth due to the aging of the population. The aggregate number of inpatient days will increase 22% more than population growth. Overall, inpatient capacity must expand by 72% to keep pace.
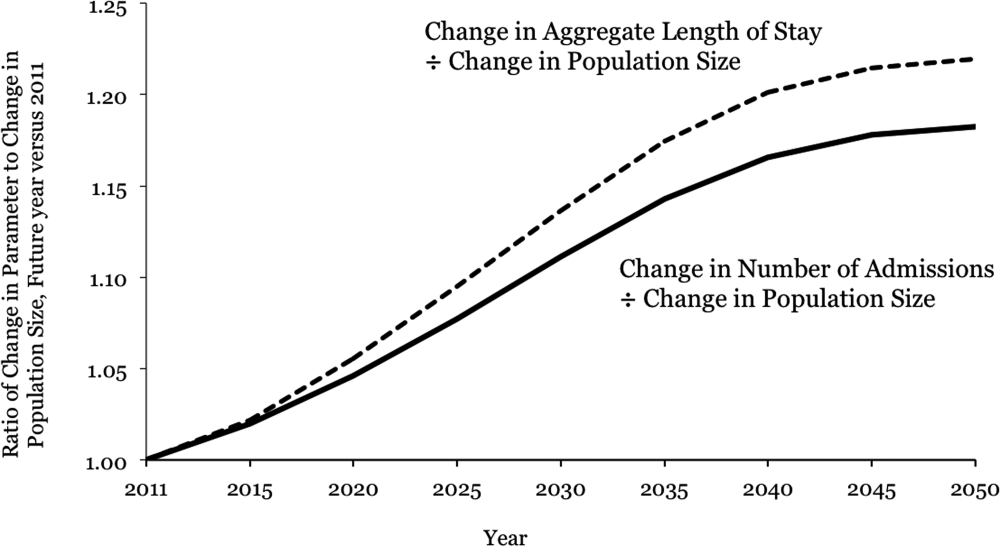
| Year | Population | Hospital Admissions | Aggregate Inpatient Days | Population: Ratio of Future Year to 2011 | Admissions: Ratio of Future Year to 2011 | Ratio of Admission Increase to Population Increase | Aggregate Inpatient Days: Ratio of Future Year to 2011 | Ratio of Increase in Inpatient Days to Population Increase |
|---|---|---|---|---|---|---|---|---|
| ||||||||
| 2011 | 311,591,917 | 38,560,751* | 177,501,515 | 1 | 1 | 1 | 1 | 1 |
| 2015 | 325,539,790 | 41,093,154 | 189,520,706 | 1.04 | 1.07 | 1.02 | 1.07 | 1.02 |
| 2020 | 341,386,665 | 44,196,669 | 205,205,962 | 1.10 | 1.15 | 1.05 | 1.16 | 1.06 |
| 2025 | 357,451,620 | 47,655,492 | 222,911,204 | 1.15 | 1.24 | 1.08 | 1.26 | 1.09 |
| 2030 | 373,503,674 | 51,365,441 | 241,852,384 | 1.20 | 1.33 | 1.11 | 1.36 | 1.14 |
| 2035 | 389,531,156 | 55,091,242 | 260,603,998 | 1.25 | 1.43 | 1.14 | 1.47 | 1.17 |
| 2040 | 405,655,295 | 58,524,016 | 277,530,732 | 1.30 | 1.52 | 1.17 | 1.56 | 1.20 |
| 2045 | 422,058,629 | 61,525,903 | 292,014,192 | 1.35 | 1.60 | 1.18 | 1.65 | 1.21 |
| 2050 | 439,010,253 | 64,249,181 | 304,945,179 | 1.41 | 1.67 | 1.18 | 1.72 | 1.22 |
DISCUSSION
Although US hospital capacity has fallen over the past 3 decades,[6, 7] our analysis suggests that demand for inpatient beds will increase 22% faster than population growth by 2050. The total projected demand increase is 72%, including that attributable to population growth and that attributable to population aging.
These are ceteris paribus projections, which reveal the changes in inpatient demand that would result if 2 conditions held: (1) the US Census Bureau's expectations for population makeup proved correct, and (2) age‐specific hospitalization rates and lengths of stay did not change. In reality, age‐specific hospitalization rates and lengths of stay could change. Examples of change drivers include epidemics, technology, and financial incentives provided by third‐party payers.[7] For example, if an epidemic of a new disease were to occur, age‐specific hospitalization rates could increase across all age groups. Our projections depict what would happen in the absence of any such change. This is useful because we do not know if changes in age‐specific hospitalization rates will occur, and whether there will be increases or decreases. Therefore, our projections should not be viewed as literal predictions, but rather as pieces of the puzzle, necessary but not sufficient elements of an understanding of what the future may hold for inpatient demand.
Clinicians, academics, and government agencies have an interest in understanding inpatient supply and demand on national and local levels. However, their ability to influence supply is limited by the fact that of all registered hospitals in the United States, only 22% are government owned.[1] As a result, decisions about hospital construction and closure are generally left to the free market.[6] Nonetheless, we bear responsibility for monitoring supply and demand, and government regulation of hospitals and reimbursement for inpatient care mean that the public is not entirely without influence. Thirty‐two percent of US residents have government‐issued health insurance.[8]
In the early 20th century, very little healthcare took place in the inpatient setting. However, by the 1970s, inpatient care accounted for a large part of healthcare, due largely to changes in technology and reimbursement. This trend reversed in the 1980s and 1990s, and hospitals closed.[7] In 1975, there were 5875 hospitals in the United States, and in 2000 there were 4915.[6] The number of staffed beds decreased from 942,000 to 826,000.[6] In parallel, likely due to changes in technology (ie, the nature of healthcare), total inpatient days in community hospitals decreased from 223 million in 1991 to 187 million in 2011.[9] On the other hand, increasing access to insurance under the Affordable Care Act could increase utilization, as seen when a 30% increase in hospital utilization occurred when people were enrolled in Oregon's Medicaid program.[10] Also, hospital utilization may increase if Medicare patients require more services.[11]
Actuarial life table analysis has been used to make forecasts related to healthcare supply and demand, though we are not aware of prior applications to the question of hospitalization. A prior study used actuarial life table adjustment to forecast demand for emergency department services.[3] These methods have also been used to forecast the influence of longevity upon healthcare expenditures[12, 13, 14] and to predict demand for specialty services.[15, 16] Of note, rather than reporting ratios of demand growth to population growth, another option would have been to derive a compound growth rate. We are not aware of a precedent for such methods in the prior published applications of actuarial life table analysis and felt that such inductive methods would complicate the interpretation of our results.
The main limitation of our investigation is its scope. We used actuarial life table adjustment to isolate the effect of population aging upon demand for inpatient hospitalizations. This method does not yield a comprehensive prediction of inpatient demand, but rather provides a robust estimate under the assumption that all other things remain equal. Another obvious limitation is that our analysis has a nationwide scope, and was not designed to account for variation from one locale to the next. However, these methods can be used by local health authorities.
CONCLUSIONS
The US Census Bureau expects the US population to increase by 41% over the next 4 decades, and the number of US residents aged 65 years to more than double. Our results indicate that, all other things being equal, this will cause the number of hospital admissions to increase 18% faster than population growth, and the aggregate number of inpatient days to increase 22% faster than population growth. Including both population growth and population aging, the total projected increase required for inpatient capacity is 72%. This is a base‐case, ceteris paribus analysis, and understanding how demand for inpatient services may change will require multiple perspectives. Increasing access to insurance, changing poverty rates, and changes in healthcare delivery and technology are other important factors. The present analysis provides a focused estimate of the influence upon demand for inpatient services due to expected changes in our population's age distribution.
- American Hospital Association. Fast facts on US hospitals, 2011. Available at: http://www.aha.org/research/rc/stat‐studies/fast‐facts.shtml. Accessed August 7, 2013.
- American Hospital Association. Cracks in the foundation: averting a crisis in America's hospitals. AHA 2002. Available at: http://www.aha.org/content/00–10/cracksreprint08‐02.pdf. Accessed August 4, 2013.
- , , , , . Population aging and emergency departments: visits will not increase, lengths‐of‐stay and hospitalizations will. Health Aff (Millwood). 2013;32(7):1306–1312.
- HCUP Nationwide Inpatient Sample (NIS). Healthcare Cost and Utilization Project (HCUP). 2011. Agency for Healthcare Research and Quality, Rockville, MD. Available at: http://www.hcup‐us.ahrq.gov/nisoverview.jsp. Accessed July 25, 2013.
- Bureau of the Census. Population Projections by Age, Sex, Race, and Hispanic Origin: July 1, 2000–2050. Washington, DC: The Bureau; 2008.
- , , , . Does U.S. hospital capacity need to be expanded? Health Aff (Millwood). 2003;22(6):40–54.
- . Decline in hospital utilization and cost inflation under managed care in California. JAMA. 1996;276(13):1060–1064.
- , , . Income, poverty, and health insurance coverage in the United States, 2011. US Census Bureau. Available at: http://www.census.gov/prod/2012pubs/p60–243.pdf. Published September 2012. Accessed August 7, 2013.
- American Hospital Association. Trendwatch. Table 3.1: trends in inpatient utilization in community hospitals, 1991–2011. Available at: http://www.aha.org/research/reports/tw/chartbook/2013/table3‐1.pdf. Accessed November 9, 2013.
- , , , et al. The Oregon health insurance experiment: evidence from the first year. Q J Econ. 2012;127(3):1057–1106.
- American Hospital Association. Trendwatch. Are Medicare patients getting sicker? Available at: http://www.aha.org/research/reports/tw/12dec‐tw‐ptacuity.pdf. Accessed November 9, 2013.
- , , . Longevity and Medicare expenditures. N Engl J Med. 1995;332(15):999–1003.
- , . The aging of America. Impact on health care costs. JAMA. 1990;263(17):2335–2340.
- , . The effect of longevity on spending for acute and long‐term care. N Engl J Med. 2000;342(19):1409–1415.
- , , , . Demographics and cardiology, 1950–2050. J Am Coll Cardiol. 2000;35(4):1067–1081.
- , , , . Population‐based analysis of inpatient vascular procedures and predicting future workload and implications for training. J Vasc Surg. 2012;55(5):1394–1399; discussion 1399–1400.
The number of older people in the United States is expected to increase, due to the aging of the post‐World War II baby boomers.[1] For example, those aged 65 years are expected to number 88.5 million in 2050, more than double the number in 2010 of 40.2 million. This demographic shift has raised concerns about future hospital capacity, but the scope of the problem has not been quantified.[2]
A recent analysis calculated the number and length of emergency department visits expected to occur based on the aging of the US population.[3] One finding was that hospital admissions would increase 23% faster than population growth. However, this considered only hospitalizations originating in the emergency department and did not consider all‐source hospitalizations. We obtained data on all‐source hospitalizations and applied them to the US Census Bureau's demographic projections for the future through 2050. This provides a base‐case estimate for how inpatient demand would change if all other influences remained equal. The goal was to isolate the effect of population age makeup on inpatient requirements while holding other influences constant.
METHODS
We used the method of actuarial life table adjustment as described previously.[3] To calculate age‐specific hospitalization rates, we estimated age‐specific hospitalization frequencies (counts) in the United States for 2011 from the Nationwide Inpatient Sample (NIS).[4] This is a stratified probability sample of US community hospitals, defined as all nonfederal, short term, general, and other specialty hospitals, excluding hospital units of institutions. Veterans hospitals and other federal facilities, short‐term rehabilitation hospitals, long‐term non‐acute care hospitals, psychiatric hospitals, and alcoholism/chemical dependency treatment facilities were excluded from NIS 2011. Of hospitals in the sample, 21% are government (nonfederal) owned.
We converted age‐specific hospitalization frequencies derived from this sample into rates by dividing each stratum‐specific admission count by the 2011 population count in each age stratum from the US Census Bureau.[5] The Census Bureau provides detailed predictions of the US population through 2050. Births, deaths, and net international migration are projected for each birth cohort. Using 2011 as the origin, we applied baseline age‐specific hospitalization rates stratum‐wise to the general population expected by the Census Bureau in future years. This gave us stratum‐specific hospitalization frequencies for each future year. We summed these to arrive at the aggregate anticipated hospitalization frequency in each year. For our main outcome measure, we calculated the ratio of change in hospitalization frequency to change in population, comparing each future year to the 2011 baseline. We also calculated aggregate inpatient days, using the same data sources and methods. Our institutional review board exempted this study from review. We used Stata 13.0 (StataCorp, College Station, TX), and Microsoft Excel (Microsoft, Redmond, WA) for all analyses.
RESULTS
Baseline data are displayed in Figure 1. In 2011, there were 0.23 hospitalizations per US resident aged 0 to 4 years, and 0.01 per resident aged 5 to 9 years. From this age forward, hospitalization rates increased steadily with advancing age, reaching 0.63 per resident aged 90 to 94 years. Length of stay also was generally associated with age, though there was a peak among older children.
Projections through 2050 are shown in Table 1 and Figure 2. Table 1 displays the population projections of the US Census Bureau, which expects the US population to increase by 41% between now and 2050. Also shown in the table are our projections, which indicate that, all other things being equal, the annual number of inpatient admissions in the US will increase by 67%. The ratio of 67% to 41% is 1.18, meaning that the frequency of inpatient admissions will grow 18% more than population growth due to the aging of the population. The aggregate number of inpatient days will increase 22% more than population growth. Overall, inpatient capacity must expand by 72% to keep pace.
| Year | Population | Hospital Admissions | Aggregate Inpatient Days | Population: Ratio of Future Year to 2011 | Admissions: Ratio of Future Year to 2011 | Ratio of Admission Increase to Population Increase | Aggregate Inpatient Days: Ratio of Future Year to 2011 | Ratio of Increase in Inpatient Days to Population Increase |
|---|---|---|---|---|---|---|---|---|
| ||||||||
| 2011 | 311,591,917 | 38,560,751* | 177,501,515 | 1 | 1 | 1 | 1 | 1 |
| 2015 | 325,539,790 | 41,093,154 | 189,520,706 | 1.04 | 1.07 | 1.02 | 1.07 | 1.02 |
| 2020 | 341,386,665 | 44,196,669 | 205,205,962 | 1.10 | 1.15 | 1.05 | 1.16 | 1.06 |
| 2025 | 357,451,620 | 47,655,492 | 222,911,204 | 1.15 | 1.24 | 1.08 | 1.26 | 1.09 |
| 2030 | 373,503,674 | 51,365,441 | 241,852,384 | 1.20 | 1.33 | 1.11 | 1.36 | 1.14 |
| 2035 | 389,531,156 | 55,091,242 | 260,603,998 | 1.25 | 1.43 | 1.14 | 1.47 | 1.17 |
| 2040 | 405,655,295 | 58,524,016 | 277,530,732 | 1.30 | 1.52 | 1.17 | 1.56 | 1.20 |
| 2045 | 422,058,629 | 61,525,903 | 292,014,192 | 1.35 | 1.60 | 1.18 | 1.65 | 1.21 |
| 2050 | 439,010,253 | 64,249,181 | 304,945,179 | 1.41 | 1.67 | 1.18 | 1.72 | 1.22 |
DISCUSSION
Although US hospital capacity has fallen over the past 3 decades,[6, 7] our analysis suggests that demand for inpatient beds will increase 22% faster than population growth by 2050. The total projected demand increase is 72%, including that attributable to population growth and that attributable to population aging.
These are ceteris paribus projections, which reveal the changes in inpatient demand that would result if 2 conditions held: (1) the US Census Bureau's expectations for population makeup proved correct, and (2) age‐specific hospitalization rates and lengths of stay did not change. In reality, age‐specific hospitalization rates and lengths of stay could change. Examples of change drivers include epidemics, technology, and financial incentives provided by third‐party payers.[7] For example, if an epidemic of a new disease were to occur, age‐specific hospitalization rates could increase across all age groups. Our projections depict what would happen in the absence of any such change. This is useful because we do not know if changes in age‐specific hospitalization rates will occur, and whether there will be increases or decreases. Therefore, our projections should not be viewed as literal predictions, but rather as pieces of the puzzle, necessary but not sufficient elements of an understanding of what the future may hold for inpatient demand.
Clinicians, academics, and government agencies have an interest in understanding inpatient supply and demand on national and local levels. However, their ability to influence supply is limited by the fact that of all registered hospitals in the United States, only 22% are government owned.[1] As a result, decisions about hospital construction and closure are generally left to the free market.[6] Nonetheless, we bear responsibility for monitoring supply and demand, and government regulation of hospitals and reimbursement for inpatient care mean that the public is not entirely without influence. Thirty‐two percent of US residents have government‐issued health insurance.[8]
In the early 20th century, very little healthcare took place in the inpatient setting. However, by the 1970s, inpatient care accounted for a large part of healthcare, due largely to changes in technology and reimbursement. This trend reversed in the 1980s and 1990s, and hospitals closed.[7] In 1975, there were 5875 hospitals in the United States, and in 2000 there were 4915.[6] The number of staffed beds decreased from 942,000 to 826,000.[6] In parallel, likely due to changes in technology (ie, the nature of healthcare), total inpatient days in community hospitals decreased from 223 million in 1991 to 187 million in 2011.[9] On the other hand, increasing access to insurance under the Affordable Care Act could increase utilization, as seen when a 30% increase in hospital utilization occurred when people were enrolled in Oregon's Medicaid program.[10] Also, hospital utilization may increase if Medicare patients require more services.[11]
Actuarial life table analysis has been used to make forecasts related to healthcare supply and demand, though we are not aware of prior applications to the question of hospitalization. A prior study used actuarial life table adjustment to forecast demand for emergency department services.[3] These methods have also been used to forecast the influence of longevity upon healthcare expenditures[12, 13, 14] and to predict demand for specialty services.[15, 16] Of note, rather than reporting ratios of demand growth to population growth, another option would have been to derive a compound growth rate. We are not aware of a precedent for such methods in the prior published applications of actuarial life table analysis and felt that such inductive methods would complicate the interpretation of our results.
The main limitation of our investigation is its scope. We used actuarial life table adjustment to isolate the effect of population aging upon demand for inpatient hospitalizations. This method does not yield a comprehensive prediction of inpatient demand, but rather provides a robust estimate under the assumption that all other things remain equal. Another obvious limitation is that our analysis has a nationwide scope, and was not designed to account for variation from one locale to the next. However, these methods can be used by local health authorities.
CONCLUSIONS
The US Census Bureau expects the US population to increase by 41% over the next 4 decades, and the number of US residents aged 65 years to more than double. Our results indicate that, all other things being equal, this will cause the number of hospital admissions to increase 18% faster than population growth, and the aggregate number of inpatient days to increase 22% faster than population growth. Including both population growth and population aging, the total projected increase required for inpatient capacity is 72%. This is a base‐case, ceteris paribus analysis, and understanding how demand for inpatient services may change will require multiple perspectives. Increasing access to insurance, changing poverty rates, and changes in healthcare delivery and technology are other important factors. The present analysis provides a focused estimate of the influence upon demand for inpatient services due to expected changes in our population's age distribution.
- American Hospital Association. Fast facts on US hospitals, 2011. Available at: http://www.aha.org/research/rc/stat‐studies/fast‐facts.shtml. Accessed August 7, 2013.
- American Hospital Association. Cracks in the foundation: averting a crisis in America's hospitals. AHA 2002. Available at: http://www.aha.org/content/00–10/cracksreprint08‐02.pdf. Accessed August 4, 2013.
- , , , , . Population aging and emergency departments: visits will not increase, lengths‐of‐stay and hospitalizations will. Health Aff (Millwood). 2013;32(7):1306–1312.
- HCUP Nationwide Inpatient Sample (NIS). Healthcare Cost and Utilization Project (HCUP). 2011. Agency for Healthcare Research and Quality, Rockville, MD. Available at: http://www.hcup‐us.ahrq.gov/nisoverview.jsp. Accessed July 25, 2013.
- Bureau of the Census. Population Projections by Age, Sex, Race, and Hispanic Origin: July 1, 2000–2050. Washington, DC: The Bureau; 2008.
- , , , . Does U.S. hospital capacity need to be expanded? Health Aff (Millwood). 2003;22(6):40–54.
- . Decline in hospital utilization and cost inflation under managed care in California. JAMA. 1996;276(13):1060–1064.
- , , . Income, poverty, and health insurance coverage in the United States, 2011. US Census Bureau. Available at: http://www.census.gov/prod/2012pubs/p60–243.pdf. Published September 2012. Accessed August 7, 2013.
- American Hospital Association. Trendwatch. Table 3.1: trends in inpatient utilization in community hospitals, 1991–2011. Available at: http://www.aha.org/research/reports/tw/chartbook/2013/table3‐1.pdf. Accessed November 9, 2013.
- , , , et al. The Oregon health insurance experiment: evidence from the first year. Q J Econ. 2012;127(3):1057–1106.
- American Hospital Association. Trendwatch. Are Medicare patients getting sicker? Available at: http://www.aha.org/research/reports/tw/12dec‐tw‐ptacuity.pdf. Accessed November 9, 2013.
- , , . Longevity and Medicare expenditures. N Engl J Med. 1995;332(15):999–1003.
- , . The aging of America. Impact on health care costs. JAMA. 1990;263(17):2335–2340.
- , . The effect of longevity on spending for acute and long‐term care. N Engl J Med. 2000;342(19):1409–1415.
- , , , . Demographics and cardiology, 1950–2050. J Am Coll Cardiol. 2000;35(4):1067–1081.
- , , , . Population‐based analysis of inpatient vascular procedures and predicting future workload and implications for training. J Vasc Surg. 2012;55(5):1394–1399; discussion 1399–1400.
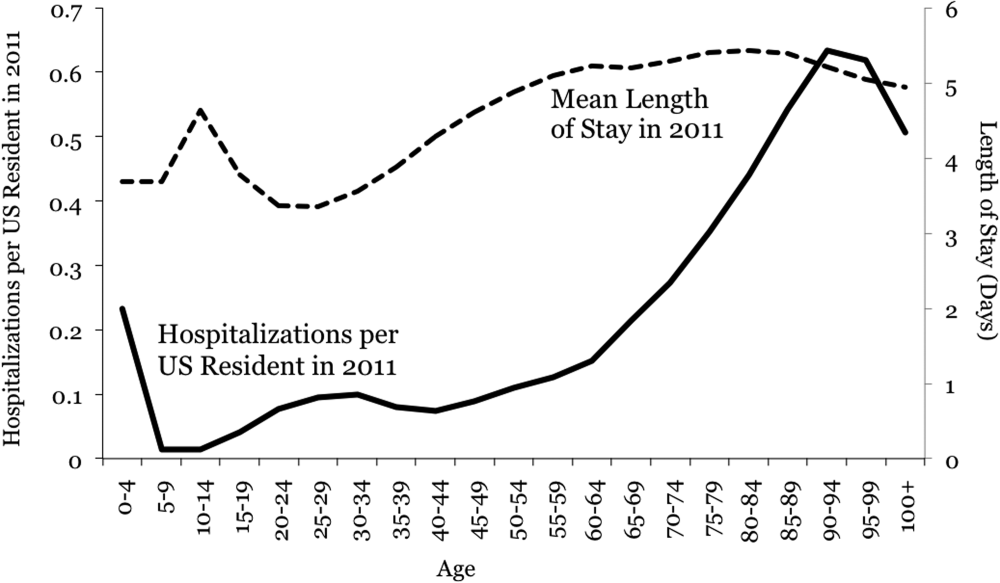
Interprofessional IM Simulation Course
Medical simulation is an effective tool in teaching health professions students.[1] It allows a wide range of experiences to be practiced including rare but crucial cases, skills training, counseling cases, and integrative medical cases.[2, 3, 4, 5, 6] Simulation also allows healthcare professionals to work and learn side by side as they do in actual patient‐care situations.
Previous studies have confirmed the effectiveness of high‐fidelity simulation in improving nursing students' and medical students' knowledge and communication skills.[7, 8, 9, 10, 11] However, only a few are designed where different professions learn together. Robertson et al. found that a simulation and modified Team Strategies and Tools to Enhance Performance and Patient Safety (TeamSTEPPs) curriculum was successful in improving nursing students' and medical students' communication skills, including an improvement in identification of effective team skills and attitudes toward working together as a team.[12] Stewart et al. also found communication, teamwork skills, and knowledge was improved with nursing students and medical students using pediatric simulation.[13] We hypothesized that simulation training would improve both nursing students' and medical students' medical knowledge, communication skills, and understanding of each profession's role in patient care.
METHODS
Aligning with the University of Alabama at Birmingham School of Medicine calendar, starting in May 2011, weekly simulations were introduced to the current curriculum of the 8‐week internal medicine clerkship for third‐year medical students. Due to differences in academic calendars, the senior nursing students did not start on a recurring basis until July 2011. The first two months served as a pilot phase to assess the validity of the pre‐ and post‐tests as well as the simulation scenarios. Data from this period were used for quality purposes and not in the final data analysis. Data were collected for this study from July 2011 through April 2012. The institutional review board of the University of Alabama at Birmingham approved this study.
Third‐year School of Medicine (SOM) students and senior baccalaureate nursing students participated in four every‐other‐week 1‐hour simulation sessions during the medical students' 8‐week internal medicine clerkship. Each scenario's participants consisted of three nursing students and five or six medical students, with five or six additional medical students observing in the control room. All students participated in the debriefing. Each cohort worked together for the four scenarios in an attempt to build camaraderie over time. Scenarios occurred over approximately 20 minutes, with the remaining 40 minutes used for debriefing. Debriefing with good judgment utilizing advocacy inquiry questioning was our debriefing model,[14] and each scenario's debriefers included at least one physician, one nurse, and one adult learning professional with simulation expertise. All debriefing sessions started with reactions, followed by an exploration phase and finally a summary phase. Debriefings were guided by a debriefing script highlighting key teaching points. TeamSTEPPS was used as the structure of team‐based learning.
Scenarios included acute myocardial infarction, pancreatitis with hyperkalemia, upper gastrointestinal bleed, and chronic obstructive pulmonary disease exacerbation with allow natural death order. Learning objectives for each case focused on teamwork and communication as well as exploring the differential diagnosis. For each scenario, physical exam findings, laboratory results, radiographs, and electrocardiogram results were developed and reviewed by experts for clarity and accuracy. All cases were programmed utilizing Laerdal (Laerdal Medical Corp., Wappinger Falls, NY) programming software and SimMan Essential mannequin (Laerdal Medical Corp.). All scenarios occurred in a simulated emergency department room for patients being admitted to the inpatient internal medicine service.
Identical pre‐ and post‐tests were given to medical and nursing students. Case‐specific knowledge was assessed with multiple choice items. Self‐efficacy related to professional roles and attitudes toward team communication were each assessed with a 6‐item evaluation using anchored 5‐point Likert response scales (see Supporting Information, Table 1, in the online version of this article). Self‐efficacy items formed a scale, whereas attitude items assessed individual dimensions. These measures were pilot tested with 34 matched pre‐ and post‐tests from medical and nursing students. Pilot data were only for quality purposes and are not in the final data analysis.
| Medicine, n=72 | Nursing, n=28 | |||||
|---|---|---|---|---|---|---|
| Pretest | Post‐test | P Value | Pretest | Post‐test | P Value | |
| ||||||
| Knowledge, meanSD | 5317% | 7015% | 0.0001 | 3215% | 4316% | 0.003 |
| Communication self‐efficacy, mean (SD), range, 030 | 18.9 (3.3) | 23.7 (3.7) | 0.0001 | 19.6 (2.7) | 24.5 (2.5) | 0.0001 |
| Attitudes | ||||||
| Working well in a medical team is a crucial part of my job. | 100%, n=72 | 97%, n=69 | NC | 100%, n=28 | 100%, n=28 | NC |
| In an emergency situation, patient care is more important than patient safety. | 25%, n=18 | 25%, n=18 | 0.025 | 21%, n=6 | 29%, n=8 | 0.032 |
| In an emergency situation, providing immediate care is more important than assigning medical team roles. | 35%, n=25 | 29%, n=21 | 0.067 | 39%, n=11 | 36%, n=10 | 0.340 |
| Closing the loop in communication is important even when it slows down patient care. | 67%, n=48 | 80%, n=58 | 0.005 | 54%, n=15 | 79%, n=22 | 0.212 |
| The highest ranking physician has the most important role on the medical team. | 33%, n=24 | 26%, n=19 | 0.0001 | 0%, n=0 | 4%, n=1 | 0.836 |
| Multidisciplinary care, where each team member is responsible for their area of expertise, is more productive than cross‐integrated care where roles are less defined. | 63%, n=45 | 71%, n=51 | 0.037 | 68%, n=19 | 71%, n=20 | 0.827 |
The self‐efficacy scale was examined for clarity and discrimination with Cronbach's . Individual attitudes were examined for response variation. Knowledge questions were examined for evidence of change. Two questions were dropped from the pilot measure (1 for inappropriate material given the case and 1 for ceiling scores at pretest), and one question was reworded to include ethics, resulting in the final version of the pretest. This pretest was completed at the medical student clerkship orientation and the nursing student introduction prior to any simulation scenario. After each debriefing, all students completed an anonymous evaluation survey about the simulation and debriefing consisting of nine questions with a 5‐point Likert response scale. The survey also included open‐ended questions related to the simulation's effectiveness and areas for improvement. At the end of the 8‐week clerkship after the final scenario, the post‐test and postcourse surveys were completed. All data were anonymous but coded with unique ID numbers to allow for comparing individual change in scores.
Statistics
Quantitative statistical analysis was performed using SPSS version 21.0 (SPSS Inc., Chicago, IL). All tests were 2‐tailed, with significance set at P=0.05. Paired t tests were used to determine differences between pre‐ and post‐test self‐efficacy for participants. A series of attitudinal statements were examined with [2] tests; response categories were collapsed due to the sparse n in some cells (strongly agree and somewhat agree=agree; strongly disagree and somewhat disagree=disagree). Significance was set at P=0.05, and the self‐efficacy scale was examined for internal consistency with Cronbach's . Reported knowledge scores are based on percentage correct; self‐efficacy results are reported as a total score for all items.
RESULTS
A total of 108 students, 78 medical students and 30 nursing students, participated in this study. Paired pre‐ and post‐tests available for 72 medical students and 28 nursing students were included in the analyses (Table 1). Knowledge scores improved significantly and similarly for medical students by 9.4% and School of Nursing (SON) students by 10.4%. The self‐efficacy scale (range, 030) had moderate to good internal consistency (Cronbach's range was 0.68 [pretest] to 0.82 [post‐test]). Both medical students and nursing students demonstrated significant improvements in the self‐efficacy scale mean scores, with increases of 4.8 points (P0.0001) and 4.9 points (P0.0001), respectively. Both medical student and nursing student groups showed the greatest change in confidence to correct another healthcare provider at bedside in a collaborative manner (=0.97 and =1.2, respectively). SOM students showed a large change in confidence to always close the loop in patient care (=0.93), whereas SON students showed a large change in confidence to always figure out role on a medical team without explicit directions (=1.1).
Results of the postsimulation evaluations indicate that students felt the activity was applicable to their field (mean=4.93/5 medicine, 4.99/5 nursing) and a beneficial educational experience (mean=4.90/5 medicine, 4.95/5 nursing). Among the open‐ended responses, the most frequent positive response for both groups was increased medical knowledge (37% of all medical students' comments, 30% nursing students). An improved sense of teamwork and team communication were the second and third most common positive comments for both groups (17% medicine, 19% nursing and 16% medicine, 15% nursing, respectively). The most commonly recognized area for improvement among medical students was medical knowledge (24%). The most commonly cited area for improvement among nursing students was communication within the team (19%).
DISCUSSION
Immersive interprofessional simulations can be successfully implemented with third‐year medical students and senior nursing students. The participants, regardless of profession, had a significant improvement in clinical knowledge. These participants also improved their attitudes toward interprofessional teamwork and role clarity.
Our results also showed that both groups of students had the greatest improvement in confidence to correct another healthcare provider at bedside in a collaborative manner. The debriefing team consisted of professionals from both nursing and medicine, which allowed for time to be spent on both the knowledge objectives of the case as well as the communication aspects of the team.
Combining learners with equivalent levels of knowledge and hands‐on experience from different professions is challenging and requires early planning. The nursing student participants were in their final of five semesters before completing baccalaureate requirements, and the medical students were in their third of four years of school. This grouping of medical and nursing students worked well. Medical students had more book knowledge, whereas nursing students had more hands‐on experience, such as administering medications and oxygen, but less specific clinical knowledge. Therefore, each group complemented the other.
Although this study was initially funded by an internal grant, the simulation course described in this report is now required for medical students during their internal medicine clerkship and nursing students during their final semester. The course has expanded from one hour each week to two hours each week and now includes eight cases instead of four. Other disciplines such as respiratory therapy and social work are now involved, and the interprofessional debriefing continues to be a part of every case with faculty from each discipline serving as content experts, and a PhD educator serving as the lead debriefer. The expansion of this course was due to faculty from each discipline observing students in action and attending the debriefing to witness the rich discussion that occurs after every case. Faculty who observed the course had the opportunity to talk to learners after the debriefing and get their feedback on the learning experience and on working with other disciplines. These faculty have become champions for simulation education within their own schools and now serve as content experts for the simulations. Aside from developing champions within each discipline and debriefers from each field, another key factor of success was giving nursing students credit for clinical time. This required nursing course directors to rethink their course structure.
The study has several limitations. Knowledge learned during the 2‐month period between the pre‐ and post‐test was not solely related to that learned during the simulation. The rise in level in the post‐test results could indicate that the questions had substantial ceiling effects. This study assessed self‐reported confidence and not qualitative improvements in medical care. Our self‐efficacy and communication surveys were created for this study and have not been previously validated. Our study was also conducted at 1 institution with strong institutional support for both simulation and interprofessional education, and its reproducibility at other institutions is unknown.
CONCLUSIONS
Interprofessional simulation training for nursing and medical students can potentially increase communication self‐efficacy as well as improve team role attitudes. By instituting a high‐fidelity simulation curriculum similar to the one used in this study, students could be exposed to other disciplines and professions in a safe and realistic environment. Further research is needed to demonstrate the effectiveness of interprofessional training in additional areas and to evaluate effects of early interprofessional training on healthcare outcomes.
Disclosures
This study was funded by the Health Services Foundation General Endowment Fund, University of Alabama at Birmingham, Birmingham, Alabama. The abstract only was presented at the 13th Annual International Meeting on Simulation in Healthcare, January 2630, 2013, Orlando, Florida. No author has any conflict of interest or financial disclosures except Dr. Tofil, who was reimbursed by Laerdal for travel expenses for a Laerdal‐sponsored meeting in the fall of 2011 and 2013 while giving an independently produced lecture on pediatric simulation. No fees were paid.
- , , , et al. Technology‐enhanced simulation for health professions education: a systematic review and meta‐analysis. JAMA. 2011;306(9):978–988.
- , , , , . Initiation of a mock code program at a children's hospital. Med Teach. 2009;31(6):e241–e247.
- , , , et al. Simulation‐based mock codes significantly correltate with improved patient cardiopulmonary arrest survival rates. Pediatr Crit Care Med. 2011;12(1):33–38.
- , , , . Long‐term educational impact of a simulator curriculum on medical student education in an internal medicine clerkship. Simul Healthc. 2010;5:75–81.
- , , . Improving medical student toxicology knowledge and self‐confidence using mannequin simulation. Hawaii Med J. 2010;69:4–7.
- , , , . Simulation technology: a comparison of experiential and visual learning for undergraduate medical students. Anesthesiology. 2002;96:10–16.
- , , , . Effectiveness of intermediate‐fidelity simulation training technology in undergraduate nursing education. J Adv Nurs. 2006;54(3):359–369.
- , , , , , . Simulation in medical school education: review for emergency medicine. West J Emerg Med. 2011;12(4):461–466.
- , , , , . Man versus machine: the preferred modality. Clin Teach. 2012;9(6):387–391.
- , , , , . High‐fidelity simulation is superior to case‐based discussion in teaching the management of shock. Med Teach. 2013;35(3):e1003–e1010.
- , , , , . Preparing medical students for clinical decision making: a pilot study exploring how students make decisions and the perceived impact of a clinical decision making teaching intervention. Med Teach. 2012;34(7):e508–e517.
- , , , , , . The use of simulation and a modified TeamSTEPPS curriculum for medical and nursing student team training. Simul Healthc. 2010;5(6):332–337.
- , , . Undergraduate interprofessional education using high‐fidelity paediatric simulation. Clin Teach. 2010;7(2):90–96.
- , , , , . Debriefing with good judgment: combining rigorous feedback with genuine inquiry. Anesthesiol Clin. 2007;25(2):361–376.
Medical simulation is an effective tool in teaching health professions students.[1] It allows a wide range of experiences to be practiced including rare but crucial cases, skills training, counseling cases, and integrative medical cases.[2, 3, 4, 5, 6] Simulation also allows healthcare professionals to work and learn side by side as they do in actual patient‐care situations.
Previous studies have confirmed the effectiveness of high‐fidelity simulation in improving nursing students' and medical students' knowledge and communication skills.[7, 8, 9, 10, 11] However, only a few are designed where different professions learn together. Robertson et al. found that a simulation and modified Team Strategies and Tools to Enhance Performance and Patient Safety (TeamSTEPPs) curriculum was successful in improving nursing students' and medical students' communication skills, including an improvement in identification of effective team skills and attitudes toward working together as a team.[12] Stewart et al. also found communication, teamwork skills, and knowledge was improved with nursing students and medical students using pediatric simulation.[13] We hypothesized that simulation training would improve both nursing students' and medical students' medical knowledge, communication skills, and understanding of each profession's role in patient care.
METHODS
Aligning with the University of Alabama at Birmingham School of Medicine calendar, starting in May 2011, weekly simulations were introduced to the current curriculum of the 8‐week internal medicine clerkship for third‐year medical students. Due to differences in academic calendars, the senior nursing students did not start on a recurring basis until July 2011. The first two months served as a pilot phase to assess the validity of the pre‐ and post‐tests as well as the simulation scenarios. Data from this period were used for quality purposes and not in the final data analysis. Data were collected for this study from July 2011 through April 2012. The institutional review board of the University of Alabama at Birmingham approved this study.
Third‐year School of Medicine (SOM) students and senior baccalaureate nursing students participated in four every‐other‐week 1‐hour simulation sessions during the medical students' 8‐week internal medicine clerkship. Each scenario's participants consisted of three nursing students and five or six medical students, with five or six additional medical students observing in the control room. All students participated in the debriefing. Each cohort worked together for the four scenarios in an attempt to build camaraderie over time. Scenarios occurred over approximately 20 minutes, with the remaining 40 minutes used for debriefing. Debriefing with good judgment utilizing advocacy inquiry questioning was our debriefing model,[14] and each scenario's debriefers included at least one physician, one nurse, and one adult learning professional with simulation expertise. All debriefing sessions started with reactions, followed by an exploration phase and finally a summary phase. Debriefings were guided by a debriefing script highlighting key teaching points. TeamSTEPPS was used as the structure of team‐based learning.
Scenarios included acute myocardial infarction, pancreatitis with hyperkalemia, upper gastrointestinal bleed, and chronic obstructive pulmonary disease exacerbation with allow natural death order. Learning objectives for each case focused on teamwork and communication as well as exploring the differential diagnosis. For each scenario, physical exam findings, laboratory results, radiographs, and electrocardiogram results were developed and reviewed by experts for clarity and accuracy. All cases were programmed utilizing Laerdal (Laerdal Medical Corp., Wappinger Falls, NY) programming software and SimMan Essential mannequin (Laerdal Medical Corp.). All scenarios occurred in a simulated emergency department room for patients being admitted to the inpatient internal medicine service.
Identical pre‐ and post‐tests were given to medical and nursing students. Case‐specific knowledge was assessed with multiple choice items. Self‐efficacy related to professional roles and attitudes toward team communication were each assessed with a 6‐item evaluation using anchored 5‐point Likert response scales (see Supporting Information, Table 1, in the online version of this article). Self‐efficacy items formed a scale, whereas attitude items assessed individual dimensions. These measures were pilot tested with 34 matched pre‐ and post‐tests from medical and nursing students. Pilot data were only for quality purposes and are not in the final data analysis.
| Medicine, n=72 | Nursing, n=28 | |||||
|---|---|---|---|---|---|---|
| Pretest | Post‐test | P Value | Pretest | Post‐test | P Value | |
| ||||||
| Knowledge, meanSD | 5317% | 7015% | 0.0001 | 3215% | 4316% | 0.003 |
| Communication self‐efficacy, mean (SD), range, 030 | 18.9 (3.3) | 23.7 (3.7) | 0.0001 | 19.6 (2.7) | 24.5 (2.5) | 0.0001 |
| Attitudes | ||||||
| Working well in a medical team is a crucial part of my job. | 100%, n=72 | 97%, n=69 | NC | 100%, n=28 | 100%, n=28 | NC |
| In an emergency situation, patient care is more important than patient safety. | 25%, n=18 | 25%, n=18 | 0.025 | 21%, n=6 | 29%, n=8 | 0.032 |
| In an emergency situation, providing immediate care is more important than assigning medical team roles. | 35%, n=25 | 29%, n=21 | 0.067 | 39%, n=11 | 36%, n=10 | 0.340 |
| Closing the loop in communication is important even when it slows down patient care. | 67%, n=48 | 80%, n=58 | 0.005 | 54%, n=15 | 79%, n=22 | 0.212 |
| The highest ranking physician has the most important role on the medical team. | 33%, n=24 | 26%, n=19 | 0.0001 | 0%, n=0 | 4%, n=1 | 0.836 |
| Multidisciplinary care, where each team member is responsible for their area of expertise, is more productive than cross‐integrated care where roles are less defined. | 63%, n=45 | 71%, n=51 | 0.037 | 68%, n=19 | 71%, n=20 | 0.827 |
The self‐efficacy scale was examined for clarity and discrimination with Cronbach's . Individual attitudes were examined for response variation. Knowledge questions were examined for evidence of change. Two questions were dropped from the pilot measure (1 for inappropriate material given the case and 1 for ceiling scores at pretest), and one question was reworded to include ethics, resulting in the final version of the pretest. This pretest was completed at the medical student clerkship orientation and the nursing student introduction prior to any simulation scenario. After each debriefing, all students completed an anonymous evaluation survey about the simulation and debriefing consisting of nine questions with a 5‐point Likert response scale. The survey also included open‐ended questions related to the simulation's effectiveness and areas for improvement. At the end of the 8‐week clerkship after the final scenario, the post‐test and postcourse surveys were completed. All data were anonymous but coded with unique ID numbers to allow for comparing individual change in scores.
Statistics
Quantitative statistical analysis was performed using SPSS version 21.0 (SPSS Inc., Chicago, IL). All tests were 2‐tailed, with significance set at P=0.05. Paired t tests were used to determine differences between pre‐ and post‐test self‐efficacy for participants. A series of attitudinal statements were examined with [2] tests; response categories were collapsed due to the sparse n in some cells (strongly agree and somewhat agree=agree; strongly disagree and somewhat disagree=disagree). Significance was set at P=0.05, and the self‐efficacy scale was examined for internal consistency with Cronbach's . Reported knowledge scores are based on percentage correct; self‐efficacy results are reported as a total score for all items.
RESULTS
A total of 108 students, 78 medical students and 30 nursing students, participated in this study. Paired pre‐ and post‐tests available for 72 medical students and 28 nursing students were included in the analyses (Table 1). Knowledge scores improved significantly and similarly for medical students by 9.4% and School of Nursing (SON) students by 10.4%. The self‐efficacy scale (range, 030) had moderate to good internal consistency (Cronbach's range was 0.68 [pretest] to 0.82 [post‐test]). Both medical students and nursing students demonstrated significant improvements in the self‐efficacy scale mean scores, with increases of 4.8 points (P0.0001) and 4.9 points (P0.0001), respectively. Both medical student and nursing student groups showed the greatest change in confidence to correct another healthcare provider at bedside in a collaborative manner (=0.97 and =1.2, respectively). SOM students showed a large change in confidence to always close the loop in patient care (=0.93), whereas SON students showed a large change in confidence to always figure out role on a medical team without explicit directions (=1.1).
Results of the postsimulation evaluations indicate that students felt the activity was applicable to their field (mean=4.93/5 medicine, 4.99/5 nursing) and a beneficial educational experience (mean=4.90/5 medicine, 4.95/5 nursing). Among the open‐ended responses, the most frequent positive response for both groups was increased medical knowledge (37% of all medical students' comments, 30% nursing students). An improved sense of teamwork and team communication were the second and third most common positive comments for both groups (17% medicine, 19% nursing and 16% medicine, 15% nursing, respectively). The most commonly recognized area for improvement among medical students was medical knowledge (24%). The most commonly cited area for improvement among nursing students was communication within the team (19%).
DISCUSSION
Immersive interprofessional simulations can be successfully implemented with third‐year medical students and senior nursing students. The participants, regardless of profession, had a significant improvement in clinical knowledge. These participants also improved their attitudes toward interprofessional teamwork and role clarity.
Our results also showed that both groups of students had the greatest improvement in confidence to correct another healthcare provider at bedside in a collaborative manner. The debriefing team consisted of professionals from both nursing and medicine, which allowed for time to be spent on both the knowledge objectives of the case as well as the communication aspects of the team.
Combining learners with equivalent levels of knowledge and hands‐on experience from different professions is challenging and requires early planning. The nursing student participants were in their final of five semesters before completing baccalaureate requirements, and the medical students were in their third of four years of school. This grouping of medical and nursing students worked well. Medical students had more book knowledge, whereas nursing students had more hands‐on experience, such as administering medications and oxygen, but less specific clinical knowledge. Therefore, each group complemented the other.
Although this study was initially funded by an internal grant, the simulation course described in this report is now required for medical students during their internal medicine clerkship and nursing students during their final semester. The course has expanded from one hour each week to two hours each week and now includes eight cases instead of four. Other disciplines such as respiratory therapy and social work are now involved, and the interprofessional debriefing continues to be a part of every case with faculty from each discipline serving as content experts, and a PhD educator serving as the lead debriefer. The expansion of this course was due to faculty from each discipline observing students in action and attending the debriefing to witness the rich discussion that occurs after every case. Faculty who observed the course had the opportunity to talk to learners after the debriefing and get their feedback on the learning experience and on working with other disciplines. These faculty have become champions for simulation education within their own schools and now serve as content experts for the simulations. Aside from developing champions within each discipline and debriefers from each field, another key factor of success was giving nursing students credit for clinical time. This required nursing course directors to rethink their course structure.
The study has several limitations. Knowledge learned during the 2‐month period between the pre‐ and post‐test was not solely related to that learned during the simulation. The rise in level in the post‐test results could indicate that the questions had substantial ceiling effects. This study assessed self‐reported confidence and not qualitative improvements in medical care. Our self‐efficacy and communication surveys were created for this study and have not been previously validated. Our study was also conducted at 1 institution with strong institutional support for both simulation and interprofessional education, and its reproducibility at other institutions is unknown.
CONCLUSIONS
Interprofessional simulation training for nursing and medical students can potentially increase communication self‐efficacy as well as improve team role attitudes. By instituting a high‐fidelity simulation curriculum similar to the one used in this study, students could be exposed to other disciplines and professions in a safe and realistic environment. Further research is needed to demonstrate the effectiveness of interprofessional training in additional areas and to evaluate effects of early interprofessional training on healthcare outcomes.
Disclosures
This study was funded by the Health Services Foundation General Endowment Fund, University of Alabama at Birmingham, Birmingham, Alabama. The abstract only was presented at the 13th Annual International Meeting on Simulation in Healthcare, January 2630, 2013, Orlando, Florida. No author has any conflict of interest or financial disclosures except Dr. Tofil, who was reimbursed by Laerdal for travel expenses for a Laerdal‐sponsored meeting in the fall of 2011 and 2013 while giving an independently produced lecture on pediatric simulation. No fees were paid.
- , , , et al. Technology‐enhanced simulation for health professions education: a systematic review and meta‐analysis. JAMA. 2011;306(9):978–988.
- , , , , . Initiation of a mock code program at a children's hospital. Med Teach. 2009;31(6):e241–e247.
- , , , et al. Simulation‐based mock codes significantly correltate with improved patient cardiopulmonary arrest survival rates. Pediatr Crit Care Med. 2011;12(1):33–38.
- , , , . Long‐term educational impact of a simulator curriculum on medical student education in an internal medicine clerkship. Simul Healthc. 2010;5:75–81.
- , , . Improving medical student toxicology knowledge and self‐confidence using mannequin simulation. Hawaii Med J. 2010;69:4–7.
- , , , . Simulation technology: a comparison of experiential and visual learning for undergraduate medical students. Anesthesiology. 2002;96:10–16.
- , , , . Effectiveness of intermediate‐fidelity simulation training technology in undergraduate nursing education. J Adv Nurs. 2006;54(3):359–369.
- , , , , , . Simulation in medical school education: review for emergency medicine. West J Emerg Med. 2011;12(4):461–466.
- , , , , . Man versus machine: the preferred modality. Clin Teach. 2012;9(6):387–391.
- , , , , . High‐fidelity simulation is superior to case‐based discussion in teaching the management of shock. Med Teach. 2013;35(3):e1003–e1010.
- , , , , . Preparing medical students for clinical decision making: a pilot study exploring how students make decisions and the perceived impact of a clinical decision making teaching intervention. Med Teach. 2012;34(7):e508–e517.
- , , , , , . The use of simulation and a modified TeamSTEPPS curriculum for medical and nursing student team training. Simul Healthc. 2010;5(6):332–337.
- , , . Undergraduate interprofessional education using high‐fidelity paediatric simulation. Clin Teach. 2010;7(2):90–96.
- , , , , . Debriefing with good judgment: combining rigorous feedback with genuine inquiry. Anesthesiol Clin. 2007;25(2):361–376.