User login
CKD Awareness in Hospitalized Patients
Chronic kidney disease (CKD) affects over 13% of the US population and is associated with increased morbidity, mortality, and healthcare costs.[1] However, only 10% of individuals with CKD are aware of their diagnoses.[2] Even in those with stage 5 CKD, only 60% of individuals are aware of their CKD.[3] To our knowledge, no work has examined CKD awareness in a hospitalized patient population.
Patient awareness of their CKD diagnosis is important because progression of kidney disease can be slowed by patient self‐management of diabetes and hypertension.[4] Patient awareness of CKD may also increase acceptance of preend‐stage renal disease (ESRD) patient education and nephrology referral, which have been shown to delay CKD progression and improve clinical status at dialysis initiation.[5] However, only 60% of patients with advanced CKD have visited a nephrologist in the past year or have seen a nephrologist prior to dialysis initiation.[1]
The hospital is an important site for patient education and linkage to outpatient care for patients with CKD.[6] The hospital serves high‐risk patients who may not be well connected to outpatient care or who have lesswell‐controlled disease.[6, 7] Thus, hospitalization represents an opportunity to identify existing CKD and to use a multidisciplinary approach to preventative care, patient education, and patient‐provider planning for renal replacement therapy needs. In our cross‐sectional study in an urban, minority‐serving hospital, we sought to determine what patient factors were associated with hospitalized patients correctly self‐identifying as having CKD.
METHODS
Subjects and Data
We used data from the University of Chicago Hospitalist Project, a study of hospitalized patient outcomes.[8] Within 48 hours of hospitalization, all general medicine patients or their proxies are approached to enroll. During one‐on‐one inpatient interviews, a trained research assistant obtains demographic, health status, and healthcare utilization information. Participants consent for study staff to review their medical records. More than 80% of general medicine patients enroll.
We obtained data on 1234 general medicine patients discharged between January 1, 2012 and March 31, 2013 with an International Classification of Diseases, Ninth Revision (ICD‐9) code for chronic kidney disease (ICD‐9 codes 585.0585.5, 585.9) in their first 20 admission diagnoses. These codes are highly specific for CKD but have lower sensitivity.[9] We excluded all patients with a history of transplant (996.81, V42.0, n=90) or ESRD (585.6, n=416). We excluded repeat admissions during the study period (n=138). Our final sample included 590 unique patients with ICD‐9 diagnosis of CKD without ESRD.
Demographic, Clinical, and Health Service Utilization Characteristics
Our outcome was CKD awareness, the patient's correct self‐report of kidney disease. Patients selected their chronic medical conditions from a list read to them and were specifically asked if they had kidney problems. Demographic characteristics including age, gender, race/ethnicity, marital status, and education were also obtained. Healthcare utilization variables included how often the patient saw their primary medical care provider in the past year and whether patients had a prior hospitalization in the last year.
Health status variables such as mental status, diabetes, hypertension, and CKD stage were also assessed. Mental status was quantified using the telephone version of the Mini‐Mental State Examination (MMSE), scored from 1 to 22.10 We defined diabetes as ICD‐9 codes 250.0250.00, and hypertension as ICD‐9 codes 401.0, 401.9, 403, 405.09, 405.19, 405.91, 405.99, or by patient self‐report. CKD stage was based on the estimated glomerular filtration rate (eGFR) from the medical record using Kidney Disease Outcomes Quality Initiative guidelines.[11] We used the mode of the eGFR to calculate the appropriate CKD stage for those with more than 1 eGFR value from the hospitalization (576/590, 98%). The eGFR was calculated by the modified Modification of Diet in Renal Disease equation: (GFR (mL/min/1.73 m2)=175 (Screatinine)1.154 (Age)0.203 (0.742 if female) x (1.212 if African American)) recommended by the National Kidney Disease Education Program.[12]
Analysis
We used logistic regression to analyze the influence of the demographic, clinical, and healthcare utilization covariates on the likelihood of a patient reporting kidney problems. For the multivariate analysis, we sequentially added variables in a step‐wise fashion. We adjusted for (1) demographic factors: gender, race, ethnicity, marital status, and education; (2) eGFR‐calculated CKD stage and comorbidities: diabetes, hypertension, and mental status; and (3) healthcare utilization in the last 12 months: any hospitalizations and the number of visits to a health provider.
RESULTS
Patient Characteristics and Bivariable Association With Patient CKD Self‐Report
Table 1 shows demographic, clinical, and health service use characteristics for 590 patients with ICD‐9 coded CKD. In the bivariable model in Table 1, age, race, marital status and comorbidities, were associated with patient self‐report of CKD. Patients older than 80 years with physician‐identified CKD through ICD‐9 coding had 57% lower odds of reporting CKD than their younger counterparts. Patients of other races (nonwhite, non‐African American), married patients, and those with CKD stages 4 and 5 were much more likely to correctly self‐report CKD. Patients with higher MMSE score, diabetes, or hypertension had greater odds of CKD self‐report (all P0.05).
| Total, N=590 | Bivariable Odds Ratio (95% CI) | Multivariable With Stepwise Addition (95% CI) | |||
|---|---|---|---|---|---|
| Model 1, Demographic Factors | Model 2, Plus CKD Stage and Other Comorbidities | Model 3, Plus Health Service Use | |||
| |||||
| Female | 312 (52.98%) | 1.21 (0.85‐1.70) | 1.64 (1.09‐2.47)* | 1.28 (0.79‐2.06) | 1.36 (0.75‐2.48) |
| Age, y | |||||
| Below 54 | 138 (23.4%) | REF | REF | REF | REF |
| 5466 | 150 (24.4%) | 0.96 (0.59‐1.54) | 0.95 (0.56‐1.59) | 1.01 (0.56‐1.81) | 0.83 (0.41‐1.68) |
| 6779 | 161 (27.3%) | 0.77 (0.48‐1.23) | 0.67 (0.39‐1.15) | 0.66 (0.35‐1.23) | 0.72(0.34‐1.52) |
| Above 80 | 141 (23.9%) | 0.43 (0.26‐0.74) | 0.32 (0.17‐0.60) | 0.42 (0.20‐0.91)* | 0.37 (0.15‐0.93)* |
| Race | |||||
| African American | 449 (82.1%) | REF | REF | REF | REF |
| White | 75 (13.7%) | 1.47 (0.89‐2.42) | 1.53 (0.86‐2.71) | 1.56 (0.78‐3.12) | 1.08 (0.47‐2.49) |
| Other | 23 (4.2%) | 3.62 (1.53‐8.54) | 5.29 (1.78‐15.73) | 6.19 (1.72‐22.29) | 11.63 (1.80‐75.21)* |
| Ethnicity (Hispanic is reference group) | 21 (4.0%) | 0.97 (0.38‐2.44) | 0.43 (0.13‐1.45) | 0.71 (0.16‐3.09) | 0.46 (0.06‐3.57) |
| Married | 171 (32.6%) | 1.49 (1.03‐2.18)* | 1.32 (0.85‐2.04) | 1.20 (0.73‐1.98) | 1.77 (0.94‐3.33) |
| Education | |||||
| Less than high school | 128 (25.2%) | REF | REF | REF | REF |
| High school grad/some college | 296 (58.2%) | 1.05 (0.68‐1.63) | 0.93 (0.58‐1.49) | 0.95 (0.54‐1.67) | 0.85 (0.42‐1.72) |
| College grad or higher | 85 (16.7%) | 1.13 (0.64‐2.01) | 0.96 (0.51‐1.78) | 1.07 (0.51‐2.23) | 0.69 (0.27‐1.77) |
| CKD stage (eGFR calculated, mode) | |||||
| 12 | 115 (20.0%) | 0.55 (0.32‐0.95)* | 0.52 (0.27‐1.01) | 0.28 (0.11‐0.69) | |
| 3 | 300 (52.1%) | REF | REF | REF | |
| 4 | 112 (19.4%) | 2.43 (1.55‐3.81) | 2.69 (1.52‐4.76) | 3.07 (1.56‐6.07) | |
| 5 | 49 (8.5%) | 4.50 (2.39‐8.48) | 3.94 (1.81‐8.56) | 5.16 (1.85‐14.41) | |
| Diabetes (ICD‐9 coded or self‐report)‖ | 292 (49.5%) | 1.52 (1.07‐2.15)* | 1.54 (0.97‐2.45) | 1.26 (0.71‐2.26) | |
| Hypertension (ICD‐9 coded or self‐report) | 436 (73.9%) | 3.36 (2.09‐5.41) | 1.53 (0.80‐2.90) | 1.26 (0.57‐2.81) | |
| Mini‐Mental State Exam score# | 19.7 (2.5) | 1.13 (1.03‐1.23) | 1.09 (0.98‐1.22) | 1.22 (1.06‐1.42) | |
| Hospitalized in last 12 months | 253 (46.9%) | 1.50 (1.05‐2.13)* | 1.12 (0.65‐1.95) | ||
| No. of visits to health provider | |||||
| Once/year or less | 80 (18.4%) | REF | REF | ||
| 23 times/year | 58 (13.3%) | 0.80 (0.40‐1.60) | 0.44 (0.17‐1.16) | ||
| 4+ times/year | 298 (68.4%) | 0.60 (0.36‐0.99)* | 0.38 (0.19‐0.74) | ||
Multivariable Associations With Patient CKD Self‐Report
Age, race, and CKD stage remained consistently associated with CKD self‐report, although the magnitude of the effects (odds ratios [ORs]) varied across models (Table 1). Across all the models, patients older than 80 years were still significantly less likely than younger patients to self‐report CKD (ORs ranging from 0.32 to 0.42, all P0.05). Patients classified as being of other race were found to have a 5.29 to 11.63 greater odds of CKD self‐report than African American patients (all P0.05).
Patients with CKD stage 4 and 5 were more likely to self‐report than patients with CKD stage 3 (ORs ranging from 2.693.07 for stage 4 and 3.945.16 for stage 5, P0.05). In the final model, every unit increase in MMSE score increased the odds of CKD self‐report by 22%. In addition, patients who saw their health provider 4 or more times per year were 62% less likely to self‐report CKD than patients who saw their provider 1 or fewer times per year (OR: 0.38, P0.05).
A large proportion of patients (68.6%) were CKD unspecified by ICD‐9 codes, and only 27% of the unspecified group reported having CKD (Table 2). Examining the eGFR CKD stage of the CKD unspecified group showed that 22.8% were eGFR‐determined CKD stage 1 to 2, 57.1% were CKD stage 3, 14.8% were CKD stage 4, and 5.3% were CKD stage 5. Patients had 2 to 3 times greater odds of correct CKD self‐report if physicians had correctly identified their CKD stage (bivariable OR: 2.42, 95% confidence interval [CI]: 1.57‐3.72, multivariable OR: 3.22, 95% CI: 0.99‐10.46) (analysis not shown).
| CKD Stage* | Physician (ICD‐9) Coded | eGFR Calculated | eGFR Coded With ICD‐9 Correct |
|---|---|---|---|
| |||
| Unspecified | 110 (27.2%) | ||
| 12 | 5 (31.2%) | 20 (17.4%) | 0 |
| 3 | 25 (27.2%) | 83 (27.7%) | 17 (29.8%) |
| 4 | 40 (63.5%) | 54 (48.2%) | 25 (69.4%) |
| 5 | 11 (78.6%) | 31 (63.3%) | 10 (83.3%) |
DISCUSSION
Although prior work has examined CKD awareness in the general population and in high‐risk cohorts,[2, 3, 13] this is the first study examining CKD awareness in an urban, underserved hospitalized population. We found that overall patients' CKD awareness was low (32%), but increased as high as 63% for CKD stage 5, even after controlling for patient demographic, clinical characteristics, and healthcare use. Our overall rate of CKD awareness was higher than prior studies overall and at lower CKD stages.[2, 3, 13] Our work is consistent with prior literature that shows increasing CKD awareness with advancing CKD stage.[2, 3, 13]
Older patients (>80 years) had lower awareness of CKD. Older patients are more likely to have a near normal creatinine, despite a markedly reduced eGFR, so their CKD may go unnoticed.[14] Even with appropriate recognition, providers may also feel like their CKD is unlikely to progress to ESRD, given its stability and/or their competing risk of death.[15] Finally, older hospitalized patients may also be less likely to report a CKD diagnosis due to difficulty in recall due to denial, dementia, or delirium.
One limitation is that our case‐finding for CKD was physician ICD‐9 coding, which is highly specific but not sensitive.[9] The majority of patients with physician‐identified CKD were CKD unspecified, perhaps due to poor coding, physician underdocumentation, or physician under‐recognition of CKD stage. Although only 27% of the CKD unspecified group correctly self‐identified as having CKD, over 75% were found to be CKD stage 3 or higher, which should trigger additional monitoring or care based on guidelines.[10] In addition, despite statistical significance, we may not be able to make meaningful inferences about our small other group (nonwhite, non‐African American). Our sample was from 1 hospitalan urban, academic, tertiary care center with a large proportion of African American patientswhich may limit generalizability. The multivariable model will need to be tested in other populations for reproducibility.
Our study significantly contributes to the literature by examining patient awareness of CKD in a high‐risk, urban, hospitalized minority population. Other study strengths include use of basic demographic information, as well as survey and laboratory data for a richer examination of the associations between patient factors and CKD awareness.
CONCLUSION
Hospitalized patients with CKD have a low CKD awareness. Patient awareness of their CKD is increased with physician documentation of CKD severity. Patient awareness of their CKD must be coupled with provider awareness and CKD documentation to link patients to multidisciplinary CKD education and care to slow CKD progression and reduce associated cardiovascular and metabolic complications. Further work is needed across hospitals to determineand improveCKD awareness among both patients and providers.
Disclosures
Dr. Saunders was supported by Pilot and Feasibility Funding from the Chicago Center for Diabetes Translation Research (NIDDK P30 DK092949). Dr. Chin was supported by NIDDK K24 DK071933. Dr. Meltzer was supported by NIA T35 AG029795. Dr. Saunders had full access to all of the study data and takes responsibility for the integrity of the data and accuracy of the data analysis. An abstract of this article was presented at the Society of Hospital Medicine Annual Meeting in Las Vegas, Nevada in March 2014 and at the Society of General Internal Medicine Annual Meeting in San Diego, California in April 2014. The authors report no conflicts of interest.
- United States Renal Data System. Annual Data Report: Atlas of Chronic Kidney Disease and End‐Stage Renal Disease in the United States. Bethesda, MD: National Institutes of Health; 2012.
- , , , et al. Chronic kidney disease awareness among individuals with clinical markers of kidney dysfunction. Clin J Am Soc Neph. 2011;6(8):1838–1844.
- , , , et al. Comparison of CKD awareness in a screening population using the Modification of Diet in Renal Disease (MDRD) Study and CKD Epidemiology Collaboration (CKD‐EPI) equations. Am J Kidney Dis. 2011;57(3 suppl 2):S17–S23.
- , , , et al. Preserving renal function in adults with hypertension and diabetes: a consensus approach. Am J Kidney Dis. 2000;36(3):646–661.
- , , , et al. Multidisciplinary predialysis education decreases the incidence of dialysis and reduces mortality—a controlled cohort study based on the NKFDOQI guidelines. Nephrol Dial Transplant. 2009;24(11):3426–3433.
- , , . Pre‐dialysis hospital use and late referrals in incident dialysis patients in England: a retrospective cohort study. Nephrol Dial Transplant. 2015;30(1):124–129.
- , , , et al. Do hospitals that provide heart failure patient education prior to discharge also promote continuity of care? A report from OPTIMIZE‐HF. J Card Fail. 2006;12(6 suppl):S111.
- , , , et al. Effects of physician experience on costs and outcomes on an academic general medicine service: results of a trial of hospitalists. Ann Intern Med. 2002;137(11):866–874.
- , , , et al. Failure of ICD‐9‐CM codes to identify patients with comorbid chronic kidney disease in diabetes. Health Serv Res. 2006;41(2):564–580.
- , , , . Validation of a telephone version of the mini‐mental state examination. J Am Geriatr Soc. 1992;40(7):697–702.
- National Kidney Foundation. Kidney disease outcomes quality initiative guidelines 2002. Available at: http://www2.kidney.org/professionals/KDOQI/guidelines_ckd/toc.htm. Accessed October 9, 2014.
- , , , , , . A more accurate method to estimate glomerular filtration rate from serum creatinine: a new prediction equation. Ann Intern Med. 1999;130(6):461–470.
- , , , et al. Prevalence and awareness of CKD among African Americans: the Jackson Heart Study. Am J Kidney Dis. 2009;53(2):238–247.
- , , , , , . Magnitude of underascertainment of impaired kidney function in older adults with normal serum creatinine. J Am Geriatr Soc. 2007;55(6):816–823.
- , , , et al. Prediction, Progression, and Outcomes of Chronic Kidney Disease in Older Adults. J Am Soc Neph. 2009;20(6):1199–1209.
Chronic kidney disease (CKD) affects over 13% of the US population and is associated with increased morbidity, mortality, and healthcare costs.[1] However, only 10% of individuals with CKD are aware of their diagnoses.[2] Even in those with stage 5 CKD, only 60% of individuals are aware of their CKD.[3] To our knowledge, no work has examined CKD awareness in a hospitalized patient population.
Patient awareness of their CKD diagnosis is important because progression of kidney disease can be slowed by patient self‐management of diabetes and hypertension.[4] Patient awareness of CKD may also increase acceptance of preend‐stage renal disease (ESRD) patient education and nephrology referral, which have been shown to delay CKD progression and improve clinical status at dialysis initiation.[5] However, only 60% of patients with advanced CKD have visited a nephrologist in the past year or have seen a nephrologist prior to dialysis initiation.[1]
The hospital is an important site for patient education and linkage to outpatient care for patients with CKD.[6] The hospital serves high‐risk patients who may not be well connected to outpatient care or who have lesswell‐controlled disease.[6, 7] Thus, hospitalization represents an opportunity to identify existing CKD and to use a multidisciplinary approach to preventative care, patient education, and patient‐provider planning for renal replacement therapy needs. In our cross‐sectional study in an urban, minority‐serving hospital, we sought to determine what patient factors were associated with hospitalized patients correctly self‐identifying as having CKD.
METHODS
Subjects and Data
We used data from the University of Chicago Hospitalist Project, a study of hospitalized patient outcomes.[8] Within 48 hours of hospitalization, all general medicine patients or their proxies are approached to enroll. During one‐on‐one inpatient interviews, a trained research assistant obtains demographic, health status, and healthcare utilization information. Participants consent for study staff to review their medical records. More than 80% of general medicine patients enroll.
We obtained data on 1234 general medicine patients discharged between January 1, 2012 and March 31, 2013 with an International Classification of Diseases, Ninth Revision (ICD‐9) code for chronic kidney disease (ICD‐9 codes 585.0585.5, 585.9) in their first 20 admission diagnoses. These codes are highly specific for CKD but have lower sensitivity.[9] We excluded all patients with a history of transplant (996.81, V42.0, n=90) or ESRD (585.6, n=416). We excluded repeat admissions during the study period (n=138). Our final sample included 590 unique patients with ICD‐9 diagnosis of CKD without ESRD.
Demographic, Clinical, and Health Service Utilization Characteristics
Our outcome was CKD awareness, the patient's correct self‐report of kidney disease. Patients selected their chronic medical conditions from a list read to them and were specifically asked if they had kidney problems. Demographic characteristics including age, gender, race/ethnicity, marital status, and education were also obtained. Healthcare utilization variables included how often the patient saw their primary medical care provider in the past year and whether patients had a prior hospitalization in the last year.
Health status variables such as mental status, diabetes, hypertension, and CKD stage were also assessed. Mental status was quantified using the telephone version of the Mini‐Mental State Examination (MMSE), scored from 1 to 22.10 We defined diabetes as ICD‐9 codes 250.0250.00, and hypertension as ICD‐9 codes 401.0, 401.9, 403, 405.09, 405.19, 405.91, 405.99, or by patient self‐report. CKD stage was based on the estimated glomerular filtration rate (eGFR) from the medical record using Kidney Disease Outcomes Quality Initiative guidelines.[11] We used the mode of the eGFR to calculate the appropriate CKD stage for those with more than 1 eGFR value from the hospitalization (576/590, 98%). The eGFR was calculated by the modified Modification of Diet in Renal Disease equation: (GFR (mL/min/1.73 m2)=175 (Screatinine)1.154 (Age)0.203 (0.742 if female) x (1.212 if African American)) recommended by the National Kidney Disease Education Program.[12]
Analysis
We used logistic regression to analyze the influence of the demographic, clinical, and healthcare utilization covariates on the likelihood of a patient reporting kidney problems. For the multivariate analysis, we sequentially added variables in a step‐wise fashion. We adjusted for (1) demographic factors: gender, race, ethnicity, marital status, and education; (2) eGFR‐calculated CKD stage and comorbidities: diabetes, hypertension, and mental status; and (3) healthcare utilization in the last 12 months: any hospitalizations and the number of visits to a health provider.
RESULTS
Patient Characteristics and Bivariable Association With Patient CKD Self‐Report
Table 1 shows demographic, clinical, and health service use characteristics for 590 patients with ICD‐9 coded CKD. In the bivariable model in Table 1, age, race, marital status and comorbidities, were associated with patient self‐report of CKD. Patients older than 80 years with physician‐identified CKD through ICD‐9 coding had 57% lower odds of reporting CKD than their younger counterparts. Patients of other races (nonwhite, non‐African American), married patients, and those with CKD stages 4 and 5 were much more likely to correctly self‐report CKD. Patients with higher MMSE score, diabetes, or hypertension had greater odds of CKD self‐report (all P0.05).
| Total, N=590 | Bivariable Odds Ratio (95% CI) | Multivariable With Stepwise Addition (95% CI) | |||
|---|---|---|---|---|---|
| Model 1, Demographic Factors | Model 2, Plus CKD Stage and Other Comorbidities | Model 3, Plus Health Service Use | |||
| |||||
| Female | 312 (52.98%) | 1.21 (0.85‐1.70) | 1.64 (1.09‐2.47)* | 1.28 (0.79‐2.06) | 1.36 (0.75‐2.48) |
| Age, y | |||||
| Below 54 | 138 (23.4%) | REF | REF | REF | REF |
| 5466 | 150 (24.4%) | 0.96 (0.59‐1.54) | 0.95 (0.56‐1.59) | 1.01 (0.56‐1.81) | 0.83 (0.41‐1.68) |
| 6779 | 161 (27.3%) | 0.77 (0.48‐1.23) | 0.67 (0.39‐1.15) | 0.66 (0.35‐1.23) | 0.72(0.34‐1.52) |
| Above 80 | 141 (23.9%) | 0.43 (0.26‐0.74) | 0.32 (0.17‐0.60) | 0.42 (0.20‐0.91)* | 0.37 (0.15‐0.93)* |
| Race | |||||
| African American | 449 (82.1%) | REF | REF | REF | REF |
| White | 75 (13.7%) | 1.47 (0.89‐2.42) | 1.53 (0.86‐2.71) | 1.56 (0.78‐3.12) | 1.08 (0.47‐2.49) |
| Other | 23 (4.2%) | 3.62 (1.53‐8.54) | 5.29 (1.78‐15.73) | 6.19 (1.72‐22.29) | 11.63 (1.80‐75.21)* |
| Ethnicity (Hispanic is reference group) | 21 (4.0%) | 0.97 (0.38‐2.44) | 0.43 (0.13‐1.45) | 0.71 (0.16‐3.09) | 0.46 (0.06‐3.57) |
| Married | 171 (32.6%) | 1.49 (1.03‐2.18)* | 1.32 (0.85‐2.04) | 1.20 (0.73‐1.98) | 1.77 (0.94‐3.33) |
| Education | |||||
| Less than high school | 128 (25.2%) | REF | REF | REF | REF |
| High school grad/some college | 296 (58.2%) | 1.05 (0.68‐1.63) | 0.93 (0.58‐1.49) | 0.95 (0.54‐1.67) | 0.85 (0.42‐1.72) |
| College grad or higher | 85 (16.7%) | 1.13 (0.64‐2.01) | 0.96 (0.51‐1.78) | 1.07 (0.51‐2.23) | 0.69 (0.27‐1.77) |
| CKD stage (eGFR calculated, mode) | |||||
| 12 | 115 (20.0%) | 0.55 (0.32‐0.95)* | 0.52 (0.27‐1.01) | 0.28 (0.11‐0.69) | |
| 3 | 300 (52.1%) | REF | REF | REF | |
| 4 | 112 (19.4%) | 2.43 (1.55‐3.81) | 2.69 (1.52‐4.76) | 3.07 (1.56‐6.07) | |
| 5 | 49 (8.5%) | 4.50 (2.39‐8.48) | 3.94 (1.81‐8.56) | 5.16 (1.85‐14.41) | |
| Diabetes (ICD‐9 coded or self‐report)‖ | 292 (49.5%) | 1.52 (1.07‐2.15)* | 1.54 (0.97‐2.45) | 1.26 (0.71‐2.26) | |
| Hypertension (ICD‐9 coded or self‐report) | 436 (73.9%) | 3.36 (2.09‐5.41) | 1.53 (0.80‐2.90) | 1.26 (0.57‐2.81) | |
| Mini‐Mental State Exam score# | 19.7 (2.5) | 1.13 (1.03‐1.23) | 1.09 (0.98‐1.22) | 1.22 (1.06‐1.42) | |
| Hospitalized in last 12 months | 253 (46.9%) | 1.50 (1.05‐2.13)* | 1.12 (0.65‐1.95) | ||
| No. of visits to health provider | |||||
| Once/year or less | 80 (18.4%) | REF | REF | ||
| 23 times/year | 58 (13.3%) | 0.80 (0.40‐1.60) | 0.44 (0.17‐1.16) | ||
| 4+ times/year | 298 (68.4%) | 0.60 (0.36‐0.99)* | 0.38 (0.19‐0.74) | ||
Multivariable Associations With Patient CKD Self‐Report
Age, race, and CKD stage remained consistently associated with CKD self‐report, although the magnitude of the effects (odds ratios [ORs]) varied across models (Table 1). Across all the models, patients older than 80 years were still significantly less likely than younger patients to self‐report CKD (ORs ranging from 0.32 to 0.42, all P0.05). Patients classified as being of other race were found to have a 5.29 to 11.63 greater odds of CKD self‐report than African American patients (all P0.05).
Patients with CKD stage 4 and 5 were more likely to self‐report than patients with CKD stage 3 (ORs ranging from 2.693.07 for stage 4 and 3.945.16 for stage 5, P0.05). In the final model, every unit increase in MMSE score increased the odds of CKD self‐report by 22%. In addition, patients who saw their health provider 4 or more times per year were 62% less likely to self‐report CKD than patients who saw their provider 1 or fewer times per year (OR: 0.38, P0.05).
A large proportion of patients (68.6%) were CKD unspecified by ICD‐9 codes, and only 27% of the unspecified group reported having CKD (Table 2). Examining the eGFR CKD stage of the CKD unspecified group showed that 22.8% were eGFR‐determined CKD stage 1 to 2, 57.1% were CKD stage 3, 14.8% were CKD stage 4, and 5.3% were CKD stage 5. Patients had 2 to 3 times greater odds of correct CKD self‐report if physicians had correctly identified their CKD stage (bivariable OR: 2.42, 95% confidence interval [CI]: 1.57‐3.72, multivariable OR: 3.22, 95% CI: 0.99‐10.46) (analysis not shown).
| CKD Stage* | Physician (ICD‐9) Coded | eGFR Calculated | eGFR Coded With ICD‐9 Correct |
|---|---|---|---|
| |||
| Unspecified | 110 (27.2%) | ||
| 12 | 5 (31.2%) | 20 (17.4%) | 0 |
| 3 | 25 (27.2%) | 83 (27.7%) | 17 (29.8%) |
| 4 | 40 (63.5%) | 54 (48.2%) | 25 (69.4%) |
| 5 | 11 (78.6%) | 31 (63.3%) | 10 (83.3%) |
DISCUSSION
Although prior work has examined CKD awareness in the general population and in high‐risk cohorts,[2, 3, 13] this is the first study examining CKD awareness in an urban, underserved hospitalized population. We found that overall patients' CKD awareness was low (32%), but increased as high as 63% for CKD stage 5, even after controlling for patient demographic, clinical characteristics, and healthcare use. Our overall rate of CKD awareness was higher than prior studies overall and at lower CKD stages.[2, 3, 13] Our work is consistent with prior literature that shows increasing CKD awareness with advancing CKD stage.[2, 3, 13]
Older patients (>80 years) had lower awareness of CKD. Older patients are more likely to have a near normal creatinine, despite a markedly reduced eGFR, so their CKD may go unnoticed.[14] Even with appropriate recognition, providers may also feel like their CKD is unlikely to progress to ESRD, given its stability and/or their competing risk of death.[15] Finally, older hospitalized patients may also be less likely to report a CKD diagnosis due to difficulty in recall due to denial, dementia, or delirium.
One limitation is that our case‐finding for CKD was physician ICD‐9 coding, which is highly specific but not sensitive.[9] The majority of patients with physician‐identified CKD were CKD unspecified, perhaps due to poor coding, physician underdocumentation, or physician under‐recognition of CKD stage. Although only 27% of the CKD unspecified group correctly self‐identified as having CKD, over 75% were found to be CKD stage 3 or higher, which should trigger additional monitoring or care based on guidelines.[10] In addition, despite statistical significance, we may not be able to make meaningful inferences about our small other group (nonwhite, non‐African American). Our sample was from 1 hospitalan urban, academic, tertiary care center with a large proportion of African American patientswhich may limit generalizability. The multivariable model will need to be tested in other populations for reproducibility.
Our study significantly contributes to the literature by examining patient awareness of CKD in a high‐risk, urban, hospitalized minority population. Other study strengths include use of basic demographic information, as well as survey and laboratory data for a richer examination of the associations between patient factors and CKD awareness.
CONCLUSION
Hospitalized patients with CKD have a low CKD awareness. Patient awareness of their CKD is increased with physician documentation of CKD severity. Patient awareness of their CKD must be coupled with provider awareness and CKD documentation to link patients to multidisciplinary CKD education and care to slow CKD progression and reduce associated cardiovascular and metabolic complications. Further work is needed across hospitals to determineand improveCKD awareness among both patients and providers.
Disclosures
Dr. Saunders was supported by Pilot and Feasibility Funding from the Chicago Center for Diabetes Translation Research (NIDDK P30 DK092949). Dr. Chin was supported by NIDDK K24 DK071933. Dr. Meltzer was supported by NIA T35 AG029795. Dr. Saunders had full access to all of the study data and takes responsibility for the integrity of the data and accuracy of the data analysis. An abstract of this article was presented at the Society of Hospital Medicine Annual Meeting in Las Vegas, Nevada in March 2014 and at the Society of General Internal Medicine Annual Meeting in San Diego, California in April 2014. The authors report no conflicts of interest.
- United States Renal Data System. Annual Data Report: Atlas of Chronic Kidney Disease and End‐Stage Renal Disease in the United States. Bethesda, MD: National Institutes of Health; 2012.
- , , , et al. Chronic kidney disease awareness among individuals with clinical markers of kidney dysfunction. Clin J Am Soc Neph. 2011;6(8):1838–1844.
- , , , et al. Comparison of CKD awareness in a screening population using the Modification of Diet in Renal Disease (MDRD) Study and CKD Epidemiology Collaboration (CKD‐EPI) equations. Am J Kidney Dis. 2011;57(3 suppl 2):S17–S23.
- , , , et al. Preserving renal function in adults with hypertension and diabetes: a consensus approach. Am J Kidney Dis. 2000;36(3):646–661.
- , , , et al. Multidisciplinary predialysis education decreases the incidence of dialysis and reduces mortality—a controlled cohort study based on the NKFDOQI guidelines. Nephrol Dial Transplant. 2009;24(11):3426–3433.
- , , . Pre‐dialysis hospital use and late referrals in incident dialysis patients in England: a retrospective cohort study. Nephrol Dial Transplant. 2015;30(1):124–129.
- , , , et al. Do hospitals that provide heart failure patient education prior to discharge also promote continuity of care? A report from OPTIMIZE‐HF. J Card Fail. 2006;12(6 suppl):S111.
- , , , et al. Effects of physician experience on costs and outcomes on an academic general medicine service: results of a trial of hospitalists. Ann Intern Med. 2002;137(11):866–874.
- , , , et al. Failure of ICD‐9‐CM codes to identify patients with comorbid chronic kidney disease in diabetes. Health Serv Res. 2006;41(2):564–580.
- , , , . Validation of a telephone version of the mini‐mental state examination. J Am Geriatr Soc. 1992;40(7):697–702.
- National Kidney Foundation. Kidney disease outcomes quality initiative guidelines 2002. Available at: http://www2.kidney.org/professionals/KDOQI/guidelines_ckd/toc.htm. Accessed October 9, 2014.
- , , , , , . A more accurate method to estimate glomerular filtration rate from serum creatinine: a new prediction equation. Ann Intern Med. 1999;130(6):461–470.
- , , , et al. Prevalence and awareness of CKD among African Americans: the Jackson Heart Study. Am J Kidney Dis. 2009;53(2):238–247.
- , , , , , . Magnitude of underascertainment of impaired kidney function in older adults with normal serum creatinine. J Am Geriatr Soc. 2007;55(6):816–823.
- , , , et al. Prediction, Progression, and Outcomes of Chronic Kidney Disease in Older Adults. J Am Soc Neph. 2009;20(6):1199–1209.
EVB in Hospitalized Cirrhotic Patients
Cirrhosis is a leading cause of death in the United States. In 2010, cirrhosis resulted in an estimated 49,500 deaths, which represented a significant increase from 35,500 deaths 2 decades ago.[1] Cirrhotic patients are susceptible to numerous disease‐specific complications including ascites, esophageal varices, hepatic encephalopathy (HE), and hepatorenal syndrome (HRS).[2]
Esophageal varices develop in approximately 50% of patient with cirrhosis, and their presence correlates with the severity of liver disease.[3] In cirrhotic patients, esophageal variceal bleeding (EVB) occurs at an annual rate of 5% to 15% and results in substantial morbidity and mortality.[3] Utilizing US national data, Jamal et al. reported a decline in the rate of hospitalizations related to EVB from 1988 to 2002.[4] However, recent large‐scale studies relating to the epidemiology of EVB are lacking. We conducted a retrospective analysis using a national US database to study the differences in demographic characteristics, rate of complications, outcomes, and temporal trends in hospitalized cirrhotic patients with and without EVB.
METHODS
We utilized biennial data (20022012) from the Healthcare Cost and Utilization Project Nationwide Inpatient Sample using methods described earlier.[5] Initially, we extracted all entries with any discharge diagnosis of cirrhosis (International Classification of Diseases, Ninth Revision, Clinical Modification [ICD‐9‐CM] codes: 571.2, 571.5, 571.6) in adult patients ages 18 years and older.[6] Within this cirrhotic population, we next extracted all entries with any discharge diagnosis of EVB (ICD‐9‐CM codes: 456.0., 456.20).[6] Population‐based rates relating to hospital discharges were reported as per 100,000 population/year.
The outcome variables of interest were in‐hospital mortality, total charges (rounded to the nearest $1000) and length of stay (LOS). Demographic details and hospital characteristics were also extracted. Cases were queried for complications well recognized in cirrhotic patients. These included urinary tract infection (UTI) (ICD‐9‐CM codes: 1122, 59010‐11, 5902‐03, 59080‐81, 5950, 5970, 5990), skin and subcutaneous tissue infections (SSCI) (ICD‐9‐CM codes: 680‐82, 684, 686), spontaneous bacterial peritonitis (SBP) (ICD‐9‐CM codes: 56723, 5672), Clostridium difficile infection (ICD‐9‐CM code: 00845), or pneumonia (ICD‐9‐CM codes: 480‐83, 487).[6] Also queried were HE (ICD‐9‐CM code: 572.2)[7] and HRS (ICD‐9‐CM code: 572.4).[8] Comorbid conditions were assessed using the Elixhauser comorbidity index minus the presence of liver disorders but including alcohol abuse.[9]
Statistical analyses were performed using SAS version 9.3 (SAS Institute, Cary, NC). To determine the independent association of EVB on outcome variables, we performed case‐control matching (EVB vs no EVB). We used high‐dimensional propensity scores in a 1:5 matching ratio with a greedy matching algorithm generated by regression analysis of patients with EVB based on demographics details (age, gender, insurance status), comorbid conditions, alcohol abuse, infections as detailed above, HE, and HRS. The 2 test and the Mann‐Whitney U test compared categorical and continuous variables. For trend analysis, we used the Cochrane‐Armitage test. The threshold for significance for all analyses was P0.01.
RESULTS
In 2012, there were 570,020 hospital discharges related to cirrhosis in patients 18 years of age and older. Within this cohort, EVB occurred in 32,945 discharges (5.78%). Table 1 details differences between cirrhotic patients with and without EVB. Comparatively, patients with EVB were younger (median age 55 years, interquartile range [IQR] 13 years vs median age 58 years, IQR 15 years; P0.01), more likely to be male (70.1% vs 60.4%; P0.01), and without health insurance (21.0% vs 12.50%; P0.01). Minor differences between the 2 groups were observed in respect to hospital region, location, teaching status, and household income quartile. There was no difference in the number of comorbid conditions (median 4 comorbid conditions in each group).
| Study Group | P Value | ||
|---|---|---|---|
| Cirrhosis Without Variceal Bleeding | Cirrhosis With Variceal Bleeding | ||
| |||
| Total 570,220 (100%) | 537,275 (94.22%) | 32,945 (5.78%) | |
| Age, y, median (IQR) | 58 (15) | 55 (13) | |
| Gender | |||
| Male | 60.40% | 70.10% | |
| Female | 39.60% | 29.90% | |
| Mortality | 5.80% | 9.90% | |
| Insurance | |||
| Private | 19.70% | 22.40% | |
| Medicare/Medicaid | 67.80% | 56.60% | |
| None | 12.50% | 21.00% | |
| Length of stay, median (IQR) | 4 (5) | 4 (4) | |
| Hospital charges, median (IQR) | 28 (39) | 41 (49) | |
| Associated comorbidities, median (IQR) | 4 (2) | 4 (3) | |
| Alcohol consumption | 48.80% | 63.90% | |
| Infections | |||
| Overall | 24.10% | 13.50% | |
| UTI | 13.10% | 6.90% | |
| Pneumonia | 1.50% | 1.40% | 0.03 |
| SBP | 3.40% | 3.40% | 0.45 |
| SSCI | 6.30% | 1.70% | |
| CDI | 2.20% | 1.40% | |
| Hepatic encephalopathy | 17.70% | 18.80% | |
| Hepatorenal syndrome | 3.70% | 4.30% | |
| EVL | 66.40% | ||
| TIPS | 4.90% | ||
| Blood transfusions | 56.90% | ||
Patients with EVB suffered a significantly higher rate of alcohol abuse (63.90% vs 48.80%; P0.01). EVB was also associated with an overall lower incidence of infection (13.50% vs 24.10%; P0.01). Specifically, the greatest difference in rates of infection were observed for UTI (6.90% vs 13.10%; P0.01) and SSCI (1.70% vs 6.30%; P0.01). Also, patients with EVB demonstrated a small, yet significant increased incidence of HE (18.80% vs 17.70%; P0.01) and HRS (4.30% vs 3.70%; P0.01).
Cirrhotic patients with EVB demonstrated worse overall outcomes compared to their counterparts without EVB. This manifested in an unadjusted higher mortality rate (9.90% vs 5.80%; P0.01) and increased hospital charges (median $41,000 [IQR $49,000] vs $28,000 [IQR $39,000]; P0.01). LOS between the 2 groups did not differ (median 4 days). After adjusting for demographic differences, complications, and comorbid conditions, EVB in patients with cirrhosis continued to be independently associated with a higher mortality rate (10.00% vs 5.00%; P0.01) and increased hospital charges (median $41,000 [IQR $49,000] vs $26,000 [IQR $34,000]; P0.01). Again, LOS was similar for the 2 groups (median 4 days).
Between the years 2002 and 2012, the number of hospital discharges related to cirrhosis increased from 337,956 to 570,220 (P0.01). Concurrently, the incidence of EVB in this population declined from 8.60% to 5.78% (Figure 1), representing an overall decrease of 33.0% with a significant decreased trend (P0.01).

We also calculated population‐adjusted hospitalization rates for discharges related to cirrhosis and EVB. The rate of cirrhosis‐related discharges continued to demonstrate an increased trend from 157.42/100,000 population in 2002 to 237.43/100,000 population in 2012 (P0.01). However, no significant trend was observed for EVB‐related hospital discharges in the same period of time (13.60/100,000 population in 2002 to 13.72/100,000 population in 2012; P=0.91).
DISCUSSION
Our results indicated a significantly higher rate of alcohol abuse in cirrhotic patients with EVB. Alcohol consumption is an independent risk factor for esophageal variceal bleeding.[10, 11] Continued alcohol consumption not only increases the risk for development of varices but may also precipitate variceal rupture.[10] Other risk factors associated with EVB in this study (younger age, male, lower economic status) are likely related to a higher incidence of alcohol abuse in this demographic.[12]
Patients with EVB were also noted to have a lower overall incidence of infection, especially UTI and SSCI. The use of broad‐spectrum antibiotics decreases mortality from secondary infection and improves the prognosis of cirrhotic patients with EVB.[13, 14] The American Association for the Study of Liver Diseases recommends the use of third‐generation cephalosporins in the setting of EVB.[3] The widespread adoption of this in clinical practice may have contributed to a decreased rate of infection in patients with EVB. The difference in the incidence rates of HE and HRS, although statistically significant, were small, and likely the consequence of the large numbers involved in our study.
Our results also indicate that cirrhotic patients with EVB were twice as likely to die compared to matched counterparts without EVB. The increased mortality associated with EVB could be related to hemorrhagic/hypovolemic shock and cardiovascular collapse, aspiration into airway, multiorgan dysfunction due to poor perfusion, infections including SBP, and HE. Although prior studies have demonstrated the relationship between EVB and increased mortality, typically they have been restricted to small single‐center studies involving fewer than 200 patients.[6, 7, 8, 9] Cirrhotic patients with EVB also incurred significantly higher hospital charges compared to matched counterparts. Interestingly, the hospital LOS did not differ between the 2 groups. Intensive care and procedural costs were likely a major contributor to the higher charges; cirrhotic patients with EVB underwent a median of 3 procedures (IQR 2) during their hospital stay compared to a median of 1 procedure (IQR 3) for cirrhotic patients without EVB (P0.01; data not shown).
In contrast to trends from earlier decades,[4] the population‐adjusted rate of EVB‐related hospital discharges did not change significantly from 2002 to 2012. However, these data are confounded in their interpretation by a substantial increase in the prevalence of cirrhosis in the United States during the same time period.[15] Therefore, it may be more meaningful to state that there was a contemporaneous decline in EVB‐related hospital discharges when considered in the context of a complicating rate in hospitalized cirrhotic patients. These results are consistent with a recent single‐center study[16] and are very likely the fruition of intensive screening programs with primary and secondary prophylaxis for EVB involving esophageal variceal ligation and pharmacotherapy (‐blockers) as well as the increased acceptance of transjugular intrahepatic portosystemic shunt placement.[17, 18, 19]
There are limitations to our study. First, we relied exclusively on ICD‐9‐CM codes for case identification. Second, there is a nonavailability of data pertaining to Model for End‐Stage Liver Disease score calculations, medication, and antibiotic usage. Third, the Nationwide Inpatient Sample database does not allow for distinguishing individual patients with repeat admissions. Finally, our results represent a weighted estimate of national data.
CONCLUSION
EVB in cirrhotic patients was associated with significantly higher mortality and increased hospital charges. Also, the rate of EVB‐related hospital discharges as a complicating factor in patients with cirrhosis declined significantly during the decade 2002 to 2012. This likely reflects the ongoing effectiveness of primary and secondary prophylaxis.
Acknowledgements
The authors acknowledge the Healthcare Cost and Utilization Project (HCUP) Nationwide Inpatient Sample, sponsored by the Agency for Healthcare Research and Quality, which contributes to HCUP (
Disclosures: C.P., the first author and corresponding author, conceptualized the study, and with A.D. gathered and analyzed the data. C.P. and M.D. wrote, edited, and proofread the manuscript as well as created the bibliography and formulated the table and figure. R.G., R.T., and M.O. edited, commented on, and reviewed the manuscript. All of the authors reviewed and agreed on the final version of the manuscript for submission. The authors report no conflicts of interest.
- US Burden of Disease Collaborators. The state of US health, 1990‐2010: burden of diseases, injuries, and risk factors. JAMA. 2013;310(6):591–608.
- , Complications of cirrhosis. Curr Opin Gastroenterol. 2012;28(3):223–229.
- , , , , Practice Guidelines Committee of the American Association for the Study of Liver Diseases, Practice Parameters Committee of the American College of Gastroenterology. Prevention and management of gastroesophageal varices and variceal hemorrhage in cirrhosis. Hepatology. 2007;46(3):922–938.
- , , , Declining hospitalization rate of esophageal variceal bleeding in the United States. Clin Gastroenterol Hepatol. 2008;6(6):689–695; quiz 605.
- , , , , , Association of Clostridium difficile infection with outcomes of hospitalized solid organ transplant recipients: results from the 2009 Nationwide Inpatient Sample database. Transpl Infect Dis. 2012;14(5):540–547.
- , , Prevalence and in‐hospital mortality trends of infections among patients with cirrhosis: a nationwide study of hospitalised patients in the United States. Aliment Pharmacol Ther. 2014;40(1):105–112.
- , , Racial disparities in the management of hospitalized patients with cirrhosis and complications of portal hypertension: a national study. Hepatology. 2007;45(5):1282–1289.
- , Protein‐calorie malnutrition as a prognostic indicator of mortality among patients hospitalized with cirrhosis and portal hypertension. Liver Int. 2009;29(9):1396–1402.
- , , , Comorbidity measures for use with administrative data. Med Care. 1998;36(1):8–27.
- , , , , , Potential precipitating factors of esophageal variceal bleeding: a case‐control study. Am J Gastroenterol. 2011;106(1):96–103.
- , , , et al. Effects of ethanol consumption on hepatic hemodynamics in patients with alcoholic cirrhosis. Gastroenterology. 1997;112(4):1284–1289.
- , , , Prevalence, correlates, disability, and comorbidity of DSM‐IV alcohol abuse and dependence in the United States: results from the National Epidemiologic Survey on Alcohol and Related Conditions. Arch Gen Psychiatry. 2007;64(7):830–842.
- , , Role of prophylactic antibiotics in cirrhotic patients with variceal bleeding. World J Gastroenterol. 2014;20(7):1790–1796.
- , , , et al. Meta‐analysis: antibiotic prophylaxis for cirrhotic patients with upper gastrointestinal bleeding—an updated Cochrane review. Aliment Pharmacol Ther. 2011;34(5):509–518.
- , , , et al. The epidemiology of cirrhosis in the United States: a population‐based study [published online ahead of print October 8, 2014]. J Clin Gastroenterol. doi: 10.1097/MCG.0000000000000208.
- , , , Hospitalization for variceal hemorrhage in an era with more prevalent cirrhosis. World J Gastroenterol. 2014;20(32):11326–11332.
- , Banding ligation versus beta‐blockers for primary prevention in oesophageal varices in adults. Cochrane Database Syst Rev. 2012;8:CD004544.
- , , , et al. Early use of TIPS in patients with cirrhosis and variceal bleeding. N Engl J Med. 2010;362(25):2370–2379.
- , , , Meta‐analysis: banding ligation and medical interventions for the prevention of rebleeding from oesophageal varices. Aliment Pharmacol Ther. 2012;35(10):1155–1165.
Cirrhosis is a leading cause of death in the United States. In 2010, cirrhosis resulted in an estimated 49,500 deaths, which represented a significant increase from 35,500 deaths 2 decades ago.[1] Cirrhotic patients are susceptible to numerous disease‐specific complications including ascites, esophageal varices, hepatic encephalopathy (HE), and hepatorenal syndrome (HRS).[2]
Esophageal varices develop in approximately 50% of patient with cirrhosis, and their presence correlates with the severity of liver disease.[3] In cirrhotic patients, esophageal variceal bleeding (EVB) occurs at an annual rate of 5% to 15% and results in substantial morbidity and mortality.[3] Utilizing US national data, Jamal et al. reported a decline in the rate of hospitalizations related to EVB from 1988 to 2002.[4] However, recent large‐scale studies relating to the epidemiology of EVB are lacking. We conducted a retrospective analysis using a national US database to study the differences in demographic characteristics, rate of complications, outcomes, and temporal trends in hospitalized cirrhotic patients with and without EVB.
METHODS
We utilized biennial data (20022012) from the Healthcare Cost and Utilization Project Nationwide Inpatient Sample using methods described earlier.[5] Initially, we extracted all entries with any discharge diagnosis of cirrhosis (International Classification of Diseases, Ninth Revision, Clinical Modification [ICD‐9‐CM] codes: 571.2, 571.5, 571.6) in adult patients ages 18 years and older.[6] Within this cirrhotic population, we next extracted all entries with any discharge diagnosis of EVB (ICD‐9‐CM codes: 456.0., 456.20).[6] Population‐based rates relating to hospital discharges were reported as per 100,000 population/year.
The outcome variables of interest were in‐hospital mortality, total charges (rounded to the nearest $1000) and length of stay (LOS). Demographic details and hospital characteristics were also extracted. Cases were queried for complications well recognized in cirrhotic patients. These included urinary tract infection (UTI) (ICD‐9‐CM codes: 1122, 59010‐11, 5902‐03, 59080‐81, 5950, 5970, 5990), skin and subcutaneous tissue infections (SSCI) (ICD‐9‐CM codes: 680‐82, 684, 686), spontaneous bacterial peritonitis (SBP) (ICD‐9‐CM codes: 56723, 5672), Clostridium difficile infection (ICD‐9‐CM code: 00845), or pneumonia (ICD‐9‐CM codes: 480‐83, 487).[6] Also queried were HE (ICD‐9‐CM code: 572.2)[7] and HRS (ICD‐9‐CM code: 572.4).[8] Comorbid conditions were assessed using the Elixhauser comorbidity index minus the presence of liver disorders but including alcohol abuse.[9]
Statistical analyses were performed using SAS version 9.3 (SAS Institute, Cary, NC). To determine the independent association of EVB on outcome variables, we performed case‐control matching (EVB vs no EVB). We used high‐dimensional propensity scores in a 1:5 matching ratio with a greedy matching algorithm generated by regression analysis of patients with EVB based on demographics details (age, gender, insurance status), comorbid conditions, alcohol abuse, infections as detailed above, HE, and HRS. The 2 test and the Mann‐Whitney U test compared categorical and continuous variables. For trend analysis, we used the Cochrane‐Armitage test. The threshold for significance for all analyses was P0.01.
RESULTS
In 2012, there were 570,020 hospital discharges related to cirrhosis in patients 18 years of age and older. Within this cohort, EVB occurred in 32,945 discharges (5.78%). Table 1 details differences between cirrhotic patients with and without EVB. Comparatively, patients with EVB were younger (median age 55 years, interquartile range [IQR] 13 years vs median age 58 years, IQR 15 years; P0.01), more likely to be male (70.1% vs 60.4%; P0.01), and without health insurance (21.0% vs 12.50%; P0.01). Minor differences between the 2 groups were observed in respect to hospital region, location, teaching status, and household income quartile. There was no difference in the number of comorbid conditions (median 4 comorbid conditions in each group).
| Study Group | P Value | ||
|---|---|---|---|
| Cirrhosis Without Variceal Bleeding | Cirrhosis With Variceal Bleeding | ||
| |||
| Total 570,220 (100%) | 537,275 (94.22%) | 32,945 (5.78%) | |
| Age, y, median (IQR) | 58 (15) | 55 (13) | |
| Gender | |||
| Male | 60.40% | 70.10% | |
| Female | 39.60% | 29.90% | |
| Mortality | 5.80% | 9.90% | |
| Insurance | |||
| Private | 19.70% | 22.40% | |
| Medicare/Medicaid | 67.80% | 56.60% | |
| None | 12.50% | 21.00% | |
| Length of stay, median (IQR) | 4 (5) | 4 (4) | |
| Hospital charges, median (IQR) | 28 (39) | 41 (49) | |
| Associated comorbidities, median (IQR) | 4 (2) | 4 (3) | |
| Alcohol consumption | 48.80% | 63.90% | |
| Infections | |||
| Overall | 24.10% | 13.50% | |
| UTI | 13.10% | 6.90% | |
| Pneumonia | 1.50% | 1.40% | 0.03 |
| SBP | 3.40% | 3.40% | 0.45 |
| SSCI | 6.30% | 1.70% | |
| CDI | 2.20% | 1.40% | |
| Hepatic encephalopathy | 17.70% | 18.80% | |
| Hepatorenal syndrome | 3.70% | 4.30% | |
| EVL | 66.40% | ||
| TIPS | 4.90% | ||
| Blood transfusions | 56.90% | ||
Patients with EVB suffered a significantly higher rate of alcohol abuse (63.90% vs 48.80%; P0.01). EVB was also associated with an overall lower incidence of infection (13.50% vs 24.10%; P0.01). Specifically, the greatest difference in rates of infection were observed for UTI (6.90% vs 13.10%; P0.01) and SSCI (1.70% vs 6.30%; P0.01). Also, patients with EVB demonstrated a small, yet significant increased incidence of HE (18.80% vs 17.70%; P0.01) and HRS (4.30% vs 3.70%; P0.01).
Cirrhotic patients with EVB demonstrated worse overall outcomes compared to their counterparts without EVB. This manifested in an unadjusted higher mortality rate (9.90% vs 5.80%; P0.01) and increased hospital charges (median $41,000 [IQR $49,000] vs $28,000 [IQR $39,000]; P0.01). LOS between the 2 groups did not differ (median 4 days). After adjusting for demographic differences, complications, and comorbid conditions, EVB in patients with cirrhosis continued to be independently associated with a higher mortality rate (10.00% vs 5.00%; P0.01) and increased hospital charges (median $41,000 [IQR $49,000] vs $26,000 [IQR $34,000]; P0.01). Again, LOS was similar for the 2 groups (median 4 days).
Between the years 2002 and 2012, the number of hospital discharges related to cirrhosis increased from 337,956 to 570,220 (P0.01). Concurrently, the incidence of EVB in this population declined from 8.60% to 5.78% (Figure 1), representing an overall decrease of 33.0% with a significant decreased trend (P0.01).
We also calculated population‐adjusted hospitalization rates for discharges related to cirrhosis and EVB. The rate of cirrhosis‐related discharges continued to demonstrate an increased trend from 157.42/100,000 population in 2002 to 237.43/100,000 population in 2012 (P0.01). However, no significant trend was observed for EVB‐related hospital discharges in the same period of time (13.60/100,000 population in 2002 to 13.72/100,000 population in 2012; P=0.91).
DISCUSSION
Our results indicated a significantly higher rate of alcohol abuse in cirrhotic patients with EVB. Alcohol consumption is an independent risk factor for esophageal variceal bleeding.[10, 11] Continued alcohol consumption not only increases the risk for development of varices but may also precipitate variceal rupture.[10] Other risk factors associated with EVB in this study (younger age, male, lower economic status) are likely related to a higher incidence of alcohol abuse in this demographic.[12]
Patients with EVB were also noted to have a lower overall incidence of infection, especially UTI and SSCI. The use of broad‐spectrum antibiotics decreases mortality from secondary infection and improves the prognosis of cirrhotic patients with EVB.[13, 14] The American Association for the Study of Liver Diseases recommends the use of third‐generation cephalosporins in the setting of EVB.[3] The widespread adoption of this in clinical practice may have contributed to a decreased rate of infection in patients with EVB. The difference in the incidence rates of HE and HRS, although statistically significant, were small, and likely the consequence of the large numbers involved in our study.
Our results also indicate that cirrhotic patients with EVB were twice as likely to die compared to matched counterparts without EVB. The increased mortality associated with EVB could be related to hemorrhagic/hypovolemic shock and cardiovascular collapse, aspiration into airway, multiorgan dysfunction due to poor perfusion, infections including SBP, and HE. Although prior studies have demonstrated the relationship between EVB and increased mortality, typically they have been restricted to small single‐center studies involving fewer than 200 patients.[6, 7, 8, 9] Cirrhotic patients with EVB also incurred significantly higher hospital charges compared to matched counterparts. Interestingly, the hospital LOS did not differ between the 2 groups. Intensive care and procedural costs were likely a major contributor to the higher charges; cirrhotic patients with EVB underwent a median of 3 procedures (IQR 2) during their hospital stay compared to a median of 1 procedure (IQR 3) for cirrhotic patients without EVB (P0.01; data not shown).
In contrast to trends from earlier decades,[4] the population‐adjusted rate of EVB‐related hospital discharges did not change significantly from 2002 to 2012. However, these data are confounded in their interpretation by a substantial increase in the prevalence of cirrhosis in the United States during the same time period.[15] Therefore, it may be more meaningful to state that there was a contemporaneous decline in EVB‐related hospital discharges when considered in the context of a complicating rate in hospitalized cirrhotic patients. These results are consistent with a recent single‐center study[16] and are very likely the fruition of intensive screening programs with primary and secondary prophylaxis for EVB involving esophageal variceal ligation and pharmacotherapy (‐blockers) as well as the increased acceptance of transjugular intrahepatic portosystemic shunt placement.[17, 18, 19]
There are limitations to our study. First, we relied exclusively on ICD‐9‐CM codes for case identification. Second, there is a nonavailability of data pertaining to Model for End‐Stage Liver Disease score calculations, medication, and antibiotic usage. Third, the Nationwide Inpatient Sample database does not allow for distinguishing individual patients with repeat admissions. Finally, our results represent a weighted estimate of national data.
CONCLUSION
EVB in cirrhotic patients was associated with significantly higher mortality and increased hospital charges. Also, the rate of EVB‐related hospital discharges as a complicating factor in patients with cirrhosis declined significantly during the decade 2002 to 2012. This likely reflects the ongoing effectiveness of primary and secondary prophylaxis.
Acknowledgements
The authors acknowledge the Healthcare Cost and Utilization Project (HCUP) Nationwide Inpatient Sample, sponsored by the Agency for Healthcare Research and Quality, which contributes to HCUP (
Disclosures: C.P., the first author and corresponding author, conceptualized the study, and with A.D. gathered and analyzed the data. C.P. and M.D. wrote, edited, and proofread the manuscript as well as created the bibliography and formulated the table and figure. R.G., R.T., and M.O. edited, commented on, and reviewed the manuscript. All of the authors reviewed and agreed on the final version of the manuscript for submission. The authors report no conflicts of interest.
- US Burden of Disease Collaborators. The state of US health, 1990‐2010: burden of diseases, injuries, and risk factors. JAMA. 2013;310(6):591–608.
- , Complications of cirrhosis. Curr Opin Gastroenterol. 2012;28(3):223–229.
- , , , , Practice Guidelines Committee of the American Association for the Study of Liver Diseases, Practice Parameters Committee of the American College of Gastroenterology. Prevention and management of gastroesophageal varices and variceal hemorrhage in cirrhosis. Hepatology. 2007;46(3):922–938.
- , , , Declining hospitalization rate of esophageal variceal bleeding in the United States. Clin Gastroenterol Hepatol. 2008;6(6):689–695; quiz 605.
- , , , , , Association of Clostridium difficile infection with outcomes of hospitalized solid organ transplant recipients: results from the 2009 Nationwide Inpatient Sample database. Transpl Infect Dis. 2012;14(5):540–547.
- , , Prevalence and in‐hospital mortality trends of infections among patients with cirrhosis: a nationwide study of hospitalised patients in the United States. Aliment Pharmacol Ther. 2014;40(1):105–112.
- , , Racial disparities in the management of hospitalized patients with cirrhosis and complications of portal hypertension: a national study. Hepatology. 2007;45(5):1282–1289.
- , Protein‐calorie malnutrition as a prognostic indicator of mortality among patients hospitalized with cirrhosis and portal hypertension. Liver Int. 2009;29(9):1396–1402.
- , , , Comorbidity measures for use with administrative data. Med Care. 1998;36(1):8–27.
- , , , , , Potential precipitating factors of esophageal variceal bleeding: a case‐control study. Am J Gastroenterol. 2011;106(1):96–103.
- , , , et al. Effects of ethanol consumption on hepatic hemodynamics in patients with alcoholic cirrhosis. Gastroenterology. 1997;112(4):1284–1289.
- , , , Prevalence, correlates, disability, and comorbidity of DSM‐IV alcohol abuse and dependence in the United States: results from the National Epidemiologic Survey on Alcohol and Related Conditions. Arch Gen Psychiatry. 2007;64(7):830–842.
- , , Role of prophylactic antibiotics in cirrhotic patients with variceal bleeding. World J Gastroenterol. 2014;20(7):1790–1796.
- , , , et al. Meta‐analysis: antibiotic prophylaxis for cirrhotic patients with upper gastrointestinal bleeding—an updated Cochrane review. Aliment Pharmacol Ther. 2011;34(5):509–518.
- , , , et al. The epidemiology of cirrhosis in the United States: a population‐based study [published online ahead of print October 8, 2014]. J Clin Gastroenterol. doi: 10.1097/MCG.0000000000000208.
- , , , Hospitalization for variceal hemorrhage in an era with more prevalent cirrhosis. World J Gastroenterol. 2014;20(32):11326–11332.
- , Banding ligation versus beta‐blockers for primary prevention in oesophageal varices in adults. Cochrane Database Syst Rev. 2012;8:CD004544.
- , , , et al. Early use of TIPS in patients with cirrhosis and variceal bleeding. N Engl J Med. 2010;362(25):2370–2379.
- , , , Meta‐analysis: banding ligation and medical interventions for the prevention of rebleeding from oesophageal varices. Aliment Pharmacol Ther. 2012;35(10):1155–1165.
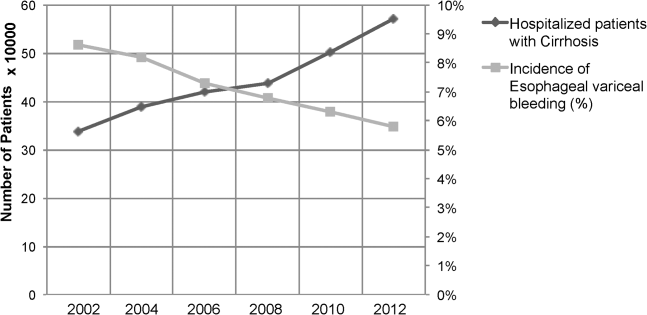
TCS Among Children with Pneumonia
National guidelines for the management of childhood pneumonia highlight the need for the development of objective outcome measures to inform clinical decision making, establish benchmarks of care, and compare treatments and interventions.[1] Time to clinical stability (TCS) is a measure reported in adult pneumonia studies that incorporates vital signs, ability to eat, and mental status to objectively assess readiness for discharge.[2, 3, 4] TCS has not been validated among children as it has in adults,[5, 6, 7, 8] although such measures could prove useful for assessing discharge readiness with applications in both clinical and research settings. The objective of our study was to test the performance of pediatric TCS measures among children hospitalized with pneumonia.
METHODS
Study Population
We studied children hospitalized with community‐acquired pneumonia at Monroe Carell Jr. Children's Hospital at Vanderbilt between January 6, 2010 and May 9, 2011. Study children were enrolled as part of the Centers for Disease Control & Prevention (CDC) Etiology of Pneumonia in the Community (EPIC) study, a prospective, population‐based study of community‐acquired pneumonia hospitalizations. Detailed enrollment criteria for the EPIC study were reported previously.[9] Institutional review boards at Vanderbilt University and the CDC approved this study. Informed consent was obtained from enrolled families.
Data Elements and Study Definitions
Baseline data, including demographics, illness history, comorbidities, and clinical outcomes (eg, length of stay [LOS], intensive care admission), were systematically and prospectively collected. Additionally, data for 4 physiologic parameters, including temperature, heart rate, respiratory rate, and use of supplemental oxygen were obtained from the electronic medical record. These parameters were measured at least every 6 hours from admission through discharge as part of routine care. Readmissions within 7 calendar days of discharge were also obtained from the electronic medical record.
Stability for each parameter was defined as follows: normal temperature (36.037.9C), normal respiratory and heart rates in accordance with Pediatric Advanced Life Support age‐based values (see Supporting Table 1 in the online version of this article),[10] and no administration of supplemental oxygen. If the last recorded value for a given parameter was abnormal, that parameter was considered unstable at discharge. Otherwise, the time and date of the last abnormal value for each parameter was subtracted from admission time and date to determine TCS for that parameter in hours.
To determine overall stability, we evaluated 4 combination TCS measures, each incorporating 2 individual parameters. All combinations included respiratory rate and need for supplemental oxygen, as these parameters are the most explicit clinical indicators of pneumonia. Stability for each combination measure was defined as normalization of all included measures.
Clinical Outcomes for the Combined TCS Measures
The 4 combined TCS measures were compared against clinical outcomes including hospital LOS (measured in hours) and an ordinal severity scale. The ordinal scale categorized children into 3 mutually exclusive groups as follows: nonsevere (hospitalization without need for intensive care or empyema requiring drainage), severe (intensive care admission without invasive mechanical ventilation or vasopressor support and no empyema requiring drainage), and very severe (invasive mechanical ventilation, vasopressor support, or empyema requiring drainage).
Statistical Analysis
Categorical and continuous variables were summarized using frequencies and percentages and median and interquartile range (IQR) values, respectively. Analyses were stratified by age (2 years, 24 years, 517 years). We also plotted summary statistics for the combined measures and LOS, and computed the median absolute difference between these measures for each level of the ordinal severity scale. Analyses were conducted using Stata 13 (StataCorp, College Station, TX).
RESULTS
Study Population
Among 336 children enrolled in the EPIC study at Vanderbilt during the study period, 334 (99.4%) with complete data were included. Median age was 33 months (IQR, 1480). Median LOS was 56.4 hours (IQR, 41.591.7). There were 249 (74.5%) children classified as nonsevere, 39 (11.7) as severe, and 46 (13.8) as very severe (for age‐based characteristics see Supporting Table 2 in the online version of this article). Overall, 12 (3.6%) children were readmitted within 7 days of discharge.
Individual Stability Parameters
Overall, 323 (96.7%) children had 1 parameter abnormal on admission. Respiratory rate (81.4%) was the most common abnormal parameter, followed by abnormal temperature (71.4%), use of supplemental oxygen (63.8%), and abnormal heart rate (54.4%). Overall, use of supplemental oxygen had the longest TCS, followed by respiratory rate (Table 1). In comparison, heart rate and temperature stabilized relatively quickly.
| Parameter | 2 Years, n=130 | 24 Years, n=90 | 517 Years, n=101 | |||
|---|---|---|---|---|---|---|
| No. (%)* | Median (IQR) TCS, h | No. (%) | Median (IQR) TCS, h | No. (%) | Median (IQR) TCS, h | |
| ||||||
| Respiratory rate | 97 (74.6) | 38.6 (18.768.9) | 63 (70.0) | 31.6 (9.561.9) | 63 (62.4) | 24.3 (10.859.2) |
| Oxygen | 90 (69.2) | 39.5 (19.273.6) | 58 (64.4) | 44.2 (2477.6) | 61 (60.4) | 38.3 (1870.6) |
| Heart rate | 21 (16.2) | 4.5 (0.318.4) | 73 (81.1) | 21.8 (5.751.9) | 62 (61.4) | 18 (5.842.2) |
| Temperature | 101 (77.7) | 14.5 (4.545.3) | 61 (67.8) | 18.4 (2.842.8) | 62 (61.4) | 10.6 (0.834) |
Seventy children (21.0%) had 1 parameter abnormal at discharge, including abnormal respiratory rate in 13.7%, heart rate in 7.0%, and temperature in 3.3%. One child (0.3%) was discharged with supplemental oxygen. Ten children (3.0%) had 2 parameters abnormal at discharge. There was no difference in 7‐day readmissions for children with 1 parameter abnormal at discharge (1.4%) compared to those with no abnormal parameters at discharge (4.4%, P=0.253).
Combination TCS Measures
Within each age group, the percentage of children achieving stability was relatively consistent across the 4 combined TCS measures (Table 2); however, more children were considered unstable at discharge (and fewer classified as stable on admission) as the number of included parameters increased. More children 5 years of age reached stability (range, 80.0%85.6%) compared to children 5 years of age (range, 68.3%72.3%). We also noted increasing median TCS with increasing disease severity (Figure 1, P0.01) (see Supporting Fig. 1AC in the online version of this article); TCS was only slightly shorter than LOS across all 3 levels of the severity scale.
| TCS Measures | 2 Years, n=130 | 24 Years, n=90 | 517 Years, n=101 | P Value | |||
|---|---|---|---|---|---|---|---|
| No. (%)* | Median (IQR) TCS, h | No. (%) | Median (IQR) TCS, h | No. (%) | Median (IQR) TCS, h | ||
| |||||||
| RR+O2 | 108 (83.1) | 40.5 (20.175.0) | 72 (80.0) | 39.6 (15.679.2) | 69 (68.3) | 30.4 (14.759.2) | 0.08 |
| RR+O2+HR | 109 (83.8) | 40.2 (19.573.9) | 73 (81.1) | 35.9 (15.977.6) | 68 (67.3) | 29.8 (17.256.6) | 0.11 |
| RR+O2+T | 110 (84.6) | 40.5 (20.770.1) | 77 (85.6) | 39.1 (18.477.6) | 73 (72.3) | 28.2 (14.744.7) | 0.03 |
| RR+O2+HR+T | 110 (84.6) | 40.5 (20.770.1) | 72 (80.0) | 39.7 (20.177.5) | 71 (70.3) | 29.2 (18.254) | 0.05 |

DISCUSSION
Our study demonstrates that longitudinal TCS measures consisting of routinely collected physiologic parameters may be useful for objectively assessing disease recovery and clinical readiness for discharge among children hospitalized with pneumonia. A simple TCS measure incorporating respiratory rate and oxygen requirement performed similarly to the more complex combinations and classified fewer children as unstable at discharge. However, we also note several challenges that deserve additional study prior to the application of a pediatric TCS measure in clinical and research settings.
Vital signs and supplemental oxygen use are used clinically to assess disease severity and response to therapy among children with acute respiratory illness. Because these objective parameters are routinely collected among hospitalized children, the systematization of these data could inform clinical decision making around hospital discharge. Similar to early warning scores used to detect impending clinical deterioration,[11] TCS measures, by signaling normalization of stability parameters in a consistent and objective manner, could serve as an early signal of readiness for discharge. However, maximizing the clinical utility of TCS would require embedding the process within the electronic health record, a tool that could also have implications for the Centers for Medicare and Medicaid Services' meaningful use regulations.[12]
TCS could also serve as an outcome measure in research and quality efforts. Increased disease severity was associated with longer TCS for the 4 combined measures; TCS also demonstrated strong agreement with LOS. Furthermore, TCS minimizes the influence of factors unrelated to disease that may impact LOS (eg, frequency of hospital rounds, transportation difficulties, or social impediments to discharge), an advantage when studying outcomes for research and quality benchmarking.
The percentage of children reaching stability and the median TCS for the combined measures demonstrated little variation within each age group, likely because respiratory rate and need for supplemental oxygen, 2 of the parameters with the longest individual time to stability, were also included in each of the combination measures. This suggests that less‐complex measures incorporating only respiratory rate and need for supplemental oxygen may be sufficient to assess clinical stability, particularly because these parameters are objectively measured and possess a direct physiological link to pneumonia. In contrast, the other parameters may be more often influenced by factors unrelated to disease severity.
Our study also highlights several shortcomings of the pediatric TCS measures. Despite use of published, age‐based reference values,[13] we noted wide variation in the achievement of stability across individual parameters, especially for children 5 years old. Overall, 21% of children had 1 abnormal parameter at discharge. Even the simplest combined measure classified 13.4% of children as unstable at discharge. Discharge with unstable parameters was not associated with 7‐day readmission, although our study was underpowered to detect small differences. Additional study is therefore needed to evaluate less restrictive cutoff values on calculated TCS and the impact of hospital discharge prior to reaching stability. In particular, relaxing the upper limit for normal respiratory rate in adolescents (16 breaths per minute) to more closely approximate the adult TCS parameter (24 breaths per minute) should be explored. Refinement and standardization of age‐based vital sign reference values specific to hospitalized children may also improve the performance of these measures.[14]
Several limitations deserve discussion. TCS parameters and readmission data were abstracted retrospectively from a single institution, and our findings may not be generalizable. Although clinical staff routinely measured these data, measurement variation likely exists. Nevertheless, such variation is likely systematic, limiting the impact of potential misclassification. TCS was calculated based on the last abnormal value for each parameter; prior fluctuations between normal and abnormal periods of stability were not captured. We were unable to assess room air oxygen saturations. Instead, supplemental oxygen use served as a surrogate for hypoxia. At our institution, oxygen therapy is provided for children with pneumonia to maintain oxygen saturations of 90% to 92%. We did not assess work of breathing (a marker of severe pneumonia) or ability to eat (a component of adult TCS measures). We initially considered the evaluation of intravenous fluids as a proxy for ability to eat (addition of this parameter to the 4 parameter TCS resulted in a modest increase in median time to stability, data not shown); however, we felt the lack of institutional policy and subjective nature of this parameter detracted from our study's objectives. Finally, we were not able to determine clinical readiness for discharge beyond the measurement of vital sign parameters. Therefore, prospective evaluation of the proposed pediatric TCS measures in broader populations will be important to build upon our findings, refine stability parameters, and test the utility of new parameters (eg, ability to eat, work of breathing) prior to use in clinical settings.
Our study provides an initial evaluation of TCS measures for assessing severity and recovery among children hospitalized with pneumonia. Similar to adults, such validated TCS measures may ultimately prove useful for improving the quality of both clinical care and research, although additional study to more clearly define stability criteria is needed prior to implementation.
Disclosures
This work was supported by the National Institute of Allergy and Infectious Diseases of the National Institutes of Health under Award Number K23AI104779 to Dr. Williams. The EPIC study was supported by the Influenza Division in the National Center for Immunizations and Respiratory Diseases at the Centers for Disease Control and Prevention through cooperative agreements with each study site and was based on a competitive research funding opportunity. The findings and conclusions in this report are those of the authors and do not necessarily represent the views of the Centers for Disease Control and Prevention or the National Institutes of Health. Dr. Grijalva serves as a consultant to Glaxo‐Smith‐Kline and Pfizer outside of the scope of this article. Dr. Edwards is supported through grants from Novartis for the conduction of a Group B strep vaccine study and serves as the Chair of the Data Safety and Monitoring Data Committee for Influenza Study outside the scope of this article. Dr. Self reports grants from CareFusion, BioMerieux, Affinium Pharmaceuticals, Astute Medical, Crucell Holland BV, BRAHMS GmbH, Pfizer, Rapid Pathogen Screening, Venaxis, BioAegis Inc., Sphingotec GmbH, and Cempra Pharmaceuticals; personal fees from BioFire Diagnostics and Venaxis, Inc; and patent 13/632,874 (Sterile Blood Culture Collection System) pending; all outside the scope of this article.
- Healthcare Cost and Utilization Project. Available at: http://www.ahrq.gov/research/data/hcup/index.html. Accessed February 1, 2014.
- , , , et al. Time to clinical stability in patients hospitalized with community‐acquired pneumonia: implications for practice guidelines. JAMA. 1998;279:1452–1457.
- , , , et al.; Neumofail Group. Reaching stability in community‐acquired pneumonia: the effects of the severity of disease, treatment, and the characteristics of patients. Clin Infect Dis. 2004;39:1783–1790.
- , , , et al.; Community‐Acquired Pneumonia Organization. The pneumonia severity index predicts time to clinical stability in patients with community‐acquired pneumonia. Int J Tuberc Lung Dis. 2006;10:739–743.
- , , , , . Efficacy of corticosteroids in community‐acquired pneumonia: a randomized double‐blinded clinical trial. Am J Respir Crit Care Med. 2010;181:975–982.
- , , , et al. Early administration of antibiotics does not shorten time to clinical stability in patients with moderate‐to‐severe community‐acquired pneumonia. Chest 2003;124:1798–1804.
- , , , . A comparison between time to clinical stability in community‐acquired aspiration pneumonia and community‐acquired pneumonia. Intern Emerg Med. 2014;9:143–150.
- , , , et al.; Community‐Acquired Pneumonia Organization (CAPO) Investigators. A worldwide perspective of atypical pathogens in community‐acquired pneumonia. Am J Respir Crit Care Med. 2007;175:1086–1093.
- , , , et al.; CDC EPIC Study Team. Community‐acquired pneumonia requiring hospitalization among U.S. children. N Engl J Med. 2015;372:835–845.
- American Heart Association. 2005 American Heart Association (AHA) guidelines for cardiopulmonary resuscitation (CPR) and emergency cardiovascular care (ECC) of pediatric and neonatal patients: pediatric basic life support. Pediatrics. 2006;117:e989–e1004.
- , , . Development and initial validation of the Bedside Paediatric Early Warning System score. Crit Care. 2009;13:R135.
- Centers for Medicare and Medicaid Services. Regulations and guidance. EHR incentive programs. Available at: http://www.cms.gov/Regulations‐and‐Guidance/Legislation/EHRIncentivePrograms/index.html. Accessed February 20, 2015
- , , , , , . Development of heart and respiratory rate percentile curves for hospitalized children. Pediatrics. 2013;131:e1150–e1157.
- , , , et al. Length of stay after reaching clinical stability drives hospital costs associated with adult community‐acquired pneumonia. Scand J Infect Dis. 2013;45:219–226.
National guidelines for the management of childhood pneumonia highlight the need for the development of objective outcome measures to inform clinical decision making, establish benchmarks of care, and compare treatments and interventions.[1] Time to clinical stability (TCS) is a measure reported in adult pneumonia studies that incorporates vital signs, ability to eat, and mental status to objectively assess readiness for discharge.[2, 3, 4] TCS has not been validated among children as it has in adults,[5, 6, 7, 8] although such measures could prove useful for assessing discharge readiness with applications in both clinical and research settings. The objective of our study was to test the performance of pediatric TCS measures among children hospitalized with pneumonia.
METHODS
Study Population
We studied children hospitalized with community‐acquired pneumonia at Monroe Carell Jr. Children's Hospital at Vanderbilt between January 6, 2010 and May 9, 2011. Study children were enrolled as part of the Centers for Disease Control & Prevention (CDC) Etiology of Pneumonia in the Community (EPIC) study, a prospective, population‐based study of community‐acquired pneumonia hospitalizations. Detailed enrollment criteria for the EPIC study were reported previously.[9] Institutional review boards at Vanderbilt University and the CDC approved this study. Informed consent was obtained from enrolled families.
Data Elements and Study Definitions
Baseline data, including demographics, illness history, comorbidities, and clinical outcomes (eg, length of stay [LOS], intensive care admission), were systematically and prospectively collected. Additionally, data for 4 physiologic parameters, including temperature, heart rate, respiratory rate, and use of supplemental oxygen were obtained from the electronic medical record. These parameters were measured at least every 6 hours from admission through discharge as part of routine care. Readmissions within 7 calendar days of discharge were also obtained from the electronic medical record.
Stability for each parameter was defined as follows: normal temperature (36.037.9C), normal respiratory and heart rates in accordance with Pediatric Advanced Life Support age‐based values (see Supporting Table 1 in the online version of this article),[10] and no administration of supplemental oxygen. If the last recorded value for a given parameter was abnormal, that parameter was considered unstable at discharge. Otherwise, the time and date of the last abnormal value for each parameter was subtracted from admission time and date to determine TCS for that parameter in hours.
To determine overall stability, we evaluated 4 combination TCS measures, each incorporating 2 individual parameters. All combinations included respiratory rate and need for supplemental oxygen, as these parameters are the most explicit clinical indicators of pneumonia. Stability for each combination measure was defined as normalization of all included measures.
Clinical Outcomes for the Combined TCS Measures
The 4 combined TCS measures were compared against clinical outcomes including hospital LOS (measured in hours) and an ordinal severity scale. The ordinal scale categorized children into 3 mutually exclusive groups as follows: nonsevere (hospitalization without need for intensive care or empyema requiring drainage), severe (intensive care admission without invasive mechanical ventilation or vasopressor support and no empyema requiring drainage), and very severe (invasive mechanical ventilation, vasopressor support, or empyema requiring drainage).
Statistical Analysis
Categorical and continuous variables were summarized using frequencies and percentages and median and interquartile range (IQR) values, respectively. Analyses were stratified by age (2 years, 24 years, 517 years). We also plotted summary statistics for the combined measures and LOS, and computed the median absolute difference between these measures for each level of the ordinal severity scale. Analyses were conducted using Stata 13 (StataCorp, College Station, TX).
RESULTS
Study Population
Among 336 children enrolled in the EPIC study at Vanderbilt during the study period, 334 (99.4%) with complete data were included. Median age was 33 months (IQR, 1480). Median LOS was 56.4 hours (IQR, 41.591.7). There were 249 (74.5%) children classified as nonsevere, 39 (11.7) as severe, and 46 (13.8) as very severe (for age‐based characteristics see Supporting Table 2 in the online version of this article). Overall, 12 (3.6%) children were readmitted within 7 days of discharge.
Individual Stability Parameters
Overall, 323 (96.7%) children had 1 parameter abnormal on admission. Respiratory rate (81.4%) was the most common abnormal parameter, followed by abnormal temperature (71.4%), use of supplemental oxygen (63.8%), and abnormal heart rate (54.4%). Overall, use of supplemental oxygen had the longest TCS, followed by respiratory rate (Table 1). In comparison, heart rate and temperature stabilized relatively quickly.
| Parameter | 2 Years, n=130 | 24 Years, n=90 | 517 Years, n=101 | |||
|---|---|---|---|---|---|---|
| No. (%)* | Median (IQR) TCS, h | No. (%) | Median (IQR) TCS, h | No. (%) | Median (IQR) TCS, h | |
| ||||||
| Respiratory rate | 97 (74.6) | 38.6 (18.768.9) | 63 (70.0) | 31.6 (9.561.9) | 63 (62.4) | 24.3 (10.859.2) |
| Oxygen | 90 (69.2) | 39.5 (19.273.6) | 58 (64.4) | 44.2 (2477.6) | 61 (60.4) | 38.3 (1870.6) |
| Heart rate | 21 (16.2) | 4.5 (0.318.4) | 73 (81.1) | 21.8 (5.751.9) | 62 (61.4) | 18 (5.842.2) |
| Temperature | 101 (77.7) | 14.5 (4.545.3) | 61 (67.8) | 18.4 (2.842.8) | 62 (61.4) | 10.6 (0.834) |
Seventy children (21.0%) had 1 parameter abnormal at discharge, including abnormal respiratory rate in 13.7%, heart rate in 7.0%, and temperature in 3.3%. One child (0.3%) was discharged with supplemental oxygen. Ten children (3.0%) had 2 parameters abnormal at discharge. There was no difference in 7‐day readmissions for children with 1 parameter abnormal at discharge (1.4%) compared to those with no abnormal parameters at discharge (4.4%, P=0.253).
Combination TCS Measures
Within each age group, the percentage of children achieving stability was relatively consistent across the 4 combined TCS measures (Table 2); however, more children were considered unstable at discharge (and fewer classified as stable on admission) as the number of included parameters increased. More children 5 years of age reached stability (range, 80.0%85.6%) compared to children 5 years of age (range, 68.3%72.3%). We also noted increasing median TCS with increasing disease severity (Figure 1, P0.01) (see Supporting Fig. 1AC in the online version of this article); TCS was only slightly shorter than LOS across all 3 levels of the severity scale.
| TCS Measures | 2 Years, n=130 | 24 Years, n=90 | 517 Years, n=101 | P Value | |||
|---|---|---|---|---|---|---|---|
| No. (%)* | Median (IQR) TCS, h | No. (%) | Median (IQR) TCS, h | No. (%) | Median (IQR) TCS, h | ||
| |||||||
| RR+O2 | 108 (83.1) | 40.5 (20.175.0) | 72 (80.0) | 39.6 (15.679.2) | 69 (68.3) | 30.4 (14.759.2) | 0.08 |
| RR+O2+HR | 109 (83.8) | 40.2 (19.573.9) | 73 (81.1) | 35.9 (15.977.6) | 68 (67.3) | 29.8 (17.256.6) | 0.11 |
| RR+O2+T | 110 (84.6) | 40.5 (20.770.1) | 77 (85.6) | 39.1 (18.477.6) | 73 (72.3) | 28.2 (14.744.7) | 0.03 |
| RR+O2+HR+T | 110 (84.6) | 40.5 (20.770.1) | 72 (80.0) | 39.7 (20.177.5) | 71 (70.3) | 29.2 (18.254) | 0.05 |
DISCUSSION
Our study demonstrates that longitudinal TCS measures consisting of routinely collected physiologic parameters may be useful for objectively assessing disease recovery and clinical readiness for discharge among children hospitalized with pneumonia. A simple TCS measure incorporating respiratory rate and oxygen requirement performed similarly to the more complex combinations and classified fewer children as unstable at discharge. However, we also note several challenges that deserve additional study prior to the application of a pediatric TCS measure in clinical and research settings.
Vital signs and supplemental oxygen use are used clinically to assess disease severity and response to therapy among children with acute respiratory illness. Because these objective parameters are routinely collected among hospitalized children, the systematization of these data could inform clinical decision making around hospital discharge. Similar to early warning scores used to detect impending clinical deterioration,[11] TCS measures, by signaling normalization of stability parameters in a consistent and objective manner, could serve as an early signal of readiness for discharge. However, maximizing the clinical utility of TCS would require embedding the process within the electronic health record, a tool that could also have implications for the Centers for Medicare and Medicaid Services' meaningful use regulations.[12]
TCS could also serve as an outcome measure in research and quality efforts. Increased disease severity was associated with longer TCS for the 4 combined measures; TCS also demonstrated strong agreement with LOS. Furthermore, TCS minimizes the influence of factors unrelated to disease that may impact LOS (eg, frequency of hospital rounds, transportation difficulties, or social impediments to discharge), an advantage when studying outcomes for research and quality benchmarking.
The percentage of children reaching stability and the median TCS for the combined measures demonstrated little variation within each age group, likely because respiratory rate and need for supplemental oxygen, 2 of the parameters with the longest individual time to stability, were also included in each of the combination measures. This suggests that less‐complex measures incorporating only respiratory rate and need for supplemental oxygen may be sufficient to assess clinical stability, particularly because these parameters are objectively measured and possess a direct physiological link to pneumonia. In contrast, the other parameters may be more often influenced by factors unrelated to disease severity.
Our study also highlights several shortcomings of the pediatric TCS measures. Despite use of published, age‐based reference values,[13] we noted wide variation in the achievement of stability across individual parameters, especially for children 5 years old. Overall, 21% of children had 1 abnormal parameter at discharge. Even the simplest combined measure classified 13.4% of children as unstable at discharge. Discharge with unstable parameters was not associated with 7‐day readmission, although our study was underpowered to detect small differences. Additional study is therefore needed to evaluate less restrictive cutoff values on calculated TCS and the impact of hospital discharge prior to reaching stability. In particular, relaxing the upper limit for normal respiratory rate in adolescents (16 breaths per minute) to more closely approximate the adult TCS parameter (24 breaths per minute) should be explored. Refinement and standardization of age‐based vital sign reference values specific to hospitalized children may also improve the performance of these measures.[14]
Several limitations deserve discussion. TCS parameters and readmission data were abstracted retrospectively from a single institution, and our findings may not be generalizable. Although clinical staff routinely measured these data, measurement variation likely exists. Nevertheless, such variation is likely systematic, limiting the impact of potential misclassification. TCS was calculated based on the last abnormal value for each parameter; prior fluctuations between normal and abnormal periods of stability were not captured. We were unable to assess room air oxygen saturations. Instead, supplemental oxygen use served as a surrogate for hypoxia. At our institution, oxygen therapy is provided for children with pneumonia to maintain oxygen saturations of 90% to 92%. We did not assess work of breathing (a marker of severe pneumonia) or ability to eat (a component of adult TCS measures). We initially considered the evaluation of intravenous fluids as a proxy for ability to eat (addition of this parameter to the 4 parameter TCS resulted in a modest increase in median time to stability, data not shown); however, we felt the lack of institutional policy and subjective nature of this parameter detracted from our study's objectives. Finally, we were not able to determine clinical readiness for discharge beyond the measurement of vital sign parameters. Therefore, prospective evaluation of the proposed pediatric TCS measures in broader populations will be important to build upon our findings, refine stability parameters, and test the utility of new parameters (eg, ability to eat, work of breathing) prior to use in clinical settings.
Our study provides an initial evaluation of TCS measures for assessing severity and recovery among children hospitalized with pneumonia. Similar to adults, such validated TCS measures may ultimately prove useful for improving the quality of both clinical care and research, although additional study to more clearly define stability criteria is needed prior to implementation.
Disclosures
This work was supported by the National Institute of Allergy and Infectious Diseases of the National Institutes of Health under Award Number K23AI104779 to Dr. Williams. The EPIC study was supported by the Influenza Division in the National Center for Immunizations and Respiratory Diseases at the Centers for Disease Control and Prevention through cooperative agreements with each study site and was based on a competitive research funding opportunity. The findings and conclusions in this report are those of the authors and do not necessarily represent the views of the Centers for Disease Control and Prevention or the National Institutes of Health. Dr. Grijalva serves as a consultant to Glaxo‐Smith‐Kline and Pfizer outside of the scope of this article. Dr. Edwards is supported through grants from Novartis for the conduction of a Group B strep vaccine study and serves as the Chair of the Data Safety and Monitoring Data Committee for Influenza Study outside the scope of this article. Dr. Self reports grants from CareFusion, BioMerieux, Affinium Pharmaceuticals, Astute Medical, Crucell Holland BV, BRAHMS GmbH, Pfizer, Rapid Pathogen Screening, Venaxis, BioAegis Inc., Sphingotec GmbH, and Cempra Pharmaceuticals; personal fees from BioFire Diagnostics and Venaxis, Inc; and patent 13/632,874 (Sterile Blood Culture Collection System) pending; all outside the scope of this article.
- Healthcare Cost and Utilization Project. Available at: http://www.ahrq.gov/research/data/hcup/index.html. Accessed February 1, 2014.
- , , , et al. Time to clinical stability in patients hospitalized with community‐acquired pneumonia: implications for practice guidelines. JAMA. 1998;279:1452–1457.
- , , , et al.; Neumofail Group. Reaching stability in community‐acquired pneumonia: the effects of the severity of disease, treatment, and the characteristics of patients. Clin Infect Dis. 2004;39:1783–1790.
- , , , et al.; Community‐Acquired Pneumonia Organization. The pneumonia severity index predicts time to clinical stability in patients with community‐acquired pneumonia. Int J Tuberc Lung Dis. 2006;10:739–743.
- , , , , . Efficacy of corticosteroids in community‐acquired pneumonia: a randomized double‐blinded clinical trial. Am J Respir Crit Care Med. 2010;181:975–982.
- , , , et al. Early administration of antibiotics does not shorten time to clinical stability in patients with moderate‐to‐severe community‐acquired pneumonia. Chest 2003;124:1798–1804.
- , , , . A comparison between time to clinical stability in community‐acquired aspiration pneumonia and community‐acquired pneumonia. Intern Emerg Med. 2014;9:143–150.
- , , , et al.; Community‐Acquired Pneumonia Organization (CAPO) Investigators. A worldwide perspective of atypical pathogens in community‐acquired pneumonia. Am J Respir Crit Care Med. 2007;175:1086–1093.
- , , , et al.; CDC EPIC Study Team. Community‐acquired pneumonia requiring hospitalization among U.S. children. N Engl J Med. 2015;372:835–845.
- American Heart Association. 2005 American Heart Association (AHA) guidelines for cardiopulmonary resuscitation (CPR) and emergency cardiovascular care (ECC) of pediatric and neonatal patients: pediatric basic life support. Pediatrics. 2006;117:e989–e1004.
- , , . Development and initial validation of the Bedside Paediatric Early Warning System score. Crit Care. 2009;13:R135.
- Centers for Medicare and Medicaid Services. Regulations and guidance. EHR incentive programs. Available at: http://www.cms.gov/Regulations‐and‐Guidance/Legislation/EHRIncentivePrograms/index.html. Accessed February 20, 2015
- , , , , , . Development of heart and respiratory rate percentile curves for hospitalized children. Pediatrics. 2013;131:e1150–e1157.
- , , , et al. Length of stay after reaching clinical stability drives hospital costs associated with adult community‐acquired pneumonia. Scand J Infect Dis. 2013;45:219–226.
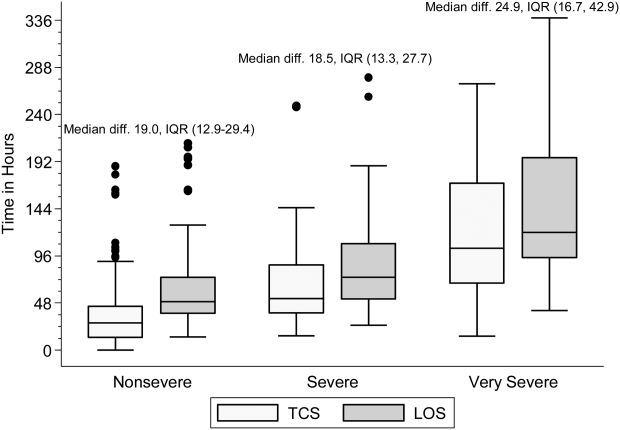
Inpatient Ambulation
A number of observational studies have documented the association between prolonged bed rest during hospitalization with adverse short‐ and long‐term functional impairments and disability in older patients.[1, 2, 3, 4] However, the body of evidence on the benefits of early mobilization on functional outcomes in both critically ill patients and more stable patients on medical‐surgical floors remains inconclusive.[5, 6, 7, 8, 9] Despite the increased emphasis on mobilizing patients early and often in the inpatient setting, there is surprisingly little information available regarding how typically active adult patients are during their hospital stay. The few published studies that are available are limited by small samples and types of patients who were monitored.[10, 11, 12, 13, 14] Therefore, the purpose of this real‐world study was to describe the level of ambulation in a large sample of hospitalized adult patients using a validated consumer‐grade wireless accelerometer.
METHODS
This was a prospective cohort study of ambulatory patients from 3 medical‐surgical units of a community hospital from March 2014 through July 2014. The study was approved by the Kaiser Permanente Southern California Institutional Review Board. All ambulatory medical and surgical adult patients were eligible for the study except for those with isolation precautions. Patients wore an accelerometer (Tractivity; Kineteks Corp., Vancouver, BC, Canada) on the ankle from soon after admission to the unit until discharge home. The sensors were only removed for bathing and medical procedures, at which time the devices were secured to the patient's bed and reworn upon their return to the room. The nursing staff was trained to use the vendor application to register the sensor to the patient, secure the sensor to the patient's ankle, transfer the sensor data to the vendor server, review the step counts on the web application, and manually key the step count into the electronic medical records (EMRs) as part of routine nursing workflow. The staff otherwise continued with usual patient mobilization practices.
We previously validated the Tractivity device in a field study of 20 hospitalized patients using a research‐grade accelerometer, Stepwatch, as the gold standard (unpublished data). We found that the inter‐Tractivity device reliability was near perfect (intraclass correlation=0.99), and that the Tractivity step counts correlated highly with the nurses' documentation on a paper log of distance walked measured in feet (r=0.76). A small number of steps (100) were recorded over 24 hours when the device was worn by 2 bed bound patients. The 24‐hour Tractivity step count had acceptable limits of agreement with the Stepwatch (+284 [standard deviation: 314] steps; 95% limits of agreement 911‐343). In addition, for the current study, when we examined the step counts between patients who were classified by the nursing team as being able to walk 50 feet (n=320) compared to patients who were able to walk >50 feet (n=434), we found a significant difference in the median number of steps over a 24‐hour period (854 vs 1697, P0.0001).
The step count data were exported from the vendor's server, examined for irregularities, and merged with administrative and clinical data for analysis. Data extracted from the EMR system included sociodemographic (age, gender, marital status, and race/ethnicity) and clinical characteristics (LACE score [readmission risk score based on length of stay (L); acuity of the admission (A); comorbidity of the patient (measured with the Charlson comorbidity index score) (C); and emergency department use (measured as the number of visits in the six months before admission) (E),[15] Charlson Comorbidity Index, length of stay, principal discharge diagnosis, and body mass index), and nursing documentation of functional status (bed bound, sit up in bed, stand next to bed, walk 50 feet, and walk >50 feet).
Descriptive statistics and nonparametric tests (Kruskal‐Wallis and Wilcoxon signed rank) were used to analyze the non‐normally distributed step count data. Quantile regression[16] was used to determine the association between the frequency of the care team's review and documentation of steps, with median total step count adjusting for age, gender, LACE score, and medicine/surgical service line. Whereas linear regression allows one to describe how the mean of a given outcome changes with respect to some set of covariates in circumstances where data are normally distributed, quantile regression allows one to assess how a set of covariates are related to a prespecified quantile (eg, 50% percentile median) of an outcome distribution. This modeling is especially appropriate here, because step count data are not normally distributed. Because step counts can vary with a number of factors, such as age and principal admitting and discharge diagnoses, we stratified our analyses by age (65 or 65 years) and service lines (medical or surgical) due to the relatively small numbers of patients in each of the diagnostic groupings. Statistical analyses were performed using SAS version 9.3 (SAS Institute Inc., Cary, NC); P values 0.05 were considered statistically significant.
RESULTS
A total of 1667 patients wore the activity sensor during their hospital stay. We included 777 patients in our analysis who had lengths of stay long enough for 24 hours of continuous monitoring, and almost half of these patients had at least 48 hours of monitoring (n=378). The demographic and clinical characteristics of the sample are detailed in Table 1. The sample included mostly medical patients (77%), with a mean age of 6017 years, 57% females, and 55% nonwhites. Nearly all patients (97%) were classified as ambulatory at discharge based on the EMR data. Approximately 44% of the sensors were lost, mostly due to nursing staff forgetting to remove the devices at discharge; device failure was minimal (n=10).
| Variables | Value |
|---|---|
| |
| Sociodemographics | |
| Age | |
| 1840 years | 111 (15%) |
| 4165 years | 325 (42%) |
| 6575 years | 187 (24%) |
| 75 years | 151 (19%) |
| Females | 444 (57%) |
| Race/ethnicity | |
| White | 349 (45%) |
| Hispanics | 277 (35%) |
| African American | 101 (13%) |
| Asian/Pacific Islander | 37 (5%) |
| Other | 13 (2%) |
| Marital status | |
| Partnered | 435 (56%) |
| Unpartnered | 332 (43%) |
| Other/unknown | 10 (1%) |
| Clinical characteristics | |
| Medical (principal discharge diagnoses) | |
| Cardiovascular | 116 (15%) |
| Respiratory | 84 (11%) |
| Gastrointestinal | 122 (16%) |
| Genitourinary | 31 (4%) |
| Metabolic/electrolytes | 26 (3%) |
| Septicemia | 92 (12%) |
| Nervous system | 21 (3%) |
| Cancer/malignancies | 13 (1%) |
| Other* | 103 (13%) |
| Surgical | |
| Orthopedic surgery | 60 (8%) |
| Other surgeries | 109 (14%) |
| LACE score | 9.33.5 |
| Charlson index | |
| 01 | 665 (85%) |
| 23 | 98 (13%) |
| 4+ | 14 (2%) |
| Length of stay, d | 3.983.80 |
| Body mass index | 30.27.5 |
| Functional status | |
| Preadmission level of function | |
| 1, bed bound | 3 (0.5%) |
| 2, able to sit | 6 (1%) |
| 3, stand next to bed | 3 (0.5%) |
| 4, walk 50 feet | 113 (14%) |
| 5, walk >50 feet | 651 (84%) |
| Missing | 1 (0%) |
| Current level of function | |
| 1, bed bound | 1 (0%) |
| 2, able to sit | 6 (1%) |
| 3, stand next to bed | 7 (1%) |
| 4, walk 50 feet | 320 (41%) |
| 5, walk >50 feet | 434 (56%) |
| Missing | 9 (1%) |
Patients accrued a median of 1158 (interquartile range: 6362238) steps over the 24 hours prior to discharge to home (Table 2). Approximately 13 (2%) patients registered zero steps in the last 24 hours; this may have been due to patients truly not accruing any steps, device failure, or the device was registered but never worn by the patient. Patients who were 65 years and older on both the medicine and surgical services accrued fewer steps compared to younger patients (962 vs 1294, P0.0001). For patients who had at least 48 hours of continuous monitoring (n=378), there was a median increase of 377 steps from the first 24 hours from admission to the unit to the final 24 hours prior to discharge (811 steps to 1188 steps, P0.0001) (Table 3 and Figure 1). The average length of stay for these patients was 5.74.9 days. Despite the longer length of stay, the level of ambulation at discharge was similar to patients with shorter stays. This is further illustrated in Figure 2 in the spaghetti plots of total steps over 4, 24‐hour monitoring increments. Ignoring the outliers, the plots suggest the following: (1) step counts tended to increase or stay about the same over the course of a hospitalization; and (2) for the medicine service line, step counts in the final 24 hours prior to discharge for patients with longer lengths of stay (72 or 96 hours) did not appear to be substantially different from patients with shorter lengths of stay. The data for the surgical patients are either too sparse or erratic to make any firm conclusions. Patients accrued steps throughout the day with the highest percentage of steps logged at approximately 6 am and 6 pm; these data are based on time stamps from the device, not the time of data transfer or documentation in the EMR (Figure 3).
| Service | Total Steps Last 24 Hours | ||
|---|---|---|---|
| Mean | SD | Median | |
| |||
| Medicine | |||
| 65 years old (n=321) | 1,972 | 1,995 | 1,284 |
| 65 years old (n=287) | 1,367 | 1,396 | 968 |
| Surgical | |||
| 65 years old (n=118) | 2,238 | 2,082 | 1,378 |
| 65 years old (n=51) | 1,485 | 1,647 | 890 |
| Total (n=777) | 1,757 | 1,818 | 1,158 |
| Service | Total Steps | |||||
|---|---|---|---|---|---|---|
| First 24 Hours | Last 24 Hours | |||||
| Mean | SD | Median | Mean | SD | Median | |
| ||||||
| Medicine | ||||||
| 65 years old (n=168) | 1,427 | 1,690 | 953 | 2,005 | 2,006 | 1,287 |
| 65 years old (n=127) | 1,004 | 1,098 | 676 | 1,260 | 1,291 | 904 |
| Surgical | ||||||
| 65 years old (n=53) | 1,722 | 1,696 | 1060 | 2,553 | 2,142 | 1,882 |
| 65 years old (n=30) | 1,184 | 1,470 | 704 | 1,829 | 1,996 | 1,053 |
| Total (n=378) | 1,307 | 1,515 | 811 | 1,817 | 1,864 | 1,188 |
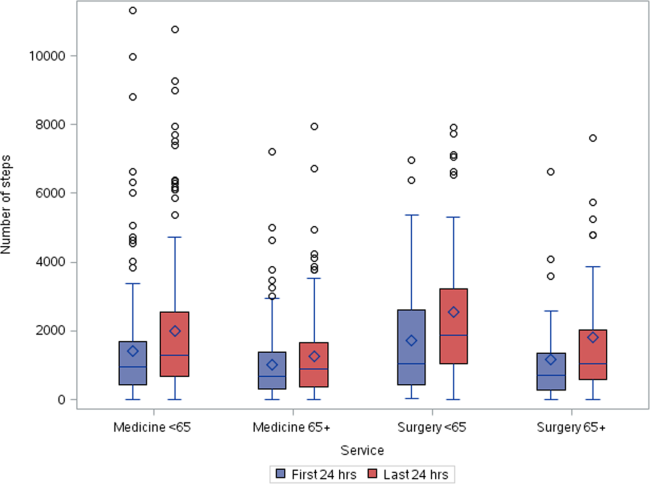

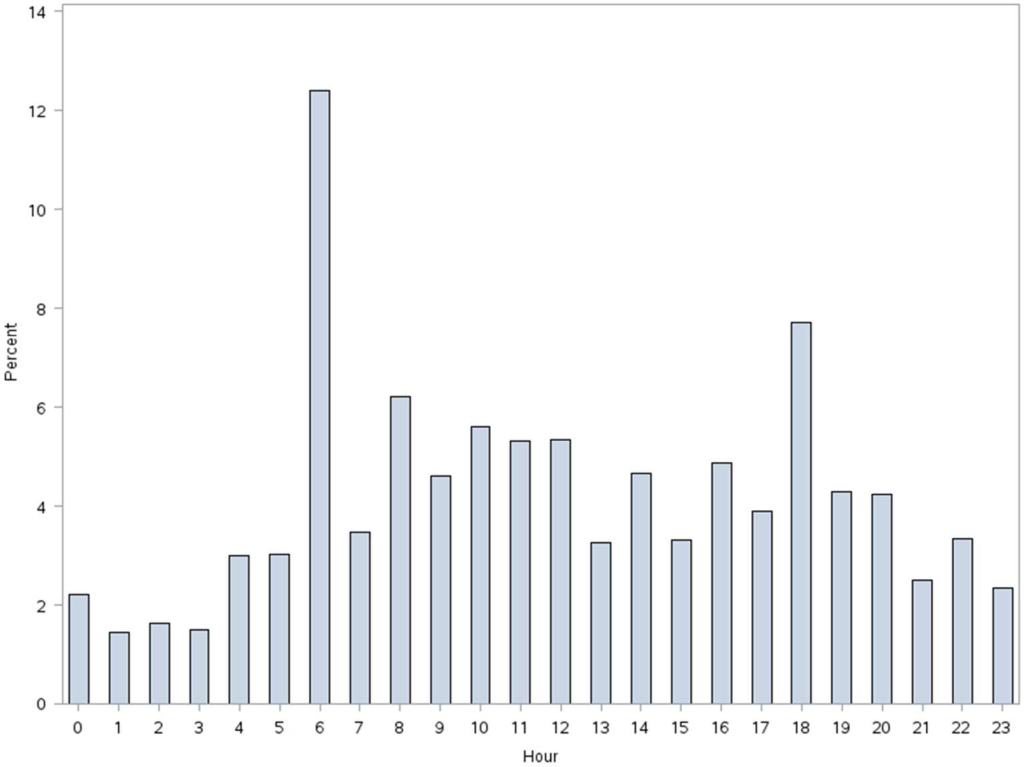
More frequent documentation of step counts in the EMR (proxy for step count data retrieval and review from the vendor web site) by the care team was associated with higher total step counts after adjustments for relevant covariates (P0.001); 3 or more documentations over a 24‐hour period appears to be a minimal frequency to achieving approximately 200 steps more than the median value (Table 4).
| Service | Frequency of Documentation of Step Counts in EMR Over 24 Hours | P Value Trenda | Adjusted P Valueb | |||||
|---|---|---|---|---|---|---|---|---|
| 0 | 1 | 2 | 3 | 4 | ||||
| ||||||||
| Medicine | ||||||||
| 65 years old (n=321) | MeanSD | 1,4051,414 | 2,4152,037 | 2,0101,929 | 1,9811,907 | 2,7412,876 | ||
| Median | 1,056 | 1,514 | 1284 | 1,196 | 1,702 | 0.004 | 0.003 | |
| N (%) | 83 (26%) | 109 (34%) | 71 (22%) | 25 (8%) | 33 (10%) | |||
| 65 years old (n=287) | MeanSD | 1,3481,711 | 1,1991428 | 1,290951 | 1,5291,180 | 1,8781,214 | ||
| Median | 850 | 773 | 999 | 1,278 | 1,498 | 0.07 | 0.10 | |
| N (%) | 85 (30%) | 82 (28%) | 66 (23%) | 20 (7%) | 34 (12%) | |||
| Surgical | ||||||||
| 65 years old (n=118) | MeanSD | 2,0772,001 | 1,8591,598 | 2,6182,536 | 2,3122,031 | 3,8022,979 | ||
| Median | 1,361 | 1,250 | 1,181 | 1,719 | 3,149 | 0.06 | 0.05 | |
| N (%) | 42 (35%) | 36 (31%) | 18 (15%) | 14 (12%) | 8 (7%) | |||
| 65 years old (n=51) | MeanSD | 2,0032,254 | 1,4781,603 | 1,1651,246 | 478 | 1,219469 | ||
| Median | 1,028 | 820 | 672 | 478 | 1,426 | 0.20 | 0.15 | |
| N (%) | 13 (26%) | 19 (37%) | 15 (29%) | 1 (2%) | 3 (6%) | |||
| Total (n=777) | MeanSD | 1,5441,717 | 1,7361,799 | 1,7201,699 | 1,8831720 | 2,4152,304 | ||
| Median | 1,012 | 1,116 | 1,124 | 1,314 | 1,557 | 0.001 | 0.001 | |
| N (%) | 223 (29%) | 246 (31%) | 170 (22%) | 60 (8%) | 78 (10%) | |||
DISCUSSION
We found that ambulatory medical‐surgical patients accrued a median of 1158 total steps in the 24 hours prior to their discharge home, which translates to walking approximately 500 meters; older patients accrued fewer steps compared to younger patients. In patients with longer length of stay, the level of ambulation at discharge was similar to patients with shorter stays, suggesting there may be an ambulation threshold (1100 steps) that patients achieve regardless of the length of stay before they are discharged home. In addition, patients whose care team reviewed and documented step counts at least 3 times over a 24‐hour period accrued significantly more steps than patients whose care team made fewer documentations.
The median step counts accrued by surgical patients in our study are similar to that found in Cook and colleagues'[14] report of patients after elective cardiac surgery using another popular consumer‐grade accelerometer. The providers in that study also had access to the data via a dashboard, but it was not clear how this information was used. Brown et al.[12] conducted the first study to objectively monitor mobility using 2 accelerometers in 45 older male veterans who had no prior mobility impairment, and found that patients spent 83% of their hospitalization lying in bed. The veterans spent about 3% of the time (43 minutes per day) standing or walking over a mean length of stay of 5 days. In a similar study with 43 older Dutch patients who had an average length of stay of 7 days, Pedersen et al.[10] found that patients spent 71% of their time lying, 21% sitting, and 4% standing or walking. Unfortunately, neither the Brown et al. nor Pedersen et al. studies were able to distinguish between standing and ambulatory activities. In a more recent study of 47 patients on medical‐surgical units at 2 hospitals that relied on time and motion observation methods, the mean duration for ambulation was 2 minutes during an 8‐hour period.[13]
We took advantage of the variability in the nursing documentation of step counts in the EMR to determine if there was a dose‐response relationship between the frequency of nursing documentation in a 24‐hour period and number of steps patients accrued. We hypothesized that if nurses make an effort to retrieve data from the vendor website and manually key in the step counts in the EMR, they are more likely to incorporate this information in their nursing care, share the information with patients and other clinicians, and therefore create a positive feedback loop for greater ambulation. Although our findings suggest a positive association between more frequent documentation and increased step counts, we cannot exclude the possibility that nurses naturally modulate the frequency with which they review and document step counts based on their overall judgment of the patients' mobility status (ie, patients who are more functionally impaired are assumed to accrue fewer steps over a shift, and therefore, nurses are less inclined to retrieve and document the information frequently). Future studies could prospectively examine what the optimal frequency for review and feedback of step counts is during a typical 8‐ or 12‐hour nursing shift for both patients and the nursing care team to promote ambulation.
A major strength of our study is the collection of objective ambulation data on a large inpatient sample by clinical staff as part of routine nursing care. This strength is balanced with several limitations. Due to the temporal pattern associated with ambulation, we were only able to analyze data for patients who had at least 24 hours of continuous monitoring. This could affect the generalizability of our findings, though we believe there is limited pragmatic value in closely tracking ambulation in patients who have such short stays. There was substantial variability in the step counts, reflecting the mix of medical versus surgical patients and their age, with very small samples available for meaningful subgroup analyses other than what we have presented. We were not able to measure other dimensions of mobility such as transfers or sitting in a chair, because the sensor is designed to only measure steps. In addition, we lost a large number of devices, mostly due to staff forgetting to remove the devices from patients' ankles at discharge. Finally, because we did not blind the nurses and patients to the step count data, the preliminary normative step counts that we present in this article may be higher than expected in patients cared for on medical‐surgical units.
In summary, we found that it is possible to measure ambulation objectively and reliably in hospitalized patients, and have provided preliminary normative step counts for a representative but heterogeneous medical‐surgical population. We also found that most patients who were discharged were ambulating at least 1100 steps over the 24 hours prior to leaving the hospital, regardless of their length of stay. This might suggest that step counts could be a useful parameter in determining readiness for hospital discharge. Our data also suggest that more frequent, objective monitoring of step counts by the nursing care team was associated with patients ambulating more. Both of these findings deserve further exploration. Future studies will need to be conducted on larger samples of medical and surgical hospitalized patients to adequately establish more refined step count norms for specific clinical populations, but especially for older patients, because this age group is at a particularly higher risk of poor functional outcomes with hospitalization. Having accurate and reliable information on ambulation is fundamental to any effort to improve ambulation in hospitalized patients. Moreover, knowing the normative range for step counts in the last 24 hours prior to discharge across specific clinical and age subgroups, could assist with discharge planning and provision of appropriate rehabilitative services in the home or community for safe transitions out of the hospital.[17]
Acknowledgements
The authors express their gratitude to the patients and nurses at the Kaiser Permanente Southern California, Ontario Medical Center.
Disclosures: Funded by the Kaiser Permanente Southern California Care Improvement Research Team. Dr. Sallis contributed substantially to the study design, interpretation, and preparation of this article. Ms. Sturm and Chijioke contributed to the interpretation and preparation of this article. Dr. Kanter contributed to study design, interpretation, and preparation of this article. Mr. Huang contributed to the analysis, interpretation, and preparation of this article. Dr. Shen contributed to study design, analysis, interpretation, and preparation of this article. Dr. Nguyen had full access to the data and led the design, analysis, interpretation, and preparation of this article. Dr. Nguyen had full access to the data and will vouch for the integrity of the work as a whole, from inception to published article. The authors have no funding, financial relationships, or conflicts of interest to disclose.
- , , . Prevalence and outcomes of low mobility in hospitalized older patients. J Am Geriatr Soc. 2004;52(8):1263–1270.
- , , , , , . Low mobility during hospitalization and functional decline in older adults. J Am Geriatr Soc. 2011;59(2):266–273.
- , , , , . The natural history of functional morbidity in hospitalized older patients. J Am Geriatr Soc. 1990;38(12):1296–1303.
- , , , , . Early ambulation and length of stay in older adults hospitalized for acute illness. Arch Intern Med. 2010;170(21):1942–1943.
- , . Early mobilization in the intensive care unit: a systematic review. Cardiopulm Phys Ther J. 2012;23(1):5–13.
- , , . Outcomes of inpatient mobilization: a literature review. J Clin Nurs. 2014;23(11–12):1486–1501.
- , , , et al. An early rehabilitation intervention to enhance recovery during hospital admission for an exacerbation of chronic respiratory disease: randomised controlled trial. BMJ. 2014;349:g4315.
- , , , , . Additional exercise does not change hospital or patient outcomes in older medical patients: a controlled clinical trial. Aust J Physiother. 2007;53(2):105–111.
- , , . Exercise for acutely hospitalised older medical patients. Cochrane Database Syst Rev. 2007;(1):CD005955.
- , , , et al. Twenty‐four‐hour mobility during acute hospitalization in older medical patients. J Gerontol A Biol Sci Med Sci. 2013;68(3):331–337.
- , , , , , . Mobility activity and its value as a prognostic indicator of survival in hospitalized older adults. J Am Geriatr Soc. 2013;61(4):551–557.
- , , , . The underrecognized epidemic of low mobility during hospitalization of older adults. J Am Geriatr Soc. 2009;57(9):1660–1665.
- , , , , . Frequency and duration of nursing care related to older patient mobility. J Nurs Scholarsh. 2014;46(1):20–27.
- , , , , . Functional recovery in the elderly after major surgery: assessment of mobility recovery using wireless technology. Ann Thorac Surg. 2013;96(3):1057–1061.
- , , , et al. Derivation and validation of an index to predict early death or unplanned readmission after discharge from hospital to the community. CMAJ. 2010;182(6):551–557.
- , . Quantile regression: an introduction. J Econ Perspect. 2001;15(4):43–56.
- . Post‐hospital syndrome—an acquired, transient condition of generalized risk. N Engl J Med. 2013;368(2):100–102.
A number of observational studies have documented the association between prolonged bed rest during hospitalization with adverse short‐ and long‐term functional impairments and disability in older patients.[1, 2, 3, 4] However, the body of evidence on the benefits of early mobilization on functional outcomes in both critically ill patients and more stable patients on medical‐surgical floors remains inconclusive.[5, 6, 7, 8, 9] Despite the increased emphasis on mobilizing patients early and often in the inpatient setting, there is surprisingly little information available regarding how typically active adult patients are during their hospital stay. The few published studies that are available are limited by small samples and types of patients who were monitored.[10, 11, 12, 13, 14] Therefore, the purpose of this real‐world study was to describe the level of ambulation in a large sample of hospitalized adult patients using a validated consumer‐grade wireless accelerometer.
METHODS
This was a prospective cohort study of ambulatory patients from 3 medical‐surgical units of a community hospital from March 2014 through July 2014. The study was approved by the Kaiser Permanente Southern California Institutional Review Board. All ambulatory medical and surgical adult patients were eligible for the study except for those with isolation precautions. Patients wore an accelerometer (Tractivity; Kineteks Corp., Vancouver, BC, Canada) on the ankle from soon after admission to the unit until discharge home. The sensors were only removed for bathing and medical procedures, at which time the devices were secured to the patient's bed and reworn upon their return to the room. The nursing staff was trained to use the vendor application to register the sensor to the patient, secure the sensor to the patient's ankle, transfer the sensor data to the vendor server, review the step counts on the web application, and manually key the step count into the electronic medical records (EMRs) as part of routine nursing workflow. The staff otherwise continued with usual patient mobilization practices.
We previously validated the Tractivity device in a field study of 20 hospitalized patients using a research‐grade accelerometer, Stepwatch, as the gold standard (unpublished data). We found that the inter‐Tractivity device reliability was near perfect (intraclass correlation=0.99), and that the Tractivity step counts correlated highly with the nurses' documentation on a paper log of distance walked measured in feet (r=0.76). A small number of steps (100) were recorded over 24 hours when the device was worn by 2 bed bound patients. The 24‐hour Tractivity step count had acceptable limits of agreement with the Stepwatch (+284 [standard deviation: 314] steps; 95% limits of agreement 911‐343). In addition, for the current study, when we examined the step counts between patients who were classified by the nursing team as being able to walk 50 feet (n=320) compared to patients who were able to walk >50 feet (n=434), we found a significant difference in the median number of steps over a 24‐hour period (854 vs 1697, P0.0001).
The step count data were exported from the vendor's server, examined for irregularities, and merged with administrative and clinical data for analysis. Data extracted from the EMR system included sociodemographic (age, gender, marital status, and race/ethnicity) and clinical characteristics (LACE score [readmission risk score based on length of stay (L); acuity of the admission (A); comorbidity of the patient (measured with the Charlson comorbidity index score) (C); and emergency department use (measured as the number of visits in the six months before admission) (E),[15] Charlson Comorbidity Index, length of stay, principal discharge diagnosis, and body mass index), and nursing documentation of functional status (bed bound, sit up in bed, stand next to bed, walk 50 feet, and walk >50 feet).
Descriptive statistics and nonparametric tests (Kruskal‐Wallis and Wilcoxon signed rank) were used to analyze the non‐normally distributed step count data. Quantile regression[16] was used to determine the association between the frequency of the care team's review and documentation of steps, with median total step count adjusting for age, gender, LACE score, and medicine/surgical service line. Whereas linear regression allows one to describe how the mean of a given outcome changes with respect to some set of covariates in circumstances where data are normally distributed, quantile regression allows one to assess how a set of covariates are related to a prespecified quantile (eg, 50% percentile median) of an outcome distribution. This modeling is especially appropriate here, because step count data are not normally distributed. Because step counts can vary with a number of factors, such as age and principal admitting and discharge diagnoses, we stratified our analyses by age (65 or 65 years) and service lines (medical or surgical) due to the relatively small numbers of patients in each of the diagnostic groupings. Statistical analyses were performed using SAS version 9.3 (SAS Institute Inc., Cary, NC); P values 0.05 were considered statistically significant.
RESULTS
A total of 1667 patients wore the activity sensor during their hospital stay. We included 777 patients in our analysis who had lengths of stay long enough for 24 hours of continuous monitoring, and almost half of these patients had at least 48 hours of monitoring (n=378). The demographic and clinical characteristics of the sample are detailed in Table 1. The sample included mostly medical patients (77%), with a mean age of 6017 years, 57% females, and 55% nonwhites. Nearly all patients (97%) were classified as ambulatory at discharge based on the EMR data. Approximately 44% of the sensors were lost, mostly due to nursing staff forgetting to remove the devices at discharge; device failure was minimal (n=10).
| Variables | Value |
|---|---|
| |
| Sociodemographics | |
| Age | |
| 1840 years | 111 (15%) |
| 4165 years | 325 (42%) |
| 6575 years | 187 (24%) |
| 75 years | 151 (19%) |
| Females | 444 (57%) |
| Race/ethnicity | |
| White | 349 (45%) |
| Hispanics | 277 (35%) |
| African American | 101 (13%) |
| Asian/Pacific Islander | 37 (5%) |
| Other | 13 (2%) |
| Marital status | |
| Partnered | 435 (56%) |
| Unpartnered | 332 (43%) |
| Other/unknown | 10 (1%) |
| Clinical characteristics | |
| Medical (principal discharge diagnoses) | |
| Cardiovascular | 116 (15%) |
| Respiratory | 84 (11%) |
| Gastrointestinal | 122 (16%) |
| Genitourinary | 31 (4%) |
| Metabolic/electrolytes | 26 (3%) |
| Septicemia | 92 (12%) |
| Nervous system | 21 (3%) |
| Cancer/malignancies | 13 (1%) |
| Other* | 103 (13%) |
| Surgical | |
| Orthopedic surgery | 60 (8%) |
| Other surgeries | 109 (14%) |
| LACE score | 9.33.5 |
| Charlson index | |
| 01 | 665 (85%) |
| 23 | 98 (13%) |
| 4+ | 14 (2%) |
| Length of stay, d | 3.983.80 |
| Body mass index | 30.27.5 |
| Functional status | |
| Preadmission level of function | |
| 1, bed bound | 3 (0.5%) |
| 2, able to sit | 6 (1%) |
| 3, stand next to bed | 3 (0.5%) |
| 4, walk 50 feet | 113 (14%) |
| 5, walk >50 feet | 651 (84%) |
| Missing | 1 (0%) |
| Current level of function | |
| 1, bed bound | 1 (0%) |
| 2, able to sit | 6 (1%) |
| 3, stand next to bed | 7 (1%) |
| 4, walk 50 feet | 320 (41%) |
| 5, walk >50 feet | 434 (56%) |
| Missing | 9 (1%) |
Patients accrued a median of 1158 (interquartile range: 6362238) steps over the 24 hours prior to discharge to home (Table 2). Approximately 13 (2%) patients registered zero steps in the last 24 hours; this may have been due to patients truly not accruing any steps, device failure, or the device was registered but never worn by the patient. Patients who were 65 years and older on both the medicine and surgical services accrued fewer steps compared to younger patients (962 vs 1294, P0.0001). For patients who had at least 48 hours of continuous monitoring (n=378), there was a median increase of 377 steps from the first 24 hours from admission to the unit to the final 24 hours prior to discharge (811 steps to 1188 steps, P0.0001) (Table 3 and Figure 1). The average length of stay for these patients was 5.74.9 days. Despite the longer length of stay, the level of ambulation at discharge was similar to patients with shorter stays. This is further illustrated in Figure 2 in the spaghetti plots of total steps over 4, 24‐hour monitoring increments. Ignoring the outliers, the plots suggest the following: (1) step counts tended to increase or stay about the same over the course of a hospitalization; and (2) for the medicine service line, step counts in the final 24 hours prior to discharge for patients with longer lengths of stay (72 or 96 hours) did not appear to be substantially different from patients with shorter lengths of stay. The data for the surgical patients are either too sparse or erratic to make any firm conclusions. Patients accrued steps throughout the day with the highest percentage of steps logged at approximately 6 am and 6 pm; these data are based on time stamps from the device, not the time of data transfer or documentation in the EMR (Figure 3).
| Service | Total Steps Last 24 Hours | ||
|---|---|---|---|
| Mean | SD | Median | |
| |||
| Medicine | |||
| 65 years old (n=321) | 1,972 | 1,995 | 1,284 |
| 65 years old (n=287) | 1,367 | 1,396 | 968 |
| Surgical | |||
| 65 years old (n=118) | 2,238 | 2,082 | 1,378 |
| 65 years old (n=51) | 1,485 | 1,647 | 890 |
| Total (n=777) | 1,757 | 1,818 | 1,158 |
| Service | Total Steps | |||||
|---|---|---|---|---|---|---|
| First 24 Hours | Last 24 Hours | |||||
| Mean | SD | Median | Mean | SD | Median | |
| ||||||
| Medicine | ||||||
| 65 years old (n=168) | 1,427 | 1,690 | 953 | 2,005 | 2,006 | 1,287 |
| 65 years old (n=127) | 1,004 | 1,098 | 676 | 1,260 | 1,291 | 904 |
| Surgical | ||||||
| 65 years old (n=53) | 1,722 | 1,696 | 1060 | 2,553 | 2,142 | 1,882 |
| 65 years old (n=30) | 1,184 | 1,470 | 704 | 1,829 | 1,996 | 1,053 |
| Total (n=378) | 1,307 | 1,515 | 811 | 1,817 | 1,864 | 1,188 |
More frequent documentation of step counts in the EMR (proxy for step count data retrieval and review from the vendor web site) by the care team was associated with higher total step counts after adjustments for relevant covariates (P0.001); 3 or more documentations over a 24‐hour period appears to be a minimal frequency to achieving approximately 200 steps more than the median value (Table 4).
| Service | Frequency of Documentation of Step Counts in EMR Over 24 Hours | P Value Trenda | Adjusted P Valueb | |||||
|---|---|---|---|---|---|---|---|---|
| 0 | 1 | 2 | 3 | 4 | ||||
| ||||||||
| Medicine | ||||||||
| 65 years old (n=321) | MeanSD | 1,4051,414 | 2,4152,037 | 2,0101,929 | 1,9811,907 | 2,7412,876 | ||
| Median | 1,056 | 1,514 | 1284 | 1,196 | 1,702 | 0.004 | 0.003 | |
| N (%) | 83 (26%) | 109 (34%) | 71 (22%) | 25 (8%) | 33 (10%) | |||
| 65 years old (n=287) | MeanSD | 1,3481,711 | 1,1991428 | 1,290951 | 1,5291,180 | 1,8781,214 | ||
| Median | 850 | 773 | 999 | 1,278 | 1,498 | 0.07 | 0.10 | |
| N (%) | 85 (30%) | 82 (28%) | 66 (23%) | 20 (7%) | 34 (12%) | |||
| Surgical | ||||||||
| 65 years old (n=118) | MeanSD | 2,0772,001 | 1,8591,598 | 2,6182,536 | 2,3122,031 | 3,8022,979 | ||
| Median | 1,361 | 1,250 | 1,181 | 1,719 | 3,149 | 0.06 | 0.05 | |
| N (%) | 42 (35%) | 36 (31%) | 18 (15%) | 14 (12%) | 8 (7%) | |||
| 65 years old (n=51) | MeanSD | 2,0032,254 | 1,4781,603 | 1,1651,246 | 478 | 1,219469 | ||
| Median | 1,028 | 820 | 672 | 478 | 1,426 | 0.20 | 0.15 | |
| N (%) | 13 (26%) | 19 (37%) | 15 (29%) | 1 (2%) | 3 (6%) | |||
| Total (n=777) | MeanSD | 1,5441,717 | 1,7361,799 | 1,7201,699 | 1,8831720 | 2,4152,304 | ||
| Median | 1,012 | 1,116 | 1,124 | 1,314 | 1,557 | 0.001 | 0.001 | |
| N (%) | 223 (29%) | 246 (31%) | 170 (22%) | 60 (8%) | 78 (10%) | |||
DISCUSSION
We found that ambulatory medical‐surgical patients accrued a median of 1158 total steps in the 24 hours prior to their discharge home, which translates to walking approximately 500 meters; older patients accrued fewer steps compared to younger patients. In patients with longer length of stay, the level of ambulation at discharge was similar to patients with shorter stays, suggesting there may be an ambulation threshold (1100 steps) that patients achieve regardless of the length of stay before they are discharged home. In addition, patients whose care team reviewed and documented step counts at least 3 times over a 24‐hour period accrued significantly more steps than patients whose care team made fewer documentations.
The median step counts accrued by surgical patients in our study are similar to that found in Cook and colleagues'[14] report of patients after elective cardiac surgery using another popular consumer‐grade accelerometer. The providers in that study also had access to the data via a dashboard, but it was not clear how this information was used. Brown et al.[12] conducted the first study to objectively monitor mobility using 2 accelerometers in 45 older male veterans who had no prior mobility impairment, and found that patients spent 83% of their hospitalization lying in bed. The veterans spent about 3% of the time (43 minutes per day) standing or walking over a mean length of stay of 5 days. In a similar study with 43 older Dutch patients who had an average length of stay of 7 days, Pedersen et al.[10] found that patients spent 71% of their time lying, 21% sitting, and 4% standing or walking. Unfortunately, neither the Brown et al. nor Pedersen et al. studies were able to distinguish between standing and ambulatory activities. In a more recent study of 47 patients on medical‐surgical units at 2 hospitals that relied on time and motion observation methods, the mean duration for ambulation was 2 minutes during an 8‐hour period.[13]
We took advantage of the variability in the nursing documentation of step counts in the EMR to determine if there was a dose‐response relationship between the frequency of nursing documentation in a 24‐hour period and number of steps patients accrued. We hypothesized that if nurses make an effort to retrieve data from the vendor website and manually key in the step counts in the EMR, they are more likely to incorporate this information in their nursing care, share the information with patients and other clinicians, and therefore create a positive feedback loop for greater ambulation. Although our findings suggest a positive association between more frequent documentation and increased step counts, we cannot exclude the possibility that nurses naturally modulate the frequency with which they review and document step counts based on their overall judgment of the patients' mobility status (ie, patients who are more functionally impaired are assumed to accrue fewer steps over a shift, and therefore, nurses are less inclined to retrieve and document the information frequently). Future studies could prospectively examine what the optimal frequency for review and feedback of step counts is during a typical 8‐ or 12‐hour nursing shift for both patients and the nursing care team to promote ambulation.
A major strength of our study is the collection of objective ambulation data on a large inpatient sample by clinical staff as part of routine nursing care. This strength is balanced with several limitations. Due to the temporal pattern associated with ambulation, we were only able to analyze data for patients who had at least 24 hours of continuous monitoring. This could affect the generalizability of our findings, though we believe there is limited pragmatic value in closely tracking ambulation in patients who have such short stays. There was substantial variability in the step counts, reflecting the mix of medical versus surgical patients and their age, with very small samples available for meaningful subgroup analyses other than what we have presented. We were not able to measure other dimensions of mobility such as transfers or sitting in a chair, because the sensor is designed to only measure steps. In addition, we lost a large number of devices, mostly due to staff forgetting to remove the devices from patients' ankles at discharge. Finally, because we did not blind the nurses and patients to the step count data, the preliminary normative step counts that we present in this article may be higher than expected in patients cared for on medical‐surgical units.
In summary, we found that it is possible to measure ambulation objectively and reliably in hospitalized patients, and have provided preliminary normative step counts for a representative but heterogeneous medical‐surgical population. We also found that most patients who were discharged were ambulating at least 1100 steps over the 24 hours prior to leaving the hospital, regardless of their length of stay. This might suggest that step counts could be a useful parameter in determining readiness for hospital discharge. Our data also suggest that more frequent, objective monitoring of step counts by the nursing care team was associated with patients ambulating more. Both of these findings deserve further exploration. Future studies will need to be conducted on larger samples of medical and surgical hospitalized patients to adequately establish more refined step count norms for specific clinical populations, but especially for older patients, because this age group is at a particularly higher risk of poor functional outcomes with hospitalization. Having accurate and reliable information on ambulation is fundamental to any effort to improve ambulation in hospitalized patients. Moreover, knowing the normative range for step counts in the last 24 hours prior to discharge across specific clinical and age subgroups, could assist with discharge planning and provision of appropriate rehabilitative services in the home or community for safe transitions out of the hospital.[17]
Acknowledgements
The authors express their gratitude to the patients and nurses at the Kaiser Permanente Southern California, Ontario Medical Center.
Disclosures: Funded by the Kaiser Permanente Southern California Care Improvement Research Team. Dr. Sallis contributed substantially to the study design, interpretation, and preparation of this article. Ms. Sturm and Chijioke contributed to the interpretation and preparation of this article. Dr. Kanter contributed to study design, interpretation, and preparation of this article. Mr. Huang contributed to the analysis, interpretation, and preparation of this article. Dr. Shen contributed to study design, analysis, interpretation, and preparation of this article. Dr. Nguyen had full access to the data and led the design, analysis, interpretation, and preparation of this article. Dr. Nguyen had full access to the data and will vouch for the integrity of the work as a whole, from inception to published article. The authors have no funding, financial relationships, or conflicts of interest to disclose.
- , , . Prevalence and outcomes of low mobility in hospitalized older patients. J Am Geriatr Soc. 2004;52(8):1263–1270.
- , , , , , . Low mobility during hospitalization and functional decline in older adults. J Am Geriatr Soc. 2011;59(2):266–273.
- , , , , . The natural history of functional morbidity in hospitalized older patients. J Am Geriatr Soc. 1990;38(12):1296–1303.
- , , , , . Early ambulation and length of stay in older adults hospitalized for acute illness. Arch Intern Med. 2010;170(21):1942–1943.
- , . Early mobilization in the intensive care unit: a systematic review. Cardiopulm Phys Ther J. 2012;23(1):5–13.
- , , . Outcomes of inpatient mobilization: a literature review. J Clin Nurs. 2014;23(11–12):1486–1501.
- , , , et al. An early rehabilitation intervention to enhance recovery during hospital admission for an exacerbation of chronic respiratory disease: randomised controlled trial. BMJ. 2014;349:g4315.
- , , , , . Additional exercise does not change hospital or patient outcomes in older medical patients: a controlled clinical trial. Aust J Physiother. 2007;53(2):105–111.
- , , . Exercise for acutely hospitalised older medical patients. Cochrane Database Syst Rev. 2007;(1):CD005955.
- , , , et al. Twenty‐four‐hour mobility during acute hospitalization in older medical patients. J Gerontol A Biol Sci Med Sci. 2013;68(3):331–337.
- , , , , , . Mobility activity and its value as a prognostic indicator of survival in hospitalized older adults. J Am Geriatr Soc. 2013;61(4):551–557.
- , , , . The underrecognized epidemic of low mobility during hospitalization of older adults. J Am Geriatr Soc. 2009;57(9):1660–1665.
- , , , , . Frequency and duration of nursing care related to older patient mobility. J Nurs Scholarsh. 2014;46(1):20–27.
- , , , , . Functional recovery in the elderly after major surgery: assessment of mobility recovery using wireless technology. Ann Thorac Surg. 2013;96(3):1057–1061.
- , , , et al. Derivation and validation of an index to predict early death or unplanned readmission after discharge from hospital to the community. CMAJ. 2010;182(6):551–557.
- , . Quantile regression: an introduction. J Econ Perspect. 2001;15(4):43–56.
- . Post‐hospital syndrome—an acquired, transient condition of generalized risk. N Engl J Med. 2013;368(2):100–102.

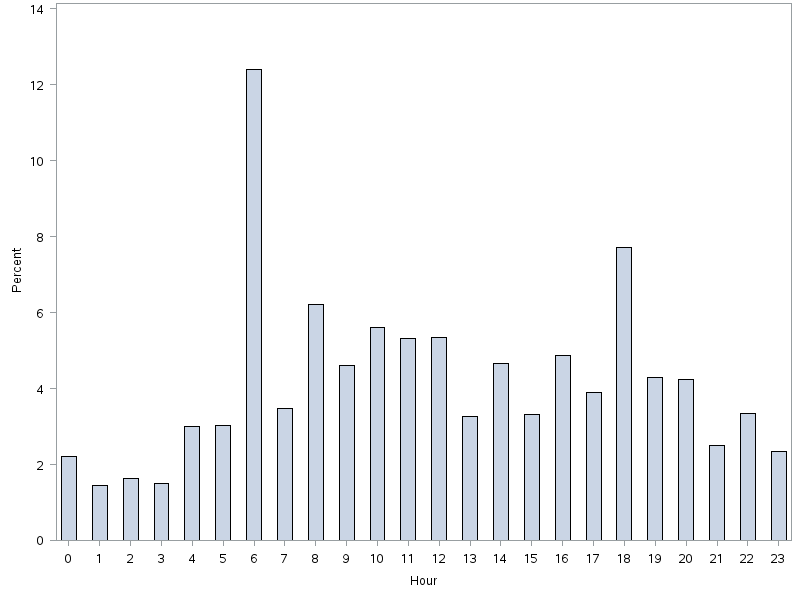
PCP Communication at Discharge
Transitions of care from hospital to home are high‐risk times for patients.[1, 2] Increasing complexity of hospital admissions and shorter lengths of stay demand more effective coordination of care between hospitalists and outpatient clinicians.[3, 4, 5] Inaccurate, delayed, or incomplete clinical handoversthat is, transfer of information and professional responsibility and accountability[6]can lead to patient harm, and has been recognized as a key cause of preventable morbidity by the World Health Organization and The Joint Commission.[6, 7, 8] Conversely, when done effectively, transitions can result in improved patient health outcomes, reduced readmission rates, and higher patient and provider satisfaction.3
Previous studies note deficits in communication at discharge and primary care provider (PCP) dissatisfaction with discharge practices.[4, 9, 10, 11, 12, 13] In studies at academic medical centers, there were low rates of direct communication between inpatient and outpatient providers, mainly because of providers' belief that the discharge summary was adequate and the presence of significant barriers to direct communication.[14, 15] However, studies have shown that discharge summaries often omit critical information, and often are not available to PCPs in a timely manner.[10, 11, 12, 16] In response, the Society of Hospital Medicine developed a discharge checklist to aide in standardization of safe discharge practices.[1, 5] Discharge summary templates further attempt to improve documentation of patients' hospital courses. An electronic medical record (EMR) system shared by both inpatient and outpatient clinicians should impart several advantages: (1) automated alerts provide timely notification to PCPs regarding admission and discharge, (2) discharge summaries are available to the PCP as soon as they are written, and (3) all patient information pertaining to the hospitalization is available to the PCP.
Although it is plausible that shared EMRs should facilitate transitions of care by streamlining communication between hospitalists and PCPs, guidelines on format and content of PCP communication at discharge in the era of a shared EMR have yet to be defined. In this study, we sought to understand current discharge communication practices and PCP satisfaction within a shared EMR at our institution, and to identify key areas in which communication can be improved.
METHODS
Participants and Setting
We surveyed all resident and attending PCPs (n=124) working in the Division of General Internal Medicine (DGIM) Outpatient Practice at the University of California, San Francisco (UCSF). In June 2012, the outpatient and inpatient practices of UCSF transitioned from having separate medical record systems to a shared EMR (Epic Systems Corp., Verona, WI) where all informationboth inpatient and outpatientis accessible among healthcare professionals. The EMR provides automated notifications of admission and discharge to PCPs, allows for review of inpatient notes, labs, and studies, and immediate access to templated discharge summaries (see Supporting Information, Appendix 1, in the online version of this article). The EMR also enables secure communication between clinicians. At our institution, over 90% of discharge summaries are completed within 24 hours of discharge.[17]
Study Design and Analysis
We developed a survey about the discharge communication practices of inpatient medicine patients based on a previously described survey in the literature (see Supporting Information, Appendix 2, in the online version of this article).[9] The anonymous, 17‐question survey was electronically distributed to resident and attending PCPs at the DGIM practice. The survey was designed to determine: (1) overall PCP satisfaction with current communication practices from the inpatient team at patient discharge, (2) perceived adequacy of automatic discharge notifications, and (3) perception of the types of patients and hospitalizations requiring additional high‐touch communication at discharge.
We analyzed results of our survey using descriptive statistics. Differences in resident and attending responses were analyzed by 2tests.
RESULTS
Seventy‐five of 124 (60%) clinicians (46% residents, 54% attendings) completed the survey. Thirty‐nine (52%) PCPs were satisfied or very satisfied with communication at patient discharge. Although most reported receiving automated discharge notifications (71%), only 39% felt that the notifications plus the discharge summaries were adequate communication for safe transition of care from hospital to community. Fifty‐one percent desired direct contact beyond a discharge summary. There were no differences in preferences on discharge communication between resident and attending PCPs (P>0.05).
Over three‐fourths of PCPs surveyed preferred that for patients with complex hospitalizations (multiple readmissions, multiple active comorbidities, goals of care changes, high‐risk medication changes, time‐sensitive follow‐up needs), an additional e‐mail or verbal communication was needed to augment the information in the discharge summary (Figure 1). Only 31% reported receiving such communication.
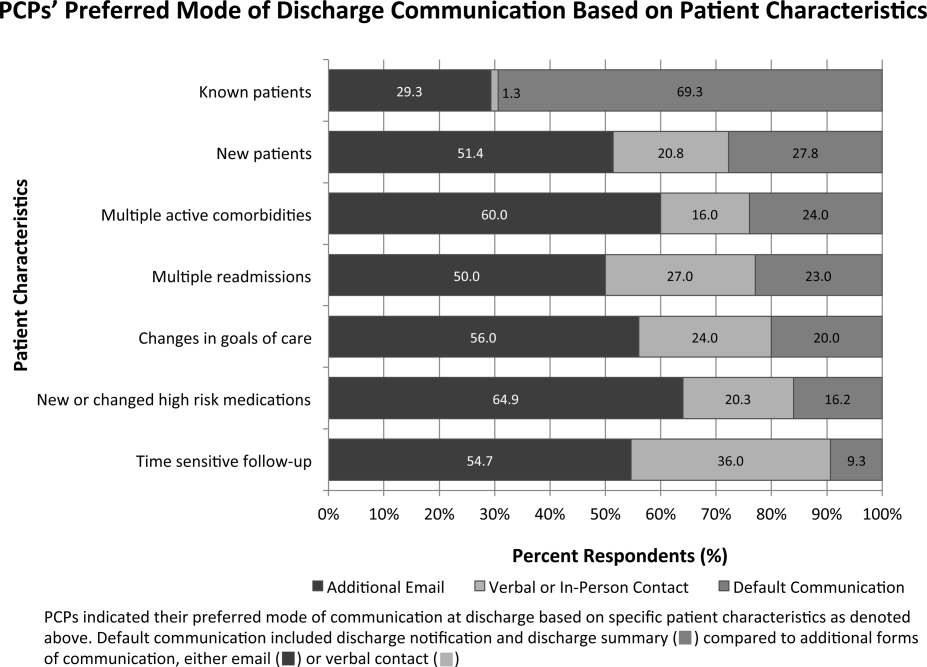
When asked about important items to communicate for safer transitions of care, PCPs reported finding the following elements most critical: (1) medication changes (93%), (2) follow‐up actions for the PCP (88%), and (3) active medical issues (84%) (Figure 2).
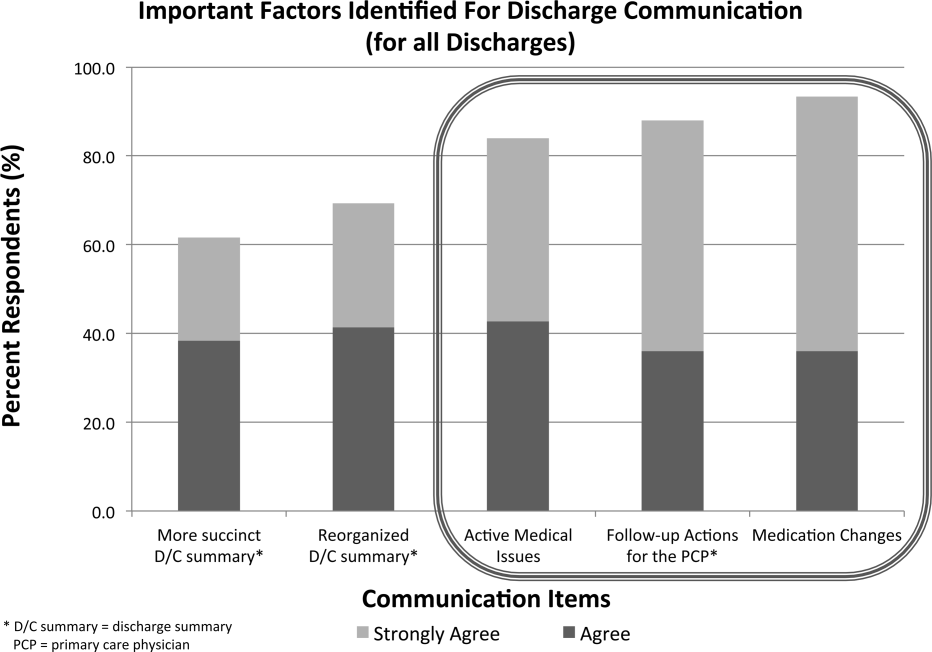
CONCLUSIONS
In the era of shared EMRs, real‐time access to medication lists, pending test results, and discharge summaries should facilitate care transitions at discharge.[18, 19] We conducted a study to determine PCP perceptions of discharge communication after implementation of a shared EMR. We found that although PCPs largely acknowledged timely receipt of automated discharge notifications and discharge summaries, the majority of PCPs felt that most discharges required additional communication to ensure safe transition of care.
Guidelines for discharge communication emphasize timely communication with the PCP, primarily through discharge summaries containing key safety elements.[1, 5, 10] At our institution, we have improved the timeliness and quality of discharge summaries according to guideline recommendations,[17] and conducted quality improvement projects to improve rates of direct communication with PCPs.[9] In addition, the shared EMR provides automated notifications to PCPs when their patients are discharged. Despite these interventions, our survey shows that PCP satisfaction with discharge communication is still inadequate. PCPs desired direct communication that highlights active medical issues, medication changes, and specific follow‐up actions. Although all of these topics are included in our discharge summary template (see Supporting Information, Appendix 1, in the online version of this article), it is possible that the templated discharge summaries lend themselves to longer documents and information overload, as prior studies have documented the desire for more succinct discharge summaries.[18] We also found that automated notifications of discharge were less reliable and useful for PCPs than anticipated. There were several reasons for this: (1) discharge summaries sometimes were sent to PCPs uncoupled from the discharge notification, (2) there were errors with the generation and delivery of automated messages at the rollout of the new system, and (3) PCPs received many other automated system messages, meaning that discharge notifications could be easily missed. These factors all likely contribute to PCPs' desire for high‐touch communication that highlights the most salient aspects of each patient's hospitalization. It is also possible that automated notifications and depersonalized discharge summaries create distance and a less‐collaborative feeling to patient care. PCPs want more direct communication, and desire to play a more active role in inpatient management, especially for complex hospitalizations.[18] This emphasis on direct communication resonates with previous studies conducted before shared EMRs existed.[9, 12, 19]
Our study had several limitations. First, because this is a single‐institution study at a tertiary care academic setting, the results may not be generalizable to all shared EMR settings, and may not reflect all the challenges of communication with the wider community of outpatient providers. One can postulate that inpatient and outpatient clinician relationships are stronger in an academic setting than in other more disparate environments, where direct communication may happen even less frequently. Of note, our low rates of direct communication are consistent with other single‐ and multi‐institution studies, suggesting that our findings are generalizable.[14, 15] Second, our survey is limited in its ability to distinguish those patients who require high‐touch communication and those who do not. Third, although we have used the survey to assess PCP satisfaction in previous studies, it is not a validated instrument, and therefore we cannot reliably say that increasing direct PCP communication would increase their satisfaction around discharge. Last, the PCP‐reported rates of discharge communication are subjective and may be influenced by recall bias. We did not have a systematic way to confirm the actual rates of communication at discharge, which could have occurred through EMR messages, e‐mails, phone calls, or pages.
Although a shared EMR allows for real‐time access to patient data, it does not eliminate PCPs' desire for direct 2‐way dialogue at discharge, especially for complex patients. Key information desired in such communication should include active medical issues, medication changes, and follow‐up needs, which is consistent with prior studies. Standardizing this direct communication process in an efficient way can be challenging. Further elucidation of PCP preferences around which patients necessitate higher‐level communication and preferred methods and timing of communication is needed, as well as determining the most efficient and effective method for hospitalists to provide such communication. Improving communication between hospitalists and PCPs requires not just the presence of a shared EMR, but additional, systematic efforts to engage both inpatient and outpatient clinicians in collaborative care.
Disclosure
Nothing to report.
- , , , et al. Development of a checklist of safe discharge practices for hospital patients. J Hosp Med. 2013;8(8):444–449.
- , , , , The incidence and severity of adverse events affecting patients after discharge from the hospital. Ann Intern Med. 2003;138(3):161–167.
- , , , et al. Improving patient handovers from hospital to primary care: a systematic review. Ann Intern Med. 2012;157(6):417–428.
- , , , , “Did I do as best as the system would let me?” Healthcare professional views on hospital to home care transitions. J Gen Intern Med. 2012;27(12):1649–1656.
- , , , et al. Transition of care for hospitalized elderly patients—development of a discharge checklist for hospitalists. J Hosp Med. 2006;1(6):354−660.
- , , , , Improving measurement in clinical handover. Qual Saf Health Care. 2009;18:272–277.
- World Health Organization. Patient safety: action on patient safety: high 5s. 2007. Available at: http://www.who.int/patientsafety/implementation/solutions/high5s/en/index.html. Accessed January 28, 2015.
- The Joint Commission Center for Transforming Healthcare. Hand‐off communications. 2012. Available at: http://www.centerfortransforminghealthcare.org/projects/detail.aspx?Project=1. Accessed January 28, 2015.
- , , , et al. The effect of a resident‐led quality improvement project on improving communication between hospital‐based and outpatient physicians. Am J Med Qual. 2013;28(6):472–479.
- , , , Promoting effective transitions of care at hospital discharge: a review of key issues for hospitalists. J Hosp Med. 2007;2(5):314–323.
- , , , , , Deficits in communication and information transfer between hospital‐based and primary care physicians: implications for patient safety and continuity of care. JAMA. 2007;297(8):831–841.
- , , , Primary care physician attitudes regarding communication with hospitalists. Am J Med. 2001;111(9B):15S–20S.
- , , , et al. Searching for the missing pieces between the hospital and primary care: mapping the patient process during care transitions. BMJ Qual Saf. 2012;21:i97–i105.
- , , , et al. Association of self‐reported hospital discharge handoffs with 30‐day readmissions. JAMA. 2013;173(8):624–629.
- , , , et al. Association of communication between hospital‐based physicians and primary care providers with patient outcomes. J Gen Intern Med. 2009;24(3):381–386.
- , , , Effect of discharge summary availability during post‐discharge visits on hospital readmission. J Gen Intern Med. 2002;17(3):186–192.
- , , , , The Housestaff Incentive Program: improving the timeliness and quality of discharge summaries by engaging residents in quality improvement. BMJ Qual Saf. 2013;22(9):768–774.
- , , , et al. A Failure to communicate: a qualitative exploration of care coordination between hospitalists and primary care providers around patient hospitalizations [published online ahead of print October 15, 2014]. J Gen Intern Med. doi: 10.1007/s11606-014-3056-x.
- , , , et al. Pediatric hospitalists and primary care providers: a communication needs assessment. J Hosp Med. 2009;4(3):187–193.
Transitions of care from hospital to home are high‐risk times for patients.[1, 2] Increasing complexity of hospital admissions and shorter lengths of stay demand more effective coordination of care between hospitalists and outpatient clinicians.[3, 4, 5] Inaccurate, delayed, or incomplete clinical handoversthat is, transfer of information and professional responsibility and accountability[6]can lead to patient harm, and has been recognized as a key cause of preventable morbidity by the World Health Organization and The Joint Commission.[6, 7, 8] Conversely, when done effectively, transitions can result in improved patient health outcomes, reduced readmission rates, and higher patient and provider satisfaction.3
Previous studies note deficits in communication at discharge and primary care provider (PCP) dissatisfaction with discharge practices.[4, 9, 10, 11, 12, 13] In studies at academic medical centers, there were low rates of direct communication between inpatient and outpatient providers, mainly because of providers' belief that the discharge summary was adequate and the presence of significant barriers to direct communication.[14, 15] However, studies have shown that discharge summaries often omit critical information, and often are not available to PCPs in a timely manner.[10, 11, 12, 16] In response, the Society of Hospital Medicine developed a discharge checklist to aide in standardization of safe discharge practices.[1, 5] Discharge summary templates further attempt to improve documentation of patients' hospital courses. An electronic medical record (EMR) system shared by both inpatient and outpatient clinicians should impart several advantages: (1) automated alerts provide timely notification to PCPs regarding admission and discharge, (2) discharge summaries are available to the PCP as soon as they are written, and (3) all patient information pertaining to the hospitalization is available to the PCP.
Although it is plausible that shared EMRs should facilitate transitions of care by streamlining communication between hospitalists and PCPs, guidelines on format and content of PCP communication at discharge in the era of a shared EMR have yet to be defined. In this study, we sought to understand current discharge communication practices and PCP satisfaction within a shared EMR at our institution, and to identify key areas in which communication can be improved.
METHODS
Participants and Setting
We surveyed all resident and attending PCPs (n=124) working in the Division of General Internal Medicine (DGIM) Outpatient Practice at the University of California, San Francisco (UCSF). In June 2012, the outpatient and inpatient practices of UCSF transitioned from having separate medical record systems to a shared EMR (Epic Systems Corp., Verona, WI) where all informationboth inpatient and outpatientis accessible among healthcare professionals. The EMR provides automated notifications of admission and discharge to PCPs, allows for review of inpatient notes, labs, and studies, and immediate access to templated discharge summaries (see Supporting Information, Appendix 1, in the online version of this article). The EMR also enables secure communication between clinicians. At our institution, over 90% of discharge summaries are completed within 24 hours of discharge.[17]
Study Design and Analysis
We developed a survey about the discharge communication practices of inpatient medicine patients based on a previously described survey in the literature (see Supporting Information, Appendix 2, in the online version of this article).[9] The anonymous, 17‐question survey was electronically distributed to resident and attending PCPs at the DGIM practice. The survey was designed to determine: (1) overall PCP satisfaction with current communication practices from the inpatient team at patient discharge, (2) perceived adequacy of automatic discharge notifications, and (3) perception of the types of patients and hospitalizations requiring additional high‐touch communication at discharge.
We analyzed results of our survey using descriptive statistics. Differences in resident and attending responses were analyzed by 2tests.
RESULTS
Seventy‐five of 124 (60%) clinicians (46% residents, 54% attendings) completed the survey. Thirty‐nine (52%) PCPs were satisfied or very satisfied with communication at patient discharge. Although most reported receiving automated discharge notifications (71%), only 39% felt that the notifications plus the discharge summaries were adequate communication for safe transition of care from hospital to community. Fifty‐one percent desired direct contact beyond a discharge summary. There were no differences in preferences on discharge communication between resident and attending PCPs (P>0.05).
Over three‐fourths of PCPs surveyed preferred that for patients with complex hospitalizations (multiple readmissions, multiple active comorbidities, goals of care changes, high‐risk medication changes, time‐sensitive follow‐up needs), an additional e‐mail or verbal communication was needed to augment the information in the discharge summary (Figure 1). Only 31% reported receiving such communication.
When asked about important items to communicate for safer transitions of care, PCPs reported finding the following elements most critical: (1) medication changes (93%), (2) follow‐up actions for the PCP (88%), and (3) active medical issues (84%) (Figure 2).
CONCLUSIONS
In the era of shared EMRs, real‐time access to medication lists, pending test results, and discharge summaries should facilitate care transitions at discharge.[18, 19] We conducted a study to determine PCP perceptions of discharge communication after implementation of a shared EMR. We found that although PCPs largely acknowledged timely receipt of automated discharge notifications and discharge summaries, the majority of PCPs felt that most discharges required additional communication to ensure safe transition of care.
Guidelines for discharge communication emphasize timely communication with the PCP, primarily through discharge summaries containing key safety elements.[1, 5, 10] At our institution, we have improved the timeliness and quality of discharge summaries according to guideline recommendations,[17] and conducted quality improvement projects to improve rates of direct communication with PCPs.[9] In addition, the shared EMR provides automated notifications to PCPs when their patients are discharged. Despite these interventions, our survey shows that PCP satisfaction with discharge communication is still inadequate. PCPs desired direct communication that highlights active medical issues, medication changes, and specific follow‐up actions. Although all of these topics are included in our discharge summary template (see Supporting Information, Appendix 1, in the online version of this article), it is possible that the templated discharge summaries lend themselves to longer documents and information overload, as prior studies have documented the desire for more succinct discharge summaries.[18] We also found that automated notifications of discharge were less reliable and useful for PCPs than anticipated. There were several reasons for this: (1) discharge summaries sometimes were sent to PCPs uncoupled from the discharge notification, (2) there were errors with the generation and delivery of automated messages at the rollout of the new system, and (3) PCPs received many other automated system messages, meaning that discharge notifications could be easily missed. These factors all likely contribute to PCPs' desire for high‐touch communication that highlights the most salient aspects of each patient's hospitalization. It is also possible that automated notifications and depersonalized discharge summaries create distance and a less‐collaborative feeling to patient care. PCPs want more direct communication, and desire to play a more active role in inpatient management, especially for complex hospitalizations.[18] This emphasis on direct communication resonates with previous studies conducted before shared EMRs existed.[9, 12, 19]
Our study had several limitations. First, because this is a single‐institution study at a tertiary care academic setting, the results may not be generalizable to all shared EMR settings, and may not reflect all the challenges of communication with the wider community of outpatient providers. One can postulate that inpatient and outpatient clinician relationships are stronger in an academic setting than in other more disparate environments, where direct communication may happen even less frequently. Of note, our low rates of direct communication are consistent with other single‐ and multi‐institution studies, suggesting that our findings are generalizable.[14, 15] Second, our survey is limited in its ability to distinguish those patients who require high‐touch communication and those who do not. Third, although we have used the survey to assess PCP satisfaction in previous studies, it is not a validated instrument, and therefore we cannot reliably say that increasing direct PCP communication would increase their satisfaction around discharge. Last, the PCP‐reported rates of discharge communication are subjective and may be influenced by recall bias. We did not have a systematic way to confirm the actual rates of communication at discharge, which could have occurred through EMR messages, e‐mails, phone calls, or pages.
Although a shared EMR allows for real‐time access to patient data, it does not eliminate PCPs' desire for direct 2‐way dialogue at discharge, especially for complex patients. Key information desired in such communication should include active medical issues, medication changes, and follow‐up needs, which is consistent with prior studies. Standardizing this direct communication process in an efficient way can be challenging. Further elucidation of PCP preferences around which patients necessitate higher‐level communication and preferred methods and timing of communication is needed, as well as determining the most efficient and effective method for hospitalists to provide such communication. Improving communication between hospitalists and PCPs requires not just the presence of a shared EMR, but additional, systematic efforts to engage both inpatient and outpatient clinicians in collaborative care.
Disclosure
Nothing to report.
- , , , et al. Development of a checklist of safe discharge practices for hospital patients. J Hosp Med. 2013;8(8):444–449.
- , , , , The incidence and severity of adverse events affecting patients after discharge from the hospital. Ann Intern Med. 2003;138(3):161–167.
- , , , et al. Improving patient handovers from hospital to primary care: a systematic review. Ann Intern Med. 2012;157(6):417–428.
- , , , , “Did I do as best as the system would let me?” Healthcare professional views on hospital to home care transitions. J Gen Intern Med. 2012;27(12):1649–1656.
- , , , et al. Transition of care for hospitalized elderly patients—development of a discharge checklist for hospitalists. J Hosp Med. 2006;1(6):354−660.
- , , , , Improving measurement in clinical handover. Qual Saf Health Care. 2009;18:272–277.
- World Health Organization. Patient safety: action on patient safety: high 5s. 2007. Available at: http://www.who.int/patientsafety/implementation/solutions/high5s/en/index.html. Accessed January 28, 2015.
- The Joint Commission Center for Transforming Healthcare. Hand‐off communications. 2012. Available at: http://www.centerfortransforminghealthcare.org/projects/detail.aspx?Project=1. Accessed January 28, 2015.
- , , , et al. The effect of a resident‐led quality improvement project on improving communication between hospital‐based and outpatient physicians. Am J Med Qual. 2013;28(6):472–479.
- , , , Promoting effective transitions of care at hospital discharge: a review of key issues for hospitalists. J Hosp Med. 2007;2(5):314–323.
- , , , , , Deficits in communication and information transfer between hospital‐based and primary care physicians: implications for patient safety and continuity of care. JAMA. 2007;297(8):831–841.
- , , , Primary care physician attitudes regarding communication with hospitalists. Am J Med. 2001;111(9B):15S–20S.
- , , , et al. Searching for the missing pieces between the hospital and primary care: mapping the patient process during care transitions. BMJ Qual Saf. 2012;21:i97–i105.
- , , , et al. Association of self‐reported hospital discharge handoffs with 30‐day readmissions. JAMA. 2013;173(8):624–629.
- , , , et al. Association of communication between hospital‐based physicians and primary care providers with patient outcomes. J Gen Intern Med. 2009;24(3):381–386.
- , , , Effect of discharge summary availability during post‐discharge visits on hospital readmission. J Gen Intern Med. 2002;17(3):186–192.
- , , , , The Housestaff Incentive Program: improving the timeliness and quality of discharge summaries by engaging residents in quality improvement. BMJ Qual Saf. 2013;22(9):768–774.
- , , , et al. A Failure to communicate: a qualitative exploration of care coordination between hospitalists and primary care providers around patient hospitalizations [published online ahead of print October 15, 2014]. J Gen Intern Med. doi: 10.1007/s11606-014-3056-x.
- , , , et al. Pediatric hospitalists and primary care providers: a communication needs assessment. J Hosp Med. 2009;4(3):187–193.

Reducing Inappropriate Acid Suppressives
Prior studies have found that up to 70% of acid‐suppressive medication (ASM) use in the hospital is not indicated, most commonly for stress ulcer prophylaxis in patients outside of the intensive care unit (ICU).[1, 2, 3, 4, 5, 6, 7] Accordingly, reducing inappropriate use of ASM for stress ulcer prophylaxis in hospitalized patients is 1 of the 5 opportunities for improved healthcare value identified by the Society of Hospital Medicine as part of the American Board of Internal Medicine's Choosing Wisely campaign.[8]
We designed and tested a computerized clinical decision support (CDS) intervention with the goal of reducing use of ASM for stress ulcer prophylaxis in hospitalized patients outside the ICU at an academic medical center.
METHODS
Study Design
We conducted a quasiexperimental study using an interrupted time series to analyze data collected prospectively during clinical care before and after implementation of our intervention. The study was deemed a quality improvement initiative by the Beth Israel Deaconess Medical Center Committee on Clinical Investigations/Institutional Review Board.
Patients and Setting
All admissions >18 years of age to a 649‐bed academic medical center in Boston, Massachusetts from September 12, 2011 through July 3, 2012 were included. The medical center consists of an East and West Campus, located across the street from each other. Care for both critically ill and noncritically ill medical and surgical patients occurs on both campuses. Differences include greater proportions of patients with gastrointestinal and oncologic conditions on the East Campus, and renal and cardiac conditions on the West Campus. Additionally, labor and delivery occurs exclusively on the East Campus, and the density of ICU beds is greater on the West Campus. Both campuses utilize a computer‐based provider order entry (POE) system.
Intervention
Our study was implemented in 2 phases (Figure 1).
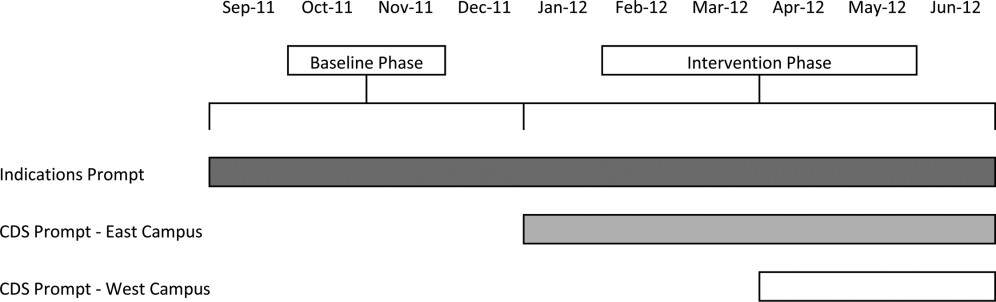
Baseline Phase
The purpose of the first phase was to obtain baseline data on ASM use prior to implementing our CDS tool designed to influence prescribing. During this baseline phase, a computerized prompt was activated through our POE system whenever a clinician initiated an order for ASM (histamine 2 receptor antagonists or proton pump inhibitors), asking the clinician to select the reason/reasons for the order based on the following predefined response options: (1) active/recent upper gastrointestinal bleed, (2) continuing preadmission medication, (3) Helicobacter pylori treatment, (4) prophylaxis in patient on medications that increase bleeding risk, (5) stress ulcer prophylaxis, (6) suspected/known peptic ulcer disease, gastritis, esophagitis, gastroesophageal reflux disease, and (7) other, with a free‐text box to input the indication. This indications prompt was rolled out to the entire medical center on September 12, 2011 and remained active for the duration of the study period.
Intervention Phase
In the second phase of the study, if a clinician selected stress ulcer prophylaxis as the only indication for ordering ASM, a CDS prompt alerted the clinician that Stress ulcer prophylaxis is not recommended for patients outside of the intensive care unit (ASHP Therapeutic Guidelines on Stress Ulcer Prophylaxis. Am J Health‐Syst Pharm. 1999, 56:347‐79). The clinician could then select either, For use in ICUOrder Medication, Choose Other Indication, or Cancel Order. This CDS prompt was rolled out in a staggered manner to the East Campus on January 3, 2012, followed by the West Campus on April 3, 2012.
Outcomes
The primary outcome was the rate of ASM use with stress ulcer prophylaxis selected as the only indication in a patient located outside of the ICU. We confirmed patient location in the 24 hours after the order was placed. Secondary outcomes were rates of overall ASM use, defined via pharmacy charges, and rates of use on discharge.
Statistical Analysis
To assure stable measurement of trends, we studied at least 3 months before and after the intervention on each campus. We used the Fisher exact test to compare the rates of our primary and secondary outcomes before and after the intervention, stratified by campus. For our primary outcomeat least 1 ASM order with stress ulcer prophylaxis selected as the only indication during hospitalizationwe developed a logistic regression model with a generalized estimating equation and exchangeable working correlation structure to control for admission characteristics (Table 1) and repeated admissions. Using a term for the interaction between time and the intervention, this model allowed us to assess changes in level and trend for the odds of a patient receiving at least 1 ASM order with stress ulcer prophylaxis as the only indication before, compared to after the intervention, stratified by campus. We used a 2‐sided type I error of 0.05 to indicate statistical significance.
| Study Phase | Campus | |||
|---|---|---|---|---|
| East | West | |||
| Baseline, n=3,747 | Intervention, n=6,191 | Baseline, n=11,177 | Intervention, n=5,285 | |
| ||||
| Age, y, mean (SD) | 48.1 (18.5) | 47.7 (18.2) | 61.0 (18.0) | 60.3 (18.1) |
| Gender, no. (%) | ||||
| Female | 2744 (73.2%) | 4542 (73.4%) | 5551 (49.7%) | 2653 (50.2%) |
| Male | 1003 (26.8%) | 1649 (26.6%) | 5626 (50.3%) | 2632 (49.8%) |
| Race, no. (%) | ||||
| Asian | 281 (7.5%) | 516 (8.3%) | 302 (2.7%) | 156 (3%) |
| Black | 424 (11.3%) | 667 (10.8%) | 1426 (12.8%) | 685 (13%) |
| Hispanic | 224 (6%) | 380 (6.1%) | 619 (5.5%) | 282 (5.3%) |
| Other | 378 (10.1%) | 738 (11.9%) | 776 (6.9%) | 396 (7.5%) |
| White | 2440 (65.1%) | 3890 (62.8%) | 8054 (72%) | 3766 (71.3%) |
| Charlson score, mean (SD) | 0.8 (1.1) | 0.7 (1.1) | 1.5 (1.4) | 1.4 (1.4) |
| Gastrointestinal bleeding, no. (%)* | 49 (1.3%) | 99 (1.6%) | 385 (3.4%) | 149 (2.8%) |
| Other medication exposures, no. (%) | ||||
| Therapeutic anticoagulant | 218 (5.8%) | 409 (6.6%) | 2242 (20.1%) | 1022 (19.3%) |
| Prophylactic anticoagulant | 1081 (28.8%) | 1682 (27.2%) | 5999 (53.7%) | 2892 (54.7%) |
| NSAID | 1899 (50.7%) | 3141 (50.7%) | 1248 (11.2%) | 575 (10.9%) |
| Antiplatelet | 313 (8.4%) | 585 (9.4%) | 4543 (40.6%) | 2071 (39.2%) |
| Admitting department, no. (%) | ||||
| Surgery | 2507 (66.9%) | 4146 (67%) | 3255 (29.1%) | 1578 (29.9%) |
| Nonsurgery | 1240 (33.1%) | 2045 (33%) | 7922 (70.9%) | 3707 (70.1%) |
| Any ICU Stay, no. (%) | 217 (5.8%) | 383 (6.2%) | 2786 (24.9%) | 1252 (23.7%) |
RESULTS
There were 26,400 adult admissions during the study period, and 22,330 discrete orders for ASM. Overall, 12,056 (46%) admissions had at least 1 charge for ASM. Admission characteristics were similar before and after the intervention on each campus (Table 1).
Table 2 shows the indications chosen each time ASM was ordered, stratified by campus and study phase. Although selection of stress ulcer prophylaxis decreased on both campuses during the intervention phase, selection of continuing preadmission medication increased.
| Study Phase | Campus | |||
|---|---|---|---|---|
| East | West | |||
| Baseline, n=2,062 | Intervention, n=3,243 | Baseline, n=12,038 | Intervention, n=4,987 | |
| ||||
| Indication* | ||||
| Continuing preadmission medication | 910 (44.1%) | 1695 (52.3%) | 5597 (46.5%) | 2802 (56.2%) |
| PUD, gastritis, esophagitis, GERD | 440 (21.3%) | 797 (24.6%) | 1303 (10.8%) | 582 (11.7%) |
| Stress ulcer prophylaxis | 298 (14.4%) | 100 (3.1%) | 2659 (22.1%) | 681 (13.7%) |
| Prophylaxis in patient on medications that increase bleeding risk | 226 (11.0%) | 259 (8.0%) | 965 (8.0%) | 411 (8.2%) |
| Active/recent gastrointestinal bleed | 154 (7.5%) | 321 (9.9%) | 1450 (12.0%) | 515 (10.3) |
| Helicobacter pylori treatment | 6 (0.2%) | 2 (0.1%) | 43 (0.4%) | 21 (0.4%) |
| Other | 111 (5.4%) | 156 (4.8%) | 384 (3.2%) | 186 (3.7%) |
Table 3 shows the unadjusted comparison of outcomes between baseline and intervention phases on each campus. Use of ASM with stress ulcer prophylaxis as the only indication decreased during the intervention phase on both campuses. There was a nonsignificant reduction in overall rates of use on both campuses, and use on discharge was unchanged. Figure 2 demonstrates the unadjusted and modeled monthly rates of admissions with at least 1 ASM order with stress ulcer prophylaxis selected as the only indication, stratified by campus. After adjusting for the admission characteristics in Table 1, during the intervention phase on both campuses there was a significant immediate reduction in the odds of receiving an ASM with stress ulcer prophylaxis selected as the only indication (East Campus odds ratio [OR]: 0.36, 95% confidence interval [CI]: 0.180.71; West Campus OR: 0.41, 95% CI: 0.280.60), and a significant change in trend compared to the baseline phase (East Campus 1.5% daily decrease in odds of receiving ASM solely for stress ulcer prophylaxis, P=0.002; West Campus 0.9% daily decrease in odds of receiving ASM solely for stress ulcer prophylaxis, P=0.02).
| Study Phase | Campus | |||||
|---|---|---|---|---|---|---|
| East | West | |||||
| Baseline, n=3,747 | Intervention, n=6,191 | P Value* | Baseline, n=11,177 | Intervention, n=5,285 | P Value* | |
| ||||||
| Outcome | ||||||
| Any inappropriate acid‐suppressive exposure | 4.0% | 0.6% | 0.001 | 7.7% | 2.2% | 0.001 |
| Any acid‐suppressive exposure | 33.1% | 31.8% | 0.16 | 54.5% | 52.9% | 0.05 |
| Discharged on acid‐suppressive medication | 18.9% | 19.6% | 0.40 | 34.7% | 34.7% | 0.95 |
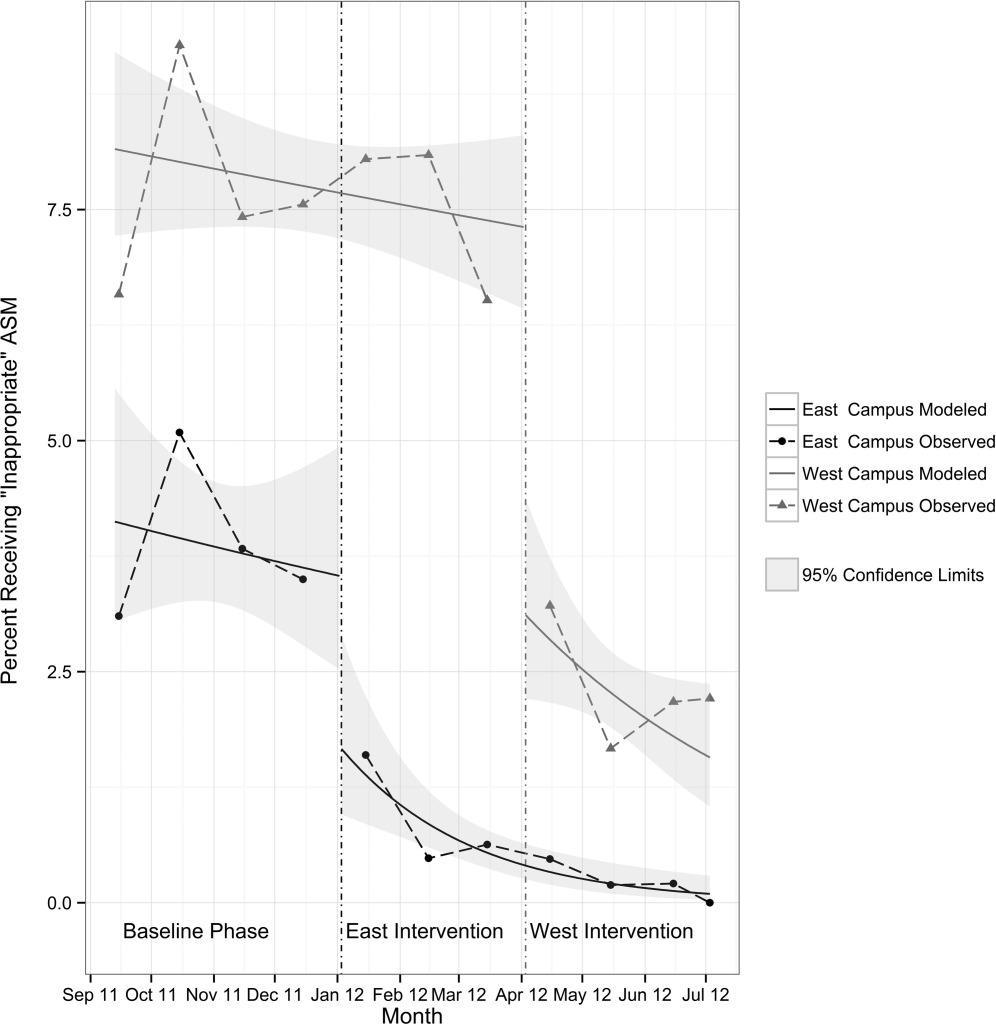
DISCUSSION
In this single‐center study, we found that a computerized CDS intervention resulted in a significant reduction in use of ASM for the sole purpose of stress ulcer prophylaxis in patients outside the ICU, a nonsignificant reduction in overall use, and no change in use on discharge. We found low rates of use for the isolated purpose of stress ulcer prophylaxis even before the intervention, and continuing preadmission medication was the most commonly selected indication throughout the study.
Although overall rates of ASM use declined after the intervention, the change was not statistically significant, and was not of the same magnitude as the decline in rates of use for the purpose of stress ulcer prophylaxis. This suggests that our intervention, in part, led to substitution of 1 indication for another. The indication that increased the most after rollout on both campuses was continuing preadmission medication. There are at least 2 possibilities for this finding: (1) the intervention prompted physicians to more accurately record the indication, or (2) physicians falsified the indication in order to execute the order. To explore these possibilities, we reviewed the charts of a random sample of 100 admissions during each of the baseline and intervention phases where continuing preadmission medication was selected as an indication for an ASM order. We found that 6/100 orders in the baseline phase and 7/100 orders in the intervention phase incorrectly indicated that the patient was on ASM prior to admission (P=0.77). This suggests that scenario 1 above is the more likely explanation for the increased use of this indication, and that the intervention, in part, simply unmasked the true rate of use at our medical center for the isolated purpose of stress ulcer prophylaxis.
These findings have implications for others attempting to use computerized CDS to better understand physician prescribing. They suggest that information collected through computer‐based interaction with clinicians at the point of care may not always be accurate or complete. As institutions increasingly use similar interventions to drive behavior, information obtained from such interaction should be validated, and when possible, patient outcomes should be measured.
Our findings suggest that rates of ASM use for the purpose of stress ulcer prophylaxis in the hospital may have declined over the last decade. Studies demonstrating that up to 70% of inpatient use of ASM was inappropriate were conducted 5 to 10 years ago.[1, 2, 3, 4, 5] Since then, studies have demonstrated risk of nosocomial infections in patients on ASM.[9, 10, 11] It is possible that the low rate of use for stress ulcer prophylaxis in our study is attributable to awareness of the risks of these medications, and limited our ability to detect differences in overall use. It is also possible, however, that a portion of the admissions with continuation of preadmission medication as the indication were started on these medications during a prior hospitalization. Thus, some portion of preadmission use is likely to represent failed medication reconciliation during a prior discharge. In this context, hospitalization may serve as an opportunity to evaluate the indication for ASM use even when these medications show up as preadmission medications.
There are additional limitations. First, the single‐center nature limits generalizability. Second, the first phase of our study, designed to obtain baseline data on ASM use, may have led to changes in prescribing prior to implementation of our CDS tool. Additionally, we did not validate the accuracy of each of the chosen indications, or the site of initial prescription in the case of preadmission exposure. Last, our study was not powered to investigate changes in rates of nosocomial gastrointestinal bleeding or nosocomial pneumonia owing to the infrequent nature of these complications.
In conclusion, we designed a simple computerized CDS intervention that was associated with a reduction in ASM use for stress ulcer prophylaxis in patients outside the ICU, a nonsignificant reduction in overall use, and no change in use on discharge. The majority of inpatient use represented continuation of preadmission medication, suggesting that interventions to improve the appropriateness of ASM prescribing should span the continuum of care. Future studies should investigate whether it is worthwhile and appropriate to reevaluate continued use of preadmission ASM during an inpatient stay.
Acknowledgements
The authors acknowledge Joshua Guthermann, MBA, and Jane Hui Chen Lim, MBA, for their assistance in the early phases of data analysis, and Long H. Ngo, PhD, for his statistical consultation.
Disclosures: Dr. Herzig was funded by a Young Clinician Research Award from the Center for Integration of Medicine and Innovative Technology, a nonprofit consortium of Boston teaching hospitals and universities, and grant number K23AG042459 from the National Institute on Aging. Dr. Marcantonio was funded by grant number K24AG035075 from the National Institute on Aging. The funding organizations had no involvement in any aspect of the study, including design, conduct, and reporting of the study. Dr. Herzig had full access to all of the data in the study and takes responsibility for the integrity of the data and the accuracy of the data analysis. Drs. Herzig and Marcantonio were responsible for the study concept and design. Drs. Herzig, Feinbloom, Howell, and Ms. Adra and Mr. Afonso were responsible for the acquisition of data. Drs. Herzig, Howell, Marcantonio, and Mr. Guess were responsible for the analysis and interpretation of the data. Dr. Herzig drafted the manuscript. All of the authors participated in the critical revision of the manuscript for important intellectual content. Drs. Herzig and Marcantonio were responsible for study supervision. The authors report no conflicts of interest.
- , . Stress ulcer prophylaxis in hospitalized patients not in intensive care units. Am J Health Syst Pharm. 2007;64(13):1396–1400.
- , . Magnitude and economic impact of inappropriate use of stress ulcer prophylaxis in non‐ICU hospitalized patients. Am J Gastroenterol. 2006;101(10):2200–2205.
- , . Stress‐ulcer prophylaxis for general medical patients: a review of the evidence. J Hosp Med. 2007;2(2):86–92.
- , , , et al. Hospital use of acid‐suppressive medications and its fall‐out on prescribing in general practice: a 1‐month survey. Aliment Pharmacol Ther. 2003;17(12):1503–1506.
- , , , , , . Inadequate use of acid‐suppressive therapy in hospitalized patients and its implications for general practice. Dig Dis Sci. 2005;50(12):2307–2311.
- , . Brief report: reducing inappropriate usage of stress ulcer prophylaxis among internal medicine residents. A practice‐based educational intervention. J Gen Intern Med. 2006;21(5):498–500.
- , , . Inappropriate continuation of stress ulcer prophylactic therapy after discharge. Ann Pharmacother. 2007;41(10):1611–1616.
- , , , et al. Choosing wisely in adult hospital medicine: five opportunities for improved healthcare value. J Hosp Med. 2013;8(9):486–492.
- , , , , . Risk of Clostridium difficile diarrhea among hospital inpatients prescribed proton pump inhibitors: cohort and case‐control studies. CMAJ. 2004;171(1):33–38.
- , , , et al. Iatrogenic gastric acid suppression and the risk of nosocomial Clostridium difficile infection. Arch Intern Med. 2010;170(9):784–790.
- , , , . Acid‐suppressive medication use and the risk for hospital‐acquired pneumonia. JAMA. 2009;301(20):2120–2128.
- Healthcare Cost and Utilization Project. Clinical classifications software (CCS) for ICD‐9‐CM. December 2009. Agency for Healthcare Research and Quality, Rockville, MD. Available at: www.hcup‐us.ahrq.gov/toolssoftware/ccs/ccs.jsp. Accessed June 18, 2014.
Prior studies have found that up to 70% of acid‐suppressive medication (ASM) use in the hospital is not indicated, most commonly for stress ulcer prophylaxis in patients outside of the intensive care unit (ICU).[1, 2, 3, 4, 5, 6, 7] Accordingly, reducing inappropriate use of ASM for stress ulcer prophylaxis in hospitalized patients is 1 of the 5 opportunities for improved healthcare value identified by the Society of Hospital Medicine as part of the American Board of Internal Medicine's Choosing Wisely campaign.[8]
We designed and tested a computerized clinical decision support (CDS) intervention with the goal of reducing use of ASM for stress ulcer prophylaxis in hospitalized patients outside the ICU at an academic medical center.
METHODS
Study Design
We conducted a quasiexperimental study using an interrupted time series to analyze data collected prospectively during clinical care before and after implementation of our intervention. The study was deemed a quality improvement initiative by the Beth Israel Deaconess Medical Center Committee on Clinical Investigations/Institutional Review Board.
Patients and Setting
All admissions >18 years of age to a 649‐bed academic medical center in Boston, Massachusetts from September 12, 2011 through July 3, 2012 were included. The medical center consists of an East and West Campus, located across the street from each other. Care for both critically ill and noncritically ill medical and surgical patients occurs on both campuses. Differences include greater proportions of patients with gastrointestinal and oncologic conditions on the East Campus, and renal and cardiac conditions on the West Campus. Additionally, labor and delivery occurs exclusively on the East Campus, and the density of ICU beds is greater on the West Campus. Both campuses utilize a computer‐based provider order entry (POE) system.
Intervention
Our study was implemented in 2 phases (Figure 1).
Baseline Phase
The purpose of the first phase was to obtain baseline data on ASM use prior to implementing our CDS tool designed to influence prescribing. During this baseline phase, a computerized prompt was activated through our POE system whenever a clinician initiated an order for ASM (histamine 2 receptor antagonists or proton pump inhibitors), asking the clinician to select the reason/reasons for the order based on the following predefined response options: (1) active/recent upper gastrointestinal bleed, (2) continuing preadmission medication, (3) Helicobacter pylori treatment, (4) prophylaxis in patient on medications that increase bleeding risk, (5) stress ulcer prophylaxis, (6) suspected/known peptic ulcer disease, gastritis, esophagitis, gastroesophageal reflux disease, and (7) other, with a free‐text box to input the indication. This indications prompt was rolled out to the entire medical center on September 12, 2011 and remained active for the duration of the study period.
Intervention Phase
In the second phase of the study, if a clinician selected stress ulcer prophylaxis as the only indication for ordering ASM, a CDS prompt alerted the clinician that Stress ulcer prophylaxis is not recommended for patients outside of the intensive care unit (ASHP Therapeutic Guidelines on Stress Ulcer Prophylaxis. Am J Health‐Syst Pharm. 1999, 56:347‐79). The clinician could then select either, For use in ICUOrder Medication, Choose Other Indication, or Cancel Order. This CDS prompt was rolled out in a staggered manner to the East Campus on January 3, 2012, followed by the West Campus on April 3, 2012.
Outcomes
The primary outcome was the rate of ASM use with stress ulcer prophylaxis selected as the only indication in a patient located outside of the ICU. We confirmed patient location in the 24 hours after the order was placed. Secondary outcomes were rates of overall ASM use, defined via pharmacy charges, and rates of use on discharge.
Statistical Analysis
To assure stable measurement of trends, we studied at least 3 months before and after the intervention on each campus. We used the Fisher exact test to compare the rates of our primary and secondary outcomes before and after the intervention, stratified by campus. For our primary outcomeat least 1 ASM order with stress ulcer prophylaxis selected as the only indication during hospitalizationwe developed a logistic regression model with a generalized estimating equation and exchangeable working correlation structure to control for admission characteristics (Table 1) and repeated admissions. Using a term for the interaction between time and the intervention, this model allowed us to assess changes in level and trend for the odds of a patient receiving at least 1 ASM order with stress ulcer prophylaxis as the only indication before, compared to after the intervention, stratified by campus. We used a 2‐sided type I error of 0.05 to indicate statistical significance.
| Study Phase | Campus | |||
|---|---|---|---|---|
| East | West | |||
| Baseline, n=3,747 | Intervention, n=6,191 | Baseline, n=11,177 | Intervention, n=5,285 | |
| ||||
| Age, y, mean (SD) | 48.1 (18.5) | 47.7 (18.2) | 61.0 (18.0) | 60.3 (18.1) |
| Gender, no. (%) | ||||
| Female | 2744 (73.2%) | 4542 (73.4%) | 5551 (49.7%) | 2653 (50.2%) |
| Male | 1003 (26.8%) | 1649 (26.6%) | 5626 (50.3%) | 2632 (49.8%) |
| Race, no. (%) | ||||
| Asian | 281 (7.5%) | 516 (8.3%) | 302 (2.7%) | 156 (3%) |
| Black | 424 (11.3%) | 667 (10.8%) | 1426 (12.8%) | 685 (13%) |
| Hispanic | 224 (6%) | 380 (6.1%) | 619 (5.5%) | 282 (5.3%) |
| Other | 378 (10.1%) | 738 (11.9%) | 776 (6.9%) | 396 (7.5%) |
| White | 2440 (65.1%) | 3890 (62.8%) | 8054 (72%) | 3766 (71.3%) |
| Charlson score, mean (SD) | 0.8 (1.1) | 0.7 (1.1) | 1.5 (1.4) | 1.4 (1.4) |
| Gastrointestinal bleeding, no. (%)* | 49 (1.3%) | 99 (1.6%) | 385 (3.4%) | 149 (2.8%) |
| Other medication exposures, no. (%) | ||||
| Therapeutic anticoagulant | 218 (5.8%) | 409 (6.6%) | 2242 (20.1%) | 1022 (19.3%) |
| Prophylactic anticoagulant | 1081 (28.8%) | 1682 (27.2%) | 5999 (53.7%) | 2892 (54.7%) |
| NSAID | 1899 (50.7%) | 3141 (50.7%) | 1248 (11.2%) | 575 (10.9%) |
| Antiplatelet | 313 (8.4%) | 585 (9.4%) | 4543 (40.6%) | 2071 (39.2%) |
| Admitting department, no. (%) | ||||
| Surgery | 2507 (66.9%) | 4146 (67%) | 3255 (29.1%) | 1578 (29.9%) |
| Nonsurgery | 1240 (33.1%) | 2045 (33%) | 7922 (70.9%) | 3707 (70.1%) |
| Any ICU Stay, no. (%) | 217 (5.8%) | 383 (6.2%) | 2786 (24.9%) | 1252 (23.7%) |
RESULTS
There were 26,400 adult admissions during the study period, and 22,330 discrete orders for ASM. Overall, 12,056 (46%) admissions had at least 1 charge for ASM. Admission characteristics were similar before and after the intervention on each campus (Table 1).
Table 2 shows the indications chosen each time ASM was ordered, stratified by campus and study phase. Although selection of stress ulcer prophylaxis decreased on both campuses during the intervention phase, selection of continuing preadmission medication increased.
| Study Phase | Campus | |||
|---|---|---|---|---|
| East | West | |||
| Baseline, n=2,062 | Intervention, n=3,243 | Baseline, n=12,038 | Intervention, n=4,987 | |
| ||||
| Indication* | ||||
| Continuing preadmission medication | 910 (44.1%) | 1695 (52.3%) | 5597 (46.5%) | 2802 (56.2%) |
| PUD, gastritis, esophagitis, GERD | 440 (21.3%) | 797 (24.6%) | 1303 (10.8%) | 582 (11.7%) |
| Stress ulcer prophylaxis | 298 (14.4%) | 100 (3.1%) | 2659 (22.1%) | 681 (13.7%) |
| Prophylaxis in patient on medications that increase bleeding risk | 226 (11.0%) | 259 (8.0%) | 965 (8.0%) | 411 (8.2%) |
| Active/recent gastrointestinal bleed | 154 (7.5%) | 321 (9.9%) | 1450 (12.0%) | 515 (10.3) |
| Helicobacter pylori treatment | 6 (0.2%) | 2 (0.1%) | 43 (0.4%) | 21 (0.4%) |
| Other | 111 (5.4%) | 156 (4.8%) | 384 (3.2%) | 186 (3.7%) |
Table 3 shows the unadjusted comparison of outcomes between baseline and intervention phases on each campus. Use of ASM with stress ulcer prophylaxis as the only indication decreased during the intervention phase on both campuses. There was a nonsignificant reduction in overall rates of use on both campuses, and use on discharge was unchanged. Figure 2 demonstrates the unadjusted and modeled monthly rates of admissions with at least 1 ASM order with stress ulcer prophylaxis selected as the only indication, stratified by campus. After adjusting for the admission characteristics in Table 1, during the intervention phase on both campuses there was a significant immediate reduction in the odds of receiving an ASM with stress ulcer prophylaxis selected as the only indication (East Campus odds ratio [OR]: 0.36, 95% confidence interval [CI]: 0.180.71; West Campus OR: 0.41, 95% CI: 0.280.60), and a significant change in trend compared to the baseline phase (East Campus 1.5% daily decrease in odds of receiving ASM solely for stress ulcer prophylaxis, P=0.002; West Campus 0.9% daily decrease in odds of receiving ASM solely for stress ulcer prophylaxis, P=0.02).
| Study Phase | Campus | |||||
|---|---|---|---|---|---|---|
| East | West | |||||
| Baseline, n=3,747 | Intervention, n=6,191 | P Value* | Baseline, n=11,177 | Intervention, n=5,285 | P Value* | |
| ||||||
| Outcome | ||||||
| Any inappropriate acid‐suppressive exposure | 4.0% | 0.6% | 0.001 | 7.7% | 2.2% | 0.001 |
| Any acid‐suppressive exposure | 33.1% | 31.8% | 0.16 | 54.5% | 52.9% | 0.05 |
| Discharged on acid‐suppressive medication | 18.9% | 19.6% | 0.40 | 34.7% | 34.7% | 0.95 |
DISCUSSION
In this single‐center study, we found that a computerized CDS intervention resulted in a significant reduction in use of ASM for the sole purpose of stress ulcer prophylaxis in patients outside the ICU, a nonsignificant reduction in overall use, and no change in use on discharge. We found low rates of use for the isolated purpose of stress ulcer prophylaxis even before the intervention, and continuing preadmission medication was the most commonly selected indication throughout the study.
Although overall rates of ASM use declined after the intervention, the change was not statistically significant, and was not of the same magnitude as the decline in rates of use for the purpose of stress ulcer prophylaxis. This suggests that our intervention, in part, led to substitution of 1 indication for another. The indication that increased the most after rollout on both campuses was continuing preadmission medication. There are at least 2 possibilities for this finding: (1) the intervention prompted physicians to more accurately record the indication, or (2) physicians falsified the indication in order to execute the order. To explore these possibilities, we reviewed the charts of a random sample of 100 admissions during each of the baseline and intervention phases where continuing preadmission medication was selected as an indication for an ASM order. We found that 6/100 orders in the baseline phase and 7/100 orders in the intervention phase incorrectly indicated that the patient was on ASM prior to admission (P=0.77). This suggests that scenario 1 above is the more likely explanation for the increased use of this indication, and that the intervention, in part, simply unmasked the true rate of use at our medical center for the isolated purpose of stress ulcer prophylaxis.
These findings have implications for others attempting to use computerized CDS to better understand physician prescribing. They suggest that information collected through computer‐based interaction with clinicians at the point of care may not always be accurate or complete. As institutions increasingly use similar interventions to drive behavior, information obtained from such interaction should be validated, and when possible, patient outcomes should be measured.
Our findings suggest that rates of ASM use for the purpose of stress ulcer prophylaxis in the hospital may have declined over the last decade. Studies demonstrating that up to 70% of inpatient use of ASM was inappropriate were conducted 5 to 10 years ago.[1, 2, 3, 4, 5] Since then, studies have demonstrated risk of nosocomial infections in patients on ASM.[9, 10, 11] It is possible that the low rate of use for stress ulcer prophylaxis in our study is attributable to awareness of the risks of these medications, and limited our ability to detect differences in overall use. It is also possible, however, that a portion of the admissions with continuation of preadmission medication as the indication were started on these medications during a prior hospitalization. Thus, some portion of preadmission use is likely to represent failed medication reconciliation during a prior discharge. In this context, hospitalization may serve as an opportunity to evaluate the indication for ASM use even when these medications show up as preadmission medications.
There are additional limitations. First, the single‐center nature limits generalizability. Second, the first phase of our study, designed to obtain baseline data on ASM use, may have led to changes in prescribing prior to implementation of our CDS tool. Additionally, we did not validate the accuracy of each of the chosen indications, or the site of initial prescription in the case of preadmission exposure. Last, our study was not powered to investigate changes in rates of nosocomial gastrointestinal bleeding or nosocomial pneumonia owing to the infrequent nature of these complications.
In conclusion, we designed a simple computerized CDS intervention that was associated with a reduction in ASM use for stress ulcer prophylaxis in patients outside the ICU, a nonsignificant reduction in overall use, and no change in use on discharge. The majority of inpatient use represented continuation of preadmission medication, suggesting that interventions to improve the appropriateness of ASM prescribing should span the continuum of care. Future studies should investigate whether it is worthwhile and appropriate to reevaluate continued use of preadmission ASM during an inpatient stay.
Acknowledgements
The authors acknowledge Joshua Guthermann, MBA, and Jane Hui Chen Lim, MBA, for their assistance in the early phases of data analysis, and Long H. Ngo, PhD, for his statistical consultation.
Disclosures: Dr. Herzig was funded by a Young Clinician Research Award from the Center for Integration of Medicine and Innovative Technology, a nonprofit consortium of Boston teaching hospitals and universities, and grant number K23AG042459 from the National Institute on Aging. Dr. Marcantonio was funded by grant number K24AG035075 from the National Institute on Aging. The funding organizations had no involvement in any aspect of the study, including design, conduct, and reporting of the study. Dr. Herzig had full access to all of the data in the study and takes responsibility for the integrity of the data and the accuracy of the data analysis. Drs. Herzig and Marcantonio were responsible for the study concept and design. Drs. Herzig, Feinbloom, Howell, and Ms. Adra and Mr. Afonso were responsible for the acquisition of data. Drs. Herzig, Howell, Marcantonio, and Mr. Guess were responsible for the analysis and interpretation of the data. Dr. Herzig drafted the manuscript. All of the authors participated in the critical revision of the manuscript for important intellectual content. Drs. Herzig and Marcantonio were responsible for study supervision. The authors report no conflicts of interest.
- , . Stress ulcer prophylaxis in hospitalized patients not in intensive care units. Am J Health Syst Pharm. 2007;64(13):1396–1400.
- , . Magnitude and economic impact of inappropriate use of stress ulcer prophylaxis in non‐ICU hospitalized patients. Am J Gastroenterol. 2006;101(10):2200–2205.
- , . Stress‐ulcer prophylaxis for general medical patients: a review of the evidence. J Hosp Med. 2007;2(2):86–92.
- , , , et al. Hospital use of acid‐suppressive medications and its fall‐out on prescribing in general practice: a 1‐month survey. Aliment Pharmacol Ther. 2003;17(12):1503–1506.
- , , , , , . Inadequate use of acid‐suppressive therapy in hospitalized patients and its implications for general practice. Dig Dis Sci. 2005;50(12):2307–2311.
- , . Brief report: reducing inappropriate usage of stress ulcer prophylaxis among internal medicine residents. A practice‐based educational intervention. J Gen Intern Med. 2006;21(5):498–500.
- , , . Inappropriate continuation of stress ulcer prophylactic therapy after discharge. Ann Pharmacother. 2007;41(10):1611–1616.
- , , , et al. Choosing wisely in adult hospital medicine: five opportunities for improved healthcare value. J Hosp Med. 2013;8(9):486–492.
- , , , , . Risk of Clostridium difficile diarrhea among hospital inpatients prescribed proton pump inhibitors: cohort and case‐control studies. CMAJ. 2004;171(1):33–38.
- , , , et al. Iatrogenic gastric acid suppression and the risk of nosocomial Clostridium difficile infection. Arch Intern Med. 2010;170(9):784–790.
- , , , . Acid‐suppressive medication use and the risk for hospital‐acquired pneumonia. JAMA. 2009;301(20):2120–2128.
- Healthcare Cost and Utilization Project. Clinical classifications software (CCS) for ICD‐9‐CM. December 2009. Agency for Healthcare Research and Quality, Rockville, MD. Available at: www.hcup‐us.ahrq.gov/toolssoftware/ccs/ccs.jsp. Accessed June 18, 2014.

In‐Hospital Stroke Alerts
Acute change in neurologic status in a hospitalized patient is an emergency requiring timely coordinated evaluation. To address this need, many hospitals have created a mechanism for in‐hospital stroke alerts utilizing generalized rapid response teams or specialized stroke teams.[1, 2, 3] The common purpose is to quickly diagnose new ischemic stroke within the time window for thrombolytic therapy.
Even when acute change in neurologic status is not due to brain ischemia, it may represent a new metabolic disturbance or reflect developing serious systemic illness. Sepsis, hypoglycemia, cardiac arrhythmia, respiratory failure, severe electrolyte disturbances, seizures, or delirium may first manifest as a change in neurologic status.
Prior research on stroke alerts has largely focused on patients who present from the community to the emergency department (ED).[4, 5, 6, 7, 8] Patients who develop acute neurologic symptoms during hospitalization have different risk factors and exposures compared to patients in the community.[9] This study represents the experience of a multistate quality improvement initiative for in‐hospital stroke. We characterize etiologies for symptoms triggering in‐hospital stroke alerts and thrombolytic treatment for in‐hospital strokes.
PATIENTS AND METHODS
The National Stroke Association's (NSA) initiative, Improving In‐Hospital Stroke Response: A Team‐based Quality Improvement Program, included data collection for all in‐hospital stroke alerts over a 12‐month period.[10] Six Joint Commission certified primary stroke centers from Michigan, South Carolina, Pennsylvania, Colorado, Washington, and North Carolina completed the 1‐year quality improvement initiative. One additional site withdrew from the program after the first quarter and was not included in this analysis. Sites prospectively reported deidentified patient‐level data on all adult in‐hospital stroke alerts from July 2010 to June 2011 to the NSA. At all sites, any provider could activate the in‐hospital stroke response system. Stroke alerts were evaluated by a rapid response team with stroke training. The providers on the stroke rapid response team varied between sites. A nurse with stroke training was 1 of the first responders on the stroke response team at all sites.
The NSA in‐hospital stroke‐alert criteria included the following symptoms occurring in the last 24‐hours, even if they resolved: (1) sudden numbness or weakness of the face, arm or leg, especially on 1 side of the body; (2) sudden confusion, trouble speaking or understanding; (3) sudden trouble seeing in 1 or both eyes; (4) sudden trouble walking, dizziness, loss of balance or coordination; and (5) sudden, severe headache with no known cause. Hospitals reported location, service, age, sex, race, symptoms triggering the stroke alert, free text entry of final clinical diagnosis following the completion of stroke alert evaluation, treatment with intravenous or intra‐arterial/mechanical thrombolysis, and any contraindications to intravenous thrombolysis. We categorized stroke mimics using the responses in the final diagnosis field after the data collection period was complete. Strokes were categorized as ischemic stroke, transient ischemic attack (TIA), or intracranial hemorrhage (intraparenchymal, intraventricular, epidural, subdural, or subarachnoid). Stroke mimics were subdivided according to the categories in Table 1. Lack of certainty in the final diagnosis was handled by creating a category of possible TIA, which includes alternative diagnosis versus TIA or the qualifier possible before TIA. Patients with final diagnoses unable to be determined were classified as stroke mimics. Institutional review board exemption was obtained for the deidentified prospective data registry of this quality‐improvement program.
| Diagnosis | No. (N=393) | % |
|---|---|---|
| ||
| Ischemic stroke | 167 | 42.5% |
| TIA (definite, probable, or likely) | 27 | 6.9% |
| TIA (possible or versus a mimic) | 7 | 1.8% |
| Syncope, hypotension, presyncope, bradycardia | 23 | 5.9% |
| Seizure | 23 | 5.9% |
| Delirium/encephalopathy/acute confusional state/dementia | 23 | 5.9% |
| Stroke mimic NOS | 21 | 5.3% |
| Other (examples include Parkinson's crisis, musculoskeletal, primary ophthalmologic diagnosis, or cardiovascular ischemia) | 17 | 4.3% |
| Final diagnosis uncertain | 16 | 4.1% |
| Medication effect (sedation due to narcotics, limb weakness due to epidural anesthetic, pupil dilation from ipratropium) | 15 | 3.8% |
| Metabolic (hypoglycemia, electrolyte abnormality, hypercarbia, acid/base disorders, respiratory failure) | 12 | 3.1% |
| Intracranial hemorrhage (intraparenchymal hemorrhage, subarachnoid hemorrhage, subdural hematoma) | 11 | 2.8% |
| Conversion disorder/psychiatric/functional/medically unexplained symptoms | 7 | 1.8% |
| Old deficit due to remote stroke | 6 | 1.5% |
| Peripheral neuropathy (Bell's palsy, cranial nerve palsy, compression neuropathy) | 6 | 1.5% |
| Sepsis/emnfection | 5 | 1.3% |
| Migraine | 4 | 1.0% |
| Peripheral vestibular dysfunction | 3 | 0.8% |
RESULTS
During the 12‐month data collection period, 393 in‐hospital stroke alerts were reported to the NSA. Hospitals reported an average of 65.5 in‐hospital stroke alerts (range, 27156; standard deviation 46.8) (Table 2). Median age was 70 years (range, 18 to >89 years, interquartile range [IQR], 6280 years). Of the stoke alert patients, 52.8% were female, 81.7% were white, 12.7% were black, 2.9% were Hispanic, and 2.7% were other or were unable to be determined. The most common primary services were medicine/hospitalist (36.4%), cardiology (19.5%), cardiothoracic/vascular surgery (13%), and orthopedic surgery (8.6%).
| All Six Sites | Site A | Site B | Site C | Site D | Site E | Site F | |
|---|---|---|---|---|---|---|---|
| |||||||
| No. of stroke alerts | 393 | 156 | 72 | 50 | 49 | 39 | 27 |
| Median age, y, (IQR 25th to 75th percentile), no. with data for this demographic | 70.0 (6280) 376 | 71.0 (63.081.0) 156 | 68.0 (58.879.3) 72 | 76.5 (65.585.0) 50 | 71.0 (63.078.5) 48 | 75.0 (58.584.5) 23 | 77.0 (66.084.5) 27 |
| Sex, % female, no. with data for this demographic | 52.8%, 377 | 48.7%, 156 | 63.9%, 72 | 52%, 50 | 49.0%, 49 | 52.2%, 23 | 55.6%, 27 |
| Race, no. (%) | |||||||
| White | 308 (81.7%) | 146 (93.6%) | 40 (55.6%) | 47 (94%) | 39 (80.0%) | 15 (65.2%) | 21 (77.8%) |
| Black or African American | 48 (12.7%) | 3 (1.9%) | 32 (44.4%) | 1 (2%) | 6 (12.2%) | 0 (0%) | 6 (22.2%) |
| Hispanic | 11 (2.9%) | 3 (1.9%) | 0 (0%) | 1 (2%) | 1 (2.0%) | 6 (26.1%) | 0 (0%) |
| Other or unable to determine | 10 (2.7%) | 4 (2.6%) | 0 (0%) | 1 (2%) | 3 (6.1%) | 2 (8.7%) | 0 (0%) |
| No. with data for this demographic | 377 | 156 | 72 | 50 | 49 | 23 | 27 |
| Service caring for patient, no. (%) | |||||||
| General medicine | 123 (36.4%) | 44 (32.1%) | 29 (40.3%) | 21 (46.7%) | 11 (22.9%) | 7 (77.7%) | 11 (40.7%) |
| Cardiology | 66 (19.5%) | 36 (26.3%) | 11 (15.3%) | 10 (22.2%) | 9 (18.8%) | 0 (0%) | 0 (0%) |
| Cardiothoracic/vascular surgery | 44 (13.0%) | 21 (15.3%) | 8 (11.1%) | 3 (6.7%) | 11 (22.9%) | 0 (0%) | 1 (3.7%) |
| Orthopedic surgery | 29 (8.6%) | 17 (12.4%) | 4 (5.6%) | 3 (6.7%) | 2 (4.2%) | 0 (0%) | 3 (11.1%) |
| Family practice | 13 (3.8%) | 2 (1.5%) | 1 (1.4%) | 1 (2.2%) | 0 (0%) | 0 (0%) | 9 (33.3%) |
| Pulmonology/critical care | 11 (3.3%) | 4 (2.9%) | 4 (5.6%) | 2 (4.4%) | 1 (2.1%) | 0 (0%) | 0 (0%) |
| General surgery | 11 (3.3%) | 4 (2.9%) | 1 (1.4%) | 3 (6.7%) | 2 (4.2%) | 0 (0%) | 1 (3.7%) |
| Other | 41 (12.1%) | 9 (6.6%) | 14 (19.4%) | 2 (4.4%) | 12 (25.0%) | 2 (22.2) | 2 (7.4%) |
| No. with data for this demographic | 338 | 137 | 72 | 45 | 48 | 9 | 27 |
| In‐hospital stroke alert mimic rate | |||||||
| Percent stroke mimics(confidence range)* | 46.1% (42.0%47.8%) | 48.7% (42.9%51.3%) | 50.0% (50.0%50.0%) | 28.0% (28.0%30.0%) | 42.9% (36.7%46.9%) | 66.7% (56.4%66.7%) | 29.6% (29.6%29.6%) |
Of the stroke alert patients, 167 (42.5%) were found to have ischemic stroke, 27 (6.9%) TIA, 11 (2.8%) intracranial hemorrhage, and 7 (1.8%) had TIA possible or considered along with a stroke mimic in the final diagnosis. The stroke mimic rate was 46.1%, with a confidence range of 42.0% to 47.8% depending on the true pathologic cause of the alerts in the categories possible TIA and final diagnosis uncertain. Participating hospitals had an alarm rate for stroke mimics ranging from 28.0% to 66.7% (median, 45.8%; IQR, 32.9%49.7%) (Table 2). The most common stroke mimics were seizure, hypotension, and delirium (Table 1). Data were available on symptoms that triggered the alert in 373 (94.9%) of cases. Eighteen alerts (4.8%) were for symptoms clearly not included in the NSA stroke alert criteria. The final diagnosis was acute ischemic stroke/TIA or intracranial hemorrhage in 4 of these 18 (22.2%) nonconforming alerts. If alerts called for a decrease in consciousness were also considered nonconforming, then 67 alerts (18.0%) could be categorized as nonconforming. However, 24 of these 67 alerts (35.8%) had a final diagnosis of acute ischemic stroke/TIA or intracranial hemorrhage.
For 194 patients with a final diagnosis of ischemic stroke or TIA, intravenous thrombolysis alone was used for 16 in‐hospital stroke patients (8.2%), 20 received intra‐arterial/mechanical thrombolysis alone (10.3%), and 2 patients received both (1%) (Table 3). No patient with a stroke mimic received thrombolysis.
| |
| Treatment of stroke alerts with final diagnosis of ischemic stroke or TIA, no. (%), n=194 | |
| Treated with IV thrombolysis alone | 16 (8.2%) |
| Treated with IA or mechanical thrombolysis alone | 20 (10.3%) |
| Treated with both IV and IA/mechanical thrombolysis | 2 (1.0%) |
| Contraindication to IV thrombolysis for patients not treated with IV thrombolysis, no. (%), n=176* | |
| Multiple | 42 (23.9%) |
| Time based | 27 (15.3%) |
| Medical | 25 (14.2%) |
| Contraindication not otherwise specified | 24 (13.6%) |
| Surgical/procedural | 20 (11.4%) |
| Minor or rapidly improving symptoms | 19 (10.8%) |
| Anticoagulation | 7 (4.0%) |
| Other | 4 (2.3%) |
| Goals of care | 3 (1.7%) |
| Data unavailable | 3 (1.7%) |
| Seizure at onset of symptoms | 2 (1.1%) |
DISCUSSION
Given the protean manifestations of brain ischemia, and significant symptom overlap with many mimics, stroke alert criteria casts a wide net in order not to miss or delay evaluation and treatment of true brain ischemia. Time is critical given the association of improved outcomes with more rapid delivery of treatment.[11] The inevitable consequence of the combination of time pressure and clinical uncertainty based solely on physical exam will be alerts due to stroke mimics. Our analysis reveals many of these alternative diagnoses also require urgent evaluation and treatment.
Prior research has found a large proportion of in‐hospital stroke alerts are not for cerebrovascular events.[1, 4, 12] We observed an average of 46.1% of in‐hospital stroke alerts were due to mimics. This rate is substantially higher than described in studies of stroke mimics in the ED.[7, 13, 14] The largest analysis over a 10‐year period from 2 hospitals in Washington found a 30% stroke mimic rate and concluded that in‐hospital location for symptom onset was a statistically significant predictor of being a mimic rather than a cerebrovascular event.[4] One single‐center trial in North Carolina found markedly higher mimic rates for in‐hospital stroke alerts (73%) versus ED stroke alerts (49%).[12] Assessment of neurologic symptoms is challenging in patients already hospitalized for acute medical conditions. The interaction of systemic illness, medications, and surgery seen in the hospital setting may make it more difficult to distinguish between cerebrovascular events and their many mimics.
Interpretation of NSA criteria for calling a stroke code likely varied within and between sites, and inter‐rater reliability of physical signs was not assessed, which is a limitation of the data. Observed rates of stroke for alerts that did not conform to the NSA criteria suggest that clinical judgment remains valuable. Final diagnoses were assigned by the stroke programs, and reliability of this assessment was not evaluated. Sites were not asked to use a specific categorization scheme to group final diagnoses. This analysis was limited to stroke centers with existing infrastructure to respond to stroke alerts and participated in an explicit quality‐improvement initiative on in‐hospital stroke response. Mimic and thrombolysis treatment rates may be different for hospitals without this stroke expertise.
Clinical uncertainty as to final diagnosis was addressed with the inclusion of confidence intervals accounting for potential misdiagnosis of the events in the categories of possible TIA or in the cases where the final diagnosis was unknown. Other studies have categorized TIA versus an alternative diagnosis as stroke mimic, and so our methodology is expected to yield a conservative estimate of the stroke mimic rate. Delirium is often a multifactorial phenomenon, so there may be an element of overlap between this category and other more specific mimic etiologies such as infection, hypotension, metabolic, or medication effect.
This initiative did not have the ability to assess the false negative rate of stroke team activation (failure to identify stroke symptoms in time for acute evaluation). It is not possible to calculate the sensitivity of stroke alerts in each center or conclude the optimal rate of false alarms. The finding of inter‐institutional variability in stroke alerts due to true brain ischemia could be explained by differences in staff education, systematic differences in the patient populations cared for among hospitals, or variation in institutional acceptance of having activated the stroke response team for cases with lower pretest probability of stroke. Sensitivity of alert criteria is more important than specificity, given the consequences of missing a potentially treatable emergent condition.
In conclusion, in this multi‐institution analysis of in‐hospital stroke alerts, a substantial proportion of in‐hospital strokes received thrombolytic therapy. Almost half of stroke alerts will not be for stroke or TIA. For many patients in our study, a change in neurologic status represented a harbinger of a change in general medical condition (hemorrhage, hypotension, hypoglycemia, or respiratory failure). Rapid response systems used for stroke in the hospital need to be trained and prepared to respond to a variety of acute medical conditions that extend beyond ischemic stroke.
Acknowledgements
This work was possible through the National Stroke Association's (NSA) In‐hospital Stroke Quality Improvement Initiative and NSA staff members including Jane Staller, MEd, Miranda N. Bretz, MS, and Amy K. Jensen.
Disclosures: This quality improvement project was funded by an educational grant to the National Stroke Association from Genentech, Inc. and Penumbra, Inc. The funding organizations had no role in the design, content, or preparation of this manuscript. The authors report no conflicts of interest.
- , , , , . Stroke alert program improves recognition and evaluation time of in‐hospital ischemic stroke. J Stroke Cerebrovasc Dis. 2010;19:494–496.
- , , . Code gray—an organized approach to inpatient stroke. Crit Care Nurs Q. 2003;26:296–302.
- , , . ID, Stat: rapid response to in‐hospital stroke patients. Nurs Manage. 2009;40:34–38.
- , , , et al. Predictors of acute stroke mimics in 8187 patients referred to a stroke service. J Stroke Cerebrovasc Dis. 2013;22:e397–e403.
- , , , , , . How to identify stroke mimics in patients eligible for intravenous thrombolysis? J Neurol. 2012;259:1347–1353.
- , , , , . Distinguishing between stroke and mimic at the bedside: The Brain Attack Study. Stroke. 2006;37:769–775.
- , , , . Identification of nonischemic stroke mimics among 411 code strokes at the University of California, San Diego, Stroke Center. J Stroke Cerebrovasc Dis. 2008;17:23–25.
- , , , . Identification of stroke mimics in the emergency department setting. J Brain Dis. 2009;1:19–22.
- , , , et al. Comparison of the characteristics for in‐hospital and out‐of‐hospital ischaemic strokes. Eur J Neur. 2009;16:582–588.
- National Stroke Association. Improving in‐hospital stroke through quality improvement interventions webinar. Available at: http://www.stroke.org/we‐can‐help/healthcare‐professionals/improve‐your‐skills/pre‐hospital‐acute‐stroke‐programs‐4. Accessed December 18, 2014.
- , , , et al. Time to treatment with intravenous tissue plasminogen activator and outcome from acute ischemic stroke. JAMA. 2013;309:2480–2488.
- , . “Code Stroke”: hospitalized versus emergency department patients. J Stroke Cerebrovasc Dis. 2013;22:345–348.
- , , , et al. Diagnostic accuracy of stroke referrals from primary care, emergency room physicians, and ambulance staff using the face arm speech test. Stroke. 2003;34:71–76.
- , , , , , . Hospitalization of non‐stroke patients in a stroke unit [in German]. Dtsch Med Wochenschr. 2004;129:731–735.
Acute change in neurologic status in a hospitalized patient is an emergency requiring timely coordinated evaluation. To address this need, many hospitals have created a mechanism for in‐hospital stroke alerts utilizing generalized rapid response teams or specialized stroke teams.[1, 2, 3] The common purpose is to quickly diagnose new ischemic stroke within the time window for thrombolytic therapy.
Even when acute change in neurologic status is not due to brain ischemia, it may represent a new metabolic disturbance or reflect developing serious systemic illness. Sepsis, hypoglycemia, cardiac arrhythmia, respiratory failure, severe electrolyte disturbances, seizures, or delirium may first manifest as a change in neurologic status.
Prior research on stroke alerts has largely focused on patients who present from the community to the emergency department (ED).[4, 5, 6, 7, 8] Patients who develop acute neurologic symptoms during hospitalization have different risk factors and exposures compared to patients in the community.[9] This study represents the experience of a multistate quality improvement initiative for in‐hospital stroke. We characterize etiologies for symptoms triggering in‐hospital stroke alerts and thrombolytic treatment for in‐hospital strokes.
PATIENTS AND METHODS
The National Stroke Association's (NSA) initiative, Improving In‐Hospital Stroke Response: A Team‐based Quality Improvement Program, included data collection for all in‐hospital stroke alerts over a 12‐month period.[10] Six Joint Commission certified primary stroke centers from Michigan, South Carolina, Pennsylvania, Colorado, Washington, and North Carolina completed the 1‐year quality improvement initiative. One additional site withdrew from the program after the first quarter and was not included in this analysis. Sites prospectively reported deidentified patient‐level data on all adult in‐hospital stroke alerts from July 2010 to June 2011 to the NSA. At all sites, any provider could activate the in‐hospital stroke response system. Stroke alerts were evaluated by a rapid response team with stroke training. The providers on the stroke rapid response team varied between sites. A nurse with stroke training was 1 of the first responders on the stroke response team at all sites.
The NSA in‐hospital stroke‐alert criteria included the following symptoms occurring in the last 24‐hours, even if they resolved: (1) sudden numbness or weakness of the face, arm or leg, especially on 1 side of the body; (2) sudden confusion, trouble speaking or understanding; (3) sudden trouble seeing in 1 or both eyes; (4) sudden trouble walking, dizziness, loss of balance or coordination; and (5) sudden, severe headache with no known cause. Hospitals reported location, service, age, sex, race, symptoms triggering the stroke alert, free text entry of final clinical diagnosis following the completion of stroke alert evaluation, treatment with intravenous or intra‐arterial/mechanical thrombolysis, and any contraindications to intravenous thrombolysis. We categorized stroke mimics using the responses in the final diagnosis field after the data collection period was complete. Strokes were categorized as ischemic stroke, transient ischemic attack (TIA), or intracranial hemorrhage (intraparenchymal, intraventricular, epidural, subdural, or subarachnoid). Stroke mimics were subdivided according to the categories in Table 1. Lack of certainty in the final diagnosis was handled by creating a category of possible TIA, which includes alternative diagnosis versus TIA or the qualifier possible before TIA. Patients with final diagnoses unable to be determined were classified as stroke mimics. Institutional review board exemption was obtained for the deidentified prospective data registry of this quality‐improvement program.
| Diagnosis | No. (N=393) | % |
|---|---|---|
| ||
| Ischemic stroke | 167 | 42.5% |
| TIA (definite, probable, or likely) | 27 | 6.9% |
| TIA (possible or versus a mimic) | 7 | 1.8% |
| Syncope, hypotension, presyncope, bradycardia | 23 | 5.9% |
| Seizure | 23 | 5.9% |
| Delirium/encephalopathy/acute confusional state/dementia | 23 | 5.9% |
| Stroke mimic NOS | 21 | 5.3% |
| Other (examples include Parkinson's crisis, musculoskeletal, primary ophthalmologic diagnosis, or cardiovascular ischemia) | 17 | 4.3% |
| Final diagnosis uncertain | 16 | 4.1% |
| Medication effect (sedation due to narcotics, limb weakness due to epidural anesthetic, pupil dilation from ipratropium) | 15 | 3.8% |
| Metabolic (hypoglycemia, electrolyte abnormality, hypercarbia, acid/base disorders, respiratory failure) | 12 | 3.1% |
| Intracranial hemorrhage (intraparenchymal hemorrhage, subarachnoid hemorrhage, subdural hematoma) | 11 | 2.8% |
| Conversion disorder/psychiatric/functional/medically unexplained symptoms | 7 | 1.8% |
| Old deficit due to remote stroke | 6 | 1.5% |
| Peripheral neuropathy (Bell's palsy, cranial nerve palsy, compression neuropathy) | 6 | 1.5% |
| Sepsis/emnfection | 5 | 1.3% |
| Migraine | 4 | 1.0% |
| Peripheral vestibular dysfunction | 3 | 0.8% |
RESULTS
During the 12‐month data collection period, 393 in‐hospital stroke alerts were reported to the NSA. Hospitals reported an average of 65.5 in‐hospital stroke alerts (range, 27156; standard deviation 46.8) (Table 2). Median age was 70 years (range, 18 to >89 years, interquartile range [IQR], 6280 years). Of the stoke alert patients, 52.8% were female, 81.7% were white, 12.7% were black, 2.9% were Hispanic, and 2.7% were other or were unable to be determined. The most common primary services were medicine/hospitalist (36.4%), cardiology (19.5%), cardiothoracic/vascular surgery (13%), and orthopedic surgery (8.6%).
| All Six Sites | Site A | Site B | Site C | Site D | Site E | Site F | |
|---|---|---|---|---|---|---|---|
| |||||||
| No. of stroke alerts | 393 | 156 | 72 | 50 | 49 | 39 | 27 |
| Median age, y, (IQR 25th to 75th percentile), no. with data for this demographic | 70.0 (6280) 376 | 71.0 (63.081.0) 156 | 68.0 (58.879.3) 72 | 76.5 (65.585.0) 50 | 71.0 (63.078.5) 48 | 75.0 (58.584.5) 23 | 77.0 (66.084.5) 27 |
| Sex, % female, no. with data for this demographic | 52.8%, 377 | 48.7%, 156 | 63.9%, 72 | 52%, 50 | 49.0%, 49 | 52.2%, 23 | 55.6%, 27 |
| Race, no. (%) | |||||||
| White | 308 (81.7%) | 146 (93.6%) | 40 (55.6%) | 47 (94%) | 39 (80.0%) | 15 (65.2%) | 21 (77.8%) |
| Black or African American | 48 (12.7%) | 3 (1.9%) | 32 (44.4%) | 1 (2%) | 6 (12.2%) | 0 (0%) | 6 (22.2%) |
| Hispanic | 11 (2.9%) | 3 (1.9%) | 0 (0%) | 1 (2%) | 1 (2.0%) | 6 (26.1%) | 0 (0%) |
| Other or unable to determine | 10 (2.7%) | 4 (2.6%) | 0 (0%) | 1 (2%) | 3 (6.1%) | 2 (8.7%) | 0 (0%) |
| No. with data for this demographic | 377 | 156 | 72 | 50 | 49 | 23 | 27 |
| Service caring for patient, no. (%) | |||||||
| General medicine | 123 (36.4%) | 44 (32.1%) | 29 (40.3%) | 21 (46.7%) | 11 (22.9%) | 7 (77.7%) | 11 (40.7%) |
| Cardiology | 66 (19.5%) | 36 (26.3%) | 11 (15.3%) | 10 (22.2%) | 9 (18.8%) | 0 (0%) | 0 (0%) |
| Cardiothoracic/vascular surgery | 44 (13.0%) | 21 (15.3%) | 8 (11.1%) | 3 (6.7%) | 11 (22.9%) | 0 (0%) | 1 (3.7%) |
| Orthopedic surgery | 29 (8.6%) | 17 (12.4%) | 4 (5.6%) | 3 (6.7%) | 2 (4.2%) | 0 (0%) | 3 (11.1%) |
| Family practice | 13 (3.8%) | 2 (1.5%) | 1 (1.4%) | 1 (2.2%) | 0 (0%) | 0 (0%) | 9 (33.3%) |
| Pulmonology/critical care | 11 (3.3%) | 4 (2.9%) | 4 (5.6%) | 2 (4.4%) | 1 (2.1%) | 0 (0%) | 0 (0%) |
| General surgery | 11 (3.3%) | 4 (2.9%) | 1 (1.4%) | 3 (6.7%) | 2 (4.2%) | 0 (0%) | 1 (3.7%) |
| Other | 41 (12.1%) | 9 (6.6%) | 14 (19.4%) | 2 (4.4%) | 12 (25.0%) | 2 (22.2) | 2 (7.4%) |
| No. with data for this demographic | 338 | 137 | 72 | 45 | 48 | 9 | 27 |
| In‐hospital stroke alert mimic rate | |||||||
| Percent stroke mimics(confidence range)* | 46.1% (42.0%47.8%) | 48.7% (42.9%51.3%) | 50.0% (50.0%50.0%) | 28.0% (28.0%30.0%) | 42.9% (36.7%46.9%) | 66.7% (56.4%66.7%) | 29.6% (29.6%29.6%) |
Of the stroke alert patients, 167 (42.5%) were found to have ischemic stroke, 27 (6.9%) TIA, 11 (2.8%) intracranial hemorrhage, and 7 (1.8%) had TIA possible or considered along with a stroke mimic in the final diagnosis. The stroke mimic rate was 46.1%, with a confidence range of 42.0% to 47.8% depending on the true pathologic cause of the alerts in the categories possible TIA and final diagnosis uncertain. Participating hospitals had an alarm rate for stroke mimics ranging from 28.0% to 66.7% (median, 45.8%; IQR, 32.9%49.7%) (Table 2). The most common stroke mimics were seizure, hypotension, and delirium (Table 1). Data were available on symptoms that triggered the alert in 373 (94.9%) of cases. Eighteen alerts (4.8%) were for symptoms clearly not included in the NSA stroke alert criteria. The final diagnosis was acute ischemic stroke/TIA or intracranial hemorrhage in 4 of these 18 (22.2%) nonconforming alerts. If alerts called for a decrease in consciousness were also considered nonconforming, then 67 alerts (18.0%) could be categorized as nonconforming. However, 24 of these 67 alerts (35.8%) had a final diagnosis of acute ischemic stroke/TIA or intracranial hemorrhage.
For 194 patients with a final diagnosis of ischemic stroke or TIA, intravenous thrombolysis alone was used for 16 in‐hospital stroke patients (8.2%), 20 received intra‐arterial/mechanical thrombolysis alone (10.3%), and 2 patients received both (1%) (Table 3). No patient with a stroke mimic received thrombolysis.
| |
| Treatment of stroke alerts with final diagnosis of ischemic stroke or TIA, no. (%), n=194 | |
| Treated with IV thrombolysis alone | 16 (8.2%) |
| Treated with IA or mechanical thrombolysis alone | 20 (10.3%) |
| Treated with both IV and IA/mechanical thrombolysis | 2 (1.0%) |
| Contraindication to IV thrombolysis for patients not treated with IV thrombolysis, no. (%), n=176* | |
| Multiple | 42 (23.9%) |
| Time based | 27 (15.3%) |
| Medical | 25 (14.2%) |
| Contraindication not otherwise specified | 24 (13.6%) |
| Surgical/procedural | 20 (11.4%) |
| Minor or rapidly improving symptoms | 19 (10.8%) |
| Anticoagulation | 7 (4.0%) |
| Other | 4 (2.3%) |
| Goals of care | 3 (1.7%) |
| Data unavailable | 3 (1.7%) |
| Seizure at onset of symptoms | 2 (1.1%) |
DISCUSSION
Given the protean manifestations of brain ischemia, and significant symptom overlap with many mimics, stroke alert criteria casts a wide net in order not to miss or delay evaluation and treatment of true brain ischemia. Time is critical given the association of improved outcomes with more rapid delivery of treatment.[11] The inevitable consequence of the combination of time pressure and clinical uncertainty based solely on physical exam will be alerts due to stroke mimics. Our analysis reveals many of these alternative diagnoses also require urgent evaluation and treatment.
Prior research has found a large proportion of in‐hospital stroke alerts are not for cerebrovascular events.[1, 4, 12] We observed an average of 46.1% of in‐hospital stroke alerts were due to mimics. This rate is substantially higher than described in studies of stroke mimics in the ED.[7, 13, 14] The largest analysis over a 10‐year period from 2 hospitals in Washington found a 30% stroke mimic rate and concluded that in‐hospital location for symptom onset was a statistically significant predictor of being a mimic rather than a cerebrovascular event.[4] One single‐center trial in North Carolina found markedly higher mimic rates for in‐hospital stroke alerts (73%) versus ED stroke alerts (49%).[12] Assessment of neurologic symptoms is challenging in patients already hospitalized for acute medical conditions. The interaction of systemic illness, medications, and surgery seen in the hospital setting may make it more difficult to distinguish between cerebrovascular events and their many mimics.
Interpretation of NSA criteria for calling a stroke code likely varied within and between sites, and inter‐rater reliability of physical signs was not assessed, which is a limitation of the data. Observed rates of stroke for alerts that did not conform to the NSA criteria suggest that clinical judgment remains valuable. Final diagnoses were assigned by the stroke programs, and reliability of this assessment was not evaluated. Sites were not asked to use a specific categorization scheme to group final diagnoses. This analysis was limited to stroke centers with existing infrastructure to respond to stroke alerts and participated in an explicit quality‐improvement initiative on in‐hospital stroke response. Mimic and thrombolysis treatment rates may be different for hospitals without this stroke expertise.
Clinical uncertainty as to final diagnosis was addressed with the inclusion of confidence intervals accounting for potential misdiagnosis of the events in the categories of possible TIA or in the cases where the final diagnosis was unknown. Other studies have categorized TIA versus an alternative diagnosis as stroke mimic, and so our methodology is expected to yield a conservative estimate of the stroke mimic rate. Delirium is often a multifactorial phenomenon, so there may be an element of overlap between this category and other more specific mimic etiologies such as infection, hypotension, metabolic, or medication effect.
This initiative did not have the ability to assess the false negative rate of stroke team activation (failure to identify stroke symptoms in time for acute evaluation). It is not possible to calculate the sensitivity of stroke alerts in each center or conclude the optimal rate of false alarms. The finding of inter‐institutional variability in stroke alerts due to true brain ischemia could be explained by differences in staff education, systematic differences in the patient populations cared for among hospitals, or variation in institutional acceptance of having activated the stroke response team for cases with lower pretest probability of stroke. Sensitivity of alert criteria is more important than specificity, given the consequences of missing a potentially treatable emergent condition.
In conclusion, in this multi‐institution analysis of in‐hospital stroke alerts, a substantial proportion of in‐hospital strokes received thrombolytic therapy. Almost half of stroke alerts will not be for stroke or TIA. For many patients in our study, a change in neurologic status represented a harbinger of a change in general medical condition (hemorrhage, hypotension, hypoglycemia, or respiratory failure). Rapid response systems used for stroke in the hospital need to be trained and prepared to respond to a variety of acute medical conditions that extend beyond ischemic stroke.
Acknowledgements
This work was possible through the National Stroke Association's (NSA) In‐hospital Stroke Quality Improvement Initiative and NSA staff members including Jane Staller, MEd, Miranda N. Bretz, MS, and Amy K. Jensen.
Disclosures: This quality improvement project was funded by an educational grant to the National Stroke Association from Genentech, Inc. and Penumbra, Inc. The funding organizations had no role in the design, content, or preparation of this manuscript. The authors report no conflicts of interest.
- , , , , . Stroke alert program improves recognition and evaluation time of in‐hospital ischemic stroke. J Stroke Cerebrovasc Dis. 2010;19:494–496.
- , , . Code gray—an organized approach to inpatient stroke. Crit Care Nurs Q. 2003;26:296–302.
- , , . ID, Stat: rapid response to in‐hospital stroke patients. Nurs Manage. 2009;40:34–38.
- , , , et al. Predictors of acute stroke mimics in 8187 patients referred to a stroke service. J Stroke Cerebrovasc Dis. 2013;22:e397–e403.
- , , , , , . How to identify stroke mimics in patients eligible for intravenous thrombolysis? J Neurol. 2012;259:1347–1353.
- , , , , . Distinguishing between stroke and mimic at the bedside: The Brain Attack Study. Stroke. 2006;37:769–775.
- , , , . Identification of nonischemic stroke mimics among 411 code strokes at the University of California, San Diego, Stroke Center. J Stroke Cerebrovasc Dis. 2008;17:23–25.
- , , , . Identification of stroke mimics in the emergency department setting. J Brain Dis. 2009;1:19–22.
- , , , et al. Comparison of the characteristics for in‐hospital and out‐of‐hospital ischaemic strokes. Eur J Neur. 2009;16:582–588.
- National Stroke Association. Improving in‐hospital stroke through quality improvement interventions webinar. Available at: http://www.stroke.org/we‐can‐help/healthcare‐professionals/improve‐your‐skills/pre‐hospital‐acute‐stroke‐programs‐4. Accessed December 18, 2014.
- , , , et al. Time to treatment with intravenous tissue plasminogen activator and outcome from acute ischemic stroke. JAMA. 2013;309:2480–2488.
- , . “Code Stroke”: hospitalized versus emergency department patients. J Stroke Cerebrovasc Dis. 2013;22:345–348.
- , , , et al. Diagnostic accuracy of stroke referrals from primary care, emergency room physicians, and ambulance staff using the face arm speech test. Stroke. 2003;34:71–76.
- , , , , , . Hospitalization of non‐stroke patients in a stroke unit [in German]. Dtsch Med Wochenschr. 2004;129:731–735.
Improving Notes in the EHR
There are described advantages to documenting in an electronic health record (EHR).[1, 2, 3, 4, 5] There has been, however, an unanticipated decline in certain aspects of documentation quality after implementing EHRs,[6, 7, 8] for example, the overinclusion of data (note clutter) and inappropriate use of copy‐paste.[6, 7, 8, 9, 10, 11, 12, 13, 14, 15, 16, 17]
The objectives of this pilot study were to examine the effectiveness of an intervention bundle designed to improve resident progress notes written in an EHR (Epic Systems Corp., Verona, WI) and to establish the reliability of an audit tool used to assess the notes. Prior to this intervention, we provided no formal education for our residents about documentation in the EHR and had no policy governing format or content. The institutional review board at the University of Wisconsin approved this study.
METHODS
The Intervention Bundle
A multidisciplinary task force developed a set of Best Practice Guidelines for Writing Progress Notes in the EHR (see Supporting Information, Appendix 1, in the online version of this article). They were designed to promote cognitive review of data, reduce note clutter, promote synthesis of data, and discourage copy‐paste. For example, the guidelines recommended either the phrase, Vital signs from the last 24 hours have been reviewed and are pertinent for or a link that included minimum/maximum values rather than including multiple sets of data. We next developed a note template aligned with these guidelines (see Supporting Information, Appendix 2, in the online version of this article) using features and links that already existed within the EHR. Interns received classroom teaching about the best practices and instruction in use of the template.
Study Design
The study was a retrospective pre‐/postintervention. An audit tool designed to assess compliance with the guidelines was used to score 25 progress notes written by pediatric interns in August 2010 and August 2011 during the pre‐ and postintervention periods, respectively (see Supporting Information, Appendix 3, in the online version of this article).
Progress notes were eligible based on the following criteria: (1) written on any day subsequent to the admission date, (2) written by a pediatric intern, and (3) progress note from the previous day available for comparison. It was not required that 2 consecutive notes be written by the same resident. Eligible notes were identified using a computer‐generated report, reviewed by a study member to ensure eligibility, and assigned a number.
Notes were scored on a scale of 0 to 17, with each question having a range of possible scores from 0 to 2. Some questions related to inappropriate copy‐paste (questions 2, 9, 10) and a question related to discrete diagnostic language for abnormal labs (question 11) were weighted more heavily in the tool, as compliance with these components of the guideline was felt to be of greater importance. Several questions within the audit tool refer to clutter. We defined clutter as any additional data not endorsed by the guidelines or not explicitly stated as relevant to the patient's care for that day.
Raters were trained to score notes through practice sessions, during which they all scored the same note and compared findings. To rectify inter‐rater scoring discrepancies identified during these sessions, a reference manual was created to assist raters in scoring notes (see Supporting Information, Appendix 4, in the online version of this article). Each preintervention note was then systematically assigned to 2 raters, comprised of a physician and 3 staff from health information management. Each rater scored the note individually without discussion. The inter‐rater reliability was determined to be excellent, with kappa indices ranging from 88% to 100% for the 13 questions; each note in the postintervention period was therefore assigned to only 1 rater. Total and individual questions' scores were sent to the statistician for analysis.
Statistical Analysis
Inter‐rater reliability of the audit tool was evaluated by calculating the intraclass correlation (ICC) coefficient using a multilevel random intercept model to account for the rater effect.[18] The study was powered to detect an anticipated ICC of at least 0.75 at the 1‐sided 0.05 significance level, assuming a null hypothesis that the ICC is 0.4 or less. The total score was summarized in terms of means and standard deviation. Individual item responses were summarized using percentages and compared between the pre‐ and postintervention assessment using the Fisher exact test. The analysis of response patterns for individual item scores was considered exploratory. The Benjamini‐Hochberg false discovery rate method was utilized to control the false‐positive rate when comparing individual item scores.[19] All P values were 2‐sided and considered statistically significant at 0.05. Statistical analyses were conducted using SAS software version 9.2 (SAS Institute Inc., Cary, NC).
RESULTS
The ICC was 0.96 (95% confidence interval: 0.91‐0.98), indicating an excellent level of inter‐rater reliability. There was a significant improvement in the total score (see Supporting Information, Appendix 5, in the online version of this article) between the preintervention (mean 9.72, standard deviation [SD] 1.52) and postintervention (mean 11.72, SD 1.62) periods (P0.0001).
Table 1 shows the percentage of yes responses to each individual item in the pre‐ and postintervention periods. Our intervention had a significant impact on reducing vital sign clutter (4% preintervention, 84% postintervention, P0.0001) and other visual clutter within the note (0% preintervention, 28% postintervention, P=0.0035). We did not observe a significant impact on the reduction of input/output or lab clutter. There was no significant difference observed in the inclusion of the medication list. No significant improvements were seen in questions related to copy‐paste. The intervention had no significant impact on areas with an already high baseline performance: newly written interval histories, newly written physical exams, newly written plans, and the inclusion of discrete diagnostic language for abnormal labs.
| Question | Preintervention, N=25* | Postintervention, N=25 | P Value |
|---|---|---|---|
| |||
| 1. Does the note header include the name of the service, author, and training level of the author? | 0% | 68% | 0.0001 |
| 2. Does it appear that the subjective/emnterval history section of the note was newly written? (ie, not copied in its entirety from the previous note) | 100% | 96% | 0.9999 |
| 3. Is the vital sign section noncluttered? | 4% | 84% | 0.0001 |
| 4. Is the entire medication list included in the note? | 96% | 96% | 0.9999 |
| 5. Is the intake/output section noncluttered? | 0% | 16% | 0.3076 |
| 6. Does it appear that the physical exam was newly written? (ie, not copied in its entirety from the previous note) | 80% | 68% | 0.9103 |
| 7. Is the lab section noncluttered? | 64% | 44% | 0.5125 |
| 8. Is the imaging section noncluttered? | 100% | 100% | 0.9999 |
| 9. Does it appear that the assessment was newly written? | 48% | 28% | 0.5121 |
| 48% partial | 52% partial | 0.9999 | |
| 10. Does it appear that the plan was newly written or partially copied with new information added? | 88% | 96% | 0.9477 |
| 11. If the assessment includes abnormal lab values, is there also an accompanying diagnosis? (eg, inclusion of patient has hemoglobin of 6.2, also includes diagnosis of anemia) | 96% | 96% | 0.9999 |
| 12. Is additional visual clutter prevented by excluding other objective data found elsewhere in the chart? | 0% | 28% | 0.0035 |
| 13. Is the author's name and contact information (pager, cell) included at the bottom of the note? | 0% | 72% | 0.0001 |
DISCUSSION
Principal Findings
Improvements in electronic note writing, particularly in reducing note clutter, were achieved after the implementation of a bundled intervention. Because the intervention is a bundle, we cannot definitively identify which component had the greatest impact. Given the improvements seen in some areas with very low baseline performance, we hypothesize that these are most attributable to the creation of a compliant note template that (1) guided authors in using data links that were less cluttered and (2) eliminated the use of unnecessary links (eg, pain scores and daily weights). The lack of similar improvements in reducing input/output and lab clutter may be due to the fact that even with changes to the template suggesting a more narrative approach to these components, residents still felt compelled to use data links. Because our EHR does not easily allow for the inclusion of individual data elements, such as specific drain output or hemoglobin as opposed to a complete blood count, residents continued to use links that included more data than necessary. Although not significant findings, there was an observed decline in the proportion of notes containing a physical exam not entirely copied from the previous day and containing an assessment that was entirely new. These findings may be attributable to having a small sample of authors, a few of whom in the postintervention period were particularly prone to using copy‐paste.
Relationship to Other Evidence
The observed decline in quality of provider documentation after implementation of the EHR has led to a robust discussion in the literature about what really constitutes a quality provider note.[7, 8, 9, 10, 20] The absence of a defined gold standard makes research in this area challenging. It is our observation that when physicians refer to a decline in quality documentation in the EHR, they are frequently referring to the fact that electronically generated notes are often unattractive, difficult to read, and seem to lack clinical narrative.
Several publications have attempted to define note quality. Payne et al. described physical characteristics of electronically generated notes that were deemed more attractive to a reader, including a large proportion of narrative free text.[15] Hanson performed a qualitative study to describe outpatient clinical notes from the perspective of multiple stakeholders, resulting in a description of the characteristics of a quality note.[21] This formed the basis for the QNOTE, a validated tool to measure the quality of outpatient notes.[22] Similar work has not been done to rigorously define quality for inpatient documentation. Stetson did develop an instrument, the Physician Documentation Quality Instrument (PDQI‐9) to assess inpatient notes across 9 attributes; however, the validation method relied on a gold standard of a general impression score of 7 physician leaders.[23, 24]
Although these tools aim to address overall note quality, an advantage provided by our audit tool is that it directly addresses the problems most attributable to documenting in an EHR, namely note clutter and copy‐paste. A second advantage is that clinicians and nonclinicians can score notes objectively. The QNOTE and PDQI‐9 still rely on subjective assessment and require that the evaluator be a clinician.
There has also been little published about how to achieve notes of high quality. In 2013, Shoolin et al. did publish a consensus statement from the Association of Medical Directors of Information Systems outlining some guidelines for inpatient EHR documentation.[25] Optimal strategies for implementing such guidelines, however, and the overall impact such an implementation would have on improving note writing has not previously been studied. This study, therefore, adds to the existing body of literature by providing an example of an intervention that may lead to improvements in note writing.
Limitations
Our study has several limitations. The sample size of notes and authors was small. The short duration of the study and the assessment of notes soon after the intervention prevented an assessment of whether improvements were sustained over time.
Unfortunately, we were not evaluating the same group of interns in the pre‐ and postintervention periods. Interns were chosen as subjects as there was an existing opportunity to do large group training during new intern orientation. Furthermore, we were concerned that more note‐writing experience alone would influence the outcome if we examined the same interns later in the year.
The audit tool was also a first attempt at measuring compliance with the guidelines. Determination of an optimal score/weight for each item requires further investigation as part of a larger scale validation study. In addition, the cognitive review and synthesis of data encouraged in our guideline were more difficult to measure using the audit tool, as they require some clinical knowledge about the patient and an assessment of the author's medical decision making. We do not assert, therefore, that compliance with the guidelines or a higher total score necessarily translates into overall note quality, as we recognize these limitations of the tool.
Future Directions
In conclusion, this report is a first effort to improve the quality of note writing in the EHR. Much more work is necessary, particularly in improving the clinical narrative and inappropriate copy‐paste. The examination of other interventions, such as the impact of structured feedback to the note author, whether by way of a validated scoring tool and/or narrative comments, is a logical next step for investigation.
ACKNOWLEDGEMENTS
The authors acknowledge and appreciate the support of Joel Buchanan, MD, Ellen Wald, MD, and Ann Boyer, MD, for their contributions to this study and manuscript preparation. We also acknowledge the members of the auditing team: Linda Brickert, Jane Duckert, and Jeannine Strunk.
Disclosure: Nothing to report.
- , , . Use of computer‐based records, completeness of documentation, and appropriateness of documented clinical decisions. J Am Med Inform Assoc. 1999;6(3):245–251.
- , , , et al. An automated model to identify heart failure patients at risk for 30‐day readmission or death using electronic medical record data. Med Care. 2010;48(11):981–988.
- , , , , . Clinical information technologies and inpatient outcomes: a multiple hospital study. Arch Intern Med. 2009;169(2):108–114.
- , , , , . Identifying patients with diabetes and the earliest date of diagnosis in real time: an electronic health record case‐finding algorithm. BMC Med Inform Decis Mak. 2013;13:81.
- , , , et al. Relationship between use of electronic health record features and health care quality: results of a statewide survey. Med Care. 2010;48(3):203–209.
- , , , , , . Impacts of computerized physician documentation in a teaching hospital: perceptions of faculty and resident physicians. J Am Med Inform Assoc. 2004;11(4):300–309.
- , . Off the record—avoiding the pitfalls of going electronic. N Engl J Med. 2008;358(16):1656–1658.
- . A piece of my mind. Copy‐and‐paste. JAMA. 2006;295(20):2335–2336.
- , . Copy and paste: a remediable hazard of electronic health records. Am J Med. 2009;122(6):495–496.
- , , , , , . Physicians' attitudes towards copy and pasting in electronic note writing. J Gen Intern Med. 2009;24(1):63–68.
- . Improving the electronic health record—are clinicians getting what they wished for? JAMA. 2013;309(10):991–992.
- , , . Copying and pasting of examinations within the electronic medical record. Int J Med Inform. 2007;76(suppl 1):S122–S128.
- . The evolving medical record. Ann Intern Med. 2010;153(10):671–677.
- , , , , , . Direct text entry in electronic progress notes. An evaluation of input errors. Methods Inf Med. 2003;42(1):61–67.
- , , , . The physical attractiveness of electronic physician notes. AMIA Annu Symp Proc. 2010;2010:622–626.
- , . Copy‐and‐paste‐and‐paste. JAMA. 2006;296(19):2315; author reply 2315–2316.
- , , , . Are electronic medical records trustworthy? Observations on copying, pasting and duplication. AMIA Annu Symp Proc. 2003:269–273.
- , . Hierarchical Linear Models: Applications and Data Analysis Methods. 2nd ed. Thousand Oaks, CA: Sage; 2002.
- , . Controlling the false discovery rate: a practical and powerful approach for multiple testing. J R Stat Soc Series B Stat Methodol 1995;57(1):289–300.
- , , . The role of copy‐and‐paste in the hospital electronic health record. JAMA Intern Med. 2014;174(8):1217–1218.
- , , , . Quality of outpatient clinical notes: a stakeholder definition derived through qualitative research. BMC Health Serv Res. 2012;12:407.
- , , , et al. QNOTE: an instrument for measuring the quality of EHR clinical notes. J Am Med Inform Assoc. 2014;21(5):910–916.
- , , , . Assessing electronic note quality using the physician documentation quality instrument (PDQI‐9). Appl Clin Inform. 2012;3(2):164–174.
- , , , . Preliminary development of the physician documentation quality instrument. J Am Med Inform Assoc. 2008;15(4):534–541.
- , , , . Association of Medical Directors of Information Systems consensus on inpatient electronic health record documentation. Appl Clin Inform. 2013;4(2):293–303.
There are described advantages to documenting in an electronic health record (EHR).[1, 2, 3, 4, 5] There has been, however, an unanticipated decline in certain aspects of documentation quality after implementing EHRs,[6, 7, 8] for example, the overinclusion of data (note clutter) and inappropriate use of copy‐paste.[6, 7, 8, 9, 10, 11, 12, 13, 14, 15, 16, 17]
The objectives of this pilot study were to examine the effectiveness of an intervention bundle designed to improve resident progress notes written in an EHR (Epic Systems Corp., Verona, WI) and to establish the reliability of an audit tool used to assess the notes. Prior to this intervention, we provided no formal education for our residents about documentation in the EHR and had no policy governing format or content. The institutional review board at the University of Wisconsin approved this study.
METHODS
The Intervention Bundle
A multidisciplinary task force developed a set of Best Practice Guidelines for Writing Progress Notes in the EHR (see Supporting Information, Appendix 1, in the online version of this article). They were designed to promote cognitive review of data, reduce note clutter, promote synthesis of data, and discourage copy‐paste. For example, the guidelines recommended either the phrase, Vital signs from the last 24 hours have been reviewed and are pertinent for or a link that included minimum/maximum values rather than including multiple sets of data. We next developed a note template aligned with these guidelines (see Supporting Information, Appendix 2, in the online version of this article) using features and links that already existed within the EHR. Interns received classroom teaching about the best practices and instruction in use of the template.
Study Design
The study was a retrospective pre‐/postintervention. An audit tool designed to assess compliance with the guidelines was used to score 25 progress notes written by pediatric interns in August 2010 and August 2011 during the pre‐ and postintervention periods, respectively (see Supporting Information, Appendix 3, in the online version of this article).
Progress notes were eligible based on the following criteria: (1) written on any day subsequent to the admission date, (2) written by a pediatric intern, and (3) progress note from the previous day available for comparison. It was not required that 2 consecutive notes be written by the same resident. Eligible notes were identified using a computer‐generated report, reviewed by a study member to ensure eligibility, and assigned a number.
Notes were scored on a scale of 0 to 17, with each question having a range of possible scores from 0 to 2. Some questions related to inappropriate copy‐paste (questions 2, 9, 10) and a question related to discrete diagnostic language for abnormal labs (question 11) were weighted more heavily in the tool, as compliance with these components of the guideline was felt to be of greater importance. Several questions within the audit tool refer to clutter. We defined clutter as any additional data not endorsed by the guidelines or not explicitly stated as relevant to the patient's care for that day.
Raters were trained to score notes through practice sessions, during which they all scored the same note and compared findings. To rectify inter‐rater scoring discrepancies identified during these sessions, a reference manual was created to assist raters in scoring notes (see Supporting Information, Appendix 4, in the online version of this article). Each preintervention note was then systematically assigned to 2 raters, comprised of a physician and 3 staff from health information management. Each rater scored the note individually without discussion. The inter‐rater reliability was determined to be excellent, with kappa indices ranging from 88% to 100% for the 13 questions; each note in the postintervention period was therefore assigned to only 1 rater. Total and individual questions' scores were sent to the statistician for analysis.
Statistical Analysis
Inter‐rater reliability of the audit tool was evaluated by calculating the intraclass correlation (ICC) coefficient using a multilevel random intercept model to account for the rater effect.[18] The study was powered to detect an anticipated ICC of at least 0.75 at the 1‐sided 0.05 significance level, assuming a null hypothesis that the ICC is 0.4 or less. The total score was summarized in terms of means and standard deviation. Individual item responses were summarized using percentages and compared between the pre‐ and postintervention assessment using the Fisher exact test. The analysis of response patterns for individual item scores was considered exploratory. The Benjamini‐Hochberg false discovery rate method was utilized to control the false‐positive rate when comparing individual item scores.[19] All P values were 2‐sided and considered statistically significant at 0.05. Statistical analyses were conducted using SAS software version 9.2 (SAS Institute Inc., Cary, NC).
RESULTS
The ICC was 0.96 (95% confidence interval: 0.91‐0.98), indicating an excellent level of inter‐rater reliability. There was a significant improvement in the total score (see Supporting Information, Appendix 5, in the online version of this article) between the preintervention (mean 9.72, standard deviation [SD] 1.52) and postintervention (mean 11.72, SD 1.62) periods (P0.0001).
Table 1 shows the percentage of yes responses to each individual item in the pre‐ and postintervention periods. Our intervention had a significant impact on reducing vital sign clutter (4% preintervention, 84% postintervention, P0.0001) and other visual clutter within the note (0% preintervention, 28% postintervention, P=0.0035). We did not observe a significant impact on the reduction of input/output or lab clutter. There was no significant difference observed in the inclusion of the medication list. No significant improvements were seen in questions related to copy‐paste. The intervention had no significant impact on areas with an already high baseline performance: newly written interval histories, newly written physical exams, newly written plans, and the inclusion of discrete diagnostic language for abnormal labs.
| Question | Preintervention, N=25* | Postintervention, N=25 | P Value |
|---|---|---|---|
| |||
| 1. Does the note header include the name of the service, author, and training level of the author? | 0% | 68% | 0.0001 |
| 2. Does it appear that the subjective/emnterval history section of the note was newly written? (ie, not copied in its entirety from the previous note) | 100% | 96% | 0.9999 |
| 3. Is the vital sign section noncluttered? | 4% | 84% | 0.0001 |
| 4. Is the entire medication list included in the note? | 96% | 96% | 0.9999 |
| 5. Is the intake/output section noncluttered? | 0% | 16% | 0.3076 |
| 6. Does it appear that the physical exam was newly written? (ie, not copied in its entirety from the previous note) | 80% | 68% | 0.9103 |
| 7. Is the lab section noncluttered? | 64% | 44% | 0.5125 |
| 8. Is the imaging section noncluttered? | 100% | 100% | 0.9999 |
| 9. Does it appear that the assessment was newly written? | 48% | 28% | 0.5121 |
| 48% partial | 52% partial | 0.9999 | |
| 10. Does it appear that the plan was newly written or partially copied with new information added? | 88% | 96% | 0.9477 |
| 11. If the assessment includes abnormal lab values, is there also an accompanying diagnosis? (eg, inclusion of patient has hemoglobin of 6.2, also includes diagnosis of anemia) | 96% | 96% | 0.9999 |
| 12. Is additional visual clutter prevented by excluding other objective data found elsewhere in the chart? | 0% | 28% | 0.0035 |
| 13. Is the author's name and contact information (pager, cell) included at the bottom of the note? | 0% | 72% | 0.0001 |
DISCUSSION
Principal Findings
Improvements in electronic note writing, particularly in reducing note clutter, were achieved after the implementation of a bundled intervention. Because the intervention is a bundle, we cannot definitively identify which component had the greatest impact. Given the improvements seen in some areas with very low baseline performance, we hypothesize that these are most attributable to the creation of a compliant note template that (1) guided authors in using data links that were less cluttered and (2) eliminated the use of unnecessary links (eg, pain scores and daily weights). The lack of similar improvements in reducing input/output and lab clutter may be due to the fact that even with changes to the template suggesting a more narrative approach to these components, residents still felt compelled to use data links. Because our EHR does not easily allow for the inclusion of individual data elements, such as specific drain output or hemoglobin as opposed to a complete blood count, residents continued to use links that included more data than necessary. Although not significant findings, there was an observed decline in the proportion of notes containing a physical exam not entirely copied from the previous day and containing an assessment that was entirely new. These findings may be attributable to having a small sample of authors, a few of whom in the postintervention period were particularly prone to using copy‐paste.
Relationship to Other Evidence
The observed decline in quality of provider documentation after implementation of the EHR has led to a robust discussion in the literature about what really constitutes a quality provider note.[7, 8, 9, 10, 20] The absence of a defined gold standard makes research in this area challenging. It is our observation that when physicians refer to a decline in quality documentation in the EHR, they are frequently referring to the fact that electronically generated notes are often unattractive, difficult to read, and seem to lack clinical narrative.
Several publications have attempted to define note quality. Payne et al. described physical characteristics of electronically generated notes that were deemed more attractive to a reader, including a large proportion of narrative free text.[15] Hanson performed a qualitative study to describe outpatient clinical notes from the perspective of multiple stakeholders, resulting in a description of the characteristics of a quality note.[21] This formed the basis for the QNOTE, a validated tool to measure the quality of outpatient notes.[22] Similar work has not been done to rigorously define quality for inpatient documentation. Stetson did develop an instrument, the Physician Documentation Quality Instrument (PDQI‐9) to assess inpatient notes across 9 attributes; however, the validation method relied on a gold standard of a general impression score of 7 physician leaders.[23, 24]
Although these tools aim to address overall note quality, an advantage provided by our audit tool is that it directly addresses the problems most attributable to documenting in an EHR, namely note clutter and copy‐paste. A second advantage is that clinicians and nonclinicians can score notes objectively. The QNOTE and PDQI‐9 still rely on subjective assessment and require that the evaluator be a clinician.
There has also been little published about how to achieve notes of high quality. In 2013, Shoolin et al. did publish a consensus statement from the Association of Medical Directors of Information Systems outlining some guidelines for inpatient EHR documentation.[25] Optimal strategies for implementing such guidelines, however, and the overall impact such an implementation would have on improving note writing has not previously been studied. This study, therefore, adds to the existing body of literature by providing an example of an intervention that may lead to improvements in note writing.
Limitations
Our study has several limitations. The sample size of notes and authors was small. The short duration of the study and the assessment of notes soon after the intervention prevented an assessment of whether improvements were sustained over time.
Unfortunately, we were not evaluating the same group of interns in the pre‐ and postintervention periods. Interns were chosen as subjects as there was an existing opportunity to do large group training during new intern orientation. Furthermore, we were concerned that more note‐writing experience alone would influence the outcome if we examined the same interns later in the year.
The audit tool was also a first attempt at measuring compliance with the guidelines. Determination of an optimal score/weight for each item requires further investigation as part of a larger scale validation study. In addition, the cognitive review and synthesis of data encouraged in our guideline were more difficult to measure using the audit tool, as they require some clinical knowledge about the patient and an assessment of the author's medical decision making. We do not assert, therefore, that compliance with the guidelines or a higher total score necessarily translates into overall note quality, as we recognize these limitations of the tool.
Future Directions
In conclusion, this report is a first effort to improve the quality of note writing in the EHR. Much more work is necessary, particularly in improving the clinical narrative and inappropriate copy‐paste. The examination of other interventions, such as the impact of structured feedback to the note author, whether by way of a validated scoring tool and/or narrative comments, is a logical next step for investigation.
ACKNOWLEDGEMENTS
The authors acknowledge and appreciate the support of Joel Buchanan, MD, Ellen Wald, MD, and Ann Boyer, MD, for their contributions to this study and manuscript preparation. We also acknowledge the members of the auditing team: Linda Brickert, Jane Duckert, and Jeannine Strunk.
Disclosure: Nothing to report.
- , , . Use of computer‐based records, completeness of documentation, and appropriateness of documented clinical decisions. J Am Med Inform Assoc. 1999;6(3):245–251.
- , , , et al. An automated model to identify heart failure patients at risk for 30‐day readmission or death using electronic medical record data. Med Care. 2010;48(11):981–988.
- , , , , . Clinical information technologies and inpatient outcomes: a multiple hospital study. Arch Intern Med. 2009;169(2):108–114.
- , , , , . Identifying patients with diabetes and the earliest date of diagnosis in real time: an electronic health record case‐finding algorithm. BMC Med Inform Decis Mak. 2013;13:81.
- , , , et al. Relationship between use of electronic health record features and health care quality: results of a statewide survey. Med Care. 2010;48(3):203–209.
- , , , , , . Impacts of computerized physician documentation in a teaching hospital: perceptions of faculty and resident physicians. J Am Med Inform Assoc. 2004;11(4):300–309.
- , . Off the record—avoiding the pitfalls of going electronic. N Engl J Med. 2008;358(16):1656–1658.
- . A piece of my mind. Copy‐and‐paste. JAMA. 2006;295(20):2335–2336.
- , . Copy and paste: a remediable hazard of electronic health records. Am J Med. 2009;122(6):495–496.
- , , , , , . Physicians' attitudes towards copy and pasting in electronic note writing. J Gen Intern Med. 2009;24(1):63–68.
- . Improving the electronic health record—are clinicians getting what they wished for? JAMA. 2013;309(10):991–992.
- , , . Copying and pasting of examinations within the electronic medical record. Int J Med Inform. 2007;76(suppl 1):S122–S128.
- . The evolving medical record. Ann Intern Med. 2010;153(10):671–677.
- , , , , , . Direct text entry in electronic progress notes. An evaluation of input errors. Methods Inf Med. 2003;42(1):61–67.
- , , , . The physical attractiveness of electronic physician notes. AMIA Annu Symp Proc. 2010;2010:622–626.
- , . Copy‐and‐paste‐and‐paste. JAMA. 2006;296(19):2315; author reply 2315–2316.
- , , , . Are electronic medical records trustworthy? Observations on copying, pasting and duplication. AMIA Annu Symp Proc. 2003:269–273.
- , . Hierarchical Linear Models: Applications and Data Analysis Methods. 2nd ed. Thousand Oaks, CA: Sage; 2002.
- , . Controlling the false discovery rate: a practical and powerful approach for multiple testing. J R Stat Soc Series B Stat Methodol 1995;57(1):289–300.
- , , . The role of copy‐and‐paste in the hospital electronic health record. JAMA Intern Med. 2014;174(8):1217–1218.
- , , , . Quality of outpatient clinical notes: a stakeholder definition derived through qualitative research. BMC Health Serv Res. 2012;12:407.
- , , , et al. QNOTE: an instrument for measuring the quality of EHR clinical notes. J Am Med Inform Assoc. 2014;21(5):910–916.
- , , , . Assessing electronic note quality using the physician documentation quality instrument (PDQI‐9). Appl Clin Inform. 2012;3(2):164–174.
- , , , . Preliminary development of the physician documentation quality instrument. J Am Med Inform Assoc. 2008;15(4):534–541.
- , , , . Association of Medical Directors of Information Systems consensus on inpatient electronic health record documentation. Appl Clin Inform. 2013;4(2):293–303.
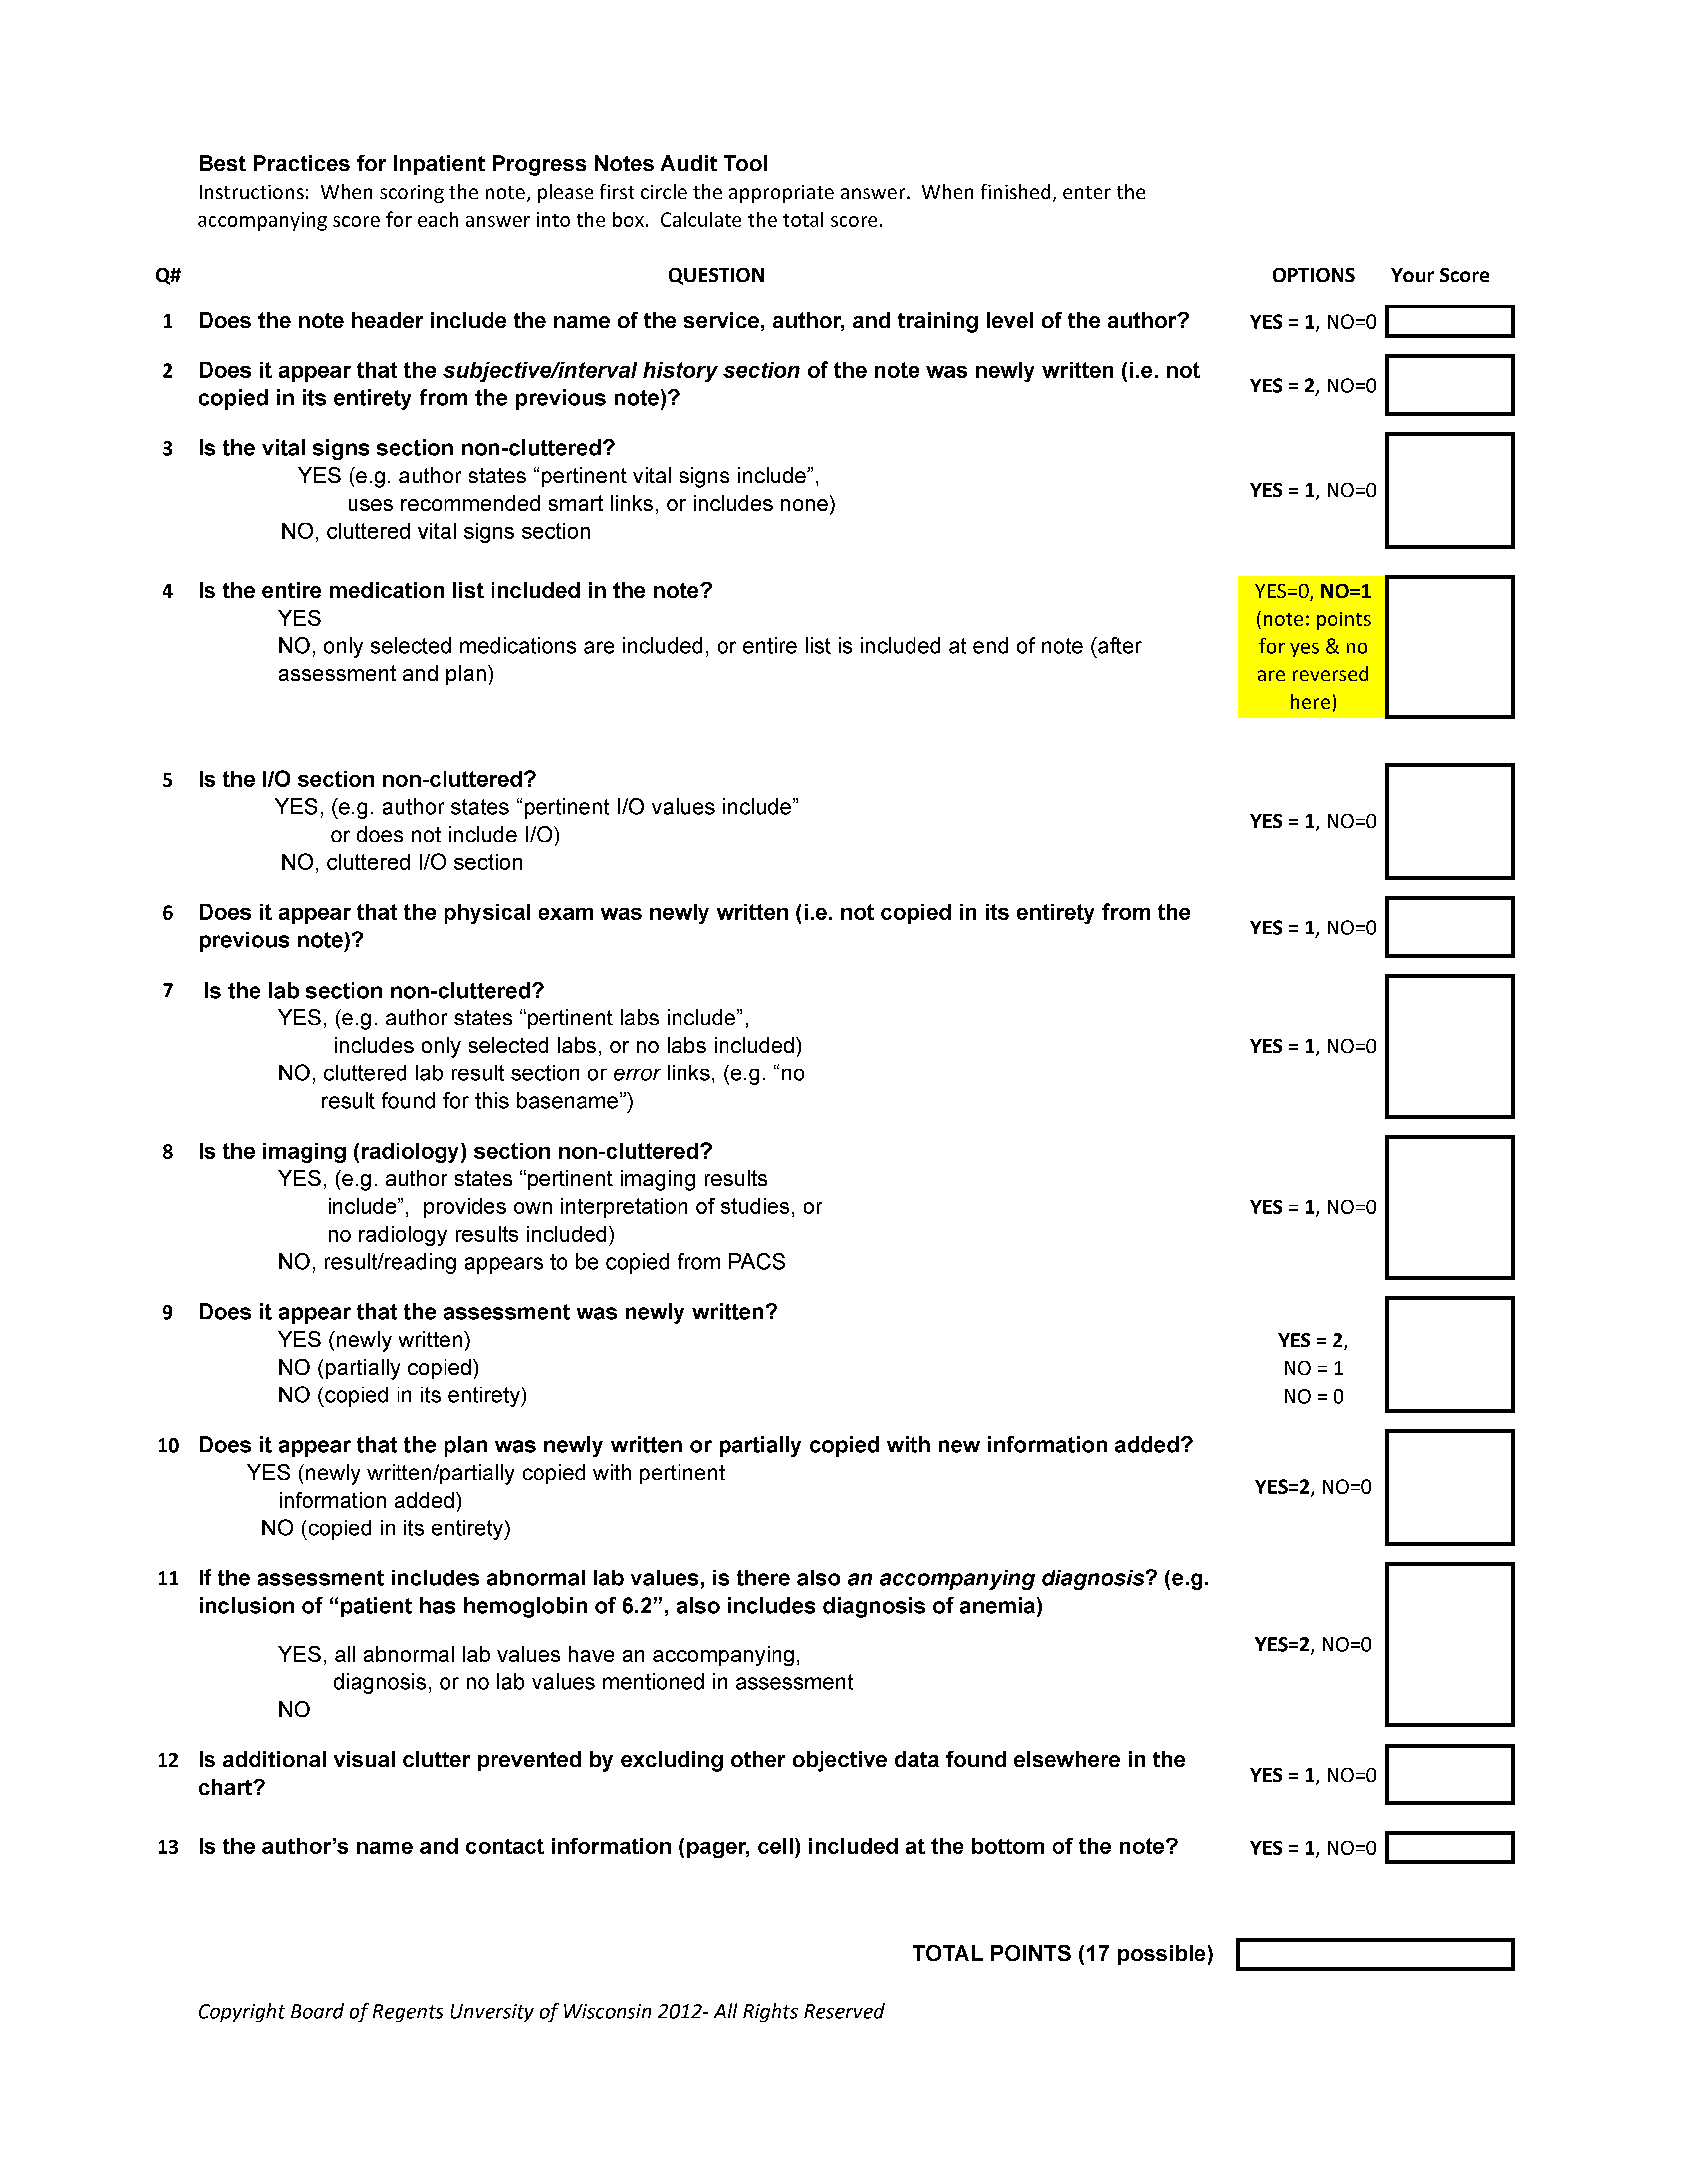
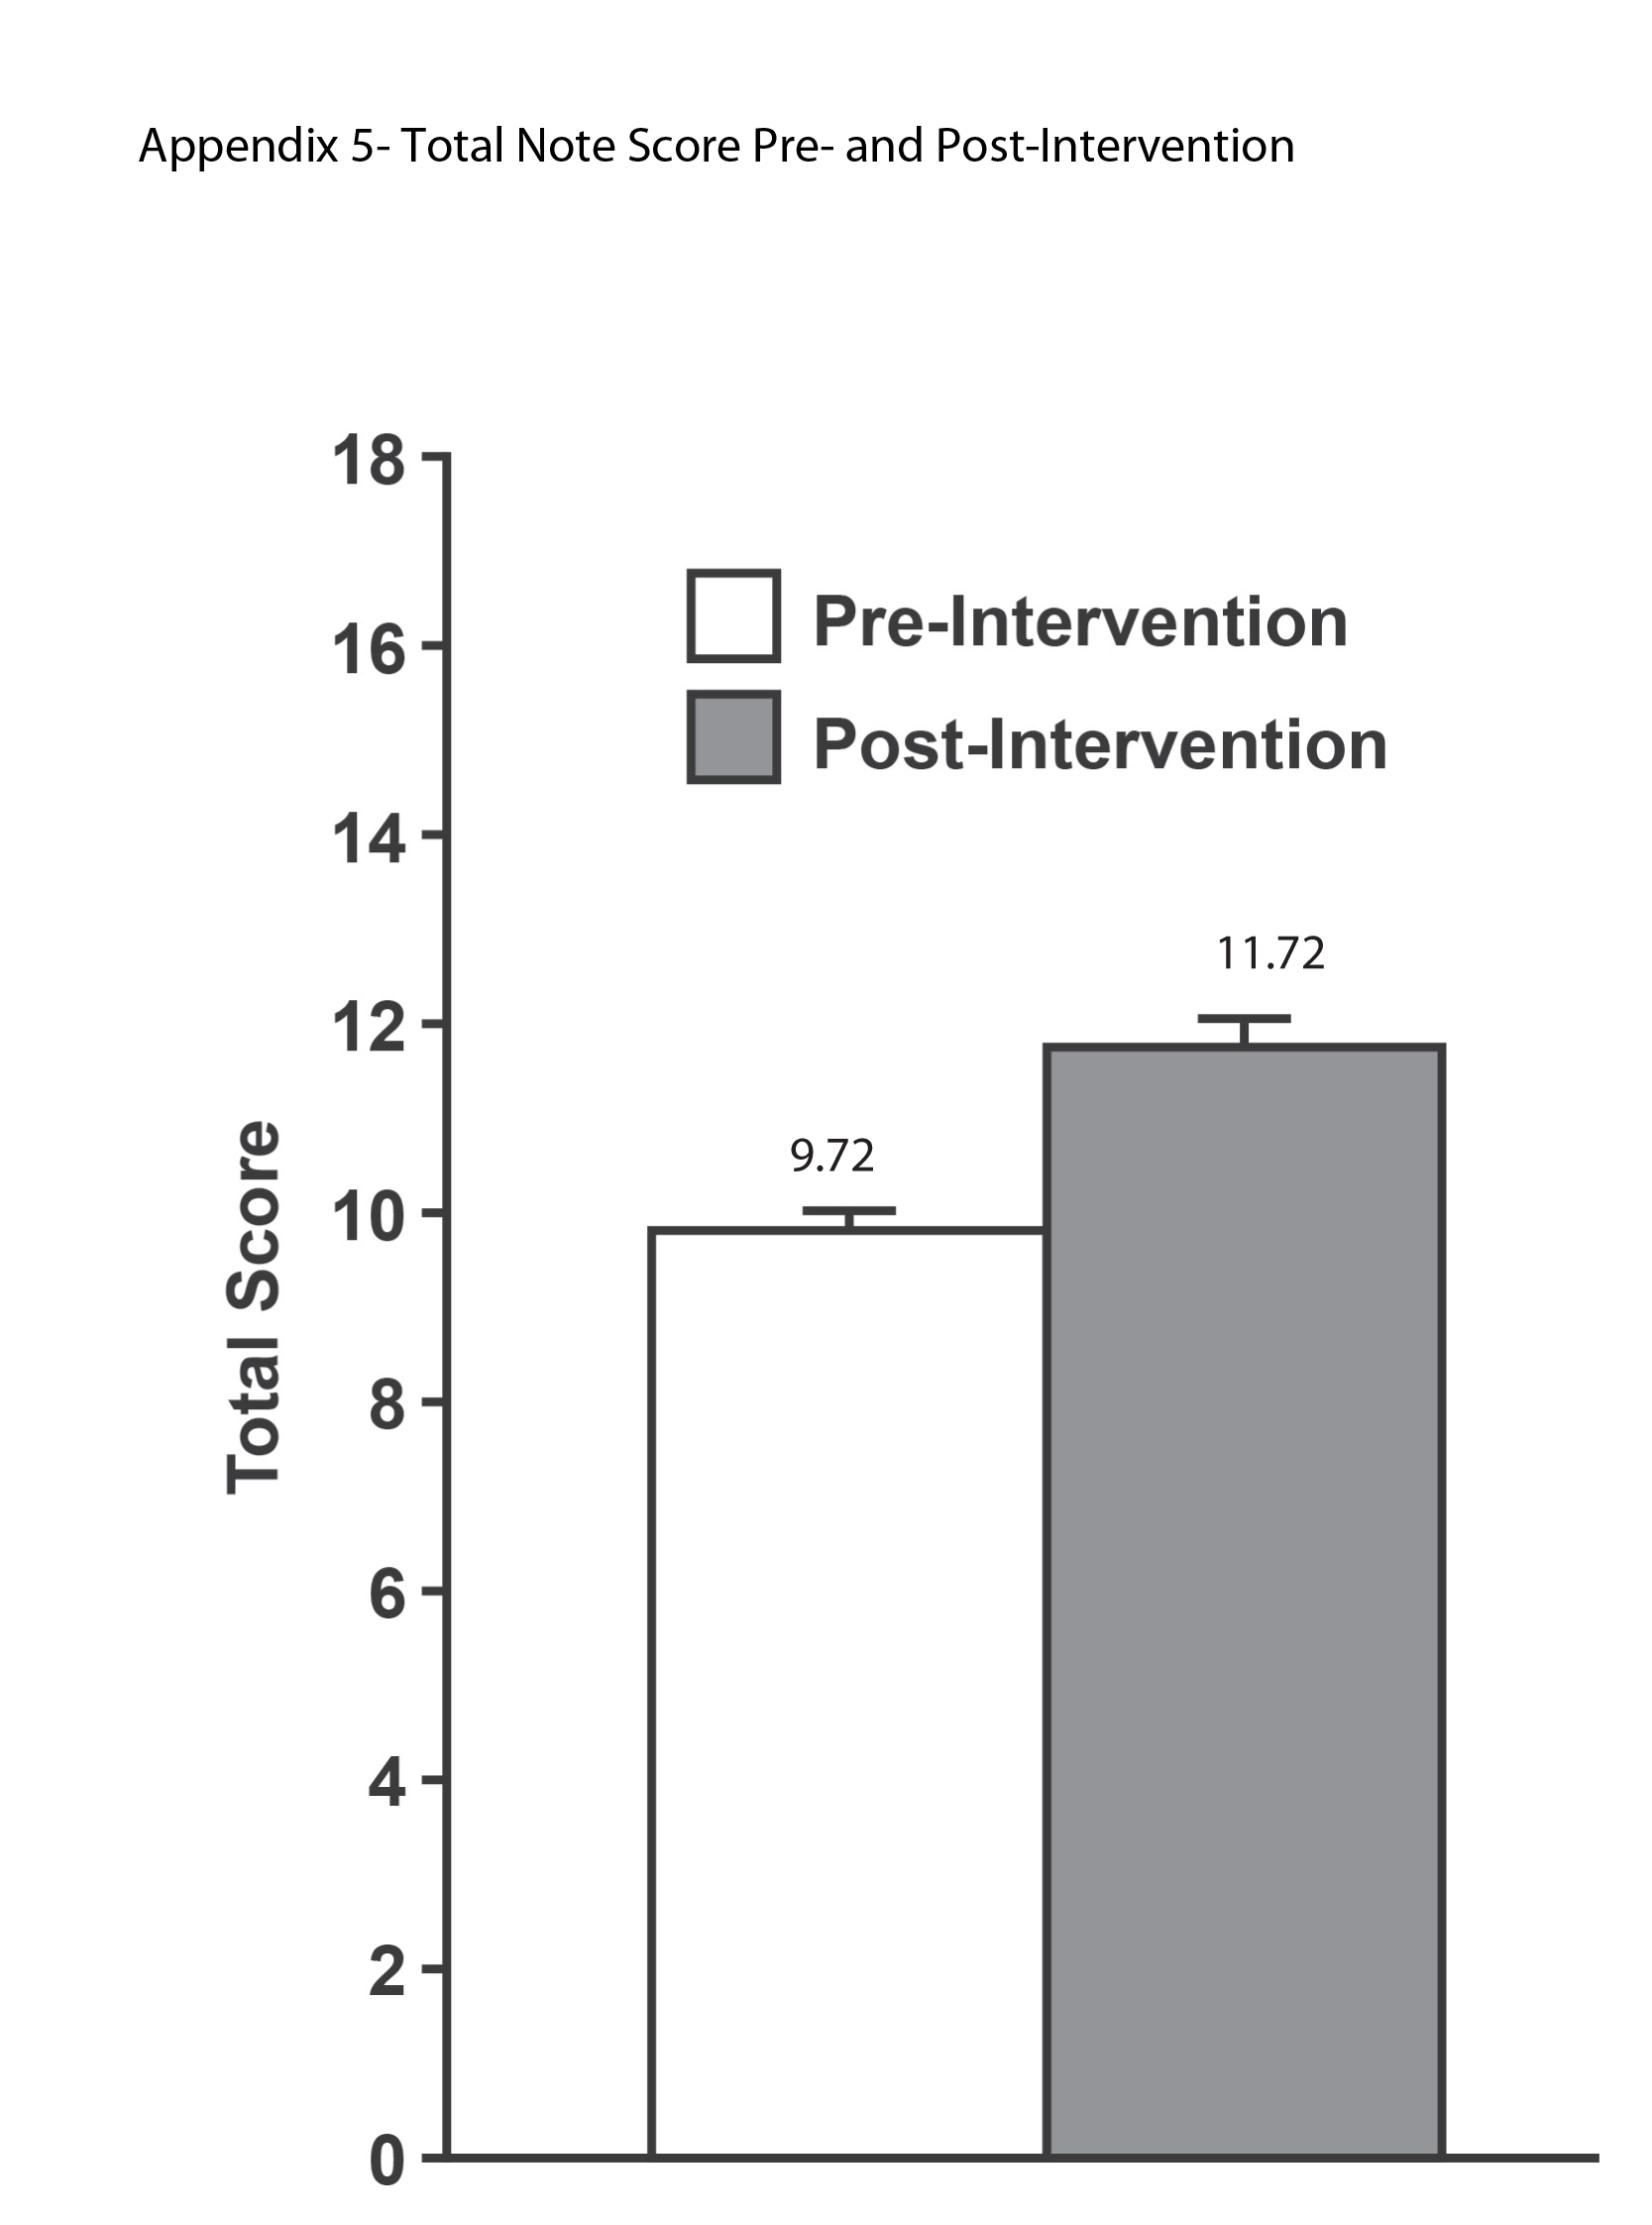
Thromboembolism Prophylaxis Preferences
The 2012 American College of Chest Physicians (ACCP) guidelines on antithrombotic and thrombolytic therapy conducted a systematic review focusing on patient values and preferences regarding antithrombotic therapy, including thromboprophylaxis.[1] They found that patient values and preferences are highly variable and should be considered when developing future clinical practice guidelines. Notably, there were no studies evaluating patient preferences for venous thromboembolism (VTE) prophylaxis, which is prescribed for the vast majority of hospitalized patients.
Historically, interventions to prevent VTE have focused on increasing prescriptions of prophylaxis. At the Johns Hopkins Hospital, we implemented a mandatory clinical decision support tool in our computerized provider order entry system.[2] Following implementation of this tool, prescription of risk‐appropriate VTE prophylaxis dramatically increased for both medical and surgical patients.[3, 4, 5] These efforts were made with the implicit and incorrect assumption that prescribed medication doses will always be administered to patients, when in fact patient refusal is a leading cause of nonadministration. Studies of VTE prophylaxis administration have reported that 10% to 12% of doses are not administered to patients.[6] Alarmingly, it has been reported that among medically ill patients, between 10% and 30% of doses are not administered, with patient refusal as the most frequently documented reason.
The purpose of this study was to assess patient preferences regarding pharmacological VTE prophylaxis.
METHODS
Study Design
A sample of consecutive hospitalized patients on select medicine and surgical floors previously identified as low‐ and high‐performing units at our institution in regard to administration rates of pharmacologic VTE prophylaxis was assembled from a daily electronic report of patients prescribed pharmacological VTE prophylaxis (Allscripts Sunrise, Chicago, IL) from December 2012 to March 2013. These units were identified in a study conducted at our institution as the lowest‐ and highest‐performing units in regard to incidence of administration of ordered pharmacologic VTE prophylaxis. From this data analysis, we chose the 2 lowest‐performing and 2 highest‐performing units on the medical and surgical service. To be eligible for this study, patients had to have an active order for 1 of the following VTE prophylaxis regimens: unfractionated heparin 5000 units or 7500 units administered subcutaneously every 8 or 12 hours, enoxaparin 30 mg administered subcutaneously every 12 hours or 40 mg administered subcutaneously every 24 hours. Participants had to be at least 18 years of age and hospitalized for at least 2 days on their respective units. Patients who were nonEnglish speaking, those previously enrolled in this study, or those unable to provide consent were excluded from the study.
Data Collection
Demographic information was collected, including patient‐reported education level. To determine their preference for VTE prophylaxis, patients were provided a survey, which included being asked, Would you prefer a pill or a shot to prevent blood clots, if they both worked equally well. The survey was created by the study team to collect information from patients regarding their baseline knowledge of VTE and preference regarding pharmacologic prophylaxis. Additional data included the patient's education level to determine potential association with preference. The survey was verbally administered by 1 investigator (A.W.) to all patients. Patients were asked to explain their rationale for their stated preference in regard to VTE prophylaxis. Patient rationale was subsequently coded to allow for uniformity among patient responses based on patterns in responses. Our electronic medication record allows us to identify patients who refused their medication through nursing documentation. Patients with documented refusal of ordered pharmacologic VTE prophylaxis were asked about the rationale for their refusal. This study was approved by the Johns Hopkins Medicine Institutional Review Board.
Statistical Analysis
Quantitative data from the surveys were analyzed using Minitab (Minitab Inc., State College, PA). A [2] test analysis was performed for categorical data, as appropriate. A P value 0.05 was considered to be statistically significant.
RESULTS
Quantitative Results
We interviewed patients regarding their preferred route of administration of VTE prophylaxis. Overall, 339 patients were screened for this study. Sixty patients were not eligible to participate. Forty‐seven were unable to provide consent, and 13 were nonEnglish speaking. Of the 269 remaining eligible patients, 227 (84.4%) consented to participate.
Baseline demographics of the participants are presented in Table 1, categorized on the basis of their preferred route of administration for VTE prophylaxis. A majority of patients indicated a preference for an oral formulation of pharmacologic VTE prophylaxis. There was no association between education level or service type on preference. Preference for an oral formulation was largely influenced by patient‐reported pain and bruising associated with subcutaneous administration (Table 2). A substantial majority of patients reporting a preference for a subcutaneous formulation and emphasized a belief that this route was associated with a faster onset of action. Among patients who preferred an oral formulation (n=137), 71 patients (51.8%) were documented as having refused at least 1 dose of ordered VTE prophylaxis. Patients who preferred a subcutaneous route of VTE prophylaxis were less likely to refuse prophylaxis, with only 22 patients (35.5%) having a documented refusal of at least 1 dose (P0.0001).
| Enteral, n=137 | Parenteral, n=62 | No Preference, n=28 | |
|---|---|---|---|
| |||
| Age, y, mean ( SD) | 49.5 (14.7) | 51.7 (16.1) | 48.9 (14.6) |
| Male, n (%) | 74 (54.0) | 38 (61.3) | 15 (53.6) |
| Race n (%) | |||
| Caucasian | 81 (59.1) | 31 (50.0) | 14 (50.0) |
| African American | 50 (36.5) | 28 (45.2) | 14 (50.0) |
| Education level, n (%) | |||
| High school or less | 46 (33.6) | 27 (43.5) | 14 (50.0) |
| College | 68 (49.6) | 21 (33.9) | 9 (32.1) |
| Advanced degree | 10 (7.3) | 8 (12.9) | 2 (7.1) |
| Unable to obtain | 13 (9.5) | 6 (9.7) | 3 (10.8) |
| Past history of VTE, n (%) | 12 (8.8) | 9 (14.5) | 2 (7.1) |
| Type of unit, n (%) | |||
| Medical | 59 (43.1) | 24 (38.7) | 17 (60.7) |
| Surgical | 78 (56.9) | 38 (61.3) | 11 (39.3) |
| Documented refusal of ordered prophylaxis, n (%) | 71 (51.8) | 20 (32.3) | 9 (32.1) |
| Length of hospital stay prior to inclusion in study, d, median (IQR) | 4.0 (3.07.0) | 3.0 (3.05.0) | 4.0 (2.05.0) |
| Patients preferring enteral route, n (%) | 137 (60.4) |
| Dislike of needles | 41 (30.0) |
| Pain from injection | 38 (27.7) |
| Ease of use | 18 (13.1) |
| Bruising from injection | 9 (6.6) |
| Other/no rationale | 31 (22.6) |
| Patients preferring injection route, n (%) | 62 (27.5) |
| Faster onset of action | 25 (40.3) |
| Pill burden | 11 (17.7) |
| Ease of use | 9 (14.5) |
| Other/no rationale | 17 (27.5) |
| Patients with no preference, n (%) | 28 (12.4) |
DISCUSSION
Using a mixed‐methods approach, we report the first survey evaluating patient preferences regarding pharmacologic VTE prophylaxis. We found that a majority of patients preferred an oral route of administration. Nevertheless, a substantial number of patients favored a subcutaneous route of administration believing it to be associated with a faster onset of action. Of interest, patients favoring subcutaneous injections were significantly less likely to refuse doses of ordered VTE prophylaxis. Given that all patients were prescribed a subcutaneous form of VTE prophylaxis, matching patient preference to VTE prophylaxis prescription could potentially increase adherence and reduce patient refusal of ordered prophylaxis. Considering the large number of patients who preferred an oral route of administration, the availability of an oral formulation may potentially result in improved adherence to inpatient VTE prophylaxis.
Our findings have significant implications for healthcare providers, and for patient safety and quality‐improvement researchers. VTE prophylaxis is an important patient‐safety practice, particularly for medically ill patients, which is believed to be underprescribed.[7] Recent studies have demonstrated that a significant number of doses of VTE prophylaxis are not administered, primarily due to patient refusal.[6] Our data indicate that tailoring the route of prophylaxis administration to patient preference may represent a feasible strategy to improve VTE prophylaxis administration rates. Recently, several target‐specific oral anticoagulants (TSOACs) have been approved for a variety of clinical indications, and all have been investigated for VTE prophylaxis.[7, 8, 9, 10, 11, 12, 13, 14, 15] However, no agent is currently US Food & Drug Administration (FDA) approved for primary prevention of VTE, although apixaban and rivaroxaban are FDA approved for VTE prevention in joint replacement.[13, 14] Although in some instances these TSOACs were noted to demonstrate only equivalent efficacy to standard subcutaneous forms of VTE prophylaxis, our data suggest that perhaps in some patients, use of these agents may result in better outcomes due to improved adherence to therapy due to a preferred oral route of administration. We think this hypothesis warrants further investigation.
Our study also underscores the importance of considering patient preferences when caring for patients as emphasized by the 2012 ACCP guidelines.[1] Our results indicate that consideration of patient preferences may lead to better patient care and better outcomes. Interestingly, there were no differences in preference based on education level or the type of service to which the patient was admitted. Clarification of uninformed opinions regarding the rationale for preference may also lead to more informed decisions by patients.
This study has a number of limitations. We only included patients on the internal medicine and general surgical services. It is possible that patients on other specialty services may have different opinions regarding prophylaxis that were not captured in our sample. Similarly, our sample size was limited, and approximately 15% of potential subjects did not participate. We do believe that our population is reflective of our institution based upon our previously published evaluation of multiple hospital units and the inclusion of low‐ and high‐performing units on both the medical and surgical services. Nevertheless, we believe that much more investigation of patient perspectives on VTE prophylaxis needs to be done to inform decision making, including the impact of patient preferences on VTE‐related outcomes. Additionally, we did not evaluate potential predictors of preference including admission diagnosis and duration of hospital length of stay.
In conclusion, we conducted a mixed‐methods analysis of patient preferences regarding pharmacologic VTE prophylaxis. Matching patient preference to ordered VTE prophylaxis may increase adherence to ordered prophylaxis. In this era of increasingly patient‐centered healthcare and expanding options for VTE prophylaxis, we believe information on patient preferences will be helpful to tailoring options for prevention and treatment.
ACKNOWLEDGMENTS
Disclosures: Dr. Haut is the primary investigator of the Mentored Clinician Scientist Development Award K08 1K08HS017952‐01 from the Agency for Healthcare Research and Quality entitled Does Screening Variability Make DVT an Unreliable Quality Measure of Trauma Care? Dr. Haut receives royalties from Lippincott, Williams, & Wilkins for a book he coauthored (Avoiding Common ICU Errors). He has received honoraria for various speaking engagements regarding clinical, quality, and safety topics and has given expert witness testimony in various medical malpractice cases. Dr. Streiff has received research funding from Sanofi‐Aventis and Bristol‐Myers Squibb; honoraria for Continuing Medial Education lectures from Sanofi‐Aventis and Ortho‐McNeil; consulted for Sanofi‐Aventis, Eisai, Daiichi‐Sankyo, and Janssen HealthCare; and has given expert witness testimony in various medical malpractice cases. Mr. Lau, Drs. Haut, Streiff, and Shermock are supported by a contract from the Patient‐Centered Outcomes Research Institute titled Preventing Venous Thromboembolism: Empowering Patients and Enabling Patient‐Centered Care via Health Information Technology (CE‐12‐11‐4489). Ms. Hobson has given expert witness testimony in various medical malpractice cases. All others have no relevant funding or conflicts of interest to report.
- , , , et al. Patient values and preferences in decision making for antithrombotic therapy: a systematic review. Chest. 2012;141(2):e1S–e23S.
- , , , et al. Lessons from the Johns Hopkins Multi‐Disciplinary Venous Thromboembolism (VTE) Prevention Collaborative. BMJ. 2012;344:e3935.
- , , , et al. Impact of a venous thromboembolism (VTE) prophylaxis “smart order set”: improved compliance, fewer events. Am J Hematol. 2013;88(7):545–549.
- , , , et al. Improved prophylaxis and decreased preventable harm with a mandatory computerized clinical decision support tool for venous thromboembolism (VTE) prophylaxis in trauma patients. Arch Surg. 2012;147(10):901–907.
- , , , , . Linking processes and outcomes: a key strategy to prevent and report harm from venous thromboembolism in surgical patients. JAMA Surg. 2013;148(3):299–300.
- , , , et al. Patterns of non‐administration of ordered doses of venous thromboembolism prophylaxis: implications for intervention strategies. PLoS One. 2013;8(6):e66311.
- , , , et al. Venous thromboembolism risk and prophylaxis in the acute hospital care setting (ENDORSE study): a multinational cross‐sectional study. Lancet. 2008;371:387–394.
- , , , et al. Rivaroxaban versus enoxaparin for thromboprophylaxis after hip arthroplasty. N Engl J Med. 2008;358:2765–2775.
- , , , et al. Rivaroxaban versus enoxaparin for thromboprophylaxis after total knee arthoplasty. N Engl J Med. 2008;358:2776–2786.
- , , , , , . Apixaban or enoxaparin for thromboprophylaxis after knee replacement. N Engl J Med. 2009;361:594–604.
- , , , , , . Apixaban versus enoxaparin for thromboprophylaxis after knee replacement (ADVANCE‐2): a randomized double‐blind trial. Lancet. 2010;275:807–815.
- , , , et al. Rivaroxaban for the prevention of venous thromboembolism after hip or knee arthroplasty. Pooled analysis of four studies. Thromb Haemost. 2011;105:444–453.
- , , , et al. Apixaban versus enoxaparin for thromboprophylaxis in medically ill patients. N Engl J Med. 2011;365:2167–2177.
- , , , et al. Efficacy and safety of thromboprophylaxis with low‐molecular‐weight heparin or rivaroxaban in hip and knee replacement surgery: findings from the ORTHO‐TEP registry. Thromb Haemost. 2013;109:154–163.
- , , , et al. Rivaroxaban for thromboprophylaxis in acutely ill medical patients. N Engl J Med. 2013;368:513–523.
The 2012 American College of Chest Physicians (ACCP) guidelines on antithrombotic and thrombolytic therapy conducted a systematic review focusing on patient values and preferences regarding antithrombotic therapy, including thromboprophylaxis.[1] They found that patient values and preferences are highly variable and should be considered when developing future clinical practice guidelines. Notably, there were no studies evaluating patient preferences for venous thromboembolism (VTE) prophylaxis, which is prescribed for the vast majority of hospitalized patients.
Historically, interventions to prevent VTE have focused on increasing prescriptions of prophylaxis. At the Johns Hopkins Hospital, we implemented a mandatory clinical decision support tool in our computerized provider order entry system.[2] Following implementation of this tool, prescription of risk‐appropriate VTE prophylaxis dramatically increased for both medical and surgical patients.[3, 4, 5] These efforts were made with the implicit and incorrect assumption that prescribed medication doses will always be administered to patients, when in fact patient refusal is a leading cause of nonadministration. Studies of VTE prophylaxis administration have reported that 10% to 12% of doses are not administered to patients.[6] Alarmingly, it has been reported that among medically ill patients, between 10% and 30% of doses are not administered, with patient refusal as the most frequently documented reason.
The purpose of this study was to assess patient preferences regarding pharmacological VTE prophylaxis.
METHODS
Study Design
A sample of consecutive hospitalized patients on select medicine and surgical floors previously identified as low‐ and high‐performing units at our institution in regard to administration rates of pharmacologic VTE prophylaxis was assembled from a daily electronic report of patients prescribed pharmacological VTE prophylaxis (Allscripts Sunrise, Chicago, IL) from December 2012 to March 2013. These units were identified in a study conducted at our institution as the lowest‐ and highest‐performing units in regard to incidence of administration of ordered pharmacologic VTE prophylaxis. From this data analysis, we chose the 2 lowest‐performing and 2 highest‐performing units on the medical and surgical service. To be eligible for this study, patients had to have an active order for 1 of the following VTE prophylaxis regimens: unfractionated heparin 5000 units or 7500 units administered subcutaneously every 8 or 12 hours, enoxaparin 30 mg administered subcutaneously every 12 hours or 40 mg administered subcutaneously every 24 hours. Participants had to be at least 18 years of age and hospitalized for at least 2 days on their respective units. Patients who were nonEnglish speaking, those previously enrolled in this study, or those unable to provide consent were excluded from the study.
Data Collection
Demographic information was collected, including patient‐reported education level. To determine their preference for VTE prophylaxis, patients were provided a survey, which included being asked, Would you prefer a pill or a shot to prevent blood clots, if they both worked equally well. The survey was created by the study team to collect information from patients regarding their baseline knowledge of VTE and preference regarding pharmacologic prophylaxis. Additional data included the patient's education level to determine potential association with preference. The survey was verbally administered by 1 investigator (A.W.) to all patients. Patients were asked to explain their rationale for their stated preference in regard to VTE prophylaxis. Patient rationale was subsequently coded to allow for uniformity among patient responses based on patterns in responses. Our electronic medication record allows us to identify patients who refused their medication through nursing documentation. Patients with documented refusal of ordered pharmacologic VTE prophylaxis were asked about the rationale for their refusal. This study was approved by the Johns Hopkins Medicine Institutional Review Board.
Statistical Analysis
Quantitative data from the surveys were analyzed using Minitab (Minitab Inc., State College, PA). A [2] test analysis was performed for categorical data, as appropriate. A P value 0.05 was considered to be statistically significant.
RESULTS
Quantitative Results
We interviewed patients regarding their preferred route of administration of VTE prophylaxis. Overall, 339 patients were screened for this study. Sixty patients were not eligible to participate. Forty‐seven were unable to provide consent, and 13 were nonEnglish speaking. Of the 269 remaining eligible patients, 227 (84.4%) consented to participate.
Baseline demographics of the participants are presented in Table 1, categorized on the basis of their preferred route of administration for VTE prophylaxis. A majority of patients indicated a preference for an oral formulation of pharmacologic VTE prophylaxis. There was no association between education level or service type on preference. Preference for an oral formulation was largely influenced by patient‐reported pain and bruising associated with subcutaneous administration (Table 2). A substantial majority of patients reporting a preference for a subcutaneous formulation and emphasized a belief that this route was associated with a faster onset of action. Among patients who preferred an oral formulation (n=137), 71 patients (51.8%) were documented as having refused at least 1 dose of ordered VTE prophylaxis. Patients who preferred a subcutaneous route of VTE prophylaxis were less likely to refuse prophylaxis, with only 22 patients (35.5%) having a documented refusal of at least 1 dose (P0.0001).
| Enteral, n=137 | Parenteral, n=62 | No Preference, n=28 | |
|---|---|---|---|
| |||
| Age, y, mean ( SD) | 49.5 (14.7) | 51.7 (16.1) | 48.9 (14.6) |
| Male, n (%) | 74 (54.0) | 38 (61.3) | 15 (53.6) |
| Race n (%) | |||
| Caucasian | 81 (59.1) | 31 (50.0) | 14 (50.0) |
| African American | 50 (36.5) | 28 (45.2) | 14 (50.0) |
| Education level, n (%) | |||
| High school or less | 46 (33.6) | 27 (43.5) | 14 (50.0) |
| College | 68 (49.6) | 21 (33.9) | 9 (32.1) |
| Advanced degree | 10 (7.3) | 8 (12.9) | 2 (7.1) |
| Unable to obtain | 13 (9.5) | 6 (9.7) | 3 (10.8) |
| Past history of VTE, n (%) | 12 (8.8) | 9 (14.5) | 2 (7.1) |
| Type of unit, n (%) | |||
| Medical | 59 (43.1) | 24 (38.7) | 17 (60.7) |
| Surgical | 78 (56.9) | 38 (61.3) | 11 (39.3) |
| Documented refusal of ordered prophylaxis, n (%) | 71 (51.8) | 20 (32.3) | 9 (32.1) |
| Length of hospital stay prior to inclusion in study, d, median (IQR) | 4.0 (3.07.0) | 3.0 (3.05.0) | 4.0 (2.05.0) |
| Patients preferring enteral route, n (%) | 137 (60.4) |
| Dislike of needles | 41 (30.0) |
| Pain from injection | 38 (27.7) |
| Ease of use | 18 (13.1) |
| Bruising from injection | 9 (6.6) |
| Other/no rationale | 31 (22.6) |
| Patients preferring injection route, n (%) | 62 (27.5) |
| Faster onset of action | 25 (40.3) |
| Pill burden | 11 (17.7) |
| Ease of use | 9 (14.5) |
| Other/no rationale | 17 (27.5) |
| Patients with no preference, n (%) | 28 (12.4) |
DISCUSSION
Using a mixed‐methods approach, we report the first survey evaluating patient preferences regarding pharmacologic VTE prophylaxis. We found that a majority of patients preferred an oral route of administration. Nevertheless, a substantial number of patients favored a subcutaneous route of administration believing it to be associated with a faster onset of action. Of interest, patients favoring subcutaneous injections were significantly less likely to refuse doses of ordered VTE prophylaxis. Given that all patients were prescribed a subcutaneous form of VTE prophylaxis, matching patient preference to VTE prophylaxis prescription could potentially increase adherence and reduce patient refusal of ordered prophylaxis. Considering the large number of patients who preferred an oral route of administration, the availability of an oral formulation may potentially result in improved adherence to inpatient VTE prophylaxis.
Our findings have significant implications for healthcare providers, and for patient safety and quality‐improvement researchers. VTE prophylaxis is an important patient‐safety practice, particularly for medically ill patients, which is believed to be underprescribed.[7] Recent studies have demonstrated that a significant number of doses of VTE prophylaxis are not administered, primarily due to patient refusal.[6] Our data indicate that tailoring the route of prophylaxis administration to patient preference may represent a feasible strategy to improve VTE prophylaxis administration rates. Recently, several target‐specific oral anticoagulants (TSOACs) have been approved for a variety of clinical indications, and all have been investigated for VTE prophylaxis.[7, 8, 9, 10, 11, 12, 13, 14, 15] However, no agent is currently US Food & Drug Administration (FDA) approved for primary prevention of VTE, although apixaban and rivaroxaban are FDA approved for VTE prevention in joint replacement.[13, 14] Although in some instances these TSOACs were noted to demonstrate only equivalent efficacy to standard subcutaneous forms of VTE prophylaxis, our data suggest that perhaps in some patients, use of these agents may result in better outcomes due to improved adherence to therapy due to a preferred oral route of administration. We think this hypothesis warrants further investigation.
Our study also underscores the importance of considering patient preferences when caring for patients as emphasized by the 2012 ACCP guidelines.[1] Our results indicate that consideration of patient preferences may lead to better patient care and better outcomes. Interestingly, there were no differences in preference based on education level or the type of service to which the patient was admitted. Clarification of uninformed opinions regarding the rationale for preference may also lead to more informed decisions by patients.
This study has a number of limitations. We only included patients on the internal medicine and general surgical services. It is possible that patients on other specialty services may have different opinions regarding prophylaxis that were not captured in our sample. Similarly, our sample size was limited, and approximately 15% of potential subjects did not participate. We do believe that our population is reflective of our institution based upon our previously published evaluation of multiple hospital units and the inclusion of low‐ and high‐performing units on both the medical and surgical services. Nevertheless, we believe that much more investigation of patient perspectives on VTE prophylaxis needs to be done to inform decision making, including the impact of patient preferences on VTE‐related outcomes. Additionally, we did not evaluate potential predictors of preference including admission diagnosis and duration of hospital length of stay.
In conclusion, we conducted a mixed‐methods analysis of patient preferences regarding pharmacologic VTE prophylaxis. Matching patient preference to ordered VTE prophylaxis may increase adherence to ordered prophylaxis. In this era of increasingly patient‐centered healthcare and expanding options for VTE prophylaxis, we believe information on patient preferences will be helpful to tailoring options for prevention and treatment.
ACKNOWLEDGMENTS
Disclosures: Dr. Haut is the primary investigator of the Mentored Clinician Scientist Development Award K08 1K08HS017952‐01 from the Agency for Healthcare Research and Quality entitled Does Screening Variability Make DVT an Unreliable Quality Measure of Trauma Care? Dr. Haut receives royalties from Lippincott, Williams, & Wilkins for a book he coauthored (Avoiding Common ICU Errors). He has received honoraria for various speaking engagements regarding clinical, quality, and safety topics and has given expert witness testimony in various medical malpractice cases. Dr. Streiff has received research funding from Sanofi‐Aventis and Bristol‐Myers Squibb; honoraria for Continuing Medial Education lectures from Sanofi‐Aventis and Ortho‐McNeil; consulted for Sanofi‐Aventis, Eisai, Daiichi‐Sankyo, and Janssen HealthCare; and has given expert witness testimony in various medical malpractice cases. Mr. Lau, Drs. Haut, Streiff, and Shermock are supported by a contract from the Patient‐Centered Outcomes Research Institute titled Preventing Venous Thromboembolism: Empowering Patients and Enabling Patient‐Centered Care via Health Information Technology (CE‐12‐11‐4489). Ms. Hobson has given expert witness testimony in various medical malpractice cases. All others have no relevant funding or conflicts of interest to report.
- , , , et al. Patient values and preferences in decision making for antithrombotic therapy: a systematic review. Chest. 2012;141(2):e1S–e23S.
- , , , et al. Lessons from the Johns Hopkins Multi‐Disciplinary Venous Thromboembolism (VTE) Prevention Collaborative. BMJ. 2012;344:e3935.
- , , , et al. Impact of a venous thromboembolism (VTE) prophylaxis “smart order set”: improved compliance, fewer events. Am J Hematol. 2013;88(7):545–549.
- , , , et al. Improved prophylaxis and decreased preventable harm with a mandatory computerized clinical decision support tool for venous thromboembolism (VTE) prophylaxis in trauma patients. Arch Surg. 2012;147(10):901–907.
- , , , , . Linking processes and outcomes: a key strategy to prevent and report harm from venous thromboembolism in surgical patients. JAMA Surg. 2013;148(3):299–300.
- , , , et al. Patterns of non‐administration of ordered doses of venous thromboembolism prophylaxis: implications for intervention strategies. PLoS One. 2013;8(6):e66311.
- , , , et al. Venous thromboembolism risk and prophylaxis in the acute hospital care setting (ENDORSE study): a multinational cross‐sectional study. Lancet. 2008;371:387–394.
- , , , et al. Rivaroxaban versus enoxaparin for thromboprophylaxis after hip arthroplasty. N Engl J Med. 2008;358:2765–2775.
- , , , et al. Rivaroxaban versus enoxaparin for thromboprophylaxis after total knee arthoplasty. N Engl J Med. 2008;358:2776–2786.
- , , , , , . Apixaban or enoxaparin for thromboprophylaxis after knee replacement. N Engl J Med. 2009;361:594–604.
- , , , , , . Apixaban versus enoxaparin for thromboprophylaxis after knee replacement (ADVANCE‐2): a randomized double‐blind trial. Lancet. 2010;275:807–815.
- , , , et al. Rivaroxaban for the prevention of venous thromboembolism after hip or knee arthroplasty. Pooled analysis of four studies. Thromb Haemost. 2011;105:444–453.
- , , , et al. Apixaban versus enoxaparin for thromboprophylaxis in medically ill patients. N Engl J Med. 2011;365:2167–2177.
- , , , et al. Efficacy and safety of thromboprophylaxis with low‐molecular‐weight heparin or rivaroxaban in hip and knee replacement surgery: findings from the ORTHO‐TEP registry. Thromb Haemost. 2013;109:154–163.
- , , , et al. Rivaroxaban for thromboprophylaxis in acutely ill medical patients. N Engl J Med. 2013;368:513–523.
Bedside Tools to Assess Volume Status
Clinical estimation of volume status in hospitalized medical patients is an important part of bedside examination, guiding management decisions for many common medical conditions such as heart failure, hyponatremia, and gastrointestinal bleeding. Despite the importance of bedside volume status assessment in clinical care, there are many barriers to its accurate estimation. Specific to the jugular venous pressure (JVP), estimation of its height relies on the transmission of venous pulsations to the overlying skin[1] and has been reported to not be visible in up to 80% of the time in critically ill patients.[2] Additional difficulty in its estimation may be encountered if the central venous pressure is either too high, too low, or obscured by a short or obese neck.[3] Furthermore, in medical patients with respiratory dysfunction, large variations of central venous pressures pose an additional challenge for the bedside examination.[1] Other clinical parameters, such as lung auscultation for crackles and identification of peripheral edema, are likewise equally problematic,[4] and despite training, housestaff may recognize fewer than 50% of respiratory findings at the bedside.[5]
The overall burden of volume status assessment requirements placed on housestaff is unknown. We hypothesize that housestaff are frequently asked to make volume status assessments on admitted medical patients. If this is true, we argue for the need for educating them on the use of additional bedside tools that can assist in volume status determination. An example of such a tool is the use of bedside ultrasound. The objective of this brief report was to conduct a survey to determine the frequency of clinical volume status assessments needed on medical inpatients and secondarily discuss the potential use of bedside ultrasound for volume status determination.
METHOD
Participants
All medical housestaff (medical students and residents) on the inpatient Medical Teaching Unit (MTU) at Foothills Medical Centre in Calgary, Alberta were invited to participate in the study. We randomly selected 13 study dates between February 2012 and January 2013. On study dates, all housestaff designated to be on call were invited to complete the paper‐based survey during their call shift. At our center, the majority of medical patients are admitted by family medicine. The more complex medical patients who are suitable for teaching are admitted to 1 of 3 teams on the MTU. Each team's patients (typically 1013 per team) are covered by its own team's housestaff on call, without cross‐coverage. Housestaff included residents in the internal medicine residency program (n=92), final year medical students (58 out of 163 students rotated through our center that year), and rotating off‐service residents in other residency programs (n=34 per rotation). At the start of each call shift, there was a dedicated time for handover, where information handed over was left to the discretion of the team.
This study was approved by the University of Calgary Conjoint Health Research Ethics Board.
Survey Development
After a review of key articles in the literature,[1, 6, 7, 8, 9] an initial 46‐item survey was generated by 1 investigator (D.L.), with additional input from a second investigator (I.W.Y.M.). The survey covered items on (1) impression and self‐reported certainty of impression of the patient's volume status assessment, (2) clinical parameters used to decide on volume status, and (3) self‐reported ability to perform volume status assessments. In addition to demographic information, consenting housestaff were asked to record the number of total pages or telephone requests received on patients that required a volume status assessment and the total number of pages or telephone requests received during the call shift. This survey was first piloted on 6 trainees (1 medical student, 2 postgraduate year [PGY]‐1 residents, 2 PGY‐2 residents, and 1 PGY‐3 resident), and feedback on completeness, flow, redundancy, and clarity of items was sought. Revision based on pilot data resulted in a final 25‐item survey. The final 25‐item survey was then administered to consenting participants on the selected study dates (see Supporting Information in the online version of this article for an example of the survey). Housestaff were instructed to include only pages regarding admitted inpatients. Pages regarding newly admitted patients were excluded, because all new patients require a comprehensive assessment, rather than targeted volume status assessments. Completed surveys were then returned anonymously in a designated collection folder.
Statistical Analysis
Correlations between continuous variables are reported using Pearson correlation coefficients. Data that are normally distributed are reported using meanstandard deviation, whereas data that are not normally distributed are reported using median and interquartile range (IQR). All reported P values are 2‐sided. Analyses were conducted using the SAS version 9.3 (SAS Institute Inc., Cary, NC).
RESULTS
The 13 randomly selected study dates included 10 weekdays and 3 weekend days. Of the 39 eligible housestaff who were on call during those study dates, 31 (79%) unique individuals consented to and completed the survey. The baseline characteristics of the study participants are reported in Table 1.
| Baseline Demographics | Participants (N=31) |
|---|---|
| |
| Sex | |
| Male | 16 (52%) |
| Female | 15 (48%) |
| Level of training | |
| Medical student | 12 (39%) |
| PGY‐1 | 14 (45%) |
| PGY‐2 | 2 (6%) |
| PGY‐3 | 3 (10%) |
| Specialty (excluding medical students) | |
| Internal medicine | 16 (84%) |
| Off service | 3 (16%) |
| Self‐reported competency of volume status assessment | |
| Borderline competency | 4 (13%) |
| Competent | 14 (45%) |
| Above average | 12 (39%) |
| Well above average | 1 (3%) |
A total of 455 on‐call hours were logged, with a total of 197 pages received during the study period. Median shift duration was 12 hours (IQR=1224 hours, range=724 hours) with a median of 5 pages received per shift (IQR=310). Of the 197 total pages received, 41 of these (21%) were felt by the participants to warrant a volume status assessment.
Of the 14 volume status assessment parameters considered, housestaff used a mean of 73 parameters per assessment. The most frequently used parameters in volume status assessment were the patient's history (90%), respiratory examination (76%), JVP (73%), blood pressure (71%), and heart rate (71%) (Figure 1). In 35 of these 41 assessments (85%), housestaff indicated examining the patient for JVP, respiratory examination, edema, heart sound, or abdominal jugular reflux. Of those who examined the patient, an average of 31 physical examination findings were sought. Of the 6 patients who were not examined, housestaff reported being very certain of the patients' volume status using nonphysical examination parameters.

In 24 cases (59%) the intravenous was changed (ie, type of intravenous fluid used, rate change, starting or stopping of fluids). In 9 cases (22%) a diuretic was given, and in 15 cases (37%) a chest radiograph was ordered.
Confidence in Volume Status Assessment
Overall self‐reported competency in performing volume status assessments was moderate (median score=3, IQR=34, range=25; where 1=not competent to perform independently, 3=competent to perform independently, 6=above average competence to perform independently). Overall certainty regarding the accuracy of volume status assessments on each patient during the call shift was moderate (mean score=3.5 1.4, range=15; where 1=very uncertain; 5=very certain (Table 2).
| Volume Status Assessments (N=41) | |
|---|---|
| |
| Difficulty with volume status assessment | |
| Conflicting history | 0 (0%) |
| Conflicting examination findings | 8 (20%) |
| Conflicting laboratory findings | 1 (2%) |
| Unsure of own examination skills | 3 (7%) |
| Suboptimal patient examination | 5 (12%) |
| Required help to confirm volume status assessment | 9 (22%) |
| Confidence in assessment* | 3.5 (1.4) |
In 9 of the 41 assessments (22%), there was at least 1 barrier identified in terms of conflicting history, examination findings, laboratory findings, or suboptimal patient examination. The most commonly reported barrier was conflicting physical examination findings (8 assessments, 20%). Five of the assessments (12%) were reported to be suboptimal in terms of patient examination.
In general, although none of the associations were significant, the more elements housetaff reported using, the less certainty was reported regarding the accuracy of volume status assessment (r=0.11, P=0.49); the more pages received by the housestaff during the work shift, the less the reported certainty (r=0.22, P=0.33). Finally, the higher the level of training, the higher the reported certainty (r=0.36, P=0.11).
DISCUSSION
In this brief report, we identified that over 20% of pages over a call shift regarding admitted medical patients required volume status assessments by medical housestaff. Despite moderate self‐reported competence in the ability to assess volume status, barriers to volume status determination, such as conflicting physical examination findings and suboptimal patient examinations, were present in up to 20% of the assessments.
Other studies have similarly shown trainees with difficulty regarding clinical examinations for volume status. In these studies, difficulty with findings ranged between 16% to well over 50%.[1, 2, 3, 5] To our knowledge, this is the first report on the estimated burden of volume status assessments borne by medical housestaff. Together, our results on the burden of volume status assessments and the uncertainty regarding volume status assessments argue for the need for either better education of examination skills, or alternatively, additional tools for volume status assessments.
Although future studies evaluating the effects of improving education on examination skills and accuracy would be helpful, it has been previously reported that even attending physicians' examination skills were poor.[3] Suboptimal educator's skills, coupled with less‐than‐ideal patient characteristics in some settings, such as obesity and anatomical variations, suggest that education of bedside examination skills alone is unlikely to optimally assist clinicians with volume status assessments. Therefore, we believe our results argue for the need for additional tools for determining volume status in patients.
Bedside ultrasound is a promising tool that may be of use in this setting. It can assist in volume status assessments in a number of ways. First, for example, the height of the JVP can be located on ultrasound, using a linear transducer, as the site of where the vein tapers, using either a longitudinal or transverse view.[10] This measurement can be readily obtained even in obese patients.[10] Second, pulmonary findings, such as pleural effusions and the appearance of bilateral B lines would be suggestive of volume overload.[11, 12] The presence of unilateral B lines and consolidation/hepatization, on the other hand, would be suggestive of an infective or atelectatic process.[11, 12, 13] Last, a small inferior vena cava (IVC) diameter (2 cm) or collapsibility of >50%, although more controversial, may be able to help identify patients who may benefit from intravascular fluid loading.[13, 14] Response of IVC diameter to passive leg raise may also be assessed.[13] Feasibility wise, many of these bedside skills require minimal training, even for novices. As little as 3 to 4 hours of training may suffice.[12, 15]
Although the use of bedside ultrasound holds promise, a number of important questions should be addressed. First, can trainees be taught to use ultrasound accurately and reliably? If so, can ultrasound be incorporated into clinical care or would the time required to perform these additional examinations be prohibitive? Second, how will its use impact on volume status estimation accuracy and clinical outcomes? Third, what may be some unintended consequences of introducing this tool into the existing educational curriculum? Future studies addressing these questions are needed to better assist educators in optimizing an educational curriculum that would best benefit learners and patients.
Some limitations in our study include the fact that first, this is a single‐centered study. However, as previously stated, our results regarding difficulty with clinical examination findings are in keeping with findings from other centers.[1, 2, 3, 5] Second, our results are based on what housestaff felt necessitated volume status assessments, rather than what calls truly needed volume status assessments. In addition, the number of pages received was by self‐report. However, housestaff are more likely to under‐report by forgetting to log their pages, rather than to over‐report. Thus, our results are likely a conservative estimate of the burden of volume status assessments faced by medical housestaff. Third, some parameters were not included in our survey. For example, ordering of B‐type natriuretic peptide required a cardiology consultation at our center, and thus this investigation is not readily available to us. Daily weights, urea to creatinine ratio, and fractional excretion of sodium were not included based on feedback from our pilot survey suggesting that these parameters were not commonly used or available for admitted patients. Thus, overall confidence in volume status assessments may differ should these parameters be routinely employed. Fourth, our participants were predominantly junior learners. Therefore, our results may not generalize to centers where patients are managed primarily by more senior learners. Last, our results pertain only to patients admitted to internal medicine. For patients in the intensive care unit or coronary care unit, the burden of volume status assessments is likely even higher.
These limitations notwithstanding, our results do raise a potential concern regarding the current practice by which patients' volume statuses are assessed. We urge educators to consider incorporating bedside ultrasound training for volume status into the internal medicine curriculum and to address the need for future studies on its utility for volume status assessments.
Acknowledgements
The authors thank all of the housestaff who completed the survey.
Disclosures
Dr. Kerri Novak has received a consulting fee, and support for travel and a study for an unrelated project on ultrasound imaging from AbbVie Inc. The authors report no other potential conflicts of interest.
- , . Does this patient have abnormal central venous pressure? JAMA. 1996;275:630–634.
- , . Estimation of central venous pressure by examination of jugular veins. Am Heart J. 1974;87:279–282.
- . Clinical assessment of central venous pressure in the critically ill. Am J Med Sci. 1990;299:175–178.
- . Assessment of intravascular volume: a comedy of errors. Crit Care Med. 2001;29:1635–1636.
- , . Pulmonary auscultatory skills during training in internal medicine and family practice. Am J Respir Crit Care Med. 1999;159:1119–1124.
- . Evidence Based Physical Diagnosis. 2nd ed. St. Louis, MO: Saunders; 2007.
- , , . The rational clinical examination. Is this patient hypovolemic? JAMA. 1999;281:1022–1029.
- . Physical examination of venous pressure: a critical review. Am Heart J. 1998;136:10–18.
- , , . The jugular venous pressure revisited. Cleve Clin J Med. 2013;80:638–644.
- . Estimation of central venous pressure by ultrasound of the internal jugular vein. Am J Emerg Med. 2000;18:432–434.
- , , , et al. International evidence‐based recommendations for point‐of‐care lung ultrasound. Intensive Care Med. 2012;38:577–591.
- , , , , . Impact of pocket ultrasound use by internal medicine housestaff in the diagnosis of dyspnea [published online ahead of print June 3, 2014]. J Hosp Med. doi: 10.1002/jhm.2219.
- , , , et al. International evidence‐based recommendations for focused cardiac ultrasound. J Am Soc Echocardiogr. 2014;27:683.e1–.e33.
- , , , et al. Qualitative assessment of the inferior vena cava: useful tool for the evaluation of fluid status in critically ill patients. Am Surg. 2012;78:468–470.
- , , , et al. A comparison by medicine residents of physical examination versus hand‐carried ultrasound for estimation of right atrial pressure. Am J Cardiol. 2007;99:1614–1616.
Clinical estimation of volume status in hospitalized medical patients is an important part of bedside examination, guiding management decisions for many common medical conditions such as heart failure, hyponatremia, and gastrointestinal bleeding. Despite the importance of bedside volume status assessment in clinical care, there are many barriers to its accurate estimation. Specific to the jugular venous pressure (JVP), estimation of its height relies on the transmission of venous pulsations to the overlying skin[1] and has been reported to not be visible in up to 80% of the time in critically ill patients.[2] Additional difficulty in its estimation may be encountered if the central venous pressure is either too high, too low, or obscured by a short or obese neck.[3] Furthermore, in medical patients with respiratory dysfunction, large variations of central venous pressures pose an additional challenge for the bedside examination.[1] Other clinical parameters, such as lung auscultation for crackles and identification of peripheral edema, are likewise equally problematic,[4] and despite training, housestaff may recognize fewer than 50% of respiratory findings at the bedside.[5]
The overall burden of volume status assessment requirements placed on housestaff is unknown. We hypothesize that housestaff are frequently asked to make volume status assessments on admitted medical patients. If this is true, we argue for the need for educating them on the use of additional bedside tools that can assist in volume status determination. An example of such a tool is the use of bedside ultrasound. The objective of this brief report was to conduct a survey to determine the frequency of clinical volume status assessments needed on medical inpatients and secondarily discuss the potential use of bedside ultrasound for volume status determination.
METHOD
Participants
All medical housestaff (medical students and residents) on the inpatient Medical Teaching Unit (MTU) at Foothills Medical Centre in Calgary, Alberta were invited to participate in the study. We randomly selected 13 study dates between February 2012 and January 2013. On study dates, all housestaff designated to be on call were invited to complete the paper‐based survey during their call shift. At our center, the majority of medical patients are admitted by family medicine. The more complex medical patients who are suitable for teaching are admitted to 1 of 3 teams on the MTU. Each team's patients (typically 1013 per team) are covered by its own team's housestaff on call, without cross‐coverage. Housestaff included residents in the internal medicine residency program (n=92), final year medical students (58 out of 163 students rotated through our center that year), and rotating off‐service residents in other residency programs (n=34 per rotation). At the start of each call shift, there was a dedicated time for handover, where information handed over was left to the discretion of the team.
This study was approved by the University of Calgary Conjoint Health Research Ethics Board.
Survey Development
After a review of key articles in the literature,[1, 6, 7, 8, 9] an initial 46‐item survey was generated by 1 investigator (D.L.), with additional input from a second investigator (I.W.Y.M.). The survey covered items on (1) impression and self‐reported certainty of impression of the patient's volume status assessment, (2) clinical parameters used to decide on volume status, and (3) self‐reported ability to perform volume status assessments. In addition to demographic information, consenting housestaff were asked to record the number of total pages or telephone requests received on patients that required a volume status assessment and the total number of pages or telephone requests received during the call shift. This survey was first piloted on 6 trainees (1 medical student, 2 postgraduate year [PGY]‐1 residents, 2 PGY‐2 residents, and 1 PGY‐3 resident), and feedback on completeness, flow, redundancy, and clarity of items was sought. Revision based on pilot data resulted in a final 25‐item survey. The final 25‐item survey was then administered to consenting participants on the selected study dates (see Supporting Information in the online version of this article for an example of the survey). Housestaff were instructed to include only pages regarding admitted inpatients. Pages regarding newly admitted patients were excluded, because all new patients require a comprehensive assessment, rather than targeted volume status assessments. Completed surveys were then returned anonymously in a designated collection folder.
Statistical Analysis
Correlations between continuous variables are reported using Pearson correlation coefficients. Data that are normally distributed are reported using meanstandard deviation, whereas data that are not normally distributed are reported using median and interquartile range (IQR). All reported P values are 2‐sided. Analyses were conducted using the SAS version 9.3 (SAS Institute Inc., Cary, NC).
RESULTS
The 13 randomly selected study dates included 10 weekdays and 3 weekend days. Of the 39 eligible housestaff who were on call during those study dates, 31 (79%) unique individuals consented to and completed the survey. The baseline characteristics of the study participants are reported in Table 1.
| Baseline Demographics | Participants (N=31) |
|---|---|
| |
| Sex | |
| Male | 16 (52%) |
| Female | 15 (48%) |
| Level of training | |
| Medical student | 12 (39%) |
| PGY‐1 | 14 (45%) |
| PGY‐2 | 2 (6%) |
| PGY‐3 | 3 (10%) |
| Specialty (excluding medical students) | |
| Internal medicine | 16 (84%) |
| Off service | 3 (16%) |
| Self‐reported competency of volume status assessment | |
| Borderline competency | 4 (13%) |
| Competent | 14 (45%) |
| Above average | 12 (39%) |
| Well above average | 1 (3%) |
A total of 455 on‐call hours were logged, with a total of 197 pages received during the study period. Median shift duration was 12 hours (IQR=1224 hours, range=724 hours) with a median of 5 pages received per shift (IQR=310). Of the 197 total pages received, 41 of these (21%) were felt by the participants to warrant a volume status assessment.
Of the 14 volume status assessment parameters considered, housestaff used a mean of 73 parameters per assessment. The most frequently used parameters in volume status assessment were the patient's history (90%), respiratory examination (76%), JVP (73%), blood pressure (71%), and heart rate (71%) (Figure 1). In 35 of these 41 assessments (85%), housestaff indicated examining the patient for JVP, respiratory examination, edema, heart sound, or abdominal jugular reflux. Of those who examined the patient, an average of 31 physical examination findings were sought. Of the 6 patients who were not examined, housestaff reported being very certain of the patients' volume status using nonphysical examination parameters.
In 24 cases (59%) the intravenous was changed (ie, type of intravenous fluid used, rate change, starting or stopping of fluids). In 9 cases (22%) a diuretic was given, and in 15 cases (37%) a chest radiograph was ordered.
Confidence in Volume Status Assessment
Overall self‐reported competency in performing volume status assessments was moderate (median score=3, IQR=34, range=25; where 1=not competent to perform independently, 3=competent to perform independently, 6=above average competence to perform independently). Overall certainty regarding the accuracy of volume status assessments on each patient during the call shift was moderate (mean score=3.5 1.4, range=15; where 1=very uncertain; 5=very certain (Table 2).
| Volume Status Assessments (N=41) | |
|---|---|
| |
| Difficulty with volume status assessment | |
| Conflicting history | 0 (0%) |
| Conflicting examination findings | 8 (20%) |
| Conflicting laboratory findings | 1 (2%) |
| Unsure of own examination skills | 3 (7%) |
| Suboptimal patient examination | 5 (12%) |
| Required help to confirm volume status assessment | 9 (22%) |
| Confidence in assessment* | 3.5 (1.4) |
In 9 of the 41 assessments (22%), there was at least 1 barrier identified in terms of conflicting history, examination findings, laboratory findings, or suboptimal patient examination. The most commonly reported barrier was conflicting physical examination findings (8 assessments, 20%). Five of the assessments (12%) were reported to be suboptimal in terms of patient examination.
In general, although none of the associations were significant, the more elements housetaff reported using, the less certainty was reported regarding the accuracy of volume status assessment (r=0.11, P=0.49); the more pages received by the housestaff during the work shift, the less the reported certainty (r=0.22, P=0.33). Finally, the higher the level of training, the higher the reported certainty (r=0.36, P=0.11).
DISCUSSION
In this brief report, we identified that over 20% of pages over a call shift regarding admitted medical patients required volume status assessments by medical housestaff. Despite moderate self‐reported competence in the ability to assess volume status, barriers to volume status determination, such as conflicting physical examination findings and suboptimal patient examinations, were present in up to 20% of the assessments.
Other studies have similarly shown trainees with difficulty regarding clinical examinations for volume status. In these studies, difficulty with findings ranged between 16% to well over 50%.[1, 2, 3, 5] To our knowledge, this is the first report on the estimated burden of volume status assessments borne by medical housestaff. Together, our results on the burden of volume status assessments and the uncertainty regarding volume status assessments argue for the need for either better education of examination skills, or alternatively, additional tools for volume status assessments.
Although future studies evaluating the effects of improving education on examination skills and accuracy would be helpful, it has been previously reported that even attending physicians' examination skills were poor.[3] Suboptimal educator's skills, coupled with less‐than‐ideal patient characteristics in some settings, such as obesity and anatomical variations, suggest that education of bedside examination skills alone is unlikely to optimally assist clinicians with volume status assessments. Therefore, we believe our results argue for the need for additional tools for determining volume status in patients.
Bedside ultrasound is a promising tool that may be of use in this setting. It can assist in volume status assessments in a number of ways. First, for example, the height of the JVP can be located on ultrasound, using a linear transducer, as the site of where the vein tapers, using either a longitudinal or transverse view.[10] This measurement can be readily obtained even in obese patients.[10] Second, pulmonary findings, such as pleural effusions and the appearance of bilateral B lines would be suggestive of volume overload.[11, 12] The presence of unilateral B lines and consolidation/hepatization, on the other hand, would be suggestive of an infective or atelectatic process.[11, 12, 13] Last, a small inferior vena cava (IVC) diameter (2 cm) or collapsibility of >50%, although more controversial, may be able to help identify patients who may benefit from intravascular fluid loading.[13, 14] Response of IVC diameter to passive leg raise may also be assessed.[13] Feasibility wise, many of these bedside skills require minimal training, even for novices. As little as 3 to 4 hours of training may suffice.[12, 15]
Although the use of bedside ultrasound holds promise, a number of important questions should be addressed. First, can trainees be taught to use ultrasound accurately and reliably? If so, can ultrasound be incorporated into clinical care or would the time required to perform these additional examinations be prohibitive? Second, how will its use impact on volume status estimation accuracy and clinical outcomes? Third, what may be some unintended consequences of introducing this tool into the existing educational curriculum? Future studies addressing these questions are needed to better assist educators in optimizing an educational curriculum that would best benefit learners and patients.
Some limitations in our study include the fact that first, this is a single‐centered study. However, as previously stated, our results regarding difficulty with clinical examination findings are in keeping with findings from other centers.[1, 2, 3, 5] Second, our results are based on what housestaff felt necessitated volume status assessments, rather than what calls truly needed volume status assessments. In addition, the number of pages received was by self‐report. However, housestaff are more likely to under‐report by forgetting to log their pages, rather than to over‐report. Thus, our results are likely a conservative estimate of the burden of volume status assessments faced by medical housestaff. Third, some parameters were not included in our survey. For example, ordering of B‐type natriuretic peptide required a cardiology consultation at our center, and thus this investigation is not readily available to us. Daily weights, urea to creatinine ratio, and fractional excretion of sodium were not included based on feedback from our pilot survey suggesting that these parameters were not commonly used or available for admitted patients. Thus, overall confidence in volume status assessments may differ should these parameters be routinely employed. Fourth, our participants were predominantly junior learners. Therefore, our results may not generalize to centers where patients are managed primarily by more senior learners. Last, our results pertain only to patients admitted to internal medicine. For patients in the intensive care unit or coronary care unit, the burden of volume status assessments is likely even higher.
These limitations notwithstanding, our results do raise a potential concern regarding the current practice by which patients' volume statuses are assessed. We urge educators to consider incorporating bedside ultrasound training for volume status into the internal medicine curriculum and to address the need for future studies on its utility for volume status assessments.
Acknowledgements
The authors thank all of the housestaff who completed the survey.
Disclosures
Dr. Kerri Novak has received a consulting fee, and support for travel and a study for an unrelated project on ultrasound imaging from AbbVie Inc. The authors report no other potential conflicts of interest.
- , . Does this patient have abnormal central venous pressure? JAMA. 1996;275:630–634.
- , . Estimation of central venous pressure by examination of jugular veins. Am Heart J. 1974;87:279–282.
- . Clinical assessment of central venous pressure in the critically ill. Am J Med Sci. 1990;299:175–178.
- . Assessment of intravascular volume: a comedy of errors. Crit Care Med. 2001;29:1635–1636.
- , . Pulmonary auscultatory skills during training in internal medicine and family practice. Am J Respir Crit Care Med. 1999;159:1119–1124.
- . Evidence Based Physical Diagnosis. 2nd ed. St. Louis, MO: Saunders; 2007.
- , , . The rational clinical examination. Is this patient hypovolemic? JAMA. 1999;281:1022–1029.
- . Physical examination of venous pressure: a critical review. Am Heart J. 1998;136:10–18.
- , , . The jugular venous pressure revisited. Cleve Clin J Med. 2013;80:638–644.
- . Estimation of central venous pressure by ultrasound of the internal jugular vein. Am J Emerg Med. 2000;18:432–434.
- , , , et al. International evidence‐based recommendations for point‐of‐care lung ultrasound. Intensive Care Med. 2012;38:577–591.
- , , , , . Impact of pocket ultrasound use by internal medicine housestaff in the diagnosis of dyspnea [published online ahead of print June 3, 2014]. J Hosp Med. doi: 10.1002/jhm.2219.
- , , , et al. International evidence‐based recommendations for focused cardiac ultrasound. J Am Soc Echocardiogr. 2014;27:683.e1–.e33.
- , , , et al. Qualitative assessment of the inferior vena cava: useful tool for the evaluation of fluid status in critically ill patients. Am Surg. 2012;78:468–470.
- , , , et al. A comparison by medicine residents of physical examination versus hand‐carried ultrasound for estimation of right atrial pressure. Am J Cardiol. 2007;99:1614–1616.
