User login
ED Observation Units and Admission Rates
Today more than one‐third of emergency departments (EDs) in the United States have affiliated observation units, where patients can stay 24 to 48 hours without being admitted to the hospital.[1] Observation units experienced significant growth in the United States from 2005 to 2007, secondary to policy changes involving the Centers for Medicare and Medicaid Services (CMS), which expanded reimbursement for observation services to include any clinical condition. Furthermore, CMS implemented the Recovery Audit Contractor process, which was able to fine providers and facilities for inappropriate claims, with the principle method for charge recovery being inappropriate charges for short inpatient stays.
ED observation units (EDOUs) vary in the number of beds, but are often located adjacent to the emergency department.[2] It is estimated that EDOUs have the capacity for caring for 5% to 10% of any given ED volume.[2] Almost half of EDOUs are protocol driven, allowing these units to discharge up to 80% of all patients within 24 hours.[1, 2] Some studies have suggested that EDOUs are associated with a decrease in overall hospitalization rates, leading to cost savings.[1] However, these studies were limited by their single‐center design or simulated in nature. In addition, other studies show that EDOUs decrease inpatient admissions, length of stay, and costs related to specific clinical conditions such as chest pain, transient ischemic attack, and syncope.[3]
To further evaluate the association of observation units on ED hospital admission rates nationally, we analyzed the largest ED‐based survey, the 2010 National Hospital Ambulatory Medical Care Survey (NHAMCS), to assess the impact of observation units on hospital admissions from the ED. We hypothesized that observation units decrease overall hospital admissions from the ED.
METHODS
Study Design and Population
We performed a retrospective cross‐sectional analysis of ED visits from 2010. This study was exempt from institutional review board review by the University of Colorado and Yale University institutional review committee. The NHAMCS is an annual, national probability sample of ambulatory visits made to nonfederal, general, and short‐stay hospitals conducted by the Centers for Disease Control and Prevention (CDC), National Center for Health Statistics. The multistaged sample design was previously described elsewhere.[4] The 2010 NHAMCS dataset included 350 participating hospitals (unweighted sampling rate of 90%) and a total of 34,936 patient visits.[4]
Exclusions
We excluded patients who were less than 18 years old (n = 8015; 23%); left without being seen, left before examination completion, or left against medical advice (n = 813; 2%); transferred to another institution (n = 626; 1.7%); died on arrival or died in the ED (n = 60; 0.2%); and with missing data on discharge disposition (n = 100; 0.3%). Finally, we excluded hospitals with fewer than 30 visits per year (n = 307; 0.9%) to comply with reliable relative standard errors, as recommended by the CDC; after all of these exclusions there were 325 hospitals. Finally, we excluded hospitals with missing information on EDOUs (n = 783, 2.2%); our dataset at this point included 315 hospitals.
Outcomes
The primary outcome was hospital admission, either from the ED or admitted to an observation unit with subsequent hospital admission, defined as the ED risk‐standardized hospital admission rate (ED RSHAR).[5] This methodology allows for risk adjustment of case mix (ie, disease severity) for each hospital's ED admission rates and has been previously described in the evaluation of varying ED hospital admission rates using the same dataset.[5] To evaluate which hospitals had observation units, we used the following hospital survey question: Does your ED have an observation or clinical decision unit?
Identification of Variables
ED hospitalization rates were risk standardized for each hospital to account for each hospital's case mix and hospital factors such as socioeconomic status, clinical severity, and hospital characteristics. This methodology and dataset use have been previously described in detail.[5]
To account for common chief complaints leading to hospitalization and case‐mix distribution of these complaints among different hospitals, we analyzed all chief complaints and their relationship to hospital admission. We first identified those associated with an admission rate that exceeded 30% and was present in 1% or more of patient visits. The study team of researchers and clinicians determined the aforementioned cutoffs as clinically meaningful. Eight chief complaints met both criteria: chest pain and related symptoms, shortness of breath, other symptoms/probably related to psychological, general weakness, labored or difficulty breathing, fainting (syncope), unconscious arrival, and other symptoms referable to the nervous system. Chronic diseases, such as congestive heart failure, diabetes mellitus, renal disease on dialysis, and human immunodeficiency virus, were also included in the model.
Hospital factors included metropolitan status, geographic region of the country (limited to Northeast, Midwest, South, and West), teaching status, and urban or rural status.[6] We derived a new variable based on a previous study, teaching status, by combining nonprivate hospital status plus having at least 1 ED visit be evaluated by a resident.
Statistical Analyses
We used SAS version 9.2 (SAS Institute, Cary, NC) for all statistical analyses. Frequencies of all variables in the model were calculated to assess the distribution of data and quantify missing data. We did not want to have variables in the model with high collinearity. To investigate collinearity between independent variables, we calculated Spearman correlation coefficients; high collinearity was defined as r > 0.6. No variables included in the model had high collinearity.
To investigate the association of the candidate variables with hospitalization, we used survey logistic regression. Although some variables did not show an association with hospitalization, we felt they were clinically relevant and did not remove them from the model. Hierarchical logistic regression modeling (explained below) was used to calculate ED RSHAR based on the aforementioned selected variables associated with hospital admission.
Hierarchical logistic regression models (HLRM) were used to estimate RSHAR for each hospital. This approach reflects the assumption that a hospital‐specific component exists, and that it will affect the outcomes of patients at a particular institution. This method takes into consideration the hierarchical structure of the data to account for patient clustering within hospitals, and has been used by the CMS to publicly report hospital risk‐standardized rates of mortality and readmission for acute myocardial infarction, heart failure, and pneumonia.
We used a similar methodology as previously published.[5] In summary, the hospital RSHAR was calculated as a ratio of the number of predicted hospital admissions in the hospital to the number of expected hospital admissions in the hospital. This ratio is then multiplied by the national unadjusted rate of hospital admissions. We calculated the C statistic of the HLRM model to assess for overall adequacy of risk prediction. To analyze the association between ED RSHAR and EDOUs, we used analysis of variance, where the dependent variable was ED RSHAR and independent variable of interest was presence of EDOUs.
RESULTS
There were 24,232 ED visits from 315 hospitals in the United States in our study. Of these, 82 (20.6%) hospitals had an observation unit physically separate from the ED. Hospitals with and without observation units did not have different hospital patient level characteristics. There was no association between hospital ownership, teaching status, region location, urban or rural location, and hospitals with observation units when compared with hospitals without observation units (Table 1).
| Hospitals With Observation Units, W% (N = 82) | Hospitals Without Observation Units, W% (N = 233) | P Value | |
|---|---|---|---|
| |||
| Region of country | 0.54 | ||
| Northeast | 10.01 | 15.46 | |
| Midwest | 32.06 | 28.35 | |
| South | 41.84 | 36.33 | |
| West | 16.08 | 19.85 | |
| Ownership of hospitals | 0.4 | ||
| Voluntary, nonprofit | 77.28 | 72.35 | |
| Government, nonfederal | 18.78 | 16.11 | |
| Private | 3.94 | 11.55 | |
| Urban or rural location | 0.43 | ||
| Urban | 68.28 | 60.19 | |
| Rural | 31.72 | 39.81 | |
| Teaching hospital status | 0.56 | ||
| Teaching hospital | 63.22 | 68.28 | |
| Nonteaching hospital | 36.78 | 31.71 | |
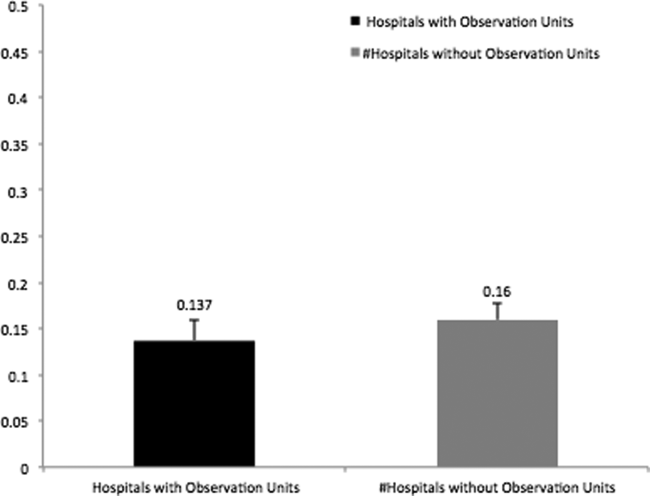
In addition, there was no association between patient characteristics at the ED visit level in hospitals with observation units when compared with patient characteristics at the ED visit level in hospitals without observation units (Table 2). The average ED risk‐standardized hospital admission rate for hospitals with observation units was 13.7% (95% confidence interval [CI]: 11.3 to 16.0) compared to 16.0% (95% CI: 14.1 to 17.7) for hospitals without observation units (Figure 1). This difference of 2.3% (95% CI: 0.1 to 4.7) was not statistically significant.

| Hospitals With Observation Units, W% (N = 6,067) | Hospitals Without Observation Units, W% (N = 18,165) | P Value | |
|---|---|---|---|
| |||
| Sex, female | 58.75 | 58.35 | 0.96 |
| Age, y | 45.17 | 46.08 | 0.32 |
| Race | 0.75 | ||
| Non‐Hispanic white | 63.54 | 66.41 | |
| Non‐Hispanic black | 23.67 | 18.77 | |
| Hispanic | 9.77 | 12.47 | |
| Other | 3.02 | 2.35 | |
| Source of payment | 0.87 | ||
| Private | 21.90 | 21.46 | |
| Medicare | 32.73 | 30.55 | |
| Medicaid | 22.15 | 23.23 | |
| Uninsured | 18.61 | 20.25 | |
| Unknown/missing | 4.61 | 4.51 | |
| Poverty level | 0.50 | ||
| 5% | 13.87 | 15.31 | |
| 5%9.9% | 32.57 | 23.38 | |
| 10%19.9% | 29.81 | 36.29 | |
| >20% | 20.32 | 20.18 | |
| Missing | 3.44 | 4.83 | |
| Arrival by ambulance | 0.06 | ||
| Yes | 20.01 | 18.61 | |
| No | 76.12 | 76.34 | |
| Unknown | 3.87 | 5.05 | |
| Severity of illness | 0.58 | ||
| Emergent | 16.58 | 16.62 | |
| Nonemergent | 44.09 | 43.85 | |
| Indeterminate | 1.18 | 1.17 | |
| Mental health, alcohol, unclassified | 38.15 | 38.37 | |
| Vital signs | |||
| Temperature | 0.91 | ||
| 9095F | 0.31 | 0.36 | |
| 95.1100.4F | 93.94 | 93.19 | |
| 100.4107F | 1.81 | 2.11 | |
| Missing | 3.94 | 4.35 | |
| Pulse | 0.60 | ||
| 1059 bpm | 3.39 | 3.93 | |
| 60100 bpm | 72.86 | 75.94 | |
| >101 bpm | 19.60 | 21.37 | |
| Missing | 4.16 | 7.67 | |
| Systolic blood pressure | 0.92 | ||
| 5090 mm Hg | 0.90 | 1.02 | |
| 91160 mm Hg | 85.49 | 84.03 | |
| 161260 mm Hg | 11.90 | 12.94 | |
| Missing | 1.71 | 2.01 | |
| Respiratory rate | 0.68 | ||
| 411 breaths/min | 0.24 | 0.19 | |
| 1220 breaths/min | 87.88 | 86.40 | |
| 2160 breaths/min | 8.90 | 10.09 | |
| Missing | 2.98 | 3.32 | |
| Chief complaint associated with hospitalization | |||
| Chest pain and related symptoms | 7.37 | 6.40 | 0.48 |
| Shortness of breath | 3.24 | 3.19 | 0.80 |
| Other symptoms/probably related to psychological | 1.28 | 0.97 | 0.19 |
| General weakness | 1.19 | 1.14 | 0.26 |
| Labored or difficult breathing | 0.56 | 0.88 | 0.93 |
| Fainting (syncope) | 0.44 | 0.42 | 0.09 |
| Unconscious on arrival | 0.35 | 0.38 | 0.17 |
| Other symptoms referable to the nervous system | 0.38 | 0.35 | 0.81 |
| Chronic diseases | |||
| Congestive heart failure | 4.13 | 4.05 | 0.05 |
| Cerebrovascular disease | 4.03 | 3.33 | 0.04 |
| Diabetes | 11.15 | 11.44 | 0.69 |
| HIV | 0.51 | 0.44 | 0.99 |
| On dialysis | 1.14 | 0.96 | 0.25 |
DISCUSSION
In this national study of hospital admissions from the ED, we did not find that hospitals with observation units had a statistically significant lower ED risk‐standardized admission rate when compared with hospitals that did not have observation units. However, the difference of ED risk‐standardized hospital admission rates between hospitals with observation units and those without observation units was very small, and we were likely underpowered to detect a statistically significant difference.
Recently, EDOUs have received much attention, in part because of increases in their numbers and frequency of use.[7] Prior studies, which did not report admission rates that were risk standardized, have also demonstrated no difference in the admission rates among hospitals with and without observation units.[6, 8] Although this result seems counterintuitive, several possible explanations exist.
One reason that there may not be a relation between the rate of inpatient admission and the presence of an observation unit is that the introduction of an EDOU appears to change physician behavior. When the option to admit to an observation unit is present, ED physicians are 2 times more likely to disposition patients to observation status without a statistically significant change in the rate of inpatient admission.[6] Studies have demonstrated that after the introduction of an observation unit, ED physicians tend to overutilize observation among patients who previously would have been discharged, while continuing to admit patients as inpatients who meet observation criteria, which could result in an increase in cost for payers and patients.[7, 9]
Observation units that are protocol driven have been associated with the best patient outcomes including shorter length of stay, lower likelihood of subsequent inpatient admission, and decreased cost.[10] Furthermore, studies evaluating EDOUs suggest increased patient satisfaction and improved patient safety, especially for protocol‐driven EDOUs.[2] However, currently, only half of dedicated observation units are protocol driven. It is also possible that the ED inpatient admission rate does not capture the full impact of an observation unit on care delivery and quality. Observation units are more likely to be present in EDs with a higher overall patient census, longer patient lengths of stay, and higher rates of ambulance diversion.[6, 8] Unfortunately, NHAMCS does not distinguish protocol‐driven versus nonprotocol‐driven observation units. From a policy standpoint, as EDOUs continue to emerge, there is an opportunity to standardize how EDOUs function by using best practices.
This study should be evaluated in the context of limitations such as heterogeneity in the management of EDOUs, limited hospital factor variables that may influence hospital admissions, and small sample size associated with each hospital. Because we were not able to determine which EDs used protocol‐driven observation units, we were not able to determine the impact of having a protocol‐driven observation unit on inpatient hospital admission rates. Additionally, the study may suffer from a selection bias, as EDs with observation units have been shown to have higher patient volume, longer patient lengths of stay, and greater rates of ED diversion. Despite the small sample size, our risk‐standardized model accounted for case mix and hospital factors associated with hospital admission rates and had a high C statistic value, which indicates that the predicted probability of being admitted from the ED highly correlates with the actual outcome of being admitted from the ED. We were unable to track hospitals longitudinally to determine if a hospital's high volume is associated with the creation of EDOUs as a means to offset its demand. However, in our analysis, we did control for overall patient volume when calculating the RHSAR. Finally, we were not able to limit the dataset to observation unit admission conditions because of the limited number of visits provided per hospital by NHAMCS. We conducted an analysis using 80% power and a P value of 0.05 to determine the sample size needed to have statistically significant results. We would require 920 hospitals to have statistically significant results, which suggests we were underpowered to detect a statistically significant difference.
In this preliminary study, we did not find an association between the presence of EDOUs and ED hospital admissions. Our study was limited by an inability to analyze administrative differences and to adjust for certain hospital factors that are likely to influence inpatient admissions via the ED. Nonetheless, our findings suggest that EDOUs merit further evaluation of their potential cost savings and the quality of the care they provide. An evaluation of ED observation departmental management is also needed to assess differences in care at observation units managed by emergency physicians versus nonemergency physicians.
Acknowledgments
Disclosures: R.C., B.S., and C.G. conceived the study. R.C. conducted the statistical analysis and was supervised by B.S. and C.G. All authors analyzed the results and interpreted findings. R.C. and D.B. drafted the manuscript, and all authors contributed substantially to its revision. All authors listed have contributed sufficiently to the project to be included as authors, and all those who are qualified to be authors are listed in the author byline. This work was previously presented at the 2013 Society for Academic Emergency Medicine Annual Meeting, Dallas, Texas. Dr. Capp is funded by a translational K award: KL2 TR001080. Dr. Gross reports grants from Johnson & Johnson, Medtronic Inc., and 21st Century Oncology during the conduct of this study. In addition, he received payment from Fair Health Inc. and ASTRO outside the submitted work. Dr. Sun receives National Institutes of Health funding. No conflicts of interest, financial or other, exist. This applies to all authors.
- , , . National study of emergency department observation services. Acad Emerg Med. 2011;18(9):959–965.
- , , . Emergency department observation units: a clinical and financial benefit for hospitals. Health Care Manage Rev 2011;36(1):28–37.
- , , , et al. Costs of an emergency department‐based accelerated diagnostic protocol vs hospitalization in patients with chest pain: a randomized controlled trial. JAMA. 1997;278(20):1670–1676.
- Centers for Disease Control and Prevention. National Hospital Ambulatory Medical Care Survey. Ambulatory health care data. Questionnaires, datasets, and related documentation. 2009. Available at: http://www.cdc.gov/nchs/ahcd/ahcd_questionnaires.htm. Accessed November 1, 2011.
- , , , et al. Hospital variation in risk‐standardized hospital admission rates from US EDs among adults. Am J Emerg Med. 2014;32(8):837–843.
- , , , , , . Use of observation care in US emergency departments, 2001 to 2008. PloS One. 2011;6(9):e24326.
- , , , , , . Making greater use of dedicated hospital observation units for many short‐stay patients could save $3.1 billion a year. Health Aff (Millwood). 2012;31(10):2314–2323.
- , , , . A national survey of observation units in the United States. Am J Emerg Med. 2003;21(7):529–533.
- , , , . An evaluation of emergency physician selection of observation unit patients. Am J Emerg Med. 2006;24(3):271–279.
- , , , , , . Protocol‐driven emergency department observation units offer savings, shorter stays, and reduced admissions. Health Aff (Millwood). 2013;32(12):2149–2156.
Today more than one‐third of emergency departments (EDs) in the United States have affiliated observation units, where patients can stay 24 to 48 hours without being admitted to the hospital.[1] Observation units experienced significant growth in the United States from 2005 to 2007, secondary to policy changes involving the Centers for Medicare and Medicaid Services (CMS), which expanded reimbursement for observation services to include any clinical condition. Furthermore, CMS implemented the Recovery Audit Contractor process, which was able to fine providers and facilities for inappropriate claims, with the principle method for charge recovery being inappropriate charges for short inpatient stays.
ED observation units (EDOUs) vary in the number of beds, but are often located adjacent to the emergency department.[2] It is estimated that EDOUs have the capacity for caring for 5% to 10% of any given ED volume.[2] Almost half of EDOUs are protocol driven, allowing these units to discharge up to 80% of all patients within 24 hours.[1, 2] Some studies have suggested that EDOUs are associated with a decrease in overall hospitalization rates, leading to cost savings.[1] However, these studies were limited by their single‐center design or simulated in nature. In addition, other studies show that EDOUs decrease inpatient admissions, length of stay, and costs related to specific clinical conditions such as chest pain, transient ischemic attack, and syncope.[3]
To further evaluate the association of observation units on ED hospital admission rates nationally, we analyzed the largest ED‐based survey, the 2010 National Hospital Ambulatory Medical Care Survey (NHAMCS), to assess the impact of observation units on hospital admissions from the ED. We hypothesized that observation units decrease overall hospital admissions from the ED.
METHODS
Study Design and Population
We performed a retrospective cross‐sectional analysis of ED visits from 2010. This study was exempt from institutional review board review by the University of Colorado and Yale University institutional review committee. The NHAMCS is an annual, national probability sample of ambulatory visits made to nonfederal, general, and short‐stay hospitals conducted by the Centers for Disease Control and Prevention (CDC), National Center for Health Statistics. The multistaged sample design was previously described elsewhere.[4] The 2010 NHAMCS dataset included 350 participating hospitals (unweighted sampling rate of 90%) and a total of 34,936 patient visits.[4]
Exclusions
We excluded patients who were less than 18 years old (n = 8015; 23%); left without being seen, left before examination completion, or left against medical advice (n = 813; 2%); transferred to another institution (n = 626; 1.7%); died on arrival or died in the ED (n = 60; 0.2%); and with missing data on discharge disposition (n = 100; 0.3%). Finally, we excluded hospitals with fewer than 30 visits per year (n = 307; 0.9%) to comply with reliable relative standard errors, as recommended by the CDC; after all of these exclusions there were 325 hospitals. Finally, we excluded hospitals with missing information on EDOUs (n = 783, 2.2%); our dataset at this point included 315 hospitals.
Outcomes
The primary outcome was hospital admission, either from the ED or admitted to an observation unit with subsequent hospital admission, defined as the ED risk‐standardized hospital admission rate (ED RSHAR).[5] This methodology allows for risk adjustment of case mix (ie, disease severity) for each hospital's ED admission rates and has been previously described in the evaluation of varying ED hospital admission rates using the same dataset.[5] To evaluate which hospitals had observation units, we used the following hospital survey question: Does your ED have an observation or clinical decision unit?
Identification of Variables
ED hospitalization rates were risk standardized for each hospital to account for each hospital's case mix and hospital factors such as socioeconomic status, clinical severity, and hospital characteristics. This methodology and dataset use have been previously described in detail.[5]
To account for common chief complaints leading to hospitalization and case‐mix distribution of these complaints among different hospitals, we analyzed all chief complaints and their relationship to hospital admission. We first identified those associated with an admission rate that exceeded 30% and was present in 1% or more of patient visits. The study team of researchers and clinicians determined the aforementioned cutoffs as clinically meaningful. Eight chief complaints met both criteria: chest pain and related symptoms, shortness of breath, other symptoms/probably related to psychological, general weakness, labored or difficulty breathing, fainting (syncope), unconscious arrival, and other symptoms referable to the nervous system. Chronic diseases, such as congestive heart failure, diabetes mellitus, renal disease on dialysis, and human immunodeficiency virus, were also included in the model.
Hospital factors included metropolitan status, geographic region of the country (limited to Northeast, Midwest, South, and West), teaching status, and urban or rural status.[6] We derived a new variable based on a previous study, teaching status, by combining nonprivate hospital status plus having at least 1 ED visit be evaluated by a resident.
Statistical Analyses
We used SAS version 9.2 (SAS Institute, Cary, NC) for all statistical analyses. Frequencies of all variables in the model were calculated to assess the distribution of data and quantify missing data. We did not want to have variables in the model with high collinearity. To investigate collinearity between independent variables, we calculated Spearman correlation coefficients; high collinearity was defined as r > 0.6. No variables included in the model had high collinearity.
To investigate the association of the candidate variables with hospitalization, we used survey logistic regression. Although some variables did not show an association with hospitalization, we felt they were clinically relevant and did not remove them from the model. Hierarchical logistic regression modeling (explained below) was used to calculate ED RSHAR based on the aforementioned selected variables associated with hospital admission.
Hierarchical logistic regression models (HLRM) were used to estimate RSHAR for each hospital. This approach reflects the assumption that a hospital‐specific component exists, and that it will affect the outcomes of patients at a particular institution. This method takes into consideration the hierarchical structure of the data to account for patient clustering within hospitals, and has been used by the CMS to publicly report hospital risk‐standardized rates of mortality and readmission for acute myocardial infarction, heart failure, and pneumonia.
We used a similar methodology as previously published.[5] In summary, the hospital RSHAR was calculated as a ratio of the number of predicted hospital admissions in the hospital to the number of expected hospital admissions in the hospital. This ratio is then multiplied by the national unadjusted rate of hospital admissions. We calculated the C statistic of the HLRM model to assess for overall adequacy of risk prediction. To analyze the association between ED RSHAR and EDOUs, we used analysis of variance, where the dependent variable was ED RSHAR and independent variable of interest was presence of EDOUs.
RESULTS
There were 24,232 ED visits from 315 hospitals in the United States in our study. Of these, 82 (20.6%) hospitals had an observation unit physically separate from the ED. Hospitals with and without observation units did not have different hospital patient level characteristics. There was no association between hospital ownership, teaching status, region location, urban or rural location, and hospitals with observation units when compared with hospitals without observation units (Table 1).
| Hospitals With Observation Units, W% (N = 82) | Hospitals Without Observation Units, W% (N = 233) | P Value | |
|---|---|---|---|
| |||
| Region of country | 0.54 | ||
| Northeast | 10.01 | 15.46 | |
| Midwest | 32.06 | 28.35 | |
| South | 41.84 | 36.33 | |
| West | 16.08 | 19.85 | |
| Ownership of hospitals | 0.4 | ||
| Voluntary, nonprofit | 77.28 | 72.35 | |
| Government, nonfederal | 18.78 | 16.11 | |
| Private | 3.94 | 11.55 | |
| Urban or rural location | 0.43 | ||
| Urban | 68.28 | 60.19 | |
| Rural | 31.72 | 39.81 | |
| Teaching hospital status | 0.56 | ||
| Teaching hospital | 63.22 | 68.28 | |
| Nonteaching hospital | 36.78 | 31.71 | |
In addition, there was no association between patient characteristics at the ED visit level in hospitals with observation units when compared with patient characteristics at the ED visit level in hospitals without observation units (Table 2). The average ED risk‐standardized hospital admission rate for hospitals with observation units was 13.7% (95% confidence interval [CI]: 11.3 to 16.0) compared to 16.0% (95% CI: 14.1 to 17.7) for hospitals without observation units (Figure 1). This difference of 2.3% (95% CI: 0.1 to 4.7) was not statistically significant.
| Hospitals With Observation Units, W% (N = 6,067) | Hospitals Without Observation Units, W% (N = 18,165) | P Value | |
|---|---|---|---|
| |||
| Sex, female | 58.75 | 58.35 | 0.96 |
| Age, y | 45.17 | 46.08 | 0.32 |
| Race | 0.75 | ||
| Non‐Hispanic white | 63.54 | 66.41 | |
| Non‐Hispanic black | 23.67 | 18.77 | |
| Hispanic | 9.77 | 12.47 | |
| Other | 3.02 | 2.35 | |
| Source of payment | 0.87 | ||
| Private | 21.90 | 21.46 | |
| Medicare | 32.73 | 30.55 | |
| Medicaid | 22.15 | 23.23 | |
| Uninsured | 18.61 | 20.25 | |
| Unknown/missing | 4.61 | 4.51 | |
| Poverty level | 0.50 | ||
| 5% | 13.87 | 15.31 | |
| 5%9.9% | 32.57 | 23.38 | |
| 10%19.9% | 29.81 | 36.29 | |
| >20% | 20.32 | 20.18 | |
| Missing | 3.44 | 4.83 | |
| Arrival by ambulance | 0.06 | ||
| Yes | 20.01 | 18.61 | |
| No | 76.12 | 76.34 | |
| Unknown | 3.87 | 5.05 | |
| Severity of illness | 0.58 | ||
| Emergent | 16.58 | 16.62 | |
| Nonemergent | 44.09 | 43.85 | |
| Indeterminate | 1.18 | 1.17 | |
| Mental health, alcohol, unclassified | 38.15 | 38.37 | |
| Vital signs | |||
| Temperature | 0.91 | ||
| 9095F | 0.31 | 0.36 | |
| 95.1100.4F | 93.94 | 93.19 | |
| 100.4107F | 1.81 | 2.11 | |
| Missing | 3.94 | 4.35 | |
| Pulse | 0.60 | ||
| 1059 bpm | 3.39 | 3.93 | |
| 60100 bpm | 72.86 | 75.94 | |
| >101 bpm | 19.60 | 21.37 | |
| Missing | 4.16 | 7.67 | |
| Systolic blood pressure | 0.92 | ||
| 5090 mm Hg | 0.90 | 1.02 | |
| 91160 mm Hg | 85.49 | 84.03 | |
| 161260 mm Hg | 11.90 | 12.94 | |
| Missing | 1.71 | 2.01 | |
| Respiratory rate | 0.68 | ||
| 411 breaths/min | 0.24 | 0.19 | |
| 1220 breaths/min | 87.88 | 86.40 | |
| 2160 breaths/min | 8.90 | 10.09 | |
| Missing | 2.98 | 3.32 | |
| Chief complaint associated with hospitalization | |||
| Chest pain and related symptoms | 7.37 | 6.40 | 0.48 |
| Shortness of breath | 3.24 | 3.19 | 0.80 |
| Other symptoms/probably related to psychological | 1.28 | 0.97 | 0.19 |
| General weakness | 1.19 | 1.14 | 0.26 |
| Labored or difficult breathing | 0.56 | 0.88 | 0.93 |
| Fainting (syncope) | 0.44 | 0.42 | 0.09 |
| Unconscious on arrival | 0.35 | 0.38 | 0.17 |
| Other symptoms referable to the nervous system | 0.38 | 0.35 | 0.81 |
| Chronic diseases | |||
| Congestive heart failure | 4.13 | 4.05 | 0.05 |
| Cerebrovascular disease | 4.03 | 3.33 | 0.04 |
| Diabetes | 11.15 | 11.44 | 0.69 |
| HIV | 0.51 | 0.44 | 0.99 |
| On dialysis | 1.14 | 0.96 | 0.25 |
DISCUSSION
In this national study of hospital admissions from the ED, we did not find that hospitals with observation units had a statistically significant lower ED risk‐standardized admission rate when compared with hospitals that did not have observation units. However, the difference of ED risk‐standardized hospital admission rates between hospitals with observation units and those without observation units was very small, and we were likely underpowered to detect a statistically significant difference.
Recently, EDOUs have received much attention, in part because of increases in their numbers and frequency of use.[7] Prior studies, which did not report admission rates that were risk standardized, have also demonstrated no difference in the admission rates among hospitals with and without observation units.[6, 8] Although this result seems counterintuitive, several possible explanations exist.
One reason that there may not be a relation between the rate of inpatient admission and the presence of an observation unit is that the introduction of an EDOU appears to change physician behavior. When the option to admit to an observation unit is present, ED physicians are 2 times more likely to disposition patients to observation status without a statistically significant change in the rate of inpatient admission.[6] Studies have demonstrated that after the introduction of an observation unit, ED physicians tend to overutilize observation among patients who previously would have been discharged, while continuing to admit patients as inpatients who meet observation criteria, which could result in an increase in cost for payers and patients.[7, 9]
Observation units that are protocol driven have been associated with the best patient outcomes including shorter length of stay, lower likelihood of subsequent inpatient admission, and decreased cost.[10] Furthermore, studies evaluating EDOUs suggest increased patient satisfaction and improved patient safety, especially for protocol‐driven EDOUs.[2] However, currently, only half of dedicated observation units are protocol driven. It is also possible that the ED inpatient admission rate does not capture the full impact of an observation unit on care delivery and quality. Observation units are more likely to be present in EDs with a higher overall patient census, longer patient lengths of stay, and higher rates of ambulance diversion.[6, 8] Unfortunately, NHAMCS does not distinguish protocol‐driven versus nonprotocol‐driven observation units. From a policy standpoint, as EDOUs continue to emerge, there is an opportunity to standardize how EDOUs function by using best practices.
This study should be evaluated in the context of limitations such as heterogeneity in the management of EDOUs, limited hospital factor variables that may influence hospital admissions, and small sample size associated with each hospital. Because we were not able to determine which EDs used protocol‐driven observation units, we were not able to determine the impact of having a protocol‐driven observation unit on inpatient hospital admission rates. Additionally, the study may suffer from a selection bias, as EDs with observation units have been shown to have higher patient volume, longer patient lengths of stay, and greater rates of ED diversion. Despite the small sample size, our risk‐standardized model accounted for case mix and hospital factors associated with hospital admission rates and had a high C statistic value, which indicates that the predicted probability of being admitted from the ED highly correlates with the actual outcome of being admitted from the ED. We were unable to track hospitals longitudinally to determine if a hospital's high volume is associated with the creation of EDOUs as a means to offset its demand. However, in our analysis, we did control for overall patient volume when calculating the RHSAR. Finally, we were not able to limit the dataset to observation unit admission conditions because of the limited number of visits provided per hospital by NHAMCS. We conducted an analysis using 80% power and a P value of 0.05 to determine the sample size needed to have statistically significant results. We would require 920 hospitals to have statistically significant results, which suggests we were underpowered to detect a statistically significant difference.
In this preliminary study, we did not find an association between the presence of EDOUs and ED hospital admissions. Our study was limited by an inability to analyze administrative differences and to adjust for certain hospital factors that are likely to influence inpatient admissions via the ED. Nonetheless, our findings suggest that EDOUs merit further evaluation of their potential cost savings and the quality of the care they provide. An evaluation of ED observation departmental management is also needed to assess differences in care at observation units managed by emergency physicians versus nonemergency physicians.
Acknowledgments
Disclosures: R.C., B.S., and C.G. conceived the study. R.C. conducted the statistical analysis and was supervised by B.S. and C.G. All authors analyzed the results and interpreted findings. R.C. and D.B. drafted the manuscript, and all authors contributed substantially to its revision. All authors listed have contributed sufficiently to the project to be included as authors, and all those who are qualified to be authors are listed in the author byline. This work was previously presented at the 2013 Society for Academic Emergency Medicine Annual Meeting, Dallas, Texas. Dr. Capp is funded by a translational K award: KL2 TR001080. Dr. Gross reports grants from Johnson & Johnson, Medtronic Inc., and 21st Century Oncology during the conduct of this study. In addition, he received payment from Fair Health Inc. and ASTRO outside the submitted work. Dr. Sun receives National Institutes of Health funding. No conflicts of interest, financial or other, exist. This applies to all authors.
- , , . National study of emergency department observation services. Acad Emerg Med. 2011;18(9):959–965.
- , , . Emergency department observation units: a clinical and financial benefit for hospitals. Health Care Manage Rev 2011;36(1):28–37.
- , , , et al. Costs of an emergency department‐based accelerated diagnostic protocol vs hospitalization in patients with chest pain: a randomized controlled trial. JAMA. 1997;278(20):1670–1676.
- Centers for Disease Control and Prevention. National Hospital Ambulatory Medical Care Survey. Ambulatory health care data. Questionnaires, datasets, and related documentation. 2009. Available at: http://www.cdc.gov/nchs/ahcd/ahcd_questionnaires.htm. Accessed November 1, 2011.
- , , , et al. Hospital variation in risk‐standardized hospital admission rates from US EDs among adults. Am J Emerg Med. 2014;32(8):837–843.
- , , , , , . Use of observation care in US emergency departments, 2001 to 2008. PloS One. 2011;6(9):e24326.
- , , , , , . Making greater use of dedicated hospital observation units for many short‐stay patients could save $3.1 billion a year. Health Aff (Millwood). 2012;31(10):2314–2323.
- , , , . A national survey of observation units in the United States. Am J Emerg Med. 2003;21(7):529–533.
- , , , . An evaluation of emergency physician selection of observation unit patients. Am J Emerg Med. 2006;24(3):271–279.
- , , , , , . Protocol‐driven emergency department observation units offer savings, shorter stays, and reduced admissions. Health Aff (Millwood). 2013;32(12):2149–2156.
Physician Predictions of Discharge
Hospital discharge planning is a complex process requiring efficient coordination of many different medical and social support services. For this reason, multidisciplinary teams work together to develop individualized discharge plans in an attempt to reduce preventable adverse events related to hospital discharge.[1, 2, 3, 4, 5] Despite these ongoing efforts, optimal discharge strategies have yet to be realized.[1, 4, 5, 6, 7, 8, 9]
One factor that may improve the discharge process is the early identification of patients who are approaching discharge.[10] Multidisciplinary teams cannot fully deploy comprehensive discharge plans until a physician deems a patient to be approaching discharge readiness.[8]
To our knowledge, no studies have examined the performance of physician predictions of upcoming discharge. Instead, prior studies have found that physicians have difficulty predicting the length of stay for patients seen in the emergency room and for elderly patients newly admitted to general medicine floor.[11, 12] The purpose of this study was to evaluate the ability of inpatient general medicine physicians to predict next or same‐day hospital discharges to help inform the timing of discharge planning.
METHODS
We collected daily in‐person predictions from all senior residents and attendings separately on the inpatient general medicine teams (5 resident/attending services and 4 attending‐only services) at a single 950‐bed academic medical center. We asked these physicians to predict whether each patient under their care had a greater than or equal to 80% chance of being discharged the next day, the same day, or neither (ie, no discharge on the next or same day).
Physician predictions of discharge occurred Monday through Friday at 1 of 3 time points: morning (79 am), midday (122 pm), or afternoon (57 pm). Data collection focused on 1 time point per week during 2 different weeks in November 2013 and 1 week in February 2014. Predictions of same‐day discharge could only be made at the morning and midday time points. Each patient could have multiple predictions if they remained hospitalized during subsequent assessments. For each physician making a prediction, we recorded the physician training level (resident or attending).
This protocol was deemed exempt by our university's institutional review board.
Outcomes
We measured the sensitivity (SN), specificity (SP), positive predictive value (PPV), and negative predictive value (NPV) for each type of physician prediction (next day, same day, or no discharge by the end of the next day). We also calculated these measurements for each time point in the time of day subgroup: morning, midday, and afternoon.
Statistical Analyses
Using a normal approximation to the binomial distribution, point estimates and 95% confidence intervals for SN, SP, PPV, and NPV for the group of all patients and for the time of day subgroup are reported. The Cochran‐Armitage trend test was used to examine trends in SN, SP, PPV, and NPV as time to discharge decreased. No adjustments were made for multiple comparisons. A 2‐sided significance level was prespecified at 0.05 for all tests.
For the subset of patients who had discharge predictions made by both a resident and an attending, agreement was examined using the kappa statistic. All analyses were conducted using SAS version 9.3 (SAS Institute, Cary, NC).
RESULTS
A total of 2660 predictions were made by 24 attendings and 15 residents. Nineteen predictions were excluded because of missing prediction type or date of discharge, leaving 2641 predictions for analysis. Table 1 summarizes the total number of predictions within subgroups.
| No. of Predictions | |
|---|---|
| All predictions | 2,641 |
| Day of the week | |
| Monday | 596 |
| Tuesday | 503 |
| Wednesday | 525 |
| Thursday | 551 |
| Friday | 466 |
| Physician training level | |
| Resident | 871 |
| Attending | 1,770 |
| Time of day | |
| Morning (7 am9 am) | 906 |
| Midday (12 pm2 pm) | 832 |
| Afternoon (5 pm7 pm) | 903 |
The overall daily discharge rate in our population was 22.3% (see Supporting Table 1 in the online version of this article for the raw values). The SN and PPV of physician predictions of next‐day discharge were 48% (95% confidence interval [CI]: 43%‐52%) and 51% (95% CI: 46%‐56%), respectively. The SN and PPV for same‐day discharge predictions were 73% (95% CI: 68%‐78%) and 69% (95% CI: 64%‐73%), respectively. The SP for next and same‐day discharge predictions was 90% (95% CI: 89%‐91%) and 95% (95% CI: 94%‐96%), whereas the NPV was 89% (95% CI: 88%‐90%) and 96% (95% CI: 95%‐97%), respectively.
Outcome measures for each prediction type are stratified by time of day and summarized in Table 2. For next‐day discharge predictions, the SN and PPV were lowest in the morning (SN 27%, PPV 33%) and peaked by the afternoon (SN 67%, PPV 69%). Similarly, for same‐day discharges, SN and PPV were highest later in the day (midday SN 88%, PPV 79%). This trend is also demonstrated in the SP and NPV, which increased as time to actual discharge approached, although the trends are not as pronounced as for SN and PPV.
| Validity Measure | Next‐Day Discharge Predictions | Trend P Value | Same‐Day Discharge Predictions | Trend P Value | ||||
|---|---|---|---|---|---|---|---|---|
| Morning | Midday | Afternoon | Morning | Midday | Afternoon | |||
| ||||||||
| Sensitivity | 0.27 (0.210.35) | 0.50 (0.410.59) | 0.67 (0.590.74) | 0.001 | 0.66 (0.590.73) | 0.88 (0.810.93) | 0.001 | |
| Specificity | 0.87 (0.850.90) | 0.90 (0.880.92) | 0.93 (0.910.95) | 0.001 | 0.88 (0.850.90) | 0.95 (0.930.97) | 0.001 | |
| PPV | 0.33 (0.250.41) | 0.48 (0.400.57) | 0.69 (0.610.76) | 0.001 | 0.62 (0.550.68) | 0.79 (0.710.85) | 0.001 | |
| NPV | 0.84 (0.810.87) | 0.91 (0.880.93) | 0.93 (0.910.94) | 0.001 | 0.90 (0.880.92) | 0.98 (0.960.99) | 0.001 | |
The overall agreement between resident and attending predictions was measured and found to have kappa values of 0.51 (P 0.001) for next‐day predictions and 0.73 (P 0.001) for same‐day predictions, indicating moderate and substantial agreement, respectively (see Supporting Table 2 in the online version of this article).[13]
DISCUSSION
This is the first study, to our knowledge, to examine the ability of physicians to predict upcoming discharge during the course of routine general medicine inpatient care. We found that although physicians are poor predictors of discharge in the morning prior to the day of expected discharge, their ability to correctly predict inpatient discharges showed continual improvement as the difference between the prediction time and time of actual discharge shortened.
For next‐day predictions, the most accurate time point was the afternoon, when physicians correctly predicted more than two‐thirds of actual next‐day discharges. This finding suggests that physicians can provide meaningful discharge estimates as early as the afternoon prior to expected discharge. This may be an optimal time for physicians to meet with the multidisciplinary discharge teams, as many preparations hinge on timely and accurate predictions of discharge (eg, arranging patient transportation, postdischarge visits by a home health company). Multidisciplinary teams will also be reassured that an afternoon prediction of next‐day discharge would only prematurely activate discharge resources in roughly 3 out of every 10 occurrences. Even in these instances, patients may benefit from the extra time for disease counselling, medication teaching, and arrangement of home services.[4, 5, 6, 7, 8, 9]
This investigation has several limitations. Our study was conducted at a large tertiary care center over brief time periods, with an overall discharge rate of about 1 in 5 patients per day. Thus, the results may not be generalizable to hospitals with different patient populations, volume, or turnover, or when predictions are made at different times throughout the year. Furthermore, we were unable to determine if the outcome measures were affected by prolonged lengths of stay or excessive predictions on relatively few patients. However, we sought to mitigate these constraints by surveying many different respondents with varying experience levels, caring for a heterogeneous patient population at nonconsecutive time points during the year. A review of our hospital's administrative data suggests that the bed occupancy and average length of stay during our surveys were similar with most other time points during the year, and therefore representative of a typical inpatient general medicine service.
Our investigation was a novel investigation into the performance of physician discharge predictions, which are daily predictions made either explicitly or implicitly by physicians caring for patients on a general medicine ward. By utilizing a simple, subjective survey without bulky calculations, this approach closely mirrors real‐world practice patterns, and if further validated, could be easily assimilated into the normal workflow of a wide range of busy clinicians to more effectively activate individualized discharge plans.[1, 2, 3, 4, 5]
Future work could capture additional patient information, such as functional status, diagnosis, and current length of stay, which would allow identification of certain subsets of patients in which physicians are more or less accurate in predicting hospital discharge. Additionally, the outcomes of incorrect predictions, particularly the surprise discharges that left even though they were predicted to stay, could be assessed. If patients were discharged prematurely, this may be reflected by a higher 30‐day readmission rate, lower clinic follow‐up rate, and/or lower patient satisfaction scores.
CONCLUSION
Although physicians are poor predictors of discharge in the morning prior to the day of expected discharge, their ability to correctly predict inpatient discharges steadily improves as the difference between the prediction time and time of actual discharge shortened. It remains to be determined if systematic incorporation of physician discharge predictions into standard workflows will improve the effectiveness of transition of care interventions.
Disclosure: Nothing to report.
- , , , et al. Care transitions project team: Association between quality improvement for care transition in communities and rehospitalizations among Medicare beneficiaries. JAMA. 2013;309(4):381–391.
- , , , , The care transitions intervention: results of a randomized controlled trial. Arch Intern Med. 2006;166:1822–1828.
- , , , et al. Comprehensive discharge planning and home follow‐up of hospitalized elders: a randomized clinical trial. JAMA. 1999;281:613–620.
- , , , et al. Hospital‐initiated transitional care interventions as a patient safety strategy: a systematic review. Ann Intern Med. 2013;158:433–440.
- , , , et al. Discharge planning from hospital to home. Cochrane Database Syst Rev. 2013;1:CD000313.
- , , . A prospective study of reasons for prolonged hospitalizations on a general medicine teaching service. J General Intern Med. 2005;20:108–115.
- , , , . The epidemiology of delays in a teaching hospital. Med Care. 1989;27:112–129.
- , , , et al. Development of a checklist of safe discharge practices for hospital patients. J Hosp Med. 2013;8:444–449.
- , , , , Medication reconciliation during transition of care as a patient safety strategy. Ann Intern Med. 2013;158:397–403.
- , , Making effective use of predicted discharge dates to reduce the length of stay in hospital. Nurs Times. 2009;105(15):12–13.
- . Physicians' outcome predictions for elderly patients: Survival, hospital discharge, and length of stay in a department of internal medicine. Scand J Soc Med. 1986;14(3):127–132.
- , , , . Physicians' ability to predict hospital length of stay for patients admitted to the hospital from the emergency department. Emerg Med Int. 2012;2012:824674.
- , . Understanding interobserver agreement: the kappa statistic. Fam Med. 2005;37(5):360–363.
Hospital discharge planning is a complex process requiring efficient coordination of many different medical and social support services. For this reason, multidisciplinary teams work together to develop individualized discharge plans in an attempt to reduce preventable adverse events related to hospital discharge.[1, 2, 3, 4, 5] Despite these ongoing efforts, optimal discharge strategies have yet to be realized.[1, 4, 5, 6, 7, 8, 9]
One factor that may improve the discharge process is the early identification of patients who are approaching discharge.[10] Multidisciplinary teams cannot fully deploy comprehensive discharge plans until a physician deems a patient to be approaching discharge readiness.[8]
To our knowledge, no studies have examined the performance of physician predictions of upcoming discharge. Instead, prior studies have found that physicians have difficulty predicting the length of stay for patients seen in the emergency room and for elderly patients newly admitted to general medicine floor.[11, 12] The purpose of this study was to evaluate the ability of inpatient general medicine physicians to predict next or same‐day hospital discharges to help inform the timing of discharge planning.
METHODS
We collected daily in‐person predictions from all senior residents and attendings separately on the inpatient general medicine teams (5 resident/attending services and 4 attending‐only services) at a single 950‐bed academic medical center. We asked these physicians to predict whether each patient under their care had a greater than or equal to 80% chance of being discharged the next day, the same day, or neither (ie, no discharge on the next or same day).
Physician predictions of discharge occurred Monday through Friday at 1 of 3 time points: morning (79 am), midday (122 pm), or afternoon (57 pm). Data collection focused on 1 time point per week during 2 different weeks in November 2013 and 1 week in February 2014. Predictions of same‐day discharge could only be made at the morning and midday time points. Each patient could have multiple predictions if they remained hospitalized during subsequent assessments. For each physician making a prediction, we recorded the physician training level (resident or attending).
This protocol was deemed exempt by our university's institutional review board.
Outcomes
We measured the sensitivity (SN), specificity (SP), positive predictive value (PPV), and negative predictive value (NPV) for each type of physician prediction (next day, same day, or no discharge by the end of the next day). We also calculated these measurements for each time point in the time of day subgroup: morning, midday, and afternoon.
Statistical Analyses
Using a normal approximation to the binomial distribution, point estimates and 95% confidence intervals for SN, SP, PPV, and NPV for the group of all patients and for the time of day subgroup are reported. The Cochran‐Armitage trend test was used to examine trends in SN, SP, PPV, and NPV as time to discharge decreased. No adjustments were made for multiple comparisons. A 2‐sided significance level was prespecified at 0.05 for all tests.
For the subset of patients who had discharge predictions made by both a resident and an attending, agreement was examined using the kappa statistic. All analyses were conducted using SAS version 9.3 (SAS Institute, Cary, NC).
RESULTS
A total of 2660 predictions were made by 24 attendings and 15 residents. Nineteen predictions were excluded because of missing prediction type or date of discharge, leaving 2641 predictions for analysis. Table 1 summarizes the total number of predictions within subgroups.
| No. of Predictions | |
|---|---|
| All predictions | 2,641 |
| Day of the week | |
| Monday | 596 |
| Tuesday | 503 |
| Wednesday | 525 |
| Thursday | 551 |
| Friday | 466 |
| Physician training level | |
| Resident | 871 |
| Attending | 1,770 |
| Time of day | |
| Morning (7 am9 am) | 906 |
| Midday (12 pm2 pm) | 832 |
| Afternoon (5 pm7 pm) | 903 |
The overall daily discharge rate in our population was 22.3% (see Supporting Table 1 in the online version of this article for the raw values). The SN and PPV of physician predictions of next‐day discharge were 48% (95% confidence interval [CI]: 43%‐52%) and 51% (95% CI: 46%‐56%), respectively. The SN and PPV for same‐day discharge predictions were 73% (95% CI: 68%‐78%) and 69% (95% CI: 64%‐73%), respectively. The SP for next and same‐day discharge predictions was 90% (95% CI: 89%‐91%) and 95% (95% CI: 94%‐96%), whereas the NPV was 89% (95% CI: 88%‐90%) and 96% (95% CI: 95%‐97%), respectively.
Outcome measures for each prediction type are stratified by time of day and summarized in Table 2. For next‐day discharge predictions, the SN and PPV were lowest in the morning (SN 27%, PPV 33%) and peaked by the afternoon (SN 67%, PPV 69%). Similarly, for same‐day discharges, SN and PPV were highest later in the day (midday SN 88%, PPV 79%). This trend is also demonstrated in the SP and NPV, which increased as time to actual discharge approached, although the trends are not as pronounced as for SN and PPV.
| Validity Measure | Next‐Day Discharge Predictions | Trend P Value | Same‐Day Discharge Predictions | Trend P Value | ||||
|---|---|---|---|---|---|---|---|---|
| Morning | Midday | Afternoon | Morning | Midday | Afternoon | |||
| ||||||||
| Sensitivity | 0.27 (0.210.35) | 0.50 (0.410.59) | 0.67 (0.590.74) | 0.001 | 0.66 (0.590.73) | 0.88 (0.810.93) | 0.001 | |
| Specificity | 0.87 (0.850.90) | 0.90 (0.880.92) | 0.93 (0.910.95) | 0.001 | 0.88 (0.850.90) | 0.95 (0.930.97) | 0.001 | |
| PPV | 0.33 (0.250.41) | 0.48 (0.400.57) | 0.69 (0.610.76) | 0.001 | 0.62 (0.550.68) | 0.79 (0.710.85) | 0.001 | |
| NPV | 0.84 (0.810.87) | 0.91 (0.880.93) | 0.93 (0.910.94) | 0.001 | 0.90 (0.880.92) | 0.98 (0.960.99) | 0.001 | |
The overall agreement between resident and attending predictions was measured and found to have kappa values of 0.51 (P 0.001) for next‐day predictions and 0.73 (P 0.001) for same‐day predictions, indicating moderate and substantial agreement, respectively (see Supporting Table 2 in the online version of this article).[13]
DISCUSSION
This is the first study, to our knowledge, to examine the ability of physicians to predict upcoming discharge during the course of routine general medicine inpatient care. We found that although physicians are poor predictors of discharge in the morning prior to the day of expected discharge, their ability to correctly predict inpatient discharges showed continual improvement as the difference between the prediction time and time of actual discharge shortened.
For next‐day predictions, the most accurate time point was the afternoon, when physicians correctly predicted more than two‐thirds of actual next‐day discharges. This finding suggests that physicians can provide meaningful discharge estimates as early as the afternoon prior to expected discharge. This may be an optimal time for physicians to meet with the multidisciplinary discharge teams, as many preparations hinge on timely and accurate predictions of discharge (eg, arranging patient transportation, postdischarge visits by a home health company). Multidisciplinary teams will also be reassured that an afternoon prediction of next‐day discharge would only prematurely activate discharge resources in roughly 3 out of every 10 occurrences. Even in these instances, patients may benefit from the extra time for disease counselling, medication teaching, and arrangement of home services.[4, 5, 6, 7, 8, 9]
This investigation has several limitations. Our study was conducted at a large tertiary care center over brief time periods, with an overall discharge rate of about 1 in 5 patients per day. Thus, the results may not be generalizable to hospitals with different patient populations, volume, or turnover, or when predictions are made at different times throughout the year. Furthermore, we were unable to determine if the outcome measures were affected by prolonged lengths of stay or excessive predictions on relatively few patients. However, we sought to mitigate these constraints by surveying many different respondents with varying experience levels, caring for a heterogeneous patient population at nonconsecutive time points during the year. A review of our hospital's administrative data suggests that the bed occupancy and average length of stay during our surveys were similar with most other time points during the year, and therefore representative of a typical inpatient general medicine service.
Our investigation was a novel investigation into the performance of physician discharge predictions, which are daily predictions made either explicitly or implicitly by physicians caring for patients on a general medicine ward. By utilizing a simple, subjective survey without bulky calculations, this approach closely mirrors real‐world practice patterns, and if further validated, could be easily assimilated into the normal workflow of a wide range of busy clinicians to more effectively activate individualized discharge plans.[1, 2, 3, 4, 5]
Future work could capture additional patient information, such as functional status, diagnosis, and current length of stay, which would allow identification of certain subsets of patients in which physicians are more or less accurate in predicting hospital discharge. Additionally, the outcomes of incorrect predictions, particularly the surprise discharges that left even though they were predicted to stay, could be assessed. If patients were discharged prematurely, this may be reflected by a higher 30‐day readmission rate, lower clinic follow‐up rate, and/or lower patient satisfaction scores.
CONCLUSION
Although physicians are poor predictors of discharge in the morning prior to the day of expected discharge, their ability to correctly predict inpatient discharges steadily improves as the difference between the prediction time and time of actual discharge shortened. It remains to be determined if systematic incorporation of physician discharge predictions into standard workflows will improve the effectiveness of transition of care interventions.
Disclosure: Nothing to report.
- , , , et al. Care transitions project team: Association between quality improvement for care transition in communities and rehospitalizations among Medicare beneficiaries. JAMA. 2013;309(4):381–391.
- , , , , The care transitions intervention: results of a randomized controlled trial. Arch Intern Med. 2006;166:1822–1828.
- , , , et al. Comprehensive discharge planning and home follow‐up of hospitalized elders: a randomized clinical trial. JAMA. 1999;281:613–620.
- , , , et al. Hospital‐initiated transitional care interventions as a patient safety strategy: a systematic review. Ann Intern Med. 2013;158:433–440.
- , , , et al. Discharge planning from hospital to home. Cochrane Database Syst Rev. 2013;1:CD000313.
- , , . A prospective study of reasons for prolonged hospitalizations on a general medicine teaching service. J General Intern Med. 2005;20:108–115.
- , , , . The epidemiology of delays in a teaching hospital. Med Care. 1989;27:112–129.
- , , , et al. Development of a checklist of safe discharge practices for hospital patients. J Hosp Med. 2013;8:444–449.
- , , , , Medication reconciliation during transition of care as a patient safety strategy. Ann Intern Med. 2013;158:397–403.
- , , Making effective use of predicted discharge dates to reduce the length of stay in hospital. Nurs Times. 2009;105(15):12–13.
- . Physicians' outcome predictions for elderly patients: Survival, hospital discharge, and length of stay in a department of internal medicine. Scand J Soc Med. 1986;14(3):127–132.
- , , , . Physicians' ability to predict hospital length of stay for patients admitted to the hospital from the emergency department. Emerg Med Int. 2012;2012:824674.
- , . Understanding interobserver agreement: the kappa statistic. Fam Med. 2005;37(5):360–363.
Patient‐Oriented Discharge Instructions
The period following discharge from the hospital is a vulnerable time for patients that can result in adverse events including avoidable emergency room visits and rehospitalizations.[1] Approximately 8.5% of all visits to the hospital result in readmissions within 30 days.[2] Poor communication of discharge information is even more pronounced for patients with language barriers or limited health literacy, particularly in ethnically diverse communities where up to 60% may speak languages other than English or French at home.[3] Defined as the degree to which individuals can obtain, process, and understand basic health information and services needed to make appropriate health decisions,[4] an estimated 55% of Canadians between the ages of 16 and 65 years have limited health literacy, and only 12% of those above the age of 65 years have adequate health literacy skills.[5]
Previous authors have demonstrated the benefits of using multiple interventions, including nonverbal communication, when designing for individuals with limited literacy.[6] Visual aids have been shown to be particularly useful to non‐English speakers and patients with limited health literacy.[7] In particular, research on medication tools for patients with limited health literacy has shown that illustrated schedules can be helpful.[8]
Typical discharge summaries are documents that are transmitted from the hospital to outpatient physicians to coordinate clinical care. The form codesigned by our team is intended to complement the summary and facilitate patient education and to provide instructions for patients to refer to after discharge.
PURPOSE
The objective of this work was to design instructions for patients going home from the hospital with relevant and actionable information, presented in an easily understandable and usable form.
METHODS
We used participatory action methodology,[9] an approach to research that encourages researchers and those who will benefit from the research to work together across all phases of research, by engaging end‐users of patient instructions from the beginning of the project. Mixed methods were used to understand needs, develop content and design, and iteratively evaluate and refine the instructions. An advisory team of patients, physicians, pharmacists, designers, researchers, and patient‐education professionals gave input into study design and execution.
Although formal inclusion and exclusion criteria were not used, care was taken to engage patients with language barriers, limited health literacy, and mental health issues.
Key methods used are listed below. See Figure 1 for a timeline of the process used to develop the instructions.
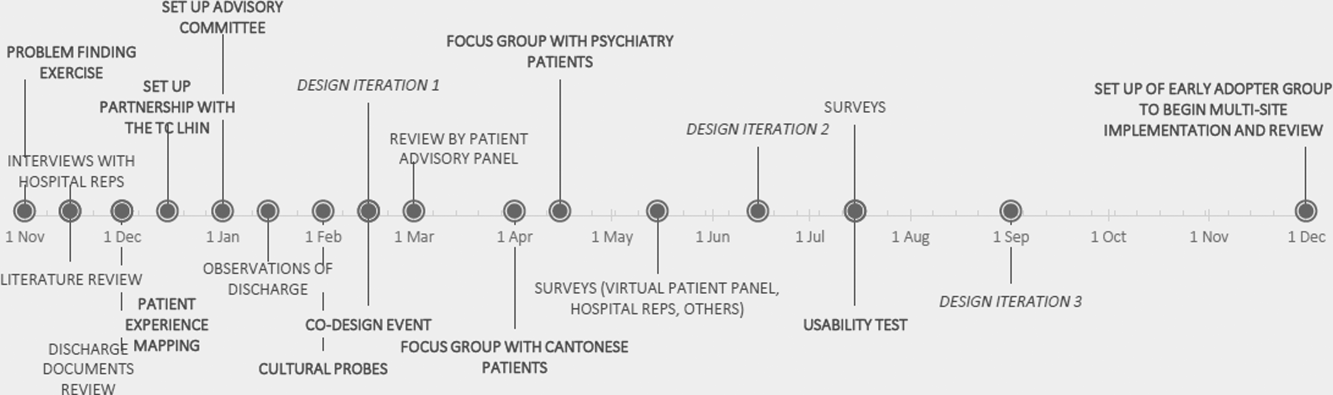
Understanding the Current Patient Experience of Discharge
Key methods included: (1) Patient experience mapping[10]a process of capturing and communicating complex patient interactions and their experience in the system by having interdisciplinary groups create a map of the patient experience and feelings through a mock discharge scenario). (2) A cultural probe[11]patients selected as having minor language barriers or limited health literacy were given a journal and disposable camera to document their time at home after discharge. Patients were asked how confident they were in filling out medical forms by themselves as a way of screening for probable health literacy limitations.[12]
Content and Design
The instructions were developed using a codesign methodology,[13] where researchers and the end‐users of a product design the product together. In our case, teams of patients, healthcare providers, and designers worked together to create prototypes using hypothetical patient cases.
Iteratively Evaluating and Refining the Design
The prototype went through 3 design iterations (Figure 1). Feedback from patients, caregivers, and providers using focus groups, interviews, and surveys was used to refine the content and design and validate symbols for each section.
Key methods included: (1) Two focus groups with hard to reach patient groups that would not participate in interviews or surveys. One was with Cantonese‐speaking patients, facilitated by an interpreter. Cantonese is a common language in Toronto, yet the language barrier typically precludes the patients from participating in research. The other group was with patients admitted to the psychiatry unit of the hospital, another group that typically is excluded from research studies. (2) Usability test of a paper‐based version of the instructions across 3 large academic hospitals; physicians and residents in general internal medicine units filled out the instructions by hand for each patient discharged.
RESULTS
Forty‐four patients, 12 caregivers, 30 healthcare personnel, 7 patient‐education professionals, and 8 designers were involved in the design (see Figure 2 for an image of the template) based on best practices in information design, graphic design, and patient education.
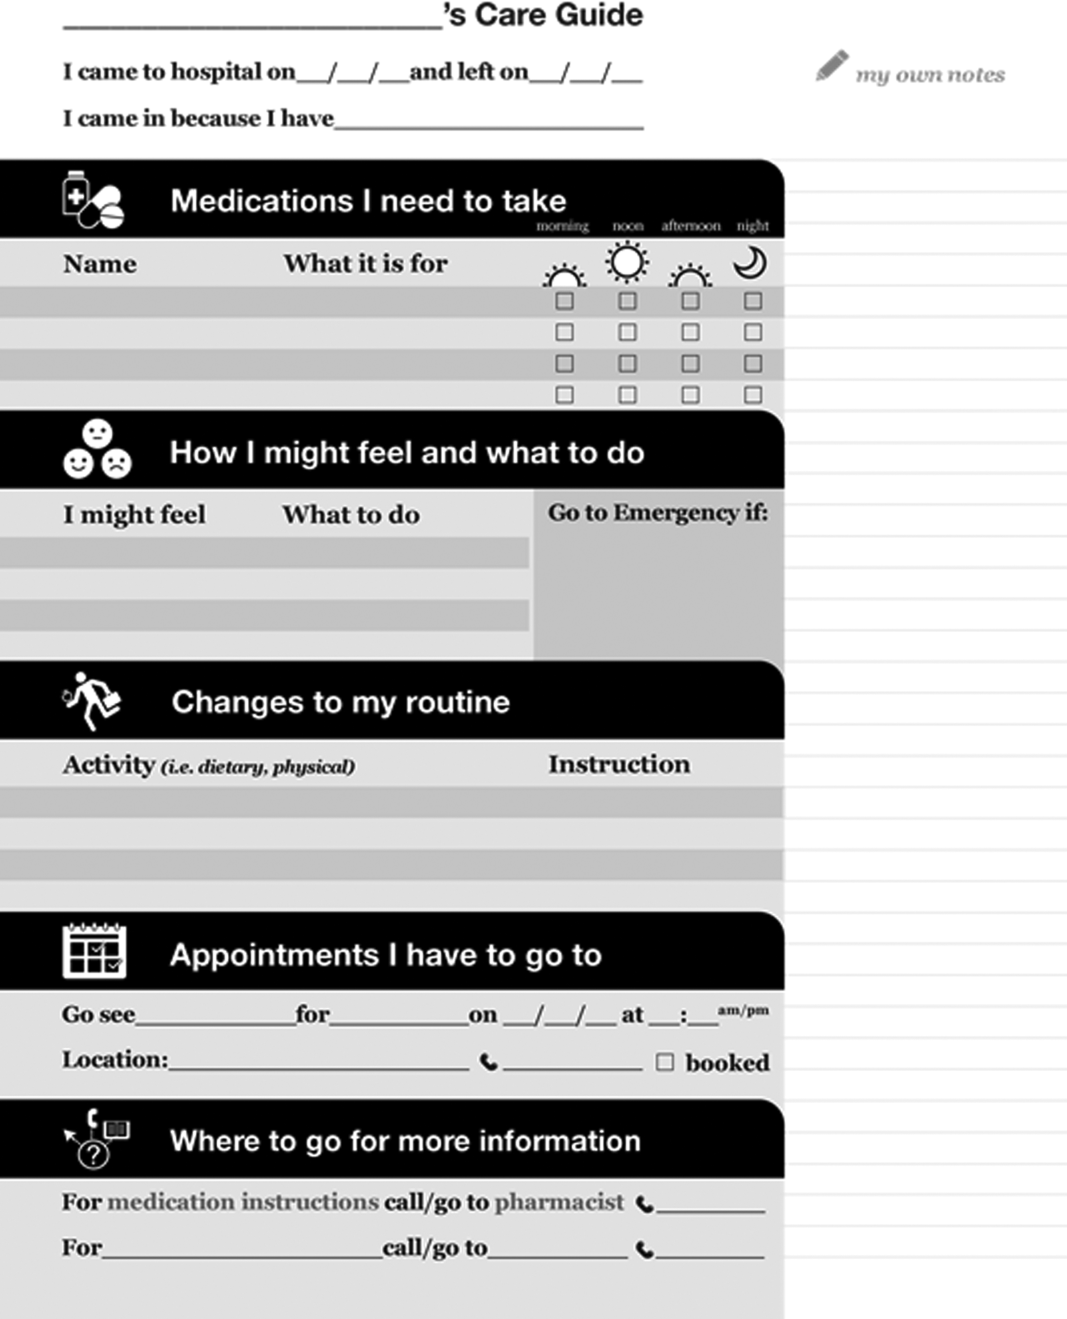
Understanding the Patient Experience of Discharge
The analysis of the patient experience at discharge revealed the following themes:
(1) Difficulties in understanding and retaining verbal instructions in the immediate postdischarge period because of exhaustion. (2) Patient concerns at discharge including feeling unprepared to leave the hospital. (3) Family members and caregivers play a large role in a patient's life, which becomes more significant in the postdischarge phase. This was made clear through journal entries from patients using cultural probes.
Content and Design
Patients wanted to know information that was relevant and actionable. They consistently mentioned the following information as being most important: (1) medication instructions, (2) follow‐up appointments with phone numbers, (3) normal expected symptoms, danger signs, and what to do, (4) lifestyle changes and when to resume activities, and (5) information and resources to have handy.
Advice from patient‐education specialists on the team, as well as the feedback from patients and caregivers was that instructions should be written in language at a fifth‐ or sixth‐grade level and be directed to the patient, use large fonts, include illustrations of medication schedules, and headings that are meaningful to the patient. In addition, patients wanted white space to take notes, an activity that has been shown to improve comprehension and recall.[14]
Patients felt having symbols for each section in the instructions helped make the form more readable by differentiating sections and providing a recognizable image for patients who could read English.
Iteratively Evaluating and Refining the Design
The results of the usability test data and surveys of the final version of the template showed that patients and providers felt that they would benefit from using the instructions. Of the patients and providers, 94.8% of patients and 75% of providers said that the instructions would be helpful to have when discharged from the hospital. Physicians filling out the instructions by hand took an average of 9 minutes to fill out the form.
DISCUSSION
This initiative is an example of engaging patients and caregivers as active partners in the healthcare system. Patients and caregivers were engaged as codesigners of the form from the outset and continuously throughout.
The instructions can be given to patients and caregivers at discharge as both a teaching tool and a reference that can be reviewed when at home. Process considerations are very important. As family and caregivers play an instrumental role in postdischarge care, the instructions should be given whenever possible in the presence of family. The form is a simple addition to any discharge process. It can be filled out by a single provider, a multidisciplinary team, or even the patient while undergoing discharge teaching. The time and resources to fill out the instructions will vary depending on the discharge process in place. Good discharge practices,[15] such as engaging the patient in the conversation and teach back, should be followed.
The form has been licensed as creative commons, so that any healthcare organization can use and adapt the materials to meet the needs of their patients.
The development of the form is only the first step in a larger project. Almost all of the study participants involved in the initiative were from the general internal medicine wards in downtown Toronto. We do not know yet if the results can be generalized to different patient and provider populations.
The instructions are currently being implemented in 8 hospitals throughout Toronto, spanning rehabilitation, acute care, surgery, and pediatrics. The form appears to have been appropriate and generalizable to all of these settings, but results from this multisite implementation on patient and provider experience or health outcomes are not available yet. Anticipated barriers include determining who has the responsibility for filling out the instructions and validating the accuracy of the medication list.
Discharge instructions serve many purposes. Though previous authors have developed checklists to ensure critical discharge information is included in discharge teaching, the creation of a patient‐oriented form, codesigned with patients and caregivers to provide the information that patients explicitly want at discharge, has been lacking. Using participatory action research, mixed methods, and codesign methodology, and including hard‐to‐reach patient groups was helpful in creating a design that will provide patients with key information at discharge in an easy‐to‐understand format.
Acknowledgements
The authors acknowledge the financial support and guidance of the Toronto Central Local Health Integration Network. The project was advised by a number of individuals, namely: Cynthia Damba, Michelle Ransom, Paolo Korre, Irene Chong, Dawn Lim, Helen Kang, Derek Leong, Elizabeth Abraham, Elke Ruthig, Grace Eagan, Vivian Lo, Rachel Solomon, Kendra Delicaet, Sara Ahmadi, and Jess Leung.
Disclosures: The funding provided by the Toronto Central Local Health Integration Network that supported much of the work contained in this article also paid for a portion of the salaries of Shoshana Hahn‐Goldberg, Tai Huynh, and Najla Zahr. There are no other conflicts of interest to report.
- , , , , . The incidence and severity of adverse events affecting patients after discharge from hospital. Ann Intern Med. 2003;138:161–167.
- , , , et al. A reengineered hospital discharge program to decrease rehospitalization: a randomized trial. Ann Inter Med. 2009;150(3):178–187.
- Statistics Canada. Visual census. 2011 census. Ottawa. Available at: http://www12.statcan.gc.ca/census‐recensement/index‐eng.cfm. Accessed September 19, 2014.
- Committee on Health Literacy. Board on Neuroscience and Behavioral Health. Institute of Medicine. Health literacy: a prescription to end confusion. Washington, DC: National Academies Press; 2004. Available at: http://www.collaborationhealthcare.com/7‐20‐10IOMHealthLiteracyExecutiveSummary.pdf. Accessed September 19, 2014.
- , . A vision for a health literate Canada: report of the Expert Panel on Health Literacy. 2008. Available at: http://www.cpha.ca/uploads/portals/h‐l/report_e.pdf. Accessed September 19, 2014.
- , , , , , . Interventions for individuals with low health literacy: a systematic review. J Health Commun. 2011;16:30–54.
- , , , , , Language, literacy, and communication regarding medication in an anticoagulation clinic: a comparison of verbal vs. visual assessment. J Health Commun. 2006;11(7):651–664.
- , , , et al. Development of an illustrated medication schedule as a low‐literacy patient education tool. Patient Educ Couns. 2007;66(3):368–377.
- , , . Participatory action research as a model for conducting family research. J Assoc Pers Sev Handicaps. 1998;23(3):178–188.
- , . Evaluation and measurement of patient experience. Patient Exp J. 2014;1(1):28–36.
- , , . Design: cultural probes. Interactions. 1999;6(1):21–29.
- , , . Can this patient read and understand written health information? JAMA. 2010;304(1):76–84.
- , . Co‐creation and the new landscapes of design. Int J Cocreat Des Arts. 2008;4(1):5–18.
- , . The pen is mightier that the keyboard: advantages of longhand over laptop note taking. Psychol Sci. 2014;25(6):1159–1168.
- , , , et al. Development of a checklist of safe discharge practices for hospital patients. J Hosp Med. 2013;8:444–449.
The period following discharge from the hospital is a vulnerable time for patients that can result in adverse events including avoidable emergency room visits and rehospitalizations.[1] Approximately 8.5% of all visits to the hospital result in readmissions within 30 days.[2] Poor communication of discharge information is even more pronounced for patients with language barriers or limited health literacy, particularly in ethnically diverse communities where up to 60% may speak languages other than English or French at home.[3] Defined as the degree to which individuals can obtain, process, and understand basic health information and services needed to make appropriate health decisions,[4] an estimated 55% of Canadians between the ages of 16 and 65 years have limited health literacy, and only 12% of those above the age of 65 years have adequate health literacy skills.[5]
Previous authors have demonstrated the benefits of using multiple interventions, including nonverbal communication, when designing for individuals with limited literacy.[6] Visual aids have been shown to be particularly useful to non‐English speakers and patients with limited health literacy.[7] In particular, research on medication tools for patients with limited health literacy has shown that illustrated schedules can be helpful.[8]
Typical discharge summaries are documents that are transmitted from the hospital to outpatient physicians to coordinate clinical care. The form codesigned by our team is intended to complement the summary and facilitate patient education and to provide instructions for patients to refer to after discharge.
PURPOSE
The objective of this work was to design instructions for patients going home from the hospital with relevant and actionable information, presented in an easily understandable and usable form.
METHODS
We used participatory action methodology,[9] an approach to research that encourages researchers and those who will benefit from the research to work together across all phases of research, by engaging end‐users of patient instructions from the beginning of the project. Mixed methods were used to understand needs, develop content and design, and iteratively evaluate and refine the instructions. An advisory team of patients, physicians, pharmacists, designers, researchers, and patient‐education professionals gave input into study design and execution.
Although formal inclusion and exclusion criteria were not used, care was taken to engage patients with language barriers, limited health literacy, and mental health issues.
Key methods used are listed below. See Figure 1 for a timeline of the process used to develop the instructions.
Understanding the Current Patient Experience of Discharge
Key methods included: (1) Patient experience mapping[10]a process of capturing and communicating complex patient interactions and their experience in the system by having interdisciplinary groups create a map of the patient experience and feelings through a mock discharge scenario). (2) A cultural probe[11]patients selected as having minor language barriers or limited health literacy were given a journal and disposable camera to document their time at home after discharge. Patients were asked how confident they were in filling out medical forms by themselves as a way of screening for probable health literacy limitations.[12]
Content and Design
The instructions were developed using a codesign methodology,[13] where researchers and the end‐users of a product design the product together. In our case, teams of patients, healthcare providers, and designers worked together to create prototypes using hypothetical patient cases.
Iteratively Evaluating and Refining the Design
The prototype went through 3 design iterations (Figure 1). Feedback from patients, caregivers, and providers using focus groups, interviews, and surveys was used to refine the content and design and validate symbols for each section.
Key methods included: (1) Two focus groups with hard to reach patient groups that would not participate in interviews or surveys. One was with Cantonese‐speaking patients, facilitated by an interpreter. Cantonese is a common language in Toronto, yet the language barrier typically precludes the patients from participating in research. The other group was with patients admitted to the psychiatry unit of the hospital, another group that typically is excluded from research studies. (2) Usability test of a paper‐based version of the instructions across 3 large academic hospitals; physicians and residents in general internal medicine units filled out the instructions by hand for each patient discharged.
RESULTS
Forty‐four patients, 12 caregivers, 30 healthcare personnel, 7 patient‐education professionals, and 8 designers were involved in the design (see Figure 2 for an image of the template) based on best practices in information design, graphic design, and patient education.
Understanding the Patient Experience of Discharge
The analysis of the patient experience at discharge revealed the following themes:
(1) Difficulties in understanding and retaining verbal instructions in the immediate postdischarge period because of exhaustion. (2) Patient concerns at discharge including feeling unprepared to leave the hospital. (3) Family members and caregivers play a large role in a patient's life, which becomes more significant in the postdischarge phase. This was made clear through journal entries from patients using cultural probes.
Content and Design
Patients wanted to know information that was relevant and actionable. They consistently mentioned the following information as being most important: (1) medication instructions, (2) follow‐up appointments with phone numbers, (3) normal expected symptoms, danger signs, and what to do, (4) lifestyle changes and when to resume activities, and (5) information and resources to have handy.
Advice from patient‐education specialists on the team, as well as the feedback from patients and caregivers was that instructions should be written in language at a fifth‐ or sixth‐grade level and be directed to the patient, use large fonts, include illustrations of medication schedules, and headings that are meaningful to the patient. In addition, patients wanted white space to take notes, an activity that has been shown to improve comprehension and recall.[14]
Patients felt having symbols for each section in the instructions helped make the form more readable by differentiating sections and providing a recognizable image for patients who could read English.
Iteratively Evaluating and Refining the Design
The results of the usability test data and surveys of the final version of the template showed that patients and providers felt that they would benefit from using the instructions. Of the patients and providers, 94.8% of patients and 75% of providers said that the instructions would be helpful to have when discharged from the hospital. Physicians filling out the instructions by hand took an average of 9 minutes to fill out the form.
DISCUSSION
This initiative is an example of engaging patients and caregivers as active partners in the healthcare system. Patients and caregivers were engaged as codesigners of the form from the outset and continuously throughout.
The instructions can be given to patients and caregivers at discharge as both a teaching tool and a reference that can be reviewed when at home. Process considerations are very important. As family and caregivers play an instrumental role in postdischarge care, the instructions should be given whenever possible in the presence of family. The form is a simple addition to any discharge process. It can be filled out by a single provider, a multidisciplinary team, or even the patient while undergoing discharge teaching. The time and resources to fill out the instructions will vary depending on the discharge process in place. Good discharge practices,[15] such as engaging the patient in the conversation and teach back, should be followed.
The form has been licensed as creative commons, so that any healthcare organization can use and adapt the materials to meet the needs of their patients.
The development of the form is only the first step in a larger project. Almost all of the study participants involved in the initiative were from the general internal medicine wards in downtown Toronto. We do not know yet if the results can be generalized to different patient and provider populations.
The instructions are currently being implemented in 8 hospitals throughout Toronto, spanning rehabilitation, acute care, surgery, and pediatrics. The form appears to have been appropriate and generalizable to all of these settings, but results from this multisite implementation on patient and provider experience or health outcomes are not available yet. Anticipated barriers include determining who has the responsibility for filling out the instructions and validating the accuracy of the medication list.
Discharge instructions serve many purposes. Though previous authors have developed checklists to ensure critical discharge information is included in discharge teaching, the creation of a patient‐oriented form, codesigned with patients and caregivers to provide the information that patients explicitly want at discharge, has been lacking. Using participatory action research, mixed methods, and codesign methodology, and including hard‐to‐reach patient groups was helpful in creating a design that will provide patients with key information at discharge in an easy‐to‐understand format.
Acknowledgements
The authors acknowledge the financial support and guidance of the Toronto Central Local Health Integration Network. The project was advised by a number of individuals, namely: Cynthia Damba, Michelle Ransom, Paolo Korre, Irene Chong, Dawn Lim, Helen Kang, Derek Leong, Elizabeth Abraham, Elke Ruthig, Grace Eagan, Vivian Lo, Rachel Solomon, Kendra Delicaet, Sara Ahmadi, and Jess Leung.
Disclosures: The funding provided by the Toronto Central Local Health Integration Network that supported much of the work contained in this article also paid for a portion of the salaries of Shoshana Hahn‐Goldberg, Tai Huynh, and Najla Zahr. There are no other conflicts of interest to report.
- , , , , . The incidence and severity of adverse events affecting patients after discharge from hospital. Ann Intern Med. 2003;138:161–167.
- , , , et al. A reengineered hospital discharge program to decrease rehospitalization: a randomized trial. Ann Inter Med. 2009;150(3):178–187.
- Statistics Canada. Visual census. 2011 census. Ottawa. Available at: http://www12.statcan.gc.ca/census‐recensement/index‐eng.cfm. Accessed September 19, 2014.
- Committee on Health Literacy. Board on Neuroscience and Behavioral Health. Institute of Medicine. Health literacy: a prescription to end confusion. Washington, DC: National Academies Press; 2004. Available at: http://www.collaborationhealthcare.com/7‐20‐10IOMHealthLiteracyExecutiveSummary.pdf. Accessed September 19, 2014.
- , . A vision for a health literate Canada: report of the Expert Panel on Health Literacy. 2008. Available at: http://www.cpha.ca/uploads/portals/h‐l/report_e.pdf. Accessed September 19, 2014.
- , , , , , . Interventions for individuals with low health literacy: a systematic review. J Health Commun. 2011;16:30–54.
- , , , , , Language, literacy, and communication regarding medication in an anticoagulation clinic: a comparison of verbal vs. visual assessment. J Health Commun. 2006;11(7):651–664.
- , , , et al. Development of an illustrated medication schedule as a low‐literacy patient education tool. Patient Educ Couns. 2007;66(3):368–377.
- , , . Participatory action research as a model for conducting family research. J Assoc Pers Sev Handicaps. 1998;23(3):178–188.
- , . Evaluation and measurement of patient experience. Patient Exp J. 2014;1(1):28–36.
- , , . Design: cultural probes. Interactions. 1999;6(1):21–29.
- , , . Can this patient read and understand written health information? JAMA. 2010;304(1):76–84.
- , . Co‐creation and the new landscapes of design. Int J Cocreat Des Arts. 2008;4(1):5–18.
- , . The pen is mightier that the keyboard: advantages of longhand over laptop note taking. Psychol Sci. 2014;25(6):1159–1168.
- , , , et al. Development of a checklist of safe discharge practices for hospital patients. J Hosp Med. 2013;8:444–449.

Using Social Media as a Hospital QI Tool
Patient experience has become a major component of the Center for Medicare and Medicaid Services Value‐Based Purchasing initiative.[1] Hospitals have therefore focused quality improvement (QI) efforts on this area.[2] Hospital performance in the realm of patient experience is generally determined using systematic surveys with closed‐ended questions, but patient‐generated narrative feedback can help hospitals identify the components of care that contribute to patient satisfaction and or are in need of improvement.[3] Online narrative responses posted by patients on rating websites or social media have been criticized because they may not be representative of the population,[4] but they also have some advantages.[5] Any patient may leave a comment, not just those who are selected for a survey. Patients may also experience benefits through the act of sharing their story with others. Moreover, most US hospitals use some form of social media,[6] which they can theoretically use to self‐collect narrative data online. To realize the full potential of patient‐generated online narratives, we need a clearer understanding of the best practices for collecting and using these narratives. We therefore solicited patient feedback on the Facebook page of a large tertiary academic medical center to determine whether it is feasible to use social media platforms for learning about and improving hospital quality.
METHODS
Baystate Medical Center (BMC) is a tertiary care medical center in western Massachusetts. We identified key BMC stakeholders in the areas of QI and public affairs. Noting that patients have expressed interest in leaving comments via social media,[7] the group opted to perform a pilot study to obtain patient narratives via a Facebook prompt (Facebook is a social media site used by an estimated 58% of US adults[8]). The BMC public affairs department delivered a press release to the local media describing a 3‐week period during which patients were invited to leave narrative feedback on the BMC Facebook wall. The BMC Institutional Review Board deemed that this study did not constitute human subjects research.
During March 2014 (March 10, 2014March 24, 2014), we posted (once a week) an open‐ended prompt on BMC's Facebook wall. The prompt was designed to elicit novel descriptions of patient experience that could help to drive QI. It read: We want to hear about your experiences. In the comment section below, please tell us what we do well and how we can improve your care. Because of concerns about the potential reputational risks of allowing open feedback on a public social media page, the prompt also reminded patients of the social media ground rules: there should be no mention of specific physicians, nurses, or other caregivers by name (for liability reasons); and patients should not include details about their medical history (for privacy reasons).
We collected all posts to preserve comments and used directed qualitative content analysis to examine them.[9] Two research team members[3, 10, 11] independently coded the responses. Starting with an a priori codebook that was developed during a previous study,[3] they amended the codebook through an iterative process to incorporate new concepts. After independently coding all blocks of text, the coders reviewed their coding selections and resolved discrepancies through discussion. We then performed second‐level coding, in which codes were organized into major pertinent themes. We reviewed the coded text after applying secondary codes in order to check for accuracy of coding and theme assignment as well as completeness of second‐level coding. We calculated percent agreement, defined as both raters scoring a block of text with the same code divided by total number of codes. We also calculated the Spearman correlation between the 2 reviewers. We used descriptive statistics to assess the frequency of select codes and themes (see Supporting Information, Appendix 1 and Appendix 2, in the online version of this article).[9, 12, 13]
RESULTS
Over a 3‐week study period, 47 comments were submitted by 37 respondents. This yielded 148 codable statements (Table 1). Despite limited information on respondents, we ascertained from Facebook that 32 (86%) were women and 5 (14%) were men.
| Theme | Total Respondents, N (%) | % Positive | Positive Quotation | % Negative | Negative Quotation |
|---|---|---|---|---|---|
| |||||
| Staff | 17 (46) | 45% | The nurses in the pediatric unit, as well as the doctors in radiology and x‐ray department were AMAZING! | 55% | My 24‐year‐old daughter had to go for 5 days of IV treatmentwhile getting her infusion there was a fire alarm. She has a video showing the flashing of the light and the sound of the alarm and the closing of doors and NOT A SINGLE staff member to be found. Her infusions take about 2 hours. They set it and forget it. Luckily there wasn't a fire and someone did finally come to disconnect her. |
| Had a fabulous experience with Wesson women's this week! Had a C section and 3‐day admission. All staff from preoperative to inpatient were so helpful and really anticipated my needs before I could even ask for things. | My mother was hospitalized for at least 3 weeks right after the cardiovascular center openedwhen she went into cardiac arrest and in acute care and the step unit the care was great, very attentive nurses and doctors. When she was starting to recover and moved upstairs, downhill it went. She'd ring for assistance because she wanted to walk to the bathrooms and more times she was left to her own devices because no one would respond. | ||||
| Facility | 9 (24) | 25% | New buildings are beautiful and the new signs are way better. | 75% | The parking situation was disappointing and the waiting room was also very dirty. |
| I really like the individual pods in the ER. | I could have used a single room as my roommate was very annoying and demanding. | ||||
| Departments | 22 (60) | 44% | The NICU was great when my son was in there. The children's unit was great with my daughter and respected my needs. | 56% | Revamp maternity; it needs it desperately. |
| Labor and delivery was a great place. | Love Baystate but hate the ER. | ||||
| Technical aspects of care (eg, errors) | 9 (24) | 0 | 100% | Day 2 of my 24 year old getting her 2‐hour IV infusion....she was set up with her IV. When checked 2 hours later, the staff member was very upset to find that only the saline had run. She never opened the medication clamp. So now they gave her the medication in 1 hour instead of 2. | |
| If I had 1 suggestion it would be to re‐evaluate patient comfort when patients are waiting to be admitted. | |||||
From coded text, several broad themes were identified (see Table 1 for representative quotes): (1) comments about staff (17/37 respondents, 45.9%). These included positive descriptions of efficiency, caring behavior, good training, and good communication, whereas negative comments included descriptions of unfriendliness, apparent lack of caring, inattentiveness, poor training, unprofessional behavior, and poor communication; (2) comments about specific departments (22/37, 59.5%); (3) comments on technical aspects of care, including perceived errors, incorrect diagnoses, and inattention to pain control (9/37, 24.3%); and (4) comments describing the hospital physical plant, parking, and amenities (9/37, 24.3%). There were a few miscellaneous comments that did not fit into these broad themes, such as expressions of gratitude for our solicitation of narratives. Percent agreement between coders was 80% and Spearman's Rho was 0.82 (p0.001).
A small number (n=3) of respondents repeatedly made comments over the 3‐week period, accounting for 30% (45/148) of codes. These repetitive commenters tended to dominate the Facebook conversation, at times describing the same experience more than once.
DISCUSSION
In this study evaluating the potential utility of social media as a hospital QI tool, several broad themes emerged. From these themes, we identified several areas that could be deemed as QI targets, including: training staff to be more responsive and sensitive to patients needs and concerns, improving patient and visitor parking, and reducing emergency department waiting times. However, the insight gained from solicited Facebook comments was similar to feedback gained from more traditional approaches of soliciting patient perspectives on care, such as patient experience surveys.[14]
Our findings should be viewed in the context of prior work focused on patient narratives in healthcare. Greaves et al. used sentiment analysis to describe the content of nearly 200,000 tweets (comments posted on the social networking website Twitter) sent to National Health Service (NHS) hospitals.[15] Themes were similar to those found in our study: (1) interaction with staff, (2) environment and facilities, and (3) issues of access and timeliness of service. Notably, these themes mirrored prior work examining narratives at NHS hospitals[3] and were similar to domains of commonly used surveys of patient experience.[14] The authors noted that there were issues with the signal to noise ratio (only about 10% of tweets were about quality) and the enforced brevity of Twitter (tweets must be 140 characters or less). These limitations suggest that using Twitter to identify QI targets would be difficult.
In contrast to Greaves et al., we chose to solicit feedback on our hospital's Facebook page. Facebook does not have Twitter's enforced brevity, allowing for more detailed narratives. In addition, we did not encounter the signal‐to‐noise problem, because our prompt was designed to request feedback that was relevant to recent experiences of care. However, a few respondents dominated the conversation, supporting the hypothesis that those most likely to comment may be the patients or families who have had the best or worst experiences. In the future, we will attempt to address this limitation and reduce the influence of repeat commenters by changing our prompt (eg, Please tell us about your experience, but please do not post descriptions of the same experience more than once.).
This pilot demonstrated some of the previously described benefits of online narratives.[5] First, there appears to be value in allowing patients to share their experiences and to read the experiences of others (as indicated in a few grateful patients comments). Second, soliciting online narratives offers a way for hospitals to demonstrate a commitment to transparency. Third, in contrast to closed‐ended survey questions, narrative comments help to identify why patients were satisfied or unsatisfied with their care. Although some surveys with closed‐ended questions also allow for narratives, these comments may or may not be carefully reviewed by the hospital. Using social media to solicit and respond to comments enhances existing methods for evaluating patient experience by engaging patients in a public space, which increases the likelihood that hospitals will attempt to improve care in response.
Notably, none of the identified areas for improvement could be considered novel QI targets for BMC. For example, our hospital has been very focused on training staff around patient experience, and emergency department wait times are the focus of a system‐wide improvement effort called Patient Progress.
This study has other limitations. We conducted this study over a 3‐week time period in a single center and on a single social media site whose members may not be representative of the overall patient population at BMC. Although we do not know how generalizable our findings are (in terms of identifying QI targets), we feel that we have demonstrated how using social media to collect data on patient experience is feasible and could be informative for other hospitals in other locations. It is possible that we did not allow the experiment to run long enough; a longer time or broader outreach (eg, a handout given to every discharged patient over a longer period) may be needed to allow patients adequate opportunity to comment. Of note, we did not specifically examine responses by time period, but it does seem, in post hoc analysis, that after 2 weeks of data collection we reached theoretical saturation with no new themes emerging in the third week (eg, third‐week comments included I heart your nurses. and Love Baystate but hate the ER.). More work is also needed that includes a broader range of social media platforms and more participating hospitals.
In conclusion, the opportunity to provide feedback on Facebook has the potential to engage and empower patients, and hospitals can use these online narratives to help to drive improvement efforts. Yet potential benefits must be weighed against reputational risks, a lack of representative respondents, and the paucity of novel QI targets obtained in this study.
Disclosures: Dr. Lagu is supported by the National Heart, Lung, and Blood Institute of the National Institutes of Health under award number K01HL114745. The authors report no conflicts of interest.
- Centers for Medicare 47(2):193–219.
- , , , , . A mixed‐methods analysis of patient reviews of hospital care in England: implications for public reporting of health care quality data in the United States. Jt Comm J Qual Patient Saf. 2013;39(1):7–15.
- , , , , , , , . Taking Patients' Narratives about Clinicians from Anecdote to Science. NEJM. 2015;373(7):675–679.
- , . Putting the public back in public reporting of health care quality. JAMA. 2010;304(15):1711–1712.
- , , , et al. Use of social media across US hospitals: descriptive analysis of adoption and utilization. J Med Internet Res. 2014;16(11):e264.
- , , , , , . Patient use of email, Facebook, and physician websites to communicate with physicians: a national online survey of retail pharmacy users [published online June 24, 2015]. J Gen Intern Med. doi:10.1007/s11606-015-3374-7.
- Pew Research Center. Social networking fact sheet. Available at: http://www.pewinternet.org/fact‐sheets/social‐networking‐fact‐sheet. Accessed March 4, 2015.
- , . Three approaches to qualitative content analysis. Qual Health Res. 2005;15(9):1277–1288.
- , , , . Patients’ evaluations of health care providers in the era of social networking: an analysis of physician‐rating websites. J Gen Intern Med. 2010;25(9):942–946.
- , , , , . Vaccine counseling: a content analysis of patient‐physician discussions regarding human papilloma virus vaccine. Vaccine. 2011;29(43):7343–7349.
- . Qualitative research methods. Int J Qual Health Care. 2002;14(4):329–336.
- , . Doing Qualitative Research. Vol 2. Thousand Oaks, CA: Sage Publications; 1999.
- , , , . Patients’ perception of hospital care in the United States. N Engl J Med. 2008;359(18):1921–1931.
- , , , et al. Tweets about hospital quality: a mixed methods study. BMJ Qual Saf. 2014;23(10):838–846.
Patient experience has become a major component of the Center for Medicare and Medicaid Services Value‐Based Purchasing initiative.[1] Hospitals have therefore focused quality improvement (QI) efforts on this area.[2] Hospital performance in the realm of patient experience is generally determined using systematic surveys with closed‐ended questions, but patient‐generated narrative feedback can help hospitals identify the components of care that contribute to patient satisfaction and or are in need of improvement.[3] Online narrative responses posted by patients on rating websites or social media have been criticized because they may not be representative of the population,[4] but they also have some advantages.[5] Any patient may leave a comment, not just those who are selected for a survey. Patients may also experience benefits through the act of sharing their story with others. Moreover, most US hospitals use some form of social media,[6] which they can theoretically use to self‐collect narrative data online. To realize the full potential of patient‐generated online narratives, we need a clearer understanding of the best practices for collecting and using these narratives. We therefore solicited patient feedback on the Facebook page of a large tertiary academic medical center to determine whether it is feasible to use social media platforms for learning about and improving hospital quality.
METHODS
Baystate Medical Center (BMC) is a tertiary care medical center in western Massachusetts. We identified key BMC stakeholders in the areas of QI and public affairs. Noting that patients have expressed interest in leaving comments via social media,[7] the group opted to perform a pilot study to obtain patient narratives via a Facebook prompt (Facebook is a social media site used by an estimated 58% of US adults[8]). The BMC public affairs department delivered a press release to the local media describing a 3‐week period during which patients were invited to leave narrative feedback on the BMC Facebook wall. The BMC Institutional Review Board deemed that this study did not constitute human subjects research.
During March 2014 (March 10, 2014March 24, 2014), we posted (once a week) an open‐ended prompt on BMC's Facebook wall. The prompt was designed to elicit novel descriptions of patient experience that could help to drive QI. It read: We want to hear about your experiences. In the comment section below, please tell us what we do well and how we can improve your care. Because of concerns about the potential reputational risks of allowing open feedback on a public social media page, the prompt also reminded patients of the social media ground rules: there should be no mention of specific physicians, nurses, or other caregivers by name (for liability reasons); and patients should not include details about their medical history (for privacy reasons).
We collected all posts to preserve comments and used directed qualitative content analysis to examine them.[9] Two research team members[3, 10, 11] independently coded the responses. Starting with an a priori codebook that was developed during a previous study,[3] they amended the codebook through an iterative process to incorporate new concepts. After independently coding all blocks of text, the coders reviewed their coding selections and resolved discrepancies through discussion. We then performed second‐level coding, in which codes were organized into major pertinent themes. We reviewed the coded text after applying secondary codes in order to check for accuracy of coding and theme assignment as well as completeness of second‐level coding. We calculated percent agreement, defined as both raters scoring a block of text with the same code divided by total number of codes. We also calculated the Spearman correlation between the 2 reviewers. We used descriptive statistics to assess the frequency of select codes and themes (see Supporting Information, Appendix 1 and Appendix 2, in the online version of this article).[9, 12, 13]
RESULTS
Over a 3‐week study period, 47 comments were submitted by 37 respondents. This yielded 148 codable statements (Table 1). Despite limited information on respondents, we ascertained from Facebook that 32 (86%) were women and 5 (14%) were men.
| Theme | Total Respondents, N (%) | % Positive | Positive Quotation | % Negative | Negative Quotation |
|---|---|---|---|---|---|
| |||||
| Staff | 17 (46) | 45% | The nurses in the pediatric unit, as well as the doctors in radiology and x‐ray department were AMAZING! | 55% | My 24‐year‐old daughter had to go for 5 days of IV treatmentwhile getting her infusion there was a fire alarm. She has a video showing the flashing of the light and the sound of the alarm and the closing of doors and NOT A SINGLE staff member to be found. Her infusions take about 2 hours. They set it and forget it. Luckily there wasn't a fire and someone did finally come to disconnect her. |
| Had a fabulous experience with Wesson women's this week! Had a C section and 3‐day admission. All staff from preoperative to inpatient were so helpful and really anticipated my needs before I could even ask for things. | My mother was hospitalized for at least 3 weeks right after the cardiovascular center openedwhen she went into cardiac arrest and in acute care and the step unit the care was great, very attentive nurses and doctors. When she was starting to recover and moved upstairs, downhill it went. She'd ring for assistance because she wanted to walk to the bathrooms and more times she was left to her own devices because no one would respond. | ||||
| Facility | 9 (24) | 25% | New buildings are beautiful and the new signs are way better. | 75% | The parking situation was disappointing and the waiting room was also very dirty. |
| I really like the individual pods in the ER. | I could have used a single room as my roommate was very annoying and demanding. | ||||
| Departments | 22 (60) | 44% | The NICU was great when my son was in there. The children's unit was great with my daughter and respected my needs. | 56% | Revamp maternity; it needs it desperately. |
| Labor and delivery was a great place. | Love Baystate but hate the ER. | ||||
| Technical aspects of care (eg, errors) | 9 (24) | 0 | 100% | Day 2 of my 24 year old getting her 2‐hour IV infusion....she was set up with her IV. When checked 2 hours later, the staff member was very upset to find that only the saline had run. She never opened the medication clamp. So now they gave her the medication in 1 hour instead of 2. | |
| If I had 1 suggestion it would be to re‐evaluate patient comfort when patients are waiting to be admitted. | |||||
From coded text, several broad themes were identified (see Table 1 for representative quotes): (1) comments about staff (17/37 respondents, 45.9%). These included positive descriptions of efficiency, caring behavior, good training, and good communication, whereas negative comments included descriptions of unfriendliness, apparent lack of caring, inattentiveness, poor training, unprofessional behavior, and poor communication; (2) comments about specific departments (22/37, 59.5%); (3) comments on technical aspects of care, including perceived errors, incorrect diagnoses, and inattention to pain control (9/37, 24.3%); and (4) comments describing the hospital physical plant, parking, and amenities (9/37, 24.3%). There were a few miscellaneous comments that did not fit into these broad themes, such as expressions of gratitude for our solicitation of narratives. Percent agreement between coders was 80% and Spearman's Rho was 0.82 (p0.001).
A small number (n=3) of respondents repeatedly made comments over the 3‐week period, accounting for 30% (45/148) of codes. These repetitive commenters tended to dominate the Facebook conversation, at times describing the same experience more than once.
DISCUSSION
In this study evaluating the potential utility of social media as a hospital QI tool, several broad themes emerged. From these themes, we identified several areas that could be deemed as QI targets, including: training staff to be more responsive and sensitive to patients needs and concerns, improving patient and visitor parking, and reducing emergency department waiting times. However, the insight gained from solicited Facebook comments was similar to feedback gained from more traditional approaches of soliciting patient perspectives on care, such as patient experience surveys.[14]
Our findings should be viewed in the context of prior work focused on patient narratives in healthcare. Greaves et al. used sentiment analysis to describe the content of nearly 200,000 tweets (comments posted on the social networking website Twitter) sent to National Health Service (NHS) hospitals.[15] Themes were similar to those found in our study: (1) interaction with staff, (2) environment and facilities, and (3) issues of access and timeliness of service. Notably, these themes mirrored prior work examining narratives at NHS hospitals[3] and were similar to domains of commonly used surveys of patient experience.[14] The authors noted that there were issues with the signal to noise ratio (only about 10% of tweets were about quality) and the enforced brevity of Twitter (tweets must be 140 characters or less). These limitations suggest that using Twitter to identify QI targets would be difficult.
In contrast to Greaves et al., we chose to solicit feedback on our hospital's Facebook page. Facebook does not have Twitter's enforced brevity, allowing for more detailed narratives. In addition, we did not encounter the signal‐to‐noise problem, because our prompt was designed to request feedback that was relevant to recent experiences of care. However, a few respondents dominated the conversation, supporting the hypothesis that those most likely to comment may be the patients or families who have had the best or worst experiences. In the future, we will attempt to address this limitation and reduce the influence of repeat commenters by changing our prompt (eg, Please tell us about your experience, but please do not post descriptions of the same experience more than once.).
This pilot demonstrated some of the previously described benefits of online narratives.[5] First, there appears to be value in allowing patients to share their experiences and to read the experiences of others (as indicated in a few grateful patients comments). Second, soliciting online narratives offers a way for hospitals to demonstrate a commitment to transparency. Third, in contrast to closed‐ended survey questions, narrative comments help to identify why patients were satisfied or unsatisfied with their care. Although some surveys with closed‐ended questions also allow for narratives, these comments may or may not be carefully reviewed by the hospital. Using social media to solicit and respond to comments enhances existing methods for evaluating patient experience by engaging patients in a public space, which increases the likelihood that hospitals will attempt to improve care in response.
Notably, none of the identified areas for improvement could be considered novel QI targets for BMC. For example, our hospital has been very focused on training staff around patient experience, and emergency department wait times are the focus of a system‐wide improvement effort called Patient Progress.
This study has other limitations. We conducted this study over a 3‐week time period in a single center and on a single social media site whose members may not be representative of the overall patient population at BMC. Although we do not know how generalizable our findings are (in terms of identifying QI targets), we feel that we have demonstrated how using social media to collect data on patient experience is feasible and could be informative for other hospitals in other locations. It is possible that we did not allow the experiment to run long enough; a longer time or broader outreach (eg, a handout given to every discharged patient over a longer period) may be needed to allow patients adequate opportunity to comment. Of note, we did not specifically examine responses by time period, but it does seem, in post hoc analysis, that after 2 weeks of data collection we reached theoretical saturation with no new themes emerging in the third week (eg, third‐week comments included I heart your nurses. and Love Baystate but hate the ER.). More work is also needed that includes a broader range of social media platforms and more participating hospitals.
In conclusion, the opportunity to provide feedback on Facebook has the potential to engage and empower patients, and hospitals can use these online narratives to help to drive improvement efforts. Yet potential benefits must be weighed against reputational risks, a lack of representative respondents, and the paucity of novel QI targets obtained in this study.
Disclosures: Dr. Lagu is supported by the National Heart, Lung, and Blood Institute of the National Institutes of Health under award number K01HL114745. The authors report no conflicts of interest.
- Centers for Medicare 47(2):193–219.
- , , , , . A mixed‐methods analysis of patient reviews of hospital care in England: implications for public reporting of health care quality data in the United States. Jt Comm J Qual Patient Saf. 2013;39(1):7–15.
- , , , , , , , . Taking Patients' Narratives about Clinicians from Anecdote to Science. NEJM. 2015;373(7):675–679.
- , . Putting the public back in public reporting of health care quality. JAMA. 2010;304(15):1711–1712.
- , , , et al. Use of social media across US hospitals: descriptive analysis of adoption and utilization. J Med Internet Res. 2014;16(11):e264.
- , , , , , . Patient use of email, Facebook, and physician websites to communicate with physicians: a national online survey of retail pharmacy users [published online June 24, 2015]. J Gen Intern Med. doi:10.1007/s11606-015-3374-7.
- Pew Research Center. Social networking fact sheet. Available at: http://www.pewinternet.org/fact‐sheets/social‐networking‐fact‐sheet. Accessed March 4, 2015.
- , . Three approaches to qualitative content analysis. Qual Health Res. 2005;15(9):1277–1288.
- , , , . Patients’ evaluations of health care providers in the era of social networking: an analysis of physician‐rating websites. J Gen Intern Med. 2010;25(9):942–946.
- , , , , . Vaccine counseling: a content analysis of patient‐physician discussions regarding human papilloma virus vaccine. Vaccine. 2011;29(43):7343–7349.
- . Qualitative research methods. Int J Qual Health Care. 2002;14(4):329–336.
- , . Doing Qualitative Research. Vol 2. Thousand Oaks, CA: Sage Publications; 1999.
- , , , . Patients’ perception of hospital care in the United States. N Engl J Med. 2008;359(18):1921–1931.
- , , , et al. Tweets about hospital quality: a mixed methods study. BMJ Qual Saf. 2014;23(10):838–846.
Identification of Hospitalists
A seminal 1996 New England Journal of Medicine article introduced the term hospitalist to describe the emerging trend of primary care physicians practicing in inpatient hospital settings.[1] Although physicians had practice patterns akin to hospitalists prior to the introduction of the term,[2] the field continues to grow and formalize as a unique specialty in medicine.
There is currently no board certification or specialty billing code associated with hospitalists. In 2009, the American Board of Internal Medicine and American Board of Family Medicine introduced a Focused Practice in Hospital Medicine optional recertification pathway.[3] However, absent a unique identifier, it remains difficult to identify the number of hospitalists practicing today. Issues with identification notwithstanding, published data consistently suggest that the number of hospitalists has grown dramatically over the last 2 decades.[4, 5, 6]
The Centers for Medicare and Medicaid Services (CMS), along with other payers, classify hospitalists based on their board certificationmost commonly internal medicine or family practice. Other approaches for more precise assessment utilized billing data or hospital designation. Saint et al. identified hospital‐based providers practicing in Washington State in 1994 using variable thresholds of billing for inpatient services.[2] In 2011, Welch et al. identified 25,787 hospitalists nationwide, using a 90% threshold of billing inpatient services in Medicare data.[6] That same year, an American Hospital Association survey identified 34,411 hospitalists based on self‐reporting.[4]
Building on the work of previous researchers, we applied an updated threshold of inpatient services in publicly available 2012 Medicare Provider Utilization and Payment Data to identify a range of hospitalists practicing in the United States. We also examine the codes billed by providers identified in different decile billing thresholds to assess the validity of using lower thresholds to identify hospitalists.
METHODS
Approach to Identifying Hospitalists
In April 2014, CMS publicly released Medicare Provider Utilization and Payment data from all 880,000 providers who billed Medicare Part B in 2012. The dataset included services charged for 2012 Medicare Part B fee‐for‐service claims. The data omitted claims billed by a unique National Provider Identifier (NPI) for fewer than 10 Medicare beneficiaries. CMS assigned a specialty designation to each provider in the pay data based on the Medicare specialty billing code listed most frequently on his or her claims.
We explored the number of hospitalists in the 2012 Medicare pay data using specialty designation in combination with patterns of billing data. We first grouped physicians with specialty designations of internal medicine and family practice (IM/FP), the most common board certifications for hospitalists. We then selected 4 Healthcare Common Procedure Coding System (HCPCS) code clusters commonly associated with hospitalist practice: acute inpatient (HCPCS codes 9922199223, 9923199233, and 9923899239), observation (9921899220, 9922499226, and 99217), observation/emnpatient same day (9923499236), and critical care (9929199292). We included observation services codes given the significant role hospitalists play in their use[7, 8] and CMS incorporation of observation services for a threshold to identify and exempt hospital‐based providers in meaningful use.[9]
Analysis of Billing Thresholds and Other Codes Billed by Hospitalists
We examined the numbers of hospitalists who would be identified using a 50%, 60%, 70%, 80%, or 90% threshold, and compared the level of change in the size of the group with each change in decile.
We then analyzed the services billed by hospitalists who billed our threshold codes between 60% and 70% of the time. We looked at all codes billed with a frequency of greater than 0.1%, grouping clusters of similar services to identify patterns of clinical activity performed by these physicians.
RESULTS
The 2012 Medicare pay data included 664,253 physicians with unique NPIs. Of these, 169,317 had IM/FP specialty designations, whereas just under half (46.25%) of those physicians billed any of the inpatient HCPCS codes associated with our threshold.
Table 1 describes the range of number of hospitalists identified by varying the threshold of inpatient services. A total of 28,473 providers bill the threshold‐associated inpatient codes almost exclusively, whereas each descending decile increases in size by an average of 7.29%.
| Threshold (%) | Unique NPIs | % of IM/FP Physicians | % of All Physicians |
|---|---|---|---|
| |||
| 90 | 28,473 | 16.8 | 4.3 |
| 80 | 30,866 | 18.2 | 4.6 |
| 70 | 32,834 | 19.4 | 4.9 |
| 60 | 35,116 | 20.7 | 5.3 |
| 50 | 37,646 | 22.2 | 5.7 |
We also analyzed billing patterns of a subset of physicians who billed our threshold codes between 60% and 70% of the time to better characterize the remainder of clinical work they perform. This group included 2282 physicians and only 56 unique HCPCS codes with frequencies greater than 0.1%. After clustering related codes, we identified 4 common code groups that account for the majority of the remaining billing beyond inpatient threshold codes (Table 2).
| Clinical Service Cluster | HCPCS Codes Included | % |
|---|---|---|
| ||
| Threshold codes | 99217, 99219, 99220, 99221, 99222, 99223, 99231, 99232, 99233, 99238, 99239, 99291 | 64.5 |
| Office visit (new and established) | 99203, 99204, 99205, 99211, 99212, 99213, 99214, 99215 | 15.3 |
| SNF care (initial and subsequent) | 99305, 99306, 99307, 99308, 99309, 99310, 99315 | 7.1 |
| ECG‐related codes | 93000, 93010, 93042 | 2.5 |
| Routine venipuncture | 36415 | 1.0 |
| Other codes with f>0.1%* | 25 codes | 5.1 |
| Codes with f0.1% | 439 codes | 4.5 |
| Total | 495 codes | 100.0 |
DISCUSSION
Hospitalists make up approximately 5% of the practicing physicians nationwide, performing a critical role caring for hospitalized patients. Saint et al. defined a pure hospitalist as a physician who meets a 90% threshold of inpatient services.[2] This approach has been replicated in subsequent studies that used a 90% threshold to identify hospitalists.[5, 6] Our results with the same threshold reveal more than 28,000 hospitalists with nearly uniform practice patterns, a 10% growth in the number of hospitalists from the Welch et al. analysis in 2011.[6]
A threshold is not a perfect tool for identifying groups of practicing physicians, as it creates an arbitrary cutoff within a dataset. Undoubtedly our analysis could include providers who would not consider themselves hospitalists, or alternatively, appear to have a hospital‐based practice when they do not. Our results suggest that a 90% threshold may identify a majority of practicing hospitalists, but excludes providers who likely identify as hospitalists albeit with divergent practice and billing patterns.
A lower threshold may be more inclusive of the current realities of hospitalist practice, accounting for the myriad other services provided during, immediately prior to, or following a hospitalization. With hospitalists commonly practicing in diverse facility settings, rotating through rehabilitation or nursing home facilities, discharge clinics, and preoperative medicine practices, the continued use of a 90% threshold appears to exclude a sizable number of practicing hospitalists.
In the absence of a formal identifier, developing identification methodologies that account for the diversity of hospitalist practice is crucial. As physician payment transitions to value‐based reimbursement, systems must have the ability to account for and allocate the most efficient mix of providers for their patient populations. Because provider alignment and coordination are structural features of these programs, these systems‐based changes in effect require accurate identification of hospitalists, yet currently lack the tools to do so.
Disclosures
The research reported here was supported by the Department of Veterans Affairs, Veterans Health Administration. Investigator salary support is provided through the South Texas Veterans Health Care System. The views expressed in this article are those of the authors and do not necessarily reflect the position or policy of the Department of Veterans Affairs. The authors report no conflicts of interest.
Pediatric Admission and Readmission
Patient outcomes tend to be worse for adults admitted on the weekend compared to the weekday.[1, 2, 3, 4] In pediatric populations, urgent surgeries on weekends are associated with increased morbidity and mortality[5]; however, studies of mortality and admission timing in the pediatric critical care setting are mixed.[6, 7] Hospital readmission is considered a potential marker of hospital quality. We hypothesized that (1) being admitted and (2) being discharged on the weekend would adversely affect 30‐day unplanned readmission for pediatric patients.
METHODS
Population
All discharges from January 1, 2006 through December 31, 2012 from C. S. Mott Children's Hospital were initially eligible. All hospitalizations were considered potential index admissions; therefore, children may contribute more than 1 hospitalization to the dataset. We excluded hospitalizations in which the patient died, was transferred to another institution, was discharged against medical advice, or was discharged to hospice. Newborns admitted to a normal newborn service were also excluded, as they do not represent a typical hospitalization for illness. Among newborns admitted to a higher‐intensity clinical service (eg, special care nursery or neonatal intensive care), we also excluded newborns with a length of stay 5 days, given the typical length of stay of up to 4 days for uncomplicated delivery via Cesarean section that would indicate infants for whom precautionary measures had been taken but there was low estimated health risk. We used International Classification of Diseases, Ninth Revision codes to identify children with complex chronic conditions (CCCs) and technology dependency.[8]
Outcome
We examined unplanned readmission within 30 days of discharge. We defined unplanned readmission as a readmission that was not entered into the hospital registration system at least 24 hours before discharge.[9] Additionally, we performed sensitive analyses examining any 30‐day readmissions.
Statistical Analysis
We fit multivariable logistic regression models for 30‐day unplanned readmission, with the primary predictor of either weekend (Saturday or Sunday) admission or weekend discharge (in separate models). We adjusted for patient age, gender, race/ethnicity, source of admission, insurance, and length of stay. We also adjusted for patient chronic illness complexity using the number of CCCs and technology dependency (yes/no). Variance in all analyses was clustered on individual patients.
RESULTS
We included a total of 55,383 hospitalizations from 32,112 patients (see Supporting Appendix Figure in the online version of this article for cohort derivation). All‐cause 30‐day readmissions occurred in 14.9% of hospital discharges; the 30‐day unplanned readmission rate was 10.3% (see the Supporting Appendix Table in the online version of this article for demographic characteristics).
Weekend Admission
Overall, 82% of admissions occurred during the week, with Tuesday as the highest admitting volume day (Figure 1). Children admitted on the weekend had higher odds of unplanned readmission compared to children admitted on weekdays (unadjusted odds ratio [OR]=1.15 [95% confidence interval {CI}: 1.07‐1.24]). Adjusting the analysis for age, gender, race/ethnicity, insurance, length of stay, CCCs, and technology dependency, higher odds of readmission remains significantly higher than weekday admission (adjusted OR=1.09 [95% CI: 1.004‐1.18]) (Table 1). Age, admission source, payer, length of stay, number of complex chronic conditions, and technology dependency were also significantly associated with readmission in the weekend admission model (see the Supporting Appendix Table in the online version of this article). A sensitivity analysis examining the association of weekend admission and readmission within different subpopulations of children with varying numbers of CCCs (ie, among children without CCCs, with 1 CCC, 2 CCCs, and 3+ CCCs) showed that the association remains the same in each subgroup. Further, a sensitivity analysis examining odds of any 30‐day readmission was similar to the primary analysis with higher odds of readmission in adjusted analysis (adjusted OR=1.09 [95% CI: 1.02‐1.18]).
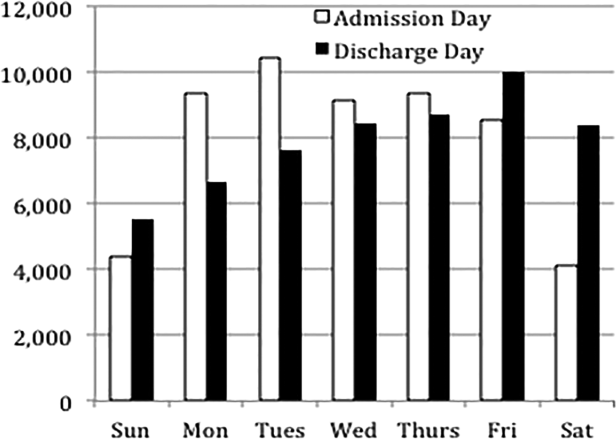
| 30‐Day Unplanned Readmission Rate | Unadjusted Odds of Unplanned Readmission (95% CI) | Weekend Admission Model: Adjusted Odds of Unplanned Readmission (95% CI) | Weekend Discharge Model: Adjusted Odds of Unplanned Readmission (95% CI) | |
|---|---|---|---|---|
| ||||
| Weekend admission, n=7,533 | 11.4%, n=973 | 1.15 (1.07‐1.24)* | 1.09 (1.004‐1.18)* | |
| Weekend discharge, n=13,911 | 9.7%, n=1,344 | 0.91 (0.85‐0.97)* | 0.97 (0.91‐1.04) | |
Weekend Discharge
Weekend discharges accounted for 34% of all discharges. Fridays had the highest discharge volumes, with lowest discharge volumes on Sunday (Figure 1). Children discharged on the weekend had lower odds of unplanned readmission compared to children discharged on weekdays in bivariate analysis (unadjusted OR=0.91 [95% CI: 0.85‐0.97]). However, when adjusting for important confounders, the relationship was no longer statistically significant (adjusted OR=0.97 [95% CI: 0.91‐1.03]) (Table 1). Age, admission source, payer, length of stay, and number of complex chronic conditions were associated with readmission in the weekend discharge model (see the Supporting Appendix Table in the online version of this article). In a sensitivity analysis examining any 30‐day readmission, weekend discharge was not associated with readmission in adjusted analysis.
DISCUSSION
Although the so‐called weekend effect has been established in adults,[1, 2, 3, 4] evidence is mixed for children. In this sample, where the 30‐day pediatric readmission rate is consistent with national pediatric rates,[10] pediatric patients admitted on the weekend have higher odds of readmission compared to children admitted during the week, even when accounting for patient characteristics and hospital length of stay. In contrast, weekend discharge was not associated with readmission.
The association of weekend admission and subsequent readmission is intriguing and may be interpreted in 1 of 2 ways: either patients admitted on the weekend are fundamentally different and thus have higher readmission rates, or care on the weekend is different. It is important to note that we adjusted the analysis for patient characteristics including number of CCCs and technology dependency to account for differences in chronic illness. We also accounted for length of stay as a marker of severity of illness in the hospital. Yet even accounting for these known differences, we cannot discern from these data if the different outcomes for children admitted on the weekend are related to residual population differences (eg, lack of access to primary care or walk‐in clinics) or differences in initial clinical management on the weekend.
Initial clinical management on weekend may be different due to differences in physician, nursing, and other ancillary staffing affecting availability of diagnostic and therapeutic interventions. Additionally, smaller staff size on the weekend may lead to increased workload. Although we are unable to directly measure resident workload in our study, prior studies suggest higher workload is associated with worse outcomes for adult patients,[11] including readmission.[12] Additionally, nurse staffing, which may vary based on day of week, has been associated with pediatric readmission.[13]
Discharge timing in our population is consistent with prior literature, with Friday being the most common discharge day of week.[14] Prior literature has shown no difference in readmission rates between Friday discharge and midweek discharge for pediatric patients.[14] Our work builds on this existing literature, demonstrating no association with weekend discharge and readmission. There were lower discharge volumes on the weekends, particularly in patients with more CCCs, suggesting that physicians avoid complicated discharges on Saturday and Sunday.
This study should be interpreted in the context of several limitations. First, this study was conducted at a single tertiary care pediatric institution. Our patient population had a high rate of children with CCCs, potentially limiting generalizability to other pediatric institutions. Ideally, we would adjust our model for clusters at the clinical service or attending physician level; however, the heterogeneity of our services and data limits prohibited these analyses. Readmissions that may have occurred at other institutions are not observable in this dataset; however, there is no reason to believe patients admitted or discharged on the weekend would have different rates of other hospital readmissions than patients admitted or discharged on weekdays. Additionally, early readmissions may be particularly affected by in‐hospital and discharge factors.[15] However, the very low rate of early readmission prohibited limiting the analyses to early readmission. Finally, we relied on administrative data to adjust for patient severity using typical methods such as CCCs; however, other patient differences may have existed beyond those that could be captured with administrative data.
CONCLUSION
Children admitted to the hospital on the weekend have higher rates of 30‐day unplanned readmission than children admitted during the week, suggesting differences of care in initial management on the weekend. Understanding this difference from the perspectives of multiple stakeholders may illuminate potential reasons for this disparity.
Disclosures
Dr. Auger received salary support from the Robert Wood Johnson Foundation Clinical Scholars program during work on this project. The hospital database was assembled with funds from a grant from the Blue Cross Blue Shield of Michigan Foundation. The authors report no conflicts of interest.
- , , , . A comparison of in‐hospital mortality risk conferred by high hospital occupancy, differences in nurse staffing levels, weekend admission, and seasonal influenza. Med Care. 2010;48(3):224–232.
- , . Mortality among patients admitted to hospitals on weekends as compared with weekdays. N Engl J Med. 2001;345(9):663–668.
- , , , . Effects of weekend admission and hospital teaching status on in‐hospital mortality. Am J Med. 2004;117(3):151–157.
- , , . Weekend admission for myocardial infarction. N Engl J Med. 2007;357(1):86–87; author reply 87–88.
- , , , et al. The "weekend effect" in pediatric surgery—increased mortality for children undergoing urgent surgery during the weekend. J Pediatr Surg. 2014;49(7):1087–1091.
- , , , , , Paediatric Intensive Care Audit Network (PICANet). Effects of out‐of‐hours and winter admissions and number of patients per unit on mortality in pediatric intensive care. J Pediatr. 2013;163(4):1039–1044.e1035.
- , , , . Do weekends or evenings matter in a pediatric intensive care unit? Pediatr Crit Care Med. 2005;6(5):523–530.
- , , , , . Pediatric complex chronic conditions classification system version 2: updated for ICD‐10 and complex medical technology dependence and transplantation. BMC Pediatr. 2014;14:199.
- , , , et al. Using hospital designation to identify unplanned pediatric readmissions [abstract]. J Hosp Med. Available at: http://www.shmabstracts.com/abstract/using‐hospital‐designation‐to‐identify‐unplanned‐pediatric‐readmissions. Accessed July 15, 2015.
- , , , et al. Rates and impact of potentially preventable readmissions at children's hospitals. J Pediatr. 2015;166(3):613–619.e615.
- , , , , . House staff team workload and organization effects on patient outcomes in an academic general internal medicine inpatient service. Arch Intern Med. 2007;167(1):47–52.
- , . A "reverse july effect": association between timing of admission, medical team workload, and 30‐day readmission rate. J Grad Med Educ. 2014;6(1):65–70.
- , , , , . An observational study of nurse staffing ratios and hospital readmission among children admitted for common conditions. BMJ Qual Saf. 2013;22(9):735–742.
- , , , , . Day of discharge and hospital readmission rates within 30 days in children: a population‐based study. Paediatr Child Health. 2006;11(7):409–412.
- , , , , . Differences between early and late readmissions among patients: a cohort study. Ann Intern Med. 2015;162(11):741–749.
Patient outcomes tend to be worse for adults admitted on the weekend compared to the weekday.[1, 2, 3, 4] In pediatric populations, urgent surgeries on weekends are associated with increased morbidity and mortality[5]; however, studies of mortality and admission timing in the pediatric critical care setting are mixed.[6, 7] Hospital readmission is considered a potential marker of hospital quality. We hypothesized that (1) being admitted and (2) being discharged on the weekend would adversely affect 30‐day unplanned readmission for pediatric patients.
METHODS
Population
All discharges from January 1, 2006 through December 31, 2012 from C. S. Mott Children's Hospital were initially eligible. All hospitalizations were considered potential index admissions; therefore, children may contribute more than 1 hospitalization to the dataset. We excluded hospitalizations in which the patient died, was transferred to another institution, was discharged against medical advice, or was discharged to hospice. Newborns admitted to a normal newborn service were also excluded, as they do not represent a typical hospitalization for illness. Among newborns admitted to a higher‐intensity clinical service (eg, special care nursery or neonatal intensive care), we also excluded newborns with a length of stay 5 days, given the typical length of stay of up to 4 days for uncomplicated delivery via Cesarean section that would indicate infants for whom precautionary measures had been taken but there was low estimated health risk. We used International Classification of Diseases, Ninth Revision codes to identify children with complex chronic conditions (CCCs) and technology dependency.[8]
Outcome
We examined unplanned readmission within 30 days of discharge. We defined unplanned readmission as a readmission that was not entered into the hospital registration system at least 24 hours before discharge.[9] Additionally, we performed sensitive analyses examining any 30‐day readmissions.
Statistical Analysis
We fit multivariable logistic regression models for 30‐day unplanned readmission, with the primary predictor of either weekend (Saturday or Sunday) admission or weekend discharge (in separate models). We adjusted for patient age, gender, race/ethnicity, source of admission, insurance, and length of stay. We also adjusted for patient chronic illness complexity using the number of CCCs and technology dependency (yes/no). Variance in all analyses was clustered on individual patients.
RESULTS
We included a total of 55,383 hospitalizations from 32,112 patients (see Supporting Appendix Figure in the online version of this article for cohort derivation). All‐cause 30‐day readmissions occurred in 14.9% of hospital discharges; the 30‐day unplanned readmission rate was 10.3% (see the Supporting Appendix Table in the online version of this article for demographic characteristics).
Weekend Admission
Overall, 82% of admissions occurred during the week, with Tuesday as the highest admitting volume day (Figure 1). Children admitted on the weekend had higher odds of unplanned readmission compared to children admitted on weekdays (unadjusted odds ratio [OR]=1.15 [95% confidence interval {CI}: 1.07‐1.24]). Adjusting the analysis for age, gender, race/ethnicity, insurance, length of stay, CCCs, and technology dependency, higher odds of readmission remains significantly higher than weekday admission (adjusted OR=1.09 [95% CI: 1.004‐1.18]) (Table 1). Age, admission source, payer, length of stay, number of complex chronic conditions, and technology dependency were also significantly associated with readmission in the weekend admission model (see the Supporting Appendix Table in the online version of this article). A sensitivity analysis examining the association of weekend admission and readmission within different subpopulations of children with varying numbers of CCCs (ie, among children without CCCs, with 1 CCC, 2 CCCs, and 3+ CCCs) showed that the association remains the same in each subgroup. Further, a sensitivity analysis examining odds of any 30‐day readmission was similar to the primary analysis with higher odds of readmission in adjusted analysis (adjusted OR=1.09 [95% CI: 1.02‐1.18]).
| 30‐Day Unplanned Readmission Rate | Unadjusted Odds of Unplanned Readmission (95% CI) | Weekend Admission Model: Adjusted Odds of Unplanned Readmission (95% CI) | Weekend Discharge Model: Adjusted Odds of Unplanned Readmission (95% CI) | |
|---|---|---|---|---|
| ||||
| Weekend admission, n=7,533 | 11.4%, n=973 | 1.15 (1.07‐1.24)* | 1.09 (1.004‐1.18)* | |
| Weekend discharge, n=13,911 | 9.7%, n=1,344 | 0.91 (0.85‐0.97)* | 0.97 (0.91‐1.04) | |
Weekend Discharge
Weekend discharges accounted for 34% of all discharges. Fridays had the highest discharge volumes, with lowest discharge volumes on Sunday (Figure 1). Children discharged on the weekend had lower odds of unplanned readmission compared to children discharged on weekdays in bivariate analysis (unadjusted OR=0.91 [95% CI: 0.85‐0.97]). However, when adjusting for important confounders, the relationship was no longer statistically significant (adjusted OR=0.97 [95% CI: 0.91‐1.03]) (Table 1). Age, admission source, payer, length of stay, and number of complex chronic conditions were associated with readmission in the weekend discharge model (see the Supporting Appendix Table in the online version of this article). In a sensitivity analysis examining any 30‐day readmission, weekend discharge was not associated with readmission in adjusted analysis.
DISCUSSION
Although the so‐called weekend effect has been established in adults,[1, 2, 3, 4] evidence is mixed for children. In this sample, where the 30‐day pediatric readmission rate is consistent with national pediatric rates,[10] pediatric patients admitted on the weekend have higher odds of readmission compared to children admitted during the week, even when accounting for patient characteristics and hospital length of stay. In contrast, weekend discharge was not associated with readmission.
The association of weekend admission and subsequent readmission is intriguing and may be interpreted in 1 of 2 ways: either patients admitted on the weekend are fundamentally different and thus have higher readmission rates, or care on the weekend is different. It is important to note that we adjusted the analysis for patient characteristics including number of CCCs and technology dependency to account for differences in chronic illness. We also accounted for length of stay as a marker of severity of illness in the hospital. Yet even accounting for these known differences, we cannot discern from these data if the different outcomes for children admitted on the weekend are related to residual population differences (eg, lack of access to primary care or walk‐in clinics) or differences in initial clinical management on the weekend.
Initial clinical management on weekend may be different due to differences in physician, nursing, and other ancillary staffing affecting availability of diagnostic and therapeutic interventions. Additionally, smaller staff size on the weekend may lead to increased workload. Although we are unable to directly measure resident workload in our study, prior studies suggest higher workload is associated with worse outcomes for adult patients,[11] including readmission.[12] Additionally, nurse staffing, which may vary based on day of week, has been associated with pediatric readmission.[13]
Discharge timing in our population is consistent with prior literature, with Friday being the most common discharge day of week.[14] Prior literature has shown no difference in readmission rates between Friday discharge and midweek discharge for pediatric patients.[14] Our work builds on this existing literature, demonstrating no association with weekend discharge and readmission. There were lower discharge volumes on the weekends, particularly in patients with more CCCs, suggesting that physicians avoid complicated discharges on Saturday and Sunday.
This study should be interpreted in the context of several limitations. First, this study was conducted at a single tertiary care pediatric institution. Our patient population had a high rate of children with CCCs, potentially limiting generalizability to other pediatric institutions. Ideally, we would adjust our model for clusters at the clinical service or attending physician level; however, the heterogeneity of our services and data limits prohibited these analyses. Readmissions that may have occurred at other institutions are not observable in this dataset; however, there is no reason to believe patients admitted or discharged on the weekend would have different rates of other hospital readmissions than patients admitted or discharged on weekdays. Additionally, early readmissions may be particularly affected by in‐hospital and discharge factors.[15] However, the very low rate of early readmission prohibited limiting the analyses to early readmission. Finally, we relied on administrative data to adjust for patient severity using typical methods such as CCCs; however, other patient differences may have existed beyond those that could be captured with administrative data.
CONCLUSION
Children admitted to the hospital on the weekend have higher rates of 30‐day unplanned readmission than children admitted during the week, suggesting differences of care in initial management on the weekend. Understanding this difference from the perspectives of multiple stakeholders may illuminate potential reasons for this disparity.
Disclosures
Dr. Auger received salary support from the Robert Wood Johnson Foundation Clinical Scholars program during work on this project. The hospital database was assembled with funds from a grant from the Blue Cross Blue Shield of Michigan Foundation. The authors report no conflicts of interest.
- , , , . A comparison of in‐hospital mortality risk conferred by high hospital occupancy, differences in nurse staffing levels, weekend admission, and seasonal influenza. Med Care. 2010;48(3):224–232.
- , . Mortality among patients admitted to hospitals on weekends as compared with weekdays. N Engl J Med. 2001;345(9):663–668.
- , , , . Effects of weekend admission and hospital teaching status on in‐hospital mortality. Am J Med. 2004;117(3):151–157.
- , , . Weekend admission for myocardial infarction. N Engl J Med. 2007;357(1):86–87; author reply 87–88.
- , , , et al. The "weekend effect" in pediatric surgery—increased mortality for children undergoing urgent surgery during the weekend. J Pediatr Surg. 2014;49(7):1087–1091.
- , , , , , Paediatric Intensive Care Audit Network (PICANet). Effects of out‐of‐hours and winter admissions and number of patients per unit on mortality in pediatric intensive care. J Pediatr. 2013;163(4):1039–1044.e1035.
- , , , . Do weekends or evenings matter in a pediatric intensive care unit? Pediatr Crit Care Med. 2005;6(5):523–530.
- , , , , . Pediatric complex chronic conditions classification system version 2: updated for ICD‐10 and complex medical technology dependence and transplantation. BMC Pediatr. 2014;14:199.
- , , , et al. Using hospital designation to identify unplanned pediatric readmissions [abstract]. J Hosp Med. Available at: http://www.shmabstracts.com/abstract/using‐hospital‐designation‐to‐identify‐unplanned‐pediatric‐readmissions. Accessed July 15, 2015.
- , , , et al. Rates and impact of potentially preventable readmissions at children's hospitals. J Pediatr. 2015;166(3):613–619.e615.
- , , , , . House staff team workload and organization effects on patient outcomes in an academic general internal medicine inpatient service. Arch Intern Med. 2007;167(1):47–52.
- , . A "reverse july effect": association between timing of admission, medical team workload, and 30‐day readmission rate. J Grad Med Educ. 2014;6(1):65–70.
- , , , , . An observational study of nurse staffing ratios and hospital readmission among children admitted for common conditions. BMJ Qual Saf. 2013;22(9):735–742.
- , , , , . Day of discharge and hospital readmission rates within 30 days in children: a population‐based study. Paediatr Child Health. 2006;11(7):409–412.
- , , , , . Differences between early and late readmissions among patients: a cohort study. Ann Intern Med. 2015;162(11):741–749.

Improving Anticoagulation Transitions
Anticoagulants are among the prescriptions with the highest risk of an adverse drug event (ADE) after discharge, and many of these events are preventable.[1, 2, 3] In recognition of the high risk for adverse events, the Institute for Healthcare Improvement Map details several key features of a safe anticoagulation management program, including the recommendation during the transition period that clinicians ensure proper lab monitoring and establish capacity for follow‐up testing.[4]
Despite the potential for harm, most hospitals do not have a structured process for the transmission of vital information related to warfarin management from the inpatient to the ambulatory setting. Our aim was to develop a concise report containing the essential information regarding the patient's anticoagulation regimen, the Safe Transitions Anticoagulation Report (STAR), and a process to ensure the report can be readily accessed and utilized by ambulatory clinicians.
METHODS
We assembled an interdisciplinary team to develop a new report and workflow to ensure that information on inpatient warfarin management was transmitted to outpatient providers in a reliable and structured manner. Explicit goals were to maximize use of the electronic medical record (EMR) to autopopulate aspects of the new report and create a process that worked seamlessly into the workflow. The final items were selected based on the risk of harm if not conveyed and feasibility of incorporation through the EMR:
- Warfarin doses: the 7 warfarin doses immediately prior to discharge
- International normalized ratio (INR) values: the 7 INR values immediately prior to discharge
- Bridging anticoagulation: the low‐molecular‐weight heparin (LMWH) prescribed as a bridging anticoagulant, if any
The STAR resides in both the discharge summary and the after visit summary (AVS) for patients discharged on warfarin. At our institution, the AVS contains a medication list, discharge instructions, and appointments, and is automatically produced through our EMR. Our institution utilizes the Epic EMR (Epic Systems Corp., Verona, WI) in the hospital, ambulatory clinics, and faculty practices.
A process was developed where a structured table is automatically created (Figure 1). A field was added to our EMR's discharge summary template asking whether the patient is being discharged on warfarin. Answering yes produces a second question asking whether the patient is also being discharged on bridging anticoagulation with LMWH. The STAR is not inserted into the discharge summary if the clinician completing the discharge summary deletes the anticoagulation question. The STAR is automatically created for patients discharged on warfarin and inserted into the AVS by the EMR regardless of whether the discharge summary has been completed. Patients are instructed by their nurse to bring their AVS to their follow‐up appointments.

The STAR project team utilized plan‐do‐study‐act cycles to test small changes and make revisions. The workflow was piloted on 2 medical/surgical units from January 2014 through March 2014, and revised based on feedback from clinicians and nursing staff. The STAR initiative was fully implemented across our institution in April 2014.
The study was evaluated by the institutional review board of the Icahn School of Medicine at Mount Sinai, and full review was waived.
Outcomes
Our primary outcomes were the timeliness of laboratory monitoring and quality of anticoagulation management for patients with an established relationship at 1 of the main outpatient practices in our system. Our institution has an anticoagulation clinic for patients followed at the general medicine clinic. We defined an established relationship as having been seen in the same practice on at least 2 occasions in the 12 months prior to admission. The primary outcomes were the percentage of patients who had an INR measurement done and the percentage who had a therapeutic INR value within 10 days after discharge. As the 10‐day period is arbitrary, we also assessed these outcomes for the 3‐, 7‐, and 30‐day periods after discharge. The therapeutic range was defined for all patients as an INR of 2.0 to 3.0, as this is the target range for the large majority of patients on warfarin in our system. Outcomes during the intervention period were compared to baseline values during the preintervention period. For patients with multiple admissions, the first admission during each period was included.
Ambulatory Physician Survey
We surveyed ambulatory care physicians at the main practices for our health system. The survey assessed how often the STAR was viewed and incorporated into decision making, whether the report improved workflow, and whether ambulatory providers perceived that the report increased patient safety. The survey was distributed at the 6‐month interval during the intervention phase. The survey was disseminated electronically on 3 occasions, and a paper version was distributed on 1 occasion to housestaff and general medicine faculty.
Statistical Analysis
Comparisons for categorical data were performed using the 2 test. P values were based on 2‐tailed tests of significance, and a value 0.05 was considered significant.
RESULTS
The STAR was embedded in the discharge summary for 1370 (78.6%) discharges during the intervention period. A total of 505 patients in the preintervention period and 292 patients in the intervention period were established patients at an affiliated practice and comprised the study population. Demographics and indications for warfarin for the preintervention and intervention groups are listed in the Table 1.
| Preintervention Group, N=505 | Intervention Group, N=292 | P Value | |
|---|---|---|---|
| |||
| Age, y | 66.7 | 68.0 | 0.29 |
| Male gender, n (%) | 236 (46.7) | 153 (52.4) | 0.12 |
| Discharged on bridging agent, n (%) | 90 (17.8) | 36 (12.3) | 0.04 |
| Average length of stay, d | 7.1 | 7.6 | 0.46 |
| Newly prescribed warfarin, n (%) | 147 (29.1) | 62 (21.2) | 0.01 |
| INR 2.03.0 range at discharge, n (%) | 187 (37.0) | 137 (46.9) | 0.02 |
| Warfarin indication, n (%)* | |||
| Venous thromboembolism | 93 (18.4) | 39 (13.4) | |
| Atrial fibrillation | 204 (40.3) | 127 (43.5) | |
| Mechanical heart valve | 19 (3.8) | 17 (6.5) | |
| Prevention of thromboembolism | 142 (28.1) | 94 (32.2) | |
| Intracardiac thrombosis | 3 (0.5) | 6 (2.1) | |
| Thrombophilia | 4 (0.8) | 5 (1.7) | |
| Other | 19 (3.8) | 12 (4.1) | |
| No indication | 32 (6.3) | 1 (3.8) | |
The frequency of INR testing within 10 days of discharge was similar for the preintervention and intervention periods (41.4% and 47.6%, respectively, P=0.09). Similarly, the likelihood of having at least 1 therapeutic INR value within 10 days of discharge was not statistically different for the groups (17.0% and 21.2%, P=0.14). The pattern was similar for the 3‐, 7‐, and 30‐day periods; a higher percentage of the intervention group had INR testing and attained a therapeutic INR value, though for no time period did this reach statistical significance. This pattern was also found when limiting the analysis to patients discharged home rather than to a facility, patients on warfarin, prior to admission, and patients started on warfarin during the hospitalization.
A total of 87of 207 (42.0%) clinicians responded to the survey. Of respondents, 75% reported that they had seen 1 patient who had been discharged on warfarin since the STAR initiative had begun, 58% of whom reported having viewed the STAR. Most respondents who viewed the STAR found it to be helpful or very helpful in guiding warfarin management (67%), improving their workflow and efficiency (58%), and improving patient safety (77%). Approximately one‐third of respondents who had viewed the STAR (34%) reported that they selected a different dose than they would have chosen had the STAR not been available.
DISCUSSION
We developed a concise report that is seamlessly created and inserted into the discharge summary. Though the STAR was perceived as improving patient safety by ambulatory care providers, there was no impact on attaining a therapeutic INR after discharge. There are several possible explanations for a lack of benefit. Most notably, our intervention was comprised of a stand‐alone EMR‐based tool and focused on 1 component of the transitions process. Given the complexity of healthcare delivery and anticoagulant management, it is likely that broader interventions are required to improve clinical outcomes over the transition period. Potential targets of multifaceted approaches may include improving access to care, providing greater access to anticoagulation clinics, enhancing patient education, and promoting direct physician‐physician communication. Bundled interventions will likely need to include involvement of an interdisciplinary team, such as pharmacist involvement in the medication reconciliation process.
The transition period from the hospital to the outpatient setting has the potential to jeopardize patient safety if vital information is not reliably transmitted across venues.[5, 6, 7, 8] Forster and colleagues noted an 11% incidence of ADEs in the posthospitalization period, of which 60% were either preventable or ameliorable.[3] To decrease the risk to patient safety during the transitions period, the Transitions of Care Consensus policy statement by the Society of Hospital Medicine and other medical organizations called for incorporation of standard data transfer forms (templates and transmission protocols).[9] Despite the high risk and preventable nature of many of the events, few specific tools have been developed. As part of broader initiatives to improve the transitions process, the STAR may have the potential to be a means for health systems to improve the quality of the transition of care for patients on anticoagulants.
Our study has several limitations. First, it was performed at a single health system. It is unknown whether the EMR‐based report could be similarly employed at other systems. Second, our study was unable to assess clinical endpoints. Given the lack of effect on attaining a therapeutic INR, it is unlikely that downstream outcomes, such as thromboembolism, were impacted. Lastly, we were unable to examine whether our intervention improved the care of patients whose outpatient provider was external to our system.
The STAR is a concise tool developed to provide essential anticoagulant‐related information to ambulatory providers. Though the report was perceived as improving patient safety, our finding of a lack of impact on attaining a therapeutic INR after discharge suggests that the tool would need to be a component of a broader multifaceted intervention to impact clinical outcomes.
Disclosures
This project was funded by a grant from the Cardinal Health E3 Foundation. The authors report no conflicts of interest.
- , , , Medication errors: experience of the United States Pharmacopeia (USP) MEDMARX reporting system. J Clin Pharm. 2003;43:760–767.
- , , , , The incidence and severity of adverse events affecting patients after discharge from the hospital. Ann Intern Med. 2003;138:161–167.
- , , , , Adverse drug events occurring following hospital discharge. J Gen Int Med. 2005;204:317–323.
- IHI Improvement Map. Available at: http://app.ihi.org/imap/tool/#Process=54aa289b‐16fd‐4a64‐8329‐3941dfc565d1. Accessed February 20 2015.
- , , , Promoting effective transitions of care at hospital discharge: a review of key issues for hospitalists. J Hosp Med. 2007;2:314–323.
- , , , , , Deficits in communication and information transfer between hospital‐based and primary care physicians: implications for patient safety and continuity of care. JAMA. 2007;297:831–841.
- Transitions of care in patients receiving oral anticoagulants: general principles, procedures, and impact of new oral anticoagulants. J Cardiovasc Nurs. 2013;28:54–65.
- Care transitions in anticoagulation management for patients with atrial fibrillation: an emphasis on safety. Oschner J. 2013;13:419–427.
- , , , et al. Transitions of Care Consensus policy statement: American College of Physicians, Society of General Internal Medicine, Society of Hospital Medicine, American Geriatrics Society, American College Of Emergency Physicians, and Society for Academic Emergency Medicine. J Hosp Med. 2009;4:364–370.
Anticoagulants are among the prescriptions with the highest risk of an adverse drug event (ADE) after discharge, and many of these events are preventable.[1, 2, 3] In recognition of the high risk for adverse events, the Institute for Healthcare Improvement Map details several key features of a safe anticoagulation management program, including the recommendation during the transition period that clinicians ensure proper lab monitoring and establish capacity for follow‐up testing.[4]
Despite the potential for harm, most hospitals do not have a structured process for the transmission of vital information related to warfarin management from the inpatient to the ambulatory setting. Our aim was to develop a concise report containing the essential information regarding the patient's anticoagulation regimen, the Safe Transitions Anticoagulation Report (STAR), and a process to ensure the report can be readily accessed and utilized by ambulatory clinicians.
METHODS
We assembled an interdisciplinary team to develop a new report and workflow to ensure that information on inpatient warfarin management was transmitted to outpatient providers in a reliable and structured manner. Explicit goals were to maximize use of the electronic medical record (EMR) to autopopulate aspects of the new report and create a process that worked seamlessly into the workflow. The final items were selected based on the risk of harm if not conveyed and feasibility of incorporation through the EMR:
- Warfarin doses: the 7 warfarin doses immediately prior to discharge
- International normalized ratio (INR) values: the 7 INR values immediately prior to discharge
- Bridging anticoagulation: the low‐molecular‐weight heparin (LMWH) prescribed as a bridging anticoagulant, if any
The STAR resides in both the discharge summary and the after visit summary (AVS) for patients discharged on warfarin. At our institution, the AVS contains a medication list, discharge instructions, and appointments, and is automatically produced through our EMR. Our institution utilizes the Epic EMR (Epic Systems Corp., Verona, WI) in the hospital, ambulatory clinics, and faculty practices.
A process was developed where a structured table is automatically created (Figure 1). A field was added to our EMR's discharge summary template asking whether the patient is being discharged on warfarin. Answering yes produces a second question asking whether the patient is also being discharged on bridging anticoagulation with LMWH. The STAR is not inserted into the discharge summary if the clinician completing the discharge summary deletes the anticoagulation question. The STAR is automatically created for patients discharged on warfarin and inserted into the AVS by the EMR regardless of whether the discharge summary has been completed. Patients are instructed by their nurse to bring their AVS to their follow‐up appointments.
The STAR project team utilized plan‐do‐study‐act cycles to test small changes and make revisions. The workflow was piloted on 2 medical/surgical units from January 2014 through March 2014, and revised based on feedback from clinicians and nursing staff. The STAR initiative was fully implemented across our institution in April 2014.
The study was evaluated by the institutional review board of the Icahn School of Medicine at Mount Sinai, and full review was waived.
Outcomes
Our primary outcomes were the timeliness of laboratory monitoring and quality of anticoagulation management for patients with an established relationship at 1 of the main outpatient practices in our system. Our institution has an anticoagulation clinic for patients followed at the general medicine clinic. We defined an established relationship as having been seen in the same practice on at least 2 occasions in the 12 months prior to admission. The primary outcomes were the percentage of patients who had an INR measurement done and the percentage who had a therapeutic INR value within 10 days after discharge. As the 10‐day period is arbitrary, we also assessed these outcomes for the 3‐, 7‐, and 30‐day periods after discharge. The therapeutic range was defined for all patients as an INR of 2.0 to 3.0, as this is the target range for the large majority of patients on warfarin in our system. Outcomes during the intervention period were compared to baseline values during the preintervention period. For patients with multiple admissions, the first admission during each period was included.
Ambulatory Physician Survey
We surveyed ambulatory care physicians at the main practices for our health system. The survey assessed how often the STAR was viewed and incorporated into decision making, whether the report improved workflow, and whether ambulatory providers perceived that the report increased patient safety. The survey was distributed at the 6‐month interval during the intervention phase. The survey was disseminated electronically on 3 occasions, and a paper version was distributed on 1 occasion to housestaff and general medicine faculty.
Statistical Analysis
Comparisons for categorical data were performed using the 2 test. P values were based on 2‐tailed tests of significance, and a value 0.05 was considered significant.
RESULTS
The STAR was embedded in the discharge summary for 1370 (78.6%) discharges during the intervention period. A total of 505 patients in the preintervention period and 292 patients in the intervention period were established patients at an affiliated practice and comprised the study population. Demographics and indications for warfarin for the preintervention and intervention groups are listed in the Table 1.
| Preintervention Group, N=505 | Intervention Group, N=292 | P Value | |
|---|---|---|---|
| |||
| Age, y | 66.7 | 68.0 | 0.29 |
| Male gender, n (%) | 236 (46.7) | 153 (52.4) | 0.12 |
| Discharged on bridging agent, n (%) | 90 (17.8) | 36 (12.3) | 0.04 |
| Average length of stay, d | 7.1 | 7.6 | 0.46 |
| Newly prescribed warfarin, n (%) | 147 (29.1) | 62 (21.2) | 0.01 |
| INR 2.03.0 range at discharge, n (%) | 187 (37.0) | 137 (46.9) | 0.02 |
| Warfarin indication, n (%)* | |||
| Venous thromboembolism | 93 (18.4) | 39 (13.4) | |
| Atrial fibrillation | 204 (40.3) | 127 (43.5) | |
| Mechanical heart valve | 19 (3.8) | 17 (6.5) | |
| Prevention of thromboembolism | 142 (28.1) | 94 (32.2) | |
| Intracardiac thrombosis | 3 (0.5) | 6 (2.1) | |
| Thrombophilia | 4 (0.8) | 5 (1.7) | |
| Other | 19 (3.8) | 12 (4.1) | |
| No indication | 32 (6.3) | 1 (3.8) | |
The frequency of INR testing within 10 days of discharge was similar for the preintervention and intervention periods (41.4% and 47.6%, respectively, P=0.09). Similarly, the likelihood of having at least 1 therapeutic INR value within 10 days of discharge was not statistically different for the groups (17.0% and 21.2%, P=0.14). The pattern was similar for the 3‐, 7‐, and 30‐day periods; a higher percentage of the intervention group had INR testing and attained a therapeutic INR value, though for no time period did this reach statistical significance. This pattern was also found when limiting the analysis to patients discharged home rather than to a facility, patients on warfarin, prior to admission, and patients started on warfarin during the hospitalization.
A total of 87of 207 (42.0%) clinicians responded to the survey. Of respondents, 75% reported that they had seen 1 patient who had been discharged on warfarin since the STAR initiative had begun, 58% of whom reported having viewed the STAR. Most respondents who viewed the STAR found it to be helpful or very helpful in guiding warfarin management (67%), improving their workflow and efficiency (58%), and improving patient safety (77%). Approximately one‐third of respondents who had viewed the STAR (34%) reported that they selected a different dose than they would have chosen had the STAR not been available.
DISCUSSION
We developed a concise report that is seamlessly created and inserted into the discharge summary. Though the STAR was perceived as improving patient safety by ambulatory care providers, there was no impact on attaining a therapeutic INR after discharge. There are several possible explanations for a lack of benefit. Most notably, our intervention was comprised of a stand‐alone EMR‐based tool and focused on 1 component of the transitions process. Given the complexity of healthcare delivery and anticoagulant management, it is likely that broader interventions are required to improve clinical outcomes over the transition period. Potential targets of multifaceted approaches may include improving access to care, providing greater access to anticoagulation clinics, enhancing patient education, and promoting direct physician‐physician communication. Bundled interventions will likely need to include involvement of an interdisciplinary team, such as pharmacist involvement in the medication reconciliation process.
The transition period from the hospital to the outpatient setting has the potential to jeopardize patient safety if vital information is not reliably transmitted across venues.[5, 6, 7, 8] Forster and colleagues noted an 11% incidence of ADEs in the posthospitalization period, of which 60% were either preventable or ameliorable.[3] To decrease the risk to patient safety during the transitions period, the Transitions of Care Consensus policy statement by the Society of Hospital Medicine and other medical organizations called for incorporation of standard data transfer forms (templates and transmission protocols).[9] Despite the high risk and preventable nature of many of the events, few specific tools have been developed. As part of broader initiatives to improve the transitions process, the STAR may have the potential to be a means for health systems to improve the quality of the transition of care for patients on anticoagulants.
Our study has several limitations. First, it was performed at a single health system. It is unknown whether the EMR‐based report could be similarly employed at other systems. Second, our study was unable to assess clinical endpoints. Given the lack of effect on attaining a therapeutic INR, it is unlikely that downstream outcomes, such as thromboembolism, were impacted. Lastly, we were unable to examine whether our intervention improved the care of patients whose outpatient provider was external to our system.
The STAR is a concise tool developed to provide essential anticoagulant‐related information to ambulatory providers. Though the report was perceived as improving patient safety, our finding of a lack of impact on attaining a therapeutic INR after discharge suggests that the tool would need to be a component of a broader multifaceted intervention to impact clinical outcomes.
Disclosures
This project was funded by a grant from the Cardinal Health E3 Foundation. The authors report no conflicts of interest.
- , , , Medication errors: experience of the United States Pharmacopeia (USP) MEDMARX reporting system. J Clin Pharm. 2003;43:760–767.
- , , , , The incidence and severity of adverse events affecting patients after discharge from the hospital. Ann Intern Med. 2003;138:161–167.
- , , , , Adverse drug events occurring following hospital discharge. J Gen Int Med. 2005;204:317–323.
- IHI Improvement Map. Available at: http://app.ihi.org/imap/tool/#Process=54aa289b‐16fd‐4a64‐8329‐3941dfc565d1. Accessed February 20 2015.
- , , , Promoting effective transitions of care at hospital discharge: a review of key issues for hospitalists. J Hosp Med. 2007;2:314–323.
- , , , , , Deficits in communication and information transfer between hospital‐based and primary care physicians: implications for patient safety and continuity of care. JAMA. 2007;297:831–841.
- Transitions of care in patients receiving oral anticoagulants: general principles, procedures, and impact of new oral anticoagulants. J Cardiovasc Nurs. 2013;28:54–65.
- Care transitions in anticoagulation management for patients with atrial fibrillation: an emphasis on safety. Oschner J. 2013;13:419–427.
- , , , et al. Transitions of Care Consensus policy statement: American College of Physicians, Society of General Internal Medicine, Society of Hospital Medicine, American Geriatrics Society, American College Of Emergency Physicians, and Society for Academic Emergency Medicine. J Hosp Med. 2009;4:364–370.
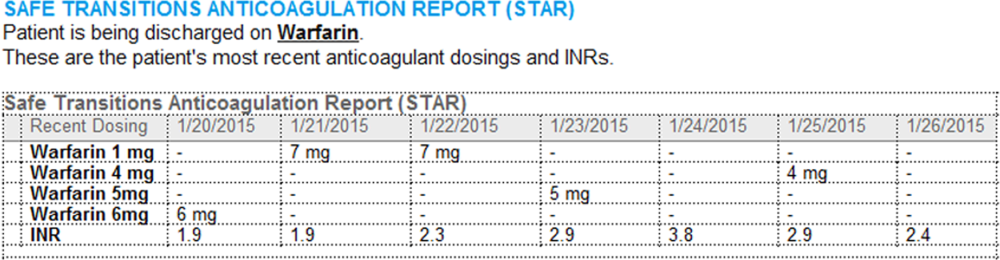
Primary Medication Nonadherence
Medication nonadherence after hospital discharge impacts morbidity and mortality in patients with cardiovascular disease.[1] Primary nonadherence, part of the spectrum of medication underuse, occurs when a patient receives a prescription but does not fill it.[1] Prior studies utilizing retrospective administrative data have found a prevalence of postdischarge primary nonadherence between 24% and 28%,[1, 2] similar to findings in a variety of outpatient populations.[3, 4]
One strategy for reduction in nonadherence is discharge medication counseling, which has been associated with improved postdischarge outcomes.[1] We evaluated the prevalence and predictors of refractory primary nonadherence in a cohort of patients hospitalized for acute cardiovascular conditions who received pharmacist counseling prior to discharge to guide future adherence interventions.
METHODS
Setting and Participants
The present study represents a secondary analysis of data from the Pharmacist Intervention for Low Literacy in Cardiovascular Disease (PILL‐CVD) study. PILL‐CVD was a randomized controlled trial that evaluated the effect of a tailored intervention consisting of pharmacist‐assisted medication reconciliation, discharge counseling, low‐literacy adherence aids, and follow‐up phone calls in adults hospitalized for acute coronary syndromes or acute decompensated heart failure. Patients likely to be discharged home taking primary responsibility for their medication management were eligible. Full study methods and results, including inclusion and exclusion criteria, can be found elsewhere.[5] The institutional review boards of each site approved the study.
For the present analysis, patients were included if they had any new discharge prescriptions to fill and received the study intervention, including a postdischarge follow‐up phone call with questions about filling discharge prescriptions.
Baseline Measures
Baseline data were obtained from medical records and patient interviews, including demographic information as well as survey data for cognitive impairment (Mini‐Cog) and health literacy (Short Test of Functional Health Literacy in Adults).[6, 7]
Data were also collected related to medication use, including the number of scheduled and as‐needed medications listed at discharge, self‐reported preadmission adherence, medication understanding, and medication management practices (eg, use of a pillbox, refill reminders). Self‐reported medication adherence was measured with the 4‐item Morisky scale.[8] Medication understanding was assessed with a tool previously developed by Marvanova et al.[9]
Outcome Measures
The primary outcome was the percentage of patients who reported not filling at least 1 discharge prescription on a telephone call that was conducted 1 to 4 days postdischarge. Patients were asked a dichotomous question about whether or not they filled all of their discharge prescriptions. Further characterization of the class or number of medications not filled was not performed. Patients were asked to provide a reason for not filling the prescriptions.
Analysis
We evaluated the prevalence and possible predictors of primary nonadherence including age, gender, race, marital status, education and income levels, insurance type, health literacy, cognition, presence of a primary care physician, number of listed discharge medications, prehospital medication adherence, medication understanding, and medication management practices using Pearson 2, Fisher exact, or Wilcoxon rank sum tests as appropriate. Multiple logistic regression with backward elimination was performed to identify independent predictors, selected with P values0.1. We also evaluated reasons that patients cited for not filling prescriptions. Two‐sided P values0.05 were considered statistically significant. All analyses were conducted using Stata version 13.1 (StataCorp LP, College Station, TX).
RESULTS
Of 851 patients in the PILL‐CVD study, the present sample includes 341 patients who received the intervention, completed the postdischarge follow‐up call, and had new discharge prescriptions to be filled. This represents 85% of patients who received the intervention.
The mean age of participants was 61.3 years, and 59.5% were male (Table 1). The majority were white (75.1%), and 88% had at least a high school education. Married or cohabitating patients represented 54.3% of the group. Just over half of the patients (54%) had an income of $35K or greater. The primary source of insurance for 82.5% of patients was either Medicare or private insurance, and 7.4% of patients were self‐pay. Most patients (80%) had adequate health literacy. The median Mini‐Cog score was 4 out of 5 (interquartile range [IQR]=35), and 11% of patients had scores indicating cognitive impairment. Just less than one‐fourth of the patients (24.1%) had a Morisky score of 8, indicating high self‐reported adherence, and the median score of patients' understanding of medications (range of 03) was 2.5 (IQR=2.22.8), reflecting relatively high understanding. The median number of prescriptions on patients' discharge medications lists was 10 (IQR=813).
| Variable | Overall 341 (100.0%) | Filled Prescription309 (90.6%) | Did Not Fill 32 (9.4%) | P Value |
|---|---|---|---|---|
| ||||
| Age, y, N (%) | 0.745a | |||
| 1849 | 69 | 63 (91.3) | 6 (8.7) | |
| 5064 | 128 | 114 (89.1) | 14 (10.9) | |
| 65+ | 144 | 132 (91.7) | 12 (8.3) | |
| Gender, N (%) | 0.056a | |||
| Male | 203 | 189 (93.1) | 14 (6.9) | |
| Female | 138 | 120 (87.0) | 18 (13.0) | |
| Race, N (%) | 0.712a | |||
| White | 256 | 234 (91.4) | 22 (8.6) | |
| African American | 60 | 54 (90.0) | 6 (10.0) | |
| Other | 22 | 19 (86.4) | 3 (13.6) | |
| Education, N (%) | 0.054a | |||
| Less than high school | 40 | 32 (80.0) | 8 (20.0) | |
| High school | 99 | 91 (91.9) | 8 (8.1) | |
| 1315 years | 93 | 83 (89.2) | 10 (10.8) | |
| 16 years | 109 | 103 (94.5) | 6 (5.5) | |
| Marital status, N (%) | ||||
| Separated/divorced/widowed/never married | 156 | 135 (86.5) | 21 (13.5) | 0.018a, b |
| Married/cohabitating | 185 | 174 (94.1) | 11 (5.9) | |
| Income, N (%) | 0.040a, b | |||
| 10K20K | 58 | 48 (82.8) | 10 (17.2) | |
| 20K35K | 86 | 76 (88.4) | 10 (11.6) | |
| 35K50K | 40 | 36 (90.0) | 4 (10.0) | |
| 50K75K | 46 | 43 (93.5) | 3 (6.5) | |
| 75K+ | 83 | 81 (97.6) | 2 (2.4) | |
| Primary source of payment, N (%) | 0.272a | |||
| Medicaid | 34 | 28 (82.4) | 6 (17.6) | |
| Medicare | 145 | 131 (90.3) | 14 (9.7) | |
| Private | 132 | 123 (93.2) | 9 (6.8) | |
| Self‐pay | 25 | 22 (88.0) | 3 (12.0) | |
| Primary care physician, N (%) | 1.000c | |||
| None/do not know | 28 | 26 (92.9) | 2 (7.1) | |
| Yes | 313 | 283 (90.4) | 30 (9.6) | |
| Site, N (%) | 0.071a | |||
| Nashville, TN | 172 | 151 (87.8) | 21 (12.2) | |
| Boston, MA | 169 | 158 (93.5) | 11 (6.5) | |
The prevalence of refractory primary nonadherence was 9.4%. In univariate analysis, single marital status, lower income, and having more than 10 total discharge medications were significantly associated with not filling medications (P=0.018, 0.04, 0.016, respectively; Table 1). In multivariable analysis, single marital status and having more than 10 total discharge medications maintained significance when controlling for other patient characteristics. Patients who were single had higher odds of failing to fill discharge prescriptions compared to married or cohabitating individuals (odds ratio [OR]: 2.2, 95% confidence interval [CI]: 1.014.8, P=0.047). Patients with more than 10 discharge medications also had higher odds of failing to fill compared with patients who had fewer total medications (OR: 2.3, 95% CI: 1.054.98, P=0.036).
Filling discharge prescriptions was not associated with health literacy, cognition, prehospital adherence, patients' medication understanding, or any of the surveyed medication management practices (Table 2). Patients' reasons for not filling included lack of time to go to the pharmacy, medications not being delivered or dispensed, or inability to afford prescriptions. Prescription cost was cited by 23.5% of patients who did not fill their prescriptions and provided a reason.
| Variable | Overall 341 (100.0%) | Filled Prescription 309 (90.6%) | Did Not Fill 32 (9.4%) | P Value |
|---|---|---|---|---|
| ||||
| s‐TOFHLA score, range 036, N (%) | 0.443a | |||
| Inadequate, 016 | 40 | 34 (85.0) | 6 (15.0) | |
| Marginal, 1722 | 27 | 25 (92.6) | 2 (7.4) | |
| Adequate, 2336 | 268 | 244 (91.0) | 24 (9.0) | |
| MiniCog score, range 05, N (%) | 0.764b | |||
| Not impaired, 35 | 304 | 276 (90.8) | 28 (9.2) | |
| Impaired, 02 | 37 | 33 (89.2) | 4 (10.8) | |
| Morisky score, range 48, N (%) | 0.517a | |||
| Low/moderate self‐reported adherence, 47 | 249 | 224 (90.0) | 25 (10.0) | |
| High self‐reported adherence, 8 | 79 | 73 (92.4) | 6 (7.6) | |
| No. of discharge medications, range 126, N (%)c | 0.016a | |||
| 010 medications | 186 | 175 (94.1) | 11 (5.9) | |
| 11+medications | 155 | 134 (86.5) | 21 (13.5) | |
| Patient responses to medication behavior questions | ||||
| Patient associates medication taking time with daily events | 253 | 229 (90.5) | 24 (9.5) | 0.913a |
| Patient uses a pillbox to organize medicine | 180 | 162 (90.0) | 18 (10.0) | 0.680a |
| Friends of family help remind patient when it is time to take medicine | 89 | 79 (88.8) | 10 (11.2) | 0.486a |
| Patient writes down instructions for when to take medicine | 60 | 55 (91.7) | 5 (8.3) | 0.758a |
| Patient uses an alarm or a reminder that beeps when it is time to take medicine | 8 | 6 (75.0) | 2 (25.0) | 0.167a |
| Patient marks refill date on calendar | 38 | 35 (92.1) | 3 (7.9) | 1.000b |
| Pharmacy gives or sends patient a reminder when it is time to refill medicine | 94 | 84 (89.4) | 10 (10.6) | 0.624a |
| Friends or family help patient to refill medicine | 60 | 53 (88.3) | 7 (11.7) | 0.504a |
DISCUSSION
Almost 1 in 10 patients hospitalized with cardiovascular disease demonstrated primary nonadherence refractory to an intervention including pharmacist discharge medication counseling. Being unmarried and having greater than 10 medications at discharge were significantly associated with higher primary nonadherence when controlling for other patient factors.
Patients with a cohabitant partner were significantly less likely to exhibit primary nonadherence, which may reflect higher levels of social support, including encouragement for disease self‐management and/or support with tasks such as picking up medications from the pharmacy. Previous research has demonstrated that social support mediates outpatient medication adherence for heart failure patients.[10]
Similar to Jackevicius et al., we found that patients with more medications at discharge were less likely to fill their prescriptions.[1] These findings may reflect the challenges that patients face in adhering to complex treatment plans, which are associated with increased coordination and cost. Conversely, some prior studies have found that patients with fewer prescriptions were less likely to fill.[11, 12] These patients were often younger, thus potentially less conditioned to fill prescriptions, and unlike our cohort, these populations had consistent prescription coverage. Interventions for polypharmacy, which have been shown to improve outcomes and decrease costs, especially in the geriatric population, may be of benefit for primary nonadherence as well.[13]
Additionally, patients with lower household incomes had higher rates of primary nonadherence, at least in univariate analysis. Medication cost and transportation limitations, which are more pronounced in lower‐income patients, likely play influential roles in this group. These findings build on prior literature that has found lower prescription cost to be associated with better medication adherence in a variety of settings.[3, 4, 14]
Because the prevalence of primary nonadherence in this cohort is less than half of historical rates, we suspect the intervention did reduce unintentional nonadherence. However, regimen cost and complexity, transportation challenges, and ingrained medication beliefs likely remained barriers. It may be that a postdischarge phone call is able address unintended primary nonadherence in many cases. Meds to beds programs, where a supply of medications is provided to patients prior to discharge, could assist patients with limited transportation. Prior studies have also found reduced primary nonadherence when e‐prescriptions are utilized.[3]
Establishing outpatient follow‐up at discharge provides additional opportunities to address unanticipated adherence barriers. Because the efficacy of any adherence intervention depends on individual patient barriers, we recommend combining medication counseling with a targeted approach for patient‐specific needs.
We note several limitations to our study. First, because we studied primary nonadherence that persisted despite an intervention, this cohort likely underestimates the prevalence of primary nonadherence and alters the associated patient characteristics found in routine practice (although counseling is becoming more common). Second, patient reporting is subject to biases that underestimate nonadherence, although this approach has been validated previously.[15] Third, our outcome measure was unable to capture the spectrum of non‐adherence that could provide a more nuanced look at predictors of postdischarge nonadherence. Fourth, we did not have patient copayment data to better characterize whether out of pocket costs or pharmacologic classes drove nonadherence. Finally, sample size may have limited the detection of other important factors, and the university setting may limit generalizability to cardiovascular patients in other practice environments. Future research should focus on intervention strategies that assess patients' individual adherence barriers for a targeted or multimodal approach to improve adherence.
In conclusion, we found a prevalence of primary nonadherence of almost 1 in 10 patients who received pharmacist counseling. Nonadherence was associated with being single and those discharged with longer medication lists. Our results support existing literature that primary nonadherence is a significant problem in the postdischarge setting and substantiate the need for ongoing efforts to study and implement interventions for adherence after hospital discharge.
Disclosures
This material is based on work supported by the Office of Academic Affiliations, Department of Veterans Affairs, Veterans Affairs National Quality Scholars Program, and with use of facilities at Veterans Affairs Tennessee Valley Healthcare System, Nashville, Tennessee (Dr. Wooldridge). The funding agency supported the work indirectly through provision of salary support and training for the primary author, but had no specific role in the design and conduct of the study; collection, management, analysis, and interpretation of the data; preparation, review, or approval of the manuscript; or decision to submit the manuscript for publication. This work was also supported by R01 HL089755 (Dr. Kripalani) and in part by K23 HL077597 (Dr. Kripalani), K08 HL072806 (Dr. Schnipper), and the Center for Clinical Quality and Implementation Research at Vanderbilt University Medical Center. A preliminary version of this research was presented at the AcademyHealth Annual Research Meeting, June 16, 2015, Minneapolis, Minnesota. The authors report the following potential conflicts of interest: Jeffrey Schnipper: PI, investigator‐initiated study funded by Sanofi‐Aventis to develop, implement, and evaluate a multifaceted intervention to improve transitions of care in patients with diabetes mellitus discharged on insulin. Robert Dittus: passive co‐owner, Medical Decision Modeling, Inc.; Bayer HealthCare. One‐day consultation and panelist on educational video for population health (consultant fee); GlaxoSmithKline. One‐day consultant for population health, envisioning the future (consultant fee). Sunil Kripalani: Bioscape Digital, stock ownership
- , , . Prevalence, predictors, and outcomes of primary nonadherence after acute myocardial infarction. Circulation. 2008;117(8):1028–1036.
- , , , . Primary medication non‐adherence after discharge from a general internal medicine service. PloS One. 2013;8(5):e61735.
- , , , et al. Trouble getting started: predictors of primary medication nonadherence. Am J Med. 2011;124(11):1081.e9–22.
- , , , , . The incidence and determinants of primary nonadherence with prescribed medication in primary care: a cohort study. Ann Intern Med. 2014;160(7):441–450.
- , , , et al. Effect of a pharmacist intervention on clinically important medication errors after hospital discharge: a randomized trial. Ann Intern Med. 2012;157(1):1–10.
- , , , . Short Test of Functional Health Literacy in Adults. Snow Camp, NC: Peppercorn Books and Press; 1998.
- , , , , . Simplifying detection of cognitive impairment: comparison of the Mini‐Cog and Mini‐Mental State Examination in a multiethnic sample. J Am Geriatr Soc. 2005;53(5):871–874.
- , , . Concurrent and predictive validity of a self‐reported measure of medication adherence. Med Care. 1986;24(1):67–74.
- , , , , , . Health literacy and medication understanding among hospitalized adults. J Hosp Med. 2011;6(9):488–493.
- , , , , , . Medication adherence, social support, and event‐free survival in patients with heart failure. Health Psychol. 2013;32(6):637–646.
- , , , , , . Effect of patient comorbidities on filling of antihypertensive prescriptions. Am J Manag Care. 2009;15(1):24–30.
- , , , et al. Primary nonadherence to statin medications in a managed care organization. J Manag Care Pharm. 2013;19(5):367–373.
- , , , et al. Reducing cost by reducing polypharmacy: the polypharmacy outcomes project. J Am Med Dir Assoc. 2012;13(9):818.e811–815.
- , , , et al. The epidemiology of prescriptions abandoned at the pharmacy. Ann Intern Med. 2010;153(10):633–640.
- , , , , , . Can simple clinical measurements detect patient noncompliance? Hypertension. 1980;2(6):757–764.
Medication nonadherence after hospital discharge impacts morbidity and mortality in patients with cardiovascular disease.[1] Primary nonadherence, part of the spectrum of medication underuse, occurs when a patient receives a prescription but does not fill it.[1] Prior studies utilizing retrospective administrative data have found a prevalence of postdischarge primary nonadherence between 24% and 28%,[1, 2] similar to findings in a variety of outpatient populations.[3, 4]
One strategy for reduction in nonadherence is discharge medication counseling, which has been associated with improved postdischarge outcomes.[1] We evaluated the prevalence and predictors of refractory primary nonadherence in a cohort of patients hospitalized for acute cardiovascular conditions who received pharmacist counseling prior to discharge to guide future adherence interventions.
METHODS
Setting and Participants
The present study represents a secondary analysis of data from the Pharmacist Intervention for Low Literacy in Cardiovascular Disease (PILL‐CVD) study. PILL‐CVD was a randomized controlled trial that evaluated the effect of a tailored intervention consisting of pharmacist‐assisted medication reconciliation, discharge counseling, low‐literacy adherence aids, and follow‐up phone calls in adults hospitalized for acute coronary syndromes or acute decompensated heart failure. Patients likely to be discharged home taking primary responsibility for their medication management were eligible. Full study methods and results, including inclusion and exclusion criteria, can be found elsewhere.[5] The institutional review boards of each site approved the study.
For the present analysis, patients were included if they had any new discharge prescriptions to fill and received the study intervention, including a postdischarge follow‐up phone call with questions about filling discharge prescriptions.
Baseline Measures
Baseline data were obtained from medical records and patient interviews, including demographic information as well as survey data for cognitive impairment (Mini‐Cog) and health literacy (Short Test of Functional Health Literacy in Adults).[6, 7]
Data were also collected related to medication use, including the number of scheduled and as‐needed medications listed at discharge, self‐reported preadmission adherence, medication understanding, and medication management practices (eg, use of a pillbox, refill reminders). Self‐reported medication adherence was measured with the 4‐item Morisky scale.[8] Medication understanding was assessed with a tool previously developed by Marvanova et al.[9]
Outcome Measures
The primary outcome was the percentage of patients who reported not filling at least 1 discharge prescription on a telephone call that was conducted 1 to 4 days postdischarge. Patients were asked a dichotomous question about whether or not they filled all of their discharge prescriptions. Further characterization of the class or number of medications not filled was not performed. Patients were asked to provide a reason for not filling the prescriptions.
Analysis
We evaluated the prevalence and possible predictors of primary nonadherence including age, gender, race, marital status, education and income levels, insurance type, health literacy, cognition, presence of a primary care physician, number of listed discharge medications, prehospital medication adherence, medication understanding, and medication management practices using Pearson 2, Fisher exact, or Wilcoxon rank sum tests as appropriate. Multiple logistic regression with backward elimination was performed to identify independent predictors, selected with P values0.1. We also evaluated reasons that patients cited for not filling prescriptions. Two‐sided P values0.05 were considered statistically significant. All analyses were conducted using Stata version 13.1 (StataCorp LP, College Station, TX).
RESULTS
Of 851 patients in the PILL‐CVD study, the present sample includes 341 patients who received the intervention, completed the postdischarge follow‐up call, and had new discharge prescriptions to be filled. This represents 85% of patients who received the intervention.
The mean age of participants was 61.3 years, and 59.5% were male (Table 1). The majority were white (75.1%), and 88% had at least a high school education. Married or cohabitating patients represented 54.3% of the group. Just over half of the patients (54%) had an income of $35K or greater. The primary source of insurance for 82.5% of patients was either Medicare or private insurance, and 7.4% of patients were self‐pay. Most patients (80%) had adequate health literacy. The median Mini‐Cog score was 4 out of 5 (interquartile range [IQR]=35), and 11% of patients had scores indicating cognitive impairment. Just less than one‐fourth of the patients (24.1%) had a Morisky score of 8, indicating high self‐reported adherence, and the median score of patients' understanding of medications (range of 03) was 2.5 (IQR=2.22.8), reflecting relatively high understanding. The median number of prescriptions on patients' discharge medications lists was 10 (IQR=813).
| Variable | Overall 341 (100.0%) | Filled Prescription309 (90.6%) | Did Not Fill 32 (9.4%) | P Value |
|---|---|---|---|---|
| ||||
| Age, y, N (%) | 0.745a | |||
| 1849 | 69 | 63 (91.3) | 6 (8.7) | |
| 5064 | 128 | 114 (89.1) | 14 (10.9) | |
| 65+ | 144 | 132 (91.7) | 12 (8.3) | |
| Gender, N (%) | 0.056a | |||
| Male | 203 | 189 (93.1) | 14 (6.9) | |
| Female | 138 | 120 (87.0) | 18 (13.0) | |
| Race, N (%) | 0.712a | |||
| White | 256 | 234 (91.4) | 22 (8.6) | |
| African American | 60 | 54 (90.0) | 6 (10.0) | |
| Other | 22 | 19 (86.4) | 3 (13.6) | |
| Education, N (%) | 0.054a | |||
| Less than high school | 40 | 32 (80.0) | 8 (20.0) | |
| High school | 99 | 91 (91.9) | 8 (8.1) | |
| 1315 years | 93 | 83 (89.2) | 10 (10.8) | |
| 16 years | 109 | 103 (94.5) | 6 (5.5) | |
| Marital status, N (%) | ||||
| Separated/divorced/widowed/never married | 156 | 135 (86.5) | 21 (13.5) | 0.018a, b |
| Married/cohabitating | 185 | 174 (94.1) | 11 (5.9) | |
| Income, N (%) | 0.040a, b | |||
| 10K20K | 58 | 48 (82.8) | 10 (17.2) | |
| 20K35K | 86 | 76 (88.4) | 10 (11.6) | |
| 35K50K | 40 | 36 (90.0) | 4 (10.0) | |
| 50K75K | 46 | 43 (93.5) | 3 (6.5) | |
| 75K+ | 83 | 81 (97.6) | 2 (2.4) | |
| Primary source of payment, N (%) | 0.272a | |||
| Medicaid | 34 | 28 (82.4) | 6 (17.6) | |
| Medicare | 145 | 131 (90.3) | 14 (9.7) | |
| Private | 132 | 123 (93.2) | 9 (6.8) | |
| Self‐pay | 25 | 22 (88.0) | 3 (12.0) | |
| Primary care physician, N (%) | 1.000c | |||
| None/do not know | 28 | 26 (92.9) | 2 (7.1) | |
| Yes | 313 | 283 (90.4) | 30 (9.6) | |
| Site, N (%) | 0.071a | |||
| Nashville, TN | 172 | 151 (87.8) | 21 (12.2) | |
| Boston, MA | 169 | 158 (93.5) | 11 (6.5) | |
The prevalence of refractory primary nonadherence was 9.4%. In univariate analysis, single marital status, lower income, and having more than 10 total discharge medications were significantly associated with not filling medications (P=0.018, 0.04, 0.016, respectively; Table 1). In multivariable analysis, single marital status and having more than 10 total discharge medications maintained significance when controlling for other patient characteristics. Patients who were single had higher odds of failing to fill discharge prescriptions compared to married or cohabitating individuals (odds ratio [OR]: 2.2, 95% confidence interval [CI]: 1.014.8, P=0.047). Patients with more than 10 discharge medications also had higher odds of failing to fill compared with patients who had fewer total medications (OR: 2.3, 95% CI: 1.054.98, P=0.036).
Filling discharge prescriptions was not associated with health literacy, cognition, prehospital adherence, patients' medication understanding, or any of the surveyed medication management practices (Table 2). Patients' reasons for not filling included lack of time to go to the pharmacy, medications not being delivered or dispensed, or inability to afford prescriptions. Prescription cost was cited by 23.5% of patients who did not fill their prescriptions and provided a reason.
| Variable | Overall 341 (100.0%) | Filled Prescription 309 (90.6%) | Did Not Fill 32 (9.4%) | P Value |
|---|---|---|---|---|
| ||||
| s‐TOFHLA score, range 036, N (%) | 0.443a | |||
| Inadequate, 016 | 40 | 34 (85.0) | 6 (15.0) | |
| Marginal, 1722 | 27 | 25 (92.6) | 2 (7.4) | |
| Adequate, 2336 | 268 | 244 (91.0) | 24 (9.0) | |
| MiniCog score, range 05, N (%) | 0.764b | |||
| Not impaired, 35 | 304 | 276 (90.8) | 28 (9.2) | |
| Impaired, 02 | 37 | 33 (89.2) | 4 (10.8) | |
| Morisky score, range 48, N (%) | 0.517a | |||
| Low/moderate self‐reported adherence, 47 | 249 | 224 (90.0) | 25 (10.0) | |
| High self‐reported adherence, 8 | 79 | 73 (92.4) | 6 (7.6) | |
| No. of discharge medications, range 126, N (%)c | 0.016a | |||
| 010 medications | 186 | 175 (94.1) | 11 (5.9) | |
| 11+medications | 155 | 134 (86.5) | 21 (13.5) | |
| Patient responses to medication behavior questions | ||||
| Patient associates medication taking time with daily events | 253 | 229 (90.5) | 24 (9.5) | 0.913a |
| Patient uses a pillbox to organize medicine | 180 | 162 (90.0) | 18 (10.0) | 0.680a |
| Friends of family help remind patient when it is time to take medicine | 89 | 79 (88.8) | 10 (11.2) | 0.486a |
| Patient writes down instructions for when to take medicine | 60 | 55 (91.7) | 5 (8.3) | 0.758a |
| Patient uses an alarm or a reminder that beeps when it is time to take medicine | 8 | 6 (75.0) | 2 (25.0) | 0.167a |
| Patient marks refill date on calendar | 38 | 35 (92.1) | 3 (7.9) | 1.000b |
| Pharmacy gives or sends patient a reminder when it is time to refill medicine | 94 | 84 (89.4) | 10 (10.6) | 0.624a |
| Friends or family help patient to refill medicine | 60 | 53 (88.3) | 7 (11.7) | 0.504a |
DISCUSSION
Almost 1 in 10 patients hospitalized with cardiovascular disease demonstrated primary nonadherence refractory to an intervention including pharmacist discharge medication counseling. Being unmarried and having greater than 10 medications at discharge were significantly associated with higher primary nonadherence when controlling for other patient factors.
Patients with a cohabitant partner were significantly less likely to exhibit primary nonadherence, which may reflect higher levels of social support, including encouragement for disease self‐management and/or support with tasks such as picking up medications from the pharmacy. Previous research has demonstrated that social support mediates outpatient medication adherence for heart failure patients.[10]
Similar to Jackevicius et al., we found that patients with more medications at discharge were less likely to fill their prescriptions.[1] These findings may reflect the challenges that patients face in adhering to complex treatment plans, which are associated with increased coordination and cost. Conversely, some prior studies have found that patients with fewer prescriptions were less likely to fill.[11, 12] These patients were often younger, thus potentially less conditioned to fill prescriptions, and unlike our cohort, these populations had consistent prescription coverage. Interventions for polypharmacy, which have been shown to improve outcomes and decrease costs, especially in the geriatric population, may be of benefit for primary nonadherence as well.[13]
Additionally, patients with lower household incomes had higher rates of primary nonadherence, at least in univariate analysis. Medication cost and transportation limitations, which are more pronounced in lower‐income patients, likely play influential roles in this group. These findings build on prior literature that has found lower prescription cost to be associated with better medication adherence in a variety of settings.[3, 4, 14]
Because the prevalence of primary nonadherence in this cohort is less than half of historical rates, we suspect the intervention did reduce unintentional nonadherence. However, regimen cost and complexity, transportation challenges, and ingrained medication beliefs likely remained barriers. It may be that a postdischarge phone call is able address unintended primary nonadherence in many cases. Meds to beds programs, where a supply of medications is provided to patients prior to discharge, could assist patients with limited transportation. Prior studies have also found reduced primary nonadherence when e‐prescriptions are utilized.[3]
Establishing outpatient follow‐up at discharge provides additional opportunities to address unanticipated adherence barriers. Because the efficacy of any adherence intervention depends on individual patient barriers, we recommend combining medication counseling with a targeted approach for patient‐specific needs.
We note several limitations to our study. First, because we studied primary nonadherence that persisted despite an intervention, this cohort likely underestimates the prevalence of primary nonadherence and alters the associated patient characteristics found in routine practice (although counseling is becoming more common). Second, patient reporting is subject to biases that underestimate nonadherence, although this approach has been validated previously.[15] Third, our outcome measure was unable to capture the spectrum of non‐adherence that could provide a more nuanced look at predictors of postdischarge nonadherence. Fourth, we did not have patient copayment data to better characterize whether out of pocket costs or pharmacologic classes drove nonadherence. Finally, sample size may have limited the detection of other important factors, and the university setting may limit generalizability to cardiovascular patients in other practice environments. Future research should focus on intervention strategies that assess patients' individual adherence barriers for a targeted or multimodal approach to improve adherence.
In conclusion, we found a prevalence of primary nonadherence of almost 1 in 10 patients who received pharmacist counseling. Nonadherence was associated with being single and those discharged with longer medication lists. Our results support existing literature that primary nonadherence is a significant problem in the postdischarge setting and substantiate the need for ongoing efforts to study and implement interventions for adherence after hospital discharge.
Disclosures
This material is based on work supported by the Office of Academic Affiliations, Department of Veterans Affairs, Veterans Affairs National Quality Scholars Program, and with use of facilities at Veterans Affairs Tennessee Valley Healthcare System, Nashville, Tennessee (Dr. Wooldridge). The funding agency supported the work indirectly through provision of salary support and training for the primary author, but had no specific role in the design and conduct of the study; collection, management, analysis, and interpretation of the data; preparation, review, or approval of the manuscript; or decision to submit the manuscript for publication. This work was also supported by R01 HL089755 (Dr. Kripalani) and in part by K23 HL077597 (Dr. Kripalani), K08 HL072806 (Dr. Schnipper), and the Center for Clinical Quality and Implementation Research at Vanderbilt University Medical Center. A preliminary version of this research was presented at the AcademyHealth Annual Research Meeting, June 16, 2015, Minneapolis, Minnesota. The authors report the following potential conflicts of interest: Jeffrey Schnipper: PI, investigator‐initiated study funded by Sanofi‐Aventis to develop, implement, and evaluate a multifaceted intervention to improve transitions of care in patients with diabetes mellitus discharged on insulin. Robert Dittus: passive co‐owner, Medical Decision Modeling, Inc.; Bayer HealthCare. One‐day consultation and panelist on educational video for population health (consultant fee); GlaxoSmithKline. One‐day consultant for population health, envisioning the future (consultant fee). Sunil Kripalani: Bioscape Digital, stock ownership
- , , . Prevalence, predictors, and outcomes of primary nonadherence after acute myocardial infarction. Circulation. 2008;117(8):1028–1036.
- , , , . Primary medication non‐adherence after discharge from a general internal medicine service. PloS One. 2013;8(5):e61735.
- , , , et al. Trouble getting started: predictors of primary medication nonadherence. Am J Med. 2011;124(11):1081.e9–22.
- , , , , . The incidence and determinants of primary nonadherence with prescribed medication in primary care: a cohort study. Ann Intern Med. 2014;160(7):441–450.
- , , , et al. Effect of a pharmacist intervention on clinically important medication errors after hospital discharge: a randomized trial. Ann Intern Med. 2012;157(1):1–10.
- , , , . Short Test of Functional Health Literacy in Adults. Snow Camp, NC: Peppercorn Books and Press; 1998.
- , , , , . Simplifying detection of cognitive impairment: comparison of the Mini‐Cog and Mini‐Mental State Examination in a multiethnic sample. J Am Geriatr Soc. 2005;53(5):871–874.
- , , . Concurrent and predictive validity of a self‐reported measure of medication adherence. Med Care. 1986;24(1):67–74.
- , , , , , . Health literacy and medication understanding among hospitalized adults. J Hosp Med. 2011;6(9):488–493.
- , , , , , . Medication adherence, social support, and event‐free survival in patients with heart failure. Health Psychol. 2013;32(6):637–646.
- , , , , , . Effect of patient comorbidities on filling of antihypertensive prescriptions. Am J Manag Care. 2009;15(1):24–30.
- , , , et al. Primary nonadherence to statin medications in a managed care organization. J Manag Care Pharm. 2013;19(5):367–373.
- , , , et al. Reducing cost by reducing polypharmacy: the polypharmacy outcomes project. J Am Med Dir Assoc. 2012;13(9):818.e811–815.
- , , , et al. The epidemiology of prescriptions abandoned at the pharmacy. Ann Intern Med. 2010;153(10):633–640.
- , , , , , . Can simple clinical measurements detect patient noncompliance? Hypertension. 1980;2(6):757–764.
Predictors of Prolonged Hospitalizations
Hospitalizations frequently last longer than warranted by medical necessity alone, due to inefficiencies within the US healthcare system.[1, 2] Discharge delays place patients at risk for hospital‐acquired complications and increase costs. With the growing emphasis on high‐value care, hospital length of stay (LOS) has emerged as a key metric for inpatient care and will remain a central focus of hospital‐based improvement initiatives for the foreseeable future.
Hospitals may find it difficult to identify the primary drivers of inpatient LOS in a dynamic and increasingly complex healthcare system. Multiple recent policy changes have affected inpatient care. The Health Information Technology for Economic and Clinical Health Act of 2009 has led to widespread adoption of electronic health records (EHRs) that have markedly impacted provider workflows.[3] In October 2013, the Centers for Medicare & Medicaid Services implemented the 2‐midnight rule, which reclassified lower acuity inpatients with an expected stay 48 hours to observation status.[4] In January 2014, expansion of insurance coverage under the Affordable Care Act (ACA) altered payer mix for hospitals nationwide.[5] At a local level, hospitals that are rapidly adjusting resource allocation, capital investments, and marketing efforts and making complex operational decisions (eg, to open new units or change admission or referral algorithms) may simultaneously experience shifts in patient volumes, case‐mix index, and staffing ratios with downstream effects on LOS.
Given the myriad factors influencing inpatient LOS, hospital leaders may encounter real challenges in designing effective LOS reduction strategies. For example, they may expend significant resources on real‐time demand‐capacity management systems to improve hospital‐wide patient flow, but the resultant emphasis on bed placement and early discharges may shave only hours off average LOS.[6, 7] An alternative approach may be to target the small percentage of patients with prolonged hospitalizations who contribute disproportionately to the average LOS, as other initiatives focused on high utilizers have done.[8, 9, 10]
Our institution noted an increase in the average inpatient LOS for general medicine patients from 2012 to 2014, prompting a call to action by hospital leaders. We sought to characterize the predictors of prolonged hospitalizations among medicine patients to guide future efforts aimed at mitigating the contribution of prolonged LOS to overall LOS.
METHODS
Study Design
We performed a retrospective analysis of medicine patients discharged between January 1, 2012 and December 31, 2014, from the University of Colorado Hospital, a 551‐bed urban, quaternary‐care academic medical center in Aurora, Colorado. Patients were included if they were admitted under inpatient status, 18 years of age, and discharged from 1 of our 10 medicine services: 7 services with residents, staffed by hospitalists, general internists, or subspecialists; and 3 services with advanced practice providers, staffed by hospitalists.
Data Collection
We obtained LOS, calendar year of discharge, demographic data, insurance type, discharge disposition, number of medications, consults, intensive care unit (ICU) stays, surgeries (ie, procedures requiring anesthesia), and primary diagnosis by International Classification of Diseases, Ninth Revision codes from an administrative database that had been developed, validated, and maintained by our hospital medicine group. This database was populated with variables from our EHR, which was implemented in September 2011; to minimize variability in data input during the EHR rollout, we excluded data from September 2011 through December 2011. The Colorado Multiple Institutional Review Board reviewed and exempted this database (protocol 13‐2953) as a program evaluation.
Outcomes
We defined a prolonged hospitalization or LOS as >21 days in duration. This represented approximately 2 standard deviations above the mean LOS in our cohort. This cutoff also helped to remove provider‐level variability, as each medicine service was staffed by 2 attendings per month, each working approximately 7 days on and 7 days off. We examined LOS >14 and >30 days in sensitivity analyses to ensure that the selection of >21 days did not impose an arbitrary and invalid limitation on our statistical analysis.
Statistical Analysis
Demographic and clinical data were compared in the group with LOS 21 days versus the group with LOS >21 days with a 2 test for dichotomous variables and Student t test for continuous variables. We then built a multivariable logistic regression model to predict LOS >21 days using the variables that were significantly different between groups in bivariate analyses. A two‐sided P value of 0.05 was considered statistically significant. All data analyses were performed using Stata 12.0 (StataCorp, College Station, TX).
RESULTS
We identified 18,363 inpatient discharges among 12,511 medicine patients between January 1, 2012 and December 31, 2014. Of these discharges, 416 (2.3%) demonstrated prolonged LOS. Prolonged hospitalizations accounted for 18.6% of total inpatient days. The average LOS during the study period was 4.8 days including patients with prolonged LOS and 4.0 days excluding patients with prolonged LOS, a contribution of 0.8 days.
Table 1 compares the characteristics of patients with and without prolonged LOS. Age, insurance, discharge disposition, palliative care consults, ICU stays, and surgeries were among the variables that differed significantly between the 2 groups. Among patients undergoing surgery, those with prolonged LOS were more likely to have surgery >24 hours after admission than those without prolonged LOS (85.7% vs 51.4%, P0.001).
| Variable | LOS 21 Days, N=17,947 | LOS >21 Days, N=416 | P Value |
|---|---|---|---|
| |||
| Age, y, mean (SD) | 56.4 (18.7) | 54.4 (17.1) | 0.030 |
| Female | 9,256 (52%) | 199 (48%) | 0.132 |
| Year of discharge | 0.001 | ||
| 2012 | 5,486 (31%) | 69 (17%) | |
| 2013 | 6,193 (35%) | 162 (39%) | |
| 2014 | 6,268 (35%) | 185 (44%) | |
| Race/ethnicity | 0.003 | ||
| White non‐Hispanic | 9,702 (54%) | 242 (58%) | |
| Black non‐Hispanic | 4,000 (22%) | 68 (16%) | |
| Hispanic | 2,872(16%) | 67 (16%) | |
| Asian | 578 (3%) | 9 (2%) | |
| Other or unknown | 795 (4%) | 30 (7%) | |
| Language preference | 0.795 | ||
| English | 16,049 (89%) | 376 (90%) | |
| Spanish | 1,052 (6%) | 23 (6%) | |
| Other | 846 (5%) | 17 (4%) | |
| Insurance | 0.001 | ||
| Medicare | 5,462 (30%) | 109 (26%) | |
| Medicaid | 3,406 (19%) | 126 (30%) | |
| Dual | 2,815 (16%) | 64 (15%) | |
| Private | 2,714 (15%) | 60 (14%) | |
| Indigent/self‐pay | 2,829 (16%) | 42 (10%) | |
| Other | 721 (4%) | 15 (4%) | |
| Length of stay, d (SD) | 4.0 (3.5) | 39.5 (37.3) | 0.001 |
| Discharge disposition | 0.001 | ||
| Home with self‐care | 13,276 (74%) | 115 (28%) | |
| Home with home health | 1,584 (9%) | 79 (19%) | |
| Hospicehome or inpatient | 369 (2%) | 19 (5%) | |
| Postacute‐care facility or LTAC | 1,761 (10%) | 141 (34%) | |
| Expired | 113 (1%) | 18 (4%) | |
| Other | 844 (5%) | 44 (11%) | |
| No. of admission medications (SD) | 9.7 (7.4) | 10.9 (7.8) | 0.002 |
| Primary diagnosis by ICD‐9 code* | |||
| Sepsis, unspecified | 1,548 (9%) | 55 (13%) | 0.001 |
| Acute respiratory failure | 293 (2%) | 9 (2%) | 0.400 |
| MSSA septicemia | 36 (0.2%) | 8 (2%) | 0.001 |
| MRSA septicemia | 13 (0.1%) | 7 (2%) | 0.001 |
| Alcoholic cirrhosis of the liver | 111 (1%) | 7 (2%) | 0.007 |
| Palliative care consult | 398 (2%) | 64 (15%) | 0.001 |
| ICU stay | 2,030 (11%) | 246 (59%) | 0.001 |
| Surgical procedure | 1,800 (10%) | 182 (44%) | 0.001 |
Unspecified sepsis was the most frequent primary diagnosis, regardless of LOS category (Table 2). However, the second through fifth most frequent diagnoses differed for patients with and without prolonged LOS.
| N | % | |
|---|---|---|
| ||
| LOS 21 days | ||
| 1. Sepsis, unspecified | 1,548 | 8.6% |
| 2. Acute pancreatitis | 435 | 2.4% |
| 3. Pneumonia | 431 | 2.4% |
| 4. Acute kidney failure | 363 | 2.0% |
| 5. COPD exacerbation | 320 | 1.8% |
| LOS >21 days | ||
| 1. Sepsis, unspecified | 55 | 13.0% |
| 2. Acute respiratory failure | 9 | 2.2% |
| 3. Methicillin‐sensitive Staphylococcus aureus septicemia | 8 | 1.9% |
| 4. Methicillin‐resistant Staphylococcus aureus septicemia | 7 | 1.7% |
| 5. Alcoholic cirrhosis of the liver | 7 | 1.7% |
In an adjusted logistic regression model (Table 3), we found lower odds of prolonged LOS for each 10‐year increase in age and higher odds of prolonged LOS for Medicaid insurance, discharge to home with home health, discharge to a postacute‐care or long‐term acute‐care facility, and in‐hospital death. Methicillin‐resistant Staphylococcus aureus (MRSA) septicemia, palliative care consults, ICU stays, and surgeries were all also associated with increased odds of prolonged LOS. We identified a statistically significant interaction between ICU stay and surgical procedure (odds ratio: 2.53, 95% confidence interval: 1.51‐4.26, P0.001).
| Outcome: LOS >21 Days | Odds Ratio | 95% CI | P Value |
|---|---|---|---|
| |||
| Age, per 10 years increase in age | 0.80 | 0.73‐0.87 | 0.001 |
| Year of discharge | |||
| 2012 | 0.47 | 0.34‐0.67 | 0.001 |
| 2013 | 1.10 | 0.84‐1.43 | 0.493 |
| 2014 | Ref | ||
| Race/ethnicity | |||
| White non‐Hispanic | Ref | ||
| Black non‐Hispanic | 0.89 | 0.64‐1.22 | 0.454 |
| Hispanic | 1.01 | 0.70‐1.46 | 0.952 |
| Asian | 0.85 | 0.40‐1.83 | 0.679 |
| Other or unknown | 1.29 | 0.73‐2.26 | 0.378 |
| Insurance | |||
| Medicare | Ref | ||
| Medicaid | 1.99 | 1.29‐3.05 | 0.002 |
| Dual | 1.06 | 0.72‐1.57 | 0.765 |
| Private | 1.13 | 0.70‐1.82 | 0.620 |
| Indigent/self‐pay | 1.66 | 0.95‐2.88 | 0.073 |
| Other | 0.96 | 0.47‐1.96 | 0.908 |
| Discharge disposition | |||
| Home with self‐care | Ref | ||
| Home with home health | 4.48 | 3.10‐6.48 | 0.001 |
| Hospicehome or inpatient | 2.11 | 0.98‐4.55 | 0.057 |
| Postacute‐care facility or LTAC | 10.37 | 6.92‐15.56 | 0.001 |
| Expired | 5.38 | 2.27‐12.75 | 0.001 |
| Other | 4.04 | 2.64‐6.18 | 0.001 |
| No. of admission medications | 1.00 | 0.99‐1.02 | 0.775 |
| Primary diagnosis by ICD‐9 code | |||
| Sepsis, unspecified | 1.11 | 0.78‐1.58 | 0.575 |
| MSSA septicemia | 2.44 | 0.68‐8.67 | 0.074 |
| MRSA septicemia | 8.83 | 1.72‐45.36 | 0.009 |
| Alcoholic cirrhosis of the liver | 1.25 | 0.43‐3.65 | 0.687 |
| Palliative care consult | 4.63 | 2.86‐7.49 | 0.001 |
| ICU stay | 6.66 | 5.22‐8.50 | 0.001 |
| Surgical procedure | 5.04 | 3.90‐6.52 | 0.001 |
Sensitivity analyses using LOS >14 and >30 days yielded similar results to LOS >21 days (see Supporting Appendix Table 1 in the online version of this article).
DISCUSSION
We found that a small proportion of medicine patients with prolonged hospitalizations contributed substantially to both total inpatient days and average inpatient LOS. Such disproportionate healthcare utilization is concerning in light of the Institute of Medicine's charge for health systems to deliver timely, efficient, and equitable care.[11]
Few studies in the United States have analyzed patient characteristics that predict prolonged LOS, and to our knowledge, none have evaluated prolonged LOS specifically in general medicine patients.[12, 13, 14] Among selected surgical populations, prolonged hospitalizations are most often related to placement difficulties, operational delays, and payer‐related issues, rather than severity of illness, baseline comorbidities, or in‐hospital complications.[12, 13] In our study, we found that patients with prolonged LOS were more likely to require a palliative care consult, ICU stay, or surgery, all proxies for disease severity. Patients with prolonged LOS were also more likely to undergo surgery >24 hours after admission than those without prolonged LOS, suggesting that the former were either too unstable to proceed directly to surgery or developed complications later during their hospitalization. Even after controlling for palliative care consults, ICU stays, and surgeries, placement at a postacute‐care facility was strongly associated with prolonged LOS. Patients with prolonged LOS were also more likely to have Medicaid compared to other insurance types.
Our findings have several potential implications for efforts aimed at decreasing the number of and length of prolonged hospitalizations. Although demographic and clinical factors such as Medicaid insurance, ICU stays, and surgeries are generally not modifiable, they could, particularly in combination, be used to trigger earlier and more intensive case management involvement. A streamlined insurance approval process for Medicaid pending inpatients could be beneficial, given the recent expansion of Medicaid eligibility under the ACA. Hospital partnerships with postacute‐care facilities could also relieve bottlenecks in placement.[8] Chart review of the patients with MRSA septicemia and prolonged LOS indicated that development of an intensive outpatient parenteral antimicrobial therapy pathway with substance abuse counseling could provide an alternative to extended inpatient treatment for intravenous drug users with complicated infections.[15]
This study has several limitations. First, given the lack of consensus in the literature regarding the definition of a prolonged hospitalization, it is difficult to directly compare our results with existing studies.[8, 12, 13, 14] However, we believe LOS >21 days to be a meaningful cutoff for our cohort. Most demographic and clinical variables that were predictive at >21 days were also predictive at >14 and >30 days, which reassured us that the relationship between variables and prolonged LOS was stable at different thresholds. Second, our database did not allow us to fully adjust for baseline comorbidities or categorize the reasons for discharge delays. Finally, this was a single‐center program evaluation. Although this limits generalization to other institutions, we believe our approach may serve as a guide for others interested in reducing prolonged hospitalizations.
In summary, prolonged hospitalizations represent a potentially high‐yield target for LOS reduction efforts. Prolonged hospitalizations among medicine patients at our institution particularly affected Medicaid enrollees with complex hospital stays who were not discharged home. Further studies are needed to determine the specific reasons for unnecessary hospital days in this population.
Acknowledgements
The authors thank Essey Yirdaw for her contributions to the building and management of the database that informed this work.
Disclosure: M.E.A. conceived of the study concept and design and drafted the manuscript. J.J.G. assisted with the study design and made critical revisions to the final manuscript. D.A., R.P., and R.C. assisted with the study design and made critical revisions to the manuscript. C.D.J. assisted with the study design, performed data analyses, and made critical revisions to the manuscript. RC has disclosed that her time is funded by a National Institutes of Health grant unrelated to this study. A modified abstract was presented in poster format at the Society of Hospital Medicine Research, Innovations, and Vignettes Competition 2015 Annual Meeting, held March 29 April 1, 2015, in National Harbor, Maryland. The authors have no conflicts of interest to disclose.
- , , , et al. Excess hospitalization days in an academic medical center: perceptions of hospitalists and discharge planners. Am J Manag Care. 2011;17(2):e34–e42.
- , , A prospective study of reasons for prolonged hospitalizations on a general medicine teaching service. J Gen Intern Med. 2005;20(2):108–115.
- , , , et al. Adoption of electronic health records grows rapidly, but fewer than half of U.S. hospitals had at least a basic system in 2012. Health Aff (Millwood). 2013;32(8):1478–1485.
- , , , et al. Observation and inpatient status: clinical impact of the 2‐midnight rule. J Hosp Med. 2014;9(4):203–209.
- , , Impact of insurance expansion on hospital uncompensated care costs in 2014. Department of Health and Human Services Office of the Assistant Secretary for Planning and Evaluation. Available at: http://aspe.hhs.gov/health/reports/2014/uncompensatedcare/ib_uncompensatedcare.pdf. Accessed March 28, 2015.
- , , , Using real‐time demand capacity management to improve hospital‐wide patient flow. Jt Comm J Qual Patient Saf. 2011;37(5):217–227.
- , , , , , Natural history of late discharges from a general medical ward. J Hosp Med. 2009;4(4):226–233.
- , , , Addressing hospital length of stay outlier patients: a community‐wide approach. Adv Biosci Biotechol. 2014;5:188–196.
- , American medical home runs. Health Aff (Millwood). 2009;28(5):1317–1326.
- The hot spotters: can we lower medical costs by giving the neediest patients better care? New Yorker. January 2011:40–51.
- Institute of Medicine. Crossing the Quality Chasm. Washington, DC: National Academies Press; 2001.
- , , , et al. Excessively long hospital stays after trauma are not related to the severity of illness: let's aim to the right target! JAMA Surg. 2013;148(1):956–961.
- , , Extended length of stay after surgery: complications, inefficient practice, or sick patients? JAMA Surg. 2014;149(8):815–820.
- , , , , Nonmedical factors associated with prolonged hospital length of stay in an urban homebound population. J Hosp Med. 2012;7(2):73–78.
- , , , Safe and successful treatment of intravenous drug users with a peripherally inserted central catheter in an outpatient parenteral antibiotic treatment service. J Antimicrob Chemother. 2010;65(12):2641–2644.
Hospitalizations frequently last longer than warranted by medical necessity alone, due to inefficiencies within the US healthcare system.[1, 2] Discharge delays place patients at risk for hospital‐acquired complications and increase costs. With the growing emphasis on high‐value care, hospital length of stay (LOS) has emerged as a key metric for inpatient care and will remain a central focus of hospital‐based improvement initiatives for the foreseeable future.
Hospitals may find it difficult to identify the primary drivers of inpatient LOS in a dynamic and increasingly complex healthcare system. Multiple recent policy changes have affected inpatient care. The Health Information Technology for Economic and Clinical Health Act of 2009 has led to widespread adoption of electronic health records (EHRs) that have markedly impacted provider workflows.[3] In October 2013, the Centers for Medicare & Medicaid Services implemented the 2‐midnight rule, which reclassified lower acuity inpatients with an expected stay 48 hours to observation status.[4] In January 2014, expansion of insurance coverage under the Affordable Care Act (ACA) altered payer mix for hospitals nationwide.[5] At a local level, hospitals that are rapidly adjusting resource allocation, capital investments, and marketing efforts and making complex operational decisions (eg, to open new units or change admission or referral algorithms) may simultaneously experience shifts in patient volumes, case‐mix index, and staffing ratios with downstream effects on LOS.
Given the myriad factors influencing inpatient LOS, hospital leaders may encounter real challenges in designing effective LOS reduction strategies. For example, they may expend significant resources on real‐time demand‐capacity management systems to improve hospital‐wide patient flow, but the resultant emphasis on bed placement and early discharges may shave only hours off average LOS.[6, 7] An alternative approach may be to target the small percentage of patients with prolonged hospitalizations who contribute disproportionately to the average LOS, as other initiatives focused on high utilizers have done.[8, 9, 10]
Our institution noted an increase in the average inpatient LOS for general medicine patients from 2012 to 2014, prompting a call to action by hospital leaders. We sought to characterize the predictors of prolonged hospitalizations among medicine patients to guide future efforts aimed at mitigating the contribution of prolonged LOS to overall LOS.
METHODS
Study Design
We performed a retrospective analysis of medicine patients discharged between January 1, 2012 and December 31, 2014, from the University of Colorado Hospital, a 551‐bed urban, quaternary‐care academic medical center in Aurora, Colorado. Patients were included if they were admitted under inpatient status, 18 years of age, and discharged from 1 of our 10 medicine services: 7 services with residents, staffed by hospitalists, general internists, or subspecialists; and 3 services with advanced practice providers, staffed by hospitalists.
Data Collection
We obtained LOS, calendar year of discharge, demographic data, insurance type, discharge disposition, number of medications, consults, intensive care unit (ICU) stays, surgeries (ie, procedures requiring anesthesia), and primary diagnosis by International Classification of Diseases, Ninth Revision codes from an administrative database that had been developed, validated, and maintained by our hospital medicine group. This database was populated with variables from our EHR, which was implemented in September 2011; to minimize variability in data input during the EHR rollout, we excluded data from September 2011 through December 2011. The Colorado Multiple Institutional Review Board reviewed and exempted this database (protocol 13‐2953) as a program evaluation.
Outcomes
We defined a prolonged hospitalization or LOS as >21 days in duration. This represented approximately 2 standard deviations above the mean LOS in our cohort. This cutoff also helped to remove provider‐level variability, as each medicine service was staffed by 2 attendings per month, each working approximately 7 days on and 7 days off. We examined LOS >14 and >30 days in sensitivity analyses to ensure that the selection of >21 days did not impose an arbitrary and invalid limitation on our statistical analysis.
Statistical Analysis
Demographic and clinical data were compared in the group with LOS 21 days versus the group with LOS >21 days with a 2 test for dichotomous variables and Student t test for continuous variables. We then built a multivariable logistic regression model to predict LOS >21 days using the variables that were significantly different between groups in bivariate analyses. A two‐sided P value of 0.05 was considered statistically significant. All data analyses were performed using Stata 12.0 (StataCorp, College Station, TX).
RESULTS
We identified 18,363 inpatient discharges among 12,511 medicine patients between January 1, 2012 and December 31, 2014. Of these discharges, 416 (2.3%) demonstrated prolonged LOS. Prolonged hospitalizations accounted for 18.6% of total inpatient days. The average LOS during the study period was 4.8 days including patients with prolonged LOS and 4.0 days excluding patients with prolonged LOS, a contribution of 0.8 days.
Table 1 compares the characteristics of patients with and without prolonged LOS. Age, insurance, discharge disposition, palliative care consults, ICU stays, and surgeries were among the variables that differed significantly between the 2 groups. Among patients undergoing surgery, those with prolonged LOS were more likely to have surgery >24 hours after admission than those without prolonged LOS (85.7% vs 51.4%, P0.001).
| Variable | LOS 21 Days, N=17,947 | LOS >21 Days, N=416 | P Value |
|---|---|---|---|
| |||
| Age, y, mean (SD) | 56.4 (18.7) | 54.4 (17.1) | 0.030 |
| Female | 9,256 (52%) | 199 (48%) | 0.132 |
| Year of discharge | 0.001 | ||
| 2012 | 5,486 (31%) | 69 (17%) | |
| 2013 | 6,193 (35%) | 162 (39%) | |
| 2014 | 6,268 (35%) | 185 (44%) | |
| Race/ethnicity | 0.003 | ||
| White non‐Hispanic | 9,702 (54%) | 242 (58%) | |
| Black non‐Hispanic | 4,000 (22%) | 68 (16%) | |
| Hispanic | 2,872(16%) | 67 (16%) | |
| Asian | 578 (3%) | 9 (2%) | |
| Other or unknown | 795 (4%) | 30 (7%) | |
| Language preference | 0.795 | ||
| English | 16,049 (89%) | 376 (90%) | |
| Spanish | 1,052 (6%) | 23 (6%) | |
| Other | 846 (5%) | 17 (4%) | |
| Insurance | 0.001 | ||
| Medicare | 5,462 (30%) | 109 (26%) | |
| Medicaid | 3,406 (19%) | 126 (30%) | |
| Dual | 2,815 (16%) | 64 (15%) | |
| Private | 2,714 (15%) | 60 (14%) | |
| Indigent/self‐pay | 2,829 (16%) | 42 (10%) | |
| Other | 721 (4%) | 15 (4%) | |
| Length of stay, d (SD) | 4.0 (3.5) | 39.5 (37.3) | 0.001 |
| Discharge disposition | 0.001 | ||
| Home with self‐care | 13,276 (74%) | 115 (28%) | |
| Home with home health | 1,584 (9%) | 79 (19%) | |
| Hospicehome or inpatient | 369 (2%) | 19 (5%) | |
| Postacute‐care facility or LTAC | 1,761 (10%) | 141 (34%) | |
| Expired | 113 (1%) | 18 (4%) | |
| Other | 844 (5%) | 44 (11%) | |
| No. of admission medications (SD) | 9.7 (7.4) | 10.9 (7.8) | 0.002 |
| Primary diagnosis by ICD‐9 code* | |||
| Sepsis, unspecified | 1,548 (9%) | 55 (13%) | 0.001 |
| Acute respiratory failure | 293 (2%) | 9 (2%) | 0.400 |
| MSSA septicemia | 36 (0.2%) | 8 (2%) | 0.001 |
| MRSA septicemia | 13 (0.1%) | 7 (2%) | 0.001 |
| Alcoholic cirrhosis of the liver | 111 (1%) | 7 (2%) | 0.007 |
| Palliative care consult | 398 (2%) | 64 (15%) | 0.001 |
| ICU stay | 2,030 (11%) | 246 (59%) | 0.001 |
| Surgical procedure | 1,800 (10%) | 182 (44%) | 0.001 |
Unspecified sepsis was the most frequent primary diagnosis, regardless of LOS category (Table 2). However, the second through fifth most frequent diagnoses differed for patients with and without prolonged LOS.
| N | % | |
|---|---|---|
| ||
| LOS 21 days | ||
| 1. Sepsis, unspecified | 1,548 | 8.6% |
| 2. Acute pancreatitis | 435 | 2.4% |
| 3. Pneumonia | 431 | 2.4% |
| 4. Acute kidney failure | 363 | 2.0% |
| 5. COPD exacerbation | 320 | 1.8% |
| LOS >21 days | ||
| 1. Sepsis, unspecified | 55 | 13.0% |
| 2. Acute respiratory failure | 9 | 2.2% |
| 3. Methicillin‐sensitive Staphylococcus aureus septicemia | 8 | 1.9% |
| 4. Methicillin‐resistant Staphylococcus aureus septicemia | 7 | 1.7% |
| 5. Alcoholic cirrhosis of the liver | 7 | 1.7% |
In an adjusted logistic regression model (Table 3), we found lower odds of prolonged LOS for each 10‐year increase in age and higher odds of prolonged LOS for Medicaid insurance, discharge to home with home health, discharge to a postacute‐care or long‐term acute‐care facility, and in‐hospital death. Methicillin‐resistant Staphylococcus aureus (MRSA) septicemia, palliative care consults, ICU stays, and surgeries were all also associated with increased odds of prolonged LOS. We identified a statistically significant interaction between ICU stay and surgical procedure (odds ratio: 2.53, 95% confidence interval: 1.51‐4.26, P0.001).
| Outcome: LOS >21 Days | Odds Ratio | 95% CI | P Value |
|---|---|---|---|
| |||
| Age, per 10 years increase in age | 0.80 | 0.73‐0.87 | 0.001 |
| Year of discharge | |||
| 2012 | 0.47 | 0.34‐0.67 | 0.001 |
| 2013 | 1.10 | 0.84‐1.43 | 0.493 |
| 2014 | Ref | ||
| Race/ethnicity | |||
| White non‐Hispanic | Ref | ||
| Black non‐Hispanic | 0.89 | 0.64‐1.22 | 0.454 |
| Hispanic | 1.01 | 0.70‐1.46 | 0.952 |
| Asian | 0.85 | 0.40‐1.83 | 0.679 |
| Other or unknown | 1.29 | 0.73‐2.26 | 0.378 |
| Insurance | |||
| Medicare | Ref | ||
| Medicaid | 1.99 | 1.29‐3.05 | 0.002 |
| Dual | 1.06 | 0.72‐1.57 | 0.765 |
| Private | 1.13 | 0.70‐1.82 | 0.620 |
| Indigent/self‐pay | 1.66 | 0.95‐2.88 | 0.073 |
| Other | 0.96 | 0.47‐1.96 | 0.908 |
| Discharge disposition | |||
| Home with self‐care | Ref | ||
| Home with home health | 4.48 | 3.10‐6.48 | 0.001 |
| Hospicehome or inpatient | 2.11 | 0.98‐4.55 | 0.057 |
| Postacute‐care facility or LTAC | 10.37 | 6.92‐15.56 | 0.001 |
| Expired | 5.38 | 2.27‐12.75 | 0.001 |
| Other | 4.04 | 2.64‐6.18 | 0.001 |
| No. of admission medications | 1.00 | 0.99‐1.02 | 0.775 |
| Primary diagnosis by ICD‐9 code | |||
| Sepsis, unspecified | 1.11 | 0.78‐1.58 | 0.575 |
| MSSA septicemia | 2.44 | 0.68‐8.67 | 0.074 |
| MRSA septicemia | 8.83 | 1.72‐45.36 | 0.009 |
| Alcoholic cirrhosis of the liver | 1.25 | 0.43‐3.65 | 0.687 |
| Palliative care consult | 4.63 | 2.86‐7.49 | 0.001 |
| ICU stay | 6.66 | 5.22‐8.50 | 0.001 |
| Surgical procedure | 5.04 | 3.90‐6.52 | 0.001 |
Sensitivity analyses using LOS >14 and >30 days yielded similar results to LOS >21 days (see Supporting Appendix Table 1 in the online version of this article).
DISCUSSION
We found that a small proportion of medicine patients with prolonged hospitalizations contributed substantially to both total inpatient days and average inpatient LOS. Such disproportionate healthcare utilization is concerning in light of the Institute of Medicine's charge for health systems to deliver timely, efficient, and equitable care.[11]
Few studies in the United States have analyzed patient characteristics that predict prolonged LOS, and to our knowledge, none have evaluated prolonged LOS specifically in general medicine patients.[12, 13, 14] Among selected surgical populations, prolonged hospitalizations are most often related to placement difficulties, operational delays, and payer‐related issues, rather than severity of illness, baseline comorbidities, or in‐hospital complications.[12, 13] In our study, we found that patients with prolonged LOS were more likely to require a palliative care consult, ICU stay, or surgery, all proxies for disease severity. Patients with prolonged LOS were also more likely to undergo surgery >24 hours after admission than those without prolonged LOS, suggesting that the former were either too unstable to proceed directly to surgery or developed complications later during their hospitalization. Even after controlling for palliative care consults, ICU stays, and surgeries, placement at a postacute‐care facility was strongly associated with prolonged LOS. Patients with prolonged LOS were also more likely to have Medicaid compared to other insurance types.
Our findings have several potential implications for efforts aimed at decreasing the number of and length of prolonged hospitalizations. Although demographic and clinical factors such as Medicaid insurance, ICU stays, and surgeries are generally not modifiable, they could, particularly in combination, be used to trigger earlier and more intensive case management involvement. A streamlined insurance approval process for Medicaid pending inpatients could be beneficial, given the recent expansion of Medicaid eligibility under the ACA. Hospital partnerships with postacute‐care facilities could also relieve bottlenecks in placement.[8] Chart review of the patients with MRSA septicemia and prolonged LOS indicated that development of an intensive outpatient parenteral antimicrobial therapy pathway with substance abuse counseling could provide an alternative to extended inpatient treatment for intravenous drug users with complicated infections.[15]
This study has several limitations. First, given the lack of consensus in the literature regarding the definition of a prolonged hospitalization, it is difficult to directly compare our results with existing studies.[8, 12, 13, 14] However, we believe LOS >21 days to be a meaningful cutoff for our cohort. Most demographic and clinical variables that were predictive at >21 days were also predictive at >14 and >30 days, which reassured us that the relationship between variables and prolonged LOS was stable at different thresholds. Second, our database did not allow us to fully adjust for baseline comorbidities or categorize the reasons for discharge delays. Finally, this was a single‐center program evaluation. Although this limits generalization to other institutions, we believe our approach may serve as a guide for others interested in reducing prolonged hospitalizations.
In summary, prolonged hospitalizations represent a potentially high‐yield target for LOS reduction efforts. Prolonged hospitalizations among medicine patients at our institution particularly affected Medicaid enrollees with complex hospital stays who were not discharged home. Further studies are needed to determine the specific reasons for unnecessary hospital days in this population.
Acknowledgements
The authors thank Essey Yirdaw for her contributions to the building and management of the database that informed this work.
Disclosure: M.E.A. conceived of the study concept and design and drafted the manuscript. J.J.G. assisted with the study design and made critical revisions to the final manuscript. D.A., R.P., and R.C. assisted with the study design and made critical revisions to the manuscript. C.D.J. assisted with the study design, performed data analyses, and made critical revisions to the manuscript. RC has disclosed that her time is funded by a National Institutes of Health grant unrelated to this study. A modified abstract was presented in poster format at the Society of Hospital Medicine Research, Innovations, and Vignettes Competition 2015 Annual Meeting, held March 29 April 1, 2015, in National Harbor, Maryland. The authors have no conflicts of interest to disclose.
- , , , et al. Excess hospitalization days in an academic medical center: perceptions of hospitalists and discharge planners. Am J Manag Care. 2011;17(2):e34–e42.
- , , A prospective study of reasons for prolonged hospitalizations on a general medicine teaching service. J Gen Intern Med. 2005;20(2):108–115.
- , , , et al. Adoption of electronic health records grows rapidly, but fewer than half of U.S. hospitals had at least a basic system in 2012. Health Aff (Millwood). 2013;32(8):1478–1485.
- , , , et al. Observation and inpatient status: clinical impact of the 2‐midnight rule. J Hosp Med. 2014;9(4):203–209.
- , , Impact of insurance expansion on hospital uncompensated care costs in 2014. Department of Health and Human Services Office of the Assistant Secretary for Planning and Evaluation. Available at: http://aspe.hhs.gov/health/reports/2014/uncompensatedcare/ib_uncompensatedcare.pdf. Accessed March 28, 2015.
- , , , Using real‐time demand capacity management to improve hospital‐wide patient flow. Jt Comm J Qual Patient Saf. 2011;37(5):217–227.
- , , , , , Natural history of late discharges from a general medical ward. J Hosp Med. 2009;4(4):226–233.
- , , , Addressing hospital length of stay outlier patients: a community‐wide approach. Adv Biosci Biotechol. 2014;5:188–196.
- , American medical home runs. Health Aff (Millwood). 2009;28(5):1317–1326.
- The hot spotters: can we lower medical costs by giving the neediest patients better care? New Yorker. January 2011:40–51.
- Institute of Medicine. Crossing the Quality Chasm. Washington, DC: National Academies Press; 2001.
- , , , et al. Excessively long hospital stays after trauma are not related to the severity of illness: let's aim to the right target! JAMA Surg. 2013;148(1):956–961.
- , , Extended length of stay after surgery: complications, inefficient practice, or sick patients? JAMA Surg. 2014;149(8):815–820.
- , , , , Nonmedical factors associated with prolonged hospital length of stay in an urban homebound population. J Hosp Med. 2012;7(2):73–78.
- , , , Safe and successful treatment of intravenous drug users with a peripherally inserted central catheter in an outpatient parenteral antibiotic treatment service. J Antimicrob Chemother. 2010;65(12):2641–2644.
Prevalence of the Use of PIVCs
Peripheral intravenous catheters (PIVCs) are ubiquitous devices that can have serious complications including bloodstream infections.[1] The annual use of PIVCs in North America has been reported to be in excess of 330 million. The estimated number of PIVCs used across greater Europe or other regions of the world is largely unknown, although estimates from global device sales have been reported to be approximately 1.2 billion.[1, 2]
Robust data on the prevalence of PIVCs and their associated management and infection prevention practices remain poor in Western countries; even more concerning is that PIVC data in developing nations remain relatively unknown.[3] Healthcare‐associated infection rates are significantly higher in developing nations, where the lack of resources and staff training can contribute to poor PIVC insertion and management.[4, 5]
There are currently scant data on PIVC management practices across different regions of the world. Localized complication rates such as phlebitis and infiltration are an under‐reported problem, yet are known to be a contributing factor for PIVC failure that leads to premature cessation of intravenous (IV) therapy, device removal, and the requirement for resiting of a new PIVC. Such failure can lead to delays in IV therapy, increased length of hospital stay, and cost.[6] Importantly, it can also lead to patient‐reported anxiety and pain. This lack of information has made it difficult to identify contributing factors for PIVC failure that may include inserter characteristics, patient‐related factors, and anatomical placement as well as healthcare facility adherence to international best practice and infection prevention guidelines.[6, 7]
The aim of this study was to undertake a multicenter, international study to assess the prevalence of PIVCs across different countries, to review population and PIVC characteristics from different regions of the world, and ascertain whether a larger study would provide beneficial data. The data of interest for this study included: (1) prevalence of PIVC use, (2) patient and PIVC characteristics, (3) prevalence of localized symptoms such as phlebitis, and (4) PIVC securement and dressing practices.
MATERIALS AND METHODS
Study Design and Participants
Participating hospitals were sourced through the authors international networks and specialist organizations in vascular access (such as the Association for Vascular Access in the United States and the World Congress in Vascular Access in Europe). A convenience sampling method was used for this point prevalence study. Participating sites were instructed to choose inpatient wards with medical or surgical patients and were asked to collect data on as many patients as possible with a PIVC in place on a given day. This method of patient recruitment was used due to the nature of the collaboration with participating sites; workload constraints dictated final sample numbers, as no funding was available. Sampling of general medical or surgical patients was expected to yield the greatest number of PIVCs compared to higher acuity areas.
The study was approved by the Human Research Ethics Committee of Griffith University (Queensland, Australia), with each participating organization required to comply with local ethical and regulatory requirements prior to participation. For the purpose of the study, only adult patients were screened, and all were required to give verbal or written informed consent prior to assessment of the PIVC.
A site questionnaire identified organizational characteristics regarding resource allocation and clinician training for insertion and management of PIVCs. The patient case report form (CRF) elicited information on patient demographics, characteristics of the PIVC, site assessment, and dressing and securement assessment. The CRF provided standardized assessment criteria. The Strengthening the Reporting of Observational Studies in Epidemiology guidelines for cross‐sectional studies were followed, and results are presented following these recommendations.
Statistical Analysis
Statistical software (SAS version 9.1; SAS Institute, Inc., Cary, NC) was used with results stratified into individual countries and regions. Proportions were used (with total number of PIVCs as the denominator) to present the data on PIVC characteristics. Data describing the prevalence of PIVC by country used individual country totals for derivation of a denominator.
RESULTS
Prevalence of PIVC Use
Fourteen sites in 13 countries contributed to this study (including 2 sites in the United States). The regions of Oceania, North and South America, Europe, and Asia were all represented. A total of 479 patients across all sites were screened for the presence of a PIVC. On the day of the study, the PIVC prevalence was 59% (n=281), with a range of 24% to 100%; only 1 patient across the entire cohort had more than 1 PIVC in place on the day of the study. The prevalence of patients with a vascular access device (VAD) other than a PIVC (eg, centrally or peripherally inserted central venous catheters) was 16% (n=76), and a quarter (n=122, 25%) of the patients screened had no VAD in place (Table 1).
| Region/Country | PIVC, n (%) | Other VAD, n (%) | No IV, n (%) | Total Patients, n |
|---|---|---|---|---|
| ||||
| North America | ||||
| Canada | 10 (48) | 11 (52) | 0 | 21 |
| United States of America | 16 (64) | 9 (36) | 0 | 25 |
| Latin America | ||||
| Argentina | 50 (79) | 3 (5) | 10 (16) | 63 |
| Western Europe | ||||
| England | 23 (100) | 0 | 0 | 23 |
| Greece | 5 (71) | 2 (29) | 0 | 7 |
| Italy | 12 (34) | 9 (26) | 14 (40) | 35 |
| Malta | 18 (78) | 0 | 5 (22) | 23 |
| Scotland | 12 (100) | 0 | 0 | 12 |
| Spain | 59 (83) | 3 (4) | 9 (13) | 71 |
| Asia | ||||
| China | 23 (24) | 24 (26) | 46 (50) | 93 |
| India | 16 (73) | 2 (9) | 4 (18) | 22 |
| Oceania | ||||
| Australia | 18 (37) | 13 (26) | 18 (37) | 49 |
| New Zealand | 19 (54) | 0 | 16 (46) | 35 |
The study sites in Spain and Argentina were among the countries that screened the largest number of patients and had a similar prevalence of PIVC use (83% and 79%, respectively, Table 1). The study site in China, which screened the highest number of patients overall (n=93), had the lowest PIVC prevalence at only 24%; this site also had the highest proportion of patients with no device at all (50%).
PIVC Characteristics
Overall, PIVC gauge preference was between 18 gauge and 22 gauge; this comprised 95% of all PIVCs in place across the regions. The forearm was the preferential choice for the regions of North America and Asia, with approximately half of PIVCs placed in this area. Notably, most PIVCs were inserted by nurses or specialty vascular access teams (Table 2), with medical practitioner insertions reported in only 2 regions (Western Europe and Oceania). Overall, most PIVCs were inserted in the general wards (91%). No PIVCs were found to have been inserted in the emergency room on the day of the study, although they could be represented in the unknown category.
| Population Group* | Region | |||||
|---|---|---|---|---|---|---|
| North America | Latin America | Western Europe | Asia | Oceania | Total | |
| ||||||
| Total PIVCs, n (%) | 26 (9) | 50 (18) | 129 (46) | 39 (14) | 37 (13) | 281 (100) |
| Age, mean (SD), y | 58 (16) | 51 (17) | 66 (19) | 51 (19) | 68 (17) | 59 (18) |
| Total men, n (%) | 11 (42) | 26 (52) | 72 (56) | 19 (49) | 25 (68) | 154 (55) |
| Hospital category, n (%) | ||||||
| Medical | 23 (89) | 19 (38) | 96 (74) | 28 (72) | 13 (35) | 179 (63) |
| Surgical | 0 | 23 (46) | 30 (23) | 3 (8) | 16 (43) | 72 (26) |
| Oncology | 0 | 0 | 3 (2) | 8 (20) | 8 (22) | 19 (7) |
| Intensive/coronary care | 3 (11) | 8 (16) | 0 | 0 | 0 | 11 (4) |
| PIVC inserted by, n (%) | ||||||
| Specialist team | 14 (54) | 8 (16) | 19 (15) | 0 | 27 (72) | 68 (24) |
| Nurse | 12 (47) | 42 (84) | 88 (68) | 39 (100.0) | 2 (5.0) | 183 (65) |
| Doctor | 0 | 0 | 22 (17) | 0 | 7 (19) | 29 (10) |
| Technician | 0 | 0 | 0 | 0 | 1 (3) | 1 (1) |
| Where PIVC was inserted, n (%) | ||||||
| Ward | 22 (85) | 42 (84) | 124 (96) | 39 (100.0) | 28 (76) | 255 (91) |
| Intensive/coronary care | 3 (12) | 8 (16) | 0 | 0 | 0 | 11 (4) |
| Unknown | 1 (4) | 0 | 5 (4) | 0 | 9 (24) | 15 (5) |
| Current IV fluid orders, n (%) | ||||||
| Yes | 10 (38) | 27 (54) | 62 (48) | 33 (85) | 14 (38) | 146 (52) |
| Current IV meds orders, n (%) | ||||||
| Yes | 22 (85) | 40 (80) | 93 (72) | 37 (95) | 16 (43) | 208 (74) |
| No IV or meds order, n (%) | ||||||
| Yes | 3 (12) | 6 (12) | 20 (16) | 1 (3) | 16 (43) | 46 (16) |
| Dressing quality, n (%) | ||||||
| Clean and intact | 25 (96) | 43 (86) | 98 (76) | 35 (90) | 25 (68) | 226 (80) |
| Moist or soiled | 0 | 2 (4) | 17 (13) | 1 (2) | 3 (8) | 23 (8) |
| Loose or lifting | 1 (4) | 5 (10) | 14 (11) | 3 (8) | 9 (24) | 32 (12) |
| Symptoms of phlebitis, n (%) | ||||||
| None | 25 (96) | 44 (88) | 114 (88) | 32 (82) | 36 (97) | 251 (89) |
| Pain or tenderness | 0 | 3 (6) | 5 (4) | 0 | 0 | 8 (3) |
| Redness | 0 | 0 | 7 (5) | 2 (5) | 0 | 9 (3) |
| Swelling | 1 (4) | 3 (6) | 2 (2) | 1 (3) | 0 | 7 (3) |
| Other | 0 | 0 | 1 (1) | 4 (10) | 1 (3) | 6 (2) |
There were disparate results across the regions for whether patients had a documented IV fluid order or IV medication order. The Asian region had the highest proportion of documented IV fluid and medication orders (85% and 95%, respectively) for patients with a PIVC. The lowest proportions of documented IV fluid and medication orders were from Oceania (38% and 43%, respectively). This region also had the highest number of PIVCs with neither IV nor medication order (43%). The overall study incidence of redundant PIVCs with no IV orders was 16%.
Most PIVC sites assessed had no symptoms of phlebitis; although every region had some patients with at least 1 sign (range: 3%12%). PIVC dressings were primarily clean and intact (n=226, 80%); however, the Oceania region had the highest proportion of dressings that were loose or lifting (24%). Dressing selection was homogenous in North America, Latin America, and Asia, where study sites exclusively used borderless transparent polyurethane dressings. A small proportion (9%) of patients in Western Europe had gauze and tape dressings.
Five of the 14 sites (36%) had a dedicated IV team, and most hospitals had dedicated PIVC insertion training for nursing staff (n=10, 71%). In contrast, only 43% (n=6) of sites provided PIVC insertion training for medical staff. Some facilities also used specially trained technicians to undertake cannulation (n=6, 43%). Most sites had policies for care and maintenance of PIVCs (n=12, 86%) and predominantly prescribed routine replacement of PIVCs every 72 to 96 hours (n=11, 83%). No sites exclusively prescribed leaving PIVCs in place until clinically indicated for removal, although some provided this as an option for certain patients.
DISCUSSION
This study has shown variation in the prevalence, characteristics, and management practices of PIVCs across sites from different regions of the world. Estimates for global PIVC prevalence in hospitalized patients vary widely from 30% to 80%.[8, 9, 10] The overall prevalence of PIVCs in this pilot study at 59% lay in the midrange of those reported in recent literature,[11] yet we found disproportionate PIVC prevalence between sites and regions. This heterogeneity could be explained by a number of factors including cohort acuity, clinician preference, and hospital guidelines. The generalizability of results from participating hospitals to their country is limited, because in most countries only a single institution participated.
Insertion of PIVCs was mainly by nurses, except in the Oceania region, where specialist teams and medical staff were the primary inserters. Of concern was the disparity in training provided by sites, with medical staff being less likely to receive instruction in how to prevent infection during this important procedure. A larger study would be needed to understand the effect on patient and infection outcomes of different inserter models and training provided.
A small proportion of patients from a site in Western Europe were observed to have gauze and tape as the PIVC dressing. The preference for gauze and tape is not common in developed nations, although recommended in clinical practice guidelines as an acceptable option.[12] There is currently no strong evidence to suggest that any 1 dressing or securement device to secure PIVCs is more effective than any other.[13] Nearly a quarter of PIVCs were loose or lifting from the Oceania region, this is of concern as interrupted dressings have been shown to increase the risk of catheter failure and catheter‐related bloodstream infection.[14]
We found that 17% of PIVCs overall had no IV order for fluids or medication. This proportion of redundant catheters increases the burden of preventable intravascular infection.[15] The prevalence of unnecessary PIVCs was lowest in Asia and greatest in the Oceania region, where 43% had no documented IV orders.
We reported PIVC prevalence from only a small number of nonrepresentative international sites for the purpose of considering a larger prevalence study. Observed differences in PIVC care and management cannot be generalized to entire regions. We asked sites to focus on medicalsurgical wards, and as such some PIVCs in higher acuity areas were likely not included. A larger study will help to assess PIVC outcomes and contributing factors for any differences, and improve external validity.
Operational challenges also may have affected sample selection and size. This was an unfunded study undertaken by hospital investigators, with competing workload demands. Poor or slow internet connection at the bedside was reported by every participating site, and may have contributed to the small numbers of patients screened at some sites.
CONCLUSION
More than half of hospitalized patients screened internationally had a PIVC, and 1 in 4 patients had no VAD, with wide variability from country to country both in prevalence and practice. The data gained have provided valuable initial insights into the global variation in PIVC use and care, and confirm that a larger international study with multiple sites is warranted. In particular, it remains important to understand variations in PIVC use and whether country or regional trends increase the risk of infection.
Acknowledgements
The authors thank the following collaborators for assisting in the collection of the data for this pilot study: Argentina: Laura Alberto, Fabio Castel, Estela Farias, and Carlos Daz; Australia: Nicholas Mifflin and Timothy Spencer; Canada: Jocelyn Hill; China: Lili Jin; Greece: Evangelos Konstantinou and Theodoros Katsoulas; India: Gracy Joseph and Sojan Ipe; Italy: Giancarlo Scoppettuolo and Laura Dolcetti; Malta: Michael Borg and Elmira Tartari; New Zealand: Ruth Barratt; Scotland: Linda Kelly and Audrey Green; Spain: Sonia Casanova, Jos Luis Mic, and Vicenta Solaz; England: Sheila Inwood; United States: Julie Jefferson and Janette Whitley.
Disclosures
All authors have made substantial contributions to the study conception and design, acquisition of the data, and analysis and interpretation of the data. Each author has contributed to drafting and editing the manuscript and approved the final version for publishing as per the International Committee of Medical Journal Editors convention. The authors wish to declare they have received unrestricted investigator‐initiated research grants from Becton Dickinson (BD) and 3M. The investigators also received professional translation services for most languages that were funded by B. Braun. All funds have been made payable to Griffith University and not to researchers themselves. These funders played no role in the conception, design, execution, analysis or reporting of the study. BD, 3M, CareFusion, Smiths Medical, B Braun, Vygon, and Teleflex assisted in disseminating study information and assisting with translation of data forms where necessary. No commercial entity had any involvement in the design, execution and analysis, or reporting of the study. Evan Alexandrou has provided education services for CareFusion, Teleflex, Cook Medical, and 3M. Peter Carr is undertaking a PhD, which is partly funded by BD. He has received payment for educational lectures from CareFusion. Claire Rickard's department (Griffith University) has received investigator‐initiated, unrestricted research/educational grants from suppliers of vascular access device products including: 3M, BD, CareFusion, and Centurion. Claire Rickard has undertaken contract research or educational lectures for Bard, BBraun, BD, CareFusion, and Teleflex. Sheila Inwood is an employee of CareFusion. Leonard Mermel has received research funding from Theravance, Astellas Pharma, Marvao Medical, and CareFusion, and he has been a consultant for 3M, CareFusion, Catheter Connections, Fresenius Medical, Marvao Medical, Bard Access, and ICU Medical.
- , . Peripheral venous catheters: an under‐evaluated problem. Int J Antimicrob Agents. 2009;34:S38–S42.
- PR Newswire. Global peripheral I.V. catheter market 2014–2018. Available at: http://www.prnewswire.com/news-releases/global-peripheral-iv-catheter-market-2014-2018-257019061.html. Accessed April 28, 2015.
- , , , et al. Burden of endemic health‐care‐associated infection in developing countries: systematic review and meta‐analysis. Lancet. 2011;377(9761):228–241.
- , , , . The attributable cost, length of hospital stay, and mortality of central line‐associated bloodstream infection in intensive care departments in Argentina: a prospective, matched analysis. Am J Infect Control. 2003;31(8):475–480.
- , , , , . Health‐care‐associated infection in Africa: a systematic review. Bull World Health Organ. 2011;89(10):757–765.
- , , , , , . Risk factors for PIV catheter failure: a multivariate analysis from a randomized control trial. InfectControl Hosp Epidemiol. 2014;35(1):63–68.
- , . Intravenous catheter complications in the hand and forearm. J Trauma. 2004;56(1):123–127.
- , , . The Auckland City Hospital Device Point Prevalence Survey 2005: utilisation and infectious complications of intravascular and urinary devices. NZ Med J. 2007;120(1260):U2683.
- , , , et al. Prospective surveillance of phlebitis associated with peripheral intravenous catheters. Am J Infect Control. 2006;34(5):308–312.
- , , , et al. Clinical epidemiology and outcomes of peripheral venous catheter‐related bloodstream infections at a university‐affiliated hospital. J Hosp Infect. 2007;67(1):22–29.
- , , , , . Gauze and tape and transparent polyurethane dressings for central venous catheters. Cochrane Database Syst Rev. 2011;(11):CD003827.
- , , , , , . Gauze and tape and transparent polyurethane dressings for central venous catheters. Cochrane Database Syst Rev. 2003;(4):CD003827.
- , , , , , . Central venous catheter dressings: a systematic review. J Adv Nurs. 2003;44(6):623–632.
- , , , et al. Dressing disruption is a major risk factor for catheter‐related infections. Crit Care Med. 2012;40(6):1707–1714.
- , , , . The idle intravenous catheter. Ann Intern Med. 1992;116(9):737–738.
Peripheral intravenous catheters (PIVCs) are ubiquitous devices that can have serious complications including bloodstream infections.[1] The annual use of PIVCs in North America has been reported to be in excess of 330 million. The estimated number of PIVCs used across greater Europe or other regions of the world is largely unknown, although estimates from global device sales have been reported to be approximately 1.2 billion.[1, 2]
Robust data on the prevalence of PIVCs and their associated management and infection prevention practices remain poor in Western countries; even more concerning is that PIVC data in developing nations remain relatively unknown.[3] Healthcare‐associated infection rates are significantly higher in developing nations, where the lack of resources and staff training can contribute to poor PIVC insertion and management.[4, 5]
There are currently scant data on PIVC management practices across different regions of the world. Localized complication rates such as phlebitis and infiltration are an under‐reported problem, yet are known to be a contributing factor for PIVC failure that leads to premature cessation of intravenous (IV) therapy, device removal, and the requirement for resiting of a new PIVC. Such failure can lead to delays in IV therapy, increased length of hospital stay, and cost.[6] Importantly, it can also lead to patient‐reported anxiety and pain. This lack of information has made it difficult to identify contributing factors for PIVC failure that may include inserter characteristics, patient‐related factors, and anatomical placement as well as healthcare facility adherence to international best practice and infection prevention guidelines.[6, 7]
The aim of this study was to undertake a multicenter, international study to assess the prevalence of PIVCs across different countries, to review population and PIVC characteristics from different regions of the world, and ascertain whether a larger study would provide beneficial data. The data of interest for this study included: (1) prevalence of PIVC use, (2) patient and PIVC characteristics, (3) prevalence of localized symptoms such as phlebitis, and (4) PIVC securement and dressing practices.
MATERIALS AND METHODS
Study Design and Participants
Participating hospitals were sourced through the authors international networks and specialist organizations in vascular access (such as the Association for Vascular Access in the United States and the World Congress in Vascular Access in Europe). A convenience sampling method was used for this point prevalence study. Participating sites were instructed to choose inpatient wards with medical or surgical patients and were asked to collect data on as many patients as possible with a PIVC in place on a given day. This method of patient recruitment was used due to the nature of the collaboration with participating sites; workload constraints dictated final sample numbers, as no funding was available. Sampling of general medical or surgical patients was expected to yield the greatest number of PIVCs compared to higher acuity areas.
The study was approved by the Human Research Ethics Committee of Griffith University (Queensland, Australia), with each participating organization required to comply with local ethical and regulatory requirements prior to participation. For the purpose of the study, only adult patients were screened, and all were required to give verbal or written informed consent prior to assessment of the PIVC.
A site questionnaire identified organizational characteristics regarding resource allocation and clinician training for insertion and management of PIVCs. The patient case report form (CRF) elicited information on patient demographics, characteristics of the PIVC, site assessment, and dressing and securement assessment. The CRF provided standardized assessment criteria. The Strengthening the Reporting of Observational Studies in Epidemiology guidelines for cross‐sectional studies were followed, and results are presented following these recommendations.
Statistical Analysis
Statistical software (SAS version 9.1; SAS Institute, Inc., Cary, NC) was used with results stratified into individual countries and regions. Proportions were used (with total number of PIVCs as the denominator) to present the data on PIVC characteristics. Data describing the prevalence of PIVC by country used individual country totals for derivation of a denominator.
RESULTS
Prevalence of PIVC Use
Fourteen sites in 13 countries contributed to this study (including 2 sites in the United States). The regions of Oceania, North and South America, Europe, and Asia were all represented. A total of 479 patients across all sites were screened for the presence of a PIVC. On the day of the study, the PIVC prevalence was 59% (n=281), with a range of 24% to 100%; only 1 patient across the entire cohort had more than 1 PIVC in place on the day of the study. The prevalence of patients with a vascular access device (VAD) other than a PIVC (eg, centrally or peripherally inserted central venous catheters) was 16% (n=76), and a quarter (n=122, 25%) of the patients screened had no VAD in place (Table 1).
| Region/Country | PIVC, n (%) | Other VAD, n (%) | No IV, n (%) | Total Patients, n |
|---|---|---|---|---|
| ||||
| North America | ||||
| Canada | 10 (48) | 11 (52) | 0 | 21 |
| United States of America | 16 (64) | 9 (36) | 0 | 25 |
| Latin America | ||||
| Argentina | 50 (79) | 3 (5) | 10 (16) | 63 |
| Western Europe | ||||
| England | 23 (100) | 0 | 0 | 23 |
| Greece | 5 (71) | 2 (29) | 0 | 7 |
| Italy | 12 (34) | 9 (26) | 14 (40) | 35 |
| Malta | 18 (78) | 0 | 5 (22) | 23 |
| Scotland | 12 (100) | 0 | 0 | 12 |
| Spain | 59 (83) | 3 (4) | 9 (13) | 71 |
| Asia | ||||
| China | 23 (24) | 24 (26) | 46 (50) | 93 |
| India | 16 (73) | 2 (9) | 4 (18) | 22 |
| Oceania | ||||
| Australia | 18 (37) | 13 (26) | 18 (37) | 49 |
| New Zealand | 19 (54) | 0 | 16 (46) | 35 |
The study sites in Spain and Argentina were among the countries that screened the largest number of patients and had a similar prevalence of PIVC use (83% and 79%, respectively, Table 1). The study site in China, which screened the highest number of patients overall (n=93), had the lowest PIVC prevalence at only 24%; this site also had the highest proportion of patients with no device at all (50%).
PIVC Characteristics
Overall, PIVC gauge preference was between 18 gauge and 22 gauge; this comprised 95% of all PIVCs in place across the regions. The forearm was the preferential choice for the regions of North America and Asia, with approximately half of PIVCs placed in this area. Notably, most PIVCs were inserted by nurses or specialty vascular access teams (Table 2), with medical practitioner insertions reported in only 2 regions (Western Europe and Oceania). Overall, most PIVCs were inserted in the general wards (91%). No PIVCs were found to have been inserted in the emergency room on the day of the study, although they could be represented in the unknown category.
| Population Group* | Region | |||||
|---|---|---|---|---|---|---|
| North America | Latin America | Western Europe | Asia | Oceania | Total | |
| ||||||
| Total PIVCs, n (%) | 26 (9) | 50 (18) | 129 (46) | 39 (14) | 37 (13) | 281 (100) |
| Age, mean (SD), y | 58 (16) | 51 (17) | 66 (19) | 51 (19) | 68 (17) | 59 (18) |
| Total men, n (%) | 11 (42) | 26 (52) | 72 (56) | 19 (49) | 25 (68) | 154 (55) |
| Hospital category, n (%) | ||||||
| Medical | 23 (89) | 19 (38) | 96 (74) | 28 (72) | 13 (35) | 179 (63) |
| Surgical | 0 | 23 (46) | 30 (23) | 3 (8) | 16 (43) | 72 (26) |
| Oncology | 0 | 0 | 3 (2) | 8 (20) | 8 (22) | 19 (7) |
| Intensive/coronary care | 3 (11) | 8 (16) | 0 | 0 | 0 | 11 (4) |
| PIVC inserted by, n (%) | ||||||
| Specialist team | 14 (54) | 8 (16) | 19 (15) | 0 | 27 (72) | 68 (24) |
| Nurse | 12 (47) | 42 (84) | 88 (68) | 39 (100.0) | 2 (5.0) | 183 (65) |
| Doctor | 0 | 0 | 22 (17) | 0 | 7 (19) | 29 (10) |
| Technician | 0 | 0 | 0 | 0 | 1 (3) | 1 (1) |
| Where PIVC was inserted, n (%) | ||||||
| Ward | 22 (85) | 42 (84) | 124 (96) | 39 (100.0) | 28 (76) | 255 (91) |
| Intensive/coronary care | 3 (12) | 8 (16) | 0 | 0 | 0 | 11 (4) |
| Unknown | 1 (4) | 0 | 5 (4) | 0 | 9 (24) | 15 (5) |
| Current IV fluid orders, n (%) | ||||||
| Yes | 10 (38) | 27 (54) | 62 (48) | 33 (85) | 14 (38) | 146 (52) |
| Current IV meds orders, n (%) | ||||||
| Yes | 22 (85) | 40 (80) | 93 (72) | 37 (95) | 16 (43) | 208 (74) |
| No IV or meds order, n (%) | ||||||
| Yes | 3 (12) | 6 (12) | 20 (16) | 1 (3) | 16 (43) | 46 (16) |
| Dressing quality, n (%) | ||||||
| Clean and intact | 25 (96) | 43 (86) | 98 (76) | 35 (90) | 25 (68) | 226 (80) |
| Moist or soiled | 0 | 2 (4) | 17 (13) | 1 (2) | 3 (8) | 23 (8) |
| Loose or lifting | 1 (4) | 5 (10) | 14 (11) | 3 (8) | 9 (24) | 32 (12) |
| Symptoms of phlebitis, n (%) | ||||||
| None | 25 (96) | 44 (88) | 114 (88) | 32 (82) | 36 (97) | 251 (89) |
| Pain or tenderness | 0 | 3 (6) | 5 (4) | 0 | 0 | 8 (3) |
| Redness | 0 | 0 | 7 (5) | 2 (5) | 0 | 9 (3) |
| Swelling | 1 (4) | 3 (6) | 2 (2) | 1 (3) | 0 | 7 (3) |
| Other | 0 | 0 | 1 (1) | 4 (10) | 1 (3) | 6 (2) |
There were disparate results across the regions for whether patients had a documented IV fluid order or IV medication order. The Asian region had the highest proportion of documented IV fluid and medication orders (85% and 95%, respectively) for patients with a PIVC. The lowest proportions of documented IV fluid and medication orders were from Oceania (38% and 43%, respectively). This region also had the highest number of PIVCs with neither IV nor medication order (43%). The overall study incidence of redundant PIVCs with no IV orders was 16%.
Most PIVC sites assessed had no symptoms of phlebitis; although every region had some patients with at least 1 sign (range: 3%12%). PIVC dressings were primarily clean and intact (n=226, 80%); however, the Oceania region had the highest proportion of dressings that were loose or lifting (24%). Dressing selection was homogenous in North America, Latin America, and Asia, where study sites exclusively used borderless transparent polyurethane dressings. A small proportion (9%) of patients in Western Europe had gauze and tape dressings.
Five of the 14 sites (36%) had a dedicated IV team, and most hospitals had dedicated PIVC insertion training for nursing staff (n=10, 71%). In contrast, only 43% (n=6) of sites provided PIVC insertion training for medical staff. Some facilities also used specially trained technicians to undertake cannulation (n=6, 43%). Most sites had policies for care and maintenance of PIVCs (n=12, 86%) and predominantly prescribed routine replacement of PIVCs every 72 to 96 hours (n=11, 83%). No sites exclusively prescribed leaving PIVCs in place until clinically indicated for removal, although some provided this as an option for certain patients.
DISCUSSION
This study has shown variation in the prevalence, characteristics, and management practices of PIVCs across sites from different regions of the world. Estimates for global PIVC prevalence in hospitalized patients vary widely from 30% to 80%.[8, 9, 10] The overall prevalence of PIVCs in this pilot study at 59% lay in the midrange of those reported in recent literature,[11] yet we found disproportionate PIVC prevalence between sites and regions. This heterogeneity could be explained by a number of factors including cohort acuity, clinician preference, and hospital guidelines. The generalizability of results from participating hospitals to their country is limited, because in most countries only a single institution participated.
Insertion of PIVCs was mainly by nurses, except in the Oceania region, where specialist teams and medical staff were the primary inserters. Of concern was the disparity in training provided by sites, with medical staff being less likely to receive instruction in how to prevent infection during this important procedure. A larger study would be needed to understand the effect on patient and infection outcomes of different inserter models and training provided.
A small proportion of patients from a site in Western Europe were observed to have gauze and tape as the PIVC dressing. The preference for gauze and tape is not common in developed nations, although recommended in clinical practice guidelines as an acceptable option.[12] There is currently no strong evidence to suggest that any 1 dressing or securement device to secure PIVCs is more effective than any other.[13] Nearly a quarter of PIVCs were loose or lifting from the Oceania region, this is of concern as interrupted dressings have been shown to increase the risk of catheter failure and catheter‐related bloodstream infection.[14]
We found that 17% of PIVCs overall had no IV order for fluids or medication. This proportion of redundant catheters increases the burden of preventable intravascular infection.[15] The prevalence of unnecessary PIVCs was lowest in Asia and greatest in the Oceania region, where 43% had no documented IV orders.
We reported PIVC prevalence from only a small number of nonrepresentative international sites for the purpose of considering a larger prevalence study. Observed differences in PIVC care and management cannot be generalized to entire regions. We asked sites to focus on medicalsurgical wards, and as such some PIVCs in higher acuity areas were likely not included. A larger study will help to assess PIVC outcomes and contributing factors for any differences, and improve external validity.
Operational challenges also may have affected sample selection and size. This was an unfunded study undertaken by hospital investigators, with competing workload demands. Poor or slow internet connection at the bedside was reported by every participating site, and may have contributed to the small numbers of patients screened at some sites.
CONCLUSION
More than half of hospitalized patients screened internationally had a PIVC, and 1 in 4 patients had no VAD, with wide variability from country to country both in prevalence and practice. The data gained have provided valuable initial insights into the global variation in PIVC use and care, and confirm that a larger international study with multiple sites is warranted. In particular, it remains important to understand variations in PIVC use and whether country or regional trends increase the risk of infection.
Acknowledgements
The authors thank the following collaborators for assisting in the collection of the data for this pilot study: Argentina: Laura Alberto, Fabio Castel, Estela Farias, and Carlos Daz; Australia: Nicholas Mifflin and Timothy Spencer; Canada: Jocelyn Hill; China: Lili Jin; Greece: Evangelos Konstantinou and Theodoros Katsoulas; India: Gracy Joseph and Sojan Ipe; Italy: Giancarlo Scoppettuolo and Laura Dolcetti; Malta: Michael Borg and Elmira Tartari; New Zealand: Ruth Barratt; Scotland: Linda Kelly and Audrey Green; Spain: Sonia Casanova, Jos Luis Mic, and Vicenta Solaz; England: Sheila Inwood; United States: Julie Jefferson and Janette Whitley.
Disclosures
All authors have made substantial contributions to the study conception and design, acquisition of the data, and analysis and interpretation of the data. Each author has contributed to drafting and editing the manuscript and approved the final version for publishing as per the International Committee of Medical Journal Editors convention. The authors wish to declare they have received unrestricted investigator‐initiated research grants from Becton Dickinson (BD) and 3M. The investigators also received professional translation services for most languages that were funded by B. Braun. All funds have been made payable to Griffith University and not to researchers themselves. These funders played no role in the conception, design, execution, analysis or reporting of the study. BD, 3M, CareFusion, Smiths Medical, B Braun, Vygon, and Teleflex assisted in disseminating study information and assisting with translation of data forms where necessary. No commercial entity had any involvement in the design, execution and analysis, or reporting of the study. Evan Alexandrou has provided education services for CareFusion, Teleflex, Cook Medical, and 3M. Peter Carr is undertaking a PhD, which is partly funded by BD. He has received payment for educational lectures from CareFusion. Claire Rickard's department (Griffith University) has received investigator‐initiated, unrestricted research/educational grants from suppliers of vascular access device products including: 3M, BD, CareFusion, and Centurion. Claire Rickard has undertaken contract research or educational lectures for Bard, BBraun, BD, CareFusion, and Teleflex. Sheila Inwood is an employee of CareFusion. Leonard Mermel has received research funding from Theravance, Astellas Pharma, Marvao Medical, and CareFusion, and he has been a consultant for 3M, CareFusion, Catheter Connections, Fresenius Medical, Marvao Medical, Bard Access, and ICU Medical.
- , . Peripheral venous catheters: an under‐evaluated problem. Int J Antimicrob Agents. 2009;34:S38–S42.
- PR Newswire. Global peripheral I.V. catheter market 2014–2018. Available at: http://www.prnewswire.com/news-releases/global-peripheral-iv-catheter-market-2014-2018-257019061.html. Accessed April 28, 2015.
- , , , et al. Burden of endemic health‐care‐associated infection in developing countries: systematic review and meta‐analysis. Lancet. 2011;377(9761):228–241.
- , , , . The attributable cost, length of hospital stay, and mortality of central line‐associated bloodstream infection in intensive care departments in Argentina: a prospective, matched analysis. Am J Infect Control. 2003;31(8):475–480.
- , , , , . Health‐care‐associated infection in Africa: a systematic review. Bull World Health Organ. 2011;89(10):757–765.
- , , , , , . Risk factors for PIV catheter failure: a multivariate analysis from a randomized control trial. InfectControl Hosp Epidemiol. 2014;35(1):63–68.
- , . Intravenous catheter complications in the hand and forearm. J Trauma. 2004;56(1):123–127.
- , , . The Auckland City Hospital Device Point Prevalence Survey 2005: utilisation and infectious complications of intravascular and urinary devices. NZ Med J. 2007;120(1260):U2683.
- , , , et al. Prospective surveillance of phlebitis associated with peripheral intravenous catheters. Am J Infect Control. 2006;34(5):308–312.
- , , , et al. Clinical epidemiology and outcomes of peripheral venous catheter‐related bloodstream infections at a university‐affiliated hospital. J Hosp Infect. 2007;67(1):22–29.
- , , , , . Gauze and tape and transparent polyurethane dressings for central venous catheters. Cochrane Database Syst Rev. 2011;(11):CD003827.
- , , , , , . Gauze and tape and transparent polyurethane dressings for central venous catheters. Cochrane Database Syst Rev. 2003;(4):CD003827.
- , , , , , . Central venous catheter dressings: a systematic review. J Adv Nurs. 2003;44(6):623–632.
- , , , et al. Dressing disruption is a major risk factor for catheter‐related infections. Crit Care Med. 2012;40(6):1707–1714.
- , , , . The idle intravenous catheter. Ann Intern Med. 1992;116(9):737–738.