User login
Inpatient Hospital Pain Management
Pain management is an integral component of patient‐centered medical care and is a major concern for patients who are hospitalized.[1] Patient‐reported ratings of pain management are highly correlated with overall satisfaction with healthcare delivery.[2] Current research indicates that patient satisfaction with pain management may be improving[3]; however, there may be structural and county‐level disparities in these improvements in satisfaction. Although patient satisfaction with pain management increased from 2008 to 2012, a discrepancy in patient satisfaction with pain management has emerged between 3 different hospital systems (safety net, acute care, critical access hospitals)[3] Specifically, acute care hospitals provide less satisfactory pain management as compared to critical access hospitals.[3] Although patients' perception of pain management is an integral part of delivering patient‐centered care, prior research indicates that there may not be a simple inverse association between pain intensity score and patient satisfaction.[4] The management of pain in hospitals continues to be problematic, perhaps, for instance, due to discrepancies in understanding the relationship between patient satisfaction and pain management. Certainly for this reason and many others, satisfaction with pain management is now one of the dimensions assessed by the Hospital Consumer Assessment of Healthcare Providers and Systems (HCAHPS) survey, which is a global measure of patient satisfaction.
The HCAHPS survey is utilized by 85% of all US‐based hospitals and gathers patient satisfaction information pertaining to 10 dimensions, including pain management. Patient satisfaction scores (via HCAHPS) now constitute 30% of Hospital Value‐Based Purchasing (HVBP), which makes up 2% of at‐risk reimbursements by the Centers for Medicare and Medicaid Services (CMS) as put forth by the Affordable Care Act (ACA) of 2010.[5] The ACA mandates that payments to hospitals must partly depend on metrics that assess patient satisfaction, as broadly measured by the HCAHPS, which are completed by patients upon hospital discharge.[5, 6] Therefore, patient satisfaction, as measured by patients, now directly affects CMS payments for over 3000 hospitals across the United States. This constitutes a large amount of money for most hospitals that operate on high revenue but have low profit margins. As such, the 2% at‐risk reimbursement may place many hospitals at financial risk that could be ameliorated with effective inpatient pain management.
In addition to its critical role in reimbursement to hospitals, patient satisfaction with pain management is also integrally related to providing patient‐centered care. As such, patient satisfaction with pain management is considered a critical element of various models of the patient‐centered approach to providing medical care. Although a medical inpatient team can assess objective signs of pain, patient‐centric pain measurements are paramount in understanding the pain experience of patients and providing adequate pain management care. Moreover, patients, doctors, payers of medical services, and now CMS increasingly regard a patient‐centered approach to medical care as crucial for the delivery of high‐quality care.
HCAHPS survey sampling represents an excellent opportunity to help assess current gaps in patient‐centered clinical care. However, ecological factors, such as county‐level demographics and hospital size (eg, bed number), are known to influence health outcomes but have not been adequately studied in pain management patient satisfaction.[7] Hospital and county‐level factors may influence the degree to which patients experience patient‐centered pain management care. For instance, most patient satisfaction scores are worse in urban areas.[8, 9] These disparities in patient satisfaction scores could be associated with population density, greater ethnic diversity or nonEnglish‐speaking individuals, or number of hospital beds.
The US Census demographics and hospital‐bed number provide a concurrent measure that can be used across the country to estimate hospital ecology. This study evaluated the influence of county‐level demographic and structural factors (ie, hospital beds) on patient satisfaction with hospital pain management in all HCAHPS‐participating hospitals across the United States. We hypothesized that demographic diversity, higher population density, and higher numbers of hospital beds would predict lower levels of patient satisfaction with inpatient pain management.
METHODS
Data Collection: County‐Level Predictors
Publically available data were obtained from the American Hospital Directory[10] and United States Census Bureau[11] websites. Twenty US Census data categories were selected a priori by their clinical relevance to influence pain management perception out of the 50 publically reported US Census categories. Final variables utilized in regression modeling are listed under the Variable column in Table 1. Covariate correlation coefficients were all under 0.7, indicating a lack of significant colinearity.
| Variable | Median Value (SD) | Range | Regression Coefficient (SE) | t Value |
|---|---|---|---|---|
| ||||
| African American alone, % | 5.6% (13.8%) | 0%85.4% | 0.02 (00) | 3.609* |
| White alone, % | 86.2% (15.8%) | 5.3%99.0% | 0.06 (0.01) | 6.661* |
| Per capita income | $24,499 ($6,419) | $7,887$61,290 | 0.00 (0.00) | 7.561* |
| With bachelor's degree, % | 22.0% (10.1%) | 6.3%70.7% | 0.06 (0.01) | 7.348* |
| Population 18 years of age, % | 23.2% (3.1%) | 8.3%40.6% | 0.18 (0.05) | 3.498* |
| With a high school degree, % | 86.0% (6.4%) | 46.3%98.6% | 0.02 (0.01) | 1.424 |
| Population change over 1 year, % | 0.7% (2.2%) | 18.1%25.6% | 0.25 (0.04) | 5.645* |
| Same house over 1 year, % | 85.4% (4.2%) | 57.1%98.0% | 0.01 (0.02) | 0.493 |
| White alone (not Hispanic), % | 75.2% (21.8%) | 3.2%98.4% | 0.05(0.00) | 12.077* |
| Household size | 2.52 (0.3) | 1.924.77 | 2.266 (0.36) | 6.283* |
| Population county | 105,937 (1,524,223) | 1,1609,818,605 | 0.00 (0.00) | 13.117* |
| Average travel time to work, min | 23 (5.0) | 642.5 | 0.21 (0.02) | 11.071* |
| NonEnglish speaking, % | 8.6% (15.1%) | 0.2%95.9% | 0.08 (0.01) | 13.843* |
| Total female, % | 50.7% (1.6%) | 34.4%57.0% | 0.44 (0.06) | 7.489* |
| Population 65 years old, % | 14.7% (4.1%) | 5.8%49.3% | 0.06 (0.02) | 2.697 |
| Population in poverty, % | 14.7% (5.6%) | 5.8%49.3% | 0.02 (0.02) | 1.01 |
| Population density | 138.7 (4,534) | 0.369,467 | 0.73 (0.05) | 15.734* |
| Foreign born, % | 4.9% (9.3%) | 0%51.2% | 0.15 (0.01) | 16.775* |
| Median household income | $46,880 ($12,868) | $20,206$120,096 | 0.00 (0.00) | 6.052* |
| No. of hospital beds | 103 (193) | 22,259 | 0.01 (0.00) | 15.403* |
Data Collection: Patient Satisfaction With Pain Management
Pain management was measured using the HCAHPS survey pain management dimension by calculating the percentage of patient responders who said their pain was always controlled. HCAHPS data are publically available on the CMS Hospital Compare website.[6] It contains 32 questions that comprise 10 evaluative measures. It is provided to a random sample of patients across the United States throughout the year at 48 hours to 6 weeks after discharge from the hospital.
Analytic Plan
HCAHPS and US Census datasets were analyzed to assess their distribution curves. The population density variable was converted to a logarithmic scale to account for its skewed distribution and long tail in the area of low population density. Data were subsequently merged into an Excel (Microsoft Corp., Redmond, WA) spreadsheet using the VLOOKUP function such that relevant 2010 census county data were added to each hospital's HCAHPS data.
Bivariate analyses were conducted to determine which US Census categories were significant predictors for patient satisfaction with pain management. All significant predictors were then included in a multivariate model, which predicted for patient satisfaction with pain management. All analyses were 2‐tailed, and statistical significance was set at = 0.05.
RESULTS
Complete HCAHPS scores were obtained from 3907 hospitals out of a total of 4621 US hospitals (85%). The majority of hospitals (73.8%, n = 2884) collected over 300 surveys, fewer (n = 696) collected 100 to 299 surveys, and a small number of hospitals (n = 327) collected less than 100 surveys. Based on the most conservative estimate, results were available from at least 934,800 individual surveys. Missing HCAHPS hospital data averaged 13.4 (standard deviation [SD] = 12.2) hospitals per state. County‐level data were obtained from all 3144 county or county equivalents across the United States (100%).
Bivariate Analyses
Univariate regression indicated a significant association between pain management patient satisfaction and most county‐level demographic variables and number of hospital beds.
Multivariate Analyses
A multivariate linear regression model was run in which 20 county‐level demographic and hospital factors were examined as predictors of patient satisfaction with pain management. The model, which examined county‐level predictors of pain management, explained 12% of the variability in patients' ratings of pain management (R2 = 0.124, P 0.0001). A total of 8 out of the 20 US Census variables were statistically significant predictors of pain management (Table 2). African American and white race were most strongly associated with higher ratings of patient satisfaction with pain management (ie, by partial coefficient and statistical significance). Number of hospital beds, percent foreign born, population density, and female gender were most strongly related to lower ratings of patient satisfaction with pain management.
| Variable | Median Value (SD) | Range | Regression Coefficient (SE) | t Value | |
|---|---|---|---|---|---|
| |||||
| African American alone, % | 5.6% (13.8%) | 0%85.4% | 0.07 (0.01) | 0.23 | 7.104* |
| White alone, % | 86.2% (15.8%) | 5.3%99.0% | 0.08 (0.01) | 0.23 | 6.953* |
| Per capita income | $24,499 ($6,419) | $7,887$61,290 | 0.00 (0.00) | 0.22 | 2.885 |
| With bachelor's degree, % | 22.0% (10.1%) | 6.3%70.7% | 0.03 (0.02) | 0.10 | 1.401 |
| Population 18 years old, % | 23.2% (3.1%) | 8.3%40.6% | 0.18 (0.05) | 0.08 | 3.498* |
| With a high school degree, % | 86.0% (6.4%) | 46.3%98.6% | 0.02 (0.01) | 0.02 | 1.424 |
| Population change over 1 year, % | 0.7% (2.2%) | 18.1%25.6% | 0.11 (0.06) | 0.01 | 1.986 |
| Same house over 1 year, % | 85.4% (4.2%) | 57.1%98.0% | 0.01 (0.02) | 0.01 | 0.493 |
| White alone (not Hispanic), % | 75.2% (21.8%) | 3.2%98.4% | 0.02(0.00) | 0.01 | 0.740 |
| Household size | 2.52 (0.3) | 1.924.77 | 0.92 (0.80) | 0.03 | 1.145 |
| Population county | 105,937 (1,524,223) | 1,1609,818,605 | 0.00 (0.00) | 0.03 | 1.495 |
| Average travel time to work, min | 23 (5.0) | 642.5 | 0.06 (0.02) | 0.06 | 3.054 |
| NonEnglish speaking, % | 8.6% (15.1%) | 0.2%95.9% | 0.00 (0.03) | 0.06 | 0.028 |
| Total female, % | 50.7% (1.6%) | 34.4%57.0% | 0.23 (0.07) | 0.06 | 3.158 |
| Population 65 years old, % | 14.7% (4.1%) | 5.8%49.3% | 0.10 (0.04) | 0.07 | 2.411 |
| Population in poverty, % | 14.7% (5.6%) | 5.8%49.3% | 0.02 (0.02) | 0.08 | 1.01 |
| Population density | 138.7 (4,534) | 0.369,467 | 0.24 (0.09) | 0.08 | 2.823 |
| Foreign born, % | 4.9% (9.3%) | 0%51.2% | 0.07 (0.02) | 0.12 | 4.906* |
| Median household income | $46,880 ($12,868) | $20,206‐$120,096 | 0.00 (0.00) | 0.16 | 2.599 |
| No. of hospital beds | 103 (193) | 22,259 | 0.00 (0.00) | 0.16 | 9.167* |
| Model statistics | F(1, 9) = 62.222, P 0.001 | ||||
| Adjusted R2 | 0.124 | ||||
DISCUSSION
By utilizing county‐level demographic data and the HCAHPS survey measures from across the United States, this study provides a representative sample of US hospitals that can be used to define ecological trends in patient satisfaction with pain management. This statistical model demonstrates the nonrandom variability of pain management satisfaction across the United States, even after CMS patient‐mix adjustment. Although the quality of pain management may be increasing by some reports, our present results indicate that pain management satisfaction is not equitable with the rest of the country among select groups of patients (eg, foreign born, female gender, areas of long travel times to work) or in certain care settings (eg, larger hospitals, population dense areas). These data suggest that areas of pain management may lack in quality compared to pain management across the entire US as a whole. This is consistent with the increasingly recognized contribution of multiple nonmedical determinates to health outcomes.[12] These results demonstrate the overall magnitude of healthcare disparity in the United States, and are particularly concerning because African Americans and Hispanics tend to rate overall satisfaction higher than Caucasians in other studies.[13, 14] The same minority reporting bias may be reflected in HCAHPS results. These patients may be reporting higher pain management satisfaction that is not consistent with the level of care they received, as studies have consistently indicated worse pain management delivery for racial and ethnic minorities.[15]
The present findings reveal structural (eg, hospital beds) and demographic (eg, population density, foreign born) gaps in satisfaction with pain management. An effort to improve pain management for all people in the heterogeneous makeup of the United States is an enormous challenge. However, change may be forthcoming, as Hospital Value‐Based Purchasing draws attention pain practice inequities in real time. Although several of the significant explanatory variables cannot be modified (eg, size of hospital, urban setting, patients served), pain management delivery should receive extra attention in hospitals with those characteristics. Pain management delivery in large, urban hospitals that serve foreign‐born patients may be improved with focused multilevel interventions. Future research should examine these inequities further and develop multilevel interventions that target hospitals in at‐risk areas with the aim of lessening disparities in hospital‐based pain management.
Disclosure
Nothing to report.
- , , , et al. Interventions for providers to promote a patient‐centred approach in clinical consultations. Cochrane Database Syst Rev. 2012;12:CD003267.
- , , , . Patient perception of pain care in hospitals in the United States. J Pain Res. 2009;2:157–164.
- , , , , . Patient perception of pain care in the United States: a 5‐year comparative analysis of hospital consumer assessment of health care providers and systems. Pain Physician. 2014;17(5):369–377.
- , , , , . Assessing the relationship between the level of pain control and patient satisfaction. J Pain Res. 2013;6:683–689.
- H.R.3590—Patient Protection and Affordable Care Act 2010. Available at: https://www.congress.gov/bill/111th‐congress/house‐bill/3590. Accessed December 1, 2013.
- Centers for Medicare 55(1):125–139.
- , . Characteristics of hospitals receiving penalties under the Hospital Readmissions Reduction Program. JAMA. 2013;309(4):342–343.
- , , , . Patients' perception of hospital care in the United States. N Engl J Med. 2008;359(18):1921–1931.
- American Hospital Directory. Hospital statistics by state. Available at: http://www.ahd.com/state_statistics.html. Accessed December 1, 2013.
- United States Census Bureau. Download center. Available at: http://factfinder.census.gov/faces/nav/jsf/pages/download_center.xhtml. Accessed December 1, 2013.
- Health policy brief: the relative contribution of multiple determinants to health outcomes. Health Affairs website. Available at: http://www.healthaffairs.org/healthpolicybriefs/brief.php?brief_id=123. Accessed December 1, 2013.
- , , , , . Racial and ethnic differences in patient assessments of interactions with providers: disparities or measurement biases? Am J Med Qual. 2006;21(2):109–114.
- , , , , . Survey response style and differential use of CAHPS rating scales by Hispanics. Med Care. 2008;46(9):963–968.
- Institute of Medicine. Committee on Advancing Pain Research, Care, and Education. Relieving Pain in America: A Blueprint for Transforming Prevention, Care, Education, and Research. Washington, DC: National Academies Press; 2011.
Pain management is an integral component of patient‐centered medical care and is a major concern for patients who are hospitalized.[1] Patient‐reported ratings of pain management are highly correlated with overall satisfaction with healthcare delivery.[2] Current research indicates that patient satisfaction with pain management may be improving[3]; however, there may be structural and county‐level disparities in these improvements in satisfaction. Although patient satisfaction with pain management increased from 2008 to 2012, a discrepancy in patient satisfaction with pain management has emerged between 3 different hospital systems (safety net, acute care, critical access hospitals)[3] Specifically, acute care hospitals provide less satisfactory pain management as compared to critical access hospitals.[3] Although patients' perception of pain management is an integral part of delivering patient‐centered care, prior research indicates that there may not be a simple inverse association between pain intensity score and patient satisfaction.[4] The management of pain in hospitals continues to be problematic, perhaps, for instance, due to discrepancies in understanding the relationship between patient satisfaction and pain management. Certainly for this reason and many others, satisfaction with pain management is now one of the dimensions assessed by the Hospital Consumer Assessment of Healthcare Providers and Systems (HCAHPS) survey, which is a global measure of patient satisfaction.
The HCAHPS survey is utilized by 85% of all US‐based hospitals and gathers patient satisfaction information pertaining to 10 dimensions, including pain management. Patient satisfaction scores (via HCAHPS) now constitute 30% of Hospital Value‐Based Purchasing (HVBP), which makes up 2% of at‐risk reimbursements by the Centers for Medicare and Medicaid Services (CMS) as put forth by the Affordable Care Act (ACA) of 2010.[5] The ACA mandates that payments to hospitals must partly depend on metrics that assess patient satisfaction, as broadly measured by the HCAHPS, which are completed by patients upon hospital discharge.[5, 6] Therefore, patient satisfaction, as measured by patients, now directly affects CMS payments for over 3000 hospitals across the United States. This constitutes a large amount of money for most hospitals that operate on high revenue but have low profit margins. As such, the 2% at‐risk reimbursement may place many hospitals at financial risk that could be ameliorated with effective inpatient pain management.
In addition to its critical role in reimbursement to hospitals, patient satisfaction with pain management is also integrally related to providing patient‐centered care. As such, patient satisfaction with pain management is considered a critical element of various models of the patient‐centered approach to providing medical care. Although a medical inpatient team can assess objective signs of pain, patient‐centric pain measurements are paramount in understanding the pain experience of patients and providing adequate pain management care. Moreover, patients, doctors, payers of medical services, and now CMS increasingly regard a patient‐centered approach to medical care as crucial for the delivery of high‐quality care.
HCAHPS survey sampling represents an excellent opportunity to help assess current gaps in patient‐centered clinical care. However, ecological factors, such as county‐level demographics and hospital size (eg, bed number), are known to influence health outcomes but have not been adequately studied in pain management patient satisfaction.[7] Hospital and county‐level factors may influence the degree to which patients experience patient‐centered pain management care. For instance, most patient satisfaction scores are worse in urban areas.[8, 9] These disparities in patient satisfaction scores could be associated with population density, greater ethnic diversity or nonEnglish‐speaking individuals, or number of hospital beds.
The US Census demographics and hospital‐bed number provide a concurrent measure that can be used across the country to estimate hospital ecology. This study evaluated the influence of county‐level demographic and structural factors (ie, hospital beds) on patient satisfaction with hospital pain management in all HCAHPS‐participating hospitals across the United States. We hypothesized that demographic diversity, higher population density, and higher numbers of hospital beds would predict lower levels of patient satisfaction with inpatient pain management.
METHODS
Data Collection: County‐Level Predictors
Publically available data were obtained from the American Hospital Directory[10] and United States Census Bureau[11] websites. Twenty US Census data categories were selected a priori by their clinical relevance to influence pain management perception out of the 50 publically reported US Census categories. Final variables utilized in regression modeling are listed under the Variable column in Table 1. Covariate correlation coefficients were all under 0.7, indicating a lack of significant colinearity.
| Variable | Median Value (SD) | Range | Regression Coefficient (SE) | t Value |
|---|---|---|---|---|
| ||||
| African American alone, % | 5.6% (13.8%) | 0%85.4% | 0.02 (00) | 3.609* |
| White alone, % | 86.2% (15.8%) | 5.3%99.0% | 0.06 (0.01) | 6.661* |
| Per capita income | $24,499 ($6,419) | $7,887$61,290 | 0.00 (0.00) | 7.561* |
| With bachelor's degree, % | 22.0% (10.1%) | 6.3%70.7% | 0.06 (0.01) | 7.348* |
| Population 18 years of age, % | 23.2% (3.1%) | 8.3%40.6% | 0.18 (0.05) | 3.498* |
| With a high school degree, % | 86.0% (6.4%) | 46.3%98.6% | 0.02 (0.01) | 1.424 |
| Population change over 1 year, % | 0.7% (2.2%) | 18.1%25.6% | 0.25 (0.04) | 5.645* |
| Same house over 1 year, % | 85.4% (4.2%) | 57.1%98.0% | 0.01 (0.02) | 0.493 |
| White alone (not Hispanic), % | 75.2% (21.8%) | 3.2%98.4% | 0.05(0.00) | 12.077* |
| Household size | 2.52 (0.3) | 1.924.77 | 2.266 (0.36) | 6.283* |
| Population county | 105,937 (1,524,223) | 1,1609,818,605 | 0.00 (0.00) | 13.117* |
| Average travel time to work, min | 23 (5.0) | 642.5 | 0.21 (0.02) | 11.071* |
| NonEnglish speaking, % | 8.6% (15.1%) | 0.2%95.9% | 0.08 (0.01) | 13.843* |
| Total female, % | 50.7% (1.6%) | 34.4%57.0% | 0.44 (0.06) | 7.489* |
| Population 65 years old, % | 14.7% (4.1%) | 5.8%49.3% | 0.06 (0.02) | 2.697 |
| Population in poverty, % | 14.7% (5.6%) | 5.8%49.3% | 0.02 (0.02) | 1.01 |
| Population density | 138.7 (4,534) | 0.369,467 | 0.73 (0.05) | 15.734* |
| Foreign born, % | 4.9% (9.3%) | 0%51.2% | 0.15 (0.01) | 16.775* |
| Median household income | $46,880 ($12,868) | $20,206$120,096 | 0.00 (0.00) | 6.052* |
| No. of hospital beds | 103 (193) | 22,259 | 0.01 (0.00) | 15.403* |
Data Collection: Patient Satisfaction With Pain Management
Pain management was measured using the HCAHPS survey pain management dimension by calculating the percentage of patient responders who said their pain was always controlled. HCAHPS data are publically available on the CMS Hospital Compare website.[6] It contains 32 questions that comprise 10 evaluative measures. It is provided to a random sample of patients across the United States throughout the year at 48 hours to 6 weeks after discharge from the hospital.
Analytic Plan
HCAHPS and US Census datasets were analyzed to assess their distribution curves. The population density variable was converted to a logarithmic scale to account for its skewed distribution and long tail in the area of low population density. Data were subsequently merged into an Excel (Microsoft Corp., Redmond, WA) spreadsheet using the VLOOKUP function such that relevant 2010 census county data were added to each hospital's HCAHPS data.
Bivariate analyses were conducted to determine which US Census categories were significant predictors for patient satisfaction with pain management. All significant predictors were then included in a multivariate model, which predicted for patient satisfaction with pain management. All analyses were 2‐tailed, and statistical significance was set at = 0.05.
RESULTS
Complete HCAHPS scores were obtained from 3907 hospitals out of a total of 4621 US hospitals (85%). The majority of hospitals (73.8%, n = 2884) collected over 300 surveys, fewer (n = 696) collected 100 to 299 surveys, and a small number of hospitals (n = 327) collected less than 100 surveys. Based on the most conservative estimate, results were available from at least 934,800 individual surveys. Missing HCAHPS hospital data averaged 13.4 (standard deviation [SD] = 12.2) hospitals per state. County‐level data were obtained from all 3144 county or county equivalents across the United States (100%).
Bivariate Analyses
Univariate regression indicated a significant association between pain management patient satisfaction and most county‐level demographic variables and number of hospital beds.
Multivariate Analyses
A multivariate linear regression model was run in which 20 county‐level demographic and hospital factors were examined as predictors of patient satisfaction with pain management. The model, which examined county‐level predictors of pain management, explained 12% of the variability in patients' ratings of pain management (R2 = 0.124, P 0.0001). A total of 8 out of the 20 US Census variables were statistically significant predictors of pain management (Table 2). African American and white race were most strongly associated with higher ratings of patient satisfaction with pain management (ie, by partial coefficient and statistical significance). Number of hospital beds, percent foreign born, population density, and female gender were most strongly related to lower ratings of patient satisfaction with pain management.
| Variable | Median Value (SD) | Range | Regression Coefficient (SE) | t Value | |
|---|---|---|---|---|---|
| |||||
| African American alone, % | 5.6% (13.8%) | 0%85.4% | 0.07 (0.01) | 0.23 | 7.104* |
| White alone, % | 86.2% (15.8%) | 5.3%99.0% | 0.08 (0.01) | 0.23 | 6.953* |
| Per capita income | $24,499 ($6,419) | $7,887$61,290 | 0.00 (0.00) | 0.22 | 2.885 |
| With bachelor's degree, % | 22.0% (10.1%) | 6.3%70.7% | 0.03 (0.02) | 0.10 | 1.401 |
| Population 18 years old, % | 23.2% (3.1%) | 8.3%40.6% | 0.18 (0.05) | 0.08 | 3.498* |
| With a high school degree, % | 86.0% (6.4%) | 46.3%98.6% | 0.02 (0.01) | 0.02 | 1.424 |
| Population change over 1 year, % | 0.7% (2.2%) | 18.1%25.6% | 0.11 (0.06) | 0.01 | 1.986 |
| Same house over 1 year, % | 85.4% (4.2%) | 57.1%98.0% | 0.01 (0.02) | 0.01 | 0.493 |
| White alone (not Hispanic), % | 75.2% (21.8%) | 3.2%98.4% | 0.02(0.00) | 0.01 | 0.740 |
| Household size | 2.52 (0.3) | 1.924.77 | 0.92 (0.80) | 0.03 | 1.145 |
| Population county | 105,937 (1,524,223) | 1,1609,818,605 | 0.00 (0.00) | 0.03 | 1.495 |
| Average travel time to work, min | 23 (5.0) | 642.5 | 0.06 (0.02) | 0.06 | 3.054 |
| NonEnglish speaking, % | 8.6% (15.1%) | 0.2%95.9% | 0.00 (0.03) | 0.06 | 0.028 |
| Total female, % | 50.7% (1.6%) | 34.4%57.0% | 0.23 (0.07) | 0.06 | 3.158 |
| Population 65 years old, % | 14.7% (4.1%) | 5.8%49.3% | 0.10 (0.04) | 0.07 | 2.411 |
| Population in poverty, % | 14.7% (5.6%) | 5.8%49.3% | 0.02 (0.02) | 0.08 | 1.01 |
| Population density | 138.7 (4,534) | 0.369,467 | 0.24 (0.09) | 0.08 | 2.823 |
| Foreign born, % | 4.9% (9.3%) | 0%51.2% | 0.07 (0.02) | 0.12 | 4.906* |
| Median household income | $46,880 ($12,868) | $20,206‐$120,096 | 0.00 (0.00) | 0.16 | 2.599 |
| No. of hospital beds | 103 (193) | 22,259 | 0.00 (0.00) | 0.16 | 9.167* |
| Model statistics | F(1, 9) = 62.222, P 0.001 | ||||
| Adjusted R2 | 0.124 | ||||
DISCUSSION
By utilizing county‐level demographic data and the HCAHPS survey measures from across the United States, this study provides a representative sample of US hospitals that can be used to define ecological trends in patient satisfaction with pain management. This statistical model demonstrates the nonrandom variability of pain management satisfaction across the United States, even after CMS patient‐mix adjustment. Although the quality of pain management may be increasing by some reports, our present results indicate that pain management satisfaction is not equitable with the rest of the country among select groups of patients (eg, foreign born, female gender, areas of long travel times to work) or in certain care settings (eg, larger hospitals, population dense areas). These data suggest that areas of pain management may lack in quality compared to pain management across the entire US as a whole. This is consistent with the increasingly recognized contribution of multiple nonmedical determinates to health outcomes.[12] These results demonstrate the overall magnitude of healthcare disparity in the United States, and are particularly concerning because African Americans and Hispanics tend to rate overall satisfaction higher than Caucasians in other studies.[13, 14] The same minority reporting bias may be reflected in HCAHPS results. These patients may be reporting higher pain management satisfaction that is not consistent with the level of care they received, as studies have consistently indicated worse pain management delivery for racial and ethnic minorities.[15]
The present findings reveal structural (eg, hospital beds) and demographic (eg, population density, foreign born) gaps in satisfaction with pain management. An effort to improve pain management for all people in the heterogeneous makeup of the United States is an enormous challenge. However, change may be forthcoming, as Hospital Value‐Based Purchasing draws attention pain practice inequities in real time. Although several of the significant explanatory variables cannot be modified (eg, size of hospital, urban setting, patients served), pain management delivery should receive extra attention in hospitals with those characteristics. Pain management delivery in large, urban hospitals that serve foreign‐born patients may be improved with focused multilevel interventions. Future research should examine these inequities further and develop multilevel interventions that target hospitals in at‐risk areas with the aim of lessening disparities in hospital‐based pain management.
Disclosure
Nothing to report.
- , , , et al. Interventions for providers to promote a patient‐centred approach in clinical consultations. Cochrane Database Syst Rev. 2012;12:CD003267.
- , , , . Patient perception of pain care in hospitals in the United States. J Pain Res. 2009;2:157–164.
- , , , , . Patient perception of pain care in the United States: a 5‐year comparative analysis of hospital consumer assessment of health care providers and systems. Pain Physician. 2014;17(5):369–377.
- , , , , . Assessing the relationship between the level of pain control and patient satisfaction. J Pain Res. 2013;6:683–689.
- H.R.3590—Patient Protection and Affordable Care Act 2010. Available at: https://www.congress.gov/bill/111th‐congress/house‐bill/3590. Accessed December 1, 2013.
- Centers for Medicare 55(1):125–139.
- , . Characteristics of hospitals receiving penalties under the Hospital Readmissions Reduction Program. JAMA. 2013;309(4):342–343.
- , , , . Patients' perception of hospital care in the United States. N Engl J Med. 2008;359(18):1921–1931.
- American Hospital Directory. Hospital statistics by state. Available at: http://www.ahd.com/state_statistics.html. Accessed December 1, 2013.
- United States Census Bureau. Download center. Available at: http://factfinder.census.gov/faces/nav/jsf/pages/download_center.xhtml. Accessed December 1, 2013.
- Health policy brief: the relative contribution of multiple determinants to health outcomes. Health Affairs website. Available at: http://www.healthaffairs.org/healthpolicybriefs/brief.php?brief_id=123. Accessed December 1, 2013.
- , , , , . Racial and ethnic differences in patient assessments of interactions with providers: disparities or measurement biases? Am J Med Qual. 2006;21(2):109–114.
- , , , , . Survey response style and differential use of CAHPS rating scales by Hispanics. Med Care. 2008;46(9):963–968.
- Institute of Medicine. Committee on Advancing Pain Research, Care, and Education. Relieving Pain in America: A Blueprint for Transforming Prevention, Care, Education, and Research. Washington, DC: National Academies Press; 2011.
Delirium Screening in Older Patients
Delirium is a rapidly developing, fluctuating disturbance in consciousness, caused by a medical condition. The diagnosis of delirium is often missed, potentiating negative outcomes.[1, 2] Regular delirium screening by nurses results in increased recognition and treatment.[3] Although multiple screening tools exist, many are cumbersome to execute. Efforts have been made to shorten them, but although the screening tools may predict adverse outcomes, there are concerns about their specificity.[1, 2, 4, 5, 6] The Delirium Observation Screening Scale[7] (DOS) is a brief screening tool based on observation. It has been validated in several patient populations, but no published studies have taken place in the United States or have focused on an older, general medicine, inpatient population. Given the low numbers of patients in earlier validation studies, the effectiveness of the DOS for screening hospitalized, older patients is not yet fully established.
This study aimed to determine the ability of the DOS to screen hospitalized, older patients for delirium compared to a validated delirium diagnostic tool, the Delirium Rating Scale‐Revised‐98 (DRS‐R‐98).[8] In addition, DOS acceptability, ease of use, and benefit were explored by surveying nurses.
METHODS
Participants
After institutional review board approval, participants were selected by convenience sample from general medicine inpatients at a large, tertiary care, academic hospital. Eligible patients were age 65 years or older, admitted to a medicine inpatient unit, and spoke English. If participants were unable to consent, consent was obtained from the participant's legally authorized representative.
Delirium Observation Screening Scale
The DOS is a 13‐point screen for delirium, based on the Diagnostic and Statistical Manual of Mental Disorders IV delirium criteria, designed to be completed by a nurse (see Supporting Information, Appendix 1, in the online version of this article). Responses are dichotomous. Scores 3 were considered positive delirium screens.[7]
Nurses on medicine units attended educational in‐services on delirium recognition and use of the DOS. The DOS was embedded in the electronic medical record (EMR) and nurses are electronically prompted to chart DOS results every 12 hours for patients, age 65 years or older. Nursing staff utilized the DOS for 1 year prior to study start.
DRS‐R‐98
The DRS‐R‐98 was used as the study reference standard.[8] Scores 15 are indicative of delirium.[9] All assessments were performed by a medical student (K.G.) trained to administer the DRS‐R‐98.
Data Collection
After consent, hospitalized participants were evaluated daily (MondayFriday) using the DRS‐R‐98. Enrollment took place over a 10‐week period. Nurses and researchers were blinded to other delirium assessment results until after participant discharge. Following discharge, additional data were collected from the EMR: age, gender, cognitive comorbidities, and nurse‐charted DOS score. Cognitive comorbidities were classified as no impairment, dementia, or cognitive impairment based on the problem list and admission note. A psychiatrist (M.W.) confirmed questions of cognitive impairment.
The DOS score closest in time, within 24 hours of DRS‐R‐98 assessment, was used for comparison. If a DOS score was not charted within 24 hours of the DRS‐R‐98 evaluation, that assessment was excluded. Partial DRS‐R‐98 assessments were included only if there was enough information to classify a subject as delirious or not.
Nursing Survey
A 13‐question nursing survey was developed and consisted of demographic, Likert‐style, and multiple‐choice questions, with opportunities for open‐ended responses (see Supporting Information, Appendix 2, in the online version of this article). Survey design followed similar surveys investigating staff experiences and clinical functionality of other brief delirium screening tools, such as the Confusion Assessment Method for the Intensive Care Unit.[10, 11] The survey was distributed by e‐mail to 435 nurses on 16 units. Coffee gift cards were raffled as participation incentive.
Statistical Analysis
Statistical analysis was completed using SPSS (IBM, Armonk, NY) and SAS (SAS Institute, Inc., Cary, NC) software. DOS results were compared to the DRS‐R‐98, and validity statistics were calculated for delirium. Confidence intervals were calculated using the Clopper‐Pearson method for binomial data. The Spearman rank correlation coefficient between DOS and DRS‐98 score was calculated. PROC LOGISTIC (SAS Institute, Inc.) modeled the relationship between positive DOS screens and delirium and created a receiver operating characteristic (ROC) curve using continuous DOS score to predict delirium. Because these models did not control for multiple observations per individual, PROC GENMOD (SAS Institute, Inc.) was used to confirm the relationship between a positive DOS screen and delirium using a marginal logistic regression model accounting for repeated measures. In addition, we selected 10 random samples of 1 observation per person, and validity statistics were calculated for each sample.
The nursing survey results were analyzed using descriptive statistics. Open‐ended comments were reviewed in aggregate.
RESULTS
Participant Characteristics
Fifty‐four participants enrolled in the study. Fifty‐three were able to complete 1 DRS‐R‐98 and comprise the study sample (Table 1). Participants completed 1 to 5 daily DRS‐R‐98 assessments (mean, 1.94; standard deviation [SD], 0.90; mean length of admission, 6.06 days). Of the 105 DRS‐R‐98 assessments, 101 were classifiable for delirium. Of the 101 DRS‐R‐98 assessments classifiable for delirium, 100 had a corresponding DOS score within 24 hours. Participant characteristics are listed in Table 1. Eight of the 53 participants (15%) had at least 1 positive DRS‐R‐98. Overall, 10 of the 101 delirium assessments diagnosed delirium (DRS‐R‐98 score 15).
| Characteristic | No Delirium, n = 45 | Delirium, n = 8a |
|---|---|---|
| ||
| Age, y | ||
| 6574, n = 26 | 22 | 4 |
| 7584, n = 15 | 13 | 2 |
| 85+, n = 12 | 10 | 2 |
| Age, y, mean (SD) [range] | 77 (10) [6592] | 76 (8.6) [6592] |
| Gender | ||
| Female, n = 33 | 28 | 5 |
| Male, n = 20 | 17 | 3 |
| Cognitive status per chart | ||
| No impairment, n = 45 | 43 | 2 |
| Cognitive impairment without dementia, n = 5 | 1 | 4 |
| Dementia, n = 3 | 1 | 2 |
DOS Validity
The mean and standard deviation of delirium screening scores are as follows: DRS‐R‐98 (mean, 6.13; SD, 4.74; range, 020) and DOS (mean, 1.22; SD, 2.37; range, 09). The Spearman correlation coefficient between DOS and DRS‐R‐98 scores was 0.58. DOS had a sensitivity of 90% (95% confidence interval [CI]: 56%‐100%) and specificity of 91% (95% CI: 83%‐96%) compared to the DRS‐98‐R standard. There was only 1 false negative DOS screen out of 83 negative assessments (negative predictive value = 99%, 95% CI: 93%‐100%). Out of the 17 positive assessments, 9 were true positives (positive predictive value = 53%, 95% CI: 28%‐77%), and 7 scored in the subsyndromal range for delirium (DRS‐R‐98 score 814).
In analyses using 10 samples, with 1 randomly selected observation per person, the mean sensitivity was 84.6%, ranging from 80% (95% CI: 28%‐99%) to 87.5% (95% CI: 47%‐100%). The mean specificity in these samples was 92%, ranging from 87% (95% CI: 74%‐95%) to 96% (95% CI: 85%‐99%).
Logistic Regression Models
All models confirmed that positive DOS screens significantly predicted delirium. The traditional logistic regression model produced an odds ratio (OR) estimate of 92 (95% CI: 10‐824, P 0.0001) for a positive DOS screen predicting delirium. The marginal logistic regression model accounting for repeated measures produced a consistent estimate (OR: 93, 95% CI: 11‐800, P 0.0001). Continuous DOS scores predicted delirium (OR: 2.1, 95% CI: 1.5‐2.9, P 0.0001), and the ROC curve supported the cutoff of DOS 3, corresponding to a predicted probability of 0.12 (Figure 1).

Nursing Survey
The nursing survey had a response rate of 23% (N = 98). The most robust results related to DOS administration were 87% (N = 83) of nurses were confident in DOS administration, 92% (N = 86) could complete the DOS in under 3 minutes, and 79% (N = 74) agreed that performing the DOS is easy. There was less agreement on the value of the DOS; 37% agreed that the DOS is worth the time to perform, 25% agreed that the DOS enhances patient care, and 36% agreed that the DOS provides valuable information for patient care. Over half the nurses (55%) reported that they perform the DOS 75% to 100% of the prompted times, and 62% stated if the DOS was no longer required, they would not use it. Open‐ended questions generated a wide range of responses, from supportive to critical of delirium screening and the DOS (see Supporting Information, Appendix 3, in the online version of this article).
DISCUSSION
This study demonstrated the effectiveness, efficiency, and ease of use of the DOS as a delirium screening tool. The DOS exhibited high sensitivity (90%) and specificity (91%). Similar to previous findings, the positive predictive value was only 53%, but the negative predictive value was 99%.[12] These results support that the DOS is consistently able to rule out delirium, with only 1 false negative in this study.
Nursing responses regarding user‐friendliness are consistent with other studies; however, there was a knowledge gap related to how positive delirium screens can inform and change care for patients.[7] Education is a known barrier to integrating delirium screening tools secondary to the need for regular and extensive education, frequent reminders to screen, and regular evaluations of assessment quality.[11, 13, 14, 15] Developing guidelines for responding to positive DOS screens and documenting its impact on care may incentivize use.
Study strengths include strong evaluator consistency, blinding of evaluator and nurses, and responses from a broad range of nurses (14 of 16 units represented). Additionally, this study demonstrated the efficacy and ease of use of an EMR‐prompted delirium screen. However, this study had several limitations, including a small sample size and a low incidence of delirium. The lower incidence is likely secondary to selection bias that resulted from difficulty consenting delirious subjects. The discordant time between DOS and DRS‐R‐98 assessments may have also influenced results; however, inclusion of data from the previous 8 to 24 hours in both tools makes the temporal separation of assessments less impactful.
The ability of the DOS to accurately identify patients at high risk of delirium is useful for healthcare staff. Future work will include nurse and physician education to emphasize delirium understanding, the importance of regular screening, and the use of nonpharmacological interventions. Additional studies will include examination of the interventions and outcomes of patients who screen positive for delirium to determine the long‐term impact of delirium screening.
Acknowledgements
The study authors would like to thank the University of Iowa Hospitals and Clinics, the Department of Family Medicine, and the University of Iowa Hospitals and Clinics nursing managers and nursing staff.
Disclosures
This study was funded by the Summer Research Fellowship program sponsored by the University of Iowa Carver College of Medicine. Drs. Weckmann and Carnahan were supported by the Health Resources and Services Administration, Iowa Geriatric Education Center (UB4 HP19054) as well as the US Department of Health and Human Services, Agency for Healthcare Research and Quality (AHRQ 1 R18 HS022666‐01).
- , , . An intervention to reduce delirium in care homes. Nurs Older People. 2010;22(4):16–21.
- , , , et al. Assessment of delirium in the intensive care unit: nursing practices and perceptions. Am J Crit Care. 2008;17(6):555–565.
- , , , et al. Delirium and sedation recognition using validated instruments: reliability of bedside intensive care unit nursing assessments from 2007 to 2010. J Am Geriatr Soc. 2011;59(suppl 2):S249–S255.
- , , , et al. Preliminary development of an ultrabrief two‐item bedside test for delirium. J Hosp Med. 2015;10(10):645–650.
- , , , et al. The association between an ultrabrief cognitive screening in older adults and hospital outcomes. J Hosp Med. 2015;10(10):651–657.
- , , , et al. Comparison of mental‐status scales for predicting mortality on the general wards. J Hosp Med. 2015;10(10):658–663.
- , , . The Delirium Observation Screening Scale: a screening instrument for delirium. Res Theory Nurs Pract. 2003;17(1):31–50.
- . Validation of the Delirium Rating Scale‐Revised‐98: comparison with the Delirium Rating Scale and the Cognitive Test for Delirium. J Neuropsychiatry Clin Neurosci. 2001;13(2):229–242.
- , , , et al. Factor analysis of the Colombian translation of the Delirium Rating Scale (DRS), Revised‐98. Psychosomatics. 2009;50(3):255–262.
- , , , et al. Implementation, reliability testing, and compliance monitoring of the Confusion Assessment Method for the Intensive Care Unit in trauma patients. Intensive Care Med. 2008;34(7):1263–1268.
- , , , et al. Limitations and practicalities of CAM‐ICU implementation, a delirium scoring system, in a Dutch intensive care unit. Intensive Crit Care Nurs. 2009;25(5):242–249.
- , . The Neecham Confusion Scale and the Delirium Observation Screening Scale: capacity to discriminate and ease of use in clinical practice. BMC Nurs. 2007;6:3.
- , , . Early recognition of delirium: review of the literature. J Clin Nurs. 2001;10(6):721–729.
- , , , et al. Impact of a delirium screening tool and multifaceted education on nurses' knowledge of delirium and ability to evaluate it correctly. Am J Crit Care. 2012;21(1):e1–e11.
- , , . Optimising the recognition of delirium in the intensive care unit. Best Pract Res Clin Anaesthesiol. 2012;26(3):385–393.
Delirium is a rapidly developing, fluctuating disturbance in consciousness, caused by a medical condition. The diagnosis of delirium is often missed, potentiating negative outcomes.[1, 2] Regular delirium screening by nurses results in increased recognition and treatment.[3] Although multiple screening tools exist, many are cumbersome to execute. Efforts have been made to shorten them, but although the screening tools may predict adverse outcomes, there are concerns about their specificity.[1, 2, 4, 5, 6] The Delirium Observation Screening Scale[7] (DOS) is a brief screening tool based on observation. It has been validated in several patient populations, but no published studies have taken place in the United States or have focused on an older, general medicine, inpatient population. Given the low numbers of patients in earlier validation studies, the effectiveness of the DOS for screening hospitalized, older patients is not yet fully established.
This study aimed to determine the ability of the DOS to screen hospitalized, older patients for delirium compared to a validated delirium diagnostic tool, the Delirium Rating Scale‐Revised‐98 (DRS‐R‐98).[8] In addition, DOS acceptability, ease of use, and benefit were explored by surveying nurses.
METHODS
Participants
After institutional review board approval, participants were selected by convenience sample from general medicine inpatients at a large, tertiary care, academic hospital. Eligible patients were age 65 years or older, admitted to a medicine inpatient unit, and spoke English. If participants were unable to consent, consent was obtained from the participant's legally authorized representative.
Delirium Observation Screening Scale
The DOS is a 13‐point screen for delirium, based on the Diagnostic and Statistical Manual of Mental Disorders IV delirium criteria, designed to be completed by a nurse (see Supporting Information, Appendix 1, in the online version of this article). Responses are dichotomous. Scores 3 were considered positive delirium screens.[7]
Nurses on medicine units attended educational in‐services on delirium recognition and use of the DOS. The DOS was embedded in the electronic medical record (EMR) and nurses are electronically prompted to chart DOS results every 12 hours for patients, age 65 years or older. Nursing staff utilized the DOS for 1 year prior to study start.
DRS‐R‐98
The DRS‐R‐98 was used as the study reference standard.[8] Scores 15 are indicative of delirium.[9] All assessments were performed by a medical student (K.G.) trained to administer the DRS‐R‐98.
Data Collection
After consent, hospitalized participants were evaluated daily (MondayFriday) using the DRS‐R‐98. Enrollment took place over a 10‐week period. Nurses and researchers were blinded to other delirium assessment results until after participant discharge. Following discharge, additional data were collected from the EMR: age, gender, cognitive comorbidities, and nurse‐charted DOS score. Cognitive comorbidities were classified as no impairment, dementia, or cognitive impairment based on the problem list and admission note. A psychiatrist (M.W.) confirmed questions of cognitive impairment.
The DOS score closest in time, within 24 hours of DRS‐R‐98 assessment, was used for comparison. If a DOS score was not charted within 24 hours of the DRS‐R‐98 evaluation, that assessment was excluded. Partial DRS‐R‐98 assessments were included only if there was enough information to classify a subject as delirious or not.
Nursing Survey
A 13‐question nursing survey was developed and consisted of demographic, Likert‐style, and multiple‐choice questions, with opportunities for open‐ended responses (see Supporting Information, Appendix 2, in the online version of this article). Survey design followed similar surveys investigating staff experiences and clinical functionality of other brief delirium screening tools, such as the Confusion Assessment Method for the Intensive Care Unit.[10, 11] The survey was distributed by e‐mail to 435 nurses on 16 units. Coffee gift cards were raffled as participation incentive.
Statistical Analysis
Statistical analysis was completed using SPSS (IBM, Armonk, NY) and SAS (SAS Institute, Inc., Cary, NC) software. DOS results were compared to the DRS‐R‐98, and validity statistics were calculated for delirium. Confidence intervals were calculated using the Clopper‐Pearson method for binomial data. The Spearman rank correlation coefficient between DOS and DRS‐98 score was calculated. PROC LOGISTIC (SAS Institute, Inc.) modeled the relationship between positive DOS screens and delirium and created a receiver operating characteristic (ROC) curve using continuous DOS score to predict delirium. Because these models did not control for multiple observations per individual, PROC GENMOD (SAS Institute, Inc.) was used to confirm the relationship between a positive DOS screen and delirium using a marginal logistic regression model accounting for repeated measures. In addition, we selected 10 random samples of 1 observation per person, and validity statistics were calculated for each sample.
The nursing survey results were analyzed using descriptive statistics. Open‐ended comments were reviewed in aggregate.
RESULTS
Participant Characteristics
Fifty‐four participants enrolled in the study. Fifty‐three were able to complete 1 DRS‐R‐98 and comprise the study sample (Table 1). Participants completed 1 to 5 daily DRS‐R‐98 assessments (mean, 1.94; standard deviation [SD], 0.90; mean length of admission, 6.06 days). Of the 105 DRS‐R‐98 assessments, 101 were classifiable for delirium. Of the 101 DRS‐R‐98 assessments classifiable for delirium, 100 had a corresponding DOS score within 24 hours. Participant characteristics are listed in Table 1. Eight of the 53 participants (15%) had at least 1 positive DRS‐R‐98. Overall, 10 of the 101 delirium assessments diagnosed delirium (DRS‐R‐98 score 15).
| Characteristic | No Delirium, n = 45 | Delirium, n = 8a |
|---|---|---|
| ||
| Age, y | ||
| 6574, n = 26 | 22 | 4 |
| 7584, n = 15 | 13 | 2 |
| 85+, n = 12 | 10 | 2 |
| Age, y, mean (SD) [range] | 77 (10) [6592] | 76 (8.6) [6592] |
| Gender | ||
| Female, n = 33 | 28 | 5 |
| Male, n = 20 | 17 | 3 |
| Cognitive status per chart | ||
| No impairment, n = 45 | 43 | 2 |
| Cognitive impairment without dementia, n = 5 | 1 | 4 |
| Dementia, n = 3 | 1 | 2 |
DOS Validity
The mean and standard deviation of delirium screening scores are as follows: DRS‐R‐98 (mean, 6.13; SD, 4.74; range, 020) and DOS (mean, 1.22; SD, 2.37; range, 09). The Spearman correlation coefficient between DOS and DRS‐R‐98 scores was 0.58. DOS had a sensitivity of 90% (95% confidence interval [CI]: 56%‐100%) and specificity of 91% (95% CI: 83%‐96%) compared to the DRS‐98‐R standard. There was only 1 false negative DOS screen out of 83 negative assessments (negative predictive value = 99%, 95% CI: 93%‐100%). Out of the 17 positive assessments, 9 were true positives (positive predictive value = 53%, 95% CI: 28%‐77%), and 7 scored in the subsyndromal range for delirium (DRS‐R‐98 score 814).
In analyses using 10 samples, with 1 randomly selected observation per person, the mean sensitivity was 84.6%, ranging from 80% (95% CI: 28%‐99%) to 87.5% (95% CI: 47%‐100%). The mean specificity in these samples was 92%, ranging from 87% (95% CI: 74%‐95%) to 96% (95% CI: 85%‐99%).
Logistic Regression Models
All models confirmed that positive DOS screens significantly predicted delirium. The traditional logistic regression model produced an odds ratio (OR) estimate of 92 (95% CI: 10‐824, P 0.0001) for a positive DOS screen predicting delirium. The marginal logistic regression model accounting for repeated measures produced a consistent estimate (OR: 93, 95% CI: 11‐800, P 0.0001). Continuous DOS scores predicted delirium (OR: 2.1, 95% CI: 1.5‐2.9, P 0.0001), and the ROC curve supported the cutoff of DOS 3, corresponding to a predicted probability of 0.12 (Figure 1).
Nursing Survey
The nursing survey had a response rate of 23% (N = 98). The most robust results related to DOS administration were 87% (N = 83) of nurses were confident in DOS administration, 92% (N = 86) could complete the DOS in under 3 minutes, and 79% (N = 74) agreed that performing the DOS is easy. There was less agreement on the value of the DOS; 37% agreed that the DOS is worth the time to perform, 25% agreed that the DOS enhances patient care, and 36% agreed that the DOS provides valuable information for patient care. Over half the nurses (55%) reported that they perform the DOS 75% to 100% of the prompted times, and 62% stated if the DOS was no longer required, they would not use it. Open‐ended questions generated a wide range of responses, from supportive to critical of delirium screening and the DOS (see Supporting Information, Appendix 3, in the online version of this article).
DISCUSSION
This study demonstrated the effectiveness, efficiency, and ease of use of the DOS as a delirium screening tool. The DOS exhibited high sensitivity (90%) and specificity (91%). Similar to previous findings, the positive predictive value was only 53%, but the negative predictive value was 99%.[12] These results support that the DOS is consistently able to rule out delirium, with only 1 false negative in this study.
Nursing responses regarding user‐friendliness are consistent with other studies; however, there was a knowledge gap related to how positive delirium screens can inform and change care for patients.[7] Education is a known barrier to integrating delirium screening tools secondary to the need for regular and extensive education, frequent reminders to screen, and regular evaluations of assessment quality.[11, 13, 14, 15] Developing guidelines for responding to positive DOS screens and documenting its impact on care may incentivize use.
Study strengths include strong evaluator consistency, blinding of evaluator and nurses, and responses from a broad range of nurses (14 of 16 units represented). Additionally, this study demonstrated the efficacy and ease of use of an EMR‐prompted delirium screen. However, this study had several limitations, including a small sample size and a low incidence of delirium. The lower incidence is likely secondary to selection bias that resulted from difficulty consenting delirious subjects. The discordant time between DOS and DRS‐R‐98 assessments may have also influenced results; however, inclusion of data from the previous 8 to 24 hours in both tools makes the temporal separation of assessments less impactful.
The ability of the DOS to accurately identify patients at high risk of delirium is useful for healthcare staff. Future work will include nurse and physician education to emphasize delirium understanding, the importance of regular screening, and the use of nonpharmacological interventions. Additional studies will include examination of the interventions and outcomes of patients who screen positive for delirium to determine the long‐term impact of delirium screening.
Acknowledgements
The study authors would like to thank the University of Iowa Hospitals and Clinics, the Department of Family Medicine, and the University of Iowa Hospitals and Clinics nursing managers and nursing staff.
Disclosures
This study was funded by the Summer Research Fellowship program sponsored by the University of Iowa Carver College of Medicine. Drs. Weckmann and Carnahan were supported by the Health Resources and Services Administration, Iowa Geriatric Education Center (UB4 HP19054) as well as the US Department of Health and Human Services, Agency for Healthcare Research and Quality (AHRQ 1 R18 HS022666‐01).
- , , . An intervention to reduce delirium in care homes. Nurs Older People. 2010;22(4):16–21.
- , , , et al. Assessment of delirium in the intensive care unit: nursing practices and perceptions. Am J Crit Care. 2008;17(6):555–565.
- , , , et al. Delirium and sedation recognition using validated instruments: reliability of bedside intensive care unit nursing assessments from 2007 to 2010. J Am Geriatr Soc. 2011;59(suppl 2):S249–S255.
- , , , et al. Preliminary development of an ultrabrief two‐item bedside test for delirium. J Hosp Med. 2015;10(10):645–650.
- , , , et al. The association between an ultrabrief cognitive screening in older adults and hospital outcomes. J Hosp Med. 2015;10(10):651–657.
- , , , et al. Comparison of mental‐status scales for predicting mortality on the general wards. J Hosp Med. 2015;10(10):658–663.
- , , . The Delirium Observation Screening Scale: a screening instrument for delirium. Res Theory Nurs Pract. 2003;17(1):31–50.
- . Validation of the Delirium Rating Scale‐Revised‐98: comparison with the Delirium Rating Scale and the Cognitive Test for Delirium. J Neuropsychiatry Clin Neurosci. 2001;13(2):229–242.
- , , , et al. Factor analysis of the Colombian translation of the Delirium Rating Scale (DRS), Revised‐98. Psychosomatics. 2009;50(3):255–262.
- , , , et al. Implementation, reliability testing, and compliance monitoring of the Confusion Assessment Method for the Intensive Care Unit in trauma patients. Intensive Care Med. 2008;34(7):1263–1268.
- , , , et al. Limitations and practicalities of CAM‐ICU implementation, a delirium scoring system, in a Dutch intensive care unit. Intensive Crit Care Nurs. 2009;25(5):242–249.
- , . The Neecham Confusion Scale and the Delirium Observation Screening Scale: capacity to discriminate and ease of use in clinical practice. BMC Nurs. 2007;6:3.
- , , . Early recognition of delirium: review of the literature. J Clin Nurs. 2001;10(6):721–729.
- , , , et al. Impact of a delirium screening tool and multifaceted education on nurses' knowledge of delirium and ability to evaluate it correctly. Am J Crit Care. 2012;21(1):e1–e11.
- , , . Optimising the recognition of delirium in the intensive care unit. Best Pract Res Clin Anaesthesiol. 2012;26(3):385–393.
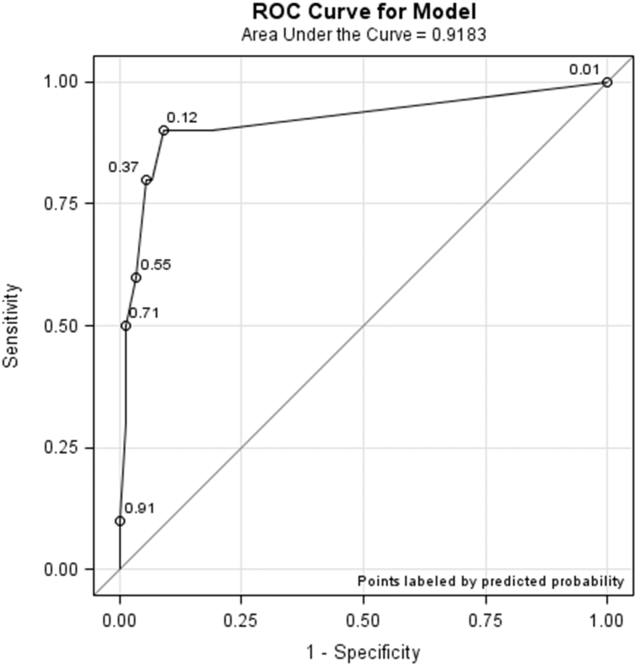
Management and Outcomes After SVTE
Superficial thrombophlebitis (SVTE), inflammation of superficial veins associated with thrombosis, is a painful condition, and 3% to 11% of the population will develop SVTE during their lifetime. Although generally considered a benign, self‐limited disease, it can cause considerable discomfort, impact mobility, and lead to further complications. Recent and accumulating evidence suggests that it is often associated with more serious forms of venous thromboembolism (VTE), including deep vein thrombosis (DVT) and pulmonary embolism (PE),[1] and SVTE is a strong risk factor for subsequent DVT or PE.[2, 3]
There is no clear consensus on the optimal treatment of SVTE. Although antithrombotic medications such as fondaparinux may be more effective than placebo in reducing the risk of subsequent DVT,[4] the evidence is generally of low grade, and the costs and inconveniences of anticoagulant therapy are not inconsequential.[1, 5, 6] Surveys suggest that physician opinions on the appropriate management of SVTE vary significantly, and management includes nonsteroidal anti‐inflammatory drugs (NSAIDs), topical therapies, or watchful waiting.[7] The objective of our study was to describe the initial management of SVTE in a community‐based population and examine subsequent rates of diagnosed DVT or PE in the following year.
MATERIALS AND METHODS
This was a retrospective, observational study seeking to describe the initial treatment for patients diagnosed with isolated SVTE.
Cohort Assembly
Data for this study were obtained from the Cardiovascular Research Network Venous Thromboembolism cohort study. The source population was based in Kaiser Permanente Northern California (KPNC), a large, integrated healthcare delivery system currently providing comprehensive care for >3.84 million members, and comprised of all adults aged 21 years or older with continuous enrollment in the KPNC health plan for 1 year and with a primary or secondary International Classification of Diseases, 9th RevisionClinical Modification (ICD‐9‐CM) diagnosis code of venous thrombosis (415.1x, 451.1x, 451.2, 451.81, 453.4x, 453.5x, 451.83, 451.84, 451.89, 453.72, 453.73, 453.74, 453.75, 453.76, 453.77, 453.82, 453.83, 453.84, 453.85, 453.86, 453.87, 451, 451.9, 452, 453, 453.0, 453.1, 453.2, 453.3, 453.79, 453.8, 453.89, 453.9) between January 1, 2004 and December 31, 2010. Of the 31,967 individuals meeting these criteria, 930 patients were selected by a random number generator for manual chart abstraction and review. Trained physician reviewers reviewed available emergency department, admission and discharge notes, outpatient clinic notes, and relevant radiology reports to determine whether or not the encounter represented a DVT, a SVTE, or other event.
Episodes were considered isolated SVTE if there was no evidence of a DVT or PE, and if there was medical chart documentation of either a diagnosis of SVTE, ultrasound evidence of a superficial vein clot, or a clinical description of SVTE as determined by the reviewing physician. All SVTE episodes in the study underwent a confirmatory review by second physician reviewer to confirm the diagnosis of SVTE.
Predictors and Outcomes
The primary outcome was documentation in the medical chart of a treatment recommendation for an antithrombotic agent, specifically, antiplatelet agents (aspirin, clopidogrel, ticlopidine), NSAIDs, and anticoagulants (low‐molecular‐weight heparin, fondaparinux, or warfarin). The secondary outcome was a subsequent diagnosis of VTE, which we defined as a subsequent encounter with an ICD‐9‐CM code for DVT or PE within 12 months after the initial episode, accompanied by a prescription for an anticoagulant within 7 days.
Data on patient age, sex, self‐reported race/ethnicity, and treatment setting (inpatient, emergency department, or outpatient) were obtained from health plan databases. Clinical risk factors for SVTE and the clinical presentation and treatment were obtained from physician chart review. Assessed risk factors included clinical conditions that have been associated with mildly increased SVTE risk (history of tobacco smoking, high body mass index), strongly increased risk (surgery or hospitalization within 30 days, active malignancy, hormonal therapy/pregnant or postpartum), provoking events (local trauma, central or peripheral intravenous catheter placement), and medical conditions that raise the risk for DVT (such as prior history of thrombosis or ischemic stroke).[8, 9] Data were abstracted by a single author (B.T.S.) using a standardized abstraction form. The study was approved by the institutional review boards of the collaborating institutions and informed consent was waived due to the nature of the study.
Statistical Methods
Analyses were conducted using SAS statistical software version 9.3 (SAS Institute Inc., Cary, NC), with a 2‐sided P 0.05 considered significant. We used 2 tests and Student t tests for categorical and continuous variables, respectively, to test the bivariate association of risk factors with receipt of antithrombotic therapy after SVTE. Multivariable models were not developed due to the limited sample size.
RESULTS
Out of 930 patients with a diagnosis code for venous thrombosis and who underwent chart review, we identified 329 individuals who were considered by reviewers to have isolated SVTE events. Most SVTEs were of the lower extremity (60.8%) and diagnosed in an outpatient or emergency department setting (91.8%). Risk factors for SVTE were common, including documented varicose veins, recent peripheral venous catheterization or injection, or antecedent hospitalization (Table 1).
| Clinical Characteristic | Value, n = 329 |
|---|---|
| Age, y, mean (standard deviation) | 59.4 (15.8) |
| Female, n (%) | 199 (60.5) |
| Race, n (%) | |
| White | 236 (71.7) |
| Black | 23 (7.0) |
| Asian/Pacific Islander | 22 (6.7) |
| Unknown | 48 (14.6) |
| Location of thrombophlebitis, n (%) | |
| Lower extremity | 200 (60.8) |
| Upper extremity | 108 (32.8) |
| Other/unknown | 21 (6.3) |
| Clinical risk factors, n (%) | |
| Varicose veins | 85 (25.8) |
| History of recent peripheral intravenous catheters | 71 (21.6) |
| History of recent local trauma | 22 (6.7) |
| History of thrombosis | 12 (3.7) |
| History of stroke | 7 (2.1) |
| Sepsis/acute infection | 18 (5.5) |
| Heart failure | 7 (2.1) |
| Chronic lung disease | 24 (7.3) |
| Malignant neoplasm | 29 (8.8) |
| Hospitalization or surgery within 30 days | 48 (14.6) |
| Hormone therapy | 12 (3.6) |
| Pregnant/postpartum | 3 (0.9) |
| Current smoker | 13 (4.0) |
| Body mass index available | 184 (55.9) |
| 25 | 48 (14.6) |
| >2530 | 64 (19.5) |
| >30 | 72 (21.9) |
Initial treatment strategies for the 329 patients are presented in Table 2. Few patients with SVTE received anticoagulants for initial treatment, although patients with lower extremity SVTE were more likely to receive antithrombotic therapy compared to patients with SVTE of other locations (P 0.001). None of the identified risk factors for thrombosis were statistically significantly associated with a greater likelihood of receiving anticoagulants (P > 0.05 for all).
| VTE Risk* | Initial Management, % (No.) | Total | |||
|---|---|---|---|---|---|
| NSAIDs | LMWH | Warfarin | No Documented Antithrombotic Therapy | ||
| |||||
| Low | 52% (128) | 1% (3) | 2% (5) | 45% (112) | 248 |
| High | 25% (20) | 4% (3) | 4% (3) | 68% (55) | 81 |
| Total | 45% (148) | 2% (6) | 2% (8) | 51% (167) | 329 |
In the 12 months after SVTE, 19 (5.8%) patients had a diagnosis encounter for VTE associated with a prescription for either warfarin or parenteral anticoagulant. Of the 200 patients in our study with lower extremity SVTE, 15 (7.5%) had a subsequent VTE diagnosis associated with anticoagulation prescription in the following year.
DISCUSSION
Clinically significant VTE within a year after SVTE diagnosis was uncommon in our study despite infrequent use of antithrombotic therapy. Although recommendations for the initial treatment of SVTE have evolved in more recent years to support the use of fondaparinux in selected patients, there are significant costs and inconveniences associated with anticoagulation therapy and debate among physicians about the preferred treatment.[7] The low rate of anticoagulant use in our study may be related to the years studied (before guidelines supported fondaparinux), as well as being largely comprised of outpatients, and also because we included types of SVTE that are unlikely to progress to DVT, such as small vein phlebitis or upper extremity SVTE.[4, 10]
Limitations of our analysis include the heterogeneous types of SVTE included in our study and our reliance on available chart documentation to ascertain SVTE diagnosis, risk factors, and treatment. Because of the observational nature of our study, SVTE in the hospital setting may have been less well documented in medical records, leading to a sample of mostly outpatients. Hence, our observed subsequent VTE rate may not be generalizable to a more inclusive population. Finally, the low rate of anticoagulant treatment and VTE diagnoses limited our ability to conduct multivariable modeling.
In conclusion, clinically significant VTE within a year after SVTE was uncommon in our study despite infrequent use of antithrombotic therapy. Although our data are observational, they suggest that not all patients may require anticoagulation for the management of SVTE, and that further investigation into defining which populations would most benefit from treatment with fondaparinux or other agents is warranted.
Disclosures
This study was funded by the National Heart, Lung, and Blood Institute of the National Institutes of Health (grants R01HL103820 and U19HL91179). The sponsor was not involved in the design and conduct of the study; collection, management, analysis, and interpretation of the data; or preparation, review, or approval of the manuscript. Dr. Go received research grant funding from CSL Behring. None of the other authors have financial conflicts of interest.
- , , . Treatment for superficial thrombophlebitis of the leg. Cochrane Database Syst Rev. 2013;4:CD004982.
- , , , et al. Superficial venous thrombosis and venous thromboembolism: a large, prospective epidemiologic study. Ann Intern Med. 2010;152:218–224.
- , , , et al. Risk of venous and arterial thrombotic events in patients diagnosed with superficial vein thrombosis: a nationwide cohort study. Blood. 2015;125:229–235.
- , , , et al. Fondaparinux for the treatment of superficial‐vein thrombosis in the legs. N Engl J Med. 2010;363:1222–1232.
- , , , . Fondaparinux for isolated superficial vein thrombosis of the legs: a cost‐effectiveness analysis. Chest. 2012;141:321–329.
- , , , et al. Antithrombotic therapy for VTE disease: Antithrombotic Therapy and Prevention of Thrombosis, 9th ed: American College of Chest Physicians Evidence‐Based Clinical Practice Guidelines. Chest. 2012;141(2 suppl):e419S–e494S.
- , , , , . The disparate management of superficial venous thrombosis in primary and secondary care. Phlebology. 2015;30:172–179.
- , , , , , . The risk of venous thrombosis in individuals with a history of superficial vein thrombosis and acquired venous thrombotic risk factors. Blood. 2013;122:4264–4269.
- , , , et al. Risk factors for recurrent events in subjects with superficial vein thrombosis in the randomized clinical trial SteFlux (Superficial Thromboembolism Fluxum). Thromb Res. 2014;133:196–202.
- , , , et al. Superficial vein thrombosis and recurrent venous thromboembolism: a pooled analysis of two observational studies. J Thromb Haemost. 2012;10:1004–1011.
Superficial thrombophlebitis (SVTE), inflammation of superficial veins associated with thrombosis, is a painful condition, and 3% to 11% of the population will develop SVTE during their lifetime. Although generally considered a benign, self‐limited disease, it can cause considerable discomfort, impact mobility, and lead to further complications. Recent and accumulating evidence suggests that it is often associated with more serious forms of venous thromboembolism (VTE), including deep vein thrombosis (DVT) and pulmonary embolism (PE),[1] and SVTE is a strong risk factor for subsequent DVT or PE.[2, 3]
There is no clear consensus on the optimal treatment of SVTE. Although antithrombotic medications such as fondaparinux may be more effective than placebo in reducing the risk of subsequent DVT,[4] the evidence is generally of low grade, and the costs and inconveniences of anticoagulant therapy are not inconsequential.[1, 5, 6] Surveys suggest that physician opinions on the appropriate management of SVTE vary significantly, and management includes nonsteroidal anti‐inflammatory drugs (NSAIDs), topical therapies, or watchful waiting.[7] The objective of our study was to describe the initial management of SVTE in a community‐based population and examine subsequent rates of diagnosed DVT or PE in the following year.
MATERIALS AND METHODS
This was a retrospective, observational study seeking to describe the initial treatment for patients diagnosed with isolated SVTE.
Cohort Assembly
Data for this study were obtained from the Cardiovascular Research Network Venous Thromboembolism cohort study. The source population was based in Kaiser Permanente Northern California (KPNC), a large, integrated healthcare delivery system currently providing comprehensive care for >3.84 million members, and comprised of all adults aged 21 years or older with continuous enrollment in the KPNC health plan for 1 year and with a primary or secondary International Classification of Diseases, 9th RevisionClinical Modification (ICD‐9‐CM) diagnosis code of venous thrombosis (415.1x, 451.1x, 451.2, 451.81, 453.4x, 453.5x, 451.83, 451.84, 451.89, 453.72, 453.73, 453.74, 453.75, 453.76, 453.77, 453.82, 453.83, 453.84, 453.85, 453.86, 453.87, 451, 451.9, 452, 453, 453.0, 453.1, 453.2, 453.3, 453.79, 453.8, 453.89, 453.9) between January 1, 2004 and December 31, 2010. Of the 31,967 individuals meeting these criteria, 930 patients were selected by a random number generator for manual chart abstraction and review. Trained physician reviewers reviewed available emergency department, admission and discharge notes, outpatient clinic notes, and relevant radiology reports to determine whether or not the encounter represented a DVT, a SVTE, or other event.
Episodes were considered isolated SVTE if there was no evidence of a DVT or PE, and if there was medical chart documentation of either a diagnosis of SVTE, ultrasound evidence of a superficial vein clot, or a clinical description of SVTE as determined by the reviewing physician. All SVTE episodes in the study underwent a confirmatory review by second physician reviewer to confirm the diagnosis of SVTE.
Predictors and Outcomes
The primary outcome was documentation in the medical chart of a treatment recommendation for an antithrombotic agent, specifically, antiplatelet agents (aspirin, clopidogrel, ticlopidine), NSAIDs, and anticoagulants (low‐molecular‐weight heparin, fondaparinux, or warfarin). The secondary outcome was a subsequent diagnosis of VTE, which we defined as a subsequent encounter with an ICD‐9‐CM code for DVT or PE within 12 months after the initial episode, accompanied by a prescription for an anticoagulant within 7 days.
Data on patient age, sex, self‐reported race/ethnicity, and treatment setting (inpatient, emergency department, or outpatient) were obtained from health plan databases. Clinical risk factors for SVTE and the clinical presentation and treatment were obtained from physician chart review. Assessed risk factors included clinical conditions that have been associated with mildly increased SVTE risk (history of tobacco smoking, high body mass index), strongly increased risk (surgery or hospitalization within 30 days, active malignancy, hormonal therapy/pregnant or postpartum), provoking events (local trauma, central or peripheral intravenous catheter placement), and medical conditions that raise the risk for DVT (such as prior history of thrombosis or ischemic stroke).[8, 9] Data were abstracted by a single author (B.T.S.) using a standardized abstraction form. The study was approved by the institutional review boards of the collaborating institutions and informed consent was waived due to the nature of the study.
Statistical Methods
Analyses were conducted using SAS statistical software version 9.3 (SAS Institute Inc., Cary, NC), with a 2‐sided P 0.05 considered significant. We used 2 tests and Student t tests for categorical and continuous variables, respectively, to test the bivariate association of risk factors with receipt of antithrombotic therapy after SVTE. Multivariable models were not developed due to the limited sample size.
RESULTS
Out of 930 patients with a diagnosis code for venous thrombosis and who underwent chart review, we identified 329 individuals who were considered by reviewers to have isolated SVTE events. Most SVTEs were of the lower extremity (60.8%) and diagnosed in an outpatient or emergency department setting (91.8%). Risk factors for SVTE were common, including documented varicose veins, recent peripheral venous catheterization or injection, or antecedent hospitalization (Table 1).
| Clinical Characteristic | Value, n = 329 |
|---|---|
| Age, y, mean (standard deviation) | 59.4 (15.8) |
| Female, n (%) | 199 (60.5) |
| Race, n (%) | |
| White | 236 (71.7) |
| Black | 23 (7.0) |
| Asian/Pacific Islander | 22 (6.7) |
| Unknown | 48 (14.6) |
| Location of thrombophlebitis, n (%) | |
| Lower extremity | 200 (60.8) |
| Upper extremity | 108 (32.8) |
| Other/unknown | 21 (6.3) |
| Clinical risk factors, n (%) | |
| Varicose veins | 85 (25.8) |
| History of recent peripheral intravenous catheters | 71 (21.6) |
| History of recent local trauma | 22 (6.7) |
| History of thrombosis | 12 (3.7) |
| History of stroke | 7 (2.1) |
| Sepsis/acute infection | 18 (5.5) |
| Heart failure | 7 (2.1) |
| Chronic lung disease | 24 (7.3) |
| Malignant neoplasm | 29 (8.8) |
| Hospitalization or surgery within 30 days | 48 (14.6) |
| Hormone therapy | 12 (3.6) |
| Pregnant/postpartum | 3 (0.9) |
| Current smoker | 13 (4.0) |
| Body mass index available | 184 (55.9) |
| 25 | 48 (14.6) |
| >2530 | 64 (19.5) |
| >30 | 72 (21.9) |
Initial treatment strategies for the 329 patients are presented in Table 2. Few patients with SVTE received anticoagulants for initial treatment, although patients with lower extremity SVTE were more likely to receive antithrombotic therapy compared to patients with SVTE of other locations (P 0.001). None of the identified risk factors for thrombosis were statistically significantly associated with a greater likelihood of receiving anticoagulants (P > 0.05 for all).
| VTE Risk* | Initial Management, % (No.) | Total | |||
|---|---|---|---|---|---|
| NSAIDs | LMWH | Warfarin | No Documented Antithrombotic Therapy | ||
| |||||
| Low | 52% (128) | 1% (3) | 2% (5) | 45% (112) | 248 |
| High | 25% (20) | 4% (3) | 4% (3) | 68% (55) | 81 |
| Total | 45% (148) | 2% (6) | 2% (8) | 51% (167) | 329 |
In the 12 months after SVTE, 19 (5.8%) patients had a diagnosis encounter for VTE associated with a prescription for either warfarin or parenteral anticoagulant. Of the 200 patients in our study with lower extremity SVTE, 15 (7.5%) had a subsequent VTE diagnosis associated with anticoagulation prescription in the following year.
DISCUSSION
Clinically significant VTE within a year after SVTE diagnosis was uncommon in our study despite infrequent use of antithrombotic therapy. Although recommendations for the initial treatment of SVTE have evolved in more recent years to support the use of fondaparinux in selected patients, there are significant costs and inconveniences associated with anticoagulation therapy and debate among physicians about the preferred treatment.[7] The low rate of anticoagulant use in our study may be related to the years studied (before guidelines supported fondaparinux), as well as being largely comprised of outpatients, and also because we included types of SVTE that are unlikely to progress to DVT, such as small vein phlebitis or upper extremity SVTE.[4, 10]
Limitations of our analysis include the heterogeneous types of SVTE included in our study and our reliance on available chart documentation to ascertain SVTE diagnosis, risk factors, and treatment. Because of the observational nature of our study, SVTE in the hospital setting may have been less well documented in medical records, leading to a sample of mostly outpatients. Hence, our observed subsequent VTE rate may not be generalizable to a more inclusive population. Finally, the low rate of anticoagulant treatment and VTE diagnoses limited our ability to conduct multivariable modeling.
In conclusion, clinically significant VTE within a year after SVTE was uncommon in our study despite infrequent use of antithrombotic therapy. Although our data are observational, they suggest that not all patients may require anticoagulation for the management of SVTE, and that further investigation into defining which populations would most benefit from treatment with fondaparinux or other agents is warranted.
Disclosures
This study was funded by the National Heart, Lung, and Blood Institute of the National Institutes of Health (grants R01HL103820 and U19HL91179). The sponsor was not involved in the design and conduct of the study; collection, management, analysis, and interpretation of the data; or preparation, review, or approval of the manuscript. Dr. Go received research grant funding from CSL Behring. None of the other authors have financial conflicts of interest.
- , , . Treatment for superficial thrombophlebitis of the leg. Cochrane Database Syst Rev. 2013;4:CD004982.
- , , , et al. Superficial venous thrombosis and venous thromboembolism: a large, prospective epidemiologic study. Ann Intern Med. 2010;152:218–224.
- , , , et al. Risk of venous and arterial thrombotic events in patients diagnosed with superficial vein thrombosis: a nationwide cohort study. Blood. 2015;125:229–235.
- , , , et al. Fondaparinux for the treatment of superficial‐vein thrombosis in the legs. N Engl J Med. 2010;363:1222–1232.
- , , , . Fondaparinux for isolated superficial vein thrombosis of the legs: a cost‐effectiveness analysis. Chest. 2012;141:321–329.
- , , , et al. Antithrombotic therapy for VTE disease: Antithrombotic Therapy and Prevention of Thrombosis, 9th ed: American College of Chest Physicians Evidence‐Based Clinical Practice Guidelines. Chest. 2012;141(2 suppl):e419S–e494S.
- , , , , . The disparate management of superficial venous thrombosis in primary and secondary care. Phlebology. 2015;30:172–179.
- , , , , , . The risk of venous thrombosis in individuals with a history of superficial vein thrombosis and acquired venous thrombotic risk factors. Blood. 2013;122:4264–4269.
- , , , et al. Risk factors for recurrent events in subjects with superficial vein thrombosis in the randomized clinical trial SteFlux (Superficial Thromboembolism Fluxum). Thromb Res. 2014;133:196–202.
- , , , et al. Superficial vein thrombosis and recurrent venous thromboembolism: a pooled analysis of two observational studies. J Thromb Haemost. 2012;10:1004–1011.
Older Inpatients' Views on Group PT
There is uncertainty regarding older adults' attitudes toward participating in group exercise. Although some evidence suggests that in the community, older adults prefer to exercise alone with some instruction,[1, 2] others support the preference of group exercise with peers.[3] Little is known about the attitudes of hospitalized older adults toward group physiotherapy (GPT). Providing physiotherapy (also known as physical therapy) in a group setting has been shown to be effective in a variety of populations,[4, 5, 6, 7] and as a consequence of simultaneously treating multiple patients, therapist[8] and cost[9] efficiency are enhanced. Description of the patient experience is increasingly being recognized as a crucial element in the delivery of patient‐centered care and performance evaluation of health professionals and services.[10] Therefore, the purpose of this investigation was to explore older inpatients' experiences of GPT to assist with planning and designing future inpatient programs to maximize patient participation, satisfaction, and clinical outcomes.
METHODS
Recruitment
A subset of participants enrolled in a randomized controlled trial investigating the effects of a GPT and individual physiotherapy program on clinical outcomes in hospitalized older adults (ANZCTR number: 12608000580370) were asked during the initial consenting procedure if they would also consent to participating in an interview about their experiences of physiotherapy. Ethics approval was provided by hospital and university ethics committees, and all participants provided written informed consent prior to commencement.
Participants
Inclusion criteria were inpatients on aged care wards at a metropolitan rehabilitation hospital, aged 65 years or older, and willing to take part in GPT. Exclusion criteria were Mini‐Mental State Examination[11] scores 10, physically unable or behaviorally unsuitable for GPT, insufficient proficiency in English, and significant memory loss. The latter 2 criteria were to allow for in‐depth interviews. Sixteen participants consented to take part.
Group Physiotherapy Intervention
Participants attended exercise classes 3 times per week, with a maximum of 6 participants, and were led by a trained physiotherapist or allied health assistant (group instructor). In addition, all participants also received individual physiotherapy; the treating therapist determined the type, intensity, and duration of the treatment with input from their patient.
Data Collection
After undertaking at least 3 group classes, individual interviews were undertaken in a quiet room with an independent researcher (MR). Interviews were conducted and audio‐recorded using a digital voice recorder, and were transcribed verbatim by MR within 24 hours. An interview guide with open‐ended questions, created specifically for this study, was modified after preliminary analysis of the first interview (Table 1). Interviews continued until no new themes arose in the last 3 interviews; saturation point[12] was decided by reviewer consensus and reached at 12 interviews. The key outcome of interest was themes relating to participants' experiences of GPT. Interviews lasted between 5 and 45 minutes.
|
| Questions |
| How do you feel about attending the group PT sessions? |
| What aspects of the group PT sessions do you enjoy? |
| What aspects of the group PT sessions do you dislike? |
| What do you think about the level of supervision and support you receive in the group sessions? |
| What do you think about the amount of PT you receive in these group sessions? |
| What are the main differences between the exercise group and the individual sessions? |
| What did you expect to occur in the group sessions? |
| How do you feel when you see other people doing better than you in the group? |
| How do you feel when you see other people doing worse than you in the group? |
| In the future, what things could be changed to make group PT more enjoyable for you? |
| What other comments or feedback do you have? |
Data Analysis
Two reviewers independently completed line‐by‐line thematic analysis.[13] One reviewer used NVivo to support analysis,[14] and the other reviewer analyzed interviews manually. Text was coded,[15] and constant comparison was utilized to ensure later emerging codes were identified in earlier interviews.[15] Researchers then met to compare and discuss coding definitions and their results; similar codes that arose in multiple interviews were compared and grouped together to develop themes and subthemes, which were refined until consensus was reached. Interviews and themes were reviewed by a third researcher (AH) as part of a peer review process to minimize researcher bias.[16]
RESULTS
Eight females and 4 males aged 73 to 93 years (mean = 82.5 years, standard deviation = 7.1 years) participated in the interviews. After initially consenting to participate, 1 participant declined due to fatigue. Three participants were discharged prior to scheduling an interview. Analysis revealed 6 major themes and 10 subthemes (Table 2).
| Major Theme | Subtheme | Supporting Extracts |
|---|---|---|
| ||
| Participation and satisfaction | Happy to participate in group PT | It's been terrific. It's the best thing I've done since being here. I've been very happyyou should continue it, that's for sure. It's best for everybody. (Participant 1) |
| Group PT was a satisfactory alternative to individual PT | I rather enjoy it. I'm looking forward to it today. I can't see much difference [between the group and individual PT]. Couldn't be better. (Participant 3) | |
| Exercise and physical benefits | Happy with the content | I didn't find any of the exercises beyond my limits. I didn't realize how weak I was. After exercising, I found the muscles in my neck were tightandgetting a bit sore initially, but the more I did, the lesser it gotwith the arthritis, it is good to get it moving. (Participant 12) |
| Described physical benefits | Whatever I'm doing is helping with my balance and helping with general muscle things. I'm getting a little bit bettermy balance has improved. (Participant 4) | |
| Camaraderie and support | Enjoyment of the social aspects of group PT, feeling like they're in it together | The group is nice because we smile at each other and we grimacewe feel the same thingsit hurts or I'm tired. We sometimes have a bit of a laugh and sometimes have a bit of a moan. I think you enjoy it more if you've got others doing the same thing as you. [We] egg everybody on to do their best. (Participant 4) |
| Celebration of others' successes | One of the other ladies went home and I was really pleased for her. She'd been here for quite some time and I wished her well. (Participant 4) | |
| I just clap like mad for somebody who has done a better job next time I see them. [It] shows that they're trying harder. (Participant 3) | ||
| Self‐satisfaction and self‐awareness | Feeling good about their performance | I can walk to the toilet and walk around the ward. A few of them just can't. It made me think about life and how fortunate I've been. When I look around, there's a lot more that's worse off than me. (Participant 2) |
| I feel lucky. I'm better than the other ones.My legs are very bad but there's one who can hardly lift her legs. I'm very lucky. (Participant 8) | ||
| Motivation and drive for improvement | Self‐determination plays an important role in recovery, with physical benefits as an extrinsic motivator | I try pretty much as hard as I canI do the best I can and that's about all I can do, really. (Participant 4) |
| Part of the reason I'm here is just to try and improve my balance so that I don't fall over. (Participant 7) | ||
| Competition as extrinsic motivation | It's a bit of a challenge. I've only done 8 and they've done 10. Incentiveit becomes a bit like competition. (Participant 1) | |
| I try and do better than what they're doing. (Participant 5). | ||
| It's good to be together to do it, I think it gives you an incentive to work at it, push yourself a little bit. Competitiveness comes out[you have] got to push yourself a bit harder. (Participant 12) | ||
| Qualities of the group instructor | Knowledge and attentiveness of the group instructor | She knows I've got a bad back and I've got a bad arm so she says, You don't do that one, Don't forget, you mustn't do it if it hurts. (Participant 3) |
Themes
Attendance and Satisfaction
Participants were happy to attend GPT. Participants saw it as an opportunity to get out of the room (participant 4) and they valued the socialization.
Participants found GPT to be a satisfactory alternative to individual sessions. Participants described no difference in the level or type of physiotherapy in group and individual settings; both were valued for exercise content.
Exercise and Physical Benefits
Participants were happy with the content of GPT. Despite being high intensity, exercises were reported to be appropriate.
Perceived physical benefits were described. Reduced pain and stiffness, and improved balance and strength were described with GPT, which contributed to satisfaction.
Qualities of the Group Instructor
Knowledge and Attentiveness of the Group Instructor
These supportive qualities were described as important factors by participants. Some participants acknowledged the number of other participants in GPT; however, they perceived that the instructor was monitoring each person individually, constantly, and equally. Participants reported that group instructors modified or ceased exercises where appropriate, engendering trust (participant 5) and perceived that GPT was individualized and not inferior to individual PT.
Social AspectsCamaraderie and Support
Enjoyment of the Social Aspects of GPT: Feeling Like They're in It Together
Participants reported enjoying the company and support of their peers. They described camaraderie and did not feel alone in their experiences. Exercising with peers encouraged them to push themselves more than during individual physiotherapy.
Celebration of Others' Successes
Some participants expressed awareness of their support to others; seeing others improve and return home gave them encouragement.
Self‐Satisfaction and Self‐Awareness
Feel Good About Their Mobility and Health in the Group Setting
Participants made downward comparisons with others less mobile, which resulted in a realization, gratitude, and acceptance of their own health and physical abilities/limitations.
Self‐Determination and Extrinsic Motivators
Self‐Determination Plays an Important Role in Recovery, With Physical Benefits as an Extrinsic Motivator
Participants described self‐determination to exercise, some without peer influence. Physical benefits of exercise were an extrinsic motivator; participants felt that they were doing as best they could to achieve their goals.
Competition as an Extrinsic Motivator
Upward social comparisons were made with peers who participants perceived were performing better than them, which increased motivation to work harder. Self‐determination and competition were not mutually exclusive.
DISCUSSION
Participants were positive about GPT and reported experiencing physical benefits. Motivation was reported as an important factor in recovery, with improving mobility and competition as commonly described extrinsic motivators. Social comparisons made between participants were motivating and reassuring.
Group physiotherapy sessions are often a replacement for individual physiotherapy; therefore, it is important that participants feel they are receiving a suitable alternative. Individual physiotherapy has advantages over GPT including affording a more individualized assessment and treatment; a combination of both may be appropriate for many older inpatients. Although there is conflicting evidence of the exercise preferences of community‐dwelling older adults,[1] the results of this study are consistent with evidence supporting exercising with peers.[3, 17]
Self‐determination theory describes motivation existing along a continuum, from intrinsic motivation to extrinsic motivation then amotivation.[18] Participants described valuing the physical benefits of exercise (extrinsic motivation), similarly noted by survivors of stroke.[19, 20] For those who do not value exercise, group instructors may consider discussing its benefits during GPT. Competition may be stimulated through exercising with peers; therefore, group instructors should utilize this advantage of GPT over individual physiotherapy.
Participants feeling socially supported in GPT were similar to those reported by hospitalized older adults[21] as well as those undertaking exercise groups for cardiac rehabilitation,[22] terminal cancer,[23] and following lung transplantation.[24] Fostering a supportive environment may enhance the patient experience; therefore, physiotherapists should encourage GPT attendance and socialization (as appropriate) and actively acknowledge physical improvements.
The Social Comparison Theory suggests that people evaluate their abilities by comparing themselves to their peers.[25, 26] Participants who made upward comparisons, with those who they perceived were better than them[26] resulted in motivation to attain the level of their more mobile peers. Downward comparisons were also made with those who they felt were less mobile; these engendered feelings of gratitude and appreciation for their own health and promoted self‐esteem,[26] and have also been reported in other populations including those with spinal cord injury[27] and breast cancer.[28]
Study Limitations
Interviews were not conducted with those who received individual physiotherapy alone, and therefore no comparisons can be drawn regarding their experiences and satisfaction. Those who participated in interviews had already consented to participating in GPT; those who declined GPT were not part of the trial and therefore responses may have some bias. To minimize this bias, the interview guide included questions into positive and negative aspects of group and individual physiotherapy. Although community‐dwelling older adults perceive boredom, intimidation, and potential for injury to be barriers to participation in exercise,[29] future research should investigate why older inpatients decline GPT and methods for improving participation.
CONCLUSION
This study provides new evidence to support GPT for hospitalized older adults. Participants in this study enjoyed GPT and were motivated and supported by their peers. As GPT was valued by hospitalized older adults who participated in this study for its physical and social benefits, clinicians could consider replacing several individual treatment sessions with GPT as part of a weekly treatment schedule.
Acknowledgements
The principle investigator thanks E. Harris, C. Chenneaux, A. Shapiro, D. Kronemberg, R. Roose and B. Doyle‐Jones for running the exercise groups, and also extends her thanks and gratitude to all of the patients interviewed for their time and honesty.
Disclosures: Melissa J. Raymond was supported by an Australian Postgraduate Award scholarship and a Caulfield Hospital Research Trust Projects Grant 2008/2009.
- , , , , , . Personal and environmental factors associated with physical inactivity among different racial‐ethnic groups of U.S. middle‐aged and older‐aged women. Health Psychol. 2000;19(4):354–364.
- , , , . Physical activity preferences of middle‐aged and older adults: a community analysis. J Aging Phys Act. 1999;7(4):386–399.
- , , , . Older adults' preferences for exercising alone versus in groups: considering contextual congruence. Ann Behav Med. 2007;33(2):200–206.
- , , , , . Group versus individual approach? A meta‐analysis of the effectiveness of interventions to promote physical activity. Sport Exerc Psychol Rev. 2006;2(1):19–35.
- , , , , , . A high‐intensity functional weight‐bearing exercise program for older people dependent in activities of daily living and living in residential care facilities: evaluation of the applicability with focus on cognitive function. Phys Ther. 2006;86(4):489–498.
- , , , , , . The value of individual or collective group exercise programs for knee or hip osteoarthritis. Clinical practice recommendations. Ann Readapt Med Phys. 2007;50(9):741–746, 734–740.
- , , , . Circuit class therapy versus individual physiotherapy sessions during inpatient stroke rehabilitation: a controlled trial. Arch Phys Med Rehabil. 2007;88(8):955–963.
- , , , . A descriptive analysis of physical therapy group intervention in five midwestern inpatient rehabilitation facilities. J Phys Ther Educ. 2000;14:13–20.
- , , , et al. Group treatments for sensitive health care problems: a randomised controlled trial of group versus individual physiotherapy sessions for female urinary incontinence. BMC Womens Health. 2009;9:26.
- . Service improvement and patient experience. Int Emerg Nurs. 2010;18(4):175–176.
- , , . “Mini‐mental state”. A practical method for grading the cognitive state of patients for the clinician. J Psychiatr Res. 1975;12:189–198.
- , . The Discovery of Grounded Theory: Strategies for Qualitative Research. Mill Valley, CA: Sociology Press; 1967.
- , . Using thematic analysis in psychology. Qual Res Psychol 2006;3(2):77–101.
- , . The NVivo Qualitative Project Book. London, United Kingdom: Sage; 2000.
- . A purposeful approach to the constant comparative method in the analysis of qualitative interviews. Qual Quant. 2002;36(4):391–409.
- , . Rigour and qualitative research. BMJ. 1995;311(6997):109–112.
- , , . How, where and with whom? Physical activity context preferences of three adult groups at risk of inactivity. Br J Sports Med. 2012;46(16):1125–1131.
- , , . Older adults' intrinsic and extrinsic motivation toward physical activity. Am J Health Behav. 2008;32(6):570–582.
- , , , . Qualitative analysis of stroke patients' motivation for rehabilitation. BMJ. 2000;321(7268):1051–1054.
- , , . Exercise perceptions among people with stroke: barriers and facilitators to participation. Int J Ther Rehabil. 2011;18(9):520–530.
- , , , . Interaction between clients and physiotherapists in group exercise classes in geriatric rehabilitation. Adv Physiother. 2009;11(3):145–153.
- , , , . Patients' experience of home and hospital based cardiac rehabilitation: a focus group study. Eur J Cardiovasc Nurs. 2009;8(1):9–17.
- , , , , . Exercise and relaxation intervention for patients with advanced lung cancer: a qualitative feasibility study. Scand J Med Sci Sports. 2012;22(6):804–815.
- , , , et al. Patients' expectations and experiences of rehabilitation following lung transplantation. Clin Transplant. 2014;28(2):252–258.
- . A theory of social comparison processes. Hum Relat. 1954;7(2):117–140.
- . Theory and research concerning social comparisons of personal attributes. Psychol Bull. 1989;106(2):231–248.
- , . Long‐term adjustment to physical disability: the role of social support, perceived control, and self‐blame. J Pers Soc Psychol. 1985;48:1162–1172.
- , , . It could be worse: selective evaluation as a response to victimization. J Soc Issues. 1983;39:19–40.
- , , , . Motivators, barriers, and beliefs regarding physical activity in an older adult population. J Geriatr Phys Ther. 2011;34(3):138–147.
There is uncertainty regarding older adults' attitudes toward participating in group exercise. Although some evidence suggests that in the community, older adults prefer to exercise alone with some instruction,[1, 2] others support the preference of group exercise with peers.[3] Little is known about the attitudes of hospitalized older adults toward group physiotherapy (GPT). Providing physiotherapy (also known as physical therapy) in a group setting has been shown to be effective in a variety of populations,[4, 5, 6, 7] and as a consequence of simultaneously treating multiple patients, therapist[8] and cost[9] efficiency are enhanced. Description of the patient experience is increasingly being recognized as a crucial element in the delivery of patient‐centered care and performance evaluation of health professionals and services.[10] Therefore, the purpose of this investigation was to explore older inpatients' experiences of GPT to assist with planning and designing future inpatient programs to maximize patient participation, satisfaction, and clinical outcomes.
METHODS
Recruitment
A subset of participants enrolled in a randomized controlled trial investigating the effects of a GPT and individual physiotherapy program on clinical outcomes in hospitalized older adults (ANZCTR number: 12608000580370) were asked during the initial consenting procedure if they would also consent to participating in an interview about their experiences of physiotherapy. Ethics approval was provided by hospital and university ethics committees, and all participants provided written informed consent prior to commencement.
Participants
Inclusion criteria were inpatients on aged care wards at a metropolitan rehabilitation hospital, aged 65 years or older, and willing to take part in GPT. Exclusion criteria were Mini‐Mental State Examination[11] scores 10, physically unable or behaviorally unsuitable for GPT, insufficient proficiency in English, and significant memory loss. The latter 2 criteria were to allow for in‐depth interviews. Sixteen participants consented to take part.
Group Physiotherapy Intervention
Participants attended exercise classes 3 times per week, with a maximum of 6 participants, and were led by a trained physiotherapist or allied health assistant (group instructor). In addition, all participants also received individual physiotherapy; the treating therapist determined the type, intensity, and duration of the treatment with input from their patient.
Data Collection
After undertaking at least 3 group classes, individual interviews were undertaken in a quiet room with an independent researcher (MR). Interviews were conducted and audio‐recorded using a digital voice recorder, and were transcribed verbatim by MR within 24 hours. An interview guide with open‐ended questions, created specifically for this study, was modified after preliminary analysis of the first interview (Table 1). Interviews continued until no new themes arose in the last 3 interviews; saturation point[12] was decided by reviewer consensus and reached at 12 interviews. The key outcome of interest was themes relating to participants' experiences of GPT. Interviews lasted between 5 and 45 minutes.
|
| Questions |
| How do you feel about attending the group PT sessions? |
| What aspects of the group PT sessions do you enjoy? |
| What aspects of the group PT sessions do you dislike? |
| What do you think about the level of supervision and support you receive in the group sessions? |
| What do you think about the amount of PT you receive in these group sessions? |
| What are the main differences between the exercise group and the individual sessions? |
| What did you expect to occur in the group sessions? |
| How do you feel when you see other people doing better than you in the group? |
| How do you feel when you see other people doing worse than you in the group? |
| In the future, what things could be changed to make group PT more enjoyable for you? |
| What other comments or feedback do you have? |
Data Analysis
Two reviewers independently completed line‐by‐line thematic analysis.[13] One reviewer used NVivo to support analysis,[14] and the other reviewer analyzed interviews manually. Text was coded,[15] and constant comparison was utilized to ensure later emerging codes were identified in earlier interviews.[15] Researchers then met to compare and discuss coding definitions and their results; similar codes that arose in multiple interviews were compared and grouped together to develop themes and subthemes, which were refined until consensus was reached. Interviews and themes were reviewed by a third researcher (AH) as part of a peer review process to minimize researcher bias.[16]
RESULTS
Eight females and 4 males aged 73 to 93 years (mean = 82.5 years, standard deviation = 7.1 years) participated in the interviews. After initially consenting to participate, 1 participant declined due to fatigue. Three participants were discharged prior to scheduling an interview. Analysis revealed 6 major themes and 10 subthemes (Table 2).
| Major Theme | Subtheme | Supporting Extracts |
|---|---|---|
| ||
| Participation and satisfaction | Happy to participate in group PT | It's been terrific. It's the best thing I've done since being here. I've been very happyyou should continue it, that's for sure. It's best for everybody. (Participant 1) |
| Group PT was a satisfactory alternative to individual PT | I rather enjoy it. I'm looking forward to it today. I can't see much difference [between the group and individual PT]. Couldn't be better. (Participant 3) | |
| Exercise and physical benefits | Happy with the content | I didn't find any of the exercises beyond my limits. I didn't realize how weak I was. After exercising, I found the muscles in my neck were tightandgetting a bit sore initially, but the more I did, the lesser it gotwith the arthritis, it is good to get it moving. (Participant 12) |
| Described physical benefits | Whatever I'm doing is helping with my balance and helping with general muscle things. I'm getting a little bit bettermy balance has improved. (Participant 4) | |
| Camaraderie and support | Enjoyment of the social aspects of group PT, feeling like they're in it together | The group is nice because we smile at each other and we grimacewe feel the same thingsit hurts or I'm tired. We sometimes have a bit of a laugh and sometimes have a bit of a moan. I think you enjoy it more if you've got others doing the same thing as you. [We] egg everybody on to do their best. (Participant 4) |
| Celebration of others' successes | One of the other ladies went home and I was really pleased for her. She'd been here for quite some time and I wished her well. (Participant 4) | |
| I just clap like mad for somebody who has done a better job next time I see them. [It] shows that they're trying harder. (Participant 3) | ||
| Self‐satisfaction and self‐awareness | Feeling good about their performance | I can walk to the toilet and walk around the ward. A few of them just can't. It made me think about life and how fortunate I've been. When I look around, there's a lot more that's worse off than me. (Participant 2) |
| I feel lucky. I'm better than the other ones.My legs are very bad but there's one who can hardly lift her legs. I'm very lucky. (Participant 8) | ||
| Motivation and drive for improvement | Self‐determination plays an important role in recovery, with physical benefits as an extrinsic motivator | I try pretty much as hard as I canI do the best I can and that's about all I can do, really. (Participant 4) |
| Part of the reason I'm here is just to try and improve my balance so that I don't fall over. (Participant 7) | ||
| Competition as extrinsic motivation | It's a bit of a challenge. I've only done 8 and they've done 10. Incentiveit becomes a bit like competition. (Participant 1) | |
| I try and do better than what they're doing. (Participant 5). | ||
| It's good to be together to do it, I think it gives you an incentive to work at it, push yourself a little bit. Competitiveness comes out[you have] got to push yourself a bit harder. (Participant 12) | ||
| Qualities of the group instructor | Knowledge and attentiveness of the group instructor | She knows I've got a bad back and I've got a bad arm so she says, You don't do that one, Don't forget, you mustn't do it if it hurts. (Participant 3) |
Themes
Attendance and Satisfaction
Participants were happy to attend GPT. Participants saw it as an opportunity to get out of the room (participant 4) and they valued the socialization.
Participants found GPT to be a satisfactory alternative to individual sessions. Participants described no difference in the level or type of physiotherapy in group and individual settings; both were valued for exercise content.
Exercise and Physical Benefits
Participants were happy with the content of GPT. Despite being high intensity, exercises were reported to be appropriate.
Perceived physical benefits were described. Reduced pain and stiffness, and improved balance and strength were described with GPT, which contributed to satisfaction.
Qualities of the Group Instructor
Knowledge and Attentiveness of the Group Instructor
These supportive qualities were described as important factors by participants. Some participants acknowledged the number of other participants in GPT; however, they perceived that the instructor was monitoring each person individually, constantly, and equally. Participants reported that group instructors modified or ceased exercises where appropriate, engendering trust (participant 5) and perceived that GPT was individualized and not inferior to individual PT.
Social AspectsCamaraderie and Support
Enjoyment of the Social Aspects of GPT: Feeling Like They're in It Together
Participants reported enjoying the company and support of their peers. They described camaraderie and did not feel alone in their experiences. Exercising with peers encouraged them to push themselves more than during individual physiotherapy.
Celebration of Others' Successes
Some participants expressed awareness of their support to others; seeing others improve and return home gave them encouragement.
Self‐Satisfaction and Self‐Awareness
Feel Good About Their Mobility and Health in the Group Setting
Participants made downward comparisons with others less mobile, which resulted in a realization, gratitude, and acceptance of their own health and physical abilities/limitations.
Self‐Determination and Extrinsic Motivators
Self‐Determination Plays an Important Role in Recovery, With Physical Benefits as an Extrinsic Motivator
Participants described self‐determination to exercise, some without peer influence. Physical benefits of exercise were an extrinsic motivator; participants felt that they were doing as best they could to achieve their goals.
Competition as an Extrinsic Motivator
Upward social comparisons were made with peers who participants perceived were performing better than them, which increased motivation to work harder. Self‐determination and competition were not mutually exclusive.
DISCUSSION
Participants were positive about GPT and reported experiencing physical benefits. Motivation was reported as an important factor in recovery, with improving mobility and competition as commonly described extrinsic motivators. Social comparisons made between participants were motivating and reassuring.
Group physiotherapy sessions are often a replacement for individual physiotherapy; therefore, it is important that participants feel they are receiving a suitable alternative. Individual physiotherapy has advantages over GPT including affording a more individualized assessment and treatment; a combination of both may be appropriate for many older inpatients. Although there is conflicting evidence of the exercise preferences of community‐dwelling older adults,[1] the results of this study are consistent with evidence supporting exercising with peers.[3, 17]
Self‐determination theory describes motivation existing along a continuum, from intrinsic motivation to extrinsic motivation then amotivation.[18] Participants described valuing the physical benefits of exercise (extrinsic motivation), similarly noted by survivors of stroke.[19, 20] For those who do not value exercise, group instructors may consider discussing its benefits during GPT. Competition may be stimulated through exercising with peers; therefore, group instructors should utilize this advantage of GPT over individual physiotherapy.
Participants feeling socially supported in GPT were similar to those reported by hospitalized older adults[21] as well as those undertaking exercise groups for cardiac rehabilitation,[22] terminal cancer,[23] and following lung transplantation.[24] Fostering a supportive environment may enhance the patient experience; therefore, physiotherapists should encourage GPT attendance and socialization (as appropriate) and actively acknowledge physical improvements.
The Social Comparison Theory suggests that people evaluate their abilities by comparing themselves to their peers.[25, 26] Participants who made upward comparisons, with those who they perceived were better than them[26] resulted in motivation to attain the level of their more mobile peers. Downward comparisons were also made with those who they felt were less mobile; these engendered feelings of gratitude and appreciation for their own health and promoted self‐esteem,[26] and have also been reported in other populations including those with spinal cord injury[27] and breast cancer.[28]
Study Limitations
Interviews were not conducted with those who received individual physiotherapy alone, and therefore no comparisons can be drawn regarding their experiences and satisfaction. Those who participated in interviews had already consented to participating in GPT; those who declined GPT were not part of the trial and therefore responses may have some bias. To minimize this bias, the interview guide included questions into positive and negative aspects of group and individual physiotherapy. Although community‐dwelling older adults perceive boredom, intimidation, and potential for injury to be barriers to participation in exercise,[29] future research should investigate why older inpatients decline GPT and methods for improving participation.
CONCLUSION
This study provides new evidence to support GPT for hospitalized older adults. Participants in this study enjoyed GPT and were motivated and supported by their peers. As GPT was valued by hospitalized older adults who participated in this study for its physical and social benefits, clinicians could consider replacing several individual treatment sessions with GPT as part of a weekly treatment schedule.
Acknowledgements
The principle investigator thanks E. Harris, C. Chenneaux, A. Shapiro, D. Kronemberg, R. Roose and B. Doyle‐Jones for running the exercise groups, and also extends her thanks and gratitude to all of the patients interviewed for their time and honesty.
Disclosures: Melissa J. Raymond was supported by an Australian Postgraduate Award scholarship and a Caulfield Hospital Research Trust Projects Grant 2008/2009.
- , , , , , . Personal and environmental factors associated with physical inactivity among different racial‐ethnic groups of U.S. middle‐aged and older‐aged women. Health Psychol. 2000;19(4):354–364.
- , , , . Physical activity preferences of middle‐aged and older adults: a community analysis. J Aging Phys Act. 1999;7(4):386–399.
- , , , . Older adults' preferences for exercising alone versus in groups: considering contextual congruence. Ann Behav Med. 2007;33(2):200–206.
- , , , , . Group versus individual approach? A meta‐analysis of the effectiveness of interventions to promote physical activity. Sport Exerc Psychol Rev. 2006;2(1):19–35.
- , , , , , . A high‐intensity functional weight‐bearing exercise program for older people dependent in activities of daily living and living in residential care facilities: evaluation of the applicability with focus on cognitive function. Phys Ther. 2006;86(4):489–498.
- , , , , , . The value of individual or collective group exercise programs for knee or hip osteoarthritis. Clinical practice recommendations. Ann Readapt Med Phys. 2007;50(9):741–746, 734–740.
- , , , . Circuit class therapy versus individual physiotherapy sessions during inpatient stroke rehabilitation: a controlled trial. Arch Phys Med Rehabil. 2007;88(8):955–963.
- , , , . A descriptive analysis of physical therapy group intervention in five midwestern inpatient rehabilitation facilities. J Phys Ther Educ. 2000;14:13–20.
- , , , et al. Group treatments for sensitive health care problems: a randomised controlled trial of group versus individual physiotherapy sessions for female urinary incontinence. BMC Womens Health. 2009;9:26.
- . Service improvement and patient experience. Int Emerg Nurs. 2010;18(4):175–176.
- , , . “Mini‐mental state”. A practical method for grading the cognitive state of patients for the clinician. J Psychiatr Res. 1975;12:189–198.
- , . The Discovery of Grounded Theory: Strategies for Qualitative Research. Mill Valley, CA: Sociology Press; 1967.
- , . Using thematic analysis in psychology. Qual Res Psychol 2006;3(2):77–101.
- , . The NVivo Qualitative Project Book. London, United Kingdom: Sage; 2000.
- . A purposeful approach to the constant comparative method in the analysis of qualitative interviews. Qual Quant. 2002;36(4):391–409.
- , . Rigour and qualitative research. BMJ. 1995;311(6997):109–112.
- , , . How, where and with whom? Physical activity context preferences of three adult groups at risk of inactivity. Br J Sports Med. 2012;46(16):1125–1131.
- , , . Older adults' intrinsic and extrinsic motivation toward physical activity. Am J Health Behav. 2008;32(6):570–582.
- , , , . Qualitative analysis of stroke patients' motivation for rehabilitation. BMJ. 2000;321(7268):1051–1054.
- , , . Exercise perceptions among people with stroke: barriers and facilitators to participation. Int J Ther Rehabil. 2011;18(9):520–530.
- , , , . Interaction between clients and physiotherapists in group exercise classes in geriatric rehabilitation. Adv Physiother. 2009;11(3):145–153.
- , , , . Patients' experience of home and hospital based cardiac rehabilitation: a focus group study. Eur J Cardiovasc Nurs. 2009;8(1):9–17.
- , , , , . Exercise and relaxation intervention for patients with advanced lung cancer: a qualitative feasibility study. Scand J Med Sci Sports. 2012;22(6):804–815.
- , , , et al. Patients' expectations and experiences of rehabilitation following lung transplantation. Clin Transplant. 2014;28(2):252–258.
- . A theory of social comparison processes. Hum Relat. 1954;7(2):117–140.
- . Theory and research concerning social comparisons of personal attributes. Psychol Bull. 1989;106(2):231–248.
- , . Long‐term adjustment to physical disability: the role of social support, perceived control, and self‐blame. J Pers Soc Psychol. 1985;48:1162–1172.
- , , . It could be worse: selective evaluation as a response to victimization. J Soc Issues. 1983;39:19–40.
- , , , . Motivators, barriers, and beliefs regarding physical activity in an older adult population. J Geriatr Phys Ther. 2011;34(3):138–147.
PCT Value to Distinguish IPE From NIPE
Epidemiological studies estimate that 40% to 50% of patients with pneumonia develop a parapneumonic effusion (PPE), and up to 35% of these have empyema. Approximately 15% of patients require surgical drainage, which has a high mortality rate.[1] Although early intervention is important in patients with suspected PPE, diagnosing a PPE is challenging, as cultures and Gram stain are frequently negative.[1] Clinicians have to rely on tests, such as pleural fluid pH, lactate dehydrogenase (LDH), and glucose, which have low sensitivity and specificity in diagnosing a PPE.
Procalcitonin (PCT) is a distinct biomarker and mediator of sepsis, emanating from parenchymal cells ubiquitously (eg, lung, liver, kidney) due to reduced conversion to mature calcitonin.[2] Besides sepsis, PCT has been used as a biomarker of pneumonia based on its ability to differentiate bacterial versus viral infections.[3, 4, 5] PCT has been shown to be a biomarker in extravascular fluids such as saliva, wound effusions, and pleural fluid.[6, 7, 8, 9] In this study we investigate the diagnostic accuracy of pleural fluid PCT in distinguishing infectious and noninfectious etiologies of pleural effusion in veterans with lung infiltrates.
METHOD
The study protocol was approved by the institution review board at the Veterans Affairs Medical Center, Washington, DC. Patients were identified using a computerized patient record system after searching the procedure code for thoracentesis. A retrospective chart review was conducted on veterans who underwent a thoracentesis from February 2011 through January 2012.
Inclusion Criteria
The inclusion criteria comprised all adults who underwent a thoracentesis and had pleural fluid collected for LDH, total protein, albumin, cell count with differential, cytology, Gram stain, culture, pH, triglycerides, cholesterol, and PCT.
Exclusion Criteria
The exclusion criteria comprised all patients with a known etiology of pleural effusion or those without pleural PCT data.
Data Collection
Pleural fluid data collected included LDH, protein, albumin, cell count and differential, pH, Gram stain and culture, cytology, triglyceride, cholesterol, amylase, and PCT. Serum chemistry data collected included LDH, protein, albumin, prothrombin time, international normalized ratio, and blood culture. PCT was measured in a 200‐L pleural fluid sample using Kryptor technology (Thermo Fisher Scientific, Freemont, CA). The Kryptor assay is based on a monoclonal mouse anti‐catacalcin antibody conjugated with colloidal gold (tracer) and a polyclonal sheep anti‐calcitonin antibody (solid phase). It has a detection limit of 0.06 ng/mL (or 0.06 g/L).[2]
Classification of Groups
Pleural fluid was classified as a transudate or an exudate by Light's criteria.[10] An exudative effusion had a pleural fluid to serum ratio of LDH > 0.6, pleural fluid to serum protein ratio >0.5, or LDH great than the upper two‐thirds of the reference value or serum value.
Patient's clinical diagnosis for the cause of pleural effusion was documented from chart review. Effusions were classified as infectious pleural effusions (IPE) or noninfectious pleural effusions (NIPE).
An effusion was considered infectious if pleural fluid Gram stain or culture were positive for bacteria, if pus was present, or if the effusion was accompanied by a lung infiltrate in a patient with evidence at least 2 of the following: temperature >38C (100.4F) or 36C (96.8F), heart rate >90 beats per minute, respiratory rate >20 breaths per minute or arterial carbon dioxide tension (PaCO2) of 32 mm Hg, and white blood cell count >12,000/L or 4000/L or >10% immature (band) forms.
An effusion not meeting the above criteria was classified as a NIPE. A malignant effusion was diagnosed by the presence of cancer cells on cytology. Paramalignant effusion was an effusion that was devoid of cancer cells on cytology and/or histology, in a patient with a malignancy.
Data Analysis
Statistical computations were performed using Graph Pad Instat version 3 and version 5 statistical software (Graph Pad Software, Inc. La Jolla, CA). Median PCT with standard deviation (SD) was calculated for IPE and NIPE. A 95% confidence interval (CI) for the median PCT was calculated for each group. A comparison of the median PCT between the IPE and NIPE was performed by calculating the SD difference and standard error difference. A 95% CI of the difference in medians was calculated. A P value was calculated using Mann‐Whitney U Test, and a P value of 0.05 was considered significant. The diagnostic performance of different cutoff values of PCT was evaluated using the area under the receiver operating characteristic curve (mean, 95% CI).
RESULTS
A total of 75 patients were included in the study. There were 73 (97.4%) males, with mean age of 70.8 years (range, 4293 years). There were 18 patients with IPE and 57 with NIPE.
Patient characteristics are detailed in Table 1. In the infectious group, 2 patients had empyema. There were no cases of tuberculosis. Of the 57 effusions in the noninfectious group there were 42 exudative effusions, 23 of which were malignant, 3 each were due to a trapped lung and pulmonary embolism. The remaining NIPEs were due to nonpulmonary processes such as chylothorax, liver disease, and renal disease.
| Infectious, n = 18 | Noninfectious, n = 57 | P Value | |
|---|---|---|---|
| |||
| Mean age, y | 73.1 | 70.1 | 0.349 |
| Male | 18 (100%) | 55 (96.6%) | 0.428 |
| Exudative effusion | 13 (72.2%) | 43 (74.1%) | 0.873 |
| Right side | 7 (38.9%) | 32 (55.2%) | 0.2268 |
| Effusion less than one‐third hemithorax | 11 (61.1%) | 28 (48.3%) | 0.3425 |
| Effusion one‐third to two‐thirds hemithorax | 6 (33.3%) | 20 (34.5%) | 0.9253 |
| Effusion greater then two‐thirds hemithorax | 1 (5.6%) | 9 (15.5%) | 0.2777 |
| Median PCT, ng/mL | 1.088 (0.3122.940) | 0.123 (0.050.263) | 0.0001* |
| Median LDH, IU/L | 178.5 (105.5346.25) | 135.5 (94255.2) | 0.629 |
| Median protein, mg/dL | 3.1 (2.33.2) | 3.7 (2.384.48) | 0.046* |
| Median pH | 7.37 (7.317.44) | 7.40 (7.367.44) | 0.111 |
| Median glucose, mg/dL | 126 (97169) | 106 (92135) | 0.226 |
| Median pleural WBC, cells/L | 778 (3237038) | 498 (2001380) | 0.154 |
| Median pleural neutrophils, cells/L | 542 (544743) | 54 (18192) | 0.005* |
The pleural fluid characteristics and biomarkers are detailed in Table 1. Median pleural fluid PCT in IPE was 1.088 ng/mL (0.3122.940 ng/mL) and 0.123 ng/mL (0.050.263 ng/mL) in NIPE, with a P value 0.0001. Pleural fluid PCT >0.25 ng/mL had a sensitivity of 77.78% and specificity of 74.14% for diagnosing an IPE (Figure 1).

A subgroup analysis comparing 13 exudative effusions in the infectious group with the 23 exudative malignant and paramalignant effusions in the noninfectious group was also performed. The median pleural PCT value in the infectious group was 0.9743 ng/mL (0.454.117 ng/mL) and 0.1222 ng/mL (0.054650.1972 ng/mL) in the noninfectious group, with a P value 0.0009
DISCUSSION
Clinicians frequently face the dilemma of differentiating IPE from NIPE. In this study, pleural fluid PCT was significantly elevated in IPE. A pleural fluid PCT >0.25 ng/mL had a sensitivity of 77.78% and specificity of 74.14% for diagnosing an IPE (Figure 1). Our subgroup analysis also showed a higher PCT in exudative effusions of the infectious group as compared to exudative effusions of malignant/paramalignant etiology in the noninfectious group. PCT may have a role as a biomarker in diagnosing an infected malignant/paramalignant effusion. Further studies are needed to confirm the same.
Our study is one of the few using the more sensitive technology (eg, Kryptor) to measure PCT levels in pleural fluid, utilizing the current method of choice for serum PCT based on assay performance.[2] PCT is produced during bacterial infections by several tissues sources, and its role in differentiating IPE and NIPE has been investigated by several authors. A prior study reported on 233 patients, 28 of whom had PPEs, 49 had tubercular effusion, and 166 had NIPE.[1] The cutoff point in this study of PCT was >0.145 ng/mL, with a sensitivity of 51.6% and specificity of 66.5%.[1] Another study evaluated 82 patients with pleural effusions, 45 of whom were infectious (bacterial, nontubercular) and used a PCT cutoff value of 0.18 ng/mL to discriminate between IPE and NIPE. They reported a sensitivity of 66.7% and specificity of 77.4%. There was no significant difference in the serum and pleural fluid PCT values within IPE and NIPE subgroups. In fact, there was a significant positive correlation between serum and pleural fluid PCT. However, on comparing evolution of pleural and serum PCT between day 1 and day 3, the authors noted that unlike pleural fluid PCT, serum PCT values were lower on day 3 as compared to day 1.[8] A study on 12 forensic autopsy cases, to establish the usefulness of pericardial and pleural fluids for the postmortem diagnosis of sepsis, also reported significantly higher and similar PCT levels in the sepsis group in both serum and pleural fluid (using an immunoassay by Roche Diagnostic, Mannheim, Germany). The authors suggested that pleural fluid PCT can be used in lieu of serum PCT values to determine the etiology of an effusion.[11]
PCT has a role in the decision to initiate or discontinue antibiotics in the management of community‐acquired pneumonia.[12] In this era of multidrug resistance, appropriate use of antibiotics is of paramount importance, and PCT could play an important role in this regard. The gold standard test to diagnose an infectious pleural effusion is present in a small percentage of patients.[13] Larger randomized studies designed to evaluate the role of serial serum and pleural fluid PCT, with appropriate cutoff values, are needed to define the role of PCT in guiding antibiotic therapy.[14]
The limitations of this study include its retrospective nature and lack of serum PCT data. The gold standard methods to diagnose pleural effusion were not available in this study.
CONCLUSION
PCT is a novel biomarker for diagnosing infectious pleural effusion, and it would be worthwhile to investigate the role of pleural PCT in assessing severity of illness, risk stratification, and antibiotic stewardship in hospitalized patients with pleural effusions.
Disclosure: Nothing to report.
- , , , et al. Procalcitonin, C‐reactive protein, and cell counts in the diagnosis of parapneumonic pleural effusions. J Investig Med. 2010;58:971–976.
- , , . Procalcitonin assay in systemic inflammation, infection, and sepsis: clinical utility and limitations. Crit Care Med. 2008;36:941–952.
- , , , , . Pneumonitis‐associated hyperprocalcitoninemia. Am J Med Sci. 1996;312:12–18.
- , , , et al. Bacterial complications of respiratory tract viral illness: a comprehensive evaluation. J Infect Dis. 2013;208:432–441.
- , , , et al. Procalcitonin guidance of antibiotic therapy in community‐acquired pneumonia: a randomized trial. Am J Respir Crit Care Med. 2006;174:84–93.
- , , , et al. Correlation of procalcitonin and cytokine expression with dehiscence of wartime extremity wounds. J Bone Joint Surg Am. 2008;90:580–588.
- , , , , . Salivary procalcitonin and periodontitis in diabetes. J Dent Res. 2008;87:630–634.
- , , , , . Diagnostic and prognostic values of pleural fluid procalcitonin in parapneumonic pleural effusions. Chest. 2009;136:205–211.
- , , , , , . Serum and pleural fluid procalcitonin in predicting bacterial infection in patients with parapneumonic effusion. J Korean Med Sci. 2009;24:398–402.
- , . Textbook of Pleural Diseases. 2nd ed. London, United Kingdom: Arnold Press; 2008.
- , . Usefulness of pericardial and pleural fluids for the postmortem diagnosis of sepsis. J Forensic Leg Med. 2014;28:15–18.
- , , , et al. Procalcitonin to initiate or discontinue antibiotics in acute respiratory tract infections. Evid Based Child Health. 2013;8:1297–1371.
- , , , , , . Routine use of pleural fluid cultures. Are they indicated? Limited yield, minimal impact on treatment decisions. Respir Med. 2006;100:2048–2052.
- , , , et al. Effect of procalcitonin‐guided treatment on antibiotic use and outcome in lower respiratory tract infections: cluster‐randomised, single‐blinded intervention trial. Lancet. 2004;363:600–607.
Epidemiological studies estimate that 40% to 50% of patients with pneumonia develop a parapneumonic effusion (PPE), and up to 35% of these have empyema. Approximately 15% of patients require surgical drainage, which has a high mortality rate.[1] Although early intervention is important in patients with suspected PPE, diagnosing a PPE is challenging, as cultures and Gram stain are frequently negative.[1] Clinicians have to rely on tests, such as pleural fluid pH, lactate dehydrogenase (LDH), and glucose, which have low sensitivity and specificity in diagnosing a PPE.
Procalcitonin (PCT) is a distinct biomarker and mediator of sepsis, emanating from parenchymal cells ubiquitously (eg, lung, liver, kidney) due to reduced conversion to mature calcitonin.[2] Besides sepsis, PCT has been used as a biomarker of pneumonia based on its ability to differentiate bacterial versus viral infections.[3, 4, 5] PCT has been shown to be a biomarker in extravascular fluids such as saliva, wound effusions, and pleural fluid.[6, 7, 8, 9] In this study we investigate the diagnostic accuracy of pleural fluid PCT in distinguishing infectious and noninfectious etiologies of pleural effusion in veterans with lung infiltrates.
METHOD
The study protocol was approved by the institution review board at the Veterans Affairs Medical Center, Washington, DC. Patients were identified using a computerized patient record system after searching the procedure code for thoracentesis. A retrospective chart review was conducted on veterans who underwent a thoracentesis from February 2011 through January 2012.
Inclusion Criteria
The inclusion criteria comprised all adults who underwent a thoracentesis and had pleural fluid collected for LDH, total protein, albumin, cell count with differential, cytology, Gram stain, culture, pH, triglycerides, cholesterol, and PCT.
Exclusion Criteria
The exclusion criteria comprised all patients with a known etiology of pleural effusion or those without pleural PCT data.
Data Collection
Pleural fluid data collected included LDH, protein, albumin, cell count and differential, pH, Gram stain and culture, cytology, triglyceride, cholesterol, amylase, and PCT. Serum chemistry data collected included LDH, protein, albumin, prothrombin time, international normalized ratio, and blood culture. PCT was measured in a 200‐L pleural fluid sample using Kryptor technology (Thermo Fisher Scientific, Freemont, CA). The Kryptor assay is based on a monoclonal mouse anti‐catacalcin antibody conjugated with colloidal gold (tracer) and a polyclonal sheep anti‐calcitonin antibody (solid phase). It has a detection limit of 0.06 ng/mL (or 0.06 g/L).[2]
Classification of Groups
Pleural fluid was classified as a transudate or an exudate by Light's criteria.[10] An exudative effusion had a pleural fluid to serum ratio of LDH > 0.6, pleural fluid to serum protein ratio >0.5, or LDH great than the upper two‐thirds of the reference value or serum value.
Patient's clinical diagnosis for the cause of pleural effusion was documented from chart review. Effusions were classified as infectious pleural effusions (IPE) or noninfectious pleural effusions (NIPE).
An effusion was considered infectious if pleural fluid Gram stain or culture were positive for bacteria, if pus was present, or if the effusion was accompanied by a lung infiltrate in a patient with evidence at least 2 of the following: temperature >38C (100.4F) or 36C (96.8F), heart rate >90 beats per minute, respiratory rate >20 breaths per minute or arterial carbon dioxide tension (PaCO2) of 32 mm Hg, and white blood cell count >12,000/L or 4000/L or >10% immature (band) forms.
An effusion not meeting the above criteria was classified as a NIPE. A malignant effusion was diagnosed by the presence of cancer cells on cytology. Paramalignant effusion was an effusion that was devoid of cancer cells on cytology and/or histology, in a patient with a malignancy.
Data Analysis
Statistical computations were performed using Graph Pad Instat version 3 and version 5 statistical software (Graph Pad Software, Inc. La Jolla, CA). Median PCT with standard deviation (SD) was calculated for IPE and NIPE. A 95% confidence interval (CI) for the median PCT was calculated for each group. A comparison of the median PCT between the IPE and NIPE was performed by calculating the SD difference and standard error difference. A 95% CI of the difference in medians was calculated. A P value was calculated using Mann‐Whitney U Test, and a P value of 0.05 was considered significant. The diagnostic performance of different cutoff values of PCT was evaluated using the area under the receiver operating characteristic curve (mean, 95% CI).
RESULTS
A total of 75 patients were included in the study. There were 73 (97.4%) males, with mean age of 70.8 years (range, 4293 years). There were 18 patients with IPE and 57 with NIPE.
Patient characteristics are detailed in Table 1. In the infectious group, 2 patients had empyema. There were no cases of tuberculosis. Of the 57 effusions in the noninfectious group there were 42 exudative effusions, 23 of which were malignant, 3 each were due to a trapped lung and pulmonary embolism. The remaining NIPEs were due to nonpulmonary processes such as chylothorax, liver disease, and renal disease.
| Infectious, n = 18 | Noninfectious, n = 57 | P Value | |
|---|---|---|---|
| |||
| Mean age, y | 73.1 | 70.1 | 0.349 |
| Male | 18 (100%) | 55 (96.6%) | 0.428 |
| Exudative effusion | 13 (72.2%) | 43 (74.1%) | 0.873 |
| Right side | 7 (38.9%) | 32 (55.2%) | 0.2268 |
| Effusion less than one‐third hemithorax | 11 (61.1%) | 28 (48.3%) | 0.3425 |
| Effusion one‐third to two‐thirds hemithorax | 6 (33.3%) | 20 (34.5%) | 0.9253 |
| Effusion greater then two‐thirds hemithorax | 1 (5.6%) | 9 (15.5%) | 0.2777 |
| Median PCT, ng/mL | 1.088 (0.3122.940) | 0.123 (0.050.263) | 0.0001* |
| Median LDH, IU/L | 178.5 (105.5346.25) | 135.5 (94255.2) | 0.629 |
| Median protein, mg/dL | 3.1 (2.33.2) | 3.7 (2.384.48) | 0.046* |
| Median pH | 7.37 (7.317.44) | 7.40 (7.367.44) | 0.111 |
| Median glucose, mg/dL | 126 (97169) | 106 (92135) | 0.226 |
| Median pleural WBC, cells/L | 778 (3237038) | 498 (2001380) | 0.154 |
| Median pleural neutrophils, cells/L | 542 (544743) | 54 (18192) | 0.005* |
The pleural fluid characteristics and biomarkers are detailed in Table 1. Median pleural fluid PCT in IPE was 1.088 ng/mL (0.3122.940 ng/mL) and 0.123 ng/mL (0.050.263 ng/mL) in NIPE, with a P value 0.0001. Pleural fluid PCT >0.25 ng/mL had a sensitivity of 77.78% and specificity of 74.14% for diagnosing an IPE (Figure 1).
A subgroup analysis comparing 13 exudative effusions in the infectious group with the 23 exudative malignant and paramalignant effusions in the noninfectious group was also performed. The median pleural PCT value in the infectious group was 0.9743 ng/mL (0.454.117 ng/mL) and 0.1222 ng/mL (0.054650.1972 ng/mL) in the noninfectious group, with a P value 0.0009
DISCUSSION
Clinicians frequently face the dilemma of differentiating IPE from NIPE. In this study, pleural fluid PCT was significantly elevated in IPE. A pleural fluid PCT >0.25 ng/mL had a sensitivity of 77.78% and specificity of 74.14% for diagnosing an IPE (Figure 1). Our subgroup analysis also showed a higher PCT in exudative effusions of the infectious group as compared to exudative effusions of malignant/paramalignant etiology in the noninfectious group. PCT may have a role as a biomarker in diagnosing an infected malignant/paramalignant effusion. Further studies are needed to confirm the same.
Our study is one of the few using the more sensitive technology (eg, Kryptor) to measure PCT levels in pleural fluid, utilizing the current method of choice for serum PCT based on assay performance.[2] PCT is produced during bacterial infections by several tissues sources, and its role in differentiating IPE and NIPE has been investigated by several authors. A prior study reported on 233 patients, 28 of whom had PPEs, 49 had tubercular effusion, and 166 had NIPE.[1] The cutoff point in this study of PCT was >0.145 ng/mL, with a sensitivity of 51.6% and specificity of 66.5%.[1] Another study evaluated 82 patients with pleural effusions, 45 of whom were infectious (bacterial, nontubercular) and used a PCT cutoff value of 0.18 ng/mL to discriminate between IPE and NIPE. They reported a sensitivity of 66.7% and specificity of 77.4%. There was no significant difference in the serum and pleural fluid PCT values within IPE and NIPE subgroups. In fact, there was a significant positive correlation between serum and pleural fluid PCT. However, on comparing evolution of pleural and serum PCT between day 1 and day 3, the authors noted that unlike pleural fluid PCT, serum PCT values were lower on day 3 as compared to day 1.[8] A study on 12 forensic autopsy cases, to establish the usefulness of pericardial and pleural fluids for the postmortem diagnosis of sepsis, also reported significantly higher and similar PCT levels in the sepsis group in both serum and pleural fluid (using an immunoassay by Roche Diagnostic, Mannheim, Germany). The authors suggested that pleural fluid PCT can be used in lieu of serum PCT values to determine the etiology of an effusion.[11]
PCT has a role in the decision to initiate or discontinue antibiotics in the management of community‐acquired pneumonia.[12] In this era of multidrug resistance, appropriate use of antibiotics is of paramount importance, and PCT could play an important role in this regard. The gold standard test to diagnose an infectious pleural effusion is present in a small percentage of patients.[13] Larger randomized studies designed to evaluate the role of serial serum and pleural fluid PCT, with appropriate cutoff values, are needed to define the role of PCT in guiding antibiotic therapy.[14]
The limitations of this study include its retrospective nature and lack of serum PCT data. The gold standard methods to diagnose pleural effusion were not available in this study.
CONCLUSION
PCT is a novel biomarker for diagnosing infectious pleural effusion, and it would be worthwhile to investigate the role of pleural PCT in assessing severity of illness, risk stratification, and antibiotic stewardship in hospitalized patients with pleural effusions.
Disclosure: Nothing to report.
- , , , et al. Procalcitonin, C‐reactive protein, and cell counts in the diagnosis of parapneumonic pleural effusions. J Investig Med. 2010;58:971–976.
- , , . Procalcitonin assay in systemic inflammation, infection, and sepsis: clinical utility and limitations. Crit Care Med. 2008;36:941–952.
- , , , , . Pneumonitis‐associated hyperprocalcitoninemia. Am J Med Sci. 1996;312:12–18.
- , , , et al. Bacterial complications of respiratory tract viral illness: a comprehensive evaluation. J Infect Dis. 2013;208:432–441.
- , , , et al. Procalcitonin guidance of antibiotic therapy in community‐acquired pneumonia: a randomized trial. Am J Respir Crit Care Med. 2006;174:84–93.
- , , , et al. Correlation of procalcitonin and cytokine expression with dehiscence of wartime extremity wounds. J Bone Joint Surg Am. 2008;90:580–588.
- , , , , . Salivary procalcitonin and periodontitis in diabetes. J Dent Res. 2008;87:630–634.
- , , , , . Diagnostic and prognostic values of pleural fluid procalcitonin in parapneumonic pleural effusions. Chest. 2009;136:205–211.
- , , , , , . Serum and pleural fluid procalcitonin in predicting bacterial infection in patients with parapneumonic effusion. J Korean Med Sci. 2009;24:398–402.
- , . Textbook of Pleural Diseases. 2nd ed. London, United Kingdom: Arnold Press; 2008.
- , . Usefulness of pericardial and pleural fluids for the postmortem diagnosis of sepsis. J Forensic Leg Med. 2014;28:15–18.
- , , , et al. Procalcitonin to initiate or discontinue antibiotics in acute respiratory tract infections. Evid Based Child Health. 2013;8:1297–1371.
- , , , , , . Routine use of pleural fluid cultures. Are they indicated? Limited yield, minimal impact on treatment decisions. Respir Med. 2006;100:2048–2052.
- , , , et al. Effect of procalcitonin‐guided treatment on antibiotic use and outcome in lower respiratory tract infections: cluster‐randomised, single‐blinded intervention trial. Lancet. 2004;363:600–607.
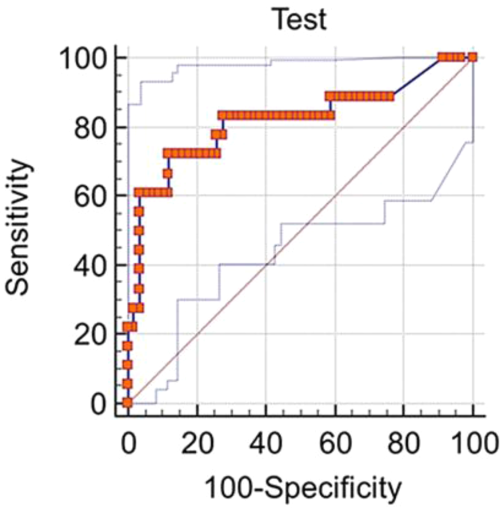
Poor Hospital Mobility
Low mobility is common in hospitalized older patients, and an independent predictor of poor functional outcomes.[1, 2, 3, 4] Few studies have included younger patients, but care models that support early mobility may reduce functional decline, enhance recovery, and reduce length of stay in older and mixed‐age populations.[5, 6] Barriers to mobility are complex and include patient symptoms and tethers, health provider behavior, team communication, and leadership, device availability, and environmental factors.[7, 8, 9, 10, 11] These contextual factors may differ even within a hospital between patient groups and ward settings. Simple measures to quantify mobility patterns would help address these barriers by providing opportunities for audit and feedback. Although accelerometry is the gold standard method for research, it requires equipment, analysis skills, and patient consent, which limits application in clinical practice. Behavioral mapping is a systematic method of observation developed in stroke patients, which is simple, objective, and requires no direct patient or staff participation,[12] and physical activity levels estimated from behavioral mapping are similar to those identified by accelerometry.[3, 13, 14] In the context of a phased quality‐improvement project aiming to reduce functional decline,[15] we undertook a cross‐sectional audit of mobility on 3 different wards using behavioral mapping, and examined differences among wards and between older (aged 65 years or more) and younger patients.
METHODS
This prospective observational study used cross‐sectional sampling from a 26‐bed general medical ward, a 30‐bed oncology ward, and a 24‐bed vascular surgical ward in a 900‐bed tertiary teaching hospital in Brisbane, Australia. Sampling was undertaken during 4 observation periods (2 mornings [10001400] and 2 afternoons [1400‐1800]) within 10 days in May 2013. All patients on each ward for each period were observed unless they were receiving end‐of‐life care. Structured observations were undertaken using behavioral mapping protocols similar to those previously described in stroke and general medical patients,[12, 13] with each patient room visited in the same sequence. Participants in each room were observed for a 2‐minute period (up to 4 participants could be observed concurrently in shared rooms) before moving to the next room, and the sequence was repeated in the same order for the whole 4‐hour period, with a single 15‐minute break. Depending on ward size and layout, this provided 12 to 17 observations per participant for each 4‐hour period (each individual observed every 1218 minutes). Observations were undertaken by 4 trained physiotherapy student observers using a predetermined set of mutually exclusive levels (lying in bed, sitting in or on the bed, sitting on a chair, standing, actively wheeling, or walking). The study was approved by the Royal Brisbane and Women's Hospital Human Research Ethics Committee as part of a quality‐improvement activity, and individual consent was not required. No clinical data except age and gender were collected for participants. The nurse unit manager for each ward was introduced to the observers and aware that observations were being conducted.
Patients who were observed for less than one‐half of an observation period were excluded so that all participants contributed at least 2 hours of observational data, up to a maximum of 16 hours. The number of valid observations for each participant (excluding time off ward or behind curtains if the level was not apparent) was calculated and used to derive the proportion of valid observations spent at each level for each participant. The proportion of observations at each level was summarized across all participants using frequency distributions and summary statistics. For ease of presentation, mean percentage of observed time in each activity was presented. However, as data were not normally distributed, statistical comparisons were undertaken using the Kruskal‐Wallis test, comparing the distribution of time spent upright (standing, walking, or actively wheeling) between groups (age group and ward). Interaction between age and ward effects was sought using generalized linear modeling.
RESULTS
Valid observations (at least 2 hours in 1 or more observation period) were available for 132 patients (48 medical, 50 oncology, and 34 surgery). Of these, 67 (51 %) were aged 65 years (54% medical, 44% oncology, 56% surgery) and 62 (47%) were male. There were a total of 3891 observations of location (median, 30 per patient; range, 965). Participants were observed in the bedded area 85.1% of observations, with 3.1% in the bathroom, 3.2% in the hallway or patient lounge, and 8.6% off ward. Allowing for time off ward and behind curtains, when observers could not be sure of their activity level, 3272 valid observations were available for physical activity.
More than half of the observed time (mean 57.4%) was spent lying in bed, 33.6% sitting on the bed or chair, and 9.0% standing, walking, or wheeling. Across all observation periods, 39/132 (29.5%) participants were never observed to be standing, walking or wheeling, and 7.6% were in bed at all observations. Comparing older and younger patients (Table 1), there was no difference in the time spent in active upright postures (median, 6.1% in older vs 7.4% in younger; P = 0.30). Table 2 summarizes descriptive data for the different wards. In the medical and surgical wards, 84% of the time was spend in or on the bed, and only 16% of the time was spent sitting in a chair or in active upright postures. Surgical patients, in particular, spent two‐thirds of observation time lying flat in bed, whereas medical patients spent more time sitting up on the bed. On statistical testing, time spent standing/walking/wheeling was significantly lower on the surgical ward (median, 4%; interquartile range [IQR], 010 for surgery; median, 7%; IQR, 013 for medical; and median, 10%; IQR 317 for oncology; P = 0.015). This was also reflected in a higher proportion of surgical patients never seen in an active upright position (44.1% compared to 27.1% medical and 22.0% oncology). Multivariate modeling showed no significant interaction between age and ward.
| All Ages, n = 132, Median Observations 29.5, Range 665* | Aged 65 Years, n = 61, Median Observations 30, Range 665 | Aged 65 Years, n = 67, Median Observations 27, Range 665 | |
|---|---|---|---|
| |||
| Location | |||
| Bedroom | 85.1 (13.3) | 84.6 (13.4) | 85.5 (12.9) |
| Bathroom | 3.0 (4.0) | 2.6 (3.9) | 3.4 (4.1) |
| Hall | 2.9 (4.6) | 3.4 (5.4) | 2.7 (4.0) |
| Lounge | 0.3 (1.9) | 0 | 0.6 (2.7) |
| Off ward/other | 8.6 (11.6) | 9.3 (11.4) | 7.8 (11.1) |
| Physical activity | |||
| Lie in bed | 57.4 (30.0) | 59.4 (29.4) | 55.5 (31.6) |
| Sit on bed | 21.0 (23.2) | 16.9 (19.9) | 24.7 (25.7) |
| Sit on chair | 12.6 (22.9) | 14.0 (25.6) | 11.9 (20.9) |
| Stand/walk/wheel | 9.0 (9.3) | 9.6 (9.6) | 8.0 (8.5) |
| Medical, n = 48, Median Observations 30, Range 759 | Oncology, n = 50, Median Observations 25, Range 652 | Surgical, n = 34, Median Observations 31, Range 1765 | |
|---|---|---|---|
| Location | |||
| Bedroom | 89.1 (11.4) | 81.3 (13.6) | 85.3 (14.1) |
| Bathroom | 2.8 (4.1) | 3.1 (3.8) | 3.1 (4.2) |
| Hall | 1.5 (2.5) | 5.3 (6.1) | 1.5 (2.7) |
| Lounge | 0.5 (2.0) | 0.4 (2.5) | 0 |
| Off ward/other | 6.2 (10.2) | 10.0 (11.9) | 10.1 (12.6) |
| Physical activity | |||
| Lie in bed | 53.3 (31.4) | 56.1 (30.2) | 65.1 (27.0) |
| Sit on bed | 30.3 (29.5) | 13.4 (16.1) | 19.0 (17.0) |
| Sit on chair | 8.2 (14.7) | 19.1 (29.1) | 9.3 (20.4) |
| Stand/walk/wheel | 8.2 (8.4) | 11.4 (9.7) | 6.5 (9.4) |
DISCUSSION
This observational cross‐sectional study extends previous observations of hospital inpatients to include a wider variety of patient types and ages. Observing 132 patients on medical, surgical, and oncology wards for up to 16 hours of weekday time, we found that patients spent only 9% in active upright postures, with significantly lower mobility on the surgical ward but no significant differences between older and younger patients.
Previous studies in older general medical patients using behavioral mapping[13] or accelerometers[2, 3] have shown 71% to 83% of time spent in bed, and 4% spent standing or walking, similar to our findings, although methodological differences between studies (eg, patient selection and time windows) caution against direct comparison. We identified different levels of physical activity on the surgical, medical, and oncology wards. This may reflect differences in patient case‐mix, ward environment, and/or ward culture. The medical and oncology wards each have a patient lounge, providing a potential walking destination, although only a small amount of patients' time was observed in these areas, suggesting that they may not fulfil their purpose. The oncology ward has a well developed wellness focus. The oncology and medical wards were actively involved in a quality‐improvement intervention to improve early patient mobility at the time of the audit,[15] whereas the surgical ward was at the precommencement (information gathering) stage. The data collected within this audit have formed part of the feedback cycle for staff involved in the improvement intervention. Repeat measurement will be undertaken on the surgical ward to help evaluate the impact of the intervention, and serial measurement will be undertaken in future participating wards to investigate the responsiveness of this measurement method.
Although the literature has focused on poor mobility in hospitalized elders, we did not find any better mobility in younger patients, suggesting that barriers to mobility are not confined to the elderly. Whereas individualized mobility assessment and support may be more important in the elderly,[16] addressing cultural and environmental issues such as promoting accountability for early ambulation, providing patients and families with permission and encouragement to ambulate, and ensuring accessible walking destinations may benefit patients of all ages.
Behavioral mapping has strengths and weaknesses compared to other methods such as accelerometry or patient/nurse report. Observations are conducted by an independent observer not involved in care and include all ward inpatients, providing a generalizable sample, as the observation protocol does not pose a participation burden for patient or ward staff. However, the cross‐sectional nature may oversample longer‐stay patients, the intermittent observation protocol tends to overestimate time spent upright,[14] the labor‐intensive nature of observations means choosing a limited time window (in our case 10001800), and the minimum time and observation frequency to generate reliable data remain uncertain. Further studies examining reliability, validity, and responsiveness would support the utility of this method for quality improvement.
In summary, this study shows that mobility is limited in older and younger adult inpatients across a range of inpatient wards, and that physical activity practices vary among wards. Interventions to enhance hospital mobility should include patients of all ages, and need to be tailored to local mobility practices, barriers, and enablers.
Acknowledgements
The authors thank the staff of wards 6AS, 9BN, and 7BW for participating in this project.
Disclosure: Nothing to report.
- , , . Prevalence and outcomes of low mobility in hospitalized older patients. J Am Geriatr Soc. 2004;52(8):1263–1270.
- , , , . The underrecognized epidemic of low mobility during hospitalization of older adults. J Am Geriatr Soc. 2009;57:1660–1665.
- , , , et al. Twenty‐four‐hour mobility during acute hospitalization in older medical patients. J Gerontol A Biol Sci Med Sci. 2013;68(3):331–337.
- , , , , , . Low mobility during hospitalization and functional decline in older adults. J Am Geriatr Soc. 2011;59(2):266–273.
- , , . Exercising body and mind: an integrated approach to functional independence. J Am Geriatr Soc. 2008;56:630–635.
- , , , , . Early mobilization of patients hospitalized with community‐acquired pneumonia. Chest. 2003;124(124):883–889.
- , , . Nursing staff perceptions of physical function in hospitalized older adults. App Nurs Res. 2011;24:215–222.
- , , , , . Barriers to mobility during hospitalization from the perspectives of older patients and their nurses and physicians. J Hosp Med. 2007;2:305–313.
- , . How nurses decide to ambulate hospitalized older adults: development of a conceptual model. Gerontologist. 2011;51(6):786–797.
- , , , . Barriers to early mobility of hospitalized general medicine patients. Survey development and validation. Am J Phys Med Rehabil. 2015;94:304–312.
- , . Attitudes and expectations regarding exercise in the hospital of hospitalized older adults: a qualitative study. J Am Geriatr Soc. 2012;60:713–718.
- , , , . Inactive and alone. Physical activity within the first 14 days of acute stroke unit care. Stroke. 2004;35:1005–1009.
- , , . Activity level of hospital medical inpatients: an observational study. Arch Gerontol Geriatr. 2012;55:417–421.
- , , , . Measuring activity levels at an acute stroke ward: comparing observations to a device. Biomed Res Int. 2013;2013:460482.
- , , . Eat walk engage: an interdisciplinary collaborative model to improve care of hospitalized elders. Am J Med Qual. 2015;30(1):5–13.
- , , . Hospitalization‐associated disability. “She was probably able to ambulate, but I'm not sure”. JAMA. 2011;306(16):1782–1793.
Low mobility is common in hospitalized older patients, and an independent predictor of poor functional outcomes.[1, 2, 3, 4] Few studies have included younger patients, but care models that support early mobility may reduce functional decline, enhance recovery, and reduce length of stay in older and mixed‐age populations.[5, 6] Barriers to mobility are complex and include patient symptoms and tethers, health provider behavior, team communication, and leadership, device availability, and environmental factors.[7, 8, 9, 10, 11] These contextual factors may differ even within a hospital between patient groups and ward settings. Simple measures to quantify mobility patterns would help address these barriers by providing opportunities for audit and feedback. Although accelerometry is the gold standard method for research, it requires equipment, analysis skills, and patient consent, which limits application in clinical practice. Behavioral mapping is a systematic method of observation developed in stroke patients, which is simple, objective, and requires no direct patient or staff participation,[12] and physical activity levels estimated from behavioral mapping are similar to those identified by accelerometry.[3, 13, 14] In the context of a phased quality‐improvement project aiming to reduce functional decline,[15] we undertook a cross‐sectional audit of mobility on 3 different wards using behavioral mapping, and examined differences among wards and between older (aged 65 years or more) and younger patients.
METHODS
This prospective observational study used cross‐sectional sampling from a 26‐bed general medical ward, a 30‐bed oncology ward, and a 24‐bed vascular surgical ward in a 900‐bed tertiary teaching hospital in Brisbane, Australia. Sampling was undertaken during 4 observation periods (2 mornings [10001400] and 2 afternoons [1400‐1800]) within 10 days in May 2013. All patients on each ward for each period were observed unless they were receiving end‐of‐life care. Structured observations were undertaken using behavioral mapping protocols similar to those previously described in stroke and general medical patients,[12, 13] with each patient room visited in the same sequence. Participants in each room were observed for a 2‐minute period (up to 4 participants could be observed concurrently in shared rooms) before moving to the next room, and the sequence was repeated in the same order for the whole 4‐hour period, with a single 15‐minute break. Depending on ward size and layout, this provided 12 to 17 observations per participant for each 4‐hour period (each individual observed every 1218 minutes). Observations were undertaken by 4 trained physiotherapy student observers using a predetermined set of mutually exclusive levels (lying in bed, sitting in or on the bed, sitting on a chair, standing, actively wheeling, or walking). The study was approved by the Royal Brisbane and Women's Hospital Human Research Ethics Committee as part of a quality‐improvement activity, and individual consent was not required. No clinical data except age and gender were collected for participants. The nurse unit manager for each ward was introduced to the observers and aware that observations were being conducted.
Patients who were observed for less than one‐half of an observation period were excluded so that all participants contributed at least 2 hours of observational data, up to a maximum of 16 hours. The number of valid observations for each participant (excluding time off ward or behind curtains if the level was not apparent) was calculated and used to derive the proportion of valid observations spent at each level for each participant. The proportion of observations at each level was summarized across all participants using frequency distributions and summary statistics. For ease of presentation, mean percentage of observed time in each activity was presented. However, as data were not normally distributed, statistical comparisons were undertaken using the Kruskal‐Wallis test, comparing the distribution of time spent upright (standing, walking, or actively wheeling) between groups (age group and ward). Interaction between age and ward effects was sought using generalized linear modeling.
RESULTS
Valid observations (at least 2 hours in 1 or more observation period) were available for 132 patients (48 medical, 50 oncology, and 34 surgery). Of these, 67 (51 %) were aged 65 years (54% medical, 44% oncology, 56% surgery) and 62 (47%) were male. There were a total of 3891 observations of location (median, 30 per patient; range, 965). Participants were observed in the bedded area 85.1% of observations, with 3.1% in the bathroom, 3.2% in the hallway or patient lounge, and 8.6% off ward. Allowing for time off ward and behind curtains, when observers could not be sure of their activity level, 3272 valid observations were available for physical activity.
More than half of the observed time (mean 57.4%) was spent lying in bed, 33.6% sitting on the bed or chair, and 9.0% standing, walking, or wheeling. Across all observation periods, 39/132 (29.5%) participants were never observed to be standing, walking or wheeling, and 7.6% were in bed at all observations. Comparing older and younger patients (Table 1), there was no difference in the time spent in active upright postures (median, 6.1% in older vs 7.4% in younger; P = 0.30). Table 2 summarizes descriptive data for the different wards. In the medical and surgical wards, 84% of the time was spend in or on the bed, and only 16% of the time was spent sitting in a chair or in active upright postures. Surgical patients, in particular, spent two‐thirds of observation time lying flat in bed, whereas medical patients spent more time sitting up on the bed. On statistical testing, time spent standing/walking/wheeling was significantly lower on the surgical ward (median, 4%; interquartile range [IQR], 010 for surgery; median, 7%; IQR, 013 for medical; and median, 10%; IQR 317 for oncology; P = 0.015). This was also reflected in a higher proportion of surgical patients never seen in an active upright position (44.1% compared to 27.1% medical and 22.0% oncology). Multivariate modeling showed no significant interaction between age and ward.
| All Ages, n = 132, Median Observations 29.5, Range 665* | Aged 65 Years, n = 61, Median Observations 30, Range 665 | Aged 65 Years, n = 67, Median Observations 27, Range 665 | |
|---|---|---|---|
| |||
| Location | |||
| Bedroom | 85.1 (13.3) | 84.6 (13.4) | 85.5 (12.9) |
| Bathroom | 3.0 (4.0) | 2.6 (3.9) | 3.4 (4.1) |
| Hall | 2.9 (4.6) | 3.4 (5.4) | 2.7 (4.0) |
| Lounge | 0.3 (1.9) | 0 | 0.6 (2.7) |
| Off ward/other | 8.6 (11.6) | 9.3 (11.4) | 7.8 (11.1) |
| Physical activity | |||
| Lie in bed | 57.4 (30.0) | 59.4 (29.4) | 55.5 (31.6) |
| Sit on bed | 21.0 (23.2) | 16.9 (19.9) | 24.7 (25.7) |
| Sit on chair | 12.6 (22.9) | 14.0 (25.6) | 11.9 (20.9) |
| Stand/walk/wheel | 9.0 (9.3) | 9.6 (9.6) | 8.0 (8.5) |
| Medical, n = 48, Median Observations 30, Range 759 | Oncology, n = 50, Median Observations 25, Range 652 | Surgical, n = 34, Median Observations 31, Range 1765 | |
|---|---|---|---|
| Location | |||
| Bedroom | 89.1 (11.4) | 81.3 (13.6) | 85.3 (14.1) |
| Bathroom | 2.8 (4.1) | 3.1 (3.8) | 3.1 (4.2) |
| Hall | 1.5 (2.5) | 5.3 (6.1) | 1.5 (2.7) |
| Lounge | 0.5 (2.0) | 0.4 (2.5) | 0 |
| Off ward/other | 6.2 (10.2) | 10.0 (11.9) | 10.1 (12.6) |
| Physical activity | |||
| Lie in bed | 53.3 (31.4) | 56.1 (30.2) | 65.1 (27.0) |
| Sit on bed | 30.3 (29.5) | 13.4 (16.1) | 19.0 (17.0) |
| Sit on chair | 8.2 (14.7) | 19.1 (29.1) | 9.3 (20.4) |
| Stand/walk/wheel | 8.2 (8.4) | 11.4 (9.7) | 6.5 (9.4) |
DISCUSSION
This observational cross‐sectional study extends previous observations of hospital inpatients to include a wider variety of patient types and ages. Observing 132 patients on medical, surgical, and oncology wards for up to 16 hours of weekday time, we found that patients spent only 9% in active upright postures, with significantly lower mobility on the surgical ward but no significant differences between older and younger patients.
Previous studies in older general medical patients using behavioral mapping[13] or accelerometers[2, 3] have shown 71% to 83% of time spent in bed, and 4% spent standing or walking, similar to our findings, although methodological differences between studies (eg, patient selection and time windows) caution against direct comparison. We identified different levels of physical activity on the surgical, medical, and oncology wards. This may reflect differences in patient case‐mix, ward environment, and/or ward culture. The medical and oncology wards each have a patient lounge, providing a potential walking destination, although only a small amount of patients' time was observed in these areas, suggesting that they may not fulfil their purpose. The oncology ward has a well developed wellness focus. The oncology and medical wards were actively involved in a quality‐improvement intervention to improve early patient mobility at the time of the audit,[15] whereas the surgical ward was at the precommencement (information gathering) stage. The data collected within this audit have formed part of the feedback cycle for staff involved in the improvement intervention. Repeat measurement will be undertaken on the surgical ward to help evaluate the impact of the intervention, and serial measurement will be undertaken in future participating wards to investigate the responsiveness of this measurement method.
Although the literature has focused on poor mobility in hospitalized elders, we did not find any better mobility in younger patients, suggesting that barriers to mobility are not confined to the elderly. Whereas individualized mobility assessment and support may be more important in the elderly,[16] addressing cultural and environmental issues such as promoting accountability for early ambulation, providing patients and families with permission and encouragement to ambulate, and ensuring accessible walking destinations may benefit patients of all ages.
Behavioral mapping has strengths and weaknesses compared to other methods such as accelerometry or patient/nurse report. Observations are conducted by an independent observer not involved in care and include all ward inpatients, providing a generalizable sample, as the observation protocol does not pose a participation burden for patient or ward staff. However, the cross‐sectional nature may oversample longer‐stay patients, the intermittent observation protocol tends to overestimate time spent upright,[14] the labor‐intensive nature of observations means choosing a limited time window (in our case 10001800), and the minimum time and observation frequency to generate reliable data remain uncertain. Further studies examining reliability, validity, and responsiveness would support the utility of this method for quality improvement.
In summary, this study shows that mobility is limited in older and younger adult inpatients across a range of inpatient wards, and that physical activity practices vary among wards. Interventions to enhance hospital mobility should include patients of all ages, and need to be tailored to local mobility practices, barriers, and enablers.
Acknowledgements
The authors thank the staff of wards 6AS, 9BN, and 7BW for participating in this project.
Disclosure: Nothing to report.
- , , . Prevalence and outcomes of low mobility in hospitalized older patients. J Am Geriatr Soc. 2004;52(8):1263–1270.
- , , , . The underrecognized epidemic of low mobility during hospitalization of older adults. J Am Geriatr Soc. 2009;57:1660–1665.
- , , , et al. Twenty‐four‐hour mobility during acute hospitalization in older medical patients. J Gerontol A Biol Sci Med Sci. 2013;68(3):331–337.
- , , , , , . Low mobility during hospitalization and functional decline in older adults. J Am Geriatr Soc. 2011;59(2):266–273.
- , , . Exercising body and mind: an integrated approach to functional independence. J Am Geriatr Soc. 2008;56:630–635.
- , , , , . Early mobilization of patients hospitalized with community‐acquired pneumonia. Chest. 2003;124(124):883–889.
- , , . Nursing staff perceptions of physical function in hospitalized older adults. App Nurs Res. 2011;24:215–222.
- , , , , . Barriers to mobility during hospitalization from the perspectives of older patients and their nurses and physicians. J Hosp Med. 2007;2:305–313.
- , . How nurses decide to ambulate hospitalized older adults: development of a conceptual model. Gerontologist. 2011;51(6):786–797.
- , , , . Barriers to early mobility of hospitalized general medicine patients. Survey development and validation. Am J Phys Med Rehabil. 2015;94:304–312.
- , . Attitudes and expectations regarding exercise in the hospital of hospitalized older adults: a qualitative study. J Am Geriatr Soc. 2012;60:713–718.
- , , , . Inactive and alone. Physical activity within the first 14 days of acute stroke unit care. Stroke. 2004;35:1005–1009.
- , , . Activity level of hospital medical inpatients: an observational study. Arch Gerontol Geriatr. 2012;55:417–421.
- , , , . Measuring activity levels at an acute stroke ward: comparing observations to a device. Biomed Res Int. 2013;2013:460482.
- , , . Eat walk engage: an interdisciplinary collaborative model to improve care of hospitalized elders. Am J Med Qual. 2015;30(1):5–13.
- , , . Hospitalization‐associated disability. “She was probably able to ambulate, but I'm not sure”. JAMA. 2011;306(16):1782–1793.
Hyperkalemia Treatment and Hypoglycemia
Hyperkalemia occurs in as many as 10% of all hospitalized patients,[1] leading to potentially fatal arrhythmias or cardiac arrest that results from ionic imbalance within the resting membrane potential of myocardial tissue.[2] Acute instances may be stabilized with insulin to stimulate intracellular uptake of potassium, but this increases the risk of hypoglycemia.[2] Centers for Medicare and Medicaid Services quality measures require hospitals to minimize hypoglycemic events, particularly serious events with blood glucose (BG) 40 mg/dL,[3] due to an association with an increase in mortality in the hospital setting.[4] Previous research at our tertiary care hospital found that 8.7% of patients had suffered a hypoglycemic event following insulin administration pursuant to acute hyperkalemia treatment, and that patients with a lower body weight are at increased risk of hypoglycemia, particularly severe hypoglycemia (BG 40 mg/dL).[5] Increasing the total dose of dextrose provided around the time of insulin administration is suggested to reduce this concern.[5]
Patients at our institution receive 50 g of dextrose in conjunction with intravenous (IV) insulin for hyperkalemia treatment. To further reduce the potential for hypoglycemia, our institution amended the acute hyperkalemia order set to provide prescribers an alternative dosing strategy to the standard 10 U of IV insulin traditionally used for this purpose. Beginning November 10, 2013, our computer prescriber order entry (CPOE) system automatically prepopulated a dose of 0.1 U/kg of body weight for any patients weighing 95 kg (doses rounded to the nearest whole unit) when the acute hyperkalemia order set was utilized. The maximum dose allowed continued to be 10 U. The revised order set also changed nursing orders to require BG monitoring as frequently as every hour following the administration of insulin and dextrose for the treatment of hyperkalemia.
The purpose of this study is to investigate whether weight‐based insulin dosing (0.1 U/kg) for patients weighing 95 kg, rather than a standard 10‐U insulin dose, resulted in fewer hypoglycemic episodes and patients affected. Secondarily, this study sought to determine the impact of weight‐based insulin dosing on potassium‐lowering effects of therapy and to detect any risk factors for development of hypoglycemia among this patient population.
METHODS
This institutional review boardapproved, single‐center, retrospective chart review examined patients for whom the physician order entry set for hyperkalemia therapy was utilized, including patients who weighed less than 95 kg and received regular insulin via weight‐based dosing (0.1 U/kg of body weight up to a maximum of 10 U) during the period November 10, 2013 to May 31, 2014, versus those who received fixed insulin dosing (10 U regardless of body weight) during the period May 1, 2013 to November 9, 2013. During each of these periods, the CPOE system autopopulated the recommended insulin dose, with the possibility for physician manual dose entry. Data collection was limited to the first use of insulin for hyperkalemia treatment per patient in each period.
Patients weighing 95 kg were the focus of this study because they received 10 U of insulin under the weight‐based dosing strategy. Patients were excluded from the study if they had a body weight >95 kg or no weight recorded, were not administered insulin as ordered, received greater than the CPOE‐specified insulin dose, or had no BG readings recorded within 24 hours of insulin administration. The first 66 patients within each group meeting all inclusion and exclusion criteria were randomly selected for analysis. This recruitment target was developed to provide enough patients for a meaningful analysis of hypoglycemia events based on previous reports from our institution.[5]
Hypoglycemia was defined as a recorded BG level 70 mg/dL within 24 hours after insulin administration; severe hypoglycemia was defined as a recorded BG 40 mg/dL within 24 hours. Individual episodes of hypoglycemia and severe hypoglycemia were recorded for each instance of such event separated by at least 1 hour from the time of the first recorded event. In addition, episodes of hypoglycemia or severe hypoglycemia and number of patients affected were assessed at within 6 hours, 6 to 12 hours, and 12 to 24 hours after insulin administration as separate subsets for statistical analysis.
For the purpose of assessing the potassium‐lowering efficacy of weight‐based versus traditional dosing of insulin, maximum serum potassium levels were examined in the 12‐hour interval before the hyperkalemia order set was implemented and compared with minimum potassium levels in the 12 hours after insulin was administered. A comparison of the treatment groups assessed differences between the mean decrease in serum potassium from baseline, the mean minimum potassium achieved, the number of patients achieving minimum potassium below 5.0 mEq/L, and the number of patients who subsequently received repeat treatment for hyperkalemia within 24 hours of treatment with insulin.
Statistical analysis was conducted utilizing 2 and Fisher exact tests for nominal data and Student t test for continuous data to detect statistically significant differences between the groups. Binomial logistic multivariable analysis using a backward stepwise approach was used to determine factors for development of hypoglycemia, analyzed on a per‐patient basis to prevent characteristics from being over‐represented when events occurred multiple times to a single patient. All analyses were completed by using SPSS version 18 (SPSS Inc., Chicago, IL).
RESULTS
In total, 1734 entries were available for the acute hyperkalemia order set with insulin during the 2 periods investigated. Only 464 patients were eligible for manual chart review once weight‐based exclusions were identified by electronic database, with additional exclusion criteria later extracted from patient charts. Patients in both treatment groups were fairly well balanced, with a slightly lower body weight in the 10‐U insulin group recorded (Table 1). Patients in the weight‐based dosing group received between 4 and 9 U of insulin, depending on body weight.
| Characteristics | 10 U Insulin, n = 66 | 0.1 U/kg Insulin, n = 66 | P Value (2‐Sided) |
|---|---|---|---|
| |||
| Weight, kg | 69.9 (14.2) | 74.2 (12.6) | 0.07 |
| Age, y | 55.7 (15.7) | 61.9 (17.6) | 0.36 |
| Male gender | 37 (56.1%) | 41 (62.1%) | 0.60 |
| Caucasian race | 40 (60.6%) | 37 (56.1%) | 0.55 |
| Serum creatinine, mg/dL | 3.16 (4.38) | 3.04 (4.61) | 0.9 |
| Creatinine clearance 30 mL/min | 41 (62.1%) | 41 (62.1%) | 0.6 |
| Dialysis | 20 (30.3%) | 16 (24.2%) | 0.56 |
| Baseline blood glucose, mg/dL | 166.0 (71.7) | 147.3 (48.0) | 0.08 |
| Received other insulin within 24 hours of hyperkalemia treatment | 30 (45.4%) | 25 (37.9%) | 0.48 |
| Received K+ supplement within 24 hours of hyperkalemia treatment | 9 (13.6%) | 11 (16.7%) | 0.81 |
| Baseline serum K+, mmol/L | 6.1 (0.5) | 6.1 (0.7) | 0.76 |
| Baseline serum K+ >6.0 mmol/L | 41 (62.1%) | 33 (50%) | 0.22 |
| No. of additional treatments for hyperkalemia in addition to insulin/dextrose | 1.5 (0.8) | 1.4 (0.9) | 0.49 |
A reduction in the number of hypoglycemic episodes was detected in the weight‐based dosing group of 56% within 24 hours, from 18 to 8 events (P = 0.05) (Table 2). The number of hypoglycemic events in every subset of time intervals was likewise reduced by at least 50% using weight‐based dosing (from 7 to 3 events within 6 hours, from 5 to 2 events in 612 hours, from 6 to 3 events in 1224 hours). The number of patients who experienced hypoglycemia within 24 hours after receiving insulin also was reduced in the weight‐based dosing group by 46% (P = 0.22).
| Outcomes | 10 U Insulin, n = 66 | 0.1 U/kg Insulin, n = 66 | P Value (2‐Sided) |
|---|---|---|---|
| |||
| Hypoglycemia, 70 mg/dL | |||
| No. of patients | 13 (19.7%) | 7 (10.6%) | 0.22 |
| No. of events total | 18 (27.3%) | 8 (12.1%) | 0.05 |
| No. of events 06 hours | 7 (10.6%) | 3 (4.5%) | 0.32 |
| No. of events 612 hours | 5 (7.6%) | 2 (3.0%) | 0.44 |
| No. of events 1224 hours | 6 (9.1%) | 3 (4.5%) | 0.49 |
| Severe hypoglycemia | |||
| No. of patients | 2 (3.0%) | 1 (1.5%) | >0.99 |
| No. of events total | 2 (3%) | 1 (1.5%) | >0.99 |
| Potassium‐lowering effects | |||
| Minimum K+ after therapy, mmol/L (SD) | 4.9 (0.7) | 4.8 (0.7) | 0.84 |
| Minimum serum K+ 5.0 mmol/L (%) | 37 (56.1%) | 35 (53.0%) | 0.32 |
| Average K+ decrease, mmol/L (SD) | 1.35 (0.97) | 1.34 (0.94) | 0.94 |
| Repeat treatment given (%) | 24 (36.4%) | 24 (36.4%) | >0.99 |
Potassium lowering was comparable across both dosing strategies in every measure assessed (Table 2). Multivariate analysis revealed that baseline BG 140 mg/dL (adjusted odds ratio: 4.3, 95% confidence interval [CI]: 1.4‐13.7, P = 0.01) and female gender (adjusted odds ratio: 3.2, 95% CI: 1.1‐9.1, P = 0.03) were associated with an increased risk of hypoglycemia. Other factors, including administration of insulin beyond that for hyperkalemia treatment and use of additional hypoglycemic agents, were not associated with the development of hypoglycemia, which is consistent with previous reports.[6]
CONCLUSIONS
Our findings indicate that using a weight‐based approach to insulin dosing when treating hyperkalemia may lead to a reduction in hypoglycemia without sacrificing the efficacy of potassium lowering. Females and patients with glucose values 140 mg/dL were at increased risk of hypoglycemia in this cohort. Based on the results of this research, a weight‐based dosing strategy of 0.1 U/kg IV insulin up to a maximum of 10 U should be considered, with further research desirable to validate these results.
This study was strengthened by the inclusion of all patients regardless of baseline glucose, baseline potassium, administration of other insulins, level of renal impairment, or symptomatic display of hypoglycemia or cardiac dysfunction, thus providing a broad representation of patients treated for acute hyperkalemia. This pilot study was limited in its scope by data collection for only 66 randomized patients per group rather than the entire patient population. In addition, the study utilized patient information from a single site, with few ethnicities represented. Validation of this research using a larger sample size should include greater variation in the patients served. Our inclusion of a hypoglycemia definition up to 24 hours after treatment may also be criticized. However, this is similar to previous reports and allows for a liberal time period for follow‐up glucose monitoring to be recorded.[7]
Because of its small sample size and the low event rate, this study was unable to draw conclusions about the ability of weight‐based insulin dosing to affect severe hypoglycemic events (40 mg/dL). A study of more than 400 patients would be necessary to find statistically significant differences in the risk of severe hypoglycemia. Furthermore, because we did not examine the results from all patients in this cohort, we cannot conclusively determine the impact of treatment. The retrospective nature of this study limited our ability to capture hypoglycemic episodes during periods in which BG levels were not recorded. Additionally, changes to the post‐treatment glucose monitoring protocol may have also affected the incidence of hypoglycemia in 2 potential ways. First, early and unrecorded interventions may have occurred in patients with a trend toward hypoglycemia. Second, the longer time to follow‐up in the nonweight‐based group may have led to additional hypoglycemic episodes being missed. A prospective trial design could provide more comprehensive information about patient response to weight‐based versus traditional dosing of IV insulin for hyperkalemia. Further investigations on reducing adverse effects of insulin when treating hyperkalemia should focus on female patients and those with lower baseline BG values. Additionally, as newer agents to treat hyperkalemia are developed and tested, the approach to management should be revisited.[8, 9, 10]
Disclosures: Garry S. Tobin, MD, lectures or is on the speakers bureau for Eli Lilly, Jansen, Boehringher Ingelheim, and Novo Nordisk, and performs data safety monitoring for Novo Nordisk. The authors report no other potential conflicts of interest.
- , , , . Hyperkalemia in hospitalized patients: causes, adequacy of treatment, and results of an attempt to improve physician compliance with published therapy guidelines. Arch Intern Med. 1998;158:917–924.
- 2010 American Heart Association guidelines for cardiopulmonary resuscitation and emergency cardiovascular care. Part 12.6: cardiac arrest associated with life‐threatening electrolyte disturbances. Circulation. 2010;122:S829–S861.
- Centers for Medicare 29(2):101–107.
- , , , . Incidence of hypoglycemia following insulin‐based acute stabilization of hyperkalemia treatment. J Hosp Med. 2012;7(3):239–242.
- , , . Hypoglycemia in the treatment of hyperkalemia with insulin in patients with end‐stage renal disease. Clin Kidney J. 2014;7(3):248–250.
- , , , . Prediction and prevention of treatment‐related inpatient hypoglycemia. J Diabetes Sci Technol. 2012;6(2):302–309.
- , , , et al. Effect of sodium zirconium cyclosilicate on potassium lowering for 28 days among outpatients with hyperkalemia: the HARMONIZE randomized clinical trial. JAMA. 2014;312(21):2223–2233.
- , , , et al. Zirconium cyclosilicate in hyperkalemia. N Engl J Med. 2015;372:222–231.
- , , , et al. Patiromer in patients with kidney disease and hyperkalemia receiving RAAS inhibitors. N Engl J Med. 2015;372:211–221.
Hyperkalemia occurs in as many as 10% of all hospitalized patients,[1] leading to potentially fatal arrhythmias or cardiac arrest that results from ionic imbalance within the resting membrane potential of myocardial tissue.[2] Acute instances may be stabilized with insulin to stimulate intracellular uptake of potassium, but this increases the risk of hypoglycemia.[2] Centers for Medicare and Medicaid Services quality measures require hospitals to minimize hypoglycemic events, particularly serious events with blood glucose (BG) 40 mg/dL,[3] due to an association with an increase in mortality in the hospital setting.[4] Previous research at our tertiary care hospital found that 8.7% of patients had suffered a hypoglycemic event following insulin administration pursuant to acute hyperkalemia treatment, and that patients with a lower body weight are at increased risk of hypoglycemia, particularly severe hypoglycemia (BG 40 mg/dL).[5] Increasing the total dose of dextrose provided around the time of insulin administration is suggested to reduce this concern.[5]
Patients at our institution receive 50 g of dextrose in conjunction with intravenous (IV) insulin for hyperkalemia treatment. To further reduce the potential for hypoglycemia, our institution amended the acute hyperkalemia order set to provide prescribers an alternative dosing strategy to the standard 10 U of IV insulin traditionally used for this purpose. Beginning November 10, 2013, our computer prescriber order entry (CPOE) system automatically prepopulated a dose of 0.1 U/kg of body weight for any patients weighing 95 kg (doses rounded to the nearest whole unit) when the acute hyperkalemia order set was utilized. The maximum dose allowed continued to be 10 U. The revised order set also changed nursing orders to require BG monitoring as frequently as every hour following the administration of insulin and dextrose for the treatment of hyperkalemia.
The purpose of this study is to investigate whether weight‐based insulin dosing (0.1 U/kg) for patients weighing 95 kg, rather than a standard 10‐U insulin dose, resulted in fewer hypoglycemic episodes and patients affected. Secondarily, this study sought to determine the impact of weight‐based insulin dosing on potassium‐lowering effects of therapy and to detect any risk factors for development of hypoglycemia among this patient population.
METHODS
This institutional review boardapproved, single‐center, retrospective chart review examined patients for whom the physician order entry set for hyperkalemia therapy was utilized, including patients who weighed less than 95 kg and received regular insulin via weight‐based dosing (0.1 U/kg of body weight up to a maximum of 10 U) during the period November 10, 2013 to May 31, 2014, versus those who received fixed insulin dosing (10 U regardless of body weight) during the period May 1, 2013 to November 9, 2013. During each of these periods, the CPOE system autopopulated the recommended insulin dose, with the possibility for physician manual dose entry. Data collection was limited to the first use of insulin for hyperkalemia treatment per patient in each period.
Patients weighing 95 kg were the focus of this study because they received 10 U of insulin under the weight‐based dosing strategy. Patients were excluded from the study if they had a body weight >95 kg or no weight recorded, were not administered insulin as ordered, received greater than the CPOE‐specified insulin dose, or had no BG readings recorded within 24 hours of insulin administration. The first 66 patients within each group meeting all inclusion and exclusion criteria were randomly selected for analysis. This recruitment target was developed to provide enough patients for a meaningful analysis of hypoglycemia events based on previous reports from our institution.[5]
Hypoglycemia was defined as a recorded BG level 70 mg/dL within 24 hours after insulin administration; severe hypoglycemia was defined as a recorded BG 40 mg/dL within 24 hours. Individual episodes of hypoglycemia and severe hypoglycemia were recorded for each instance of such event separated by at least 1 hour from the time of the first recorded event. In addition, episodes of hypoglycemia or severe hypoglycemia and number of patients affected were assessed at within 6 hours, 6 to 12 hours, and 12 to 24 hours after insulin administration as separate subsets for statistical analysis.
For the purpose of assessing the potassium‐lowering efficacy of weight‐based versus traditional dosing of insulin, maximum serum potassium levels were examined in the 12‐hour interval before the hyperkalemia order set was implemented and compared with minimum potassium levels in the 12 hours after insulin was administered. A comparison of the treatment groups assessed differences between the mean decrease in serum potassium from baseline, the mean minimum potassium achieved, the number of patients achieving minimum potassium below 5.0 mEq/L, and the number of patients who subsequently received repeat treatment for hyperkalemia within 24 hours of treatment with insulin.
Statistical analysis was conducted utilizing 2 and Fisher exact tests for nominal data and Student t test for continuous data to detect statistically significant differences between the groups. Binomial logistic multivariable analysis using a backward stepwise approach was used to determine factors for development of hypoglycemia, analyzed on a per‐patient basis to prevent characteristics from being over‐represented when events occurred multiple times to a single patient. All analyses were completed by using SPSS version 18 (SPSS Inc., Chicago, IL).
RESULTS
In total, 1734 entries were available for the acute hyperkalemia order set with insulin during the 2 periods investigated. Only 464 patients were eligible for manual chart review once weight‐based exclusions were identified by electronic database, with additional exclusion criteria later extracted from patient charts. Patients in both treatment groups were fairly well balanced, with a slightly lower body weight in the 10‐U insulin group recorded (Table 1). Patients in the weight‐based dosing group received between 4 and 9 U of insulin, depending on body weight.
| Characteristics | 10 U Insulin, n = 66 | 0.1 U/kg Insulin, n = 66 | P Value (2‐Sided) |
|---|---|---|---|
| |||
| Weight, kg | 69.9 (14.2) | 74.2 (12.6) | 0.07 |
| Age, y | 55.7 (15.7) | 61.9 (17.6) | 0.36 |
| Male gender | 37 (56.1%) | 41 (62.1%) | 0.60 |
| Caucasian race | 40 (60.6%) | 37 (56.1%) | 0.55 |
| Serum creatinine, mg/dL | 3.16 (4.38) | 3.04 (4.61) | 0.9 |
| Creatinine clearance 30 mL/min | 41 (62.1%) | 41 (62.1%) | 0.6 |
| Dialysis | 20 (30.3%) | 16 (24.2%) | 0.56 |
| Baseline blood glucose, mg/dL | 166.0 (71.7) | 147.3 (48.0) | 0.08 |
| Received other insulin within 24 hours of hyperkalemia treatment | 30 (45.4%) | 25 (37.9%) | 0.48 |
| Received K+ supplement within 24 hours of hyperkalemia treatment | 9 (13.6%) | 11 (16.7%) | 0.81 |
| Baseline serum K+, mmol/L | 6.1 (0.5) | 6.1 (0.7) | 0.76 |
| Baseline serum K+ >6.0 mmol/L | 41 (62.1%) | 33 (50%) | 0.22 |
| No. of additional treatments for hyperkalemia in addition to insulin/dextrose | 1.5 (0.8) | 1.4 (0.9) | 0.49 |
A reduction in the number of hypoglycemic episodes was detected in the weight‐based dosing group of 56% within 24 hours, from 18 to 8 events (P = 0.05) (Table 2). The number of hypoglycemic events in every subset of time intervals was likewise reduced by at least 50% using weight‐based dosing (from 7 to 3 events within 6 hours, from 5 to 2 events in 612 hours, from 6 to 3 events in 1224 hours). The number of patients who experienced hypoglycemia within 24 hours after receiving insulin also was reduced in the weight‐based dosing group by 46% (P = 0.22).
| Outcomes | 10 U Insulin, n = 66 | 0.1 U/kg Insulin, n = 66 | P Value (2‐Sided) |
|---|---|---|---|
| |||
| Hypoglycemia, 70 mg/dL | |||
| No. of patients | 13 (19.7%) | 7 (10.6%) | 0.22 |
| No. of events total | 18 (27.3%) | 8 (12.1%) | 0.05 |
| No. of events 06 hours | 7 (10.6%) | 3 (4.5%) | 0.32 |
| No. of events 612 hours | 5 (7.6%) | 2 (3.0%) | 0.44 |
| No. of events 1224 hours | 6 (9.1%) | 3 (4.5%) | 0.49 |
| Severe hypoglycemia | |||
| No. of patients | 2 (3.0%) | 1 (1.5%) | >0.99 |
| No. of events total | 2 (3%) | 1 (1.5%) | >0.99 |
| Potassium‐lowering effects | |||
| Minimum K+ after therapy, mmol/L (SD) | 4.9 (0.7) | 4.8 (0.7) | 0.84 |
| Minimum serum K+ 5.0 mmol/L (%) | 37 (56.1%) | 35 (53.0%) | 0.32 |
| Average K+ decrease, mmol/L (SD) | 1.35 (0.97) | 1.34 (0.94) | 0.94 |
| Repeat treatment given (%) | 24 (36.4%) | 24 (36.4%) | >0.99 |
Potassium lowering was comparable across both dosing strategies in every measure assessed (Table 2). Multivariate analysis revealed that baseline BG 140 mg/dL (adjusted odds ratio: 4.3, 95% confidence interval [CI]: 1.4‐13.7, P = 0.01) and female gender (adjusted odds ratio: 3.2, 95% CI: 1.1‐9.1, P = 0.03) were associated with an increased risk of hypoglycemia. Other factors, including administration of insulin beyond that for hyperkalemia treatment and use of additional hypoglycemic agents, were not associated with the development of hypoglycemia, which is consistent with previous reports.[6]
CONCLUSIONS
Our findings indicate that using a weight‐based approach to insulin dosing when treating hyperkalemia may lead to a reduction in hypoglycemia without sacrificing the efficacy of potassium lowering. Females and patients with glucose values 140 mg/dL were at increased risk of hypoglycemia in this cohort. Based on the results of this research, a weight‐based dosing strategy of 0.1 U/kg IV insulin up to a maximum of 10 U should be considered, with further research desirable to validate these results.
This study was strengthened by the inclusion of all patients regardless of baseline glucose, baseline potassium, administration of other insulins, level of renal impairment, or symptomatic display of hypoglycemia or cardiac dysfunction, thus providing a broad representation of patients treated for acute hyperkalemia. This pilot study was limited in its scope by data collection for only 66 randomized patients per group rather than the entire patient population. In addition, the study utilized patient information from a single site, with few ethnicities represented. Validation of this research using a larger sample size should include greater variation in the patients served. Our inclusion of a hypoglycemia definition up to 24 hours after treatment may also be criticized. However, this is similar to previous reports and allows for a liberal time period for follow‐up glucose monitoring to be recorded.[7]
Because of its small sample size and the low event rate, this study was unable to draw conclusions about the ability of weight‐based insulin dosing to affect severe hypoglycemic events (40 mg/dL). A study of more than 400 patients would be necessary to find statistically significant differences in the risk of severe hypoglycemia. Furthermore, because we did not examine the results from all patients in this cohort, we cannot conclusively determine the impact of treatment. The retrospective nature of this study limited our ability to capture hypoglycemic episodes during periods in which BG levels were not recorded. Additionally, changes to the post‐treatment glucose monitoring protocol may have also affected the incidence of hypoglycemia in 2 potential ways. First, early and unrecorded interventions may have occurred in patients with a trend toward hypoglycemia. Second, the longer time to follow‐up in the nonweight‐based group may have led to additional hypoglycemic episodes being missed. A prospective trial design could provide more comprehensive information about patient response to weight‐based versus traditional dosing of IV insulin for hyperkalemia. Further investigations on reducing adverse effects of insulin when treating hyperkalemia should focus on female patients and those with lower baseline BG values. Additionally, as newer agents to treat hyperkalemia are developed and tested, the approach to management should be revisited.[8, 9, 10]
Disclosures: Garry S. Tobin, MD, lectures or is on the speakers bureau for Eli Lilly, Jansen, Boehringher Ingelheim, and Novo Nordisk, and performs data safety monitoring for Novo Nordisk. The authors report no other potential conflicts of interest.
- , , , . Hyperkalemia in hospitalized patients: causes, adequacy of treatment, and results of an attempt to improve physician compliance with published therapy guidelines. Arch Intern Med. 1998;158:917–924.
- 2010 American Heart Association guidelines for cardiopulmonary resuscitation and emergency cardiovascular care. Part 12.6: cardiac arrest associated with life‐threatening electrolyte disturbances. Circulation. 2010;122:S829–S861.
- Centers for Medicare 29(2):101–107.
- , , , . Incidence of hypoglycemia following insulin‐based acute stabilization of hyperkalemia treatment. J Hosp Med. 2012;7(3):239–242.
- , , . Hypoglycemia in the treatment of hyperkalemia with insulin in patients with end‐stage renal disease. Clin Kidney J. 2014;7(3):248–250.
- , , , . Prediction and prevention of treatment‐related inpatient hypoglycemia. J Diabetes Sci Technol. 2012;6(2):302–309.
- , , , et al. Effect of sodium zirconium cyclosilicate on potassium lowering for 28 days among outpatients with hyperkalemia: the HARMONIZE randomized clinical trial. JAMA. 2014;312(21):2223–2233.
- , , , et al. Zirconium cyclosilicate in hyperkalemia. N Engl J Med. 2015;372:222–231.
- , , , et al. Patiromer in patients with kidney disease and hyperkalemia receiving RAAS inhibitors. N Engl J Med. 2015;372:211–221.
Readmissions in Medicaid Beneficiaries
Hospital readmissions that occur within 30 days of discharge are an important measure for assessing performance of the healthcare system and the quality of patient care.[1, 2] According to the Healthcare Cost and Utilization Project (HCUP), there were approximately 3.3 million adults with all‐cause 30‐day readmissions in the United States in 2011, incurring nearly $41.3 billion in hospital costs.[3] Reducing 30‐day readmissions has become a priority for payers, providers, and policymakers seeking to achieve improved quality of care at lower costs.
The implementation of the Affordable Care Act (ACA) provided the Centers for Medicare & Medicaid Services (CMS) statutory authority under the Hospital Readmissions Reduction Program to reduce payments for certain hospital readmissions that it deemed avoidable.[4] Although initial focus was on Medicare readmissions related to heart failure, myocardial infarction, and pneumonia, CMS is now considering expanding the list beyond the 3 conditions covered by the program.[4, 5] Therefore, it is important to understand major risk factors for readmissions in beneficiaries with chronic conditions.
Medicaid consists of the largest number of beneficiaries among all payers in the United States, with approximately 62 million beneficiaries in 2013.[5] The Medicaid population is further expected to increase with the coverage expansions under the ACA. In addition, the state Medicaid programs incur an estimated $374 billion in healthcare expenditures and provide healthcare services to the vulnerable, indigent, and disabled. It is estimated that 61% of adult Medicaid beneficiaries have chronic or disabling conditions that place them at an increased risk of hospitalization.[6] A series of HCUP statistical briefs reported several findings. First, Medicaid all‐cause readmission rates were comparable with Medicare but double the rate of private insurance.[7] Second, for readmissions following nonsurgical hospitalizations, 30‐day Medicaid readmission rates were higher than Medicare and private insurance for both acute and chronic conditions.[1] The effects of such costly utilization patterns, for this large and growing population necessitates heightened attention under healthcare reform.
The balance between hospital efficiency and quality of care is another crucial aspect for our healthcare system. However, length of stay (LOS), a proxy marker for efficiency, may conflict with hospital readmission rates, an indicator of quality. Further, CMS plans to bundle 30‐day readmission rates to reimbursement for the index hospitalization.[8]
The effect of LOS on readmission rates is complex, and previous studies have provided conflicting data regarding the relationship between LOS and subsequent readmission risk. Some indicate that shorter LOS is associated with a higher risk of readmission,[8, 9] whereas others suggest that extended LOS is associated with a higher risk of readmission.[10, 11, 12] However, most research on readmissions has focused on Medicare beneficiaries.[11, 13, 14] The readmission patterns of Medicaid beneficiaries differ from those of the geriatric Medicare beneficiaries, from a clinical and socioeconomic perspective. Considering the importance of 30‐day readmission for payers and policy makers, there is a need to understand the role of LOS and implications for treatment and management strategies.
Our study examined the association between index hospitalization characteristics (LOS and reason for admission) and all‐cause 30‐day readmission risk in fee‐for‐service high‐risk Medicaid beneficiaries. The study is limited to patients with selected chronic conditions and examines the differentiating factors within this high‐risk population. For the purpose of our study, variables were selected based on a priori knowledge and Andersen's behavioral model of health service utilization. This model suggests that potential health service use is determined by interactions among predisposing (demographics, index hospitalization characteristics), enabling (county level [eg, socioeconomic status]), and need (health status) characteristics of individuals and also the healthcare systems in the communities where they reside.[15]
METHODS
Study Design
A retrospective cohort approach was used with baseline and follow‐up periods. The baseline period was defined as the admission date of the index hospitalization (first observed hospitalization) between January 1, 2007 and December 31, 2007. Patients were followed for 180 days after discharge date of the associated index hospitalization.
Data Source
Medicaid administrative claims files from California, Illinois, New York, and Texas, between 2006 and 2008, were used. The personal summary file included information on demographics, Medicaid enrollment, and eligibility status. Outpatient and Inpatient files included claims for services provided in ambulatory and inpatient settings and contained International Classification of Diseases, 9th Revision, Clinical Modification codes. Information on county‐level characteristics were obtained from the 2009 Area Health Resource File (AHRF), which was linked to Medicaid administrative claims files using state and county codes where each beneficiary resided.
Study Population
The study population consisted of nonelderly (2164 years old) fee‐for‐service Medicaid‐only beneficiaries with selected chronic conditions and continuous enrollment during baseline and follow‐up period (Figure 1). Analyses were restricted to those who had at least 1 inpatient admission in 2007 and were conducted at the person‐level.
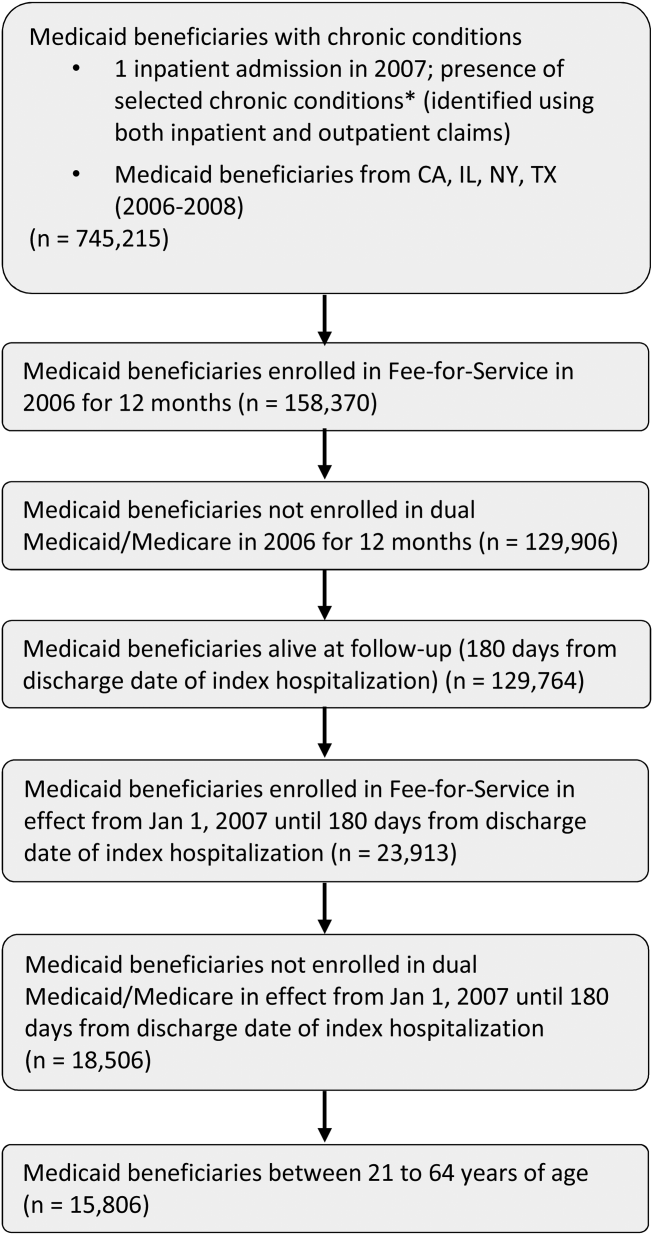
For the purpose of this study, Medicaid beneficiaries with 19 chronic conditions were selected: asthma, arthritis, cardiac arrhythmias, coronary artery disease, cancer, congestive heart failure, chronic kidney disease, chronic obstructive pulmonary disease, dementia, diabetes, hypertension, hyperlipidemia, hepatitis, human immunodeficiency virus osteoporosis, stroke, depression, schizophrenia, and substance use disorders. These conditions were identified based on the strategic framework developed and adopted by the Department of Health and Human Services for research, policy, program, and practice.[16]
Dependent Variable
Individuals were categorized into 2 groups, those with and without all‐cause 30‐day readmission. All‐cause 30‐day readmission was identified as subsequent hospitalization within 30 days of discharge date of the index hospitalization.
Key Independent Variables
These were index hospitalization characteristics, where LOS was the primary independent variable, reason for admission was the secondary independent variable, and month of index hospitalization (included to control for potential seasonal effect).
Other Independent Variables
Patient‐level characteristics included demographics (age, gender, and race/ethnicity) and Medicaid eligibility status (cash and medical need). Primary care access included continuity of care measured using a previously published continuity index (Modified Modified Continuity Index) and coordination of care, measured as primary care visit within 14 days of discharge date. Healthcare utilization was measured as an emergency room visit within 6 months prior to the index hospitalization.
Variables accounting for county socioeconomic status included educational attainment, per capita income, employment rate, poverty level, and metropolitan statistical area. Variables related to availability of providers and healthcare facilities were AHRF designations for primary/mental healthcare shortage areas, presence of federally qualified health centers, rural health centers, and community mental health centers. Hospital and primary care provider density was defined as total number of hospitals or primary care providers per 100,000 individuals, respectively.
Statistical Techniques
2 tests of independence were used for categorical variables and t tests for continuous variables to determine group differences in patient‐level and county‐level characteristics and all‐cause 30‐day readmission. Multilevel logistic regression models, which accounted for beneficiaries nested within counties, were used to examine the association between all‐cause 30‐day readmission and index hospitalization characteristics. The reference group for the dependent variable was no 30‐day readmission. Model 1 controlled for only patient‐level characteristics. Model 2 controlled for both patient‐level and county‐level characteristics. In both models, county was specified as a random intercept using the GLIMMIX procedure. All analyses were conducted using SAS version 9.3 (SAS Inc., Cary, NC).
RESULTS
After the exclusion criteria, there were 15,806 Medicaid beneficiaries with selected chronic conditions and at least 1 inpatient encounter in 2007. Overall, 16.7% experienced all‐cause 30‐day readmissions. A description of the study population and unadjusted associations between independent variables and all‐cause 30‐day readmission are presented in Table 1.
| Variables | 30‐Day Readmission, 2,633 (16.7%) | No 30‐Day Readmission, 13,173 (83.3%) | Significance |
|---|---|---|---|
| |||
| Demographic and Medicaid eligibility characteristics | |||
| Gender, N (%) | * | ||
| Female | 1,715 (65.1%) | 9,274 (70.4%) | |
| Male | 918 (34.9%) | 3,899 (29.6%) | |
| Age group, N (%) | * | ||
| 2124 years | 301 (11.4%) | 1,675 (12.7%) | |
| 2534 years | 567 (21.5%) | 3,578 (27.2%) | |
| 3544 years | 517 (19.6%) | 2,498 (19.0%) | |
| 4554 years | 673 (25.6%) | 2,971 (22.6%) | |
| 5564 years | 575 (21.8%) | 2,451 (18.6%) | |
| Race/ethnicity, N (%) | * | ||
| Caucasian | 847 (32.2%) | 3,831 (29.1%) | |
| African American | 988 (37.5%) | 4,270(32.4%) | |
| Hispanic | 608 (23.1%) | 4,245 (32.2%) | |
| Asian/AI/PI | 39 (1.5%) | 169 (1.3%) | |
| Other | 151 (5.7%) | 658 (5.0%) | |
| Cash eligibility, N (%) | 1,529 (58.1%) | 6,666 (50.6%) | * |
| Medical need eligibility, N (%) | 876 (33.3%) | 3769 (28.6%) | * |
| Index hospitalization characteristics | |||
| Length of stay, mean [SD] | 6.62 [9.09] | 4.29 [6.35] | * |
| Chronic conditions at admission, N (%) | |||
| Arthritis/osteoporosis | 99 (3.8%) | 464 (3.5%) | |
| Cancer | 134 (5.1%) | 429 (3.3%) | * |
| Cardiovascular conditions | 995 (37.8%) | 3,733 (28.3%) | * |
| COPD/asthma | 541 (20.5%) | 2,197 (16.7%) | * |
| Diabetes | 575 (21.8%) | 2,103 (16.0%) | * |
| HIV/hepatitis | 305 (11.6%) | 1,185 (9.0%) | * |
| Mental health conditions | 1,491 (56.6%) | 4,352 (33.0%) | * |
| Season of readmission, N (%) | * | ||
| Spring | 730 (27.7%) | 3,944 (29.9%) | |
| Summer | 401 (15.2%) | 2,332 (17.7%) | |
| Fall | 211 (8.0%) | 1,605 (12.2%) | |
| Winter | 1,291 (49.0%) | 5,292 (40.2%) | |
| Primary care access, N (%) | |||
| Coordination of primary care | 326 (12.4%) | 1,747 (13.3%) | |
| Continuity of primary care, N (%) | |||
| Complete care continuity | 349 (13.3%) | 1,764 (13.4%) | |
| Some care continuity | 634 (24.1%) | 2,960 (22.5%) | |
| No care continuity | 1650 (62.7%) | 8,449 (64.1%) | |
| Healthcare utilization, N (%) | |||
| Emergency room visit | 893 (33.9%) | 4,449 (33.8%) | |
| County‐level characteristics | |||
| Metropolitan status, N (%) | |||
| Nonmetro | 267 (10.1%) | 1,285 (9.8%) | |
| Metro | 2,366 (89.9%) | 11,888 (90.2%) | |
| Primary care shortage area, N (%) | |||
| Whole county | 2,034 (77.3%) | 10,147 (77.0%) | |
| Part county | 429 (16.3%) | 2,312 (17.6%) | |
| No shortage | 170 (6.5%) | 714 (5.4%) | |
| Mental healthcare shortage area, N (%) | |||
| Whole county | 2,015 (76.5%) | 9,925 (75.3%) | |
| Part county | 388 (14.7%) | 2,242 (17.0%) | |
| No shortage | 230 (8.7%) | 1,006 (7.6%) | |
| CMHC, mean [SD] | 0.81 [1.23] | 0.94 [1.24] | * |
| Rural health center, mean [SD] | 0.62 [3.03] | 1.06 [4.41] | * |
| FQHC, mean [SD] | 37.69 [44.31] | 37.78 [42.98] | |
| Education rate, 4+ years, mean [SD] | 25.39 [10.98] | 23.77 [10.51] | * |
| Unemployment rate, mean [SD] | 4.57 [0.71] | 4.67 [0.90] | * |
| % Below poverty level, mean [SD] | 15.11 [3.73] | 15.06 [3.80] | |
| Per capita income (US dollars), mean [SD] | 58,761.96 [33,697.42] | 54,029.16 [31,265.86] | * |
| Nonfederal PCP density, mean [SD] | 307.10 [192.29] | 279.97 [179.22] | * |
| Hospital density, mean [SD] | 1.74 [1.37] | 1.65 [1.14] | * |
Multilevel logistic regressions of all‐cause 30‐day readmissions are summarized in Table 2. Beneficiaries with longer LOS had significantly higher odds of 30‐day readmission. In addition, presence of cancer, cardiovascular conditions, diabetes, and mental health conditions at index hospitalization significantly increased the odds of readmission. In addition, beneficiaries with cash or medical need eligibility had significantly higher odds of 30‐day readmission.
| AOR | 95% CI | Significance | |
|---|---|---|---|
| |||
| Length of stay | 1.03 | [1.031.04] | * |
| Chronic conditions at admission | |||
| Arthritis/osteoporosis | 0.90 | [0.721.13] | |
| Cancer | 1.55 | [1.261.90] | * |
| Cardiovascular conditions | 1.20 | [1.081.33] | * |
| COPD/asthma | 1.01 | [0.901.12] | |
| Diabetes | 1.23 | [1.101.39] | * |
| HIV/hepatitis | 0.98 | [0.851.12] | |
| Mental health conditions | 2.17 | [1.982.38] | * |
| Season of readmission | |||
| Spring | 0.79 | [0.710.88] | * |
| Summer | 0.77 | [0.680.88] | * |
| Fall | 0.58 | [0.490.68] | * |
| Winter | Reference | ||
| Cash eligibility | 1.14 | [1.011.27] | |
| Medical need eligibility | 1.21 | [1.081.36] | |
DISCUSSION
To the best of our knowledge, this is the first study examining patient‐level and county‐level characteristics associated with all‐cause 30‐day readmission in Medicaid beneficiaries with chronic conditions. In addition, our findings add to the nascent literature on readmissions among Medicaid beneficiaries, with findings discussed below.
LOS has been reported as a risk factor for readmission both in elderly and nonelderly populations.[11] Our findings indicate that longer LOS is associated with increased odds of 30‐day readmission, which could be attributed to severity of illness at index hospitalization.[10] This finding could be related to unmeasured clinical severity (our models account for some comorbidities) and socioeconomic issues (as noted in the introduction). This may have implications for discharge planning efforts and focusing on chronic disease management, which has previously shown to be effective in reducing readmissions.[17] Our findings suggest 30‐day readmissions can be predicted using variables that are readily available, few in number, and simple to incorporate in discharge planning. Comprehensive discharge planning which takes into account chronic conditions and index hospitalization characteristics may help organize postdischarge services, including coordination of care with physicians, medication reconciliation, follow‐up care, and appropriate self‐management for chronic conditions.
Our findings of increased risk of 30‐day hospital readmissions as well as longer LOS among Medicaid beneficiaries with cancer, cardiovascular conditions, diabetes, and mental health conditions at index hospitalization suggests that patient complexity/poor health status increases the risk of readmission. A more focused approach in treatment of these diseases can help reduce readmissions. Integrated care management interventions after hospital discharge have been shown to reduce readmissions among those with heart disease; a coordinated care team including cardiologists, specialized nurses, and primary care physicians, and provision of integrated care following hospitalizations have shown benefit.[18, 19] Emerging models of delivery such as accountable care organizations and patient‐centered medical homes, which offer comprehensive, well‐coordinated primary care services, may be needed to reduce readmission among Medicaid beneficiaries with chronic health conditions. In this respect, 3 of the 4 states represented (California, New York, and Texas) are CMS Innovation Model partner states and are presently awardees of Medicaid Incentives for the Prevention of Chronic Disease state grants.[20] It remains to be seen whether such programs can reduce the high prevalence of readmissions in a Medicaid population.
Although our findings may have implications in reducing readmission risk, these results need to be interpreted in the light of study limitations. Our study was based on beneficiaries from only 4 states and cannot be generalized to the entire US Medicaid population. We also excluded individuals who were not enrolled in Medicaid health maintenance organizations. Given that less than one‐third of the population receives fee‐for‐service care in Medicaid, our study may have selection bias. Our study design utilized a retrospective cohort approach and cannot be used to establish causal relationships. Further, our study did not include adjustment for variables related to discharge planning or care coordination other than a primary care visit 14 days post discharge, which might influence the readmission risk of complex patients. Our study utilized data from administrative claims files.
Overall, our analyses revealed that patient complexities increased the risk of all‐cause 30‐day readmission for high‐risk Medicaid beneficiaries with chronic conditions, thus warranting the need for comprehensive care for those with chronic conditions. Programs designed to reduce the risk of 30‐day readmissions may need to focus on appropriate disease management and better coordinated care post hospitalization.
Disclosures
Research reported in this publication was supported by the Training Program in the Behavioral and Biomedical Sciences at West Virginia University, National Institute of General Medical Sciences grant number T32 GM08174, and the National Institute of General Medical Sciences of the National Institutes of Health under award number U54GM104942, and the Benedum Foundation. The content is solely the responsibility of the author and does not necessarily represent the official views of the National Institutes of Health. The funders had no role in study design, data collection and analyses, decision to publish, or preparation of the manuscript.
Hospital readmissions that occur within 30 days of discharge are an important measure for assessing performance of the healthcare system and the quality of patient care.[1, 2] According to the Healthcare Cost and Utilization Project (HCUP), there were approximately 3.3 million adults with all‐cause 30‐day readmissions in the United States in 2011, incurring nearly $41.3 billion in hospital costs.[3] Reducing 30‐day readmissions has become a priority for payers, providers, and policymakers seeking to achieve improved quality of care at lower costs.
The implementation of the Affordable Care Act (ACA) provided the Centers for Medicare & Medicaid Services (CMS) statutory authority under the Hospital Readmissions Reduction Program to reduce payments for certain hospital readmissions that it deemed avoidable.[4] Although initial focus was on Medicare readmissions related to heart failure, myocardial infarction, and pneumonia, CMS is now considering expanding the list beyond the 3 conditions covered by the program.[4, 5] Therefore, it is important to understand major risk factors for readmissions in beneficiaries with chronic conditions.
Medicaid consists of the largest number of beneficiaries among all payers in the United States, with approximately 62 million beneficiaries in 2013.[5] The Medicaid population is further expected to increase with the coverage expansions under the ACA. In addition, the state Medicaid programs incur an estimated $374 billion in healthcare expenditures and provide healthcare services to the vulnerable, indigent, and disabled. It is estimated that 61% of adult Medicaid beneficiaries have chronic or disabling conditions that place them at an increased risk of hospitalization.[6] A series of HCUP statistical briefs reported several findings. First, Medicaid all‐cause readmission rates were comparable with Medicare but double the rate of private insurance.[7] Second, for readmissions following nonsurgical hospitalizations, 30‐day Medicaid readmission rates were higher than Medicare and private insurance for both acute and chronic conditions.[1] The effects of such costly utilization patterns, for this large and growing population necessitates heightened attention under healthcare reform.
The balance between hospital efficiency and quality of care is another crucial aspect for our healthcare system. However, length of stay (LOS), a proxy marker for efficiency, may conflict with hospital readmission rates, an indicator of quality. Further, CMS plans to bundle 30‐day readmission rates to reimbursement for the index hospitalization.[8]
The effect of LOS on readmission rates is complex, and previous studies have provided conflicting data regarding the relationship between LOS and subsequent readmission risk. Some indicate that shorter LOS is associated with a higher risk of readmission,[8, 9] whereas others suggest that extended LOS is associated with a higher risk of readmission.[10, 11, 12] However, most research on readmissions has focused on Medicare beneficiaries.[11, 13, 14] The readmission patterns of Medicaid beneficiaries differ from those of the geriatric Medicare beneficiaries, from a clinical and socioeconomic perspective. Considering the importance of 30‐day readmission for payers and policy makers, there is a need to understand the role of LOS and implications for treatment and management strategies.
Our study examined the association between index hospitalization characteristics (LOS and reason for admission) and all‐cause 30‐day readmission risk in fee‐for‐service high‐risk Medicaid beneficiaries. The study is limited to patients with selected chronic conditions and examines the differentiating factors within this high‐risk population. For the purpose of our study, variables were selected based on a priori knowledge and Andersen's behavioral model of health service utilization. This model suggests that potential health service use is determined by interactions among predisposing (demographics, index hospitalization characteristics), enabling (county level [eg, socioeconomic status]), and need (health status) characteristics of individuals and also the healthcare systems in the communities where they reside.[15]
METHODS
Study Design
A retrospective cohort approach was used with baseline and follow‐up periods. The baseline period was defined as the admission date of the index hospitalization (first observed hospitalization) between January 1, 2007 and December 31, 2007. Patients were followed for 180 days after discharge date of the associated index hospitalization.
Data Source
Medicaid administrative claims files from California, Illinois, New York, and Texas, between 2006 and 2008, were used. The personal summary file included information on demographics, Medicaid enrollment, and eligibility status. Outpatient and Inpatient files included claims for services provided in ambulatory and inpatient settings and contained International Classification of Diseases, 9th Revision, Clinical Modification codes. Information on county‐level characteristics were obtained from the 2009 Area Health Resource File (AHRF), which was linked to Medicaid administrative claims files using state and county codes where each beneficiary resided.
Study Population
The study population consisted of nonelderly (2164 years old) fee‐for‐service Medicaid‐only beneficiaries with selected chronic conditions and continuous enrollment during baseline and follow‐up period (Figure 1). Analyses were restricted to those who had at least 1 inpatient admission in 2007 and were conducted at the person‐level.
For the purpose of this study, Medicaid beneficiaries with 19 chronic conditions were selected: asthma, arthritis, cardiac arrhythmias, coronary artery disease, cancer, congestive heart failure, chronic kidney disease, chronic obstructive pulmonary disease, dementia, diabetes, hypertension, hyperlipidemia, hepatitis, human immunodeficiency virus osteoporosis, stroke, depression, schizophrenia, and substance use disorders. These conditions were identified based on the strategic framework developed and adopted by the Department of Health and Human Services for research, policy, program, and practice.[16]
Dependent Variable
Individuals were categorized into 2 groups, those with and without all‐cause 30‐day readmission. All‐cause 30‐day readmission was identified as subsequent hospitalization within 30 days of discharge date of the index hospitalization.
Key Independent Variables
These were index hospitalization characteristics, where LOS was the primary independent variable, reason for admission was the secondary independent variable, and month of index hospitalization (included to control for potential seasonal effect).
Other Independent Variables
Patient‐level characteristics included demographics (age, gender, and race/ethnicity) and Medicaid eligibility status (cash and medical need). Primary care access included continuity of care measured using a previously published continuity index (Modified Modified Continuity Index) and coordination of care, measured as primary care visit within 14 days of discharge date. Healthcare utilization was measured as an emergency room visit within 6 months prior to the index hospitalization.
Variables accounting for county socioeconomic status included educational attainment, per capita income, employment rate, poverty level, and metropolitan statistical area. Variables related to availability of providers and healthcare facilities were AHRF designations for primary/mental healthcare shortage areas, presence of federally qualified health centers, rural health centers, and community mental health centers. Hospital and primary care provider density was defined as total number of hospitals or primary care providers per 100,000 individuals, respectively.
Statistical Techniques
2 tests of independence were used for categorical variables and t tests for continuous variables to determine group differences in patient‐level and county‐level characteristics and all‐cause 30‐day readmission. Multilevel logistic regression models, which accounted for beneficiaries nested within counties, were used to examine the association between all‐cause 30‐day readmission and index hospitalization characteristics. The reference group for the dependent variable was no 30‐day readmission. Model 1 controlled for only patient‐level characteristics. Model 2 controlled for both patient‐level and county‐level characteristics. In both models, county was specified as a random intercept using the GLIMMIX procedure. All analyses were conducted using SAS version 9.3 (SAS Inc., Cary, NC).
RESULTS
After the exclusion criteria, there were 15,806 Medicaid beneficiaries with selected chronic conditions and at least 1 inpatient encounter in 2007. Overall, 16.7% experienced all‐cause 30‐day readmissions. A description of the study population and unadjusted associations between independent variables and all‐cause 30‐day readmission are presented in Table 1.
| Variables | 30‐Day Readmission, 2,633 (16.7%) | No 30‐Day Readmission, 13,173 (83.3%) | Significance |
|---|---|---|---|
| |||
| Demographic and Medicaid eligibility characteristics | |||
| Gender, N (%) | * | ||
| Female | 1,715 (65.1%) | 9,274 (70.4%) | |
| Male | 918 (34.9%) | 3,899 (29.6%) | |
| Age group, N (%) | * | ||
| 2124 years | 301 (11.4%) | 1,675 (12.7%) | |
| 2534 years | 567 (21.5%) | 3,578 (27.2%) | |
| 3544 years | 517 (19.6%) | 2,498 (19.0%) | |
| 4554 years | 673 (25.6%) | 2,971 (22.6%) | |
| 5564 years | 575 (21.8%) | 2,451 (18.6%) | |
| Race/ethnicity, N (%) | * | ||
| Caucasian | 847 (32.2%) | 3,831 (29.1%) | |
| African American | 988 (37.5%) | 4,270(32.4%) | |
| Hispanic | 608 (23.1%) | 4,245 (32.2%) | |
| Asian/AI/PI | 39 (1.5%) | 169 (1.3%) | |
| Other | 151 (5.7%) | 658 (5.0%) | |
| Cash eligibility, N (%) | 1,529 (58.1%) | 6,666 (50.6%) | * |
| Medical need eligibility, N (%) | 876 (33.3%) | 3769 (28.6%) | * |
| Index hospitalization characteristics | |||
| Length of stay, mean [SD] | 6.62 [9.09] | 4.29 [6.35] | * |
| Chronic conditions at admission, N (%) | |||
| Arthritis/osteoporosis | 99 (3.8%) | 464 (3.5%) | |
| Cancer | 134 (5.1%) | 429 (3.3%) | * |
| Cardiovascular conditions | 995 (37.8%) | 3,733 (28.3%) | * |
| COPD/asthma | 541 (20.5%) | 2,197 (16.7%) | * |
| Diabetes | 575 (21.8%) | 2,103 (16.0%) | * |
| HIV/hepatitis | 305 (11.6%) | 1,185 (9.0%) | * |
| Mental health conditions | 1,491 (56.6%) | 4,352 (33.0%) | * |
| Season of readmission, N (%) | * | ||
| Spring | 730 (27.7%) | 3,944 (29.9%) | |
| Summer | 401 (15.2%) | 2,332 (17.7%) | |
| Fall | 211 (8.0%) | 1,605 (12.2%) | |
| Winter | 1,291 (49.0%) | 5,292 (40.2%) | |
| Primary care access, N (%) | |||
| Coordination of primary care | 326 (12.4%) | 1,747 (13.3%) | |
| Continuity of primary care, N (%) | |||
| Complete care continuity | 349 (13.3%) | 1,764 (13.4%) | |
| Some care continuity | 634 (24.1%) | 2,960 (22.5%) | |
| No care continuity | 1650 (62.7%) | 8,449 (64.1%) | |
| Healthcare utilization, N (%) | |||
| Emergency room visit | 893 (33.9%) | 4,449 (33.8%) | |
| County‐level characteristics | |||
| Metropolitan status, N (%) | |||
| Nonmetro | 267 (10.1%) | 1,285 (9.8%) | |
| Metro | 2,366 (89.9%) | 11,888 (90.2%) | |
| Primary care shortage area, N (%) | |||
| Whole county | 2,034 (77.3%) | 10,147 (77.0%) | |
| Part county | 429 (16.3%) | 2,312 (17.6%) | |
| No shortage | 170 (6.5%) | 714 (5.4%) | |
| Mental healthcare shortage area, N (%) | |||
| Whole county | 2,015 (76.5%) | 9,925 (75.3%) | |
| Part county | 388 (14.7%) | 2,242 (17.0%) | |
| No shortage | 230 (8.7%) | 1,006 (7.6%) | |
| CMHC, mean [SD] | 0.81 [1.23] | 0.94 [1.24] | * |
| Rural health center, mean [SD] | 0.62 [3.03] | 1.06 [4.41] | * |
| FQHC, mean [SD] | 37.69 [44.31] | 37.78 [42.98] | |
| Education rate, 4+ years, mean [SD] | 25.39 [10.98] | 23.77 [10.51] | * |
| Unemployment rate, mean [SD] | 4.57 [0.71] | 4.67 [0.90] | * |
| % Below poverty level, mean [SD] | 15.11 [3.73] | 15.06 [3.80] | |
| Per capita income (US dollars), mean [SD] | 58,761.96 [33,697.42] | 54,029.16 [31,265.86] | * |
| Nonfederal PCP density, mean [SD] | 307.10 [192.29] | 279.97 [179.22] | * |
| Hospital density, mean [SD] | 1.74 [1.37] | 1.65 [1.14] | * |
Multilevel logistic regressions of all‐cause 30‐day readmissions are summarized in Table 2. Beneficiaries with longer LOS had significantly higher odds of 30‐day readmission. In addition, presence of cancer, cardiovascular conditions, diabetes, and mental health conditions at index hospitalization significantly increased the odds of readmission. In addition, beneficiaries with cash or medical need eligibility had significantly higher odds of 30‐day readmission.
| AOR | 95% CI | Significance | |
|---|---|---|---|
| |||
| Length of stay | 1.03 | [1.031.04] | * |
| Chronic conditions at admission | |||
| Arthritis/osteoporosis | 0.90 | [0.721.13] | |
| Cancer | 1.55 | [1.261.90] | * |
| Cardiovascular conditions | 1.20 | [1.081.33] | * |
| COPD/asthma | 1.01 | [0.901.12] | |
| Diabetes | 1.23 | [1.101.39] | * |
| HIV/hepatitis | 0.98 | [0.851.12] | |
| Mental health conditions | 2.17 | [1.982.38] | * |
| Season of readmission | |||
| Spring | 0.79 | [0.710.88] | * |
| Summer | 0.77 | [0.680.88] | * |
| Fall | 0.58 | [0.490.68] | * |
| Winter | Reference | ||
| Cash eligibility | 1.14 | [1.011.27] | |
| Medical need eligibility | 1.21 | [1.081.36] | |
DISCUSSION
To the best of our knowledge, this is the first study examining patient‐level and county‐level characteristics associated with all‐cause 30‐day readmission in Medicaid beneficiaries with chronic conditions. In addition, our findings add to the nascent literature on readmissions among Medicaid beneficiaries, with findings discussed below.
LOS has been reported as a risk factor for readmission both in elderly and nonelderly populations.[11] Our findings indicate that longer LOS is associated with increased odds of 30‐day readmission, which could be attributed to severity of illness at index hospitalization.[10] This finding could be related to unmeasured clinical severity (our models account for some comorbidities) and socioeconomic issues (as noted in the introduction). This may have implications for discharge planning efforts and focusing on chronic disease management, which has previously shown to be effective in reducing readmissions.[17] Our findings suggest 30‐day readmissions can be predicted using variables that are readily available, few in number, and simple to incorporate in discharge planning. Comprehensive discharge planning which takes into account chronic conditions and index hospitalization characteristics may help organize postdischarge services, including coordination of care with physicians, medication reconciliation, follow‐up care, and appropriate self‐management for chronic conditions.
Our findings of increased risk of 30‐day hospital readmissions as well as longer LOS among Medicaid beneficiaries with cancer, cardiovascular conditions, diabetes, and mental health conditions at index hospitalization suggests that patient complexity/poor health status increases the risk of readmission. A more focused approach in treatment of these diseases can help reduce readmissions. Integrated care management interventions after hospital discharge have been shown to reduce readmissions among those with heart disease; a coordinated care team including cardiologists, specialized nurses, and primary care physicians, and provision of integrated care following hospitalizations have shown benefit.[18, 19] Emerging models of delivery such as accountable care organizations and patient‐centered medical homes, which offer comprehensive, well‐coordinated primary care services, may be needed to reduce readmission among Medicaid beneficiaries with chronic health conditions. In this respect, 3 of the 4 states represented (California, New York, and Texas) are CMS Innovation Model partner states and are presently awardees of Medicaid Incentives for the Prevention of Chronic Disease state grants.[20] It remains to be seen whether such programs can reduce the high prevalence of readmissions in a Medicaid population.
Although our findings may have implications in reducing readmission risk, these results need to be interpreted in the light of study limitations. Our study was based on beneficiaries from only 4 states and cannot be generalized to the entire US Medicaid population. We also excluded individuals who were not enrolled in Medicaid health maintenance organizations. Given that less than one‐third of the population receives fee‐for‐service care in Medicaid, our study may have selection bias. Our study design utilized a retrospective cohort approach and cannot be used to establish causal relationships. Further, our study did not include adjustment for variables related to discharge planning or care coordination other than a primary care visit 14 days post discharge, which might influence the readmission risk of complex patients. Our study utilized data from administrative claims files.
Overall, our analyses revealed that patient complexities increased the risk of all‐cause 30‐day readmission for high‐risk Medicaid beneficiaries with chronic conditions, thus warranting the need for comprehensive care for those with chronic conditions. Programs designed to reduce the risk of 30‐day readmissions may need to focus on appropriate disease management and better coordinated care post hospitalization.
Disclosures
Research reported in this publication was supported by the Training Program in the Behavioral and Biomedical Sciences at West Virginia University, National Institute of General Medical Sciences grant number T32 GM08174, and the National Institute of General Medical Sciences of the National Institutes of Health under award number U54GM104942, and the Benedum Foundation. The content is solely the responsibility of the author and does not necessarily represent the official views of the National Institutes of Health. The funders had no role in study design, data collection and analyses, decision to publish, or preparation of the manuscript.

Ordering Patterns in Shift‐Based Care
Duty‐hour restrictions were implemented by the Accreditation Council for Graduate Medical Education (ACGME) in 2003 in response to data showing that sleep deprivation was correlated with serious medical errors.[1] In 2011, the ACGME required more explicit restrictions in the number of hours worked and the maximal shift length.[2] These requirements have necessitated a transition from a traditional q4 call model for interns to one in which shifts are limited to a maximum of 16 hours.
Studies of interns working these shorter shifts have had varied results, and comprehensive reviews have failed to demonstrate consistent improvements.[3, 4, 5] Studies of shift‐length limitation initially suggested improvements in patient safety (decreased length of stay,[6, 7] cost of hospitalization,[6] medication errors,[7] serious medical errors,[8] and intensive care unit [ICU] admissions[9]) and resident quality of life.[10] However, other recent studies have reported an increased number of self‐reported medical errors[11] and either did not detect change[12] or reported perceived decreases[13] in quality of care and continuity of care.
We previously reported decreased length of stay and decreased cost of hospitalization in pediatric inpatients cared for in a day/night‐shiftbased care model.[6] An hypothesized reason for those care improvements is the restructured care model led to increased active clinical management during both day and night hours. Here we report the findings of a retrospective analysis to investigate this hypothesis.
PATIENTS AND METHODS
Study Population
We reviewed the charts of pediatric patients admitted to University of California, San Francisco Benioff Children's Hospital, a 175‐bed tertiary care facility, over a 2‐year period between September 15, 2007 and September 15, 2008 (preintervention) and September 16, 2008 and September 16, 2009 (postintervention). During this study period, our hospital was still dependent on paper orders. Admission order sets were preprinted paper forms that were unchanged for the study period. Using International Classification of Diseases, 9th Revision coding, we identified patients on the general pediatrics service with 1 of 6 common diagnosesdehydration, community‐acquired pneumonia, aspiration pneumonia, upper respiratory infection, asthma, and bronchiolitis. These diagnoses were chosen because it was hypothesized that their length of inpatient stay could be impacted by active clinical management. We excluded patients admitted to the ICU or transferred between services.
A list of medical record numbers (MRNs) corresponding to admissions for 1 of the 6 above diagnoses during the pre‐ and postintervention periods was compiled. MRNs were randomized and then sequentially reviewed until 50 admissions in each time period were obtained. After data collection was completed, we noted that 2 patients had been in the ICU for part of their hospitalization, and these were excluded, leaving 48 admissions from prior to the intervention and 50 admissions from after intervention who were examined.
Intervention
During the preintervention period, patients were cared for by interns who took call every sixth night (duty periods up to 30 hours), with cross‐coverage of patients on multiple teams. Cross‐coverage was defined as coverage of patients cared for during nonconsecutive shifts and for whom residents did not participate in attending rounds. Noncall shifts were typically 10 to 11 hours. They were supervised by senior residents who took call every fourth or fifth night and who provided similar cross‐coverage.
During the postintervention period, interns worked day and night shifts of 13 hours (1 hour overlap time between shifts for handoffs), with increased night staffing to eliminate intern‐level cross‐coverage of multiple teams and maintain interns as the primary providers. Interns covered the same team for 5 to 7 consecutive days on either the day or night shifts. Interns remained on the same teams when they switched from day shifts to night shifts to preserve continuity. There were some 24‐hour shifts for senior residents on weekends. Senior residents maintained supervisory responsibility for all patients (both hospitalist teams and a subspecialty team). They also worked 7 consecutive nights.
There were changes in the staffing ratios associated with the change to day and night teams (Table 1, Figure 1). In the preintervention period, general pediatrics patients were covered by a single hospitalist and cohorted on a single team (team A), which also covered several groups of subspecialty patients with subspecialty attendings. The team consisted of 2 interns and 1 senior resident, who shared extended (30‐hour) call in a cycle with 2 other inpatient teams. In the postintervention period, general pediatrics patients were split between 2 teams (teams D and E) and mixed with subspecialty patients. Hospitalist continued to be the attendings, and these hospitalists also covered specialty patients with subspecialists in consulting roles. The teams consisted of 3 interns on the day shift, and 1 on the night shift. There was 1 senior resident per team on day shift, and a single senior resident covering all teams at night.
| Preintervention | Postintervention | |||||
|---|---|---|---|---|---|---|
| ||||||
| General Pediatrics | Team A | Team B | Team C | Team D | Team E | Team F |
| Patient Distribution | General Pediatrics | GI/Liver | Renal | General Pediatrics | General Pediatrics | Liver |
| Pulmonary | Neurology | Rheumatology | Mixed Specialty | Mixed Specialty | Renal | |
| Adolescent | Endocrine | |||||
| Team membersa | 2 interns (q6 call) | 4 interns (3 on day shift/1 on night shift) | ||||
| 1 senior resident (q5 call) | 1 senior resident | |||||
| Night‐shift coveragea | 1 intern and 1 senior resident together covered all 3 teams. | 1 night intern per team (teams D/E) working 7 consecutive night shifts | ||||
| 1 supervising night resident covering all 3 teams | ||||||
| Intern cross‐coverage of other teams | Nights/clinic afternoons | None | ||||
| Length of night shift | 30 hours | 13 hours | ||||

There was no change in the paper‐order system, the electronic health record, timing of the morning blood draw, use of new facilities for patient care, or protocol for emergency department admission. Concomitant with the restructuring, most subspecialty patients were consolidated onto the hospitalist service, necessitating creation of a second hospitalist team. However, patients admitted with the diagnoses identified above would have been on the hospitalist service before and after the restructuring.
Data Collection/Analysis
We reviewed specific classes of orders and categorized by type: respiratory medication, oxygen, intravenous (IV) fluids, diet, monitoring, and activity, time of day (day vs night‐shift), and whether they were an escalation or de‐escalation of care. De‐escalation of care was defined as orders that decreased patient care such as weaning a patient off nebulized albuterol or decreasing their IV fluids. Orders between 07:00 to 18:00 were considered day‐shift orders and between 18:01 and 06:59 were classified as night‐shift orders. Only orders falling into 1 of the aforementioned categories were recorded. Admission order sets were not included. Initially, charts were reviewed by both investigators together; after comparing results for 10 charts to ensure consistency of methodology and criteria, the remaining charts were reviewed by 1 of the study investigators.
To compare demographics, diagnoses, and ordering patterns, t tests and 2 (SAS version 9.2 [SAS Institute, Cary, NC], Stata version 13.1 [StataCorp, College Station, TX]) were used. Multivariate gamma models (SAS version 9.2 [SAS Institute]) that adjusted for clustering at the attending level and patient age were used to compare severity of illness before and after the intervention. This study was approved by the University of California, San Francisco Committee on Human Research.
RESULTS
We analyzed data for 48 admissions preintervention and 50 postintervention. With the exception of insurance type, there was no difference in baseline demographics, diagnoses, or severity of illness between the groups (Table 2). Within the order classes above, we identified 212 orders preintervention and 231 orders postintervention.
| Preintervention,n = 48, N (%) | Postintervention, n = 50, N (%) | P Value | |
|---|---|---|---|
| |||
| Age, y, mean (SD) | 4.8 (4.6) | 5.5 (4.7) | 0.4474 |
| Race/ethnicity | 0.1953 | ||
| NH white | 12 (25.0%) | 9 (18.0%) | |
| NH black | 11 (22.9%) | 7 (14.0%) | |
| Hispanic | 16 (33.3%) | 13 (26.0%) | |
| Asian | 6 (12.5%) | 10 (20.0%) | |
| Other | 3 (6.3%) | 10 (20.0%) | |
| Missing | 0 | 1 (2.0%) | |
| Gender | 0.6577 | ||
| Female | 19 (39.6%) | 22 (44.0%) | |
| Male | 29 (60.4%) | 28 (56.0%) | |
| Primary language | 0.2601 | ||
| English | 38 (79.2%) | 45 (90.0%) | |
| Spanish | 9 (18.8%) | 5 (10.0%) | |
| Other | 1 (2.1%) | 0 | |
| Insurance | 0.0118 | ||
| Private | 13 (27.1%) | 26 (52.0%) | |
| Medical | 35 (72.9%) | 24 (48.0%) | |
| Other | 0 | 0 | |
| Admit source | 0.6581 | ||
| Referral | 20 (41.7%) | 18 (36.0%) | |
| ED | 26 (54.2%) | 31 (62.0%) | |
| Transfer | 2 (4.2%) | 1 (2.0%) | |
| Severity of illness | 0.1926 | ||
| Minor | 15 (31.3%) | 24 (48.0%) | |
| Moderate | 23 (47.9%) | 16 (32.0%) | |
| Severe | 10 (20.8%) | 10 (20.0%) | |
| Extreme | 0 | 0 | |
| Diagnoses | 0.562 | ||
| Asthma | 21 | 19 | |
| Bronchiolitis | 2 | 4 | |
| Pneumonia | 17 | 19 | |
| Dehydration | 6 | 7 | |
| URI | 0 | 1 | |
| Aspiration pneumonia | 2 | 0 | |
After the intervention, there was a statistically significant increase in the average number of orders written within the first 12 hours (pre: 0.58 orders vs post: 1.12, P = 0.009) and 24 hours (pre: 1.52 vs post: 2.38, P = 0.004) following admission (Table 3), not including the admission order set. The fraction of orders written at night was not significantly different (27% at night preintervention, 33% postintervention, P = 0.149). The fraction of admissions on the day shift compared to the night shift did not change (P = 0.72). There was no difference in the ratio of de‐escalation to escalation orders written during the night (Table 2).
| Preintervention, 48 Admissions | Postintervention, 50 Admissions | P Value | |
|---|---|---|---|
| |||
| Total no. of orders | 212 | 231 | |
| Mean no. of orders per admission | 4.42 | 4.62 | |
| Day shift orders, n (%) | 155 (73) | 155 (67) | 0.149 |
| Night shift orders, n (%) | 57 (27) | 76 (33) | |
| Mean no. of orders within first 12 hours* | 0.58 | 1.12 | 0.009 |
| Mean no. of orders within first 24 hours* | 1.52 | 2.38 | 0.004 |
| Night shift escalation orders (%) | 27 (47) | 33 (43) | 0.491 |
| Night shift de‐escalation orders (%) | 30 (53) | 43 (57) | |
DISCUSSION
In this study, we demonstrate increased patient care management early in the hospitalization, measured in this study by the mean number of orders written per patient in the first 12 and 24 hours after admission, after transition from a call schedule with extended (>16 hours) shifts to one with shorter shifts compliant with current ACGME duty‐hour restrictions and an explicit focus on greater continuity of care. We did not detect a change in the proportion of total orders written on the night shift compared to the day shift. Earlier active medical management, such as weaning nebulized albuterol or supplemental oxygen, can speed the time to discharge.[14]
Our failure to detect a significant change in the proportion or type of orders written at night may have been due to our small sample size. Anecdotally, after the intervention, medical students reported to us that they noticed a difference between our service, in which we expect night teams to advance care, and other services at our institution, in which nights are a time to focus on putting out fires. This was not something that had been reported to us prior. It is likely reflective of the overall approach to patient care taken by residents working a night shift as part of a longitudinal care team.
This study builds on previous findings that demonstrated lower costs and shorter length of stay after implementing a schedule based on day and night teams.[7] The reasons for such improvements are likely multifactorial. In our model, which was purposefully designed to create night‐team continuity and minimize cross‐coverage, it is likely that residents also felt a greater sense of responsibility for and familiarity with the patients[15] and therefore felt more comfortable advancing care. Not only were interns likely better rested, the patient‐to‐provider ratio was also lower than in the preintervention model. Increases in staffing are often necessary to eliminate cross‐coverage while maintaining safe, 24‐hour care. These findings suggest that increases in cost from additional staffing may be at least partially offset by more active patient management early in the hospitalization, which has the potential to lead to shorter hospital stays.
There are several limitations to our research. We studied a small sample, including a subset of general pediatrics diagnoses that are amenable to active management, limiting generalizability. We did not calculate a physician‐to‐patient ratio because this was not possible with the retrospective data we collected. Staffing ratios likely improved, and we consider that part of the overall improvements in staffing that may have contributed to the observed changes in ordering patterns. Although intern‐level cross‐coverage was eliminated, the senior resident continued to cover multiple teams overnight. This senior covered the same 3 teams for 7 consecutive nights. The addition of a hospitalist team, with subspecialists being placed in consultant roles, may have contributed to the increase in active management, though our study population did not include subspecialty patients. There was a difference in insurance status between the 2 groups. This was unlikely to affect resident physician practices as insurance information is not routinely discussed in the course of patient care. In the context of the ongoing debate about duty‐hour restrictions, it will be important for future studies to elucidate whether sleep or other variables are the primary contributors to this finding. Our data are derived solely from 1 inpatient service at a single academic medical center; however, we do feel there are lessons that may be applied to other settings.
CONCLUSION
A coverage system with improved nighttime resident coverage was associated with a greater number of orders written early in the hospitalization, suggesting more active management of clinical problems to advance care.
Acknowledgements
The authors thank Dr. I. Elaine Allen, John Kornak, and Dr. Derek Pappas for assistance with biostatistics, and Dr. Diana Bojorquez and Dr. Derek Pappas for assistance with review of the manuscript and creation of the figures.
Disclosures: None of the authors have financial relationships or other conflicts of interest to disclose. No external funding was secured for this study. Dr. Auerbach was supported by grant K24HL098372 during the course of this study. This project was supported by the National Center for Advancing Translational Sciences, National Institutes of Health (NIH), through University of California San FranciscoClinical and Translational Sciences Institute grant UL1 TR000004. Its contents are solely the responsibility of the authors and do not necessarily represent the official views of the NIH. Dr. Rosenbluth had access to all of the data in the study and takes responsibility for the integrity of the data and the accuracy of the data analysis.
- , , . New requirements for resident duty hours. JAMA. 2002;288(9):1112–1114.
- Accreditation Council for Graduate Medical Education. Common program requirements. 2011. Available at: http://www.acgme.org/acgmeweb/Portals/0/PDFs/Common_Program_Requirements_07012011[2].pdf. Accessed November 28, 2011.
- , , . Patient safety, resident education and resident well‐being following implementation of the 2003 ACGME duty hour rules. J Gen Intern Med. 2011;26(8):907–919.
- , , , et al. A systematic review of the effects of resident duty hour restrictions in surgery: impact on resident wellness, training, and patient outcomes. Ann Surg. 2014;259(6):1041–1053.
- , , , . Duty‐hour limits and patient care and resident outcomes: can high‐quality studies offer insight into complex relationships? Annu Rev Med. 2013;64:467–483.
- , , , , , . Association between adaptations to ACGME duty hour requirements, length of stay, and costs. Sleep. 2013;36(2):245–248.
- , , , . Effect of a change in house staff work schedule on resource utilization and patient care. Arch Intern Med. 1991;151(10):2065–2070.
- , , , et al. Effect of reducing interns' work hours on serious medical errors in intensive care units. N Engl J Med. 2004;351(18):1838–1848.
- , , , . Changes in outcomes for internal medicine inpatients after work‐hour regulations. Ann Intern Med. 2007;147(2):97–103.
- , , . Effects of reducing or eliminating resident work shifts over 16 hours: a systematic review. Sleep. 2010;33(8):1043–1053.
- , , , et al. Effects of the 2011 duty hour reforms on interns and their patients: a prospective longitudinal cohort study. JAMA Intern Med. 2013;173(8):657–662; discussion 663.
- , , , , . Effect of 16‐hour duty periods on patient care and resident education. Mayo Clin Proc. 2011;86(3):192–196.
- , , , et al. Effect of the 2011 vs 2003 duty hour regulation‐compliant models on sleep duration, trainee education, and continuity of patient care among internal medicine house staff: a randomized trial. JAMA Intern Med. 2013;173(8):649–655.
- , , , . Effectiveness of a clinical pathway for inpatient asthma management. Pediatrics. 2000;106(5):1006–1012.
- , , , . Resident perceptions of autonomy in a complex tertiary care environment improve when supervised by hospitalists. Hosp Pediatr. 2012;2(4):228–234.
Duty‐hour restrictions were implemented by the Accreditation Council for Graduate Medical Education (ACGME) in 2003 in response to data showing that sleep deprivation was correlated with serious medical errors.[1] In 2011, the ACGME required more explicit restrictions in the number of hours worked and the maximal shift length.[2] These requirements have necessitated a transition from a traditional q4 call model for interns to one in which shifts are limited to a maximum of 16 hours.
Studies of interns working these shorter shifts have had varied results, and comprehensive reviews have failed to demonstrate consistent improvements.[3, 4, 5] Studies of shift‐length limitation initially suggested improvements in patient safety (decreased length of stay,[6, 7] cost of hospitalization,[6] medication errors,[7] serious medical errors,[8] and intensive care unit [ICU] admissions[9]) and resident quality of life.[10] However, other recent studies have reported an increased number of self‐reported medical errors[11] and either did not detect change[12] or reported perceived decreases[13] in quality of care and continuity of care.
We previously reported decreased length of stay and decreased cost of hospitalization in pediatric inpatients cared for in a day/night‐shiftbased care model.[6] An hypothesized reason for those care improvements is the restructured care model led to increased active clinical management during both day and night hours. Here we report the findings of a retrospective analysis to investigate this hypothesis.
PATIENTS AND METHODS
Study Population
We reviewed the charts of pediatric patients admitted to University of California, San Francisco Benioff Children's Hospital, a 175‐bed tertiary care facility, over a 2‐year period between September 15, 2007 and September 15, 2008 (preintervention) and September 16, 2008 and September 16, 2009 (postintervention). During this study period, our hospital was still dependent on paper orders. Admission order sets were preprinted paper forms that were unchanged for the study period. Using International Classification of Diseases, 9th Revision coding, we identified patients on the general pediatrics service with 1 of 6 common diagnosesdehydration, community‐acquired pneumonia, aspiration pneumonia, upper respiratory infection, asthma, and bronchiolitis. These diagnoses were chosen because it was hypothesized that their length of inpatient stay could be impacted by active clinical management. We excluded patients admitted to the ICU or transferred between services.
A list of medical record numbers (MRNs) corresponding to admissions for 1 of the 6 above diagnoses during the pre‐ and postintervention periods was compiled. MRNs were randomized and then sequentially reviewed until 50 admissions in each time period were obtained. After data collection was completed, we noted that 2 patients had been in the ICU for part of their hospitalization, and these were excluded, leaving 48 admissions from prior to the intervention and 50 admissions from after intervention who were examined.
Intervention
During the preintervention period, patients were cared for by interns who took call every sixth night (duty periods up to 30 hours), with cross‐coverage of patients on multiple teams. Cross‐coverage was defined as coverage of patients cared for during nonconsecutive shifts and for whom residents did not participate in attending rounds. Noncall shifts were typically 10 to 11 hours. They were supervised by senior residents who took call every fourth or fifth night and who provided similar cross‐coverage.
During the postintervention period, interns worked day and night shifts of 13 hours (1 hour overlap time between shifts for handoffs), with increased night staffing to eliminate intern‐level cross‐coverage of multiple teams and maintain interns as the primary providers. Interns covered the same team for 5 to 7 consecutive days on either the day or night shifts. Interns remained on the same teams when they switched from day shifts to night shifts to preserve continuity. There were some 24‐hour shifts for senior residents on weekends. Senior residents maintained supervisory responsibility for all patients (both hospitalist teams and a subspecialty team). They also worked 7 consecutive nights.
There were changes in the staffing ratios associated with the change to day and night teams (Table 1, Figure 1). In the preintervention period, general pediatrics patients were covered by a single hospitalist and cohorted on a single team (team A), which also covered several groups of subspecialty patients with subspecialty attendings. The team consisted of 2 interns and 1 senior resident, who shared extended (30‐hour) call in a cycle with 2 other inpatient teams. In the postintervention period, general pediatrics patients were split between 2 teams (teams D and E) and mixed with subspecialty patients. Hospitalist continued to be the attendings, and these hospitalists also covered specialty patients with subspecialists in consulting roles. The teams consisted of 3 interns on the day shift, and 1 on the night shift. There was 1 senior resident per team on day shift, and a single senior resident covering all teams at night.
| Preintervention | Postintervention | |||||
|---|---|---|---|---|---|---|
| ||||||
| General Pediatrics | Team A | Team B | Team C | Team D | Team E | Team F |
| Patient Distribution | General Pediatrics | GI/Liver | Renal | General Pediatrics | General Pediatrics | Liver |
| Pulmonary | Neurology | Rheumatology | Mixed Specialty | Mixed Specialty | Renal | |
| Adolescent | Endocrine | |||||
| Team membersa | 2 interns (q6 call) | 4 interns (3 on day shift/1 on night shift) | ||||
| 1 senior resident (q5 call) | 1 senior resident | |||||
| Night‐shift coveragea | 1 intern and 1 senior resident together covered all 3 teams. | 1 night intern per team (teams D/E) working 7 consecutive night shifts | ||||
| 1 supervising night resident covering all 3 teams | ||||||
| Intern cross‐coverage of other teams | Nights/clinic afternoons | None | ||||
| Length of night shift | 30 hours | 13 hours | ||||
There was no change in the paper‐order system, the electronic health record, timing of the morning blood draw, use of new facilities for patient care, or protocol for emergency department admission. Concomitant with the restructuring, most subspecialty patients were consolidated onto the hospitalist service, necessitating creation of a second hospitalist team. However, patients admitted with the diagnoses identified above would have been on the hospitalist service before and after the restructuring.
Data Collection/Analysis
We reviewed specific classes of orders and categorized by type: respiratory medication, oxygen, intravenous (IV) fluids, diet, monitoring, and activity, time of day (day vs night‐shift), and whether they were an escalation or de‐escalation of care. De‐escalation of care was defined as orders that decreased patient care such as weaning a patient off nebulized albuterol or decreasing their IV fluids. Orders between 07:00 to 18:00 were considered day‐shift orders and between 18:01 and 06:59 were classified as night‐shift orders. Only orders falling into 1 of the aforementioned categories were recorded. Admission order sets were not included. Initially, charts were reviewed by both investigators together; after comparing results for 10 charts to ensure consistency of methodology and criteria, the remaining charts were reviewed by 1 of the study investigators.
To compare demographics, diagnoses, and ordering patterns, t tests and 2 (SAS version 9.2 [SAS Institute, Cary, NC], Stata version 13.1 [StataCorp, College Station, TX]) were used. Multivariate gamma models (SAS version 9.2 [SAS Institute]) that adjusted for clustering at the attending level and patient age were used to compare severity of illness before and after the intervention. This study was approved by the University of California, San Francisco Committee on Human Research.
RESULTS
We analyzed data for 48 admissions preintervention and 50 postintervention. With the exception of insurance type, there was no difference in baseline demographics, diagnoses, or severity of illness between the groups (Table 2). Within the order classes above, we identified 212 orders preintervention and 231 orders postintervention.
| Preintervention,n = 48, N (%) | Postintervention, n = 50, N (%) | P Value | |
|---|---|---|---|
| |||
| Age, y, mean (SD) | 4.8 (4.6) | 5.5 (4.7) | 0.4474 |
| Race/ethnicity | 0.1953 | ||
| NH white | 12 (25.0%) | 9 (18.0%) | |
| NH black | 11 (22.9%) | 7 (14.0%) | |
| Hispanic | 16 (33.3%) | 13 (26.0%) | |
| Asian | 6 (12.5%) | 10 (20.0%) | |
| Other | 3 (6.3%) | 10 (20.0%) | |
| Missing | 0 | 1 (2.0%) | |
| Gender | 0.6577 | ||
| Female | 19 (39.6%) | 22 (44.0%) | |
| Male | 29 (60.4%) | 28 (56.0%) | |
| Primary language | 0.2601 | ||
| English | 38 (79.2%) | 45 (90.0%) | |
| Spanish | 9 (18.8%) | 5 (10.0%) | |
| Other | 1 (2.1%) | 0 | |
| Insurance | 0.0118 | ||
| Private | 13 (27.1%) | 26 (52.0%) | |
| Medical | 35 (72.9%) | 24 (48.0%) | |
| Other | 0 | 0 | |
| Admit source | 0.6581 | ||
| Referral | 20 (41.7%) | 18 (36.0%) | |
| ED | 26 (54.2%) | 31 (62.0%) | |
| Transfer | 2 (4.2%) | 1 (2.0%) | |
| Severity of illness | 0.1926 | ||
| Minor | 15 (31.3%) | 24 (48.0%) | |
| Moderate | 23 (47.9%) | 16 (32.0%) | |
| Severe | 10 (20.8%) | 10 (20.0%) | |
| Extreme | 0 | 0 | |
| Diagnoses | 0.562 | ||
| Asthma | 21 | 19 | |
| Bronchiolitis | 2 | 4 | |
| Pneumonia | 17 | 19 | |
| Dehydration | 6 | 7 | |
| URI | 0 | 1 | |
| Aspiration pneumonia | 2 | 0 | |
After the intervention, there was a statistically significant increase in the average number of orders written within the first 12 hours (pre: 0.58 orders vs post: 1.12, P = 0.009) and 24 hours (pre: 1.52 vs post: 2.38, P = 0.004) following admission (Table 3), not including the admission order set. The fraction of orders written at night was not significantly different (27% at night preintervention, 33% postintervention, P = 0.149). The fraction of admissions on the day shift compared to the night shift did not change (P = 0.72). There was no difference in the ratio of de‐escalation to escalation orders written during the night (Table 2).
| Preintervention, 48 Admissions | Postintervention, 50 Admissions | P Value | |
|---|---|---|---|
| |||
| Total no. of orders | 212 | 231 | |
| Mean no. of orders per admission | 4.42 | 4.62 | |
| Day shift orders, n (%) | 155 (73) | 155 (67) | 0.149 |
| Night shift orders, n (%) | 57 (27) | 76 (33) | |
| Mean no. of orders within first 12 hours* | 0.58 | 1.12 | 0.009 |
| Mean no. of orders within first 24 hours* | 1.52 | 2.38 | 0.004 |
| Night shift escalation orders (%) | 27 (47) | 33 (43) | 0.491 |
| Night shift de‐escalation orders (%) | 30 (53) | 43 (57) | |
DISCUSSION
In this study, we demonstrate increased patient care management early in the hospitalization, measured in this study by the mean number of orders written per patient in the first 12 and 24 hours after admission, after transition from a call schedule with extended (>16 hours) shifts to one with shorter shifts compliant with current ACGME duty‐hour restrictions and an explicit focus on greater continuity of care. We did not detect a change in the proportion of total orders written on the night shift compared to the day shift. Earlier active medical management, such as weaning nebulized albuterol or supplemental oxygen, can speed the time to discharge.[14]
Our failure to detect a significant change in the proportion or type of orders written at night may have been due to our small sample size. Anecdotally, after the intervention, medical students reported to us that they noticed a difference between our service, in which we expect night teams to advance care, and other services at our institution, in which nights are a time to focus on putting out fires. This was not something that had been reported to us prior. It is likely reflective of the overall approach to patient care taken by residents working a night shift as part of a longitudinal care team.
This study builds on previous findings that demonstrated lower costs and shorter length of stay after implementing a schedule based on day and night teams.[7] The reasons for such improvements are likely multifactorial. In our model, which was purposefully designed to create night‐team continuity and minimize cross‐coverage, it is likely that residents also felt a greater sense of responsibility for and familiarity with the patients[15] and therefore felt more comfortable advancing care. Not only were interns likely better rested, the patient‐to‐provider ratio was also lower than in the preintervention model. Increases in staffing are often necessary to eliminate cross‐coverage while maintaining safe, 24‐hour care. These findings suggest that increases in cost from additional staffing may be at least partially offset by more active patient management early in the hospitalization, which has the potential to lead to shorter hospital stays.
There are several limitations to our research. We studied a small sample, including a subset of general pediatrics diagnoses that are amenable to active management, limiting generalizability. We did not calculate a physician‐to‐patient ratio because this was not possible with the retrospective data we collected. Staffing ratios likely improved, and we consider that part of the overall improvements in staffing that may have contributed to the observed changes in ordering patterns. Although intern‐level cross‐coverage was eliminated, the senior resident continued to cover multiple teams overnight. This senior covered the same 3 teams for 7 consecutive nights. The addition of a hospitalist team, with subspecialists being placed in consultant roles, may have contributed to the increase in active management, though our study population did not include subspecialty patients. There was a difference in insurance status between the 2 groups. This was unlikely to affect resident physician practices as insurance information is not routinely discussed in the course of patient care. In the context of the ongoing debate about duty‐hour restrictions, it will be important for future studies to elucidate whether sleep or other variables are the primary contributors to this finding. Our data are derived solely from 1 inpatient service at a single academic medical center; however, we do feel there are lessons that may be applied to other settings.
CONCLUSION
A coverage system with improved nighttime resident coverage was associated with a greater number of orders written early in the hospitalization, suggesting more active management of clinical problems to advance care.
Acknowledgements
The authors thank Dr. I. Elaine Allen, John Kornak, and Dr. Derek Pappas for assistance with biostatistics, and Dr. Diana Bojorquez and Dr. Derek Pappas for assistance with review of the manuscript and creation of the figures.
Disclosures: None of the authors have financial relationships or other conflicts of interest to disclose. No external funding was secured for this study. Dr. Auerbach was supported by grant K24HL098372 during the course of this study. This project was supported by the National Center for Advancing Translational Sciences, National Institutes of Health (NIH), through University of California San FranciscoClinical and Translational Sciences Institute grant UL1 TR000004. Its contents are solely the responsibility of the authors and do not necessarily represent the official views of the NIH. Dr. Rosenbluth had access to all of the data in the study and takes responsibility for the integrity of the data and the accuracy of the data analysis.
- , , . New requirements for resident duty hours. JAMA. 2002;288(9):1112–1114.
- Accreditation Council for Graduate Medical Education. Common program requirements. 2011. Available at: http://www.acgme.org/acgmeweb/Portals/0/PDFs/Common_Program_Requirements_07012011[2].pdf. Accessed November 28, 2011.
- , , . Patient safety, resident education and resident well‐being following implementation of the 2003 ACGME duty hour rules. J Gen Intern Med. 2011;26(8):907–919.
- , , , et al. A systematic review of the effects of resident duty hour restrictions in surgery: impact on resident wellness, training, and patient outcomes. Ann Surg. 2014;259(6):1041–1053.
- , , , . Duty‐hour limits and patient care and resident outcomes: can high‐quality studies offer insight into complex relationships? Annu Rev Med. 2013;64:467–483.
- , , , , , . Association between adaptations to ACGME duty hour requirements, length of stay, and costs. Sleep. 2013;36(2):245–248.
- , , , . Effect of a change in house staff work schedule on resource utilization and patient care. Arch Intern Med. 1991;151(10):2065–2070.
- , , , et al. Effect of reducing interns' work hours on serious medical errors in intensive care units. N Engl J Med. 2004;351(18):1838–1848.
- , , , . Changes in outcomes for internal medicine inpatients after work‐hour regulations. Ann Intern Med. 2007;147(2):97–103.
- , , . Effects of reducing or eliminating resident work shifts over 16 hours: a systematic review. Sleep. 2010;33(8):1043–1053.
- , , , et al. Effects of the 2011 duty hour reforms on interns and their patients: a prospective longitudinal cohort study. JAMA Intern Med. 2013;173(8):657–662; discussion 663.
- , , , , . Effect of 16‐hour duty periods on patient care and resident education. Mayo Clin Proc. 2011;86(3):192–196.
- , , , et al. Effect of the 2011 vs 2003 duty hour regulation‐compliant models on sleep duration, trainee education, and continuity of patient care among internal medicine house staff: a randomized trial. JAMA Intern Med. 2013;173(8):649–655.
- , , , . Effectiveness of a clinical pathway for inpatient asthma management. Pediatrics. 2000;106(5):1006–1012.
- , , , . Resident perceptions of autonomy in a complex tertiary care environment improve when supervised by hospitalists. Hosp Pediatr. 2012;2(4):228–234.
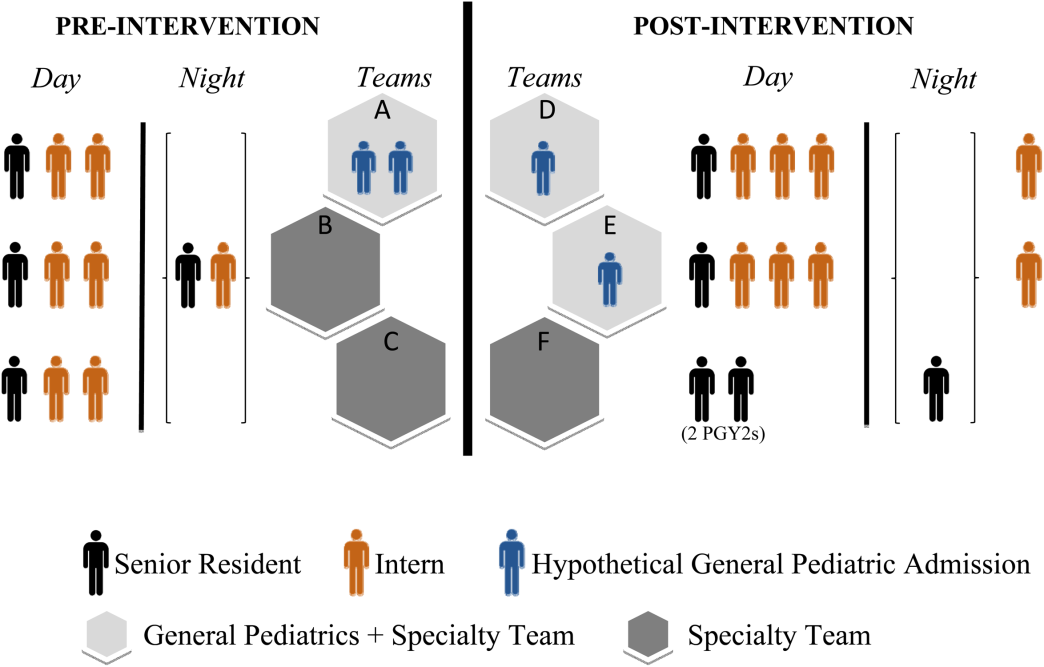
Changeover of Trainee Doctors
In England, the day when trainee doctors start work for the first time in their careers or rotate to a different hospital is the first Wednesday of August. This is often referred to as the Black Wednesday in the National Health Service (NHS), as it is widely perceived that inexperience and nonfamiliarity with the new hospital systems and policies in these first few weeks lead to increased medical errors and mismanagement and may therefore cost lives.[1] However, there is very little evidence in favor of this widely held view in the NHS. A 2009 English study found a small but significant increase of 6% in the odds of death for inpatients admitted in the week following the first Wednesday in August than in the week following the last Wednesday in July, whereas a previous report did not support this.[2, 3] In the United States, the resident trainee doctor's changeover occurs in July, and its negative impact on patient outcomes is often dubbed the July phenomenon.[4] With conflicting reports of the July phenomenon on patient outcomes,[5, 6, 7] Young et al. systematically reviewed 39 studies and concluded that the July phenomenon exists in that there is increased mortality around the changeover period.[4]
It can be hypothesized that glycemic control in inpatients with diabetes would be worse in the immediate period following changeover of trainee doctors for the same reasons mentioned earlier that impact mortality. However, contrary to expectations, a recent single‐hospital study from the United States reported that changeover of resident trainee doctors did not worsen inpatient glycemic control.[8] Although the lack of confidence among trainee doctors in inpatient diabetes management has been clearly demonstrated in England,[9] the impact of August changeover of trainee doctors on inpatient glycemic control is unknown. The aim of this study was to determine whether the August changeover of trainee doctors impacted on glycemic control in inpatients with diabetes in a single English hospital.
MATERIAL AND METHODS
The study setting was a medium‐sized 550‐bed hospital in England that serves a population of approximately 360,000 residents. Capillary blood glucose (CBG) readings for adult inpatients across all wards were downloaded from the Precision Web Point‐of‐Care Data Management System (Abbott Diabetes Care Inc., Alameda, CA), an electronic database where all the CBG readings for inpatients are stored. Patient administration data were used to identify those with diabetes admitted to the hospital for at least 1 day, and only their CBG readings were included in this study. Glucometrics, a term coined by Goldberg et al., refers to standardized glucose performance metrics to assess the quality of inpatient glycemic control.[10] In this study, patient‐day glucometric measures were used, as they are considered the best indicator of inpatient glycemic control compared to other glucometrics.[10] Patient‐day glucometrics were analyzed for 4 weeks before and after Black Wednesday for the years 2012, 2013, and 2014 using Microsoft Excel 2007 (Microsoft Corp., Redmond, WA) and R version 3.1.0 (The R Foundation, Vienna, Austria). Patient‐day glucometrics analyzed were hypoglycemia (any CBG 2.2 mmol/L [40 mg/dL], any CBG 2.9 mmol/L [52 mg/dL], any CBG 3.9 mmol/L [72 mg/dL]), normoglycemia (mean CBGs between 4 and 12 mmol/L [73‐216 mg/dL]), hyperglycemia (any CBG 12.1 mmol/L [218 mg/dL]), and mean CBG. Proportions were compared using the z test, whereas sample means between the groups were compared by nonparametric Mann‐Whitney U tests, as per statistical literature.[11] All P values are 2‐tailed, and 0.05 was considered statistically significant.
Patient characteristics and healthcare professional's workload were identified as potential causes of variation in CBG readings. Regression analysis of covariance was used to identify and adjust for these factors when comparing mean glucose readings. Binomial logistic regression was used to adjust proportions of patients‐days with readings out of range and patient‐days with mean readings within range. Variables tested were length of stay as a proxy for severity of condition, number of patients whose CBG were measured in the hospital in a day as a proxy for the healthcare professional's workload, and location of the patient to account for variation in patient characteristics as the wards were specialty based. Goodness of fit was tested using the R2 value in the linear model, which indicates the proportion of outcome that is explained by the model. For binomial models, McFadden's pseudo R2 (pseudo‐R2McFadden) was used as advised for logistic models. McFadden's pseudo‐R2 ranges from 0 to 1, but unlike R2 in ordinary linear regression, values tend to be significantly lower: McFadden's pseudo R2 values between 0.2 and 0.4 indicate excellent fit.[12]
RESULTS
A total of 16,870 patient‐day CBG measures in 2730 inpatients with diabetes were analyzed. The results of all regressions are presented in Table 1. The coefficients in the first model represent the effect of each covariate on mean patient‐day CBG. For example, each extra day of hospitalization was associated with a 0.02 mmol/L (0.36 mg/dL) increase in mean patient‐day reading, ceteris paribus. The remaining models indicate the change in relative risk (in this case the proportion of patient‐days) associated with the covariates. For example, in patients who were hospitalized for 3 days, the proportion of patient‐days with at least 1 CBG greater than 12 mmol/L (216 mg/dL) was 1.01 times the comparable proportion of patients who were hospitalized for 2 days. Each additional day in the hospital significantly increased the mean CBG by 0.015 mmol/L (0.27 mg/dL) and increased the risk of having at least 1 reading below 3.9 mmol/L (72 mg/dL) or above 12 mmol/L (216 mg/dL). Monitoring more patients in a day also affected outcomes, although the effect was small. Each additional patient monitored reduced mean patient‐day CBG by 0.011 mmol/L (0.198 mg/dL) and increased the proportion of patients with at least 1 reading below 4 mmol/L (72 mg/dL) 1.01 times. Location of the patient also significantly affected CBG readings. This could have been due to either ward or patient characteristics, but lack of data on each ward's healthcare personnel and individual patient characteristics prevented further analysis of this effect, and therefore the results were used for adjustment only. All models have relatively low predictive power, as demonstrated by the low R2 and pseudo‐R2McFadden values. In the linear model that estimated the effect of covariates on mean patient‐day CBG, the R2 is 0.0270, indicating that only 2.70% of results were explained by the covariates in the model. The pseudo‐R2McFadden varied between 0.0146 and 0.0540, as presented in Table 1. Although the pseudo‐R2McFadden generally had lower values than the R2 for the linear models, values of 0.0540 and below are considered to be relatively low.[12]
| Covariate | Outcome | |||||
|---|---|---|---|---|---|---|
| Change in Mean CBG for Each Patient‐Day, mmol/L (mg/dL) | Change in % of Patient‐Days With Any CBG 2.2 mmol/L (40 mg/dL) | Change in % of Patient‐Days With Any CBG 2.9 mmol/L (52 mg/dL) | Change in % of Patient‐Days With Any CBG 3.9 mmol/L (72 mg/dL) | Change in % of Patient‐Days With Mean CBG Between 4 and 12 mmol/L (73216 mg/dL) | Change in % of Patient‐Days With Any CBG >12 mmol/L (218 mg/dL) | |
| ||||||
| Additional day in the hospital | 0.015 (0.27), P 0.001* | 1.00, P = 0.605 | 1.00, P = 0.986 | 1.005, P = 0.004 | 0.99, P 0.001* | 1.01, P 0.001* |
| Additional patients monitored | 0.011 (0.198), P 0.001* | 1.01, P = 0.132 | 1.01, P = 0.084 | 1.01, P = 0.021 | 1.00, P = 0.128 | 0.997, P = 0.011 |
| Ward (range) |
0.5913.68(10.62246.24) |
0.3722.71 | 03.62 | 03.10 | 047,124.14 | 04,094,900 |
| R2/pseudo‐R2McFadden | 0.0247 | 0.0503 | 0.0363 | 0.0270 | 0.0140 | 0.0243 |
Table 2 summarizes outcomes for the 3 years individually. The results suggest that all indices of inpatient glycemic control that were analyzedhypoglycemia, normoglycemia, hyperglycemia, and mean CBGdid not worsen in August compared to July that year. The results are presented after adjustment for variation in the length of stay, number of patients monitored in a day, and location of the patient. Their effect on the difference in proportions of patients with at least 1 reading out of range and mean reading within range were not statistically significant. However, their effect on mean patient‐day CBG measures was statistically significant, although the effect was only a small decrease (0.4 mmol/L or 7.2 mg/dL) in the mean CBG (see Supporting Table 1 in the online version of this article for unadjusted readings).
| 2012 | 2013 | 2014 | ||||
|---|---|---|---|---|---|---|
| Before Changeover | After Changeover | Before Changeover | After Changeover | Before Changeover | After Changeover | |
| ||||||
| No. of inpatients with diabetes whose CBG readings were analyzed | 470 | 482 | 464 | 427 | 440 | 447 |
| No. of patient‐day CBG readings analyzed | 2917 | 3159 | 3097 | 2588 | 2484 | 2625 |
| Mean no. of CBG readings per patient‐day (range) | 2.5 (127) | 2.5 (123), P = 0.676 | 2.6 (121) | 2.4 (118), P = 0.009* | 2.5 (120) | 2.4 (120), P = 0.028 |
| Mean no. of CBG readings per patient‐day (range) in those where at least 1 reading was CBG 3.9 mmol/L (72 mg/dL) or CBG 12.1 mmol/L (218 mg/dL) | 3.8 (127) | 3.8 (123) | 3.7 (121) | 3.5 (118) | 3.2 (120) | 3.5 (120) |
| Mean no. of CBG readings per patient‐day (range) in those where all CBG readings were between 4 and 12 mmol/L (73216mg/dL) | 1.8 (127) | 1.8 (112) | 1.8 (112) | 1.8 (117) | 1.7 (111) | 1.7 (115) |
| % of patient‐days with any CBG 2.2 mmol/L (40 mg/dL) | 0.99% | 1.09%, P = 0.703 | 1.03% | 0.88%, P = 0.544 | 0.84% | 0.87%, P = 0.927 |
| % of patient‐days with any CBG 2.9 mmol/L (52 mg/dL) | 2.53% | 2.68%, P = 0.708 | 2.63% | 1.35%, P = 0.490 | 2.24% | 2.31%, P = 0.874 |
| % of patient‐days with any CBG 3.9 mmol/L (72 mg/dL) | 7.25% | 7.42%, P = 0.792 | 7.56 % | 6.93%, P = 0.361 | 6.55% | 6.70%, P = 0.858 |
| % of patient‐days with mean CBG between 4 and 12 mmol/L (73216 mg/dL) | 79.10% | 79.89%, P = 0.446 | 78.69% | 78.58%, P = 0.924 | 78.65% | 78.61%, P = 0.973 |
| % of patient‐days with any CBG 12.1 mmol/L (218 mg/dL) | 32.32% | 31.40%, P = 0.443 | 32.29% | 32.88%, P = 0.634 | 32.78% | 32.66%, P = 0.928 |
| Median of mean CBG for each patient‐day in mmol/L (mg/dL) | 8.0 (144.6) | 7.8 (140.0) | 8.4 (151.5) | 8.3 (150.2) | 8.9 (159.8) | 8.8 (157.8) |
| Mean of mean CBG for each patient‐day in mmol/L (standard deviation) | 9.1 (4.0) | 8.8 (4.1), P = 0.033+ | 9.4 (4.1) | 9.2 (4.0), P = 0.075 | 9.8 (4.1) | 9.6 (3.8), P = 0.189 |
DISCUSSION
This study shows that contrary to expectation, inpatient glycemic control did not worsen in the 4 weeks following the August changeover of trainee doctors for the years 2012, 2013, and 2014. In fact, inpatient glycemic control was marginally better in the first 4 weeks after changeover each year compared to the preceding 4 weeks before changeover. There may be several reasons for the findings in this study. First, since 2010 in this hospital and since 2012 nationally (further to direction from NHS England Medical Director Sir Bruce Keogh), it has become established practice that newly qualified trainee doctors shadow their colleagues at work a week prior to Black Wednesday.[13, 14] The purpose of this practice, called the preparation for professional practice is to familiarize trainee doctors with the hospital protocols and systems, improve their confidence, and potentially reduce medical errors when starting work. Second, since 2012, this hospital has also implemented the Joint British Diabetes Societies' national guidelines in managing inpatients with diabetes.[15] These guidelines are widely publicized on the changeover day during the trainee doctor's induction program. Finally, since 2012, a diabetes‐specific interactive 1‐hour educational program for trainee doctors devised by this hospital was implemented during the changeover period, which takes them through practical and problem‐solving case scenarios related to inpatient glycemic management, in particular prevention of hypoglycemia and hospital‐acquired diabetic ketoacidosis.[16] Attendance was mandatory, and informal feedback from trainee doctors about the educational program was extremely positive.
There are several limitations in this study. It could be argued that trainee doctors have very little impact on glycemic control in inpatients with diabetes. In NHS hospitals, trainee doctors are often the first port of call for managing glycemic issues in inpatients both in and out of hours, who in turn may or may not call the inpatient diabetes team wherever available. Therefore, trainee doctors' impact on glycemic control in inpatients with diabetes cannot be understated. However, it is acknowledged that in this study, a number of other factors that influence inpatient glycemic control, such as individual patient characteristics, medication errors, and the knowledge and confidence levels of individual trainee doctors, were not accounted for. Nevertheless, such factors are unlikely to have been significantly different over the 3‐year period. A further limitation was the unavailability of hospital‐wide electronic CBG data prior to 2012 to determine whether changeover impacted on inpatient glycemic control prior to this period. Another limitation was the dependence on patient administration data to identify those with diabetes, as it is well recognized that coded data in hospital data management systems can be inaccurate, though this has significantly improved over the years.[17] Finally, the most important limitation is that this is a single‐hospital study, and so the results may not be applicable to other English hospitals. Nevertheless, the finding of this study is similar to the finding in the single‐hospital study from the United States.[8]
The finding that glycemic control in inpatients with diabetes did not worsen in the 4 weeks following changeover of trainee doctors compared to the 4 weeks before changeover each year suggests that appropriate forethought and planning by the deanery foundation school and the inpatient diabetes team has prevented the anticipated deterioration of glycemic control during the August changeover of trainee doctors in this English hospital.
Disclosures: R.R. and G.R. conceived and designed the study. R.R. collected data and drafted the manuscript. R.R., D.J., and G.R. analyzed and interpreted the data. D.J. provided statistical input for analysis of the data. R.R., D.J., and G.R. critically revised the manuscript for intellectual content. All authors have approved the final version. The authors report no conflicts of interest.
- . Black Wednesday: today junior doctors will start work—and cause A4(9):e7103.
- , . The killing season—fact or fiction? BMJ. 1994;309(6970):1690.
- , , , , , . “July effect”: impact of the academic year‐end changeover on patient outcomes: a systematic review. Ann Intern Med. 2011;155(5):309–315.
- , . A July spike in fatal medication errors: a possible effect of new medical residents. J Gen Intern Med. 2010;25(8):774–779.
- , , , et al. Complications and death at the start of the new academic year: is there a July phenomenon? J Trauma. 2010;68(1):19–22.
- , , , . Errors and adverse outcomes on a surgical service: what is the role of residents? J Surg Res. 2004;122(2):162–166.
- , , , . Is There a “July Effect” for inpatient glycemic control? Endocr Pract. 2014;20(19):919–924.
- , , , et al.; TOPDOC Diabetes Study Team. Lack of confidence among trainee doctors in the management of diabetes: the Trainees Own Perception of Delivery of Care (TOPDOC) Diabetes Study. QJM. 2011;104(9):761–766.
- , , , et al. “Glucometrics”—assessing the quality of inpatient glucose management. Diabetes Technol Ther. 2006;8(5):560–569.
- , , . Statistics for Business and Economics. 5th ed. Upper Saddle River, NJ: Prentice Hall; 2002.
- , , . Stated choice methods. New York, NY: Cambridge University Press; 2000.
- Health Education East of England. Preparing for professional practice. Available at: https://heeoe.hee.nhs.uk/foundation_faq. Accessed October 07, 2015.
- Department of Health. Lives will be saved as junior doctors shadow new role 2012. Available at: https://www.gov.uk/government/news/lives‐will‐be‐saved‐as‐junior‐doctors‐shadow‐new‐role. Accessed October 29, 2014.
- Association of British Clinical Diabetologists. Joint British Diabetes Societies for Inpatient Care. Available at: http://www.diabetologists‐abcd.org.uk/JBDS/JBDS.htm. Accessed October 8, 2014.
- , , . An interactive 1‐h educational programme for junior doctors, increases their confidence and improves inpatient diabetes care. Diabet Med. 2012;29(12):1574–1578.
- , , , et al. Systematic review of discharge coding accuracy. J Public Health (Oxf). 2012;34(1):138–148.
In England, the day when trainee doctors start work for the first time in their careers or rotate to a different hospital is the first Wednesday of August. This is often referred to as the Black Wednesday in the National Health Service (NHS), as it is widely perceived that inexperience and nonfamiliarity with the new hospital systems and policies in these first few weeks lead to increased medical errors and mismanagement and may therefore cost lives.[1] However, there is very little evidence in favor of this widely held view in the NHS. A 2009 English study found a small but significant increase of 6% in the odds of death for inpatients admitted in the week following the first Wednesday in August than in the week following the last Wednesday in July, whereas a previous report did not support this.[2, 3] In the United States, the resident trainee doctor's changeover occurs in July, and its negative impact on patient outcomes is often dubbed the July phenomenon.[4] With conflicting reports of the July phenomenon on patient outcomes,[5, 6, 7] Young et al. systematically reviewed 39 studies and concluded that the July phenomenon exists in that there is increased mortality around the changeover period.[4]
It can be hypothesized that glycemic control in inpatients with diabetes would be worse in the immediate period following changeover of trainee doctors for the same reasons mentioned earlier that impact mortality. However, contrary to expectations, a recent single‐hospital study from the United States reported that changeover of resident trainee doctors did not worsen inpatient glycemic control.[8] Although the lack of confidence among trainee doctors in inpatient diabetes management has been clearly demonstrated in England,[9] the impact of August changeover of trainee doctors on inpatient glycemic control is unknown. The aim of this study was to determine whether the August changeover of trainee doctors impacted on glycemic control in inpatients with diabetes in a single English hospital.
MATERIAL AND METHODS
The study setting was a medium‐sized 550‐bed hospital in England that serves a population of approximately 360,000 residents. Capillary blood glucose (CBG) readings for adult inpatients across all wards were downloaded from the Precision Web Point‐of‐Care Data Management System (Abbott Diabetes Care Inc., Alameda, CA), an electronic database where all the CBG readings for inpatients are stored. Patient administration data were used to identify those with diabetes admitted to the hospital for at least 1 day, and only their CBG readings were included in this study. Glucometrics, a term coined by Goldberg et al., refers to standardized glucose performance metrics to assess the quality of inpatient glycemic control.[10] In this study, patient‐day glucometric measures were used, as they are considered the best indicator of inpatient glycemic control compared to other glucometrics.[10] Patient‐day glucometrics were analyzed for 4 weeks before and after Black Wednesday for the years 2012, 2013, and 2014 using Microsoft Excel 2007 (Microsoft Corp., Redmond, WA) and R version 3.1.0 (The R Foundation, Vienna, Austria). Patient‐day glucometrics analyzed were hypoglycemia (any CBG 2.2 mmol/L [40 mg/dL], any CBG 2.9 mmol/L [52 mg/dL], any CBG 3.9 mmol/L [72 mg/dL]), normoglycemia (mean CBGs between 4 and 12 mmol/L [73‐216 mg/dL]), hyperglycemia (any CBG 12.1 mmol/L [218 mg/dL]), and mean CBG. Proportions were compared using the z test, whereas sample means between the groups were compared by nonparametric Mann‐Whitney U tests, as per statistical literature.[11] All P values are 2‐tailed, and 0.05 was considered statistically significant.
Patient characteristics and healthcare professional's workload were identified as potential causes of variation in CBG readings. Regression analysis of covariance was used to identify and adjust for these factors when comparing mean glucose readings. Binomial logistic regression was used to adjust proportions of patients‐days with readings out of range and patient‐days with mean readings within range. Variables tested were length of stay as a proxy for severity of condition, number of patients whose CBG were measured in the hospital in a day as a proxy for the healthcare professional's workload, and location of the patient to account for variation in patient characteristics as the wards were specialty based. Goodness of fit was tested using the R2 value in the linear model, which indicates the proportion of outcome that is explained by the model. For binomial models, McFadden's pseudo R2 (pseudo‐R2McFadden) was used as advised for logistic models. McFadden's pseudo‐R2 ranges from 0 to 1, but unlike R2 in ordinary linear regression, values tend to be significantly lower: McFadden's pseudo R2 values between 0.2 and 0.4 indicate excellent fit.[12]
RESULTS
A total of 16,870 patient‐day CBG measures in 2730 inpatients with diabetes were analyzed. The results of all regressions are presented in Table 1. The coefficients in the first model represent the effect of each covariate on mean patient‐day CBG. For example, each extra day of hospitalization was associated with a 0.02 mmol/L (0.36 mg/dL) increase in mean patient‐day reading, ceteris paribus. The remaining models indicate the change in relative risk (in this case the proportion of patient‐days) associated with the covariates. For example, in patients who were hospitalized for 3 days, the proportion of patient‐days with at least 1 CBG greater than 12 mmol/L (216 mg/dL) was 1.01 times the comparable proportion of patients who were hospitalized for 2 days. Each additional day in the hospital significantly increased the mean CBG by 0.015 mmol/L (0.27 mg/dL) and increased the risk of having at least 1 reading below 3.9 mmol/L (72 mg/dL) or above 12 mmol/L (216 mg/dL). Monitoring more patients in a day also affected outcomes, although the effect was small. Each additional patient monitored reduced mean patient‐day CBG by 0.011 mmol/L (0.198 mg/dL) and increased the proportion of patients with at least 1 reading below 4 mmol/L (72 mg/dL) 1.01 times. Location of the patient also significantly affected CBG readings. This could have been due to either ward or patient characteristics, but lack of data on each ward's healthcare personnel and individual patient characteristics prevented further analysis of this effect, and therefore the results were used for adjustment only. All models have relatively low predictive power, as demonstrated by the low R2 and pseudo‐R2McFadden values. In the linear model that estimated the effect of covariates on mean patient‐day CBG, the R2 is 0.0270, indicating that only 2.70% of results were explained by the covariates in the model. The pseudo‐R2McFadden varied between 0.0146 and 0.0540, as presented in Table 1. Although the pseudo‐R2McFadden generally had lower values than the R2 for the linear models, values of 0.0540 and below are considered to be relatively low.[12]
| Covariate | Outcome | |||||
|---|---|---|---|---|---|---|
| Change in Mean CBG for Each Patient‐Day, mmol/L (mg/dL) | Change in % of Patient‐Days With Any CBG 2.2 mmol/L (40 mg/dL) | Change in % of Patient‐Days With Any CBG 2.9 mmol/L (52 mg/dL) | Change in % of Patient‐Days With Any CBG 3.9 mmol/L (72 mg/dL) | Change in % of Patient‐Days With Mean CBG Between 4 and 12 mmol/L (73216 mg/dL) | Change in % of Patient‐Days With Any CBG >12 mmol/L (218 mg/dL) | |
| ||||||
| Additional day in the hospital | 0.015 (0.27), P 0.001* | 1.00, P = 0.605 | 1.00, P = 0.986 | 1.005, P = 0.004 | 0.99, P 0.001* | 1.01, P 0.001* |
| Additional patients monitored | 0.011 (0.198), P 0.001* | 1.01, P = 0.132 | 1.01, P = 0.084 | 1.01, P = 0.021 | 1.00, P = 0.128 | 0.997, P = 0.011 |
| Ward (range) |
0.5913.68(10.62246.24) |
0.3722.71 | 03.62 | 03.10 | 047,124.14 | 04,094,900 |
| R2/pseudo‐R2McFadden | 0.0247 | 0.0503 | 0.0363 | 0.0270 | 0.0140 | 0.0243 |
Table 2 summarizes outcomes for the 3 years individually. The results suggest that all indices of inpatient glycemic control that were analyzedhypoglycemia, normoglycemia, hyperglycemia, and mean CBGdid not worsen in August compared to July that year. The results are presented after adjustment for variation in the length of stay, number of patients monitored in a day, and location of the patient. Their effect on the difference in proportions of patients with at least 1 reading out of range and mean reading within range were not statistically significant. However, their effect on mean patient‐day CBG measures was statistically significant, although the effect was only a small decrease (0.4 mmol/L or 7.2 mg/dL) in the mean CBG (see Supporting Table 1 in the online version of this article for unadjusted readings).
| 2012 | 2013 | 2014 | ||||
|---|---|---|---|---|---|---|
| Before Changeover | After Changeover | Before Changeover | After Changeover | Before Changeover | After Changeover | |
| ||||||
| No. of inpatients with diabetes whose CBG readings were analyzed | 470 | 482 | 464 | 427 | 440 | 447 |
| No. of patient‐day CBG readings analyzed | 2917 | 3159 | 3097 | 2588 | 2484 | 2625 |
| Mean no. of CBG readings per patient‐day (range) | 2.5 (127) | 2.5 (123), P = 0.676 | 2.6 (121) | 2.4 (118), P = 0.009* | 2.5 (120) | 2.4 (120), P = 0.028 |
| Mean no. of CBG readings per patient‐day (range) in those where at least 1 reading was CBG 3.9 mmol/L (72 mg/dL) or CBG 12.1 mmol/L (218 mg/dL) | 3.8 (127) | 3.8 (123) | 3.7 (121) | 3.5 (118) | 3.2 (120) | 3.5 (120) |
| Mean no. of CBG readings per patient‐day (range) in those where all CBG readings were between 4 and 12 mmol/L (73216mg/dL) | 1.8 (127) | 1.8 (112) | 1.8 (112) | 1.8 (117) | 1.7 (111) | 1.7 (115) |
| % of patient‐days with any CBG 2.2 mmol/L (40 mg/dL) | 0.99% | 1.09%, P = 0.703 | 1.03% | 0.88%, P = 0.544 | 0.84% | 0.87%, P = 0.927 |
| % of patient‐days with any CBG 2.9 mmol/L (52 mg/dL) | 2.53% | 2.68%, P = 0.708 | 2.63% | 1.35%, P = 0.490 | 2.24% | 2.31%, P = 0.874 |
| % of patient‐days with any CBG 3.9 mmol/L (72 mg/dL) | 7.25% | 7.42%, P = 0.792 | 7.56 % | 6.93%, P = 0.361 | 6.55% | 6.70%, P = 0.858 |
| % of patient‐days with mean CBG between 4 and 12 mmol/L (73216 mg/dL) | 79.10% | 79.89%, P = 0.446 | 78.69% | 78.58%, P = 0.924 | 78.65% | 78.61%, P = 0.973 |
| % of patient‐days with any CBG 12.1 mmol/L (218 mg/dL) | 32.32% | 31.40%, P = 0.443 | 32.29% | 32.88%, P = 0.634 | 32.78% | 32.66%, P = 0.928 |
| Median of mean CBG for each patient‐day in mmol/L (mg/dL) | 8.0 (144.6) | 7.8 (140.0) | 8.4 (151.5) | 8.3 (150.2) | 8.9 (159.8) | 8.8 (157.8) |
| Mean of mean CBG for each patient‐day in mmol/L (standard deviation) | 9.1 (4.0) | 8.8 (4.1), P = 0.033+ | 9.4 (4.1) | 9.2 (4.0), P = 0.075 | 9.8 (4.1) | 9.6 (3.8), P = 0.189 |
DISCUSSION
This study shows that contrary to expectation, inpatient glycemic control did not worsen in the 4 weeks following the August changeover of trainee doctors for the years 2012, 2013, and 2014. In fact, inpatient glycemic control was marginally better in the first 4 weeks after changeover each year compared to the preceding 4 weeks before changeover. There may be several reasons for the findings in this study. First, since 2010 in this hospital and since 2012 nationally (further to direction from NHS England Medical Director Sir Bruce Keogh), it has become established practice that newly qualified trainee doctors shadow their colleagues at work a week prior to Black Wednesday.[13, 14] The purpose of this practice, called the preparation for professional practice is to familiarize trainee doctors with the hospital protocols and systems, improve their confidence, and potentially reduce medical errors when starting work. Second, since 2012, this hospital has also implemented the Joint British Diabetes Societies' national guidelines in managing inpatients with diabetes.[15] These guidelines are widely publicized on the changeover day during the trainee doctor's induction program. Finally, since 2012, a diabetes‐specific interactive 1‐hour educational program for trainee doctors devised by this hospital was implemented during the changeover period, which takes them through practical and problem‐solving case scenarios related to inpatient glycemic management, in particular prevention of hypoglycemia and hospital‐acquired diabetic ketoacidosis.[16] Attendance was mandatory, and informal feedback from trainee doctors about the educational program was extremely positive.
There are several limitations in this study. It could be argued that trainee doctors have very little impact on glycemic control in inpatients with diabetes. In NHS hospitals, trainee doctors are often the first port of call for managing glycemic issues in inpatients both in and out of hours, who in turn may or may not call the inpatient diabetes team wherever available. Therefore, trainee doctors' impact on glycemic control in inpatients with diabetes cannot be understated. However, it is acknowledged that in this study, a number of other factors that influence inpatient glycemic control, such as individual patient characteristics, medication errors, and the knowledge and confidence levels of individual trainee doctors, were not accounted for. Nevertheless, such factors are unlikely to have been significantly different over the 3‐year period. A further limitation was the unavailability of hospital‐wide electronic CBG data prior to 2012 to determine whether changeover impacted on inpatient glycemic control prior to this period. Another limitation was the dependence on patient administration data to identify those with diabetes, as it is well recognized that coded data in hospital data management systems can be inaccurate, though this has significantly improved over the years.[17] Finally, the most important limitation is that this is a single‐hospital study, and so the results may not be applicable to other English hospitals. Nevertheless, the finding of this study is similar to the finding in the single‐hospital study from the United States.[8]
The finding that glycemic control in inpatients with diabetes did not worsen in the 4 weeks following changeover of trainee doctors compared to the 4 weeks before changeover each year suggests that appropriate forethought and planning by the deanery foundation school and the inpatient diabetes team has prevented the anticipated deterioration of glycemic control during the August changeover of trainee doctors in this English hospital.
Disclosures: R.R. and G.R. conceived and designed the study. R.R. collected data and drafted the manuscript. R.R., D.J., and G.R. analyzed and interpreted the data. D.J. provided statistical input for analysis of the data. R.R., D.J., and G.R. critically revised the manuscript for intellectual content. All authors have approved the final version. The authors report no conflicts of interest.
- . Black Wednesday: today junior doctors will start work—and cause A4(9):e7103.
- , . The killing season—fact or fiction? BMJ. 1994;309(6970):1690.
- , , , , , . “July effect”: impact of the academic year‐end changeover on patient outcomes: a systematic review. Ann Intern Med. 2011;155(5):309–315.
- , . A July spike in fatal medication errors: a possible effect of new medical residents. J Gen Intern Med. 2010;25(8):774–779.
- , , , et al. Complications and death at the start of the new academic year: is there a July phenomenon? J Trauma. 2010;68(1):19–22.
- , , , . Errors and adverse outcomes on a surgical service: what is the role of residents? J Surg Res. 2004;122(2):162–166.
- , , , . Is There a “July Effect” for inpatient glycemic control? Endocr Pract. 2014;20(19):919–924.
- , , , et al.; TOPDOC Diabetes Study Team. Lack of confidence among trainee doctors in the management of diabetes: the Trainees Own Perception of Delivery of Care (TOPDOC) Diabetes Study. QJM. 2011;104(9):761–766.
- , , , et al. “Glucometrics”—assessing the quality of inpatient glucose management. Diabetes Technol Ther. 2006;8(5):560–569.
- , , . Statistics for Business and Economics. 5th ed. Upper Saddle River, NJ: Prentice Hall; 2002.
- , , . Stated choice methods. New York, NY: Cambridge University Press; 2000.
- Health Education East of England. Preparing for professional practice. Available at: https://heeoe.hee.nhs.uk/foundation_faq. Accessed October 07, 2015.
- Department of Health. Lives will be saved as junior doctors shadow new role 2012. Available at: https://www.gov.uk/government/news/lives‐will‐be‐saved‐as‐junior‐doctors‐shadow‐new‐role. Accessed October 29, 2014.
- Association of British Clinical Diabetologists. Joint British Diabetes Societies for Inpatient Care. Available at: http://www.diabetologists‐abcd.org.uk/JBDS/JBDS.htm. Accessed October 8, 2014.
- , , . An interactive 1‐h educational programme for junior doctors, increases their confidence and improves inpatient diabetes care. Diabet Med. 2012;29(12):1574–1578.
- , , , et al. Systematic review of discharge coding accuracy. J Public Health (Oxf). 2012;34(1):138–148.