User login
Blood Products Provided to Patients Receiving Futile Critical Care
Critical care physicians frequently find themselves providing care that they find to be futile or inappropriate for hospitalized critically ill patients. A survey of physicians found that 87% felt that “futile” treatment was provided in their intensive care unit (ICU) in the past year.1 In a single-day cross-sectional study, 27% of ICU clinicians reported providing inappropriate care to at least 1 patient, most of which was excessive.2 In a 3-month study, 11% of all ICU patients were perceived by their physician as receiving futile treatment at some point during their ICU hospitalization.3 Given that more than 1 in 5 decedents die after an ICU stay during a terminal admission, there is increasing scrutiny of the ICU as a setting where potentially inappropriate resource-intensive treatment is provided.4-6 Blood is an especially valuable resource, not only because it exists in finite supply (and is sometimes in shortage) but also because it is donated in ways that arguably create special stewardship expectations and responsibilities for those trusted to make decisions about its use. The amount of blood products used for patients who are perceived to be receiving inappropriate critical care has not been quantified.
Blood transfusion is the most frequently performed inpatient procedure, occurring in more than 10% of hospital admissions that involve a procedure.7 When used appropriately, the transfusion of blood products can be lifesaving; however, studies show that some transfused blood might not be needed and efforts are afoot to improve the match between transfusion and transfusion need.8,9 These efforts largely focus on generating guidelines based on physiologic benefit and aim mainly at promoting a restrictive transfusion protocol by avoiding blood product use for patients who will likely do well even without transfusion.8,10-12 The guiding principle behind efforts to improve the stewardship of scarce blood products is that they should only be used if they will make a difference in patient outcomes. Unlike prior studies, the goal of this study is to quantify the amount of blood products administered to patients who would do poorly with or without receipt of blood products, that is, patients perceived by their physicians as receiving futile critical care.
MATERIALS AND METHODS
Based on a focus group discussion with physicians who cared for critically ill patients, a questionnaire was developed to identify patients perceived as receiving futile critical care. Details of the definition of futile treatment and the core data collection are described in detail elsewhere.3
For each ICU patient under the physician’s care, the attending physician completed a daily questionnaire asking whether the patient was receiving futile treatment, probably futile treatment, or nonfutile treatment. These surveys were administered every day from December 15, 2011, through March 15, 2012, to each critical care specialist providing care in 5 ICUs (medical ICU, neurocritical care ICU, cardiac care unit, cardiothoracic ICU, and a mixed medical-surgical ICU) in 1 academic health system. All clinicians provided informed consent.
Patients were categorized into the following 3 groups: patients for whom treatment was never perceived as futile; patients with at least 1 assessment that treatment was probably futile, but no futile treatment assessments; and patients who had at least 1 assessment of futile treatment. Hospital and 6-month mortality was abstracted for all patients.
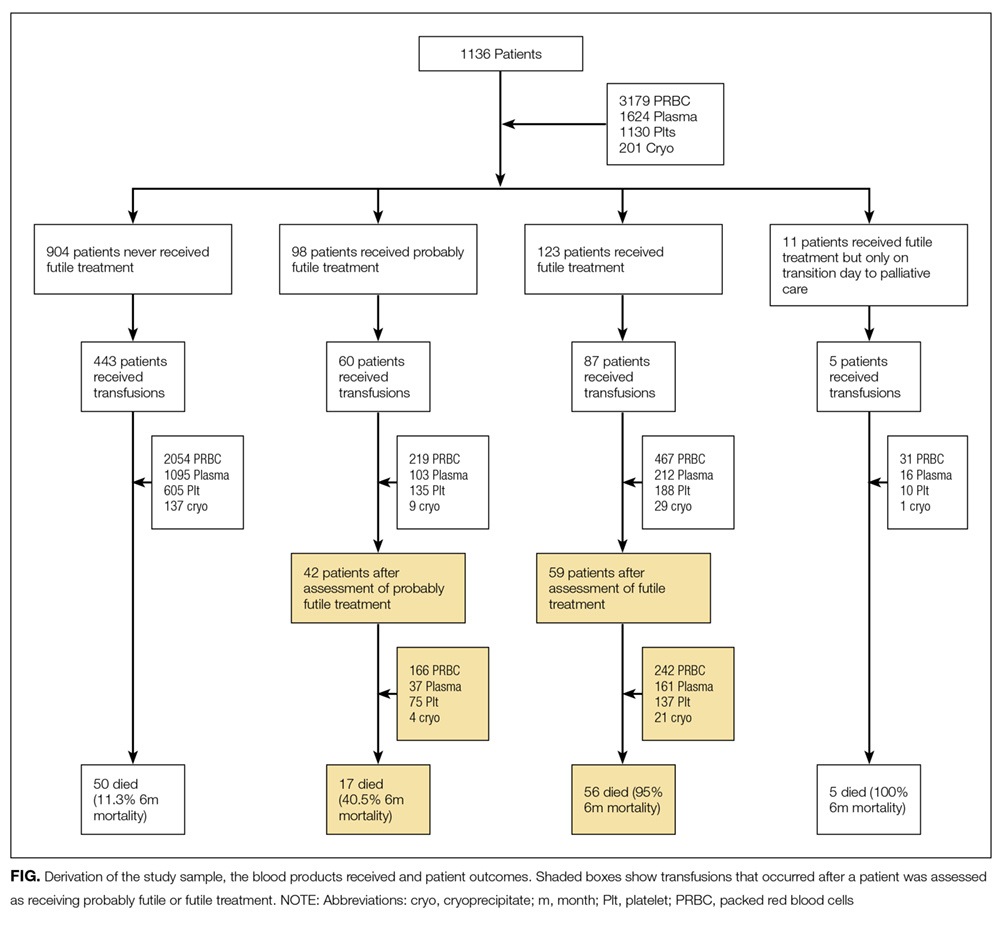
The Division of Transfusion Medicine provided a database of all adult patients during the 3-month study period who received a transfusion of packed red blood cells (PRBCs), apheresis platelets, plasma, or cryoprecipitate (5 unit prepooled units). This database was merged with the daily assessments of the appropriateness of critical care. To determine the proportion of blood products that was utilized for patients receiving inappropriate treatment, we tallied the blood products infused to these patients after the day the patient was assessed as receiving probably inappropriate or inappropriate treatment. The denominator was the total amount of blood products used by all assessed patients during the 3-month study period.
This study was approved by the University of California Los Angeles Institutional Review Board.
RESULTS
During the 3-month study period, 36 critical care clinicians in 5 ICUs provided care to 1193 adult patients. After excluding boarders in the ICUs and missed and invalid assessments, 6916 assessments were made on 1136 patients. Of these 1136 patients, 98 (8.6%) patients received probably futile treatment and 123 (11%) patients received futile treatment according to the physicians caring for them.
For patients who were never rated as receiving futile treatment, the in-hospital mortality was 4.6% and the 6-month mortality was 7.3%. On the contrary, 68% of the patients who were perceived to receive futile ICU treatment died before hospital discharge and 85% died within 6 months; survivors remained in severely compromised health states.3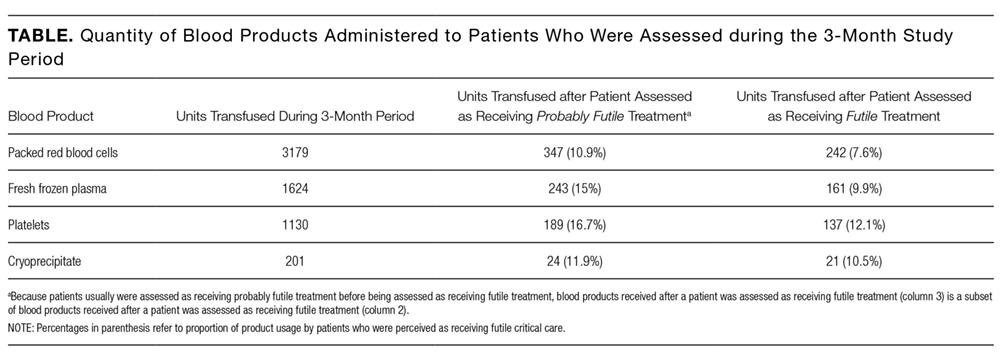
DISCUSSION
Blood and blood products are donated resources. These biological products are altruistically given with the expectation that they will be used to benefit others.13 It is the clinicians’ responsibility to use these precious gifts to achieve the goals of medicine, which include curing, preserving function, and preventing clinical deterioration that has meaning to the patient. Our study shows that a small, but not insignificant, proportion of these donated resources are provided to hospitalized patients who are perceived as receiving futile critical care. That means that these transfusions are used as part of the critical care interventions that prolong the dying process and achieve outcomes, such as existence in coma, which few, if any, patients would desire. However, it should be noted that some of the health states preserved, such as neurological devastation or multi-organ failure with an inability to survive outside an ICU, were likely desired by patients’ families and might even have been desired by patients themselves. Whether blood donors would wish to donate blood to preserve life in such compromised health states is testable. This proportion of blood provided to ICU patients perceived as receiving futile treatment (7.6%) is similar to or greater than that lost due to wastage, which ranges from 0.1% to 6.7%.14 While the loss of this small proportion of blood products due to expiration or procedural issues is probably unavoidable, but should be minimized as much as possible, the provision of blood products to patients receiving futile critical care is under the control of the healthcare team. This raises the question of how altruistic blood donors would feel about donating if they were aware that 1 of every 13 units transfused in the ICU would be given to a patient that the physician feels will not benefit. In turn, it raises the question of whether the physician should refrain from using these blood products for patients who will not benefit in accordance with principles of evidence-based medicine, in order to ensure their availability for patients that will benefit.
This study has several limitations. Family/patient perspectives were not included in the assessment of futile treatment. It should also be recognized that the percentage of blood products provided to patients receiving inappropriate critical care is likely an underestimate as only blood product use during the 3-month study period was included, as many of these patients were admitted to the ICU prior the study period, and/or remained in the ICU or hospital after this window.
CONCLUSIONS
Similar to other treatments provided to patients who are perceived to receive futile critical care, blood products represent a healthcare resource that has the potential to be used without achieving the goals of medicine. But unlike many other medical treatments, the ability to maintain an adequate blood supply for transfusion relies on altruistic blood donors, individuals who are simply motivated by a desire to achieve a healthcare good.13 Explicit guidelines on the use of blood products should be developed to ensure that the use of this precious resource achieves meaningful goals. These goals need to be transparently defined such that a physician’s decision to not transfuse is expected as part of evidence-based medicine. Empiric research, educational interventions, and clearly delineated conflict-resolution processes may improve clinicians’ ability to handle these difficult cases.15
Disclosure
T. Neville was supported by the UCLA CTSI KL2 UL1TR000124, the NIH-NIA 1K23AG047900 - 01A1, and the NIH Loan Repayment Program grant. This project was supported by a donation from Mary Kay Farley to RAND Health. The funder played no role in the design and conduct of the study; collection, management, analysis, and interpretation of the data; or preparation, review, or approval of the manuscript. The authors have no conflicts of interest to disclose.
1. Palda VA, Bowman KW, McLean RF, Chapman MG. “Futile” care: do we provide it? Why? A semistructured, Canada-wide survey of intensive care unit doctors and nurses. J Crit Care. 2005;20:207-213. PubMed
2. Piers RD, Azoulay E, Ricou B, et al. Perceptions of appropriateness of care among European and Israeli intensive care unit nurses and physicians. JAMA. 2011;306:2694-2703. PubMed
3. Huang S, Dang H, Huynh W, Sambrook PJ, Goss AN. The healing of dental extraction sockets in patients with Type 2 diabetes on oral hypoglycaemics: a prospective cohort. Aust Dent J. 2013;58:89-93. PubMed
4. Angus DC, Barnato AE, Linde-Zwirble WT, et al. Use of intensive care at the end of life in the United States: an epidemiologic study. Crit Care Med. 2004;32:638-643. PubMed
5. Wunsch H, Linde-Zwirble WT, Harrison DA, Barnato AE, Rowan KM, Angus DC. Use of intensive care services during terminal hospitalizations in England and the United States. Am J Respir Crit Care Med. 2009;180:875-880. PubMed
6. Esserman L, Belkora J, Lenert L. Potentially ineffective care. A new outcome to assess the limits of critical care. JAMA. 1995;274:1544-1551. PubMed
7. Agency for Healthcare Research and Quality: HCUP facts and figures: statistics on hospital-based care in the United States. 2009. https://www.hcup-us.ahrq.gov/reports/factsandfigures/2009/TOC_2009.jsp. Accessed July 15, 2016.
8. Goodnough LT, Maggio P, Hadhazy E, et al. Restrictive blood transfusion practices are associated with improved patient outcomes. Transfusion. 2014;54:2753-2759. PubMed
9. Shander AS, Goodnough LT. Blood transfusion as a quality indicator in cardiac surgery. JAMA. 2010;304:1610-1611. PubMed
10. Hebert PC, Wells G, Blajchman MA, et al. A multicenter, randomized, controlled clinical trial of transfusion requirements in critical care. Transfusion Requirements in Critical Care Investigators, Canadian Critical Care Trials Group. N Engl J Med. 1999;340:409-417. PubMed
11. Morton J, Anastassopoulos KP, Patel ST, et al. Frequency and outcomes of blood products transfusion across procedures and clinical conditions warranting inpatient care: an analysis of the 2004 healthcare cost and utilization project nationwide inpatient sample database. Am J Med Qual. 2010;25:289-296. PubMed
12. Shander A, Fink A, Javidroozi M, et al. Appropriateness of allogeneic red blood cell transfusion: the international consensus conference on transfusion outcomes. Transfus Med Rev. 2011;25:232-246 e53. PubMed
13. Bednall TC, Bove LL. Donating blood: a meta-analytic review of self-reported motivators and deterrents. Transfus Med Rev. 2011;25:317-334. PubMed
14. Heitmiller ES, Hill RB, Marshall CE, et al. Blood wastage reduction using Lean Sigma methodology. Transfusion. 2010;50:1887-1896. PubMed
15. Bosslet GT, Pope TM, Rubenfeld GD, et al. An Official ATS/AACN/ACCP/ESICM/SCCM Policy Statement: Responding to Requests for Potentially Inappropriate Treatments in Intensive Care Units. Am J Respir Crit Care Med. 2015;191:1318-1330. PubMed
Critical care physicians frequently find themselves providing care that they find to be futile or inappropriate for hospitalized critically ill patients. A survey of physicians found that 87% felt that “futile” treatment was provided in their intensive care unit (ICU) in the past year.1 In a single-day cross-sectional study, 27% of ICU clinicians reported providing inappropriate care to at least 1 patient, most of which was excessive.2 In a 3-month study, 11% of all ICU patients were perceived by their physician as receiving futile treatment at some point during their ICU hospitalization.3 Given that more than 1 in 5 decedents die after an ICU stay during a terminal admission, there is increasing scrutiny of the ICU as a setting where potentially inappropriate resource-intensive treatment is provided.4-6 Blood is an especially valuable resource, not only because it exists in finite supply (and is sometimes in shortage) but also because it is donated in ways that arguably create special stewardship expectations and responsibilities for those trusted to make decisions about its use. The amount of blood products used for patients who are perceived to be receiving inappropriate critical care has not been quantified.
Blood transfusion is the most frequently performed inpatient procedure, occurring in more than 10% of hospital admissions that involve a procedure.7 When used appropriately, the transfusion of blood products can be lifesaving; however, studies show that some transfused blood might not be needed and efforts are afoot to improve the match between transfusion and transfusion need.8,9 These efforts largely focus on generating guidelines based on physiologic benefit and aim mainly at promoting a restrictive transfusion protocol by avoiding blood product use for patients who will likely do well even without transfusion.8,10-12 The guiding principle behind efforts to improve the stewardship of scarce blood products is that they should only be used if they will make a difference in patient outcomes. Unlike prior studies, the goal of this study is to quantify the amount of blood products administered to patients who would do poorly with or without receipt of blood products, that is, patients perceived by their physicians as receiving futile critical care.
MATERIALS AND METHODS
Based on a focus group discussion with physicians who cared for critically ill patients, a questionnaire was developed to identify patients perceived as receiving futile critical care. Details of the definition of futile treatment and the core data collection are described in detail elsewhere.3
For each ICU patient under the physician’s care, the attending physician completed a daily questionnaire asking whether the patient was receiving futile treatment, probably futile treatment, or nonfutile treatment. These surveys were administered every day from December 15, 2011, through March 15, 2012, to each critical care specialist providing care in 5 ICUs (medical ICU, neurocritical care ICU, cardiac care unit, cardiothoracic ICU, and a mixed medical-surgical ICU) in 1 academic health system. All clinicians provided informed consent.
Patients were categorized into the following 3 groups: patients for whom treatment was never perceived as futile; patients with at least 1 assessment that treatment was probably futile, but no futile treatment assessments; and patients who had at least 1 assessment of futile treatment. Hospital and 6-month mortality was abstracted for all patients.
The Division of Transfusion Medicine provided a database of all adult patients during the 3-month study period who received a transfusion of packed red blood cells (PRBCs), apheresis platelets, plasma, or cryoprecipitate (5 unit prepooled units). This database was merged with the daily assessments of the appropriateness of critical care. To determine the proportion of blood products that was utilized for patients receiving inappropriate treatment, we tallied the blood products infused to these patients after the day the patient was assessed as receiving probably inappropriate or inappropriate treatment. The denominator was the total amount of blood products used by all assessed patients during the 3-month study period.
This study was approved by the University of California Los Angeles Institutional Review Board.
RESULTS
During the 3-month study period, 36 critical care clinicians in 5 ICUs provided care to 1193 adult patients. After excluding boarders in the ICUs and missed and invalid assessments, 6916 assessments were made on 1136 patients. Of these 1136 patients, 98 (8.6%) patients received probably futile treatment and 123 (11%) patients received futile treatment according to the physicians caring for them.
For patients who were never rated as receiving futile treatment, the in-hospital mortality was 4.6% and the 6-month mortality was 7.3%. On the contrary, 68% of the patients who were perceived to receive futile ICU treatment died before hospital discharge and 85% died within 6 months; survivors remained in severely compromised health states.3
DISCUSSION
Blood and blood products are donated resources. These biological products are altruistically given with the expectation that they will be used to benefit others.13 It is the clinicians’ responsibility to use these precious gifts to achieve the goals of medicine, which include curing, preserving function, and preventing clinical deterioration that has meaning to the patient. Our study shows that a small, but not insignificant, proportion of these donated resources are provided to hospitalized patients who are perceived as receiving futile critical care. That means that these transfusions are used as part of the critical care interventions that prolong the dying process and achieve outcomes, such as existence in coma, which few, if any, patients would desire. However, it should be noted that some of the health states preserved, such as neurological devastation or multi-organ failure with an inability to survive outside an ICU, were likely desired by patients’ families and might even have been desired by patients themselves. Whether blood donors would wish to donate blood to preserve life in such compromised health states is testable. This proportion of blood provided to ICU patients perceived as receiving futile treatment (7.6%) is similar to or greater than that lost due to wastage, which ranges from 0.1% to 6.7%.14 While the loss of this small proportion of blood products due to expiration or procedural issues is probably unavoidable, but should be minimized as much as possible, the provision of blood products to patients receiving futile critical care is under the control of the healthcare team. This raises the question of how altruistic blood donors would feel about donating if they were aware that 1 of every 13 units transfused in the ICU would be given to a patient that the physician feels will not benefit. In turn, it raises the question of whether the physician should refrain from using these blood products for patients who will not benefit in accordance with principles of evidence-based medicine, in order to ensure their availability for patients that will benefit.
This study has several limitations. Family/patient perspectives were not included in the assessment of futile treatment. It should also be recognized that the percentage of blood products provided to patients receiving inappropriate critical care is likely an underestimate as only blood product use during the 3-month study period was included, as many of these patients were admitted to the ICU prior the study period, and/or remained in the ICU or hospital after this window.
CONCLUSIONS
Similar to other treatments provided to patients who are perceived to receive futile critical care, blood products represent a healthcare resource that has the potential to be used without achieving the goals of medicine. But unlike many other medical treatments, the ability to maintain an adequate blood supply for transfusion relies on altruistic blood donors, individuals who are simply motivated by a desire to achieve a healthcare good.13 Explicit guidelines on the use of blood products should be developed to ensure that the use of this precious resource achieves meaningful goals. These goals need to be transparently defined such that a physician’s decision to not transfuse is expected as part of evidence-based medicine. Empiric research, educational interventions, and clearly delineated conflict-resolution processes may improve clinicians’ ability to handle these difficult cases.15
Disclosure
T. Neville was supported by the UCLA CTSI KL2 UL1TR000124, the NIH-NIA 1K23AG047900 - 01A1, and the NIH Loan Repayment Program grant. This project was supported by a donation from Mary Kay Farley to RAND Health. The funder played no role in the design and conduct of the study; collection, management, analysis, and interpretation of the data; or preparation, review, or approval of the manuscript. The authors have no conflicts of interest to disclose.
1. Palda VA, Bowman KW, McLean RF, Chapman MG. “Futile” care: do we provide it? Why? A semistructured, Canada-wide survey of intensive care unit doctors and nurses. J Crit Care. 2005;20:207-213. PubMed
2. Piers RD, Azoulay E, Ricou B, et al. Perceptions of appropriateness of care among European and Israeli intensive care unit nurses and physicians. JAMA. 2011;306:2694-2703. PubMed
3. Huang S, Dang H, Huynh W, Sambrook PJ, Goss AN. The healing of dental extraction sockets in patients with Type 2 diabetes on oral hypoglycaemics: a prospective cohort. Aust Dent J. 2013;58:89-93. PubMed
4. Angus DC, Barnato AE, Linde-Zwirble WT, et al. Use of intensive care at the end of life in the United States: an epidemiologic study. Crit Care Med. 2004;32:638-643. PubMed
5. Wunsch H, Linde-Zwirble WT, Harrison DA, Barnato AE, Rowan KM, Angus DC. Use of intensive care services during terminal hospitalizations in England and the United States. Am J Respir Crit Care Med. 2009;180:875-880. PubMed
6. Esserman L, Belkora J, Lenert L. Potentially ineffective care. A new outcome to assess the limits of critical care. JAMA. 1995;274:1544-1551. PubMed
7. Agency for Healthcare Research and Quality: HCUP facts and figures: statistics on hospital-based care in the United States. 2009. https://www.hcup-us.ahrq.gov/reports/factsandfigures/2009/TOC_2009.jsp. Accessed July 15, 2016.
8. Goodnough LT, Maggio P, Hadhazy E, et al. Restrictive blood transfusion practices are associated with improved patient outcomes. Transfusion. 2014;54:2753-2759. PubMed
9. Shander AS, Goodnough LT. Blood transfusion as a quality indicator in cardiac surgery. JAMA. 2010;304:1610-1611. PubMed
10. Hebert PC, Wells G, Blajchman MA, et al. A multicenter, randomized, controlled clinical trial of transfusion requirements in critical care. Transfusion Requirements in Critical Care Investigators, Canadian Critical Care Trials Group. N Engl J Med. 1999;340:409-417. PubMed
11. Morton J, Anastassopoulos KP, Patel ST, et al. Frequency and outcomes of blood products transfusion across procedures and clinical conditions warranting inpatient care: an analysis of the 2004 healthcare cost and utilization project nationwide inpatient sample database. Am J Med Qual. 2010;25:289-296. PubMed
12. Shander A, Fink A, Javidroozi M, et al. Appropriateness of allogeneic red blood cell transfusion: the international consensus conference on transfusion outcomes. Transfus Med Rev. 2011;25:232-246 e53. PubMed
13. Bednall TC, Bove LL. Donating blood: a meta-analytic review of self-reported motivators and deterrents. Transfus Med Rev. 2011;25:317-334. PubMed
14. Heitmiller ES, Hill RB, Marshall CE, et al. Blood wastage reduction using Lean Sigma methodology. Transfusion. 2010;50:1887-1896. PubMed
15. Bosslet GT, Pope TM, Rubenfeld GD, et al. An Official ATS/AACN/ACCP/ESICM/SCCM Policy Statement: Responding to Requests for Potentially Inappropriate Treatments in Intensive Care Units. Am J Respir Crit Care Med. 2015;191:1318-1330. PubMed
© 2017 Society of Hospital Medicine
Magnitude of Potentially Inappropriate Thrombophilia Testing in the Inpatient Hospital Setting
Venous thromboembolism (VTE) affects more than 1 million patients and costs the US healthcare system more than $1.5 billion annually.1 Inherited and acquired thrombophilias have been perceived as important risk factors in assessing the risk of VTE recurrence and guiding the duration of anticoagulation.
Thrombophilias increase the risk of a first thrombotic event, but existing data have failed to demonstrate the usefulness of routine thrombophilia screening on subsequent management.2,3 Moreover, thrombophilia testing ordered in the context of an inpatient hospitalization is limited by confounding factors, especially during an acute thrombotic event or in the setting of concurrent anticoagulation.4
Recognizing the costliness of routine thrombophilia testing, The American Society of Hematology introduced its Choosing Wisely campaign in 2013 in an effort to reduce test ordering in the setting of provoked VTEs with a major transient risk factor.5 In order to define current practice behavior at our institution, we conducted a retrospective study to determine the magnitude and financial impact of potentially inappropriate thrombophilia testing in the inpatient setting.
METHODS
We performed a retrospective analysis of thrombophilia testing across all inpatient services at a large, quaternary-care academic institution over a 2-year period. Electronic medical record data containing all thrombophilia tests ordered on inpatients from June 2013 to June 2015 were obtained. This study was exempt from institutional review board approval.
Inclusion criteria included any inpatient for which thrombophilia testing occurred. Patients were excluded if testing was ordered in the absence of VTE or arterial thrombosis or if it was ordered as part of a work-up for another medical condition (see Supplementary Material).
Thrombophilia testing was defined as any of the following: inherited thrombophilias (Factor V Leiden or prothrombin 20210 gene mutations, antithrombin, or protein C or S activity levels) or acquired thrombophilias (lupus anticoagulant [Testing refers to the activated partial thromboplastin time lupus assay.], beta-2 glycoprotein 1 immunoglobulins M and G, anticardiolipin immunoglobulins M and G, dilute Russell’s viper venom time, or JAK2 V617F mutations).
Extracted data included patient age, sex, type of thrombophilia test ordered, ordering primary service, admission diagnosis, and objective confirmation of thrombotic events. The indication for test ordering was determined via medical record review of the patient’s corresponding hospitalization. Each test was evaluated in the context of the patient’s presenting history, hospital course, active medications, accompanying laboratory and radiographic studies, and consultant recommendations to arrive at a conclusion regarding both the test’s reason for ordering and whether its indication was “inappropriate,” “appropriate,” or “equivocal.” Cost data were obtained through the Centers for Medicare & Medicaid Services (CMS) Clinical Laboratory Fee Schedule for 2016 (see Supplementary Material).6
The criteria for defining test appropriateness were formulated by utilizing a combination of major society guidelines and literature review.5,7-10 The criteria placed emphasis upon the ordered tests’ clinical relevance and reliability and were subsequently reviewed by a senior hematologist with specific expertise in thrombosis (see Supplementary Material).
Two internal medicine resident physician data reviewers independently evaluated the ordered tests. To ensure consistency between reviewers, a sample of identical test orders was compared for concordance, and a Cohen’s kappa coefficient was calculated. For purposes of analysis, equivocal orders were included under the appropriate category, as this study focused on the quantification of potentially inappropriate ordering practices. Pearson chi-square testing was performed in order to compare ordering practices between services using Stata.11
RESULTS
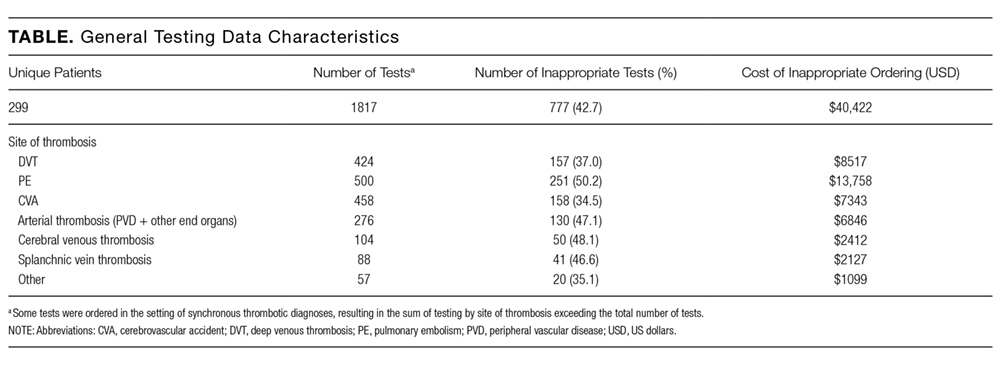
In total, we reviewed 2179 individual tests, of which 362 (16.6%) were excluded. The remaining 1817 tests involved 299 patients across 26 primary specialties. Fifty-two (2.9% of orders) were ultimately deemed equivocal. The Table illustrates the overall proportion and cost of inappropriate test ordering as well as testing characteristics of the most commonly encountered thrombotic diagnoses. The Figure illustrates the proportion of potentially inappropriate test ordering with its associated cost by test type.
Orders for Factor V Leiden, prothrombin 20210, and protein C and S activity levels were most commonly deemed inappropriate due to the test results’ failure to alter clinical management (97.3%, 99.2%, 99.4% of their inappropriate orders, respectively). Antithrombin testing (59.4%) was deemed inappropriate most commonly in the setting of acute thrombosis. The lupus anticoagulant (82.8%) was inappropriately ordered most frequently in the setting of concurrent anticoagulation.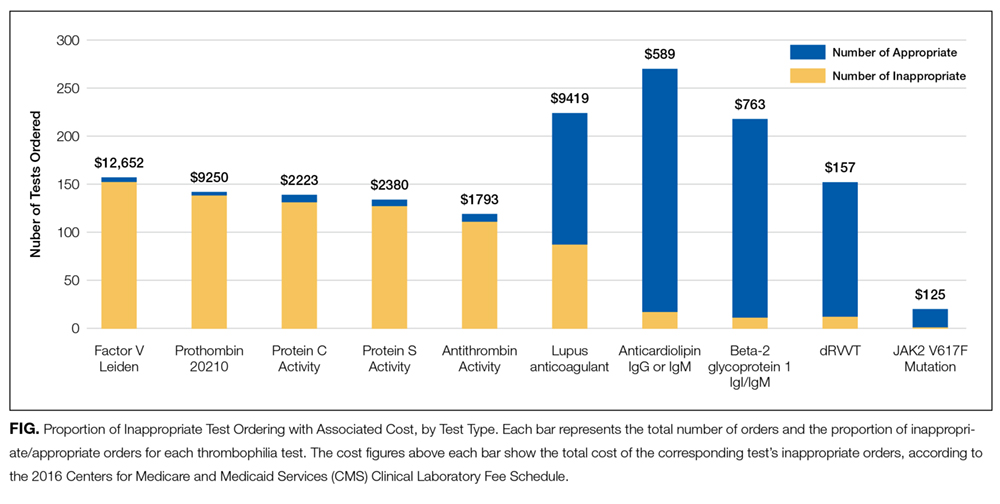
Ordering practices were then compared between nonteaching and teaching inpatient general medicine services. We observed a higher proportion of inappropriate tests ordered by the nonteaching services as compared to the teaching services (120 of 173 orders [69.4%] versus 125 of 320 [39.1%], respectively; P < 0.001).
The interreviewer kappa coefficient was 0.82 (P < 0.0001).
DISCUSSION
This retrospective analysis represents one of the largest examinations of inpatient thrombophilia testing practices to date. Our results illustrate the high prevalence and significant financial impact of potentially inappropriate thrombophilia testing conducted in the inpatient setting. The data confirm that, per our defined criteria, more than 90% of inherited thrombophilia testing was potentially inappropriate while the majority of acquired thrombophilia testing was appropriate, with the exception of the lupus anticoagulant.
Even when appropriately ordered, studies suggest that positive thrombophilia screening results fail to impact outcomes in most patients with VTE. In an effort to evaluate positive results’ potential to provide a basis from which to extend the duration of anticoagulation, and therefore reduce the risk of a recurrent VTE, a case-control analysis was performed on a series of patients with a first-VTE event (Multiple Environmental and Genetic Assessment of risk factors for venous thrombosis [MEGA] study).3 In examining the odds ratio (OR) for recurrence between patients who did or did not undergo testing for Factor V Leiden, antithrombin, or protein C or S activity, the data failed to show an impact of testing on the risk of VTE recurrence (OR 1.2; confidence interval, 0.8-1.8). In fact, decision making has increasingly relied on patients’ clinical characteristics rather than thrombophilia test results to guide anticoagulation duration after incident VTEs. A 2017 study illustrated that when using a clinical decision rule (Clinical Decision Rule Validation Study to Predict Low Recurrent Risk in Patients With Unprovoked Venous Thromboembolism [REVERSE criteria]) in patients with a first, unprovoked VTE, routine thrombophilia screening added little to determining the need for prolonged anticoagulation.12 These findings support the limited clinical utility of current test ordering practices for the prediction and management of recurrent venous thrombosis.
Regarding the acquired thrombophilias, antiphospholipid antibody testing was predominantly ordered in a justified manner, which is consistent with the notion that test results could affect clinical management, such as anticoagulation duration or choice of anticoagulant.13 However, the validity of lupus anticoagulant testing was limited by the frequency of patients on concurrent anticoagulation.
Financially, the cumulative cost associated with inappropriate ordering was substantial, regardless of the thrombotic event in question. Moreover, our calculated costs are derived from CMS reimbursement rates and likely underestimate the true financial impact of errant testing given that commercial laboratories frequently charge at rates several-fold higher. On a national scale, prior analyses have suggested that the annual cost of thrombophilia testing, based on typical commercial rates, ranges from $300 million to $672 million.14
Researchers in prior studies have similarly examined the frequency of inappropriate thrombophilia testing and methods to reduce it. Researchers in a 2014 study demonstrated initially high rates of inappropriate inherited thrombophilia testing, and then showed marked reductions in testing and cost savings across multiple specialties following the introduction of a flowchart on a preprinted order form.15 Our findings provide motivation to perform similar endeavors.
The proportional difference of inappropriate ordering observed between nonteaching- and teaching-medicine services indicates a potential role for educational interventions. We recently completed a series of lectures on high-value thrombophilia ordering for residents and are actively analyzing its impact on subsequent ordering practices. We are also piloting an electronic best practice advisory for thrombophilia test ordering. Though the advisory may be overridden, providers are asked to provide justification for doing so on a voluntary basis. We plan to evaluate its effect on our findings reported in this study.
We acknowledge that our exclusion criteria resulted in the omission of testing across a spectrum of nonthrombotic clinical conditions, raising the question of selection bias. Because there are no established guidelines to determine the appropriateness of testing in these scenarios, we chose to limit the analysis of errant ordering to the context of thrombotic events. Other limitations of this study include the analysis of equivocal orders as appropriate. However, because equivocal ordering represented less than 3% of all analyzed orders, including these as inappropriate would not have significantly altered our findings.
CONCLUSIONS
A review of thrombophilia testing practices at our institution demonstrated that inappropriate testing in the inpatient setting is a frequent phenomenon associated with a significant financial impact. This effect was more pronounced in inherited versus acquired thrombophilia testing. Testing was frequently confounded and often failed to impact patients’ short- or long-term clinical management, regardless of the result.
These findings serve as a strong impetus to reduce the burden of routine thrombophilia testing during hospital admissions. Our data demonstrate a need for institution-wide changes such as implementing best practice advisories, introducing ordering restrictions, and conducting educational interventions in order to reduce unnecessary expenditures and improve patient care.
Disclosure
The authors have nothing to disclose.
1. Dobesh PP. Economic burden of venous thromboembolism in hospitalized patients. Pharmacotherapy. 2009;29(8):943-953. PubMed
2. Cohn DM, Vansenne F, de Borgie CA, Middeldorp S. Thrombophilia testing for prevention of recurrent venous thromboembolism. Cochrane Database Syst Rev. 2012;12:Cd007069. PubMed
3. Coppens M, Reijnders JH, Middeldorp S, Doggen CJ, Rosendaal FR. Testing for inherited thrombophilia does not reduce the recurrence of venous thrombosis. J Thromb Haemost. 2008;6(9):1474-1477. PubMed
4. Somma J, Sussman, II, Rand JH. An evaluation of thrombophilia screening in an urban tertiary care medical center: A “real world” experience. Am J Clin Pathol. 2006;126(1):120-127. PubMed
5. Hicks LK, Bering H, Carson KR, et al. The ASH Choosing Wisely® campaign: five hematologic tests and treatments to question. Blood. 2013;122(24):3879-3883. PubMed
6. Centers for Medicare & Medicaid Services: Clinical Laboratory Fee Schedule Files. https://www.cms.gov/Medicare/Medicare-Fee-for-Service-Payment/ClinicalLabFeeSched/Clinical-Laboratory-Fee-Schedule-Files.html. Accessed October 2016
7. Stevens SM, Woller SC, Bauer KA, et al. Guidance for the evaluation and treatment of hereditary and acquired thrombophilia. J Thromb Thrombolysis. 2016;41(1):154-164. PubMed
8. Moll S. Thrombophilia: clinical-practical aspects. J Thromb Thrombolysis. 2015;39(3):367-378. PubMed
9. Kearon C, Akl EA, Ornelas J, et al. Antithrombotic therapy for vte disease: Chest guideline and expert panel report. Chest. 2016;149(2):315-352. PubMed
10. Baglin T, Gray E, Greaves M, et al. Clinical guidelines for testing for heritable thrombophilia. Br J Haematol. 2010;149(2):209-220. PubMed
11. Stata Statistical Software [computer program]. Version Release 14. College Station, TX: StataCorp LP; 2015.
12. Garcia-Horton A, Kovacs MJ, Abdulrehman J, Taylor JE, Sharma S, Lazo-Langner A. Impact of thrombophilia screening on venous thromboembolism management practices. Thromb Res.149:76-80. PubMed
13. Schulman S, Svenungsson E, Granqvist S. Anticardiolipin antibodies predict early recurrence of thromboembolism and death among patients with venous thromboembolism following anticoagulant therapy. Duration of Anticoagulation Study Group. Am J Med. 1998;104(4):332-338. PubMed
14. Petrilli CM, Heidemann L, Mack M, Durance P, Chopra V. Inpatient inherited thrombophilia testing. J Hosp Med. 2016;11(11):801-804. PubMed
15. Smith TW, Pi D, Hudoba M, Lee AY. Reducing inpatient heritable thrombophilia testing using a clinical decision-making tool. J Clin Pathol. 2014;67(4):345-349. PubMed
Venous thromboembolism (VTE) affects more than 1 million patients and costs the US healthcare system more than $1.5 billion annually.1 Inherited and acquired thrombophilias have been perceived as important risk factors in assessing the risk of VTE recurrence and guiding the duration of anticoagulation.
Thrombophilias increase the risk of a first thrombotic event, but existing data have failed to demonstrate the usefulness of routine thrombophilia screening on subsequent management.2,3 Moreover, thrombophilia testing ordered in the context of an inpatient hospitalization is limited by confounding factors, especially during an acute thrombotic event or in the setting of concurrent anticoagulation.4
Recognizing the costliness of routine thrombophilia testing, The American Society of Hematology introduced its Choosing Wisely campaign in 2013 in an effort to reduce test ordering in the setting of provoked VTEs with a major transient risk factor.5 In order to define current practice behavior at our institution, we conducted a retrospective study to determine the magnitude and financial impact of potentially inappropriate thrombophilia testing in the inpatient setting.
METHODS
We performed a retrospective analysis of thrombophilia testing across all inpatient services at a large, quaternary-care academic institution over a 2-year period. Electronic medical record data containing all thrombophilia tests ordered on inpatients from June 2013 to June 2015 were obtained. This study was exempt from institutional review board approval.
Inclusion criteria included any inpatient for which thrombophilia testing occurred. Patients were excluded if testing was ordered in the absence of VTE or arterial thrombosis or if it was ordered as part of a work-up for another medical condition (see Supplementary Material).
Thrombophilia testing was defined as any of the following: inherited thrombophilias (Factor V Leiden or prothrombin 20210 gene mutations, antithrombin, or protein C or S activity levels) or acquired thrombophilias (lupus anticoagulant [Testing refers to the activated partial thromboplastin time lupus assay.], beta-2 glycoprotein 1 immunoglobulins M and G, anticardiolipin immunoglobulins M and G, dilute Russell’s viper venom time, or JAK2 V617F mutations).
Extracted data included patient age, sex, type of thrombophilia test ordered, ordering primary service, admission diagnosis, and objective confirmation of thrombotic events. The indication for test ordering was determined via medical record review of the patient’s corresponding hospitalization. Each test was evaluated in the context of the patient’s presenting history, hospital course, active medications, accompanying laboratory and radiographic studies, and consultant recommendations to arrive at a conclusion regarding both the test’s reason for ordering and whether its indication was “inappropriate,” “appropriate,” or “equivocal.” Cost data were obtained through the Centers for Medicare & Medicaid Services (CMS) Clinical Laboratory Fee Schedule for 2016 (see Supplementary Material).6
The criteria for defining test appropriateness were formulated by utilizing a combination of major society guidelines and literature review.5,7-10 The criteria placed emphasis upon the ordered tests’ clinical relevance and reliability and were subsequently reviewed by a senior hematologist with specific expertise in thrombosis (see Supplementary Material).
Two internal medicine resident physician data reviewers independently evaluated the ordered tests. To ensure consistency between reviewers, a sample of identical test orders was compared for concordance, and a Cohen’s kappa coefficient was calculated. For purposes of analysis, equivocal orders were included under the appropriate category, as this study focused on the quantification of potentially inappropriate ordering practices. Pearson chi-square testing was performed in order to compare ordering practices between services using Stata.11
RESULTS
In total, we reviewed 2179 individual tests, of which 362 (16.6%) were excluded. The remaining 1817 tests involved 299 patients across 26 primary specialties. Fifty-two (2.9% of orders) were ultimately deemed equivocal. The Table illustrates the overall proportion and cost of inappropriate test ordering as well as testing characteristics of the most commonly encountered thrombotic diagnoses. The Figure illustrates the proportion of potentially inappropriate test ordering with its associated cost by test type.
Orders for Factor V Leiden, prothrombin 20210, and protein C and S activity levels were most commonly deemed inappropriate due to the test results’ failure to alter clinical management (97.3%, 99.2%, 99.4% of their inappropriate orders, respectively). Antithrombin testing (59.4%) was deemed inappropriate most commonly in the setting of acute thrombosis. The lupus anticoagulant (82.8%) was inappropriately ordered most frequently in the setting of concurrent anticoagulation.
Ordering practices were then compared between nonteaching and teaching inpatient general medicine services. We observed a higher proportion of inappropriate tests ordered by the nonteaching services as compared to the teaching services (120 of 173 orders [69.4%] versus 125 of 320 [39.1%], respectively; P < 0.001).
The interreviewer kappa coefficient was 0.82 (P < 0.0001).
DISCUSSION
This retrospective analysis represents one of the largest examinations of inpatient thrombophilia testing practices to date. Our results illustrate the high prevalence and significant financial impact of potentially inappropriate thrombophilia testing conducted in the inpatient setting. The data confirm that, per our defined criteria, more than 90% of inherited thrombophilia testing was potentially inappropriate while the majority of acquired thrombophilia testing was appropriate, with the exception of the lupus anticoagulant.
Even when appropriately ordered, studies suggest that positive thrombophilia screening results fail to impact outcomes in most patients with VTE. In an effort to evaluate positive results’ potential to provide a basis from which to extend the duration of anticoagulation, and therefore reduce the risk of a recurrent VTE, a case-control analysis was performed on a series of patients with a first-VTE event (Multiple Environmental and Genetic Assessment of risk factors for venous thrombosis [MEGA] study).3 In examining the odds ratio (OR) for recurrence between patients who did or did not undergo testing for Factor V Leiden, antithrombin, or protein C or S activity, the data failed to show an impact of testing on the risk of VTE recurrence (OR 1.2; confidence interval, 0.8-1.8). In fact, decision making has increasingly relied on patients’ clinical characteristics rather than thrombophilia test results to guide anticoagulation duration after incident VTEs. A 2017 study illustrated that when using a clinical decision rule (Clinical Decision Rule Validation Study to Predict Low Recurrent Risk in Patients With Unprovoked Venous Thromboembolism [REVERSE criteria]) in patients with a first, unprovoked VTE, routine thrombophilia screening added little to determining the need for prolonged anticoagulation.12 These findings support the limited clinical utility of current test ordering practices for the prediction and management of recurrent venous thrombosis.
Regarding the acquired thrombophilias, antiphospholipid antibody testing was predominantly ordered in a justified manner, which is consistent with the notion that test results could affect clinical management, such as anticoagulation duration or choice of anticoagulant.13 However, the validity of lupus anticoagulant testing was limited by the frequency of patients on concurrent anticoagulation.
Financially, the cumulative cost associated with inappropriate ordering was substantial, regardless of the thrombotic event in question. Moreover, our calculated costs are derived from CMS reimbursement rates and likely underestimate the true financial impact of errant testing given that commercial laboratories frequently charge at rates several-fold higher. On a national scale, prior analyses have suggested that the annual cost of thrombophilia testing, based on typical commercial rates, ranges from $300 million to $672 million.14
Researchers in prior studies have similarly examined the frequency of inappropriate thrombophilia testing and methods to reduce it. Researchers in a 2014 study demonstrated initially high rates of inappropriate inherited thrombophilia testing, and then showed marked reductions in testing and cost savings across multiple specialties following the introduction of a flowchart on a preprinted order form.15 Our findings provide motivation to perform similar endeavors.
The proportional difference of inappropriate ordering observed between nonteaching- and teaching-medicine services indicates a potential role for educational interventions. We recently completed a series of lectures on high-value thrombophilia ordering for residents and are actively analyzing its impact on subsequent ordering practices. We are also piloting an electronic best practice advisory for thrombophilia test ordering. Though the advisory may be overridden, providers are asked to provide justification for doing so on a voluntary basis. We plan to evaluate its effect on our findings reported in this study.
We acknowledge that our exclusion criteria resulted in the omission of testing across a spectrum of nonthrombotic clinical conditions, raising the question of selection bias. Because there are no established guidelines to determine the appropriateness of testing in these scenarios, we chose to limit the analysis of errant ordering to the context of thrombotic events. Other limitations of this study include the analysis of equivocal orders as appropriate. However, because equivocal ordering represented less than 3% of all analyzed orders, including these as inappropriate would not have significantly altered our findings.
CONCLUSIONS
A review of thrombophilia testing practices at our institution demonstrated that inappropriate testing in the inpatient setting is a frequent phenomenon associated with a significant financial impact. This effect was more pronounced in inherited versus acquired thrombophilia testing. Testing was frequently confounded and often failed to impact patients’ short- or long-term clinical management, regardless of the result.
These findings serve as a strong impetus to reduce the burden of routine thrombophilia testing during hospital admissions. Our data demonstrate a need for institution-wide changes such as implementing best practice advisories, introducing ordering restrictions, and conducting educational interventions in order to reduce unnecessary expenditures and improve patient care.
Disclosure
The authors have nothing to disclose.
1. Dobesh PP. Economic burden of venous thromboembolism in hospitalized patients. Pharmacotherapy. 2009;29(8):943-953. PubMed
2. Cohn DM, Vansenne F, de Borgie CA, Middeldorp S. Thrombophilia testing for prevention of recurrent venous thromboembolism. Cochrane Database Syst Rev. 2012;12:Cd007069. PubMed
3. Coppens M, Reijnders JH, Middeldorp S, Doggen CJ, Rosendaal FR. Testing for inherited thrombophilia does not reduce the recurrence of venous thrombosis. J Thromb Haemost. 2008;6(9):1474-1477. PubMed
4. Somma J, Sussman, II, Rand JH. An evaluation of thrombophilia screening in an urban tertiary care medical center: A “real world” experience. Am J Clin Pathol. 2006;126(1):120-127. PubMed
5. Hicks LK, Bering H, Carson KR, et al. The ASH Choosing Wisely® campaign: five hematologic tests and treatments to question. Blood. 2013;122(24):3879-3883. PubMed
6. Centers for Medicare & Medicaid Services: Clinical Laboratory Fee Schedule Files. https://www.cms.gov/Medicare/Medicare-Fee-for-Service-Payment/ClinicalLabFeeSched/Clinical-Laboratory-Fee-Schedule-Files.html. Accessed October 2016
7. Stevens SM, Woller SC, Bauer KA, et al. Guidance for the evaluation and treatment of hereditary and acquired thrombophilia. J Thromb Thrombolysis. 2016;41(1):154-164. PubMed
8. Moll S. Thrombophilia: clinical-practical aspects. J Thromb Thrombolysis. 2015;39(3):367-378. PubMed
9. Kearon C, Akl EA, Ornelas J, et al. Antithrombotic therapy for vte disease: Chest guideline and expert panel report. Chest. 2016;149(2):315-352. PubMed
10. Baglin T, Gray E, Greaves M, et al. Clinical guidelines for testing for heritable thrombophilia. Br J Haematol. 2010;149(2):209-220. PubMed
11. Stata Statistical Software [computer program]. Version Release 14. College Station, TX: StataCorp LP; 2015.
12. Garcia-Horton A, Kovacs MJ, Abdulrehman J, Taylor JE, Sharma S, Lazo-Langner A. Impact of thrombophilia screening on venous thromboembolism management practices. Thromb Res.149:76-80. PubMed
13. Schulman S, Svenungsson E, Granqvist S. Anticardiolipin antibodies predict early recurrence of thromboembolism and death among patients with venous thromboembolism following anticoagulant therapy. Duration of Anticoagulation Study Group. Am J Med. 1998;104(4):332-338. PubMed
14. Petrilli CM, Heidemann L, Mack M, Durance P, Chopra V. Inpatient inherited thrombophilia testing. J Hosp Med. 2016;11(11):801-804. PubMed
15. Smith TW, Pi D, Hudoba M, Lee AY. Reducing inpatient heritable thrombophilia testing using a clinical decision-making tool. J Clin Pathol. 2014;67(4):345-349. PubMed
© 2017 Society of Hospital Medicine
Antidepressant Use and Depressive Symptoms in Intensive Care Unit Survivors
As the number of intensive care unit (ICU) survivors has steadily increased over the past few decades, there is growing awareness of the long-term physical, cognitive, and psychological impairments after ICU hospitalization, collectively known as post–intensive care syndrome (PICS).1 Systematic reviews based mostly on research studies suggest that the prevalence of depressive symptoms 2-12 months after ICU discharge is nearly 30%.2-5 Due to the scarcity of established models of care for ICU survivors, there is limited characterization of depressive symptoms and antidepressant regimens in this clinical population. The Critical Care Recovery Center (CCRC) at Eskenazi Hospital is one of the first ICU survivor clinics in the United States and targets a racially diverse, underserved population in the Indianapolis metropolitan area.6 In this study, we examined whether patients had depressive symptoms at their initial CCRC visit, and whether the risk factors for depressive symptoms differed if they were on an antidepressant at their initial CCRC visit.
METHODS
Referral criteria to the CCRC were 18 years or older, admitted to the Eskenazi ICU, were on mechanical ventilation or delirious for ≥48 hours (major risk factors for the development of PICS), and recommended for follow-up by a critical care physician. The exclusion criterion included was enrollment in hospice or palliative care services. Institutional review board approval was obtained to conduct retrospective analyses of de-identified clinical data. Medical history and medication lists were collected from patients, informal caregivers, and electronic medical records.
Two hundred thirty-three patients were seen in the CCRC from July 2011 to August 2016. Two hundred four patients rated symptoms of depression with either the Patient Health Questionnaire (PHQ-9; N = 99) or Geriatric Depression Scale (GDS-30; N = 105) at their initial visit to the CCRC prior to receiving any treatment at the CCRC. Twenty-nine patients who did not complete depression questionnaires were excluded from the analyses. Patients with PHQ-9 score ≥10 or GDS score ≥20 were categorized as having moderate to severe depressive symptoms.7,8
Electronic medical records were reviewed to determine whether patients were on an antidepressant at hospital admission, hospital discharge, and the initial CCRC visit prior to any treatment in the CCRC. Patients who were on a tricyclic antidepressant, selective serotonin reuptake inhibitor, selective serotonin-norepinephrine reuptake inhibitor, noradrenergic and specific serotonergic antidepressant (eg, mirtazapine), or norepinephrine and dopaminergic reuptake inhibitor (eg, bupropion) at any dose were designated as being on an antidepressant. Prescribers of antidepressants included primary care providers, clinical providers during their hospital stay, and various outpatient subspecialists other than those in the CCRC.
We then examined whether the risk factors for depressive symptoms differed if patients were on an antidepressant at their initial CCRC visit. We compared demographic and clinical characteristics between depressed and nondepressed patients not on an antidepressant. We repeated these analyses for those on an antidepressant. Dichotomous outcomes were compared using chi-square testing, and two-way Student t tests for continuous outcomes. Demographic and clinical variables with P < 0.1 were included as covariates in a logistic regression model for depressive symptoms separately for those not an antidepressant and those on an antidepressant. History of depression was not included as a covariate because it is highly collinear with post-ICU depression.
RESULTS
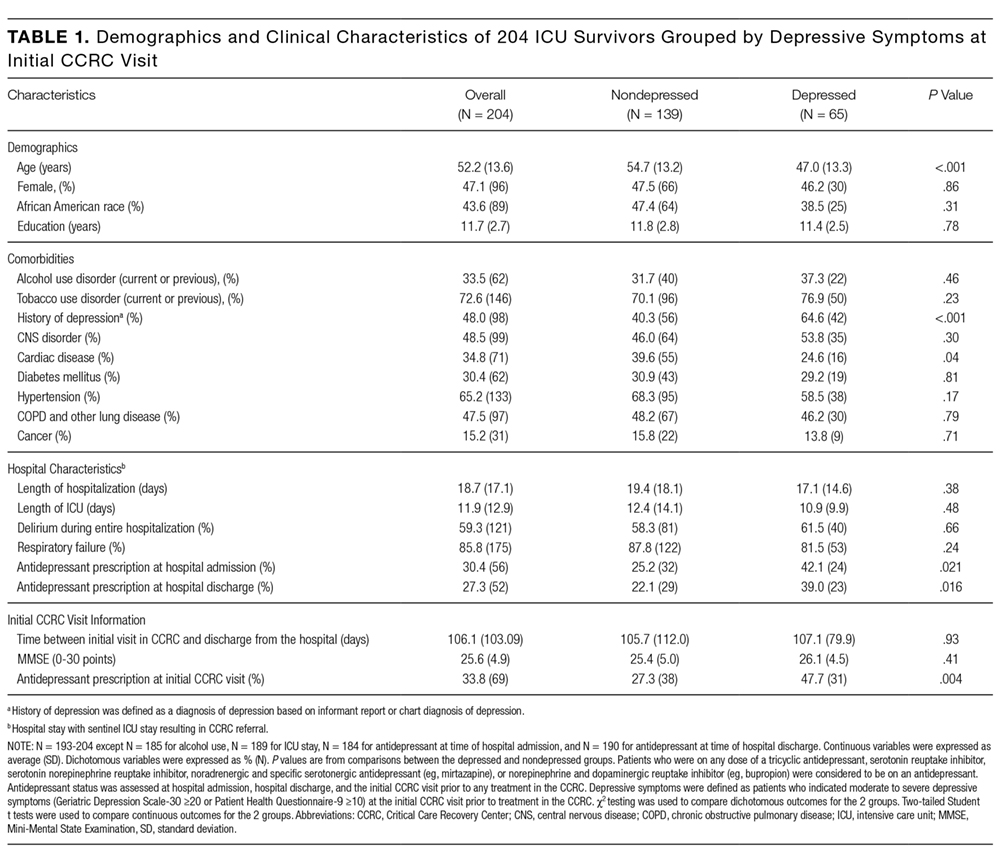
Two hundred four ICU survivors in this study reflected a racially diverse and underserved population (monthly income $745.3 ± $931.5). Although most had respiratory failure and/or delirium during their hospital stay, 94.1% (N = 160) mostly lived independently after discharge. Nearly one-third of patients (N = 69) were on at least 1 antidepressant at their initial CCRC visit. Of these 69 patients, 60.9% (N = 42) had an antidepressant prescription on hospital admission, and 60.9% (N = 42) had an antidepressant prescription on hospital discharge.
We first compared the demographic and clinical characteristics of patients with and without depressive symptoms at their initial CCRC visit. Patients with depressive symptoms were younger, less likely to have cardiac disease, more likely to have a history of depression, more likely to have been prescribed an antidepressant on hospital admission, more likely to be prescribed an antidepressant on hospital discharge, and more likely to be on an antidepressant at their initial CCRC visit (Table 1).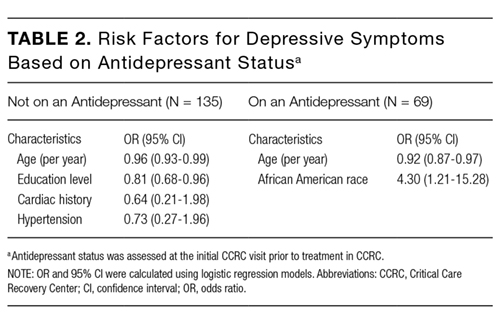
Patients with depressive symptoms on an antidepressant (n = 65) were younger and more likely to be African American (borderline significance; Supplementary Table 2). Multivariate logistic regression showed that both younger age (OR = 0.92 per year, P = 0.003) and African American race (OR = 4.3, P = 0.024) remained significantly associated with depressive symptoms (Table 2).
DISCUSSION
Our study demonstrated that about one-third of our ICU survivor clinical cohort had untreated or inadequately treated depressive symptoms at their CCRC initial visit. Many patients with depressive symptoms had a history of depression and/or antidepressant prescription on hospital admission. This suggests that pre-ICU depression is a major contributor to post-ICU depression. These findings are consistent with the results of a large retrospective analysis of Danish ICU survivors that found that patients were more likely to have premorbid psychiatric diagnoses, compared with the general population.9 Another ICU survivor research study that excluded patients who were on antidepressants prior to ICU hospitalization found that 49% of these patients were on an antidepressant after their ICU stay.10 Our much lower rate of patients on an antidepressant after their ICU stay may reflect the differences between patient populations, differences in healthcare systems, and differences in clinician prescribing practices.
Younger age was associated with a higher likelihood of depressive symptoms independent of antidepressant status. Findings about the relationship between age and post-ICU depression have varied. The Bringing to Light the Risk Factors and Incidence of Neuropsychological Dysfunction in ICU Survivors group found that older age was associated with more depressive symptoms at 12 months postdischarge.11 On the other hand, a systematic review of post-ICU depression did not find any relationship between age and post-ICU depression.2,3 These differences may be due in part to demographic variations in cohorts.
Our logistic regression models suggest that there may also be different risk factors in patients who had untreated vs inadequately treated depressive symptoms. Patients who were not on an antidepressant at their initial CCRC visit were more likely to have a lower level of education. This is consistent with the Medical Expenditure Panel Surveys study, which showed that adults with less than a high school education were less likely to receive depression treatment.12 In patients who were on antidepressants at their initial CCRC visit, African Americans were more likely to have depressive symptoms. Possible reasons may include differences in receiving guideline-concordant antidepressant medication treatment, access to mental health subspecialty services, higher prevalence of treatment refractory depression, and differences in responses to antidepressant treatments.13,14
Strengths of our study include detailed characterization for a fairly large ICU survivor clinic population and a racially diverse cohort. To the best of our knowledge, our study is also the first to examine whether there may be different risk factors for depressive symptoms based on antidepressant status. Limitations include the lack of information about nonpharmacologic antidepressant treatment and the inability to assess whether noncompliance, insufficient dose, or insufficient time on antidepressants contributed to inadequate antidepressant treatment. Antidepressants may have also been prescribed for other purposes such as smoking cessation, neuropathic pain, and migraine headaches. However, because 72.4% of patients on antidepressants had a history of depression, it is likely that most of them were on antidepressants to treat depression.
Other limitations include potential biases in our clinical cohort. Over the last 5 years, the CCRC has provided care to more than 200 ICU survivors. With 1100 mechanically ventilated admissions per year, only 1.8% of survivors are seen. The referral criteria for the CCRC is a major source of selection bias, which likely overrepresents PICS. Because patients are seen in the CCRC about 3 months after hospital discharge, there is also informant censoring due to death. Physically sicker survivors in nursing home facilities were less likely to be included. Finally, the small cohort size may have resulted in an underpowered study.
Future studies will need to confirm our findings about the high prevalence of post-ICU depression and different responses to antidepressant medications by certain groups. Pre-ICU depression, lack of antidepressant treatment, and inadequate antidepressant treatment are major causes of post-ICU depression. Currently, the CCRC offers pharmacotherapy, problem-solving therapy, or referral to mental health specialists to treat patients with depressive symptoms. ICU survivor clinics, such as the CCRC, may become important settings that allow for increased access to depression treatment for those at higher risk for post-ICU depression as well as the testing of new antidepressant regimens for those with inadequately treated depression.
Acknowledgments
The authors thank Dr. Adil Sheikh for assistance with data entry and Cynthia Reynolds for her clinical services. Grant support: The Critical Care Recovery Center (CCRC) is supported by Eskenazi Health Services. SW is supported by NIA 2P30AG010133. SG is supported by NIA 2P30AG010133 and NIA 5R01AG045350. SK is supported by NHBLI 5T32HL091816-07. MB is supported by NIA R01 AG040220-05, AHRQ P30 HS024384-02, CMS 1 L1 CMS331444-02-00 and NIA R01 AG030618-05A1. BK is supported by NIA K23-AG043476 and NHLBI R01HL131730.
Disclosure
There are no conflicts of interest. None of the above NIH grants supported the CCRC or this work.
1. Needham DM, Davidson J, Cohen H, et al. Improving long-term outcomes after discharge from intensive care unit: report from a stakeholders’ conference. Crit Care Med. 2012;40:502-509. PubMed
2. Davydow DS, Gifford JM, Desai SV, Bienvenu OJ, Needham DM. Depression in general intensive care unit survivors: a systematic review. Intensive Care Med. 2009;35:796-809. PubMed
3. Rabiee A, Nikayin S, Hashem MD, et al. Depressive symptoms after critical illness: a systematic review and meta-analysis. Crit Care Med. 2016;44(9):1744-1753. PubMed
4. Huang M, Parker AM, Bienvenu OJ, et al. Psychiatric symptoms in acute respiratory distress syndrome survivors: A 1-year national multicenter study. Crit Care Med 2016;44:954-965. PubMed
5. Bienvenu OJ, Colantuoni E, Mendez-Tellez PA, et al. Cooccurrence of and remission from general anxiety, depression, and posttraumatic stress disorder symptoms after acute lung injury: a 2-year longitudinal study. Crit Care Med. 2015;43:642-653. PubMed
6. Khan BA, Lasiter S, Boustani MA. CE: critical care recovery center: an innovative collaborative care model for ICU survivors. Am J Nurs. 2015;115:24-31. PubMed
7. Kroenke K, Spitzer RL, Williams JB. The PHQ-9: validity of a brief depression severity measure. J Gen Intern Med. 2001;16:606-613. PubMed
8. Yesavage JA, Brink TL, Rose TL, et al. Development and validation of a geriatric depression screening scale: a preliminary report. J Psychiatr Res. 1982-1983;17:37-49. PubMed
9. Wuns ch H, Christiansen CF, Johansen MB, et al. Psychiatric diagnoses and psychoactive medication use among nonsurgical critically ill patients receiving mechanical ventilation. JAMA. 2014;311:1133-1142. PubMed
10. Weinert C, Meller W. Epidemiology of depression and antidepressant therapy after acute respiratory failure. Psychosomatics. 2006;47(5):399-407. PubMed
11. Jackson JC, Pandharipande PP, Girard TD, et al. Depression, post-traumatic stress disorder, and functional disability in survivors of critical illness in the BRAIN-ICU study: a longitudinal cohort study. Lancet Respir Med. 2014;2:369-379. PubMed
12. Olfson M, Blanco C, Marcus SC. Treatment of adult depression in the United States. JAMA Intern Med. 2016;176:1482-1491. PubMed
13. González HM, Vega WA, Williams DR, Tarraf W, West BT, Neighbors HW. Depression care in the United States: too little for too few. Arch Gen Psychiatry. 2010;67:37-46. PubMed
14. Bailey RK, Patel M, Barker NC, Ali S, Jabeen S. Major depressive disorder in the African American population. J Natl Med Assoc. 2011;103:548-557. PubMed
As the number of intensive care unit (ICU) survivors has steadily increased over the past few decades, there is growing awareness of the long-term physical, cognitive, and psychological impairments after ICU hospitalization, collectively known as post–intensive care syndrome (PICS).1 Systematic reviews based mostly on research studies suggest that the prevalence of depressive symptoms 2-12 months after ICU discharge is nearly 30%.2-5 Due to the scarcity of established models of care for ICU survivors, there is limited characterization of depressive symptoms and antidepressant regimens in this clinical population. The Critical Care Recovery Center (CCRC) at Eskenazi Hospital is one of the first ICU survivor clinics in the United States and targets a racially diverse, underserved population in the Indianapolis metropolitan area.6 In this study, we examined whether patients had depressive symptoms at their initial CCRC visit, and whether the risk factors for depressive symptoms differed if they were on an antidepressant at their initial CCRC visit.
METHODS
Referral criteria to the CCRC were 18 years or older, admitted to the Eskenazi ICU, were on mechanical ventilation or delirious for ≥48 hours (major risk factors for the development of PICS), and recommended for follow-up by a critical care physician. The exclusion criterion included was enrollment in hospice or palliative care services. Institutional review board approval was obtained to conduct retrospective analyses of de-identified clinical data. Medical history and medication lists were collected from patients, informal caregivers, and electronic medical records.
Two hundred thirty-three patients were seen in the CCRC from July 2011 to August 2016. Two hundred four patients rated symptoms of depression with either the Patient Health Questionnaire (PHQ-9; N = 99) or Geriatric Depression Scale (GDS-30; N = 105) at their initial visit to the CCRC prior to receiving any treatment at the CCRC. Twenty-nine patients who did not complete depression questionnaires were excluded from the analyses. Patients with PHQ-9 score ≥10 or GDS score ≥20 were categorized as having moderate to severe depressive symptoms.7,8
Electronic medical records were reviewed to determine whether patients were on an antidepressant at hospital admission, hospital discharge, and the initial CCRC visit prior to any treatment in the CCRC. Patients who were on a tricyclic antidepressant, selective serotonin reuptake inhibitor, selective serotonin-norepinephrine reuptake inhibitor, noradrenergic and specific serotonergic antidepressant (eg, mirtazapine), or norepinephrine and dopaminergic reuptake inhibitor (eg, bupropion) at any dose were designated as being on an antidepressant. Prescribers of antidepressants included primary care providers, clinical providers during their hospital stay, and various outpatient subspecialists other than those in the CCRC.
We then examined whether the risk factors for depressive symptoms differed if patients were on an antidepressant at their initial CCRC visit. We compared demographic and clinical characteristics between depressed and nondepressed patients not on an antidepressant. We repeated these analyses for those on an antidepressant. Dichotomous outcomes were compared using chi-square testing, and two-way Student t tests for continuous outcomes. Demographic and clinical variables with P < 0.1 were included as covariates in a logistic regression model for depressive symptoms separately for those not an antidepressant and those on an antidepressant. History of depression was not included as a covariate because it is highly collinear with post-ICU depression.
RESULTS
Two hundred four ICU survivors in this study reflected a racially diverse and underserved population (monthly income $745.3 ± $931.5). Although most had respiratory failure and/or delirium during their hospital stay, 94.1% (N = 160) mostly lived independently after discharge. Nearly one-third of patients (N = 69) were on at least 1 antidepressant at their initial CCRC visit. Of these 69 patients, 60.9% (N = 42) had an antidepressant prescription on hospital admission, and 60.9% (N = 42) had an antidepressant prescription on hospital discharge.
We first compared the demographic and clinical characteristics of patients with and without depressive symptoms at their initial CCRC visit. Patients with depressive symptoms were younger, less likely to have cardiac disease, more likely to have a history of depression, more likely to have been prescribed an antidepressant on hospital admission, more likely to be prescribed an antidepressant on hospital discharge, and more likely to be on an antidepressant at their initial CCRC visit (Table 1).
Patients with depressive symptoms on an antidepressant (n = 65) were younger and more likely to be African American (borderline significance; Supplementary Table 2). Multivariate logistic regression showed that both younger age (OR = 0.92 per year, P = 0.003) and African American race (OR = 4.3, P = 0.024) remained significantly associated with depressive symptoms (Table 2).
DISCUSSION
Our study demonstrated that about one-third of our ICU survivor clinical cohort had untreated or inadequately treated depressive symptoms at their CCRC initial visit. Many patients with depressive symptoms had a history of depression and/or antidepressant prescription on hospital admission. This suggests that pre-ICU depression is a major contributor to post-ICU depression. These findings are consistent with the results of a large retrospective analysis of Danish ICU survivors that found that patients were more likely to have premorbid psychiatric diagnoses, compared with the general population.9 Another ICU survivor research study that excluded patients who were on antidepressants prior to ICU hospitalization found that 49% of these patients were on an antidepressant after their ICU stay.10 Our much lower rate of patients on an antidepressant after their ICU stay may reflect the differences between patient populations, differences in healthcare systems, and differences in clinician prescribing practices.
Younger age was associated with a higher likelihood of depressive symptoms independent of antidepressant status. Findings about the relationship between age and post-ICU depression have varied. The Bringing to Light the Risk Factors and Incidence of Neuropsychological Dysfunction in ICU Survivors group found that older age was associated with more depressive symptoms at 12 months postdischarge.11 On the other hand, a systematic review of post-ICU depression did not find any relationship between age and post-ICU depression.2,3 These differences may be due in part to demographic variations in cohorts.
Our logistic regression models suggest that there may also be different risk factors in patients who had untreated vs inadequately treated depressive symptoms. Patients who were not on an antidepressant at their initial CCRC visit were more likely to have a lower level of education. This is consistent with the Medical Expenditure Panel Surveys study, which showed that adults with less than a high school education were less likely to receive depression treatment.12 In patients who were on antidepressants at their initial CCRC visit, African Americans were more likely to have depressive symptoms. Possible reasons may include differences in receiving guideline-concordant antidepressant medication treatment, access to mental health subspecialty services, higher prevalence of treatment refractory depression, and differences in responses to antidepressant treatments.13,14
Strengths of our study include detailed characterization for a fairly large ICU survivor clinic population and a racially diverse cohort. To the best of our knowledge, our study is also the first to examine whether there may be different risk factors for depressive symptoms based on antidepressant status. Limitations include the lack of information about nonpharmacologic antidepressant treatment and the inability to assess whether noncompliance, insufficient dose, or insufficient time on antidepressants contributed to inadequate antidepressant treatment. Antidepressants may have also been prescribed for other purposes such as smoking cessation, neuropathic pain, and migraine headaches. However, because 72.4% of patients on antidepressants had a history of depression, it is likely that most of them were on antidepressants to treat depression.
Other limitations include potential biases in our clinical cohort. Over the last 5 years, the CCRC has provided care to more than 200 ICU survivors. With 1100 mechanically ventilated admissions per year, only 1.8% of survivors are seen. The referral criteria for the CCRC is a major source of selection bias, which likely overrepresents PICS. Because patients are seen in the CCRC about 3 months after hospital discharge, there is also informant censoring due to death. Physically sicker survivors in nursing home facilities were less likely to be included. Finally, the small cohort size may have resulted in an underpowered study.
Future studies will need to confirm our findings about the high prevalence of post-ICU depression and different responses to antidepressant medications by certain groups. Pre-ICU depression, lack of antidepressant treatment, and inadequate antidepressant treatment are major causes of post-ICU depression. Currently, the CCRC offers pharmacotherapy, problem-solving therapy, or referral to mental health specialists to treat patients with depressive symptoms. ICU survivor clinics, such as the CCRC, may become important settings that allow for increased access to depression treatment for those at higher risk for post-ICU depression as well as the testing of new antidepressant regimens for those with inadequately treated depression.
Acknowledgments
The authors thank Dr. Adil Sheikh for assistance with data entry and Cynthia Reynolds for her clinical services. Grant support: The Critical Care Recovery Center (CCRC) is supported by Eskenazi Health Services. SW is supported by NIA 2P30AG010133. SG is supported by NIA 2P30AG010133 and NIA 5R01AG045350. SK is supported by NHBLI 5T32HL091816-07. MB is supported by NIA R01 AG040220-05, AHRQ P30 HS024384-02, CMS 1 L1 CMS331444-02-00 and NIA R01 AG030618-05A1. BK is supported by NIA K23-AG043476 and NHLBI R01HL131730.
Disclosure
There are no conflicts of interest. None of the above NIH grants supported the CCRC or this work.
1. Needham DM, Davidson J, Cohen H, et al. Improving long-term outcomes after discharge from intensive care unit: report from a stakeholders’ conference. Crit Care Med. 2012;40:502-509. PubMed
2. Davydow DS, Gifford JM, Desai SV, Bienvenu OJ, Needham DM. Depression in general intensive care unit survivors: a systematic review. Intensive Care Med. 2009;35:796-809. PubMed
3. Rabiee A, Nikayin S, Hashem MD, et al. Depressive symptoms after critical illness: a systematic review and meta-analysis. Crit Care Med. 2016;44(9):1744-1753. PubMed
4. Huang M, Parker AM, Bienvenu OJ, et al. Psychiatric symptoms in acute respiratory distress syndrome survivors: A 1-year national multicenter study. Crit Care Med 2016;44:954-965. PubMed
5. Bienvenu OJ, Colantuoni E, Mendez-Tellez PA, et al. Cooccurrence of and remission from general anxiety, depression, and posttraumatic stress disorder symptoms after acute lung injury: a 2-year longitudinal study. Crit Care Med. 2015;43:642-653. PubMed
6. Khan BA, Lasiter S, Boustani MA. CE: critical care recovery center: an innovative collaborative care model for ICU survivors. Am J Nurs. 2015;115:24-31. PubMed
7. Kroenke K, Spitzer RL, Williams JB. The PHQ-9: validity of a brief depression severity measure. J Gen Intern Med. 2001;16:606-613. PubMed
8. Yesavage JA, Brink TL, Rose TL, et al. Development and validation of a geriatric depression screening scale: a preliminary report. J Psychiatr Res. 1982-1983;17:37-49. PubMed
9. Wuns ch H, Christiansen CF, Johansen MB, et al. Psychiatric diagnoses and psychoactive medication use among nonsurgical critically ill patients receiving mechanical ventilation. JAMA. 2014;311:1133-1142. PubMed
10. Weinert C, Meller W. Epidemiology of depression and antidepressant therapy after acute respiratory failure. Psychosomatics. 2006;47(5):399-407. PubMed
11. Jackson JC, Pandharipande PP, Girard TD, et al. Depression, post-traumatic stress disorder, and functional disability in survivors of critical illness in the BRAIN-ICU study: a longitudinal cohort study. Lancet Respir Med. 2014;2:369-379. PubMed
12. Olfson M, Blanco C, Marcus SC. Treatment of adult depression in the United States. JAMA Intern Med. 2016;176:1482-1491. PubMed
13. González HM, Vega WA, Williams DR, Tarraf W, West BT, Neighbors HW. Depression care in the United States: too little for too few. Arch Gen Psychiatry. 2010;67:37-46. PubMed
14. Bailey RK, Patel M, Barker NC, Ali S, Jabeen S. Major depressive disorder in the African American population. J Natl Med Assoc. 2011;103:548-557. PubMed
© 2017 Society of Hospital Medicine
Using standardized patients to assess hospitalist communication skills
Hospitalists must create rapport and communicate large amounts of information in a short amount of time without having a prior relationship with the patient.1 High-quality communication can improve satisfaction and compliance, while poor communication leaves patients ill prepared to transition back to the community.2–10
Many medical schools use standardized patients (SPs) to both train and evaluate their students’ communication skills. To our knowledge, no published studies describe using SPs to assess or teach communication skills for hospitalists.
Our objective in this study was to use SPs to assess for deficits in our hospitalists’ communication skills and to determine whether feedback provided by SPs could improve hospitalist confidence in and performance of optimal communication behaviors.
METHODS
Setting and Participants

Scenario and Checklist Development
We developed 3 SP encounters around common hospitalist-patient interactions: daily rounding, discharge, and interacting with a difficult patient. In order to assess communication skills, we developed a checklist with 3 core domains: Courtesy and Respect, Listen, and Explain. Each domain corresponded to 1 of 3 questions on the Hospital Consumer Assessment of Healthcare Providers and Systems (HCAHPS) survey that pertained to doctor’s communications skills: (1) How often did doctors treat you with courtesy and respect? (2) How often did doctors listen carefully to you? (3) How often did doctors explain things in a way you could understand? We then developed checklist items that corresponded to essential communication skills within each of the 3 domains. These communication skills were based on best practices and published literature.
")
Discharge Encounter (Table 2): Patient admitted the night before with abdominal pain by another hospitalist. The checklist was based on AIDET®, an effective communication skills training protocol that our hospitalist group had been trained on.11
Daily Rounding Encounter (Table 3): Patient being discharged after an admission for congestive heart failure. The checklist was developed from the Society of Hospital Medicine discharge toolkit.12
")
Difficult Patient Encounter (Table 4): A patient and his daughter who were unhappy because of a previously missed lung mass that was now found to be cancer. Our checklist was based on characteristics of therapeutic bedside manner.13
The checklist items were each scored using a 3-point scale of adequate, partial, or inadequate performance. A description of checklist items within each of the 3 domains is listed in Table 1. A postintervention survey was filled out by all hospitalists after the 3 encounters.
")
Simulated Encounters
All 3 encounters occurred on the same day and each one lasted 1 hour (20 minutes for the encounter, 10 minutes for a posttest survey, and 30 minutes of feedback from the SP). For each case, a task list was given to the hospitalist before walking into the room (Appendix 1). During the feedback session, the SP gave the hospitalist feedback using the case checklist items. They then watched a video of the encounter and the SP further emphasized areas for improvement.
SP Training
SP training consisted of three 3-hour training sessions, which included review of the case, script, guidance on scoring the checklist items, role plays with attending hospitalists, and feedback training. Each SP was assigned to only 1 case.
Seven of the 24 encounters for each SP were reviewed independently by 2 investigators who created a final score for each checklist item which was compared to the SP’s checklist item score. The kappa (k) statistic was used to evaluate inter-observer reliability using the SAS system software (SAS Institute Inc.).
Analysis
The percent of hospitalists who performed each checklist item adequately within in each of the 3 domains (Courtesy and Respect, Listen, and Explain) was calculated. To compare the 3 domains, t tests were used.
We calculated the percent that our hospitalist group received on the 3 HCAHPS doctor’s questions 1 year prior to our SP exercise and 1 year after the SP exercise.
RESULTS
Twenty-three hospitalists completed all 3 encounters. For the 3 domains (Courtesy and Respect, Listen, and Explain), hospitalists performed significantly better in the Listen domain compared to the other 2 domains, with a mean percent adequate score of 90.2 % (95% confidence interval [CI], 72.2%-100%; P < 0.05), and significantly worse in the Explain domain compared to the other 2 domains, with a mean percent adequate score of 65.0% (95% CI, 49.2%-83.6%; P < 0.05). The mean percent adequate score for the Courtesy and Respect domain was 81.6% (95% CI, 56%-100%). This was significantly higher than the Explain domain and significantly lower than the Listen domain.
Posttest survey results showed that hospitalists had an increased level of confidence in their bedside manner, patient satisfaction skills, and high-quality discharge discussion skills.
Inter-Rater Reliability
Inter-rater reliability for the discharge encounter, the daily rounding encounter, and the difficult patient encounter were 0.74 (95% CI, 0.64-0.84), 0.73 (95% CI, 0.63-0.82), and 0.73 (95% CI, 0.63-0.83), respectively.
HCAHPS
Four hundred sixteen HCAHPS surveys were returned in the year prior to our SP exercise, and the percent of patients who answered always to the questions on Courtesy and Respect, Listen, and Explain were 80.4%, 74.2 %, and 69.4 %, respectively. In the year after our SP exercise, 492 surveys were returned, and there was no significant change in HCAHP scores for the group (80.9% for Courtesy and Respect, 70.2% for the Listen question, and 70.5% for Explain).
DISCUSSION
We have shown that SPs can be used to assess deficits in hospitalist communication skills and provide feedback that can improve hospitalist confidence in performing optimal communication behaviors. We have also shown that hospitalists perceive the exercise as beneficial in improving their communication skills and perceive them as similar to their real patient encounters.
The Explain domain was significantly worse than the Courtesy and Respect and Listen domains for our hospitalists. Analysis of the checklist items within the Explain domain found that the items within this domain that were most problematic for hospitalists were summarizing information at the end of the encounter, using teach-back (a communication confirmation method where a healthcare provider asks a patient to repeat what was said to confirm understanding), encouraging additional questions by using open-ended statements (What questions do you have?) instead of close ended statements (Do you have any questions?), managing team and self-up, setting expectations on length of stay, and timing of tests. This correlated with our patient satisfaction HCAHPS data, which showed that patients consistently rated our hospitalists’ ability to explain things in a way they could understand lowest among the 3 questions. HCAHPS scores did not change after our SP exercise, and this lack of improvement may indicate that meaningful improvement in communication skills requires longitudinal interventions and real-time feedback rather than a single exercise, as was shown in a recent study looking at daily patient satisfaction score feedback given to internal medicine residents.14
Our study had several limitations. First, hospitalists knew they were being videotaped and observed, which may have altered their behaviors and may not reflect our hospitalists’ actual behaviors with patients. Furthermore, we did not examine whether the feedback given was incorporated into our hospitalists’ daily patient communications and whether this impacted our patients care other than examining HCAHPS scores.
CONCLUSION
SPs can be used to identify deficiencies in communication skills and provide specific guidance that improves hospitalist confidence in their communication skills.
Acknowledgment
This trial was funded by a grant from The Doctor’s Company Foundation.
Disclosure
None of the authors report any conflicts of interest.
1. Barnett PB. Rapport and the hospitalist. Am J Med. 2001;111(9B):31S-35S. PubMed
2. Kurtz S, Silverman J, Draper J. Teaching and learning communication skills in medicine.
2nd ed. London, UK: Radcliffe Publishing Ltd.; 2009.
3. Stewart MA. What is a successful doctor–patient interview? A study of interactions
and outcomes. Soc Sci Med. 1984;9:167-175. PubMed
4. Kaplan SH, Greenfield S, Ware JE. Assessing the effects of physician–patient interactions
on the outcomes of chronic disease. Med Care. 1989;27:S110-S127. PubMed
5. Levinson W, Lesser CS, Epstein RM. Developing physician communication skills for
patient-centered care. Health Aff (Millwood). 2010;29:1310-1318. PubMed
6. Griffin SJ, Kinmonth AL, Veltman MWM, Gillard S, Grant J, Stewart M. Effect
on health-related outcomes of interventions to alter the interaction between
patients and practitioners: a systematic review of trials. Ann Fam Med. 2004;2:
595-608. PubMed
7. Levinson W, Roter DL, Mullooly JP, Dull V, Frankel R. Physician-patient communication:
the relationship with malpractice claims among primary care physicians and
surgeons. JAMA. 1997;277:553-559. PubMed
8. Levinson W. Physician-patient communication: a key to malpractice prevention. [Editorial].
JAMA. 1994;272:1619-1620. PubMed
9. Beckman HB, Markakis KM, Suchman AL, Frankel RM. The doctor–patient relationship
and malpractice. Lessons from plaintiff depositions. Arch Intern Med.
1994;154:1365-1370. PubMed
10. Wofford MM, Wofford JL, Bothra J, Kendrick SB, Patient complaints about physician
behaviors: a qualitative study. Acad Med. 2004;79(2):134-138. PubMed
11. Studer Group. Acknowledge, Introduce, Duration, Explanation and Thank You.
http://www.studergroup.com/aidet. Accessed November 5, 2012.
12. SHM Discharge/Heart Failure Implementation Toolkit. https://www.hospitalmedicine.
org/Web/Quality_Innovation/Implementation_Toolkits/Congestive_Heart_
Failure/Web/Quality___Innovation/Implementation_Toolkit/CHF/CHF_overview.
aspx?hkey=f91120e3-6c8f-4a55-90e7-9b6a4b5472ef.
13. Carkhuff, RR. Helping and Human Relations: A Primer for Lay and Professional Helpers.
Volume I. New York, NY: Holt, Rinehart & Winston; 1969.
14. Banka G, Edgington S, Kyulo N, et al. Improving patient satisfaction through physician
education, feedback, and incentives. J Hosp Med. 2015;10:497-502. PubMed
Hospitalists must create rapport and communicate large amounts of information in a short amount of time without having a prior relationship with the patient.1 High-quality communication can improve satisfaction and compliance, while poor communication leaves patients ill prepared to transition back to the community.2–10
Many medical schools use standardized patients (SPs) to both train and evaluate their students’ communication skills. To our knowledge, no published studies describe using SPs to assess or teach communication skills for hospitalists.
Our objective in this study was to use SPs to assess for deficits in our hospitalists’ communication skills and to determine whether feedback provided by SPs could improve hospitalist confidence in and performance of optimal communication behaviors.
METHODS
Setting and Participants
Scenario and Checklist Development
We developed 3 SP encounters around common hospitalist-patient interactions: daily rounding, discharge, and interacting with a difficult patient. In order to assess communication skills, we developed a checklist with 3 core domains: Courtesy and Respect, Listen, and Explain. Each domain corresponded to 1 of 3 questions on the Hospital Consumer Assessment of Healthcare Providers and Systems (HCAHPS) survey that pertained to doctor’s communications skills: (1) How often did doctors treat you with courtesy and respect? (2) How often did doctors listen carefully to you? (3) How often did doctors explain things in a way you could understand? We then developed checklist items that corresponded to essential communication skills within each of the 3 domains. These communication skills were based on best practices and published literature.
Discharge Encounter (Table 2): Patient admitted the night before with abdominal pain by another hospitalist. The checklist was based on AIDET®, an effective communication skills training protocol that our hospitalist group had been trained on.11
Daily Rounding Encounter (Table 3): Patient being discharged after an admission for congestive heart failure. The checklist was developed from the Society of Hospital Medicine discharge toolkit.12
Difficult Patient Encounter (Table 4): A patient and his daughter who were unhappy because of a previously missed lung mass that was now found to be cancer. Our checklist was based on characteristics of therapeutic bedside manner.13
The checklist items were each scored using a 3-point scale of adequate, partial, or inadequate performance. A description of checklist items within each of the 3 domains is listed in Table 1. A postintervention survey was filled out by all hospitalists after the 3 encounters.
Simulated Encounters
All 3 encounters occurred on the same day and each one lasted 1 hour (20 minutes for the encounter, 10 minutes for a posttest survey, and 30 minutes of feedback from the SP). For each case, a task list was given to the hospitalist before walking into the room (Appendix 1). During the feedback session, the SP gave the hospitalist feedback using the case checklist items. They then watched a video of the encounter and the SP further emphasized areas for improvement.
SP Training
SP training consisted of three 3-hour training sessions, which included review of the case, script, guidance on scoring the checklist items, role plays with attending hospitalists, and feedback training. Each SP was assigned to only 1 case.
Seven of the 24 encounters for each SP were reviewed independently by 2 investigators who created a final score for each checklist item which was compared to the SP’s checklist item score. The kappa (k) statistic was used to evaluate inter-observer reliability using the SAS system software (SAS Institute Inc.).
Analysis
The percent of hospitalists who performed each checklist item adequately within in each of the 3 domains (Courtesy and Respect, Listen, and Explain) was calculated. To compare the 3 domains, t tests were used.
We calculated the percent that our hospitalist group received on the 3 HCAHPS doctor’s questions 1 year prior to our SP exercise and 1 year after the SP exercise.
RESULTS
Twenty-three hospitalists completed all 3 encounters. For the 3 domains (Courtesy and Respect, Listen, and Explain), hospitalists performed significantly better in the Listen domain compared to the other 2 domains, with a mean percent adequate score of 90.2 % (95% confidence interval [CI], 72.2%-100%; P < 0.05), and significantly worse in the Explain domain compared to the other 2 domains, with a mean percent adequate score of 65.0% (95% CI, 49.2%-83.6%; P < 0.05). The mean percent adequate score for the Courtesy and Respect domain was 81.6% (95% CI, 56%-100%). This was significantly higher than the Explain domain and significantly lower than the Listen domain.
Posttest survey results showed that hospitalists had an increased level of confidence in their bedside manner, patient satisfaction skills, and high-quality discharge discussion skills.
Inter-Rater Reliability
Inter-rater reliability for the discharge encounter, the daily rounding encounter, and the difficult patient encounter were 0.74 (95% CI, 0.64-0.84), 0.73 (95% CI, 0.63-0.82), and 0.73 (95% CI, 0.63-0.83), respectively.
HCAHPS
Four hundred sixteen HCAHPS surveys were returned in the year prior to our SP exercise, and the percent of patients who answered always to the questions on Courtesy and Respect, Listen, and Explain were 80.4%, 74.2 %, and 69.4 %, respectively. In the year after our SP exercise, 492 surveys were returned, and there was no significant change in HCAHP scores for the group (80.9% for Courtesy and Respect, 70.2% for the Listen question, and 70.5% for Explain).
DISCUSSION
We have shown that SPs can be used to assess deficits in hospitalist communication skills and provide feedback that can improve hospitalist confidence in performing optimal communication behaviors. We have also shown that hospitalists perceive the exercise as beneficial in improving their communication skills and perceive them as similar to their real patient encounters.
The Explain domain was significantly worse than the Courtesy and Respect and Listen domains for our hospitalists. Analysis of the checklist items within the Explain domain found that the items within this domain that were most problematic for hospitalists were summarizing information at the end of the encounter, using teach-back (a communication confirmation method where a healthcare provider asks a patient to repeat what was said to confirm understanding), encouraging additional questions by using open-ended statements (What questions do you have?) instead of close ended statements (Do you have any questions?), managing team and self-up, setting expectations on length of stay, and timing of tests. This correlated with our patient satisfaction HCAHPS data, which showed that patients consistently rated our hospitalists’ ability to explain things in a way they could understand lowest among the 3 questions. HCAHPS scores did not change after our SP exercise, and this lack of improvement may indicate that meaningful improvement in communication skills requires longitudinal interventions and real-time feedback rather than a single exercise, as was shown in a recent study looking at daily patient satisfaction score feedback given to internal medicine residents.14
Our study had several limitations. First, hospitalists knew they were being videotaped and observed, which may have altered their behaviors and may not reflect our hospitalists’ actual behaviors with patients. Furthermore, we did not examine whether the feedback given was incorporated into our hospitalists’ daily patient communications and whether this impacted our patients care other than examining HCAHPS scores.
CONCLUSION
SPs can be used to identify deficiencies in communication skills and provide specific guidance that improves hospitalist confidence in their communication skills.
Acknowledgment
This trial was funded by a grant from The Doctor’s Company Foundation.
Disclosure
None of the authors report any conflicts of interest.
1. Barnett PB. Rapport and the hospitalist. Am J Med. 2001;111(9B):31S-35S. PubMed
2. Kurtz S, Silverman J, Draper J. Teaching and learning communication skills in medicine.
2nd ed. London, UK: Radcliffe Publishing Ltd.; 2009.
3. Stewart MA. What is a successful doctor–patient interview? A study of interactions
and outcomes. Soc Sci Med. 1984;9:167-175. PubMed
4. Kaplan SH, Greenfield S, Ware JE. Assessing the effects of physician–patient interactions
on the outcomes of chronic disease. Med Care. 1989;27:S110-S127. PubMed
5. Levinson W, Lesser CS, Epstein RM. Developing physician communication skills for
patient-centered care. Health Aff (Millwood). 2010;29:1310-1318. PubMed
6. Griffin SJ, Kinmonth AL, Veltman MWM, Gillard S, Grant J, Stewart M. Effect
on health-related outcomes of interventions to alter the interaction between
patients and practitioners: a systematic review of trials. Ann Fam Med. 2004;2:
595-608. PubMed
7. Levinson W, Roter DL, Mullooly JP, Dull V, Frankel R. Physician-patient communication:
the relationship with malpractice claims among primary care physicians and
surgeons. JAMA. 1997;277:553-559. PubMed
8. Levinson W. Physician-patient communication: a key to malpractice prevention. [Editorial].
JAMA. 1994;272:1619-1620. PubMed
9. Beckman HB, Markakis KM, Suchman AL, Frankel RM. The doctor–patient relationship
and malpractice. Lessons from plaintiff depositions. Arch Intern Med.
1994;154:1365-1370. PubMed
10. Wofford MM, Wofford JL, Bothra J, Kendrick SB, Patient complaints about physician
behaviors: a qualitative study. Acad Med. 2004;79(2):134-138. PubMed
11. Studer Group. Acknowledge, Introduce, Duration, Explanation and Thank You.
http://www.studergroup.com/aidet. Accessed November 5, 2012.
12. SHM Discharge/Heart Failure Implementation Toolkit. https://www.hospitalmedicine.
org/Web/Quality_Innovation/Implementation_Toolkits/Congestive_Heart_
Failure/Web/Quality___Innovation/Implementation_Toolkit/CHF/CHF_overview.
aspx?hkey=f91120e3-6c8f-4a55-90e7-9b6a4b5472ef.
13. Carkhuff, RR. Helping and Human Relations: A Primer for Lay and Professional Helpers.
Volume I. New York, NY: Holt, Rinehart & Winston; 1969.
14. Banka G, Edgington S, Kyulo N, et al. Improving patient satisfaction through physician
education, feedback, and incentives. J Hosp Med. 2015;10:497-502. PubMed
© 2017 Society of Hospital Medicine
Contextual influences of trainee characteristics and daily workload on trainee learning preferences
We previously identified key domains of attending attributes for successful rounds1 and adapted them to represent the trainees’ perspective: Teaching Process (eg, sharing decision-making process, physical exam skills), Learning Environment (eg, being approachable, respectful), Role Modeling (eg, teaching by example, bedside manner), and Team Management (eg, efficiency, providing autonomy). Though all domains are necessary, the relative importance may change in response to external pressures. Inpatient service demands and time constraints fluctuate daily due to patient admissions and discharges, educational conference schedules, and concurrent outpatient clinic responsibilities.2–4 Furthermore, the 2011 Accreditation Council for Graduate Medical Education (ACGME) duty hour rules placed greater time pressure on inpatient ward attending rounds.5 It is plausible that these pressures affect trainees’ needs and priorities during rounds.
Therefore, we sought to refine our understanding of the learners’ needs during ward rounds. Because we were interested in the contextual influences of trainee characteristics and workload on their preferences, we used the principles of ecological momentary assessment (EMA) to design a novel system to assess daily changes in trainee priorities and associated workload.
METHODS
Design, Participants, and Setting
In a prospective observational study, we assessed trainee priorities during inpatient rounds. Participants included third- and fourth-year medical students in the University of Alabama at Birmingham (UAB) School of Medicine (Birmingham campus) and residents in the Tinsley Harrison Internal Medicine Residency Training Program assigned to inpatient general medicine ward services from September 2010 to February 2011 (except from December 20, 2010, to January 3, 2011). Three training sites were included in this study: UAB Hospital (>1000-bed, university-based hospital), Birmingham Veterans Affairs Medical Center (300-bed), and Cooper Green Hospital (40-bed county hospital). Each site housed 4 or 5 general medicine ward teams, composed of 1–3 medical students (third or fourth year), 2 first-year residents, 1 upper level resident (postgraduate year 2–4), and 1 attending physician.
 card. Daily assessment tool created to determine which of 4 domains for successful ward rounds the trainee prioritized and factors impacting workload.")
Trainees were recruited to participate via e-mail and verbal announcements during program conferences. Participation was voluntary and responses were confidential. As an incentive, the team submitting the highest number of cards per site each month received 1 free lunch. Institutional review boards of all 3 participating hospitals approved this study.
Assessment
Our original domains of attending rounds were derived from groupings and ratings of specific teaching characteristics by attending physicians, residents, and students.1 However, because our goal was to understand the learners’ perspective of successful ward rounds, we revised these domains by limiting the algorithm to data on groupings and ratings by residents and students only. This process resulted in the domains used in this study (Appendix).
We used EMA principles to create a novel system to assess daily variation in trainees’ prioritization of these domains and workload.6,7 EMA-derived assessment tools collect data frequently (several times per week, up to multiple times per day) to identify time-sensitive fluctuations. We designed a pocket-sized daily assessment card for trainees to complete each day after rounds (Figure 1). Trainees were asked to indicate the most important domain for successful ward rounds to them that day and provide individual characteristics (ie, sex and training level) and data on factors we hypothesized were related to perceived work load (ie, patient census, day of call cycle, and number of team members absent on rounds that day). We anticipated the Expectations domain would not be responsive to daily changes in workload because expectations are usually set once on the first day of the rotation, and thus we did not include this domain in our final assessment tool. Assessment cards and locked receptacles were kept in team workrooms for ease of accessibility; cards were collected twice monthly. All data were anonymous.
Analysis
Our unit of analysis was the EMA card. We examined associations between daily domain priority with respondent demographics and workload information using Pearson’s chi-squared analyses, adjusted for clustering effects by team. α was set at 0.05. All analyses were performed by using Stata 13.0 (Stata Statistical Software: Release 13; College Station, TX).
RESULTS

Sex and training level were associated with prioritization of teaching domains. Male trainees were more likely to choose Team Management (P = 0.01) or Teaching Process (P = 0.04) as their preferred domain. Medical students valued Teaching Process 42% of the time, compared with 23% for interns and 21% for upper level residents (P = 0.005). The opposite trend emerged for Team Management: as training level increased, the importance of Team Management increased (P < 0.001). There were no significant trends by training level for the Role Modeling and Learning Environment domains.
Domain priority was also associated with workload characteristics. On post-call days, Team Management (P < 0.001) was more likely to be selected as the most important domain, but on other days, Teaching Process (P = 0.005) was more often selected (Figure 2). Trainees also selected Team Management as the most important domain with an increasing number of team members absent (P = 0.001), and as the teams’ overall patient census increased (P < 0.001). The Learning Environment and Role Modeling domains’ importance did not vary by call-day or patient census.
DISCUSSION
We used a novel approach to assess contextual factors affecting trainee prioritization of 4 domains that contribute to successful inpatient internal medicine attending rounds. We found training level and workload demands were associated with prioritization of teaching domains. Prioritization of Teaching Process, exemplified by setting aside time to teach, demonstrating physical exam skills, and clear delineation of the attending’s thought process, was inversely associated with training level. On the days with highest workload, Team Management was most likely to be prioritized. Our findings suggest that attending physicians should consider adapting rounding style based on team members’ training levels and workload.
Prior work has described teaching and rounding styles, influences, and priorities in response to workload from the attending physician’s perspective,8–11 and our study extends these reports by providing the complementary perspective of trainees. On days with high workload, trainees prefer the Team Management domain, characterized by organized and efficient rounds, agreement on a clear and consistent plan of care, and being allowed independence and time during rounds to meet other responsibilities.1 These findings support an “empowerment style,” defined by Goldszmidt et al. as using integrated teaching and oversight strategies to support trainees’ progressive independence.9 Though some attending physicians report shifting to a more direct patient care style on days with a high patient census,9 our results suggest that learners instead prefer more independence, being empowered to perform more direct care. While there is an increasing pressure to heighten attending supervision due to concerns about patient safety, restricted work hours, and litigation,12 trainees value being part of the care process and being included as integral members of the care team, which may actually mitigate patient safety risks.8
Our results are consistent with prior studies, reporting that learners at different levels of training have different instructional needs: medical students seek more teaching, and senior residents sought an efficient leader.13,14 Taken together, these studies suggest that attending physicians should tailor rounds to the level of the trainee. For example, it may be beneficial for the attending physician to spend time outside of rounds with students to teach medical knowledge. During rounds, the entire group benefits most from modeling clinical reasoning, discussing new medical evidence, and demonstrating communication skills and leadership.
Our study has limitations. Though our study was performed before the 2011 ACGME duty hour restrictions,5 our results are likely of greater importance and relevance, as our findings ultimately highlight the competing demands of time vs duty. Also, while our study was performed at a single institution, potentially limiting generalizability, we included 3 types of training hospitals, a university, veterans and a county hospital, and found no differences between sites. Additionally, we collected over 1,000 cards over the course of 6 months, assessing rounds of over 50 different attending physicians, suggesting broader applicability. Our overall response rate was low, a typical signal for respondent bias, but because we collected daily assessments, standard interpretation of response rates referring to a one-time survey do not apply.15 We believe we achieved an adequate sample, as the majority of teams participated, the respondent demographics were proportional to the base population eligible to participate, and we received a similar number of cards on all months. Finally, although we were unable to account for clustering effects by individual respondents because response cards were anonymous, we adjusted for clustering effects by team.
Attending physicians may use our findings to adapt teaching techniques to appeal to specific training levels and to external pressures during teaching rounds. Focusing and investing time in teaching medical knowledge and clinical reasoning tailored to each level of learner is paramount on most days. However, days with a high workload may require emphasis on delegating clear, rational treatment plans, when learners are less receptive to traditional didactic methods.
Disclosure
An abstract based on the current analysis was presented at the Society of General Internal Medicine 34th Annual Meeting, April 2011, Phoenix, AZ. Dr. Brita Roy is supported by grant number K12HS023000 from the Agency for Healthcare Research and Quality. The authors have no conflicts to disclose. The opinions expressed in this article are those of the authors alone and do not reflect the views of the Department of Veterans Affairs or the Agency for Healthcare Research and Quality.
1. Roy B, Salanitro AH, Willett L, et al. Using cognitive mapping to identify attributes contributing to successful ward-attending rounds -- a resident and student perspective. J Gen Intern Med. 2010;25(S3):2. PubMed
2. Ben-Menachem T, Estrada C, Young MJ, et al. Balancing service and education: improving internal medicine residencies in the managed care era. Am J Med. 1996;100(2):224–229. PubMed
3. Drolet BC, Bishop KD. Unintended consequences of duty hours regulation. Acad Med. 2012;87(6):680. PubMed
4. Drolet BC, Spalluto LB, Fischer SA. Residents’ perspectives on ACGME regulation of supervision and duty hours--a national survey. N Engl J Med. 2010;363(23):e34. PubMed
5. Nasca TJ, Day SH, Amis ES, Jr. The new recommendations on duty hours from the ACGME Task Force. N Engl J Med. 2010;363(2):e3. PubMed
6. Shiffman S, Stone AA, Hufford MR. Ecological momentary assessment. Annu Rev Clin Psychol. 2008;4:1–32. PubMed
7. Moskowitz DS, Young SN. Ecological momentary assessment: what it is and why it is a method of the future in clinical psychopharmacology. J Psychiatry Neurosci. 2006;31(1):13–20. PubMed
8. Wingo MT, Halvorsen AJ, Beckman TJ, Johnson MG, Reed DA. Associations between attending physician workload, teaching effectiveness, and patient safety. J Hosp Med. 2016;11(3):169–173. PubMed
9. Goldszmidt M, Faden L, Dornan T, van Merriënboer J, Bordage G, Lingard L. Attending physician variability: a model of four supervisory styles. Acad Med. 2015;90(11):1541–1546. PubMed
10. Kennedy TJ, Lingard L, Baker GR, Kitchen L, Regehr G. Clinical oversight: conceptualizing the relationship between supervision and safety. J Gen Intern Med. 2007;22(8):1080–1085. PubMed
11. Irby DM. How attending physicians make instructional decisions when conducting teaching rounds. Acad Med. 1992;67(10):630–638. PubMed
12. Kennedy TJ, Regehr G, Baker GR, Lingard LA. Progressive independence in clinical training: a tradition worth defending? Acad Med. 2005;80(10):S106–S111. PubMed
13. Tariq M, Motiwala A, Ali SU, Riaz M, Awan S, Akhter J. The learners’ perspective on internal medicine ward rounds: a cross-sectional study. BMC Med Educ. 2010;10:53. PubMed
14. Certain LK, Guarino AJ, Greenwald JL. Effective multilevel teaching techniques on attending rounds: a pilot survey and systematic review of the literature. Med Teach. 2011;33(12):e644–e650. PubMed
15. Stone AA, Shiffman S. Capturing momentary, self-report data: A proposal for reporting guidelines. Ann Behav Med. 2002;24(3):236–243. PubMed
We previously identified key domains of attending attributes for successful rounds1 and adapted them to represent the trainees’ perspective: Teaching Process (eg, sharing decision-making process, physical exam skills), Learning Environment (eg, being approachable, respectful), Role Modeling (eg, teaching by example, bedside manner), and Team Management (eg, efficiency, providing autonomy). Though all domains are necessary, the relative importance may change in response to external pressures. Inpatient service demands and time constraints fluctuate daily due to patient admissions and discharges, educational conference schedules, and concurrent outpatient clinic responsibilities.2–4 Furthermore, the 2011 Accreditation Council for Graduate Medical Education (ACGME) duty hour rules placed greater time pressure on inpatient ward attending rounds.5 It is plausible that these pressures affect trainees’ needs and priorities during rounds.
Therefore, we sought to refine our understanding of the learners’ needs during ward rounds. Because we were interested in the contextual influences of trainee characteristics and workload on their preferences, we used the principles of ecological momentary assessment (EMA) to design a novel system to assess daily changes in trainee priorities and associated workload.
METHODS
Design, Participants, and Setting
In a prospective observational study, we assessed trainee priorities during inpatient rounds. Participants included third- and fourth-year medical students in the University of Alabama at Birmingham (UAB) School of Medicine (Birmingham campus) and residents in the Tinsley Harrison Internal Medicine Residency Training Program assigned to inpatient general medicine ward services from September 2010 to February 2011 (except from December 20, 2010, to January 3, 2011). Three training sites were included in this study: UAB Hospital (>1000-bed, university-based hospital), Birmingham Veterans Affairs Medical Center (300-bed), and Cooper Green Hospital (40-bed county hospital). Each site housed 4 or 5 general medicine ward teams, composed of 1–3 medical students (third or fourth year), 2 first-year residents, 1 upper level resident (postgraduate year 2–4), and 1 attending physician.
Trainees were recruited to participate via e-mail and verbal announcements during program conferences. Participation was voluntary and responses were confidential. As an incentive, the team submitting the highest number of cards per site each month received 1 free lunch. Institutional review boards of all 3 participating hospitals approved this study.
Assessment
Our original domains of attending rounds were derived from groupings and ratings of specific teaching characteristics by attending physicians, residents, and students.1 However, because our goal was to understand the learners’ perspective of successful ward rounds, we revised these domains by limiting the algorithm to data on groupings and ratings by residents and students only. This process resulted in the domains used in this study (Appendix).
We used EMA principles to create a novel system to assess daily variation in trainees’ prioritization of these domains and workload.6,7 EMA-derived assessment tools collect data frequently (several times per week, up to multiple times per day) to identify time-sensitive fluctuations. We designed a pocket-sized daily assessment card for trainees to complete each day after rounds (Figure 1). Trainees were asked to indicate the most important domain for successful ward rounds to them that day and provide individual characteristics (ie, sex and training level) and data on factors we hypothesized were related to perceived work load (ie, patient census, day of call cycle, and number of team members absent on rounds that day). We anticipated the Expectations domain would not be responsive to daily changes in workload because expectations are usually set once on the first day of the rotation, and thus we did not include this domain in our final assessment tool. Assessment cards and locked receptacles were kept in team workrooms for ease of accessibility; cards were collected twice monthly. All data were anonymous.
Analysis
Our unit of analysis was the EMA card. We examined associations between daily domain priority with respondent demographics and workload information using Pearson’s chi-squared analyses, adjusted for clustering effects by team. α was set at 0.05. All analyses were performed by using Stata 13.0 (Stata Statistical Software: Release 13; College Station, TX).
RESULTS
Sex and training level were associated with prioritization of teaching domains. Male trainees were more likely to choose Team Management (P = 0.01) or Teaching Process (P = 0.04) as their preferred domain. Medical students valued Teaching Process 42% of the time, compared with 23% for interns and 21% for upper level residents (P = 0.005). The opposite trend emerged for Team Management: as training level increased, the importance of Team Management increased (P < 0.001). There were no significant trends by training level for the Role Modeling and Learning Environment domains.
Domain priority was also associated with workload characteristics. On post-call days, Team Management (P < 0.001) was more likely to be selected as the most important domain, but on other days, Teaching Process (P = 0.005) was more often selected (Figure 2). Trainees also selected Team Management as the most important domain with an increasing number of team members absent (P = 0.001), and as the teams’ overall patient census increased (P < 0.001). The Learning Environment and Role Modeling domains’ importance did not vary by call-day or patient census.
DISCUSSION
We used a novel approach to assess contextual factors affecting trainee prioritization of 4 domains that contribute to successful inpatient internal medicine attending rounds. We found training level and workload demands were associated with prioritization of teaching domains. Prioritization of Teaching Process, exemplified by setting aside time to teach, demonstrating physical exam skills, and clear delineation of the attending’s thought process, was inversely associated with training level. On the days with highest workload, Team Management was most likely to be prioritized. Our findings suggest that attending physicians should consider adapting rounding style based on team members’ training levels and workload.
Prior work has described teaching and rounding styles, influences, and priorities in response to workload from the attending physician’s perspective,8–11 and our study extends these reports by providing the complementary perspective of trainees. On days with high workload, trainees prefer the Team Management domain, characterized by organized and efficient rounds, agreement on a clear and consistent plan of care, and being allowed independence and time during rounds to meet other responsibilities.1 These findings support an “empowerment style,” defined by Goldszmidt et al. as using integrated teaching and oversight strategies to support trainees’ progressive independence.9 Though some attending physicians report shifting to a more direct patient care style on days with a high patient census,9 our results suggest that learners instead prefer more independence, being empowered to perform more direct care. While there is an increasing pressure to heighten attending supervision due to concerns about patient safety, restricted work hours, and litigation,12 trainees value being part of the care process and being included as integral members of the care team, which may actually mitigate patient safety risks.8
Our results are consistent with prior studies, reporting that learners at different levels of training have different instructional needs: medical students seek more teaching, and senior residents sought an efficient leader.13,14 Taken together, these studies suggest that attending physicians should tailor rounds to the level of the trainee. For example, it may be beneficial for the attending physician to spend time outside of rounds with students to teach medical knowledge. During rounds, the entire group benefits most from modeling clinical reasoning, discussing new medical evidence, and demonstrating communication skills and leadership.
Our study has limitations. Though our study was performed before the 2011 ACGME duty hour restrictions,5 our results are likely of greater importance and relevance, as our findings ultimately highlight the competing demands of time vs duty. Also, while our study was performed at a single institution, potentially limiting generalizability, we included 3 types of training hospitals, a university, veterans and a county hospital, and found no differences between sites. Additionally, we collected over 1,000 cards over the course of 6 months, assessing rounds of over 50 different attending physicians, suggesting broader applicability. Our overall response rate was low, a typical signal for respondent bias, but because we collected daily assessments, standard interpretation of response rates referring to a one-time survey do not apply.15 We believe we achieved an adequate sample, as the majority of teams participated, the respondent demographics were proportional to the base population eligible to participate, and we received a similar number of cards on all months. Finally, although we were unable to account for clustering effects by individual respondents because response cards were anonymous, we adjusted for clustering effects by team.
Attending physicians may use our findings to adapt teaching techniques to appeal to specific training levels and to external pressures during teaching rounds. Focusing and investing time in teaching medical knowledge and clinical reasoning tailored to each level of learner is paramount on most days. However, days with a high workload may require emphasis on delegating clear, rational treatment plans, when learners are less receptive to traditional didactic methods.
Disclosure
An abstract based on the current analysis was presented at the Society of General Internal Medicine 34th Annual Meeting, April 2011, Phoenix, AZ. Dr. Brita Roy is supported by grant number K12HS023000 from the Agency for Healthcare Research and Quality. The authors have no conflicts to disclose. The opinions expressed in this article are those of the authors alone and do not reflect the views of the Department of Veterans Affairs or the Agency for Healthcare Research and Quality.
1. Roy B, Salanitro AH, Willett L, et al. Using cognitive mapping to identify attributes contributing to successful ward-attending rounds -- a resident and student perspective. J Gen Intern Med. 2010;25(S3):2. PubMed
2. Ben-Menachem T, Estrada C, Young MJ, et al. Balancing service and education: improving internal medicine residencies in the managed care era. Am J Med. 1996;100(2):224–229. PubMed
3. Drolet BC, Bishop KD. Unintended consequences of duty hours regulation. Acad Med. 2012;87(6):680. PubMed
4. Drolet BC, Spalluto LB, Fischer SA. Residents’ perspectives on ACGME regulation of supervision and duty hours--a national survey. N Engl J Med. 2010;363(23):e34. PubMed
5. Nasca TJ, Day SH, Amis ES, Jr. The new recommendations on duty hours from the ACGME Task Force. N Engl J Med. 2010;363(2):e3. PubMed
6. Shiffman S, Stone AA, Hufford MR. Ecological momentary assessment. Annu Rev Clin Psychol. 2008;4:1–32. PubMed
7. Moskowitz DS, Young SN. Ecological momentary assessment: what it is and why it is a method of the future in clinical psychopharmacology. J Psychiatry Neurosci. 2006;31(1):13–20. PubMed
8. Wingo MT, Halvorsen AJ, Beckman TJ, Johnson MG, Reed DA. Associations between attending physician workload, teaching effectiveness, and patient safety. J Hosp Med. 2016;11(3):169–173. PubMed
9. Goldszmidt M, Faden L, Dornan T, van Merriënboer J, Bordage G, Lingard L. Attending physician variability: a model of four supervisory styles. Acad Med. 2015;90(11):1541–1546. PubMed
10. Kennedy TJ, Lingard L, Baker GR, Kitchen L, Regehr G. Clinical oversight: conceptualizing the relationship between supervision and safety. J Gen Intern Med. 2007;22(8):1080–1085. PubMed
11. Irby DM. How attending physicians make instructional decisions when conducting teaching rounds. Acad Med. 1992;67(10):630–638. PubMed
12. Kennedy TJ, Regehr G, Baker GR, Lingard LA. Progressive independence in clinical training: a tradition worth defending? Acad Med. 2005;80(10):S106–S111. PubMed
13. Tariq M, Motiwala A, Ali SU, Riaz M, Awan S, Akhter J. The learners’ perspective on internal medicine ward rounds: a cross-sectional study. BMC Med Educ. 2010;10:53. PubMed
14. Certain LK, Guarino AJ, Greenwald JL. Effective multilevel teaching techniques on attending rounds: a pilot survey and systematic review of the literature. Med Teach. 2011;33(12):e644–e650. PubMed
15. Stone AA, Shiffman S. Capturing momentary, self-report data: A proposal for reporting guidelines. Ann Behav Med. 2002;24(3):236–243. PubMed
© 2017 Society of Hospital Medicine
The shifting landscape in utilization of inpatient, observation, and emergency department services across payers
For over a decade, private and public payers have implemented policies aimed at reducing rates of inpatient hospitalization. One approach for doing so is to improve ambulatory care, which can reduce the need for hospital-based acute care. Another approach is to stabilize acutely ill patients and discharge them from the emergency department (ED) or following a period of observation.1 Private payers are entering into value-based contracting arrangements with hospitals and health systems to improve the quality of ambulatory care and lower healthcare expenditures.2 Enrollment in managed care programs has grown among Medicaid recipients for similar reasons.3 Policies of the Centers for Medicare & Medicaid Services (CMS) encourage improvements in ambulatory care as well as observation of Medicare beneficiaries instead of inpatient admission in certain situations.4
Recent studies have documented declines in inpatient admissions and increases in treat-and-release observation stays and ED visits among Medicare beneficiaries.4-7 However, almost half of all hospitalizations unrelated to childbirth occur among patients with private insurance, Medicaid, or no insurance.8 Less is known about shifts in the nature of hospital-based acute care among these populations. Such shifts would have implications for quality of care, patient outcomes, and costs. Therefore, further investigation is warranted.
Our objective was to investigate recent trends in payer-specific population-based rates of adults using inpatient, observation, and ED services. We focused on 10 medical conditions that are common reasons for hospital-based acute care: heart failure, bacterial pneumonia, chronic obstructive pulmonary disease, asthma, dehydration, urinary tract infection, uncontrolled diabetes, diabetes with long-term complications, diabetes with short-term complications, and hypertension. These conditions constitute more than 20% of inpatient stays in the general medical service line, can be affected by improvements in ambulatory care, and provided a consistent set of diagnoses to track trends over time.9 We used 2009 and 2013 data from four states to examine trends among individuals with private insurance, Medicare, Medicaid, and no insurance.
METHODS
We obtained encounter-level data for Georgia, Nebraska, South Carolina, and Tennessee from the Agency for Healthcare Research and Quality (AHRQ), Healthcare Cost and Utilization Project (HCUP).10 Using encrypted patient identifiers, we linked inpatient admissions from the 2009 and 2013 State Inpatient Databases, observation stays from the State Ambulatory Surgery and Services Databases, and ED visits from State Emergency Department Databases.
We defined the 10 medical conditions using numerator specifications from the ICD-9-CM v 5.0 AHRQ Prevention Quality Indicators (see Appendix). At most, 1 inpatient admission, 1 observation stay, and 1 ED visit for a study condition was counted for each adult in each year. Limiting the number of visits minimized the skew caused by multiple uses of the same service.
Using the American Community Survey, we calculated utilization rates for each type of service per 100,000 population in four payer and age groups: privately insured adults, Medicaid recipients, and uninsured adults 18 to 64 years, as well as Medicare beneficiaries 65 years and older. For each group, we also examined the origin of inpatient admissions—those who were directly admitted without evaluation in the ED, those admitted from the ED, and ED visits leading to observation stays and then inpatient admission.
 with treat-and-release observation stays and ED visits relative to inpatient admissions for ambulatory care sensitive conditions, 2009–2013.")
RESULTS
Comparing 2009 and 2013, population-based rates of adults with 1 or more inpatient admissions for 10 common medical conditions declined, whereas rates of adults with treat-and-release observation stays rose. Changes in rates of treat-and-release ED visits varied across payers but were small relative to the substantial declines in inpatient admissions (Figure 1). In addition, a growing percentage of inpatient admissions began as observation stays and fewer adults were admitted directly, except among uninsured individuals (Figure 2).

Private Payers, 18 to 64 Years
The rate of adults with treat-and-release observation stays rose (+12.0%, 30 to 33 per 100,000 private payer population, P < 0.001). The rate of adults with treat-and-release ED visits declined (–9.0%, 713 to 648 per 100,000 population, P < 0.001), but by less than for inpatient admissions (–28.2%, 231 to 166 per 100,000 population, P < 0.001; Figure 1A). The percentage of inpatient admissions that began as observation stays rose (from 4.1% to 5.4%, P = 0.041), as did the percentage of admissions originating in the ED (from 66.4% to 71.5%, P ≤ 0.001; Figure 2).
Medicare, 65 Years and Older
The rate of adults with inpatient admissions declined (–17.0%, 2669 to 2216 per 100,000 Medicare population, P < 0.001). Rates rose for adults with treat-and-release ED visits (+3.9%, 1887 to 1961 per 100,000 population, P < 0.001) and treat-and-release observation stays (+32.9%, 234 to 311 per 100,000 population, P < 0.001; Figure 1B). The percentage of inpatient admissions that began as observation stays also rose (5.4% to 9.1%, P < 0.001; Figure 2).
Medicaid, 18 to 64 Years
The rate of adults with inpatient admissions declined (–15.3%, 1100 to 931 per 100,000 Medicaid population, P < 0.001), whereas treat-and-release ED visits remained flat (–1.5%, 4867 to 4792 per 100,000 population, P = 0.413) and treat-and-release observation stays rose (+18.1%, 196 to 232 per 100,000 population, P < 0.001; Figure 1C). The percentage of inpatient admissions that began as observation stays rose (5.9% to 8.1%, P = 0.022; Figure 2).
Uninsured, 18 to 64 Years
The rate of adults with inpatient admissions declined (–5.2%, 296 to 281 per 100,000 uninsured population, P = 0.003), whereas rates rose for treat-and-release ED visits (+8.9%, 1888 to 2057 per 100,000 population, P < 0.001) and treat-and-release observation stays (34.7%, 54 to 73 per 100,000 population, P < 0.001; Figure 1D). The source of inpatient admissions remained stable (Figure 2).
DISCUSSION
Data on hospital encounters from four states show that both ED visits and observation stays are playing an increasing role in hospital-based acute care for 10 common conditions among populations insured by private payers, Medicare, and Medicaid, as well as those without insurance. Compared with 2009, in 2013 substantially fewer individuals had inpatient admissions, and patients were more likely to be discharged from the ED or discharged following observation without receiving inpatient care. Additionally, an increasing percentage of inpatient admissions followed observation stays, whereas direct admissions declined.
Previous authors also have reported declines in inpatient stays for these same conditions.11 Others have reported increases in the use of observation stays for diverse conditions among patients with private insurance, Medicare beneficiaries, and veterans.4,12,13 The unique attributes of HCUP databases from these four states (eg, all-payer data including patient linkage numbers across inpatient, observation, and ED care) enabled us to assess concurrent shifts in hospital-based acute care from inpatient to outpatient care among multiple payer populations. A recent analysis reported declines in readmissions and increases in observation visits occurring within 30 days after hospitalization among Medicare beneficiaries with heart failure, acute myocardial infarction, or pneumonia.14 Future research should examine trends in readmissions and observation visits following hospitalization among multiple payer populations.
These shifts raise two important questions. The first pertains to quality of care, including outcomes. Although dedicated observation units with condition-specific care pathways can be associated with shorter stays and fewer admissions, many patients placed under observation are neither in dedicated units nor subject to care pathways.15,16 Systems for monitoring quality of care are less developed for observation care. The CMS publicly reports hospital-level data on quality of ED and inpatient care, including for several of the conditions we studied, but no measures apply to observation stays.17 Little is known about whether shifts from inpatient care to observation status or discharge from the ED are associated with different health outcomes.
The second issue is patients’ out-of-pocket costs. Although shifts from inpatient admissions to observation stays can reduce costs to payers,15 effects on patient out-of-pocket costs are uncertain and may vary. For privately insured patients, out-of-pocket costs may be up to four times higher for observation than for inpatient care.18 For Medicare beneficiaries, out-of-pocket costs can be higher for observation than for inpatient stays, particularly when patients receive costly medications or are discharged to skilled nursing facilities;19,20 however, having secondary insurance dramatically reduces out-of-pocket costs.21 We are not aware of data on Medicaid recipients or uninsured individuals.
This study has limitations. Only four states had data needed for these analyses, so generalization to other states is limited. Our analysis was descriptive and did not control for case mix, evaluate specific policies by any payer, or assess the full volume of visits among high utilizers. Movement of healthier or sicker individuals across payers could have contributed to temporal trends, but findings were similar across payers.
In conclusion, among 10 common medical conditions and three major payer populations and uninsured individuals in four states, inpatient admissions declined, and care shifted toward treat-and-release ED visits and observation stays. The number of inpatient admissions that began as observation stays also increased. Given these trends and the possibility that such shifts may be widespread and continue beyond 2013, quality of care, outcomes, and costs to patients warrant further evaluation.
Acknowledgments
The authors gratefully acknowledge Minya Sheng, MS (Truven Health Analytics) for assistance in programming and data management, and Paige Jackson, MS and Linda Lee, PhD, (Truven Health Analytics) for providing editorial review of the manuscript. They also wish to acknowledge the four HCUP Partner organizations that contributed to the 2009 and 2013 HCUP state databases used in this study: Georgia Hospital Association, Nebraska Hospital Association, South Carolina Revenue and Fiscal Affairs Office, and Tennessee Hospital Association.
Disclosure
Funding for this study was provided by the Agency for Healthcare Research and Quality (AHRQ), Healthcare Cost and Utilization Project (HCUP) (Contract No. HHSA-290-2013-00002-C). The views expressed in this article are those of the authors and do not necessarily reflect those of the Agency for Healthcare Research and Quality or the U.S. Department of Health and Human Services. The authors have no conflicts of interest to declare or financial disclosures.
1. Ross MA, Hockenberry JM, Mutter R, Barrett M, Wheatley M, Pitts SR. Protocol-driven emergency department observation units offer savings, shorter stays, and reduced admissions. Health Aff (Millwood). 2013;32(12):2149-2156 PubMed
2. Song Z. Accountable care organizations in the U.S. health care system. J Clin Outcomes Manag. 2014;21(8):364-371. PubMed
3. Kaiser Family Foundation. Total Medicaid MCOs. State Health Facts. 2016. http://kff.org/other/state-indicator/total-medicaid-mcos/. Accessed July 19, 2016.
4. Feng Z, Wright B, Mor V. Sharp rise in Medicare enrollees being held in hospitals for observation raises concerns about causes and consequences. Health Aff (Millwood). 2012;31(6):1251-1259. PubMed
5. Skinner HG, Blanchard J, Elixhauser A. Trends in emergency department visits, 2006–2011. HCUP Statistical Brief #179. September 2014. Agency for Healthcare Research and Quality, Rockville, MD. http://www.hcup-us.ahrq.gov/reports/statbriefs/sb179-Emergency-Department-Trends.pdf. Accessed July 21, 2016.
6. Medicare Payment Advisory Commission. Report to the Congress: Medicare and the Health Care Delivery System. June 2015. http://www.medpac.gov/docs/default-source/reports/june-2015-report-to-the-congress-medicare-and-the-health-care-delivery-system.pdf?sfvrsn=0. Accessed October 6, 2016.
7. Medicare Payment Advisory Commission. Report to the Congress: Medicare Payment Policy. March 2016. http://www.medpac.gov/docs/default-source/reports/march-2016-report-to-the-congress-medicare-payment-policy.pdf?sfvrsn=0. Accessed October 6, 2016.
8. Agency for Healthcare Research and Quality. Healthcare Cost and Utilization Project. HCUPnet. Agency for Healthcare Research and Quality, Rockville, MD. http://hcupnet.ahrq.gov/. Accessed October 6, 2016.
9. Fingar KR, Barrett ML, Elixhauser A, Stocks C, Steiner CA. Trends in potentially preventable inpatient hospital admissions and emergency department visits. HCUP Statistical Brief #195. November 2015. Agency for Healthcare Research and Quality, Rockville, MD. http://www.hcup-us.ahrq.gov/reports/statbriefs/sb195-Potentially-Preventable-Hospitalizations.pdf. Accessed August 9, 2016.
10. Agency for Healthcare Research and Quality. HCUP Databases. Agency for Healthcare Research and Quality, Rockville, MD. www.hcup-us.ahrq.gov/databases.jsp. Accessed August 8, 2016.
11. Torio CM, Andrews RM. Geographic variation in potentially preventable hospitalizations for acute and chronic conditions, 2005–2011. HCUP Statistical Brief, #178. September 2014. Agency for Healthcare Research and Quality, Rockville, MD. http://www.hcup-us.ahrq.gov/reports/statbriefs/sb178-Preventable-Hospitalizations-by-Region.pdf. Accessed November 8, 2015.
12. Wright B, O’Shea AM, Ayyagari P, Ugwi PG, Kaboli P, Vaughan Sarrazin M. Observation rates at veterans’ hospitals more than doubled during 2005-13, similar to Medicare trends. Health Aff (Millwood). 2015;34(10):1730-1737. PubMed
13. Noel-Miller C, Lind K. Is observation status substituting for hospital readmission? Health Affairs Blog. October 28, 2015. Project Hope: The People-to-People Health Foundation, Inc., Millwood, VA. http://healthaffairs.org/blog/2015/10/28/is-observation-status-substituting-for-hospital-readmission/. Accessed November 8, 2015.
14. Zuckerman RB, Sheingold SH, Orav EJ, Ruhter J, Epstein AM. Readmissions, observation, and the hospital readmissions reduction program. N Engl J Med. 2016;374(16):1543-1551. PubMed
15. Ross MA, Hockenberry JM, Mutter R, Barrett M, Wheatley M, Pitts SR. Protocol-driven emergency department observation units offer savings, shorter stays, and reduced admissions. Health Aff (Millwood). 2013;32(12):2149-2156. PubMed
16. Sheehy AM. Dedicated observation unit for patients with “observation status” -- reply. JAMA Intern Med. 2014;174(2):301-302. PubMed
17. Medicare.gov. Measures and current data collection periods. Centers for Medicare and Medicaid Services, Baltimore, MD. https://www.medicare.gov/hospitalcompare/Data/Data-Updated.html#. Accessed July 19, 2016.
18. Jaffe S. You’re being observed in the hospital? Patients with private insurance better off than seniors. September 11, 2014. Kaiser Health News, Kaiser Family Foundation, Menlo Park, CA. http://khn.org/news/youre-being-observed-in-the-hospital-patients-with-private-insurance-are-better-off-than-seniors/. Accessed November 8, 2015.
19. Kangovi S, Cafardi SG, Smith RA, Kulkarni R, Grande D. Patient financial responsibility for observation care. J Hosp Med. 2015;10(11):718-723. PubMed
20. U.S. Department of Health and Human Services, Office of Inspector General. Hospitals’ use of observation stays and short inpatient stays for Medicare beneficiaries. Memorandum Report OEI-02-12-00040. July 29, 2013. U.S. Department of Health and Human Services, Washington, DC. https://oig.hhs.gov/oei/reports/oei-02-12-00040.pdf. Accessed October 6, 2016.
21. Doyle BJ, Ettner SL, Nuckols TK. Supplemental insurance reduces out-of-pocket costs in Medicare observation services. J Hosp Med. 2016;11(7):502-504. PubMed
For over a decade, private and public payers have implemented policies aimed at reducing rates of inpatient hospitalization. One approach for doing so is to improve ambulatory care, which can reduce the need for hospital-based acute care. Another approach is to stabilize acutely ill patients and discharge them from the emergency department (ED) or following a period of observation.1 Private payers are entering into value-based contracting arrangements with hospitals and health systems to improve the quality of ambulatory care and lower healthcare expenditures.2 Enrollment in managed care programs has grown among Medicaid recipients for similar reasons.3 Policies of the Centers for Medicare & Medicaid Services (CMS) encourage improvements in ambulatory care as well as observation of Medicare beneficiaries instead of inpatient admission in certain situations.4
Recent studies have documented declines in inpatient admissions and increases in treat-and-release observation stays and ED visits among Medicare beneficiaries.4-7 However, almost half of all hospitalizations unrelated to childbirth occur among patients with private insurance, Medicaid, or no insurance.8 Less is known about shifts in the nature of hospital-based acute care among these populations. Such shifts would have implications for quality of care, patient outcomes, and costs. Therefore, further investigation is warranted.
Our objective was to investigate recent trends in payer-specific population-based rates of adults using inpatient, observation, and ED services. We focused on 10 medical conditions that are common reasons for hospital-based acute care: heart failure, bacterial pneumonia, chronic obstructive pulmonary disease, asthma, dehydration, urinary tract infection, uncontrolled diabetes, diabetes with long-term complications, diabetes with short-term complications, and hypertension. These conditions constitute more than 20% of inpatient stays in the general medical service line, can be affected by improvements in ambulatory care, and provided a consistent set of diagnoses to track trends over time.9 We used 2009 and 2013 data from four states to examine trends among individuals with private insurance, Medicare, Medicaid, and no insurance.
METHODS
We obtained encounter-level data for Georgia, Nebraska, South Carolina, and Tennessee from the Agency for Healthcare Research and Quality (AHRQ), Healthcare Cost and Utilization Project (HCUP).10 Using encrypted patient identifiers, we linked inpatient admissions from the 2009 and 2013 State Inpatient Databases, observation stays from the State Ambulatory Surgery and Services Databases, and ED visits from State Emergency Department Databases.
We defined the 10 medical conditions using numerator specifications from the ICD-9-CM v 5.0 AHRQ Prevention Quality Indicators (see Appendix). At most, 1 inpatient admission, 1 observation stay, and 1 ED visit for a study condition was counted for each adult in each year. Limiting the number of visits minimized the skew caused by multiple uses of the same service.
Using the American Community Survey, we calculated utilization rates for each type of service per 100,000 population in four payer and age groups: privately insured adults, Medicaid recipients, and uninsured adults 18 to 64 years, as well as Medicare beneficiaries 65 years and older. For each group, we also examined the origin of inpatient admissions—those who were directly admitted without evaluation in the ED, those admitted from the ED, and ED visits leading to observation stays and then inpatient admission.
RESULTS
Comparing 2009 and 2013, population-based rates of adults with 1 or more inpatient admissions for 10 common medical conditions declined, whereas rates of adults with treat-and-release observation stays rose. Changes in rates of treat-and-release ED visits varied across payers but were small relative to the substantial declines in inpatient admissions (Figure 1). In addition, a growing percentage of inpatient admissions began as observation stays and fewer adults were admitted directly, except among uninsured individuals (Figure 2).
Private Payers, 18 to 64 Years
The rate of adults with treat-and-release observation stays rose (+12.0%, 30 to 33 per 100,000 private payer population, P < 0.001). The rate of adults with treat-and-release ED visits declined (–9.0%, 713 to 648 per 100,000 population, P < 0.001), but by less than for inpatient admissions (–28.2%, 231 to 166 per 100,000 population, P < 0.001; Figure 1A). The percentage of inpatient admissions that began as observation stays rose (from 4.1% to 5.4%, P = 0.041), as did the percentage of admissions originating in the ED (from 66.4% to 71.5%, P ≤ 0.001; Figure 2).
Medicare, 65 Years and Older
The rate of adults with inpatient admissions declined (–17.0%, 2669 to 2216 per 100,000 Medicare population, P < 0.001). Rates rose for adults with treat-and-release ED visits (+3.9%, 1887 to 1961 per 100,000 population, P < 0.001) and treat-and-release observation stays (+32.9%, 234 to 311 per 100,000 population, P < 0.001; Figure 1B). The percentage of inpatient admissions that began as observation stays also rose (5.4% to 9.1%, P < 0.001; Figure 2).
Medicaid, 18 to 64 Years
The rate of adults with inpatient admissions declined (–15.3%, 1100 to 931 per 100,000 Medicaid population, P < 0.001), whereas treat-and-release ED visits remained flat (–1.5%, 4867 to 4792 per 100,000 population, P = 0.413) and treat-and-release observation stays rose (+18.1%, 196 to 232 per 100,000 population, P < 0.001; Figure 1C). The percentage of inpatient admissions that began as observation stays rose (5.9% to 8.1%, P = 0.022; Figure 2).
Uninsured, 18 to 64 Years
The rate of adults with inpatient admissions declined (–5.2%, 296 to 281 per 100,000 uninsured population, P = 0.003), whereas rates rose for treat-and-release ED visits (+8.9%, 1888 to 2057 per 100,000 population, P < 0.001) and treat-and-release observation stays (34.7%, 54 to 73 per 100,000 population, P < 0.001; Figure 1D). The source of inpatient admissions remained stable (Figure 2).
DISCUSSION
Data on hospital encounters from four states show that both ED visits and observation stays are playing an increasing role in hospital-based acute care for 10 common conditions among populations insured by private payers, Medicare, and Medicaid, as well as those without insurance. Compared with 2009, in 2013 substantially fewer individuals had inpatient admissions, and patients were more likely to be discharged from the ED or discharged following observation without receiving inpatient care. Additionally, an increasing percentage of inpatient admissions followed observation stays, whereas direct admissions declined.
Previous authors also have reported declines in inpatient stays for these same conditions.11 Others have reported increases in the use of observation stays for diverse conditions among patients with private insurance, Medicare beneficiaries, and veterans.4,12,13 The unique attributes of HCUP databases from these four states (eg, all-payer data including patient linkage numbers across inpatient, observation, and ED care) enabled us to assess concurrent shifts in hospital-based acute care from inpatient to outpatient care among multiple payer populations. A recent analysis reported declines in readmissions and increases in observation visits occurring within 30 days after hospitalization among Medicare beneficiaries with heart failure, acute myocardial infarction, or pneumonia.14 Future research should examine trends in readmissions and observation visits following hospitalization among multiple payer populations.
These shifts raise two important questions. The first pertains to quality of care, including outcomes. Although dedicated observation units with condition-specific care pathways can be associated with shorter stays and fewer admissions, many patients placed under observation are neither in dedicated units nor subject to care pathways.15,16 Systems for monitoring quality of care are less developed for observation care. The CMS publicly reports hospital-level data on quality of ED and inpatient care, including for several of the conditions we studied, but no measures apply to observation stays.17 Little is known about whether shifts from inpatient care to observation status or discharge from the ED are associated with different health outcomes.
The second issue is patients’ out-of-pocket costs. Although shifts from inpatient admissions to observation stays can reduce costs to payers,15 effects on patient out-of-pocket costs are uncertain and may vary. For privately insured patients, out-of-pocket costs may be up to four times higher for observation than for inpatient care.18 For Medicare beneficiaries, out-of-pocket costs can be higher for observation than for inpatient stays, particularly when patients receive costly medications or are discharged to skilled nursing facilities;19,20 however, having secondary insurance dramatically reduces out-of-pocket costs.21 We are not aware of data on Medicaid recipients or uninsured individuals.
This study has limitations. Only four states had data needed for these analyses, so generalization to other states is limited. Our analysis was descriptive and did not control for case mix, evaluate specific policies by any payer, or assess the full volume of visits among high utilizers. Movement of healthier or sicker individuals across payers could have contributed to temporal trends, but findings were similar across payers.
In conclusion, among 10 common medical conditions and three major payer populations and uninsured individuals in four states, inpatient admissions declined, and care shifted toward treat-and-release ED visits and observation stays. The number of inpatient admissions that began as observation stays also increased. Given these trends and the possibility that such shifts may be widespread and continue beyond 2013, quality of care, outcomes, and costs to patients warrant further evaluation.
Acknowledgments
The authors gratefully acknowledge Minya Sheng, MS (Truven Health Analytics) for assistance in programming and data management, and Paige Jackson, MS and Linda Lee, PhD, (Truven Health Analytics) for providing editorial review of the manuscript. They also wish to acknowledge the four HCUP Partner organizations that contributed to the 2009 and 2013 HCUP state databases used in this study: Georgia Hospital Association, Nebraska Hospital Association, South Carolina Revenue and Fiscal Affairs Office, and Tennessee Hospital Association.
Disclosure
Funding for this study was provided by the Agency for Healthcare Research and Quality (AHRQ), Healthcare Cost and Utilization Project (HCUP) (Contract No. HHSA-290-2013-00002-C). The views expressed in this article are those of the authors and do not necessarily reflect those of the Agency for Healthcare Research and Quality or the U.S. Department of Health and Human Services. The authors have no conflicts of interest to declare or financial disclosures.
1. Ross MA, Hockenberry JM, Mutter R, Barrett M, Wheatley M, Pitts SR. Protocol-driven emergency department observation units offer savings, shorter stays, and reduced admissions. Health Aff (Millwood). 2013;32(12):2149-2156 PubMed
2. Song Z. Accountable care organizations in the U.S. health care system. J Clin Outcomes Manag. 2014;21(8):364-371. PubMed
3. Kaiser Family Foundation. Total Medicaid MCOs. State Health Facts. 2016. http://kff.org/other/state-indicator/total-medicaid-mcos/. Accessed July 19, 2016.
4. Feng Z, Wright B, Mor V. Sharp rise in Medicare enrollees being held in hospitals for observation raises concerns about causes and consequences. Health Aff (Millwood). 2012;31(6):1251-1259. PubMed
5. Skinner HG, Blanchard J, Elixhauser A. Trends in emergency department visits, 2006–2011. HCUP Statistical Brief #179. September 2014. Agency for Healthcare Research and Quality, Rockville, MD. http://www.hcup-us.ahrq.gov/reports/statbriefs/sb179-Emergency-Department-Trends.pdf. Accessed July 21, 2016.
6. Medicare Payment Advisory Commission. Report to the Congress: Medicare and the Health Care Delivery System. June 2015. http://www.medpac.gov/docs/default-source/reports/june-2015-report-to-the-congress-medicare-and-the-health-care-delivery-system.pdf?sfvrsn=0. Accessed October 6, 2016.
7. Medicare Payment Advisory Commission. Report to the Congress: Medicare Payment Policy. March 2016. http://www.medpac.gov/docs/default-source/reports/march-2016-report-to-the-congress-medicare-payment-policy.pdf?sfvrsn=0. Accessed October 6, 2016.
8. Agency for Healthcare Research and Quality. Healthcare Cost and Utilization Project. HCUPnet. Agency for Healthcare Research and Quality, Rockville, MD. http://hcupnet.ahrq.gov/. Accessed October 6, 2016.
9. Fingar KR, Barrett ML, Elixhauser A, Stocks C, Steiner CA. Trends in potentially preventable inpatient hospital admissions and emergency department visits. HCUP Statistical Brief #195. November 2015. Agency for Healthcare Research and Quality, Rockville, MD. http://www.hcup-us.ahrq.gov/reports/statbriefs/sb195-Potentially-Preventable-Hospitalizations.pdf. Accessed August 9, 2016.
10. Agency for Healthcare Research and Quality. HCUP Databases. Agency for Healthcare Research and Quality, Rockville, MD. www.hcup-us.ahrq.gov/databases.jsp. Accessed August 8, 2016.
11. Torio CM, Andrews RM. Geographic variation in potentially preventable hospitalizations for acute and chronic conditions, 2005–2011. HCUP Statistical Brief, #178. September 2014. Agency for Healthcare Research and Quality, Rockville, MD. http://www.hcup-us.ahrq.gov/reports/statbriefs/sb178-Preventable-Hospitalizations-by-Region.pdf. Accessed November 8, 2015.
12. Wright B, O’Shea AM, Ayyagari P, Ugwi PG, Kaboli P, Vaughan Sarrazin M. Observation rates at veterans’ hospitals more than doubled during 2005-13, similar to Medicare trends. Health Aff (Millwood). 2015;34(10):1730-1737. PubMed
13. Noel-Miller C, Lind K. Is observation status substituting for hospital readmission? Health Affairs Blog. October 28, 2015. Project Hope: The People-to-People Health Foundation, Inc., Millwood, VA. http://healthaffairs.org/blog/2015/10/28/is-observation-status-substituting-for-hospital-readmission/. Accessed November 8, 2015.
14. Zuckerman RB, Sheingold SH, Orav EJ, Ruhter J, Epstein AM. Readmissions, observation, and the hospital readmissions reduction program. N Engl J Med. 2016;374(16):1543-1551. PubMed
15. Ross MA, Hockenberry JM, Mutter R, Barrett M, Wheatley M, Pitts SR. Protocol-driven emergency department observation units offer savings, shorter stays, and reduced admissions. Health Aff (Millwood). 2013;32(12):2149-2156. PubMed
16. Sheehy AM. Dedicated observation unit for patients with “observation status” -- reply. JAMA Intern Med. 2014;174(2):301-302. PubMed
17. Medicare.gov. Measures and current data collection periods. Centers for Medicare and Medicaid Services, Baltimore, MD. https://www.medicare.gov/hospitalcompare/Data/Data-Updated.html#. Accessed July 19, 2016.
18. Jaffe S. You’re being observed in the hospital? Patients with private insurance better off than seniors. September 11, 2014. Kaiser Health News, Kaiser Family Foundation, Menlo Park, CA. http://khn.org/news/youre-being-observed-in-the-hospital-patients-with-private-insurance-are-better-off-than-seniors/. Accessed November 8, 2015.
19. Kangovi S, Cafardi SG, Smith RA, Kulkarni R, Grande D. Patient financial responsibility for observation care. J Hosp Med. 2015;10(11):718-723. PubMed
20. U.S. Department of Health and Human Services, Office of Inspector General. Hospitals’ use of observation stays and short inpatient stays for Medicare beneficiaries. Memorandum Report OEI-02-12-00040. July 29, 2013. U.S. Department of Health and Human Services, Washington, DC. https://oig.hhs.gov/oei/reports/oei-02-12-00040.pdf. Accessed October 6, 2016.
21. Doyle BJ, Ettner SL, Nuckols TK. Supplemental insurance reduces out-of-pocket costs in Medicare observation services. J Hosp Med. 2016;11(7):502-504. PubMed
© 2017 Society of Hospital Medicine
Telemetry monitor watchers reduce bedside nurses’ exposure to alarms by intercepting a high number of nonactionable alarms
Cardiac telemetry, designed to monitor hospitalized patients with active cardiac conditions, is highly utilized outside the intensive care unit (ICU) and generates a large number of automated alarms. Telemetry is also costly and requires substantial time and attention commitments from nursing and technician staff, who place and maintain the recording devices and address monitoring results. 1,2 The staff address and dismiss invalid alarms caused by telemetry artifacts, 2 such as the misreporting of patient movement as ventricular tachycardia/fibrillation (VT/VF) or the mimicking of asystole by a lead disconnection.
One strategy for addressing telemetry alarms is to have dedicated staff observe telemetry monitors and notify nurses with any events or findings. Studies conducted in the 1990s showed that dedicated monitor watchers, compared with automatically generated alarms alone, did not affect most outcomes 3 but can improve accuracy of arrhythmia detection. 4 Since then, given the advances in telemetry detection software, the effect of monitor watchers has not been evaluated. Mindful of the perceived burden of nonactionable telemetry alerts, we wanted to quantify the frequency of automated telemetry alerts in the wards and analyze the proportion of alerts deemed nonactionable by monitor watchers.
METHODS
We conducted this retrospective study at a 545-bed urban academic hospital in the United States. We reviewed the cases of all non-ICU patients with telemetry monitoring ordered. The telemetry order requires providers specify the indication for monitoring and adjust alert parameters for variables such as heart rate (preset to 60 and 100 beats per minute) and baseline rhythm (preset to normal sinus). Once a telemetry order is received, 5 leads are attached to the patient, and electrocardiographic data begin transmitting to a portable wireless telemetry monitor, or telemeter (Philips Intellispace Telemetry System), which in turn transmits to a central monitoring station in the progressive care unit (PCU; cardiac/pulmonary unit). The majority of patients on telemetry are in the PCU. Telemeters are also located in the general medicine, surgical, and neurologic non-ICU units. Data from a maximum of 96 telemeters in the hospital are simultaneously displayed in the central monitoring station.
At all times, two dedicated monitor watchers oversee the central monitoring station. Watchers are certified medical assistants with extra telemetry-specific training. Each receives a salary of $17 per hour (no benefits), or about $800 per 24-hour day for two watchers. Their role is to respond to audiovisual alerts triggered by the monitoring system—they either contact the bedside nurse or intercept the alert if deemed nonactionable. Consistent with the literature, 5 nonactionable alerts and alarms were defined as either “invalid” or “nuisance.” Invalid alerts and alarms misrepresent patient status (eg, patient motion is electronically interpreted as VT/VF), and nuisance alerts and alarms do not require clinical intervention (eg, persistent sinus tachycardia has already been communicated to the nurse or provider). Monitor watchers must intercept the alert within a limited amount of time: 15 seconds for suspected lethal alerts (asystole, VT/VF), 30 seconds for extreme tachycardia/bradycardia, and 60 seconds for lead displacement or low battery.

If a watcher does not intercept an alert—either intentionally or because time ran out—the alert generates an alarm, which automatically sends a text message to the patient’s nurse’s wireless phone. The nurse acknowledges the alarm and decides on further action. If the bedside nurse does not acknowledge the alarm within the same time frames as mentioned, the alarm is escalated, first to the unit charge nurse and then to the monitoring station charge nurse (Figure). All alerts are available for provider review at the central monitoring station for the duration of the telemetry order, and select telemetry strips are printed and filed in the patient’s paper chart.
For this study, we analyzed telemetry system data for all monitored non-ICU ward patients from August 1 through September 30, 2014. We focused on the rate and relevance of alerts (system-generated) and alarms (text message to nurse). As cardiac arrhythmias leading to cardiopulmonary arrest can potentially be detected by telemetry, we also reviewed all code team activations, which are recorded in a separate database that details time of code team activation, to evaluate for correlation with telemetry alerts.
RESULTS
Within the 2-month study period, there were 1917 admissions to, and 1370 transfers to, non-ICU floors, for a total of 3287 unique patient-admissions and 9704 total patient-days. There were 1199 patient admissions with telemetry orders (36.5% of all admissions), 4044 total patient-days of telemetry, and an average of 66.3 patients monitored per day. In addition, the system generated 20,775 alerts, an average of 341 per day, 5.1 per patient-day, 1 every 4 minutes. Overall, 18,051 alerts (87%) were intercepted by monitor watchers, preventing nurse text-alarms. Of all alerts, 91% were from patients on medicine services, including pulmonary and cardiology; 6% were from patients on the neurology floor; and 3% were from patients on the surgery floor.

Forty percent of all alerts were for heart rates deviating outside the ranges set by the provider; of these, the overwhelming majority were intercepted as nuisance alerts (Table). In addition, 26% of all alerts were for maintenance reasons, including issues with batteries or leads. Finally, 34% (6954) were suspected lethal alerts (asystole, VT/VF); of these, 74% (5170) were intercepted by monitor watchers, suggesting they were deemed invalid. None of the suspected lethal alerts triggered a code team activation, indicating there were no telemetry-documented asystole or VT/VF episodes prompting resuscitative efforts. During the study period, there were 7 code team activations. Of the 7 patients, 2 were on telemetry, and their code team activation was for hypoxia detected by pulse oximetry; the other 5 patients, not on telemetry, were found unresponsive or apneic, and 4 of them had confirmed pulseless electrical activity.
DISCUSSION
In small studies, other investigators have directly observed nurses for hours at a time and assessed their response to telemetry-related alarms. 1,2 In the present study, we found a very large number of telemetry-detected alerts over a continuous 2-month period. The large majority (87%) of alerts were manually intercepted by monitor watchers before being communicated to a nurse or provider, indicating these alerts did not affect clinical management and likely were either false positives or nonactionable. It is possible that repeat nonactionable alerts, like continued sinus tachycardia or bradycardia, affect decision making, but this may be outside the role of continuous cardiac telemetry. In addition, it is likely that all the lethal alarms (asystole, VT/VF) forwarded to the nurses were invalid, as none resulted in code team activations.
Addressing these alerts is a major issue, as frequent telemetry alarms can lead to alarm fatigue, a widely acknowledged safety concern. 6 Furthermore, nonactionable alarms are a time sink, diverting nursing attention from other patient care needs. Finally, nonactionable alarms, especially invalid alarms, can lead to adverse patient outcomes. Although we did not specifically evaluate for harm, an earlier case series found a potential for unnecessary interventions and device implantation as a result of reporting artifactual arrhythmias. 7
Our results also highlight the role of monitor watchers in intercepting nonactionable alarms and reducing the alarm burden on nurses. Other investigators have reported on computerized paging systems that directly alert only nurses, 8 or on escalated alarm paging systems that let noncrisis alarms self-resolve. 9 In contrast, our study used a hybrid 2-step telemetry-monitoring system—an escalated paging system designed to be sensitive and less likely than human monitoring to overlook events, followed by dedicated monitor watchers who are first-responders for a large number of alarms and who increase the specificity of alarms by screening for nonactionable alarms, thereby reducing the number of alarms transmitted to nurses. We think that, for most hospitals, monitor watchers are cost-effective, as their hourly wage is lower than that of registered nurses. Furthermore, monitor watchers can screen alerts faster because they are always at the monitoring station. Their presence reduces the amount of time that nurses need to divert from other clinical tasks in order to walk to the monitoring station to evaluate alerts.
Nonetheless, there remains a large number of nonactionable alerts forwarded as alarms to nurses, likely because of monitor watchers’ inability to address the multitude of alerts, and perhaps because of alarm fatigue. Although this study showed the utility of monitor watchers in decreasing telemetry alarms to nurses, other steps can be taken to reduce telemetry alarm fatigue. A systematic review of alarm frequency interventions 5 noted that detection algorithms can be improved to decrease telemetry alert false positives. Another solution, likely easier to implement, is to encourage appropriate alterations in telemetry alarm parameters, which can decrease the alarm proportion. 10 An essential step is to decrease inappropriate telemetry use regarding the indication for and duration of monitoring, as emphasized by the Choosing Wisely campaign championing American Heart Association (AHA) guidelines for appropriate telemetry use. 11 At our institution, 20.2% of telemetry orders were for indications outside AHA guidelines, and that percentage likely is an underestimate, as this was required self-reporting on ordering. 12 Telemetry may not frequently result in changes in management in the non-ICU setting, 13 and may lead to other harms such as worsening delirium, 14 so it needs to be evaluated for harm versus benefit per patient before order.
Cardiac telemetry in the non-ICU setting produces a large number of alerts and alarms. The vast majority are not seen or addressed by nurses or physicians, leading to a negligible impact on patient care decisions. Monitor watchers reduce the nursing burden in dealing with telemetry alerts, but we emphasize the need to take additional measures to reduce telemetry-related alerts and thereby reduce alarm-related harms and alarm fatigue.
Acknowledgments
The authors thank Torberg Tonnessen, who was instrumental in providing the telemetry and clinical data used in this study, as well as the numerous Johns Hopkins Bayview Medical Center nurses, patient care technicians, and monitor watchers who answered questions about telemetry processes and allowed their work to be observed.
Disclosure
Nothing to report.
1. Gazarian PK. Nurses’ response to frequency and types of electrocardiography alarms in a non-critical care setting: a descriptive study. Int J Nurs Stud . 2014;51(2):190-197. PubMed
2. Varpio L, Kuziemsky C, MacDonald C, King WJ. The helpful or hindering effects of in-hospital patient monitor alarms on nurses. Comput Inform Nurs . 2012;30(4):210-217. PubMed
3. Funk M, Parkosewich J, Johnson C, Stukshis I. Effect of dedicated monitor watchers on patients’ outcomes. Am J Crit Care . 1997;6(4):318-323. PubMed
4. Stukshis I, Funk M, Johnson C, Parkosewich J. Accuracy of detection of clinically important dysrhythmias with and without a dedicated monitor watcher. Am J Crit Care . 1997;6(4):312-317. PubMed
5. Paine CW, Goel VV, Ely E, et al. Systematic review of physiologic monitor alarm characteristics and pragmatic interventions to reduce alarm frequency. J Hosp Med . 2016;11(2):136-144. PubMed
6. Joint Commission on Accreditation of Healthcare Organizations. The Joint Commission announces 2014 national patient safety goal. Jt Comm Perspect . 2013;33(7):1, 3-4. PubMed
7. Knight BP, Pelosi F, Michaud GF, Strickberger SA, Morady F. Clinical consequences of electrocardiographic artifact mimicking ventricular tachycardia. N Engl J Med . 1999;341(17):1270-1274. PubMed
8. Zwieg FH, Karfonta TL, Jeske LJ, et al. Arrhythmia detection and response in a monitoring technician and pocket paging system. Prog Cardiovasc Nurs . 1998;13(1):16-22, 33. PubMed
9. Cvach MM, Frank RJ, Doyle P, Stevens ZK. Use of pagers with an alarm escalation system to reduce cardiac monitor alarm signals. J Nurs Care Qual . 2013;29(1):9-18. PubMed
10. Gross B, Dahl D, Nielsen L. Physiologic monitoring alarm load on medical/surgical floors of a community hospital. Biomed Instrum Technol . 2011;Spring(suppl):29-36. PubMed
11. Drew BJ, Califf RM, Funk M, et al; American Heart Association; Councils on Cardiovascular Nursing, Clinical Cardiology, and Cardiovascular Disease in the Young. Practice standards for electrocardiographic monitoring in hospital settings: an American Heart Association scientific statement from the Councils on Cardiovascular Nursing, Clinical Cardiology, and Cardiovascular Disease in the Young: endorsed by the International Society of Computerized Electrocardiology and the American Association of Critical-Care Nurses [published correction appears in Circulation . 2005;111(3):378]. Circulation . 2004;110(17):2721-2746. PubMed
12. Chen S, Palchaudhuri S, Johnson A, Trost J, Ponor I, Zakaria S. Does this patient need telemetry? An analysis of telemetry ordering practices at an academic medical center. J Eval Clin Pract . 2017 Jan 27 [Epub ahead of print] . PubMed
13. Estrada CA, Rosman HS, Prasad NK, et al. Role of telemetry monitoring in the non-intensive care unit. Am J Cardiol . 1995;76(12):960-965. PubMed
14. Chen S, Zakaria S. Behind the monitor—the trouble with telemetry: a teachable moment. JAMA Intern Med . 2015;175(6):894. PubMed
Cardiac telemetry, designed to monitor hospitalized patients with active cardiac conditions, is highly utilized outside the intensive care unit (ICU) and generates a large number of automated alarms. Telemetry is also costly and requires substantial time and attention commitments from nursing and technician staff, who place and maintain the recording devices and address monitoring results. 1,2 The staff address and dismiss invalid alarms caused by telemetry artifacts, 2 such as the misreporting of patient movement as ventricular tachycardia/fibrillation (VT/VF) or the mimicking of asystole by a lead disconnection.
One strategy for addressing telemetry alarms is to have dedicated staff observe telemetry monitors and notify nurses with any events or findings. Studies conducted in the 1990s showed that dedicated monitor watchers, compared with automatically generated alarms alone, did not affect most outcomes 3 but can improve accuracy of arrhythmia detection. 4 Since then, given the advances in telemetry detection software, the effect of monitor watchers has not been evaluated. Mindful of the perceived burden of nonactionable telemetry alerts, we wanted to quantify the frequency of automated telemetry alerts in the wards and analyze the proportion of alerts deemed nonactionable by monitor watchers.
METHODS
We conducted this retrospective study at a 545-bed urban academic hospital in the United States. We reviewed the cases of all non-ICU patients with telemetry monitoring ordered. The telemetry order requires providers specify the indication for monitoring and adjust alert parameters for variables such as heart rate (preset to 60 and 100 beats per minute) and baseline rhythm (preset to normal sinus). Once a telemetry order is received, 5 leads are attached to the patient, and electrocardiographic data begin transmitting to a portable wireless telemetry monitor, or telemeter (Philips Intellispace Telemetry System), which in turn transmits to a central monitoring station in the progressive care unit (PCU; cardiac/pulmonary unit). The majority of patients on telemetry are in the PCU. Telemeters are also located in the general medicine, surgical, and neurologic non-ICU units. Data from a maximum of 96 telemeters in the hospital are simultaneously displayed in the central monitoring station.
At all times, two dedicated monitor watchers oversee the central monitoring station. Watchers are certified medical assistants with extra telemetry-specific training. Each receives a salary of $17 per hour (no benefits), or about $800 per 24-hour day for two watchers. Their role is to respond to audiovisual alerts triggered by the monitoring system—they either contact the bedside nurse or intercept the alert if deemed nonactionable. Consistent with the literature, 5 nonactionable alerts and alarms were defined as either “invalid” or “nuisance.” Invalid alerts and alarms misrepresent patient status (eg, patient motion is electronically interpreted as VT/VF), and nuisance alerts and alarms do not require clinical intervention (eg, persistent sinus tachycardia has already been communicated to the nurse or provider). Monitor watchers must intercept the alert within a limited amount of time: 15 seconds for suspected lethal alerts (asystole, VT/VF), 30 seconds for extreme tachycardia/bradycardia, and 60 seconds for lead displacement or low battery.
If a watcher does not intercept an alert—either intentionally or because time ran out—the alert generates an alarm, which automatically sends a text message to the patient’s nurse’s wireless phone. The nurse acknowledges the alarm and decides on further action. If the bedside nurse does not acknowledge the alarm within the same time frames as mentioned, the alarm is escalated, first to the unit charge nurse and then to the monitoring station charge nurse (Figure). All alerts are available for provider review at the central monitoring station for the duration of the telemetry order, and select telemetry strips are printed and filed in the patient’s paper chart.
For this study, we analyzed telemetry system data for all monitored non-ICU ward patients from August 1 through September 30, 2014. We focused on the rate and relevance of alerts (system-generated) and alarms (text message to nurse). As cardiac arrhythmias leading to cardiopulmonary arrest can potentially be detected by telemetry, we also reviewed all code team activations, which are recorded in a separate database that details time of code team activation, to evaluate for correlation with telemetry alerts.
RESULTS
Within the 2-month study period, there were 1917 admissions to, and 1370 transfers to, non-ICU floors, for a total of 3287 unique patient-admissions and 9704 total patient-days. There were 1199 patient admissions with telemetry orders (36.5% of all admissions), 4044 total patient-days of telemetry, and an average of 66.3 patients monitored per day. In addition, the system generated 20,775 alerts, an average of 341 per day, 5.1 per patient-day, 1 every 4 minutes. Overall, 18,051 alerts (87%) were intercepted by monitor watchers, preventing nurse text-alarms. Of all alerts, 91% were from patients on medicine services, including pulmonary and cardiology; 6% were from patients on the neurology floor; and 3% were from patients on the surgery floor.
Forty percent of all alerts were for heart rates deviating outside the ranges set by the provider; of these, the overwhelming majority were intercepted as nuisance alerts (Table). In addition, 26% of all alerts were for maintenance reasons, including issues with batteries or leads. Finally, 34% (6954) were suspected lethal alerts (asystole, VT/VF); of these, 74% (5170) were intercepted by monitor watchers, suggesting they were deemed invalid. None of the suspected lethal alerts triggered a code team activation, indicating there were no telemetry-documented asystole or VT/VF episodes prompting resuscitative efforts. During the study period, there were 7 code team activations. Of the 7 patients, 2 were on telemetry, and their code team activation was for hypoxia detected by pulse oximetry; the other 5 patients, not on telemetry, were found unresponsive or apneic, and 4 of them had confirmed pulseless electrical activity.
DISCUSSION
In small studies, other investigators have directly observed nurses for hours at a time and assessed their response to telemetry-related alarms. 1,2 In the present study, we found a very large number of telemetry-detected alerts over a continuous 2-month period. The large majority (87%) of alerts were manually intercepted by monitor watchers before being communicated to a nurse or provider, indicating these alerts did not affect clinical management and likely were either false positives or nonactionable. It is possible that repeat nonactionable alerts, like continued sinus tachycardia or bradycardia, affect decision making, but this may be outside the role of continuous cardiac telemetry. In addition, it is likely that all the lethal alarms (asystole, VT/VF) forwarded to the nurses were invalid, as none resulted in code team activations.
Addressing these alerts is a major issue, as frequent telemetry alarms can lead to alarm fatigue, a widely acknowledged safety concern. 6 Furthermore, nonactionable alarms are a time sink, diverting nursing attention from other patient care needs. Finally, nonactionable alarms, especially invalid alarms, can lead to adverse patient outcomes. Although we did not specifically evaluate for harm, an earlier case series found a potential for unnecessary interventions and device implantation as a result of reporting artifactual arrhythmias. 7
Our results also highlight the role of monitor watchers in intercepting nonactionable alarms and reducing the alarm burden on nurses. Other investigators have reported on computerized paging systems that directly alert only nurses, 8 or on escalated alarm paging systems that let noncrisis alarms self-resolve. 9 In contrast, our study used a hybrid 2-step telemetry-monitoring system—an escalated paging system designed to be sensitive and less likely than human monitoring to overlook events, followed by dedicated monitor watchers who are first-responders for a large number of alarms and who increase the specificity of alarms by screening for nonactionable alarms, thereby reducing the number of alarms transmitted to nurses. We think that, for most hospitals, monitor watchers are cost-effective, as their hourly wage is lower than that of registered nurses. Furthermore, monitor watchers can screen alerts faster because they are always at the monitoring station. Their presence reduces the amount of time that nurses need to divert from other clinical tasks in order to walk to the monitoring station to evaluate alerts.
Nonetheless, there remains a large number of nonactionable alerts forwarded as alarms to nurses, likely because of monitor watchers’ inability to address the multitude of alerts, and perhaps because of alarm fatigue. Although this study showed the utility of monitor watchers in decreasing telemetry alarms to nurses, other steps can be taken to reduce telemetry alarm fatigue. A systematic review of alarm frequency interventions 5 noted that detection algorithms can be improved to decrease telemetry alert false positives. Another solution, likely easier to implement, is to encourage appropriate alterations in telemetry alarm parameters, which can decrease the alarm proportion. 10 An essential step is to decrease inappropriate telemetry use regarding the indication for and duration of monitoring, as emphasized by the Choosing Wisely campaign championing American Heart Association (AHA) guidelines for appropriate telemetry use. 11 At our institution, 20.2% of telemetry orders were for indications outside AHA guidelines, and that percentage likely is an underestimate, as this was required self-reporting on ordering. 12 Telemetry may not frequently result in changes in management in the non-ICU setting, 13 and may lead to other harms such as worsening delirium, 14 so it needs to be evaluated for harm versus benefit per patient before order.
Cardiac telemetry in the non-ICU setting produces a large number of alerts and alarms. The vast majority are not seen or addressed by nurses or physicians, leading to a negligible impact on patient care decisions. Monitor watchers reduce the nursing burden in dealing with telemetry alerts, but we emphasize the need to take additional measures to reduce telemetry-related alerts and thereby reduce alarm-related harms and alarm fatigue.
Acknowledgments
The authors thank Torberg Tonnessen, who was instrumental in providing the telemetry and clinical data used in this study, as well as the numerous Johns Hopkins Bayview Medical Center nurses, patient care technicians, and monitor watchers who answered questions about telemetry processes and allowed their work to be observed.
Disclosure
Nothing to report.
1. Gazarian PK. Nurses’ response to frequency and types of electrocardiography alarms in a non-critical care setting: a descriptive study. Int J Nurs Stud . 2014;51(2):190-197. PubMed
2. Varpio L, Kuziemsky C, MacDonald C, King WJ. The helpful or hindering effects of in-hospital patient monitor alarms on nurses. Comput Inform Nurs . 2012;30(4):210-217. PubMed
3. Funk M, Parkosewich J, Johnson C, Stukshis I. Effect of dedicated monitor watchers on patients’ outcomes. Am J Crit Care . 1997;6(4):318-323. PubMed
4. Stukshis I, Funk M, Johnson C, Parkosewich J. Accuracy of detection of clinically important dysrhythmias with and without a dedicated monitor watcher. Am J Crit Care . 1997;6(4):312-317. PubMed
5. Paine CW, Goel VV, Ely E, et al. Systematic review of physiologic monitor alarm characteristics and pragmatic interventions to reduce alarm frequency. J Hosp Med . 2016;11(2):136-144. PubMed
6. Joint Commission on Accreditation of Healthcare Organizations. The Joint Commission announces 2014 national patient safety goal. Jt Comm Perspect . 2013;33(7):1, 3-4. PubMed
7. Knight BP, Pelosi F, Michaud GF, Strickberger SA, Morady F. Clinical consequences of electrocardiographic artifact mimicking ventricular tachycardia. N Engl J Med . 1999;341(17):1270-1274. PubMed
8. Zwieg FH, Karfonta TL, Jeske LJ, et al. Arrhythmia detection and response in a monitoring technician and pocket paging system. Prog Cardiovasc Nurs . 1998;13(1):16-22, 33. PubMed
9. Cvach MM, Frank RJ, Doyle P, Stevens ZK. Use of pagers with an alarm escalation system to reduce cardiac monitor alarm signals. J Nurs Care Qual . 2013;29(1):9-18. PubMed
10. Gross B, Dahl D, Nielsen L. Physiologic monitoring alarm load on medical/surgical floors of a community hospital. Biomed Instrum Technol . 2011;Spring(suppl):29-36. PubMed
11. Drew BJ, Califf RM, Funk M, et al; American Heart Association; Councils on Cardiovascular Nursing, Clinical Cardiology, and Cardiovascular Disease in the Young. Practice standards for electrocardiographic monitoring in hospital settings: an American Heart Association scientific statement from the Councils on Cardiovascular Nursing, Clinical Cardiology, and Cardiovascular Disease in the Young: endorsed by the International Society of Computerized Electrocardiology and the American Association of Critical-Care Nurses [published correction appears in Circulation . 2005;111(3):378]. Circulation . 2004;110(17):2721-2746. PubMed
12. Chen S, Palchaudhuri S, Johnson A, Trost J, Ponor I, Zakaria S. Does this patient need telemetry? An analysis of telemetry ordering practices at an academic medical center. J Eval Clin Pract . 2017 Jan 27 [Epub ahead of print] . PubMed
13. Estrada CA, Rosman HS, Prasad NK, et al. Role of telemetry monitoring in the non-intensive care unit. Am J Cardiol . 1995;76(12):960-965. PubMed
14. Chen S, Zakaria S. Behind the monitor—the trouble with telemetry: a teachable moment. JAMA Intern Med . 2015;175(6):894. PubMed
© 2017 Society of Hospital Medicine
Perceptions of hospital-dependent patients on their needs for hospitalization
In the United States, patients 65 years old or older accounted for more than one third of inpatient stays and 42% of inpatient care spending in 2012.1 Despite the identification of risk factors, the implementation of an array of interventions, and the institution of penalties on hospitals, a subset of older adults continues to spend significant time in the hospital.2,3
Hospital dependency is a concept that was only recently described. It identifies patients who improve while in the hospital but quickly deteriorate after leaving the hospital, resulting in recurring hospitalizations.4 Although little is known about hospital-dependent patients, studies have explored patients’ perspectives on readmissions.5,6 Nevertheless, it remains unclear whether there are individuals for whom frequent and prolonged hospitalizations are appropriate, and whether there are undisclosed factors that, if addressed, could decrease their hospital dependency. We conducted an exploratory study to ascertain hospital-dependent patients’ perspectives on their needs for hospitalizations.
METHODS
Study Design
This study was approved by the Yale University Institutional Review Board. From March 2015 to September 2015, Dr. Liu conducted semistructured explorative interviews with patients on the medical units of an academic medical center. Dr. Liu was not directly involved in the care of these patients. An interview guide that includes open-ended questions was created to elicit patients’ perspectives on their need for hospitalizations, health status, and outside-hospital support. This guide was pilot-tested with 6 patients, whose transcripts were not included in the final analysis, to assess for ease of understanding. After the pilot interviews, the questions were revised, and the final guide consists of 12 questions (Supplemental Table).
Recruitment
We used predetermined criteria and a purposeful sampling strategy to select potential study participants. We identified participants by periodically (~once a week) reviewing the electronic medical records of all patients admitted to the medicine service during the study period. Eligible patients were 65 years old or older and had at least 3 hospitalizations over the preceding 6 months. Patients were excluded if they met our chronic critical illness criteria: mechanical ventilation for more than 21 days, history of tracheotomy for failed weaning from mechanical ventilation,7 presence of a conservator, or admission only for comfort measures. Participants were recruited until no new themes emerged.
Data Collection
Twenty-nine patients were eligible. We obtained permission from their inpatient providers to approach them about the study. Of the 29 patients, 26 agreed to be interviewed, and 3 declined. Of the 26 participants, 6 underwent pilot interviews, and 20 underwent formal interviews with use of the finalized interview guide. The interviews, conducted in the hospital while the participants were hospitalized, lasted 17 minutes on average. The interviews were transcribed and iteratively analyzed. The themes that emerged from the initial interviews were further explored and validated in subsequent interviews. Interviews were conducted until theoretical saturation was reached and no new themes were derived from them. Demographic information, including age, sex, ethnicity, and marital status, was also collected.
Analysis
Interviews were digitally recorded and transcribed. Independently, two investigators used Atlas Ti software to analyze and code the interview transcriptions. An inductive approach was used to identify new codes from the data.8 The coders then met to discuss repeating ideas based on the codes. When a code was identified by one coder but not the other, or when there was disagreement about interpretation of a code, the coders returned to the relevant text to reach consensus and to determine whether to include or discard the code.9 We then organized and reorganized repeating ideas based on their conceptual similarities to determine the themes and subthemes.9
")
RESULTS
Twenty patients participated in the formal interviews. Participants’ baseline characteristics are listed in Table 1, and four dominant themes, and their subthemes and exemplary quotations, are listed in Table 2.

Perspectives on Hospital Care
Participants perceived their hospitalizations as inevitable and necessary for survival: “I think if I haven’t come to the hospital, I probably would have died.” Furthermore, participants thought only the hospital had the resources to help them (“The medications they were giving me … you can get that in the hospital but not outside the hospital”) and sustain them (“You are like an old car, and it breaks down little by little, so you have to go in periodically and get the problem fixed, so you will drive it around for a while”).
Feeling Safe in Hospital. Asked how being in the hospital makes them feel, participants attributed their feelings of safety to the constant observation, the availability of providers and nurses, and the idea that hospital care is helping. As one participant stated, “Makes me feel safer in case you go into something like cardiac arrest. You are right here where they can help you.”
Outside-Hospital Support. Despite multiple hospitalizations, most participants reported having social support (“I have the aide. I got the nurses come in. I have my daughter …”), physical support, and medical support (“I have all the doctors”) outside the hospital. A minority of participants questioned the usefulness of the services. One participant described declining the help of visiting nurses because she wanted to be independent and thought that, despite recurrent hospitalizations for physical symptoms, she still had the ability to manage her own medications.
Goals-of-Care Discussion. Some participants reported inadequate discussions about goals of care, health priorities, and health trajectories. In their reports, this inadequacy included not thinking about their goals, despite continued health decline. One participant stated, “Oh, God, I don’t know if I had any conversation like that. … I think until it is really brought to the front, you don’t make a decision really if you don’t have to.” Citing the value of a more established relationship and deeper trust, participants preferred having these serious and personal discussions with their ambulatory care clinicians: “Because I know my doctor much closer. I have been with him for a number of years. The doctors in the hospital seem to be nice and competent, but I don’t know them.”
DISCUSSION
Participants considered their hospitalizations a necessity and reported feeling safe in the hospital. Given that most already had support outside the hospital, increasing community services may be inadequate to alter participants’ perceived hospital care needs. On the other hand, a few participants reported declining services that might have prevented hospitalizations. Although there has been a study of treatment refusal among older adults with advanced illnesses,10 not much is known about refusal of services among this population. Investigators should examine the reasons for refusing services and the effect that refusal has on hospitalizations. Furthermore, although it would have been informative to ascertain clinician perspectives as well, we focused on patient perspectives because less is known on this topic.
Some participants noted their lack of discussion with their clinicians about healthcare goals and probable health trajectories. Barriers to goals-of-care discussion among this highly vulnerable population have been researched from the perspectives of clinicians and other health professionals but not patients themselves.11,12 Of particular concern in our study is the participant-noted lack of discussion about health trajectories and health priorities, given the decline that occurs in this population and even in those with good care. This inadequacy in discussion suggests continued hospital care may not always be consistent with a patient’s goals. Patients’ desire to have this discussion with their clinicians, with whom they have a relationship, supports the need to involve ambulatory care clinicians, or ensure these patients are cared for by the same clinicians, across healthcare settings.13,14 Whoever provides the care, the clinician must align treatment with the patient’s goal, whether it is to continue hospital-level care or to transition to palliative care. Such an approach also reflects the core elements of person-centered care.15
Study Limitations
Participants were recruited from the medicine service at a single large academic center, limiting the study’s generalizability to patients admitted to surgical services or community hospitals. The patients in this small sample were English-speaking and predominantly Caucasian, so our findings may not represent the perspectives of non-English-speaking or minority patients. We did not perform statistical analysis to quantify intercoder reliability. Last, as this was a qualitative study, we cannot comment on the relative importance or prevalence of the reasons cited for frequent hospitalizations, and we cannot estimate the proportion of patients who had recurrent hospitalizations and were hospital-dependent.
Implication
Although quantitative research is needed to confirm our findings, the hospital-dependent patients in this study thought their survival required hospital-level care and resources. From their perspective, increasing posthospital and community support may be insufficient to prevent some hospitalizations. The lack of goals-of-care discussion supports attempts to increase efforts to facilitate discussion about health trajectories and health priorities between patients and their preferred clinicians.
Acknowledgments
The authors thank Dr. Grace Jenq for providing feedback on the study design.
Disclosure
Nothing to report.
1. Weiss AJ, Elixhauser A. Overview of Hospital Stays in the United States, 2012: Statistical Brief 180. Rockville, MD: Agency for Healthcare Research and Quality, Healthcare Cost and Utilization Project; 2014. http://www.ncbi.nlm.nih.gov/books/NBK259100/. Published October 2014. Accessed February 17, 2016.
2. Auerbach AD, Kripalani S, Vasilevskis EE, et al. Preventability and causes of readmissions in a national cohort of general medicine patients. JAMA Intern Med. 2016;176(4):484-493. PubMed
3. Donzé JD, Williams MV, Robinson EJ, et al. International validity of the HOSPITAL score to predict 30-day potentially avoidable hospital readmissions. JAMA Intern Med. 2016;176(4):496-502. PubMed
4. Reuben DB, Tinetti ME. The hospital-dependent patient. N Engl J Med. 2014;370(8):694-697. PubMed
5. Enguidanos S, Coulourides Kogan AM, Schreibeis-Baum H, Lendon J, Lorenz K. “Because I was sick”: seriously ill veterans’ perspectives on reason for 30-day readmissions. J Am Geriatr Soc. 2015;63(3):537-542. PubMed
6. Kangovi S, Grande D, Meehan P, Mitra N, Shannon R, Long JA. Perceptions of readmitted patients on the transition from hospital to home. J Hosp Med. 2012;7(9):709-712. PubMed
7. Lamas D. Chronic critical illness. N Engl J Med. 2014;370(2):175-177. PubMed
8. Saldana J. Fundamentals of Qualitative Research. Cary, NC: Oxford University Press; 2011.
9. Auerbach CF, Silverstein LB. Qualitative Data: An Introduction to Coding and Analysis. New York, NY: New York University Press; 2003.
10. Rothman MD, Van Ness PH, O’Leary JR, Fried TR. Refusal of medical and surgical interventions by older persons with advanced chronic disease. J Gen Intern Med. 2007;22(7):982-987. PubMed
11. You JJ, Downar J, Fowler RA, et al; Canadian Researchers at the End of Life Network. Barriers to goals of care discussions with seriously ill hospitalized patients and their families: a multicenter survey of clinicians. JAMA Intern Med. 2015;175(4):549-556. PubMed
12. Schoenborn NL, Bowman TL 2nd, Cayea D, Pollack CE, Feeser S, Boyd C. Primary care practitioners’ views on incorporating long-term prognosis in the care of older adults. JAMA Intern Med. 2016;176(5):671-678. PubMed
13. Arora VM, Prochaska ML, Farnan JM, et al. Problems after discharge and understanding of communication with their primary care physicians among hospitalized seniors: a mixed methods study. J Hosp Med. 2010;5(7):385-391. PubMed
14. Jones CD, Vu MB, O’Donnell CM, et al. A failure to communicate: a qualitative exploration of care coordination between hospitalists and primary care providers around patient hospitalizations. J Gen Intern Med. 2015;30(4):417-424. PubMed
15. American Geriatrics Society Expert Panel on Person-Centered Care. Person-centered care: a definition and essential elements. J Am Geriatr Soc. 2016;64(1):15-18. PubMed
In the United States, patients 65 years old or older accounted for more than one third of inpatient stays and 42% of inpatient care spending in 2012.1 Despite the identification of risk factors, the implementation of an array of interventions, and the institution of penalties on hospitals, a subset of older adults continues to spend significant time in the hospital.2,3
Hospital dependency is a concept that was only recently described. It identifies patients who improve while in the hospital but quickly deteriorate after leaving the hospital, resulting in recurring hospitalizations.4 Although little is known about hospital-dependent patients, studies have explored patients’ perspectives on readmissions.5,6 Nevertheless, it remains unclear whether there are individuals for whom frequent and prolonged hospitalizations are appropriate, and whether there are undisclosed factors that, if addressed, could decrease their hospital dependency. We conducted an exploratory study to ascertain hospital-dependent patients’ perspectives on their needs for hospitalizations.
METHODS
Study Design
This study was approved by the Yale University Institutional Review Board. From March 2015 to September 2015, Dr. Liu conducted semistructured explorative interviews with patients on the medical units of an academic medical center. Dr. Liu was not directly involved in the care of these patients. An interview guide that includes open-ended questions was created to elicit patients’ perspectives on their need for hospitalizations, health status, and outside-hospital support. This guide was pilot-tested with 6 patients, whose transcripts were not included in the final analysis, to assess for ease of understanding. After the pilot interviews, the questions were revised, and the final guide consists of 12 questions (Supplemental Table).
Recruitment
We used predetermined criteria and a purposeful sampling strategy to select potential study participants. We identified participants by periodically (~once a week) reviewing the electronic medical records of all patients admitted to the medicine service during the study period. Eligible patients were 65 years old or older and had at least 3 hospitalizations over the preceding 6 months. Patients were excluded if they met our chronic critical illness criteria: mechanical ventilation for more than 21 days, history of tracheotomy for failed weaning from mechanical ventilation,7 presence of a conservator, or admission only for comfort measures. Participants were recruited until no new themes emerged.
Data Collection
Twenty-nine patients were eligible. We obtained permission from their inpatient providers to approach them about the study. Of the 29 patients, 26 agreed to be interviewed, and 3 declined. Of the 26 participants, 6 underwent pilot interviews, and 20 underwent formal interviews with use of the finalized interview guide. The interviews, conducted in the hospital while the participants were hospitalized, lasted 17 minutes on average. The interviews were transcribed and iteratively analyzed. The themes that emerged from the initial interviews were further explored and validated in subsequent interviews. Interviews were conducted until theoretical saturation was reached and no new themes were derived from them. Demographic information, including age, sex, ethnicity, and marital status, was also collected.
Analysis
Interviews were digitally recorded and transcribed. Independently, two investigators used Atlas Ti software to analyze and code the interview transcriptions. An inductive approach was used to identify new codes from the data.8 The coders then met to discuss repeating ideas based on the codes. When a code was identified by one coder but not the other, or when there was disagreement about interpretation of a code, the coders returned to the relevant text to reach consensus and to determine whether to include or discard the code.9 We then organized and reorganized repeating ideas based on their conceptual similarities to determine the themes and subthemes.9
RESULTS
Twenty patients participated in the formal interviews. Participants’ baseline characteristics are listed in Table 1, and four dominant themes, and their subthemes and exemplary quotations, are listed in Table 2.
Perspectives on Hospital Care
Participants perceived their hospitalizations as inevitable and necessary for survival: “I think if I haven’t come to the hospital, I probably would have died.” Furthermore, participants thought only the hospital had the resources to help them (“The medications they were giving me … you can get that in the hospital but not outside the hospital”) and sustain them (“You are like an old car, and it breaks down little by little, so you have to go in periodically and get the problem fixed, so you will drive it around for a while”).
Feeling Safe in Hospital. Asked how being in the hospital makes them feel, participants attributed their feelings of safety to the constant observation, the availability of providers and nurses, and the idea that hospital care is helping. As one participant stated, “Makes me feel safer in case you go into something like cardiac arrest. You are right here where they can help you.”
Outside-Hospital Support. Despite multiple hospitalizations, most participants reported having social support (“I have the aide. I got the nurses come in. I have my daughter …”), physical support, and medical support (“I have all the doctors”) outside the hospital. A minority of participants questioned the usefulness of the services. One participant described declining the help of visiting nurses because she wanted to be independent and thought that, despite recurrent hospitalizations for physical symptoms, she still had the ability to manage her own medications.
Goals-of-Care Discussion. Some participants reported inadequate discussions about goals of care, health priorities, and health trajectories. In their reports, this inadequacy included not thinking about their goals, despite continued health decline. One participant stated, “Oh, God, I don’t know if I had any conversation like that. … I think until it is really brought to the front, you don’t make a decision really if you don’t have to.” Citing the value of a more established relationship and deeper trust, participants preferred having these serious and personal discussions with their ambulatory care clinicians: “Because I know my doctor much closer. I have been with him for a number of years. The doctors in the hospital seem to be nice and competent, but I don’t know them.”
DISCUSSION
Participants considered their hospitalizations a necessity and reported feeling safe in the hospital. Given that most already had support outside the hospital, increasing community services may be inadequate to alter participants’ perceived hospital care needs. On the other hand, a few participants reported declining services that might have prevented hospitalizations. Although there has been a study of treatment refusal among older adults with advanced illnesses,10 not much is known about refusal of services among this population. Investigators should examine the reasons for refusing services and the effect that refusal has on hospitalizations. Furthermore, although it would have been informative to ascertain clinician perspectives as well, we focused on patient perspectives because less is known on this topic.
Some participants noted their lack of discussion with their clinicians about healthcare goals and probable health trajectories. Barriers to goals-of-care discussion among this highly vulnerable population have been researched from the perspectives of clinicians and other health professionals but not patients themselves.11,12 Of particular concern in our study is the participant-noted lack of discussion about health trajectories and health priorities, given the decline that occurs in this population and even in those with good care. This inadequacy in discussion suggests continued hospital care may not always be consistent with a patient’s goals. Patients’ desire to have this discussion with their clinicians, with whom they have a relationship, supports the need to involve ambulatory care clinicians, or ensure these patients are cared for by the same clinicians, across healthcare settings.13,14 Whoever provides the care, the clinician must align treatment with the patient’s goal, whether it is to continue hospital-level care or to transition to palliative care. Such an approach also reflects the core elements of person-centered care.15
Study Limitations
Participants were recruited from the medicine service at a single large academic center, limiting the study’s generalizability to patients admitted to surgical services or community hospitals. The patients in this small sample were English-speaking and predominantly Caucasian, so our findings may not represent the perspectives of non-English-speaking or minority patients. We did not perform statistical analysis to quantify intercoder reliability. Last, as this was a qualitative study, we cannot comment on the relative importance or prevalence of the reasons cited for frequent hospitalizations, and we cannot estimate the proportion of patients who had recurrent hospitalizations and were hospital-dependent.
Implication
Although quantitative research is needed to confirm our findings, the hospital-dependent patients in this study thought their survival required hospital-level care and resources. From their perspective, increasing posthospital and community support may be insufficient to prevent some hospitalizations. The lack of goals-of-care discussion supports attempts to increase efforts to facilitate discussion about health trajectories and health priorities between patients and their preferred clinicians.
Acknowledgments
The authors thank Dr. Grace Jenq for providing feedback on the study design.
Disclosure
Nothing to report.
1. Weiss AJ, Elixhauser A. Overview of Hospital Stays in the United States, 2012: Statistical Brief 180. Rockville, MD: Agency for Healthcare Research and Quality, Healthcare Cost and Utilization Project; 2014. http://www.ncbi.nlm.nih.gov/books/NBK259100/. Published October 2014. Accessed February 17, 2016.
2. Auerbach AD, Kripalani S, Vasilevskis EE, et al. Preventability and causes of readmissions in a national cohort of general medicine patients. JAMA Intern Med. 2016;176(4):484-493. PubMed
3. Donzé JD, Williams MV, Robinson EJ, et al. International validity of the HOSPITAL score to predict 30-day potentially avoidable hospital readmissions. JAMA Intern Med. 2016;176(4):496-502. PubMed
4. Reuben DB, Tinetti ME. The hospital-dependent patient. N Engl J Med. 2014;370(8):694-697. PubMed
5. Enguidanos S, Coulourides Kogan AM, Schreibeis-Baum H, Lendon J, Lorenz K. “Because I was sick”: seriously ill veterans’ perspectives on reason for 30-day readmissions. J Am Geriatr Soc. 2015;63(3):537-542. PubMed
6. Kangovi S, Grande D, Meehan P, Mitra N, Shannon R, Long JA. Perceptions of readmitted patients on the transition from hospital to home. J Hosp Med. 2012;7(9):709-712. PubMed
7. Lamas D. Chronic critical illness. N Engl J Med. 2014;370(2):175-177. PubMed
8. Saldana J. Fundamentals of Qualitative Research. Cary, NC: Oxford University Press; 2011.
9. Auerbach CF, Silverstein LB. Qualitative Data: An Introduction to Coding and Analysis. New York, NY: New York University Press; 2003.
10. Rothman MD, Van Ness PH, O’Leary JR, Fried TR. Refusal of medical and surgical interventions by older persons with advanced chronic disease. J Gen Intern Med. 2007;22(7):982-987. PubMed
11. You JJ, Downar J, Fowler RA, et al; Canadian Researchers at the End of Life Network. Barriers to goals of care discussions with seriously ill hospitalized patients and their families: a multicenter survey of clinicians. JAMA Intern Med. 2015;175(4):549-556. PubMed
12. Schoenborn NL, Bowman TL 2nd, Cayea D, Pollack CE, Feeser S, Boyd C. Primary care practitioners’ views on incorporating long-term prognosis in the care of older adults. JAMA Intern Med. 2016;176(5):671-678. PubMed
13. Arora VM, Prochaska ML, Farnan JM, et al. Problems after discharge and understanding of communication with their primary care physicians among hospitalized seniors: a mixed methods study. J Hosp Med. 2010;5(7):385-391. PubMed
14. Jones CD, Vu MB, O’Donnell CM, et al. A failure to communicate: a qualitative exploration of care coordination between hospitalists and primary care providers around patient hospitalizations. J Gen Intern Med. 2015;30(4):417-424. PubMed
15. American Geriatrics Society Expert Panel on Person-Centered Care. Person-centered care: a definition and essential elements. J Am Geriatr Soc. 2016;64(1):15-18. PubMed
© 2017 Society of Hospital Medicine
Incidental pulmonary nodules reported on CT abdominal imaging: Frequency and factors affecting inclusion in the hospital discharge summary
Incidental findings create both medical and logistical challenges regarding communication.1,2 Pulmonary nodules are among the most frequent and medically relevant incidental findings, being noted in up to 8.4% of abdominal computed tomography (CT) scans.3 There are guidelines regarding proper follow-up and management of such incidental pulmonary nodules, but appropriate evidence-based surveillance imaging is often not performed, and many patients remain uninformed. Collins et al.4 reported that, before initiation of a standardized protocol, only 17.7% of incidental findings were communicated to patients admitted to the trauma service; after protocol initiation, the rate increased to 32.4%. The hospital discharge summary provides an opportunity to communicate incidental findings to patients and their medical care providers, but Kripalani et al.5 raised questions regarding the current completeness and accuracy of discharge summaries, reporting that 65% of discharge summaries omitted relevant diagnostic testing, and 30% omitted a follow-up plan.
We conducted a study to determine how often incidental pulmonary nodules found on abdominal CT are documented in the discharge summary, and to identify factors associated with pulmonary nodule inclusion.
METHODS
This was a retrospective cohort study of hospitalized patients ≥35 years of age who underwent in-patient abdominal CT between January 1, 2012 and December 31, 2014. Patients were identified by cross-referencing hospital admissions with Current Procedural Terminology (CPT) codes indicating abdominal CT (74176, 74177, 74178, 74160, 74150, 74170). Patients with chest CT (CPT codes 71260, 71250, 71270) during that hospitalization or within 30 days before admission were excluded to ensure that pulmonary nodules were incidental and asymptomatic. The index hospitalization was defined as the first hospitalization during which the patient was diagnosed with an incidental pulmonary nodule on abdominal CT, or the first hospitalization during the study period for patients without pulmonary nodules. All patient charts were manually reviewed, and baseline age, sex, and smoking status data collected.
Radiology reports were electronically screened for the words nodule and nodules and then confirmed through manual review of the full text reports. Nodules described as tiny (without other size description) were assumed to be <4 mm in size, per manual review of a small sample. Nodules were deemed as falling outside the Fleischner Society criteria guidelines (designed for indeterminate pulmonary nodules), and were therefore excluded, if any of seven criteria were met: The nodule was (1) cavitary, (2) associated with a known metastatic disease, (3) associated with a known granulomatous disease, (4) associated with a known inflammatory process, (5) reported likely to represent atelectasis, (6) reported likely to be a lymph node, or (7) previously biopsied.4
For each patient with pulmonary nodules, a personal history of cancer was obtained. Nodule size, characteristics, and stability compared with available prior imaging were recorded. Radiology reports were reviewed to determine if pulmonary nodules were mentioned in the summary headings of the reports or in the body of the reports and whether specific follow-up recommendations were provided. Hospital discharge summaries were reviewed for documentation of pulmonary nodule(s) and follow-up recommendations. Discharging service (medical/medical subspecialty, surgical/surgical subspecialty) was noted, along with the patients’ condition at discharge (alive, alive on hospice, deceased).
The frequency of incidental pulmonary nodules on abdominal CT during hospitalization and the frequency of nodules requiring follow-up were reported using a point estimate and corresponding 95% confidence interval (CI). The χ2 test was used to compare the frequency of pulmonary nodules across patient groups. In addition, for patients found to have incidental nodules requiring follow-up, the χ2 test was used to compare across groups the percentage of patients with discharge documentation of the incidental nodule. In all cases, 2-tailed Ps are reported, with P ≤ 0.05 considered statistically significant.

RESULTS
Between January 1, 2012 and December 31, 2014, 7173 patients ≥35 years old underwent in-patient abdominal CT without concurrent chest CT. Of these patients, 62.2% were ≥60 years old, 50.6% were men, and 45.5% were current or former smokers. Incidental pulmonary nodules were noted in 402 patients (5.6%; 95% CI, 5.1%-6.2%), of whom 68.7% were ≥60 years old, 56.5% were men, and 46.3% were current or former smokers. Increasing age (P = 0.004) and male sex (P = 0.015) were associated with increased frequency of incidental pulmonary nodules, but smoking status (P = 0.586) was not. Of patients with incidental nodules, 71.6% had solitary nodules, and 58.5% had a maximum nodule size of ≤4 mm (Table 1). Based on smoking status, nodule size, and reported size stability, 208 patients (2.9%; 95% CI, 2.5%-3.3%) required follow-up surveillance as per 2005 Fleischner Society guidelines. Among solitary pulmonary nodules requiring further surveillance (n = 147), the mean risk of malignancy based on the Mayo Clinic solitary pulmonary nodule risk calculator was 7.9% (interquartile range, 3.0%-10.5%), with 28% having a malignancy risk of ≥10%.6
Of the 208 patients with nodules requiring further surveillance, only 48 (23%) received discharge summaries documenting the nodule; 34 of these summaries included a recommendation for nodule follow-up, with 19 of the recommendations including a time frame for repeat CT. Three factors were positively associated with documentation of the pulmonary nodule in the discharge summary: mention of the pulmonary nodule in the summary headings of the radiology report (P < 0.001), radiologist recommendation for further surveillance (P < 0.001), and medical discharging service (P = 0.016) (Table 2). The highest rate of pulmonary nodule inclusion in the discharge summary (42%) was noted among patients for whom the radiology report included specific recommendations.
")
DISCUSSION
The frequency of incidental pulmonary nodules reported on abdominal CT in our study (5.6%) is consistent with frequencies reported in similar studies. Wu et al.7 (reviewing 141,406 abdominal CT scans) and Alpert et al.8 (reviewing 12,287 abdominal CT scans) reported frequencies of 2.5% and 3%, respectively, while Rinaldi et al.3 (reviewing 243 abdominal CT scans) reported a higher frequency, 8.4%. Variation likely results from patient factors and the individual radiologist’s attention to incidental pulmonary findings. Rinaldi et al. suggested that up to 39% of abdominal CT scans include pulmonary nodules on independent review, raising the possibility of significant underreporting. In our study, we focused on pulmonary nodules included in the radiology report to tailor the relevance of our study to the hospital medicine community. We also included only those incidental nodules falling within the purview of the Fleischner Society criteria in order to analyze only findings with established follow-up guidelines.
The rate of pulmonary nodule documentation in our study was low overall (23%) but consistent with the literature. Collins et al.,4 for example, reported that only 17.7% of patients with trauma were notified of incidental CT findings by either the discharge summary or an appropriate specialist consultation. Various contributing factors can be hypothesized. First, incidental pulmonary nodules are discovered largely in the context of evaluation for other symptomatic conditions, which can overshadow their importance. Second, the lack of clear patient-friendly education materials regarding incidental pulmonary nodules can complicate discussions with patients. Third, many electronic health record (EHR) systems cannot automatically pull incidental findings into the discharge summary and instead rely on provider vigilance.
As our study does, the literature highlights the importance of the radiology report in communicating incidental findings. In a review of >1000 pulmonary angiographic CT studies, Blagev et al.9 reported an overall follow-up rate of 29% (28/96) among patients with incidental pulmonary nodules, but none of the 12 patients with pulmonary nodules mentioned in the body of the report (rather than in the summary headings) received adequate follow-up. Similarly, in Shuaib et al.,10 radiology reports that included follow-up recommendations were more likely to change patient treatment than reports without follow-up recommendations (70% vs 2%). However, our data also show that radiologist recommendations alone are insufficient to ensure adequate communication of incidental findings.
The literature regarding the most cost-effective means of addressing this quality gap is limited. Some institutions have integrated their EHR systems to allow radiologists to flag incidental findings for auto-population in a dedicated section of the discharge summary. Although these efforts can be helpful, documentation alone does not save lives without appropriate follow-up and intervention. Some institutions have hired dedicated nursing staff as incidental finding coordinators. For high-risk incidental findings, Sperry et al.11 reported that hiring an incidental findings coordinator helped their level I trauma center achieve nearly complete documentation, patient notification, and confirmation of posthospital follow-up appointments. Such solutions, however, are labor-intensive and still rely on appropriate primary care follow-up.
Strengths of our study include its relatively large size and particular focus on the issues and decisions facing hospital medicine providers. By focusing on incidental pulmonary nodules reported on abdominal CT, and excluding patients with concurrent chest CT, we avoided including patients with symptomatic or previously identified pulmonary findings. Study limitations include the cross-sectional, retrospective design, which did not include follow-up data regarding such outcomes as rates of appropriate follow-up surveillance and subsequent lung cancer diagnoses. Our single-center study findings may not apply to all hospital practice settings, though they are consistent with the literature with comparison data.
Our study results highlight the need for a multidisciplinary systems-based approach to incidental pulmonary nodule documentation, communication, and follow-up surveillance.
Disclosure
Nothing to report.
1. Armao D, Smith JK. Overuse of computed tomography and the onslaught of incidental findings. N C Med J. 2014;75(2):127. PubMed
2. Gould MK, Tang T, Liu IL, et al. Recent trends in the identification of incidental pulmonary nodules. Am J Respir Crit Care Med. 2015;192(10):1208-1214. PubMed
3. Rinaldi MF, Bartalena T, Giannelli G, et al. Incidental lung nodules on CT examinations of the abdomen: prevalence and reporting rates in the PACS era. Eur J Radiol. 2010;74(3):e84-e88. PubMed
4. Collins CE, Cherng N, McDade T, et al. Improving patient notification of solid abdominal viscera incidental findings with a standardized protocol. J Trauma Manag Outcomes. 2015;9(1):1. PubMed
5. Kripalani S, LeFevre F, Phillips CO, Williams MV, Basaviah P, Baker DW. Deficits in communication and information transfer between hospital-based and primary care physicians: implications for patient safety and continuity of care. JAMA. 2007;297(8):831-841. PubMed
6. Swensen SJ, Silverstein MD, Ilstrup DM, Schleck CD, Edell ES. The probability of malignancy in solitary pulmonary nodules. Application to small radiologically indeterminate nodules. Arch Intern Med. 1997;157(8):849-855. PubMed
7. Wu CC, Cronin CG, Chu JT, et al. Incidental pulmonary nodules detected on abdominal computed tomography. J Comput Assist Tomogr. 2012;36(6):641-645. PubMed
8. Alpert JB, Fantauzzi JP, Melamud K, Greenwood H, Naidich DP, Ko JP. Clinical significance of lung nodules reported on abdominal CT. AJR Am J Roentgenol. 2012;198(4):793-799. PubMed
9. Blagev DP, Lloyd JF, Conner K, et al. Follow-up of incidental pulmonary nodules and the radiology report. J Am Coll Radiol. 2014;11(4):378-383. PubMed
10. Shuaib W, Johnson JO, Salastekar N, Maddu KK, Khosa F. Incidental findings detected on abdomino-pelvic multidetector computed tomography performed in the acute setting [published correction appears in Am J Emerg Med. 2014;32(7):811. Waqas, Shuaib (corrected to Shuaib, Waqas)]. Am J Emerg Med. 2014;32(1):36-39. PubMed
11. Sperry JL, Massaro MS, Collage RD, et al. Incidental radiographic findings after injury: dedicated attention results in improved capture, documentation, and management. Surgery. 2010;148(4):618-624. PubMed
Incidental findings create both medical and logistical challenges regarding communication.1,2 Pulmonary nodules are among the most frequent and medically relevant incidental findings, being noted in up to 8.4% of abdominal computed tomography (CT) scans.3 There are guidelines regarding proper follow-up and management of such incidental pulmonary nodules, but appropriate evidence-based surveillance imaging is often not performed, and many patients remain uninformed. Collins et al.4 reported that, before initiation of a standardized protocol, only 17.7% of incidental findings were communicated to patients admitted to the trauma service; after protocol initiation, the rate increased to 32.4%. The hospital discharge summary provides an opportunity to communicate incidental findings to patients and their medical care providers, but Kripalani et al.5 raised questions regarding the current completeness and accuracy of discharge summaries, reporting that 65% of discharge summaries omitted relevant diagnostic testing, and 30% omitted a follow-up plan.
We conducted a study to determine how often incidental pulmonary nodules found on abdominal CT are documented in the discharge summary, and to identify factors associated with pulmonary nodule inclusion.
METHODS
This was a retrospective cohort study of hospitalized patients ≥35 years of age who underwent in-patient abdominal CT between January 1, 2012 and December 31, 2014. Patients were identified by cross-referencing hospital admissions with Current Procedural Terminology (CPT) codes indicating abdominal CT (74176, 74177, 74178, 74160, 74150, 74170). Patients with chest CT (CPT codes 71260, 71250, 71270) during that hospitalization or within 30 days before admission were excluded to ensure that pulmonary nodules were incidental and asymptomatic. The index hospitalization was defined as the first hospitalization during which the patient was diagnosed with an incidental pulmonary nodule on abdominal CT, or the first hospitalization during the study period for patients without pulmonary nodules. All patient charts were manually reviewed, and baseline age, sex, and smoking status data collected.
Radiology reports were electronically screened for the words nodule and nodules and then confirmed through manual review of the full text reports. Nodules described as tiny (without other size description) were assumed to be <4 mm in size, per manual review of a small sample. Nodules were deemed as falling outside the Fleischner Society criteria guidelines (designed for indeterminate pulmonary nodules), and were therefore excluded, if any of seven criteria were met: The nodule was (1) cavitary, (2) associated with a known metastatic disease, (3) associated with a known granulomatous disease, (4) associated with a known inflammatory process, (5) reported likely to represent atelectasis, (6) reported likely to be a lymph node, or (7) previously biopsied.4
For each patient with pulmonary nodules, a personal history of cancer was obtained. Nodule size, characteristics, and stability compared with available prior imaging were recorded. Radiology reports were reviewed to determine if pulmonary nodules were mentioned in the summary headings of the reports or in the body of the reports and whether specific follow-up recommendations were provided. Hospital discharge summaries were reviewed for documentation of pulmonary nodule(s) and follow-up recommendations. Discharging service (medical/medical subspecialty, surgical/surgical subspecialty) was noted, along with the patients’ condition at discharge (alive, alive on hospice, deceased).
The frequency of incidental pulmonary nodules on abdominal CT during hospitalization and the frequency of nodules requiring follow-up were reported using a point estimate and corresponding 95% confidence interval (CI). The χ2 test was used to compare the frequency of pulmonary nodules across patient groups. In addition, for patients found to have incidental nodules requiring follow-up, the χ2 test was used to compare across groups the percentage of patients with discharge documentation of the incidental nodule. In all cases, 2-tailed Ps are reported, with P ≤ 0.05 considered statistically significant.
RESULTS
Between January 1, 2012 and December 31, 2014, 7173 patients ≥35 years old underwent in-patient abdominal CT without concurrent chest CT. Of these patients, 62.2% were ≥60 years old, 50.6% were men, and 45.5% were current or former smokers. Incidental pulmonary nodules were noted in 402 patients (5.6%; 95% CI, 5.1%-6.2%), of whom 68.7% were ≥60 years old, 56.5% were men, and 46.3% were current or former smokers. Increasing age (P = 0.004) and male sex (P = 0.015) were associated with increased frequency of incidental pulmonary nodules, but smoking status (P = 0.586) was not. Of patients with incidental nodules, 71.6% had solitary nodules, and 58.5% had a maximum nodule size of ≤4 mm (Table 1). Based on smoking status, nodule size, and reported size stability, 208 patients (2.9%; 95% CI, 2.5%-3.3%) required follow-up surveillance as per 2005 Fleischner Society guidelines. Among solitary pulmonary nodules requiring further surveillance (n = 147), the mean risk of malignancy based on the Mayo Clinic solitary pulmonary nodule risk calculator was 7.9% (interquartile range, 3.0%-10.5%), with 28% having a malignancy risk of ≥10%.6
Of the 208 patients with nodules requiring further surveillance, only 48 (23%) received discharge summaries documenting the nodule; 34 of these summaries included a recommendation for nodule follow-up, with 19 of the recommendations including a time frame for repeat CT. Three factors were positively associated with documentation of the pulmonary nodule in the discharge summary: mention of the pulmonary nodule in the summary headings of the radiology report (P < 0.001), radiologist recommendation for further surveillance (P < 0.001), and medical discharging service (P = 0.016) (Table 2). The highest rate of pulmonary nodule inclusion in the discharge summary (42%) was noted among patients for whom the radiology report included specific recommendations.
DISCUSSION
The frequency of incidental pulmonary nodules reported on abdominal CT in our study (5.6%) is consistent with frequencies reported in similar studies. Wu et al.7 (reviewing 141,406 abdominal CT scans) and Alpert et al.8 (reviewing 12,287 abdominal CT scans) reported frequencies of 2.5% and 3%, respectively, while Rinaldi et al.3 (reviewing 243 abdominal CT scans) reported a higher frequency, 8.4%. Variation likely results from patient factors and the individual radiologist’s attention to incidental pulmonary findings. Rinaldi et al. suggested that up to 39% of abdominal CT scans include pulmonary nodules on independent review, raising the possibility of significant underreporting. In our study, we focused on pulmonary nodules included in the radiology report to tailor the relevance of our study to the hospital medicine community. We also included only those incidental nodules falling within the purview of the Fleischner Society criteria in order to analyze only findings with established follow-up guidelines.
The rate of pulmonary nodule documentation in our study was low overall (23%) but consistent with the literature. Collins et al.,4 for example, reported that only 17.7% of patients with trauma were notified of incidental CT findings by either the discharge summary or an appropriate specialist consultation. Various contributing factors can be hypothesized. First, incidental pulmonary nodules are discovered largely in the context of evaluation for other symptomatic conditions, which can overshadow their importance. Second, the lack of clear patient-friendly education materials regarding incidental pulmonary nodules can complicate discussions with patients. Third, many electronic health record (EHR) systems cannot automatically pull incidental findings into the discharge summary and instead rely on provider vigilance.
As our study does, the literature highlights the importance of the radiology report in communicating incidental findings. In a review of >1000 pulmonary angiographic CT studies, Blagev et al.9 reported an overall follow-up rate of 29% (28/96) among patients with incidental pulmonary nodules, but none of the 12 patients with pulmonary nodules mentioned in the body of the report (rather than in the summary headings) received adequate follow-up. Similarly, in Shuaib et al.,10 radiology reports that included follow-up recommendations were more likely to change patient treatment than reports without follow-up recommendations (70% vs 2%). However, our data also show that radiologist recommendations alone are insufficient to ensure adequate communication of incidental findings.
The literature regarding the most cost-effective means of addressing this quality gap is limited. Some institutions have integrated their EHR systems to allow radiologists to flag incidental findings for auto-population in a dedicated section of the discharge summary. Although these efforts can be helpful, documentation alone does not save lives without appropriate follow-up and intervention. Some institutions have hired dedicated nursing staff as incidental finding coordinators. For high-risk incidental findings, Sperry et al.11 reported that hiring an incidental findings coordinator helped their level I trauma center achieve nearly complete documentation, patient notification, and confirmation of posthospital follow-up appointments. Such solutions, however, are labor-intensive and still rely on appropriate primary care follow-up.
Strengths of our study include its relatively large size and particular focus on the issues and decisions facing hospital medicine providers. By focusing on incidental pulmonary nodules reported on abdominal CT, and excluding patients with concurrent chest CT, we avoided including patients with symptomatic or previously identified pulmonary findings. Study limitations include the cross-sectional, retrospective design, which did not include follow-up data regarding such outcomes as rates of appropriate follow-up surveillance and subsequent lung cancer diagnoses. Our single-center study findings may not apply to all hospital practice settings, though they are consistent with the literature with comparison data.
Our study results highlight the need for a multidisciplinary systems-based approach to incidental pulmonary nodule documentation, communication, and follow-up surveillance.
Disclosure
Nothing to report.
1. Armao D, Smith JK. Overuse of computed tomography and the onslaught of incidental findings. N C Med J. 2014;75(2):127. PubMed
2. Gould MK, Tang T, Liu IL, et al. Recent trends in the identification of incidental pulmonary nodules. Am J Respir Crit Care Med. 2015;192(10):1208-1214. PubMed
3. Rinaldi MF, Bartalena T, Giannelli G, et al. Incidental lung nodules on CT examinations of the abdomen: prevalence and reporting rates in the PACS era. Eur J Radiol. 2010;74(3):e84-e88. PubMed
4. Collins CE, Cherng N, McDade T, et al. Improving patient notification of solid abdominal viscera incidental findings with a standardized protocol. J Trauma Manag Outcomes. 2015;9(1):1. PubMed
5. Kripalani S, LeFevre F, Phillips CO, Williams MV, Basaviah P, Baker DW. Deficits in communication and information transfer between hospital-based and primary care physicians: implications for patient safety and continuity of care. JAMA. 2007;297(8):831-841. PubMed
6. Swensen SJ, Silverstein MD, Ilstrup DM, Schleck CD, Edell ES. The probability of malignancy in solitary pulmonary nodules. Application to small radiologically indeterminate nodules. Arch Intern Med. 1997;157(8):849-855. PubMed
7. Wu CC, Cronin CG, Chu JT, et al. Incidental pulmonary nodules detected on abdominal computed tomography. J Comput Assist Tomogr. 2012;36(6):641-645. PubMed
8. Alpert JB, Fantauzzi JP, Melamud K, Greenwood H, Naidich DP, Ko JP. Clinical significance of lung nodules reported on abdominal CT. AJR Am J Roentgenol. 2012;198(4):793-799. PubMed
9. Blagev DP, Lloyd JF, Conner K, et al. Follow-up of incidental pulmonary nodules and the radiology report. J Am Coll Radiol. 2014;11(4):378-383. PubMed
10. Shuaib W, Johnson JO, Salastekar N, Maddu KK, Khosa F. Incidental findings detected on abdomino-pelvic multidetector computed tomography performed in the acute setting [published correction appears in Am J Emerg Med. 2014;32(7):811. Waqas, Shuaib (corrected to Shuaib, Waqas)]. Am J Emerg Med. 2014;32(1):36-39. PubMed
11. Sperry JL, Massaro MS, Collage RD, et al. Incidental radiographic findings after injury: dedicated attention results in improved capture, documentation, and management. Surgery. 2010;148(4):618-624. PubMed
© 2017 Society of Hospital Medicine
Overuse of troponin? A comprehensive evaluation of testing in a large hospital system
The ability of serum troponin measurement in the diagnosis of acute myocardial infarction (AMI) was validated in patients with at least a moderate pretest probability for the disease.1 The diagnostic yield of troponin testing in clinical trials has been between 20% and 50%, excluded patients thought unlikely to have AMI. In practice, physicians often encounter low-risk patients and patients in whom the diagnosis on initial presentation is unclear. Several noncardiac diagnoses, such as pneumonia and respiratory failure, are associated with an elevated troponin level in the absence of AMI, but patients can present with symptoms similar or identical to those of patients who present with AMI.2-4 Elevated troponin level in sepsis has been associated with worsened prognosis, though there is no evidence that this finding alters management. An American College of Cardiology Foundation opinion published in 2012 expressly recommends against troponin testing in patients with sepsis.4
The only guideline-based indication for troponin testing is the diagnosis or exclusion of AMI.5 We conducted a comprehensive review of troponin testing in our healthcare system to see whether testing might be used in clinical settings in which AMI was unlikely.
METHODS
We retrospectively obtained data on all visits to 14 hospitals in an integrated healthcare system in Texas between June 2013 and June 2014. We analyzed data for all hospital encounters during which a troponin assay was ordered and a troponin level reported—including qualitative point-of-care assays and quantitative laboratory troponin I measurements. We identified 93,436 visits. Quantitative measurements were divided into negative (<0.05 ng/mL), indeterminate (0.05-0.09 ng/mL), and elevated (>0.09 ng/mL), based on the reference ranges reported to physicians. We associated troponin levels with ICD-9 (International Classification of Diseases, Ninth Revision) primary and secondary diagnoses, grouping ICD-9 codes 410 (AMI), 411 (other acute or subacute forms of ischemic heart disease [IHD]), 412 (old myocardial infarction), 413 (angina pectoris), and 414 (other forms of chronic IHD) as representing IHD diagnoses.
To further evaluate troponin testing, we constructed 2 contingency matrices (Table).6 We included visits for which both primary and secondary diagnoses were available for review and for which quantitative troponin I measurements were available; 92,445 encounters met criteria for inclusion in matrix calculations. In the first matrix (part A of Table), a primary diagnosis of any AMI (ICD-9 code 410) was used as “positive” and all others “negative.” In the second matrix (part B of Table), “positive” includes any primary or secondary diagnosis of AMI.

RESULTS
We identified a total of 93,436 hospital visits associated with troponin testing; 179,239 troponin measurements were associated with these visits (an average of 1.81 per encounter). Of these visits, 59,897 (64.1%) were associated with a single measurement. Of the 179,239 measurements, 147,051 (82.1%) were negative, 21,881 (12.1%) indeterminate, and 10,307 (5.8%) positive. Primary diagnoses of hypertension, dizziness, abdominal pain, anxiety, dehydration, and headache associated with troponin testing comprised 6127 encounters and had no associated elevated troponin levels. Several non-cardiac primary diagnoses were associated with significant numbers of elevated troponin values including septicemia (27%), acute respiratory failure (28%), and cerebrovascular accident (10%). Seventy-six percent of encounters associated with troponin testing had no primary or secondary IHD diagnosis. Only 2% of 16,941 visits with a primary diagnosis of chest pain were associated with abnormal troponin levels (Figure).

Analysis of contingency matrices revealed AMI prevalence of 2.6% when primary AMI diagnoses were considered and 3.5% when any AMI diagnoses were considered. Sensitivity and specificity were high (>90%), and negative predictive value extremely high (>99%) in each circumstance. However, positive predictive values were low (21.7% and 28.8%, respectively), indicating the majority of patients with elevated troponin levels were not reported to have AMI by attending physicians.
DISCUSSION
We were surprised to find that troponin level was measured only once during 64% of the hospital encounters. Although there are clinical scenarios in which a single measurement might be indicated, detecting a rise or fall in troponin level is integral to the diagnosis of AMI, which is why guidelines recommend serial measurement.4 We were also surprised to find a low rate of either primary or secondary AMI in patients tested. As others have found,2,3 elevated troponin levels were associated with noncardiac primary diagnoses, such as sepsis, respiratory failure, and stroke. Of interest, the majority (72%) of patients with elevated troponin levels did not receive a primary or secondary diagnosis of AMI.
Determining the appropriate level of use for a diagnostic laboratory test can be difficult. Primary diagnostic codes, including codes for headache and dizziness, accounted for thousands of tested patients but were associated with no elevated troponin levels. On the other hand, sepsis, pneumonia, and stroke were associated with high rates of elevated troponin levels. Elevated troponin levels likely precipitate cardiology consultation and testing, which increase cost of care perhaps without improving either quality or value of care. However, evidence for the potential prognostic value of testing has led to ongoing research at our institution to evaluate whether troponin measurement might guide better management of such patients.
Appropriate use criteria have been developed for many diagnostic studies, including echocardiography, stress testing, and cardiac catheterization, but not for laboratory testing. Our data suggest possible overuse of troponin testing in our healthcare system. The low AMI incidence we found (2.6%-3.5%) indicates that many patients without AMI are being tested.
Although it is impossible to accurately estimate sensitivity and specificity of testing post hoc, it is reassuring to see that measured sensitivity, specificity, and negative predictive values were all high and consistent with published values from prospective clinical trials.7,8
As potential roles for troponin testing develop for patients without primary cardiac disease, it becomes even more important to develop guidelines for testing and to avoid universal testing of all hospitalized patients. The high negative predictive value of troponin testing (99%) is attractive to physicians who want to avoid missing AMI. Electronic order sets allow troponin testing to be included alongside “standard” testing, such as complete blood cell counts and comprehensive metabolic panels, and may contribute to overuse.
The troponin assays used in our healthcare system in 2014 likely will be replaced with high-sensitivity assays currently being used in Europe.9,10 These high-sensitivity assays can improve sensitivity but cannot be expected to increase positive predictive value or reduce false detection rates. When performed as single measurements, hs troponin has the potential to increase the number of elevated troponins detected that are not associated with AMI.
On the basis of our data, we have initiated a system-wide program to improve performance of troponin testing in our healthcare system. We are working with hospitalists and critical care and emergency department physicians to ensure that serial measurements are being performed and that the correct patients are being tested. Future data collection will help determine the success or failure of these efforts.
Disclosure
Nothing to report.
1. Thygesen K, Alpert JS, Jaffe AS, et al. Third universal definition of myocardial infarction. Circulation. 2012;126(16):2020-2035. PubMed
2. Hamm CW, Giannitsis E, Katus HA. Cardiac troponin elevations in patients without acute coronary syndrome. Circulation. 2002;106(23):2871-2872. PubMed
3. Roongsritong C, Warraich I, Bradley C. Common causes of troponin elevations in the absence of acute myocardial infarction: incidence and clinical significance. Chest. 2004;125(5):1877-1884. PubMed
4. Newby LK, Jesse RL, Babb JD, et al. ACCF 2012 expert consensus document on practical clinical considerations in the interpretation of troponin elevations: a report of the American College of Cardiology Foundation Task Force on Clinical Consensus Documents. J Am Coll Cardiol. 2012;60(23):2427-2463. PubMed
5. Amsterdam EA, Wenger NK, Brindis RG, et al; American College of Cardiology; American Heart Association Task Force on Practice Guidelines; Society for Cardiovascular Angiography and Interventions; Society of Thoracic Surgeons; American Association for Clinical Chemistry. 2014 AHA/ACC Guideline for the Management of Patients With Non-ST-Elevation Acute Coronary Syndromes: a report of the American College of Cardiology/American Heart Association Task Force on Practice Guidelines. J Am Coll Cardiol. 2014;64(24):e139-e228.
6. Pearson K. On the Theory of Contingency and Its Relationship to Association and Normal Correlation. Mathematical Contributions to the Theory of Evolution. London, England: Dulau & Co; 1904.
7. Katus HA, Remppis A, Neumann FJ, et al. Diagnostic efficiency of troponin T measurements in acute myocardial infarction. Circulation. 1991;83(3):902-912. PubMed
8. Olatidoye AG, Wu AH, Feng YJ, Waters D. Prognostic role of troponin T versus troponin I in unstable angina pectoris for cardiac events with meta-analysis comparing published studies. Am J Cardiol. 1998;81(12):1405-1410. PubMed
9. Reichlin T, Hochholzer W, Bassetti S, et al. Early diagnosis of myocardial infarction with sensitive cardiac troponin assays. N Engl J Med. 2009;361(9):858-867. PubMed
10. Keller T, Zeller T, Peetz D, et al. Sensitive troponin I assay in early diagnosis of acute myocardial infarction. N Engl J Med. 2009;361(9):868-877. PubMed
The ability of serum troponin measurement in the diagnosis of acute myocardial infarction (AMI) was validated in patients with at least a moderate pretest probability for the disease.1 The diagnostic yield of troponin testing in clinical trials has been between 20% and 50%, excluded patients thought unlikely to have AMI. In practice, physicians often encounter low-risk patients and patients in whom the diagnosis on initial presentation is unclear. Several noncardiac diagnoses, such as pneumonia and respiratory failure, are associated with an elevated troponin level in the absence of AMI, but patients can present with symptoms similar or identical to those of patients who present with AMI.2-4 Elevated troponin level in sepsis has been associated with worsened prognosis, though there is no evidence that this finding alters management. An American College of Cardiology Foundation opinion published in 2012 expressly recommends against troponin testing in patients with sepsis.4
The only guideline-based indication for troponin testing is the diagnosis or exclusion of AMI.5 We conducted a comprehensive review of troponin testing in our healthcare system to see whether testing might be used in clinical settings in which AMI was unlikely.
METHODS
We retrospectively obtained data on all visits to 14 hospitals in an integrated healthcare system in Texas between June 2013 and June 2014. We analyzed data for all hospital encounters during which a troponin assay was ordered and a troponin level reported—including qualitative point-of-care assays and quantitative laboratory troponin I measurements. We identified 93,436 visits. Quantitative measurements were divided into negative (<0.05 ng/mL), indeterminate (0.05-0.09 ng/mL), and elevated (>0.09 ng/mL), based on the reference ranges reported to physicians. We associated troponin levels with ICD-9 (International Classification of Diseases, Ninth Revision) primary and secondary diagnoses, grouping ICD-9 codes 410 (AMI), 411 (other acute or subacute forms of ischemic heart disease [IHD]), 412 (old myocardial infarction), 413 (angina pectoris), and 414 (other forms of chronic IHD) as representing IHD diagnoses.
To further evaluate troponin testing, we constructed 2 contingency matrices (Table).6 We included visits for which both primary and secondary diagnoses were available for review and for which quantitative troponin I measurements were available; 92,445 encounters met criteria for inclusion in matrix calculations. In the first matrix (part A of Table), a primary diagnosis of any AMI (ICD-9 code 410) was used as “positive” and all others “negative.” In the second matrix (part B of Table), “positive” includes any primary or secondary diagnosis of AMI.
RESULTS
We identified a total of 93,436 hospital visits associated with troponin testing; 179,239 troponin measurements were associated with these visits (an average of 1.81 per encounter). Of these visits, 59,897 (64.1%) were associated with a single measurement. Of the 179,239 measurements, 147,051 (82.1%) were negative, 21,881 (12.1%) indeterminate, and 10,307 (5.8%) positive. Primary diagnoses of hypertension, dizziness, abdominal pain, anxiety, dehydration, and headache associated with troponin testing comprised 6127 encounters and had no associated elevated troponin levels. Several non-cardiac primary diagnoses were associated with significant numbers of elevated troponin values including septicemia (27%), acute respiratory failure (28%), and cerebrovascular accident (10%). Seventy-six percent of encounters associated with troponin testing had no primary or secondary IHD diagnosis. Only 2% of 16,941 visits with a primary diagnosis of chest pain were associated with abnormal troponin levels (Figure).
Analysis of contingency matrices revealed AMI prevalence of 2.6% when primary AMI diagnoses were considered and 3.5% when any AMI diagnoses were considered. Sensitivity and specificity were high (>90%), and negative predictive value extremely high (>99%) in each circumstance. However, positive predictive values were low (21.7% and 28.8%, respectively), indicating the majority of patients with elevated troponin levels were not reported to have AMI by attending physicians.
DISCUSSION
We were surprised to find that troponin level was measured only once during 64% of the hospital encounters. Although there are clinical scenarios in which a single measurement might be indicated, detecting a rise or fall in troponin level is integral to the diagnosis of AMI, which is why guidelines recommend serial measurement.4 We were also surprised to find a low rate of either primary or secondary AMI in patients tested. As others have found,2,3 elevated troponin levels were associated with noncardiac primary diagnoses, such as sepsis, respiratory failure, and stroke. Of interest, the majority (72%) of patients with elevated troponin levels did not receive a primary or secondary diagnosis of AMI.
Determining the appropriate level of use for a diagnostic laboratory test can be difficult. Primary diagnostic codes, including codes for headache and dizziness, accounted for thousands of tested patients but were associated with no elevated troponin levels. On the other hand, sepsis, pneumonia, and stroke were associated with high rates of elevated troponin levels. Elevated troponin levels likely precipitate cardiology consultation and testing, which increase cost of care perhaps without improving either quality or value of care. However, evidence for the potential prognostic value of testing has led to ongoing research at our institution to evaluate whether troponin measurement might guide better management of such patients.
Appropriate use criteria have been developed for many diagnostic studies, including echocardiography, stress testing, and cardiac catheterization, but not for laboratory testing. Our data suggest possible overuse of troponin testing in our healthcare system. The low AMI incidence we found (2.6%-3.5%) indicates that many patients without AMI are being tested.
Although it is impossible to accurately estimate sensitivity and specificity of testing post hoc, it is reassuring to see that measured sensitivity, specificity, and negative predictive values were all high and consistent with published values from prospective clinical trials.7,8
As potential roles for troponin testing develop for patients without primary cardiac disease, it becomes even more important to develop guidelines for testing and to avoid universal testing of all hospitalized patients. The high negative predictive value of troponin testing (99%) is attractive to physicians who want to avoid missing AMI. Electronic order sets allow troponin testing to be included alongside “standard” testing, such as complete blood cell counts and comprehensive metabolic panels, and may contribute to overuse.
The troponin assays used in our healthcare system in 2014 likely will be replaced with high-sensitivity assays currently being used in Europe.9,10 These high-sensitivity assays can improve sensitivity but cannot be expected to increase positive predictive value or reduce false detection rates. When performed as single measurements, hs troponin has the potential to increase the number of elevated troponins detected that are not associated with AMI.
On the basis of our data, we have initiated a system-wide program to improve performance of troponin testing in our healthcare system. We are working with hospitalists and critical care and emergency department physicians to ensure that serial measurements are being performed and that the correct patients are being tested. Future data collection will help determine the success or failure of these efforts.
Disclosure
Nothing to report.
1. Thygesen K, Alpert JS, Jaffe AS, et al. Third universal definition of myocardial infarction. Circulation. 2012;126(16):2020-2035. PubMed
2. Hamm CW, Giannitsis E, Katus HA. Cardiac troponin elevations in patients without acute coronary syndrome. Circulation. 2002;106(23):2871-2872. PubMed
3. Roongsritong C, Warraich I, Bradley C. Common causes of troponin elevations in the absence of acute myocardial infarction: incidence and clinical significance. Chest. 2004;125(5):1877-1884. PubMed
4. Newby LK, Jesse RL, Babb JD, et al. ACCF 2012 expert consensus document on practical clinical considerations in the interpretation of troponin elevations: a report of the American College of Cardiology Foundation Task Force on Clinical Consensus Documents. J Am Coll Cardiol. 2012;60(23):2427-2463. PubMed
5. Amsterdam EA, Wenger NK, Brindis RG, et al; American College of Cardiology; American Heart Association Task Force on Practice Guidelines; Society for Cardiovascular Angiography and Interventions; Society of Thoracic Surgeons; American Association for Clinical Chemistry. 2014 AHA/ACC Guideline for the Management of Patients With Non-ST-Elevation Acute Coronary Syndromes: a report of the American College of Cardiology/American Heart Association Task Force on Practice Guidelines. J Am Coll Cardiol. 2014;64(24):e139-e228.
6. Pearson K. On the Theory of Contingency and Its Relationship to Association and Normal Correlation. Mathematical Contributions to the Theory of Evolution. London, England: Dulau & Co; 1904.
7. Katus HA, Remppis A, Neumann FJ, et al. Diagnostic efficiency of troponin T measurements in acute myocardial infarction. Circulation. 1991;83(3):902-912. PubMed
8. Olatidoye AG, Wu AH, Feng YJ, Waters D. Prognostic role of troponin T versus troponin I in unstable angina pectoris for cardiac events with meta-analysis comparing published studies. Am J Cardiol. 1998;81(12):1405-1410. PubMed
9. Reichlin T, Hochholzer W, Bassetti S, et al. Early diagnosis of myocardial infarction with sensitive cardiac troponin assays. N Engl J Med. 2009;361(9):858-867. PubMed
10. Keller T, Zeller T, Peetz D, et al. Sensitive troponin I assay in early diagnosis of acute myocardial infarction. N Engl J Med. 2009;361(9):868-877. PubMed
© 2017 Society of Hospital Medicine