User login
Hospitalist and Internal Medicine Leaders’ Perspectives of Early Discharge Challenges at Academic Medical Centers
The discharge process is a critical bottleneck for efficient patient flow through the hospital. Delayed discharges translate into delays in admissions and other patient transitions, often leading to excess costs, patient dissatisfaction, and even patient harm.1-3 The emergency department is particularly impacted by these delays; bottlenecks there lead to overcrowding, increased overall hospital length of stay, and increased risks for bad outcomes during hospitalization.2
Academic medical centers in particular may struggle with delayed discharges. In a typical teaching hospital, a team composed of an attending physician and housestaff share responsibility for determining the discharge plan. Additionally, clinical teaching activities may affect the process and quality of discharge.4-6
The prevalence and causes of delayed discharges vary greatly.7-9 To improve efficiency around discharge, many hospitals have launched initiatives designed to discharge patients earlier in the day, including goal setting (“discharge by noon”), scheduling discharge appointments, and using quality-improvement methods, such as Lean Methodology (LEAN), to remove inefficiencies within discharge processes.10-12 However, there are few data on the prevalence and effectiveness of different strategies.
The aim of this study was to survey academic hospitalist and general internal medicine physician leaders to elicit their perspectives on the factors contributing to discharge timing and the relative importance and effectiveness of early-discharge initiatives.
METHODS
Study Design, Participants, and Oversight
We obtained a list of 115 university-affiliated hospitals associated with a residency program and, in most cases, a medical school from Vizient Inc. (formerly University HealthSystem Consortium), an alliance of academic medical centers and affiliated hospitals. Each member institution submits clinical data to allow for the benchmarking of outcomes to drive transparency and quality improvement.13 More than 95% of the nation’s academic medical centers and affiliated hospitals participate in this collaborative. Vizient works with members but does not set nor promote quality metrics, such as discharge timeliness. E-mail addresses for hospital medicine physician leaders (eg, division chief) of major academic medical centers were obtained from each institution via publicly available data (eg, the institution’s website). When an institution did not have a hospital medicine section, we identified the division chief of general internal medicine. The University of California, San Francisco Institutional Review Board approved this study.
Survey Development and Domains
We developed a 30-item survey to evaluate 5 main domains of interest: current discharge practices, degree of prioritization of early discharge on the inpatient service, barriers to timely discharge, prevalence and perceived effectiveness of implemented early-discharge initiatives, and barriers to implementation of early-discharge initiatives.
Respondents were first asked to identify their institutions’ goals for discharge time. They were then asked to compare the priority of early-discharge initiatives to other departmental quality-improvement initiatives, such as reducing 30-day readmissions, improving interpreter use, and improving patient satisfaction. Next, respondents were asked to estimate the degree to which clinical or patient factors contributed to delays in discharge. Respondents were then asked whether specific early-discharge initiatives, such as changes to rounding practices or communication interventions, were implemented at their institutions and, if so, the perceived effectiveness of these initiatives at meeting discharge targets. We piloted the questions locally with physicians and researchers prior to finalizing the survey.
Data Collection
We sent surveys via an online platform (Research Electronic Data Capture).14 Nonresponders were sent 2 e-mail reminders and then a follow-up telephone call asking them to complete the survey. Only 1 survey per academic medical center was collected. Any respondent who completed the survey within 2 weeks of receiving it was entered to win a Kindle Fire.
Data Analysis
We summarized survey responses using descriptive statistics. Analysis was completed in IBM SPSS version 22 (Armonk, NY).
RESULTS
Survey Respondent and Institutional Characteristics
Of the 115 institutions surveyed, we received 61 responses (response rate of 53%), with 39 (64%) respondents from divisions of hospital medicine and 22 (36%) from divisions of general internal medicine. A majority (n = 53; 87%) stated their medicine services have a combination of teaching (with residents) and nonteaching (without residents) teams. Thirty-nine (64%) reported having daily multidisciplinary rounds.
Early Discharge as a Priority
Forty-seven (77%) institutional representatives strongly agreed or agreed that early discharge was a priority, with discharge by noon being the most common target time (n = 23; 38%). Thirty (50%) respondents rated early discharge as more important than improving interpreter use for non-English-speaking patients and equally important as reducing 30-day readmissions (n = 29; 48%) and improving patient satisfaction (n = 27; 44%).
Factors Delaying Discharge
The most common factors perceived as delaying discharge were considered external to the hospital, such as postacute care bed availability or scheduled (eg, ambulance) transport delays (n = 48; 79%), followed by patient factors such as patient transport issues (n = 44; 72%). Less commonly reported were workflow issues, such as competing primary team priorities or case manager bandwidth (n = 38; 62%; Table 1).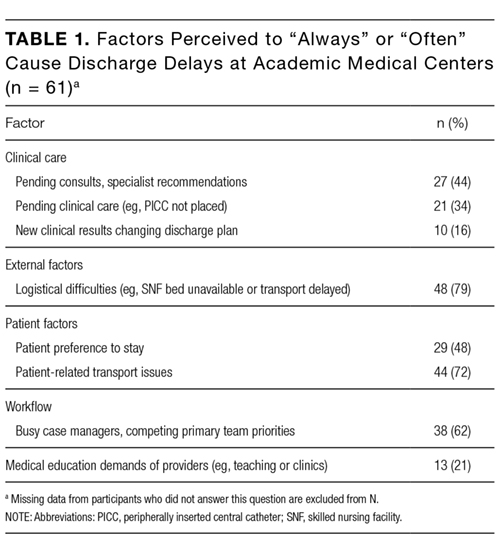
Initiatives to Improve Discharge
The most commonly implemented initiatives perceived as effective at improving discharge times were the preemptive identification of early discharges to plan discharge paperwork (n = 34; 56%), communication with patients about anticipated discharge time on the day prior to discharge (n = 29; 48%), and the implementation of additional rounds between physician teams and case managers specifically around discharge planning (n = 28; 46%). Initiatives not commonly implemented included regular audit of and feedback on discharge times to providers and teams (n = 21; 34%), the use of a discharge readiness checklist (n = 26; 43%), incentives such as bonuses or penalties (n = 37; 61%), the use of a whiteboard to indicate discharge times (n = 23; 38%), and dedicated quality-improvement approaches such as LEAN (n = 37; 61%; Table 2).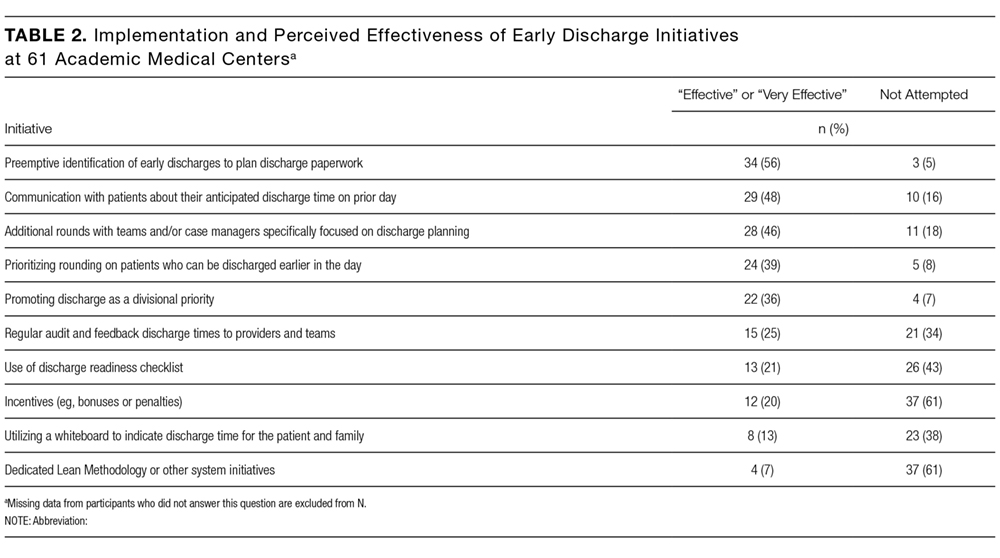
DISCUSSION
Our study suggests early discharge for medicine patients is a priority among academic institutions. Hospitalist and general internal medicine physician leaders in our study generally attributed delayed discharges to external factors, particularly unavailability of postacute care facilities and transportation delays. Having issues with finding postacute care placements is consistent with previous findings by Selker et al.15 and Carey et al.8 This is despite the 20-year difference between Selker et al.’s study and the current study, reflecting a continued opportunity for improvement, including stronger partnerships with local and regional postacute care facilities to expedite care transition and stronger discharge-planning efforts early in the admission process. Efforts in postacute care placement may be particularly important for Medicaid-insured and uninsured patients.
Our responders, hospitalist and internal medicine physician leaders, did not perceive the additional responsibilities of teaching and supervising trainees to be factors that significantly delayed patient discharge. This is in contrast to previous studies, which attributed delays in discharge to prolonged clinical decision-making related to teaching and supervision.4-6,8 This discrepancy may be due to the fact that we only surveyed single physician leaders at each institution and not residents. Our finding warrants further investigation to understand the degree to which resident skills may impact discharge planning and processes.
Institutions represented in our study have attempted a variety of initiatives promoting earlier discharge, with varying levels of perceived success. Initiatives perceived to be the most effective by hospital leaders centered on 2 main areas: (1) changing individual provider practice and (2) anticipatory discharge preparation. Interestingly, this is in discordance with the main factors labeled as causing delays in discharges, such as obtaining postacute care beds, busy case managers, and competing demands on primary teams. We hypothesize this may be because such changes require organization- or system-level changes and are perceived as more arduous than changes at the individual level. In addition, changes to individual provider behavior may be more cost- and time-effective than more systemic initiatives.
Our findings are consistent with the work published by Wertheimer and colleagues,11 who show that additional afternoon interdisciplinary rounds can help identify patients who may be discharged before noon the next day. In their study, identifying such patients in advance improved the overall early-discharge rate the following day.
Our findings should be interpreted in light of several limitations. Our survey only considers the perspectives of hospitalist and general internal medicine physician leaders at academic medical centers that are part of the Vizient Inc. collaborative. They do not represent all academic or community-based medical centers. Although the perceived effectiveness of some initiatives was high, we did not collect empirical data to support these claims or to determine which initiative had the greatest relative impact on discharge timeliness. Lastly, we did not obtain resident, nursing, or case manager perspectives on discharge practices. Given their roles as frontline providers, we may have missed these alternative perspectives.
Our study shows there is a strong interest in increasing early discharges in an effort to improve hospital throughput and patient flow.
Acknowledgments
The authors thank all participants who completed the survey and Danielle Carrier at Vizient Inc. (formally University HealthSystem Consortium) for her assistance in obtaining data.
Disclosures
Hemali Patel, Margaret Fang, Michelle Mourad, Adrienne Green, Ryan Murphy, and James Harrison report no conflicts of interest. At the time the research was conducted, Robert Wachter reported that he is a member of the Lucian Leape Institute at the National Patient Safety Foundation (no compensation except travel expenses); recently chaired an advisory board to England’s National Health Service (NHS) reviewing the NHS’s digital health strategy (no compensation except travel expenses); has a contract with UCSF from the Agency for Healthcare Research and Quality to edit a patient-safety website; receives compensation from John Wiley & Sons for writing a blog; receives royalties from Lippincott Williams & Wilkins and McGraw-Hill Education for writing and/or editing several books; receives stock options for serving on the board of Acuity Medical Management Systems; receives a yearly stipend for serving on the board of The Doctors Company; serves on the scientific advisory boards for amino.com, PatientSafe Solutions Inc., Twine, and EarlySense (for which he receives stock options); has a small royalty stake in CareWeb, a hospital communication tool developed at UCSF; and holds the Marc and Lynne Benioff Endowed Chair in Hospital Medicine and the Holly Smith Distinguished Professorship in Science and Medicine at UCSF.
1. Khanna S, Boyle J, Good N, Lind J. Impact of admission and discharge peak times on hospital overcrowding. Stud Health Technol Inform. 2011;168:82-88. PubMed
2. White BA, Biddinger PD, Chang Y, Grabowski B, Carignan S, Brown DFM. Boarding Inpatients in the Emergency Department Increases Discharged Patient Length of Stay. J Emerg Med. 2013;44(1):230-235. doi:10.1016/j.jemermed.2012.05.007. PubMed
3. Derlet RW, Richards JR. Overcrowding in the nation’s emergency departments: complex causes and disturbing effects. Ann Emerg Med. 2000;35(1):63-68. PubMed
4. da Silva SA, Valácio RA, Botelho FC, Amaral CFS. Reasons for discharge delays in teaching hospitals. Rev Saúde Pública. 2014;48(2):314-321. doi:10.1590/S0034-8910.2014048004971. PubMed
5. Greysen SR, Schiliro D, Horwitz LI, Curry L, Bradley EH. “Out of Sight, Out of Mind”: Housestaff Perceptions of Quality-Limiting Factors in Discharge Care at Teaching Hospitals. J Hosp Med Off Publ Soc Hosp Med. 2012;7(5):376-381. doi:10.1002/jhm.1928. PubMed
6. Goldman J, Reeves S, Wu R, Silver I, MacMillan K, Kitto S. Medical Residents and Interprofessional Interactions in Discharge: An Ethnographic Exploration of Factors That Affect Negotiation. J Gen Intern Med. 2015;30(10):1454-1460. doi:10.1007/s11606-015-3306-6. PubMed
7. Okoniewska B, Santana MJ, Groshaus H, et al. Barriers to discharge in an acute care medical teaching unit: a qualitative analysis of health providers’ perceptions. J Multidiscip Healthc. 2015;8:83-89. doi:10.2147/JMDH.S72633. PubMed
8. Carey MR, Sheth H, Scott Braithwaite R. A Prospective Study of Reasons for Prolonged Hospitalizations on a General Medicine Teaching Service. J Gen Intern Med. 2005;20(2):108-115. doi:10.1111/j.1525-1497.2005.40269.x. PubMed
9. Kim CS, Hart AL, Paretti RF, et al. Excess Hospitalization Days in an Academic Medical Center: Perceptions of Hospitalists and Discharge Planners. Am J Manag Care. 2011;17(2):e34-e42. http://www.ajmc.com/journals/issue/2011/2011-2-vol17-n2/AJMC_11feb_Kim_WebX_e34to42/. Accessed on October 26, 2016.
10. Gershengorn HB, Kocher R, Factor P. Management Strategies to Effect Change in Intensive Care Units: Lessons from the World of Business. Part II. Quality-Improvement Strategies. Ann Am Thorac Soc. 2014;11(3):444-453. doi:10.1513/AnnalsATS.201311-392AS. PubMed
11. Wertheimer B, Jacobs REA, Bailey M, et al. Discharge before noon: An achievable hospital goal. J Hosp Med. 2014;9(4):210-214. doi:10.1002/jhm.2154. PubMed
12. Manning DM, Tammel KJ, Blegen RN, et al. In-room display of day and time patient is anticipated to leave hospital: a “discharge appointment.” J Hosp Med. 2007;2(1):13-16. doi:10.1002/jhm.146. PubMed
13. Networks for academic medical centers. https://www.vizientinc.com/Our-networks/Networks-for-academic-medical-centers. Accessed on July 13, 2017.
14. Harris PA, Taylor R, Thielke R, Payne J, Gonzalez N, Conde JG. Research Electronic Data Capture (REDCap) - A metadata-driven methodology and workflow process for providing translational research informatics support. J Biomed Inform. 2009;42(2):377-381. doi:10.1016/j.jbi.2008.08.010. PubMed
15. Selker HP, Beshansky JR, Pauker SG, Kassirer JP. The epidemiology of delays in a teaching hospital. The development and use of a tool that detects unnecessary hospital days. Med Care. 1989;27(2):112-129. PubMed
The discharge process is a critical bottleneck for efficient patient flow through the hospital. Delayed discharges translate into delays in admissions and other patient transitions, often leading to excess costs, patient dissatisfaction, and even patient harm.1-3 The emergency department is particularly impacted by these delays; bottlenecks there lead to overcrowding, increased overall hospital length of stay, and increased risks for bad outcomes during hospitalization.2
Academic medical centers in particular may struggle with delayed discharges. In a typical teaching hospital, a team composed of an attending physician and housestaff share responsibility for determining the discharge plan. Additionally, clinical teaching activities may affect the process and quality of discharge.4-6
The prevalence and causes of delayed discharges vary greatly.7-9 To improve efficiency around discharge, many hospitals have launched initiatives designed to discharge patients earlier in the day, including goal setting (“discharge by noon”), scheduling discharge appointments, and using quality-improvement methods, such as Lean Methodology (LEAN), to remove inefficiencies within discharge processes.10-12 However, there are few data on the prevalence and effectiveness of different strategies.
The aim of this study was to survey academic hospitalist and general internal medicine physician leaders to elicit their perspectives on the factors contributing to discharge timing and the relative importance and effectiveness of early-discharge initiatives.
METHODS
Study Design, Participants, and Oversight
We obtained a list of 115 university-affiliated hospitals associated with a residency program and, in most cases, a medical school from Vizient Inc. (formerly University HealthSystem Consortium), an alliance of academic medical centers and affiliated hospitals. Each member institution submits clinical data to allow for the benchmarking of outcomes to drive transparency and quality improvement.13 More than 95% of the nation’s academic medical centers and affiliated hospitals participate in this collaborative. Vizient works with members but does not set nor promote quality metrics, such as discharge timeliness. E-mail addresses for hospital medicine physician leaders (eg, division chief) of major academic medical centers were obtained from each institution via publicly available data (eg, the institution’s website). When an institution did not have a hospital medicine section, we identified the division chief of general internal medicine. The University of California, San Francisco Institutional Review Board approved this study.
Survey Development and Domains
We developed a 30-item survey to evaluate 5 main domains of interest: current discharge practices, degree of prioritization of early discharge on the inpatient service, barriers to timely discharge, prevalence and perceived effectiveness of implemented early-discharge initiatives, and barriers to implementation of early-discharge initiatives.
Respondents were first asked to identify their institutions’ goals for discharge time. They were then asked to compare the priority of early-discharge initiatives to other departmental quality-improvement initiatives, such as reducing 30-day readmissions, improving interpreter use, and improving patient satisfaction. Next, respondents were asked to estimate the degree to which clinical or patient factors contributed to delays in discharge. Respondents were then asked whether specific early-discharge initiatives, such as changes to rounding practices or communication interventions, were implemented at their institutions and, if so, the perceived effectiveness of these initiatives at meeting discharge targets. We piloted the questions locally with physicians and researchers prior to finalizing the survey.
Data Collection
We sent surveys via an online platform (Research Electronic Data Capture).14 Nonresponders were sent 2 e-mail reminders and then a follow-up telephone call asking them to complete the survey. Only 1 survey per academic medical center was collected. Any respondent who completed the survey within 2 weeks of receiving it was entered to win a Kindle Fire.
Data Analysis
We summarized survey responses using descriptive statistics. Analysis was completed in IBM SPSS version 22 (Armonk, NY).
RESULTS
Survey Respondent and Institutional Characteristics
Of the 115 institutions surveyed, we received 61 responses (response rate of 53%), with 39 (64%) respondents from divisions of hospital medicine and 22 (36%) from divisions of general internal medicine. A majority (n = 53; 87%) stated their medicine services have a combination of teaching (with residents) and nonteaching (without residents) teams. Thirty-nine (64%) reported having daily multidisciplinary rounds.
Early Discharge as a Priority
Forty-seven (77%) institutional representatives strongly agreed or agreed that early discharge was a priority, with discharge by noon being the most common target time (n = 23; 38%). Thirty (50%) respondents rated early discharge as more important than improving interpreter use for non-English-speaking patients and equally important as reducing 30-day readmissions (n = 29; 48%) and improving patient satisfaction (n = 27; 44%).
Factors Delaying Discharge
The most common factors perceived as delaying discharge were considered external to the hospital, such as postacute care bed availability or scheduled (eg, ambulance) transport delays (n = 48; 79%), followed by patient factors such as patient transport issues (n = 44; 72%). Less commonly reported were workflow issues, such as competing primary team priorities or case manager bandwidth (n = 38; 62%; Table 1).
Initiatives to Improve Discharge
The most commonly implemented initiatives perceived as effective at improving discharge times were the preemptive identification of early discharges to plan discharge paperwork (n = 34; 56%), communication with patients about anticipated discharge time on the day prior to discharge (n = 29; 48%), and the implementation of additional rounds between physician teams and case managers specifically around discharge planning (n = 28; 46%). Initiatives not commonly implemented included regular audit of and feedback on discharge times to providers and teams (n = 21; 34%), the use of a discharge readiness checklist (n = 26; 43%), incentives such as bonuses or penalties (n = 37; 61%), the use of a whiteboard to indicate discharge times (n = 23; 38%), and dedicated quality-improvement approaches such as LEAN (n = 37; 61%; Table 2).
DISCUSSION
Our study suggests early discharge for medicine patients is a priority among academic institutions. Hospitalist and general internal medicine physician leaders in our study generally attributed delayed discharges to external factors, particularly unavailability of postacute care facilities and transportation delays. Having issues with finding postacute care placements is consistent with previous findings by Selker et al.15 and Carey et al.8 This is despite the 20-year difference between Selker et al.’s study and the current study, reflecting a continued opportunity for improvement, including stronger partnerships with local and regional postacute care facilities to expedite care transition and stronger discharge-planning efforts early in the admission process. Efforts in postacute care placement may be particularly important for Medicaid-insured and uninsured patients.
Our responders, hospitalist and internal medicine physician leaders, did not perceive the additional responsibilities of teaching and supervising trainees to be factors that significantly delayed patient discharge. This is in contrast to previous studies, which attributed delays in discharge to prolonged clinical decision-making related to teaching and supervision.4-6,8 This discrepancy may be due to the fact that we only surveyed single physician leaders at each institution and not residents. Our finding warrants further investigation to understand the degree to which resident skills may impact discharge planning and processes.
Institutions represented in our study have attempted a variety of initiatives promoting earlier discharge, with varying levels of perceived success. Initiatives perceived to be the most effective by hospital leaders centered on 2 main areas: (1) changing individual provider practice and (2) anticipatory discharge preparation. Interestingly, this is in discordance with the main factors labeled as causing delays in discharges, such as obtaining postacute care beds, busy case managers, and competing demands on primary teams. We hypothesize this may be because such changes require organization- or system-level changes and are perceived as more arduous than changes at the individual level. In addition, changes to individual provider behavior may be more cost- and time-effective than more systemic initiatives.
Our findings are consistent with the work published by Wertheimer and colleagues,11 who show that additional afternoon interdisciplinary rounds can help identify patients who may be discharged before noon the next day. In their study, identifying such patients in advance improved the overall early-discharge rate the following day.
Our findings should be interpreted in light of several limitations. Our survey only considers the perspectives of hospitalist and general internal medicine physician leaders at academic medical centers that are part of the Vizient Inc. collaborative. They do not represent all academic or community-based medical centers. Although the perceived effectiveness of some initiatives was high, we did not collect empirical data to support these claims or to determine which initiative had the greatest relative impact on discharge timeliness. Lastly, we did not obtain resident, nursing, or case manager perspectives on discharge practices. Given their roles as frontline providers, we may have missed these alternative perspectives.
Our study shows there is a strong interest in increasing early discharges in an effort to improve hospital throughput and patient flow.
Acknowledgments
The authors thank all participants who completed the survey and Danielle Carrier at Vizient Inc. (formally University HealthSystem Consortium) for her assistance in obtaining data.
Disclosures
Hemali Patel, Margaret Fang, Michelle Mourad, Adrienne Green, Ryan Murphy, and James Harrison report no conflicts of interest. At the time the research was conducted, Robert Wachter reported that he is a member of the Lucian Leape Institute at the National Patient Safety Foundation (no compensation except travel expenses); recently chaired an advisory board to England’s National Health Service (NHS) reviewing the NHS’s digital health strategy (no compensation except travel expenses); has a contract with UCSF from the Agency for Healthcare Research and Quality to edit a patient-safety website; receives compensation from John Wiley & Sons for writing a blog; receives royalties from Lippincott Williams & Wilkins and McGraw-Hill Education for writing and/or editing several books; receives stock options for serving on the board of Acuity Medical Management Systems; receives a yearly stipend for serving on the board of The Doctors Company; serves on the scientific advisory boards for amino.com, PatientSafe Solutions Inc., Twine, and EarlySense (for which he receives stock options); has a small royalty stake in CareWeb, a hospital communication tool developed at UCSF; and holds the Marc and Lynne Benioff Endowed Chair in Hospital Medicine and the Holly Smith Distinguished Professorship in Science and Medicine at UCSF.
1. Khanna S, Boyle J, Good N, Lind J. Impact of admission and discharge peak times on hospital overcrowding. Stud Health Technol Inform. 2011;168:82-88. PubMed
2. White BA, Biddinger PD, Chang Y, Grabowski B, Carignan S, Brown DFM. Boarding Inpatients in the Emergency Department Increases Discharged Patient Length of Stay. J Emerg Med. 2013;44(1):230-235. doi:10.1016/j.jemermed.2012.05.007. PubMed
3. Derlet RW, Richards JR. Overcrowding in the nation’s emergency departments: complex causes and disturbing effects. Ann Emerg Med. 2000;35(1):63-68. PubMed
4. da Silva SA, Valácio RA, Botelho FC, Amaral CFS. Reasons for discharge delays in teaching hospitals. Rev Saúde Pública. 2014;48(2):314-321. doi:10.1590/S0034-8910.2014048004971. PubMed
5. Greysen SR, Schiliro D, Horwitz LI, Curry L, Bradley EH. “Out of Sight, Out of Mind”: Housestaff Perceptions of Quality-Limiting Factors in Discharge Care at Teaching Hospitals. J Hosp Med Off Publ Soc Hosp Med. 2012;7(5):376-381. doi:10.1002/jhm.1928. PubMed
6. Goldman J, Reeves S, Wu R, Silver I, MacMillan K, Kitto S. Medical Residents and Interprofessional Interactions in Discharge: An Ethnographic Exploration of Factors That Affect Negotiation. J Gen Intern Med. 2015;30(10):1454-1460. doi:10.1007/s11606-015-3306-6. PubMed
7. Okoniewska B, Santana MJ, Groshaus H, et al. Barriers to discharge in an acute care medical teaching unit: a qualitative analysis of health providers’ perceptions. J Multidiscip Healthc. 2015;8:83-89. doi:10.2147/JMDH.S72633. PubMed
8. Carey MR, Sheth H, Scott Braithwaite R. A Prospective Study of Reasons for Prolonged Hospitalizations on a General Medicine Teaching Service. J Gen Intern Med. 2005;20(2):108-115. doi:10.1111/j.1525-1497.2005.40269.x. PubMed
9. Kim CS, Hart AL, Paretti RF, et al. Excess Hospitalization Days in an Academic Medical Center: Perceptions of Hospitalists and Discharge Planners. Am J Manag Care. 2011;17(2):e34-e42. http://www.ajmc.com/journals/issue/2011/2011-2-vol17-n2/AJMC_11feb_Kim_WebX_e34to42/. Accessed on October 26, 2016.
10. Gershengorn HB, Kocher R, Factor P. Management Strategies to Effect Change in Intensive Care Units: Lessons from the World of Business. Part II. Quality-Improvement Strategies. Ann Am Thorac Soc. 2014;11(3):444-453. doi:10.1513/AnnalsATS.201311-392AS. PubMed
11. Wertheimer B, Jacobs REA, Bailey M, et al. Discharge before noon: An achievable hospital goal. J Hosp Med. 2014;9(4):210-214. doi:10.1002/jhm.2154. PubMed
12. Manning DM, Tammel KJ, Blegen RN, et al. In-room display of day and time patient is anticipated to leave hospital: a “discharge appointment.” J Hosp Med. 2007;2(1):13-16. doi:10.1002/jhm.146. PubMed
13. Networks for academic medical centers. https://www.vizientinc.com/Our-networks/Networks-for-academic-medical-centers. Accessed on July 13, 2017.
14. Harris PA, Taylor R, Thielke R, Payne J, Gonzalez N, Conde JG. Research Electronic Data Capture (REDCap) - A metadata-driven methodology and workflow process for providing translational research informatics support. J Biomed Inform. 2009;42(2):377-381. doi:10.1016/j.jbi.2008.08.010. PubMed
15. Selker HP, Beshansky JR, Pauker SG, Kassirer JP. The epidemiology of delays in a teaching hospital. The development and use of a tool that detects unnecessary hospital days. Med Care. 1989;27(2):112-129. PubMed
© 2017 Society of Hospital Medicine
The Use of Clinical Decision Support in Reducing Diagnosis of and Treatment of Asymptomatic Bacteriuria
Reducing the treatment of asymptomatic bacteriuria (ASB), or isolation of bacteria from a urine specimen in a patient without urinary tract infection (UTI) symptoms, is a key goal of antibiotic stewardship programs.1 Treatment of ASB has been associated with the emergence of resistant organisms and subsequent UTI risk among women with recurrent UTI.2,3 The Infectious Diseases Society of America and the American Board of Internal Medicine Foundation’s Choosing Wisely campaign recommend against treating ASB, with the exception of pregnant patients and urogenital surgical patients.1,4
Obtaining urinalyses and urine cultures (UC) in asymptomatic patients may contribute to the unnecessary treatment of ASB. In a study of hospitalized patients, 62% received urinalysis testing, even though 82% of these patients did not have UTI symptoms.5 Of the patients found to have ASB, 30% were given antibiotics.5 Therefore, interventions aimed at reducing urine testing may reduce ASB treatment.
Electronic passive clinical decision support (CDS) alerts and electronic education may be effective interventions to reduce urine testing.6 While CDS tools are recommended in antibiotic stewardship guidelines,7 they have led to only modest improvements in appropriate antibiotic prescribing and are typically bundled with time-intensive educational interventions.8 Furthermore, most in-hospital interventions to decrease ASB treatment have focused on intensive care units (ICUs).9 We hypothesized that CDS and electronic education would decrease (1) urinalysis and UC ordering and (2) antibiotic orders for urinalyses and UCs in hospitalized adult patients.
METHODS
Population
We conducted a prospective time series analysis (preintervention: September 2014 to June 2015; postintervention: September 2015 to June 2016) at a large tertiary medical center. All hospitalized patients ≥18 years old were eligible except those admitted to services requiring specialized ASB management (eg, leukemia and lymphoma, solid organ transplant, and obstetrics).1 The study was declared quality improvement by the Johns Hopkins Institutional Review Board.
Intervention
In August 2015, we implemented a multifaceted intervention that included provider education and passive electronic CDS (supplementary Appendix 1 and supplementary Appendix 2). Materials were disseminated through hospital-wide computer workstation screensavers and a 1-page e-mailed newsletter to department of medicine clinicians. The CDS tool included simple informational messages recommending against urine testing without symptoms and against treating ASB; these messages accompanied electronic health record (EHR; Allscripts Sunrise Clinical Manager, Chicago, IL) orders for urinalysis, UC, and antibiotics commonly used within our institution to treat UTI (cefazolin, cephalexin, ceftriaxone, trimethoprim-sulfamethoxazole, nitrofurantoin, and ciprofloxacin). The information was displayed automatically when orders for these tests and antibiotics were selected; provider acknowledgment was not required to proceed.
Data Collection
The services within our hospital are geographically located. We collected orders for urinalysis, UC, and the associated antibiotics for all units except those housing patients excluded from our study. As the CDS tool appeared only in the inpatient EHR, only postadmission orders were included, excluding emergency department orders. For admissions with multiple urinalyses, urinalysis orders placed ≥72 hours apart were eligible. Only antibiotics ordered for ≥24 hours were included, excluding on-call and 1-time antibiotic orders.
Our approach to data collection attempted to model a clinician’s decision-making pathway from (1) ordering a urinalysis, to (2) ordering a UC in response to a urinalysis result, to (3) ordering antibiotics in response to a urinalysis or UC result. We focused on order placement rather than results to prioritize avoiding testing in asymptomatic patients, as our institution does not require positive urinalyses for UC testing (reflex testing). Urinalyses resulted within 1 to 2 hours, allowing for clinicians to quickly order UCs after urinalysis result review. Urinalysis and UC orders per monthly admissions were defined as (1) urinalyses, (2) UCs, (3) simultaneous urinalysis and UC (within 1 hour of each other), and (4) UCs ordered 1 to 24 hours after urinalysis. We also analyzed the following antibiotic orders per monthly admissions: (1) simultaneous urinalysis and antibiotic orders, (2) antibiotics ordered 1 to 24 hours after urinalysis order, and (3) antibiotics ordered within 24 hours of the UC result.
Outcome Measures
All outcome measures were calculated as the change over time per total monthly admissions in the preintervention and postintervention periods. In addition to symptoms, urinalysis is a critical, measurable early step in determining the presence of ASB. Therefore, the primary outcome measure was the postintervention change in monthly urinalysis orders, and the secondary outcome measure was the postintervention change in monthly UC orders. Additional outcome measures included monthly postintervention changes in (1) UC ordered 1 to 24 hours after urinalyses, (2) urinalyses and antibiotics ordered simultaneously, (3) antibiotic orders within 1 to 24 hours of urinalyses, and (4) antibiotics ordered within 24 hours of UC result.
Statistical Analysis
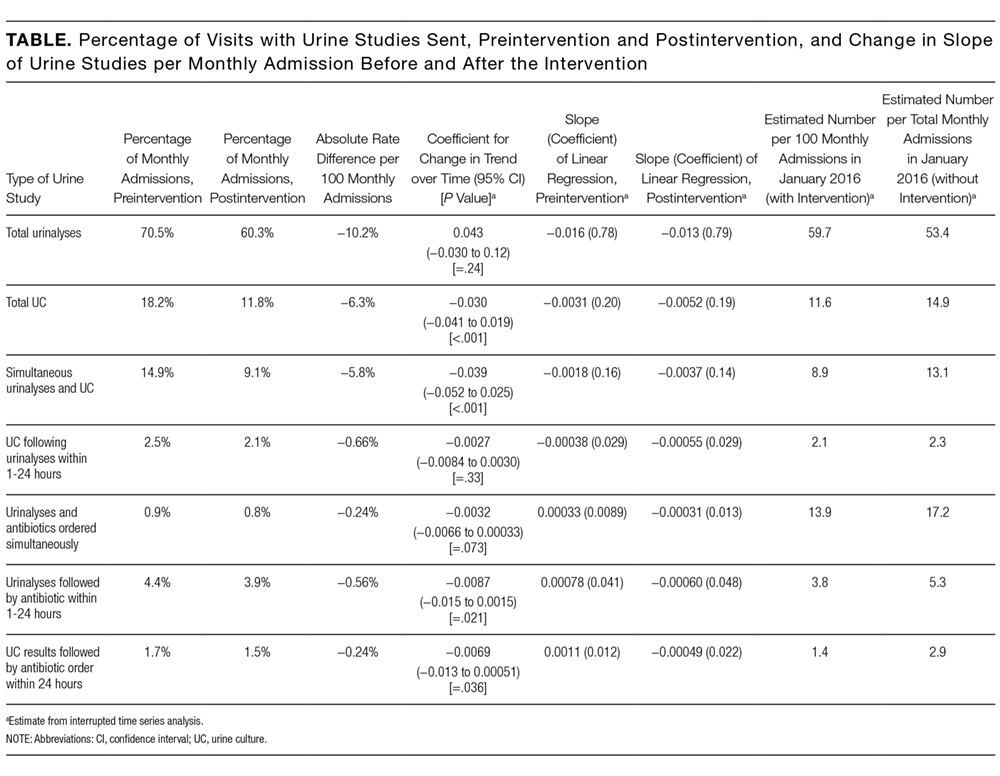
Statistical analyses were performed by using Stata (version 14.2; StataCorp LLC, College Station, TX). An interrupted time series analysis was performed to compare the change in orders per 100 monthly admissions in preintervention and postintervention periods. To do this, we created 2 separate segmented linear regression models for each dependent variable, pre- and postintervention. Normality was assumed because of large numbers. Rate differences per 100 monthly admissions are also calculated as the total number of orders divided by the total number of admissions in postintervention and preintervention periods with Mantel-Haenszel estimators. Differences were considered statistically significant at P ≤ .05.
RESULTS
DISCUSSION
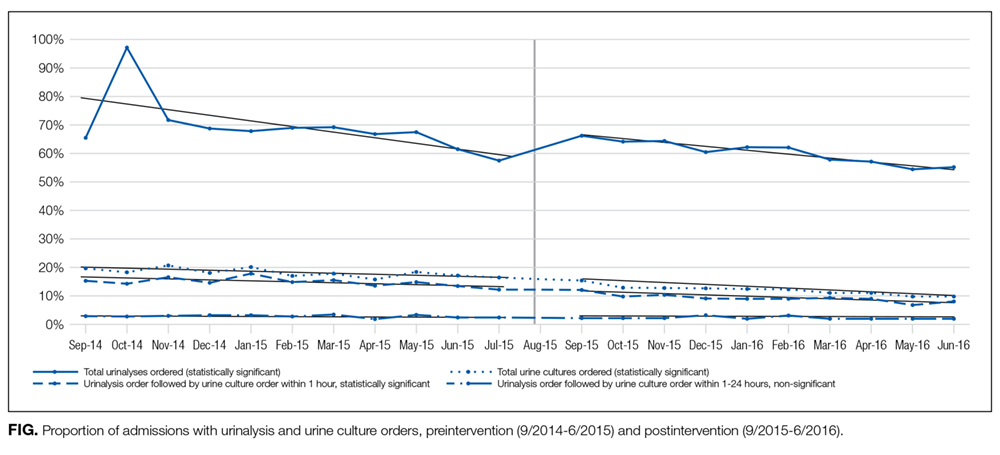
A multifaceted but simple bundle of CDS and provider education reduced UC testing but not urinalyses in a large tertiary care hospital. The bundle also reduced antibiotic ordering in response to urinalyses as well as antibiotic ordering in response to UC results.
Other in-hospital CDS tools to decrease ASB treatment have focused only on ICUs.9,10 Our intervention was evaluated hospital-wide and included urinalyses and UCs. Our intervention was clinician directed and not laboratory directed, such as a positive urinalysis reflexing to a UC. Simultaneous urinalysis and UC testing may lead to ASB treatment, as clinicians treat the positive UC and ignore the negative urinalysis.11,12 Therefore, we focused on UCs being sent in response to urinalyses.
We chose to focus on laboratory testing data instead of administrative diagnoses for UTI. The sensitivity of administrative data to determine similar conditions such as catheter-associated UTIs is low (0%).13
Our single-center study may not be generalizable to other settings. We did not include emergency department patients, as this location used a different EHR. In addition, given the 600,000 yearly hospital admissions, it was impractical to assess the appropriateness of each antibiotic-based documentation of symptoms. Instead of focusing on symptoms of ASB or UTI diagnoses, we focused on ordering urinalysis, UC, and antibiotics. In investigating the antibiotics most frequently used to treat UTI in our hospital, we may have both missed some patients who were treated with other antibiotics for ASB (eg, 4th generation cephalosporins, penicillins, carbapenems, etc) and captured patients receiving antibiotics for indications other than UTI (eg, pneumonia). In our focus on overall ordering practices across a hospital, we did not capture data on bladder catheterization status or the predominant organism seen in UC. At the time of the intervention, the laboratory did not have the resources for urinalysis testing reflexing to UC. However, our intervention did not prevent ordering simultaneous urinalysis and UC in symptomatic patients in general or urosepsis in particular. With only 12 total time points, the interrupted time series analysis may have been underpowered.14 We also do not know if the intervention’s effect would decay over time.
Although the intervention took very little staff time and resources, alert fatigue was a risk.15 We attempted to mitigate this alert fatigue by making the CDS passive (in the form of a brief informational message) with no provider action required. In conversations with providers in our institution, there has been dissatisfaction with alerts requiring action, as these are thought to be overly intrusive. We are also not clear on which element of the intervention bundle (ie, the CDS or the educational intervention) may have had more of an impact, as the elements of the intervention bundle were rolled out simultaneously. It is possible and even probable that both elements are needed to raise awareness of the problem. Also, as our EHR required all interventions to be rolled out hospital-wide simultaneously, we were unable to randomize certain floors or providers to the CDS portion of the intervention bundle. Other analyses including the type of hospital unit were beyond the scope of this brief report.
Our intervention bundle was associated with reduced UC orders and reduced antibiotics ordered after urinalyses. If a provider does not know there is bacteriuria, then the provider will not be tempted to order antibiotics. This easily implementable bundle may play an important role as an antimicrobial stewardship strategy for ASB.
Acknowledgments
The authors acknowledge the support of Erin Fanning, BS, and Angel Florentin, BS, in providing data for analysis. SCK received funding from the Johns Hopkins Institute for Clinical and Translational Research (ICTR), which is funded in part by grant number KL2TR001077 from the National Center for Advancing Translational Sciences (NCATS), a component of the National Institutes of Health (NIH), and the NIH Roadmap for Medical Research. These contents are solely the responsibility of the authors and do not necessarily represent the official view of the Johns Hopkins ICTR, NCATS, or NIH. We also acknowledge support from the Centers for Disease Control and Prevention’s Prevention Epicenter Program Q8377 (collaborative agreement U54 CK000447 to SEC). SEC has received support for consulting from Novartis and Theravance, and her institution has received a grant from Pfizer Grants for Learning and Change/The Joint Commission. This work was supported by the NIH T32 HL116275 to NC. The content is solely the responsibility of the authors and does not necessarily represent the official views of the NIH.
Disclosure
No conflicts of interest have been reported by any author.
1. Nicolle LE, Bradley S, Colgan R, et al. Infectious Diseases Society of America guidelines for the diagnosis and treatment of asymptomatic bacteriuria in adults. Clin Infect Dis. 2005;40(5):643-654. PubMed
2. Cai T, Mazzoli S, Mondaini N, et al. The role of asymptomatic bacteriuria in young women with recurrent urinary tract infections: to treat or not to treat? Clin Infect Dis. 2012;55(6):771-777. PubMed
3. Cai T, Nesi G, Mazzoli S, et al. Asymptomatic bacteriuria treatment is associated with a higher prevalence of antibiotic resistant strains in women with urinary tract infections. Clin Infect Dis. 2015;61(11):1655-1661. PubMed
4. Infectious Diseases Society of America. Choosing Wisely: Five Things Physicians and Patients Should Question. 2015. http://www.choosingwisely.org/societies/infectious-diseases-society-of-america/. Accessed on September 11, 2016.
5. Yin P, Kiss A, Leis JA. Urinalysis Orders Among Patients Admitted to the General Medicine Service. JAMA Intern Med. 2015;175(10):1711-1713. PubMed
6. McGregor JC, Weekes E, Forrest GN, et al. Impact of a computerized clinical decision support system on reducing inappropriate antimicrobial use: a randomized controlled trial. J Am Med Inform Assoc. 2006;13(4):378-384. PubMed
7. Barlam TF, Cosgrove SE, Abbo LM, et al. Implementing an Antibiotic Stewardship Program: Guidelines by the Infectious Diseases Society of America and the Society for Healthcare Epidemiology of America. Clin Infect Dis. 2016;62(10):e51-e77. PubMed
8. Gonzales R, Anderer T, McCulloch CE, et al. A cluster randomized trial of decision support strategies for reducing antibiotic use in acute bronchitis. JAMA Intern Med. 2013;173(4):267-273. PubMed
9. Sarg M, Waldrop GE, Beier MA, et al. Impact of Changes in Urine Culture Ordering Practice on Antimicrobial Utilization in Intensive Care Units at an Academic Medical Center. Infect Control Hosp Epidemiol. 2016;37(4):448-454. PubMed
10. Mehrotra A, Linder JA. Tipping the Balance Toward Fewer Antibiotics. JAMA Intern Med. 2016;176(11):1649-1650. PubMed
11. Leis JA, Gold WL, Daneman N, Shojania K, McGeer A. Downstream impact of urine cultures ordered without indication at two acute care teaching hospitals. Infect Control Hosp Epidemiol. 2013;34(10):1113-1114. PubMed
12. Stagg A, Lutz H, Kirpalaney S, et al. Impact of two-step urine culture ordering in the emergency department: a time series analysis. BMJ Qual Saf. 2017. doi:10.1136/bmjqs-2016-006250. PubMed
13. Cass AL, Kelly JW, Probst JC, Addy CL, McKeown RE. Identification of device-associated infections utilizing administrative data. Am J Infect Control. 2013;41(12):1195-1199. PubMed
14. Zhang F, Wagner AK, Ross-Degnan D. Simulation-based power calculation for designing interrupted time series analyses of health policy interventions. J Clin Epidemiol. 2011;64(11):1252-1261. PubMed
15. Embi PJ, Leonard AC. Evaluating alert fatigue over time to EHR-based clinical trial alerts: findings from a randomized controlled study. J Am Med Inform Assoc. 2012;19(e1):e145-e148. PubMed
Reducing the treatment of asymptomatic bacteriuria (ASB), or isolation of bacteria from a urine specimen in a patient without urinary tract infection (UTI) symptoms, is a key goal of antibiotic stewardship programs.1 Treatment of ASB has been associated with the emergence of resistant organisms and subsequent UTI risk among women with recurrent UTI.2,3 The Infectious Diseases Society of America and the American Board of Internal Medicine Foundation’s Choosing Wisely campaign recommend against treating ASB, with the exception of pregnant patients and urogenital surgical patients.1,4
Obtaining urinalyses and urine cultures (UC) in asymptomatic patients may contribute to the unnecessary treatment of ASB. In a study of hospitalized patients, 62% received urinalysis testing, even though 82% of these patients did not have UTI symptoms.5 Of the patients found to have ASB, 30% were given antibiotics.5 Therefore, interventions aimed at reducing urine testing may reduce ASB treatment.
Electronic passive clinical decision support (CDS) alerts and electronic education may be effective interventions to reduce urine testing.6 While CDS tools are recommended in antibiotic stewardship guidelines,7 they have led to only modest improvements in appropriate antibiotic prescribing and are typically bundled with time-intensive educational interventions.8 Furthermore, most in-hospital interventions to decrease ASB treatment have focused on intensive care units (ICUs).9 We hypothesized that CDS and electronic education would decrease (1) urinalysis and UC ordering and (2) antibiotic orders for urinalyses and UCs in hospitalized adult patients.
METHODS
Population
We conducted a prospective time series analysis (preintervention: September 2014 to June 2015; postintervention: September 2015 to June 2016) at a large tertiary medical center. All hospitalized patients ≥18 years old were eligible except those admitted to services requiring specialized ASB management (eg, leukemia and lymphoma, solid organ transplant, and obstetrics).1 The study was declared quality improvement by the Johns Hopkins Institutional Review Board.
Intervention
In August 2015, we implemented a multifaceted intervention that included provider education and passive electronic CDS (supplementary Appendix 1 and supplementary Appendix 2). Materials were disseminated through hospital-wide computer workstation screensavers and a 1-page e-mailed newsletter to department of medicine clinicians. The CDS tool included simple informational messages recommending against urine testing without symptoms and against treating ASB; these messages accompanied electronic health record (EHR; Allscripts Sunrise Clinical Manager, Chicago, IL) orders for urinalysis, UC, and antibiotics commonly used within our institution to treat UTI (cefazolin, cephalexin, ceftriaxone, trimethoprim-sulfamethoxazole, nitrofurantoin, and ciprofloxacin). The information was displayed automatically when orders for these tests and antibiotics were selected; provider acknowledgment was not required to proceed.
Data Collection
The services within our hospital are geographically located. We collected orders for urinalysis, UC, and the associated antibiotics for all units except those housing patients excluded from our study. As the CDS tool appeared only in the inpatient EHR, only postadmission orders were included, excluding emergency department orders. For admissions with multiple urinalyses, urinalysis orders placed ≥72 hours apart were eligible. Only antibiotics ordered for ≥24 hours were included, excluding on-call and 1-time antibiotic orders.
Our approach to data collection attempted to model a clinician’s decision-making pathway from (1) ordering a urinalysis, to (2) ordering a UC in response to a urinalysis result, to (3) ordering antibiotics in response to a urinalysis or UC result. We focused on order placement rather than results to prioritize avoiding testing in asymptomatic patients, as our institution does not require positive urinalyses for UC testing (reflex testing). Urinalyses resulted within 1 to 2 hours, allowing for clinicians to quickly order UCs after urinalysis result review. Urinalysis and UC orders per monthly admissions were defined as (1) urinalyses, (2) UCs, (3) simultaneous urinalysis and UC (within 1 hour of each other), and (4) UCs ordered 1 to 24 hours after urinalysis. We also analyzed the following antibiotic orders per monthly admissions: (1) simultaneous urinalysis and antibiotic orders, (2) antibiotics ordered 1 to 24 hours after urinalysis order, and (3) antibiotics ordered within 24 hours of the UC result.
Outcome Measures
All outcome measures were calculated as the change over time per total monthly admissions in the preintervention and postintervention periods. In addition to symptoms, urinalysis is a critical, measurable early step in determining the presence of ASB. Therefore, the primary outcome measure was the postintervention change in monthly urinalysis orders, and the secondary outcome measure was the postintervention change in monthly UC orders. Additional outcome measures included monthly postintervention changes in (1) UC ordered 1 to 24 hours after urinalyses, (2) urinalyses and antibiotics ordered simultaneously, (3) antibiotic orders within 1 to 24 hours of urinalyses, and (4) antibiotics ordered within 24 hours of UC result.
Statistical Analysis
Statistical analyses were performed by using Stata (version 14.2; StataCorp LLC, College Station, TX). An interrupted time series analysis was performed to compare the change in orders per 100 monthly admissions in preintervention and postintervention periods. To do this, we created 2 separate segmented linear regression models for each dependent variable, pre- and postintervention. Normality was assumed because of large numbers. Rate differences per 100 monthly admissions are also calculated as the total number of orders divided by the total number of admissions in postintervention and preintervention periods with Mantel-Haenszel estimators. Differences were considered statistically significant at P ≤ .05.
RESULTS
DISCUSSION
A multifaceted but simple bundle of CDS and provider education reduced UC testing but not urinalyses in a large tertiary care hospital. The bundle also reduced antibiotic ordering in response to urinalyses as well as antibiotic ordering in response to UC results.
Other in-hospital CDS tools to decrease ASB treatment have focused only on ICUs.9,10 Our intervention was evaluated hospital-wide and included urinalyses and UCs. Our intervention was clinician directed and not laboratory directed, such as a positive urinalysis reflexing to a UC. Simultaneous urinalysis and UC testing may lead to ASB treatment, as clinicians treat the positive UC and ignore the negative urinalysis.11,12 Therefore, we focused on UCs being sent in response to urinalyses.
We chose to focus on laboratory testing data instead of administrative diagnoses for UTI. The sensitivity of administrative data to determine similar conditions such as catheter-associated UTIs is low (0%).13
Our single-center study may not be generalizable to other settings. We did not include emergency department patients, as this location used a different EHR. In addition, given the 600,000 yearly hospital admissions, it was impractical to assess the appropriateness of each antibiotic-based documentation of symptoms. Instead of focusing on symptoms of ASB or UTI diagnoses, we focused on ordering urinalysis, UC, and antibiotics. In investigating the antibiotics most frequently used to treat UTI in our hospital, we may have both missed some patients who were treated with other antibiotics for ASB (eg, 4th generation cephalosporins, penicillins, carbapenems, etc) and captured patients receiving antibiotics for indications other than UTI (eg, pneumonia). In our focus on overall ordering practices across a hospital, we did not capture data on bladder catheterization status or the predominant organism seen in UC. At the time of the intervention, the laboratory did not have the resources for urinalysis testing reflexing to UC. However, our intervention did not prevent ordering simultaneous urinalysis and UC in symptomatic patients in general or urosepsis in particular. With only 12 total time points, the interrupted time series analysis may have been underpowered.14 We also do not know if the intervention’s effect would decay over time.
Although the intervention took very little staff time and resources, alert fatigue was a risk.15 We attempted to mitigate this alert fatigue by making the CDS passive (in the form of a brief informational message) with no provider action required. In conversations with providers in our institution, there has been dissatisfaction with alerts requiring action, as these are thought to be overly intrusive. We are also not clear on which element of the intervention bundle (ie, the CDS or the educational intervention) may have had more of an impact, as the elements of the intervention bundle were rolled out simultaneously. It is possible and even probable that both elements are needed to raise awareness of the problem. Also, as our EHR required all interventions to be rolled out hospital-wide simultaneously, we were unable to randomize certain floors or providers to the CDS portion of the intervention bundle. Other analyses including the type of hospital unit were beyond the scope of this brief report.
Our intervention bundle was associated with reduced UC orders and reduced antibiotics ordered after urinalyses. If a provider does not know there is bacteriuria, then the provider will not be tempted to order antibiotics. This easily implementable bundle may play an important role as an antimicrobial stewardship strategy for ASB.
Acknowledgments
The authors acknowledge the support of Erin Fanning, BS, and Angel Florentin, BS, in providing data for analysis. SCK received funding from the Johns Hopkins Institute for Clinical and Translational Research (ICTR), which is funded in part by grant number KL2TR001077 from the National Center for Advancing Translational Sciences (NCATS), a component of the National Institutes of Health (NIH), and the NIH Roadmap for Medical Research. These contents are solely the responsibility of the authors and do not necessarily represent the official view of the Johns Hopkins ICTR, NCATS, or NIH. We also acknowledge support from the Centers for Disease Control and Prevention’s Prevention Epicenter Program Q8377 (collaborative agreement U54 CK000447 to SEC). SEC has received support for consulting from Novartis and Theravance, and her institution has received a grant from Pfizer Grants for Learning and Change/The Joint Commission. This work was supported by the NIH T32 HL116275 to NC. The content is solely the responsibility of the authors and does not necessarily represent the official views of the NIH.
Disclosure
No conflicts of interest have been reported by any author.
1. Nicolle LE, Bradley S, Colgan R, et al. Infectious Diseases Society of America guidelines for the diagnosis and treatment of asymptomatic bacteriuria in adults. Clin Infect Dis. 2005;40(5):643-654. PubMed
2. Cai T, Mazzoli S, Mondaini N, et al. The role of asymptomatic bacteriuria in young women with recurrent urinary tract infections: to treat or not to treat? Clin Infect Dis. 2012;55(6):771-777. PubMed
3. Cai T, Nesi G, Mazzoli S, et al. Asymptomatic bacteriuria treatment is associated with a higher prevalence of antibiotic resistant strains in women with urinary tract infections. Clin Infect Dis. 2015;61(11):1655-1661. PubMed
4. Infectious Diseases Society of America. Choosing Wisely: Five Things Physicians and Patients Should Question. 2015. http://www.choosingwisely.org/societies/infectious-diseases-society-of-america/. Accessed on September 11, 2016.
5. Yin P, Kiss A, Leis JA. Urinalysis Orders Among Patients Admitted to the General Medicine Service. JAMA Intern Med. 2015;175(10):1711-1713. PubMed
6. McGregor JC, Weekes E, Forrest GN, et al. Impact of a computerized clinical decision support system on reducing inappropriate antimicrobial use: a randomized controlled trial. J Am Med Inform Assoc. 2006;13(4):378-384. PubMed
7. Barlam TF, Cosgrove SE, Abbo LM, et al. Implementing an Antibiotic Stewardship Program: Guidelines by the Infectious Diseases Society of America and the Society for Healthcare Epidemiology of America. Clin Infect Dis. 2016;62(10):e51-e77. PubMed
8. Gonzales R, Anderer T, McCulloch CE, et al. A cluster randomized trial of decision support strategies for reducing antibiotic use in acute bronchitis. JAMA Intern Med. 2013;173(4):267-273. PubMed
9. Sarg M, Waldrop GE, Beier MA, et al. Impact of Changes in Urine Culture Ordering Practice on Antimicrobial Utilization in Intensive Care Units at an Academic Medical Center. Infect Control Hosp Epidemiol. 2016;37(4):448-454. PubMed
10. Mehrotra A, Linder JA. Tipping the Balance Toward Fewer Antibiotics. JAMA Intern Med. 2016;176(11):1649-1650. PubMed
11. Leis JA, Gold WL, Daneman N, Shojania K, McGeer A. Downstream impact of urine cultures ordered without indication at two acute care teaching hospitals. Infect Control Hosp Epidemiol. 2013;34(10):1113-1114. PubMed
12. Stagg A, Lutz H, Kirpalaney S, et al. Impact of two-step urine culture ordering in the emergency department: a time series analysis. BMJ Qual Saf. 2017. doi:10.1136/bmjqs-2016-006250. PubMed
13. Cass AL, Kelly JW, Probst JC, Addy CL, McKeown RE. Identification of device-associated infections utilizing administrative data. Am J Infect Control. 2013;41(12):1195-1199. PubMed
14. Zhang F, Wagner AK, Ross-Degnan D. Simulation-based power calculation for designing interrupted time series analyses of health policy interventions. J Clin Epidemiol. 2011;64(11):1252-1261. PubMed
15. Embi PJ, Leonard AC. Evaluating alert fatigue over time to EHR-based clinical trial alerts: findings from a randomized controlled study. J Am Med Inform Assoc. 2012;19(e1):e145-e148. PubMed
© 2017 Society of Hospital Medicine
A Randomized Cohort Controlled Trial to Compare Intern Sign-Out Training Interventions
Patient sign-outs are defined as the transition of patient care that includes the transfer of information, task accountability, and personal responsibility between providers.1-3 The adoption of mnemonics as a memory aid has been used to improve the transfer of patient information between providers.4 In the transfer of task accountability, providers transfer follow-up tasks to on-call or coverage providers and ensure that directives are understood. Joint task accountability is enhanced through collaborative giving and cross-checking of information received through assertive questioning to detect errors, and it also enables the receiver to codevelop an understanding of a patient’s condition.5-8 In the transfer of personal responsibility for the primary team’s patients, the provision of anticipatory guidance enables the coverage provider to have prospective information about potential, upcoming issues to facilitate care plans.6 Enabling coverage providers to anticipate overnight events helps them exercise responsibility for patients who are under their temporary care.2
The Accreditation Council for Graduate Medical Education requires residency programs to provide formal instruction on sign-outs.9 Yet, variability across training programs exists,8,10 with training emphasis on the transfer of information over accountability or responsibility.11 Previous studies have demonstrated the efficacy of sign-out training, such as the illness severity, patient summary, action list, situation awareness and contingency planning, and synthesis by reviewer (I-PASS) bundle.3 Yet, participation is far from 100% because the I-PASS bundle requires in-person workshops, e-learning platforms, organizational change campaigns, and faculty participation,12 involving resource and time commitments that few programs can afford. To address this issue, we seek to compare resource-efficient, knowledge-based, skill-based, compliance-based, and learner-initiated sign-out training pedagogies. We focused on the evening sign-out because it is a high-risk period when care for inpatients is transferred to smaller coverage intern teams.
METHODS
Setting and Study Design
A prospective, randomized cohort trial of 4 training interventions was conducted at an internal medicine residency program at a Mid-Atlantic, academic, tertiary-care hospital with 1192 inpatient beds. The 52 interns admitted to the program were randomly assigned to 4 firms caring for up to 25 inpatients on each floor of the hospital. The case mix faced by each firm was similar because patients were randomly assigned to firms based on bed availability. Teams of 5 interns in each firm worked in 5-day duty cycles, during which each intern rotated as a night cover for his or her firm. Interns remain in their firm throughout their residency. Sign-outs were conducted face to face with a computer. Receivers printed sign-out sheets populated with patient information and took notes when senders communicated information from the computer. The hospital’s institutional review board approved this study.
Interventions
The firms were randomly assigned to 1 of 4 one-hour quality-improvement training interventions delivered at the same time and day in November 2014 at each firm’s office, located on different floors of the hospital. There was virtually no cross-talk among the firms in the first year, which ensured the integrity of the cohort randomization and interventions. Faculty from an affiliated business school of the academic center worked with attending physicians to train the firms.
All interventions took 1 hour at noontime. Firm 1 (the control) received a didactic lecture on sign-out, which participants heard during orientation. Repeating that lecture reinforced their knowledge of sign-outs. Firm 2 was trained on the I-PASS mnemonic with a predictable progression of information elements to transfer.3,12 Interns role-played 3 scenarios to practice sign-out.3 They received skills feedback and a debriefing to link I-PASS with information elements to transfer. Firm 3 was dealt a policy mandate by the interns’ attending physician to perform specific tasks at sign-out. Senders were to provide the night cover with to-do tasks, and receivers were to actively discuss and verify these tasks to ensure task accountability.13 Firm 4 was trained on a Plan-Do-Study-Act (PDSA) protocol to identify and solve perceived barriers to sign-outs. Firm 4 agreed to solve the problem of the lack of care plans by the day team to the night cover. An ad hoc team in Firm 4 refined, pilot tested, and rolled out the solution within a month. Its protocol emphasized information on anticipated changes in patient status, providing contingency plans and their rationale as well as discussions to clarify care plans. Details of the 4 interventions are shown in the Table.
Data Collection Process
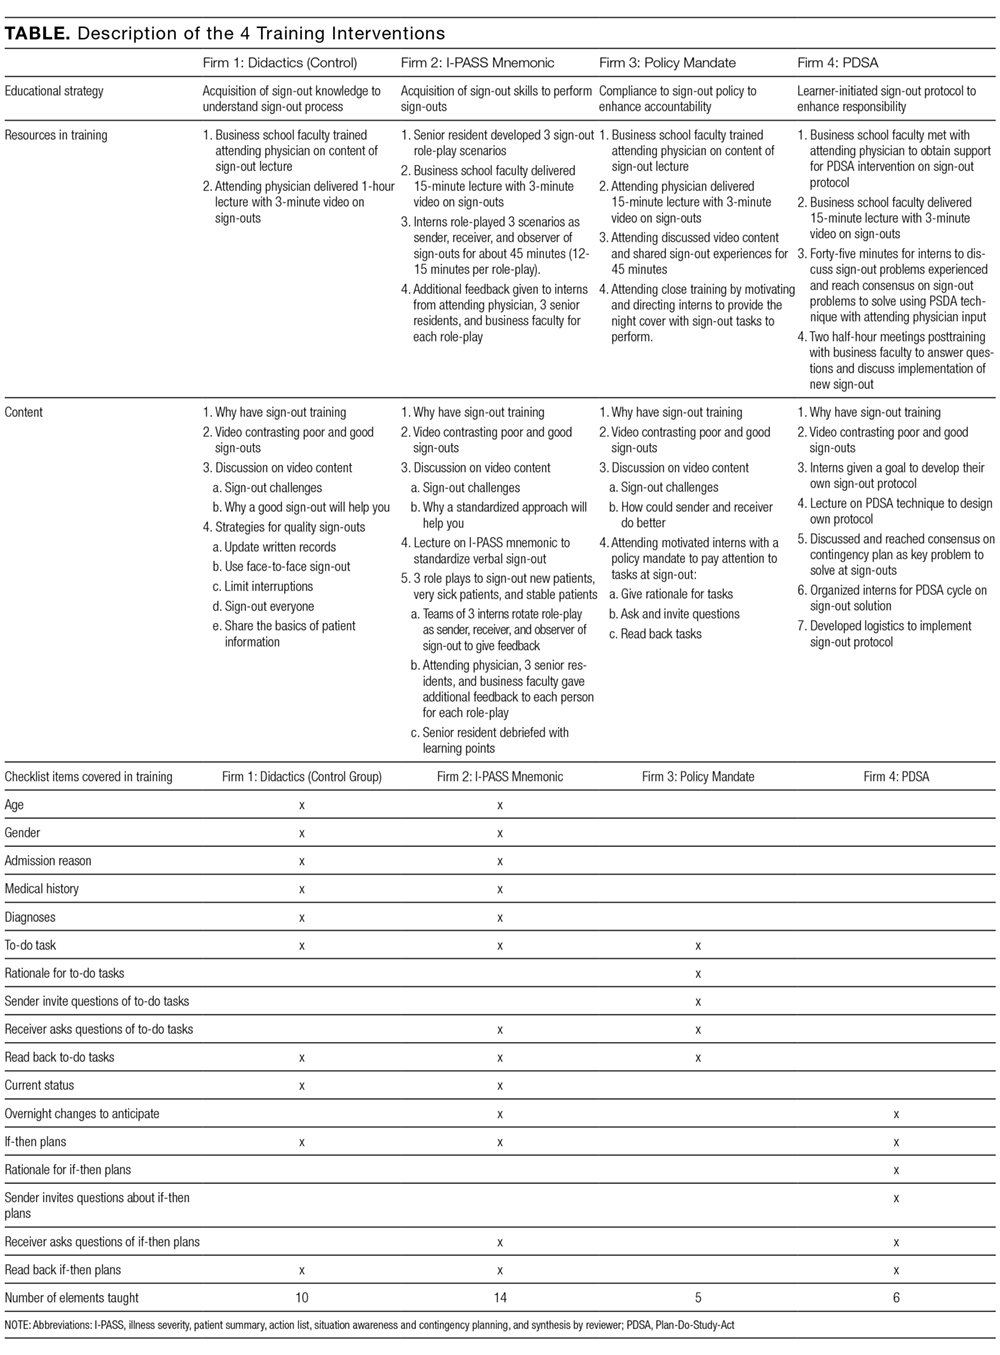
Outcomes
We measured improvements in sign-out quality by the mean percentage differences for each of the 3 dimensions of sign-out, as well as a multidimensional measure of sign-out comprising the 3 dimensions for each firm in 2 ways: (1) pre- and postintervention, and (2) vis-à-vis the control group postintervention.
Statistical Analysis
We factor analyzed the 17 sign-out elements using principal components analysis with varimax rotation to confirm their groupings within the 3 dimensions of sign-out using Statistical Package for the Social Sciences (SPSS) version 24 (IBM, North Castle, NY). We calculated the mean percentage differences and used Student t tests to evaluate statistical differences at P < 0.05.
RESULTS
Five hundred and sixty-three patient sign-outs were observed prior to the training interventions (κ = 0.646), and 620 patient sign-outs were observed after the interventions (κ = 0.648). Kappa values derived from SPSS were within acceptable interrater agreement ranges. Factor analysis of the 17 sign-out elements yielded 3 factors that we named patient information, task accountability, and responsibility, as shown in the supporting Table.
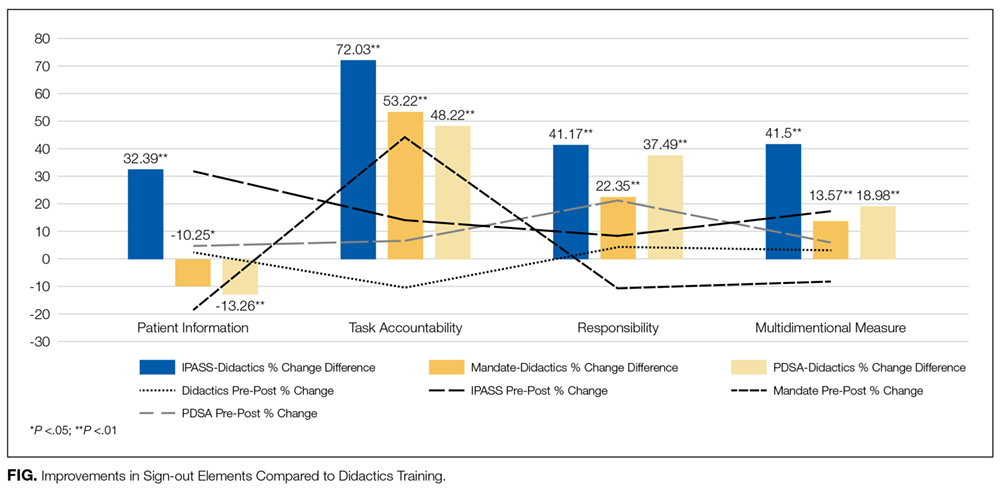
DISCUSSION
The results indicated that after only 1 hour of training, skill-based, compliance-based, and learner-initiated sign-out training improved sign-out quality beyond knowledge-based didactics even though the number of sign-out elements taught in the latter 2 was lower than in the didactics group. Different training emphases influenced different dimensions of sign-out quality so that training interns to focus on task accountability or responsibility led to improvements in those dimensions only. The lower scores in other dimensions suggest potential risks in sign-out quality from focusing attention on 1 dimension at the expense of other dimensions. I-PASS, which covered the most sign-out elements and utilized 5 facilitators, led to the best overall improvement in sign-out quality, which is consistent with previous studies.3,12 We demonstrated that only 1 hour of training on the I-PASS mnemonics using video, role-playing, and feedback led to significant improvements. This approach is portable and easily applied to any program. Potential improvements in I-PASS training could be obtained by emphasizing task accountability and responsibility because the mandate and PDSA groups obtained higher scores than the I-PASS group in these dimensions.
Limitations
We measured sign-out quality in the evening at this site because it was at greatest risk for errors. Future studies should consider daytime sign-outs, interunit handoffs, and other hospital settings, such as community or rural hospitals and nonacute patient settings, to ascertain generalizability. Data were collected from observations, so Hawthorne effects may introduce bias. However, we believe that using a standardized checklist, a control group, and assessing relative changes minimized this risk. Although we observed almost 1200 patient sign-outs over 80 shift changes, we were not able to observe every intern in every firm. Finally, no sentinel events were reported during the study period, and we did not include other measures of clinical outcomes, which represent an opportunity for future researchers to test which specific sign-out elements or dimensions are related to clinical outcomes or are relevant to specific patient types.
CONCLUSION
The results of this study indicate that 1 hour of formal training can improve sign-out quality. Program directors should consider including I-PASS with additional focus on task accountability and personal responsibility in their sign-out training plans.
Disclosure
The authors have nothing to disclose.
1. Darbyshire D, Gordon M, Baker P. Teaching handover of care to medical students. Clin Teach. 2013;10:32-37. PubMed
2. Lee SH, Phan PH, Dorman T, Weaver SJ, Pronovost PJ. Handoffs, safety culture, and practices: evidence from the hospital survey on patient safety culture. BMJ Health Serv Res. 2016;16:254. DOI 10.1186/s12913-016-1502-7. PubMed
3. Starmer AJ, O’Toole JK, Rosenbluth G, et al. Development, implementation, and dissemination of the I-PASS handoff curriculum: a multisite educational intervention to improve patient handoffs. Acad Med. 2014:89:876-884. PubMed
4. Riesenberg LA, Leitzsch J, Little BW. Systematic review of handoff mnemonics literature. Am J Med Qual. 2009;24:196-204. PubMed
5. Cohen MD, Hilligoss B, Kajdacsy-Balla A. A handoff is not a telegram: an understanding of the patient is co-constructed. Crit Care. 2012;16:303. PubMed
6. McMullan A, Parush A, Momtahan K. Transferring patient care: patterns of synchronous bidisciplinary communication between physicians and nurses during handoffs in a critical care unit. J Perianesth Nurs. 2015;30:92-104. PubMed
7. Rayo MF, Mount-Campbell AF, O’Brien JM, et al. Interactive questioning in critical care during handovers: a transcript analysis of communication behaviours by physicians, nurses and nurse practitioners. BMJ Qual Saf. 2014;23:483-489. PubMed
8. Gordon M, Findley R. Educational interventions to improve handover in health care: a systematic review. Med Educ. 2011;45:1081-1089. PubMed
9. Nasca TJ, Day SH, Amis ES Jr; ACGME Duty Hour Task Force. The new recommendations on duty hours from the ACGME Task Force. N Engl J Med. 2010;363:e3. PubMed
10. Wohlauer MV, Arora VM, Horwitz LI, et al. The patient handoff: a comprehensive curricular blueprint for resident education to improve continuity of care. Acad Med. 2012;87:411-418. PubMed
11. Riesenberg LA, Leitzsch J, Massucci JL, et al. Residents’ and attending physicians’ handoffs: a systematic review of the literature. Acad Med. 2009;84:1775-1787. PubMed
12. Huth K, Hart F, Moreau K, et al. Real-world implementation of a standardized handover program (I-PASS) on a pediatric clinical teaching unit. Acad Ped. 2016;16:532-539. PubMed
13. Jonas E, Schulz-Hardt S, Frey D, Thelen N. Confirmation bias in sequential information search after preliminary decisions: An expansion of dissonance theoretical research on selective exposure to information. J Per Soc Psy. 2001;80:557-571. PubMed
14. Joint Commission. Improving handoff communications: Meeting national patient safety goal 2E. Jt Pers Patient Saf. 2006;6:9-15.
15. Improving Hand-off Communication. Joint Commission Resources. 2007. PubMed
Patient sign-outs are defined as the transition of patient care that includes the transfer of information, task accountability, and personal responsibility between providers.1-3 The adoption of mnemonics as a memory aid has been used to improve the transfer of patient information between providers.4 In the transfer of task accountability, providers transfer follow-up tasks to on-call or coverage providers and ensure that directives are understood. Joint task accountability is enhanced through collaborative giving and cross-checking of information received through assertive questioning to detect errors, and it also enables the receiver to codevelop an understanding of a patient’s condition.5-8 In the transfer of personal responsibility for the primary team’s patients, the provision of anticipatory guidance enables the coverage provider to have prospective information about potential, upcoming issues to facilitate care plans.6 Enabling coverage providers to anticipate overnight events helps them exercise responsibility for patients who are under their temporary care.2
The Accreditation Council for Graduate Medical Education requires residency programs to provide formal instruction on sign-outs.9 Yet, variability across training programs exists,8,10 with training emphasis on the transfer of information over accountability or responsibility.11 Previous studies have demonstrated the efficacy of sign-out training, such as the illness severity, patient summary, action list, situation awareness and contingency planning, and synthesis by reviewer (I-PASS) bundle.3 Yet, participation is far from 100% because the I-PASS bundle requires in-person workshops, e-learning platforms, organizational change campaigns, and faculty participation,12 involving resource and time commitments that few programs can afford. To address this issue, we seek to compare resource-efficient, knowledge-based, skill-based, compliance-based, and learner-initiated sign-out training pedagogies. We focused on the evening sign-out because it is a high-risk period when care for inpatients is transferred to smaller coverage intern teams.
METHODS
Setting and Study Design
A prospective, randomized cohort trial of 4 training interventions was conducted at an internal medicine residency program at a Mid-Atlantic, academic, tertiary-care hospital with 1192 inpatient beds. The 52 interns admitted to the program were randomly assigned to 4 firms caring for up to 25 inpatients on each floor of the hospital. The case mix faced by each firm was similar because patients were randomly assigned to firms based on bed availability. Teams of 5 interns in each firm worked in 5-day duty cycles, during which each intern rotated as a night cover for his or her firm. Interns remain in their firm throughout their residency. Sign-outs were conducted face to face with a computer. Receivers printed sign-out sheets populated with patient information and took notes when senders communicated information from the computer. The hospital’s institutional review board approved this study.
Interventions
The firms were randomly assigned to 1 of 4 one-hour quality-improvement training interventions delivered at the same time and day in November 2014 at each firm’s office, located on different floors of the hospital. There was virtually no cross-talk among the firms in the first year, which ensured the integrity of the cohort randomization and interventions. Faculty from an affiliated business school of the academic center worked with attending physicians to train the firms.
All interventions took 1 hour at noontime. Firm 1 (the control) received a didactic lecture on sign-out, which participants heard during orientation. Repeating that lecture reinforced their knowledge of sign-outs. Firm 2 was trained on the I-PASS mnemonic with a predictable progression of information elements to transfer.3,12 Interns role-played 3 scenarios to practice sign-out.3 They received skills feedback and a debriefing to link I-PASS with information elements to transfer. Firm 3 was dealt a policy mandate by the interns’ attending physician to perform specific tasks at sign-out. Senders were to provide the night cover with to-do tasks, and receivers were to actively discuss and verify these tasks to ensure task accountability.13 Firm 4 was trained on a Plan-Do-Study-Act (PDSA) protocol to identify and solve perceived barriers to sign-outs. Firm 4 agreed to solve the problem of the lack of care plans by the day team to the night cover. An ad hoc team in Firm 4 refined, pilot tested, and rolled out the solution within a month. Its protocol emphasized information on anticipated changes in patient status, providing contingency plans and their rationale as well as discussions to clarify care plans. Details of the 4 interventions are shown in the Table.
Data Collection Process
Outcomes
We measured improvements in sign-out quality by the mean percentage differences for each of the 3 dimensions of sign-out, as well as a multidimensional measure of sign-out comprising the 3 dimensions for each firm in 2 ways: (1) pre- and postintervention, and (2) vis-à-vis the control group postintervention.
Statistical Analysis
We factor analyzed the 17 sign-out elements using principal components analysis with varimax rotation to confirm their groupings within the 3 dimensions of sign-out using Statistical Package for the Social Sciences (SPSS) version 24 (IBM, North Castle, NY). We calculated the mean percentage differences and used Student t tests to evaluate statistical differences at P < 0.05.
RESULTS
Five hundred and sixty-three patient sign-outs were observed prior to the training interventions (κ = 0.646), and 620 patient sign-outs were observed after the interventions (κ = 0.648). Kappa values derived from SPSS were within acceptable interrater agreement ranges. Factor analysis of the 17 sign-out elements yielded 3 factors that we named patient information, task accountability, and responsibility, as shown in the supporting Table.
DISCUSSION
The results indicated that after only 1 hour of training, skill-based, compliance-based, and learner-initiated sign-out training improved sign-out quality beyond knowledge-based didactics even though the number of sign-out elements taught in the latter 2 was lower than in the didactics group. Different training emphases influenced different dimensions of sign-out quality so that training interns to focus on task accountability or responsibility led to improvements in those dimensions only. The lower scores in other dimensions suggest potential risks in sign-out quality from focusing attention on 1 dimension at the expense of other dimensions. I-PASS, which covered the most sign-out elements and utilized 5 facilitators, led to the best overall improvement in sign-out quality, which is consistent with previous studies.3,12 We demonstrated that only 1 hour of training on the I-PASS mnemonics using video, role-playing, and feedback led to significant improvements. This approach is portable and easily applied to any program. Potential improvements in I-PASS training could be obtained by emphasizing task accountability and responsibility because the mandate and PDSA groups obtained higher scores than the I-PASS group in these dimensions.
Limitations
We measured sign-out quality in the evening at this site because it was at greatest risk for errors. Future studies should consider daytime sign-outs, interunit handoffs, and other hospital settings, such as community or rural hospitals and nonacute patient settings, to ascertain generalizability. Data were collected from observations, so Hawthorne effects may introduce bias. However, we believe that using a standardized checklist, a control group, and assessing relative changes minimized this risk. Although we observed almost 1200 patient sign-outs over 80 shift changes, we were not able to observe every intern in every firm. Finally, no sentinel events were reported during the study period, and we did not include other measures of clinical outcomes, which represent an opportunity for future researchers to test which specific sign-out elements or dimensions are related to clinical outcomes or are relevant to specific patient types.
CONCLUSION
The results of this study indicate that 1 hour of formal training can improve sign-out quality. Program directors should consider including I-PASS with additional focus on task accountability and personal responsibility in their sign-out training plans.
Disclosure
The authors have nothing to disclose.
1. Darbyshire D, Gordon M, Baker P. Teaching handover of care to medical students. Clin Teach. 2013;10:32-37. PubMed
2. Lee SH, Phan PH, Dorman T, Weaver SJ, Pronovost PJ. Handoffs, safety culture, and practices: evidence from the hospital survey on patient safety culture. BMJ Health Serv Res. 2016;16:254. DOI 10.1186/s12913-016-1502-7. PubMed
3. Starmer AJ, O’Toole JK, Rosenbluth G, et al. Development, implementation, and dissemination of the I-PASS handoff curriculum: a multisite educational intervention to improve patient handoffs. Acad Med. 2014:89:876-884. PubMed
4. Riesenberg LA, Leitzsch J, Little BW. Systematic review of handoff mnemonics literature. Am J Med Qual. 2009;24:196-204. PubMed
5. Cohen MD, Hilligoss B, Kajdacsy-Balla A. A handoff is not a telegram: an understanding of the patient is co-constructed. Crit Care. 2012;16:303. PubMed
6. McMullan A, Parush A, Momtahan K. Transferring patient care: patterns of synchronous bidisciplinary communication between physicians and nurses during handoffs in a critical care unit. J Perianesth Nurs. 2015;30:92-104. PubMed
7. Rayo MF, Mount-Campbell AF, O’Brien JM, et al. Interactive questioning in critical care during handovers: a transcript analysis of communication behaviours by physicians, nurses and nurse practitioners. BMJ Qual Saf. 2014;23:483-489. PubMed
8. Gordon M, Findley R. Educational interventions to improve handover in health care: a systematic review. Med Educ. 2011;45:1081-1089. PubMed
9. Nasca TJ, Day SH, Amis ES Jr; ACGME Duty Hour Task Force. The new recommendations on duty hours from the ACGME Task Force. N Engl J Med. 2010;363:e3. PubMed
10. Wohlauer MV, Arora VM, Horwitz LI, et al. The patient handoff: a comprehensive curricular blueprint for resident education to improve continuity of care. Acad Med. 2012;87:411-418. PubMed
11. Riesenberg LA, Leitzsch J, Massucci JL, et al. Residents’ and attending physicians’ handoffs: a systematic review of the literature. Acad Med. 2009;84:1775-1787. PubMed
12. Huth K, Hart F, Moreau K, et al. Real-world implementation of a standardized handover program (I-PASS) on a pediatric clinical teaching unit. Acad Ped. 2016;16:532-539. PubMed
13. Jonas E, Schulz-Hardt S, Frey D, Thelen N. Confirmation bias in sequential information search after preliminary decisions: An expansion of dissonance theoretical research on selective exposure to information. J Per Soc Psy. 2001;80:557-571. PubMed
14. Joint Commission. Improving handoff communications: Meeting national patient safety goal 2E. Jt Pers Patient Saf. 2006;6:9-15.
15. Improving Hand-off Communication. Joint Commission Resources. 2007. PubMed
© 2017 Society of Hospital Medicine
Interhospital Transfer and Receipt of Specialty Procedures
Patients who undergo interhospital transfer (IHT) are felt to benefit from receipt of unique specialty care at the receiving hospital.1 Although only 1.5% of all hospitalized Medicare patients undergo hospital transfer,2 the frequency of transfer is much greater within certain patient populations, as may be expected with diagnoses requiring specialty care.3,4 Existent data demonstrate that 5% of Medicare patients admitted to the intensive care unit (ICU)5 and up to 50% of patients presenting with acute myocardial infarction (AMI) undergo IHT.6
More recent data suggest variability in hospital transfer practices not accounted for by differences in patient or hospital characteristics.2 Although disease-specific guidelines for IHT exist for certain diagnoses,3,4 the process remains largely nonstandardized for many patients,7 leading to ambiguity surrounding indications for transfer. Because limited data suggest worse outcomes for transferred versus nontransferred patients,8 a better understanding of the specialized care patients actually receive across the transfer continuum may help to elucidate potential indications for transfer and ultimately help delineate which patients are most (or least) likely to benefit from transfer and why.
In this national study, we examined a select cohort of transferred patients with diagnoses associated with specific specialty procedural services to determine if they received these procedures and where along the transfer continuum they were performed.
METHODS
We performed a cross-sectional analysis using the Center for Medicare and Medicaid Services 2013 100% Master Beneficiary Summary and Inpatient claims files. Our study protocol was approved by the Partners Healthcare Human Subjects Review Committee.
Beneficiaries were eligible for inclusion if they were aged ≥65 years, continuously enrolled in Medicare A and B, and with an acute care hospitalization claim in 2013, excluding Medicare managed care and end stage renal disease beneficiaries due to incomplete claims data in these groups. We additionally excluded beneficiaries hospitalized at federal or nonacute care hospitals, or critical access hospitals given their mission to stabilize and then transfer patients to referral hospitals.9
Transferred patients were defined as beneficiaries with corresponding “transfer in” and “transfer out” claims, or those with either claim and a corresponding date of admission/discharge from another hospital within 1 day of the claim, as we used in our prior research.2 Beneficiaries transferred to the same hospital, those with greater than 1 transfer within the same hospitalization, or those cared for at hospitals with “outlier” transfer-in rates equal to 100% or transfer-out rates greater than 35% were excluded from analysis given the suggestion of nonstandard claims practices.
We first identified the top 15 primary diagnoses at time of transfer using International Classification of Diseases, Ninth Revision (ICD-9) codes (supplementary Appendix), and then identified those 4 most likely to require specialty procedural services: AMI, gastrointestinal bleed (GI bleed), renal failure, and hip fracture/dislocation. We then chose associated ICD-9 procedure codes for each diagnosis, via expert opinion (authors SM and JS, hospitalist physicians with greater than 20 years of combined clinical experience), erring on overinclusion of procedure codes. We then quantified receipt of associated procedures at transferring and receiving hospitals, stratified by diagnosis.
We further explored the cohort of patients with hip fracture/dislocation who underwent an associated procedure at the transferring but not receiving hospital, examining the frequency with which these patients had other (nonrelated) procedures at the receiving hospital, and identifying which procedures they received.
RESULTS
Of the 101,507 patients transferred to another hospital, 19,613 (19.3%) had a primary diagnosis of AMI, GI bleed, renal failure, or hip fracture/dislocation. Table 1 lists the ICD-9 procedure codes associated with each diagnosis.
Distribution of receipt of specialty procedures at the transferring and receiving hospitals varied by disease (Figure). With the exception of GI bleed, patients more often received specialty procedural care at the receiving than the transferring hospital. Depending on primary diagnosis, between 32.4% and 89.1% of patients did not receive any associated specialty procedure at the receiving hospital.
Of the 370 (22.1%) hip fracture/dislocation patients that received a specialty procedure at the transferring but not receiving hospital, 132 (35.7%) did not receive any procedure at the receiving hospital, whereas the remaining 238 (64.3%) received an unrelated (not associated with the primary diagnosis) procedure. There was great variety in the types of procedures received, the most common being transfusion of blood products (ICD-9 Clinical Modification 9904).
DISCUSSION
Among transferred patients with primary diagnoses that have clearly associated specialized procedural services, we found that patients received these procedures at varying frequency and locations across the transfer continuum. Across 4 diagnoses, receipt of associated procedures was more common at the receiving than the transferring hospital, with the exception being patients with GI bleed. We additionally found that many transferred patients did not receive any associated specialty procedure at the receiving hospital. These findings suggest the strong likelihood of more diverse underlying reasons for transfer rather than solely receipt of specialized procedural care.
Despite the frequency with which AMI patients are transferred,6 and American Heart Association guidelines directing hospitals to transfer AMI patients to institutions able to provide necessary invasive treatments,4 prior studies suggest these patients inconsistently receive specialty intervention following transfer, including stress testing, cardiac catheterization, or coronary artery bypass graft surgery.10,11 Our findings add to these data, demonstrating that only 47.3% of patients transferred with AMI received any cardiac-related procedure at the receiving hospital. Additionally, we found that 38.1% of AMI patients do not receive any specialty procedures at either the transferring or the receiving hospital. Taken together, these data suggest possible discrepancies in the perceived need for these procedures between transferring and receiving hospitals, reasons for transfer related to these conditions that don’t involve an associated procedure, or reasons for transfer unrelated to specialty care of the primary diagnosis (such as care of comorbidities, hospital location, prior relationships with that hospital, or desire for a second opinion). Although some of these alternate reasons for transfer likely still benefit the patient, some of these reasons may not justify the increased risks of discontinuity of care created by IHT.
Given limited data looking at IHT practices for patients with other diagnoses, the varying patterns of specialty procedural interventions we observed among transferred patients with GI bleed, renal failure, and hip fracture/dislocation are novel contributions to this topic. Notably, we found that among patients transferred with a primary diagnosis of renal failure, the vast majority (84.1%) did not receive any associated procedure at either the transferring or the receiving hospital. It is possible that although these patients carried the diagnosis of renal failure, their clinical phenotype is more heterogeneous, and they could still be managed conservatively without receipt of invasive procedures such as hemodialysis.
Conversely, patients transferred with primary diagnosis of hip fracture/dislocation were far more likely to receive associated specialty procedural intervention at the receiving hospital, presumably reflective of the evidence demonstrating improved outcomes with early surgical intervention.12 However, these data do not explain the reasoning behind the substantial minority of patients who received specialty intervention at the transferring hospital prior to transfer or those that did not receive any specialty intervention at either the transferring or receiving hospital. Our secondary analysis demonstrating great variety in receipt and type of nonassociated procedures provided at the receiving hospital did not help to elucidate potential underlying reasons for transfer.
Notably, among patients transferred with primary diagnosis of GI bleed, receipt of specialty procedures was more common at the transferring (77.7%) than receiving (63.2%) hospital, with nearly half (49.3%) undergoing specialty procedures at both hospitals. It is possible that these findings are reflective of the broad array of specialty procedures examined within this diagnosis. For example, it is reasonable to consider that a patient may be stabilized with receipt of a blood transfusion at the transferring hospital, then transferred to undergo a diagnostic/therapeutic procedure (ie, endoscopy/colonoscopy) at the receiving hospital, as is suggested by our results.
Our study is subject to several limitations. First, given the criteria we used to define transfer, it is possible that we included nontransferred patients within our transferred cohort if they were discharged from one hospital and admitted to a different hospital within 1 day, although quality assurance analyses we conducted in prior studies on these data support the validity of the criteria used.2 Second, we cannot exclude the possibility that patients received nonprocedural specialty care (ie, expert opinion, specialized imaging, medical management, management of secondary diagnoses, etc.) not available at the transferring hospital, although, arguably, in select patients, such input could be obtained without physical transfer of the patient (ie, tele-consult). And even in patients transferred with intent to receive procedural care who did not ultimately receive that care, there is likely an appropriate “nonprocedure” rate, where patients who might benefit from a procedure receive a timely evaluation to reduce the risk of missing the opportunity to receive it. This would be analogous to transferring a patient to an ICU even if they do not end up requiring intubation or pressor therapy. However, given the likelihood of higher risks of IHT compared with intrahospital transfers, one could argue that the threshold of perceived benefit might be different in patients being considered for IHT. Additionally, we limited our analyses to only 4 diagnoses; thus, our findings may not be generalizable to other diagnoses of transferred patients. However, because the diagnoses we examined were ones considered most effectively treated with specialty procedural interventions, it is reasonable to presume that the variability in receipt of specialty procedures observed within these diagnoses is also present, if not greater, across other diagnoses. Third, although we intentionally included a broad array of specialty procedures associated with each diagnosis, it is possible that we overlooked particular specialty interventions. For example, in assuming that patients are most likely to be transferred to receive procedural services associated with their primary diagnosis, we may have missed alternate indications for transfer, including need for procedural care related to secondary or subsequent diagnoses (ie, a patient may have presented with GI bleed
CONCLUSIONS
We found that Medicare patients who undergo IHT with primary diagnoses of AMI, GI bleed, renal failure, and hip fracture/dislocation receive associated specialty interventions at varying frequency and locations, and many patients do not receive any associated procedures at receiving hospitals. Our findings suggest that specialty procedural care of patients, even those with primary diagnoses that often warrant specialized intervention, may not be the primary driver of IHT as commonly suggested, although underlying reasons for transfer in these and other “nonprocedural” transferred patients remains obscure. Given known ambiguity in the transfer process,7 and unclear benefit of IHT,8 additional research is required to further identify and evaluate other potential underlying reasons for transfer and to examine these in the context of patient outcomes, in order to understand which patients may or may not benefit from transfer and why.
Disclosure
The authors have nothing to disclose.
1. Iwashyna TJ. The incomplete infrastructure for interhospital patient transfer. Crit Care Med. 2012;40(8):2470-2478. PubMed
2. Mueller SK, Zheng J, Orav EJ, Schnipper JL. Rates, Predictors and Variability of Interhospital Transfers: A National Evaluation. J Hosp Med. 2017;12(6):435-442. PubMed
3. Guidelines for the transfer of critically ill patients. Guidelines Committee of the American College of Critical Care Medicine; Society of Critical Care Medicine and American Association of Critical-Care Nurses Transfer Guidelines Task Force. Crit Care Med. 1993;21(6):931-937. PubMed
4. Anderson JL, Adams CD, Antman EM, et al. 2011 ACCF/AHA Focused Update Incorporated Into the ACC/AHA 2007 Guidelines for the Management of Patients With Unstable Angina/Non-ST-Elevation Myocardial Infarction: a report of the American College of Cardiology Foundation/American Heart Association Task Force on Practice Guidelines. Circulation. 2011;123(18):e426-e579. PubMed
5. Iwashyna TJ, Christie JD, Moody J, Kahn JM, Asch DA. The structure of critical care transfer networks. Med Care. 2009;47(7):787-793. PubMed
6. Iwashyna TJ, Kahn JM, Hayward RA, Nallamothu BK. Interhospital transfers among Medicare beneficiaries admitted for acute myocardial infarction at nonrevascularization hospitals. Circ Cardiovasc Qual Outcomes. 2010;3(5):468-475. PubMed
7. Bosk EA, Veinot T, Iwashyna TJ. Which patients and where: a qualitative study of patient transfers from community hospitals. Med Care. 2011;49(6):592-598. PubMed
8. Sokol-Hessner L, White AA, Davis KF, Herzig SJ, Hohmann SF. Interhospital transfer patients discharged by academic hospitalists and general internists: Characteristics and outcomes. J Hosp Med. 2016;11(4):245-250. PubMed
9. Department of Health and Human Services, Center for Medicare & Medicaid Services: Critical Access Hospitals. https://www.cms.gov/Outreach-and-Education/Medicare-Learning-Network-MLN/MLNProducts/downloads/CritAccessHospfctsht.pdf. Accessed June 29, 2017. PubMed
10. Roe MT, Chen AY, Delong ER, et al. Patterns of transfer for patients with non-ST-segment elevation acute coronary syndrome from community to tertiary care hospitals. Am Heart J. 2008;156(1):185-192. PubMed
11. Barreto-Filho JA, Wang Y, Rathore SS, et al. Transfer rates from nonprocedure hospitals after initial admission and outcomes among elderly patients with acute myocardial infarction. JAMA Intern Med. 2014;174(2):213-222. PubMed
12. Doruk H, Mas MR, Yildiz C, Sonmez A, Kyrdemir V. The effect of the timing of hip fracture surgery on the activity of daily living and mortality in elderly. Arch Gerontol Geriatr. 2004;39(2):179-185. PubMed
Patients who undergo interhospital transfer (IHT) are felt to benefit from receipt of unique specialty care at the receiving hospital.1 Although only 1.5% of all hospitalized Medicare patients undergo hospital transfer,2 the frequency of transfer is much greater within certain patient populations, as may be expected with diagnoses requiring specialty care.3,4 Existent data demonstrate that 5% of Medicare patients admitted to the intensive care unit (ICU)5 and up to 50% of patients presenting with acute myocardial infarction (AMI) undergo IHT.6
More recent data suggest variability in hospital transfer practices not accounted for by differences in patient or hospital characteristics.2 Although disease-specific guidelines for IHT exist for certain diagnoses,3,4 the process remains largely nonstandardized for many patients,7 leading to ambiguity surrounding indications for transfer. Because limited data suggest worse outcomes for transferred versus nontransferred patients,8 a better understanding of the specialized care patients actually receive across the transfer continuum may help to elucidate potential indications for transfer and ultimately help delineate which patients are most (or least) likely to benefit from transfer and why.
In this national study, we examined a select cohort of transferred patients with diagnoses associated with specific specialty procedural services to determine if they received these procedures and where along the transfer continuum they were performed.
METHODS
We performed a cross-sectional analysis using the Center for Medicare and Medicaid Services 2013 100% Master Beneficiary Summary and Inpatient claims files. Our study protocol was approved by the Partners Healthcare Human Subjects Review Committee.
Beneficiaries were eligible for inclusion if they were aged ≥65 years, continuously enrolled in Medicare A and B, and with an acute care hospitalization claim in 2013, excluding Medicare managed care and end stage renal disease beneficiaries due to incomplete claims data in these groups. We additionally excluded beneficiaries hospitalized at federal or nonacute care hospitals, or critical access hospitals given their mission to stabilize and then transfer patients to referral hospitals.9
Transferred patients were defined as beneficiaries with corresponding “transfer in” and “transfer out” claims, or those with either claim and a corresponding date of admission/discharge from another hospital within 1 day of the claim, as we used in our prior research.2 Beneficiaries transferred to the same hospital, those with greater than 1 transfer within the same hospitalization, or those cared for at hospitals with “outlier” transfer-in rates equal to 100% or transfer-out rates greater than 35% were excluded from analysis given the suggestion of nonstandard claims practices.
We first identified the top 15 primary diagnoses at time of transfer using International Classification of Diseases, Ninth Revision (ICD-9) codes (supplementary Appendix), and then identified those 4 most likely to require specialty procedural services: AMI, gastrointestinal bleed (GI bleed), renal failure, and hip fracture/dislocation. We then chose associated ICD-9 procedure codes for each diagnosis, via expert opinion (authors SM and JS, hospitalist physicians with greater than 20 years of combined clinical experience), erring on overinclusion of procedure codes. We then quantified receipt of associated procedures at transferring and receiving hospitals, stratified by diagnosis.
We further explored the cohort of patients with hip fracture/dislocation who underwent an associated procedure at the transferring but not receiving hospital, examining the frequency with which these patients had other (nonrelated) procedures at the receiving hospital, and identifying which procedures they received.
RESULTS
Of the 101,507 patients transferred to another hospital, 19,613 (19.3%) had a primary diagnosis of AMI, GI bleed, renal failure, or hip fracture/dislocation. Table 1 lists the ICD-9 procedure codes associated with each diagnosis.
Distribution of receipt of specialty procedures at the transferring and receiving hospitals varied by disease (Figure). With the exception of GI bleed, patients more often received specialty procedural care at the receiving than the transferring hospital. Depending on primary diagnosis, between 32.4% and 89.1% of patients did not receive any associated specialty procedure at the receiving hospital.
Of the 370 (22.1%) hip fracture/dislocation patients that received a specialty procedure at the transferring but not receiving hospital, 132 (35.7%) did not receive any procedure at the receiving hospital, whereas the remaining 238 (64.3%) received an unrelated (not associated with the primary diagnosis) procedure. There was great variety in the types of procedures received, the most common being transfusion of blood products (ICD-9 Clinical Modification 9904).
DISCUSSION
Among transferred patients with primary diagnoses that have clearly associated specialized procedural services, we found that patients received these procedures at varying frequency and locations across the transfer continuum. Across 4 diagnoses, receipt of associated procedures was more common at the receiving than the transferring hospital, with the exception being patients with GI bleed. We additionally found that many transferred patients did not receive any associated specialty procedure at the receiving hospital. These findings suggest the strong likelihood of more diverse underlying reasons for transfer rather than solely receipt of specialized procedural care.
Despite the frequency with which AMI patients are transferred,6 and American Heart Association guidelines directing hospitals to transfer AMI patients to institutions able to provide necessary invasive treatments,4 prior studies suggest these patients inconsistently receive specialty intervention following transfer, including stress testing, cardiac catheterization, or coronary artery bypass graft surgery.10,11 Our findings add to these data, demonstrating that only 47.3% of patients transferred with AMI received any cardiac-related procedure at the receiving hospital. Additionally, we found that 38.1% of AMI patients do not receive any specialty procedures at either the transferring or the receiving hospital. Taken together, these data suggest possible discrepancies in the perceived need for these procedures between transferring and receiving hospitals, reasons for transfer related to these conditions that don’t involve an associated procedure, or reasons for transfer unrelated to specialty care of the primary diagnosis (such as care of comorbidities, hospital location, prior relationships with that hospital, or desire for a second opinion). Although some of these alternate reasons for transfer likely still benefit the patient, some of these reasons may not justify the increased risks of discontinuity of care created by IHT.
Given limited data looking at IHT practices for patients with other diagnoses, the varying patterns of specialty procedural interventions we observed among transferred patients with GI bleed, renal failure, and hip fracture/dislocation are novel contributions to this topic. Notably, we found that among patients transferred with a primary diagnosis of renal failure, the vast majority (84.1%) did not receive any associated procedure at either the transferring or the receiving hospital. It is possible that although these patients carried the diagnosis of renal failure, their clinical phenotype is more heterogeneous, and they could still be managed conservatively without receipt of invasive procedures such as hemodialysis.
Conversely, patients transferred with primary diagnosis of hip fracture/dislocation were far more likely to receive associated specialty procedural intervention at the receiving hospital, presumably reflective of the evidence demonstrating improved outcomes with early surgical intervention.12 However, these data do not explain the reasoning behind the substantial minority of patients who received specialty intervention at the transferring hospital prior to transfer or those that did not receive any specialty intervention at either the transferring or receiving hospital. Our secondary analysis demonstrating great variety in receipt and type of nonassociated procedures provided at the receiving hospital did not help to elucidate potential underlying reasons for transfer.
Notably, among patients transferred with primary diagnosis of GI bleed, receipt of specialty procedures was more common at the transferring (77.7%) than receiving (63.2%) hospital, with nearly half (49.3%) undergoing specialty procedures at both hospitals. It is possible that these findings are reflective of the broad array of specialty procedures examined within this diagnosis. For example, it is reasonable to consider that a patient may be stabilized with receipt of a blood transfusion at the transferring hospital, then transferred to undergo a diagnostic/therapeutic procedure (ie, endoscopy/colonoscopy) at the receiving hospital, as is suggested by our results.
Our study is subject to several limitations. First, given the criteria we used to define transfer, it is possible that we included nontransferred patients within our transferred cohort if they were discharged from one hospital and admitted to a different hospital within 1 day, although quality assurance analyses we conducted in prior studies on these data support the validity of the criteria used.2 Second, we cannot exclude the possibility that patients received nonprocedural specialty care (ie, expert opinion, specialized imaging, medical management, management of secondary diagnoses, etc.) not available at the transferring hospital, although, arguably, in select patients, such input could be obtained without physical transfer of the patient (ie, tele-consult). And even in patients transferred with intent to receive procedural care who did not ultimately receive that care, there is likely an appropriate “nonprocedure” rate, where patients who might benefit from a procedure receive a timely evaluation to reduce the risk of missing the opportunity to receive it. This would be analogous to transferring a patient to an ICU even if they do not end up requiring intubation or pressor therapy. However, given the likelihood of higher risks of IHT compared with intrahospital transfers, one could argue that the threshold of perceived benefit might be different in patients being considered for IHT. Additionally, we limited our analyses to only 4 diagnoses; thus, our findings may not be generalizable to other diagnoses of transferred patients. However, because the diagnoses we examined were ones considered most effectively treated with specialty procedural interventions, it is reasonable to presume that the variability in receipt of specialty procedures observed within these diagnoses is also present, if not greater, across other diagnoses. Third, although we intentionally included a broad array of specialty procedures associated with each diagnosis, it is possible that we overlooked particular specialty interventions. For example, in assuming that patients are most likely to be transferred to receive procedural services associated with their primary diagnosis, we may have missed alternate indications for transfer, including need for procedural care related to secondary or subsequent diagnoses (ie, a patient may have presented with GI bleed
CONCLUSIONS
We found that Medicare patients who undergo IHT with primary diagnoses of AMI, GI bleed, renal failure, and hip fracture/dislocation receive associated specialty interventions at varying frequency and locations, and many patients do not receive any associated procedures at receiving hospitals. Our findings suggest that specialty procedural care of patients, even those with primary diagnoses that often warrant specialized intervention, may not be the primary driver of IHT as commonly suggested, although underlying reasons for transfer in these and other “nonprocedural” transferred patients remains obscure. Given known ambiguity in the transfer process,7 and unclear benefit of IHT,8 additional research is required to further identify and evaluate other potential underlying reasons for transfer and to examine these in the context of patient outcomes, in order to understand which patients may or may not benefit from transfer and why.
Disclosure
The authors have nothing to disclose.
1. Iwashyna TJ. The incomplete infrastructure for interhospital patient transfer. Crit Care Med. 2012;40(8):2470-2478. PubMed
2. Mueller SK, Zheng J, Orav EJ, Schnipper JL. Rates, Predictors and Variability of Interhospital Transfers: A National Evaluation. J Hosp Med. 2017;12(6):435-442. PubMed
3. Guidelines for the transfer of critically ill patients. Guidelines Committee of the American College of Critical Care Medicine; Society of Critical Care Medicine and American Association of Critical-Care Nurses Transfer Guidelines Task Force. Crit Care Med. 1993;21(6):931-937. PubMed
4. Anderson JL, Adams CD, Antman EM, et al. 2011 ACCF/AHA Focused Update Incorporated Into the ACC/AHA 2007 Guidelines for the Management of Patients With Unstable Angina/Non-ST-Elevation Myocardial Infarction: a report of the American College of Cardiology Foundation/American Heart Association Task Force on Practice Guidelines. Circulation. 2011;123(18):e426-e579. PubMed
5. Iwashyna TJ, Christie JD, Moody J, Kahn JM, Asch DA. The structure of critical care transfer networks. Med Care. 2009;47(7):787-793. PubMed
6. Iwashyna TJ, Kahn JM, Hayward RA, Nallamothu BK. Interhospital transfers among Medicare beneficiaries admitted for acute myocardial infarction at nonrevascularization hospitals. Circ Cardiovasc Qual Outcomes. 2010;3(5):468-475. PubMed
7. Bosk EA, Veinot T, Iwashyna TJ. Which patients and where: a qualitative study of patient transfers from community hospitals. Med Care. 2011;49(6):592-598. PubMed
8. Sokol-Hessner L, White AA, Davis KF, Herzig SJ, Hohmann SF. Interhospital transfer patients discharged by academic hospitalists and general internists: Characteristics and outcomes. J Hosp Med. 2016;11(4):245-250. PubMed
9. Department of Health and Human Services, Center for Medicare & Medicaid Services: Critical Access Hospitals. https://www.cms.gov/Outreach-and-Education/Medicare-Learning-Network-MLN/MLNProducts/downloads/CritAccessHospfctsht.pdf. Accessed June 29, 2017. PubMed
10. Roe MT, Chen AY, Delong ER, et al. Patterns of transfer for patients with non-ST-segment elevation acute coronary syndrome from community to tertiary care hospitals. Am Heart J. 2008;156(1):185-192. PubMed
11. Barreto-Filho JA, Wang Y, Rathore SS, et al. Transfer rates from nonprocedure hospitals after initial admission and outcomes among elderly patients with acute myocardial infarction. JAMA Intern Med. 2014;174(2):213-222. PubMed
12. Doruk H, Mas MR, Yildiz C, Sonmez A, Kyrdemir V. The effect of the timing of hip fracture surgery on the activity of daily living and mortality in elderly. Arch Gerontol Geriatr. 2004;39(2):179-185. PubMed
© 2017 Society of Hospital Medicine
617-732-7072; E-mail: smueller1@bwh.harvard.edu
Trends in Hospitalization for Opioid Overdose among Rural Compared to Urban Residents of the United States, 2007-2014
Background
Hospitalizations and deaths due to opioid overdose have increased over the last decades, straining the healthcare system and generating substantial costs.1-4Hospitalizations for overdose also represent opportunities to intervene in the opioid epidemic by linking patients to resources for nonpharmacologic chronic pain treatment resources or substance use treatment services during and following hospitalization.5,6Studies of trends in the frequency of hospitalizations for opioid overdose in rural and urban areas are necessary to inform planning and resource allocation for inpatient and postdischarge transitional care.
Nonmedical opioid use and opioid-related deaths and injuries appear to be higher in rural areas.7,8 As well, rural areas tend to be more under-resourced in terms of substance abuse treatment and chronic pain specialty services.9,10 Contemporaneous with rising opioid use has been an increasing trend of rural hospital closures.11 This may compound the impact of opioid-related hospitalizations on remaining rural hospitals and lead to increasing reliance on more distant, urban hospitals to treat and discharge patients with overdoses. Rural residents who are admitted or transferred to urban hospitals may face distinct challenges. Similarly, urban hospitals may struggle during discharge planning to link patients to substance use treatment services in less familiar rural communities.
To better define the differential impact of the opioid epidemic based on patient rurality, we described trends in rates of hospitalization for opioid overdose among rural residents compared with urban residents of the United States. We separated hospitalizations into those due to overdose of prescription opioids, and those related to heroin. Among rural residents who overdosed on opioids, we examined trends in admission to rural versus urban hospitals.
METHODS
Data Source
We analyzed data from the National Inpatient Sample (NIS) from 2007 to 2014, developed by the Healthcare Cost and Utilization Project (HCUP). NIS yields nationally representative estimates of inpatient stays in community hospitals in the United States, regardless of payer. Rehabilitation and long-term care hospital stays are excluded. Prior to 2012, NIS included data on all discharges from a 20% sample of hospitals. Beginning in 2012, NIS included a 20% sample of discharges from all HCUP hospitals. We used weights to estimate trends in the total number of hospital admissions for heroin and prescription opioid overdose (POD) in the US by year, accounting for the change in sampling design in 2012 as recommended by HCUP. Standard errors for estimates accounted for the complex sample design.12 We used data from the US Census American Community Survey on the US population in rural versus urban areas for each year to calculate overdose admission rates per 100,000 residents.
Target Population
Following methods applied in previous analyses of NIS data,1,4,13 we identified hospitalizations for heroin or POD based on International Classification of Diseases 9th Clinical Modification (ICD-9-CM) codes. We use the lay term “overdose” to refer to admissions defined by the medical term “poisoning.” In each year between 2007 and 2013, we determined the total number of admissions due to heroin or prescription opioid by considering ICD-9CM codes 965.00 (poisoning by opium), 965.01 (poisoning by heroin), or 965.09 (poisoning by other opiates and related narcotics); or E code E850.0 (accidental poisoning by heroin); or 850.2 (accidental poisoning by opiates and related narcotics) in any position. We defined admissions for heroin overdose (HOD) as 965.01 or E code of E850.0 in any position, and admissions for POD not related to heroin as 965.00, or 965.09, or E code 850.2 in any position excluding admissions with any heroin-related code 965.01 or E code E850.0 or E935.0 (adverse effects of heroin). We excluded hospitalizations in which a patient was transferred out to another acute care facility to avoid duplicate counting.
Analysis
We classified these admissions based on patient residence in a rural versus urban area. NIS contained a variable representing rural versus urban patient residence based on the county-level framework maintained by the Office of Management and Budget, supplemented with information from Urban Influence Codes developed by the Economic Research Service of the US Department of Agriculture.14 We used this information to create a 3-level variable for patient residence: rural (ie, nonmetropolitan areas with a population less than 50,000), small metropolitan (ie, metropolitan areas with a population of 50,000–999,999), and large metropolitan (ie, metropolitan areas with a population of 1,000,000 or greater). We explored further separating categories (eg, breaking rural into micropolitan population centers and other), but this did not further discriminate admission rates.
For each study year, we combined results on overdose admissions with data on the total populations for each of these 3 areas in the US based on American Community Survey data in order to calculate rates of each type of admission per 100,000 persons. To compare pharmaceutical opioids to heroin, we examined pharmaceutical-only overdoses and heroin-only overdoses. We also examined patient age, sex, race and/or ethnicity, and whether they were admitted to a rural or urban hospital based on the hospital location code contained in NIS, and compared these characteristics across residence categories; we presented characteristics for years 2012 to 2014 combined as recent characteristics are most relevant.
The authors had full access to and take full responsibility for the integrity of the data. All analyses were conducted using SAS statistical software version 9.2 (SAS Institute, Cary, North Carolina). The study was reviewed by the University of Iowa Institutional Review Board and the Iowa City Veterans Affairs Healthcare System Research and Development Committee and was judged human subject research exempt.
RESULTS
Characteristics of Patients with Opioids Overdose Admissions
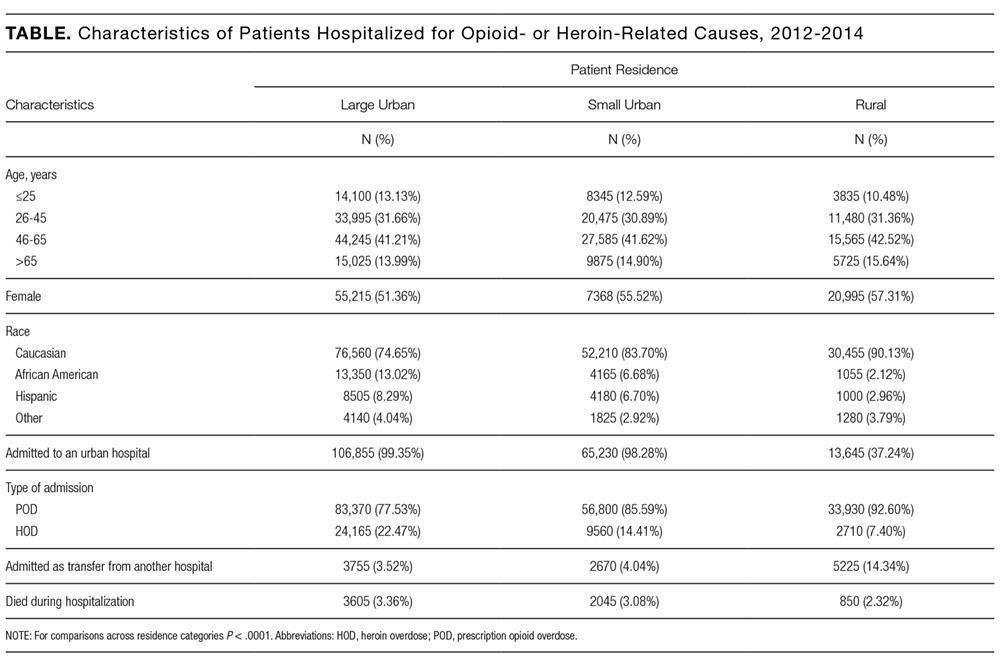
Opioid Overdose Admission Trends by Patient Residence
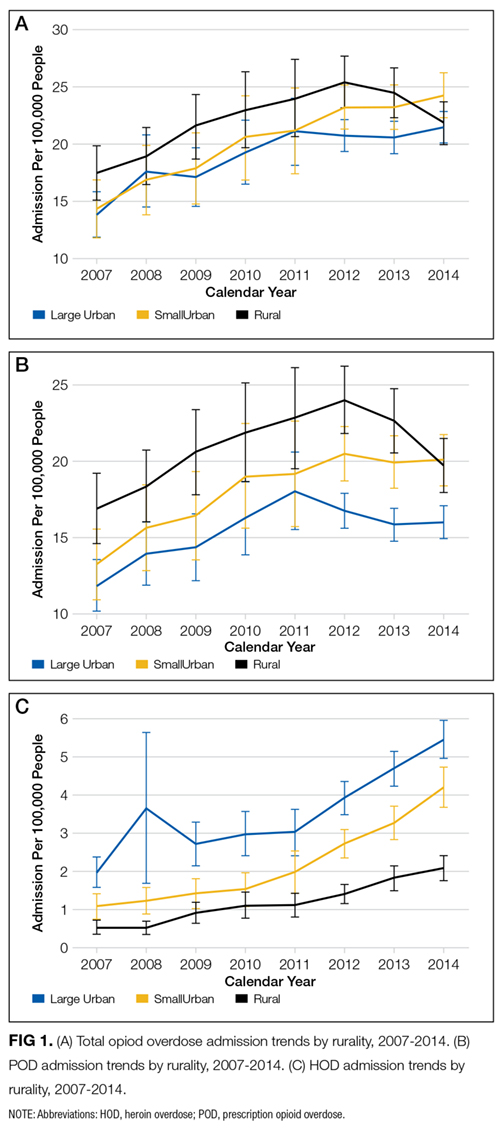
Opioid Overdose Admissions among Rural Residents to Urban and Rural Hospitals
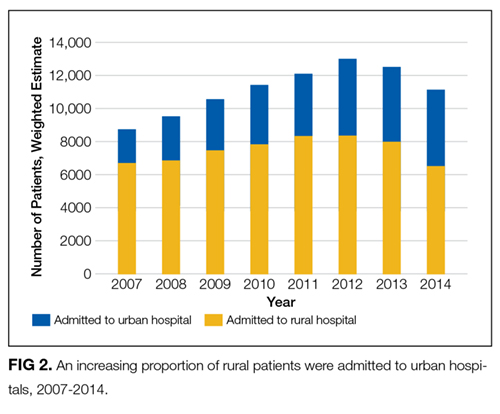
DISCUSSION
Up until 2013, hospital admissions for POD occurred at a higher rate among rural US residents than their urban counterparts. Rates of admission of rural residents for POD have decreased since 2012; a similar trend was not observed among urban residents. Over this same interval, rates of hospitalization for HOD among rural residents continued to increase.
Hospital admission is one sequela of harm related to opioid use: patients experiencing opioid overdose or poisoning may be treated by emergency responders, in emergency departments or on observation status, or may die prior to receiving medical attention or presenting for hospital admission. Factors potentially driving the trends described include patient behaviors, opioid availability, prehospital and hospital treatment practices, and hospital closures. Recent work describing increased opioid overdose deaths15 and high opioid-related mortality in rural areas16 suggests that overdose admission and death rates may be divergent. Changing policies governing naloxone availability and administration17 and ongoing trends in rural hospital closures11 may differentially affect the rates at which rural and urban residents who experience overdose are hospitalized.
Hospital admission also represents a potential point-of-entry into subsequent treatment to reduce risk of further opioid-related harms. Decreasing rates of admission could conceivably result in decreasing opportunities to engage in care. Rural and urban patient populations are distinct; an understanding of these distinctions may help to inform how hospitals structure inpatient treatment and discharge planning for overdose patients. Overdose is likely to suggest either an underlying substance use disorder or a chronic pain condition requiring risky levels of prescribed opioids, and therefore is indicative of a persistent condition requiring follow-up care. Thus, there is a need for treatment models and transition care systems aimed at providing adequate care for these populations both in the acute setting and following hospital discharge. The increasing proportion of rural residents admitted to urban hospitals with opioid overdoses highlights the need for urban hospitals to develop relationships with substance use treatment and chronic pain services in rural areas to facilitate linkage to treatment at discharge.
Limitations of this study include the use of ICD-9-CM codes from administrative data to identify hospitalizations for prescription opioid and heroin overdose. While we have used the common term “overdose,” opioid adverse events may occasion hospitalization in the absence of overdose or as a result of patients taking opioid doses in the quantity prescribed. As such, the term overdose does not necessarily imply the behavior of intentional or unintentional excess use. Additionally, coding depends on providers diagnosing and documenting conditions and may be subject to secular trends independent of overdose prevalence. We included data through 2014, the most recent year of data available at time of analyses.
CONCLUSION
Hospitals can expect to continue to treat patients presenting with opioid overdose. As overdose is likely to suggest either an underlying substance use disorder or a chronic pain condition requiring risky levels of prescribed opioids, there will be a need for treatment models and transition care systems to provide adequate care for these populations both in the acute setting and following hospital discharge. Rates of admission among rural residents declined during the last 2 years of the study period, and rural residents who were hospitalized for opioid overdose were increasingly receiving care in urban hospitals. While factors driving these trends remain to be elucidated, the trends themselves highlight a need to consider the differential challenges facing rural and urban residents who overdose. Access to resources and transportation and other challenges are distinct in urban and rural areas, with rural areas being less likely to have providers in addiction medicine, psychiatry, and pain specialties. Efforts to address these challenges will need to explore models and solutions applicable to differentially resourced hospital and postdischarge settings.
Disclosure
The work reported here was supported by the Department of Veterans Affairs, Veterans Health Administration, Office of Rural Health, Veterans Rural Health Resource Center-Central Region, and the Health Services Research and Development Service through the Comprehensive Access and Delivery Research and Evaluation Center (HFP 04-149). This manuscript is not under review elsewhere and there is no prior publication or presentation of manuscript contents. The views expressed in this article are those of the authors and do not necessarily represent the views of the Department of Veterans Affairs. The authors report no conflict of interest in regards to this study. Data: Available to researchers with VA accreditation. Statistical Code: Available to interested readers by contacting Dr. Ohl. Protocol: Available to interested readers by contacting Dr. Ohl.
1. Ronan MV, Herzig SJ. Hospitalizations Related To Opioid Abuse/Dependence And Associated Serious Infections Increased Sharply, 2002-12. Health Aff (Millwood). 2016;35:832-837. PubMed
2. Florence CS, Zhou C, Luo F, Xu L. The Economic Burden of Prescription Opioid Overdose, Abuse, and Dependence in the United States, 2013. Med Care. 2016;54:901-906. PubMed
3. Jennifer PS, Michael JW, Douglas H, John M, Michael DH. The Critical Care Crisis of Opioid Overdoses in the U.S. In: C95 OUTSTANDING EPIDEMIOLOGY AND HEALTH SERVICES RESEARCH IN CRITICAL CARE: American Thoracic Society 2016 International Conference; 2016 May 13-18; San Francisco, CA:A6146-A.
4. Owens PL, Barrett ML, Weiss AJ, Washington RE, Kronick R. Hospital Inpatient Utilization Related to Opioid Overuse Among Adults, 1993-2012: Statistical Brief #177. Healthcare Cost and Utilization Project (HCUP) Statistical Briefs; 2006. https://www.hcup-us.ahrq.gov/reports/statbriefs/sb177-Hospitalizations-for-Opioid-Overuse.jsp. Accessed January 4, 2017
5. Fanucchi L, Lofwall MR. Putting Parity into Practice - Integrating Opioid-Use Disorder Treatment into the Hospital Setting. N Engl J Med. 2016;375:811-813. PubMed
6. Liebschutz JM, Crooks D, Herman D, et al. Buprenorphine treatment for hospitalized, opioid-dependent patients: a randomized clinical trial. JAMA Intern Med. 2014;174:1369-1376. PubMed
7. Keyes KM, Cerda M, Brady JE, Havens JR, Galea S. Understanding the rural-urban differences in nonmedical prescription opioid use and abuse in the United States. Am J Public Health. 2014;104:e52-e59. PubMed
8. Rigg KK, Monnat SM. Urban vs. rural differences in prescription opioid misuse among adults in the United States: informing region specific drug policies and interventions. Int J Drug Policy. 2015;26:484-491. PubMed
9. Ellis AR, Konrad TR, Thomas KC, Morrissey JP. County-level estimates of mental health professional supply in the United States. Psychiatr Serv. 2009;60:1315-1322. PubMed
10. Rosenblatt RA, Andrilla CH, Catlin M, Larson EH. Geographic and specialty distribution of US physicians trained to treat opioid use disorder. Ann Fam Med. 2015;13:23-26. PubMed
11. Kaufman BG, Thomas SR, Randolph RK, et al. The Rising Rate of Rural Hospital Closures. J Rural Health. 2016;32:35-43. PubMed
12. Houchens RL DR, A Elixhauser. Using the HCUP National Inpatient Sample to Estimate Trends: U.S. Agency for Healthcare Research and Quality; 2015. Report No.: 2006-05
13. Unick GJ, Rosenblum D, Mars S, Ciccarone D. Intertwined epidemics: national demographic trends in hospitalizations for heroin- and opioid-related overdoses, 1993-2009. PLoS One. 2013;8:e54496.
14. Urban Influence Codes. USDA, 2016. https://www.ers.usda.gov/data-products/urban-influence-codes.aspx. Accessed January 4, 2017
15. Rudd RA, Seth P, David F, Scholl L. Increases in Drug and Opioid-Involved Overdose Deaths - United States, 2010-2015. MMWR Morb Mortal Wkly Rep. 2016;65:1445-1452. PubMed
16. Case A, Deaton A. Rising morbidity and mortality in midlife among white non-Hispanic Americans in the 21st century. Proc Natl Acad Sci U S A. 2015;112:15078-15083. PubMed
17. Davis CS, Southwell JK, Niehaus VR, Walley AY, Dailey MW. Emergency medical services naloxone access: a national systematic legal review. Acad Emerg Med. 2014;21:1173-1177. PubMed
Background
Hospitalizations and deaths due to opioid overdose have increased over the last decades, straining the healthcare system and generating substantial costs.1-4Hospitalizations for overdose also represent opportunities to intervene in the opioid epidemic by linking patients to resources for nonpharmacologic chronic pain treatment resources or substance use treatment services during and following hospitalization.5,6Studies of trends in the frequency of hospitalizations for opioid overdose in rural and urban areas are necessary to inform planning and resource allocation for inpatient and postdischarge transitional care.
Nonmedical opioid use and opioid-related deaths and injuries appear to be higher in rural areas.7,8 As well, rural areas tend to be more under-resourced in terms of substance abuse treatment and chronic pain specialty services.9,10 Contemporaneous with rising opioid use has been an increasing trend of rural hospital closures.11 This may compound the impact of opioid-related hospitalizations on remaining rural hospitals and lead to increasing reliance on more distant, urban hospitals to treat and discharge patients with overdoses. Rural residents who are admitted or transferred to urban hospitals may face distinct challenges. Similarly, urban hospitals may struggle during discharge planning to link patients to substance use treatment services in less familiar rural communities.
To better define the differential impact of the opioid epidemic based on patient rurality, we described trends in rates of hospitalization for opioid overdose among rural residents compared with urban residents of the United States. We separated hospitalizations into those due to overdose of prescription opioids, and those related to heroin. Among rural residents who overdosed on opioids, we examined trends in admission to rural versus urban hospitals.
METHODS
Data Source
We analyzed data from the National Inpatient Sample (NIS) from 2007 to 2014, developed by the Healthcare Cost and Utilization Project (HCUP). NIS yields nationally representative estimates of inpatient stays in community hospitals in the United States, regardless of payer. Rehabilitation and long-term care hospital stays are excluded. Prior to 2012, NIS included data on all discharges from a 20% sample of hospitals. Beginning in 2012, NIS included a 20% sample of discharges from all HCUP hospitals. We used weights to estimate trends in the total number of hospital admissions for heroin and prescription opioid overdose (POD) in the US by year, accounting for the change in sampling design in 2012 as recommended by HCUP. Standard errors for estimates accounted for the complex sample design.12 We used data from the US Census American Community Survey on the US population in rural versus urban areas for each year to calculate overdose admission rates per 100,000 residents.
Target Population
Following methods applied in previous analyses of NIS data,1,4,13 we identified hospitalizations for heroin or POD based on International Classification of Diseases 9th Clinical Modification (ICD-9-CM) codes. We use the lay term “overdose” to refer to admissions defined by the medical term “poisoning.” In each year between 2007 and 2013, we determined the total number of admissions due to heroin or prescription opioid by considering ICD-9CM codes 965.00 (poisoning by opium), 965.01 (poisoning by heroin), or 965.09 (poisoning by other opiates and related narcotics); or E code E850.0 (accidental poisoning by heroin); or 850.2 (accidental poisoning by opiates and related narcotics) in any position. We defined admissions for heroin overdose (HOD) as 965.01 or E code of E850.0 in any position, and admissions for POD not related to heroin as 965.00, or 965.09, or E code 850.2 in any position excluding admissions with any heroin-related code 965.01 or E code E850.0 or E935.0 (adverse effects of heroin). We excluded hospitalizations in which a patient was transferred out to another acute care facility to avoid duplicate counting.
Analysis
We classified these admissions based on patient residence in a rural versus urban area. NIS contained a variable representing rural versus urban patient residence based on the county-level framework maintained by the Office of Management and Budget, supplemented with information from Urban Influence Codes developed by the Economic Research Service of the US Department of Agriculture.14 We used this information to create a 3-level variable for patient residence: rural (ie, nonmetropolitan areas with a population less than 50,000), small metropolitan (ie, metropolitan areas with a population of 50,000–999,999), and large metropolitan (ie, metropolitan areas with a population of 1,000,000 or greater). We explored further separating categories (eg, breaking rural into micropolitan population centers and other), but this did not further discriminate admission rates.
For each study year, we combined results on overdose admissions with data on the total populations for each of these 3 areas in the US based on American Community Survey data in order to calculate rates of each type of admission per 100,000 persons. To compare pharmaceutical opioids to heroin, we examined pharmaceutical-only overdoses and heroin-only overdoses. We also examined patient age, sex, race and/or ethnicity, and whether they were admitted to a rural or urban hospital based on the hospital location code contained in NIS, and compared these characteristics across residence categories; we presented characteristics for years 2012 to 2014 combined as recent characteristics are most relevant.
The authors had full access to and take full responsibility for the integrity of the data. All analyses were conducted using SAS statistical software version 9.2 (SAS Institute, Cary, North Carolina). The study was reviewed by the University of Iowa Institutional Review Board and the Iowa City Veterans Affairs Healthcare System Research and Development Committee and was judged human subject research exempt.
RESULTS
Characteristics of Patients with Opioids Overdose Admissions
Opioid Overdose Admission Trends by Patient Residence
Opioid Overdose Admissions among Rural Residents to Urban and Rural Hospitals
DISCUSSION
Up until 2013, hospital admissions for POD occurred at a higher rate among rural US residents than their urban counterparts. Rates of admission of rural residents for POD have decreased since 2012; a similar trend was not observed among urban residents. Over this same interval, rates of hospitalization for HOD among rural residents continued to increase.
Hospital admission is one sequela of harm related to opioid use: patients experiencing opioid overdose or poisoning may be treated by emergency responders, in emergency departments or on observation status, or may die prior to receiving medical attention or presenting for hospital admission. Factors potentially driving the trends described include patient behaviors, opioid availability, prehospital and hospital treatment practices, and hospital closures. Recent work describing increased opioid overdose deaths15 and high opioid-related mortality in rural areas16 suggests that overdose admission and death rates may be divergent. Changing policies governing naloxone availability and administration17 and ongoing trends in rural hospital closures11 may differentially affect the rates at which rural and urban residents who experience overdose are hospitalized.
Hospital admission also represents a potential point-of-entry into subsequent treatment to reduce risk of further opioid-related harms. Decreasing rates of admission could conceivably result in decreasing opportunities to engage in care. Rural and urban patient populations are distinct; an understanding of these distinctions may help to inform how hospitals structure inpatient treatment and discharge planning for overdose patients. Overdose is likely to suggest either an underlying substance use disorder or a chronic pain condition requiring risky levels of prescribed opioids, and therefore is indicative of a persistent condition requiring follow-up care. Thus, there is a need for treatment models and transition care systems aimed at providing adequate care for these populations both in the acute setting and following hospital discharge. The increasing proportion of rural residents admitted to urban hospitals with opioid overdoses highlights the need for urban hospitals to develop relationships with substance use treatment and chronic pain services in rural areas to facilitate linkage to treatment at discharge.
Limitations of this study include the use of ICD-9-CM codes from administrative data to identify hospitalizations for prescription opioid and heroin overdose. While we have used the common term “overdose,” opioid adverse events may occasion hospitalization in the absence of overdose or as a result of patients taking opioid doses in the quantity prescribed. As such, the term overdose does not necessarily imply the behavior of intentional or unintentional excess use. Additionally, coding depends on providers diagnosing and documenting conditions and may be subject to secular trends independent of overdose prevalence. We included data through 2014, the most recent year of data available at time of analyses.
CONCLUSION
Hospitals can expect to continue to treat patients presenting with opioid overdose. As overdose is likely to suggest either an underlying substance use disorder or a chronic pain condition requiring risky levels of prescribed opioids, there will be a need for treatment models and transition care systems to provide adequate care for these populations both in the acute setting and following hospital discharge. Rates of admission among rural residents declined during the last 2 years of the study period, and rural residents who were hospitalized for opioid overdose were increasingly receiving care in urban hospitals. While factors driving these trends remain to be elucidated, the trends themselves highlight a need to consider the differential challenges facing rural and urban residents who overdose. Access to resources and transportation and other challenges are distinct in urban and rural areas, with rural areas being less likely to have providers in addiction medicine, psychiatry, and pain specialties. Efforts to address these challenges will need to explore models and solutions applicable to differentially resourced hospital and postdischarge settings.
Disclosure
The work reported here was supported by the Department of Veterans Affairs, Veterans Health Administration, Office of Rural Health, Veterans Rural Health Resource Center-Central Region, and the Health Services Research and Development Service through the Comprehensive Access and Delivery Research and Evaluation Center (HFP 04-149). This manuscript is not under review elsewhere and there is no prior publication or presentation of manuscript contents. The views expressed in this article are those of the authors and do not necessarily represent the views of the Department of Veterans Affairs. The authors report no conflict of interest in regards to this study. Data: Available to researchers with VA accreditation. Statistical Code: Available to interested readers by contacting Dr. Ohl. Protocol: Available to interested readers by contacting Dr. Ohl.
1. Ronan MV, Herzig SJ. Hospitalizations Related To Opioid Abuse/Dependence And Associated Serious Infections Increased Sharply, 2002-12. Health Aff (Millwood). 2016;35:832-837. PubMed
2. Florence CS, Zhou C, Luo F, Xu L. The Economic Burden of Prescription Opioid Overdose, Abuse, and Dependence in the United States, 2013. Med Care. 2016;54:901-906. PubMed
3. Jennifer PS, Michael JW, Douglas H, John M, Michael DH. The Critical Care Crisis of Opioid Overdoses in the U.S. In: C95 OUTSTANDING EPIDEMIOLOGY AND HEALTH SERVICES RESEARCH IN CRITICAL CARE: American Thoracic Society 2016 International Conference; 2016 May 13-18; San Francisco, CA:A6146-A.
4. Owens PL, Barrett ML, Weiss AJ, Washington RE, Kronick R. Hospital Inpatient Utilization Related to Opioid Overuse Among Adults, 1993-2012: Statistical Brief #177. Healthcare Cost and Utilization Project (HCUP) Statistical Briefs; 2006. https://www.hcup-us.ahrq.gov/reports/statbriefs/sb177-Hospitalizations-for-Opioid-Overuse.jsp. Accessed January 4, 2017
5. Fanucchi L, Lofwall MR. Putting Parity into Practice - Integrating Opioid-Use Disorder Treatment into the Hospital Setting. N Engl J Med. 2016;375:811-813. PubMed
6. Liebschutz JM, Crooks D, Herman D, et al. Buprenorphine treatment for hospitalized, opioid-dependent patients: a randomized clinical trial. JAMA Intern Med. 2014;174:1369-1376. PubMed
7. Keyes KM, Cerda M, Brady JE, Havens JR, Galea S. Understanding the rural-urban differences in nonmedical prescription opioid use and abuse in the United States. Am J Public Health. 2014;104:e52-e59. PubMed
8. Rigg KK, Monnat SM. Urban vs. rural differences in prescription opioid misuse among adults in the United States: informing region specific drug policies and interventions. Int J Drug Policy. 2015;26:484-491. PubMed
9. Ellis AR, Konrad TR, Thomas KC, Morrissey JP. County-level estimates of mental health professional supply in the United States. Psychiatr Serv. 2009;60:1315-1322. PubMed
10. Rosenblatt RA, Andrilla CH, Catlin M, Larson EH. Geographic and specialty distribution of US physicians trained to treat opioid use disorder. Ann Fam Med. 2015;13:23-26. PubMed
11. Kaufman BG, Thomas SR, Randolph RK, et al. The Rising Rate of Rural Hospital Closures. J Rural Health. 2016;32:35-43. PubMed
12. Houchens RL DR, A Elixhauser. Using the HCUP National Inpatient Sample to Estimate Trends: U.S. Agency for Healthcare Research and Quality; 2015. Report No.: 2006-05
13. Unick GJ, Rosenblum D, Mars S, Ciccarone D. Intertwined epidemics: national demographic trends in hospitalizations for heroin- and opioid-related overdoses, 1993-2009. PLoS One. 2013;8:e54496.
14. Urban Influence Codes. USDA, 2016. https://www.ers.usda.gov/data-products/urban-influence-codes.aspx. Accessed January 4, 2017
15. Rudd RA, Seth P, David F, Scholl L. Increases in Drug and Opioid-Involved Overdose Deaths - United States, 2010-2015. MMWR Morb Mortal Wkly Rep. 2016;65:1445-1452. PubMed
16. Case A, Deaton A. Rising morbidity and mortality in midlife among white non-Hispanic Americans in the 21st century. Proc Natl Acad Sci U S A. 2015;112:15078-15083. PubMed
17. Davis CS, Southwell JK, Niehaus VR, Walley AY, Dailey MW. Emergency medical services naloxone access: a national systematic legal review. Acad Emerg Med. 2014;21:1173-1177. PubMed
© 2017 Society of Hospital Medicine
Supporting Faculty Development in Hospital Medicine: Design and Implementation of a Personalized Structured Mentoring Program
The lack of mentorship in hospital medicine has been previously documented,1-3 but there is scant literature about solutions to the problem.4 In other disciplines, data suggest that the guidance of a mentor has a positive influence on academic productivity and professional satisfaction. Mentored faculty at all levels in their careers are more successful at producing peer-reviewed publications, procuring grant support, and maintaining confidence in their career trajectory.
METHODS
The mentorship program was implemented from October 2015 to June 2016 in the Hospital Medicine Unit (HMU) of the Massachusetts General Hospital (MGH), a teaching affiliate of Harvard Medical School.
Program Goals, Design, and Development
Participants
Mentees had to be hired at >0.5 full-time equivalent and have 3 years or fewer of hospitalist experience.
Mentor–Mentee Matching
Mentors were paired with 1 or 2 mentees. Participant information such as history of mentorship and areas of interest for mentorship was collected. Two authors matched mentors and mentees to maximize similarities in these areas. Four mentors were paired with 2 mentees each, and 12 mentors were paired with 1 mentee each.
Mentorship Training Sessions
The program provided 3 mentorship-training lunch sessions for both mentees and mentors during the 9-month program. To enrich attendance, mentees were provided coverage for their clinical duties. The initial training session provided an opportunity to meet, articulate expectations and challenges, and develop action plans with individualized goals for the mentoring relationship. The second training session occurred at the midpoint. Pairs considered their mentorship status, evaluated their progress, and discussed strategies for optimizing their experience. At the final training session, participants reflected on their mentoring relationships, identified their extended network of mentoring support, and set expectations regarding whether the mentoring relationship would continue.
Mentorship Meetings
In addition to the training sessions, mentee–mentor pairs were expected to meet a minimum of 2 times during the formal mentorship program. CFD experts performed participant outreach via e-mail to assess progress. Mentees were given dining facility gift cards to support meetings with their mentors.
Program Evaluation
Statistical Analysis
RESULTS
Program Participation and Response Rate
Of the 25 eligible mentees, 16 (64%) participated in the mentorship program. Of the 20 eligible mentors, 12 (60%) participated. One participating mentee and 1 mentor left the institution during the intervention period. Fourteen mentees (response rate: 88%) and 9 mentors (response rate: 75%) completed the preintervention survey. Ten mentees (response rate: 63%) and 8 mentors (response rate: 67%) completed the postintervention survey.
Mentor Characteristics
Mentorship Meetings and the Mentorship Network
All participants attended at least 2 of the 3 trainings. For the mentees who completed the postintervention survey, 9 (90%) met with their mentors 3 or more additional times, and 8 (80%) were connected by their mentor to at least 1 additional faculty mentor.
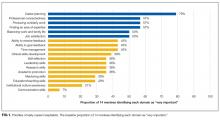
Perceptions and Overall Satisfaction with Mentorship
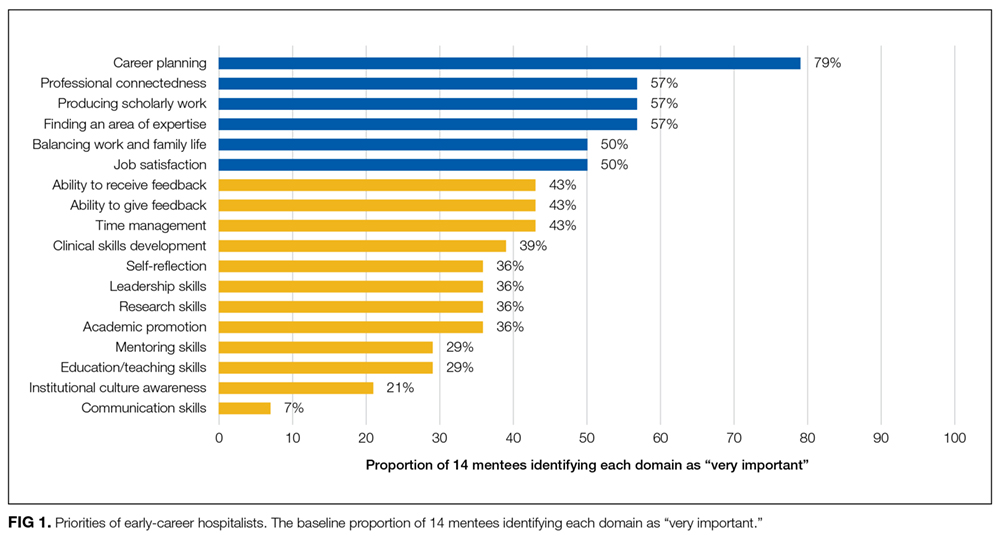
Prior to starting the mentoring relationship, 86% of mentees and 78% of mentors anticipated that differing career goals would be a challenge to a successful mentor–mentee relationship. At the end of the program, only 30% of mentees and 38% of mentors felt that such differences were a challenge. Ninety percent of mentees and 88% of mentors were satisfied or very satisfied with their mentorship match. Forty-three percent of mentees felt supported by the HMU prior to the mentorship program, while 90% felt supported after the program. All the mentees agreed that future HMU faculty should participate in a similar program.
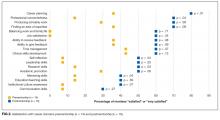
Impact of Mentorship on Critical Domains
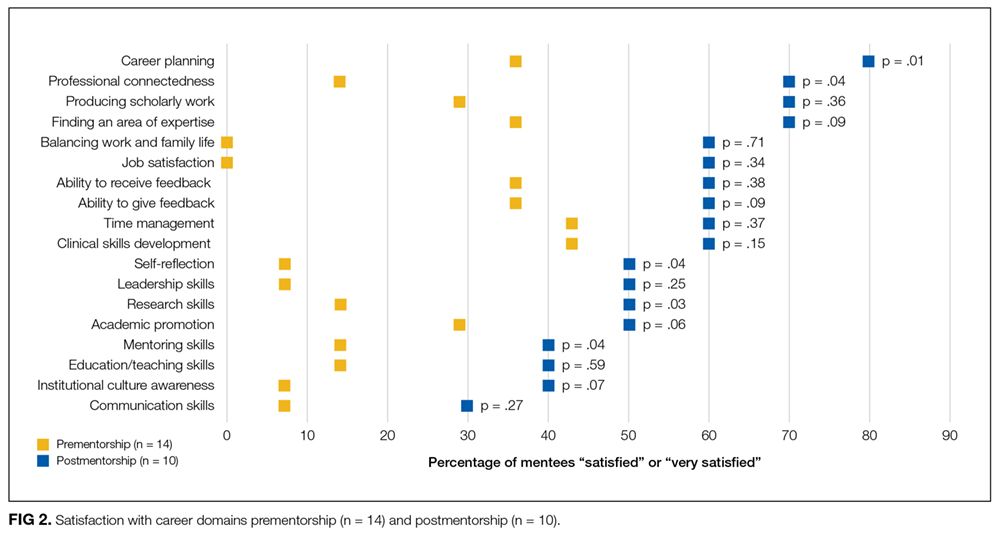
At baseline, the following domains were most commonly rated as very important by mentees: career planning, professional connectedness, producing scholarly work, finding an area of expertise, balancing work and family life, and job satisfaction (Figure 1). There was a significant improvement in composite satisfaction scores after completion of the mentorship program (54.5 ± 6.2 vs 65 ± 14.9, P = 0.02). The influence of the mentorship program on all domains is shown in Figure 2.
DISCUSSION
Our pilot structured mentorship program for junior hospitalists was feasible and led to improved satisfaction in select key career domains. Other mentoring or faculty coaching programs have been studied in several fields of medicine10-12; however, to our knowledge, there have not been published data studying a structured mentorship program for junior faculty in hospital medicine. Our intervention prioritized not only optimizing mentorship matches but also formalizing training sessions led by content experts.
After experiencing a structured mentoring relationship, most mentees felt a greater sense of support, were satisfied with their mentoring experiences, were connected to additional faculty, and had significant improvement in satisfaction in key career domains. Satisfaction with other self-identified “very important” domains, including scholarly activity, finding an area of expertise, job satisfaction, and work and family-life balance, did not significantly improve by the end of the program.
Perceived challenges to mentoring did not persist to the same degree with the implementation of a structured program. This highlights the importance of building mentorship skill sets (such as mentoring across differences and goal setting) through expert-led training sessions and perhaps also the importance of matching based on career goals.
CONCLUSION
Effective and sustainable career development requires mentorship.
Acknowledgments
The authors would like to thank each of the participants in the HMU Mentorship Program and the MGH CFD and Division of General Internal Medicine for supporting this effort.
Disclosure
Funding was provided by the MGH DGIM and CFD. Dr. Regina O’Neill reports the following relevant financial relationship: Massachusetts General Hospital Center for Faculty Development (consultant). All other authors report no other financial or other conflicts of interest to disclose.
1. Harrison R, Hunter AJ, Sharpe B, Auerbach AD. Survey of US academic hospitalist leaders about mentorship and academic activities in hospitalist groups. J Hosp Med. 2011;6:5-9. PubMed
2. Reid MB, Misky GJ, Harrison RA, Sharpe B, Auerbach A, Glasheen JJ. Mentorship, productivity, and promotion among academic hospitalists. J Gen Intern Med. 2012;27:23-27. PubMed
3. Wiese J, Centor R. The need for mentors in the odyssey of the academic hospitalist. J Hosp Med. 2011;6:1-2. PubMed
4. Howell E, Kravet S, Kisuule F, Wright SM. An innovative approach to supporting hospitalist physicians towards academic success. J Hosp Med. 2008;3:314-318. PubMed
5. Berk RA, Berg J, Mortimer R, Walton-Moss B, Yeo TP. Measuring the effectiveness of faculty mentoring relationships. Acad Med. 2005;80:66-71. PubMed
6. Jackson VA, Palepu A, Szalacha L, Caswell C, Carr PL, Inui T. “Having the right chemistry”: a qualitative study of mentoring in academic medicine. Acad Med. 2003;78:328-334. PubMed
7. Ramanan RA, Phillips RS, Davis RB, Silen W, Reede JY. Mentoring in medicine: keys to satisfaction. Am J Med. 2002;112:336-341. PubMed
8. Steven A, Oxley J, Fleming WG. Mentoring for NHS doctors: perceived benefits across the personal-professional interface. J R Soc Med. 2008;101:552-557. PubMed
9. Jha AK, Orav EJ, Zheng J, Epstein AM. Patients’ perception of hospital care in the United States. N Engl J Med. 2008;359:1921-1931. PubMed
10. Pololi LH, Knight SM, Dennis K, Frankel RM. Helping medical school faculty realize their dreams: an innovative, collaborative mentoring program. Acad Med. 2002;77:377-384. PubMed
11. Sambunjak D, Straus SE, Marusic A. Mentoring in academic medicine: a systematic review. JAMA. 2006;296:1103-1115. PubMed
12. Sehgal NL, Sharpe BA, Auerbach AA, Wachter RM. Investing in the future: building an academic hospitalist faculty development program. J Hosp Med. 2011;6:161-166. PubMed
The lack of mentorship in hospital medicine has been previously documented,1-3 but there is scant literature about solutions to the problem.4 In other disciplines, data suggest that the guidance of a mentor has a positive influence on academic productivity and professional satisfaction. Mentored faculty at all levels in their careers are more successful at producing peer-reviewed publications, procuring grant support, and maintaining confidence in their career trajectory.
METHODS
The mentorship program was implemented from October 2015 to June 2016 in the Hospital Medicine Unit (HMU) of the Massachusetts General Hospital (MGH), a teaching affiliate of Harvard Medical School.
Program Goals, Design, and Development
Participants
Mentees had to be hired at >0.5 full-time equivalent and have 3 years or fewer of hospitalist experience.
Mentor–Mentee Matching
Mentors were paired with 1 or 2 mentees. Participant information such as history of mentorship and areas of interest for mentorship was collected. Two authors matched mentors and mentees to maximize similarities in these areas. Four mentors were paired with 2 mentees each, and 12 mentors were paired with 1 mentee each.
Mentorship Training Sessions
The program provided 3 mentorship-training lunch sessions for both mentees and mentors during the 9-month program. To enrich attendance, mentees were provided coverage for their clinical duties. The initial training session provided an opportunity to meet, articulate expectations and challenges, and develop action plans with individualized goals for the mentoring relationship. The second training session occurred at the midpoint. Pairs considered their mentorship status, evaluated their progress, and discussed strategies for optimizing their experience. At the final training session, participants reflected on their mentoring relationships, identified their extended network of mentoring support, and set expectations regarding whether the mentoring relationship would continue.
Mentorship Meetings
In addition to the training sessions, mentee–mentor pairs were expected to meet a minimum of 2 times during the formal mentorship program. CFD experts performed participant outreach via e-mail to assess progress. Mentees were given dining facility gift cards to support meetings with their mentors.
Program Evaluation
Statistical Analysis
RESULTS
Program Participation and Response Rate
Of the 25 eligible mentees, 16 (64%) participated in the mentorship program. Of the 20 eligible mentors, 12 (60%) participated. One participating mentee and 1 mentor left the institution during the intervention period. Fourteen mentees (response rate: 88%) and 9 mentors (response rate: 75%) completed the preintervention survey. Ten mentees (response rate: 63%) and 8 mentors (response rate: 67%) completed the postintervention survey.
Mentor Characteristics
Mentorship Meetings and the Mentorship Network
All participants attended at least 2 of the 3 trainings. For the mentees who completed the postintervention survey, 9 (90%) met with their mentors 3 or more additional times, and 8 (80%) were connected by their mentor to at least 1 additional faculty mentor.
Perceptions and Overall Satisfaction with Mentorship
Prior to starting the mentoring relationship, 86% of mentees and 78% of mentors anticipated that differing career goals would be a challenge to a successful mentor–mentee relationship. At the end of the program, only 30% of mentees and 38% of mentors felt that such differences were a challenge. Ninety percent of mentees and 88% of mentors were satisfied or very satisfied with their mentorship match. Forty-three percent of mentees felt supported by the HMU prior to the mentorship program, while 90% felt supported after the program. All the mentees agreed that future HMU faculty should participate in a similar program.
Impact of Mentorship on Critical Domains
At baseline, the following domains were most commonly rated as very important by mentees: career planning, professional connectedness, producing scholarly work, finding an area of expertise, balancing work and family life, and job satisfaction (Figure 1). There was a significant improvement in composite satisfaction scores after completion of the mentorship program (54.5 ± 6.2 vs 65 ± 14.9, P = 0.02). The influence of the mentorship program on all domains is shown in Figure 2.
DISCUSSION
Our pilot structured mentorship program for junior hospitalists was feasible and led to improved satisfaction in select key career domains. Other mentoring or faculty coaching programs have been studied in several fields of medicine10-12; however, to our knowledge, there have not been published data studying a structured mentorship program for junior faculty in hospital medicine. Our intervention prioritized not only optimizing mentorship matches but also formalizing training sessions led by content experts.
After experiencing a structured mentoring relationship, most mentees felt a greater sense of support, were satisfied with their mentoring experiences, were connected to additional faculty, and had significant improvement in satisfaction in key career domains. Satisfaction with other self-identified “very important” domains, including scholarly activity, finding an area of expertise, job satisfaction, and work and family-life balance, did not significantly improve by the end of the program.
Perceived challenges to mentoring did not persist to the same degree with the implementation of a structured program. This highlights the importance of building mentorship skill sets (such as mentoring across differences and goal setting) through expert-led training sessions and perhaps also the importance of matching based on career goals.
CONCLUSION
Effective and sustainable career development requires mentorship.
Acknowledgments
The authors would like to thank each of the participants in the HMU Mentorship Program and the MGH CFD and Division of General Internal Medicine for supporting this effort.
Disclosure
Funding was provided by the MGH DGIM and CFD. Dr. Regina O’Neill reports the following relevant financial relationship: Massachusetts General Hospital Center for Faculty Development (consultant). All other authors report no other financial or other conflicts of interest to disclose.
1. Harrison R, Hunter AJ, Sharpe B, Auerbach AD. Survey of US academic hospitalist leaders about mentorship and academic activities in hospitalist groups. J Hosp Med. 2011;6:5-9. PubMed
2. Reid MB, Misky GJ, Harrison RA, Sharpe B, Auerbach A, Glasheen JJ. Mentorship, productivity, and promotion among academic hospitalists. J Gen Intern Med. 2012;27:23-27. PubMed
3. Wiese J, Centor R. The need for mentors in the odyssey of the academic hospitalist. J Hosp Med. 2011;6:1-2. PubMed
4. Howell E, Kravet S, Kisuule F, Wright SM. An innovative approach to supporting hospitalist physicians towards academic success. J Hosp Med. 2008;3:314-318. PubMed
5. Berk RA, Berg J, Mortimer R, Walton-Moss B, Yeo TP. Measuring the effectiveness of faculty mentoring relationships. Acad Med. 2005;80:66-71. PubMed
6. Jackson VA, Palepu A, Szalacha L, Caswell C, Carr PL, Inui T. “Having the right chemistry”: a qualitative study of mentoring in academic medicine. Acad Med. 2003;78:328-334. PubMed
7. Ramanan RA, Phillips RS, Davis RB, Silen W, Reede JY. Mentoring in medicine: keys to satisfaction. Am J Med. 2002;112:336-341. PubMed
8. Steven A, Oxley J, Fleming WG. Mentoring for NHS doctors: perceived benefits across the personal-professional interface. J R Soc Med. 2008;101:552-557. PubMed
9. Jha AK, Orav EJ, Zheng J, Epstein AM. Patients’ perception of hospital care in the United States. N Engl J Med. 2008;359:1921-1931. PubMed
10. Pololi LH, Knight SM, Dennis K, Frankel RM. Helping medical school faculty realize their dreams: an innovative, collaborative mentoring program. Acad Med. 2002;77:377-384. PubMed
11. Sambunjak D, Straus SE, Marusic A. Mentoring in academic medicine: a systematic review. JAMA. 2006;296:1103-1115. PubMed
12. Sehgal NL, Sharpe BA, Auerbach AA, Wachter RM. Investing in the future: building an academic hospitalist faculty development program. J Hosp Med. 2011;6:161-166. PubMed
© 2018 Society of Hospital Medicine
Hospital Privileging Practices for Bedside Procedures: A Survey of Hospitalist Experts
Performance of 6 bedside procedures (paracentesis, thoracentesis, lumbar puncture, arthrocentesis, central venous catheter [CVC] placement, and arterial line placement) are considered core competencies for hospitalists.1 Yet, the American Board of Internal Medicine (ABIM) no longer requires demonstration of manual competency for bedside procedures, and graduates may enter the workforce with minimal or no experience performing such procedures.2 As such, the burden falls on hospital privileging committees to ensure providers have the necessary training and experience to competently perform invasive procedures before granting institutional privileges to perform them.3 Although recommendations for privileging to perform certain surgical procedures have been proposed,4,5 there are no widely accepted guidelines for initial or ongoing privileging of common invasive bedside procedures performed by hospitalists, and current privileging practices vary significantly.
In 2015, the Society of Hospital Medicine (SHM) set up a Point-of-Care Ultrasound (POCUS) Task Force to draft evidence-based guidelines on the use of ultrasound to perform bedside procedures. The recommendations for certification of competency in ultrasound-guided procedures may guide institutional privileging. The purpose of this study was to better understand current hospital privileging practices for invasive bedside procedures both with and without ultrasound guidance and how current practices are perceived by experts.
METHODS
Study Design, Setting, and Participants
After approval by the University of Texas Health Science Center at San Antonio Institutional Review Board, we conducted a survey of hospital privileging processes for bedside procedures from a convenience sample of hospitalist procedure experts on the SHM POCUS Task Force. All 21 hospitalists on the task force were invited to participate, including the authors of this article. These hospitalists represent 21 unique institutions, and all have clinical, educational, and/or research expertise in ultrasound-guided bedside procedures.
Survey Design
A 26-question, electronic survey on privileging for bedside procedures was conducted (Appendix A). Twenty questions addressed procedures in general, such as minimum numbers of procedures required and use of simulation. Six questions focused on the use of ultrasound guidance. To provide context, many questions were framed to assess a privileging process being drafted by the task force. Answers were either multiple choice or free text.
Data Collection and Analysis
All members of the task force were invited to complete the survey by e-mail during November 2016. A reminder e-mail was sent on the day after initial distribution. No compensation was offered, and participation was not required. Survey results were compiled electronically through Research Electronic Data Capture, or “REDCap”TM (Nashville, Tennessee), and data analysis was performed with Stata version 14 (College Station, Texas). Means of current and recommended minimum thresholds were calculated by excluding responses of “I don’t know,” and responses of “no minimum number threshold” were coded as 0.
RESULTS
The survey response rate was 100% (21 of 21). All experts were hospitalists, but 2 also identified themselves as intensivists. Experts practiced in a variety of hospital settings, including private university hospitals (43%), public university hospitals (19%), Veterans Affairs teaching hospitals (14%), community teaching hospitals (14%), and community nonteaching hospitals (10%). Most hospitals (90%) were teaching hospitals for internal medicine trainees. All experts have personally performed bedside procedures on a regular basis, and most (86%) had leadership roles in teaching procedures to students, residents, fellows, physician assistants, nurse practitioners, and/or physicians. Approximately half (57%) were involved in granting privileges for bedside procedures at their institutions.
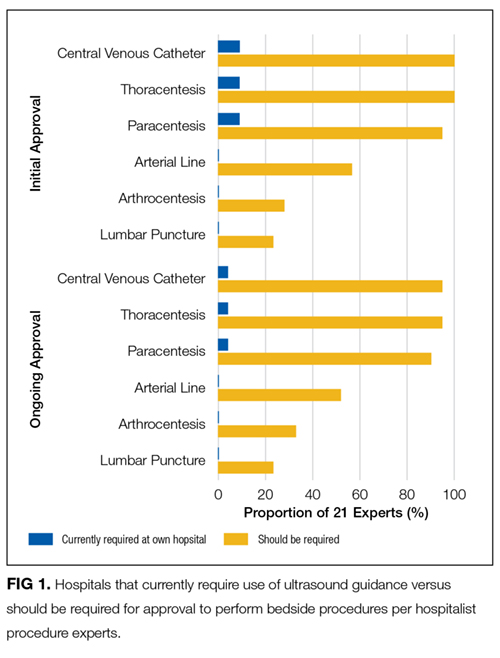
Only half of the experts reported that their hospitals required a minimum number of procedures to earn initial (48%) or ongoing (52%) privileges to perform bedside procedures. Nevertheless, most experts thought there ought to be minimum numbers of procedures for initial (81%) and ongoing (81%) privileging, recommending higher minimums for both initial and ongoing privileging than are currently required at their hospitals (Figure 2).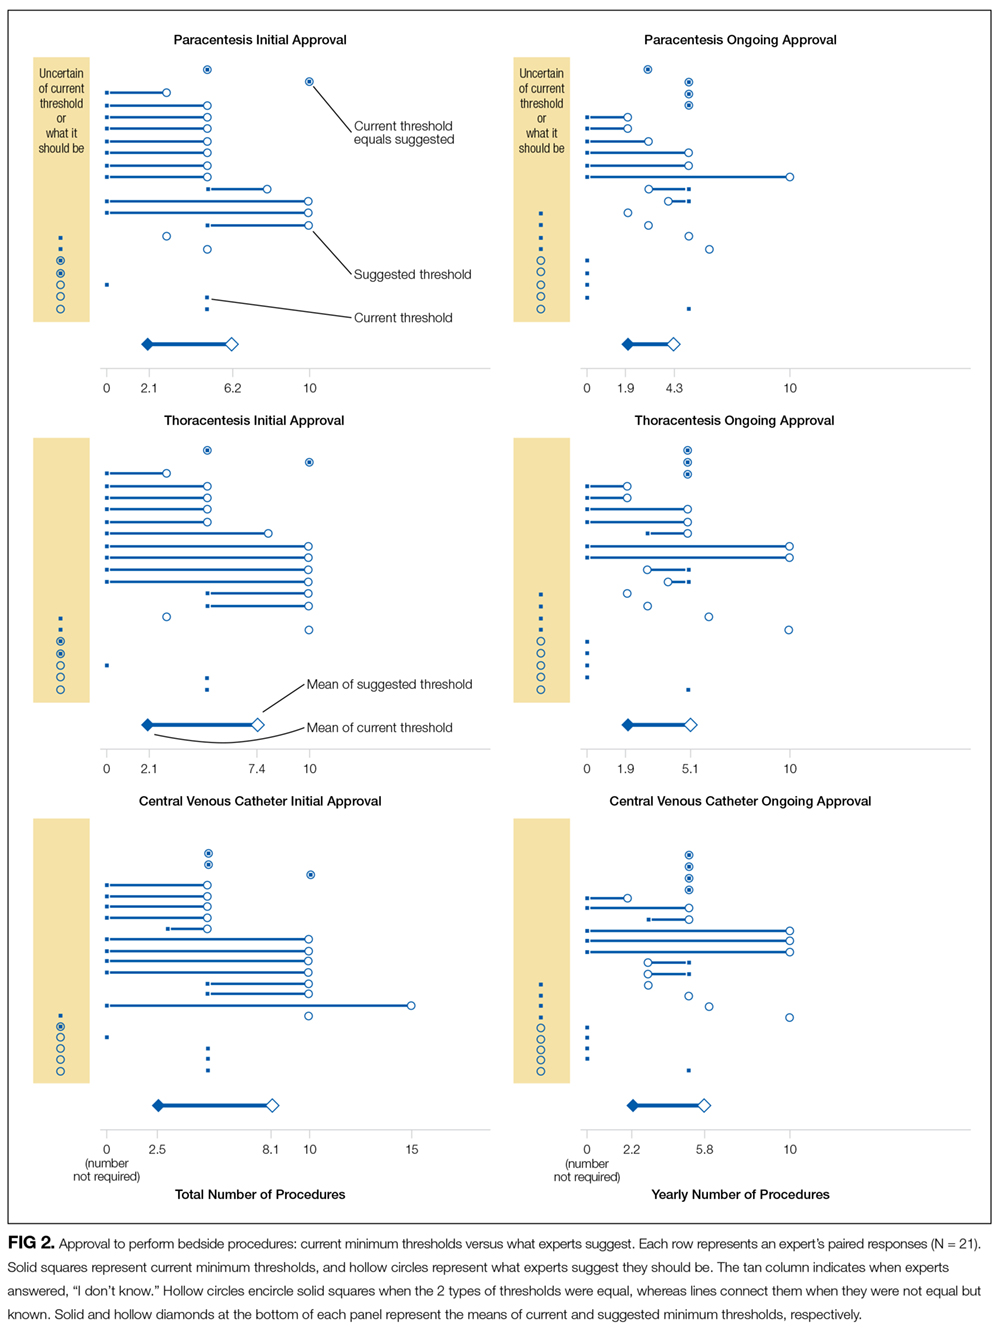
Most hospitalist procedure experts thought that simulation training (67%) and direct observation of procedural skills (71%) should be core components of an initial privileging process. Many of the experts who did not agree with direct observation or simulation training as core components of initial privileging had concerns about feasibility with respect to manpower, availability of simulation equipment, and costs. In contrast, the majority (67%) did not think it was necessary to directly observe providers for ongoing privileging when routine monitoring was in place for periprocedural complications, which all experts (100%) agreed should be in place.
DISCUSSION
Our survey identified 3 distinct differences between hospitalist procedure experts’ recommendations and their own hospitals’ current privileging practices. First, whereas experts recommended ultrasound guidance for thoracentesis, paracentesis, and CVC placement, it is rarely a current requirement. Second, experts recommend requiring minimum numbers of procedures for both initial and ongoing privileging even though such minimums are not currently required at half of their hospitals. Third, recommended minimum numbers were generally higher than those currently in place.
The routine use of ultrasound guidance for thoracentesis, paracentesis, and CVC placement is likely a result of increased adoption based on the literature showing clinical benefits.6-9 Thus, the expert recommendations for required use of ultrasound guidance for these procedures seems both appropriate and feasible. The procedure minimums identified in our study are similar to prior ABIM guidelines when manual competency was required for board certification in internal medicine and are comparable to recent minimums proposed by the Society of Critical Care Medicine, both of which recommended a minimum of 5 to 10 per procedure.10,11 Nevertheless, no commonly agreed-upon minimum number of procedures currently exists for certification of competency, and the variability seen in the experts’ responses further supports the idea that no specific number will guarantee competence. Thus, while requiring minimum numbers of procedures was generally considered necessary by our experts, minimums alone were also considered insufficient for initial privileging because most recommended that direct observation and simulation should be part of an initial privileging process.
These findings encourage more rigorous requirements for both initial and ongoing privileging of procedures. Nevertheless, our findings were rarely unanimous. The most frequently cited reason for disagreement on our findings was feasibility and capacity for direct observation, and the absence of ultrasound equipment or simulators, particularly in resource-limited clinical environments.
Our study has several strengths and limitations. One strength is the recruitment of study experts specifically composed of hospitalist procedure experts from diverse geographic and hospital settings. Yet, we acknowledge that our findings may not be generalizable to other specialties. Another strength is we obtained 100% participation from the experts surveyed. Weaknesses of this study include the relatively small number of experts who are likely to be biased in favor of both the use of ultrasound guidance and higher standards for privileging. We also relied on self-reported data about privileging processes rather than direct observation of those practices. Finally, questions were framed in the context of only 1 possible privileging pathway, and experts may respond differently to a different framing.
CONCLUSION
Our findings may guide the development of more standardized frameworks for initial and ongoing privileging of hospitalists for invasive bedside procedures. In particular, additional privileging requirements may include the routine use of ultrasound guidance for paracentesis, thoracentesis, and CVC insertion; simulation preceding direct observation of manual skills if possible; and higher required minimums of procedures for both initial and ongoing privileging. The goal of a standardized framework for privileging should be directed at improving the quality and safety of bedside procedures but must consider feasibility in diverse clinical settings where hospitalists work.
Acknowledgments
The authors thank the hospitalists on the SHM POCUS Task Force who provided data about their institutions’ privileging processes and requirements. They are also grateful to Loretta M. Grikis, MLS, AHIP, at the White River Junction Veterans Affairs Medical Center for her assistance as a medical librarian.
Disclosure
B
1. Nichani S, Jonathan Crocker, MD, Nick Fitterman, MD, Michael Lukela, MD, Updating the core competencies in hospital medicine—2017 revision: Introduction and methodology. J Hosp Med 2017;12(4);283-287. PubMed
2. American Board of Internal Medicine. Policies and Procedures for Certification. http://www.abim.org/certification/policies/imss/im.aspx - procedures. Published July 2016. Accessed on November 8, 2016.
3. Department of Health & Human Services. Centers for Medicare & Medicaid Services (CMS) Requirements for Hospital Medical Staff Privileging. Centers for Medicare and Medicaid Services website. https://www.cms.gov/Medicare/Provider-Enrollment-and-Certification/SurveyCertificationGenInfo/downloads/SCLetter05-04.pdf. Published November 12, 2004. Accessed on November 8, 2016.
4. Blackmon SH, Cooke DT, Whyte R, et al. The Society of Thoracic Surgeons Expert Consensus Statement: A tool kit to assist thoracic surgeons seeking privileging to use new technology and perform advanced procedures in general thoracic surgery. Ann Thorac Surg. 2016;101(3):1230-1237. PubMed
5. Bhora FY, Al-Ayoubi AM, Rehmani SS, Forleiter CM, Raad WN, Belsley SG. Robotically assisted thoracic surgery: proposed guidelines for privileging and credentialing. Innovations (Phila). 2016;11(6):386-389. PubMed
6. Mercaldi CJ, Lanes SF. Ultrasound guidance decreases complications and improves the cost of care among patients undergoing thoracentesis and paracentesis. Chest. 2013;143:532-538. PubMed
7. Patel PA, Ernst FR, Gunnarsson CL. Ultrasonography guidance reduces complications and costs associated with thoracentesis procedures. J Clin Ultrasound. 2012;40:135-141. PubMed
8. Brass P, Hellmich M, Kolodziej L, Schick G, Smith AF. Ultrasound guidance versus anatomical landmarks for internal jugular vein catheterization. Cochrane Database Syst Rev. 2015;1:CD006962. DOI: 10.1002/14651858.CD006962.pub2. PubMed
9. Brass P, Hellmich M, Kolodziej L, Schick G, Smith AF. Ultrasound guidance versus anatomical landmarks for subclavian or femoral vein catheterization. Cochrane Database Syst Rev. 2015;1:CD011447. DOI: 10.1002/14651858.CD011447. PubMed
10. American Board of Internal Medicine. Policies and Procedures. Philadelphia, PA; July 1990.
11. Society of Critical Care Medicine Ultrasound Certification Task Force. Recommendations for Achieving and Maintaining Competence and Credentialing in Critical Care Ultrasound with Focused Cardiac Ultrasound and Advanced Critical Care Echocardiography. http://journals.lww.com/ccmjournal/Documents/Critical%20Care%20Ultrasound.pdf. Published 2013. Accessed November 8, 2016.
Performance of 6 bedside procedures (paracentesis, thoracentesis, lumbar puncture, arthrocentesis, central venous catheter [CVC] placement, and arterial line placement) are considered core competencies for hospitalists.1 Yet, the American Board of Internal Medicine (ABIM) no longer requires demonstration of manual competency for bedside procedures, and graduates may enter the workforce with minimal or no experience performing such procedures.2 As such, the burden falls on hospital privileging committees to ensure providers have the necessary training and experience to competently perform invasive procedures before granting institutional privileges to perform them.3 Although recommendations for privileging to perform certain surgical procedures have been proposed,4,5 there are no widely accepted guidelines for initial or ongoing privileging of common invasive bedside procedures performed by hospitalists, and current privileging practices vary significantly.
In 2015, the Society of Hospital Medicine (SHM) set up a Point-of-Care Ultrasound (POCUS) Task Force to draft evidence-based guidelines on the use of ultrasound to perform bedside procedures. The recommendations for certification of competency in ultrasound-guided procedures may guide institutional privileging. The purpose of this study was to better understand current hospital privileging practices for invasive bedside procedures both with and without ultrasound guidance and how current practices are perceived by experts.
METHODS
Study Design, Setting, and Participants
After approval by the University of Texas Health Science Center at San Antonio Institutional Review Board, we conducted a survey of hospital privileging processes for bedside procedures from a convenience sample of hospitalist procedure experts on the SHM POCUS Task Force. All 21 hospitalists on the task force were invited to participate, including the authors of this article. These hospitalists represent 21 unique institutions, and all have clinical, educational, and/or research expertise in ultrasound-guided bedside procedures.
Survey Design
A 26-question, electronic survey on privileging for bedside procedures was conducted (Appendix A). Twenty questions addressed procedures in general, such as minimum numbers of procedures required and use of simulation. Six questions focused on the use of ultrasound guidance. To provide context, many questions were framed to assess a privileging process being drafted by the task force. Answers were either multiple choice or free text.
Data Collection and Analysis
All members of the task force were invited to complete the survey by e-mail during November 2016. A reminder e-mail was sent on the day after initial distribution. No compensation was offered, and participation was not required. Survey results were compiled electronically through Research Electronic Data Capture, or “REDCap”TM (Nashville, Tennessee), and data analysis was performed with Stata version 14 (College Station, Texas). Means of current and recommended minimum thresholds were calculated by excluding responses of “I don’t know,” and responses of “no minimum number threshold” were coded as 0.
RESULTS
The survey response rate was 100% (21 of 21). All experts were hospitalists, but 2 also identified themselves as intensivists. Experts practiced in a variety of hospital settings, including private university hospitals (43%), public university hospitals (19%), Veterans Affairs teaching hospitals (14%), community teaching hospitals (14%), and community nonteaching hospitals (10%). Most hospitals (90%) were teaching hospitals for internal medicine trainees. All experts have personally performed bedside procedures on a regular basis, and most (86%) had leadership roles in teaching procedures to students, residents, fellows, physician assistants, nurse practitioners, and/or physicians. Approximately half (57%) were involved in granting privileges for bedside procedures at their institutions.
Only half of the experts reported that their hospitals required a minimum number of procedures to earn initial (48%) or ongoing (52%) privileges to perform bedside procedures. Nevertheless, most experts thought there ought to be minimum numbers of procedures for initial (81%) and ongoing (81%) privileging, recommending higher minimums for both initial and ongoing privileging than are currently required at their hospitals (Figure 2).
Most hospitalist procedure experts thought that simulation training (67%) and direct observation of procedural skills (71%) should be core components of an initial privileging process. Many of the experts who did not agree with direct observation or simulation training as core components of initial privileging had concerns about feasibility with respect to manpower, availability of simulation equipment, and costs. In contrast, the majority (67%) did not think it was necessary to directly observe providers for ongoing privileging when routine monitoring was in place for periprocedural complications, which all experts (100%) agreed should be in place.
DISCUSSION
Our survey identified 3 distinct differences between hospitalist procedure experts’ recommendations and their own hospitals’ current privileging practices. First, whereas experts recommended ultrasound guidance for thoracentesis, paracentesis, and CVC placement, it is rarely a current requirement. Second, experts recommend requiring minimum numbers of procedures for both initial and ongoing privileging even though such minimums are not currently required at half of their hospitals. Third, recommended minimum numbers were generally higher than those currently in place.
The routine use of ultrasound guidance for thoracentesis, paracentesis, and CVC placement is likely a result of increased adoption based on the literature showing clinical benefits.6-9 Thus, the expert recommendations for required use of ultrasound guidance for these procedures seems both appropriate and feasible. The procedure minimums identified in our study are similar to prior ABIM guidelines when manual competency was required for board certification in internal medicine and are comparable to recent minimums proposed by the Society of Critical Care Medicine, both of which recommended a minimum of 5 to 10 per procedure.10,11 Nevertheless, no commonly agreed-upon minimum number of procedures currently exists for certification of competency, and the variability seen in the experts’ responses further supports the idea that no specific number will guarantee competence. Thus, while requiring minimum numbers of procedures was generally considered necessary by our experts, minimums alone were also considered insufficient for initial privileging because most recommended that direct observation and simulation should be part of an initial privileging process.
These findings encourage more rigorous requirements for both initial and ongoing privileging of procedures. Nevertheless, our findings were rarely unanimous. The most frequently cited reason for disagreement on our findings was feasibility and capacity for direct observation, and the absence of ultrasound equipment or simulators, particularly in resource-limited clinical environments.
Our study has several strengths and limitations. One strength is the recruitment of study experts specifically composed of hospitalist procedure experts from diverse geographic and hospital settings. Yet, we acknowledge that our findings may not be generalizable to other specialties. Another strength is we obtained 100% participation from the experts surveyed. Weaknesses of this study include the relatively small number of experts who are likely to be biased in favor of both the use of ultrasound guidance and higher standards for privileging. We also relied on self-reported data about privileging processes rather than direct observation of those practices. Finally, questions were framed in the context of only 1 possible privileging pathway, and experts may respond differently to a different framing.
CONCLUSION
Our findings may guide the development of more standardized frameworks for initial and ongoing privileging of hospitalists for invasive bedside procedures. In particular, additional privileging requirements may include the routine use of ultrasound guidance for paracentesis, thoracentesis, and CVC insertion; simulation preceding direct observation of manual skills if possible; and higher required minimums of procedures for both initial and ongoing privileging. The goal of a standardized framework for privileging should be directed at improving the quality and safety of bedside procedures but must consider feasibility in diverse clinical settings where hospitalists work.
Acknowledgments
The authors thank the hospitalists on the SHM POCUS Task Force who provided data about their institutions’ privileging processes and requirements. They are also grateful to Loretta M. Grikis, MLS, AHIP, at the White River Junction Veterans Affairs Medical Center for her assistance as a medical librarian.
Disclosure
B
1. Nichani S, Jonathan Crocker, MD, Nick Fitterman, MD, Michael Lukela, MD, Updating the core competencies in hospital medicine—2017 revision: Introduction and methodology. J Hosp Med 2017;12(4);283-287. PubMed
2. American Board of Internal Medicine. Policies and Procedures for Certification. http://www.abim.org/certification/policies/imss/im.aspx - procedures. Published July 2016. Accessed on November 8, 2016.
3. Department of Health & Human Services. Centers for Medicare & Medicaid Services (CMS) Requirements for Hospital Medical Staff Privileging. Centers for Medicare and Medicaid Services website. https://www.cms.gov/Medicare/Provider-Enrollment-and-Certification/SurveyCertificationGenInfo/downloads/SCLetter05-04.pdf. Published November 12, 2004. Accessed on November 8, 2016.
4. Blackmon SH, Cooke DT, Whyte R, et al. The Society of Thoracic Surgeons Expert Consensus Statement: A tool kit to assist thoracic surgeons seeking privileging to use new technology and perform advanced procedures in general thoracic surgery. Ann Thorac Surg. 2016;101(3):1230-1237. PubMed
5. Bhora FY, Al-Ayoubi AM, Rehmani SS, Forleiter CM, Raad WN, Belsley SG. Robotically assisted thoracic surgery: proposed guidelines for privileging and credentialing. Innovations (Phila). 2016;11(6):386-389. PubMed
6. Mercaldi CJ, Lanes SF. Ultrasound guidance decreases complications and improves the cost of care among patients undergoing thoracentesis and paracentesis. Chest. 2013;143:532-538. PubMed
7. Patel PA, Ernst FR, Gunnarsson CL. Ultrasonography guidance reduces complications and costs associated with thoracentesis procedures. J Clin Ultrasound. 2012;40:135-141. PubMed
8. Brass P, Hellmich M, Kolodziej L, Schick G, Smith AF. Ultrasound guidance versus anatomical landmarks for internal jugular vein catheterization. Cochrane Database Syst Rev. 2015;1:CD006962. DOI: 10.1002/14651858.CD006962.pub2. PubMed
9. Brass P, Hellmich M, Kolodziej L, Schick G, Smith AF. Ultrasound guidance versus anatomical landmarks for subclavian or femoral vein catheterization. Cochrane Database Syst Rev. 2015;1:CD011447. DOI: 10.1002/14651858.CD011447. PubMed
10. American Board of Internal Medicine. Policies and Procedures. Philadelphia, PA; July 1990.
11. Society of Critical Care Medicine Ultrasound Certification Task Force. Recommendations for Achieving and Maintaining Competence and Credentialing in Critical Care Ultrasound with Focused Cardiac Ultrasound and Advanced Critical Care Echocardiography. http://journals.lww.com/ccmjournal/Documents/Critical%20Care%20Ultrasound.pdf. Published 2013. Accessed November 8, 2016.
© 2017 Society of Hospital Medicine
An Opportunity to Improve Medicare’s Planned Readmissions Measure
Readmissions result in $41.3 billion in annual healthcare expenses.1 As a result of the Affordable Care Act, Centers for Medicare & Medicaid Services (CMS) implemented the Hospital Readmission Reduction Program (HRRP) to reduce expenditures and improve quality associated with hospital care.2-5 The HRRP monitors readmission rates for pneumonia, congestive heart failure (CHF), acute myocardial infarction (AMI), chronic obstructive pulmonary disease (COPD), coronary artery bypass graft (CABG), and joint replacement. Hospitals are penalized for excess readmissions that occur following any of these index admissions. However, some readmissions within 30 days of an index admission are planned. For example, patients may have scheduled admissions for chemotherapy visits or may have prescheduled elective surgeries that happen to fall within a 30-day postdischarge window. Furthermore, even unplanned readmissions may not be a marker of suboptimal care.6 To prevent penalization for planned readmissions, CMS developed an algorithm to exclude planned readmissions from the HRRP.7
Few studies have investigated the planned readmissions in the HRRP since Horwitz and colleagues7 developed the algorithm with the assistance of a technical expert panel and validated it by reviewing charts in 2 healthcare systems comprising 7 hospitals. Most studies focus on unplanned readmissions.8,9 We build on this work by studying readmissions for 131 hospitals and using administrative claims to determine whether the algorithm could be improved. Specifically, we examined planned readmissions after the conditions included in the HRRP and determine whether they occurred under elective, urgent, or emergent circumstances. The goal is to assess whether the algorithm may misclassify some readmissions as planned even though the readmission is unanticipated. We hypothesize that some readmissions considered planned by the HRRP will occur under emergent circumstances. Our findings will provide more nuanced insights regarding planned readmissions and potentially provide a mechanism to identify potentially misclassified readmissions without administrative burden.
METHODS
We analyzed Medicare claims from 2011 to 2015 for beneficiaries in Michigan who had index admissions for pneumonia, CHF, AMI, COPD, CABG, and joint replacement. Exclusion criteria were as follows: patients who were not continuously enrolled in Medicare Part A and B, had health maintenance organization coverage, were transferred to another hospital during the index admission, or received Medicare because of end-stage renal disease or disability. Patients with hip fractures were excluded because the HRRP readmission algorithm only includes elective, unilateral, total hip arthroplasties. Transfer patients were excluded because these patients are excluded from the HRRP readmission algorithm. We also excluded patients who died within 90 days of their index admission because these patients are often outliers in regards to healthcare utilization. The institutional review board at our health system deemed this study exempt from review.
For each hospital and each condition, we calculated 30-day readmission rates by identifying inpatient claims that occurred following discharge from the index admission. For patients who had multiple readmissions, we only considered the first readmission, as this follows the HRRP method. All readmissions were credited to the hospital where the index admission occurred.
To calculate 30-day planned readmission rates, we examined all readmissions and identified those deemed planned by version 3.0 of the CMS readmissions algorithm.10 We characterized these planned readmissions by examining the admission type variable and the presence or absence of emergency department (ED) charges. Planned readmissions that had an admission type of “emergent” or “urgent” and/or ED charges may have been unplanned. Because we cannot unequivocally determine whether or not the readmissions were misclassified, we refer to these readmissions as “potentially misclassified” in this manuscript. We also calculated the potential misclassification rate by hospital type.
RESULTS

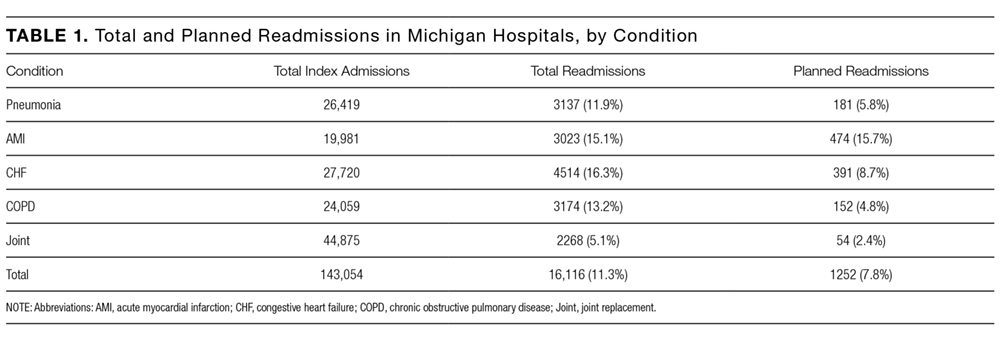
For 131 Michigan hospitals, we identified 143,054 index admissions, 16,116 (11.3%) 30-day readmissions, and 1252 (7.8%) planned readmissions (Table 1).
Of the unplanned readmissions, 97.0% had either an admission type that was “urgent” or “emergent” and/or ED charges, 96.2% were associated with an “emergent” or “urgent” admission type, and 84.3% had emergency room charges on the claim line.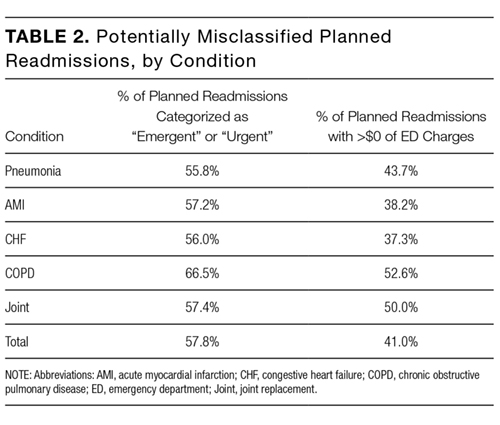
There were some differences in potential misclassification rate by hospital type. Specifically, teaching hospitals had lower potential misclassification rates than nonteaching hospitals (57.9% vs 59.7%). Larger (≥300 beds) hospitals had similar potential misclassification rates to smaller (<300 beds) hospitals (58.1% vs 58.6%). Urban hospitals had lower potential misclassification rates than rural hospitals (58.0% vs 63.3%).
DISCUSSION
In this study, we found that planned readmissions are generally infrequent. However, the majority are coded with an emergent or urgent admission type and many have ED charges reported on the claim. These findings suggest that the CMS readmission algorithm examined in this study may potentially misclassify many planned readmissions and that CMS should explore the use of admission type and presence of ED charges in the unplanned/planned readmission algorithm.
Our primary finding that planned readmissions are infrequent is supported by several observations.7-9,11 In the initial article describing the CMS algorithm,7 7.8% of readmissions were considered planned; upon review of the discharge medical records from the index admissions, 41.3% of these planned readmissions were found to be unplanned. These findings closely correlate with our own findings that 7.8% of readmissions were considered planned by the CMS criteria, and 57.8% of planned readmissions were urgent or emergent. From a clinical perspective, there are few circumstances where a patient undergoing an elective procedure will transit electively through the ED.
The CMS algorithm was intentionally designed to have a high specificity for unplanned readmissions to ensure that truly planned readmissions would not be characterized as unplanned.7 There is a potential tradeoff to increasing the sensitivity for unplanned readmissions, in that more planned readmissions might be inadvertently characterized as unplanned. Additional validation work (ie, medical chart review) will be required to explore potentially misclassified planned readmissions in greater detail.
Our study has several limitations. First, we rely solely on information in administrative claims to determine whether an admission is planned. The full clinical story is obviously limited by this method. However, the CMS readmission algorithm is only based on information from administrative claims,7 and our goal was to explore a method of improving the algorithm that could be applied by CMS in a pragmatic manner. Second, the validity of the admission type variable for the purpose of identifying “emergent” and “urgent” admissions is not entirely clear. However, based on personal communication with the Research Data Assistance Center, the variable is known to be reliable, although no specific validity testing has been performed. Third, it is possible that some truly planned readmissions began in the ED. This situation may arise at small hospitals. However, we found that most of the planned readmissions that started in the ED had secondary diagnosis codes associated with acute conditions. In addition, we did not find a disproportionate number of potentially misclassified planned readmissions at small hospitals. Fourth, the association between high readmission rates and poor quality of care has been called into question recently. However, the purpose of this study is not to assess the quality of healthcare provided by these hospitals; our intent is to explore opportunities to improve the HRRP planned readmission algorithm. Fifth, our analysis only included the state of Michigan. However, Michigan is 1 of the 10 largest states by population, and we do not expect significant differences between our data and the rest of the country. Sixth, we conducted this analysis with version 3.0 of the CMS readmission algorithm. The latest version (4.0) has made several substantial changes to reduce the number of potentially misclassified planned readmissions. However, neither admission type nor presence of ED charges are considered in the updated version. Therefore, our study provides another potential target for further improvement.
These limitations notwithstanding, these findings have important implications for key stakeholders. Relevant to policymakers, the finding that a large percentage of the planned readmissions had ED charges and/or emergent/urgent admission claim type suggests that CMS should explore the use of these variables in their readmission algorithm. Relevant to hospitals and physicians, the potential misclassification of some planned readmissions suggests that close evaluation of the sources and causes of readmission is imperative during the local development of readmission reduction initiatives.
Collectively, these findings suggest that although planned readmissions are infrequent, many of these planned readmissions may actually be nonelective or unplanned in nature. Furthermore, our findings suggest that the CMS readmission algorithm might improve its accuracy by considering the admission type and the presence of ED charges. Future research in this area should focus on validating the use of ED charges and admission type to identify unplanned readmissions through medical chart review. The aim of the HRRP is to identify signals of poor quality in a fair and equitable manner. Misclassification of readmissions will limit CMS’ ability to achieve this important goal.
Disclosure
None of the authors have any conflicts of interest to disclose.
1. Hines AL, Barrett ML, Jiang HJ, Steiner CA. Conditions with the largest number of adult hospital readmissions by payer, 2011. HCUP Statistical Brief #172. April 2014. https://www.hcup-us.ahrq.gov/reports/statbriefs/sb172-Conditions-Readmissions-Payer.jsp. PubMed
2. Kahn CN, Ault T, Potetz L, et al. Assessing Medicare’s hospital pay-for- performance programs and whether they are achieving their goals. Health Aff (Millwood). 2015;34:1281-1288. PubMed
3. Barnett ML, Hsu J and McWilliams JM. Patient characteristics and differences in hospital readmission rates. JAMA Intern. Med. 2015;175:1803-1812. PubMed
4. Jha AK. Seeking rational approaches to fixing hospital readmissions. JAMA 2015;314:1681-1682. PubMed
5. Shih T, Ryan AM, Gonzalez AA, et al. Medicare’s hospital readmissions reduction program in surgery may disproportionately affect minority-serving hospitals. Ann Surg. 2015;261:1027-1031. PubMed
6. Schairer WW, Sing DC, Vail TP, et al. Causes and frequency of unplanned hospital readmission after total hip arthroplasty. Clin Orthop Relat Res. 2014;472:464-470. PubMed
7. Horwitz LI, Grady JN, Cohen DB, et al. Development and validation of an algorithm to identify planned readmissions from claims data. J Hosp Med. 2015;10:670-677. PubMed
8. Bernatz JT, Tueting JL, Hetzel S, et al. What are the 30-day readmission rates across orthopaedic subspecialties? Clin Orthop Relat Res. 2016;474:838-847. PubMed
9. Sacks GD, Dawes AJ, Russell MM, et al. Evaluation of hospital readmissions in surgical patients: do administrative data tell the real story? JAMA Surg. 2014;149:759-764. PubMed
10. QualityNet. http://www.qualitynet.org/dcs/ContentServer?c=Page&pagename=QnetPublic%2FPage%2FQnetTier4&cid=1228774267858. Accessed on January 15, 2016.
11. Glebova NO, Bronsert M, Hicks CW, et al. Contributions of planned readmissions and patient comorbidities to high readmission rates in vascular surgery patients. J Vasc Surg. 2016;63:746-755.e2. PubMed
Readmissions result in $41.3 billion in annual healthcare expenses.1 As a result of the Affordable Care Act, Centers for Medicare & Medicaid Services (CMS) implemented the Hospital Readmission Reduction Program (HRRP) to reduce expenditures and improve quality associated with hospital care.2-5 The HRRP monitors readmission rates for pneumonia, congestive heart failure (CHF), acute myocardial infarction (AMI), chronic obstructive pulmonary disease (COPD), coronary artery bypass graft (CABG), and joint replacement. Hospitals are penalized for excess readmissions that occur following any of these index admissions. However, some readmissions within 30 days of an index admission are planned. For example, patients may have scheduled admissions for chemotherapy visits or may have prescheduled elective surgeries that happen to fall within a 30-day postdischarge window. Furthermore, even unplanned readmissions may not be a marker of suboptimal care.6 To prevent penalization for planned readmissions, CMS developed an algorithm to exclude planned readmissions from the HRRP.7
Few studies have investigated the planned readmissions in the HRRP since Horwitz and colleagues7 developed the algorithm with the assistance of a technical expert panel and validated it by reviewing charts in 2 healthcare systems comprising 7 hospitals. Most studies focus on unplanned readmissions.8,9 We build on this work by studying readmissions for 131 hospitals and using administrative claims to determine whether the algorithm could be improved. Specifically, we examined planned readmissions after the conditions included in the HRRP and determine whether they occurred under elective, urgent, or emergent circumstances. The goal is to assess whether the algorithm may misclassify some readmissions as planned even though the readmission is unanticipated. We hypothesize that some readmissions considered planned by the HRRP will occur under emergent circumstances. Our findings will provide more nuanced insights regarding planned readmissions and potentially provide a mechanism to identify potentially misclassified readmissions without administrative burden.
METHODS
We analyzed Medicare claims from 2011 to 2015 for beneficiaries in Michigan who had index admissions for pneumonia, CHF, AMI, COPD, CABG, and joint replacement. Exclusion criteria were as follows: patients who were not continuously enrolled in Medicare Part A and B, had health maintenance organization coverage, were transferred to another hospital during the index admission, or received Medicare because of end-stage renal disease or disability. Patients with hip fractures were excluded because the HRRP readmission algorithm only includes elective, unilateral, total hip arthroplasties. Transfer patients were excluded because these patients are excluded from the HRRP readmission algorithm. We also excluded patients who died within 90 days of their index admission because these patients are often outliers in regards to healthcare utilization. The institutional review board at our health system deemed this study exempt from review.
For each hospital and each condition, we calculated 30-day readmission rates by identifying inpatient claims that occurred following discharge from the index admission. For patients who had multiple readmissions, we only considered the first readmission, as this follows the HRRP method. All readmissions were credited to the hospital where the index admission occurred.
To calculate 30-day planned readmission rates, we examined all readmissions and identified those deemed planned by version 3.0 of the CMS readmissions algorithm.10 We characterized these planned readmissions by examining the admission type variable and the presence or absence of emergency department (ED) charges. Planned readmissions that had an admission type of “emergent” or “urgent” and/or ED charges may have been unplanned. Because we cannot unequivocally determine whether or not the readmissions were misclassified, we refer to these readmissions as “potentially misclassified” in this manuscript. We also calculated the potential misclassification rate by hospital type.
RESULTS
For 131 Michigan hospitals, we identified 143,054 index admissions, 16,116 (11.3%) 30-day readmissions, and 1252 (7.8%) planned readmissions (Table 1).
Of the unplanned readmissions, 97.0% had either an admission type that was “urgent” or “emergent” and/or ED charges, 96.2% were associated with an “emergent” or “urgent” admission type, and 84.3% had emergency room charges on the claim line.
There were some differences in potential misclassification rate by hospital type. Specifically, teaching hospitals had lower potential misclassification rates than nonteaching hospitals (57.9% vs 59.7%). Larger (≥300 beds) hospitals had similar potential misclassification rates to smaller (<300 beds) hospitals (58.1% vs 58.6%). Urban hospitals had lower potential misclassification rates than rural hospitals (58.0% vs 63.3%).
DISCUSSION
In this study, we found that planned readmissions are generally infrequent. However, the majority are coded with an emergent or urgent admission type and many have ED charges reported on the claim. These findings suggest that the CMS readmission algorithm examined in this study may potentially misclassify many planned readmissions and that CMS should explore the use of admission type and presence of ED charges in the unplanned/planned readmission algorithm.
Our primary finding that planned readmissions are infrequent is supported by several observations.7-9,11 In the initial article describing the CMS algorithm,7 7.8% of readmissions were considered planned; upon review of the discharge medical records from the index admissions, 41.3% of these planned readmissions were found to be unplanned. These findings closely correlate with our own findings that 7.8% of readmissions were considered planned by the CMS criteria, and 57.8% of planned readmissions were urgent or emergent. From a clinical perspective, there are few circumstances where a patient undergoing an elective procedure will transit electively through the ED.
The CMS algorithm was intentionally designed to have a high specificity for unplanned readmissions to ensure that truly planned readmissions would not be characterized as unplanned.7 There is a potential tradeoff to increasing the sensitivity for unplanned readmissions, in that more planned readmissions might be inadvertently characterized as unplanned. Additional validation work (ie, medical chart review) will be required to explore potentially misclassified planned readmissions in greater detail.
Our study has several limitations. First, we rely solely on information in administrative claims to determine whether an admission is planned. The full clinical story is obviously limited by this method. However, the CMS readmission algorithm is only based on information from administrative claims,7 and our goal was to explore a method of improving the algorithm that could be applied by CMS in a pragmatic manner. Second, the validity of the admission type variable for the purpose of identifying “emergent” and “urgent” admissions is not entirely clear. However, based on personal communication with the Research Data Assistance Center, the variable is known to be reliable, although no specific validity testing has been performed. Third, it is possible that some truly planned readmissions began in the ED. This situation may arise at small hospitals. However, we found that most of the planned readmissions that started in the ED had secondary diagnosis codes associated with acute conditions. In addition, we did not find a disproportionate number of potentially misclassified planned readmissions at small hospitals. Fourth, the association between high readmission rates and poor quality of care has been called into question recently. However, the purpose of this study is not to assess the quality of healthcare provided by these hospitals; our intent is to explore opportunities to improve the HRRP planned readmission algorithm. Fifth, our analysis only included the state of Michigan. However, Michigan is 1 of the 10 largest states by population, and we do not expect significant differences between our data and the rest of the country. Sixth, we conducted this analysis with version 3.0 of the CMS readmission algorithm. The latest version (4.0) has made several substantial changes to reduce the number of potentially misclassified planned readmissions. However, neither admission type nor presence of ED charges are considered in the updated version. Therefore, our study provides another potential target for further improvement.
These limitations notwithstanding, these findings have important implications for key stakeholders. Relevant to policymakers, the finding that a large percentage of the planned readmissions had ED charges and/or emergent/urgent admission claim type suggests that CMS should explore the use of these variables in their readmission algorithm. Relevant to hospitals and physicians, the potential misclassification of some planned readmissions suggests that close evaluation of the sources and causes of readmission is imperative during the local development of readmission reduction initiatives.
Collectively, these findings suggest that although planned readmissions are infrequent, many of these planned readmissions may actually be nonelective or unplanned in nature. Furthermore, our findings suggest that the CMS readmission algorithm might improve its accuracy by considering the admission type and the presence of ED charges. Future research in this area should focus on validating the use of ED charges and admission type to identify unplanned readmissions through medical chart review. The aim of the HRRP is to identify signals of poor quality in a fair and equitable manner. Misclassification of readmissions will limit CMS’ ability to achieve this important goal.
Disclosure
None of the authors have any conflicts of interest to disclose.
1. Hines AL, Barrett ML, Jiang HJ, Steiner CA. Conditions with the largest number of adult hospital readmissions by payer, 2011. HCUP Statistical Brief #172. April 2014. https://www.hcup-us.ahrq.gov/reports/statbriefs/sb172-Conditions-Readmissions-Payer.jsp. PubMed
2. Kahn CN, Ault T, Potetz L, et al. Assessing Medicare’s hospital pay-for- performance programs and whether they are achieving their goals. Health Aff (Millwood). 2015;34:1281-1288. PubMed
3. Barnett ML, Hsu J and McWilliams JM. Patient characteristics and differences in hospital readmission rates. JAMA Intern. Med. 2015;175:1803-1812. PubMed
4. Jha AK. Seeking rational approaches to fixing hospital readmissions. JAMA 2015;314:1681-1682. PubMed
5. Shih T, Ryan AM, Gonzalez AA, et al. Medicare’s hospital readmissions reduction program in surgery may disproportionately affect minority-serving hospitals. Ann Surg. 2015;261:1027-1031. PubMed
6. Schairer WW, Sing DC, Vail TP, et al. Causes and frequency of unplanned hospital readmission after total hip arthroplasty. Clin Orthop Relat Res. 2014;472:464-470. PubMed
7. Horwitz LI, Grady JN, Cohen DB, et al. Development and validation of an algorithm to identify planned readmissions from claims data. J Hosp Med. 2015;10:670-677. PubMed
8. Bernatz JT, Tueting JL, Hetzel S, et al. What are the 30-day readmission rates across orthopaedic subspecialties? Clin Orthop Relat Res. 2016;474:838-847. PubMed
9. Sacks GD, Dawes AJ, Russell MM, et al. Evaluation of hospital readmissions in surgical patients: do administrative data tell the real story? JAMA Surg. 2014;149:759-764. PubMed
10. QualityNet. http://www.qualitynet.org/dcs/ContentServer?c=Page&pagename=QnetPublic%2FPage%2FQnetTier4&cid=1228774267858. Accessed on January 15, 2016.
11. Glebova NO, Bronsert M, Hicks CW, et al. Contributions of planned readmissions and patient comorbidities to high readmission rates in vascular surgery patients. J Vasc Surg. 2016;63:746-755.e2. PubMed
©2017 Society of Hospital Medicine
Post-Intensive Care Unit Psychiatric Comorbidity and Quality of Life
The prevalence of depression, anxiety, and posttraumatic stress disorder (PTSD) symptoms in intensive care unit (ICU) survivors ranges from 17% to 44%.1-4 Psychiatric comorbidity, the presence of 2 or more psychiatric disorders, is highly prevalent in survivors of acute respiratory distress syndrome and is associated with higher mortality in postsurgical ICU survivors.5-7 While long-term cognitive impairment in patients with ICU delirium has been associated with poor quality of life (QoL),1 the effects of psychiatric comorbidity on QoL among similar patients are not as well understood. In this study, we examined whether psychiatric comorbidity was associated with poorer QoL in survivors of ICU delirium.
METHODS
We examined subjects who participated in the Pharmacologic Management of Delirium (PMD) clinical trial. This trial examined the efficacy of a pharmacological intervention for patients who developed ICU delirium at a local tertiary-care academic hospital.8 Out of 62 patients who participated in the follow-up of the PMD study, 58 completed QoL interviews and validated psychiatric screens (Patient Health Questionnaire-9 [PHQ-9] for depression, the Generalized Anxiety Disorder-7 [GAD-7] questionnaire for anxiety, and the Post-Traumatic Stress Syndrome [PTSS-10] questionnaire for PTSD) at 3 months after hospital discharge. High psychiatric comorbidity was defined as having significant symptoms for all 3 conditions (depression: PHQ-9 score ≥ 10; anxiety: GAD-7 ≥ 10; and PTSD: PTSS-10 > 35). No psychiatric morbidity was defined as having no significant symptoms for all 3 conditions. Low to moderate (low-moderate) psychiatric morbidity was defined as having symptoms for 1 to 2 conditions.
Participants also completed 2 complementary QoL measures: the EuroQol 5 dimensions questionnaire 3-level (EQ-5D-3L) Index and the EuroQol 5 dimensions Visual Analog Scale (EQ-5D-VAS).9 The EQ-5D-3L Index asks participants to rate themselves as having (1) no problems, (2) some problems, or (3) extreme problems on the following 5 scales: mobility, self-care, usual activities, pain/discomfort, and anxiety/depression. The scores are then indexed against the US population to create a continuous index scale ranging from −0.11 to 1.00.
Fisher’s exact tests were used to compare dichotomous outcomes. Analysis of variance (ANOVA) was used to compare continuous outcomes across the 3 psychiatric groups. Analysis of covariance (ANCOVA) was used to determine whether psychiatric comorbidity in survivors of ICU delirium was associated with QoL measures. Models were adjusted for the following covariates: age, gender, Charlson Comorbidity Index, discharged to home, prior history of depression, and prior history of anxiety. To assess the relationship of psychiatric comorbidity with QoL, we chose the 2 continuous QoL measures as the outcome. Because we were interested in the effect of psychiatric burden on QoL, we used ANCOVA with QoL as the dependent variable and psychiatric burden as an independent variable. Pairwise comparisons were then performed when overall differences were significant (P < 0.05). We performed 2 separate sensitivity analyses. The first analysis looked solely at the subgroup of patients from the medical intensive care unit. We also recalculated the EQ-5D-3L index excluding the anxiety/depression item.
RESULTS
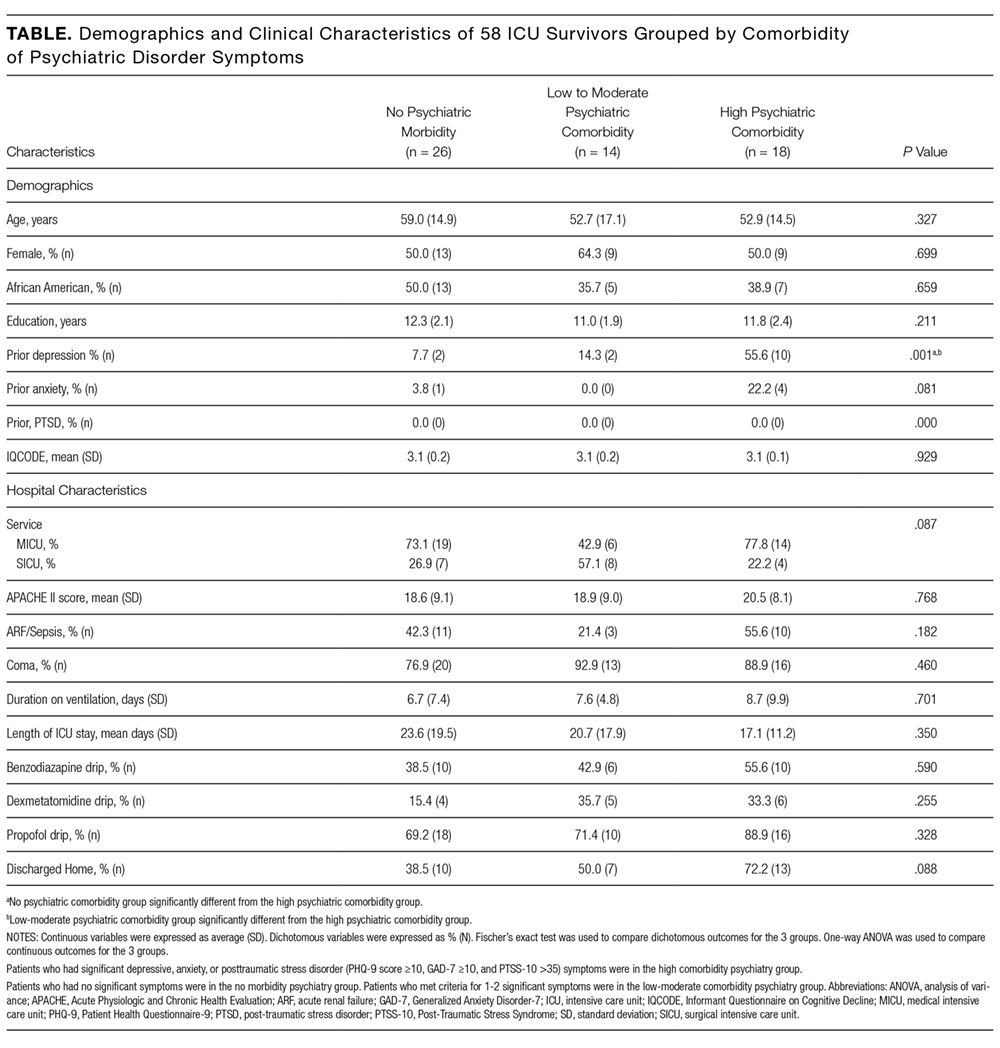
Nearly one-third of patients (18/58) had high psychiatric burden. The table looks at the demographic and clinical characteristics of patients with high psychiatric comorbidity versus those of low-moderate psychiatric comorbidity and those with no psychiatric morbidity. Patient groups did not differ significantly in terms of demographics. For clinical characteristics, patients with high psychiatric comorbidity were more likely than patients with low-moderate psychiatric comorbidity to have a prior history of depression (P < 0.05).
Patients with high psychiatric comorbidity were more likely to have a poorer QoL when compared with patients with low-moderate psychiatric comorbidity and to those with no morbidity as measured by a lower EQ-5D-3L Index (no, 0.69 ± 0.25; low-moderate, 0.70 ± 0.19; high, 0.48 ± 0.24; P = 0.006) and EQ-5D-VAS (no, 67.0 ± 20.7; low-moderate, 76.6 ± 20.0; high, 50.8 ± 22.4; P = 0.004). After adjusting for covariates, patients with high psychiatric comorbidity had a poorer QoL compared with those with no morbidity or low-moderate comorbidity on the EQ-5D-3L Index (P = 0.017 for overall differences), whereas patients who had high psychiatric comorbidity had a poorer QoL compared to those with low-moderate comorbidity on the EQ-5D-VAS (P = 0.039 for overall differences; Figure). Subgroup analysis of MICU patients yielded similar results. Patients with high psychiatric burden had significantly poorer QoL as measured by the EQ-5D-3L (unadjusted P = 0.044, adjusted P = 0.003) and the EQ-5D-VAS (unadjusted P = 0.007, adjusted P = 0.021). After excluding the anxiety/depression item from the EQ-5D-3L, we observed similar differences (no, 0.71 ± 0.24; low-moderate, 0.75 ± 0.15; high, 0.58 ± 0.22; unadjusted P = 0.062; adjusted P = 0.040).
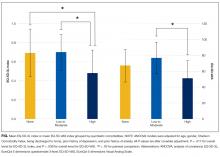
DISCUSSION/CONCLUSION
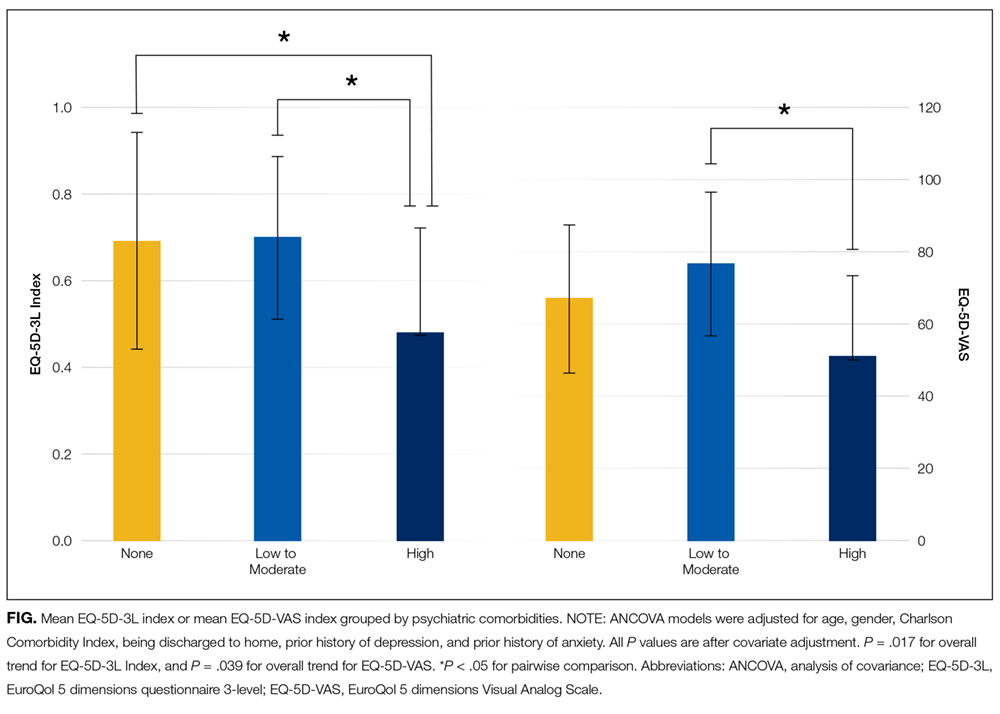
Psychiatric comorbidities in ICU survivors are common and pose a significant clinical issue. Patients with multiple psychiatric comorbidities can be more complicated to identify from a diagnostic standpoint and often require more prolonged, intensive mental health treatment when compared with patients with a single psychiatric disorder.10,11 Our study showed that high psychiatric comorbidity in survivors of ICU delirium is associated with a decreased QoL compared with those with no psychiatric comorbidity or with low-moderate psychiatric comorbidity. This finding is consistent with previous studies in the general population that patients with multiple psychiatric comorbidities are associated with a poorer QoL compared with patients with a single psychiatric comorbidity.10,11
There is a pressing need to better characterize psychiatric comorbidities in ICU survivors because our current evidence suggests that the prevalence of psychiatric comorbidities of ICU survivors is substantially higher than that of the general population. We found that nearly one-third of survivors of ICU delirium had comorbid depression, anxiety, and PTSD symptoms at 3 months. This is consistent with the few other studies of ICU survivors, which showed a prevalence of psychiatric comorbidity of 25% to 33%.5,12 These rates are substantially higher than the prevalence in the general population of 6%.13
The high rate of psychiatric comorbidities may render it difficult to effectively treat the mental health symptoms in ICU survivors.14 Treating multiple psychiatric comorbidities may also be especially challenging in survivors of ICU delirium because they have a high prevalence of cognitive impairment. Mental health treatments for patients with psychiatric disorders and comorbid cognitive impairment are limited. Better characterization of psychiatric comorbidity in ICU survivors, particularly those with ICU delirium, is vital to the development of more effective, bundled treatments for this population with multiple comorbidities.
Standardized screenings of ICU survivors at a high risk for psychiatric disorders, such as survivors of ICU delirium, may help to identify patients with comorbid psychiatric disorder symptoms and have them referred to appropriate treatment earlier with the hope of improving their QoL sooner. Although opportunities to deliver integrated outpatient collaborative mental health and medical care for a subspecialty population are limited, one potential model of care would be to utilize a collaborative-care model in an ICU survivor clinic.15
Strengths of our study include the examination of psychiatric comorbidities in survivors of ICU delirium, who often have a poor QoL. A deeper understanding of psychiatric comorbidity and its relationship with QoL is needed to better understand how to deliver more effective treatments for these survivors. Limitations include the small sample size, a one-time measurement of psychiatric comorbidities at the 3-month follow-up based on screenings tools, and a lack of objective measures of physical functioning to determine the effects of psychiatric comorbidities on physical functioning. There may also have been differences in how patients with no psychiatric comorbidity responded to the EQ-5D-VAS as a result of premorbid differences (eg, they were healthier prior to their ICU stay and perceived their survivor status more negatively). This may explain why we did not see a statistically significant difference between no psychiatric comorbidity and high psychiatric comorbidity groups on the EQ-5D-VAS. Nevertheless, we did see a difference between the low-moderate psychiatric comorbidity group on EQ-5D-VAS and differences between the no comorbidity and low-moderate comorbidity groups versus the high comorbidity group on the EQ-5D-3L. Finally, data about psychiatric history and QoL prior to ICU hospitalization were limited. Therefore, truly determining incidence versus prevalence of post-ICU comorbidities and whether psychiatric symptoms and its effects on QoL were due to ICU hospitalization or to premorbid psychiatric symptoms is difficult.
Our study demonstrated that in survivors of ICU delirium, higher comorbidity of psychiatric symptoms was associated with poorer QoL. Future studies will need to confirm these findings. We will also need to identify potentially reversible risk factors for psychiatric comorbidity and poorer QoL and develop treatments to effectively target the mental health symptoms of survivors of ICU delirium.
Disclosure
Grant support: The PMD trial is funded through the National Institutes of Health grant R01AG054205-02. SW is supported by NIA 2P30AG010133. AP is supported by CMS 1 L1 CMS331444-02-00, Indiana CTSI, and NIA R01AG054205-02. SG is supported by NIA 2P30AG010133, NIA 5R01AG045350, and NIA R01AG054205-02. SK is supported by NHBLI 5T32HL091816-07. MB is supported by NIA R01 AG040220-05, AHRQ P30 HS024384-02, CMS 1 L1 CMS331444-02-00, NIA R01 AG030618-05A1 and NIA R01AG054205-02. BK is supported by NIA K23-AG043476 and NHLBI R01HL131730. The funding agency had no role in the development of the study design, collection, analysis, interpretation of data, manuscript development, or the decision to submit the manuscript for publication. Conflicts of interest include MB, SG, and AP being funded by NIA R01AG054205-02 for the PMD study.
1. Jutte JE, Erb CT, Jackson JC. Physical, cognitive, and psychological disability following critical illness: what is the risk? Semin Respir Crit Care Med. 2015;36(6):943-958. PubMed
2. Nikayin S, Rabiee A, Hashem MD, et al. Anxiety symptoms in survivors of critical illness: a systematic review and meta-analysis. Gen Hosp Psychiatry. 2016;43:23-29. PubMed
3. Rabiee A, Nikayin S, Hashem MD, et al. Depressive symptoms after critical illness: a systematic review and meta-analysis. Crit Care Med. 2016;44(9):1744-1753. PubMed
4. Parker AM, Sricharoenchai T, Raparla S, Schneck KW, Bienvenu OJ, Needham DM. Posttraumatic stress disorder in critical illness survivors: a metaanalysis. Crit Care Med. 2015;43(5):1121-1129. PubMed
5. Bienvenu OJ, Colantuoni E, Mendez-Tellez PA, et al. Cooccurrence of and remission from general anxiety, depression, and posttraumatic stress disorder symptoms after acute lung injury: a 2-year longitudinal study. Crit Care Med. 2015;43(3):642-653. PubMed
6. Huang M, Parker AM, Bienvenu OJ, et al. Psychiatric Symptoms in Acute Respiratory Distress Syndrome Survivors: A 1-Year National Multicenter Study. Crit Care Med. 2016;44(5):954-965. PubMed
7. Abrams TE, Vaughan-Sarrazin M, Rosenthal GE. Influence of psychiatric comorbidity on surgical mortality. Arch Surg. 2010;145(10):947-953. PubMed
8. Campbell NL, Khan BA, Farber M, et al. Improving delirium care in the intensive care unit: the design of a pragmatic study. Trials. 2011;12:139. PubMed
9. EuroQol Group. EuroQol--a new facility for the measurement of health-related quality of life. Health Policy. 1990;16(3):199-208. PubMed
10. Hirschfeld RM. The comorbidity of major depression and anxiety disorders: recognition and management in primary care. Prim Care Companion J Clin Psychiatry. 2001;3(6):244–254. PubMed
11. Campbell DG, Felker BL, Liu CF, et al. Prevalence of depression–PTSD comorbidity: implications for clinical practice guidelines and primary care-based interventions. J Gen Intern Med. 2007;22(6):711–718. PubMed
12. Wolters AE, Peelen LM, Welling MC, et al. Long-term mental health problems after delirium in the ICU. Crit Care Med. 2016;44(10):1808-1813. PubMed
13. Kessler RC, Chiu WT, Demler O, Merikangas KR, Walters EE. Prevalence, severity, and comorbidity of 12-month DSM-IV disorders in the National Comorbidity Survey Replication. Arch Gen Psychiatry. 2005;62(6):617-627. PubMed
14. Mehlhorn J, Freytag A, Schmidt K, et al. Rehabilitation interventions for postintensive care syndrome: a systematic review. Crit Care Med. 2014;42(5):1263-1271. PubMed
15. Khan BA, Lasiter S, Boustani MA. CE: critical care recovery center: an innovative collaborative care model for ICU survivors. Am J Nurs. 2015;115(3):24-31. PubMed
The prevalence of depression, anxiety, and posttraumatic stress disorder (PTSD) symptoms in intensive care unit (ICU) survivors ranges from 17% to 44%.1-4 Psychiatric comorbidity, the presence of 2 or more psychiatric disorders, is highly prevalent in survivors of acute respiratory distress syndrome and is associated with higher mortality in postsurgical ICU survivors.5-7 While long-term cognitive impairment in patients with ICU delirium has been associated with poor quality of life (QoL),1 the effects of psychiatric comorbidity on QoL among similar patients are not as well understood. In this study, we examined whether psychiatric comorbidity was associated with poorer QoL in survivors of ICU delirium.
METHODS
We examined subjects who participated in the Pharmacologic Management of Delirium (PMD) clinical trial. This trial examined the efficacy of a pharmacological intervention for patients who developed ICU delirium at a local tertiary-care academic hospital.8 Out of 62 patients who participated in the follow-up of the PMD study, 58 completed QoL interviews and validated psychiatric screens (Patient Health Questionnaire-9 [PHQ-9] for depression, the Generalized Anxiety Disorder-7 [GAD-7] questionnaire for anxiety, and the Post-Traumatic Stress Syndrome [PTSS-10] questionnaire for PTSD) at 3 months after hospital discharge. High psychiatric comorbidity was defined as having significant symptoms for all 3 conditions (depression: PHQ-9 score ≥ 10; anxiety: GAD-7 ≥ 10; and PTSD: PTSS-10 > 35). No psychiatric morbidity was defined as having no significant symptoms for all 3 conditions. Low to moderate (low-moderate) psychiatric morbidity was defined as having symptoms for 1 to 2 conditions.
Participants also completed 2 complementary QoL measures: the EuroQol 5 dimensions questionnaire 3-level (EQ-5D-3L) Index and the EuroQol 5 dimensions Visual Analog Scale (EQ-5D-VAS).9 The EQ-5D-3L Index asks participants to rate themselves as having (1) no problems, (2) some problems, or (3) extreme problems on the following 5 scales: mobility, self-care, usual activities, pain/discomfort, and anxiety/depression. The scores are then indexed against the US population to create a continuous index scale ranging from −0.11 to 1.00.
Fisher’s exact tests were used to compare dichotomous outcomes. Analysis of variance (ANOVA) was used to compare continuous outcomes across the 3 psychiatric groups. Analysis of covariance (ANCOVA) was used to determine whether psychiatric comorbidity in survivors of ICU delirium was associated with QoL measures. Models were adjusted for the following covariates: age, gender, Charlson Comorbidity Index, discharged to home, prior history of depression, and prior history of anxiety. To assess the relationship of psychiatric comorbidity with QoL, we chose the 2 continuous QoL measures as the outcome. Because we were interested in the effect of psychiatric burden on QoL, we used ANCOVA with QoL as the dependent variable and psychiatric burden as an independent variable. Pairwise comparisons were then performed when overall differences were significant (P < 0.05). We performed 2 separate sensitivity analyses. The first analysis looked solely at the subgroup of patients from the medical intensive care unit. We also recalculated the EQ-5D-3L index excluding the anxiety/depression item.
RESULTS
Nearly one-third of patients (18/58) had high psychiatric burden. The table looks at the demographic and clinical characteristics of patients with high psychiatric comorbidity versus those of low-moderate psychiatric comorbidity and those with no psychiatric morbidity. Patient groups did not differ significantly in terms of demographics. For clinical characteristics, patients with high psychiatric comorbidity were more likely than patients with low-moderate psychiatric comorbidity to have a prior history of depression (P < 0.05).
Patients with high psychiatric comorbidity were more likely to have a poorer QoL when compared with patients with low-moderate psychiatric comorbidity and to those with no morbidity as measured by a lower EQ-5D-3L Index (no, 0.69 ± 0.25; low-moderate, 0.70 ± 0.19; high, 0.48 ± 0.24; P = 0.006) and EQ-5D-VAS (no, 67.0 ± 20.7; low-moderate, 76.6 ± 20.0; high, 50.8 ± 22.4; P = 0.004). After adjusting for covariates, patients with high psychiatric comorbidity had a poorer QoL compared with those with no morbidity or low-moderate comorbidity on the EQ-5D-3L Index (P = 0.017 for overall differences), whereas patients who had high psychiatric comorbidity had a poorer QoL compared to those with low-moderate comorbidity on the EQ-5D-VAS (P = 0.039 for overall differences; Figure). Subgroup analysis of MICU patients yielded similar results. Patients with high psychiatric burden had significantly poorer QoL as measured by the EQ-5D-3L (unadjusted P = 0.044, adjusted P = 0.003) and the EQ-5D-VAS (unadjusted P = 0.007, adjusted P = 0.021). After excluding the anxiety/depression item from the EQ-5D-3L, we observed similar differences (no, 0.71 ± 0.24; low-moderate, 0.75 ± 0.15; high, 0.58 ± 0.22; unadjusted P = 0.062; adjusted P = 0.040).
DISCUSSION/CONCLUSION
Psychiatric comorbidities in ICU survivors are common and pose a significant clinical issue. Patients with multiple psychiatric comorbidities can be more complicated to identify from a diagnostic standpoint and often require more prolonged, intensive mental health treatment when compared with patients with a single psychiatric disorder.10,11 Our study showed that high psychiatric comorbidity in survivors of ICU delirium is associated with a decreased QoL compared with those with no psychiatric comorbidity or with low-moderate psychiatric comorbidity. This finding is consistent with previous studies in the general population that patients with multiple psychiatric comorbidities are associated with a poorer QoL compared with patients with a single psychiatric comorbidity.10,11
There is a pressing need to better characterize psychiatric comorbidities in ICU survivors because our current evidence suggests that the prevalence of psychiatric comorbidities of ICU survivors is substantially higher than that of the general population. We found that nearly one-third of survivors of ICU delirium had comorbid depression, anxiety, and PTSD symptoms at 3 months. This is consistent with the few other studies of ICU survivors, which showed a prevalence of psychiatric comorbidity of 25% to 33%.5,12 These rates are substantially higher than the prevalence in the general population of 6%.13
The high rate of psychiatric comorbidities may render it difficult to effectively treat the mental health symptoms in ICU survivors.14 Treating multiple psychiatric comorbidities may also be especially challenging in survivors of ICU delirium because they have a high prevalence of cognitive impairment. Mental health treatments for patients with psychiatric disorders and comorbid cognitive impairment are limited. Better characterization of psychiatric comorbidity in ICU survivors, particularly those with ICU delirium, is vital to the development of more effective, bundled treatments for this population with multiple comorbidities.
Standardized screenings of ICU survivors at a high risk for psychiatric disorders, such as survivors of ICU delirium, may help to identify patients with comorbid psychiatric disorder symptoms and have them referred to appropriate treatment earlier with the hope of improving their QoL sooner. Although opportunities to deliver integrated outpatient collaborative mental health and medical care for a subspecialty population are limited, one potential model of care would be to utilize a collaborative-care model in an ICU survivor clinic.15
Strengths of our study include the examination of psychiatric comorbidities in survivors of ICU delirium, who often have a poor QoL. A deeper understanding of psychiatric comorbidity and its relationship with QoL is needed to better understand how to deliver more effective treatments for these survivors. Limitations include the small sample size, a one-time measurement of psychiatric comorbidities at the 3-month follow-up based on screenings tools, and a lack of objective measures of physical functioning to determine the effects of psychiatric comorbidities on physical functioning. There may also have been differences in how patients with no psychiatric comorbidity responded to the EQ-5D-VAS as a result of premorbid differences (eg, they were healthier prior to their ICU stay and perceived their survivor status more negatively). This may explain why we did not see a statistically significant difference between no psychiatric comorbidity and high psychiatric comorbidity groups on the EQ-5D-VAS. Nevertheless, we did see a difference between the low-moderate psychiatric comorbidity group on EQ-5D-VAS and differences between the no comorbidity and low-moderate comorbidity groups versus the high comorbidity group on the EQ-5D-3L. Finally, data about psychiatric history and QoL prior to ICU hospitalization were limited. Therefore, truly determining incidence versus prevalence of post-ICU comorbidities and whether psychiatric symptoms and its effects on QoL were due to ICU hospitalization or to premorbid psychiatric symptoms is difficult.
Our study demonstrated that in survivors of ICU delirium, higher comorbidity of psychiatric symptoms was associated with poorer QoL. Future studies will need to confirm these findings. We will also need to identify potentially reversible risk factors for psychiatric comorbidity and poorer QoL and develop treatments to effectively target the mental health symptoms of survivors of ICU delirium.
Disclosure
Grant support: The PMD trial is funded through the National Institutes of Health grant R01AG054205-02. SW is supported by NIA 2P30AG010133. AP is supported by CMS 1 L1 CMS331444-02-00, Indiana CTSI, and NIA R01AG054205-02. SG is supported by NIA 2P30AG010133, NIA 5R01AG045350, and NIA R01AG054205-02. SK is supported by NHBLI 5T32HL091816-07. MB is supported by NIA R01 AG040220-05, AHRQ P30 HS024384-02, CMS 1 L1 CMS331444-02-00, NIA R01 AG030618-05A1 and NIA R01AG054205-02. BK is supported by NIA K23-AG043476 and NHLBI R01HL131730. The funding agency had no role in the development of the study design, collection, analysis, interpretation of data, manuscript development, or the decision to submit the manuscript for publication. Conflicts of interest include MB, SG, and AP being funded by NIA R01AG054205-02 for the PMD study.
1. Jutte JE, Erb CT, Jackson JC. Physical, cognitive, and psychological disability following critical illness: what is the risk? Semin Respir Crit Care Med. 2015;36(6):943-958. PubMed
2. Nikayin S, Rabiee A, Hashem MD, et al. Anxiety symptoms in survivors of critical illness: a systematic review and meta-analysis. Gen Hosp Psychiatry. 2016;43:23-29. PubMed
3. Rabiee A, Nikayin S, Hashem MD, et al. Depressive symptoms after critical illness: a systematic review and meta-analysis. Crit Care Med. 2016;44(9):1744-1753. PubMed
4. Parker AM, Sricharoenchai T, Raparla S, Schneck KW, Bienvenu OJ, Needham DM. Posttraumatic stress disorder in critical illness survivors: a metaanalysis. Crit Care Med. 2015;43(5):1121-1129. PubMed
5. Bienvenu OJ, Colantuoni E, Mendez-Tellez PA, et al. Cooccurrence of and remission from general anxiety, depression, and posttraumatic stress disorder symptoms after acute lung injury: a 2-year longitudinal study. Crit Care Med. 2015;43(3):642-653. PubMed
6. Huang M, Parker AM, Bienvenu OJ, et al. Psychiatric Symptoms in Acute Respiratory Distress Syndrome Survivors: A 1-Year National Multicenter Study. Crit Care Med. 2016;44(5):954-965. PubMed
7. Abrams TE, Vaughan-Sarrazin M, Rosenthal GE. Influence of psychiatric comorbidity on surgical mortality. Arch Surg. 2010;145(10):947-953. PubMed
8. Campbell NL, Khan BA, Farber M, et al. Improving delirium care in the intensive care unit: the design of a pragmatic study. Trials. 2011;12:139. PubMed
9. EuroQol Group. EuroQol--a new facility for the measurement of health-related quality of life. Health Policy. 1990;16(3):199-208. PubMed
10. Hirschfeld RM. The comorbidity of major depression and anxiety disorders: recognition and management in primary care. Prim Care Companion J Clin Psychiatry. 2001;3(6):244–254. PubMed
11. Campbell DG, Felker BL, Liu CF, et al. Prevalence of depression–PTSD comorbidity: implications for clinical practice guidelines and primary care-based interventions. J Gen Intern Med. 2007;22(6):711–718. PubMed
12. Wolters AE, Peelen LM, Welling MC, et al. Long-term mental health problems after delirium in the ICU. Crit Care Med. 2016;44(10):1808-1813. PubMed
13. Kessler RC, Chiu WT, Demler O, Merikangas KR, Walters EE. Prevalence, severity, and comorbidity of 12-month DSM-IV disorders in the National Comorbidity Survey Replication. Arch Gen Psychiatry. 2005;62(6):617-627. PubMed
14. Mehlhorn J, Freytag A, Schmidt K, et al. Rehabilitation interventions for postintensive care syndrome: a systematic review. Crit Care Med. 2014;42(5):1263-1271. PubMed
15. Khan BA, Lasiter S, Boustani MA. CE: critical care recovery center: an innovative collaborative care model for ICU survivors. Am J Nurs. 2015;115(3):24-31. PubMed
© 2017 Society of Hospital Medicine
Internal Medicine Resident Engagement with a Laboratory Utilization Dashboard: Mixed Methods Study
Recent efforts to reduce waste and overuse in healthcare include reforms, such as merit-based physician reimbursement for efficient resource use1 and the inclusion of cost-effective care as a competency for physician trainees.2 Focusing on resource use in physician training and reimbursement presumes that teaching and feedback about utilization can alter physician behavior. Early studies of social comparison feedback observed considerable variation in effectiveness, depending on the behavior targeted and how feedback was provided to physicians.3-5 The widespread adoption of electronic medical record (EMR) software enables the design of feedback interventions that provide continuous feedback in real-time via EMR-based practice dashboards. Currently, little is known about physician engagement with practice dashboards and, in particular, about trainee engagement with dashboards aimed to improve cost-effective care.
To inform future efforts in using social comparison feedback to teach cost-effective care in residency, we measured internal medicine resident engagement with an EMR-based utilization dashboard that provides feedback on their use of routine laboratory tests on an inpatient medicine service. Routine labs are often overused in the inpatient setting. In fact, one study reported that 68% of laboratory tests ordered in an academic hospital did not contribute to improving patient outcomes.6 To understand resident perceptions of the dashboards and identify barriers to their use, we conducted a mixed methods study tracking resident utilization of the dashboard over time and collecting qualitative data from 3 focus groups about resident attitudes toward the dashboards.
METHODS
From January 2016 to June 2016, resident-specific rates of routine lab orders (eg, complete blood count, basic metabolic panel, complete metabolic panel, liver function panel, and common coagulation tests) were synthesized continuously in a web-based dashboard. Laboratory orders could be placed either individually on a day-to-day basis or ordered on a recurrent basis (eg, daily morning labs ordered on admission). The dashboard contained an interactive graph, which plotted the average number of labs per patient-day ordered by each resident over the past week, along with an overall graph for all services for comparison (Appendix Figure). Residents could click on an individual day on the graph to review the labs they ordered for each patient. The dashboard also allowed the user to look up each patient’s medical record to obtain more detailed information.
All residents received an e-mail describing the study, including the purpose of the intervention, basic description of the feedback intervention (dashboard and e-mail), potential risks and benefits, duration and scope of data collection, and contact information of the principal investigator. One hundred and ninety-eight resident-blocks on 6 general medicine services at the Hospital of the University of Pennsylvania were cluster-randomized with an equal probability to 1 of 2 arms: (1) those e-mailed a snapshot of the personalized dashboard, a link to the online dashboard, and text containing resident and service utilization averages, and (2) those who did not receive the feedback intervention. Postgraduate year (PGY) 1 residents were attributed only orders by that resident. PGY2 and PGY3 residents were attributed orders for all patients assigned to the resident’s team.
The initial e-mails were timed to arrive in the middle of each resident’s 2-week service to allow for a baseline and follow-up period. The e-mail contained an attachment of a snapshot of the personalized graphic dashboard (Appendix Figure), a link to the online dashboard, and a few sentences summarizing the resident utilization average compared to the general medicine service overall, for the same time interval. They were followed by a reminder e-mail 24 hours later containing only the link to the report card. We measured resident engagement with the utilization dashboard by using e-mail read-receipts and a web-based tracking platform that recorded when the dashboard was opened and who logged on.
Following completion of the intervention, 3-hour-long focus groups were conducted with residents. These focus groups were guided with prescripted questions to prompt discussion on the advantages and drawbacks of the study intervention and the usage of dashboards in general. These sessions were digitally recorded and transcribed. The transcripts were reviewed by 2 authors (KR and GK) and analyzed to identify common themes by using a grounded theory approach.7 First, the transcripts were reviewed independently by each author, who each generated a broad list of themes across 3 domains: dashboard usability, barriers to use, and suggestions for the future. Next, the codebook was refined through an iterative series of discussions and transcript review, resulting in a unified codebook. Lastly, all transcripts were reviewed by using the final codebook definitions, resulting in a list of exemplary quotes and suggestions.
The study was approved by the University of Pennsylvania Institutional Review Board and registered on clinicaltrials.gov (NCT02330289).
RESULTS
Eighty unique residents participated in the intervention, including 51 PGY1s (64%) and 29 PGY2- or PGY3-level (36%) residents. Of these, 19/80 (24%) physicians participated more than once. 74% of participants opened the e-mail and 21% opened the link to the dashboard. The average elapsed time from receiving the initial e-mail to logging into the dashboard was 28.5 hours (standard deviation [SD] = 25.7, median = 25.5, interquartile range [IQR] = 40.5). On average, residents deviated from the service mean by 0.54 laboratory test orders (SD = 0.49, median = 0.40, IQR = 0.60). The mean baseline rate of targeted labs was 1.30 (SD 1.77) labs per physician per patient-day.8
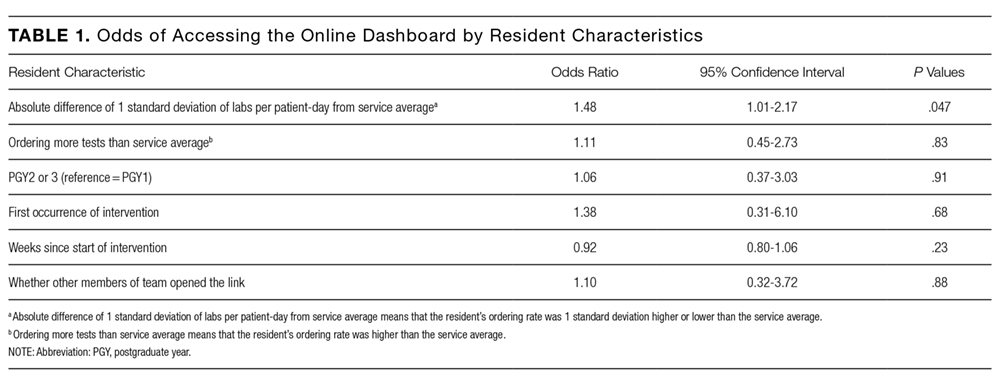
We did not observe a statistically significant difference in routine laboratory ordering by dashboard use, although residents who opened the link to the dashboard ordered 0.26 fewer labs per doctor-patient-day than those who did not (95% CI, −0.77-0.25; P = 0.31). The greatest difference was observed on day 2 after the intervention, when lab orders were lower among dashboard users by 0.59 labs per doc-patient-day (95% CI, −1.41-0.24; P = 0.16) when compared with the residents who did not open the dashboard.
Third, participants identified barriers to using dashboards during training, including time constraints, insufficient patient volume, possible unanticipated consequences, and concerns regarding punitive action by the hospital administration or teaching supervisors. Suggestions to improve the uptake of practice feedback via dashboards included additional guidance for interpreting the data, exclusion of outlier cases or risk-adjustment, and ensuring ease of access to the data.
Last, participants also expressed enthusiasm toward receiving other types of individualized feedback data, including patient satisfaction, timing of discharges, readmission rates, utilization of consulting services, length of stay, antibiotic stewardship practices, costs and utilization data, and mortality or intensive care unit transfer rates (data not shown).
DISCUSSION
Overall, the engagement rates of internal medicine trainees with the online dashboard were low. Most residents did open the e-mails containing the link and basic information about their utilization rates, but less than a quarter of them accessed the dashboard containing real-time data. Additionally, on average, it took them more than a day to do so. However, there is some indication that residents who deviated further from the mean in either direction, which was described in the body of the e-mail, were more motivated to investigate further and click the link to access the dashboard. This suggests that providing practice feedback in this manner may be effective for a subset of residents who deviate from the “typical practice,” and as such, dashboards may represent a potential educational tool that could be aligned with practice-based learning competencies.
The focus groups provided important context about residents’ attitudes toward EMR-based dashboards. Overall, residents were enthusiastic about receiving information regarding their personal laboratory ordering, both in terms of preventing iatrogenic harm and waste of resources. This supports previous research that found that both medical students and residents overwhelmingly believe that the overuse of labs is a problem and that there may be insufficient focus on cost-conscious care during training.9,10 However, many residents questioned several aspects of the specific intervention used in this study and suggested that significant improvements would need to be made to future dashboards to increase their utility.
To our knowledge, this is the first attempt to evaluate resident engagement and attitudes toward receiving practice-based feedback via an EMR-based online dashboard. Previous efforts to influence resident laboratory ordering behavior have primarily focused on didactic sessions, financial incentives, price transparency, and repeated e-mail messaging containing summary statistics about ordering practices and peer comparisons.11-14 While some prior studies observed success in decreasing unnecessary use of laboratory tests, such efforts are challenging to implement routinely on a teaching service with multiple rotating providers and may be difficult to replicate. Future iterations of dashboards that incorporate focused curriculum design and active participation of teaching attendings require further study.
This study has several limitations. The sample size of physicians is relatively small and consists of residents at a single institution. This may limit the generalizability of the results. Additionally, the dashboard captured laboratory-ordering rates during a 2-week block on an inpatient medicine service and was not adjusted for factors such as patient case mix. However, the rates were adjusted for patient volume. In future iterations of utilization dashboards, residents’ concerns about small sample size and variability in clinical severity could be addressed through the adoption of risk-adjustment methodologies to balance out patient burden. This could be accomplished using currently available EMR data, such as diagnosis related groups or diagnoses codes to adjust for clinical complexity or report expected length of stay as a surrogate indicator of complexity.
Because residents are expected to be responsive to feedback, their use of the dashboards may represent an upper bound on physician responsiveness to social comparison feedback regarding utilization. However, e-mails alone may not be an effective way to provide feedback in areas that require additional engagement by the learner, especially given the volume of e-mails and alerts physicians receive. Future efforts to improve care efficiency may try to better capture baseline ordering rates, follow resident ordering over a longer period of time, encourage hospital staff to review utilization information with trainees, integrate dashboard information into regular performance reviews by the attendings, and provide more concrete feedback from attendings or senior residents for how this information can be used to adjust behavior.
Disclosure
Dr. Ryskina’s work on this study was supported by the Ruth L. Kirschstein National Research Service Award (T32-HP10026) and the NIA Career Development Award (K08AG052572). Dr. Patel reports board membership on the advisory board of and owning stock/stock options for Healthmine Services, and serving as a consultant and owning stock/stock options for Catalyst Health LLC. The authors declare no conflict of interest.
1. Clough JD, McClellan M. Implementing MACRA: Implications for Physicians and for Physician Leadership. JAMA. 2016;315(22):2397-2398. PubMed
2. The Internal Medicine Subspecialty Milestones Project. A Joint Initiative of the Accrediation Council for Graduate Medical Education and The American Board of Internal Medicine. http://www.acgme.org/portals/0/pdfs/milestones/internalmedicinesubspecialtymilestoint.pdf. Accessed July 6, 2016.
3. Meeker D, Linder JA, Fox CR, et al. Effect of Behavioral Interventions on Inappropriate Antibiotic Prescribing Among Primary Care Practices: A Randomized Clinical Trial. JAMA. 2016;315(6):562-570. PubMed
4. Jamtvedt G, Young JM, Kristoffersen DT, O’Brien MA, Oxman AD. Audit and feedback: effects on professional practice and health care outcomes. Cochrane Database Syst Rev. 2006;2(2):CD000259. PubMed
5. Navathe AS, Emanuel EJ. Physician Peer Comparisons as a Nonfinancial Strategy to Improve the Value of Care. JAMA. 2016;316(17)1759-1760. PubMed
6. Miyakis S, Karamanof G, Liontos M, Mountokalakis TD. Factors contributing to inappropriate ordering of tests in an academic medical department and the effect of an educational feedback strategy. Postgrad Med J. 2006;82(974):823-829. PubMed
7. Glaser B, Strauss A. The Discovery of Grounded Theory. London: Weidenfeld and Nicholson; 1967.
8. Ryskina K, Dine J, Gitelman Y, et al. Effect of norms on laboratory and imaging testing (ENLITen): A Randomized Controlled Trial. Abstract presented at the Society of General Internal Medicine Conference; April 20, 2017; Washington, DC.
9. Sedrak MS, Patel MS, Ziemba JB, et al. Residents’ self-report on why they order perceived unnecessary inpatient laboratory tests. J Hosp Med. 2016;11(12):869-872. PubMed
10. Tartaglia KM, Kman N, Ledford C. Medical student perceptions of cost-conscious care in an internal medicine clerkship: a thematic analysis. J Gen Intern Med. 2015;30(10):1491-1496. PubMed
11. Iams W, Heck J, Kapp M, et al. A Multidisciplinary Housestaff-Led Initiative to Safely Reduce Daily Laboratory Testing. Acad Med. 2016;91(6):813-820. DOI:10.1097/ACM.0000000000001149. PubMed
12. Corson AH, Fan VS, White T, et al. A multifaceted hospitalist quality improvement intervention: decreased frequency of common labs. J Hosp Med. 2015;10:390-395. PubMed
13. Yarbrough P, Kukhareva P, Horton D, Edholm K, Kawamoto K. Multifaceted Intervention including Education, Rounding Checklist Implementation, Cost Feedback, and Financial Incentives Reduces Inpatient Laboratory Costs. J Hosp Med. 2016;11(5):348-354. PubMed
14. Feldman LS, Shihab HM, Thiemann D, et al. Impact of Providing Fee Data on Laboratory Test Ordering: A Controlled Clinical Trial. JAMA Intern Med. 2013;173(10):903-908. PubMed
Recent efforts to reduce waste and overuse in healthcare include reforms, such as merit-based physician reimbursement for efficient resource use1 and the inclusion of cost-effective care as a competency for physician trainees.2 Focusing on resource use in physician training and reimbursement presumes that teaching and feedback about utilization can alter physician behavior. Early studies of social comparison feedback observed considerable variation in effectiveness, depending on the behavior targeted and how feedback was provided to physicians.3-5 The widespread adoption of electronic medical record (EMR) software enables the design of feedback interventions that provide continuous feedback in real-time via EMR-based practice dashboards. Currently, little is known about physician engagement with practice dashboards and, in particular, about trainee engagement with dashboards aimed to improve cost-effective care.
To inform future efforts in using social comparison feedback to teach cost-effective care in residency, we measured internal medicine resident engagement with an EMR-based utilization dashboard that provides feedback on their use of routine laboratory tests on an inpatient medicine service. Routine labs are often overused in the inpatient setting. In fact, one study reported that 68% of laboratory tests ordered in an academic hospital did not contribute to improving patient outcomes.6 To understand resident perceptions of the dashboards and identify barriers to their use, we conducted a mixed methods study tracking resident utilization of the dashboard over time and collecting qualitative data from 3 focus groups about resident attitudes toward the dashboards.
METHODS
From January 2016 to June 2016, resident-specific rates of routine lab orders (eg, complete blood count, basic metabolic panel, complete metabolic panel, liver function panel, and common coagulation tests) were synthesized continuously in a web-based dashboard. Laboratory orders could be placed either individually on a day-to-day basis or ordered on a recurrent basis (eg, daily morning labs ordered on admission). The dashboard contained an interactive graph, which plotted the average number of labs per patient-day ordered by each resident over the past week, along with an overall graph for all services for comparison (Appendix Figure). Residents could click on an individual day on the graph to review the labs they ordered for each patient. The dashboard also allowed the user to look up each patient’s medical record to obtain more detailed information.
All residents received an e-mail describing the study, including the purpose of the intervention, basic description of the feedback intervention (dashboard and e-mail), potential risks and benefits, duration and scope of data collection, and contact information of the principal investigator. One hundred and ninety-eight resident-blocks on 6 general medicine services at the Hospital of the University of Pennsylvania were cluster-randomized with an equal probability to 1 of 2 arms: (1) those e-mailed a snapshot of the personalized dashboard, a link to the online dashboard, and text containing resident and service utilization averages, and (2) those who did not receive the feedback intervention. Postgraduate year (PGY) 1 residents were attributed only orders by that resident. PGY2 and PGY3 residents were attributed orders for all patients assigned to the resident’s team.
The initial e-mails were timed to arrive in the middle of each resident’s 2-week service to allow for a baseline and follow-up period. The e-mail contained an attachment of a snapshot of the personalized graphic dashboard (Appendix Figure), a link to the online dashboard, and a few sentences summarizing the resident utilization average compared to the general medicine service overall, for the same time interval. They were followed by a reminder e-mail 24 hours later containing only the link to the report card. We measured resident engagement with the utilization dashboard by using e-mail read-receipts and a web-based tracking platform that recorded when the dashboard was opened and who logged on.
Following completion of the intervention, 3-hour-long focus groups were conducted with residents. These focus groups were guided with prescripted questions to prompt discussion on the advantages and drawbacks of the study intervention and the usage of dashboards in general. These sessions were digitally recorded and transcribed. The transcripts were reviewed by 2 authors (KR and GK) and analyzed to identify common themes by using a grounded theory approach.7 First, the transcripts were reviewed independently by each author, who each generated a broad list of themes across 3 domains: dashboard usability, barriers to use, and suggestions for the future. Next, the codebook was refined through an iterative series of discussions and transcript review, resulting in a unified codebook. Lastly, all transcripts were reviewed by using the final codebook definitions, resulting in a list of exemplary quotes and suggestions.
The study was approved by the University of Pennsylvania Institutional Review Board and registered on clinicaltrials.gov (NCT02330289).
RESULTS
Eighty unique residents participated in the intervention, including 51 PGY1s (64%) and 29 PGY2- or PGY3-level (36%) residents. Of these, 19/80 (24%) physicians participated more than once. 74% of participants opened the e-mail and 21% opened the link to the dashboard. The average elapsed time from receiving the initial e-mail to logging into the dashboard was 28.5 hours (standard deviation [SD] = 25.7, median = 25.5, interquartile range [IQR] = 40.5). On average, residents deviated from the service mean by 0.54 laboratory test orders (SD = 0.49, median = 0.40, IQR = 0.60). The mean baseline rate of targeted labs was 1.30 (SD 1.77) labs per physician per patient-day.8
We did not observe a statistically significant difference in routine laboratory ordering by dashboard use, although residents who opened the link to the dashboard ordered 0.26 fewer labs per doctor-patient-day than those who did not (95% CI, −0.77-0.25; P = 0.31). The greatest difference was observed on day 2 after the intervention, when lab orders were lower among dashboard users by 0.59 labs per doc-patient-day (95% CI, −1.41-0.24; P = 0.16) when compared with the residents who did not open the dashboard.
Third, participants identified barriers to using dashboards during training, including time constraints, insufficient patient volume, possible unanticipated consequences, and concerns regarding punitive action by the hospital administration or teaching supervisors. Suggestions to improve the uptake of practice feedback via dashboards included additional guidance for interpreting the data, exclusion of outlier cases or risk-adjustment, and ensuring ease of access to the data.
Last, participants also expressed enthusiasm toward receiving other types of individualized feedback data, including patient satisfaction, timing of discharges, readmission rates, utilization of consulting services, length of stay, antibiotic stewardship practices, costs and utilization data, and mortality or intensive care unit transfer rates (data not shown).
DISCUSSION
Overall, the engagement rates of internal medicine trainees with the online dashboard were low. Most residents did open the e-mails containing the link and basic information about their utilization rates, but less than a quarter of them accessed the dashboard containing real-time data. Additionally, on average, it took them more than a day to do so. However, there is some indication that residents who deviated further from the mean in either direction, which was described in the body of the e-mail, were more motivated to investigate further and click the link to access the dashboard. This suggests that providing practice feedback in this manner may be effective for a subset of residents who deviate from the “typical practice,” and as such, dashboards may represent a potential educational tool that could be aligned with practice-based learning competencies.
The focus groups provided important context about residents’ attitudes toward EMR-based dashboards. Overall, residents were enthusiastic about receiving information regarding their personal laboratory ordering, both in terms of preventing iatrogenic harm and waste of resources. This supports previous research that found that both medical students and residents overwhelmingly believe that the overuse of labs is a problem and that there may be insufficient focus on cost-conscious care during training.9,10 However, many residents questioned several aspects of the specific intervention used in this study and suggested that significant improvements would need to be made to future dashboards to increase their utility.
To our knowledge, this is the first attempt to evaluate resident engagement and attitudes toward receiving practice-based feedback via an EMR-based online dashboard. Previous efforts to influence resident laboratory ordering behavior have primarily focused on didactic sessions, financial incentives, price transparency, and repeated e-mail messaging containing summary statistics about ordering practices and peer comparisons.11-14 While some prior studies observed success in decreasing unnecessary use of laboratory tests, such efforts are challenging to implement routinely on a teaching service with multiple rotating providers and may be difficult to replicate. Future iterations of dashboards that incorporate focused curriculum design and active participation of teaching attendings require further study.
This study has several limitations. The sample size of physicians is relatively small and consists of residents at a single institution. This may limit the generalizability of the results. Additionally, the dashboard captured laboratory-ordering rates during a 2-week block on an inpatient medicine service and was not adjusted for factors such as patient case mix. However, the rates were adjusted for patient volume. In future iterations of utilization dashboards, residents’ concerns about small sample size and variability in clinical severity could be addressed through the adoption of risk-adjustment methodologies to balance out patient burden. This could be accomplished using currently available EMR data, such as diagnosis related groups or diagnoses codes to adjust for clinical complexity or report expected length of stay as a surrogate indicator of complexity.
Because residents are expected to be responsive to feedback, their use of the dashboards may represent an upper bound on physician responsiveness to social comparison feedback regarding utilization. However, e-mails alone may not be an effective way to provide feedback in areas that require additional engagement by the learner, especially given the volume of e-mails and alerts physicians receive. Future efforts to improve care efficiency may try to better capture baseline ordering rates, follow resident ordering over a longer period of time, encourage hospital staff to review utilization information with trainees, integrate dashboard information into regular performance reviews by the attendings, and provide more concrete feedback from attendings or senior residents for how this information can be used to adjust behavior.
Disclosure
Dr. Ryskina’s work on this study was supported by the Ruth L. Kirschstein National Research Service Award (T32-HP10026) and the NIA Career Development Award (K08AG052572). Dr. Patel reports board membership on the advisory board of and owning stock/stock options for Healthmine Services, and serving as a consultant and owning stock/stock options for Catalyst Health LLC. The authors declare no conflict of interest.
1. Clough JD, McClellan M. Implementing MACRA: Implications for Physicians and for Physician Leadership. JAMA. 2016;315(22):2397-2398. PubMed
2. The Internal Medicine Subspecialty Milestones Project. A Joint Initiative of the Accrediation Council for Graduate Medical Education and The American Board of Internal Medicine. http://www.acgme.org/portals/0/pdfs/milestones/internalmedicinesubspecialtymilestoint.pdf. Accessed July 6, 2016.
3. Meeker D, Linder JA, Fox CR, et al. Effect of Behavioral Interventions on Inappropriate Antibiotic Prescribing Among Primary Care Practices: A Randomized Clinical Trial. JAMA. 2016;315(6):562-570. PubMed
4. Jamtvedt G, Young JM, Kristoffersen DT, O’Brien MA, Oxman AD. Audit and feedback: effects on professional practice and health care outcomes. Cochrane Database Syst Rev. 2006;2(2):CD000259. PubMed
5. Navathe AS, Emanuel EJ. Physician Peer Comparisons as a Nonfinancial Strategy to Improve the Value of Care. JAMA. 2016;316(17)1759-1760. PubMed
6. Miyakis S, Karamanof G, Liontos M, Mountokalakis TD. Factors contributing to inappropriate ordering of tests in an academic medical department and the effect of an educational feedback strategy. Postgrad Med J. 2006;82(974):823-829. PubMed
7. Glaser B, Strauss A. The Discovery of Grounded Theory. London: Weidenfeld and Nicholson; 1967.
8. Ryskina K, Dine J, Gitelman Y, et al. Effect of norms on laboratory and imaging testing (ENLITen): A Randomized Controlled Trial. Abstract presented at the Society of General Internal Medicine Conference; April 20, 2017; Washington, DC.
9. Sedrak MS, Patel MS, Ziemba JB, et al. Residents’ self-report on why they order perceived unnecessary inpatient laboratory tests. J Hosp Med. 2016;11(12):869-872. PubMed
10. Tartaglia KM, Kman N, Ledford C. Medical student perceptions of cost-conscious care in an internal medicine clerkship: a thematic analysis. J Gen Intern Med. 2015;30(10):1491-1496. PubMed
11. Iams W, Heck J, Kapp M, et al. A Multidisciplinary Housestaff-Led Initiative to Safely Reduce Daily Laboratory Testing. Acad Med. 2016;91(6):813-820. DOI:10.1097/ACM.0000000000001149. PubMed
12. Corson AH, Fan VS, White T, et al. A multifaceted hospitalist quality improvement intervention: decreased frequency of common labs. J Hosp Med. 2015;10:390-395. PubMed
13. Yarbrough P, Kukhareva P, Horton D, Edholm K, Kawamoto K. Multifaceted Intervention including Education, Rounding Checklist Implementation, Cost Feedback, and Financial Incentives Reduces Inpatient Laboratory Costs. J Hosp Med. 2016;11(5):348-354. PubMed
14. Feldman LS, Shihab HM, Thiemann D, et al. Impact of Providing Fee Data on Laboratory Test Ordering: A Controlled Clinical Trial. JAMA Intern Med. 2013;173(10):903-908. PubMed
© 2017 Society of Hospital Medicine