User login
Safety in Numbers
Patient safety organizations, commonly referred to as PSOs, are about to take off. And when they do, PSOs should provide hospitalists with invaluable data on improving patient safety.
“PSOs are a great concept, but even though it’s been around since 2005, I haven’t seen it clinically,” says Janet Nagamine, RN, MD, hospitalist at Kaiser Permanente in Santa Clara, Calif., and chair of SHM’s Hospital Quality and Patient Safety Committee.
This calendar year, Nagamine and the rest of hospital medicine should start to see some movement—“PSO 1.0,” if you will.
Background
PSOs are public and private organizations approved by the Agency for Healthcare Research and Quality (AHRQ); they include such groups as Health Watch Inc., Human Performance Technology Group, and the Institute for Safe Medication Practices, which will collect, aggregate, and analyze data on patient safety events. Hospitals and other healthcare providers will voluntarily and confidentially report data. The ultimate goal is to advance changes in culture, processes, and systems to enhance patient safety.
PSOs grew out of the Patient Safety and Quality Improvement Act of 2005, which was a response to the Institute of Medicine’s landmark report “To Err Is Human: Building a Safer Health System.” But it wasn’t until last year that the U.S. Department of Health and Human Services issued a final rule outlining PSO requirements and procedures. The rule became effective Jan. 19, 2009.
AHRQ is responsible for coordinating the development of a set of common definitions and reporting formats, called common formats, for collecting the data. Eventually, AHRQ will create a network of patient safety databases to which PSOs, providers, and others can voluntarily contribute non-identifiable patient safety information. This network will serve as an interactive evidence-based management resource for providers, PSOs, and other entities. AHRQ will use data from the network to analyze national and regional statistics regarding patient safety events. Findings will be made public and will be included in AHRQ’s annual National Healthcare Quality Report.
IT Example
To date, the only comparable data-collection system is MedMarx, which compiles information on medication errors. The Joint Commission requires providers to supply a root-cause analysis on every Level 1 incident, “but that’s just scratching the surface of what occurs,” Dr. Nagamine says. “There are far many more Level 2 and Level 3 events with the same precursors, and that information would be very valuable.”
By collecting nationwide data on patient safety events, PSOs will be able to bridge the gaps in the reporting system and provide crucial patient safety information to the healthcare industry. “In general, the concept of aggregate information that allows us to compare events is incredibly important,” Dr. Nagamine says. “A hospitalist working in one hospital has only the information about events in that hospital, but 5,000 hospitals can provide more specific and actionable information. We just haven’t seen this operationalized yet.”
Dr. Nagamine uses a technology example to show the value PSOs could have in identifying patterns or problems that threaten patient safety: “Every hospital has a horror story of implementing a new information technology (IT) system, and we’re getting some very interesting feedback from hospitals about unintended consequences,” she says. “We’re hearing that patients are being hurt because of mistakes in systems—the use of dropdown menus (on computer screens) that don’t drop down far enough to reveal all options, or a screen where it’s easy to click the wrong item.”
Current systems might not allow problems like these to be highlighted. Even if staff knows of a problem, their hospital’s coding system might not allow them to detail it. “It may fall under ‘communications’ or ‘physician computerized order entry’ or something vague, so the data won’t show the specifics of what happened,” Dr. Nagamine points out. “If we had aggregate data on issues like this, we could address it. Right now, we just have word of mouth.”
An isolated event at a hospital is one thing, but similar data from around the nation is significant. “Drug companies or IT vendors confronted with (patterns) might make some changes,” she says. “That kind of data is powerful.”
Hospital Medicine on Board
When hospitals start reporting data to PSOs, where will hospitalists fit into the process? Hospitalists likely will be interviewed to answer some of the PSO’s questions, but they will not be the ones filling out the forms, Dr. Nagamine says. Hospitalists also will be among the ranks of healthcare professionals eagerly awaiting the release of the data. “The way that PSOs approach patient safety and quality—what’s near and dear to our hearts—is it gives us more data,” Dr. Nagamine says. This is crucial for hospitalists leading quality-improvement projects and similar tasks. “Without that data, it’s hard to get traction and movement. That data will help convince someone to invest more time and money in a particular problem area.”
Phase One: Participation
AHRQ has established a comprehensive Web site (www.pso.ahrq.gov) that includes information on the first draft of common formats for use with hospital inpatients. These are found on downloadable paper forms, available at the PSO Privacy Protection Center (PPC) Web site at www.psoppc.org/ web/patientsafety/paperforms.
“The forms are a first step,” Dr. Nagamine explains. “If we had these data points on every incident at every hospital, we’d know a lot more than we do now. We’d be able to harness that information.”
It will be a while before healthcare providers can search the data for patterns and possible solutions in patient safety, but the wait should be worth it. “You’ve got to start somewhere, and it’s not going to happen in one sweep,” Dr. Nagamine says. “This is simply a start. Hopefully, in a decade, we’ll have a lot more actionable information.” TH
Jane Jerrard is a medical writer based in Chicago.
Converse Like a Leader
Communication is an integral part of a hospitalist’s job: from admission interviews to conveying orders to nursing staff, communicating clearly and precisely is part of numerous best practices. When a hospitalist assumes a leadership role, however, the types and styles of communication change. A committee chair or department head must be aware of the messages they send—both literally and in the most general sense of the term. This transition to leadership can be tough.
“Physician communication is focused on clinical outcome. That’s easy for someone trained in medicine. But in leadership communication, there may not be a defined outcome,” says Timothy J. Keogh, PhD, assistant professor at The Citadel School of Business Administration in Charleston, S.C. “That’s a difficult switch from clinician to leader; maybe half of the problems a leader faces can’t be solved.”
Dr. Keogh and William F. Martin, PsyD, MPH, summarized their research data in “Managing Medical Groups: 21st Century Challenges and the Impact of Physician Leadership Styles,” published in the September-October 2004 issue of Journal of Medical Practice Management.
The Basics
The most basic communication skill a hospitalist leader should practice, according to Dr. Keogh, is “being less direct than [he or she] would like to be.” Dr. Keogh, who teaches communication skills as part of SHM’s Leadership Academy, says, “Data shows that physicians prefer to be more precise and cover topics quickly. In a leadership role, the initial part of the communication or conversation needs to be chattier. Some physicians believe that this uses up too much time, but, in fact, it doesn’t take that long and it’s a necessary step.” Acknowledge others’ need for connection by making eye contact, pausing, and exchanging quick pleasantries. “Leaders need to be able to say things in passing, greet people, et cetera,” Dr. Keogh stresses.
But what about in-depth communication?
Management Topics
If you supervise hospitalists, you can condense discussions of your expectations—at least compared with managers in business fields. “Physicians are skilled, well-trained individuals, so you don’t have to do so much of this,” Dr. Keogh says. “They have an internal sense of quality and you don’t really need to motivate them. It’s a matter of adjusting the edges.”
A hospitalist supervisor might need to address a situation in which a physician on the team has been disruptive or needs a disciplinary talk. In these instances, Dr. Keogh says, “The leader has to somehow collect data on what the hospitalist has displayed that doesn’t fit in with teamwork. The hard part is that the data is likely to be hearsay—what was said by whom, when. That’s management.”
For example, you might receive complaints from nursing staff of abrupt or rude behavior from a hospitalist. “Physicians may not think of this as data, but it is. What someone said or did, or gestured,” Dr. Keogh points out. “You have to be able to say, ‘Here’s what we know happened on this date. Help me understand what happened, because we have to change this. This behavior is not acceptable.’”
The key to all official management communication is to carefully consider how to frame the conversation and keep it flowing for both parties: Speak with hospitalists, not to them. Here is an example: “In a performance appraisal, one suggestion we make is to have a conversation about data,” Dr. Keogh explains. “Look at some numbers on quality assurance, patient load, or whatever you’re discussing. Do your homework and allow the other person to have a look at the data before you sit down with them. That’s a sign of respect.”
Styles of Communication
Dr. Keogh’s training for physician executives—including what he teaches at the Leadership Academy—is based on the personality profile system developed by Carlson Learning Company (now Inscape Publishing).1 The DiSC model outlines behavior or characteristic leadership preferences in four dimensions:
- Dominance (D): People who score high in this category have behavioral characteristics that include being motivated by control over tasks and work environment, directing others, and achieving specific stretch goals. In general, physician managers who score high on dominance tend to be results-focused, fast-paced, and value autonomy.
- Influence (I): People who score high in this category are motivated by interacting with others, giving and receiving immediate feedback, and acknowledging emotions as well as facts.
- Steadiness (S): People who score high in this category are motivated by job security, predictability, and clearly defined expectations.
- Conscientiousness (C): People who score high in this category are motivated by needing to be right, working alone, and preferring to work on tasks rather than dealing with people.
“This model provides groundwork for seeing that other people have different ways, different preferences of communicating,” Dr. Keogh says. In his own research, he says, he has found “nearly half of all physicians are some combination of time-sensitive and perfectionist,” meaning they fit the dominance style.
The trick to effective communication is learning to modify your style when necessary. Task-focused individuals must practice taking a minute for a greeting or a pleasantry, even if it initially goes against their routine. “Someone who is extremely outgoing and open can have trouble, too,” Dr. Keogh points out. “You can’t start a conversation with a lot of chit-chat, if you’re addressing someone who is direct. … That won’t work, either.”
The solution is to practice stepping outside of your normal communication style. “You can learn how to adjust your style, how to flex to others’ styles,” Dr. Keogh says. “Depending on whom you’re communicating with, you can mirror the style of the other person.” This helps to ensure that what you’re saying is received and understood.
Practicing new ways to communicate means making a fundamental shift in your behavior. It sounds difficult, but Dr. Keogh promises it’s not.
“The transition is not as hard as you think, because hospitalists have been trained to do patient interviews,” he says. “They’re skilled at observation and listening. In the transition to leadership, they sometimes forget that they have these skills and can use these to be a great leader.”” TH
Jane Jerrard is a medical writer based in Chicago. She also writes “Public Policy” for The Hospitalist.
Reference
1. Straw J. The 4-Dimensional Manager: DiSC Strategies for Managing Different People in the Best Ways. San Francisco: Berrett-Koehler Publishers, Inc.; 2002.
Never-Event Implications
The Center for Medicare and Medicaid Services (CMS) recently announced federal payor programs no longer reimburses for medical services rendered to treat certain complications of care. Although CMS chose the majority of these complications because they are “reasonably preventable by following evidence-based guidelines,” the national media and patient advocacy groups have adopted the term “never events” to describe them.
Aside from the payment implications, CMS’ new policy affects the liability risk of any person providing inpatient care, regardless of whether a federal payor is involved.
In its press release announcing the new payment policy, CMS stated, “when you enter the hospital for treatment of one medical problem, you don’t expect to leave with additional injuries, infections, or serious conditions that occur during the course of your stay.” Recognizing “some of these complications may not be avoidable,” CMS found “too often patients suffer from injuries or illnesses that could have been prevented if the hospital had taken proper precautions.”
Consequently, “as part of its commitment to improve the quality of care [patients] receive during a hospital stay,” CMS policy is targeted at reducing “hospital-acquired conditions like certain infections, advanced bed sores, or fractures;” and “preventable medical errors, like performing surgery on the wrong side of the body, that should never happen.”
The list of “never events” covered under the CMS payment policy can be organized into three categories: surgical events, medical products and devices, and case management. The following breaks down each category:
Case Management
- Stage III and Stage IV pressure ulcers;
- Air embolism;
- Manifestations of poor control of blood sugar levels; and
- Fracture, burns, joint dislocations, and other injuries occurring from falls or other trauma suffered while an inpatient.
Surgical Events
- Surgery on wrong body part;
- Surgery on the wrong patient;
- Wrong surgery on a patient;
- Retention of a foreign object, such as a sponge or needle, inadvertently left in a patient after surgery;
- Surgical site infection following a coronary artery bypass graft;
- Surgical site infection following bariatric surgery;
- Surgical site infection following certain orthopedic procedures; and
- Deep vein thrombosis or pulmonary embolism following certain orthopedic procedures.
Medical Products and Devices
- Transfusion of wrong blood type;
- Catheter associated urinary tract infection; and
- Vascular catheter associated infections.
It’s easy to see why some of the complications made the list. Wrong-side surgery or surgery on the wrong patient are the quintessential cases where liability is generally uncontested. There is not much one can do to satisfactorily explain to a patient, or a jury, why a surgeon and surgical team operated on the wrong body part.
In other cases, however, such as fatal pulmonary embolus, death can occur even when a patient has been appropriately managed. In fact, medical literature demonstrates a small percentage of patients will develop deep vein thrombosis or pulmonary embolus even after having received therapeutic doses of heparin.
Reasonable Expectations
In any case involving a “never event,” we expect plaintiffs’ attorneys to argue CMS’ reimbursement determination is tantamount to a finding of substandard care. In other words, plaintiffs’ attorneys will argue a physician acted negligently simply because the patient incurred one of the proscribed complications. It’s a compelling argument because the federal government has essentially concluded these complications do not occur if physicians and hospitals pay attention while providing care.
You may have heard the Latin phrase res ipsa loquitur; it translates to “the thing speaks for itself.” Legally, res ipsa loquitur states a rule of law where a jury must presume a defendant was negligent when a certain type of injury occurs. The burden then shifts to the defendant to prove the injury occurred in the absence of negligence. The res ipsa rule originated in 1863 when a plaintiff was struck by a barrel of flour falling from a second-story window. The barrel caused the judge hearing the case to remark, “It is the duty of persons who keep barrels in a warehouse to take care that they do not roll out, and I think that such a case would, beyond all doubt, afford prima facie evidence of negligence. A barrel could not roll out of a warehouse without some negligence. … [I]f there are any facts inconsistent with negligence, it is for the defendant to prove them.” Thus, res ipsa is grounded in the notion everyone knows barrels aren’t supposed to fall from second-floor windows.
Traditionally, res ipsa applied only in a small class of medical malpractice cases, such as retained objects following surgery. In such cases, jurors are just as capable as medical professionals in understanding someone was negligent. For example, it does not take expert testimony to establish there has been negligence when a surgical instrument is left in a patient. There’s simply no compelling medical reason for a surgeon to leave an instrument in a patient’s abdomen.
In contrast, res ipsa generally has not applied in cases involving pulmonary embolus because the process of thromboembolic disease is beyond the average juror’s understanding and death by pulmonary embolus would not give rise to a presumption of negligence.
Where res ipsa applies, it’s a powerful concept. If res ipsa were found to apply to pulmonary embolus cases, the jury would be instructed it is the duty of a physician caring for a post-surgical patient to take care that the patient does not develop pulmonary embolus. Thus, a jury would begin with the presumption a patient would not develop pulmonary embolus absent negligence. The physician would then be left with the burden to prove otherwise. Given such a charge, it is foreseeable a jury could return a verdict against a physician, even if the physician managed the patient’s care appropriately and ordered appropriate prophylaxis.
Take Extra Precaution
To prevent CMS' reimbursement decisions from becoming the functional equivalent of a res ipsa instruction, physicians need to raise the level of precaution they employ against “never event” complications. At the heart of CMS' decision is its statement “never event” complications are “reasonably preventable by following evidence-based guidelines.” When a condition is only “reasonably preventable,” instead of “absolutely preventable,” a defense lawyer retains the ability to argue some patients will develop the condition even when the care was entirely appropriate.
We believe most jurors understand the inherent difficulties of caring for sick patients, and the risks that exist every time a patient undergoes a surgical procedure. The defense lawyer’s challenge is convincing a jury the patient received appropriate care, notwithstanding the complication.
Because CMS refers to “evidence-based guidelines,” physicians must know and follow the guidelines. The first step is becoming familiar with the complications CMS will deny reimbursement, and then regularly review the available guidelines to identify practices to reduce or eliminate the complication. Re-evaluate and update your practice whenever new information becomes available.
A consistent cycle of evaluating and responding to complications will afford the defense lawyer the ability to argue the physician and hospital complied with “evidence-based guidelines” and the patient’s case represents one of the unfortunate incidents where a patient suffers a complication despite receiving the highest-level of care.
In our experience, many providers initially create good systems, but run into trouble in the follow up. Make sure you respond to new or additional information or methods of practice. Without this follow up, CMS’ reimbursement decisions have the potential to create malpractice liabilities for all inpatient providers. TH
Patrick O’Rourke works in the Office of University Counsel, Department of Litigation, University of Colorado Denver.
Focused on Patient Care
Julia S. Wright, MD, spent 10 years in traditional practice before joining the University of Wisconsin School of Medicine and Public Health in Madison. Now a clinical associate professor and section head of hospital medicine, the title has changed and the professional demands have intensified. The mission, however, remains the same.
Every decision she’s made in her career—whether it be medical, managerial, financial, or even her seemingly curious choice of college majors—has been guided by one basic question: What will this mean for the quality of patient care? “It may sound cliché, but that’s always the bottom line,” Dr. Wright says. “It’s why I do what I do.”
You spent 10 years in traditional practice before becoming a hospitalist. How did that prepare you for what you’re doing now?
Answer: That experience is a tremendous asset. I made the switch to inpatient medicine because that was the arena I enjoyed the most. But having had experience in the outpatient setting gives me a better understanding of the continuum of care, and my clinical skills have been honed by that experience. I also have an understanding of the strengths of the primary care physicians (PCP), as well as the breadth of the problems they are able to take on.
How does that help you?
A: It really helps in the patient transition, especially on the return side, when patients go back to their PCP after hospitalization. Having an understanding of what resources are available to PCPs helps to determine an appropriate time to discharge a patient. Someone without that experience may have a tendency to think every loose end has to be tied up, or they may make changes that wind up making things more difficult for PCP. But if you have an understanding of a PCP’s capabilities, maybe the patient can be discharged a little earlier.
The University of Wisconsin’s hospitalist program started in 2005. You were named director in 2006. How exciting is it to guide a new program and help it develop?
A: It’s been a tremendous experience. When I joined, we had six hospitalists. Now we have 19. But it was strategic growth; it wasn’t haphazard.
What do you mean by strategic growth?
A: We didn’t simply say, ‘We need more people.’ Every time we brought somebody on, we really made sure it was going to be someone who would add value to the program and be beneficial to the hospital. We were worried, as we got bigger, that it’d be hard to keep the same cohesiveness and that same espirit de corps. During the interviews and the search process, we’re not just asking, ‘Are they qualified?’ We’re asking, ‘Are they a really good fit?’ And everybody has different areas of interest within the group. Some are more research-inclined; one developed a curriculum; some are more clinically oriented. That allows each hospitalist to have an identity in the group. That translated into a good expansion, and it’s been a win-win for us.
What makes someone a good fit for your program?
A: It sounds cliché, but I think the key to a strong developing program is to have a strong sense of what the group values. For us, we value the academic experience. For people going into academic medicine, the struggle is to be able to provide value to the hospital and yet stay academic. Our hospitalists are very clear—that’s our vision. With the support of the hospital and the department, we were able to do both at the same time.
Can you pinpoint one experience that you’ve had that made you realize you’re doing what you’re meant to do?
A: The biggest reward is always patient care. I enjoy the direct patient experience as much as I always have, and that’s what keeps me in the game.
What have you enjoyed most about your transition to a leadership role?
A: I really enjoy the position, not because of the hierarchy, but because of the opportunities afforded by it. I get to interact with hospital medicine staff and the department of medicine chair, and the vice chairs. I’ve been able to interact with others in hospital medicine across the country, and that has been a great experience.
Some hospitalists enjoy what they do because they don’t have to handle the business side of operations or deal with the administrative hassles that private physicians face. In your role, though, you do have to face those challenges. Is that a drawback?
A: I do have to pay attention to the numbers. That’s the bottom line. But it’s something I actually really enjoy. When it comes to awareness of the balance sheet, there’s a division between the leadership level and the clinician level. It’s hard to bridge that chasm of, ‘I’m here for patient care and I don’t necessarily focus on the numbers.’
How do you bridge the chasm?
A: It’s something we should be emphasizing more in hospital medicine. Some people may think it’s distasteful to think about, but it’s something hospitals do need to care about. There’s not enough of that trickling down. This is a huge area for potential growth. It’s important to have an understanding of the importance of the bottom line without feeling too much like it’s threatening the quality of the practice or getting in the way of what we want to be doing.
What other changes are in store for hospital medicine?
A: If you look at the traditional role of a hospitalist, you do a few things on the side of quality, but basically you’re seeing patients. The theory is there could be market saturation, because there are only a certain number of patients you can see in a hospital. But now hospitalists are seen as a physician resource that didn’t exist before. You have a group of doctors that understand patient care very well and are available to make changes and implement initiatives within a hospital. That’s going to lead to more roles besides direct patient care role. Hospitalists are going to be in charge of a number of administrative duties or assume administrative positions within hospitals. Because we’re branching out into other areas of hospital-based care, we’ll see more growth and still see high demand.
One of your primary medical interests is healthcare for Spanish-speaking families. Why is that so important to you?
A: My interest in working with the Latino population comes from my own background. I was a Spanish literature major at Northwestern University, and I’ve had a lot of opportunities to travel. When I started practicing, a large number of the patients were Latino. It became clear how important it is for us to understand what’s happening in our communities. We need to know what patients are coming in, what their demographics are, what their experiences have been, and what their needs are. Everything we do in a hospital translates to what’s happening outside the hospital.
Hospital medicine is quite a switch from Spanish literature. How’d that come about?
A: Actually, it was planned. I always knew I was going to medical school, but I really enjoy linguistics and language. I kept that balance. I didn’t want to be too science-oriented. It was one of those left brain-right brain things.
What is the biggest challenge facing hospital medicine?
A: The challenge is going to be retaining hospitalists and trying to avoid burnout.
How do you address the retention issue?
A: A big part of retention is making people feel happy in their field. It’s about allowing them to feel like they’re contributing in their particular area of physician interest, making them feel like their contributions are valued, making them feel like they can effect change, and making them feel like they’re really part of a team. We’ve been able to keep those as priorities.
How about the risk of burnout?
A: We have to find ways to balance our professions with our personal lives. Everybody’s looking for that balance. I have a husband and three children, so I want it, too. We really have to be reasonable. An important part of being good doctors is being good human beings.
What’s next for you personally?
A: Expanding research and developing a fellowship are two of the primary areas of focus. We also want to focus on triage and flow, and improving the throughput. Beyond that, it’s going to be program expansion, just like it’s been. That’s going to keep me busy. TH
Mark Leiser is a freelance writer in New Jersey.
“Caregiver Culture” and End-of-Life Discussions
When it comes to discussing a patient’s wishes for code status care, practices at the institution play a more important role than almost any other factor, according to a new study, “Factors Associated with Discussion of Care Plans and Code Status at the Time of Hospital Admission: Results from the Multicenter Hospitalist Study,” in the Journal of Hospital Medicine.
“What was most surprising to me was how variable the discussion rate was,” lead author Andrew Auerbach, MD, tells The Hospitalist. “It had little or nothing to do with how sick the patient was, or with the type of institution in which the discussion took place.”
Hospitalists are no more or less likely to document such discussions than doctors in any other specialty, says Dr. Auerbach, a hospitalist and associate professor of medicine at the University of California San Francisco. He and his colleagues analyzed data from patients admitted to the general medicine services at six academic medical centers as part of the Multicenter Hospitalist Study. Each site complied with requirements established by the Patient Self-Determination Act (PSDA), which says patients must be informed of their right to create an advance directive.
None of the hospitals in the study had established guidelines or formal policies regarding physician-patient discussions about code status or end-of-life care. Patients were interviewed immediately after informed consent was obtained, usually within 24 hours of admission. In each case, the authors determined whether or not the patient had had a care discussion, defined as a documented discussion “between patients (or family) and at least one physician … during the first 24 hours of hospitalization,” the authors write. “Care discussions needed to specify that the person who wrote the note had actually spoken with the patient or their family for the purposes of determining preferences for care, and that this discussion resulted in a specific care plan.”
A notation, such as “the patient continues to want full efforts,” qualified as a care discussion. Less-specific comments, such as “DNR/DNI” or “spoke with family, questions answered,” did not qualify. “These were all really, really sick people, and it was important to assess their wishes for care,” Dr. Auerbach says. Individually, PSDA or durable power of attorney may not adequately convey a patient’s true wishes, because often times the measures involve nothing more than having the patient or family complete a form. “The true marker is a conversation,” he says.
—Andrew Auerbach, MD, University of California San Francisco
By the Numbers
Of 17,097 patients interviewed, only 1,776 (10.4%) had a documented care discussion within 24 hours of hospital admission. The frequency of discussions varied from a low of 2.8% at one institution, to a high of 24.9% at another.
On unadjusted analysis, patients with documented care discussions were more likely to have living wills, durable powers of attorney, or the names of surrogate decision-makers in their charts (P<0.0001 for all categories). These patients were older, more likely to be white, and more likely to be on Medicare, compared to patients without documented care discussions.
The unadjusted analysis also showed patients with care discussions were more likely to be married, but less likely to be living in their own home or apartment, and, not surprisingly, more likely to have been hospitalized at least once within the previous 12 months. Overall, the general health of patients with care discussions was poorer than those without. Patients with documented discussions were more likely to report needing help within the past month with chores or bathing or dressing themselves, than were patients who did not have care discussions. Cancer, depression, and a history of stroke were common among patients with care discussions. Compared to patients without documented discussions, those who did have the discussion appear to want more of a say in their care: they were less likely to agree with the study statements, “I prefer my doctor give me choices regarding my care,” and “I prefer to leave care decisions to my physician.”
The authors found multivariate analysis showed many of these factors turn out to have only a moderate association with a documented care discussion, with adjusted odds ratios of less than 2.0. The strongest predictors were the existence of informal notations describing pre-hospital care wishes, with odds ratios ranging from 3.22 to 11.32, compared to people with no such documentation, and site of enrollment, with odds ratios of 1.74 to 5.14.
The Caregiver Culture
These findings suggest the “caregiver culture” at any given institution is a stronger determinant of a patient participating in a documented care discussion than other, more intuitive factors, such as medical condition or socioeconomic characteristics, or even whether or not the patient has a pre-existing advance directive or durable power of attorney, Dr. Auerbach explains. “It may just be a part of what some hospitals do. It’s driven by what your peers are doing and by local practices.”
Based on the results of the study, Dr. Auerbach and his co-authors suggest simply establishing mandates to document code status on admission probably will not encourage more conversations of this nature, “unless sites also develop an approach to using this newly documented information as a prompt for subsequent discussions.” The Patient Self-Determination Act went into effect in 1991, but its effect on improving communication around end-of-life care remains uncertain, the authors note. It might be why California passed a new law, effective as of January 2009, requiring physicians and health care organizations in the state to provide terminally ill patients who ask about their end-of-life care options with comprehensive information and counseling. Such discussions must cover advance directives, hospice care, and the right to receive palliative care. The new law is the first of its kind in the nation, but proponents of the legislation hope it will serve as a model for other states to adopt.1
“Documentation has an impact on quality of care. Lots of errors are driven by code status,” Dr. Auerbach points out. “If a patient is admitted in the middle of the night, when the doctor checks in on him the next day, he can look at the chart and see that his partner documented the care discussion the night before. That is incredibly helpful.” TH
Norra MacReady is a medical writer based in California.
Reference
1. O’Reilly KB. California law mandates discussing end-of-life options. Am Med News Web site. Available at amaassn.org/amednews/2008/11/10/prsc1110.htm. Last accessed November 6, 2008.
QTc Interval Prolongation
Terfenadine, cisapride, astemizole … do you remember these drugs? They all were removed from the U.S. market subsequent to adverse outcomes related to QTc interval prolongation, including ventricular arrhythmias.1-3 Many drugs prolong the QTc interval, particularly if a drug is combined with others that affect its metabolism.
QTc interval prolongation can lead to torsades de pointes (TdP). Certain individuals are particularly predisposed to developing TdP, including: women, people with hypokalemia or hypomagnesemia, and those with a history of congenital or idiopathic QTc syndrome, cardiac arrest, syncope, congestive heart failure, bradycardia, baseline QT prolongation, renal failure, or cardiac failure.4 Some agents can prolong the QTc interval by five to 10 milliseconds and cause TdP, while others require a 50-millisecond increase or more.
Drugs that confer a risk of ventricular arrhythmias include: disopyramide, dofetilide, ibutilide, procainamide, quinidine, sotalol, and amiodarone (antiarrhythmic agents); clarithromycin, erythromycin, levofloxacin, gatifloxacin, gemifloxacin, moxifloxacin, telithromycin (anti-infectives); domperidone and droperidol antiemetics; chlorpromazine, haloperidol, mesoridazine, thioridazine, and pimozide (antipsychotics); amitriptyline, desipramine, doxepin, fluoxetine, imipramine, sertraline, and venlafaxine (antidepressants); fluconazole, itraconazole, and ketoconazole (antifungals); naratriptan, sumatriptan, and zolmitriptan; and methadone.4-8 Other related agents, such as voriconazole and ondansetron, have been reported to cause QTc prolongation.
Drugs of special concern are those that frequently inhibit the metabolism of other agents, including erythromycin, clarithromycin, ketoconazole, itraconazole, amiodarone, and quinidine, and many antidepressants and antiretroviral agents. Of the deaths associated with drug-induced QTc prolongation related to the prokinetic agent cisapride, many were due to drug interactions with an imidazole or macrolide antibiotic. In these cases, increased serum concentrations of cisapride occurred due to inhibition of the cytochrome P450 CYP3A4 isoenzyme.9
If treatment with a drug that has the potential for causing QTc prolongation is begun, tell your patient to report any “potential cardiac” symptoms, such as palpitations, syncope, or near-syncope with or without palpitations, to a member of the healthcare team. Always be on the lookout for any concomitant conditions or treatments that can cause hypokalemia (e.g., diuretic use, gastroenteritis, diarrhea, excessive vomiting), or other agents that inhibit drug metabolism.
Obtaining a complete medication history, including the use of herbal products and over-the-counter medications, can help identify and prevent QTc prolongation from a drug interaction. A routine, 12-lead electrocardiogram (EKG) should be utilized during treatment to detect asymptomatic QTc prolongation or abnormal postectopic QTc intervals. Additionally, any patient predisposed to QTc prolongation should have an EKG performed before commencing treatment as well as after treatment is complete. If a drug prolongs the QTc interval beyond normal limits, the benefit of continuing the drug should be weighed against the risk of serious adverse cardiac events.10 TH
Michele B Kaufman, PharmD, BSc, RPh, is a freelance medical writer based in New York City.
References
1. Kupec IF. Seldane and generic terfenadine withdrawn from market. Food and Drug Administration Web site. Available at: www.fda.gov/bbs/topics/answers/ ans00853.html. Accessed Nov. 7, 2008.
2. Zalewski JM. Cisapride withdrawal requires alternate therapy. Cleveland Clinic Web site. Available at: www.clevelandclinicmeded.com/medicalpubs/pharmacy/mayjune2000/cisapride.htm. Accessed Nov. 7, 2008.
3. Drugs removed from or restricted in the U.S. market because of drug interactions. Food and Drug Administration Web site. Available at: www.fda.gov/cder/drug/drugReactions/CERT%20Educational%20Module%201/sld013.htm. Updated Dec. 22, 2008. Accessed Nov. 7, 2008.
4. Roden DM. Drug-induced prolongation of the QT interval. N Engl J Med. 2004;350:1013-1022.
5. Pham CP, de Feiter PW, van der Kuy PHM, van Mook WN. Long QTc interval and torsades de pointes caused by fluconazole. Ann Pharmacother. 2006;40:1456-1461.
6. Nykamp DL, Blackmon CL, Schmidt PE, Roberson AG. QTc prolongation associated with combination therapy of levofloxacin, imipramine, and fluoxetine. Ann Pharmacother. 1005;39:543-546.
7. Philips JA, Marty FM, Stone RM et al. Torsades de pointes associated with voriconazole use. Transpl Infect Dis. 2007;9:33-36.
8. Charbit B, Alvarez JC, Dasque E, Abe E, Démolis JL, Funck-Brentano C. Droperidol and ondansetron-induced QT interval prolongation. Anesthesiol. 2008;109:206-212.
9. Yap YG, Camm AJ. Drug induced qt prolongation and torsades de pointes. Heart. 2003;89:1363-1372.
10. Jayasinghe R, Registrar S, Kovoor P. Drugs and the QTc interval. Aust Prescr. 2002;25:63-65.
11. Atacand HCT 32/25 mg gives patients and physicians more treatment flexibility. Available at: www.pharmacitelink.com/news/2008/08/14_az.pdf. Accessed Nov. 4, 2008.
12. FDA approves astellas’ vaprisol (conivaptan hydrochloride injection) premixed in 5% dextrose for the treatment of hyponatremia. Sandoz Web site. Available at: sandoz.yellowbrix.com/pages/sandoz/Story.nsp?story_id=122559939. Accessed Nov. 4, 2008.
13. U.S. FDA drug shortages. Available at: www.fda.gov/cder/drug/shortages/default.htm#Foscavir. Accessed Nov. 3, 2008.
14. FDA Drug Shortages. Food and Drug Administration Web site. Available at: www.fda.gov/cder/drug/ shortages/discontinuation.pdf. Accessed Nov. 6, 2008.
15. Waknine Y. FDA safety changes: mirena, zyvox, orencia. Medscape Web site. Available at: www.medscape.com/viewarticle/580101. Accessed Nov. 3, 2008.
16. MannKind and Pfizer announce collaboration for certain exubera patients to transition to Mannkind’s inhaled insulin therapy. Drugs.com Web site. Available at: www.drugs.com/news/mannkind-pfizer-announce-collaboration-certain-exubera-patients-transition-mannkind-s-inhaled-13677.html. Accessed Nov. 3, 2008.
17. MannKind reports positive data from a phase 3 clinical study of technosphere insulin in Type 1 diabetics. Drugs.com Web site. Available at: www.drugs.com/ clinical_trials/mannkind-reports-positive-data-phase-3-clinical-study-technosphere-insulin-type-1-diabetes-5554.html. Accessed Nov. 3, 2008.
18. Bratulic A. Sanofi-aventis to halt all Acomplia trials. FirstWord Web site. Available at: www.firstwordplus.com/Fws.do?articleid=34DAB2DC3D7A48939A1D24AB97204CB4&logRowId=263560. Accessed Nov. 6, 2008.
You Asked, We Delivered

When the groundhog pops out of the ground and sees his shadow, what does it mean again? Snow, rain, global warming? Better check Google.
One thing I don’t need a search engine to find out is that readers of The Hospitalist want more pediatric HM coverage. In fact, more than 40% of respondents to our recent reader survey specifically asked for it. More than 500 readers responded, which leads me to think the numbers are pretty accurate.
In response to the overwhelming demand, I’m pleased to announce a new addition to The Hospitalist’s editorial staff. Beginning this month, Mark Shen, MD, medical director of hospital medicine at Dell Children’s Medical Center in Austin, Texas, will become pediatric editor for The Hospitalist. A leading authority on pediatric issues in hospital medicine, Dr. Shen has practiced as a pediatric hospitalist in the seven years since he completed his medical training and pediatric residency at the University of Texas’ Southwestern Medical School in Dallas. With Dr. Shen serving as our guide, the editorial team will expand coverage of pediatric HM with:
- A monthly, pediatric-focused “In the Literature” review;
- More features focusing on trends in pediatric HM; and
- Dr. Shen’s semiannual column, in which he’ll concentrate on pediatric issues relevant to the entire HM community.
We’re glad to have Dr. Shen join us.
Digital Fever
What do a football star shooting himself in the leg, excessive and erroneous asthma diagnoses, and a respected hospitalist admitting to “being a slow learner” have in common? Each has been a lead story in eWire, our weekly e-newsletter that launched in October and appears in your inbox every Tuesday.
In “Taking the Pulse of Hospital Medicine,” we keep you apprised of the latest news and trends in HM in quick news “pieces,” providing you with useful tools, facts, and links to make your day a little easier. In response to your demand for more brief clinical updates, we recently added exclusive “In the Literature” reviews of clinical research and an HM blogosphere roundup. Keep a lookout online and on your phone, as more digital products are in the works.
HM 2009
Yes, SHM’s annual meeting is right around the corner. Early registration ends April 5, which might seem a long way off, but it really isn’t. For the record, I’m totally stoked. Not only will it be my first HM convention, but it will be a homecoming of sorts. I was raised outside of Chicago, in the long shadow of the Sears Tower, and have suffered as a diehard Cubs baseball fan. Sigh. The Cubbies will be in town that week, and I invite convention-goers to visit the hallowed brick house known as Wrigley Field (it’s 15 minutes from the HM09 hotel base).
But back to work. Our editorial staff is conjuring up some exciting HM09 coverage plans. In addition to previews of the big event, we’re planning special daily—yes, daily—news, features, and multimedia offerings from Chicago. Stay tuned.
And, for the record, Google directed me to a Web site that explained everything you need to know about woodchucks—er, groundhogs. When Punxsutawney Phil sees his shadow, it means six more weeks of winter. Let’s hope it doesn’t. TH
Jason Carris is editor of The Hospitalist.
Crunch Time
Before his recent promotion, hospitalist Garth King, MD, medical director of the Schumacher Group at Southwest Medical Center in Lafayette, La., had hoped to add a fourth full-time doctor to his roster. The hiring made sense at the time. As recently as last summer, the group’s three full-time doctors were averaging 35 to 40 patient encounters a day, enough to warrant the additional hospitalist position. But the group’s census dropped 25% in the fourth quarter of 2008, and these days, Dr. King simply can’t justify the math to bring on another six-figure salary.
“Over the past two, three months, patient slowdown has pushed off the ability” to add staff, Dr. King explains. “We’ll wait until things ramp up again, once we get the numbers to where they were before.”
Dr. King could be in for a long wait. The fiscal meltdown that began in 2007 and last year mushroomed into a full-blown recession has taken hold in the world of hospital medicine. More and more, hospitals are reporting decreased revenues and increased levels of charity care. The result: Planned group expansions have been put on hold, open positions are going unfilled, and some hospitalists have been laid off.
Constituencies from health-system executives to rank-and-file hospitalists to economists remain cautious of acting too boldly before President Obama and the new Congress unveil much-anticipated changes to Medicare billing and reimbursement schedules. Aggressive reforms, such as extending health coverage to more than 45 million uninsured Americans, could swamp hospitals with new patients and lead to cuts in reimbursement rates. A more temperate approach by the new administration could leave a relative status quo.
Either way, hospital medicine has never endured a recession so deep that some healthcare economists liken it to the Great Depression, so the practical effect on the industry is difficult to forecast with accuracy. Hospitalists and their observers agree on one thing, though: This is the year hospital medicine will have to prove its worth more empirically than ever. Positive public relations and studies proclaiming reduced lengths of stay and sped-up emergency department throughput have given the industry a “rarified position as a specialty,” one researcher says. But in constrictive economic times, those figures likely will be revisited, says Mark Pauly, professor of healthcare management at The Wharton School at the University of Pennsylvania. “When revenues are falling, you go back and look at that evidence again,” Pauly says. “Is it really bulletproof?”
Still, the prognosis for economic health is not all bad. Many hospital medicine leaders think the concerns over whether chief financial officers will look to hospital contracts as places to cut spending might spawn improved coding and billing, create new partnerships between hospital medicine groups, and push new revenue streams, such as preoperative clinics or inpatient palliative-care initiatives. This also is a time for hospital groups to reaffirm to their respective C-suites—through a deft combination of data and intangible relationships—that they are an indispensable staffing measure that their respective institutions cannot do without.
“This is an opportunity for hospitalists,” says Joe Miller, SHM’s executive advisor to the CEO. “The problem is we’ve got young, inexperienced leaders. Can they see this? Can they recognize this and not see this as a challenge?”
Problem Identification
Hospitalist Marc Westle, DO, FACP, president and managing partner of Asheville Hospital Group in North Carolina, thinks tracking, collating, and reporting quantifiable metrics is the fastest way to convince hospital executives that hospitalists are not the place to cut spending. And when those same executives are looking at staff reductions—53% of hospitals already are cutting or considering cuts, according to the most recent American Hospital Association data—hospital medicine leaders need to be able to point to specific numbers to prove their worth. Detailed information on coding, cost of capture, revenue production, and patient referrals generated are data points that can strengthen a presentation, especially if an argument shows that revenue production and collection is maximized.
“Don’t leave money on the table,” Dr. Westle says. “Your billing department is only going to bill what your physicians tell them to bill. For hospital groups that have not mentioned both the upfront E&M coding by their doctors and the back-end billing efficiency, those are definite things they need to do, today or yesterday. That efficiency may not have hurt them before, but it could hurt them in the next 12 to 18 months.”
Dr. Westle and others also note that hospitalists have to see the economic downturn through the eyes of hospital executives—and the hospital’s bottom line. Recent AHA data show 29% of hospitals are reporting moderate decreases in admissions, and another 9% of hospitals categorize those drops as significant. More than 3 in 10 hospitals have reported a noticeable reduction in elective procedures.
Pauly, the Wharton professor, also cautions that a tightened economy might force primary-care physicians (PCPs) back into hospitals, taking away patients now in the hospitalists’ purview. Hospital medicine’s beginnings trace to those PCPs acquiescing hospital rounds to a new intermediary—hospitalists—in return for the ability to focus more on their daily practices, Pauly says. Ancillary benefits included not being on call 24 hours a day, seven days a week.
“A lower income may change that willingness,” Pauly notes. “Leisure is a luxury good, and if your revenue is falling, you may want to get that business back.”
Another part of the equation is the rising tide of the uninsured, currently estimated at 47 million. It remains to be seen what effect the uninsured have on overall healthcare spending in the U.S., which is projected to rise 6.6% in 2009 to $2.6 trillion, according to the most recent data available from the Centers for Medicare and Medicaid Services (see Figure 1, below). Those projections, however, were released nearly a year ago, long before the severity of the current financial crisis became clear. Pauly says adjusted numbers released this winter, which assumedly will reflect the nation’s ever-deepening financial hole, should be a better gauge on whether healthcare remains as recession-proof as some think it is.
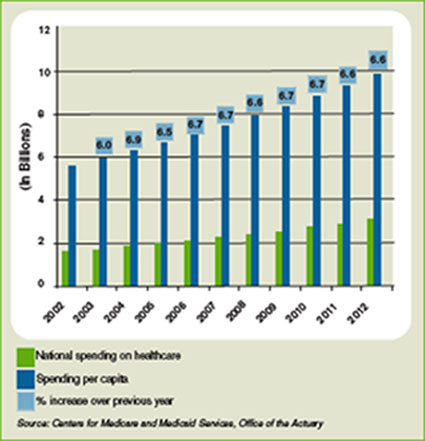
Hoangmai Pham, a senior health researcher at the Center for Studying Health System Change and lead author of a study on how the hospitalist model has focused attention on patient-care coordination, says changes at the federal level will be a driving factor in the strength of healthcare. Roughly 50% to 80% of a hospitalist’s annual salary comes from clinical billings, according to SHM data. The balance comes from hospital subsidies, in the form of annual contracts, monthly stipends, or pay-for-performance bonuses. Drastic changes in payment policy could have drastic implications on those subsidies.
“The ground is very fluid right now, in terms of where payment policy is going,” Pham says. “If I were hospitalists, part of the nervousness would be I’m not sure what direction things are heading in.”
Potential Solutions
Many hospitalists, however, see positives in the economic morass. Hospitalist Troy Ahlstrom, MD, is financial director of Hospitalists of Northwest Michigan in Traverse City, which serves roughly 400 beds at Munson Medical Center. He says groups can prove their worth by showing how they make it easier for other specialists—cardiologists, orthopedists, etc.—to perform the more lucrative procedures on which hospitals rely for higher reimbursements. Then, the group can negotiate for a piece of the savings under a pay-for-performance contracting model.
“What can we do to help make you more efficient, so you can do two extra surgical cases a week?” Dr. Ahlstrom says. “What if the hospital itself realizes a 15% increase in efficiency? Work out a deal that if we save you 15% … you give us a cut.”
Dr. Westle suggests analyzing cost accounting as another way to offer evidence of productivity. Paying overtime for back-office staff is ineffective if your salary overhead is greater than your billing collection. He also recommends a virtual office to employ billing specialists who work from home and doctors without off-site offices, eliminating real estate, utility, and infectious-waste-disposal costs that can cost private practices 55% to 60% in overhead costs.
Partnerships and reinvention are other avenues for cost-effectiveness. Some smaller, single-hospitalist groups might merge to cut costs through economies of scale, but SHM’s Miller thinks there is an opportunity to create a cooperative structure in which hospital medicine groups maintain individual identifies yet share certain functions, such as a common billing service.
Dr. King, the medical director who was promoted in November, is running a long-term acute-care center (LTAC) to help generate a parallel revenue stream. The center opened in May; during periods of decreased patient traffic at Southwest Medical Center, it affords his hospitalists another place to work, encountering patients and billing services. It also creates a referral stream for his hospital. He also has engaged in preliminary discussions for opening and staffing a pre-operative clinic or a wound-care clinic, but those discussions are in the early stages. King is sitting down with PCPs his group has little history with to increase referrals, and he is meeting with the hospital’s specialists to inform them that earlier consults with hospitalists could allow for streamlined service, shorter stays, and greater revenue.
“If you stop your research and development (R&D) during the hard times, 18 months from now, everyone else has stopped their R&D,” Dr. Westle says. “But if you continued your R&D, you’re 18 months ahead of everyone else.”
Dr. Westle refers to his method as “weaving yourself into the fabric of the health system.” Caring for the unassigned adult population and handling internal medicine assignments is low-hanging fruit for hospital medicine groups. He suggests creating programs to teach residents who are participating in hospital quality committees or other panels to deal with coding and billing, staffing LTACs, and improving the referral process for smaller, outlying hospitals to send patients to larger hospitals.
And, of course, there is relationship-building. Although tight economic times will require hospitalists to provide more quantitative data to prove their worth, the hospitalist model thrives on doctor-to-doctor interactions. Connections built with proceduralists and nurses, who can vouch for the value of a hospital medicine group, can mean a lot when hospital boards are searching for areas to trim costs.
“If you talk to seasoned directors of hospitalist programs, you win over hearts and minds one at a time,” Pham says. Most hospital executives “know there is value beyond that which can be proven on the balance sheet. It’s difficult to price things like convenience, satisfaction.”
What’s Next
Doug Cutler, MD, a hospitalist at Banner Sun City Hospitalists in Arizona, which serves 800-plus beds in two hospitals in Sun City and Sun City West, has watched economics change his situation. His old employer, Banner Health, recently merged its two hospitals with Sun Health. The new owners are learning how Cutler’s group works, talking to both hospitalists and other hospital staff. They have the group’s documentation to review, but individual doctors now have the opportunity to prove themselves as standouts.
“Find out the needs and service them the best you can,” Dr. Cutler says. “If it’s a throughput issue, work with them on that. Are you on committees? Are you on the quality committee? Pharmacy and therapeutics? Find what they need and fill a niche. Talk to medical directors, work with case managers. Don’t be the one that they hate to page; be the one they’re not worried about stopping in the hallways because you’re the go-to physician.”
SHM’s Miller agrees that individual hospitalists should take every opportunity to stand out. Whether it’s making sure hospital executives know your name, earning as many certifications as applicable, or applying for the society’s new Fellow in Hospital Medicine program, each doctor has to look at the economic crisis from a professional and personal viewpoint.
And while some could reason that Dr. Cutler’s situation—working for a hospital-owned group as opposed to a large multistate group or multispecialty practice—gives him more job security, he could argue the lack of negotiating leverage might give him less. But as he often tells his patients when they ask for a diagnosis: It’s hard to see 10 seconds into the future.
“I don’t want to think I’m sitting here fat, dumb, and happy and they won’t let me go,” Cutler says, knocking on wood. “I just don’t know. Every company … realistically needs to look at everything if they want to survive. We’re potentially on the chopping block, but do you lop off something that costs a million dollars when it saves you five? Are you willing to go back to a time before that?” TH
Richard Quinn is a freelance writer based in New Jersey.
Before his recent promotion, hospitalist Garth King, MD, medical director of the Schumacher Group at Southwest Medical Center in Lafayette, La., had hoped to add a fourth full-time doctor to his roster. The hiring made sense at the time. As recently as last summer, the group’s three full-time doctors were averaging 35 to 40 patient encounters a day, enough to warrant the additional hospitalist position. But the group’s census dropped 25% in the fourth quarter of 2008, and these days, Dr. King simply can’t justify the math to bring on another six-figure salary.
“Over the past two, three months, patient slowdown has pushed off the ability” to add staff, Dr. King explains. “We’ll wait until things ramp up again, once we get the numbers to where they were before.”
Dr. King could be in for a long wait. The fiscal meltdown that began in 2007 and last year mushroomed into a full-blown recession has taken hold in the world of hospital medicine. More and more, hospitals are reporting decreased revenues and increased levels of charity care. The result: Planned group expansions have been put on hold, open positions are going unfilled, and some hospitalists have been laid off.
Constituencies from health-system executives to rank-and-file hospitalists to economists remain cautious of acting too boldly before President Obama and the new Congress unveil much-anticipated changes to Medicare billing and reimbursement schedules. Aggressive reforms, such as extending health coverage to more than 45 million uninsured Americans, could swamp hospitals with new patients and lead to cuts in reimbursement rates. A more temperate approach by the new administration could leave a relative status quo.
Either way, hospital medicine has never endured a recession so deep that some healthcare economists liken it to the Great Depression, so the practical effect on the industry is difficult to forecast with accuracy. Hospitalists and their observers agree on one thing, though: This is the year hospital medicine will have to prove its worth more empirically than ever. Positive public relations and studies proclaiming reduced lengths of stay and sped-up emergency department throughput have given the industry a “rarified position as a specialty,” one researcher says. But in constrictive economic times, those figures likely will be revisited, says Mark Pauly, professor of healthcare management at The Wharton School at the University of Pennsylvania. “When revenues are falling, you go back and look at that evidence again,” Pauly says. “Is it really bulletproof?”
Still, the prognosis for economic health is not all bad. Many hospital medicine leaders think the concerns over whether chief financial officers will look to hospital contracts as places to cut spending might spawn improved coding and billing, create new partnerships between hospital medicine groups, and push new revenue streams, such as preoperative clinics or inpatient palliative-care initiatives. This also is a time for hospital groups to reaffirm to their respective C-suites—through a deft combination of data and intangible relationships—that they are an indispensable staffing measure that their respective institutions cannot do without.
“This is an opportunity for hospitalists,” says Joe Miller, SHM’s executive advisor to the CEO. “The problem is we’ve got young, inexperienced leaders. Can they see this? Can they recognize this and not see this as a challenge?”
Problem Identification
Hospitalist Marc Westle, DO, FACP, president and managing partner of Asheville Hospital Group in North Carolina, thinks tracking, collating, and reporting quantifiable metrics is the fastest way to convince hospital executives that hospitalists are not the place to cut spending. And when those same executives are looking at staff reductions—53% of hospitals already are cutting or considering cuts, according to the most recent American Hospital Association data—hospital medicine leaders need to be able to point to specific numbers to prove their worth. Detailed information on coding, cost of capture, revenue production, and patient referrals generated are data points that can strengthen a presentation, especially if an argument shows that revenue production and collection is maximized.
“Don’t leave money on the table,” Dr. Westle says. “Your billing department is only going to bill what your physicians tell them to bill. For hospital groups that have not mentioned both the upfront E&M coding by their doctors and the back-end billing efficiency, those are definite things they need to do, today or yesterday. That efficiency may not have hurt them before, but it could hurt them in the next 12 to 18 months.”
Dr. Westle and others also note that hospitalists have to see the economic downturn through the eyes of hospital executives—and the hospital’s bottom line. Recent AHA data show 29% of hospitals are reporting moderate decreases in admissions, and another 9% of hospitals categorize those drops as significant. More than 3 in 10 hospitals have reported a noticeable reduction in elective procedures.
Pauly, the Wharton professor, also cautions that a tightened economy might force primary-care physicians (PCPs) back into hospitals, taking away patients now in the hospitalists’ purview. Hospital medicine’s beginnings trace to those PCPs acquiescing hospital rounds to a new intermediary—hospitalists—in return for the ability to focus more on their daily practices, Pauly says. Ancillary benefits included not being on call 24 hours a day, seven days a week.
“A lower income may change that willingness,” Pauly notes. “Leisure is a luxury good, and if your revenue is falling, you may want to get that business back.”
Another part of the equation is the rising tide of the uninsured, currently estimated at 47 million. It remains to be seen what effect the uninsured have on overall healthcare spending in the U.S., which is projected to rise 6.6% in 2009 to $2.6 trillion, according to the most recent data available from the Centers for Medicare and Medicaid Services (see Figure 1, below). Those projections, however, were released nearly a year ago, long before the severity of the current financial crisis became clear. Pauly says adjusted numbers released this winter, which assumedly will reflect the nation’s ever-deepening financial hole, should be a better gauge on whether healthcare remains as recession-proof as some think it is.
Hoangmai Pham, a senior health researcher at the Center for Studying Health System Change and lead author of a study on how the hospitalist model has focused attention on patient-care coordination, says changes at the federal level will be a driving factor in the strength of healthcare. Roughly 50% to 80% of a hospitalist’s annual salary comes from clinical billings, according to SHM data. The balance comes from hospital subsidies, in the form of annual contracts, monthly stipends, or pay-for-performance bonuses. Drastic changes in payment policy could have drastic implications on those subsidies.
“The ground is very fluid right now, in terms of where payment policy is going,” Pham says. “If I were hospitalists, part of the nervousness would be I’m not sure what direction things are heading in.”
Potential Solutions
Many hospitalists, however, see positives in the economic morass. Hospitalist Troy Ahlstrom, MD, is financial director of Hospitalists of Northwest Michigan in Traverse City, which serves roughly 400 beds at Munson Medical Center. He says groups can prove their worth by showing how they make it easier for other specialists—cardiologists, orthopedists, etc.—to perform the more lucrative procedures on which hospitals rely for higher reimbursements. Then, the group can negotiate for a piece of the savings under a pay-for-performance contracting model.
“What can we do to help make you more efficient, so you can do two extra surgical cases a week?” Dr. Ahlstrom says. “What if the hospital itself realizes a 15% increase in efficiency? Work out a deal that if we save you 15% … you give us a cut.”
Dr. Westle suggests analyzing cost accounting as another way to offer evidence of productivity. Paying overtime for back-office staff is ineffective if your salary overhead is greater than your billing collection. He also recommends a virtual office to employ billing specialists who work from home and doctors without off-site offices, eliminating real estate, utility, and infectious-waste-disposal costs that can cost private practices 55% to 60% in overhead costs.
Partnerships and reinvention are other avenues for cost-effectiveness. Some smaller, single-hospitalist groups might merge to cut costs through economies of scale, but SHM’s Miller thinks there is an opportunity to create a cooperative structure in which hospital medicine groups maintain individual identifies yet share certain functions, such as a common billing service.
Dr. King, the medical director who was promoted in November, is running a long-term acute-care center (LTAC) to help generate a parallel revenue stream. The center opened in May; during periods of decreased patient traffic at Southwest Medical Center, it affords his hospitalists another place to work, encountering patients and billing services. It also creates a referral stream for his hospital. He also has engaged in preliminary discussions for opening and staffing a pre-operative clinic or a wound-care clinic, but those discussions are in the early stages. King is sitting down with PCPs his group has little history with to increase referrals, and he is meeting with the hospital’s specialists to inform them that earlier consults with hospitalists could allow for streamlined service, shorter stays, and greater revenue.
“If you stop your research and development (R&D) during the hard times, 18 months from now, everyone else has stopped their R&D,” Dr. Westle says. “But if you continued your R&D, you’re 18 months ahead of everyone else.”
Dr. Westle refers to his method as “weaving yourself into the fabric of the health system.” Caring for the unassigned adult population and handling internal medicine assignments is low-hanging fruit for hospital medicine groups. He suggests creating programs to teach residents who are participating in hospital quality committees or other panels to deal with coding and billing, staffing LTACs, and improving the referral process for smaller, outlying hospitals to send patients to larger hospitals.
And, of course, there is relationship-building. Although tight economic times will require hospitalists to provide more quantitative data to prove their worth, the hospitalist model thrives on doctor-to-doctor interactions. Connections built with proceduralists and nurses, who can vouch for the value of a hospital medicine group, can mean a lot when hospital boards are searching for areas to trim costs.
“If you talk to seasoned directors of hospitalist programs, you win over hearts and minds one at a time,” Pham says. Most hospital executives “know there is value beyond that which can be proven on the balance sheet. It’s difficult to price things like convenience, satisfaction.”
What’s Next
Doug Cutler, MD, a hospitalist at Banner Sun City Hospitalists in Arizona, which serves 800-plus beds in two hospitals in Sun City and Sun City West, has watched economics change his situation. His old employer, Banner Health, recently merged its two hospitals with Sun Health. The new owners are learning how Cutler’s group works, talking to both hospitalists and other hospital staff. They have the group’s documentation to review, but individual doctors now have the opportunity to prove themselves as standouts.
“Find out the needs and service them the best you can,” Dr. Cutler says. “If it’s a throughput issue, work with them on that. Are you on committees? Are you on the quality committee? Pharmacy and therapeutics? Find what they need and fill a niche. Talk to medical directors, work with case managers. Don’t be the one that they hate to page; be the one they’re not worried about stopping in the hallways because you’re the go-to physician.”
SHM’s Miller agrees that individual hospitalists should take every opportunity to stand out. Whether it’s making sure hospital executives know your name, earning as many certifications as applicable, or applying for the society’s new Fellow in Hospital Medicine program, each doctor has to look at the economic crisis from a professional and personal viewpoint.
And while some could reason that Dr. Cutler’s situation—working for a hospital-owned group as opposed to a large multistate group or multispecialty practice—gives him more job security, he could argue the lack of negotiating leverage might give him less. But as he often tells his patients when they ask for a diagnosis: It’s hard to see 10 seconds into the future.
“I don’t want to think I’m sitting here fat, dumb, and happy and they won’t let me go,” Cutler says, knocking on wood. “I just don’t know. Every company … realistically needs to look at everything if they want to survive. We’re potentially on the chopping block, but do you lop off something that costs a million dollars when it saves you five? Are you willing to go back to a time before that?” TH
Richard Quinn is a freelance writer based in New Jersey.
System Overhaul
The global economy is on life support, unemployment is marching upward, wars rage on in Iraq and Afghanistan, and the federal deficit is approaching $1 trillion. By necessity, President Obama will push campaign promises to lower healthcare costs and provide affordable, accessible health insurance to all Americans to the end of his “to do” list, right?
Not necessarily.
“If we want to overcome our economic challenges, we must also finally address our healthcare challenge,” Obama said in a Dec. 11, 2008, speech in which he nominated former Sen. Tom Daschle (D-S.D.) to be his secretary of Health and Human Services and appointed him director of a new White House Office on Health Reform.
What this aggressive pursuit of healthcare change means for hospital medicine is still unclear, say health policy experts and hospitalists, because the Obama administration’s plan isn’t concrete and will change as it moves through Congress and the forums of public debate. Even so, some experts think an Obama healthcare overhaul would mean more revenue and information technology advancements for hospitals as well as significantly more patients as millions of newly insured Americans flood a system beset by a dwindling number of primary-care physicians.
For hospitalists and other physicians, the Obama plan could mean:
- Access to more information on what therapies work best for patients.
- A focus on preventative care.
- Greater emphasis on care-management programs and medical homes, especially for people with chronic conditions.
“He will lay out a bold vision on what he wants to do over time, and then he will enact it in several steps,” says Karen Davis, PhD, president of the Commonwealth Fund, a private healthcare research organization. “He’s certainly said it won’t be business as usual.”
Key Healthcare Officials in President Obama’s Administration

TOM DASCHLE
The secretary of Health and Human Services and director of a new White House Office on Health Reform is a former Democratic congressman and senator from South Dakota. He co-authored a book with Jeanne Lambrew this year, “Critical: What We Can Do About the Health-Care Crisis.” Obama has called the book “groundbreaking.” Prior to joining the Obama team, Daschle, 61, was a public policy adviser at Alston & Bird, a legal and lobbying firm. He remains a distinguished senior fellow at the Center for American Progress, where he’s pursued his interest in healthcare policy.

JEANNE LAMBREW
The deputy director of a new White House Office on Health Reform is an associate professor at the Lyndon B. Johnson School of Public Affairs at the University of Texas in Austin, and a senior fellow at the Center for American Progress. A co-author of the book Critical: What We Can Do About the Health-Care Crisis, Lambrew was a health policy advisor to President Clinton during his second term and helped establish the State Children’s Health Insurance Program.

PETER ORSZAG
The director of the Office of Management and Budget is a Princeton University graduate who has a Ph.D. from the London School of Economics. Prior to joining the Obama administration, Orszag, 39, directed the Con-gressional Budget Office and shifted a large part of its focus to healthcare issues. Orszag says the top fiscal threat facing the nation is escalating healthcare spending.
Sources: Obama-Biden transition Web site, www.change.gov; Center for American Progress; Congressional Quarterly
Right to Work
Obama says he will work immediately to expand eligibility for the State Children’s Health Insurance Program (SCHIP) and, in light of the recession, direct more federal money to states’ Medicaid programs, says Joseph Newhouse, PhD, a professor of health policy at Harvard University. Indeed, in the months before she was named deputy director of the White House’s new office on health reform, Jeanne Lambrew urged Congress to pass legislation that would boost federal funding for Medicaid and SCHIP.
Within the first few months of his administration, Obama also plans to push for investment in health information technology as a way to modernize the healthcare system and spur the economy, says Judy Feder, PhD, a professor and former dean of Georgetown University’s Public Policy Institute and a two-time Democratic congressional candidate who campaigned on a healthcare platform almost identical to the president’s.
Obama says he would like to direct $10 billion a year over the next five years to help the nation’s hospitals and healthcare providers install electronic billing and medical record systems.
“Somebody’s got to help set those up. We’ve got to buy computer systems and so forth. That’s an immediate boost to the economy…but it’s also laying the groundwork for reducing our healthcare costs over the long term,” Obama said in November upon naming Peter Orszag, an economist who regards rising healthcare spending as the nation’s top fiscal threat, director of the Office of Management and Budget.
Hospitals and hospitalists can benefit from IT advancements, but the technology should be slowly phased in to give users time to adjust, which may run counter to the quick economic stimulus Obama is trying to achieve, says David Meltzer, M.D., Ph.D., a professor in the department of medicine at the University of Chicago who has conducted considerable research in hospital medicine.
“The point is, health IT takes years to implement,” Dr. Meltzer says. “Just giving grants to buy and set up the equipment isn’t enough. You also want to give grants to prepare people on how to use it effectively.”
Dr. Meltzer is encouraged by Obama’s plan to create an independent, government-funded board charged with scientifically comparing the effectiveness of pharmaceutical drugs, medical devices, and procedures, and presenting the results to the medical community. He foresees hospitalists gaining opportunities to participate in clinical research as well as enroll patients in clinical trials.
“Over the long run, we’ll probably end up with therapies that will be better for patients and will control costs,” Dr. Meltzer says. “We spend a lot of money on things that don’t work or don’t work very well.”
Calling a comparative-effectiveness board “absolutely essential,” the Common-wealth Fund’s Davis says the U.S. has fallen far behind other countries in reviewing and rating therapies. Part of the reason is a fear that comparative effectiveness would stymie innovation and prevent doctors and patients from pursuing their choice of treatments, Dr. Meltzer says.
Opponents point to the book “Critical: What We Can Do About the Healthcare Crisis,” which Daschle and Lambrew co-wrote last year. In the book, Daschle advocates creating a federal health board outside the influence of Congress that would decide which procedures and therapies should be covered under public and private insurance plans. Obama has yet to support such a concept.
“There is that danger, but we live in an even more dangerous health system now,” says Dr. Meltzer, who predicts comparative-effectiveness legislation will advance this year. “I will be shocked and profoundly disappointed if we don’t see the legislation.”
Dr. Meltzer and other experts are less certain as to when Obama will move on other parts of his proposal, although Feder believes the president will try to create a national health-plan option and establish a national health insurance exchange, a kind of one-stop shop offering consumers health plans that would meet a minimum level of benefits, sometime in the next four years.
The national health-plan benefits could be similar to what federal employees receive, namely guaranteed health coverage and long-term care benefits, a wide variety of health plans to choose from, and insurability for pre-existing conditions. Private insurers would have to sell policies to everyone, regardless of pre-existing health conditions, and consumers who are unable to afford the premiums would be eligible for tax credits. The president’s plan stops short of requiring all Americans to have health insurance.
System Overload?
With more Americans insured, hospitals’ revenues will increase, according to Davis. Hospital patient loads—and hospitalists’ workloads—would increase, says Iris Mangulabnan, MD, a hospitalist at Covenant HealthCare in Saginaw, Mich.
“In the global scheme of things, if (Obama) is going to have insurance for about 45 million more patients, you’re going to see hospitals crammed with more people,” Dr. Mangulabnan says.
Adam Singer, MD, CEO of IPC: The Hospitalist Company, a national physician group practice based in California, says Obama’s plan has the potential to “overwhelm” the U.S. healthcare system. “Who’s going to take care of all these people?” he says.
Obama’s healthcare plan highlights preventive-care and disease management programs as ways to keep people out of hospitals and save money, but Dr. Mangulabnan says research has shown such initiatives aren’t always effective. “They hold a lot of conceptual promise, but I’m reminded of that fast-food commercial—you know, ‘Where’s the beef?’ ” Dr. Singer says.
Both doctors question how Obama’s healthcare plan, which would cost an estimated $75 billion a year when fully implemented, would be paid for. During his campaign, Obama talked about letting tax cuts expire for people making more than $250,000 a year and using that money for healthcare. But the economic crisis has forced the president to reconsider ending the tax cuts.
Cost is just one obstacle to Obama’s plan. Experts say the list also includes health insurers, pharmaceutical and medical product companies, doctors, congressional Republicans, an agenda full of other pressing problems, and change.
“It’s very difficult for a multitrillion-dollar industry to see the ground shift beneath it. It’s the known versus the unknown,” Davis says. “But I don’t see the economy as an obstacle. If anything, it increases the chance that healthcare will be addressed, because more people are being affected by problems in the system. The main thing that’s driving all of this is a feeling that it’s time.” TH
Lisa M. Ryan is a freelance writer based in New Jersey.
The global economy is on life support, unemployment is marching upward, wars rage on in Iraq and Afghanistan, and the federal deficit is approaching $1 trillion. By necessity, President Obama will push campaign promises to lower healthcare costs and provide affordable, accessible health insurance to all Americans to the end of his “to do” list, right?
Not necessarily.
“If we want to overcome our economic challenges, we must also finally address our healthcare challenge,” Obama said in a Dec. 11, 2008, speech in which he nominated former Sen. Tom Daschle (D-S.D.) to be his secretary of Health and Human Services and appointed him director of a new White House Office on Health Reform.
What this aggressive pursuit of healthcare change means for hospital medicine is still unclear, say health policy experts and hospitalists, because the Obama administration’s plan isn’t concrete and will change as it moves through Congress and the forums of public debate. Even so, some experts think an Obama healthcare overhaul would mean more revenue and information technology advancements for hospitals as well as significantly more patients as millions of newly insured Americans flood a system beset by a dwindling number of primary-care physicians.
For hospitalists and other physicians, the Obama plan could mean:
- Access to more information on what therapies work best for patients.
- A focus on preventative care.
- Greater emphasis on care-management programs and medical homes, especially for people with chronic conditions.
“He will lay out a bold vision on what he wants to do over time, and then he will enact it in several steps,” says Karen Davis, PhD, president of the Commonwealth Fund, a private healthcare research organization. “He’s certainly said it won’t be business as usual.”
Key Healthcare Officials in President Obama’s Administration
TOM DASCHLE
The secretary of Health and Human Services and director of a new White House Office on Health Reform is a former Democratic congressman and senator from South Dakota. He co-authored a book with Jeanne Lambrew this year, “Critical: What We Can Do About the Health-Care Crisis.” Obama has called the book “groundbreaking.” Prior to joining the Obama team, Daschle, 61, was a public policy adviser at Alston & Bird, a legal and lobbying firm. He remains a distinguished senior fellow at the Center for American Progress, where he’s pursued his interest in healthcare policy.
JEANNE LAMBREW
The deputy director of a new White House Office on Health Reform is an associate professor at the Lyndon B. Johnson School of Public Affairs at the University of Texas in Austin, and a senior fellow at the Center for American Progress. A co-author of the book Critical: What We Can Do About the Health-Care Crisis, Lambrew was a health policy advisor to President Clinton during his second term and helped establish the State Children’s Health Insurance Program.
PETER ORSZAG
The director of the Office of Management and Budget is a Princeton University graduate who has a Ph.D. from the London School of Economics. Prior to joining the Obama administration, Orszag, 39, directed the Con-gressional Budget Office and shifted a large part of its focus to healthcare issues. Orszag says the top fiscal threat facing the nation is escalating healthcare spending.
Sources: Obama-Biden transition Web site, www.change.gov; Center for American Progress; Congressional Quarterly
Right to Work
Obama says he will work immediately to expand eligibility for the State Children’s Health Insurance Program (SCHIP) and, in light of the recession, direct more federal money to states’ Medicaid programs, says Joseph Newhouse, PhD, a professor of health policy at Harvard University. Indeed, in the months before she was named deputy director of the White House’s new office on health reform, Jeanne Lambrew urged Congress to pass legislation that would boost federal funding for Medicaid and SCHIP.
Within the first few months of his administration, Obama also plans to push for investment in health information technology as a way to modernize the healthcare system and spur the economy, says Judy Feder, PhD, a professor and former dean of Georgetown University’s Public Policy Institute and a two-time Democratic congressional candidate who campaigned on a healthcare platform almost identical to the president’s.
Obama says he would like to direct $10 billion a year over the next five years to help the nation’s hospitals and healthcare providers install electronic billing and medical record systems.
“Somebody’s got to help set those up. We’ve got to buy computer systems and so forth. That’s an immediate boost to the economy…but it’s also laying the groundwork for reducing our healthcare costs over the long term,” Obama said in November upon naming Peter Orszag, an economist who regards rising healthcare spending as the nation’s top fiscal threat, director of the Office of Management and Budget.
Hospitals and hospitalists can benefit from IT advancements, but the technology should be slowly phased in to give users time to adjust, which may run counter to the quick economic stimulus Obama is trying to achieve, says David Meltzer, M.D., Ph.D., a professor in the department of medicine at the University of Chicago who has conducted considerable research in hospital medicine.
“The point is, health IT takes years to implement,” Dr. Meltzer says. “Just giving grants to buy and set up the equipment isn’t enough. You also want to give grants to prepare people on how to use it effectively.”
Dr. Meltzer is encouraged by Obama’s plan to create an independent, government-funded board charged with scientifically comparing the effectiveness of pharmaceutical drugs, medical devices, and procedures, and presenting the results to the medical community. He foresees hospitalists gaining opportunities to participate in clinical research as well as enroll patients in clinical trials.
“Over the long run, we’ll probably end up with therapies that will be better for patients and will control costs,” Dr. Meltzer says. “We spend a lot of money on things that don’t work or don’t work very well.”
Calling a comparative-effectiveness board “absolutely essential,” the Common-wealth Fund’s Davis says the U.S. has fallen far behind other countries in reviewing and rating therapies. Part of the reason is a fear that comparative effectiveness would stymie innovation and prevent doctors and patients from pursuing their choice of treatments, Dr. Meltzer says.
Opponents point to the book “Critical: What We Can Do About the Healthcare Crisis,” which Daschle and Lambrew co-wrote last year. In the book, Daschle advocates creating a federal health board outside the influence of Congress that would decide which procedures and therapies should be covered under public and private insurance plans. Obama has yet to support such a concept.
“There is that danger, but we live in an even more dangerous health system now,” says Dr. Meltzer, who predicts comparative-effectiveness legislation will advance this year. “I will be shocked and profoundly disappointed if we don’t see the legislation.”
Dr. Meltzer and other experts are less certain as to when Obama will move on other parts of his proposal, although Feder believes the president will try to create a national health-plan option and establish a national health insurance exchange, a kind of one-stop shop offering consumers health plans that would meet a minimum level of benefits, sometime in the next four years.
The national health-plan benefits could be similar to what federal employees receive, namely guaranteed health coverage and long-term care benefits, a wide variety of health plans to choose from, and insurability for pre-existing conditions. Private insurers would have to sell policies to everyone, regardless of pre-existing health conditions, and consumers who are unable to afford the premiums would be eligible for tax credits. The president’s plan stops short of requiring all Americans to have health insurance.
System Overload?
With more Americans insured, hospitals’ revenues will increase, according to Davis. Hospital patient loads—and hospitalists’ workloads—would increase, says Iris Mangulabnan, MD, a hospitalist at Covenant HealthCare in Saginaw, Mich.
“In the global scheme of things, if (Obama) is going to have insurance for about 45 million more patients, you’re going to see hospitals crammed with more people,” Dr. Mangulabnan says.
Adam Singer, MD, CEO of IPC: The Hospitalist Company, a national physician group practice based in California, says Obama’s plan has the potential to “overwhelm” the U.S. healthcare system. “Who’s going to take care of all these people?” he says.
Obama’s healthcare plan highlights preventive-care and disease management programs as ways to keep people out of hospitals and save money, but Dr. Mangulabnan says research has shown such initiatives aren’t always effective. “They hold a lot of conceptual promise, but I’m reminded of that fast-food commercial—you know, ‘Where’s the beef?’ ” Dr. Singer says.
Both doctors question how Obama’s healthcare plan, which would cost an estimated $75 billion a year when fully implemented, would be paid for. During his campaign, Obama talked about letting tax cuts expire for people making more than $250,000 a year and using that money for healthcare. But the economic crisis has forced the president to reconsider ending the tax cuts.
Cost is just one obstacle to Obama’s plan. Experts say the list also includes health insurers, pharmaceutical and medical product companies, doctors, congressional Republicans, an agenda full of other pressing problems, and change.
“It’s very difficult for a multitrillion-dollar industry to see the ground shift beneath it. It’s the known versus the unknown,” Davis says. “But I don’t see the economy as an obstacle. If anything, it increases the chance that healthcare will be addressed, because more people are being affected by problems in the system. The main thing that’s driving all of this is a feeling that it’s time.” TH
Lisa M. Ryan is a freelance writer based in New Jersey.
Perioperative Medicine Summit 2009
Summit Director:
Amir K. Jaffer, MD
Contents
Abstract 1: Pulmonary hypertension is an important predictor of perioperative outcomes in patients undergoing noncardiac surgery
Roop Kaw, MD; Esteban Walker, PhD; Vinay Pasupuleti, MD, PhD; Abhishek Deshpande, MD, PhD; Tarek Hamieh, MD; and Omar A. Minai, MD
Abstract 2: Analysis of administrative practices and residency training curricula in academic anesthesiology programs
David Hepner, A.R. Bader, D. Correll, L.C. Tsen, B.S. Segal, and A.M. Bader
Abstract 3: Is percent body fat a better predictor of surgical site infection risk than body mass index?
Emily Waisbren, BS; Angela M. Bader, MD, MPH; Heather Rosen, MD, MPH; Selwyn O. Rogers, Jr., MD, MPH; and Elof Eriksson, MD, PhD
Abstract 4: A nomogram for prediction of survival for patients undergoing elective major noncardiac surgery
Y. Olivia Xu-Cai, MD; and Michael W. Kattan, PhD
Abstract 5: Sustainability of an osteoporosis pathway
Catherine Gibb, MBBS, FRACP; Christopher Butcher, FRACS; Lesley Thomas, BNsg; and Jennifer Pink, BPharm
Abstract 6: Length of hospital stay is predicted by comorbidities
Catherine Gibb, MBBS, FRACP; and Professor Villis Marshall, FRACS
Abstract 7: Generalization of the POISE and Mangano studies on beta-blocker use in the perioperative period
Matthieu Touchette, MD; Odile Paquette, MD; Catherine St-Georges, MD; and Luc Lanthier, MD, MSc
Abstract 8: Impact of antihypertensive medication on perioperative period
Matthieu Touchette, MD; Odile Paquette, MD; Catherine St-Georges, MD; Danielle Pilon, MD, MSc; and Luc Lanthier, MD, MSc
Abstract 9: An analysis of preoperative testing protocols in academic anesthesiology programs
David Hepner, A.R. Bader, D. Correll, L.C. Tsen, B.S. Segal, and A.M. Bader
Abstract 10: Preoperative biomarkers of inflammation, ischemia, and heart failure and outcomes of vascular surgery
Matthew Griffee, MD; Ansgar Brambrink, MD, PhD; and Thomas Barrett, MD
Abstract 11: Alcohol-related predictors of postoperative delirium in major head and neck cancer surgery
Harrison Weed, MD; Summit Shah, BS; Xin He, PhD; Amit Agrawal, MD; Enver Ozer, MD; and David E. Schuller, MD
Abstract 12: Intraoperative coagulopathy: A low-volume treatment protocol that completely replaces fresh frozen plasma
Peter Kallas, MD; Mary Lou Green, MHS; and Anjali Desai, MD
Abstract 13: Is the Berlin Questionnaire an effective screening tool for obstructive sleep apnea in the preoperative total joint replacement population?
Peter Kallas, MD; Mark Schumacher; Mona Lazar, DO; and Anjali Desai, MD
Abstract 14: The impact of preoperative medical optimization on head and neck cancer surgery
Christopher Tan, MBBS; Catherine Gibb, MBBS, FRACP; and Suren Krishnan, MBBS, FRACS
Abstract 15: Reconceptualizing the preoperative process
Ross Kerridge, MBBS, FRCA, FANZCA
Abstract 16: Development of an electronic medical record smart set form to increase standardization, consistency, and compliance with ACC/AHA perioperative guidelines
Anitha Rajamanickam, MD; Ali Usmani, MD; Ajay Kumar, MD; and Brian Harte, MD
Abstract 17: Development of a perioperative electronic medical record research and quality improvement database
Anitha Rajamanickam, MD; Ali Usmani, MD; Feza Remzi, MD; Brian Harte, MD; and Ajay Kumar, MD
Abstract 18: An innovative perioperative/consultative curriculum for third-year internal medicine residents
Alex Rico, MD; Joshua Lenchus, DO; and Amir Jaffer, MD
Abstract 19: Preoperative medicine infobutton
Terrence J. Adam, MD, PhD
Abstract 20: Nurse practitioners: Bridging the gap in perioperative care
Sally Morgan, RN, MS, ANP-BC, ACNS-BC; and Angela Wright, RN, MSN, APRN, BC
Abstract 21: Intubation training of deploying far forward combat medical personnel with the video laryngoscope
Ben Boedeker, MD; Mary Barak-Bernhagen, BS; Kirsten Boedeker; and W. Bosseau Murray, MD
Abstract 22: The establishment of a perioperative skin integrity committee
Jeanne Lanchester, RN, MEd; Ann Leary, BSN, RNC; and Susan Vargas, AD, RN
Abstract 23: Development and implementation of a perianesthesia integrative care committee
Jeanne Lanchester, RN, MEd; Jeanette Cote, BWN, RN; Terri Jamros, RN; Charla Delillo, RN; Sherie Lavoie, BSN, RN; Jennifer Therminos, SN; Joan Compagnone, RN; and Nicole Engel, MSN, RN
Abstract 24: Development of a screening system to identify patients preoperatively who may benefit from a postoperative hospitalist consult
Elizabeth Marlow, MD, MA; and Chad Whelan, MD
Abstract 25: An algorithm for preoperative screening and management of sleep apnea: Have we created a monster?
Deborah C. Richman, MBChB, FFA(SA); Jorge M. Mallea, MD; Paul S. Richman, MD; and Pater S.A. Glass, MBChB
Abstract 26: Constructing a collaborative neuroscience hospitalist program
Rachel Thompson, MD; Christy Gilmore, MD; Kamal Ajam, MD; and Jennifer Thompson, MD
Abstract 27: The development of algorithms for preoperative management of antiplatelet and anticoagulation therapy in patients undergoing surgical or invasive procedures
Catherine McGowan, MSN, and Patricia Kidik, MSN
Abstract 28: Surgeon-initiated preoperative screening: A new approach
Christina Johnson, RN, PA-C; and Edward J. denBraven, CRNA
Abstract 29: A new process for ensuring the safety of patients having anesthesia outside of the operating room
Ellen Leary, MSN; Catherine McGowan, MSN; Kathleen McGrath, MSN; Sheila McCabe Hassan, MSN; and Theresa Kennedy, MSN
Abstract 30: Establishing a virtual preoperative evaluation clinic
Corey Zetterman, MD; Bobbie J. Sweitzer, MD; and Ben H. Boedeker, MD
Abstract 31: Perioperative hypoxemia and rhabdomyolysis in a medically complicated patient
Sarah Bodin, MD
Abstract 32: How soon is too soon? General anesthesia after coronary intervention with bare metal stents
Meghan Tadel, MD
Abstract 33: Can patients with critical aortic stenosis undergo noncardiac surgery without intervening aortic valve replacement?
M. Chadi Alraies, MD; Abdul Alraiyes, MD; Anitha Rajamanickam, MD; and Frank Michota, MD
Abstract 34: Is it safe to operate on cocaine-positive patients?
M. Chadi Alraies, MD; Abdul Hamid Alraiyes, MD; and Brian Harte, MD
Abstract 35: To intensive care or not?
Mona Lazar, DO; and Peter Kallas, MD
Abstract 36: Predicting surgical complications from liver disease
Mona Lazar, DO, and Peter Kallas, MD
Abstract 37: Preoperative coronary angiography: Friend or foe?
Ross Kerridge, MBBS, FRCA, FANZCA
Abstract 38: Heparin-induced thrombocytopenia with low molecular weight heparin after total knee replacement
Steven Cohn, MD
Abstract 39: Patient with Parkinson’s disease treated with implanted deep brain stimulators for laparotomy
Deborah C. Richman, MBChB, FFA(SA); Daryn H. Moller, MD; and Khoa N. Nguyen, MD
Abstract 40: Ethical dilemma in the preoperative assessment clinic: Can a patient refuse an indicated cardiac workup? Can we refuse to anesthetize?
Deborah C. Richman, MBChB, FFA(SA)
Abstract 41: Coronary artery bypass grafting as a precipitatin factor in diabetic ketoacidosis in type 2 diabetes
Vishal Sehgral, MD, and Abbas Kitabchi, MD
