User login
Congressional Adviser
A mystery. That’s what MedPAC is to many hospitalists. You might recognize the name from communications about Medicare’s physician fee schedule, but what is this entity, what power does it possess, and how does it affect the work you do and the pay you receive?
MedPAC is the Medicare Payment Advisory Commission, an independent agency established by the Balanced Budget Act of 1997. Its mission is to advise Congress on issues affecting Medicare, including payments to private health plans participating in Medicare as well as providers in Medicare’s traditional fee-for-service program. MedPAC also analyzes and advises legislators on two issues on HM’s radar: access to care and quality of care.
Ear of the Law
Why is MedPAC important to hospitalists? Money. The commission advises Congress on how Medicare is going to pay for healthcare services, and Medicare is a major payor for any hospitalist, says Ron Greeno, MD, FHM, chief medical officer of Cogent Healthcare in Irvine, Calif., and a member of SHM’s Public Policy Committee. “The majority of patients we’ll be taking care of in any hospital are Medicare patients,” he says, “and it’s not just how we get paid, but all the regulations around that. … MedPAC will weigh in on that and certainly shape the thinking of lawmakers.”
“MedPAC is about payment … but obviously there are other policy issues they weigh in on,” Dr. Greeno says. For example, MedPAC makes specific recommendations on the physician fee schedule and determines how hospitalists document and code.
How It Works
The commission is made up of 17 volunteer members from a diverse spectrum of healthcare backgrounds. Commissioners are appointed to three-year renewable terms. An executive director and staff of analysts with backgrounds in economics, health policy, public health, and medicine support the agency.
MedPAC holds monthly public meetings in Washington, D.C., to discuss Medicare issues and policy questions, and to formulate recommendations to Congress. Meetings include research presentations by MedPAC staff, policy experts, and interested parties. Each meeting allows time for public comment.
The commission provides its recommendations to Congress in biannual reports, issued in March and June. MedPAC also advises Congress through comment on reports and proposed regulations issued by the U.S. Department of Health and Human Services (HHS), testimony, and briefings for congressional staff.
A New Role
This year, as President Obama and his administration push for rapid and major healthcare changes, Dr. Greeno says MedPAC’s role will shift as Congress speeds toward new solutions. “How things are going to get done is already different than it was last year,” he says. “The pace of the government’s attempts to change how Medicare looks has picked up considerably.”
—Ron Greeno, MD, Cogent Healthcare, SHM Public Policy Committee
Citing SHM’s Public Policy Committee meetings with lawmakers in March, Dr. Greeno says healthcare reform is on the fast track. “Everything we were hearing from CMS [Centers for Medicare and Medicaid Services], the American Hospital Association, and MedPAC indicated that they’re looking to have a healthcare reform bill to Congress by summer,” he says. “When you have that kind of pace, things will come from a lot of different areas.”
Dr. Greeno uses pay for performance as one example of how government can be slow to change healthcare policy. “That process has taken years, but it’s still a small percentage of how we’re paid,” Dr. Greeno says, noting the current administration has expressed interest in changing course on the policy. “Now we may have complete reform of Medicare payments. In light of the rapidness of this pace, I’m not sure MedPAC’s role will be the same. They’ll continue to be a resource to Congress, but the commissioners are volunteers with full-time jobs; they meet once a month, while legislation is being worked on pretty much around the clock right now.”
MedPAC Sets the Tone
Even if the commission isn’t prepared to make direct recommendations for new legislation in the next few months, it still has significant influence. Since its inception, MedPac has routinely “set the tone” for policy reform, Dr. Greeno stresses. “For example, the healthcare reform legislation will likely include bundling payments to hospitals and physicians who work in hospitals,” he says. “MedPAC has already made recommendations to do this, as well as to start demonstration projects.” Earlier this year, sites were selected for Medicare’s Acute Care Episode (ACE) demonstration, under which a single global payment will be made for inpatient facility and professional services. “The same is true of the idea of paying based on quality, not patient volume,” Dr. Greeno says. “The commission has made recommendations on this.”
Then again, no one can say how the future of healthcare reform will unfold, or how quickly things will move this year. “The healthcare bill introduced this summer could completely do away with fee-for-service payments,” Dr. Greeno says. “Of course, nobody knows when—or if—that bill will get passed.” TH
Jane Jerrard is a medical writer based in Chicago.
Head Off Hypoglycemia
Let’s look at a case: A known diabetic patient has been in good control, with glycosylated hemoglobin (HbA1c) levels lower than 6.5 gm/dL the past two years. Her medication regimen has remained relatively stable during that time. Her daily medications include simvastatin, 40 mg; metformin extended release, 2,000 mg; sitagliptin, 100 mg; glimepiride, 8 mg; quinapril, 20 mg; a multivitamin; calcium carbonate, 1,500 mg; and an 81-mg aspirin.
Her lipid panel, liver and renal function tests, and blood pressure are all within normal limits. However, she was admitted to the hospital with a plasma glucose level of 38 mg/dL.
Upon physical examination, she appears diaphoretic, with weakness, confusion, tremulousness, and palpitations. She is treated with glucose to maintain a level of above 50 mg/dL, and she responds without long-term sequelae.
What precipitated this event?
Drug-Induced Hypoglycemia
Hypoglycemia may represent a lab error or artifactual hypoglycemia due to glycolysis in the collection sample. To determine a pathological cause of hypoglycemia, the triad of low plasma glucose, hypoglycemia symptoms, and symptom resolution with correction of the blood glucose level should be used.1 Hypoglycemia is most often seen in diabetic patients and is the most commonly noted endocrine emergency in the inpatient setting, as well as in the ambulatory setting. Some common causes of hypoglycemia in diabetes patients include alcohol consumption, skipping meals, too much exercise, and intentional or unintentional medication overdoses.2
Treatment is required when the blood glucose level is below 45 gm/dL. Symptoms include anxiety, tremulousness, nausea, sweating, palpitation, and hunger.3 More severe symptoms related to compromised central nervous system function include weakness, fatigue, confusion, seizures, focal neurologic deficits, and coma.
The most common causes of drug-induced hypoglycemia are insulin, ethanol, or sulfonylureas. Risk factors associated with unintentional overdose of sulfonylureas include advanced age, drug-to-drug interactions, and decreased renal or hepatic clearance. Other drugs have been reported to cause hypoglycemia. Some of these include high-dose salicylates, beta-blockers, haloperidol, monoamine oxidase inhibitors, other sulfonamides (particularly trimethoprim-sulfamethoxazole), pentamidine, quinine/quinidine, and quinolone antibiotics (e.g., gatifloxacin or levofloxacin).4
Diabetics use more than 120 natural medicines, either alone or in combination with their prescribed diabetes medications, to lower blood glucose and/or improve HbA1c.5 Some of the most commonly used products are banaba, bitter melon, fenugreek, and Gymnema (hypoglycemics), along with American or panax ginseng, cassia cinnamon, chromium, prickly pear cactus, soy, or vanadium (insulin sensitizers).
Diagnosis
Patient history aids in the clinical diagnosis of hypoglycemia and should be reviewed to determine a potential drug-induced cause. History also might identify a medication dispensing error (e.g., the onset of hypoglycemia following a recent medication refill). Hospitalists should question the patient or the patient’s family as to medication use, including over-the-counter drugs, vitamins, supplements, natural foods, and other related products.
Treatment
Glucose should be administered to maintain a plasma glucose level of at least 50 gm/dL. This may be achieved orally via frequent meals or snacks, or intravenously. The underlying cause should be addressed. In drug- or medication-induced cases, the causative agent should be removed or retitrated to an effective dose that does not cause hypoglycemia.
Upon further questioning, the patient admitted she’d been taking 3,000 mg of a bitter melon product per day. She took this in addition to all her prescribed medications. Because bitter melon has an insulin-like effect, its use in combination with glimepiride led to the clinically significant hypoglycemic reaction, which required hospitalization and treatment. Prior to discharge, the patient promised to discuss the use of alternative and natural products with her pharmacist or physician before trying anything new. TH
Michele B. Kaufman, PharmD, BSc, RPh, is a freelance medical writer based in New York City.
References
- Guettier JM, Gorden P. Hypoglycemia. Endocrinol Metab Clin North Am. 2006;35:753-766.
- Holt HH. Drug-induced hypoglycemia: overview. The University of Maryland Medical Center Web site. Available at: www.umm.edu/ency/article/000310.htm. Accessed March 2, 2009.
- Hurd R. Drug-induced hypoglycemia. Drugs.com Web site. Available at: www.drugs.com/enc/drug-induced-hypoglycemia.html. Accessed March 2, 2009.
- Mehlhorn AJ, Brown DA. Safety concerns with fluoroquinolones. Ann Pharmacother. 2007; 41:1859-1866.
- Natural medicines in the clinical management of diabetes. Natural Medicines Comprehensive Database Web site. Available at: www.naturaldatabase.com. Accessed March 3, 2009.
- Teva announces approval and launch of generic Imitrex tablets. Available at: finance.yahoo.com/news/Teva-Announces-Approval-and-bw-14308223.html/print. Accessed March 2, 2009.
- Additional strengths of Avinza available. Monthly Prescribing Reference Web site. Available at: www.empr.com/Additional-strengths-of-Avinza-available/article/126905/. Accessed March 2, 2009.
- Gelnique treatment for overactive bladder. Drugs.com Web site. Available at: www.drugs.com/gelnique.html. Accessed March 2, 2009.
- Reclast label. The U.S. Food and Drug Administration Web site. Available at: www.fda.gov/cder/foi/label/2008/021817s002lbl.pdf. Accessed March 2, 2009.
- Clopidogrel bisulfate (marketed as Plavix). The U.S. Food and Drug Administration Web site. Available at: www.fda.gov/medwatch/safety/2009/safety09.htm#plavix. Accessed March 2, 2009.
- PPI interactions with clopidogrel. Med Lett Drugs Ther. 2009;51 (1303):2-3.
- PPI interactions with clopidogrel revisited. Med Lett Drugs Ther. 2009;51(1306):13-4.
- Xigris (Drotrecogin alfa [activated]): early communication about an ongoing safety review. The U.S. Food and Drug Administration Web site. Available at: www.fda.gov/medwatch/safety/2009/safety09.htm#Xigris. Accessed March 2, 2009.
In the Literature
Literature at a Glance
A guide to this month’s studies
- Inhaled steroids and COPD.
- Communication about dietary supplement use.
- Glycemic control in stroke.
- Hospitalist-PCP communication and outcomes.
- Gentamicin nephrotoxicity in endocarditis.
- Outcomes after osteoporotic fractures.
- Predictors of readmission after pulmonary embolism.
- Provider awareness of hospital readmission.
Inhaled Corticosteroid Use in COPD Associated with Increased Pneumonia Risk
Clinical question: Does long-term use of inhaled corticosteroids in chronic obstructive pulmonary disease (COPD) increase the risk of developing pneumonia?
Background: Guidelines recommend a combination of inhaled corticosteroids and long-acting bronchodilators in patients with severe COPD. However, recent evidence has raised concerns about the increased risk of pneumonia in patients on inhaled steroids. The exact nature of this association and its specificity to the inhaled corticosteroid component is unclear.
Study design: Meta-analysis and systematic review of 18 randomized controlled trials (RCTs) evaluating inhaled corticosteroid use in COPD.
Setting: Medline, EMBASE, the Cochrane Database of Systematic Reviews, regulatory documents, and trial registries.
Synopsis: This study, which totaled 16,996 case reviews, focused on inhaled corticosteroid use in COPD (excluding asthma) with at least 24 weeks of followup. The study authors evaluated inhaled corticosteroid use—alone or in combination with long-acting beta-agonists (LABA)—against a control (placebo or LABA alone). Primary outcomes were any pneumonia and serious pneumonia leading to increased morbidity and mortality. Secondary outcomes included pneumonia-related mortality and all-cause mortality.
Inhaled corticosteroids—irrespective of associated LABA use—significantly increased the risk of pneumonia (7.4% vs. 4.7%) with a relative risk (RR) of 1.60; 95% CI, 1.33-1.92, P<0.001. Inhaled corticosteroids were strongly associated with an increase in serious pneumonia (RR 1.71; 95% CI, 1.46-1.99, P<0.001). However, inhaled corticosteroid use did not translate to significantly increased pneumonia-related or overall mortality, possibly due to the inadequate power of most of the individual trials.
The findings reflect those from other database studies, but lend specificity to the inhaled corticosteroid component. This can be cause for concern as studies of long-term inhaled corticosteroid use in patients with COPD have failed to show a benefit in mortality or decreased exacerbations.
Bottom line: Risk-benefit analysis for inhaled corticosteroid use in COPD patients should consider the increased risk of pneumonia, possibly related to local immunosuppression.
Citation: Singh S, Amin AV, Loke YK. Long-term use of inhaled corticosteroids and the risk of pneumonia in chronic obstructive pulmonary disease: a meta-analysis. Arch Intern Med. 2009;169(3):219-229.
Inadequate Physician Communication Regarding Dietary Supplement Usage
Clinical question: How frequently do hospital physicians communicate about the use of dietary supplements?
Background: About 20% of the U.S. population uses dietary supplements, products that have potential interactions with other prescription medications. Dietary supplement usage patterns, disclosure, and discussion with physicians have been studied in the outpatient setting. However, these metrics have not been evaluated in the inpatient setting.
Study design: A cross-sectional, observational pilot study.
Setting: Inpatients on a general medicine and geriatrics service at the University of North Carolina Medical Center.
Synopsis: Sixty inpatients were questioned regarding their use of dietary supplements in the past year. Patients were asked about their communication with the admitting resident physician regarding dietary supplements and their beliefs regarding continued use during hospitalization. Patient responses revealed prevalent dietary supplement use, with about 80% of patients using supplements and 52% using nonvitamin/nonmineral supplements.
The study revealed poor communication between residents and their patients. Only 20% of residents inquired about dietary supplement use during the admission process, while 74% of patients neglected to disclose their use of dietary supplements. Furthermore, 56% of patients thought communication was unimportant; they assumed that it was in their medical records (18%), or they expected the physician to ask them about it (20%). Though most patients agreed to stop using dietary supplements as inpatients, 13% did not think dietary supplement use was a problem, even if it went against medical advice.
Study limitations include the small sample size and recall bias inherent to the design. It also is likely that more patients using dietary supplements consented for the study, as evidenced by higher prevalence of use.
Bottom line: Use of dietary supplements in hospitalized patients is common, and communication about their use between patients and physicians is limited.
Citation: Young LA, Faurot KR, Gaylord SA. Use of and communication about dietary supplements among hospitalized patients. J Gen Intern Med. 2009;24(3):366-369.
Early Hyperglycemia Associated with Poor Outcomes After Acute Ischemic Stroke
Clinical question: Is there a threshold of hyperglycemia after an acute ischemic stroke (IS) that predicts a poor outcome?
Background: A growing body of evidence shows that admission hyperglycemia in an acute IS predicts a poor outcome. Current triggers to initiate glucose control measures are based on consensus data. However, capillary glucose is a continuous variable and could have a linear relationship with stroke outcomes. A particular glucose level may herald poor outcomes.
Study design: Prospective observational cohort study.
Setting: Seven university hospitals with dedicated stroke units in Spain.
Synopsis: 476 patients with acute IS had admission and maximum glucose levels recorded during the first 48 hours of admission. Stroke scales and brain imaging assessed the patients’ stroke severity. The primary endpoint of a poor outcome at three months was defined by a modified Rankin score of >2.
The primary endpoint was noted in 156 (38%) patients. Receiver operating characteristic curves for both capillary glucose at admission and maximal values within 48 hours pointed to 155mg/dL as a cutoff for the primary outcome. However, subsequent regression analysis confirmed only the maximal value as an independent predictor of poor outcome (OR 2.73; 95% CI, 1.42 to 5.24). Additionally, in contrast to patient age and infarct volume, the maximal glucose value of ≥155 mg/dL was associated with stroke severity on admission and a higher three-month mortality (HR 3.80; 95% CI, 1.79 to 8.10; P=0.001).
The observational nature of the study opens it to speculation: Does lowering the level to less than 155 mg/dl improve patient outcomes? However, it does offer a potential target for future interventional studies.
Bottom line: Hyperglycemia within the first 48 hours of an ischemic stroke offers a more robust predictor of poor outcomes compared with admission glucose levels. A glucose level less than 155 mg/dL could be a potential treatment goal in the future.
Citation: Fuentes B, Castillo J, San José B, et al. The prognostic value of capillary glucose levels in acute stroke: The GLycemia In Acute Stroke (GLIAS) study. Stroke. 2009;40(2):562-568.
Communication Between Inpatient Medical Teams and PCPs Does Not Improve Outcomes
Clinical question: Does communication between patients’ physicians in the hospital and their primary-care physicians (PCPs) improve outcomes after discharge?
Background: The increased use of the hospitalist model has resulted in concerns about discontinuity of patient care after discharge. This might hamper the quality of clinical care and increase adverse outcomes, including readmission or death. Effective communication could have the potential to improve clinical outcomes.
Study design: Survey based in a quasi-randomized cohort of medical inpatients.
Setting: Six academic medical centers throughout the U.S.
Synopsis: Of the initial 2,526 patients, only 1,078 were available for final analysis based on failure of patient followup and a 68% PCP response rate. PCP surveys were faxed two weeks after patient discharge. PCPs were asked about hospitalization awareness and communication methods. Patients were contacted post-discharge, and National Death Index data were reviewed to determine the primary composite outcomes of ED visits, hospital readmissions, or death at 30 days.
Four out of five PCPs surveyed were aware of their patients’ hospitalizations—23% via direct communication and 42% by discharge summary. The primary outcome occurred in 184 (22%) of 834 patients. In contrast, of the 244 PCPs unaware of their patients’ hospitalizations, the primary outcome occurred in 49 (20%) patients. After logistic regression, PCP awareness of hospitalization, irrespective of communication method, was not associated with risk of outcomes (adjusted OR 1.08, 95% CI, 0.73 to 1.59). Having a hospitalist as the hospital physician (34%) did not affect outcomes. These results could reflect the inclusion of patients with fewer comorbidities. Additionally, effect on adverse drug events, patient satisfaction, and quality of life were not evaluated.
Bottom line: Communication between inpatient physicians and PCPs needs improvement to affect clinical outcomes, especially in high-risk patients.
Citation: Bell CM, Schnipper JL, Auerbach AD, et al. Association of communication between hospital-based physicians and primary care providers with patient outcomes. J Gen Intern Med. 2008;24(3):381-386.
Gentamicin Use in Staphylococcal Bacteremia or Endocarditis Causes Nephrotoxicity
Clinical question: Does gentamicin synergism in Staphylococcal bacteremia and endocarditis achieve faster eradication at the cost of nephrotoxicity?
Background: Gentamicin has been used to help with sterilization of blood or cardiac vegetations in patients with Staphylococcal bacteremia or infective endocarditis (IE). However, historic data negate its role in decreasing morbidity or mortality. If its potential nephrotoxicity were better characterized, it could help assess the overall utility of this practice.
Study design: Retrospective analysis of a cohort from a published randomized control trial.
Setting: 44 hospitals in the U.S. and Europe.
Synopsis: Two hundred thirty-six patients with Staphylococcal bacteremia or native-valve IE (mostly right-sided) were randomized to receive standard therapy (vancomycin or antistaphylococcal penicillin) or daptomycin. Patients receiving standard therapy and those with left-side IE in the daptomycin arm also received low-dose gentamicin. Sequential creatinine levels were used to determine primary outcomes of renal impairment events and a decrease in creatinine clearance.
Renal impairment events, elevation of mean serum creatinine, and decrease in creatinine clearance were more prevalent with standard therapy, especially in the elderly and those with diabetes. Combination of gentamicin with penicillin caused an earlier creatinine elevation compared with that with vancomycin.
Patients on gentamicin had a modest decrease in creatinine clearance (22% vs. 8%; P= 0.005), especially if their baseline was 50 to 80 mL/min. The decrease was early and sustained with gentamicin exposure. Multivariate analysis revealed age (≥65 years) and gentamicin use (not dose and duration) to be independent predictors of renal impairment. The analysis fails to address use of gentamicin in prosthetic-valve IE and left-side IE.
Bottom line: Initial low-dose gentamicin use in Staphylococcal bacteremia or endocarditis increases nephrotoxicity with no clear mortality benefit.
Citation: Cosgrove SE, Vigliani GA, Fowler VG, et al. Initial low-dose gentamicin for Staphylococcus aureus bacteremia and endocarditis is nephrotoxic. Clin Infect Dis. 2009;48(6):713-721.
Osteoporotic Fractures Increase Five-Year Mortality, Especially in the Elderly
Clinical question: What is the effect of initial osteoporotic fractures and subsequent fractures on mortality?
Background: With an aging population, osteoporotic fractures are poised to escalate into a national healthcare problem. Studies have outlined the increase in premature and long-term mortality associated with hip or vertebral fractures. However, other appendicular fractures have not been studied, and little is known about the mortality risk with subsequent fracturing.
Study design: Prospective cohort from the Dubbo Osteoporosis Epidemiology Study, a longitudinal, population-based study.
Setting: Stable population of men and women 60 and older in Dubbo, Australia.
Synopsis: 1,300 people with at least one minimal-trauma fracture were selected. Fractures were grouped as hip, vertebral, major (long bones and ribs), and minor (any remaining). Mortality data were extracted from local media, along with state and national registries. Age- and sex-specific mortality rates in each group were compared with population mortality rates to provide standardized mortality ratios (SMRs) over five-year periods.
Osteoporotic fractures increased five-year mortality with SMRs of 1.38 to 2.53 for women and 1.64 to 3.52 for men. An exception was minor fractures in patients 60 to 75 years old with no increase in mortality. Only hip fractures influenced mortality adversely for up to 10 years.
Interestingly, the nonhip, nonvertebral group included 50% of the fractures and contributed to 29% of overall mortality. Another five-year increase in mortality was evident in 364 people with a subsequent fracture.
A subgroup analysis revealed independent predictors of mortality, including lower bone mineral density, weaker quadriceps, smoking history, and increased sway in female patients; weaker quadriceps and decreased activities were independent predictors in male patients. Apart from the limitation that most subjects were white, the study gives a robust mortality analysis on osteoporotic fractures.
Bottom line: Osteoporotic fractures, initial and subsequent, increase five-year mortality. This is true even for nonhip, nonvertebral fractures, especially in the elderly.
Citation: Bliuc D, Nguyen ND, Milch VE, Nguyen TV, Eisman JA, Center JR. Mortality risk associated with low-trauma osteoporotic fracture and subsequent fracture in men and women. JAMA. 2009;301(5): 513-521.
Early Rehospitalization After Pulmonary Embolism Dictated by Clinical Severity and Anticoagulation Practices
Clinical question: What factors portend readmission after acute pulmonary embolism (PE)?
Background: The significant clinical and economic burden of acute pulmonary embolism (PE) has fueled studies to define predictors of early mortality. However, the variables leading to readmission after PE remain uncharted. Knowledge of these factors can provide additional targets to improve the quality of care.
Study design: Prospective population-based cohort study.
Setting: 186 acute-care hospitals in Pennsylvania.
Synopsis: Using ICD-9-CM codes, 14,426 PE patients were selected for the study. Primary outcome was hospital readmission within 30 days; secondary outcomes were venous thromboembolism (VTE) and bleeding.
More than 2,000 patients (14.3%) experienced a 30-day readmission. The predominant reasons were VTE (21.9%) and bleeding (5%), with the rest related to comorbidities, such as cancer (10.8%), pneumonia (5.2%), and chest pain (5.0%).
The discrete proportional odds model showed a significant association of high PE Severity Index score (OR 2.04; 95% CI, 1.73-2.40) and previous home care provision (OR 1.40; 95% CI, 1.27-1.54) with readmission, indicating that sicker patients tend to be readmitted. Black patients and Medicaid recipients were more likely to be readmitted, especially for VTE, which reflects the possible socioeconomic bearing on outcomes. Surprisingly, the few patients leaving the hospital against medical advice (0.4%) had a high OR of 2.84 (95% CI, 1.80-4.48) for readmission. Academic centers were not associated with increased readmissions but had significantly more readmissions for bleeding.
Anticoagulation practices—initial choice of agents, intensity of treatment, and monitoring—were not evaluated, which could affect readmission after PE, especially due to VTE and bleeding.
Bottom line: Apart from severity of illness and demographics, high rates of readmission after PE, especially for bleeding and VTE, might be related to poor anticoagulation practices.
Citation: Aujesky D, Mor MK, Geng M, Stone RA, Fine MJ, Ibrahim SA. Predictors of early hospital readmission after acute pulmonary embolism. Arch Intern Med. 2009;169(3):287-293.
Need for Improved Awareness of Hospital Readmission
Clinical question: What is the frequency of readmission awareness in discharging physicians and the trends in their communications with readmitting physicians?
Background: Rotation-based schedules of inpatient physicians, especially at academic centers, increase the likelihood that patients with complex medical or psychosocial issues requiring readmission will be cared for by a different team.
Though gaps in communication between the successive teams have the potential to hamper the quality of care, these gaps have not been adequately characterized in the literature.
Study design: Prospective cohort study.
Setting: Inpatient general-medicine services at two academic medical centers.
Synopsis: Researchers selected 225 patients readmitted within two weeks. The discharge and readmission teams were surveyed by e-mail within 48 hours of readmission regarding frequency and content of communications.
On analysis, the discharging teams were aware of patient readmissions only 48.5% of the time. Most of the remaining teams acknowledged a desire to be notified.
Actual communication occurred in 43.7% of cases and included information on medical assessments (61.9%), psychosocial issues (52.9%), pending tests (34%), and discharge medications (30.9%).
As expected, physician perception of higher medical complexity increased the likelihood of communication. Surprisingly, though psychosocial issues did not predict communication, they were discussed in almost half the cases. Lapses in communication were attributed to lack of time, perceived necessity, and contact information.
The observational nature, nongeneralizable population, and effect of responder bias limit the study. Though an interventional study can better evaluate improvement in patient outcomes, communication at readmission can be used as an educational feedback tool for house staff and attendings.
Bottom line: Modest frequency of communication between discharge and readmission physicians is driven mostly by medical complexity. It bears the potential to improve patient outcomes and offer valuable feedback.
Citation: Roy CL, Kachalia A, Woolf S, Burdick E, Karson A, Gandhi TK. Hospital readmissions: physician awareness and communication practices. J Gen Intern Med. 2009;24(3):374–380. TH
Focused on the Practice
Most HM groups (HMGs) participate in quality initiatives in their hospitals, according to new SHM research. Moreover, 7 out of 10 HMGs participating in QI initiatives are leading those efforts at their hospitals.
The findings are part of SHM’s 2008-2009 Focused Survey, the latest in a series of reports commissioned by the Practice Analysis Committee. The survey and report concentrate on topics of interest from SHM’s comprehensive, biannual survey of its membership.
The survey compiled responses from 145 HMG leaders. In addition to QI initiatives, participants in the survey responded to a variety of questions, including quality-based incentives, hospitalist turnover, and the use of part-time hospitalists.

—Joe Miller, SHM’s executive advisor to the CEO
“This is certain to be a conversation starter for hospitalists, hospital executives, and others,” says Burke Kealey, MD, FHM, medical director for hospital medicine at St. Paul, Minn.-based HealthPartners and chair of SHM’s Practice Analysis Committee. “The Focused Survey is an opportunity for SHM to answer some of the pressing questions that healthcare executives and providers have about managing a hospitalist practice within the larger context of the hospital.”
Hospital executives and hospitalists use SHM survey findings to better understand what is going on in the specialty, says Joe Miller, SHM’s executive advisor to the CEO. “These surveys answer the kinds of questions that often come up when hospitalists and hospitals begin to evaluate their performance and plan for the future,” Miller says. “We use their questions as source material for this survey, so we can help them answer questions like, ‘How are most hospitalists participating in QI?’ or ‘How are other hospitalists using part-time staff members?’ ”
Hospitalists Lead the Way
Hospitalists continue to be at the forefront of QI initiatives within their hospitals, according to the latest survey. Almost all respondents (96.5%) reported that their HMG participated in QI programs; the average HMG has six hospitalists playing an active role in QI within the hospital.
The survey also found that 72.1% of respondents involved in QI activity reported that their hospitalists were “responsible for leading project(s)” on QI initiatives.
“The findings about the active role hospitalists play in QI initiatives may surprise even the most staunch advocate of QI within the hospital medicine specialty,” says Leslie Flores, MHA, SHM’s director of the Practice Management Institute and leader of the Focused Survey research. “In essence, it shows that nearly every hospitalist group is active in promoting QI, and that the vast majority of them are taking a leadership position to improve quality. … It is remarkable and extremely exciting that hospitalists are so deeply involved in QI in their organizations.”
The survey identified patient safety, clinical QI, and quality-related IT initiatives as most popular.
Quality Incentive Compensation
In order to track HMG quality incentive compensation, the 2008-2009 Focused Survey asked similar questions about the topic to questions in the 2006-2007 Focused Survey. Quality incentive compensation—paying bonuses or additional payments for meeting QI measures—not only increased markedly in the past two years, but a majority of HMGs also have adopted the practice. The number of HMGs that have quality incentive compensation plans has increased by 39% since 2006, according to the survey.
Nine out of 10 HMGs that receive performance-based compensation reported that the source of the compensation was the hospital or health system. In most cases, the compensation was paid to an individual hospitalist, which represents a shift from 2006, when more groups reported receiving the compensation directly.
The survey also shows that hospitals and HMGs use a number of process measures to evaluate QI incentives, including participation in quality or safety committees, transition of care measures, or core measures for heart failure, pneumonia, and acute myocardial infarction.
New Numbers Dispel High Turnover Myth
For years, the conventional wisdom throughout the healthcare community has been that HM suffers from a high turnover rate among its hospitalists. Focused Survey findings suggest otherwise. In fact, turnover rates for hospitalist groups have remained constant since 2005. Nearly a third (31.7%) of HMGs reported no turnover at all within the past 12 months.
“Getting an accurate idea about turnover in hospitalist groups has been an ongoing challenge in our research,” Flores says. “In this year’s Focused Survey, we provided clearer definitions and asked more specific questions to improve our measurement of turnover.”
The added specificity only served to reinforce findings from previous surveys that showed relatively low turnover rates. The most recent research revealed a 12.7% turnover rate, compared with 13% in 2007 and 12% in 2005.
The latest Focused Survey also includes detailed findings on turnover among full-time hospitalists compared with part-time hospitalists.
Part-Time vs. Full-Time
The new data challenge long-held assumptions about the role of part-time hospitalists. The survey queried HMGs about full-time and part-time hospitalist staff, and the proportion of time that each employee covers in the hospital.
Although there isn’t a consensus about what constitutes a full-time hospitalist, it is clear that they cover the vast majority (85%) of HMG staff hours. Part-time hospitalists are responsible for 10% of hospitalist staff hours, and “casual” hospitalists—temporary hospitalists or moonlighters—make up the remaining 5%.
Part-time hospitalists share the same responsibilities as their full-time colleagues, according to the report. More than 70% of HMG leaders said their part-time staff is deployed to cover the same shifts and responsibilities as full-time staff. Many HMGs use part-time staff to cover night and weekend shifts.
Trend Today, Initiative Tomorrow
Taken together, SHM’s bi-annual survey and Focused Survey have begun to reveal some of the most prevalent trends within the specialty, including low turnover and a specialty-wide QI emphasis. However, Flores sees room for additional research in the near future.
“There is a lot more to learn about the nature of hospitalists’ involvement in organizational quality initiatives and what benefits that involvement is delivering to their organizations,” she says. “The survey suggests some areas, particularly in the quality arena, where SHM can develop additional programs and services to support hospitalists and the work they do.”
The 10-page 2008-2009 Focused Survey report is available at www.hospitalmedicine.org/shmstore. TH
Brendon Shank is a freelance writer based in Philadelphia.
Chapter Update
Philadelphia Tri-State Area

The Philadelphia Tri-State Area chapter kicked off its 2009 meeting March 26 with its new “pharma-free” format. The chapter’s decision to forgo an expensive meal and industry-sponsored lecture was the result of an agreement to create more open dialogue among its members.
Chapter co-presidents Jen Myers, assistant professor of clinical medicine and patient safety officer at the Hospital of the University of Pennsylvania, and Erik DeLue, MD, MBA, medical director of the hospitalist program at Virtua Memorial Hospital in Mount Holly, N.J., kicked off the meeting, which focused on recruiting in a competitive market. Despite SHM’s collective recruiting challenges, most medical directors indicated that their groups were fully staffed.
Future meetings will be held at various medical institutions around the greater Philadelphia area. The next is to be held this month at Christiana Medical Center in Wilmington, Del. Future topics will be centered on pragmatic, nonclinical concerns for hospitalists, such as how to best utilize allied health providers.
Most HM groups (HMGs) participate in quality initiatives in their hospitals, according to new SHM research. Moreover, 7 out of 10 HMGs participating in QI initiatives are leading those efforts at their hospitals.
The findings are part of SHM’s 2008-2009 Focused Survey, the latest in a series of reports commissioned by the Practice Analysis Committee. The survey and report concentrate on topics of interest from SHM’s comprehensive, biannual survey of its membership.
The survey compiled responses from 145 HMG leaders. In addition to QI initiatives, participants in the survey responded to a variety of questions, including quality-based incentives, hospitalist turnover, and the use of part-time hospitalists.
—Joe Miller, SHM’s executive advisor to the CEO
“This is certain to be a conversation starter for hospitalists, hospital executives, and others,” says Burke Kealey, MD, FHM, medical director for hospital medicine at St. Paul, Minn.-based HealthPartners and chair of SHM’s Practice Analysis Committee. “The Focused Survey is an opportunity for SHM to answer some of the pressing questions that healthcare executives and providers have about managing a hospitalist practice within the larger context of the hospital.”
Hospital executives and hospitalists use SHM survey findings to better understand what is going on in the specialty, says Joe Miller, SHM’s executive advisor to the CEO. “These surveys answer the kinds of questions that often come up when hospitalists and hospitals begin to evaluate their performance and plan for the future,” Miller says. “We use their questions as source material for this survey, so we can help them answer questions like, ‘How are most hospitalists participating in QI?’ or ‘How are other hospitalists using part-time staff members?’ ”
Hospitalists Lead the Way
Hospitalists continue to be at the forefront of QI initiatives within their hospitals, according to the latest survey. Almost all respondents (96.5%) reported that their HMG participated in QI programs; the average HMG has six hospitalists playing an active role in QI within the hospital.
The survey also found that 72.1% of respondents involved in QI activity reported that their hospitalists were “responsible for leading project(s)” on QI initiatives.
“The findings about the active role hospitalists play in QI initiatives may surprise even the most staunch advocate of QI within the hospital medicine specialty,” says Leslie Flores, MHA, SHM’s director of the Practice Management Institute and leader of the Focused Survey research. “In essence, it shows that nearly every hospitalist group is active in promoting QI, and that the vast majority of them are taking a leadership position to improve quality. … It is remarkable and extremely exciting that hospitalists are so deeply involved in QI in their organizations.”
The survey identified patient safety, clinical QI, and quality-related IT initiatives as most popular.
Quality Incentive Compensation
In order to track HMG quality incentive compensation, the 2008-2009 Focused Survey asked similar questions about the topic to questions in the 2006-2007 Focused Survey. Quality incentive compensation—paying bonuses or additional payments for meeting QI measures—not only increased markedly in the past two years, but a majority of HMGs also have adopted the practice. The number of HMGs that have quality incentive compensation plans has increased by 39% since 2006, according to the survey.
Nine out of 10 HMGs that receive performance-based compensation reported that the source of the compensation was the hospital or health system. In most cases, the compensation was paid to an individual hospitalist, which represents a shift from 2006, when more groups reported receiving the compensation directly.
The survey also shows that hospitals and HMGs use a number of process measures to evaluate QI incentives, including participation in quality or safety committees, transition of care measures, or core measures for heart failure, pneumonia, and acute myocardial infarction.
New Numbers Dispel High Turnover Myth
For years, the conventional wisdom throughout the healthcare community has been that HM suffers from a high turnover rate among its hospitalists. Focused Survey findings suggest otherwise. In fact, turnover rates for hospitalist groups have remained constant since 2005. Nearly a third (31.7%) of HMGs reported no turnover at all within the past 12 months.
“Getting an accurate idea about turnover in hospitalist groups has been an ongoing challenge in our research,” Flores says. “In this year’s Focused Survey, we provided clearer definitions and asked more specific questions to improve our measurement of turnover.”
The added specificity only served to reinforce findings from previous surveys that showed relatively low turnover rates. The most recent research revealed a 12.7% turnover rate, compared with 13% in 2007 and 12% in 2005.
The latest Focused Survey also includes detailed findings on turnover among full-time hospitalists compared with part-time hospitalists.
Part-Time vs. Full-Time
The new data challenge long-held assumptions about the role of part-time hospitalists. The survey queried HMGs about full-time and part-time hospitalist staff, and the proportion of time that each employee covers in the hospital.
Although there isn’t a consensus about what constitutes a full-time hospitalist, it is clear that they cover the vast majority (85%) of HMG staff hours. Part-time hospitalists are responsible for 10% of hospitalist staff hours, and “casual” hospitalists—temporary hospitalists or moonlighters—make up the remaining 5%.
Part-time hospitalists share the same responsibilities as their full-time colleagues, according to the report. More than 70% of HMG leaders said their part-time staff is deployed to cover the same shifts and responsibilities as full-time staff. Many HMGs use part-time staff to cover night and weekend shifts.
Trend Today, Initiative Tomorrow
Taken together, SHM’s bi-annual survey and Focused Survey have begun to reveal some of the most prevalent trends within the specialty, including low turnover and a specialty-wide QI emphasis. However, Flores sees room for additional research in the near future.
“There is a lot more to learn about the nature of hospitalists’ involvement in organizational quality initiatives and what benefits that involvement is delivering to their organizations,” she says. “The survey suggests some areas, particularly in the quality arena, where SHM can develop additional programs and services to support hospitalists and the work they do.”
The 10-page 2008-2009 Focused Survey report is available at www.hospitalmedicine.org/shmstore. TH
Brendon Shank is a freelance writer based in Philadelphia.
Chapter Update
Philadelphia Tri-State Area
The Philadelphia Tri-State Area chapter kicked off its 2009 meeting March 26 with its new “pharma-free” format. The chapter’s decision to forgo an expensive meal and industry-sponsored lecture was the result of an agreement to create more open dialogue among its members.
Chapter co-presidents Jen Myers, assistant professor of clinical medicine and patient safety officer at the Hospital of the University of Pennsylvania, and Erik DeLue, MD, MBA, medical director of the hospitalist program at Virtua Memorial Hospital in Mount Holly, N.J., kicked off the meeting, which focused on recruiting in a competitive market. Despite SHM’s collective recruiting challenges, most medical directors indicated that their groups were fully staffed.
Future meetings will be held at various medical institutions around the greater Philadelphia area. The next is to be held this month at Christiana Medical Center in Wilmington, Del. Future topics will be centered on pragmatic, nonclinical concerns for hospitalists, such as how to best utilize allied health providers.
Family Comes First

I recently returned from a seminar where I sang “Kumbaya” (OK, maybe I hummed) and performed a skit in front of the 250 other participants. Having once been edited out of my own end-of-residency movie, you might think this was Acting 101 for the next Shen’s Anatomy. Rather, this was “Hospitals and Communities Moving Forward with Patient and Family-Centered Care.” Replete with experiential lessons in positive change, it transformed my vision of the future for patients, families, and our field.
Patient- and family-centered care (PFCC) is a movement rooted in the values at the core of our profession. As soon as the hunter-gatherers formed communities, a village healer emerged. Parents could turn to the healer for help when a child developed bronchiolitis. With similar amounts of hand-waving, these healers produced outcomes similar to current bronchiolitis care.
But what once was a simple relationship has become fractured through relentless de-evolutionary forces. Progressive specialization has exponentially increased the number of healers. The rapid, paternalistic injection of science and technology overwhelms even the most capable of Homo sapiens. The final product can be as cold and sterile as a modern-day operating room.
Amidst the labyrinthine tangle of providers, information, and facilities, there is a warm underglow of hope. Unless you’ve been hiding under the concrete foundation of the old part of your hospital, you’ve heard about family-centered rounds (FCR). It’s the new black, or the new steroids, of pediatric HM. And it carries with it the potential to be the bellwether of change.
A simplistic view entails moving teaching rounds from the conference room to the bedside. Throw in a multidisciplinary component and you have a theoretical therapeutic milieu from which all manner of positive education and patient outcomes might be measured.
But one must ask the question: Can creating patient- and family-centeredness really be this simple?
Work with Families
Let’s begin with definitions. At one end of the spectrum is system-centered care (SCC). In this system, family members are denied access to the recovery room because it’s easier for the post-operative staff to do their work. Children wake up terrified? Tough. SCC is what the system does to you.
The next step on the developmental continuum is patient- and family-focused care (PFFC). Providers work for the benefit of the patient and family. You transport your gaggle of learners to the bedside for each and every family. You do it for everyone because you believe it’s best for the patient. You do it … until Tyler, age 9, tells you that your intimidating team gives him ulcers, perhaps literally.
What I thought was PFCC really was PFF, at best. By imposing my form of rounds on each patient and family, I had left out a key tenet of PFCC: collaboration. PFCC is partnering with patients and families. A simple fix for rounds would be to ask each patient and family how they would like to be involved.
Then again, just as a family is not easily defined, FCR is not best viewed in light of its structural composition or mechanics, but in its ability to deliver what each individual patient and family desires. And given the alacrity with which research in our field has gravitated toward FCR as a clean, measurable intervention, the implications of an FCR-dominant agenda should be highlighted.
To date, we have focused on measuring the challenges and successes of FCR implementation in academic settings. The emphasis on traditional teaching rounds has been at the price of the exclusion of defining what is family-centered when consultants or nonteaching hospitalists provide care, let alone nonphysician staff and outpatient providers. The emphasis on measurable data has subdued the powerful voices of patient and family stories. We have, predictably, created a hospitalist-centered agenda.
PFCC’s broad umbrella involves working with families at every juncture, from the design of your unit to the format of rounds to the outcomes of your study. True PFCC is measured by culture change and is successful when patients and families are surrounded by continuous healing relationships. By focusing efforts squarely on the implementation of FCR, I fear we may lose sight of a tremendous opportunity.
Pediatric Calling
Adult HM has turned a focus on quality and safety into a building block for the growth and acceptance of the field. Pediatrics invented and advanced the medical home concept, now a core principle of healthcare reform. PFCC is a central yet underdeveloped component of both of these parent organization efforts. Meanwhile, federally mandated public reporting of patients’ and families’ experience of care is under way, and hospitals are at varying stages of funding relevant initiatives.
These winds of change have created a fertile climate from which pediatric HM should blossom and lead. We can build upon our strong start in FCR, but we also must expand our efforts to lead in all directions. We must align our goals with administrative leadership, extend our work laterally to all other physicians and healthcare personnel, and elevate patients and families from subjects to collaborators.
FCR becomes a speed bump only if it is seen as a distinct and removable piece of PFCC. FCR accelerates change when it is embedded in the continuum of PFCC. Translating this vision into the language of strategic planning, a mission statement for the future of pediatric HM might look something like this:
Our strategy is to demonstrate our value to healthcare by leveraging FCR knowledge and expertise to generate a strong leadership presence at the forefront of the PFCC movement.
- We will seek partnership with institutional, community, and national leaders to promote a unified and collective vision for change.
- We will continue to accumulate not only data, but also powerful stories with which to effect change.
- We will use our experience in interdisciplinary partnerships with families to engage early adopters from other domains of the healthcare system.
- We will maintain a central focus on relationships and communication to effectively model culture change. TH
Dr. Shen is pediatric editor of The Hospitalist and medical director of hospital medicine at Dell Children’s Medical Center in Austin, Texas.
Quality Commitment
Ehab Hanna, MD, MBBch, FHM, understands better than most why hospitalists are frustrated with all the grand plans to utilize information technology (IT) for streamlining admissions, medical reconciliations, and the discharge process. As assistant chief medical information officer at Eastern Maine Medical Center in Bangor, he spends half his time scouting and assessing the value of new IT platforms and the other half as a front-line hospitalist.
Dr. Hanna and his colleagues are frustrated that software systems promise to deliver electronic medical records (EMR) but freeze up too often, take too long to download files, or can’t handle the functions for which they were developed. But he also knows the future of healthcare hinges on IT as much as anything else—and that done correctly, and probably expensively, it can be a savior.
“Every time we want to come up with a quality-initiative project, we want to ask, ‘What can IT do for us?’ ” Dr. Hanna says. He also acknowledges that “it’s all types of money, whether it be resources, funding, or people to implement [the system]. And there’s physician resistance to it.”
The link between quality and cost is paramount to healthcare and HM. As evidence, the keynote theme of HM09 in Chicago was quality improvement (QI)—defining it, making it a priority, setting up analytical metrics to measure it, and the most difficult step: implementing it. QI projects vary in size, shape, and scope. On one end of the spectrum: hand-washing compliance systems and simple programs to increase the prescription of pneumococcal vaccines. On the laborious and expensive end: EMR system integration with ambulatory care and pharmacy.

Industry leaders agree QI projects must include measurable goals and incentives for success. The flip side is that failure to reach those goals has to include a level of accountability.
One thing is for sure: The choice to focus on patient safety no longer is a choice, it’s a mandate. Patient-safety advocates are barking louder than ever, and the public and politicians are taking note. Medicare reimbursements are increasingly tied to performance measures, a trend that is likely to accelerate in light of recent news that Medicare will sink into the red in just eight years. Many expect that threshold to keep moving closer, too. President Obama has pledged to push major healthcare reform legislation—including a focus on EMR—through Congress. He wants to sign it into law by Labor Day.
On the other hand, there still is a relatively small sample of data on the effectiveness of pay-for-performance contracting in relation to overall patient health. There is a recurring call from many outside the HM field for more independent, empirical data that can pinpoint the quantifiable value of hospitalists. Discussions based on those values could satisfy group leaders, hospital administrators, and government regulators who still use the tried-and-true HM formula: value equals quality divided by cost.
“I see about as many challenges in QI as I do opportunities,” says SHM President Scott Flanders, MD, FHM, director of the hospitalist program at the University of Michigan Health System in Ann Arbor. “Is the horse before the cart? We have spent a lot of time and effort putting in place … programs before understanding the clinical effect.”

Can IT be EZ?
Dr. Hanna says hospitalists would embrace new IT initiatives immediately if they were easier to use. Many hospitalists are frustrated that in their pocket sits a handy, portable device that works in real time as a computer, a phone, a CD player, a GPS tracking device, and a scheduling secretary, yet they can’t use their E&M coding system without encountering constant hiccups, interruptions that take valuable time out of an already crowded 12-hour shift.
“Why isn’t it working like the iPhone?” is a complaint Dr. Hanna says he hears all the time.
One answer is that a number of medical software programs are limited in nature and don’t automatically network well with other systems already in place. User errors and other problems crop up regularly; plus, there isn’t a repository for people to measure different systems against each other. Some SHM leaders are considering a plan to create an online resource for IT vendors, but the society is leery of making recommendations because of potential conflicts of interest.
The Joint Commission, which accredits and certifies more than 15,000 healthcare organizations and programs, has been asked—by Dr. Hanna, among others—if it intends to regulate EMR vendors, which would let hospitalists know which systems are most reliable and useful. Commission President Mark Chassin, MD, MPP, MPH, said after his HM09 keynote address that his agency has no intention of doing so.
—Scott Flanders, MD, FHM, SHM president
“We don’t see [that] as a good message for us to give,” Dr. Chassin said.
IT also can be used in creative ways to spur patient-safety improvements. As hospitalists struggle to increase compliance with hand-hygiene standards, several hospitals have resorted to using video cameras above sinks to track whose hands are clean and whose hands are not clean, Robert Wachter, MD, FHM, said during his plenary address to conclude HM09. Real-time tracking runs through a software program and is displayed on a small, LED screen that hangs from the ceiling. Positive results are praised, while low rates of compliance result in pages to HM and hospital leaders to address hygiene issues. Dr. Wachter, professor and associate chairman of the department of medicine at the University of California at San Francisco Medical Center, chief of the division of hospital medicine, former SHM president and author of the blog “Wachter’s World” (www.wachtersworld), said UCSF hospital executives are considering the video system.
Dr. Wachter also says hospitalists can’t lament the rise of QI and the stricter standards that are attached. Nor can HM complain too loudly about the burdens QI places on them. As hospitalists argue that their value is partly defined by their contributions to hospital quality, they have to expect to be accountable to the claim. “We have positioned ourselves as being leaders in quality and safety,” he says. “This is not going out and being branded. We bring this in. We often say we have two sick patients; one is in front of us, the other is our organization.”
Pay for Performance?
Another largely unanswered question is how valuable pay-for-performance will be in improving patient care, safety, and satisfaction. While most HM contracts include additional compensation based on volume, bonus pay often ignores such measurable outcomes as readmission rates and length of stay.
“Does incentivizing healthcare quality actually improve health?” asks Susan Freeman, MD, chief medical officer at Temple University Hospital in Philadelphia. “It’s really hard to measure things that don’t happen—the myocardial infarction that didn’t happen, the stroke that didn’t happen.”
Active pay-for-performance programs numbered 160 in November 2007, four times the number of programs four years earlier.1 Yet as the concept catches on, the average physician incentive was 2% or less, and it seems to play a small role in how care was delivered.2
A more recent look at the issue concludes that if insurance companies and private employers worked with hospitals and physicians, attitudes toward pay for performance might change. “The amount of incentives available to physicians strongly affected their rate of participation,” say the authors of a May study in the American Journal of Managed Care. “Our analysis suggests that all stakeholders—health plans, physicians, and patients—would benefit from health plans collaborating on their pay-for-performance efforts to maximize physician participation.”3
Russell Holman, MD, FHM, chief operating officer of Cogent Healthcare, says another pay-for-performance concern is that improved quality is not always something that translates quickly into bottom-line savings. In today’s economic environment, in which every dollar spent has to be justified, it can actually be tougher to sell the upfront costs and long-term savings associated with investment in QI projects. “Improving quality is going to take a long time to see the advantages to the healthcare system,” says Dr. Holman, a former SHM president. “It is delayed gratification.”

Is HM Ready?
Dr. Holman says the pay-for-performance solution might end up as more of a hybrid of two reimbursement models, incentive-based pay and the controversial notion of billing bundling. Most hospitalists and HM groups are not entirely comfortable with the bundling idea, in which the hospital receives a lump-sum reimbursement for all services performed for a patient, then shells out payment to the surgeons, hospitalists, nurses, etc. The concept of hospitals as payment intermediaries adds an extra layer of bureaucracy, but the bundling concept appears to be gaining momentum.
While QI projects are the trendy way to measure value, Dr. Chassin points out that physicians need more detailed thresholds to exceed. Such measures as prescribing beta-blockers after myocardial infarction were good first-generation concepts, but better care requires better benchmarks, he says. Dr. Wachter echoes the sentiment, telling HM09 attendees that relying on past successes in QI won’t help hospitalists demonstrate their value or answer the “What have you done for me lately?” demand from hospital administrators.
Dr. Chassin compares healthcare to other high-pressure industries that do much better at controlling mistakes. Some estimates show nearly 100,000 people a year die from medical errors. Why? Many high-risk industries—airlines, nuclear energy, mining—have better quality and safety processes to protect against routine errors that continually plague healthcare (e.g., hospital-acquired infections, operations on the wrong patient).
The responsibility to get better doesn’t belong to one medical group, either. Dr. Chassin says researchers, the Centers for Medicare and Medicaid Services, and trade groups like SHM have to work collaboratively to design benchmarks that can be measured quantitatively. Once those measuring sticks are in place, though, Dr. Chassin believes hospitalists are the first responders who can best identify and solve problems.
“You have to understand the causes of the problems you’re trying to fix,” he says. “Hospitalists are on the front lines.” TH
Richard Quinn is a freelance writer based in New Jersey.
References
- Baker G, Delbanco S. Pay for performance: national perspective. 2006 longitudinal survey results with 2007 market updates. MedVantage Web site. Available at www.medvantage.com/Pdf/2006 NationalP4PStudy.pdf. Accessed May 17, 2009.
- Pearson SD, Schneider EC, Kleinman KP, Colin KL, Singer JA. The impact of pay-for-performance on health care quality in Massachusetts, 2001-2003. Health Aff (Millwood). 2008;27(4):1167-1176.
- De Brantes FS, D’Andrea BG. Physicians respond to pay-for-performance incentives: larger incentives yield greater participation. Am J Manag Care. 2009;15(5):305-310.
Ehab Hanna, MD, MBBch, FHM, understands better than most why hospitalists are frustrated with all the grand plans to utilize information technology (IT) for streamlining admissions, medical reconciliations, and the discharge process. As assistant chief medical information officer at Eastern Maine Medical Center in Bangor, he spends half his time scouting and assessing the value of new IT platforms and the other half as a front-line hospitalist.
Dr. Hanna and his colleagues are frustrated that software systems promise to deliver electronic medical records (EMR) but freeze up too often, take too long to download files, or can’t handle the functions for which they were developed. But he also knows the future of healthcare hinges on IT as much as anything else—and that done correctly, and probably expensively, it can be a savior.
“Every time we want to come up with a quality-initiative project, we want to ask, ‘What can IT do for us?’ ” Dr. Hanna says. He also acknowledges that “it’s all types of money, whether it be resources, funding, or people to implement [the system]. And there’s physician resistance to it.”
The link between quality and cost is paramount to healthcare and HM. As evidence, the keynote theme of HM09 in Chicago was quality improvement (QI)—defining it, making it a priority, setting up analytical metrics to measure it, and the most difficult step: implementing it. QI projects vary in size, shape, and scope. On one end of the spectrum: hand-washing compliance systems and simple programs to increase the prescription of pneumococcal vaccines. On the laborious and expensive end: EMR system integration with ambulatory care and pharmacy.
Industry leaders agree QI projects must include measurable goals and incentives for success. The flip side is that failure to reach those goals has to include a level of accountability.
One thing is for sure: The choice to focus on patient safety no longer is a choice, it’s a mandate. Patient-safety advocates are barking louder than ever, and the public and politicians are taking note. Medicare reimbursements are increasingly tied to performance measures, a trend that is likely to accelerate in light of recent news that Medicare will sink into the red in just eight years. Many expect that threshold to keep moving closer, too. President Obama has pledged to push major healthcare reform legislation—including a focus on EMR—through Congress. He wants to sign it into law by Labor Day.
On the other hand, there still is a relatively small sample of data on the effectiveness of pay-for-performance contracting in relation to overall patient health. There is a recurring call from many outside the HM field for more independent, empirical data that can pinpoint the quantifiable value of hospitalists. Discussions based on those values could satisfy group leaders, hospital administrators, and government regulators who still use the tried-and-true HM formula: value equals quality divided by cost.
“I see about as many challenges in QI as I do opportunities,” says SHM President Scott Flanders, MD, FHM, director of the hospitalist program at the University of Michigan Health System in Ann Arbor. “Is the horse before the cart? We have spent a lot of time and effort putting in place … programs before understanding the clinical effect.”
Can IT be EZ?
Dr. Hanna says hospitalists would embrace new IT initiatives immediately if they were easier to use. Many hospitalists are frustrated that in their pocket sits a handy, portable device that works in real time as a computer, a phone, a CD player, a GPS tracking device, and a scheduling secretary, yet they can’t use their E&M coding system without encountering constant hiccups, interruptions that take valuable time out of an already crowded 12-hour shift.
“Why isn’t it working like the iPhone?” is a complaint Dr. Hanna says he hears all the time.
One answer is that a number of medical software programs are limited in nature and don’t automatically network well with other systems already in place. User errors and other problems crop up regularly; plus, there isn’t a repository for people to measure different systems against each other. Some SHM leaders are considering a plan to create an online resource for IT vendors, but the society is leery of making recommendations because of potential conflicts of interest.
The Joint Commission, which accredits and certifies more than 15,000 healthcare organizations and programs, has been asked—by Dr. Hanna, among others—if it intends to regulate EMR vendors, which would let hospitalists know which systems are most reliable and useful. Commission President Mark Chassin, MD, MPP, MPH, said after his HM09 keynote address that his agency has no intention of doing so.
—Scott Flanders, MD, FHM, SHM president
“We don’t see [that] as a good message for us to give,” Dr. Chassin said.
IT also can be used in creative ways to spur patient-safety improvements. As hospitalists struggle to increase compliance with hand-hygiene standards, several hospitals have resorted to using video cameras above sinks to track whose hands are clean and whose hands are not clean, Robert Wachter, MD, FHM, said during his plenary address to conclude HM09. Real-time tracking runs through a software program and is displayed on a small, LED screen that hangs from the ceiling. Positive results are praised, while low rates of compliance result in pages to HM and hospital leaders to address hygiene issues. Dr. Wachter, professor and associate chairman of the department of medicine at the University of California at San Francisco Medical Center, chief of the division of hospital medicine, former SHM president and author of the blog “Wachter’s World” (www.wachtersworld), said UCSF hospital executives are considering the video system.
Dr. Wachter also says hospitalists can’t lament the rise of QI and the stricter standards that are attached. Nor can HM complain too loudly about the burdens QI places on them. As hospitalists argue that their value is partly defined by their contributions to hospital quality, they have to expect to be accountable to the claim. “We have positioned ourselves as being leaders in quality and safety,” he says. “This is not going out and being branded. We bring this in. We often say we have two sick patients; one is in front of us, the other is our organization.”
Pay for Performance?
Another largely unanswered question is how valuable pay-for-performance will be in improving patient care, safety, and satisfaction. While most HM contracts include additional compensation based on volume, bonus pay often ignores such measurable outcomes as readmission rates and length of stay.
“Does incentivizing healthcare quality actually improve health?” asks Susan Freeman, MD, chief medical officer at Temple University Hospital in Philadelphia. “It’s really hard to measure things that don’t happen—the myocardial infarction that didn’t happen, the stroke that didn’t happen.”
Active pay-for-performance programs numbered 160 in November 2007, four times the number of programs four years earlier.1 Yet as the concept catches on, the average physician incentive was 2% or less, and it seems to play a small role in how care was delivered.2
A more recent look at the issue concludes that if insurance companies and private employers worked with hospitals and physicians, attitudes toward pay for performance might change. “The amount of incentives available to physicians strongly affected their rate of participation,” say the authors of a May study in the American Journal of Managed Care. “Our analysis suggests that all stakeholders—health plans, physicians, and patients—would benefit from health plans collaborating on their pay-for-performance efforts to maximize physician participation.”3
Russell Holman, MD, FHM, chief operating officer of Cogent Healthcare, says another pay-for-performance concern is that improved quality is not always something that translates quickly into bottom-line savings. In today’s economic environment, in which every dollar spent has to be justified, it can actually be tougher to sell the upfront costs and long-term savings associated with investment in QI projects. “Improving quality is going to take a long time to see the advantages to the healthcare system,” says Dr. Holman, a former SHM president. “It is delayed gratification.”
Is HM Ready?
Dr. Holman says the pay-for-performance solution might end up as more of a hybrid of two reimbursement models, incentive-based pay and the controversial notion of billing bundling. Most hospitalists and HM groups are not entirely comfortable with the bundling idea, in which the hospital receives a lump-sum reimbursement for all services performed for a patient, then shells out payment to the surgeons, hospitalists, nurses, etc. The concept of hospitals as payment intermediaries adds an extra layer of bureaucracy, but the bundling concept appears to be gaining momentum.
While QI projects are the trendy way to measure value, Dr. Chassin points out that physicians need more detailed thresholds to exceed. Such measures as prescribing beta-blockers after myocardial infarction were good first-generation concepts, but better care requires better benchmarks, he says. Dr. Wachter echoes the sentiment, telling HM09 attendees that relying on past successes in QI won’t help hospitalists demonstrate their value or answer the “What have you done for me lately?” demand from hospital administrators.
Dr. Chassin compares healthcare to other high-pressure industries that do much better at controlling mistakes. Some estimates show nearly 100,000 people a year die from medical errors. Why? Many high-risk industries—airlines, nuclear energy, mining—have better quality and safety processes to protect against routine errors that continually plague healthcare (e.g., hospital-acquired infections, operations on the wrong patient).
The responsibility to get better doesn’t belong to one medical group, either. Dr. Chassin says researchers, the Centers for Medicare and Medicaid Services, and trade groups like SHM have to work collaboratively to design benchmarks that can be measured quantitatively. Once those measuring sticks are in place, though, Dr. Chassin believes hospitalists are the first responders who can best identify and solve problems.
“You have to understand the causes of the problems you’re trying to fix,” he says. “Hospitalists are on the front lines.” TH
Richard Quinn is a freelance writer based in New Jersey.
References
- Baker G, Delbanco S. Pay for performance: national perspective. 2006 longitudinal survey results with 2007 market updates. MedVantage Web site. Available at www.medvantage.com/Pdf/2006 NationalP4PStudy.pdf. Accessed May 17, 2009.
- Pearson SD, Schneider EC, Kleinman KP, Colin KL, Singer JA. The impact of pay-for-performance on health care quality in Massachusetts, 2001-2003. Health Aff (Millwood). 2008;27(4):1167-1176.
- De Brantes FS, D’Andrea BG. Physicians respond to pay-for-performance incentives: larger incentives yield greater participation. Am J Manag Care. 2009;15(5):305-310.
Beware the Doughnut Hole
Judy Zerzan, MD, MPH, was at a loss. A Health and Aging Policy Fellow and hospitalist at the University of Colorado Denver, Dr. Zerzan was examining a Medicare patient who was admitted to the hospital with an apparent urinary tract infection. But the same patient had been released from the hospital only five days earlier with an antibiotic prescription to treat an oddly similar infection.
The confusion only increased when lab cultures revealed an E. coli infection. It should have been sensitive to most antibiotics, especially to the brand-name moxifloxacin the patient said she had been taking since her last hospital stay.
Several days into the patient’s rehospitalization, a medical student finally cracked the case. “The medical student went in and started talking to her some more and learned that she didn’t fill the prescription because under her [insurance] plan, it was going to be something like $50, and she felt like she couldn’t afford it,” Dr. Zerzan recalls. “She felt really embarrassed about it, so she didn’t want to tell us that she didn’t fill it.”
The medical team sent the woman home with a $4 generic prescription. “She was much relieved,” Dr. Zerzan says. More importantly, the patient did not return to the hospital for a third stay.
Hospitalists might not see a $46 difference in drug pricing as a core consideration of patient care. But with many seniors enrolled in Medicare Part D’s prescription drug plan falling through holes in the partially privatized safety net, many agree that far more must be done to ensure that financial stress doesn’t lead to medical misfortune.
“It is an ethical issue,” says Stephen Soumerai, ScD, director of the Drug Policy Research Program and a professor in the Department of Ambulatory Care and Prevention at Harvard University. “ … It’s easy to target those people who are the most vulnerable in our society and, therefore, it is an opportunity to try to find ways for them to lower their problems of economic access to medicine.”
Soumerai calls cost-related medication nonadherence a matter of distributive justice. In a study published last year in the Journal of the American Medical Association, he and 10 co-authors found that even after enrolling in Medicare Part D, the sickest beneficiaries were just as likely to skip medications they couldn’t afford.1
Identify the Coverage Gap
Medicare’s prescription drug plan, initiated in 2006, has provided coverage for many beneficiaries who previously went without. But it has been widely criticized as unnecessarily confusing by both doctors and patients—and particularly expensive for beneficiaries unlucky enough to fall into its notorious gap in coverage, dubbed the “doughnut hole” (see “Medicare Part D: The Basics,” right).
That economic burden can be exacerbated by medical illiteracy, ignorance, and misinformation. Recent Consumer Reports polls suggest as few as 4% of patients discuss drug prices with their doctors; almost half of Americans have reservations or misgivings about lower-cost generic drugs.
As focal points in the coordination of patient care, hospitalists are better positioned than most to help steer the most vulnerable away from the douhgnut hole while helping hospitals equitably distribute limited resources. But hospitalists often are completely unaware of a patient’s plight. “My research interest is prescription drug coverage, so I think I’m more keyed into it, but certainly even I don’t generally think about, when discharging a patient, if something is going to be on their Part D formulary or not, or what sort of prior-authorization hoops their primary-care doc may have to go through,” Dr. Zerzan says. “And I think that’s generally true of my colleagues as well.”
With tight schedules, a limited personal history with patients, disparities in local resources, and a litany of cost-control measures established by insurers, even hospitalists in the know concede that helping Medicare patients manage drug costs can be an exercise in frustration. As a result, patients are often left with medications that require higher cost-sharing or aren’t even on a plan’s formulary, forcing them to pay out-of-pocket for a prescription. Adding insult to injury, any money spent on a medication not covered by a Part D plan doesn’t count toward getting a patient out of the doughnut hole.
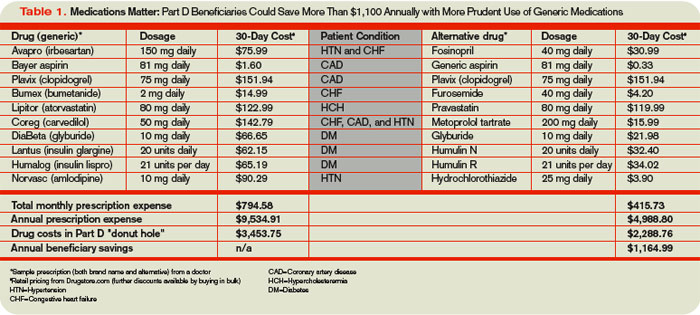
The Extra Mile
Jocelyne Watrous, a Medicare beneficiary consultant at the Willimantic, Conn.-based Center for Medicare Advocacy, says drug affordability while in the doughnut hole is a hardship for many. But so are specialty drug copays that range from 25% to 33% of the total price (see Table 1, below). For expensive prescriptions, Watrous says, hospitalists can get the name of a patient’s Part D formulary from the membership card and check for restrictions, such as prior authorization, quantity limits, or step therapy. “This is a terrible burden to place on physicians and their staffs, but nothing is worse than having the patient come back to the hospital via the ER because they could not get the drug prescribed by their doctor,” she says. “Best to square it all away before discharge, if possible.”
Brandon Koretz, MD, an associate clinical professor of geriatric medicine at the University of California at Los Angeles, says keeping track of differences among the dozens of Part D plans isn’t feasible. “Oftentimes, what happens is, you find yourself writing a prescription for what you think is a reasonable and cost-effective treatment, only to find out that drug A is not on insurance company B’s formulary, but drug C is,” Dr. Koretz says.
And if doctors are confused by the array of Part D formularies, hospitalists wonder, how can geriatric patients be expected to navigate the system, especially given the not-insignificant number with cognitive impairments?
Bill Vaughan, a health policy analyst for Consumers Union in Washington, D.C., compares the consumer paralysis created by the proliferation of prescription drug plans to walking by a store display featuring 20 brands of jam. “You’re kind of awed by it, but you don’t buy anything because you’re kind of intimidated,” he says. Only instead of 20 varieties, the typical local government agency offered 48 competing Part D plans in November 2006, with some boasting more than 70. In a new study sponsored by the Henry J. Kaiser Family Foundation, Massachusetts Institute of Technology economist Jonathan Gruber found that when seniors made a decision, only 6% to 9% chose the least expensive plan, while the remaining seniors paid an extra $360 to $520 annually (www.kff.org/medicare/7864.cfm).
All too often, economic problems are simply transferred to other providers. Nursing home pharmacists have complained to Dr. Zerzan about doctors switching seniors’ medications to hospital formulary drugs that aren’t covered under Part D, requiring pharmacists to switch the drugs back again. “From their standpoint, it takes a ton of work because hospitalists don’t know what’s on their formulary,” she says.
Miscommunication can wreak havoc in other ways. Dr. Zerzan recalls how her parents were hosting her grandmother in Oregon when she fell and broke her pelvis. At the hospital, she arrived with two overlapping medication lists from her primary-care physician, cardiologist, and rheumatologist in California. The lists contained several combination pills that essentially duplicated her cholesterol and blood pressure medications. Instead of conducting a medication review, the hospital left the lists intact and added its own, sending her grandmother home with a “fistful of prescriptions.” Unsurprisingly, her blood pressure dipped dangerously. “She actually ended up going back into the hospital briefly to sort out her medications because it was such a mess,” Dr. Zerzan says.
Two-Way Conversation
Hospitalists generally don’t have the benefit of a longstanding relationship with their patients, says Ashley Beard, MD, PhD, a pharmaceutical policy research fellow in the Department of Ambulatory Care and Prevention at Harvard University. “And they’re dealing with people who are at their most vulnerable and least able to communicate effectively about what is going on in their lives.”
The virtual impossibility of knowing Part D formularies for every patient, she says, only increases the importance of effective bedside discussions and open-ended questions. “I think that communicating about costs really has been, and continues to be, a taboo subject in direct patient encounters, even though it is widely talked about in the research and popular press,” she says.
Likewise, hospitalists can intervene during transition planning, Dr. Beard says, when “the goal of the hospitalist is to stabilize the patient to be able to go out into the community and then have community follow-up care, preferably by a primary-care physician.” For people who don’t seek care regularly, she says, part of that stabilization can be a medication review that eliminates nonessential or harmful drugs and alleviates a patient’s financial burden.
Christine Lum Lung, MD, medical director of the independent Northern Colorado Hospitalists group, says a proactive discharge-planning department can be a huge help in coordinating such transitions of care. Her privately run group, affiliated with two private nonprofit hospitals in Loveland and Fort Collins, works closely with a “very active and involved” department that regularly meets with patients to assess financial issues. “Then they will approach us oftentimes with any concerns or issues with the discharge plan and medication,” she says.
Real-Time Solutions
Patient advocates have proposed a combination of other incentives to encourage better coordination among healthcare providers, including penalties for preventable rehospitalizations and a faster rollout of e-prescribing and electronic databases. Many hospitalists are particularly enthusiastic about the potential of electronic health records to assist them and their patients, though researchers like Soumerai are far less convinced about the merits of such a billion-dollar investment.
In the meantime, Dr. Lum Lung points to other low-cost solutions. At every workstation, her hospitals have posted details of the $4-a-month generic prescription programs offered by retailers like Target and Walmart. “I think it is probably prudent for us to be cognizant of that for everybody,” she says, “regardless of their insurance or payor source.”
For a recently discharged patient, one hospital Dr. Lum Lung works with proactively asked a pharmacist to run a few antibiotics through the patient’s insurance formulary to help pick the most cost-effective one. If a patient can’t afford the drug, the discharge-planning department can look into local drug assistance programs or the hospital’s voucher system, which allows medications to be filled by an in-house pharmacy. “We don’t want to—especially right now—make somebody have to make a choice between making their mortgage or rent payment or paying for a very expensive medication,” she says.
With so much information coming at them at once, hospitalists say, patients may need to be monitored once they get home. And with limited medical resources, physicians must constantly ask themselves whether they’re using the most appropriate and least expensive medications for every patient. “The hospitalists, in particular, are the natural leaders for this kind of thinking,” Dr. Koretz says. “Thinking about medical problems not as isolated, patient-specific problems, but rather as problems of systems of care, and processes of care.” TH
Bryn Nelson is a freelance medical writer based in Seattle.
Reference
- Madden JM, Graves AJ, Zhang F, et al. Cost-related medication nonadherence and spending on basic needs following implementation of Medicare Part D. JAMA. 2008;299(16):1922-1928.
Judy Zerzan, MD, MPH, was at a loss. A Health and Aging Policy Fellow and hospitalist at the University of Colorado Denver, Dr. Zerzan was examining a Medicare patient who was admitted to the hospital with an apparent urinary tract infection. But the same patient had been released from the hospital only five days earlier with an antibiotic prescription to treat an oddly similar infection.
The confusion only increased when lab cultures revealed an E. coli infection. It should have been sensitive to most antibiotics, especially to the brand-name moxifloxacin the patient said she had been taking since her last hospital stay.
Several days into the patient’s rehospitalization, a medical student finally cracked the case. “The medical student went in and started talking to her some more and learned that she didn’t fill the prescription because under her [insurance] plan, it was going to be something like $50, and she felt like she couldn’t afford it,” Dr. Zerzan recalls. “She felt really embarrassed about it, so she didn’t want to tell us that she didn’t fill it.”
The medical team sent the woman home with a $4 generic prescription. “She was much relieved,” Dr. Zerzan says. More importantly, the patient did not return to the hospital for a third stay.
Hospitalists might not see a $46 difference in drug pricing as a core consideration of patient care. But with many seniors enrolled in Medicare Part D’s prescription drug plan falling through holes in the partially privatized safety net, many agree that far more must be done to ensure that financial stress doesn’t lead to medical misfortune.
“It is an ethical issue,” says Stephen Soumerai, ScD, director of the Drug Policy Research Program and a professor in the Department of Ambulatory Care and Prevention at Harvard University. “ … It’s easy to target those people who are the most vulnerable in our society and, therefore, it is an opportunity to try to find ways for them to lower their problems of economic access to medicine.”
Soumerai calls cost-related medication nonadherence a matter of distributive justice. In a study published last year in the Journal of the American Medical Association, he and 10 co-authors found that even after enrolling in Medicare Part D, the sickest beneficiaries were just as likely to skip medications they couldn’t afford.1
Identify the Coverage Gap
Medicare’s prescription drug plan, initiated in 2006, has provided coverage for many beneficiaries who previously went without. But it has been widely criticized as unnecessarily confusing by both doctors and patients—and particularly expensive for beneficiaries unlucky enough to fall into its notorious gap in coverage, dubbed the “doughnut hole” (see “Medicare Part D: The Basics,” right).
That economic burden can be exacerbated by medical illiteracy, ignorance, and misinformation. Recent Consumer Reports polls suggest as few as 4% of patients discuss drug prices with their doctors; almost half of Americans have reservations or misgivings about lower-cost generic drugs.
As focal points in the coordination of patient care, hospitalists are better positioned than most to help steer the most vulnerable away from the douhgnut hole while helping hospitals equitably distribute limited resources. But hospitalists often are completely unaware of a patient’s plight. “My research interest is prescription drug coverage, so I think I’m more keyed into it, but certainly even I don’t generally think about, when discharging a patient, if something is going to be on their Part D formulary or not, or what sort of prior-authorization hoops their primary-care doc may have to go through,” Dr. Zerzan says. “And I think that’s generally true of my colleagues as well.”
With tight schedules, a limited personal history with patients, disparities in local resources, and a litany of cost-control measures established by insurers, even hospitalists in the know concede that helping Medicare patients manage drug costs can be an exercise in frustration. As a result, patients are often left with medications that require higher cost-sharing or aren’t even on a plan’s formulary, forcing them to pay out-of-pocket for a prescription. Adding insult to injury, any money spent on a medication not covered by a Part D plan doesn’t count toward getting a patient out of the doughnut hole.
The Extra Mile
Jocelyne Watrous, a Medicare beneficiary consultant at the Willimantic, Conn.-based Center for Medicare Advocacy, says drug affordability while in the doughnut hole is a hardship for many. But so are specialty drug copays that range from 25% to 33% of the total price (see Table 1, below). For expensive prescriptions, Watrous says, hospitalists can get the name of a patient’s Part D formulary from the membership card and check for restrictions, such as prior authorization, quantity limits, or step therapy. “This is a terrible burden to place on physicians and their staffs, but nothing is worse than having the patient come back to the hospital via the ER because they could not get the drug prescribed by their doctor,” she says. “Best to square it all away before discharge, if possible.”
Brandon Koretz, MD, an associate clinical professor of geriatric medicine at the University of California at Los Angeles, says keeping track of differences among the dozens of Part D plans isn’t feasible. “Oftentimes, what happens is, you find yourself writing a prescription for what you think is a reasonable and cost-effective treatment, only to find out that drug A is not on insurance company B’s formulary, but drug C is,” Dr. Koretz says.
And if doctors are confused by the array of Part D formularies, hospitalists wonder, how can geriatric patients be expected to navigate the system, especially given the not-insignificant number with cognitive impairments?
Bill Vaughan, a health policy analyst for Consumers Union in Washington, D.C., compares the consumer paralysis created by the proliferation of prescription drug plans to walking by a store display featuring 20 brands of jam. “You’re kind of awed by it, but you don’t buy anything because you’re kind of intimidated,” he says. Only instead of 20 varieties, the typical local government agency offered 48 competing Part D plans in November 2006, with some boasting more than 70. In a new study sponsored by the Henry J. Kaiser Family Foundation, Massachusetts Institute of Technology economist Jonathan Gruber found that when seniors made a decision, only 6% to 9% chose the least expensive plan, while the remaining seniors paid an extra $360 to $520 annually (www.kff.org/medicare/7864.cfm).
All too often, economic problems are simply transferred to other providers. Nursing home pharmacists have complained to Dr. Zerzan about doctors switching seniors’ medications to hospital formulary drugs that aren’t covered under Part D, requiring pharmacists to switch the drugs back again. “From their standpoint, it takes a ton of work because hospitalists don’t know what’s on their formulary,” she says.
Miscommunication can wreak havoc in other ways. Dr. Zerzan recalls how her parents were hosting her grandmother in Oregon when she fell and broke her pelvis. At the hospital, she arrived with two overlapping medication lists from her primary-care physician, cardiologist, and rheumatologist in California. The lists contained several combination pills that essentially duplicated her cholesterol and blood pressure medications. Instead of conducting a medication review, the hospital left the lists intact and added its own, sending her grandmother home with a “fistful of prescriptions.” Unsurprisingly, her blood pressure dipped dangerously. “She actually ended up going back into the hospital briefly to sort out her medications because it was such a mess,” Dr. Zerzan says.
Two-Way Conversation
Hospitalists generally don’t have the benefit of a longstanding relationship with their patients, says Ashley Beard, MD, PhD, a pharmaceutical policy research fellow in the Department of Ambulatory Care and Prevention at Harvard University. “And they’re dealing with people who are at their most vulnerable and least able to communicate effectively about what is going on in their lives.”
The virtual impossibility of knowing Part D formularies for every patient, she says, only increases the importance of effective bedside discussions and open-ended questions. “I think that communicating about costs really has been, and continues to be, a taboo subject in direct patient encounters, even though it is widely talked about in the research and popular press,” she says.
Likewise, hospitalists can intervene during transition planning, Dr. Beard says, when “the goal of the hospitalist is to stabilize the patient to be able to go out into the community and then have community follow-up care, preferably by a primary-care physician.” For people who don’t seek care regularly, she says, part of that stabilization can be a medication review that eliminates nonessential or harmful drugs and alleviates a patient’s financial burden.
Christine Lum Lung, MD, medical director of the independent Northern Colorado Hospitalists group, says a proactive discharge-planning department can be a huge help in coordinating such transitions of care. Her privately run group, affiliated with two private nonprofit hospitals in Loveland and Fort Collins, works closely with a “very active and involved” department that regularly meets with patients to assess financial issues. “Then they will approach us oftentimes with any concerns or issues with the discharge plan and medication,” she says.
Real-Time Solutions
Patient advocates have proposed a combination of other incentives to encourage better coordination among healthcare providers, including penalties for preventable rehospitalizations and a faster rollout of e-prescribing and electronic databases. Many hospitalists are particularly enthusiastic about the potential of electronic health records to assist them and their patients, though researchers like Soumerai are far less convinced about the merits of such a billion-dollar investment.
In the meantime, Dr. Lum Lung points to other low-cost solutions. At every workstation, her hospitals have posted details of the $4-a-month generic prescription programs offered by retailers like Target and Walmart. “I think it is probably prudent for us to be cognizant of that for everybody,” she says, “regardless of their insurance or payor source.”
For a recently discharged patient, one hospital Dr. Lum Lung works with proactively asked a pharmacist to run a few antibiotics through the patient’s insurance formulary to help pick the most cost-effective one. If a patient can’t afford the drug, the discharge-planning department can look into local drug assistance programs or the hospital’s voucher system, which allows medications to be filled by an in-house pharmacy. “We don’t want to—especially right now—make somebody have to make a choice between making their mortgage or rent payment or paying for a very expensive medication,” she says.
With so much information coming at them at once, hospitalists say, patients may need to be monitored once they get home. And with limited medical resources, physicians must constantly ask themselves whether they’re using the most appropriate and least expensive medications for every patient. “The hospitalists, in particular, are the natural leaders for this kind of thinking,” Dr. Koretz says. “Thinking about medical problems not as isolated, patient-specific problems, but rather as problems of systems of care, and processes of care.” TH
Bryn Nelson is a freelance medical writer based in Seattle.
Reference
- Madden JM, Graves AJ, Zhang F, et al. Cost-related medication nonadherence and spending on basic needs following implementation of Medicare Part D. JAMA. 2008;299(16):1922-1928.
Soft tissue atrophy after corticosteroid injection
A 27-year-old woman presents with pain and tenderness over her right radial styloid. Examination reveals tenderness to palpation and a positive Finkelstein test, and her condition is diagnosed as de Quervain tenosynovitis. She is referred for occupational therapy and for a corticosteroid injection.
Q: On the basis of the skin findings, which corticosteroid injection was most likely used?
- Triamcinolone hexacetonide (Aristospan)
- Dexamethasone sodium phosphate (Decadron)
- Betamethasone sodium phosphate and betamethasone acetate (Celestone Soluspan)
- Triamcinolone acetonide (Kenalog-40)
A: Both triamcinolone hexacetonide and triamcinolone acetonide are correct, as they are the least soluble of the agents listed.
ADVERSE EFFECTS OF STEROID INJECTIONS
Soft tissue atrophy and local depigmentation are possible adverse effects of any steroid injection, particularly when given at a superficial site.1,2 Although these are rare, with an estimated risk of less than 1%, patients still need to be told about these potential side effects.3 In addition, these adverse effects of injection may be prevented by applying pressure with gauze over the injection site as the needle is withdrawn to prevent leakage of corticosteroid along the needle track.3
Soft tissue atrophy generally appears in 1 to 4 months and resolves 6 to 30 months later. 4 Patients with darker skin are at greater risk of depigmentation.
The cause of the pigment changes is not fully understood but may be related either to the steroid or to the constituents of the vehicle in which the steroid is suspended.5
CHOOSING THE APPROPRIATE STEROID PREPARATION
Although soft tissue (fat) atrophy and local depigmentation are possible with any steroid preparation injected into soft tissue, the risk can be modulated by using a corticosteroid agent with appropriate solubility. A less soluble agent such as triamcinolone acetonide or hexacetonide is preferred for intra-articular injections of deep structures, such as the knee, elbow, or shoulder. A more soluble agent, such as betamethasone sodium phosphate and acetate or dexamethasone sodium phosphate, is preferred for soft tissue injections of bursae, tendon sheaths, metacarpophalangeal joints, proximal phalangeal joints, and the carpal tunnel.
OTHER POSSIBLE COMPLICATIONS
Other potential complications of corticosteroid injection include pain, bleeding, infection (risk 1 in 40,000), flushing, post-injection flare (< 1%), nerve damage, tendon weakening, and rarely, tendon rupture. In cases of tendonitis, it is very important to ensure that the drug is injected into the tendon sheath and not the tendon. A general rule for tendon sheath injection is to not inject if resistance is met.
PATIENT UNWILLING TO RECEIVE MORE INJECTIONS
This patient’s symptoms persist, with a painful right wrist, perhaps due to refractory de Quervain tenosynovitis, nerve damage, or tendinosis. In time, the tenosynovitis and atrophy may improve, but she is reluctant to receive any more injections, as she was not forewarned about the possibility of atrophy.
- Saunders S, Longworth S. Injection Techniques in Orthopaedics and Sports Medicine. 3rd ed. London: Elsevier; 2006.
- Cardone DA, Tallia AF. Joint and soft tissue injection. Am Fam Physician 2002; 66:283–288.
- Gray RG, Gottlieb NL. Intra-articular corticosteroids: an updated assessment. Clin Orthop Relat Res 1983; 177:235–263.
- Cassidy JT, Bole GG. Cutaneous atrophy secondary to intra-articular corticosteroid administration. Ann Intern Med 1966; 65:1008–1018.
- Newman RJ. Local skin depigmentation due to corticosteroid injection. Br Med J (Clin Res Ed) 1984; 288:1725–1726.
A 27-year-old woman presents with pain and tenderness over her right radial styloid. Examination reveals tenderness to palpation and a positive Finkelstein test, and her condition is diagnosed as de Quervain tenosynovitis. She is referred for occupational therapy and for a corticosteroid injection.
Q: On the basis of the skin findings, which corticosteroid injection was most likely used?
- Triamcinolone hexacetonide (Aristospan)
- Dexamethasone sodium phosphate (Decadron)
- Betamethasone sodium phosphate and betamethasone acetate (Celestone Soluspan)
- Triamcinolone acetonide (Kenalog-40)
A: Both triamcinolone hexacetonide and triamcinolone acetonide are correct, as they are the least soluble of the agents listed.
ADVERSE EFFECTS OF STEROID INJECTIONS
Soft tissue atrophy and local depigmentation are possible adverse effects of any steroid injection, particularly when given at a superficial site.1,2 Although these are rare, with an estimated risk of less than 1%, patients still need to be told about these potential side effects.3 In addition, these adverse effects of injection may be prevented by applying pressure with gauze over the injection site as the needle is withdrawn to prevent leakage of corticosteroid along the needle track.3
Soft tissue atrophy generally appears in 1 to 4 months and resolves 6 to 30 months later. 4 Patients with darker skin are at greater risk of depigmentation.
The cause of the pigment changes is not fully understood but may be related either to the steroid or to the constituents of the vehicle in which the steroid is suspended.5
CHOOSING THE APPROPRIATE STEROID PREPARATION
Although soft tissue (fat) atrophy and local depigmentation are possible with any steroid preparation injected into soft tissue, the risk can be modulated by using a corticosteroid agent with appropriate solubility. A less soluble agent such as triamcinolone acetonide or hexacetonide is preferred for intra-articular injections of deep structures, such as the knee, elbow, or shoulder. A more soluble agent, such as betamethasone sodium phosphate and acetate or dexamethasone sodium phosphate, is preferred for soft tissue injections of bursae, tendon sheaths, metacarpophalangeal joints, proximal phalangeal joints, and the carpal tunnel.
OTHER POSSIBLE COMPLICATIONS
Other potential complications of corticosteroid injection include pain, bleeding, infection (risk 1 in 40,000), flushing, post-injection flare (< 1%), nerve damage, tendon weakening, and rarely, tendon rupture. In cases of tendonitis, it is very important to ensure that the drug is injected into the tendon sheath and not the tendon. A general rule for tendon sheath injection is to not inject if resistance is met.
PATIENT UNWILLING TO RECEIVE MORE INJECTIONS
This patient’s symptoms persist, with a painful right wrist, perhaps due to refractory de Quervain tenosynovitis, nerve damage, or tendinosis. In time, the tenosynovitis and atrophy may improve, but she is reluctant to receive any more injections, as she was not forewarned about the possibility of atrophy.
- Saunders S, Longworth S. Injection Techniques in Orthopaedics and Sports Medicine. 3rd ed. London: Elsevier; 2006.
- Cardone DA, Tallia AF. Joint and soft tissue injection. Am Fam Physician 2002; 66:283–288.
- Gray RG, Gottlieb NL. Intra-articular corticosteroids: an updated assessment. Clin Orthop Relat Res 1983; 177:235–263.
- Cassidy JT, Bole GG. Cutaneous atrophy secondary to intra-articular corticosteroid administration. Ann Intern Med 1966; 65:1008–1018.
- Newman RJ. Local skin depigmentation due to corticosteroid injection. Br Med J (Clin Res Ed) 1984; 288:1725–1726.
Is telemetry overused? Is it as helpful as thought?
Telemetry—from the Greek words tele (remote) and metron (measure)—for cardiac monitoring was developed in the mid-1960s by Spacelabs Medical for use in spaceflight.1 The system was later adopted in hospitals to detect life-threatening arrhythmias.
Guidelines for the use of telemetry were published in 1991 by the American College of Cardiology (ACC)2 in response to concerns raised by its increasing use in noncritical care settings during the 30 years after its introduction to clinical medicine. The latest revision of the guidelines was published in 2004 by the American Heart Association (AHA).3
However, the guidelines are based largely on expert opinion and on research data in electrocardiography. Few clinical trials of telemetry have been published, and they were either retrospective or nonrandomized. In fact, there were no published randomized trials at the time the 2004 guidelines were written. Moreover, very few of these studies evaluated the impact of cardiac telemetry monitoring on physician management decisions.
We reviewed the literature to find out how cardiac telemetry is being used in clinical practice and how it might be used more selectively. The literature search was performed using Ovid MEDLINE (1996 to present) and PubMed Central using the key search terms “cardiac monitoring,” “telemetry monitoring,” “telemetry,” and “inpatient.” References from articles identified using Ovid MEDLINE (1996 to present) and PubMed Central that were relevant to our review were also included.
THREE CLASSES OF RISK
- Class II consists of patients for whom cardiac monitoring may be of benefit in some cases but is not essential for all (Table 2).
PATIENTS AT LOW RISK DO NOT BENEFIT
Telemetry monitoring has become an essential and commonly used clinical tool in most hospital systems. However, physicians do not seem to be using the risk stratification guidelines routinely or appropriately. The result is that many patients are being monitored needlessly, because telemetric monitoring neither affects how patients at low risk are managed nor improves their clinical outcomes.
Saleem et al4 reported that, of 105 patients at low risk who presented with chest pain and were admitted to a telemetry unit, none experienced a cardiac event or arrhythmia warranting changes in management while in the hospital.
Durairaj et al5 conducted a prospective cohort study of 1,033 patients admitted consecutively from an emergency department to an inpatient telemetry unit from July 1998 to January 1999. Patients were initially stratified according to a prediction model proposed by Goldman et al6 into groups at high, moderate, low, and very low risk. The risk groups were substratified according to the presence or absence of chest pain. The outcomes measured were transfer to an intensive care unit and a major cardiac complication, which included acute myocardial infarction, cardiac arrest, ventricular fibrillation, temporary pacemaker implantation, cardiogenic shock, emergency cardioversion, use of an intraaortic balloon assist device, intubation, and recurrent ischemic pain requiring coronary revascularization within 72 hours after admission or requiring cardiac catheterization followed by coronary revascularization before discharge from the hospital. The subgroup of patients who were classified as being at very low risk and who did not have chest pain (n = 318) did not experience any major cardiac complication.
Sivaram and colleagues7 studied the role of telemetric monitoring in the management of patients with class I, II, and III indications for telemetric monitoring outside of critical care units. The class was assigned at the time of discharge for the purpose of the study. A total of 297 telemetry events were noted during the study, but only 12 (4%) of the events led to changes in patient management: a change in medication in 8 patients, cardioversion for unstable atrial flutter in 1 patient, insertion of a pacemaker for sinus pause in 1, and electrophysiology studies in 2 patients.
Estrada et al8 examined the clinical outcomes of 2,240 patients admitted to a non-intensive care unit. The physicians perceived telemetric monitoring as helpful in 283 (12.6%) of the patients. However, data obtained from telemetry monitoring directly affected management decisions in only 156 patients (7% of the original study population). The researchers concluded that physicians may overestimate the role of telemetry in guiding patient management.
Hollander et al9 examined the outcomes of 261 patients admitted because of chest pain who had normal or nonspecific findings on electrocardiography on presentation. Only 4 patients (1.5%) experienced arrhythmias. The authors concluded that the policy of admitting patients at low risk to monitored beds should be reevaluated.
Snider et al10 showed that patients presenting with atypical chest pain and normal electrocardiographic findings were at low risk of arrhythmias and did not benefit from telemetric monitoring.
Schull and Redelmeier11 performed a 5-year observational study in which they reviewed all telemetry admissions (N = 8,932) to a tertiary care facility. Twenty patients experienced cardiac arrest during the study period, but telemetric monitoring was in use at the time in only 16 of the 20. Furthermore, the telemetry monitors signalled the onset of cardiac arrest in only 9 of these 16 patients. Three of the patients whose hearts stopped beating survived until discharge: two in whom telemetry actually signalled the onset of cardiac arrest and one in whom it did not.
TELEMETRY CAN GIVE FALSE-POSITIVE ALARMS
Inappropriate use of telemetric monitoring increases the chance of artifacts or false-positive rhythms being misinterpreted as dysrhythmias and can potentially lead to errors in management.
Cases have been reported of patients undergoing invasive procedures because of artifacts seen during telemetric monitoring. Knight et al12 described 12 patients who underwent unnecessary diagnostic or therapeutic interventions as a result of misdiagnosis of artifacts as ventricular tachycardia.
We did not discover in our review any data correlating the frequency of false-positive telemetric monitoring findings to management errors. On the other hand, it is also not possible to discern from these studies how often cardiac telemetric monitoring reaffirmed the clinical impression and facilitated ongoing therapy.
TELEMETRY IS EXPENSIVE
Telemetry requires specialized equipment and trained personnel, making it both costly and labor-intensive. The additional costs and cost-effectiveness of telemetry remain uncertain. Studies of its medical costs have found wide variations across different hospital systems. Sivaram et al,7 in an observational study published in 1998, estimated the cost per patient at $683. At our hospital, the current cost of telemetric monitoring is at least $1,400 per patient per 24 hours.
Whatever the true cost, inappropriate use of telemetry creates a financial burden on the health care system and adds to unnecessary costs incurred by patients.
POTENTIAL BARRIERS TO APPROPRIATE USE OF TELEMETRY
A number of factors contribute to the inappropriate use of telemetry. Possible causes for its overuse may be a lack of awareness of the ACC and AHA guidelines, nonadherence to the guidelines, or a combination of factors.
Even when physicians are aware of these guidelines, adherence may be suboptimal for a variety of reasons (reviewed by Mehta13). Adams et al14 revealed that most studies evaluating adherence were biased by overreporting, since the levels of adherence were self-reported.
OUR RECOMMENDATIONS
To improve on the appropriate use of telemetry, we recommend that several strategies be implemented.
Current guidelines for in-hospital cardiac monitoring need to be updated, particularly since the recommendations were based on evidence that is several decades old. Also, medical care has improved since the publication of the last guidelines, justifying an update in the guidelines.
Guidelines for cardiac monitoring should be incorporated into the curriculum for physician education to increase awareness of the guidelines. Hospitals should ensure that the emergency medicine staff is educated with regard to ensuring appropriateness of admissions to telemetry units.
Finally, the implementation of predictive models similar to that developed by Goldman et al6 and implemented in the study by Durairaj5 could help to ensure that cardiac telemetry is reserved for patients who will benefit from it the most.
- NASA Scientific and Technical Information (STI). Space-proven medical monitor: the total patient care package. Health and medicine. Originating technology/NASA contribution. Spinoff 2006. www.sti.nasa.gov/Textonly/tto/Spinoff2006/hm_2.html. Accessed 1/2009.
- Jaffe AS, Atkins JM, Field JM, et al. Recommended guidelines for in-hospital cardiac monitoring of adults for detection of arrhythmia. J Am Coll Cardiol 1991; 18:1431–1433.
- Drew BJ, Califf RM, Funk M, et al. Practice standards for electrocardiographic monitoring in hospital settings: an American Heart Association scientific statement from the Councils on Cardiovascular Nursing, Clinical Cardiology, and Cardiovascular Disease in the Young: endorsed by the International Society of Computerized Electrocardiology and the American Association of Critical-Care Nurses. Circulation 2004; 110:2721–2746.
- Saleem MA, McClung JA, Aronow WS, Kannam H. Inpatient telemetry does not need to be used in the management of older patients hospitalized with chest pain at low risk for in-hospital coronary events and mortality. J Gerontol A Biol Sci Med Sci 2005; 60:605–606.
- Durairaj L, Reilly B, Das K, et al. Emergency department admissions to inpatient cardiac telemetry beds: a prospective cohort study of risk stratification and outcomes. Am J Med 2001; 110:7–11.
- Goldman A, Cook EF, Johnson PA, et al. Prediction of the need for intensive care in patients who come to emergency departments with acute chest pain. N Engl J Med 1996; 334:1498–1504.
- Sivaram CA, Summers JH, Ahmed N. Telemetry outside critical care units: patterns of utilization and influence on management decisions. Clin Cardiol 1998; 21:503–505.
- Estrada CA, Rosman HS, Prasad NK, et al. Role of telemetry monitoring in the non-intensive care unit. Am J Cardiol 1995; 76:960–965.
- Hollander JE, Valentine SM, McCuskey CF, Brogan GX. Are monitored telemetry beds necessary for patients with nontraumatic chest pain and normal or nonspecific electrocardiograms? Am J Cardiol 1997; 79:1110–1111.
- Snider A, Papaleo M, Beldner S, et al. Is telemetry monitoring necessary in low-risk suspected acute chest pain syndromes? Chest 2002; 122:517–523.
- Schull MJ, Redelmeier DA. Continuous electrocardiographic monitoring and cardiac arrest outcomes in 8,932 telemetry ward patients. Acad Emerg Med 2000; 7:647–652.
- Knight BP, Pelosi F, Michaud GF, Strickberger SA, Morady F. Clinical consequences of electrocardiographic artifact mimicking ventricular tachycardia. N Engl J Med 1999; 341:1270–1274.
- Mehta NB. The doctors’ challenge: How can we follow guidelines better? Cleve Clin J Med 2004; 71:81–85.
- Adams AS, Soumerai SB, Lomas J, Ross-Degnan D. Evidence of self-reporting bias in assessing adherence to guidelines. Int J Quality Health Care 1999; 11:187–192.
Telemetry—from the Greek words tele (remote) and metron (measure)—for cardiac monitoring was developed in the mid-1960s by Spacelabs Medical for use in spaceflight.1 The system was later adopted in hospitals to detect life-threatening arrhythmias.
Guidelines for the use of telemetry were published in 1991 by the American College of Cardiology (ACC)2 in response to concerns raised by its increasing use in noncritical care settings during the 30 years after its introduction to clinical medicine. The latest revision of the guidelines was published in 2004 by the American Heart Association (AHA).3
However, the guidelines are based largely on expert opinion and on research data in electrocardiography. Few clinical trials of telemetry have been published, and they were either retrospective or nonrandomized. In fact, there were no published randomized trials at the time the 2004 guidelines were written. Moreover, very few of these studies evaluated the impact of cardiac telemetry monitoring on physician management decisions.
We reviewed the literature to find out how cardiac telemetry is being used in clinical practice and how it might be used more selectively. The literature search was performed using Ovid MEDLINE (1996 to present) and PubMed Central using the key search terms “cardiac monitoring,” “telemetry monitoring,” “telemetry,” and “inpatient.” References from articles identified using Ovid MEDLINE (1996 to present) and PubMed Central that were relevant to our review were also included.
THREE CLASSES OF RISK
- Class II consists of patients for whom cardiac monitoring may be of benefit in some cases but is not essential for all (Table 2).
PATIENTS AT LOW RISK DO NOT BENEFIT
Telemetry monitoring has become an essential and commonly used clinical tool in most hospital systems. However, physicians do not seem to be using the risk stratification guidelines routinely or appropriately. The result is that many patients are being monitored needlessly, because telemetric monitoring neither affects how patients at low risk are managed nor improves their clinical outcomes.
Saleem et al4 reported that, of 105 patients at low risk who presented with chest pain and were admitted to a telemetry unit, none experienced a cardiac event or arrhythmia warranting changes in management while in the hospital.
Durairaj et al5 conducted a prospective cohort study of 1,033 patients admitted consecutively from an emergency department to an inpatient telemetry unit from July 1998 to January 1999. Patients were initially stratified according to a prediction model proposed by Goldman et al6 into groups at high, moderate, low, and very low risk. The risk groups were substratified according to the presence or absence of chest pain. The outcomes measured were transfer to an intensive care unit and a major cardiac complication, which included acute myocardial infarction, cardiac arrest, ventricular fibrillation, temporary pacemaker implantation, cardiogenic shock, emergency cardioversion, use of an intraaortic balloon assist device, intubation, and recurrent ischemic pain requiring coronary revascularization within 72 hours after admission or requiring cardiac catheterization followed by coronary revascularization before discharge from the hospital. The subgroup of patients who were classified as being at very low risk and who did not have chest pain (n = 318) did not experience any major cardiac complication.
Sivaram and colleagues7 studied the role of telemetric monitoring in the management of patients with class I, II, and III indications for telemetric monitoring outside of critical care units. The class was assigned at the time of discharge for the purpose of the study. A total of 297 telemetry events were noted during the study, but only 12 (4%) of the events led to changes in patient management: a change in medication in 8 patients, cardioversion for unstable atrial flutter in 1 patient, insertion of a pacemaker for sinus pause in 1, and electrophysiology studies in 2 patients.
Estrada et al8 examined the clinical outcomes of 2,240 patients admitted to a non-intensive care unit. The physicians perceived telemetric monitoring as helpful in 283 (12.6%) of the patients. However, data obtained from telemetry monitoring directly affected management decisions in only 156 patients (7% of the original study population). The researchers concluded that physicians may overestimate the role of telemetry in guiding patient management.
Hollander et al9 examined the outcomes of 261 patients admitted because of chest pain who had normal or nonspecific findings on electrocardiography on presentation. Only 4 patients (1.5%) experienced arrhythmias. The authors concluded that the policy of admitting patients at low risk to monitored beds should be reevaluated.
Snider et al10 showed that patients presenting with atypical chest pain and normal electrocardiographic findings were at low risk of arrhythmias and did not benefit from telemetric monitoring.
Schull and Redelmeier11 performed a 5-year observational study in which they reviewed all telemetry admissions (N = 8,932) to a tertiary care facility. Twenty patients experienced cardiac arrest during the study period, but telemetric monitoring was in use at the time in only 16 of the 20. Furthermore, the telemetry monitors signalled the onset of cardiac arrest in only 9 of these 16 patients. Three of the patients whose hearts stopped beating survived until discharge: two in whom telemetry actually signalled the onset of cardiac arrest and one in whom it did not.
TELEMETRY CAN GIVE FALSE-POSITIVE ALARMS
Inappropriate use of telemetric monitoring increases the chance of artifacts or false-positive rhythms being misinterpreted as dysrhythmias and can potentially lead to errors in management.
Cases have been reported of patients undergoing invasive procedures because of artifacts seen during telemetric monitoring. Knight et al12 described 12 patients who underwent unnecessary diagnostic or therapeutic interventions as a result of misdiagnosis of artifacts as ventricular tachycardia.
We did not discover in our review any data correlating the frequency of false-positive telemetric monitoring findings to management errors. On the other hand, it is also not possible to discern from these studies how often cardiac telemetric monitoring reaffirmed the clinical impression and facilitated ongoing therapy.
TELEMETRY IS EXPENSIVE
Telemetry requires specialized equipment and trained personnel, making it both costly and labor-intensive. The additional costs and cost-effectiveness of telemetry remain uncertain. Studies of its medical costs have found wide variations across different hospital systems. Sivaram et al,7 in an observational study published in 1998, estimated the cost per patient at $683. At our hospital, the current cost of telemetric monitoring is at least $1,400 per patient per 24 hours.
Whatever the true cost, inappropriate use of telemetry creates a financial burden on the health care system and adds to unnecessary costs incurred by patients.
POTENTIAL BARRIERS TO APPROPRIATE USE OF TELEMETRY
A number of factors contribute to the inappropriate use of telemetry. Possible causes for its overuse may be a lack of awareness of the ACC and AHA guidelines, nonadherence to the guidelines, or a combination of factors.
Even when physicians are aware of these guidelines, adherence may be suboptimal for a variety of reasons (reviewed by Mehta13). Adams et al14 revealed that most studies evaluating adherence were biased by overreporting, since the levels of adherence were self-reported.
OUR RECOMMENDATIONS
To improve on the appropriate use of telemetry, we recommend that several strategies be implemented.
Current guidelines for in-hospital cardiac monitoring need to be updated, particularly since the recommendations were based on evidence that is several decades old. Also, medical care has improved since the publication of the last guidelines, justifying an update in the guidelines.
Guidelines for cardiac monitoring should be incorporated into the curriculum for physician education to increase awareness of the guidelines. Hospitals should ensure that the emergency medicine staff is educated with regard to ensuring appropriateness of admissions to telemetry units.
Finally, the implementation of predictive models similar to that developed by Goldman et al6 and implemented in the study by Durairaj5 could help to ensure that cardiac telemetry is reserved for patients who will benefit from it the most.
- NASA Scientific and Technical Information (STI). Space-proven medical monitor: the total patient care package. Health and medicine. Originating technology/NASA contribution. Spinoff 2006. www.sti.nasa.gov/Textonly/tto/Spinoff2006/hm_2.html. Accessed 1/2009.
- Jaffe AS, Atkins JM, Field JM, et al. Recommended guidelines for in-hospital cardiac monitoring of adults for detection of arrhythmia. J Am Coll Cardiol 1991; 18:1431–1433.
- Drew BJ, Califf RM, Funk M, et al. Practice standards for electrocardiographic monitoring in hospital settings: an American Heart Association scientific statement from the Councils on Cardiovascular Nursing, Clinical Cardiology, and Cardiovascular Disease in the Young: endorsed by the International Society of Computerized Electrocardiology and the American Association of Critical-Care Nurses. Circulation 2004; 110:2721–2746.
- Saleem MA, McClung JA, Aronow WS, Kannam H. Inpatient telemetry does not need to be used in the management of older patients hospitalized with chest pain at low risk for in-hospital coronary events and mortality. J Gerontol A Biol Sci Med Sci 2005; 60:605–606.
- Durairaj L, Reilly B, Das K, et al. Emergency department admissions to inpatient cardiac telemetry beds: a prospective cohort study of risk stratification and outcomes. Am J Med 2001; 110:7–11.
- Goldman A, Cook EF, Johnson PA, et al. Prediction of the need for intensive care in patients who come to emergency departments with acute chest pain. N Engl J Med 1996; 334:1498–1504.
- Sivaram CA, Summers JH, Ahmed N. Telemetry outside critical care units: patterns of utilization and influence on management decisions. Clin Cardiol 1998; 21:503–505.
- Estrada CA, Rosman HS, Prasad NK, et al. Role of telemetry monitoring in the non-intensive care unit. Am J Cardiol 1995; 76:960–965.
- Hollander JE, Valentine SM, McCuskey CF, Brogan GX. Are monitored telemetry beds necessary for patients with nontraumatic chest pain and normal or nonspecific electrocardiograms? Am J Cardiol 1997; 79:1110–1111.
- Snider A, Papaleo M, Beldner S, et al. Is telemetry monitoring necessary in low-risk suspected acute chest pain syndromes? Chest 2002; 122:517–523.
- Schull MJ, Redelmeier DA. Continuous electrocardiographic monitoring and cardiac arrest outcomes in 8,932 telemetry ward patients. Acad Emerg Med 2000; 7:647–652.
- Knight BP, Pelosi F, Michaud GF, Strickberger SA, Morady F. Clinical consequences of electrocardiographic artifact mimicking ventricular tachycardia. N Engl J Med 1999; 341:1270–1274.
- Mehta NB. The doctors’ challenge: How can we follow guidelines better? Cleve Clin J Med 2004; 71:81–85.
- Adams AS, Soumerai SB, Lomas J, Ross-Degnan D. Evidence of self-reporting bias in assessing adherence to guidelines. Int J Quality Health Care 1999; 11:187–192.
KEY POINTS
- Guidelines from the American College of Cardiology (1991) and American Heart Association (2004) divide patients into three risk classes for whom telemetry is, may be, or is not indicated.
- Few studies have addressed whether telemetry is beneficial in clinical practice.
- The available evidence suggests that telemetry infrequently influences physician management decisions for patients at low risk, although it may in a relatively small subset at high risk.
- Inappropriate use of telemetry is associated with unnecessary testing and treatment and higher cost of care.
- Better risk-assessment and selection strategies are needed to identify patients for whom telemetry monitoring will be most beneficial.
A 72-year-old man with a purpuric rash
A 72-year-old man whose medical history includes diabetes mellitus, hypertension, coronary artery disease, aortic valve replacement, atrial fibrillation, and chronic obstructive pulmonary disease was in his usual state of health until 2 weeks ago, when he developed a purpuric rash on his legs. His physician started him on prednisone 40 mg daily for the rash; however, 1 week later he presented to a hospital emergency room when his family found him confused and diaphoretic.
In the emergency room, he was found to be hypoglycemic, with a serum glucose level of 40 mg/dL, which was promptly treated. His mental status improved partially. In the hospital, the rash worsened and progressed upwards to his trunk and upper extremities. He was transferred to our institution for further workup and management.
A review of systems reveals occasional epistaxis in the summer, recent fatigue, cough, and shortness of breath on exertion. His medications at the time of transfer include warfarin (Coumadin), amlodipine (Norvasc), insulin, ipratropium and albuterol (Combivent) inhalers, and prednisone 40 mg daily. He has not undergone surgery recently.
PHYSICAL EXAMINATION
He is alert and oriented to person but not to time and place.
Vital signs. Oral temperature 101.1°F (38.4°C), pulse rate 108, blood pressure 108/79 mm/Hg, respiratory rate 22, oxygen saturation 93% by pulse oximetry on room air, weight 94 kg (207 lb).
Head, eyes, ears, nose, and throat. No pallor or icterus, pupils are equally reactive, nasal mucosa not inflamed or ulcerated, mucous membranes moist, no sinus tenderness.
Neck. No jugular venous distention and no cervical lymphadenopathy.
Cardiovascular. Tachycardia, irregularly irregular rhythm, prosthetic valve sounds, no murmurs, rubs, or gallops.
Respiratory. Bibasal crackles (right side more than the left). No wheezing.
Abdomen. Soft, nontender, nondistended, no palpable organomegaly, bowel sounds normal.
Extremities. No edema, good peripheral pulses.

Neurologic. No focal deficits noted.
Lymphatic. No enlarged lymph nodes.
Musculoskeletal. Traumatic right second distal interphalangeal amputation. Otherwise, no joint abnormality or restriction of movement.
Initial laboratory values:
- White blood cell count 15.78 × 10⁹/L (normal 4.5–11.0)
- Absolute neutrophil count 13.3 × 10⁹/L (4.0–11.0)
- Hemoglobin 13.3 g/dL (13.5–17.5)
- Platelet count 133 × 109/L (150–400)
- International normalized ratio (INR) 1.8
- Sodium 136 mmol/L (135–146)
- Potassium 4.6 mmol/L (3.5–5.0)
- Blood urea nitrogen 31 mg/dL (10–25)
- Creatinine 1.6 mg/dL (0.70–1.40)
- Glucose 62 mg/dL (65–100)
- Bicarbonate 23 mmol/L (23–32)
- Albumin 2.5 g/dL (3.5–5.0)
- Total protein 4.6 g/dL (6.0–8.4)
- Bilirubin 1.2 mg/dL (0.0–1.5)
- Aspartate aminotransferase 41 U/L (7–40)
- Alanine aminotransferase 74 U/L (5–50)
- Alkaline phosphatase 55 U/L (40–150)
- C-reactive protein 9.9 mg/dL (0.0–1.0).
Other studies
Electrocardiography shows atrial fibrillation and left ventricular hypertrophy, but no acute changes.
Computed tomography (CT) of the head shows no evidence of hemorrhage or infarction.
Blood cultures are sent at the time of hospital admission.
WHICH TEST IS NEXT?
1. Which is the most appropriate next step for this patient?
- Urinalysis
- CT of the chest
- Echocardiography
- Skin biopsy
The rash in Figure 1 is palpable purpura, which strongly suggests small-vessel cutaneous vasculitis, a condition that can occur in a broad range of settings. An underlying cause is identified in over 70% of cases. Cutaneous vasculitis may herald a primary small-vessel systemic vasculitis such as Wegener granulomatosis, microscopic polyangiitis, or Henoch-Schönlein purpura. It can also be secondary to a spectrum of underlying triggers or diseases that include medications, infections, malignancies such as lymphoproliferative disorders, cryoglobulinemia secondary to hepatitis C viral infection, and connective tissue diseases such as rheumatoid arthritis and systemic lupus erythematosus.
Infective endocarditis is associated with a secondary form of vasculitis and is a strong possibility in this patient, who has a prosthetic aortic valve, fever, and a high white blood cell count.
Thrombocytopenia should also prompt an assessment for any drugs the patient is taking that affect platelet function. However, thrombocytopenia typically results in nonpalpable purpura.
Idiopathic isolated cutaneous vasculitis, in which no underlying cause for the cutaneous vasculitis can be identified, is the diagnosis in less than 30% of cases.
A vasculitic disease process can involve multiple sites, which may be asymptomatic on presentation. Identifying these sites is important, not only to establish the diagnosis, but also to detect potentially life-threatening complications early.
Thus, in this patient, urinalysis should be done promptly to check for active sediment consisting of red cell casts, which would suggest renal involvement (glomerulonephritis). Also, a rising blood pressure and creatinine would point to renal involvement and warrant more aggressive initial therapy.
Chest radiography should be done to rule out pulmonary infiltrates, septic emboli, nodules, or cavities that could represent vasculitic or infectious involvement of the lungs. CT of the chest may be needed to further characterize abnormalities on chest radiography.
Echocardiography should certainly be pursued as part of the workup for endocarditis, but urinalysis is of the utmost importance in this patient at this point.
More diagnostic information is needed before considering skin biopsy.
Clues from the urinalysis and chest radiography
Our patient’s sedimentation rate is 24 mm/hour. The urinalysis is strongly positive for blood and a moderate amount of protein but negative for leukocyte esterase and nitrite. The urine sediment contains numerous red blood cell casts and 6 to 10 white blood cells per high-power field.
Pending return of blood cultures, ceftriaxone (Rocephin) and azithromycin (Zithromax) are started to treat possible community-acquired pneumonia. Vancomycin (Vancocin) is empirically added, given the possibility of prosthetic valve endocarditis. Gram stain on blood cultures shows gram-positive cocci.
Ground-glass attenuation implies focal or diffuse opacification of the lung that does not obscure the vascular structures, is not associated with air bronchograms, and appears as a “veil” across the lung parenchyma.1 It can be seen in acute diseases such as infection (including pneumonia from atypical bacteria, viruses, acid-fast bacilli, and Pneumocystis jiroveci), pulmonary hemorrhage of any cause, acute viral, eosinophilic, and interstitial pneumonias, and hypersensitivity pneumonitis. It can also be seen in chronic disease states such as interstitial lung disease, bronchoalveolar carcinoma, alveolar proteinosis, and sarcoidosis.
WHICH TEST WOULD NOT HELP?
2. Which of the following tests is least likely to help in the diagnostic evaluation at this point?
- Transthoracic echocardiography
- Transesophageal echocardiography
- Bronchoscopy
- Cystoscopy
In this case, the least likely to help is cystoscopy.
This patient’s vasculitic-appearing rash, ground-glass pulmonary infiltrates, and impaired renal function with red cell casts suggest a pulmonary-renal syndrome, and with this constellation of features, a systemic vasculitis is very likely. Therefore, the focus of the evaluation should be on any evidence to support a diagnosis of vasculitis, as well as other possible causes.
In a patient with diabetes, an artificial heart valve, and fever, the possibility of infection, especially endocarditis, remains high. Transthoracic echocardiography is warranted, and if it is negative for vegetations, transesophageal echocardiography would be a reasonable next option.
Bronchoscopy is warranted to determine if the infiltrates represent pulmonary hemorrhage, which can be seen in certain types of vasculitic and systemic disorders.
The finding of red cell casts in the urine indicates glomerulonephritis, and therefore the kidneys are the likely source of the urinary red blood cells, making cystoscopy of no utility in this current, acute setting.
Case continued: His condition worsens
Transthoracic echocardiography reveals a well-seated mechanical prosthetic aortic valve, trivial aortic regurgitation, a peak gradient of 23 mm Hg and a mean gradient of 12 mm Hg (normal values for his prosthetic valve), and no valvular vegetations. Transesophageal echocardiography confirms the absence of vegetations.
His oxygen requirement increases, and analysis of arterial blood gases reveals a pH of 7.37, Pco2 49 mm Hg (normal range 35–45), Po2 102 mm Hg (normal 80–100), and bicarbonate 28 mmol/L while breathing 100% supplemental oxygen by a nonrebreather face mask. He is taken to the medical intensive care unit for intubation and mechanical ventilation. Bronchoscopy performed while he is intubated confirms diffuse alveolar hemorrhage. Pulse intravenous methylprednisolone (Solu-Medrol) therapy is started.
DIFFUSE ALVEOLAR HEMORRHAGE
3. Which of the following is not true about diffuse alveolar hemorrhage?
- Its onset is usually abrupt or of short duration
- It is always associated with hemoptysis
- Radiography most commonly shows new patchy or diffuse alveolar opacities
- Pulmonary function testing shows increased diffusing capacity of the lung for carbon monoxide (Dlco)
Hemoptysis is absent at presentation in as many as 33% of patients.
The onset of diffuse alveolar hemorrhage is usually abrupt or of short duration, with initial symptoms of cough, fever, and dyspnea. Some patients, such as ours, can present with severe acute respiratory distress syndrome requiring mechanical ventilation. Radiography most often shows new patchy alveolar opacities, and CT may reveal a ground-glass appearance. On pulmonary function testing, the Dlco is high, owing to the hemoglobin within the alveoli.
ACUTE GLOMERULONEPHRITIS PLUS PULMONARY HEMORRHAGE EQUALS…?
4. Which disease could have manifestations consistent with acute glomerulonephritis and pulmonary hemorrhage?
- Antiglomerular basement membrane disease
- Wegener granulomatosis
- Microscopic polyangiitis
- Systemic lupus erythematosus
All of these are possible.
The combined presentation of acute glomerulonephritis and pulmonary hemorrhage (also called pulmonary-renal syndrome) is usually seen in antiglomerular basement membrane disease (Goodpasture syndrome) and small-vessel systemic vasculitides such as Wegener granulomatosis and microscopic polyangiitis.2,3 It can also be seen in patients with systemic lupus erythematosus.
Antiglomerular basement membrane disease
In antiglomerular basement membrane disease, circulating antibodies are directed towards an antigen intrinsic to the glomerular basement membrane, typically leading to acute glomerulonephritis associated with crescent formation. It may present as acute renal failure in which urinalysis shows proteinuria with sediment characterized by red cell casts. Pulmonary involvement, usually alveolar hemorrhage, is present in approximately 60% to 70% of cases.
The diagnosis requires demonstration of antiglomerular basement membrane antibodies in either the serum or the kidney. Renal biopsy is usually recommended because the accuracy of serum assays is variable.
A key histologic feature of the renal lesion in antiglomerular basement membrane disease is crescentic glomerulonephritis in which immunofluorescence microscopy demonstrates the virtually pathognomonic finding of linear deposition of immunoglobulin G along the glomerular capillaries.
The treatment of choice for antiglomerular basement membrane disease is plasmapheresis and immunosuppression with a combination of glucocorticoids and cyclophosphamide (Cytoxan). If the disease is high on the differential diagnosis, empiric plasmapheresis should be started while waiting for diagnostic studies, because the prognosis of untreated glomerulonephritis is poor.
Wegener granulomatosis
Wegener granulomatosis is a systemic vasculitis of the medium and small arteries, arterioles, and venules that classically involves the upper and lower respiratory tracts and the kidneys. Patients may present with persistent rhinorrhea and epistaxis, cough with chest radiographs showing nodules, fixed infiltrates, or cavities, and abnormal urinary sediment with microscopic hematuria with or without red cell casts.
From 75% to 90% of patients with active Wegener granulomatosis are positive for antineutrophil cytoplasmic antibody (ANCA). In 60% to 80% of cases, ANCA is directed against proteinase 3 (PR3), which produces a cytoplasmic standing pattern by immunofluorescence (cANCA), while 5% to 20% have ANCA directed against myeloper-oxidase, which produces a perinuclear staining pattern (pANCA). A small number of patients with Wegener granulomatosis are ANCA-negative.
The diagnosis is usually confirmed by tissue biopsy at the site of active disease, which shows necrotizing vasculitis with granulomatous inflammation. The renal lesion is typically that of a focal, segmental, necrotizing glomerulonephritis that has few to no immune complexes (pauci-immune glomerulonephritis).
The treatment of severe disease involves a combination of cyclophosphamide and glucocorticoids initially to achieve remission followed by maintenance therapy with methotrexate or azathioprine (Imuran).
Microscopic polyangiitis
Microscopic polyangiitis is a systemic vasculitis of the capillaries, venules, and arterioles, with little or no immune complex deposition. Nearly all patients have renal involvement, and 10% to 30% have lung involvement. In those with lung involvement, diffuse alveolar hemorrhage is the most common manifestation.
On histopathologic study, microscopic polyangiitis differs from Wegener granulomatosis in that it does not have granuloma formation. However, the renal lesion is that of a pauci-immune glomerulonephritis and is identical to that seen in Wegener granulomatosis. From 70% to 85% of patients with microscopic polyangiitis are ANCA-positive, and most of these have pANCA.
The management of active severe microscopic polyangiitis is identical to that of Wegener granulomatosis.
Systemic lupus erythematosus
Systemic lupus erythematosus is an autoimmune disease characterized by tissue-binding autoantibody and immune-complex-mediated organ damage. It can involve multiple organ systems, and the diagnosis is based on characteristic clinical features and autoantibodies. The sensitivity of antinuclear antibody for lupus is close to 100%, which makes it a good screening tool. Antibodies to dsDNA and Smith antigen have high specificity for lupus.
About 75% of patients have renal involvement at some point in their disease course. The different types of renal disease in systemic lupus are usually differentiated with a renal biopsy, with immune-complex-mediated glomerular diseases being the most common.
The most common pulmonary manifestation is pleuritis with or without pleural effusion. Life-threatening pulmonary manifestations include pulmonary hemorrhage and interstitial inflammation leading to fibrosis.
Lupus has great clinical variability and the treatment approach is based on the organ manifestations, disease activity, and severity.
CASE CONTINUED: ARRIVING AT THE DIAGNOSIS
We start our patient on cyclophosphamide 175 mg daily in view of possible Wegener granulomatosis.
Even though purpura is extremely rare in primary antiglomerular basement membrane disease, this patient has life-threatening pulmonary hemorrhage, a complication seen in over 50% of these patients. Therefore, plasmapheresis is started empirically.
On the second day of cyclophosphamide treatment, tests for ANCA, glomerular basement membrane antibody, and antinuclear antibody are reported as negative, and complement levels are normal. Bronchoalveolar lavage shows no infection. Follow-up blood cultures are negative.
To summarize the findings so far, this patient has a purpuric skin rash, active urine sediment with red cell casts indicating glomerulonephritis, acute renal failure, and severe pulmonary hemorrhage requiring mechanical ventilation. Although one set of blood cultures showed gram-positive cocci, no source of infection, particularly endocarditis, could be identified.
Antiglomerular basement membrane disease would still be high on the list of suspected diagnoses, given his diffuse alveolar hemorrhage. As mentioned earlier, renal biopsy is imperative to making a diagnosis, because serologic tests have variable accuracy. And making the correct diagnosis has therapeutic implications.
Renal biopsy is performed and shows immune-complex mesangiopathic glomerulonephritis with positive immunofluorescent staining in the mesangium for IgA. Only one glomerulus shows fibrinoid necrosis.
Skin biopsy results obtained earlier showed positive direct immunofluorescence for IgA. Both renal and skin biopsies suggested Henoch-Schönlein purpura.
IgA deposition in the kidney and skin has been associated with liver cirrhosis, celiac disease, and infections with agents such as human immunodeficiency virus, cytomegalovirus, Haemophilus parainfluenzae, and Staphylococcus aureus. In a Japanese study,4 renal biopsy specimens from 116 patients with IgA nephropathy and from 122 patients with other types of kidney disease were examined for the presence of S aureus antigen in the glomeruli. Although antigen was not detected in non-IgA disease, 68% of specimens from patients with IgA nephropathy had S aureus cell envelope antigen together with IgA antibody in the glomeruli. However, no single antigen has been consistently identified, so it seems more probable that the development of IgA deposition in kidneys is a consequence of aberrant IgA immune response rather than the antigen itself.
HENOCH-SCHÖNLEIN PURPURA
Henoch-Schönlein purpura is a systemic vasculitis with a prominent cutaneous component. It is characterized by the tissue deposition of IgA-containing immune complexes. It is predominantly a disease of children but it can be seen in adults. A UK study found the prevalence to be 20 per 100,000 children, with the highest prevalence between ages 4 and 7 (70 per 100,000).5
The four cardinal clinical features of Henoch-Schönlein purpura are purpuric rash, abdominal pain, arthralgia, and renal involvement. Almost all patients have purpuric rash at some point in their disease course. Arthralgia with or without arthritis is typically migratory, oligoarticular, and nondeforming, usually affecting the large joints of the lower extremities; involvement of the upper extremities is less common.
Skin biopsy typically shows leukocytoclastic vasculitis in postcapillary venules with IgA deposition, and these findings are pathognomonic of Henoch-Schönlein purpura.
Gastrointestinal involvement can range from mild symptoms such as nausea, vomiting, abdominal pain, and paralytic ileus to severe disease such as gastrointestinal hemorrhage, bowel infarction, bowel perforation, and intussusception.
Renal involvement is common and is important, as it can in rare cases progress to end-stage renal disease. The urinalysis usually shows mild proteinuria with active sediment with red cell casts. Most patients have relatively mild disease, characterized by asymptomatic hematuria with a normal or slightly elevated creatinine. However, severe involvement may occur, with nephrotic syndrome, hypertension, and acute renal failure.
Different presentation in adults vs children
Adults with Henoch-Schönlein purpura only rarely present with bowel intussusception, whereas some studies have found that adults are more likely than children to develop significant renal involvement, including end-stage renal disease.6,7
There is a general but not absolute correlation between the severity of clinical manifestations and the findings on renal biopsy. A poor prognosis (significant proteinuria, hypertension, renal insufficiency, or end-stage renal disease) is associated with crescent formation involving more than 50% of the glomeruli.8
Our current understanding of the longterm outcome of the renal disease in Henoch-Schönlein purpura is primarily derived from studies in children. In one study, complete recovery occurred in 94% of children and 89% of adults.7 A long-term study of 250 adults with Henoch-Schönlein purpura and renal involvement of sufficient severity to require biopsy reported that, at a median follow up of 15 years, 11% had become dialysis-dependent and 13% had severe renal failure (creatinine clearance < 30 mL/min).6 Recurrence is common, occurring in approximately one-third of patients, more likely in those with nephritis.8
The diagnosis of Henoch-Schönlein purpura is typically made on the basis of key clinical features. In patients such as ours who have an atypical presentation, biopsy of affected skin and renal biopsy can be essential in the diagnosis. Diffuse alveolar hemorrhage is exceedingly rare in Henoch-Schönlein purpura but can be seen, as in our patient.9,10 In this setting, the findings of IgA deposits in skin and renal biopsy specimens, together with the absence of other clinical, serologic, or histologic features of other more-common potential causes, secured the diagnosis in this patient.
Henoch-Schönlein purpura is usually self-limited and requires no specific therapy. Evidence suggests that glucocorticoids enhance the rate of resolution of the arthritis and abdominal pain but do not appear to prevent recurrent disease or lessen the likelihood of progression of renal disease.8 Patients with severe renal involvement with renal function impairment may benefit from pulse intravenous corticosteroid therapy (methylprednisolone 250–1,000 mg per day for 3 days), followed by oral steroids for 3 months.11
In anecdotal reports, renal function improved in 19 of 21 children with Henoch-Schönlein purpura and severe crescentic nephritis.12 Studies have evaluated cyclophosphamide13 and plasmapheresis,14 but their role remains uncertain. Renal transplantation is an option in patients who progress to end-stage renal disease.
OUR CASE CONTINUED
In our patient, plasmapheresis was discontinued. As the pulmonary hemorrhage had developed during treatment with prednisone, we decided to continue cyclophosphamide, given the life-threatening nature of his disease. His pulmonary status improved and he was extubated.
During his initial hospital stay, he was taking heparin for anticoagulation therapy. However, given the life-threatening diffuse alveolar hemorrhage, heparin was stopped during the course of his stay in the intensive care unit. Once he was stable and was transferred out of the intensive care unit, heparin was resumed, and his anticoagulation therapy was bridged to warfarin just before discharge. He was eventually discharged on a tapering dose of oral prednisone and cyclophosphamide for 3 months, after which he was switched to azathioprine for maintenance therapy. He was doing well 6 months later, with a serum creatinine level of 1.6 mg/dL, no red cell casts in the urine, and no rash.
TAKE-HOME POINT
In any case of suspected vasculitis that presents with skin disease, it is essential to look for other sites with potentially life-threatening involvement. Henoch-Schönlein purpura is a systemic vasculitis with a prominent cutaneous component. It is not always benign and can be associated with serious complications such as renal failure, gastrointestinal events, and, very rarely, diffuse alveolar hemorrhage.
- Collins J, Stern EJ. Ground-glass opacity at CT: the ABCs. AJR Am J Roentgenol 1997; 169:355–367.
- Boyce NW, Holdsworth SR. Pulmonary manifestations of the clinical syndrome of acute glomerulonephritis and lung hemorrhage. Am J Kidney Dis 1986; 8:31–36.
- Gallagher H, Kwan JT, Jayne DR. Pulmonary renal syndrome: a 4-year, single-center experience. Am J Kidney Dis 2002; 39:42–47.
- Koyama A, Sharmin S, Sakurai H, et al. Staphylococcus aureus cell envelope antigen is a new candidate for the induction of IgA nephropathy. Kidney Int 2004; 66:121–132.
- Gardner-Medwin JM, Dolezalova P, Cummins C, Southwood TR. Incidence of Henoch-Schönlein purpura, Kawasaki disease, and rare vasculitides in children of different ethnic origins. Lancet 2002; 360:1197–1202.
- Pillebout E, Thervet E, Hill G, Alberti C, Vanhille P, Nochy D. Henoch-Schönlein purpura in adults: outcome and prognostic factors. J Am Soc Nephrol 2002; 13:1271–1278.
- Blanco R, Martinez-Taboada VM, Rodriguez-Valverde V, Garcia-Fuentes M, Gonzalez-Gay MA. Henoch-Schönlein purpura in adulthood and childhood: two different expressions of the same syndrome. Arthritis Rheum 1997; 40:859–864.
- Saulsbury FT. Henoch-Schönlein purpura in children. Report of 100 patients and review of the literature. Medicine (Baltimore) 1999; 78:395–409.
- Nadrous HF, Yu AC, Specks U, Ryu JH. Pulmonary involvement in Henoch-Schönlein purpura. Mayo Clin Proc 2004; 79:1151–1157.
- Vats KR, Vats A, Kim Y, Dassenko D, Sinaiko AR. Henoch-Schönlein purpura and pulmonary hemorrhage: a report and literature review. Pediatr Nephrol 1999; 13:530–534.
- Niaudet P, Habib R. Methylprednisolone pulse therapy in the treatment of severe forms of Schönlein-Henoch purpura nephritis. Pediatr Nephrol 1998; 12:238–243.
- Bergstein J, Leiser J, Andreoli SP. Response of crescentic Henoch-Schöenlein purpura nephritis to corticosteroid and azathioprine therapy. Clin Nephrol 1998; 49:9–14.
- Tarshish P, Bernstein J, Edelmann CM. Henoch-Schönlein purpura nephritis: course of disease and efficacy of cyclophosphamide. Pediatr Nephrol 2004; 19:51–56.
- Hattori M, Ito K, Konomoto T, Kawaguchi H, Yoshioka T, Khono M. Plasmapheresis as the sole therapy for rapidly progressive Henoch-Schönlein purpura nephritis in children. Am J Kidney Dis 1999; 33:427–433.
A 72-year-old man whose medical history includes diabetes mellitus, hypertension, coronary artery disease, aortic valve replacement, atrial fibrillation, and chronic obstructive pulmonary disease was in his usual state of health until 2 weeks ago, when he developed a purpuric rash on his legs. His physician started him on prednisone 40 mg daily for the rash; however, 1 week later he presented to a hospital emergency room when his family found him confused and diaphoretic.
In the emergency room, he was found to be hypoglycemic, with a serum glucose level of 40 mg/dL, which was promptly treated. His mental status improved partially. In the hospital, the rash worsened and progressed upwards to his trunk and upper extremities. He was transferred to our institution for further workup and management.
A review of systems reveals occasional epistaxis in the summer, recent fatigue, cough, and shortness of breath on exertion. His medications at the time of transfer include warfarin (Coumadin), amlodipine (Norvasc), insulin, ipratropium and albuterol (Combivent) inhalers, and prednisone 40 mg daily. He has not undergone surgery recently.
PHYSICAL EXAMINATION
He is alert and oriented to person but not to time and place.
Vital signs. Oral temperature 101.1°F (38.4°C), pulse rate 108, blood pressure 108/79 mm/Hg, respiratory rate 22, oxygen saturation 93% by pulse oximetry on room air, weight 94 kg (207 lb).
Head, eyes, ears, nose, and throat. No pallor or icterus, pupils are equally reactive, nasal mucosa not inflamed or ulcerated, mucous membranes moist, no sinus tenderness.
Neck. No jugular venous distention and no cervical lymphadenopathy.
Cardiovascular. Tachycardia, irregularly irregular rhythm, prosthetic valve sounds, no murmurs, rubs, or gallops.
Respiratory. Bibasal crackles (right side more than the left). No wheezing.
Abdomen. Soft, nontender, nondistended, no palpable organomegaly, bowel sounds normal.
Extremities. No edema, good peripheral pulses.
Neurologic. No focal deficits noted.
Lymphatic. No enlarged lymph nodes.
Musculoskeletal. Traumatic right second distal interphalangeal amputation. Otherwise, no joint abnormality or restriction of movement.
Initial laboratory values:
- White blood cell count 15.78 × 10⁹/L (normal 4.5–11.0)
- Absolute neutrophil count 13.3 × 10⁹/L (4.0–11.0)
- Hemoglobin 13.3 g/dL (13.5–17.5)
- Platelet count 133 × 109/L (150–400)
- International normalized ratio (INR) 1.8
- Sodium 136 mmol/L (135–146)
- Potassium 4.6 mmol/L (3.5–5.0)
- Blood urea nitrogen 31 mg/dL (10–25)
- Creatinine 1.6 mg/dL (0.70–1.40)
- Glucose 62 mg/dL (65–100)
- Bicarbonate 23 mmol/L (23–32)
- Albumin 2.5 g/dL (3.5–5.0)
- Total protein 4.6 g/dL (6.0–8.4)
- Bilirubin 1.2 mg/dL (0.0–1.5)
- Aspartate aminotransferase 41 U/L (7–40)
- Alanine aminotransferase 74 U/L (5–50)
- Alkaline phosphatase 55 U/L (40–150)
- C-reactive protein 9.9 mg/dL (0.0–1.0).
Other studies
Electrocardiography shows atrial fibrillation and left ventricular hypertrophy, but no acute changes.
Computed tomography (CT) of the head shows no evidence of hemorrhage or infarction.
Blood cultures are sent at the time of hospital admission.
WHICH TEST IS NEXT?
1. Which is the most appropriate next step for this patient?
- Urinalysis
- CT of the chest
- Echocardiography
- Skin biopsy
The rash in Figure 1 is palpable purpura, which strongly suggests small-vessel cutaneous vasculitis, a condition that can occur in a broad range of settings. An underlying cause is identified in over 70% of cases. Cutaneous vasculitis may herald a primary small-vessel systemic vasculitis such as Wegener granulomatosis, microscopic polyangiitis, or Henoch-Schönlein purpura. It can also be secondary to a spectrum of underlying triggers or diseases that include medications, infections, malignancies such as lymphoproliferative disorders, cryoglobulinemia secondary to hepatitis C viral infection, and connective tissue diseases such as rheumatoid arthritis and systemic lupus erythematosus.
Infective endocarditis is associated with a secondary form of vasculitis and is a strong possibility in this patient, who has a prosthetic aortic valve, fever, and a high white blood cell count.
Thrombocytopenia should also prompt an assessment for any drugs the patient is taking that affect platelet function. However, thrombocytopenia typically results in nonpalpable purpura.
Idiopathic isolated cutaneous vasculitis, in which no underlying cause for the cutaneous vasculitis can be identified, is the diagnosis in less than 30% of cases.
A vasculitic disease process can involve multiple sites, which may be asymptomatic on presentation. Identifying these sites is important, not only to establish the diagnosis, but also to detect potentially life-threatening complications early.
Thus, in this patient, urinalysis should be done promptly to check for active sediment consisting of red cell casts, which would suggest renal involvement (glomerulonephritis). Also, a rising blood pressure and creatinine would point to renal involvement and warrant more aggressive initial therapy.
Chest radiography should be done to rule out pulmonary infiltrates, septic emboli, nodules, or cavities that could represent vasculitic or infectious involvement of the lungs. CT of the chest may be needed to further characterize abnormalities on chest radiography.
Echocardiography should certainly be pursued as part of the workup for endocarditis, but urinalysis is of the utmost importance in this patient at this point.
More diagnostic information is needed before considering skin biopsy.
Clues from the urinalysis and chest radiography
Our patient’s sedimentation rate is 24 mm/hour. The urinalysis is strongly positive for blood and a moderate amount of protein but negative for leukocyte esterase and nitrite. The urine sediment contains numerous red blood cell casts and 6 to 10 white blood cells per high-power field.
Pending return of blood cultures, ceftriaxone (Rocephin) and azithromycin (Zithromax) are started to treat possible community-acquired pneumonia. Vancomycin (Vancocin) is empirically added, given the possibility of prosthetic valve endocarditis. Gram stain on blood cultures shows gram-positive cocci.
Ground-glass attenuation implies focal or diffuse opacification of the lung that does not obscure the vascular structures, is not associated with air bronchograms, and appears as a “veil” across the lung parenchyma.1 It can be seen in acute diseases such as infection (including pneumonia from atypical bacteria, viruses, acid-fast bacilli, and Pneumocystis jiroveci), pulmonary hemorrhage of any cause, acute viral, eosinophilic, and interstitial pneumonias, and hypersensitivity pneumonitis. It can also be seen in chronic disease states such as interstitial lung disease, bronchoalveolar carcinoma, alveolar proteinosis, and sarcoidosis.
WHICH TEST WOULD NOT HELP?
2. Which of the following tests is least likely to help in the diagnostic evaluation at this point?
- Transthoracic echocardiography
- Transesophageal echocardiography
- Bronchoscopy
- Cystoscopy
In this case, the least likely to help is cystoscopy.
This patient’s vasculitic-appearing rash, ground-glass pulmonary infiltrates, and impaired renal function with red cell casts suggest a pulmonary-renal syndrome, and with this constellation of features, a systemic vasculitis is very likely. Therefore, the focus of the evaluation should be on any evidence to support a diagnosis of vasculitis, as well as other possible causes.
In a patient with diabetes, an artificial heart valve, and fever, the possibility of infection, especially endocarditis, remains high. Transthoracic echocardiography is warranted, and if it is negative for vegetations, transesophageal echocardiography would be a reasonable next option.
Bronchoscopy is warranted to determine if the infiltrates represent pulmonary hemorrhage, which can be seen in certain types of vasculitic and systemic disorders.
The finding of red cell casts in the urine indicates glomerulonephritis, and therefore the kidneys are the likely source of the urinary red blood cells, making cystoscopy of no utility in this current, acute setting.
Case continued: His condition worsens
Transthoracic echocardiography reveals a well-seated mechanical prosthetic aortic valve, trivial aortic regurgitation, a peak gradient of 23 mm Hg and a mean gradient of 12 mm Hg (normal values for his prosthetic valve), and no valvular vegetations. Transesophageal echocardiography confirms the absence of vegetations.
His oxygen requirement increases, and analysis of arterial blood gases reveals a pH of 7.37, Pco2 49 mm Hg (normal range 35–45), Po2 102 mm Hg (normal 80–100), and bicarbonate 28 mmol/L while breathing 100% supplemental oxygen by a nonrebreather face mask. He is taken to the medical intensive care unit for intubation and mechanical ventilation. Bronchoscopy performed while he is intubated confirms diffuse alveolar hemorrhage. Pulse intravenous methylprednisolone (Solu-Medrol) therapy is started.
DIFFUSE ALVEOLAR HEMORRHAGE
3. Which of the following is not true about diffuse alveolar hemorrhage?
- Its onset is usually abrupt or of short duration
- It is always associated with hemoptysis
- Radiography most commonly shows new patchy or diffuse alveolar opacities
- Pulmonary function testing shows increased diffusing capacity of the lung for carbon monoxide (Dlco)
Hemoptysis is absent at presentation in as many as 33% of patients.
The onset of diffuse alveolar hemorrhage is usually abrupt or of short duration, with initial symptoms of cough, fever, and dyspnea. Some patients, such as ours, can present with severe acute respiratory distress syndrome requiring mechanical ventilation. Radiography most often shows new patchy alveolar opacities, and CT may reveal a ground-glass appearance. On pulmonary function testing, the Dlco is high, owing to the hemoglobin within the alveoli.
ACUTE GLOMERULONEPHRITIS PLUS PULMONARY HEMORRHAGE EQUALS…?
4. Which disease could have manifestations consistent with acute glomerulonephritis and pulmonary hemorrhage?
- Antiglomerular basement membrane disease
- Wegener granulomatosis
- Microscopic polyangiitis
- Systemic lupus erythematosus
All of these are possible.
The combined presentation of acute glomerulonephritis and pulmonary hemorrhage (also called pulmonary-renal syndrome) is usually seen in antiglomerular basement membrane disease (Goodpasture syndrome) and small-vessel systemic vasculitides such as Wegener granulomatosis and microscopic polyangiitis.2,3 It can also be seen in patients with systemic lupus erythematosus.
Antiglomerular basement membrane disease
In antiglomerular basement membrane disease, circulating antibodies are directed towards an antigen intrinsic to the glomerular basement membrane, typically leading to acute glomerulonephritis associated with crescent formation. It may present as acute renal failure in which urinalysis shows proteinuria with sediment characterized by red cell casts. Pulmonary involvement, usually alveolar hemorrhage, is present in approximately 60% to 70% of cases.
The diagnosis requires demonstration of antiglomerular basement membrane antibodies in either the serum or the kidney. Renal biopsy is usually recommended because the accuracy of serum assays is variable.
A key histologic feature of the renal lesion in antiglomerular basement membrane disease is crescentic glomerulonephritis in which immunofluorescence microscopy demonstrates the virtually pathognomonic finding of linear deposition of immunoglobulin G along the glomerular capillaries.
The treatment of choice for antiglomerular basement membrane disease is plasmapheresis and immunosuppression with a combination of glucocorticoids and cyclophosphamide (Cytoxan). If the disease is high on the differential diagnosis, empiric plasmapheresis should be started while waiting for diagnostic studies, because the prognosis of untreated glomerulonephritis is poor.
Wegener granulomatosis
Wegener granulomatosis is a systemic vasculitis of the medium and small arteries, arterioles, and venules that classically involves the upper and lower respiratory tracts and the kidneys. Patients may present with persistent rhinorrhea and epistaxis, cough with chest radiographs showing nodules, fixed infiltrates, or cavities, and abnormal urinary sediment with microscopic hematuria with or without red cell casts.
From 75% to 90% of patients with active Wegener granulomatosis are positive for antineutrophil cytoplasmic antibody (ANCA). In 60% to 80% of cases, ANCA is directed against proteinase 3 (PR3), which produces a cytoplasmic standing pattern by immunofluorescence (cANCA), while 5% to 20% have ANCA directed against myeloper-oxidase, which produces a perinuclear staining pattern (pANCA). A small number of patients with Wegener granulomatosis are ANCA-negative.
The diagnosis is usually confirmed by tissue biopsy at the site of active disease, which shows necrotizing vasculitis with granulomatous inflammation. The renal lesion is typically that of a focal, segmental, necrotizing glomerulonephritis that has few to no immune complexes (pauci-immune glomerulonephritis).
The treatment of severe disease involves a combination of cyclophosphamide and glucocorticoids initially to achieve remission followed by maintenance therapy with methotrexate or azathioprine (Imuran).
Microscopic polyangiitis
Microscopic polyangiitis is a systemic vasculitis of the capillaries, venules, and arterioles, with little or no immune complex deposition. Nearly all patients have renal involvement, and 10% to 30% have lung involvement. In those with lung involvement, diffuse alveolar hemorrhage is the most common manifestation.
On histopathologic study, microscopic polyangiitis differs from Wegener granulomatosis in that it does not have granuloma formation. However, the renal lesion is that of a pauci-immune glomerulonephritis and is identical to that seen in Wegener granulomatosis. From 70% to 85% of patients with microscopic polyangiitis are ANCA-positive, and most of these have pANCA.
The management of active severe microscopic polyangiitis is identical to that of Wegener granulomatosis.
Systemic lupus erythematosus
Systemic lupus erythematosus is an autoimmune disease characterized by tissue-binding autoantibody and immune-complex-mediated organ damage. It can involve multiple organ systems, and the diagnosis is based on characteristic clinical features and autoantibodies. The sensitivity of antinuclear antibody for lupus is close to 100%, which makes it a good screening tool. Antibodies to dsDNA and Smith antigen have high specificity for lupus.
About 75% of patients have renal involvement at some point in their disease course. The different types of renal disease in systemic lupus are usually differentiated with a renal biopsy, with immune-complex-mediated glomerular diseases being the most common.
The most common pulmonary manifestation is pleuritis with or without pleural effusion. Life-threatening pulmonary manifestations include pulmonary hemorrhage and interstitial inflammation leading to fibrosis.
Lupus has great clinical variability and the treatment approach is based on the organ manifestations, disease activity, and severity.
CASE CONTINUED: ARRIVING AT THE DIAGNOSIS
We start our patient on cyclophosphamide 175 mg daily in view of possible Wegener granulomatosis.
Even though purpura is extremely rare in primary antiglomerular basement membrane disease, this patient has life-threatening pulmonary hemorrhage, a complication seen in over 50% of these patients. Therefore, plasmapheresis is started empirically.
On the second day of cyclophosphamide treatment, tests for ANCA, glomerular basement membrane antibody, and antinuclear antibody are reported as negative, and complement levels are normal. Bronchoalveolar lavage shows no infection. Follow-up blood cultures are negative.
To summarize the findings so far, this patient has a purpuric skin rash, active urine sediment with red cell casts indicating glomerulonephritis, acute renal failure, and severe pulmonary hemorrhage requiring mechanical ventilation. Although one set of blood cultures showed gram-positive cocci, no source of infection, particularly endocarditis, could be identified.
Antiglomerular basement membrane disease would still be high on the list of suspected diagnoses, given his diffuse alveolar hemorrhage. As mentioned earlier, renal biopsy is imperative to making a diagnosis, because serologic tests have variable accuracy. And making the correct diagnosis has therapeutic implications.
Renal biopsy is performed and shows immune-complex mesangiopathic glomerulonephritis with positive immunofluorescent staining in the mesangium for IgA. Only one glomerulus shows fibrinoid necrosis.
Skin biopsy results obtained earlier showed positive direct immunofluorescence for IgA. Both renal and skin biopsies suggested Henoch-Schönlein purpura.
IgA deposition in the kidney and skin has been associated with liver cirrhosis, celiac disease, and infections with agents such as human immunodeficiency virus, cytomegalovirus, Haemophilus parainfluenzae, and Staphylococcus aureus. In a Japanese study,4 renal biopsy specimens from 116 patients with IgA nephropathy and from 122 patients with other types of kidney disease were examined for the presence of S aureus antigen in the glomeruli. Although antigen was not detected in non-IgA disease, 68% of specimens from patients with IgA nephropathy had S aureus cell envelope antigen together with IgA antibody in the glomeruli. However, no single antigen has been consistently identified, so it seems more probable that the development of IgA deposition in kidneys is a consequence of aberrant IgA immune response rather than the antigen itself.
HENOCH-SCHÖNLEIN PURPURA
Henoch-Schönlein purpura is a systemic vasculitis with a prominent cutaneous component. It is characterized by the tissue deposition of IgA-containing immune complexes. It is predominantly a disease of children but it can be seen in adults. A UK study found the prevalence to be 20 per 100,000 children, with the highest prevalence between ages 4 and 7 (70 per 100,000).5
The four cardinal clinical features of Henoch-Schönlein purpura are purpuric rash, abdominal pain, arthralgia, and renal involvement. Almost all patients have purpuric rash at some point in their disease course. Arthralgia with or without arthritis is typically migratory, oligoarticular, and nondeforming, usually affecting the large joints of the lower extremities; involvement of the upper extremities is less common.
Skin biopsy typically shows leukocytoclastic vasculitis in postcapillary venules with IgA deposition, and these findings are pathognomonic of Henoch-Schönlein purpura.
Gastrointestinal involvement can range from mild symptoms such as nausea, vomiting, abdominal pain, and paralytic ileus to severe disease such as gastrointestinal hemorrhage, bowel infarction, bowel perforation, and intussusception.
Renal involvement is common and is important, as it can in rare cases progress to end-stage renal disease. The urinalysis usually shows mild proteinuria with active sediment with red cell casts. Most patients have relatively mild disease, characterized by asymptomatic hematuria with a normal or slightly elevated creatinine. However, severe involvement may occur, with nephrotic syndrome, hypertension, and acute renal failure.
Different presentation in adults vs children
Adults with Henoch-Schönlein purpura only rarely present with bowel intussusception, whereas some studies have found that adults are more likely than children to develop significant renal involvement, including end-stage renal disease.6,7
There is a general but not absolute correlation between the severity of clinical manifestations and the findings on renal biopsy. A poor prognosis (significant proteinuria, hypertension, renal insufficiency, or end-stage renal disease) is associated with crescent formation involving more than 50% of the glomeruli.8
Our current understanding of the longterm outcome of the renal disease in Henoch-Schönlein purpura is primarily derived from studies in children. In one study, complete recovery occurred in 94% of children and 89% of adults.7 A long-term study of 250 adults with Henoch-Schönlein purpura and renal involvement of sufficient severity to require biopsy reported that, at a median follow up of 15 years, 11% had become dialysis-dependent and 13% had severe renal failure (creatinine clearance < 30 mL/min).6 Recurrence is common, occurring in approximately one-third of patients, more likely in those with nephritis.8
The diagnosis of Henoch-Schönlein purpura is typically made on the basis of key clinical features. In patients such as ours who have an atypical presentation, biopsy of affected skin and renal biopsy can be essential in the diagnosis. Diffuse alveolar hemorrhage is exceedingly rare in Henoch-Schönlein purpura but can be seen, as in our patient.9,10 In this setting, the findings of IgA deposits in skin and renal biopsy specimens, together with the absence of other clinical, serologic, or histologic features of other more-common potential causes, secured the diagnosis in this patient.
Henoch-Schönlein purpura is usually self-limited and requires no specific therapy. Evidence suggests that glucocorticoids enhance the rate of resolution of the arthritis and abdominal pain but do not appear to prevent recurrent disease or lessen the likelihood of progression of renal disease.8 Patients with severe renal involvement with renal function impairment may benefit from pulse intravenous corticosteroid therapy (methylprednisolone 250–1,000 mg per day for 3 days), followed by oral steroids for 3 months.11
In anecdotal reports, renal function improved in 19 of 21 children with Henoch-Schönlein purpura and severe crescentic nephritis.12 Studies have evaluated cyclophosphamide13 and plasmapheresis,14 but their role remains uncertain. Renal transplantation is an option in patients who progress to end-stage renal disease.
OUR CASE CONTINUED
In our patient, plasmapheresis was discontinued. As the pulmonary hemorrhage had developed during treatment with prednisone, we decided to continue cyclophosphamide, given the life-threatening nature of his disease. His pulmonary status improved and he was extubated.
During his initial hospital stay, he was taking heparin for anticoagulation therapy. However, given the life-threatening diffuse alveolar hemorrhage, heparin was stopped during the course of his stay in the intensive care unit. Once he was stable and was transferred out of the intensive care unit, heparin was resumed, and his anticoagulation therapy was bridged to warfarin just before discharge. He was eventually discharged on a tapering dose of oral prednisone and cyclophosphamide for 3 months, after which he was switched to azathioprine for maintenance therapy. He was doing well 6 months later, with a serum creatinine level of 1.6 mg/dL, no red cell casts in the urine, and no rash.
TAKE-HOME POINT
In any case of suspected vasculitis that presents with skin disease, it is essential to look for other sites with potentially life-threatening involvement. Henoch-Schönlein purpura is a systemic vasculitis with a prominent cutaneous component. It is not always benign and can be associated with serious complications such as renal failure, gastrointestinal events, and, very rarely, diffuse alveolar hemorrhage.
- Collins J, Stern EJ. Ground-glass opacity at CT: the ABCs. AJR Am J Roentgenol 1997; 169:355–367.
- Boyce NW, Holdsworth SR. Pulmonary manifestations of the clinical syndrome of acute glomerulonephritis and lung hemorrhage. Am J Kidney Dis 1986; 8:31–36.
- Gallagher H, Kwan JT, Jayne DR. Pulmonary renal syndrome: a 4-year, single-center experience. Am J Kidney Dis 2002; 39:42–47.
- Koyama A, Sharmin S, Sakurai H, et al. Staphylococcus aureus cell envelope antigen is a new candidate for the induction of IgA nephropathy. Kidney Int 2004; 66:121–132.
- Gardner-Medwin JM, Dolezalova P, Cummins C, Southwood TR. Incidence of Henoch-Schönlein purpura, Kawasaki disease, and rare vasculitides in children of different ethnic origins. Lancet 2002; 360:1197–1202.
- Pillebout E, Thervet E, Hill G, Alberti C, Vanhille P, Nochy D. Henoch-Schönlein purpura in adults: outcome and prognostic factors. J Am Soc Nephrol 2002; 13:1271–1278.
- Blanco R, Martinez-Taboada VM, Rodriguez-Valverde V, Garcia-Fuentes M, Gonzalez-Gay MA. Henoch-Schönlein purpura in adulthood and childhood: two different expressions of the same syndrome. Arthritis Rheum 1997; 40:859–864.
- Saulsbury FT. Henoch-Schönlein purpura in children. Report of 100 patients and review of the literature. Medicine (Baltimore) 1999; 78:395–409.
- Nadrous HF, Yu AC, Specks U, Ryu JH. Pulmonary involvement in Henoch-Schönlein purpura. Mayo Clin Proc 2004; 79:1151–1157.
- Vats KR, Vats A, Kim Y, Dassenko D, Sinaiko AR. Henoch-Schönlein purpura and pulmonary hemorrhage: a report and literature review. Pediatr Nephrol 1999; 13:530–534.
- Niaudet P, Habib R. Methylprednisolone pulse therapy in the treatment of severe forms of Schönlein-Henoch purpura nephritis. Pediatr Nephrol 1998; 12:238–243.
- Bergstein J, Leiser J, Andreoli SP. Response of crescentic Henoch-Schöenlein purpura nephritis to corticosteroid and azathioprine therapy. Clin Nephrol 1998; 49:9–14.
- Tarshish P, Bernstein J, Edelmann CM. Henoch-Schönlein purpura nephritis: course of disease and efficacy of cyclophosphamide. Pediatr Nephrol 2004; 19:51–56.
- Hattori M, Ito K, Konomoto T, Kawaguchi H, Yoshioka T, Khono M. Plasmapheresis as the sole therapy for rapidly progressive Henoch-Schönlein purpura nephritis in children. Am J Kidney Dis 1999; 33:427–433.