User login
Bigger Isn’t Always Better

Editor’s note: This is the second of a two-part series addressing issues at large HM groups.
Last month (“The Bigger They Are…,” May 2009, p. 58), I discussed the difficulty large HM groups (more than 20 full-time equivalent hospitalists) face in trying to ensure that nurses and other staff always know which hospitalist is attending a patient daily, as well as issues raised by the common practice of separating admitter and rounder shifts. This month, I want to address patient distribution and economic issues faced by large groups.
Patient Census
Large and small groups often work diligently to ensure all rounding doctors start the day with a nearly identical patient load. Such “load leveling” might take only a few minutes in groups of two or three rounding doctors, but it may take up to an hour a day if there are eight to 10 rounding doctors. Think about what this costs a large group. If a group has eight rounders spending the first 30 minutes of each day distributing patients, the practice is devoting 1,460 hours annually to this function. Those 1,460 hours equate to 0.7 FTE, and if each FTE costs the practice $220,000 annually in salary and benefits, then the practice is spending $154,000 per year to distribute patients each morning.
Is that the best way to use $154,000?
An alternative is to establish a system that allows the evening and night admitters to know in advance which rounding doctor will assume each patient’s care the next morning. The night/evening admitters would then write “admit to Dr. Satriani” for the first new admission, and “admit to Dr. Johnson” for the second, and so on. The hospital would never list evening/night admitters as a patient’s attending on the chart or in the computer. And each rounding doctor could arrive in the morning to find a list of new patients from overnight, eliminating the need for a meeting of all rounding doctors just to distribute the patients. There may be other reasons to meet each morning, such as case management rounds, but eliminating the need to spend time distributing patients will make the meetings shorter and get everyone out to the floors to see patients more quickly.
There are two simple ways the evening/night admitters can know how to assign new patients to the rounding doctors for the next morning. If the group wants to have each rounding doctor start with a nearly identical patient load, then the rounding doctors could indicate their load at the end of each day and the evening/night admitters would follow an algorithm of assigning the first admissions to the doctor who finished the prior day with a lighter load. The other option is for evening/night admitters to assign new patients through the night according to a fixed protocol, which wouldn’t vary based on the current patient load of each rounder. Of course, this will mean daily patient load could vary significantly from one rounder to the next, but over any long period, the workloads will tend to even out.
Elusive Economy of Scale
Hospitalists and hospital executives tend to have a different view of the benefits of practice growth to require more hospitalist FTEs. The hospitalists themselves often are convinced that when the group has more doctors, there will be more scheduling flexibility for each individual doctor, and perhaps each doctor will have to work fewer weekends. Sadly, neither is true to any significant degree in most practices. Some aspects of scheduling are easier when there are more doctors. For example, it usually is easier to find someone to fill in for an unexpected absence in larger groups. However, each doctor’s schedule usually doesn’t get much better or more flexible.
Hospital executives, or whoever is responsible for coming up with funding to support the practice, often look at a larger practice as one that can take advantage of economies of scale. For example, executives may project that when the practice is larger, the hospital’s contribution to the practice on a per-FTE or per-encounter basis will become smaller. But just like the elusive scheduling benefit of larger groups, few practices realize any economies of scale. The vast majority of the costs in most programs are provider labor costs, which scale with program volume. So in most cases, the larger a practice becomes, the larger the overall hospital financial support will be on a roughly linear basis.
More often than not, night-shift work does become more cost-effective as practices grow. For example, an in-house night shift for a practice of eight FTEs might generate $200 to $400 in collected professional fee revenue each night, leaving the hospital to pay the remaining $700 to $900 each night. (These numbers are for illustration and aren’t intended to represent benchmarks or realistic targets for any practice.) But as the practice grows to support 20 FTE hospitalists in total, nights get busier. The night doctor might average three or four admissions per night in an eight-FTE practice but could average 10 or more in a 20-FTE practice. Those 10 admissions might generate around $1,200 in professional fee revenue, leaving the hospital to contribute only a small fraction (about $200 per night) of the cost of each night shift. So night shifts typically require diminishing dollars of hospital support as the practice grows.
Unfortunately, any economy of scale for night-shift coverage usually is offset by inefficiencies and costs that larger practices incur—and small practices often don’t—such as a significant amount of management infrastructure, professional administration, dedicated physician leader time, and an information technology infrastructure. These resources often are necessary to manage the complexity of a large practice, but every practice should challenge itself to demonstrate that these things actually improve the practice’s efficiency and performance enough to justify the money spent on them.
Triage Pager
The larger the practice, the more likely there have been attempts to implement a triage pager system in which all new admissions and consults are routed to one pager (the triage, or “hot,” pager), which is held by one hospitalist at a time. In large practices, the “triage hospitalist” is usually so busy answering pages that they can do little else. And in many cases, ED doctors may describe a new admission to the triage hospitalist in detail only to have the triage hospitalist pass the information along to a colleague who will actually see the patient. This is an inefficient chain of communication, and I think most groups could do away with the triage pager. I described this issue in detail in my December 2008 column (“Technological Advance or Workplace Setback,” p. 69).
Unit-Based Assignment
Large hospitalist groups work in large hospitals and end up doing a lot of inefficient walking between nursing units during the day. They may have patients on 10 or more nursing units and end up spending only a little time on each unit, which probably diminishes the “constant availability” that most see as key to the hospitalist model. So many groups decide to have each hospitalist cover only a small number of nursing units. This really has become a hot topic in the past couple of years, and I discussed it in detail in my September 2007 column (“Unit-Based Hospitalist Practice,” p. 84).
Dr. Nelson has been a practicing hospitalist since 1988 and is co-founder and past president of SHM. He is a principal in Nelson/Flores Associates, a national hospitalist practice management consulting firm. He also is part of the faculty for SHM’s “Best Practices in Managing a Hospital Medicine Program” course. This column represents his views and is not intended to reflect an official position of SHM.
All Atwitter at HM09
The world is atwitter over Twitter—the social networking utility that allows users to send immediate, 140-character text messages known as “tweets.” From then-presidential-nominee Barack Obama updating the masses on his campaign travels to actor Ashton Kutcher challenging the entire CNN news organization to a Twitter challenge (the former beat the latter by achieving 1 million Twitter followers first) to Britney Spears micro-blogging updates from her ever-so-fascinating life, Twitter is all the rage. The site describes its mission as allowing friends and family to stay connected through quick, frequent text answers to one question: “What are you doing?”
Not one to be left out, I thought I’d give it a shot. However, my tweeting ability is hamstrung by two serious insufficiencies: First, I’m a technology buffoon. Second, there’s no way I can keep my glorious insights to 140 characters.
So, with respect to the folks at Twitter, here’s a not-so-real-time chronicle of how I spent my time at HM09 in Chicago.
Us vs. Them?
The main session opened with a panel discussion about the future role of hospitalist leaders. The most poignant moment came when the panel of chief medical officers was asked how they viewed hospitalists. One recognized the tremendous potential hospitalists offer as the go-to resource for tackling important quality, efficiency, and process issues. This was countered by another participant warning that this potential can go untapped when HM group leaders function as “union stewards,” protecting hospitalists’ interests without a thought to the greater needs of the hospital. While recognizing advocacy as an important part of a group leader’s job, the message was clear: Too much advocacy can create an adversarial relationship that undermines our great potential. (That’s 769 characters.)
Laws Are Like Sausages: It’s Best Not to Watch Them Being Made
Mark Chassin, MD, MPP, MPH, president of The Joint Commission, discussed the quality revolution. He outlined the growing need and role of hospitalists in crossing the hospital quality chasm. He fired a cautionary shot across our bow by noting the increasing shortcomings of the public-private enterprise in improving healthcare quality. His clear concern is that if we don’t improve quality drastically, the government will step in and pass legislation—something that would most likely impact hospitals and hospitalists negatively. (532)
“Rack-da-poo”
A highly informative physician roundtable tackled value-based purchasing. The Reporting Hospital Quality Data for Annual Payment Update, or RHQDAPU—pronounced “rack-da-poo”—is a voluntary (insofar as hospitals who don’t comply lose 2% of Medicare reimbursement) hospital reporting system for adherence to core measures. This program, widely viewed as the foundation for future hospital pay for performance, will be a budget-neutral process such that some hospitals will win while an equal number will lose. Up to 5% of hospital reimbursement could be at risk. Data is available at www.hospital compare.gov. Check out your hospital; your patients already are. (659)
The Eagle Has Landed
At the end of the first day I co-chaired the Academic/Research special-interest forum with David Meltzer, MD, PhD, of the University of Chicago. The group grappled with a number of questions, from struggles with QI work to finding ways to support research to the development of young academicians. One comment, from Kim Eagle, MD, a world-renowned cardiologist at the University of Michigan and SHM’s visiting professor, resonated with the group. Dr. Eagle sagely responded to a young physician having difficulty developing a research interest by stating research is not about research but about answering questions. In the current healthcare environment, there are more than enough questions to launch all of our academic careers. (734)
Is HM Intensive Enough?
The second day got off to a roaring start with the best of the Research, Innovations and Clinical Vignettes (RIV). The most hotly anticipated research was from Emory University, where Kristin Wise, MD, and her colleagues evaluated an intensivist vs. hospitalist model for ICU staffing and found that after correction for baseline differences in acute illnesses, overall there were no differences in mortality between the two groups. Despite being constrained by methodological differences between the comparator groups and a lack of randomization, the data represents an important first step in addressing the huge shortfall of intensivist providers. (650)
Why My Wife Never Listens
Vinny Arora, MD, MA, of the University of Chicago and Erin R. Stucky, MD, of Rady Children’s Hospital in San Diego addressed the tremendously important topic of improving in-hospital handoffs. Part of the problem, they noted, is the egocentric heuristic. This cognitive shortcoming results in the sender believing that they are clearly expressing themselves because the message is apparent to them. Research shows that 40% of the time, the piece of information deemed most important by the sender is not identified as such by the recipient. Disconnect increases the better the sender knows the recipient, which explains much of our difficulty communicating in the hospital and domestically. Overcoming this requires vigilance on the sender’s part to be sure the message is accurately conveyed. (793)
Could We Go Bankrupt?
We all have too many patients and not enough providers. Thus, I was shocked when Scott F. Enderby, MD, of East Bay Physicians Medical Group in San Francisco spoke of a hospitalist group that went from profitability to bankruptcy in one year after adding four new employees. In his Finance 101 session, we learned how it happened despite an expected increase in clinical revenue: The group was constrained by a lack of liquidity that was retrospectively obvious from their balance sheet and operations and cash flow statements. Considering that more than a third of hospitalist directors do not know their group’s most basic financial metrics, this was a reminder that many more of us may be at risk in this increasingly unforgiving economy. (741)
Wachter’s World
As has become an annual meeting tradition, HM pioneer Robert Wachter, MD, FHM, professor and associate chairman of the department of medicine at the University of California at San Francisco, closed the meeting with his uniquely insightful comments on the state of healthcare. In using a case of mistaken identity he adeptly illustrated many of the key safety problems we face in healthcare. Further, he called for a transition away from a “no blame” medical culture to one of accountability. Once again, Dr. Wachter proved that despite going last, he continues to be out in front. (582)
A Child’s Calming Touch
This was my seventh consecutive annual meeting, and like the six before, it has exceeded my every expectation. From knowledge gained to the chance to speak and share my research to the opportunity to network and catch up with friends, the meeting was filled with lasting memories. Still, at times my hectic schedule bordered on chaos. It was during those times that I turned to a short, 23-second voicemail my wife sent the first day. On it my son, almost 2 years old, is belly-laughing as only a child can—pure, unbridled, carefree.
For me, it acted as a mariner, calming me at the end of a busy day, serving as a reminder of the important things in life, guiding me home. (674)
Dr. Glasheen is associate professor of medicine at the University of Colorado Denver, where he serves as director of hospital medicine and the hospitalist training program, and as associate program director of the Internal Medicine Residency Program.
Collaborative Effort

Let me start my first column as SHM president by introducing myself. I am an associate professor of medicine and the director of the hospital medicine program at the University of Michigan in Ann Arbor. I live in Ann Arbor with my family, which includes my wife, Juliet, and three young children. I also have a “professional family” at U of M, which includes 40 hospitalists and all the staff who facilitate the great work they do every day.
SHM, of course, is another big part of my extended family. I have been involved with SHM since 1997—when it was formed as the National Association of Inpatient Physi-cians (NAIP)—and have watched in awe its meteoric rise. What started as an organization with a handful of members and one staffer fully supported by the American College of Physicians (ACP) has grown into a fully independent society with more than 9,400 members and 50 employees. The growth in scope of SHM’s activities is no less impressive. In the mid-1990s, the society was focused on justifying the existence of a new breed of doctors called hospitalists.
Today, SHM is involved in multiple projects and programs designed to cement HM as the center of a healthcare system being redesigned to deliver high-quality, safe, efficient, and patient-centered healthcare.
Challenges Ahead
As exciting and ambitious as SHM’s goals are, there are innumerable challenges facing the field of HM that stand in its way. Let me touch on just a few.
The first and most obvious is the economy. This country is experiencing the worst recession it has seen in decades, and it is certainly affecting our hospitals. Here in Michigan, the plight of the auto industry graces the front pages of our newspapers daily (at least the papers that still exist). Hospitals that used to gloat about their high percentage of privately insured patients as a result of lucrative auto union contracts now see marked increases in public insurance—or no insurance at all.
Unfortunately, this is not just Michigan’s problem. Recent data suggest that more than 65% of the nation’s hospitals have seen increases in nonpaying patients and, as a result, marked declines in elective procedures and a bleak financial outlook. Many hospitalist programs are tied to the financial viability of their hospitals.
The decline in hospital resources also comes at a time when hospitals are being asked to invest more to promote safety and quality concurrent with growth in pay-for-performance programs and “no-pay” events, which make it clear that the financial picture could get even worse if these investments are not made.
The challenge in positioning hospitalists and HM at quality improvement (QI) ground zero—as we are doing—is that many of the systems and processes that require change extend beyond our usual range of control. The attention that has been given to reducing hospital readmissions by improving care transitions is a good example. It is not news that many bad things can—and often do—happen to patients after discharge. And many of the patients who suffer a post-discharge adverse event get readmitted.
It seems logical to have hospitalists fix the problem. But hospital readmissions are complex. As has been recently argued, some readmissions may even be a reflection of good quality—for example, if we capture a post-discharge problem and “save the patient” by readmitting them before they died at home.1 And to address preventable readmissions, systems must be developed to manage patients after they leave our hospitals, primary-care physicians need to be engaged to create effective ways to “receive” the post-discharge patient, and, finally, the decision to readmit—which often is made by the ED doctor or the PCP—needs to be addressed. This is not easy work.
Additionally, there are some challenges unique to academic hospitalists, a subset of our membership. Academic HM programs have been forced to grow at a dizzying speed in the past several years to keep up with increases in hospital discharges in an era of increased restrictions on the work hours of medical residents. These programs have grown by hiring many junior faculty with no advanced training in research, teaching, QI, or patient safety, let alone all the skills they need to bill, lead large teams, or manage complex hospital processes.
Of those problems, the most challenging, and arguably the most important to fix, is research training. To make lasting contributions to the practice of HM, rather than just implementing the practices, new treatments, and new care processes developed by other fields, HM needs to generate the new knowledge we use. That takes growing research, researchers, and sustainable academic programs. That, too, is not easy work.
HM Can Meet the Challenges
I am optimistic we can meet these myriad challenges, and I believe SHM is positioned to lead the charge. There is nothing we can do about the recession; hospitalists will have to weather the storm. Fortunately, HM has spent the last decade advocating not only its effectiveness, but also its cost-effectiveness. As a key hospital ally in the quality and safety wars, we are entrenched, and most hospital CEOs looking at ways to control costs should look beyond the core aspects of the local HM program. (They can take back my water cooler.)
It has not been lost on many at SHM that improving quality and safety at the hospital level requires engaging those outside our field. SHM is indeed tackling the daunting task of improving care transitions with its Project BOOST (Better Outcomes for Older Adults through Safe Transitions) program, but this comes after years of working with national quality organizations, policymakers, and other professional societies—including those that represent ED physicians and PCPs—in recognizing that fixing poor care transitions cannot be done by hospitalists alone.
Academic HM also is on SHM’s radar. The society, along with the Society of General Internal Medicine and the Association of Chiefs of General Internal Medicine, organized a summit to delineate and address the problems faced by academic HM. That meeting led to increased attention on the problems the field faces, enhanced advocacy at the federal level for research support, a “boot camp” designed for academic hospitalists to develop the skills they need to excel in an academic environment, and the beginnings of an SHM-funded faculty development research award.
All told, while there may be dark clouds on the horizon and rain in the forecast, SHM has spent years building a watertight organization and has foreseen many of the problems we now face. If we keep up the hard work, I am confident we, our patients, and the next generation of hospitalists will have brighter days ahead.
I look forward to the next year at the helm of SHM and am honored to represent SHM and its members, whose hard work and accomplishments never cease to amaze me.
Dr. Flanders is president of SHM.
Reference
- Epstein AM. Revisiting readmissions—changing the incentives for shared accountability. N Engl J Med. 2009;360(14):1457-1459.
First Class
Mercy Medical Center in Springfield, Mass., has enjoyed a number of distinctions in its brief HM history. The 182-bed acute-care institution was one of the first to use the term hospitalist. Its C-suite was among the first to subsidize an HM group. And one of its physicians is a co-founder of SHM.
So it was only natural that Amanda Wilson, MD, FHM, wanted Mercy’s staff—including HM pioneer Winthrop F. Whitcomb, MD, FHM—to be among the first hospitalists in the country honored with SHM’s new Fellow of Hospital Medicine (FHM) designation. The first class of fellows was inducted at HM09 in Chicago.
“It’s inspiring to me,” says Dr. Wilson, chief of medicine and medical director of the hospitalist program at Mercy Medical Center. “It’s about how many people are lifelong, committed hospitalists. It’s a recognition [that] it’s a real specialty.”
A Select Few
The inaugural group of fellows numbers 514, roughly 5% of SHM total membership, but only about 2% of the estimated 28,000 hospitalists currently practicing. More than 600 hospitalists applied for the designation. To be eligible, candidates must have a minimum of five years as a practicing hospitalist, no serious disciplinary action in the past five years, and the endorsement of two active SHM members.
Hospitalists who have taken on added responsibilities at their institutions, including involvement in quality initiatives and a commitment to continuing education, are especially encouraged to apply. All of the FHM values are reflected in a pledge the group took before about 1,600 colleagues at HM09 in Chicago.
“I make the following pledge,” the testimony reads in part, “to consistently strive to provide the highest quality care for all my patients … to foster interdisciplinary teamwork that integrates hospital systems … and to conduct myself in a manner becoming of a Fellow in Hospital Medicine.”
—Kerry Moore, MD, FHM, Sound Inpatient Physicians, Denver
Recognition and Respect
The FHM is the first step in the society’s plan to incorporate several levels of designations to recognize hospitalist contributions. The next level will be a Senior Fellow in Hospital Medicine (SFHM); the final rung on the ladder will be a Master in Hospital Medicine (MHM). Criteria for those programs will be unveiled soon, and the first SFHM class will be inducted at HM10 in Washington, D.C.
Organizers say it’s likely that only a percentage of the first class of fellows will move to the second level right away. The American Board of Internal Med-icine anticipates that a focused-practice program could open for qualified candidates in 2010 or 2011.
Still, freshman fellows see the FHM designation as a step forward—for both individual hospitalists and SHM.
“It’s recognition you went above and beyond just punching the clock,” says Kerry Moore, MD, FHM, co-chief of the Sound Inpatient Physicians hospitalist group at St. Anthony Central Hospital in Denver. “We don’t just have a meeting; we’re a society and we offer levels of recognition.”
Dr. Wilson says the FHM designation will add a level of respect to the HM specialty and should be just as important to physicians in other specialties as it will be to HM stalwarts. “Up until now,” she says, “you’re a glorified resident, in their opinion.”
Andrea Darilek, MD, FAAP, FHM, agrees the FHM designation should confer an added level of admiration to the hospitalist profession, especially for those like her who have never worked in another specialty. Dr. Darilek, vice chair of the department of hospital medicine at the Billings Clinic in Montana, has been a hospitalist for eight years. “All other fields of medicine have this,” she says. “If you go to a surgery convention, everyone has membership in a society of surgery. It’s important for hospitalists to have national recognition.”
Bijo Chacko, MD, FHM, says it’s particularly meaningful to be part of the first corps of fellows because it includes some of the most recognizable names in HM. He also noted that future fellows could view this class as “trailblazers.” “It shows the penetration of the field,” says Dr. Chacko, hospital medicine director for Preferred Health Partners, which staffs four sites in Brooklyn, N.Y. “The expertise and the physician base is growing enough [that] it warrants a designation.”
The FHM designation doesn’t yet have the familiar ring of such titles as FACP, MPH, or MBA. The sheen is still so new that many in the healthcare industry are likely going to need a while to get used to it, jokes Jack Childress, MD, FHM, a hospitalist at Christus St. Michael Hospital in Texarkana, Texas. That could be seen as an advantage in spreading the word about how much the field of HM has grown, Dr. Childress notes.
“If they see the [letters], they probably have no idea what it means,” he says. “They’ll be asking a lot of questions.”
What better spokesperson for HM than a fellow? TH
Richard Quinn is a freelance writer based in New Jersey.
Take a Bow
SHM has announced the annual Awards of Excellence to hospitalists on the leading edge of the specialty. The honors recognize accomplishments in education, research, clinical care, service, and quality improvement (QI). The praises are as varied as the recipients: They hail from Wisconsin to Pennsylvania, Minnesota to North Carolina.
This year’s awards, presented at the annual President’s Luncheon at HM09 in Chicago, went to:

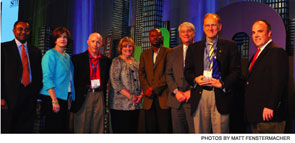
Award for Excellence in Teaching
Eric Howell, MD, FHM
Johns Hopkins Bayview Medical Center, Baltimore
Dr. Howell is an admitted introvert, so one might assume teaching isn’t the most natural application of his medical talents. But when he became chief resident at Johns Hopkins in 1999, he was forced to lead weekly education sessions. The next year, it was weekly didactic classes as an instructor. Five years later, he made assistant professor; this year he moved up again, to associate professor.
“It’s certainly not my fund of knowledge,” Dr. Howell says. “Students and I enjoy interacting because I enjoy it and I make it fun. What little knowledge I have, I pass on well.”
Dr. Howell’s laid-back style—he asks students to call him Eric, although they rarely do—serves him well in the classroom setting. However, the other hats he wears—as Bayview Medical Center’s hospitalist division director and faculty leader at Helen B. Taussig College—limit his teaching time. In a way, it’s what helped him win the award.
“Because I have many other things to do, [teaching] stays special,” says Dr. Howell, who recently joined SHM’s Board of Directors. “It’s a nice reprieve from some of the other high-pressure things, like treating a sick patient, problem-solving for my hospital, or keeping my hospitalist group running.”
Excellence in Research Award
Samir Shah, MD, MSCE, FHM
Children’s Hospital of Philadelphia
Most medical students don’t set out to be hailed as researchers, and Dr. Shah is no exception. Still, in order to graduate from the Yale University School of Medicine, every student has to complete a research project. The research bug bit Dr. Shah, and he stayed an extra year at Yale to pursue teaching and research interests. Now he’s a leading voice for pediatric hospitalists, an assistant professor of pediatrics and epidemiology at the University of Pennsylvania Medical School of Medicine, and an attending physician at Children’s Hospital of Philadelphia.
“It’s the feeling of making a difference not in the life of one child but the lives of many children,” he says. “To say I fundamentally had an impact on the way we view a disease … that’s a different feeling altogether.”
Dr. Shah’s research has focused on improved management of patients with common childhood infections, particularly pneumonia and meningitis. His research is published regularly, and he serves as editor or co-editor for several journals.
“The goal of our research is to influence policy or clinical practice,” Dr Shah says. “Ideally, both.”

Award for Outstanding Service in HM
Eric Siegal, MD, FHM
University of Wisconsin School of Medicine and Public Health, Madison
Dr. Siegal has been the head of SHM’s Public Policy Committee for nearly four years, and while he jokes that no one else is dumb enough to take on the role, it’s exactly that kind of experience that has earned him the society’s “utility infielder award.”
“It’s gotten harder,” Dr. Siegal says of HM advocacy. “Now that people know what SHM is ... it’s going to get a lot harder, in a good way.”
SHM leaders say Dr. Siegal’s grasp of issues is vital as the federal government weighs the most significant healthcare reform in decades and hospitals struggle to balance costs and efficiency against the push to improve quality of care.
In fact, Dr. Siegal’s reputation within the society is so respected he was co-nominated for this year’s service award by Laura Allendorf, SHM’s senior advisor on advocacy and government affairs. Dr. Siegal currently is a critical-care fellow in Madison, and previously served as regional medical director for Cogent Healthcare.
Award for Clinical Excellence
Jerome Siy, MD, FHM
Regions Hospital, Saint Paul, Minn.
Dr. Siy wants to collaborate on pretty much everything. It doesn’t matter if he’s developing an HM platform that employs nearly 50 hospitalists, teaching at the University of Minnesota Medical School, or creating an interdisciplinary program that pulls together hospitalists, ED physicians, and behavioral health doctors.
“Nothing is successful when one person does all the work,” Dr. Siy says. “It doesn’t help just having department heads in a room. You need the people who are actually working.”
Dr. Siy’s work as chief of hospital medicine at Regions drew industry-wide attention, namely for the program he developed to carve out 96 inpatient mental-health beds to streamline intake and discharge processes. And even though he also directs a fellowship program for HealthPartners Medical Group in Saint Paul, Dr. Siy views his award as a testament to his colleagues.
“When you’re part of a team that you really enjoy, the work becomes easier,” Dr. Siy says. “I feel like it’s an acknowledgement of the way we all work together.” TH
Richard Quinn is a freelance writer based in New Jersey.
SHM has announced the annual Awards of Excellence to hospitalists on the leading edge of the specialty. The honors recognize accomplishments in education, research, clinical care, service, and quality improvement (QI). The praises are as varied as the recipients: They hail from Wisconsin to Pennsylvania, Minnesota to North Carolina.
This year’s awards, presented at the annual President’s Luncheon at HM09 in Chicago, went to:
Award for Excellence in Teaching
Eric Howell, MD, FHM
Johns Hopkins Bayview Medical Center, Baltimore
Dr. Howell is an admitted introvert, so one might assume teaching isn’t the most natural application of his medical talents. But when he became chief resident at Johns Hopkins in 1999, he was forced to lead weekly education sessions. The next year, it was weekly didactic classes as an instructor. Five years later, he made assistant professor; this year he moved up again, to associate professor.
“It’s certainly not my fund of knowledge,” Dr. Howell says. “Students and I enjoy interacting because I enjoy it and I make it fun. What little knowledge I have, I pass on well.”
Dr. Howell’s laid-back style—he asks students to call him Eric, although they rarely do—serves him well in the classroom setting. However, the other hats he wears—as Bayview Medical Center’s hospitalist division director and faculty leader at Helen B. Taussig College—limit his teaching time. In a way, it’s what helped him win the award.
“Because I have many other things to do, [teaching] stays special,” says Dr. Howell, who recently joined SHM’s Board of Directors. “It’s a nice reprieve from some of the other high-pressure things, like treating a sick patient, problem-solving for my hospital, or keeping my hospitalist group running.”
Excellence in Research Award
Samir Shah, MD, MSCE, FHM
Children’s Hospital of Philadelphia
Most medical students don’t set out to be hailed as researchers, and Dr. Shah is no exception. Still, in order to graduate from the Yale University School of Medicine, every student has to complete a research project. The research bug bit Dr. Shah, and he stayed an extra year at Yale to pursue teaching and research interests. Now he’s a leading voice for pediatric hospitalists, an assistant professor of pediatrics and epidemiology at the University of Pennsylvania Medical School of Medicine, and an attending physician at Children’s Hospital of Philadelphia.
“It’s the feeling of making a difference not in the life of one child but the lives of many children,” he says. “To say I fundamentally had an impact on the way we view a disease … that’s a different feeling altogether.”
Dr. Shah’s research has focused on improved management of patients with common childhood infections, particularly pneumonia and meningitis. His research is published regularly, and he serves as editor or co-editor for several journals.
“The goal of our research is to influence policy or clinical practice,” Dr Shah says. “Ideally, both.”
Award for Outstanding Service in HM
Eric Siegal, MD, FHM
University of Wisconsin School of Medicine and Public Health, Madison
Dr. Siegal has been the head of SHM’s Public Policy Committee for nearly four years, and while he jokes that no one else is dumb enough to take on the role, it’s exactly that kind of experience that has earned him the society’s “utility infielder award.”
“It’s gotten harder,” Dr. Siegal says of HM advocacy. “Now that people know what SHM is ... it’s going to get a lot harder, in a good way.”
SHM leaders say Dr. Siegal’s grasp of issues is vital as the federal government weighs the most significant healthcare reform in decades and hospitals struggle to balance costs and efficiency against the push to improve quality of care.
In fact, Dr. Siegal’s reputation within the society is so respected he was co-nominated for this year’s service award by Laura Allendorf, SHM’s senior advisor on advocacy and government affairs. Dr. Siegal currently is a critical-care fellow in Madison, and previously served as regional medical director for Cogent Healthcare.
Award for Clinical Excellence
Jerome Siy, MD, FHM
Regions Hospital, Saint Paul, Minn.
Dr. Siy wants to collaborate on pretty much everything. It doesn’t matter if he’s developing an HM platform that employs nearly 50 hospitalists, teaching at the University of Minnesota Medical School, or creating an interdisciplinary program that pulls together hospitalists, ED physicians, and behavioral health doctors.
“Nothing is successful when one person does all the work,” Dr. Siy says. “It doesn’t help just having department heads in a room. You need the people who are actually working.”
Dr. Siy’s work as chief of hospital medicine at Regions drew industry-wide attention, namely for the program he developed to carve out 96 inpatient mental-health beds to streamline intake and discharge processes. And even though he also directs a fellowship program for HealthPartners Medical Group in Saint Paul, Dr. Siy views his award as a testament to his colleagues.
“When you’re part of a team that you really enjoy, the work becomes easier,” Dr. Siy says. “I feel like it’s an acknowledgement of the way we all work together.” TH
Richard Quinn is a freelance writer based in New Jersey.
An Environmental Assessment for Hospital Medicine
In preparation for the SHM Board Strategic Planning Retreat in November 2006, SHM performed a series of surveys to get a handle on the current and future world of hospital medicine. During this investigational process, SHM contacted leaders in hospital medicine and throughout healthcare to get their input and perspectives. In the final phases of understanding the hospital medicine landscape, SHM launched a focused survey of SHM members in fall 2006 to validate what we were hearing from our healthcare experts. Here are some of our findings.
Expectations of Hospital Medicine
While the list of these expectations can seem without end, our survey of hospitalists indicated the following expectations in order of most importance as rated by the survey respondents.
- Provide high quality patient care: At the end of the day even though hospitalists have many roles, the hallmark is to be the best at the bedside that we can be;
- Effectively communicate with other health professionals as well as patients and their families: Hospitalists have crucial information and insights. We have the responsibility to be experts in translating this knowledge so that our patients and their families have an expert partner in their healthcare. This translates into efforts in health literacy and palliative care and end-of-life care;
- Provide leadership in transitions and coordination of care: More and more often there are opportunities for fragmentation and voltage drops as patients move into and out of the hospital. But even within the hospital, the frequent handoffs by staff with shift changes or from ICU or ED to the rest of the hospital create opportunities for errors and quality drop offs. Hospitalists are expected to play a key role in minimizing these valleys in patient care and to set the standard for the institution. You will be hearing more about this in future columns as SHM takes a leadership role on a national level;
- Deliver efficient patient care with appropriate use of resources: This is the most studied aspect of hospital medicine and one trait that is accepted now without much question. Hospitalists are the first physician specialty expected to reduce resource consumption and improve the patient flow at their hospital (i.e., throughput) while improving measurable quality;
- Help hospitals meet regulatory, quality, and safety requirements: It seems that every day brings a new mandate or measurement to our nation’s hospitals. Increasingly it falls to the hospitalist to work with the hospitals and their staffs to meet these requirements. Hospitalists are becoming the de facto chief quality officers (CQOs) in many hospitals;
- Collaborate with other health professionals to form and lead multidisciplinary teams: Hospitalists know that we can’t meet this expectation alone. The day of the individual as the all-knowing solo provider of healthcare is going the way of the dinosaur. There is enough work to go around, and the enlightened hospital is figuring out how to use all the available man (and woman) power at its disposal. If we are to create the quality and efficiency we are expected to produce we will need everyone pulling in the same direction;
- Broaden the scope of hospitalist practice through co-management of patients with surgeons and other specialists: The fastest growing aspect of hospital medicine is the role of hospitalists in co-management with other physicians. The hospitalist has a role as an in-house advisor to the emergency physicians, as an “extender” of the overextended intensivists, as the perioperative manager of the medical problems of the surgical patients, and as the general physician for the acutely ill specialty patient. But this attempt to have hospitalists help everyone with everything creates opportunities for “scope creep.” Hospitalists must be helpful to the rest of the medical staff, but everyone needs to be careful to draw the lines of practice based on competence and expertise and not simply availability and convenience; and
- Be a geriatric expert for the acutely ill senior: Hospitalists are not geriatricians for the most part, but the vast majority of the patients managed by hospitalists who do care for adults are over 65. This vulnerable population has unique needs and the penalties for miscommunication or mismanagement are severe and potentially lethal. Hospitalists will need to work with geriatricians, social workers, patients’ families, and other resources to bring value to this key population of patients.
Education Niche Work
Hospitalists also are expected to play unique roles in healthcare education and the development of new knowledge. While this burden may seem to fall disproportionately on academic hospitalists, many community hospitalists also play a role here.
- Serve as a role model for residents and medical students: Much of medical education in medical school and residencies still occurs in the hospital. Hospitalists can bring the enthusiasm of being on the cutting edge of the future of healthcare to the next generation of physicians.
- Update medical education to address the training of young hospitalists and other health professionals: No one knows how large the gap between what they were taught in med school and what they are expected to perform in real time in real life is as well as hospitalists do. If hospitalists and the rest of the healthcare team are expected to improve quality performance (and measure it), mange patients efficiently, make the patient flow through the hospital go smoothly, and communicate to all stakeholders through the transitions and coordination of care, then we had better change what is taught in our professional schools; and
- Increase medical knowledge in hospital medicine through original research: Hospital medicine is a unique discipline that hopes to rely on evidence-based information. The Journal of Hospital Medicine provides a venue for displaying new information that the cadre of young hospitalist researchers will provide in health systems and quality improvement and patient safety studies.
By no means is this meant to be an exhaustive list, but rather a “Top 10” (or 11) gleaned from our survey of hospitalists. This study also examined the hospitalists’ view of the difficult issues facing hospitalists and the major barriers that hospitalists face in meeting these extensive and lofty expectations. In future columns we will examine these issues and barriers. In the meantime everyone should get back to work. We still have much left to do. TH
Dr. Wellikson has been CEO of SHM since 2000.
The Place for Debate
Hospitalists are looking to SHM to provide comanagement guidelines—a basic “rules of engagement”—that could be used to help shape discussion with the specialists and hospital administrators who are central to the process and payment issues surrounding patient care.
Yet many hospitalists are uncomfortable with comanagement, even as the idea continues to gain acceptance nationwide. Those were the takeaways from the Comanagement/Consultative Hospital Medicine Forum at HM09 in Chicago, one of nearly 20 forums that afforded hospitalists more interactive settings to address HM issues.
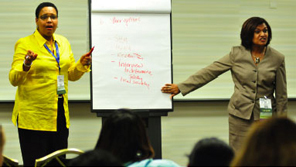
SHM board member Sylvia McKean, MD, FHM, outlined steps HM programs need to consider before they create a comanagement service:
- Identify the need for the service;
- Develop ground rules; and
- Establish measures.
“It’s tough to make a one-size-fits-all,” Dr. McKean, assistant professor of medicine at Brigham and Women’s Hospital in Boston, told one hospitalist who called for SHM to develop a practice model. She did, however, explain that the society has formed a task force to address issues including screening tools, protocols, and reimbursement for services.
Sean Fennessey, MD, of Swedish Medical Center in Seattle, expressed concerns about training, billing, and liability. A new comanagement agreement with the neurosurgery department at Swedish is helping to fund an expansion at his HM group.
“My group is using the phrase ‘physician manager,’ ” Dr. Fennessey said. “We think we would likely be involved in these cases at some point. Maybe we should be involved early on and find the medical issues.”
—Jason Carris
Information Technology
Two dozen hospitalists with a knack for software and a desire to start using it more want SHM to be a leading voice for information technology (IT) in healthcare.
“We’re on board with the idea of IT. … It’s impossible for us to get to high-reliability systems without the IT tools,” said Kendall Rogers, MD, assistant professor at the University of New Mexico School of Medicine and chair of SHM’s IT task force. But “Where is hospitalists’ place at the table?” he asked.
Dr. Rogers and other task force members hope to answer that question in the coming months as they introduce online resources that point HM groups to proven IT systems and Web-based forums to keep the conversation current. The task force hopes to reach out to organizations that are focused on patient safety and QI.
IT Forum participants agreed SHM can educate non-IT-savvy physicians, letting them know the technology is there to help and that new systems rarely come off the shelf without a glitch. Training and software improvements will help alleviate those pressures, Dr. Rogers says. Interactive discussion networks should stimulate evaluation of systems used in HM, allowing peer groups to help each other discover the right fit for their groups.
—Richard Quinn
Value and Competition
“Subsidy” as a dirty word and increased competition from specialists were just a couple of the weighty topics discussed at the Community-Based Hospitalist Forum at HM09 in Chicago.
John Nelson, MD, FHM, FACP, a principal in national hospitalist practice management consulting firm Nelson/Flores Associates and a columnist for The Hospitalist, and Winthrop F. Whitcomb, MD, FHM, a hospitalist at Mercy Medical Center in Springfield, Mass., led a group discussion about issues affecting their groups. Dr. Nelson asked hospitalists if they were dealing with competition from specialists. “Years ago, it was just us,” he said. “No one ever presented the case that their specialty deserved or required special support from the hospital. Now, essentially they all do.”
Jesse Wagner, MD, FHM, a hospitalist at Middlesex Hospital, a 275-bed facility in Middletown, Conn., said hospital administrators need to understand the value of the subsidies they provide HM groups. “I hate the term ‘subsidy.’ It’s not a subsidy because of the value,” Dr. Wagner said. “When I present my administrators with our budget every year, part of the value I present is they don’t have to pay for call for medicine at all because we’re there, we’ll do it. … The hospital’s bottom line is clearly better for having a hospitalist program.” TH
—Stephanie Cajigal
Hospitalists are looking to SHM to provide comanagement guidelines—a basic “rules of engagement”—that could be used to help shape discussion with the specialists and hospital administrators who are central to the process and payment issues surrounding patient care.
Yet many hospitalists are uncomfortable with comanagement, even as the idea continues to gain acceptance nationwide. Those were the takeaways from the Comanagement/Consultative Hospital Medicine Forum at HM09 in Chicago, one of nearly 20 forums that afforded hospitalists more interactive settings to address HM issues.
SHM board member Sylvia McKean, MD, FHM, outlined steps HM programs need to consider before they create a comanagement service:
- Identify the need for the service;
- Develop ground rules; and
- Establish measures.
“It’s tough to make a one-size-fits-all,” Dr. McKean, assistant professor of medicine at Brigham and Women’s Hospital in Boston, told one hospitalist who called for SHM to develop a practice model. She did, however, explain that the society has formed a task force to address issues including screening tools, protocols, and reimbursement for services.
Sean Fennessey, MD, of Swedish Medical Center in Seattle, expressed concerns about training, billing, and liability. A new comanagement agreement with the neurosurgery department at Swedish is helping to fund an expansion at his HM group.
“My group is using the phrase ‘physician manager,’ ” Dr. Fennessey said. “We think we would likely be involved in these cases at some point. Maybe we should be involved early on and find the medical issues.”
—Jason Carris
Information Technology
Two dozen hospitalists with a knack for software and a desire to start using it more want SHM to be a leading voice for information technology (IT) in healthcare.
“We’re on board with the idea of IT. … It’s impossible for us to get to high-reliability systems without the IT tools,” said Kendall Rogers, MD, assistant professor at the University of New Mexico School of Medicine and chair of SHM’s IT task force. But “Where is hospitalists’ place at the table?” he asked.
Dr. Rogers and other task force members hope to answer that question in the coming months as they introduce online resources that point HM groups to proven IT systems and Web-based forums to keep the conversation current. The task force hopes to reach out to organizations that are focused on patient safety and QI.
IT Forum participants agreed SHM can educate non-IT-savvy physicians, letting them know the technology is there to help and that new systems rarely come off the shelf without a glitch. Training and software improvements will help alleviate those pressures, Dr. Rogers says. Interactive discussion networks should stimulate evaluation of systems used in HM, allowing peer groups to help each other discover the right fit for their groups.
—Richard Quinn
Value and Competition
“Subsidy” as a dirty word and increased competition from specialists were just a couple of the weighty topics discussed at the Community-Based Hospitalist Forum at HM09 in Chicago.
John Nelson, MD, FHM, FACP, a principal in national hospitalist practice management consulting firm Nelson/Flores Associates and a columnist for The Hospitalist, and Winthrop F. Whitcomb, MD, FHM, a hospitalist at Mercy Medical Center in Springfield, Mass., led a group discussion about issues affecting their groups. Dr. Nelson asked hospitalists if they were dealing with competition from specialists. “Years ago, it was just us,” he said. “No one ever presented the case that their specialty deserved or required special support from the hospital. Now, essentially they all do.”
Jesse Wagner, MD, FHM, a hospitalist at Middlesex Hospital, a 275-bed facility in Middletown, Conn., said hospital administrators need to understand the value of the subsidies they provide HM groups. “I hate the term ‘subsidy.’ It’s not a subsidy because of the value,” Dr. Wagner said. “When I present my administrators with our budget every year, part of the value I present is they don’t have to pay for call for medicine at all because we’re there, we’ll do it. … The hospital’s bottom line is clearly better for having a hospitalist program.” TH
—Stephanie Cajigal
Is Anybody Out There?
In a tale all too familiar to HM group leaders, whether they head two- or three-physician services or the large, multistate hospitalist companies, Heather Bellow, MD, FAAP, is trying to recruit a pediatric hospitalist to her midsize Midwest town.
Her sales pitch, though, seems to focus more on the bounties of Lansing, Mich., rather than the work to be done as the fourth full-time member of Sparrow Hospital Inpatient Pediatric Services. Dr. Bellow often talks up the culture, lifestyle, and the vibrant atmosphere Michigan State University provides the community. And yet, she struggles to find new hires.
Her story is the new norm: Group directors outside the nation’s largest markets agree that they often work for months at a time to recruit hospitalists. Some relent and hire a steady string of residents from nearby institutions. Others throw money at the problem, only to lose those well-paid hospitalists to other groups that throw more money at the problem. The problem is particularly acute in secondary- and tertiary-population areas, where hiring managers often find themselves battling each other for the same hospitalists.
“That’s the million-dollar question,” Dr. Bellow says. “How do you find that outside person that’s willing to come to small-town USA? I really don’t know.”
One possible answer: A focused recruitment strategy should be considered its own subspecialty. Highlighting the growing importance of recruitment and retention issues, SHM offered its first recruitment course last month at HM09 in Chicago. More than 300 people attended the session, which looked at the hiring process from both perspectives. In anticipation of high demand, the presentation was one of only a handful of sessions that were held twice during the meeting, allowing those who missed the first-day session to attend the same session on the final day.
“It’s a crazy time in some ways,” says Kirk Mathews, co-founder and CEO of Inpatient Management Inc. in St. Louis. “In challenging times, people often abandon the fundamentals because they feel they’re in desperation mode. Just bring someone in, get a body in there—anything with an MD behind their name.”
Hospitalists looking to recruit to smaller markets say times are getting tougher. The job posting board at HM09—always a popular gathering site—was littered with fliers for practices in smaller markets: Albuquerque, N.M.; Coeur d’Alene, Idaho; Murphy, N.C. Most of the announcements focused on the natural beauty of an area, proximity to surf or sand, or the peaceful lifestyle a community affords. Few focused on compensation, rotation schedules, or whether malpractice insurance and continuing medical education would be reimbursed.
“These ads try to appeal to your life other than medicine,” says Cecelia Wong, MD, a hospitalist with Med One Hospitalist Physicians in Columbus, Ohio.
Rohit Uppal, MD, medical director of the hospitalist program at Grant Medical Center, also in Columbus, says job hopefuls now know they can be picky when it comes to looking at positions in markets struggling to maintain a job candidate pipeline. Dr. Uppal uses a fellowship program as a recruitment tool, but he concedes he’s not in a power position when it comes to negotiation. “We’re not saying ‘Here’s our great hospitalist group, move to Columbus,’ ” he says. “We’re hearing ‘I’m moving to Columbus ... looking to be a hospitalist.’ ”
Sweeten the Pot
Another potential recruiting tool some groups might overlook is physical office space. While many groups search for cost savings by moving to a “virtual office,” don’t underestimate the value a candidate might place in having a nice office to do their paperwork, says Joseph Ming-Wah Li, MD, FHM, SHM board member, director of the hospital medicine program at Harvard Medical School and associate chief of the division of general medicine and primary care at Beth Israel Deaconess Medical Center in Boston. “What does that say to a hospitalist?” Dr. Li asks. “I take them to this nice suite with outside-looking windows—it sends a nice message of how you’re valued at your institution.”
Just don’t tilt too far toward fancy offices and big salaries. Mathews cautions clients not to focus solely on compensation, because it doesn’t solve long-term recruitment issues and might attract candidates only interested in short-term commitments. “It’s not wise to buy loyalty, because then you never know when it’s paid for,” Mathews says. “I’m going to throw a $40,000 signing bonus at this doctor. … Two years from now, somebody else can throw $50,000 at them and they’re gone. It’s not the candidate’s fault. They’re at the smorgasbord table.” TH
Richard Quinn is a freelance writer based in New Jersey.
Communication King
When Kenneth Patrick, MD, joined Chestnut Hill Hospital in Philadelphia in 1982, he was known simply as a physician who practiced HM. It wasn’t until 14 years later that the term “hospitalist” appeared for the first time in a New England Journal of Medicine article.
As Dr. Patrick’s job title changed, so did his outlook on the future of the profession. “My practice was exceedingly unique and, for many years, people didn’t understand that a physician could practice exclusively in a hospital,” says Dr. Patrick, now the ICU director at Chestnut Hill. “But when I first heard the word ‘hospitalist,’ I was surprised. I remember thinking, ‘Hey, I’m one of them.’ ”
He also knew that if other physicians were recognizing the specialty, more and more physicians were going to jump on the HM bandwagon. “I knew it wasn’t just a short-lived thing,” he says.
With three decades of HM experience in the bank, Dr. Patrick offers his take on the evolution of HM, changes to the delivery of care, and the importance of communicating with patients.
Question: What drew you into the medical field?
Answer: I earned an undergraduate degree in mechanical engineering [from Drexel University]. The country was going through a recession and there weren’t many job offers, so when I was a junior, I decided to switch careers. I went into medicine.
Q: Have you found any similarities between engineering and HM?
A: Very much so, particularly in the intensive-care unit (ICU). That’s what drew me to critical care and HM. You have to be very detail-oriented. You have to go through your thinking process in a very organized fashion, and you have to be prepared to solve problems that aren’t apparent when you first start caring for a patient. That’s the basis of engineering.
—Kenneth Patrick, MD, Chestnut Hill Hospital, Philadelphia
Q: Did you face challenges in 1982 that new hospitalists won’t face today because the field is more established?
A: No, I would say it’s the other way around, particularly in terms of regulation and monitoring. The Joint Commission existed then, but the standards of hospital care, pressures from insurers, and things like length of stay were not so much of an issue. The challenge to get people evaluated and discharged exceedingly quickly did not exist back then.
Q: How has your role as a hospitalist changed in 26 years?
A: The most significant change is speed. I remember during residency caring for a patient with an infection of the heart valves. That patient stayed in the hospital for 28 days getting antibiotics, and I went to see the person every day to listen to the heart. … Today, that patient would be in the hospital two or, at most, three days. They’d be discharged either to home on IV antibiotics or to a skilled nursing facility. They’d no longer stay in the hospital for a prolonged period of time.
Q: How has that changed the delivery of care?
A: Our job as hospitalists is to see someone who is sick enough to be in the hospital, evaluate and diagnose them exceedingly quickly, get them started on treatment exceedingly quickly, and, as soon as they start improving, the regulators or insurers say they no longer need to be in the hospital. We don’t get to follow them through their entire illness.
I think that is something that is lacking for young hospitalists and residents during training. They don’t see the illness from start to finish. They see it from the start until the moment the patient begins to improve and is discharged.
Q: What is the consequence of that shift?
A: Less-experienced physicians, in terms of management of a patient from the beginning to end, unless there is good communication between hospital physicians and outpatient physicians. And I just think younger physicians are less well prepared for the complications that may ensue from a given illness because they only see the illness for such a short period of time.
Q: What’s the biggest reward of being a hospitalist?
A: Making patients better, if that can be done, and helping them through illnesses that can’t be made better. The outcome may be death, permanent disability, or something tragic, but patients and their families still feel thankful if they feel you’ve been a caring physician. Without the patient and the family being satisfied, I wouldn’t have many rewards.
Q: After 26 years as a hospitalist, what’s the best advice you could offer to someone new in the field?
A: Don’t cut corners. Be as complete and as thorough as you need to be. Communicate with patients and their families, which is crucial. Be open to suggestions, because you don’t know everything. I still feel that way after 26 years. Be optimistic and enjoy what you do. And it’s very important for busy, high-pressure physician specialists to keep their mind on their family and their outside-the-hospital relationships. Don’t forget your kids are going to grow up.
Q: You often emphasize the importance of physicians communicating with patients and their families. What’s the biggest barrier to communication?
A: First, reimbursement isn’t there for explanations and counseling. You get reimbursed for the evaluation, the diagnosis, and the management of the illness. No. 2, it takes time—sometimes an inordinate amount of time. If a patient is critically ill, I can spend 30 to 90 minutes with a family, not treating the patient, but explaining what’s the matter with the patient and what the treatment options are. During that time, you’re giving up other patient-care responsibilities.
And I don’t think physicians have been well trained to communicate with someone and explain the details of an illness and the treatment options nonmedically. I’ve seen doctors try to explain to families that a patient is dead and the family didn’t know what the doctor meant. I teach residents to speak English to patients and their families, not speak medical.
Q: Should there be a greater emphasis on communication during education and residency?
A: Absolutely. I tell residents they need this training as much as they need to know what antibiotic to use for pneumonia. … My experience over the years is patients think they’re getting better care from average doctors who communicate well than doctors who are brilliant and can’t communicate.
Q: What has kept you at Chestnut Hill Hospital for 26 years?
A: Some of it is inertia. When my children were young, it was the community in which I lived. And I like working in a small, community hospital because of the personal relationships I’ve developed with the other professionals, everyone from medical records to the secretarial staff.
Q: What’s next for you?
A: As I’ve gotten older, being woken up in the middle of the night gets harder and harder, so I’ve thought of doing something where the hours are more fixed and I have a little more time. I have thought about starting satellite practices in other community hospitals that are looking to start hospitalist programs, being more of an administrator and delivering less patient care. But I still like what I’m doing, and that’s why I keep doing it. TH
Mark Leiser is a freelance writer based in New Jersey.
Transition Time
The light at the end of the tunnel has arrived—finally. The long hours, scut work, and call nights have paid off; you’re an attending. The transition to the “real world” can be intimidating, especially when you’ve been in training for so long. Here are some tips to ease the transition.
1. Cultivate relationships. Your interactions with nurses, house staff, case managers, social workers, and your colleagues are even more important as an attending and will serve as the building blocks of your reputation. Diplomacy during times of conflict is invaluable. Your approach to resolving situations can further your career—or be a barrier to success.
In the beginning, you might be misidentified as a resident, so it’s important to introduce yourself and have regular conversations with colleagues and consultants until you are recognized and are on a first-name basis with them. Effective communication will go a long way with your patients, their families, and primary-care physicians (PCPs). The benefits of good communication include good Press Ganey patient satisfaction scores, less liability from lawsuits, safer hospital transitions and discharges, and a successful HM practice.
2. Learn the business of practice. The first year of practice will feature a steep learning curve in the areas of billing and documentation. Effective and appropriate billing is essential to maintaining the financial viability of a hospitalist group. Most HM groups provide formal training in billing and documentation as well as chart audits by billing experts. You may find it helpful to review “Billing and Coding” articles in The Hospitalist (also available at www.the-hospitalist.org).
Take time to learn business goals and areas in need of improvement, as this will allow you to improve individual and group performance. This may include maximizing pay for performance, improving hospital throughput by prioritizing discharges early in the morning, and reducing length of stay and readmission rates.
3. Seek work-life balance. Expect to be presented with multiple opportunities to get involved outside of your clinical duties. You could have the chance to participate in quality-improvement (QI) projects, teaching, hospital committees, and research. These activities will add to the depth of your curriculum vitae and give you a voice in hospital operations.
It’s important, however, to remember to pace yourself when you add duties outside the realm of your primary job responsibilities. Avoid spreading yourself too thin. As an attending, your work hours will be fewer and your salary will be better, but your responsibility will be greater. Be sure to set aside personal time and make job satisfaction a priority. More information is available in “A Challenge for a New Specialty: A White Paper on Hospitalist Career Satisfaction” (www.hospitalmedicine.org/dashboard), which outlines the pillars of career satisfaction: autonomy/workflow, workload/schedule, reward/recognition, and community/ environment.
4. Stay current. In addition to reading prominent journals, such as the New England Journal of Medicine and the Journal of Hospital Medicine, look to newer resources that screen up-to-date literature for articles most relevant to hospitalists. American College of Physicians (ACP) members can sign up for ACP Journal Club Plus (acpjc.org), which provides periodic e-mail alerts when new articles meet customized quality and relevance filters. The Hospitalist has a monthly column, “In the Literature,” (see p. 9) that summarizes recent medical research. It also is important to understand how to find evidence-based information quickly. Familiarize yourself with Medline searches and pre-appraised literature resources, such as the Cochrane database, the print version of ACP Journal Club, and guidelines.gov.
5. Be efficient and thorough. Time-management skills are critical as an attending, especially when you’re being pulled in multiple directions. Develop a “to do” list to stay organized. When you are working with nurse practitioners, physician assistants, and residents, delegate certain duties to maximize your own efficiency. Their notes often can be used to assist with documentation, but remember to properly chart the clinical rationale for critical decisions and document medical stability on the day of patient discharge. Be sure you regularly review primary data, such as imaging, culture results, and consultant recommendations. Routinely communicate with PCPs—a prompt, real-time discharge summary is easiest when the information is fresh in your mind, and it ensures proper follow-up care.
6. Know help is available. Just because you’re not a trainee anymore doesn’t mean help isn’t available. Medicine is a constantly evolving field, and you will encounter novel disease states as well as changing diagnostics and therapeutics throughout your career. When you encounter a challenging case, use your colleagues as a sounding board for ideas. When you’re not sure what to do, consultants can be called to assist. Remember, you’re not there to impress others but to provide the best possible care for your patients. Sometimes that means obtaining the advice of a specialist.
If you practice with physician extenders or house staff, you’ll find it helpful to occasionally speak directly to the attending consultant. This helps promote collegial relationships, gives consultants a better understanding of your concerns, and improves your own base of knowledge.
7. Use supervisory skills. If you are practicing in an academic setting or one with physician extenders, you will want to be readily accessible to house staff, physician assistants, and nurse practitioners under your supervision. When you first greet a patient, be sure to clearly identify yourself as the attending physician. At the same time, afford trainees the opportunity to experience being the physician—allow them to actively participate in decision-making, reinforcing best-practice and evidence-based principles as you teach.
8. Understand licensing and certification. Understand your state’s policies and start the licensing process right away, especially if your first job is in a state other than where you completed residency. For most hospitalists, this means taking the medicine boards, then a recertification exam every 10 years, as well as regularly completing continuing medical education (CME). For those looking for a promotion down the line, familiarize yourself with the culture and selection criteria of your individual hospital or group. TH
Dr. Huang is assistant clinical professor in the department of hospital medicine at the University of California San Diego Department of Medicine. Dr. Patel is associate director of hospitalist services at Staten Island University Hospital and assistant clinical professor of medicine at SUNY-Brooklyn. Dr. Chacko is a member of SHM’s Young Physician Committee and medical director of the hospitalist program at Preferred Health Partners in New York City.