User login
Medicare Cuts Could Hit HM Hard
The final 2010 Medicare physician fee schedule presents a mixed bag for hospitalists. As officials from the Centers for Medicare and Medicaid Services (CMS) warned, the update carries a hefty 21.2% fee schedule cut. Congressional action to avert that cut is expected, though wrangling over healthcare reform may force a stopgap measure to prevent the cuts from taking effect Jan. 1.
In a statement, Jonathan Blum, director of the CMS Center for Medicare Management, said the Obama administration is committed to repealing the sustainable growth rate formula that resulted in the substantial cut. In the meantime, he said, CMS is finalizing its proposal to drop physician-administered drugs from the definition of "physician services," which is used to formulate future fee updates. SHM has strongly supported both efforts and is calling on members to contact their legislators before a Nov. 16 vote.
Another huge change for hospitalists: The use of consultation codes has been discontinued, with the exception of codes related to telemedicine. In their place, healthcare providers must bill under initial hospital care, initial nursing facility care, or initial office visits. All transfers of care, for example, will now require billing under an initial visit code rather than a subsequent visit code. Consultation documentation requirements will no longer apply, though initial codes could be valued somewhat lower than similar consultation codes despite proposed adjustments to the relative value units (RVUs). Although bad for traditional consultations, some analysts see the net change as good for the comanagement of patients.
To help smooth the transition to this new coding system, SHM will be hosting a webinar, "Hot Topics in Evaluation and Management Coding," on Dec. 2.
Academics Energized
Frank Marquez, MD, wasn't told he was going to the Academic Hospitalist Academy (AHA) until a couple of days before the start of the four-day training program in Atlanta. Short notice aside, Dr. Marquez was elated he was able to attend.
"There are a lot of practical tips. For me, the biggest thing is the academy has shown me that I have to stop being passive and start being proactive. I need to take an active role, serve on committees," says Dr. Marquez, a third-year academic hospitalist at St. Joseph's Hospital and Medical Center in Phoenix. "I think that's going to help my career."
Dr. Marquez, who leads a five-person team of residents, interns, and medical students, was one of nearly 80 early-career physicians—the average attendee had two years of HM experience—who attended AHA. The inaugural event was co-sponsored by SHM, the Society of General Internal Medicine and the Associate Chiefs of General Internal Medicine. The program featured top-flight HM faculty, but Dr. Marquez especially enjoyed the emphasis on small-group workshops and interactive teaching.
"When we first took our jobs as hospitalists, no one took the time to explain to us how to be an effective leader, mentor people, implement change," he says. "Here you have an opportunity to learn that and to participate. It’s not a lecture; it’s not intimidating. You can speak up."
Make the Diagnosis
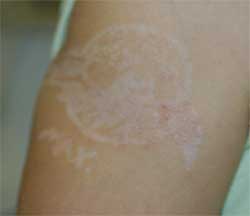
Diagnosis: Contact Dermatitis to Paraphenylenediamine
The patient’s mother reported blisters, erythema, and scabbing in the area of the tattoo. Six months later, the patient underwent paraphenylenediamine patch testing and exhibited a reaction.
The patient was treated with mild topical steroids and a 4-day prednisone course prior to presentation. A week of clobetasol ointment improved the pruritus and erythema.
Henna is a green powdered extract derived from the leaves of the Lawsonia alba plant. The active ingredient is lawsone. Middle Eastern and Indian cultures use the extract to dye the hair, skin, and nails. Contact with the skin for an extended period of time yields a brownish orange pigment. In Western countries, Henna tattoos have gained popularity as a temporary alternative to ink tattoos.
Henna may be used in its pure form, however, paraphenylenediamine (PPD) is often added to darken the pigment, expedite drying time, and improve design accuracy. PPD is an allergen found in hair dyes and photographic film processing. It is a potent T-cell stimulator, and its efficacy is directly related to concentration and duration of exposure. Patch tests among individuals with henna contact dermatitis are negative to pure henna powder but react strongly to PPD, which has lead to the assumption that PPD is the main allergen in henna paste.
Henna tattoo inks have been found to have PPD concentrations as high as 15%-30%, and, often, the inks are in contact with the skin for several days after application. The hypersensitivity can sensitize individuals to PPD-containing substances such as dark hair dyes and dark clothing. Cross reaction may cause hypersensitivity to natural rubber latex, azo dyes, thiurams, PABA sunscreen, para-aminosalicylic acid, and benzocaine.
The initial inflammatory response may present as erythematous, eczematous, pruritic, or papulovesicular eruption in the area or boundary of the original design. Edema, anaphylaxis, and collapse are less common manifestations. The inflammation can result in scarring, keloid formation, and permanent, post-inflammatory pigment changes.
As demonstrated in my patient, hypopigmentation occurs more frequently in children than adults. Therapy includes protection of the blistered area, antihistamines, treatment of infection, and aggressive topical corticosteroid therapy.
This case was first presented at Maryland Derm, at the University of Maryland School of Medicine in Baltimore, by Dr. Martin, Dr. Vera David, and Dr. Anthony Gaspari.
VTE Prophylaxis Compliance Lacking
Only one in six medical discharges receives venous thromboembolism (VTE) prophylaxis that conforms to the seventh American College of Chest Physicians (ACCP) guidelines, according to a report in the Journal of Hospital Medicine.
The study reported that, overall, 65.9% of medical discharges and 77.7% of surgical discharges received at least one order for VTE prophylaxis during hospitalization. However, when ACCP guidelines for type, dose, and duration are overlaid on the same data set, the percentage of "appropriate prophylaxis" dropped to 16.4% for medical discharges and 12.7% for surgical discharges (JHM 2009;doi 10.1002/jhm.526).
"If we're going to be in the business of healthcare safety and quality … that's not good enough," says lead investigator Alpesh Amin, MD, MBA, FHM, FACP, professor and chairman of the Department of Medicine and executive director of the hospitalist program at the University of California at Irvine. "We're only doing it appropriately [part] of the time."
Dr. Amin has turned VTE research into an area of focus, and is in San Diego today presenting two additional VTE studies at CHEST 2009. One study, "Analysis of Inpatient and Outpatient Venous Thromboembolism Prophylaxis Patterns in U.S. Critical Care Patients," found that of 1,279 discharges analyzed, only 4% continued prophylaxis. The other study, "VTE Prophylaxis Across the Continuum of Care in U.S. Medical and Surgical Patients at Risk of Venous Thromboembolism," reported nearly 90% of patients received no outpatient prophylaxis.
All three studies were supported by Sanofi-Aventis U.S. Inc. The CHEST 2009 presentations have not been published yet. Dr. Amin says the studies show hospitalists can take charge of VTE orders to assure treatment is delivered in line with approved protocols.
"The idea of these studies was to say, 'We've got these national recommendations; how well are we actually doing?' " Dr. Amin says. "You can do something, but you ought to do it according to national guidelines."
For more information on the essential elements of VTE prevention and performance improvement, visit SHM's VTE Resource Room.
In the Literature: Research You Need to Know
Clinical question: Does PR prolongation have any clinical significance in ambulatory adults?
Background: Several studies have suggested that first-degree atrio-ventricular block (AVB) is associated with a benign prognosis. However, these studies were based on young, active men in the military. Another study, which was based on middle-aged men, has suggested that AVB may be associated with coronary artery disease. Little is known about AVB prognosis in ambulatory individuals older than 20 years of age.
Study design: Prospective cohort study.
Setting: Community-hospital-based patients.
Synopsis: A subset population of 7,575 individuals older than 20 from the Framingham Heart Study showed that a prolonged PR interval of more than 200 msec is associated with an increased risk of atrial fibrillation/flutter, pacemaker implantation, and all-cause mortality.
When adjusted for age, sex, cardiovascular disease status, body mass index, hypertension, smoking, diabetes, and ratio of total to high-density lipoprotein cholesterol, individuals with first-degree AVB had a twofold adjusted risk of atrial fibrillation (HR, 2.06; 95% CI, 1.36-3.12; P<0.001), a threefold adjusted risk of pacemaker implantation (HR, 2.89; 95% CI, 1.83-4.57; P<0.001), and 1.4-fold adjusted risk of all-cause mortality (HR, 1.44, 95% CI, 1.09-1.91; P=0.01).
This study was confounded by the usual limitations of the Framingham Study Database. Most notably, this study focused specifically on ambulatory patients with prolonged PR interval demonstrated on routine electrocardiogram and, therefore, does not account for factors commonly related to the inpatient setting, such as electrolyte abnormalities. Hospitalists should neither prognosticate nor plan more frequent follow-up for patients based on a prolonged PR interval based on an EKG obtained during acute illness.
Bottom line: PR prolongation is associated with increased risks of atrial fibrillation/flutter, pacemaker implantation, and all-cause mortality in ambulatory adults.
Citation: Cheng S, Keyes M, Larson M, et al. Long-term outcomes in individuals with prolonged PR interval or first-degree atrioventricular block. JAMA. 2009;301(24):2571-2577.
—Reviewed for The Hospitalist by Robert Chang, MD; Nabil Alkhoury-Fallouh, MD; Anita Hart, MD; Hae-won Kim, MD; Francis McBee-Orzulak, MD; Helena Pasieka, MD; Division of General Medicine, University of Michigan, Ann Arbor
CTAs are promising therapeutic targets in MM
New York, NY—A new study suggests that cancer testis antigens (CTAs) should be therapeutically targeted in patients with multiple myeloma (MM).
The study revealed that CTAs are frequently expressed in newly diagnosed MM patients, the presence of certain CTAs can help predict poor survival, and MM patients experience spontaneous antibody responses to CTAs. Adam Cohen, MD, of Fox Chase Cancer Center in Philadelphia, presented this research at Lymphoma & Myeloma 2009, where it was deemed “the best myeloma abstract.”
Dr Cohen and his colleagues enrolled in their study 67 newly diagnosed MM patients. Patients received an induction regimen consisting of thalidomide, doxorubicin, and dexamethasone, and 54 patients went on to receive autologous stem cell transplant.
The researchers assessed CTA expression in cryopreserved pretreatment bone marrow plasma cells. Seventy-seven percent of patients had at least 1 CTA. MAGE-A3 was present in 52% of patients, SSX1 in 40%, CT7 in 29%, CT10 in 25%, NY-ESO1 in 21%, and SSX5 was expressed in 17% of patients. Twenty-nine percent of patients had 3 or more CTAs.
“So the main question was, what was the prognostic significance of these findings?” Dr Cohen said. “We looked at overall survival on the basis of the presence or absence of each of these antigens or based on the absolute number of antigens that were expressed. What we found were 2 antigens that really seemed to stand out, in terms of having prognostic significance.”
Patients who expressed MAGE-A3 or NY-ESO1 had worse overall survival (OS) than patients who expressed other CTAs. OS was a median of 66 months in patients with MAGE-A3 and 65 months in patients with NY-ESO1, while OS was not reached in the other patients.
The poor OS observed in patients with MAGE-A3 and NY-ESO1 was independent of disease stage, cytogenetic abnormalities, and response to induction therapy.
Dr Cohen and his colleagues then assessed pre- and post-treatment sera for antibody responses. Forty-six patients had sera available. Six patients had antibody responses to NY-ESO1. Of these patients, 2 also demonstrated responses to CT7, 1 had response to CT10, and 1 had response to SSX4.
“[A]ll these patients had immunity to NY-ESO1, but in 2 patients, number 30 and 54, there actually was no NY-ESO1 expression in their bone marrow,” Dr Cohen said. “[B]oth of these had extramedullary disease, and so the suggestion was that there may be an additional source of the NY-ESO1 antigen.”
This theory was supported by the fact that these 2 patients had soft tissue plasmacytomas. And the presence of NY-ESO1 antibody was significantly associated with soft tissue involvement, as 67% of NY-ESO1 antibody-positive patients had soft tissue plasmacytomas.
In addition, antibody response against NY-ESO1 was associated with poor OS. NY-ESO1 antibody-positive patients had an OS of 21 months, while OS was not reached in NY-ESO1 antibody-negative patients.
Dr Cohen presented these data at Lymphoma & Myeloma 2009, which took place October 22-24. ![]()
AUDIO: Billing and Coding
John Gilbert, MD, discusses SHM's "Fundamentals of Inpatient Billing and Coding" pre-course at HM09.
John Gilbert, MD, discusses SHM's "Fundamentals of Inpatient Billing and Coding" pre-course at HM09.
John Gilbert, MD, discusses SHM's "Fundamentals of Inpatient Billing and Coding" pre-course at HM09.
Dr. Hospitalist

H1N1 Update for Hospital-Based Physicians
Can you relay the latest information regarding swine flu?
K. Thane, MD, Lincoln, Neb.
Dr. Hospitalist responds: Dr. Thane, please do not feel alone. The information regarding 2009 novel H1N1 influenza (swine flu) has been coming out quickly, and the recommendations have been evolving over time. I commend you for your efforts to keep up with the information. All of us have an important role in this pandemic.
I suspect that some of the information I am providing might have changed by the time this article is published. The best advice I can give you is to frequently check the H1N1 flu section of the Centers for Disease Control and Prevention Web site (www.cdc.gov). The CDC’s “FluView” is particularly helpful. It is a weekly “surveillance report” prepared by the CDC’s influenza division. It offers activity estimates reported by “state and territorial epidemiologists.”
Here is a list of what I consider to be the most interesting facts and recommendations regarding the H1N1 pandemic:
5. Fever (93%) and cough (83%) are the most common symptoms of hospitalized patients with the novel H1N1 influenza. Less-frequent symptoms include shortness of breath (54%) and fatigue (40%).
4. Preliminary observation suggests that obesity may be a risk factor for hospitalization and death. A body mass index (BMI) greater than or equal to 40 appears to increase risk of hospitalization and death. Patients with a BMI of 30 to 39 might also be at increased risk.
3. The CDC recommends testing for all patients hospitalized with suspected H1N1 influenza. There are a number of diagnostic tests commercially available to detect the presence of influenza virus in respiratory specimens: cell culture, direct antigen tests, and detection of influenza RNA by reverse transcriptase polymerase chain reaction (rT-PCR). The rT-PCR is the most sensitive and specific test. The test takes about four to six hours and differentiates between influenza types and subtypes.
The rapid influenza detection tests are direct antigen tests that detect influenza viral nucleoproteins. These tests offer the advantage of producing results within 30 minutes, but the sensitivity is lower than viral culture or rT-PCR. Several commercially available rapid antigen tests can differentiate between influenza A and B, but none can differentiate influenza subtypes.
2. All patients at high risk for complications from known or suspected H1N1 influenza should be treated with antiviral medications. Treatment should start as soon as possible, even before laboratory confirmation of infection. High-risk groups include patients 5 years and younger or 65 years and older, pregnant women, those with chronic medical or immunosuppressive conditions, and patients 19 years or younger on chronic aspirin therapy. All patients hospitalized with the novel H1N1 influenza should be treated with antiviral medications regardless of time of symptom onset.
Oseltamivir (Tamiflue) or zanamivir (Relenza) are recommended for treatment. Oseltamivir is administered by mouth, 75 mg twice daily for five days. Zanamivir is orally inhaled, 10 mg every 12 hours for five days. Oseltamivir resistance does not predict Zanamivir resistance.
1. Chemoprophylaxis is recommended for individuals at high risk for complications who were in close contact with an individual with known or suspected H1N1 influenza. It is not necessary in healthy children and adults, and it is not recommended more than 48 hours after exposure. Sitting across a table from a symptomatic patient would not be considered close contact. TH
Fiduciary Responsibility

Editor’s note: Second of a two-part series.
Many issues that influence hospitalist budgets, specifically the amount of financial support provided by the hospital, are common in most HM practices. Last month I addressed issues related to collecting professional fee revenue (see “Budget Checkup,” October 2009, p. 54). This month I’ll turn to operations that have a significant influence on the practice’s financial picture.
Staffing and Scheduling
My experience is that hospitalists think carefully about the effect of their chosen schedule on a physician’s lifestyle (e.g., make HM a career path and minimize the risk of burnout) and patient-hospitalist continuity. But rarely do I find evidence that the group has acknowledged the effect of their schedules on the budget.
Here’s a common example. As patient volume grows, most groups find that the volume of admissions from late in the afternoon to around 10 or 11 p.m. is too high for one doctor to manage. So the group decides to add an evening shift (often called a “swing shift”). And because all previous shifts in the practice have been 12 hours long, they decide to make the evening shift last 12 hours as well. Many groups adhere to this physician schedule even if patient volume only requires evening-shift coverage from 5 p.m. until around 10 or 11 at night. By choosing a 12-hour evening shift, rather than the five or six hours that are really needed, the practice may be paying for about six hours of unnecessary coverage each day. Six hours more per day is 42 hours per week; I don’t have to tell you that this system can get really expensive very quickly.
Another common example: A group that uses a seven-on/seven-off schedule will add two new full-time equivalent (FTE) employees at the same time to preserve the symmetry required by the schedule, even if patient volume justifies adding only 0.5 to 1.0 FTE.
My point in these examples is not to suggest the right schedule for your group, but to provide a reminder that the schedule has a significant impact on the budget (see “Staffing Strategies,” January 2007, p. 50).
NPP Roles
Physician assistants and nurse practitioners, which I refer to collectively as non-physician providers (NPPs), can make valuable contributions to hospitalist practices. Just as it would do for an MD hospitalist, a practice should assess NPP contribution to important metrics, such as quality of care, throughput, stakeholder satisfaction, and practice economics. I have worked with practices that never give much thought to whether their NPPs occupy the right roles in the practice—positions that allow NPPs to make significant, cost-effective, and career-satisfying contributions.
A simple exercise that can be very helpful is to determine the total cost to employ NPPs (salary and benefits) and think about whether the practice would be better off if those dollars were spent on physicians. If the return on investing in NPPs is less than the return on investing in physicians, the practice should consider adjusting the NPPs’ roles and/or schedules (see “Role Refinement,” September 2009, p. 53).
I’m not suggesting that the only measure of NPP value is in dollars or professional fee revenue billed. Instead, the group’s return on investment should be viewed broadly and include things that don’t appear in financial statements, such as quality, efficiency, patient satisfaction, etc.
Arbitrary Definitions
SHM’s “2007-2008 Bi-Annual Survey on the State of the Hospital Medicine Movement” shows full-time hospitalists work an average of 2,172 hours annually. This might not be a reliable figure. Even so, many practices define full-time work based on annual hours (or shifts), but the doctors regularly adjust actual number of hours worked depending on that day’s workload, and few practices rigorously track actual hours worked. So I think data on hours worked annually (from SHM or other sources) should not be used as reliable or valid target for a practice.
Annual number of shifts worked can be reported by a practice more reliably but usually isn’t included in surveys because shift lengths can vary significantly from one place to the next. Ultimately, the number of hours or shifts that define full-time work for a given practice is arbitrary. And it has an impact on the budget.
Many—maybe most—practices arrive at a definition of full-time work based on annual hours, and any provider who works more than that number is paid for “extra” hours or shifts. If the number of hours or shifts that define full-time work is set low, the practice will end up paying for a lot of extra hours or shifts. Payment beyond the projected salary allowance can cause the practice budget to balloon.
One test to see if this might be an issue in your practice is to total the compensation and productivity (e.g., work relative value units, or wRVUs, or billable encounters) for each doctor in the practice. Analyze how the compensation per wRVU or encounter compares with survey data. If your group is higher than survey data, then the definition of full-time work might be unreasonably low, and vice versa.
Night-Shift Costs
Hospitalist night shifts tend to result in low productivity until the practice has grown enough that there are six to eight daytime hospitalists (rounder/admitter) for every night-shift doctor. Still, most small practices find that it is worthwhile to schedule a separate in-house night shift. The cost of the additional FTEs required to staff a separate night shift can be significant, and is a reason many very small practices require more financial support per FTE hospitalist from the hospital than larger practices.
In most cases, I think it is in the hospital’s best interest to provide support for a separate night shift (see “Finding and Keeping Dedicated Noctornists,” February 2008, p. 61). If the practice budget, or amount of support required of the hospital, is seen as excessive, it is worth estimating how much of the excess is attributable to the expensive night shift.
One simple way to do this is to think about the amount of hospital support that goes to each doctor during each shift. For example, if a hospitalist works 182 shifts a year and is compensated $230,000 (salary and bonus at $200,000, and benefits at $30,000 annually), then the doctor costs the practice $1,264 per shift. You might conduct an analysis and learn that the doctor averages $900 in collected professional fees during a day shift and $500 during a night shift. That means more hospital support goes to cover a night shift ($764) than a day shift ($364). Put another way, in this example, each night shift worked by a doctor requires $400 more hospital support per shift than the day-shift hospitalist ($764 vs. $364). In most cases, the hospital realizes a significant return on spending the extra money on the night shifts.
Hospitalist Productivity
Some hospitals have systems of care that interfere with hospitalist productivity. These could be such things as a poorly organized medical record, an IT system that requires logging into multiple programs to retrieve data on a single patient, or hospitalists being required to do clerical work. Productivity also is influenced by time spent on nonclinical activities, which leads to decreasing professional fee revenue. Every practice should think carefully about the systems and activities that might be getting in the way of efficiency. TH
Dr. Nelson has been a practicing hospitalist since 1988 and is co-founder and past president of SHM. He is a principal in Nelson Flores Hospital Medicine Consultants, a national hospitalist practice management consulting firm (www.nelsonflores.com). He is co-director and faculty for SHM’s “Best Practices in Managing a Hospital Medicine Program” course. This column represents his views and is not intended to reflect an official position of SHM.
Certified Special

“I don’t want to be rude or sarcastic,” he implored rudely and sarcastically, a pretentious smirk materializing, “but for hospital medicine to be considered a specialty, don’t you need to do something ‘special’?”
As I spun my internal Rolodex of responses for a setting-appropriate rebuttal, he exchanged knowing glances with the group of grizzled subspecialist academics surrounding him. The crowd, sensing its young prey was cornered, looked on with pitch-forked stares. The prey, sweaty-palmed and tachycardic, made a valiant yet ultimately futile attempt to stave off the questioner.
This exchange came during the question-and-answer portion of a medical grand rounds presentation that I made as a visiting professor at a major academic medical center many years ago. I was asked to talk about the growing specialty of HM, then a relatively new concept to the starched white coats in the academic ivory tower. To be fair, my interpretation of this interaction might be tainted by transference of an early-career inferiority complex. The inquiry had more than a kernel of legitimacy. Is HM really anything special? That query has lived with me for years in the form of a running internal discussion I’ve had with that questioner’s visage.
A Hospitalist is Born
I distinctly remember the day I became a hospitalist. Unlike for most of you, it wasn’t the day I began practicing as a hospitalist. Rather, it was about two years after I started, when my boss dropped off a brochure to join the National Association of Inpatient Physicians (NAIP). “You should probably join this group, whatever it is,” my nonhospitalist boss said dismissively. I nodded my head approvingly, my face contorting into a deferential and admiring look that indicated appreciation for the boss’s all-knowing greatness (note to my hospitalist group: Read that last sentence again). Moments later, I accessed this group’s Web page and found that the position I’d really been filling, what we called “attending on the medical wards 10 months a year,” was called a “hospitalist.”
OK, I had a name.
But was I special?
Growing Up and Finding Our ‘Disease’
Over the ensuing years, NAIP became SHM, HM textbooks were written, national and local CME meetings sprouted up, and a newsmagazine (this one) and medical journal for hospitalists (Journal of Hospital Medicine) were born.
“That’s terrific,” my imaginary grand rounds visage patronizes, “but a specialty needs more than a few people. It needs a critical mass of providers.”
By the beginning of this decade, the number of hospitalists had surpassed the number of practitioners in such time-honored specialties as geriatrics, critical care, and infectious diseases. By 2005, estimates had hospitalists trumping the number of cardiology and emergency medicine doctors. It is likely that the next decade will see the field mushroom to as many as 50,000, even 70,000, providers.
“But you don’t ‘own’ a disease,” exclaims the organ-centric visage. “You can’t be a specialty without ‘owning’ something.”
About five years ago, SHM decided to embrace VTE as a “hospitalist disease.” For sure, we treat the vast majority of pulmonary embolisms and DVTs, and we are best positioned to prevent the hospital-acquired variants. This, along with the realization that hospitalists care for the vast majority of myocardial infarctions, pneumonia, and stroke cases, provided us several diseases to “own,” or at least share with our subspecialist colleagues. The past decade has seen hospitalists take—and eventually run with—the QI and patient-safety baton. These are not diseases per se, but efforts poised to define the next generation of U.S. healthcare.
Research Agenda
“Let’s be clear,” my visage chides grumpily. “Owning a disease means more than caring for patients with it. You have to build a research agenda and advance the science of that field.”
HM now counts numerous primary research-based training fellowships and hospitalist researchers. The result is a growing cadre of research-funded hospitalists establishing careers in QI, patient safety, and comparative-effectiveness work around inpatient disease states. Additionally, SHM recently decided to begin funding early-career researchers to bolster the ranks of hospitalist researchers.
Training: The Next Frontier
“That’s cute,” the visage condescends, “but come on—you just can’t be a specialty without training programs. How can you be special if anyone coming out of residency training can do what you do?”
This is a question that has preoccupied me for years. Is there really something that hospitalists do that the typical graduating resident isn’t trained to do? The answer is clear to anyone who has reviewed the published literature—or practiced HM.1,2 Necessity dictates that hospitalists become experts in the perioperative management of surgical patients, provide the bulk of care for acute stroke and many neurosurgical patients, be front-line palliative-care providers, and grant a level of medical consultation that is infrequently stressed in residency training.
Moreover, hospitalists require a strong understanding of healthcare finance, transitions of care, and leadership and communication skills that are underemphasized in most training programs. On top of that, we are tasked with improving hospital efficiency, stewarding hospital resources, and tackling the myriad patient safety and QI initiatives being foisted upon American hospitals. Traditional residency training falls short in most of these categories. Educators are taking note, quickly adapting their HM-focused programs.3
“All right, maybe you’re right there, but you can’t be a specialty without certification. Period, end of story,” my friend, now exasperated, states.
Specialty Status
Enter the recently announced American Board of Internal Medicine’s (ABIM) Recognition of Focused Practice (RFP) in Hospital Medicine program. Although the full details have yet to be released, the RFP in HM will utilize the ABIM’s maintenance of certification (MOC) process that all internists are required to partake in at least every 10 years after their initial certification. Certification in HM will most likely include successful completion of four baseline requirements, starting with the ability to document that an applicant has truly focused their practice on inpatient medicine.
Next, diplomates will have to apply their QI skills to HM-based PIMs, or practice improvement modules. Additionally, diplomates will have to complete hospitalist-specific Self-Evaluation Program (SEPs) modules in medical knowledge. And, of course, there will be a secure examination written specifically for hospitalists that is focused on inpatient medicine (see “A-Plus Achievement,” p. 1).
So, as I reminisce fondly with my imaginary visage, it is with the clarity that the next time I give medical grand rounds, I will do so as an unquestioned specialist. TH
Dr. Glasheen is associate professor of medicine at the University of Colorado Denver, where he serves as director of the Hospital Medicine Program and the Hospitalist Training Program, and as associate program director of the Internal Medicine Residency Program.
References
- Plauth WH III, Pantilat SZ, Wachter RM, Fenton CL. Hospitalists’ perceptions of their residency training needs: results of a national survey. Am J Med. 2001;111(3):247-254.
- Glasheen JJ, Epstein KR, Siegal E, Kutner J, Prochazka AV. The spectrum of community-based hospitalist practice: a call to tailor internal medicine residency training. Arch Intern Med. 2007;167(7): 727-728.
- Glasheen JJ, Siegal EM, Epstein K, Kutner, J, Prochazka AV. Fulfilling the promise of hospital medicine: Tailoring internal medicine training to address hospitalists’ needs. J Gen Intern Med. 2008;23(7): 1110-1115.