User login
Things We Do For No Reason: Echocardiogram in Unselected Patients with Syncope
The “Things We Do for No Reason” (TWDFNR) series reviews practices that have become common parts of hospital care but which may provide little value to our patients. Practices reviewed in the TWDFNR series do not represent “black and white” conclusions or clinical practice standards, but are meant as a starting place for research and active discussions among hospitalists and patients. We invite you to be part of that discussion. https://www.choosingwisely.org/

Syncope is a common cause of emergency department (ED) visits and hospitalizations. Echocardiogram is frequently used as a diagnostic tool in the evaluation of syncope, performed in 39%-91% of patients.
CLINICAL SCENARIO
A 57-year-old woman presented to the ED after a syncopal episode. She had just eaten dinner when she slumped over and became unresponsive. Her husband estimated that she regained consciousness 30 seconds later and quickly returned to baseline mental status. She denied chest pain, shortness of breath, or palpitations. Her medical history included hypertension and hypothyroidism. Her medication regimen was unchanged.
Vital signs, including orthostatic blood pressures, were within normal ranges. A physical examination revealed regular heart sounds without murmur, rub, or gallop. ECG showed normal sinus rhythm, normal axis, and normal intervals. Chest radiograph, complete blood count, chemistry, pro-brain natriuretic peptide (pro-BNP), and troponin were within normal ranges.
BACKGROUND
Syncope, defined as “abrupt, transient, complete loss of consciousness, associated with inability to maintain postural tone, with rapid and spontaneous recovery,”1 is a common clinical problem, accounting for 1% of ED visits in the United States.2 As syncope has been shown to be associated with increased mortality,3 the primary goal of syncope evaluation is to identify modifiable underlying causes, particularly cardiac causes. Current guidelines recommend a complete history and physical, orthostatic blood pressure measurement, and ECG as the initial evaluation for syncope.1 Echocardiogram is a frequent additional test, performed in 39%-91% of patients.4-8
WHY YOU MAY THINK ECHOCARDIOGRAM IS HELPFUL
Echocardiogram may identify depressed ejection fraction, a risk factor for ventricular arrhythmias, along with structural causes of syncope, including aortic stenosis, pulmonary hypertension, and hypertrophic cardiomyopathy.9 Structural heart disease is the underlying etiology in about 3% of patients with syncope.10
Prior guidelines stated that “an echocardiogram is a helpful screening test if the history, physical examination, and ECG do not provide a diagnosis or if underlying heart disease is suspected.”11 A separate guideline for the appropriate use of echocardiogram assigned a score of appropriateness on a 1-9 scale based on increasing indication.12 Echocardiogram for syncope was scored a 7 in patients with “no other symptoms or signs of cardiovascular disease.”12 Only 25%-40% of patients with syncope will have a cause identified after the history, physical examination, and ECG,13,14 creating diagnostic uncertainty that often leads to further testing.
WHY ECHOCARDIOGRAM IS NOT NECESSARY IN ALL PATIENTS
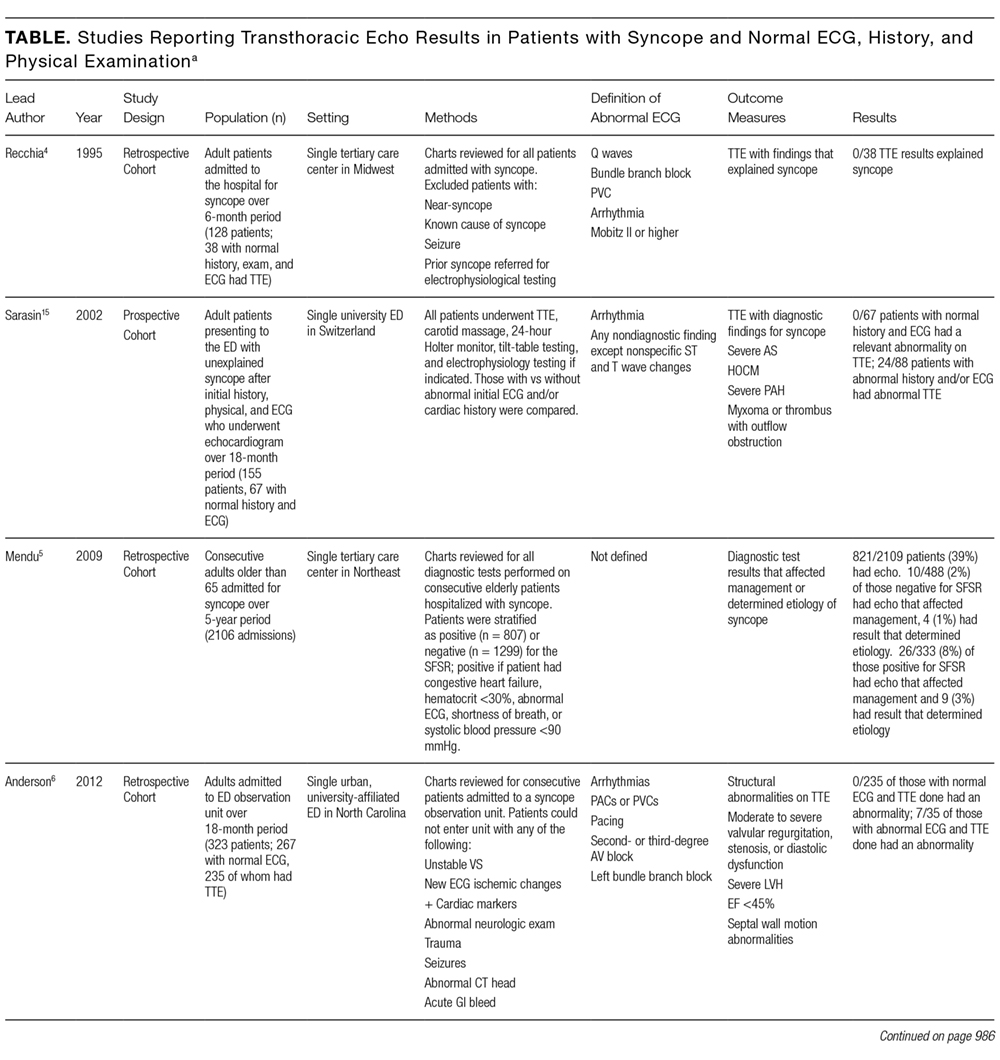

Mendu et al.5 performed a single-center, retrospective study of the diagnostic yield of testing for syncope in 2106 consecutive patients older than 65 admitted over the course of 5 years. They retrospectively applied the San Francisco Syncope Rule (SFSR), which patients met if they had congestive heart failure, hematocrit <30%, abnormal ECG, shortness of breath, or systolic blood pressure <90 mm Hg. There were 821 patients (39%) who underwent echocardiogram. Among the 488 with no SFSR criteria, 10 patients (2%) had echocardiogram results that affected management, and 4 patients (1%) had results that helped determine the etiology of syncope.
Anderson et al. studied 323 syncope patients in a single ED observation unit over 18 months.6 Patients with high-risk features, including unstable vital signs, abnormal cardiac biomarkers, or ischemic ECG changes, were excluded from the unit. The initial ECG was considered abnormal if it contained arrhythmia, premature atrial or ventricular contractions, pacing, second- or third-degree heart block, or left bundle branch block. Of the 235 patients with a normal ECG who underwent echocardiogram, none had an abnormal study.
Chang et al.7 performed a retrospective review of 468 patients admitted with syncope at a single hospital. Charts were reviewed for ECG and echocardiogram results. Abnormal ECGs were defined as those containing arrhythmias, Q waves, ischemic changes, second- and third-degree heart block, paced rhythm, corrected QT interval (QTc) >500 ms, left bundle branch or bifasicular block, Brugada pattern, or abnormal axis. Among 321 patients with normal ECGs, echocardiograms were performed in 192. Eleven of those echocardiograms were abnormal: 3 demonstrated aortic stenosis in patients who already carried the diagnosis, and the other 8 abnormal echocardiograms revealed unexpected left ventricular ejection fractions <45% or other nonaortic valvular pathology. None of the findings were felt to be the cause of syncope.
Han et al.8 performed a retrospective cohort study of all syncope patients presenting to a single ED over the course of 1 year. Patients were stratified as high risk if they had chest pain, palpitations, a history of cardiac disease (defined as prior arrhythmia, heart failure, coronary artery disease, or structural heart disease), abnormal cardiac biomarkers, or an abnormal ECG (defined as sinus bradycardia, arrhythmia, premature beats, second- or third-degree heart block, ventricular hypertrophy, ischemic Q or ST changes, or abnormal QT interval). Patients with none of those symptoms or findings were considered low risk. Of those categorized as low risk (n = 115), 47 underwent echocardiogram, only 1 of which was abnormal.
Across studies, the percentage of patients with a normal cardiac history, examination, and ECG with new, significant abnormalities on echocardiogram was 0% in 3 studies (n = 340),4,6,15 2% in 1 study (10/488 patients),5 2.1% in 1 study (1/47 patients),8 and 4.2% in 1 study (8/192 patients).7 The 11 echocardiograms with significant findings in the studies by Mendu et al.5 and Han et al.8 were not further described. The 8 patients with abnormal echocardiograms reported by Chang et al.7 had depressed left ventricular ejection fraction or nonaortic valvular disease that did not represent a definitive etiology of their syncope. Given the cost of $1,000 to $2,220 per study,16 routine echocardiograms in patients with a normal history, examination, and ECG would thus require $60,000 to $132,000 in spending to find 1 new significant abnormality, which may be unrelated to the actual cause of syncope.
SITUATIONS IN WHICH ECHOCARDIOGRAM MAY BE HELPFUL
The diagnostic yield of echocardiogram is higher in patients with a positive cardiac history or abnormal ECG. In the prospective study by Sarasin et al.15 a total of 27% of patients with a positive cardiac history or abnormal ECG were found to have an ejection fraction less than or equal to 40%. Other studies reporting percentages of abnormal echocardiograms in patients with abnormal history, ECG, or examination found rates of 8% (26/333),5 20% (7/35),6 28% (27/97),8 and 29% (27/93).7 It should be noted that not all of these abnormalities were felt to be the cause of syncope. For example, Sarasin et al.15 reported that only half of the patients with newly identified depressed ejection fraction were diagnosed with arrhythmia-related syncope. Chang et al7 reported that 6 of the 27 patients (22%) with abnormal ECG and echocardiogram had the cause of syncope established by echocardiogram.
Finally, some syncope patients will have cardiac biomarkers sent in the ED. Han et al.8 found that among patients with syncope, those with abnormal versus normal echocardiogram were more likely to have elevated BNP (70% vs 23%) and troponin (36% vs 12.4%). Thus, obtaining an echocardiogram in patients with syncope and abnormal cardiac biomarkers may be reasonable. It should be noted, however, that while some studies have suggested a role for biomarkers in differentiating cardiac from noncardiac syncope,17-20 current guidelines state that the usefulness of these tests is uncertain.1
WHAT YOU SHOULD DO INSTEAD OF ECHOCARDIOGRAM FOR ALL PATIENTS
Clinicians should carefully screen patients with syncope for abnormal findings suggesting cardiac disease on history, physical examination, and ECG. Relevant cardiac history includes known coronary artery disease, valvular heart disease, arrhythmia, congestive heart failure, and risk factors for cardiac syncope (supplemental Appendix). The definition of abnormal ECG varies among studies, but abnormalities that should prompt an echocardiogram include arrhythmia, premature atrial or ventricular contractions, second- or third-degree heart block, sinus bradycardia, bundle branch or fascicular blocks, left ventricular hypertrophy, ischemic ST or T wave changes, Q waves, or a prolonged QTc interval. New guidelines from the American College of Cardiology state, “Routine cardiac imaging is not useful in the evaluation of patients with syncope unless cardiac etiology is suspected on the basis of an initial evaluation, including history, physical examination, or ECG.”1
RECOMMENDATIONS
- All patients with syncope should receive a complete history, physical examination, orthostatic vital signs, and ECG.
- Perform echocardiogram on patients with syncope and a history of cardiac disease, examination suggestive of structural heart disease or congestive heart failure, or abnormal ECG.
- Echocardiogram may be reasonable in patients with syncope and abnormal cardiac biomarkers.
CONCLUSIONS
While commonly performed as part of syncope evaluations, echocardiogram has a very low diagnostic yield in patients with a normal history, physical, and ECG. The patient described in the initial case scenario would have an extremely low likelihood of having important diagnostic information found on echocardiogram.
Disclosure
The authors have no conflicts of interest relevant to this article.
1. Shen WK, Sheldon RS, Benditt DG, et al. 2017 ACC/AHA/HRS Guideline for the Evaluation and Management of Patients With Syncope: A Report of the American College of Cardiology/American Heart Association Task Force on Clinical Practice Guidelines, and the Heart Rhythm Society. J Am Coll Cardiol. 2017;70(5):620-633. PubMed
2. Sun BC, Emond JA, Camargo CA Jr. Characteristics and admission patterns of patients presenting with syncope to U.S. emergency departments, 1992-2000. Acad Emerg Med. 2004;11(10):1029-1034. PubMed
3. Soteriades ES, Evans JC, Larson MG, et al. Incidence and prognosis of syncope. N Engl J Med. 2002;347(12):878-885. PubMed
4. Recchia D, Barzilai B. Echocardiography in the evaluation of patients with syncope. J Gen Intern Med. 1995;10(12):649-655. PubMed
5. Mendu ML, McAvay G, Lampert R, Stoehr J, Tinetti ME. Yield of diagnostic tests in evaluating syncopal episodes in older patients. Arch Intern Med. 2009;169(14):1299-1305. PubMed
6. Anderson KL, Limkakeng A, Damuth E, Chandra A. Cardiac evaluation for structural abnormalities may not be required in patients presenting with syncope and a normal ECG result in an observation unit setting. Ann Emerg Med. 2012;60(4):478-484.e1. PubMed
7. Chang NL, Shah P, Bajaj S, Virk H, Bikkina M, Shamoon F. Diagnostic Yield of Echocardiography in Syncope Patients with Normal ECG. Cardiol Res Pract. 2016;2016:1251637. PubMed
8. Han SK, Yeom SR, Lee SH, et al. Transthoracic echocardiogram in syncope patients with normal initial evaluation. Am J Emerg Med. 2017;35(2):281-284. PubMed
9. Task Force for the Diagnosis and Management of Syncope, European Society of Cardiology, European Heart Rhythm Association, et al. Guidelines for the diagnosis and management of syncope (version 2009). Eur Heart J. 2009;30(21):2631-2671.
10. Alboni P, Brignole M, Menozzi C, et al. Diagnostic value of history in patients with syncope with or without heart disease. J Am Coll Cardiol. 2001;37(7):1921-1928. PubMed
11. Strickberger SA, Benson DW, Biaggioni I, et al. AHA/ACCF Scientific Statement on the evaluation of syncope: from the American Heart Association Councils on Clinical Cardiology, Cardiovascular Nursing, Cardiovascular Disease in the Young, and Stroke, and the Quality of Care and Outcomes Research Interdisciplinary Working Group; and the American College of Cardiology Foundation: in collaboration with the Heart Rhythm Society: endorsed by the American Autonomic Society. Circulation. 2006;113(2):316-327. PubMed
12. American College of Cardiology Foundation Appropriate Use Criteria Task Force, American Society of Echocardiography, American Heart Association, et al. ACCF/ASE/AHA/ASNC/HFSA/HRS/SCAI/SCCM/SCCT/SCMR 2011 Appropriate Use Criteria for Echocardiography. A Report of the American College of Cardiology Foundation Appropriate Use Criteria Task Force, American Society of Echocardiography, American Heart Association, American Society of Nuclear Cardiology, Heart Failure Society of America, Heart Rhythm Society, Society for Cardiovascular Angiography and Interventions, Society of Critical Care Medicine, Society of Cardiovascular Computed Tomography, and Society for Cardiovascular Magnetic Resonance Endorsed by the American College of Chest Physicians. J Am Coll Cardiol. 2011;57(9):1126-1166. PubMed
13. Crane SD. Risk stratification of patients with syncope in an accident and emergency department. Emerg Med J. 2002;19(1):23-27. PubMed
14. Croci F, Brignole M, Alboni P, et al. The application of a standardized strategy of evaluation in patients with syncope referred to three syncope units. Europace. 2002;4(4):351-355. PubMed
15. Sarasin FP, Junod AF, Carballo D, Slama S, Unger PF, Louis-Simonet M. Role of echocardiography in the evaluation of syncope: a prospective study. Heart. 2002;88(4):363-367. PubMed
16. Echocardiogram Cost. http://health.costhelper.com/echocardiograms.html. 2017. Accessed January 26, 2017.
17. Thiruganasambandamoorthy V, Ramaekers R, Rahman MO, et al. Prognostic value of cardiac biomarkers in the risk stratification of syncope: a systematic review. Intern Emerg Med. 2015;10(8):1003-1014. PubMed
18. Pfister R, Diedrichs H, Larbig R, Erdmann E, Schneider CA. NT-pro-BNP for differential diagnosis in patients with syncope. Int J Cardiol. 2009;133(1):51-54. PubMed
19. Reed MJ, Mills NL, Weir CJ. Sensitive troponin assay predicts outcome in syncope. Emerg Med J. 2012;29(12):1001-1003. PubMed
20. Tanimoto K, Yukiiri K, Mizushige K, et al. Usefulness of brain natriuretic peptide as a marker for separating cardiac and noncardiac causes of syncope. Am J Cardiol. 2004;93(2):228-230. PubMed
The “Things We Do for No Reason” (TWDFNR) series reviews practices that have become common parts of hospital care but which may provide little value to our patients. Practices reviewed in the TWDFNR series do not represent “black and white” conclusions or clinical practice standards, but are meant as a starting place for research and active discussions among hospitalists and patients. We invite you to be part of that discussion. https://www.choosingwisely.org/
Syncope is a common cause of emergency department (ED) visits and hospitalizations. Echocardiogram is frequently used as a diagnostic tool in the evaluation of syncope, performed in 39%-91% of patients.
CLINICAL SCENARIO
A 57-year-old woman presented to the ED after a syncopal episode. She had just eaten dinner when she slumped over and became unresponsive. Her husband estimated that she regained consciousness 30 seconds later and quickly returned to baseline mental status. She denied chest pain, shortness of breath, or palpitations. Her medical history included hypertension and hypothyroidism. Her medication regimen was unchanged.
Vital signs, including orthostatic blood pressures, were within normal ranges. A physical examination revealed regular heart sounds without murmur, rub, or gallop. ECG showed normal sinus rhythm, normal axis, and normal intervals. Chest radiograph, complete blood count, chemistry, pro-brain natriuretic peptide (pro-BNP), and troponin were within normal ranges.
BACKGROUND
Syncope, defined as “abrupt, transient, complete loss of consciousness, associated with inability to maintain postural tone, with rapid and spontaneous recovery,”1 is a common clinical problem, accounting for 1% of ED visits in the United States.2 As syncope has been shown to be associated with increased mortality,3 the primary goal of syncope evaluation is to identify modifiable underlying causes, particularly cardiac causes. Current guidelines recommend a complete history and physical, orthostatic blood pressure measurement, and ECG as the initial evaluation for syncope.1 Echocardiogram is a frequent additional test, performed in 39%-91% of patients.4-8
WHY YOU MAY THINK ECHOCARDIOGRAM IS HELPFUL
Echocardiogram may identify depressed ejection fraction, a risk factor for ventricular arrhythmias, along with structural causes of syncope, including aortic stenosis, pulmonary hypertension, and hypertrophic cardiomyopathy.9 Structural heart disease is the underlying etiology in about 3% of patients with syncope.10
Prior guidelines stated that “an echocardiogram is a helpful screening test if the history, physical examination, and ECG do not provide a diagnosis or if underlying heart disease is suspected.”11 A separate guideline for the appropriate use of echocardiogram assigned a score of appropriateness on a 1-9 scale based on increasing indication.12 Echocardiogram for syncope was scored a 7 in patients with “no other symptoms or signs of cardiovascular disease.”12 Only 25%-40% of patients with syncope will have a cause identified after the history, physical examination, and ECG,13,14 creating diagnostic uncertainty that often leads to further testing.
WHY ECHOCARDIOGRAM IS NOT NECESSARY IN ALL PATIENTS
Mendu et al.5 performed a single-center, retrospective study of the diagnostic yield of testing for syncope in 2106 consecutive patients older than 65 admitted over the course of 5 years. They retrospectively applied the San Francisco Syncope Rule (SFSR), which patients met if they had congestive heart failure, hematocrit <30%, abnormal ECG, shortness of breath, or systolic blood pressure <90 mm Hg. There were 821 patients (39%) who underwent echocardiogram. Among the 488 with no SFSR criteria, 10 patients (2%) had echocardiogram results that affected management, and 4 patients (1%) had results that helped determine the etiology of syncope.
Anderson et al. studied 323 syncope patients in a single ED observation unit over 18 months.6 Patients with high-risk features, including unstable vital signs, abnormal cardiac biomarkers, or ischemic ECG changes, were excluded from the unit. The initial ECG was considered abnormal if it contained arrhythmia, premature atrial or ventricular contractions, pacing, second- or third-degree heart block, or left bundle branch block. Of the 235 patients with a normal ECG who underwent echocardiogram, none had an abnormal study.
Chang et al.7 performed a retrospective review of 468 patients admitted with syncope at a single hospital. Charts were reviewed for ECG and echocardiogram results. Abnormal ECGs were defined as those containing arrhythmias, Q waves, ischemic changes, second- and third-degree heart block, paced rhythm, corrected QT interval (QTc) >500 ms, left bundle branch or bifasicular block, Brugada pattern, or abnormal axis. Among 321 patients with normal ECGs, echocardiograms were performed in 192. Eleven of those echocardiograms were abnormal: 3 demonstrated aortic stenosis in patients who already carried the diagnosis, and the other 8 abnormal echocardiograms revealed unexpected left ventricular ejection fractions <45% or other nonaortic valvular pathology. None of the findings were felt to be the cause of syncope.
Han et al.8 performed a retrospective cohort study of all syncope patients presenting to a single ED over the course of 1 year. Patients were stratified as high risk if they had chest pain, palpitations, a history of cardiac disease (defined as prior arrhythmia, heart failure, coronary artery disease, or structural heart disease), abnormal cardiac biomarkers, or an abnormal ECG (defined as sinus bradycardia, arrhythmia, premature beats, second- or third-degree heart block, ventricular hypertrophy, ischemic Q or ST changes, or abnormal QT interval). Patients with none of those symptoms or findings were considered low risk. Of those categorized as low risk (n = 115), 47 underwent echocardiogram, only 1 of which was abnormal.
Across studies, the percentage of patients with a normal cardiac history, examination, and ECG with new, significant abnormalities on echocardiogram was 0% in 3 studies (n = 340),4,6,15 2% in 1 study (10/488 patients),5 2.1% in 1 study (1/47 patients),8 and 4.2% in 1 study (8/192 patients).7 The 11 echocardiograms with significant findings in the studies by Mendu et al.5 and Han et al.8 were not further described. The 8 patients with abnormal echocardiograms reported by Chang et al.7 had depressed left ventricular ejection fraction or nonaortic valvular disease that did not represent a definitive etiology of their syncope. Given the cost of $1,000 to $2,220 per study,16 routine echocardiograms in patients with a normal history, examination, and ECG would thus require $60,000 to $132,000 in spending to find 1 new significant abnormality, which may be unrelated to the actual cause of syncope.
SITUATIONS IN WHICH ECHOCARDIOGRAM MAY BE HELPFUL
The diagnostic yield of echocardiogram is higher in patients with a positive cardiac history or abnormal ECG. In the prospective study by Sarasin et al.15 a total of 27% of patients with a positive cardiac history or abnormal ECG were found to have an ejection fraction less than or equal to 40%. Other studies reporting percentages of abnormal echocardiograms in patients with abnormal history, ECG, or examination found rates of 8% (26/333),5 20% (7/35),6 28% (27/97),8 and 29% (27/93).7 It should be noted that not all of these abnormalities were felt to be the cause of syncope. For example, Sarasin et al.15 reported that only half of the patients with newly identified depressed ejection fraction were diagnosed with arrhythmia-related syncope. Chang et al7 reported that 6 of the 27 patients (22%) with abnormal ECG and echocardiogram had the cause of syncope established by echocardiogram.
Finally, some syncope patients will have cardiac biomarkers sent in the ED. Han et al.8 found that among patients with syncope, those with abnormal versus normal echocardiogram were more likely to have elevated BNP (70% vs 23%) and troponin (36% vs 12.4%). Thus, obtaining an echocardiogram in patients with syncope and abnormal cardiac biomarkers may be reasonable. It should be noted, however, that while some studies have suggested a role for biomarkers in differentiating cardiac from noncardiac syncope,17-20 current guidelines state that the usefulness of these tests is uncertain.1
WHAT YOU SHOULD DO INSTEAD OF ECHOCARDIOGRAM FOR ALL PATIENTS
Clinicians should carefully screen patients with syncope for abnormal findings suggesting cardiac disease on history, physical examination, and ECG. Relevant cardiac history includes known coronary artery disease, valvular heart disease, arrhythmia, congestive heart failure, and risk factors for cardiac syncope (supplemental Appendix). The definition of abnormal ECG varies among studies, but abnormalities that should prompt an echocardiogram include arrhythmia, premature atrial or ventricular contractions, second- or third-degree heart block, sinus bradycardia, bundle branch or fascicular blocks, left ventricular hypertrophy, ischemic ST or T wave changes, Q waves, or a prolonged QTc interval. New guidelines from the American College of Cardiology state, “Routine cardiac imaging is not useful in the evaluation of patients with syncope unless cardiac etiology is suspected on the basis of an initial evaluation, including history, physical examination, or ECG.”1
RECOMMENDATIONS
- All patients with syncope should receive a complete history, physical examination, orthostatic vital signs, and ECG.
- Perform echocardiogram on patients with syncope and a history of cardiac disease, examination suggestive of structural heart disease or congestive heart failure, or abnormal ECG.
- Echocardiogram may be reasonable in patients with syncope and abnormal cardiac biomarkers.
CONCLUSIONS
While commonly performed as part of syncope evaluations, echocardiogram has a very low diagnostic yield in patients with a normal history, physical, and ECG. The patient described in the initial case scenario would have an extremely low likelihood of having important diagnostic information found on echocardiogram.
Disclosure
The authors have no conflicts of interest relevant to this article.
1. Shen WK, Sheldon RS, Benditt DG, et al. 2017 ACC/AHA/HRS Guideline for the Evaluation and Management of Patients With Syncope: A Report of the American College of Cardiology/American Heart Association Task Force on Clinical Practice Guidelines, and the Heart Rhythm Society. J Am Coll Cardiol. 2017;70(5):620-633. PubMed
2. Sun BC, Emond JA, Camargo CA Jr. Characteristics and admission patterns of patients presenting with syncope to U.S. emergency departments, 1992-2000. Acad Emerg Med. 2004;11(10):1029-1034. PubMed
3. Soteriades ES, Evans JC, Larson MG, et al. Incidence and prognosis of syncope. N Engl J Med. 2002;347(12):878-885. PubMed
4. Recchia D, Barzilai B. Echocardiography in the evaluation of patients with syncope. J Gen Intern Med. 1995;10(12):649-655. PubMed
5. Mendu ML, McAvay G, Lampert R, Stoehr J, Tinetti ME. Yield of diagnostic tests in evaluating syncopal episodes in older patients. Arch Intern Med. 2009;169(14):1299-1305. PubMed
6. Anderson KL, Limkakeng A, Damuth E, Chandra A. Cardiac evaluation for structural abnormalities may not be required in patients presenting with syncope and a normal ECG result in an observation unit setting. Ann Emerg Med. 2012;60(4):478-484.e1. PubMed
7. Chang NL, Shah P, Bajaj S, Virk H, Bikkina M, Shamoon F. Diagnostic Yield of Echocardiography in Syncope Patients with Normal ECG. Cardiol Res Pract. 2016;2016:1251637. PubMed
8. Han SK, Yeom SR, Lee SH, et al. Transthoracic echocardiogram in syncope patients with normal initial evaluation. Am J Emerg Med. 2017;35(2):281-284. PubMed
9. Task Force for the Diagnosis and Management of Syncope, European Society of Cardiology, European Heart Rhythm Association, et al. Guidelines for the diagnosis and management of syncope (version 2009). Eur Heart J. 2009;30(21):2631-2671.
10. Alboni P, Brignole M, Menozzi C, et al. Diagnostic value of history in patients with syncope with or without heart disease. J Am Coll Cardiol. 2001;37(7):1921-1928. PubMed
11. Strickberger SA, Benson DW, Biaggioni I, et al. AHA/ACCF Scientific Statement on the evaluation of syncope: from the American Heart Association Councils on Clinical Cardiology, Cardiovascular Nursing, Cardiovascular Disease in the Young, and Stroke, and the Quality of Care and Outcomes Research Interdisciplinary Working Group; and the American College of Cardiology Foundation: in collaboration with the Heart Rhythm Society: endorsed by the American Autonomic Society. Circulation. 2006;113(2):316-327. PubMed
12. American College of Cardiology Foundation Appropriate Use Criteria Task Force, American Society of Echocardiography, American Heart Association, et al. ACCF/ASE/AHA/ASNC/HFSA/HRS/SCAI/SCCM/SCCT/SCMR 2011 Appropriate Use Criteria for Echocardiography. A Report of the American College of Cardiology Foundation Appropriate Use Criteria Task Force, American Society of Echocardiography, American Heart Association, American Society of Nuclear Cardiology, Heart Failure Society of America, Heart Rhythm Society, Society for Cardiovascular Angiography and Interventions, Society of Critical Care Medicine, Society of Cardiovascular Computed Tomography, and Society for Cardiovascular Magnetic Resonance Endorsed by the American College of Chest Physicians. J Am Coll Cardiol. 2011;57(9):1126-1166. PubMed
13. Crane SD. Risk stratification of patients with syncope in an accident and emergency department. Emerg Med J. 2002;19(1):23-27. PubMed
14. Croci F, Brignole M, Alboni P, et al. The application of a standardized strategy of evaluation in patients with syncope referred to three syncope units. Europace. 2002;4(4):351-355. PubMed
15. Sarasin FP, Junod AF, Carballo D, Slama S, Unger PF, Louis-Simonet M. Role of echocardiography in the evaluation of syncope: a prospective study. Heart. 2002;88(4):363-367. PubMed
16. Echocardiogram Cost. http://health.costhelper.com/echocardiograms.html. 2017. Accessed January 26, 2017.
17. Thiruganasambandamoorthy V, Ramaekers R, Rahman MO, et al. Prognostic value of cardiac biomarkers in the risk stratification of syncope: a systematic review. Intern Emerg Med. 2015;10(8):1003-1014. PubMed
18. Pfister R, Diedrichs H, Larbig R, Erdmann E, Schneider CA. NT-pro-BNP for differential diagnosis in patients with syncope. Int J Cardiol. 2009;133(1):51-54. PubMed
19. Reed MJ, Mills NL, Weir CJ. Sensitive troponin assay predicts outcome in syncope. Emerg Med J. 2012;29(12):1001-1003. PubMed
20. Tanimoto K, Yukiiri K, Mizushige K, et al. Usefulness of brain natriuretic peptide as a marker for separating cardiac and noncardiac causes of syncope. Am J Cardiol. 2004;93(2):228-230. PubMed
© 2017 Society of Hospital Medicine
Hospital Perceptions of Medicare’s Sepsis Quality Reporting Initiative
Sepsis affects over 1 million Americans annually, resulting in significant morbidity, mortality, and costs for hospitalized patients.1-4 There is an increasing interest in policy-oriented approaches to improving sepsis care at both the state and national levels.5,6 The most prominent policy is the Centers for Medicare and Medicaid Services (CMS) Sepsis CMS Core (SEP-1) program, which was formally implemented in October 2015; the program mandates that hospitals report their compliance with a variety of sepsis treatment processes (Table 1). Academic quality experts generally applaud the increased attention to sepsis but are concerned that the measure’s design and specifications advance beyond the existing evidence base.7,8 However, remarkably little is known about how front-line hospital quality officials perceive the program and how they are responding or not responding, to the new requirements. This knowledge gap is a critical barrier to evaluating the program’s practical impact on sepsis treatment and outcomes.
METHODS
Study Design, Setting, and Subjects
We conducted a qualitative study by using semistructured telephone interviews with hospital quality officers in the United States. We targeted hospital quality officers because they are in a position to provide overarching insights into hospitals’ perceptions of and responses to the SEP-1 program. We enrolled quality officers at general, short-stay, nonfederal acute care hospitals because those are the hospitals to which the SEP-1 program applies. We generated a stratified random sample of hospitals by using 2013 data from Medicare’s Healthcare Cost and Reporting Information System (HCRIS) database.10 We stratified by size (greater than or less than 200 total beds), teaching status (presence or absence of any resident physician trainees), and ownership (for-profit vs nonprofit), creating 8 mutually exclusive strata. This sampling frame was designed to ensure representativeness from a broad range of hospital types, not to enable comparisons across hospital types, which is outside the scope of qualitative research.
Within strata, we contacted hospitals in a random order by phone using the primary number listed in the HCRIS database. We asked the hospital operator to connect us to the chief quality officer or an appropriate alternative hospital administrator with knowledge of hospital quality-improvement activities. We limited participation to 1 respondent per hospital. We did not offer any specific incentives for participation.
The study was approved by the University of Pittsburgh Institutional Review Board with a waiver of signed informed consent.
Data Collection
Interviews were conducted by a trained research coordinator between February 2016 and October 2016. Interviews were conducted concurrently with data analysis by using a constant comparison approach.11 The constant comparison approach involves the iterative refinement of themes by comparing the existing themes to new data as they emerge during successive interviews. We chose a constant comparison approach because we wanted to systematically describe hospital responses to SEP-1 rather than specifically test individual hypotheses.11 As is typical in qualitative research, we did not set the sample size a priori but instead continued the interviews until we achieved thematic saturation.12,13
The interview script included a mix of directed and open-ended questions about respondents’ perspectives of and hospital responses to the SEP-1 program. The questions covered the following 4 domains: hospitals’ sepsis quality-improvement initiatives before and after the Medicare reporting program, reception of the hospital responses, the approach to data abstraction and reporting, and the overall impressions of the program and its impact.6-8,14 We allowed for updates and revisions of the interview guide as necessary to explore any new content and emergent themes. We piloted the interview guide on 2 hospital quality officers at our institution and then revised its structure again after interviews with the initial 6 hospitals. The complete final interview guide is available in the supplemental digital content.
Analysis
Interviews were audio recorded, transcribed, and loaded onto a secure server. We used NVivo 11 (QSR International, Cambridge, Massachusetts) for coding and analysis. We iteratively reviewed and thematically analyzed the transcripts for structural content and emergent themes, consistent with established qualitative methods.15 Three investigators reviewed the initial 20 transcripts and developed the codebook through iterative discussion and consensus. The codes were then organized into themes and subthemes. Subsequently, 1 investigator coded the remaining transcripts. The results are presented as a series of key themes supported by direct quotes from the interviews.
RESULTS
Sample Description
Perspectives on SEP-1

Responses to SEP-1

Efforts to Collect Data for SEP-1 Reporting
Respondents reported challenges in reliably and validly measuring and reporting data for the SEP-1 program. First, patient identification and the measurement of treatment processes depends largely on manual medical record review, which is subject to variation across coders. This presents a particular challenge because the clinical definition of sepsis itself is in evolution,1 creating the possibility that treating physicians could identify a given patient as having sepsis or septic shock based on the most up-to-date definitions but not based on the measure’s specifications or vice versa. Second, each case requires up to an hour of manual medical record review and patients who develop sepsis during prolonged hospitalizations can require several hours or more, which is an unprecedented length of time to spend abstracting data for a single measure.
In addressing these measurement challenges, investment in human resources is the rule. No respondent reported automating abstraction of all the SEP-1 data elements, underscoring concerns regarding the measurement burden of the SEP-1 program.7,8,14 Rather, hospitals with sufficient financial resources frequently employ full-time data abstractors and individuals responsible for ongoing performance feedback, which facilitates the iterative revision of sepsis quality-improvement initiatives. In contrast, hospitals with fewer resources often rely on contracts with third-party vendors, which delays reporting and complicates efforts to use the data for individualized performance improvement.
Efforts to Coordinate Hospital Responses Across Care Teams
Complying with the measure involves the longitudinal coordination of multiple care teams across different units, so planning and executing local hospital responses required interdepartmental and multidisciplinary stakeholder involvement. Respondents were uncertain about the ideal strategy to coordinate these quality-improvement efforts, yielding iterative changes to electronic health records (EHRs), education programs, and data collection methods. This “learning by doing” is necessary because no prior CMS quality measure is as complex as SEP-1 or as varied in the sources of data required to measure and report the results. By requiring hospitals to improve coordination of care throughout the hospital, SEP-1 presents a quality-improvement and measurement challenge that may ultimately drive innovation and better patient care.
Efforts to Improve Sepsis Diagnosis
Several hospitals are implementing sepsis screening and alerts to speed sepsis recognition and meet the measure’s time-sensitive treatment requirements. An example of a less-intensive alert is one hospital’s lowering of the threshold for lactate values that are viewed as “critical” (and thus requiring notification of the bedside clinician). Examples of more resource-intensive alerts included electronic screening for vital sign abnormalities that trigger bedside assessment for infection as well as nurse-driven manual sepsis screening tools.
Frequently, these more intensive efforts faced barriers to successful implementation related to the broader issues of performance measurement rather than the specifics of SEP-1. EHRs generally lacked built-in electronic screening capacity, and few hospitals had the resources required for customized EHR modification. Manual screening required nurses to spend time away from direct patient care. For both electronic and manual screening, respondents expressed concern about how these new alerts would fit into a care landscape already inundated with alerts, alarms, and care notifications.16,17
Efforts to Improve Sepsis Treatment
Many hospitals are implementing sepsis-specific treatment protocols and order sets designed to help meet SEP-1 treatment specifications. In hospitals and health systems with preexisting sepsis quality-improvement efforts, SEP-1 stimulated adaptation and acceleration of their efforts; in hospitals without preexisting sepsis-specific quality improvement, SEP-1 inspired de novo program development and implementation. These programs were wide ranging. Several hospitals implemented a process by which an initially elevated lactate value automates an order for a repeat lactate level, facilitating an assessment of the clinical response to treatment. Other examples include triggers for sepsis-specific treatment protocols and checklists that bedside nurses can begin without initial physician oversight. In 1 hospital, sepsis alerts triggered by emergency medical first responders initiate responses prior to hospital arrival in a manner analogous to prehospital alerts for myocardial infarction and stroke.18,19
Efforts to implement these protocols encountered several common challenges. Physicians were often resistant to adopting inflexible treatment rules that did not allow them to tailor therapies to individual patients. Furthermore, even protocols and order sets that worked in 1 setting did not necessarily generalize throughout the hospital or health system, reflecting the difficulty in implementing a highly specified measure across diverse treatment environments.
Efforts to Manage Clinician Attitudes Toward SEP-1 Implementation
In addition to addressing clinicians’ behaviors, hospitals sought to address stakeholders’ attitudes when those attitudes created barriers to SEP-1 implementation. First, hospitals frequently faced a lack of buy-in from clinicians who were resistant to the idea of protocolized care in general and who were specifically skeptical that initiatives designed to increase clinical documentation would drive improvements in patient-centered outcomes. Second, respondents had to confront a hierarchical hospital culture, which manifests not only in clinical care, but also in the quality-improvement infrastructure. Many respondents reported that physicians were more receptive to performance feedback from fellow physicians rather than nonphysician quality administrators.
Respondents described a range of approaches to counteract these attitudes. First, hospitals deployed department- and profession-specific “champions” to provide peer-to-peer performance feedback supported by data demonstrating a link between process improvements and patient outcomes. Second, many respondents noted that the addition of new clinical staff, who were often younger and more receptive to new initiatives, could alter a hospital’s quality culture; in smaller hospitals, just a few individuals could significantly alter the dynamic. Finally, when other efforts failed, some respondents indicated that top-down administrative support could persuade resistant individuals to change their approach. However, this solution worked best with employed physicians and was less effective with independent physician groups without direct financial ties to hospital performance. These efforts to overcome negative attitudes toward SEP-1 implementation required individuals’ time and energy, leading to frustration at times and adding to the resources required to comply with the program.
Planning for the Future of SEP-1
Respondents anticipate that performance of the SEP-1 measure will eventually become publicly reported and incorporated into value-based purchasing calculations. Hospitals are therefore seeking greater interaction with CMS as it makes iterative revisions to the measure because respondents expect that their hospitals’ level of performance, rather than just the act of participating, will affect hospital finances. Respondents expressed a desire for more live, interactive educational sessions with CMS moving forward, rather than limiting the opportunities for clarification to online comment forums or statements elsewhere in the public record. In addition, respondents hope that public reporting and pay-for-performance could be delayed to allow more time to work out the “kinks” in measurement and reporting.
DISCUSSION
We conducted semistructured telephone interviews with quality officers in U.S. hospitals in order to understand hospitals’ perceptions of and responses to Medicare’s SEP-1 sepsis quality-reporting program. Hospitals are struggling with the program’s complexity and investing considerable resources in order to iteratively revise their responses to the program. However, they generally believe that the program is bringing much-needed attention to sepsis diagnosis and treatment. These findings have several implications for the SEP-1 measure in particular and for hospital-based quality measurement and pay-for-performance policies in general.
First, we demonstrate that SEP-1 consistently requires a substantial investment of resources from hospitals already struggling under the weight of numerous local, state, and national quality-reporting and improvement programs.14,20,21 In aggregate, these programs can stretch hospitals’ resources to their limit. Respondents universally reported that the SEP-1 program is requiring dedicated staff to meet the data abstraction and reporting requirements as well as multicomponent quality-improvement initiatives. In the absence of well-established roadmaps for improving sepsis care, these sepsis quality-improvement efforts require experimentation and iterative revision, which can contribute to fatigue and frustration among quality officers and clinical staff. This process of innovation inherently involves successes, failures, and the risk of harm and opportunity costs that strain hospital resources.
Second, our study indicates how SEP-1 could exacerbate existing inequalities in our health system. Sepsis incidence and mortality are already higher in medically underserved regions.22 Given the resources required to respond to the SEP-1 program, optimal performance may be beyond the reach of smaller hospitals, or even larger hospitals, whose resources are already stretched to their limits. Public reporting and pay-for-performance can be adisadvantage to hospitals caring for underserved populations.23,24 To the extent that responding to sepsis-oriented public policy requires resources that certain hospitals cannot access, these policies could exacerbate existing health disparities.
Third, our findings highlight some specific ways that CMS could revise the SEP-1 program to better meet the needs of hospitals and improve outcomes for patients with sepsis. Primarily, although the program’s current specifications take an “all-or-none” approach to treatment success, a more flexible approach, such as a weighted score or composite measure that combines processes and outcomes,25,26 could allow hospitals to focus their efforts on those components of the bundle with the strongest evidence for improved patient outcomes.27 Second, policy makers need to reconcile the 2 existing clinical definitions for sepsis.1,28 CMS has already stated its plans to retain the preexisting sepsis definition,29 but this does not change the reality that frontline providers and quality officials face different, and at times conflicting, clinical definitions while caring for patients. Finally, current implementation challenges may support a delay in moving the measure toward public reporting and pay-for-performance. Hospitals are already responding to the measure in a substantial way, providing an opportunity for early quantitative evaluations of the program’s impact that could inform evidence-based revisions to the measure.
Our study has several limitations. First, by interviewing only individual quality officers within each hospital, it is possible that our findings were not representative of the perspectives of other individuals within their hospitals or the hospital as a whole; indeed, to the extent that quality officers “buy in” to quality measurement and reporting, their perspectives on SEP-1 may skew more positive than other hospital staff. Our respondents represented individuals from a range of positions within the quality infrastructure, whereas “hospital quality leaders” are often chief executive officers, chief medical officers, or vice presidents for quality.30 However, by virtue of our purposive sampling approach, we included respondents from a broad range of hospitals and found similar themes across these respondents, supporting the internal validity of our findings. Second, as is inherent in interview-based research, we cannot verify that respondents’ reports of hospital responses to SEP-1 match the actual changes implemented “on the ground.” We are reassured, however, by the fact that many of the perspectives and quality-improvement changes that respondents described align with the opinions and suggestions of academic quality experts, which are informed by clinical experience.6-8 Third, while respondents believe that hospital responses to SEP-1 are contributing to improvements in treatment and outcomes, we do not yet have robust objective data to support this opinion or to evaluate the association between quality officers’ perspectives and hospital performance. A quantitative evaluation of the clinical impact of SEP-1, as well as the relationship between hospital performance and quality officers’ perspectives on the measure, are important areas for future research.
CONCLUSIONS
In a qualitative study of hospital responses to Medicare’s SEP-1 program, we found that hospitals are implementing changes across a variety of domains and in ways that consistently require dedicated resources. Giving hospitals the flexibility to focus on treatment processes with the most direct impact on patient-centered outcomes might enhance the program’s effectiveness. Future work should quantify the program’s impact and develop novel approaches to data abstraction and quality improvement.
Disclosure
Aside from federal funding, the authors have no conflicts of interest to disclose. The authors received funding from the National Institutes of Health (IJB, F32HL132461) (JMK, K24HL133444). This work was submitted as an abstract to the 2017 American Thoracic Society International Conference, May 2017.
1. Singer M, Deutschman CS, Seymour CW, et al. The Third International Consensus Definitions for Sepsis and Septic Shock (Sepsis-3). JAMA. 2016;315(8):801-810. doi:10.1001/jama.2016.0287. PubMed
2. Angus DC, Linde-Zwirble WT, Lidicker J, Clermont G, Carcillo J, Pinsky MR. Epidemiology of severe sepsis in the United States: analysis of incidence, outcome, and associated costs of care. Crit Care Med. 2001;29(7):1303-1310. PubMed
3. Gaieski DF, Edwards JM, Kallan MJ, Carr BG. Benchmarking the incidence and mortality of severe sepsis in the United States. Crit Care Med. 2013;41(5):1167-1174. doi:10.1097/CCM.0b013e31827c09f8. PubMed
4. Liu V, Escobar GJ, Greene JD, et al. Hospital deaths in patients with sepsis from 2 independent cohorts. JAMA. 2014;312(1):90-92. doi:10.1001/jama.2014.5804. PubMed
5. Rhee C, Gohil S, Klompas M. Regulatory Mandates for Sepsis Care—Reasons for Caution. N Engl J Med. 2014;370(18):1673-1676. doi:10.1056/NEJMp1400276. PubMed
6. Cooke CR, Iwashyna TJ. Sepsis mandates: Improving inpatient care while advancing quality improvement. JAMA. 2014;312(14):1397-1398. doi:10.1001/jama.2014.11350. PubMed
7. Barbash IJ, Kahn JM, Thompson BT. Medicare’s Sepsis Reporting Program: Two Steps Forward, One Step Back. Am J Respir Crit Care Med. 2016;194(2):139-141. doi:10.1164/rccm.201604-0723ED. PubMed
8. Klompas M, Rhee C. The CMS Sepsis Mandate: Right Disease, Wrong Measure. Ann Intern Med. 2016;165(7):517-518. doi:10.7326/M16-0588. PubMed
9. Reade MC, Huang DT, Bell D, et al. Variability in management of early severe sepsis. Emerg Med J. 2010;27(2):110-115. doi:10.1136/emj.2008.070912. PubMed
10. Centers for Medicare & Medicaid Services. CMS Cost Reports. https://www.cms.gov/Research-Statistics-Data-and-Systems/Downloadable-Public-Use-Files/Cost-Reports/. Published 2017. Accessed on January 30, 2017.
11. Glaser BG. The Constant Comparative Method of Qualitative Analysis. Soc Probl. 1965;12(4):436-445. doi:10.2307/798843.
12. Morse JM. “Data Were Saturated...” Qual Health Res. 2015;25(5):587-588. doi:10.1177/1049732315576699. PubMed
13. Hennink MM, Kaiser BN, Marconi VC. Code Saturation Versus Meaning Saturation: How Many Interviews Are Enough? Qual Health Res. 2017;27(4):591-608. doi:10.1177/1049732316665344. PubMed
14. Wall MJ, Howell MD. Variation and Cost-effectiveness of Quality Measurement Programs. The Case of Sepsis Bundles. Ann Am Thorac Soc. 2015;12(11):1597-1599. doi:10.1513/AnnalsATS.201509-625ED. PubMed
15. Guest G, MacQueen KM. Handbook for Team-Based Qualitative Research. Plymouth: Altamira Press; 2008.
16. Kesselheim AS, Cresswell K, Phansalkar S, Bates DW, Sheikh A. Clinical decision support systems could be modified to reduce “alert fatigue” while still minimizing the risk of litigation. Health Aff (Millwood). 2011;30(12):2310-2317. doi:10.1377/hlthaff.2010.1111. PubMed
17. Sittig DF, Singh H. Electronic Health Records and National Patient-Safety Goals. N Engl J Med. 2012;367(19):1854-1860. doi:10.1056/NEJMsb1205420. PubMed
18. Kobayashi A, Misumida N, Aoi S, et al. STEMI notification by EMS predicts shorter door-to-balloon time and smaller infarct size. Am J Emerg Med. 2016;34(8):1610-1613. doi:10.1016/j.ajem.2016.06.022. PubMed
19. Lin CB, Peterson ED, Smith EE, et al. Emergency Medical Service Hospital Prenotification Is Associated With Improved Evaluation and Treatment of Acute Ischemic Stroke. Circ Cardiovasc Qual Outcomes. 2012;5(4):514-522. doi:10.1161/CIRCOUTCOMES.112.965210. PubMed
20. Meyer GS, Nelson EC, Pryor DB, et al. More quality measures versus measuring what matters: a call for balance and parsimony. BMJ Qual Saf. 2012;21(11):964-968. doi:10.1136/bmjqs-2012-001081. PubMed
21. Cassel CK, Conway PH, Delbanco SF, Jha AK, Saunders RS, Lee TH. Getting More Performance from Performance Measurement. N Engl J Med. 2014;371(23):2145-2147. doi:10.1056/NEJMp1408345. PubMed
22. Goodwin AJ, Nadig NR, McElligott JT, Simpson KN, Ford DW. Where You Live Matters: The Impact of Place of Residence on Severe Sepsis Incidence and Mortality. Chest. 2016;150(4):829-836. doi:10.1016/j.chest.2016.07.004. PubMed
23. Sjoding MW, Cooke CR. Readmission Penalties for Chronic Obstructive Pulmonary Disease Will Further Stress Hospitals Caring for Vulnerable Patient Populations. Am J Respir Crit Care Med. 2014;190(9):1072-1074. doi:10.1164/rccm.201407-1345LE. PubMed
24. Joynt KE, Jha AK. Characteristics of Hospitals Receiving Penalties Under the Hospital Readmissions Reduction Program. JAMA. 2013;309(4):342. doi:10.1001/jama.2012.94856. PubMed
25. Nolan T, Berwick DM. All-or-None Measurement Raises the Bar on Performance. JAMA. 2006;295(10):1168-1170. doi:10.1001/jama.295.10.1168. PubMed
26. Chen LM, Staiger DO, Birkmeyer JD, Ryan AM, Zhang W, Dimick JB. Composite quality measures for common inpatient medical conditions. Med Care. 2013;51(9):832-837. doi:10.1097/MLR.0b013e31829fa92a. PubMed
27. Rhodes A, Evans LE, Alhazzani W, et al. Surviving Sepsis Campaign: International Guidelines for Management of Sepsis and Septic Shock: 2016. Crit Care Med. 2017;45(3):486-552. doi:10.1097/CCM.0000000000002255. PubMed
28. Levy MM, Fink MP, Marshall JC, et al. 2001 SCCM/ESICM/ACCP/ATS/SIS International Sepsis Definitions Conference. Intensive Care Med. 2003;29(4):530-538. doi:10.1007/s00134-003-1662-x. PubMed
29. Townsend SR, Rivers E, Tefera L. Definitions for Sepsis and Septic Shock. JAMA. 2016;316(4):457-458. doi:10.1001/jama.2016.6374. PubMed
30. Lindenauer PK, Lagu T, Ross JS, et al. Attitudes of hospital leaders toward publicly reported measures of health care quality. JAMA Intern Med. 2014;174(12):1904-1911. doi:10.1001/jamainternmed.2014.5161. PubMed
Sepsis affects over 1 million Americans annually, resulting in significant morbidity, mortality, and costs for hospitalized patients.1-4 There is an increasing interest in policy-oriented approaches to improving sepsis care at both the state and national levels.5,6 The most prominent policy is the Centers for Medicare and Medicaid Services (CMS) Sepsis CMS Core (SEP-1) program, which was formally implemented in October 2015; the program mandates that hospitals report their compliance with a variety of sepsis treatment processes (Table 1). Academic quality experts generally applaud the increased attention to sepsis but are concerned that the measure’s design and specifications advance beyond the existing evidence base.7,8 However, remarkably little is known about how front-line hospital quality officials perceive the program and how they are responding or not responding, to the new requirements. This knowledge gap is a critical barrier to evaluating the program’s practical impact on sepsis treatment and outcomes.
METHODS
Study Design, Setting, and Subjects
We conducted a qualitative study by using semistructured telephone interviews with hospital quality officers in the United States. We targeted hospital quality officers because they are in a position to provide overarching insights into hospitals’ perceptions of and responses to the SEP-1 program. We enrolled quality officers at general, short-stay, nonfederal acute care hospitals because those are the hospitals to which the SEP-1 program applies. We generated a stratified random sample of hospitals by using 2013 data from Medicare’s Healthcare Cost and Reporting Information System (HCRIS) database.10 We stratified by size (greater than or less than 200 total beds), teaching status (presence or absence of any resident physician trainees), and ownership (for-profit vs nonprofit), creating 8 mutually exclusive strata. This sampling frame was designed to ensure representativeness from a broad range of hospital types, not to enable comparisons across hospital types, which is outside the scope of qualitative research.
Within strata, we contacted hospitals in a random order by phone using the primary number listed in the HCRIS database. We asked the hospital operator to connect us to the chief quality officer or an appropriate alternative hospital administrator with knowledge of hospital quality-improvement activities. We limited participation to 1 respondent per hospital. We did not offer any specific incentives for participation.
The study was approved by the University of Pittsburgh Institutional Review Board with a waiver of signed informed consent.
Data Collection
Interviews were conducted by a trained research coordinator between February 2016 and October 2016. Interviews were conducted concurrently with data analysis by using a constant comparison approach.11 The constant comparison approach involves the iterative refinement of themes by comparing the existing themes to new data as they emerge during successive interviews. We chose a constant comparison approach because we wanted to systematically describe hospital responses to SEP-1 rather than specifically test individual hypotheses.11 As is typical in qualitative research, we did not set the sample size a priori but instead continued the interviews until we achieved thematic saturation.12,13
The interview script included a mix of directed and open-ended questions about respondents’ perspectives of and hospital responses to the SEP-1 program. The questions covered the following 4 domains: hospitals’ sepsis quality-improvement initiatives before and after the Medicare reporting program, reception of the hospital responses, the approach to data abstraction and reporting, and the overall impressions of the program and its impact.6-8,14 We allowed for updates and revisions of the interview guide as necessary to explore any new content and emergent themes. We piloted the interview guide on 2 hospital quality officers at our institution and then revised its structure again after interviews with the initial 6 hospitals. The complete final interview guide is available in the supplemental digital content.
Analysis
Interviews were audio recorded, transcribed, and loaded onto a secure server. We used NVivo 11 (QSR International, Cambridge, Massachusetts) for coding and analysis. We iteratively reviewed and thematically analyzed the transcripts for structural content and emergent themes, consistent with established qualitative methods.15 Three investigators reviewed the initial 20 transcripts and developed the codebook through iterative discussion and consensus. The codes were then organized into themes and subthemes. Subsequently, 1 investigator coded the remaining transcripts. The results are presented as a series of key themes supported by direct quotes from the interviews.
RESULTS
Sample Description
Perspectives on SEP-1
Responses to SEP-1
Efforts to Collect Data for SEP-1 Reporting
Respondents reported challenges in reliably and validly measuring and reporting data for the SEP-1 program. First, patient identification and the measurement of treatment processes depends largely on manual medical record review, which is subject to variation across coders. This presents a particular challenge because the clinical definition of sepsis itself is in evolution,1 creating the possibility that treating physicians could identify a given patient as having sepsis or septic shock based on the most up-to-date definitions but not based on the measure’s specifications or vice versa. Second, each case requires up to an hour of manual medical record review and patients who develop sepsis during prolonged hospitalizations can require several hours or more, which is an unprecedented length of time to spend abstracting data for a single measure.
In addressing these measurement challenges, investment in human resources is the rule. No respondent reported automating abstraction of all the SEP-1 data elements, underscoring concerns regarding the measurement burden of the SEP-1 program.7,8,14 Rather, hospitals with sufficient financial resources frequently employ full-time data abstractors and individuals responsible for ongoing performance feedback, which facilitates the iterative revision of sepsis quality-improvement initiatives. In contrast, hospitals with fewer resources often rely on contracts with third-party vendors, which delays reporting and complicates efforts to use the data for individualized performance improvement.
Efforts to Coordinate Hospital Responses Across Care Teams
Complying with the measure involves the longitudinal coordination of multiple care teams across different units, so planning and executing local hospital responses required interdepartmental and multidisciplinary stakeholder involvement. Respondents were uncertain about the ideal strategy to coordinate these quality-improvement efforts, yielding iterative changes to electronic health records (EHRs), education programs, and data collection methods. This “learning by doing” is necessary because no prior CMS quality measure is as complex as SEP-1 or as varied in the sources of data required to measure and report the results. By requiring hospitals to improve coordination of care throughout the hospital, SEP-1 presents a quality-improvement and measurement challenge that may ultimately drive innovation and better patient care.
Efforts to Improve Sepsis Diagnosis
Several hospitals are implementing sepsis screening and alerts to speed sepsis recognition and meet the measure’s time-sensitive treatment requirements. An example of a less-intensive alert is one hospital’s lowering of the threshold for lactate values that are viewed as “critical” (and thus requiring notification of the bedside clinician). Examples of more resource-intensive alerts included electronic screening for vital sign abnormalities that trigger bedside assessment for infection as well as nurse-driven manual sepsis screening tools.
Frequently, these more intensive efforts faced barriers to successful implementation related to the broader issues of performance measurement rather than the specifics of SEP-1. EHRs generally lacked built-in electronic screening capacity, and few hospitals had the resources required for customized EHR modification. Manual screening required nurses to spend time away from direct patient care. For both electronic and manual screening, respondents expressed concern about how these new alerts would fit into a care landscape already inundated with alerts, alarms, and care notifications.16,17
Efforts to Improve Sepsis Treatment
Many hospitals are implementing sepsis-specific treatment protocols and order sets designed to help meet SEP-1 treatment specifications. In hospitals and health systems with preexisting sepsis quality-improvement efforts, SEP-1 stimulated adaptation and acceleration of their efforts; in hospitals without preexisting sepsis-specific quality improvement, SEP-1 inspired de novo program development and implementation. These programs were wide ranging. Several hospitals implemented a process by which an initially elevated lactate value automates an order for a repeat lactate level, facilitating an assessment of the clinical response to treatment. Other examples include triggers for sepsis-specific treatment protocols and checklists that bedside nurses can begin without initial physician oversight. In 1 hospital, sepsis alerts triggered by emergency medical first responders initiate responses prior to hospital arrival in a manner analogous to prehospital alerts for myocardial infarction and stroke.18,19
Efforts to implement these protocols encountered several common challenges. Physicians were often resistant to adopting inflexible treatment rules that did not allow them to tailor therapies to individual patients. Furthermore, even protocols and order sets that worked in 1 setting did not necessarily generalize throughout the hospital or health system, reflecting the difficulty in implementing a highly specified measure across diverse treatment environments.
Efforts to Manage Clinician Attitudes Toward SEP-1 Implementation
In addition to addressing clinicians’ behaviors, hospitals sought to address stakeholders’ attitudes when those attitudes created barriers to SEP-1 implementation. First, hospitals frequently faced a lack of buy-in from clinicians who were resistant to the idea of protocolized care in general and who were specifically skeptical that initiatives designed to increase clinical documentation would drive improvements in patient-centered outcomes. Second, respondents had to confront a hierarchical hospital culture, which manifests not only in clinical care, but also in the quality-improvement infrastructure. Many respondents reported that physicians were more receptive to performance feedback from fellow physicians rather than nonphysician quality administrators.
Respondents described a range of approaches to counteract these attitudes. First, hospitals deployed department- and profession-specific “champions” to provide peer-to-peer performance feedback supported by data demonstrating a link between process improvements and patient outcomes. Second, many respondents noted that the addition of new clinical staff, who were often younger and more receptive to new initiatives, could alter a hospital’s quality culture; in smaller hospitals, just a few individuals could significantly alter the dynamic. Finally, when other efforts failed, some respondents indicated that top-down administrative support could persuade resistant individuals to change their approach. However, this solution worked best with employed physicians and was less effective with independent physician groups without direct financial ties to hospital performance. These efforts to overcome negative attitudes toward SEP-1 implementation required individuals’ time and energy, leading to frustration at times and adding to the resources required to comply with the program.
Planning for the Future of SEP-1
Respondents anticipate that performance of the SEP-1 measure will eventually become publicly reported and incorporated into value-based purchasing calculations. Hospitals are therefore seeking greater interaction with CMS as it makes iterative revisions to the measure because respondents expect that their hospitals’ level of performance, rather than just the act of participating, will affect hospital finances. Respondents expressed a desire for more live, interactive educational sessions with CMS moving forward, rather than limiting the opportunities for clarification to online comment forums or statements elsewhere in the public record. In addition, respondents hope that public reporting and pay-for-performance could be delayed to allow more time to work out the “kinks” in measurement and reporting.
DISCUSSION
We conducted semistructured telephone interviews with quality officers in U.S. hospitals in order to understand hospitals’ perceptions of and responses to Medicare’s SEP-1 sepsis quality-reporting program. Hospitals are struggling with the program’s complexity and investing considerable resources in order to iteratively revise their responses to the program. However, they generally believe that the program is bringing much-needed attention to sepsis diagnosis and treatment. These findings have several implications for the SEP-1 measure in particular and for hospital-based quality measurement and pay-for-performance policies in general.
First, we demonstrate that SEP-1 consistently requires a substantial investment of resources from hospitals already struggling under the weight of numerous local, state, and national quality-reporting and improvement programs.14,20,21 In aggregate, these programs can stretch hospitals’ resources to their limit. Respondents universally reported that the SEP-1 program is requiring dedicated staff to meet the data abstraction and reporting requirements as well as multicomponent quality-improvement initiatives. In the absence of well-established roadmaps for improving sepsis care, these sepsis quality-improvement efforts require experimentation and iterative revision, which can contribute to fatigue and frustration among quality officers and clinical staff. This process of innovation inherently involves successes, failures, and the risk of harm and opportunity costs that strain hospital resources.
Second, our study indicates how SEP-1 could exacerbate existing inequalities in our health system. Sepsis incidence and mortality are already higher in medically underserved regions.22 Given the resources required to respond to the SEP-1 program, optimal performance may be beyond the reach of smaller hospitals, or even larger hospitals, whose resources are already stretched to their limits. Public reporting and pay-for-performance can be adisadvantage to hospitals caring for underserved populations.23,24 To the extent that responding to sepsis-oriented public policy requires resources that certain hospitals cannot access, these policies could exacerbate existing health disparities.
Third, our findings highlight some specific ways that CMS could revise the SEP-1 program to better meet the needs of hospitals and improve outcomes for patients with sepsis. Primarily, although the program’s current specifications take an “all-or-none” approach to treatment success, a more flexible approach, such as a weighted score or composite measure that combines processes and outcomes,25,26 could allow hospitals to focus their efforts on those components of the bundle with the strongest evidence for improved patient outcomes.27 Second, policy makers need to reconcile the 2 existing clinical definitions for sepsis.1,28 CMS has already stated its plans to retain the preexisting sepsis definition,29 but this does not change the reality that frontline providers and quality officials face different, and at times conflicting, clinical definitions while caring for patients. Finally, current implementation challenges may support a delay in moving the measure toward public reporting and pay-for-performance. Hospitals are already responding to the measure in a substantial way, providing an opportunity for early quantitative evaluations of the program’s impact that could inform evidence-based revisions to the measure.
Our study has several limitations. First, by interviewing only individual quality officers within each hospital, it is possible that our findings were not representative of the perspectives of other individuals within their hospitals or the hospital as a whole; indeed, to the extent that quality officers “buy in” to quality measurement and reporting, their perspectives on SEP-1 may skew more positive than other hospital staff. Our respondents represented individuals from a range of positions within the quality infrastructure, whereas “hospital quality leaders” are often chief executive officers, chief medical officers, or vice presidents for quality.30 However, by virtue of our purposive sampling approach, we included respondents from a broad range of hospitals and found similar themes across these respondents, supporting the internal validity of our findings. Second, as is inherent in interview-based research, we cannot verify that respondents’ reports of hospital responses to SEP-1 match the actual changes implemented “on the ground.” We are reassured, however, by the fact that many of the perspectives and quality-improvement changes that respondents described align with the opinions and suggestions of academic quality experts, which are informed by clinical experience.6-8 Third, while respondents believe that hospital responses to SEP-1 are contributing to improvements in treatment and outcomes, we do not yet have robust objective data to support this opinion or to evaluate the association between quality officers’ perspectives and hospital performance. A quantitative evaluation of the clinical impact of SEP-1, as well as the relationship between hospital performance and quality officers’ perspectives on the measure, are important areas for future research.
CONCLUSIONS
In a qualitative study of hospital responses to Medicare’s SEP-1 program, we found that hospitals are implementing changes across a variety of domains and in ways that consistently require dedicated resources. Giving hospitals the flexibility to focus on treatment processes with the most direct impact on patient-centered outcomes might enhance the program’s effectiveness. Future work should quantify the program’s impact and develop novel approaches to data abstraction and quality improvement.
Disclosure
Aside from federal funding, the authors have no conflicts of interest to disclose. The authors received funding from the National Institutes of Health (IJB, F32HL132461) (JMK, K24HL133444). This work was submitted as an abstract to the 2017 American Thoracic Society International Conference, May 2017.
1. Singer M, Deutschman CS, Seymour CW, et al. The Third International Consensus Definitions for Sepsis and Septic Shock (Sepsis-3). JAMA. 2016;315(8):801-810. doi:10.1001/jama.2016.0287. PubMed
2. Angus DC, Linde-Zwirble WT, Lidicker J, Clermont G, Carcillo J, Pinsky MR. Epidemiology of severe sepsis in the United States: analysis of incidence, outcome, and associated costs of care. Crit Care Med. 2001;29(7):1303-1310. PubMed
3. Gaieski DF, Edwards JM, Kallan MJ, Carr BG. Benchmarking the incidence and mortality of severe sepsis in the United States. Crit Care Med. 2013;41(5):1167-1174. doi:10.1097/CCM.0b013e31827c09f8. PubMed
4. Liu V, Escobar GJ, Greene JD, et al. Hospital deaths in patients with sepsis from 2 independent cohorts. JAMA. 2014;312(1):90-92. doi:10.1001/jama.2014.5804. PubMed
5. Rhee C, Gohil S, Klompas M. Regulatory Mandates for Sepsis Care—Reasons for Caution. N Engl J Med. 2014;370(18):1673-1676. doi:10.1056/NEJMp1400276. PubMed
6. Cooke CR, Iwashyna TJ. Sepsis mandates: Improving inpatient care while advancing quality improvement. JAMA. 2014;312(14):1397-1398. doi:10.1001/jama.2014.11350. PubMed
7. Barbash IJ, Kahn JM, Thompson BT. Medicare’s Sepsis Reporting Program: Two Steps Forward, One Step Back. Am J Respir Crit Care Med. 2016;194(2):139-141. doi:10.1164/rccm.201604-0723ED. PubMed
8. Klompas M, Rhee C. The CMS Sepsis Mandate: Right Disease, Wrong Measure. Ann Intern Med. 2016;165(7):517-518. doi:10.7326/M16-0588. PubMed
9. Reade MC, Huang DT, Bell D, et al. Variability in management of early severe sepsis. Emerg Med J. 2010;27(2):110-115. doi:10.1136/emj.2008.070912. PubMed
10. Centers for Medicare & Medicaid Services. CMS Cost Reports. https://www.cms.gov/Research-Statistics-Data-and-Systems/Downloadable-Public-Use-Files/Cost-Reports/. Published 2017. Accessed on January 30, 2017.
11. Glaser BG. The Constant Comparative Method of Qualitative Analysis. Soc Probl. 1965;12(4):436-445. doi:10.2307/798843.
12. Morse JM. “Data Were Saturated...” Qual Health Res. 2015;25(5):587-588. doi:10.1177/1049732315576699. PubMed
13. Hennink MM, Kaiser BN, Marconi VC. Code Saturation Versus Meaning Saturation: How Many Interviews Are Enough? Qual Health Res. 2017;27(4):591-608. doi:10.1177/1049732316665344. PubMed
14. Wall MJ, Howell MD. Variation and Cost-effectiveness of Quality Measurement Programs. The Case of Sepsis Bundles. Ann Am Thorac Soc. 2015;12(11):1597-1599. doi:10.1513/AnnalsATS.201509-625ED. PubMed
15. Guest G, MacQueen KM. Handbook for Team-Based Qualitative Research. Plymouth: Altamira Press; 2008.
16. Kesselheim AS, Cresswell K, Phansalkar S, Bates DW, Sheikh A. Clinical decision support systems could be modified to reduce “alert fatigue” while still minimizing the risk of litigation. Health Aff (Millwood). 2011;30(12):2310-2317. doi:10.1377/hlthaff.2010.1111. PubMed
17. Sittig DF, Singh H. Electronic Health Records and National Patient-Safety Goals. N Engl J Med. 2012;367(19):1854-1860. doi:10.1056/NEJMsb1205420. PubMed
18. Kobayashi A, Misumida N, Aoi S, et al. STEMI notification by EMS predicts shorter door-to-balloon time and smaller infarct size. Am J Emerg Med. 2016;34(8):1610-1613. doi:10.1016/j.ajem.2016.06.022. PubMed
19. Lin CB, Peterson ED, Smith EE, et al. Emergency Medical Service Hospital Prenotification Is Associated With Improved Evaluation and Treatment of Acute Ischemic Stroke. Circ Cardiovasc Qual Outcomes. 2012;5(4):514-522. doi:10.1161/CIRCOUTCOMES.112.965210. PubMed
20. Meyer GS, Nelson EC, Pryor DB, et al. More quality measures versus measuring what matters: a call for balance and parsimony. BMJ Qual Saf. 2012;21(11):964-968. doi:10.1136/bmjqs-2012-001081. PubMed
21. Cassel CK, Conway PH, Delbanco SF, Jha AK, Saunders RS, Lee TH. Getting More Performance from Performance Measurement. N Engl J Med. 2014;371(23):2145-2147. doi:10.1056/NEJMp1408345. PubMed
22. Goodwin AJ, Nadig NR, McElligott JT, Simpson KN, Ford DW. Where You Live Matters: The Impact of Place of Residence on Severe Sepsis Incidence and Mortality. Chest. 2016;150(4):829-836. doi:10.1016/j.chest.2016.07.004. PubMed
23. Sjoding MW, Cooke CR. Readmission Penalties for Chronic Obstructive Pulmonary Disease Will Further Stress Hospitals Caring for Vulnerable Patient Populations. Am J Respir Crit Care Med. 2014;190(9):1072-1074. doi:10.1164/rccm.201407-1345LE. PubMed
24. Joynt KE, Jha AK. Characteristics of Hospitals Receiving Penalties Under the Hospital Readmissions Reduction Program. JAMA. 2013;309(4):342. doi:10.1001/jama.2012.94856. PubMed
25. Nolan T, Berwick DM. All-or-None Measurement Raises the Bar on Performance. JAMA. 2006;295(10):1168-1170. doi:10.1001/jama.295.10.1168. PubMed
26. Chen LM, Staiger DO, Birkmeyer JD, Ryan AM, Zhang W, Dimick JB. Composite quality measures for common inpatient medical conditions. Med Care. 2013;51(9):832-837. doi:10.1097/MLR.0b013e31829fa92a. PubMed
27. Rhodes A, Evans LE, Alhazzani W, et al. Surviving Sepsis Campaign: International Guidelines for Management of Sepsis and Septic Shock: 2016. Crit Care Med. 2017;45(3):486-552. doi:10.1097/CCM.0000000000002255. PubMed
28. Levy MM, Fink MP, Marshall JC, et al. 2001 SCCM/ESICM/ACCP/ATS/SIS International Sepsis Definitions Conference. Intensive Care Med. 2003;29(4):530-538. doi:10.1007/s00134-003-1662-x. PubMed
29. Townsend SR, Rivers E, Tefera L. Definitions for Sepsis and Septic Shock. JAMA. 2016;316(4):457-458. doi:10.1001/jama.2016.6374. PubMed
30. Lindenauer PK, Lagu T, Ross JS, et al. Attitudes of hospital leaders toward publicly reported measures of health care quality. JAMA Intern Med. 2014;174(12):1904-1911. doi:10.1001/jamainternmed.2014.5161. PubMed
© 2017 Society of Hospital Medicine
A Randomized Cohort Controlled Trial to Compare Intern Sign-Out Training Interventions
Patient sign-outs are defined as the transition of patient care that includes the transfer of information, task accountability, and personal responsibility between providers.1-3 The adoption of mnemonics as a memory aid has been used to improve the transfer of patient information between providers.4 In the transfer of task accountability, providers transfer follow-up tasks to on-call or coverage providers and ensure that directives are understood. Joint task accountability is enhanced through collaborative giving and cross-checking of information received through assertive questioning to detect errors, and it also enables the receiver to codevelop an understanding of a patient’s condition.5-8 In the transfer of personal responsibility for the primary team’s patients, the provision of anticipatory guidance enables the coverage provider to have prospective information about potential, upcoming issues to facilitate care plans.6 Enabling coverage providers to anticipate overnight events helps them exercise responsibility for patients who are under their temporary care.2
The Accreditation Council for Graduate Medical Education requires residency programs to provide formal instruction on sign-outs.9 Yet, variability across training programs exists,8,10 with training emphasis on the transfer of information over accountability or responsibility.11 Previous studies have demonstrated the efficacy of sign-out training, such as the illness severity, patient summary, action list, situation awareness and contingency planning, and synthesis by reviewer (I-PASS) bundle.3 Yet, participation is far from 100% because the I-PASS bundle requires in-person workshops, e-learning platforms, organizational change campaigns, and faculty participation,12 involving resource and time commitments that few programs can afford. To address this issue, we seek to compare resource-efficient, knowledge-based, skill-based, compliance-based, and learner-initiated sign-out training pedagogies. We focused on the evening sign-out because it is a high-risk period when care for inpatients is transferred to smaller coverage intern teams.
METHODS
Setting and Study Design
A prospective, randomized cohort trial of 4 training interventions was conducted at an internal medicine residency program at a Mid-Atlantic, academic, tertiary-care hospital with 1192 inpatient beds. The 52 interns admitted to the program were randomly assigned to 4 firms caring for up to 25 inpatients on each floor of the hospital. The case mix faced by each firm was similar because patients were randomly assigned to firms based on bed availability. Teams of 5 interns in each firm worked in 5-day duty cycles, during which each intern rotated as a night cover for his or her firm. Interns remain in their firm throughout their residency. Sign-outs were conducted face to face with a computer. Receivers printed sign-out sheets populated with patient information and took notes when senders communicated information from the computer. The hospital’s institutional review board approved this study.
Interventions
The firms were randomly assigned to 1 of 4 one-hour quality-improvement training interventions delivered at the same time and day in November 2014 at each firm’s office, located on different floors of the hospital. There was virtually no cross-talk among the firms in the first year, which ensured the integrity of the cohort randomization and interventions. Faculty from an affiliated business school of the academic center worked with attending physicians to train the firms.
All interventions took 1 hour at noontime. Firm 1 (the control) received a didactic lecture on sign-out, which participants heard during orientation. Repeating that lecture reinforced their knowledge of sign-outs. Firm 2 was trained on the I-PASS mnemonic with a predictable progression of information elements to transfer.3,12 Interns role-played 3 scenarios to practice sign-out.3 They received skills feedback and a debriefing to link I-PASS with information elements to transfer. Firm 3 was dealt a policy mandate by the interns’ attending physician to perform specific tasks at sign-out. Senders were to provide the night cover with to-do tasks, and receivers were to actively discuss and verify these tasks to ensure task accountability.13 Firm 4 was trained on a Plan-Do-Study-Act (PDSA) protocol to identify and solve perceived barriers to sign-outs. Firm 4 agreed to solve the problem of the lack of care plans by the day team to the night cover. An ad hoc team in Firm 4 refined, pilot tested, and rolled out the solution within a month. Its protocol emphasized information on anticipated changes in patient status, providing contingency plans and their rationale as well as discussions to clarify care plans. Details of the 4 interventions are shown in the Table.
Data Collection Process
Outcomes
We measured improvements in sign-out quality by the mean percentage differences for each of the 3 dimensions of sign-out, as well as a multidimensional measure of sign-out comprising the 3 dimensions for each firm in 2 ways: (1) pre- and postintervention, and (2) vis-à-vis the control group postintervention.
Statistical Analysis
We factor analyzed the 17 sign-out elements using principal components analysis with varimax rotation to confirm their groupings within the 3 dimensions of sign-out using Statistical Package for the Social Sciences (SPSS) version 24 (IBM, North Castle, NY). We calculated the mean percentage differences and used Student t tests to evaluate statistical differences at P < 0.05.
RESULTS
Five hundred and sixty-three patient sign-outs were observed prior to the training interventions (κ = 0.646), and 620 patient sign-outs were observed after the interventions (κ = 0.648). Kappa values derived from SPSS were within acceptable interrater agreement ranges. Factor analysis of the 17 sign-out elements yielded 3 factors that we named patient information, task accountability, and responsibility, as shown in the supporting Table.
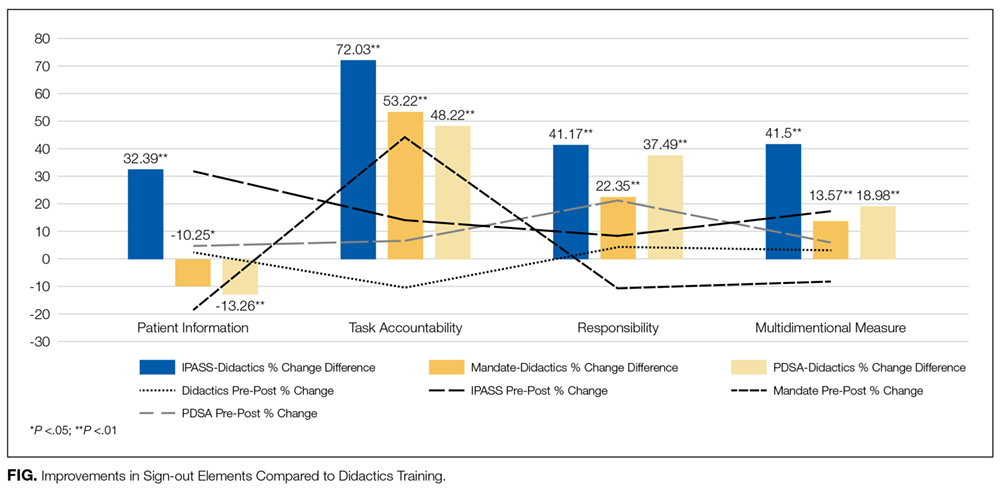
DISCUSSION
The results indicated that after only 1 hour of training, skill-based, compliance-based, and learner-initiated sign-out training improved sign-out quality beyond knowledge-based didactics even though the number of sign-out elements taught in the latter 2 was lower than in the didactics group. Different training emphases influenced different dimensions of sign-out quality so that training interns to focus on task accountability or responsibility led to improvements in those dimensions only. The lower scores in other dimensions suggest potential risks in sign-out quality from focusing attention on 1 dimension at the expense of other dimensions. I-PASS, which covered the most sign-out elements and utilized 5 facilitators, led to the best overall improvement in sign-out quality, which is consistent with previous studies.3,12 We demonstrated that only 1 hour of training on the I-PASS mnemonics using video, role-playing, and feedback led to significant improvements. This approach is portable and easily applied to any program. Potential improvements in I-PASS training could be obtained by emphasizing task accountability and responsibility because the mandate and PDSA groups obtained higher scores than the I-PASS group in these dimensions.
Limitations
We measured sign-out quality in the evening at this site because it was at greatest risk for errors. Future studies should consider daytime sign-outs, interunit handoffs, and other hospital settings, such as community or rural hospitals and nonacute patient settings, to ascertain generalizability. Data were collected from observations, so Hawthorne effects may introduce bias. However, we believe that using a standardized checklist, a control group, and assessing relative changes minimized this risk. Although we observed almost 1200 patient sign-outs over 80 shift changes, we were not able to observe every intern in every firm. Finally, no sentinel events were reported during the study period, and we did not include other measures of clinical outcomes, which represent an opportunity for future researchers to test which specific sign-out elements or dimensions are related to clinical outcomes or are relevant to specific patient types.
CONCLUSION
The results of this study indicate that 1 hour of formal training can improve sign-out quality. Program directors should consider including I-PASS with additional focus on task accountability and personal responsibility in their sign-out training plans.
Disclosure
The authors have nothing to disclose.
1. Darbyshire D, Gordon M, Baker P. Teaching handover of care to medical students. Clin Teach. 2013;10:32-37. PubMed
2. Lee SH, Phan PH, Dorman T, Weaver SJ, Pronovost PJ. Handoffs, safety culture, and practices: evidence from the hospital survey on patient safety culture. BMJ Health Serv Res. 2016;16:254. DOI 10.1186/s12913-016-1502-7. PubMed
3. Starmer AJ, O’Toole JK, Rosenbluth G, et al. Development, implementation, and dissemination of the I-PASS handoff curriculum: a multisite educational intervention to improve patient handoffs. Acad Med. 2014:89:876-884. PubMed
4. Riesenberg LA, Leitzsch J, Little BW. Systematic review of handoff mnemonics literature. Am J Med Qual. 2009;24:196-204. PubMed
5. Cohen MD, Hilligoss B, Kajdacsy-Balla A. A handoff is not a telegram: an understanding of the patient is co-constructed. Crit Care. 2012;16:303. PubMed
6. McMullan A, Parush A, Momtahan K. Transferring patient care: patterns of synchronous bidisciplinary communication between physicians and nurses during handoffs in a critical care unit. J Perianesth Nurs. 2015;30:92-104. PubMed
7. Rayo MF, Mount-Campbell AF, O’Brien JM, et al. Interactive questioning in critical care during handovers: a transcript analysis of communication behaviours by physicians, nurses and nurse practitioners. BMJ Qual Saf. 2014;23:483-489. PubMed
8. Gordon M, Findley R. Educational interventions to improve handover in health care: a systematic review. Med Educ. 2011;45:1081-1089. PubMed
9. Nasca TJ, Day SH, Amis ES Jr; ACGME Duty Hour Task Force. The new recommendations on duty hours from the ACGME Task Force. N Engl J Med. 2010;363:e3. PubMed
10. Wohlauer MV, Arora VM, Horwitz LI, et al. The patient handoff: a comprehensive curricular blueprint for resident education to improve continuity of care. Acad Med. 2012;87:411-418. PubMed
11. Riesenberg LA, Leitzsch J, Massucci JL, et al. Residents’ and attending physicians’ handoffs: a systematic review of the literature. Acad Med. 2009;84:1775-1787. PubMed
12. Huth K, Hart F, Moreau K, et al. Real-world implementation of a standardized handover program (I-PASS) on a pediatric clinical teaching unit. Acad Ped. 2016;16:532-539. PubMed
13. Jonas E, Schulz-Hardt S, Frey D, Thelen N. Confirmation bias in sequential information search after preliminary decisions: An expansion of dissonance theoretical research on selective exposure to information. J Per Soc Psy. 2001;80:557-571. PubMed
14. Joint Commission. Improving handoff communications: Meeting national patient safety goal 2E. Jt Pers Patient Saf. 2006;6:9-15.
15. Improving Hand-off Communication. Joint Commission Resources. 2007. PubMed
Patient sign-outs are defined as the transition of patient care that includes the transfer of information, task accountability, and personal responsibility between providers.1-3 The adoption of mnemonics as a memory aid has been used to improve the transfer of patient information between providers.4 In the transfer of task accountability, providers transfer follow-up tasks to on-call or coverage providers and ensure that directives are understood. Joint task accountability is enhanced through collaborative giving and cross-checking of information received through assertive questioning to detect errors, and it also enables the receiver to codevelop an understanding of a patient’s condition.5-8 In the transfer of personal responsibility for the primary team’s patients, the provision of anticipatory guidance enables the coverage provider to have prospective information about potential, upcoming issues to facilitate care plans.6 Enabling coverage providers to anticipate overnight events helps them exercise responsibility for patients who are under their temporary care.2
The Accreditation Council for Graduate Medical Education requires residency programs to provide formal instruction on sign-outs.9 Yet, variability across training programs exists,8,10 with training emphasis on the transfer of information over accountability or responsibility.11 Previous studies have demonstrated the efficacy of sign-out training, such as the illness severity, patient summary, action list, situation awareness and contingency planning, and synthesis by reviewer (I-PASS) bundle.3 Yet, participation is far from 100% because the I-PASS bundle requires in-person workshops, e-learning platforms, organizational change campaigns, and faculty participation,12 involving resource and time commitments that few programs can afford. To address this issue, we seek to compare resource-efficient, knowledge-based, skill-based, compliance-based, and learner-initiated sign-out training pedagogies. We focused on the evening sign-out because it is a high-risk period when care for inpatients is transferred to smaller coverage intern teams.
METHODS
Setting and Study Design
A prospective, randomized cohort trial of 4 training interventions was conducted at an internal medicine residency program at a Mid-Atlantic, academic, tertiary-care hospital with 1192 inpatient beds. The 52 interns admitted to the program were randomly assigned to 4 firms caring for up to 25 inpatients on each floor of the hospital. The case mix faced by each firm was similar because patients were randomly assigned to firms based on bed availability. Teams of 5 interns in each firm worked in 5-day duty cycles, during which each intern rotated as a night cover for his or her firm. Interns remain in their firm throughout their residency. Sign-outs were conducted face to face with a computer. Receivers printed sign-out sheets populated with patient information and took notes when senders communicated information from the computer. The hospital’s institutional review board approved this study.
Interventions
The firms were randomly assigned to 1 of 4 one-hour quality-improvement training interventions delivered at the same time and day in November 2014 at each firm’s office, located on different floors of the hospital. There was virtually no cross-talk among the firms in the first year, which ensured the integrity of the cohort randomization and interventions. Faculty from an affiliated business school of the academic center worked with attending physicians to train the firms.
All interventions took 1 hour at noontime. Firm 1 (the control) received a didactic lecture on sign-out, which participants heard during orientation. Repeating that lecture reinforced their knowledge of sign-outs. Firm 2 was trained on the I-PASS mnemonic with a predictable progression of information elements to transfer.3,12 Interns role-played 3 scenarios to practice sign-out.3 They received skills feedback and a debriefing to link I-PASS with information elements to transfer. Firm 3 was dealt a policy mandate by the interns’ attending physician to perform specific tasks at sign-out. Senders were to provide the night cover with to-do tasks, and receivers were to actively discuss and verify these tasks to ensure task accountability.13 Firm 4 was trained on a Plan-Do-Study-Act (PDSA) protocol to identify and solve perceived barriers to sign-outs. Firm 4 agreed to solve the problem of the lack of care plans by the day team to the night cover. An ad hoc team in Firm 4 refined, pilot tested, and rolled out the solution within a month. Its protocol emphasized information on anticipated changes in patient status, providing contingency plans and their rationale as well as discussions to clarify care plans. Details of the 4 interventions are shown in the Table.
Data Collection Process
Outcomes
We measured improvements in sign-out quality by the mean percentage differences for each of the 3 dimensions of sign-out, as well as a multidimensional measure of sign-out comprising the 3 dimensions for each firm in 2 ways: (1) pre- and postintervention, and (2) vis-à-vis the control group postintervention.
Statistical Analysis
We factor analyzed the 17 sign-out elements using principal components analysis with varimax rotation to confirm their groupings within the 3 dimensions of sign-out using Statistical Package for the Social Sciences (SPSS) version 24 (IBM, North Castle, NY). We calculated the mean percentage differences and used Student t tests to evaluate statistical differences at P < 0.05.
RESULTS
Five hundred and sixty-three patient sign-outs were observed prior to the training interventions (κ = 0.646), and 620 patient sign-outs were observed after the interventions (κ = 0.648). Kappa values derived from SPSS were within acceptable interrater agreement ranges. Factor analysis of the 17 sign-out elements yielded 3 factors that we named patient information, task accountability, and responsibility, as shown in the supporting Table.
DISCUSSION
The results indicated that after only 1 hour of training, skill-based, compliance-based, and learner-initiated sign-out training improved sign-out quality beyond knowledge-based didactics even though the number of sign-out elements taught in the latter 2 was lower than in the didactics group. Different training emphases influenced different dimensions of sign-out quality so that training interns to focus on task accountability or responsibility led to improvements in those dimensions only. The lower scores in other dimensions suggest potential risks in sign-out quality from focusing attention on 1 dimension at the expense of other dimensions. I-PASS, which covered the most sign-out elements and utilized 5 facilitators, led to the best overall improvement in sign-out quality, which is consistent with previous studies.3,12 We demonstrated that only 1 hour of training on the I-PASS mnemonics using video, role-playing, and feedback led to significant improvements. This approach is portable and easily applied to any program. Potential improvements in I-PASS training could be obtained by emphasizing task accountability and responsibility because the mandate and PDSA groups obtained higher scores than the I-PASS group in these dimensions.
Limitations
We measured sign-out quality in the evening at this site because it was at greatest risk for errors. Future studies should consider daytime sign-outs, interunit handoffs, and other hospital settings, such as community or rural hospitals and nonacute patient settings, to ascertain generalizability. Data were collected from observations, so Hawthorne effects may introduce bias. However, we believe that using a standardized checklist, a control group, and assessing relative changes minimized this risk. Although we observed almost 1200 patient sign-outs over 80 shift changes, we were not able to observe every intern in every firm. Finally, no sentinel events were reported during the study period, and we did not include other measures of clinical outcomes, which represent an opportunity for future researchers to test which specific sign-out elements or dimensions are related to clinical outcomes or are relevant to specific patient types.
CONCLUSION
The results of this study indicate that 1 hour of formal training can improve sign-out quality. Program directors should consider including I-PASS with additional focus on task accountability and personal responsibility in their sign-out training plans.
Disclosure
The authors have nothing to disclose.
1. Darbyshire D, Gordon M, Baker P. Teaching handover of care to medical students. Clin Teach. 2013;10:32-37. PubMed
2. Lee SH, Phan PH, Dorman T, Weaver SJ, Pronovost PJ. Handoffs, safety culture, and practices: evidence from the hospital survey on patient safety culture. BMJ Health Serv Res. 2016;16:254. DOI 10.1186/s12913-016-1502-7. PubMed
3. Starmer AJ, O’Toole JK, Rosenbluth G, et al. Development, implementation, and dissemination of the I-PASS handoff curriculum: a multisite educational intervention to improve patient handoffs. Acad Med. 2014:89:876-884. PubMed
4. Riesenberg LA, Leitzsch J, Little BW. Systematic review of handoff mnemonics literature. Am J Med Qual. 2009;24:196-204. PubMed
5. Cohen MD, Hilligoss B, Kajdacsy-Balla A. A handoff is not a telegram: an understanding of the patient is co-constructed. Crit Care. 2012;16:303. PubMed
6. McMullan A, Parush A, Momtahan K. Transferring patient care: patterns of synchronous bidisciplinary communication between physicians and nurses during handoffs in a critical care unit. J Perianesth Nurs. 2015;30:92-104. PubMed
7. Rayo MF, Mount-Campbell AF, O’Brien JM, et al. Interactive questioning in critical care during handovers: a transcript analysis of communication behaviours by physicians, nurses and nurse practitioners. BMJ Qual Saf. 2014;23:483-489. PubMed
8. Gordon M, Findley R. Educational interventions to improve handover in health care: a systematic review. Med Educ. 2011;45:1081-1089. PubMed
9. Nasca TJ, Day SH, Amis ES Jr; ACGME Duty Hour Task Force. The new recommendations on duty hours from the ACGME Task Force. N Engl J Med. 2010;363:e3. PubMed
10. Wohlauer MV, Arora VM, Horwitz LI, et al. The patient handoff: a comprehensive curricular blueprint for resident education to improve continuity of care. Acad Med. 2012;87:411-418. PubMed
11. Riesenberg LA, Leitzsch J, Massucci JL, et al. Residents’ and attending physicians’ handoffs: a systematic review of the literature. Acad Med. 2009;84:1775-1787. PubMed
12. Huth K, Hart F, Moreau K, et al. Real-world implementation of a standardized handover program (I-PASS) on a pediatric clinical teaching unit. Acad Ped. 2016;16:532-539. PubMed
13. Jonas E, Schulz-Hardt S, Frey D, Thelen N. Confirmation bias in sequential information search after preliminary decisions: An expansion of dissonance theoretical research on selective exposure to information. J Per Soc Psy. 2001;80:557-571. PubMed
14. Joint Commission. Improving handoff communications: Meeting national patient safety goal 2E. Jt Pers Patient Saf. 2006;6:9-15.
15. Improving Hand-off Communication. Joint Commission Resources. 2007. PubMed
© 2017 Society of Hospital Medicine
Health Literacy and Hospital Length of Stay: An Inpatient Cohort Study
Health literacy (HL), defined as patients’ ability to understand health information and make health decisions,1 is a prevalent problem in the outpatient and inpatient settings.2,3 In both settings, low HL has adverse implications for self-care including interpreting health labels4 and taking medications correctly.5 Among outpatient cohorts, HL has been associated with worse outcomes and acute care utilization.6 Associations with low HL include increased hospitalizations,7 rehospitalizations,8,9 emergency department visits,10 and decreased preventative care use.11 Among the elderly, low HL is associated with increased mortality12 and decreased self-perception of health.13
A systematic review revealed that most high-quality HL outcome studies were conducted in the outpatient setting.6 There have been very few studies assessing effects of low HL in an acute-care setting.7,14 These studies have evaluated postdischarge outcomes, including admissions or readmissions,7-9 and medication knowledge.14 To the best of our knowledge, there are no studies evaluating associations between HL and hospital length of stay (LOS).
LOS has received much attention as providers and payers focus more on resource utilization and eliminating adverse effects of prolonged hospitalization.15 LOS is multifactorial, depending on clinical characteristics like disease severity, as well as on sociocultural, demographic, and geographic factors.16 Despite evidence that LOS reductions translate into improved resource allocation and potentially fewer complications, there remains a tension between the appropriate LOS and one that is too short for a given condition.17
Because low HL is associated with inefficient resource utilization, we hypothesized that low HL would be associated with increased LOS after controlling for illness severity. Our objectives were to evaluate the association between low HL and LOS and whether such an association was modified by illness severity and sociodemographics.
METHODS
Study Design, Setting, Participants
An in-hospital, cohort study design of patients who were admitted or transferred to the general medicine service at the University of Chicago between October 2012 and November 2015 and screened for inclusion as part of a large, ongoing study of inpatient care quality was conducted.18 Exclusion criteria included observation status, age under 18 years, non-English speaking, and repeat participants. Those who died during hospitalization or whose discharge status was missing were excluded because the primary goal was to examine the association of HL and time to discharge, which could not be evaluated among those who died. We excluded participants with LOS >30 days to limit overly influential effects of extreme outliers (1% of the population).
Variables
HL was screened using the Brief Health Literacy Screen (BHLS), a validated, 3-question verbal survey not requiring adequate visual acuity to assess HL.19,20 The 3 questions are as follows: (1) “How confident are you filling out medical forms by yourself?”, (2) “How often do you have someone help you read hospital materials?”, and (3) “How often do you have problems learning about your medical condition because of difficulty understanding written information?” Responses to the questions were scored on a 5-point Likert scale in which higher scores corresponded to higher HL.21,22 The scores for each of the 3 questions were summed to yield a range between 3 and 15. On the individual questions, prior work has demonstrated improved test performance with a cutoff of ≤3, which corresponds to a response of “some of the time” or “somewhat”; therefore, when the 3 questions were summed together, scores of ≤9 were considered indicative of low HL.21,23
For severity of illness adjustment, we used relative weights derived from the 3M (3M, Maplewood, MN) All Patient Refined Diagnosis Related Groups (APR-DRG) classification system, which uses administrative data to classify the severity. The APR-DRG system assigns each admission to a DRG based on principal diagnosis; for each DRG, patients are then subdivided into 4 severity classes based on age, comorbidity, and interactions between these variables and the admitting diagnosis.24 Using the base DRG and severity score, the system assigns relative weights that reflect differences in expected hospital resource utilization.
LOS was derived from hospital administrative data and counted from the date of admission to the hospital. Participants who were discharged on the day of admission were counted as having an LOS of 1. Insurance status (Medicare, Medicaid, no payer, private) also was obtained from administrative data. Age, sex (male or female), education (junior high or less, some high school, high school graduate, some college, college graduate, postgraduate), and race (black/African American, white, Asian or Pacific Islander [including Asian Indian, Chinese, Filipino, Japanese, Korean, Vietnamese, other Asian, Native Hawaiian, Guam/Chamorro, Samoan, other Pacific], American Indian or Alaskan Native, multiple race) were obtained from administrative data based on information provided by the patient. Participants with missing data on any of the sociodemographic variables or on the APR-DRG score were excluded from the analysis.
Statistical Analysis
χ2 and 2-tailed t tests were used to compare categorical and continuous variables, respectively. Multivariate linear regressions were employed to measure associations between the independent variables (HL, illness severity, race, gender, education, and insurance status) and the dependent variable, LOS. Independent variables were chosen for clinical significance and retained in the model regardless of statistical significance. The adjusted R2 values of models with and without the HL variable included were reported to provide information on the contribution of HL to the overall model.
Because LOS was observed to be right skewed and residuals of the untransformed regression were observed to be non-normally distributed, the decision was made to natural log transform LOS, which is consistent with previous hospital LOS studies.16 Regression coefficients and confidence intervals were then transformed into percentage estimates using the following equation: 100(eβ–1). Adjusted R2 was reported for the transformed regression.
The APR-DRG relative weight was treated as a continuous variable. Sociodemographic variables were dichotomized as follows: female vs male; high school graduates vs not; African American vs not; Medicaid/no payer vs Medicare/private payer. Age was not included in the multivariate model because it has been incorporated into the weighted APR-DRG illness severity scores.
Each of the sociodemographic variables and the APR-DRG score were examined for effect modification via the same multivariate linear equation described above, with the addition of an interaction term. A separate regression was performed with an interaction term between age (dichotomized at ≥65) and HL to investigate whether age modified the association between HL and LOS. Finally, we explored whether effects were isolated to long vs short LOS by dividing the sample based on the mean LOS (≥6 days) and performing separate multivariate comparisons.
Sensitivity analyses were performed to exclude those with LOS greater than the 90th percentile and those with APR-DRG score greater than the 90th percentile; age was added to the model as a continuous variable to evaluate whether the illness severity score fully adjusted for the effects of age on LOS. Furthermore, we compared the participants with missing data to those with complete data across both dependent and independent variables. Alpha was set at 0.05; analyses were performed using Stata Version 14 (Stata, College Station, TX).
RESULTS
A total of 5983 participants met inclusion criteria and completed the HL assessment; of these participants, 75 (1%) died during hospitalization, 9 (0.2%) had missing discharge status, and 79 (1%) had LOS >30 days. Two hundred eighty (5%) were missing data on sociodemographic variables or APR-DRG score. Of the remaining (n = 5540), the mean age was 57 years (standard deviation [SD] = 19 years), over half of participants were female (57%), and the majority were African American (73%) and had graduated from high school (81%). The sample was divided into those with private insurance (25%), those with Medicare (46%), and those with Medicaid (26%); 2% had no payer. The mean APR-DRG score was 1.3 (SD = 1.2), and the scores ranged from 0.3 to 15.8.
On the BHLS screen for HL, 20% (1104/5540) had inadequate HL. Participants with low HL had higher weighted illness severity scores (average 1.4 vs 1.3; P = 0.003). Participants with low HL were also more likely to be 65 or older (55% vs 33%; P < 0.001), non-high school graduates (35% vs 15%; P < 0.001), and African American (78% vs 72%; P < 0.001), and to have Medicare or private insurance (75% vs 71%; P = 0.02). There was no significant difference with respect to gender (54% male vs 57% female; P = 0.1)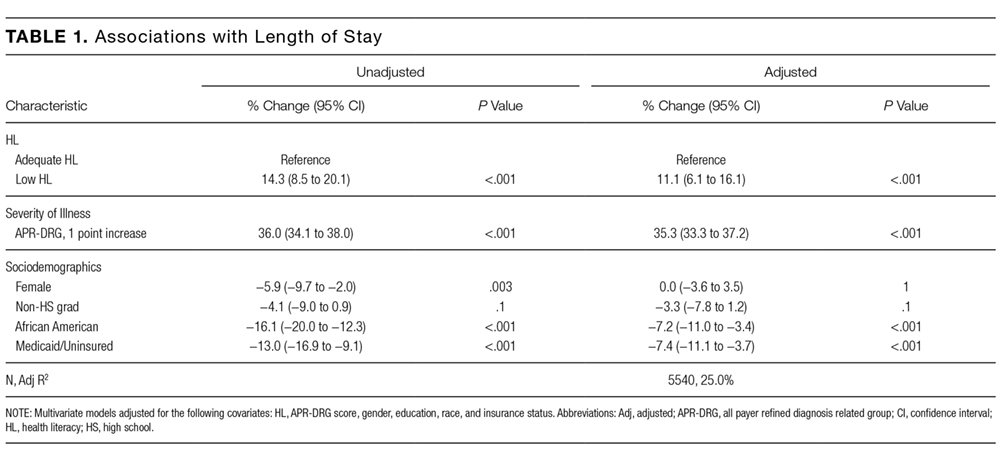
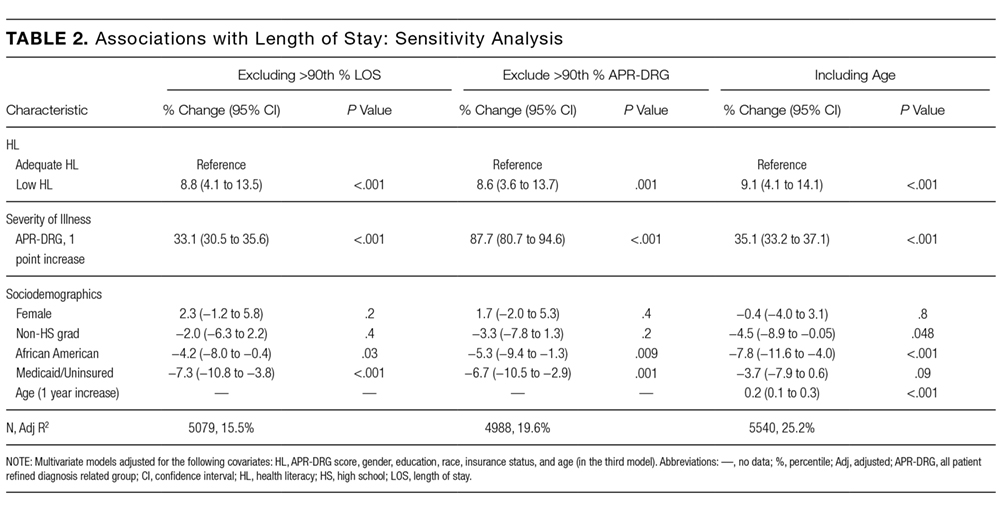
Finally, we compared the group with missing data (n = 280) to the group with complete data (n = 5540). The participants with missing data were more likely to have low HL (31% [86/280] vs 20%; P < 0.001) and to have Medicare or private insurance (82% [177/217] vs 72%; P = 0.002); however, they were not more likely to be 65 or older (40% [112/280] vs 37%; P = 0.3), high school graduates (88% [113/129] vs 81%; P = 0.06), African American (69% [177/256] vs 73%; P = 0.1), or female (57% [158/279] vs 57%; P = 1), nor were they more likely to have longer LOS (5.7 [n = 280] vs 5.5 days; P = 0.6) or higher illness severity scores (1.3 [n = 231] vs 1.3; P = 0.7).
DISCUSSION
To our knowledge, this study is the first to evaluate the association between low HL and an important in-hospital outcome measure, hospital LOS. We found that low HL was associated with a longer hospital LOS, a result which remained significant when controlling for severity of illness and sociodemographic variables and when testing the model for sensitivity to the highest values of LOS and illness severity. Additionally, the association of HL with LOS appeared concentrated among participants with shorter LOS. Relative to other predictors, the contribution of HL to the overall LOS model was small, as evidenced by the change in adjusted R2 values with HL excluded.
Among the covariates, only gender modified the association between HL and LOS; the findings suggested that men were more susceptible to the effect of low HL on increased LOS. Illness severity and other sociodemographics, including age ≥65, did not appear to modify the association. We also found that being African American and having Medicaid or no insurance were associated with a significantly shorter LOS in multivariate analysis.
Previous work suggested that the adverse health effects of low HL may be mediated through several pathways, including health knowledge, self-efficacy, health skills, and illness stigma.25-27 The finding of a small but significant relationship between HL and LOS was not surprising given these known associations; nevertheless, there may be an additional patient-dependent effect of low HL on LOS not discovered here. For instance, patients with poor health knowledge and self-efficacy might stay in the hospital longer if they or their providers do not feel comfortable with their self-care ability.
This finding may be useful in developing hospital-based interventions. HL-specific interventions, several of which have been tested in the inpatient setting,14,28,29 have shown promise toward improving health knowledge,30 disease severity,31 and health resource utilization.32
Those with low HL may lack the self-efficacy to participate in discharge planning; in fact, previous work has related low HL to posthospital readmissions.8,9 Conversely, patients with low HL might struggle to engage in the inpatient milieu, advocating for shorter LOS if they feel alienated by the inpatient experience.
These possibilities show that LOS is a complex measure shown to depend on patient-level characteristics and on provider-based, geographical, and sociocultural factors.16,33 With these forces at play, additional effects of lower levels of HL may be lost without phenotyping patients by both level of HL and related characteristics, such as self-efficacy, health skills, and stigma. By gathering these additional data, future work should explore whether subpopulations of patients with low HL may be at risk for too-short vs too-long hospital admissions.
For instance, in this study, both race and Medicaid insurance were associated with shorter LOS. Being African American was associated with shorter LOS in our study but has been found to be associated with longer LOS in another study specifically focused on diabetes.34 Prior findings found uninsured patients have shorter LOS.35 Therefore, these findings in our study are difficult to explain without further work to understand whether there are health disparities in the way patients are cared for during hospitalization that may shorten or lengthen their LOS because of factors outside of their clinical need.
The finding that gender modified the effect of low HL on LOS was unexpected. There were similar proportions of men and women with low HL. There is evidence to support that women make the majority of health decisions for themselves and their familes36; therefore, there may be unmeasured aspects of HL that provide an advantage for female vs male inpatients. Furthermore, omitted confounders, such as social support, may not fully capture potential gender-related differences. Future work is needed to understand the role of gender in relationship to HL and LOS.
Limitations of this study include its observational, single-centered design with information derived from administrative data; positive and negative confounding cannot be ruled out. For instance, we did not control for complex aspects affecting LOS, such as discharge disposition and goals of care (eg, aggressive care after discharge vs hospice). To address this limitation, multivariate analyses were performed, which were adjusted for illness severity scores and took into account both comorbidity and severity of the current illness. Additionally, although it is important to study such populations, our largely urban, minority sample is not representative of the U.S. population, and within our large sample, there were participants with missing data who had lower HL on average, although this group represented only 5% of the sample. Finally, different HL tools have noncomplete concordance, which has been seen when comparing the BHLS with more objective tools.20,37 Furthermore, certain in-hospital clinical scenarios (eg, recent stroke or prolonged intensive care unit stay) may present unique challenges in establishing a baseline HL level. However, the BHLS was used in this study because of its greater feasibility.
In conclusion, this study is the first to evaluate the relationship between low HL and LOS. The findings suggest that HL may play a role in shaping outcomes in the inpatient setting and that targeting interventions toward screened patients may be a pathway toward mitigating adverse effects. Our findings need to be replicated in larger, more representative samples, and further work understanding subpopulations within the low HL population is needed. Future work should measure this association in diverse inpatient settings (eg, psychiatric, surgical, and specialty), in addition to assessing associations between HL and other important in-hospital outcome measures, including mortality and discharge disposition.
Acknowledgments
The authors thank the Hospitalist Project team for their assistance with data collection. The authors especially thank Chuanhong Liao and Ashley Snyder for assistance with statistical analyses; Andrea Flores, Ainoa Coltri, and Tom Best for their assistance with data management. The authors would also like to thank Nicole Twu for her help with preparing and editing the manuscript.
Disclosures
Dr. Jaffee was supported by a Calvin Fentress Research Fellowship and NIH R25MH094612. Dr. Press was supported by a career development award (NHLBI K23HL118151). This work was also supported by a seed grant from the Center for Health Administration Studies. All other authors declare no conflicts of interest.
1. U.S. Department of Health and Human Services. Healthy People 2010: Understanding and Improving Health. Washington, DC: U.S. Government Printing Office; 2000.
2. “What Did the Doctor Say”? Improving Health Literacy to Protect Patient Safety. The Joint Commission; 2007.
3. Kutner M, Greenberg E, Jin Y, Paulsen C. The Health Literacy of America’s Adults: Results from the 2003 National Assessment of Adult Literacy. National Center for Education Statistics; 2006.
4. Davis TC, Wolf MS, Bass PF, et al. Literacy and misunderstanding prescription drug labels. Ann Intern Med. 2006;145(12):887-894. PubMed
5. Kripalani S, Henderson LE, Chiu EY, Robertson R, Kolm P, Jacobson TA. Predictors of medication self-management skill in a low-literacy population. J Gen Intern Med. 2006;21(8):852-856. PubMed
6. Berkman ND, Sheridan SL, Donahue KE, Halpern DJ, Crotty K. Low health literacy and health outcomes: an updated systematic review. Ann Intern Med. 2011;155(2):97-107. PubMed
7. Baker DW, Parker RM, Williams MV, Clark WS. Health literacy and the risk of hospital admission. J Gen Intern Med. 1998;13(12):791-798. PubMed
8. Mitchell SE, Sadikova E, Jack BW, Paasche-Orlow MK. Health literacy and 30-day postdischarge hospital utilization. J Health Commun. 2012;17(Suppl 3):325-338. PubMed
9. Jaffee EG, Arora VM, Matthiesen MI, Hariprasad SM, Meltzer DO, Press VG. Postdischarge Falls and Readmissions: Associations with Insufficient Vision and Low Health Literacy among Hospitalized Seniors. J Health Commun. 2016;21(sup2):135-140. PubMed
10. Hope CJ, Wu J, Tu W, Young J, Murray MD. Association of medication adherence, knowledge, and skills with emergency department visits by adults 50 years or older with congestive heart failure. Am J Health Syst Pharm. 2004;61(19):2043-2049. PubMed
11. Bennett IM, Chen J, Soroui JS, White S. The contribution of health literacy to disparities in self-rated health status and preventive health behaviors in older adults. Ann Fam Med. 2009;7(3):204-211. PubMed
12. Baker DW, Wolf MS, Feinglass J, Thompson JA. Health literacy, cognitive abilities, and mortality among elderly persons. J Gen Intern Med. 2008;23(6):723-726. PubMed
13. Cho YI, Lee SY, Arozullah AM, Crittenden KS. Effects of health literacy on health status and health service utilization amongst the elderly. Soc Sci Med. 2008;66(8):1809-1816. PubMed
14. Paasche-Orlow MK, Riekert KA, Bilderback A, et al. Tailored education may reduce health literacy disparities in asthma self-management. Am J Respir Crit Care Med. 2005;172(8):980-986. PubMed
15. Soria-Aledo V, Carrillo-Alcaraz A, Campillo-Soto Á, et al. Associated factors and cost of inappropriate hospital admissions and stays in a second-level hospital. Am J Med Qual. 2009;24(4):321-332. PubMed
16. Lu M, Sajobi T, Lucyk K, Lorenzetti D, Quan H. Systematic review of risk adjustment models of hospital length of stay (LOS). Med Care. 2015;53(4):355-365. PubMed
17. Clarke A, Rosen R. Length of stay. How short should hospital care be? Eur J Public Health. 2001;11(2):166-170. PubMed
18. Meltzer D, Manning WG, Morrison J, et al. Effects of physician experience on costs and outcomes on an academic general medicine service: results of a trial of hospitalists. Ann Intern Med. 2002;137(11):866-874. PubMed
19. Chew LD, Bradley KA, Boyko EJ. Brief questions to identify patients with inadequate health literacy. Fam Med. 2004;36(8):588-594. PubMed
20. Press VG, Shapiro MI, Mayo AM, Meltzer DO, Arora VM. More than meets the eye: relationship between low health literacy and poor vision in hospitalized patients. J Health Commun. 2013;18 Suppl 1:197-204. PubMed
21. Willens DE, Kripalani S, Schildcrout JS, et al. Association of brief health literacy screening and blood pressure in primary care. J Health Commun. 2013;18 Suppl 1:129-142. PubMed
22. Peterson PN, Shetterly SM, Clarke CL, et al. Health literacy and outcomes among patients with heart failure. JAMA. 2011;305(16):1695-1701. PubMed
23. Chew LD, Griffin JM, Partin MR, et al. Validation of screening questions for limited health literacy in a large VA outpatient population. J Gen Intern Med. 2008;23(5):561-566. PubMed
24. Averill RF, Goldfield N, Hughes JS, et al. All Patient Refined Diagnosis Related Groups (APR-DRGs): Methodology Overview. 3M Health Information Systems; 2003.
25. Waite KR, Paasche-Orlow M, Rintamaki LS, Davis TC, Wolf MS. Literacy, social stigma, and HIV medication adherence. J Gen Intern Med. 2008;23(9):1367-1372. PubMed
26. Paasche-Orlow MK, Wolf MS. The causal pathways linking health literacy to health outcomes. Am J Health Behav. 2007;31 Suppl 1:S19-26. PubMed
27. Berkman ND, Sheridan SL, Donahue KE, et al. Health literacy interventions and outcomes: an updated systematic review. Evid Rep Technol Assess (Full Rep). 2011;(199):1-941. PubMed
28. Kripalani S, Roumie CL, Dalal AK, et al. Effect of a pharmacist intervention on clinically important medication errors after hospital discharge: a randomized trial. Ann Intern Med. 2012;157(1):1-10. PubMed
29. Press VG, Arora VM, Shah LM, et al. Teaching the use of respiratory inhalers to hospitalized patients with asthma or COPD: a randomized trial. J Gen Intern Med. 2012;27(10):1317-1325. PubMed
30. Sobel RM, Paasche-Orlow MK, Waite KR, Rittner SS, Wilson EAH, Wolf MS. Asthma 1-2-3: a low literacy multimedia tool to educate African American adults about asthma. J Community Health. 2009;34(4):321-327. PubMed
31. Rothman RL, DeWalt DA, Malone R, et al. Influence of patient literacy on the effectiveness of a primary care-based diabetes disease management program. JAMA. 2004;292(14):1711-1716. PubMed
32. DeWalt DA, Malone RM, Bryant ME, et al. A heart failure self-management
program for patients of all literacy levels: a randomized, controlled trial [ISRCTN11535170].
BMC Health Serv Res. 2006;6:30. PubMed
33. Hasan O, Orav EJ, Hicks LS. Insurance status and hospital care for myocardial
infarction, stroke, and pneumonia. J Hosp Med. 2010;5(8):452-459. PubMed
34. Cook CB, Naylor DB, Hentz JG, et al. Disparities in diabetes-related hospitalizations:
relationship of age, sex, and race/ethnicity with hospital discharges, lengths
of stay, and direct inpatient charges. Ethn Dis. 2006;16(1):126-131. PubMed
35. Hadley J, Steinberg EP, Feder J. Comparison of uninsured and privately insured
hospital patients. Condition on admission, resource use, and outcome. JAMA.
1991;265(3):374-379. PubMed
36. Women’s Health Care Chartbook: Key Findings From the Kaiser Women’s
Health Survey. May 2011. https://kaiserfamilyfoundation.files.wordpress.
com/2013/01/8164.pdf. Accessed August 1, 2017.
37. Louis AJ, Arora VM, Matthiesen MI, Meltzer DO, Press VG. Screening Hospitalized Patients for Low Health Literacy: Beyond the REALM of Possibility? PubMed
Health literacy (HL), defined as patients’ ability to understand health information and make health decisions,1 is a prevalent problem in the outpatient and inpatient settings.2,3 In both settings, low HL has adverse implications for self-care including interpreting health labels4 and taking medications correctly.5 Among outpatient cohorts, HL has been associated with worse outcomes and acute care utilization.6 Associations with low HL include increased hospitalizations,7 rehospitalizations,8,9 emergency department visits,10 and decreased preventative care use.11 Among the elderly, low HL is associated with increased mortality12 and decreased self-perception of health.13
A systematic review revealed that most high-quality HL outcome studies were conducted in the outpatient setting.6 There have been very few studies assessing effects of low HL in an acute-care setting.7,14 These studies have evaluated postdischarge outcomes, including admissions or readmissions,7-9 and medication knowledge.14 To the best of our knowledge, there are no studies evaluating associations between HL and hospital length of stay (LOS).
LOS has received much attention as providers and payers focus more on resource utilization and eliminating adverse effects of prolonged hospitalization.15 LOS is multifactorial, depending on clinical characteristics like disease severity, as well as on sociocultural, demographic, and geographic factors.16 Despite evidence that LOS reductions translate into improved resource allocation and potentially fewer complications, there remains a tension between the appropriate LOS and one that is too short for a given condition.17
Because low HL is associated with inefficient resource utilization, we hypothesized that low HL would be associated with increased LOS after controlling for illness severity. Our objectives were to evaluate the association between low HL and LOS and whether such an association was modified by illness severity and sociodemographics.
METHODS
Study Design, Setting, Participants
An in-hospital, cohort study design of patients who were admitted or transferred to the general medicine service at the University of Chicago between October 2012 and November 2015 and screened for inclusion as part of a large, ongoing study of inpatient care quality was conducted.18 Exclusion criteria included observation status, age under 18 years, non-English speaking, and repeat participants. Those who died during hospitalization or whose discharge status was missing were excluded because the primary goal was to examine the association of HL and time to discharge, which could not be evaluated among those who died. We excluded participants with LOS >30 days to limit overly influential effects of extreme outliers (1% of the population).
Variables
HL was screened using the Brief Health Literacy Screen (BHLS), a validated, 3-question verbal survey not requiring adequate visual acuity to assess HL.19,20 The 3 questions are as follows: (1) “How confident are you filling out medical forms by yourself?”, (2) “How often do you have someone help you read hospital materials?”, and (3) “How often do you have problems learning about your medical condition because of difficulty understanding written information?” Responses to the questions were scored on a 5-point Likert scale in which higher scores corresponded to higher HL.21,22 The scores for each of the 3 questions were summed to yield a range between 3 and 15. On the individual questions, prior work has demonstrated improved test performance with a cutoff of ≤3, which corresponds to a response of “some of the time” or “somewhat”; therefore, when the 3 questions were summed together, scores of ≤9 were considered indicative of low HL.21,23
For severity of illness adjustment, we used relative weights derived from the 3M (3M, Maplewood, MN) All Patient Refined Diagnosis Related Groups (APR-DRG) classification system, which uses administrative data to classify the severity. The APR-DRG system assigns each admission to a DRG based on principal diagnosis; for each DRG, patients are then subdivided into 4 severity classes based on age, comorbidity, and interactions between these variables and the admitting diagnosis.24 Using the base DRG and severity score, the system assigns relative weights that reflect differences in expected hospital resource utilization.
LOS was derived from hospital administrative data and counted from the date of admission to the hospital. Participants who were discharged on the day of admission were counted as having an LOS of 1. Insurance status (Medicare, Medicaid, no payer, private) also was obtained from administrative data. Age, sex (male or female), education (junior high or less, some high school, high school graduate, some college, college graduate, postgraduate), and race (black/African American, white, Asian or Pacific Islander [including Asian Indian, Chinese, Filipino, Japanese, Korean, Vietnamese, other Asian, Native Hawaiian, Guam/Chamorro, Samoan, other Pacific], American Indian or Alaskan Native, multiple race) were obtained from administrative data based on information provided by the patient. Participants with missing data on any of the sociodemographic variables or on the APR-DRG score were excluded from the analysis.
Statistical Analysis
χ2 and 2-tailed t tests were used to compare categorical and continuous variables, respectively. Multivariate linear regressions were employed to measure associations between the independent variables (HL, illness severity, race, gender, education, and insurance status) and the dependent variable, LOS. Independent variables were chosen for clinical significance and retained in the model regardless of statistical significance. The adjusted R2 values of models with and without the HL variable included were reported to provide information on the contribution of HL to the overall model.
Because LOS was observed to be right skewed and residuals of the untransformed regression were observed to be non-normally distributed, the decision was made to natural log transform LOS, which is consistent with previous hospital LOS studies.16 Regression coefficients and confidence intervals were then transformed into percentage estimates using the following equation: 100(eβ–1). Adjusted R2 was reported for the transformed regression.
The APR-DRG relative weight was treated as a continuous variable. Sociodemographic variables were dichotomized as follows: female vs male; high school graduates vs not; African American vs not; Medicaid/no payer vs Medicare/private payer. Age was not included in the multivariate model because it has been incorporated into the weighted APR-DRG illness severity scores.
Each of the sociodemographic variables and the APR-DRG score were examined for effect modification via the same multivariate linear equation described above, with the addition of an interaction term. A separate regression was performed with an interaction term between age (dichotomized at ≥65) and HL to investigate whether age modified the association between HL and LOS. Finally, we explored whether effects were isolated to long vs short LOS by dividing the sample based on the mean LOS (≥6 days) and performing separate multivariate comparisons.
Sensitivity analyses were performed to exclude those with LOS greater than the 90th percentile and those with APR-DRG score greater than the 90th percentile; age was added to the model as a continuous variable to evaluate whether the illness severity score fully adjusted for the effects of age on LOS. Furthermore, we compared the participants with missing data to those with complete data across both dependent and independent variables. Alpha was set at 0.05; analyses were performed using Stata Version 14 (Stata, College Station, TX).
RESULTS
A total of 5983 participants met inclusion criteria and completed the HL assessment; of these participants, 75 (1%) died during hospitalization, 9 (0.2%) had missing discharge status, and 79 (1%) had LOS >30 days. Two hundred eighty (5%) were missing data on sociodemographic variables or APR-DRG score. Of the remaining (n = 5540), the mean age was 57 years (standard deviation [SD] = 19 years), over half of participants were female (57%), and the majority were African American (73%) and had graduated from high school (81%). The sample was divided into those with private insurance (25%), those with Medicare (46%), and those with Medicaid (26%); 2% had no payer. The mean APR-DRG score was 1.3 (SD = 1.2), and the scores ranged from 0.3 to 15.8.
On the BHLS screen for HL, 20% (1104/5540) had inadequate HL. Participants with low HL had higher weighted illness severity scores (average 1.4 vs 1.3; P = 0.003). Participants with low HL were also more likely to be 65 or older (55% vs 33%; P < 0.001), non-high school graduates (35% vs 15%; P < 0.001), and African American (78% vs 72%; P < 0.001), and to have Medicare or private insurance (75% vs 71%; P = 0.02). There was no significant difference with respect to gender (54% male vs 57% female; P = 0.1)
Finally, we compared the group with missing data (n = 280) to the group with complete data (n = 5540). The participants with missing data were more likely to have low HL (31% [86/280] vs 20%; P < 0.001) and to have Medicare or private insurance (82% [177/217] vs 72%; P = 0.002); however, they were not more likely to be 65 or older (40% [112/280] vs 37%; P = 0.3), high school graduates (88% [113/129] vs 81%; P = 0.06), African American (69% [177/256] vs 73%; P = 0.1), or female (57% [158/279] vs 57%; P = 1), nor were they more likely to have longer LOS (5.7 [n = 280] vs 5.5 days; P = 0.6) or higher illness severity scores (1.3 [n = 231] vs 1.3; P = 0.7).
DISCUSSION
To our knowledge, this study is the first to evaluate the association between low HL and an important in-hospital outcome measure, hospital LOS. We found that low HL was associated with a longer hospital LOS, a result which remained significant when controlling for severity of illness and sociodemographic variables and when testing the model for sensitivity to the highest values of LOS and illness severity. Additionally, the association of HL with LOS appeared concentrated among participants with shorter LOS. Relative to other predictors, the contribution of HL to the overall LOS model was small, as evidenced by the change in adjusted R2 values with HL excluded.
Among the covariates, only gender modified the association between HL and LOS; the findings suggested that men were more susceptible to the effect of low HL on increased LOS. Illness severity and other sociodemographics, including age ≥65, did not appear to modify the association. We also found that being African American and having Medicaid or no insurance were associated with a significantly shorter LOS in multivariate analysis.
Previous work suggested that the adverse health effects of low HL may be mediated through several pathways, including health knowledge, self-efficacy, health skills, and illness stigma.25-27 The finding of a small but significant relationship between HL and LOS was not surprising given these known associations; nevertheless, there may be an additional patient-dependent effect of low HL on LOS not discovered here. For instance, patients with poor health knowledge and self-efficacy might stay in the hospital longer if they or their providers do not feel comfortable with their self-care ability.
This finding may be useful in developing hospital-based interventions. HL-specific interventions, several of which have been tested in the inpatient setting,14,28,29 have shown promise toward improving health knowledge,30 disease severity,31 and health resource utilization.32
Those with low HL may lack the self-efficacy to participate in discharge planning; in fact, previous work has related low HL to posthospital readmissions.8,9 Conversely, patients with low HL might struggle to engage in the inpatient milieu, advocating for shorter LOS if they feel alienated by the inpatient experience.
These possibilities show that LOS is a complex measure shown to depend on patient-level characteristics and on provider-based, geographical, and sociocultural factors.16,33 With these forces at play, additional effects of lower levels of HL may be lost without phenotyping patients by both level of HL and related characteristics, such as self-efficacy, health skills, and stigma. By gathering these additional data, future work should explore whether subpopulations of patients with low HL may be at risk for too-short vs too-long hospital admissions.
For instance, in this study, both race and Medicaid insurance were associated with shorter LOS. Being African American was associated with shorter LOS in our study but has been found to be associated with longer LOS in another study specifically focused on diabetes.34 Prior findings found uninsured patients have shorter LOS.35 Therefore, these findings in our study are difficult to explain without further work to understand whether there are health disparities in the way patients are cared for during hospitalization that may shorten or lengthen their LOS because of factors outside of their clinical need.
The finding that gender modified the effect of low HL on LOS was unexpected. There were similar proportions of men and women with low HL. There is evidence to support that women make the majority of health decisions for themselves and their familes36; therefore, there may be unmeasured aspects of HL that provide an advantage for female vs male inpatients. Furthermore, omitted confounders, such as social support, may not fully capture potential gender-related differences. Future work is needed to understand the role of gender in relationship to HL and LOS.
Limitations of this study include its observational, single-centered design with information derived from administrative data; positive and negative confounding cannot be ruled out. For instance, we did not control for complex aspects affecting LOS, such as discharge disposition and goals of care (eg, aggressive care after discharge vs hospice). To address this limitation, multivariate analyses were performed, which were adjusted for illness severity scores and took into account both comorbidity and severity of the current illness. Additionally, although it is important to study such populations, our largely urban, minority sample is not representative of the U.S. population, and within our large sample, there were participants with missing data who had lower HL on average, although this group represented only 5% of the sample. Finally, different HL tools have noncomplete concordance, which has been seen when comparing the BHLS with more objective tools.20,37 Furthermore, certain in-hospital clinical scenarios (eg, recent stroke or prolonged intensive care unit stay) may present unique challenges in establishing a baseline HL level. However, the BHLS was used in this study because of its greater feasibility.
In conclusion, this study is the first to evaluate the relationship between low HL and LOS. The findings suggest that HL may play a role in shaping outcomes in the inpatient setting and that targeting interventions toward screened patients may be a pathway toward mitigating adverse effects. Our findings need to be replicated in larger, more representative samples, and further work understanding subpopulations within the low HL population is needed. Future work should measure this association in diverse inpatient settings (eg, psychiatric, surgical, and specialty), in addition to assessing associations between HL and other important in-hospital outcome measures, including mortality and discharge disposition.
Acknowledgments
The authors thank the Hospitalist Project team for their assistance with data collection. The authors especially thank Chuanhong Liao and Ashley Snyder for assistance with statistical analyses; Andrea Flores, Ainoa Coltri, and Tom Best for their assistance with data management. The authors would also like to thank Nicole Twu for her help with preparing and editing the manuscript.
Disclosures
Dr. Jaffee was supported by a Calvin Fentress Research Fellowship and NIH R25MH094612. Dr. Press was supported by a career development award (NHLBI K23HL118151). This work was also supported by a seed grant from the Center for Health Administration Studies. All other authors declare no conflicts of interest.
1. U.S. Department of Health and Human Services. Healthy People 2010: Understanding and Improving Health. Washington, DC: U.S. Government Printing Office; 2000.
2. “What Did the Doctor Say”? Improving Health Literacy to Protect Patient Safety. The Joint Commission; 2007.
3. Kutner M, Greenberg E, Jin Y, Paulsen C. The Health Literacy of America’s Adults: Results from the 2003 National Assessment of Adult Literacy. National Center for Education Statistics; 2006.
4. Davis TC, Wolf MS, Bass PF, et al. Literacy and misunderstanding prescription drug labels. Ann Intern Med. 2006;145(12):887-894. PubMed
5. Kripalani S, Henderson LE, Chiu EY, Robertson R, Kolm P, Jacobson TA. Predictors of medication self-management skill in a low-literacy population. J Gen Intern Med. 2006;21(8):852-856. PubMed
6. Berkman ND, Sheridan SL, Donahue KE, Halpern DJ, Crotty K. Low health literacy and health outcomes: an updated systematic review. Ann Intern Med. 2011;155(2):97-107. PubMed
7. Baker DW, Parker RM, Williams MV, Clark WS. Health literacy and the risk of hospital admission. J Gen Intern Med. 1998;13(12):791-798. PubMed
8. Mitchell SE, Sadikova E, Jack BW, Paasche-Orlow MK. Health literacy and 30-day postdischarge hospital utilization. J Health Commun. 2012;17(Suppl 3):325-338. PubMed
9. Jaffee EG, Arora VM, Matthiesen MI, Hariprasad SM, Meltzer DO, Press VG. Postdischarge Falls and Readmissions: Associations with Insufficient Vision and Low Health Literacy among Hospitalized Seniors. J Health Commun. 2016;21(sup2):135-140. PubMed
10. Hope CJ, Wu J, Tu W, Young J, Murray MD. Association of medication adherence, knowledge, and skills with emergency department visits by adults 50 years or older with congestive heart failure. Am J Health Syst Pharm. 2004;61(19):2043-2049. PubMed
11. Bennett IM, Chen J, Soroui JS, White S. The contribution of health literacy to disparities in self-rated health status and preventive health behaviors in older adults. Ann Fam Med. 2009;7(3):204-211. PubMed
12. Baker DW, Wolf MS, Feinglass J, Thompson JA. Health literacy, cognitive abilities, and mortality among elderly persons. J Gen Intern Med. 2008;23(6):723-726. PubMed
13. Cho YI, Lee SY, Arozullah AM, Crittenden KS. Effects of health literacy on health status and health service utilization amongst the elderly. Soc Sci Med. 2008;66(8):1809-1816. PubMed
14. Paasche-Orlow MK, Riekert KA, Bilderback A, et al. Tailored education may reduce health literacy disparities in asthma self-management. Am J Respir Crit Care Med. 2005;172(8):980-986. PubMed
15. Soria-Aledo V, Carrillo-Alcaraz A, Campillo-Soto Á, et al. Associated factors and cost of inappropriate hospital admissions and stays in a second-level hospital. Am J Med Qual. 2009;24(4):321-332. PubMed
16. Lu M, Sajobi T, Lucyk K, Lorenzetti D, Quan H. Systematic review of risk adjustment models of hospital length of stay (LOS). Med Care. 2015;53(4):355-365. PubMed
17. Clarke A, Rosen R. Length of stay. How short should hospital care be? Eur J Public Health. 2001;11(2):166-170. PubMed
18. Meltzer D, Manning WG, Morrison J, et al. Effects of physician experience on costs and outcomes on an academic general medicine service: results of a trial of hospitalists. Ann Intern Med. 2002;137(11):866-874. PubMed
19. Chew LD, Bradley KA, Boyko EJ. Brief questions to identify patients with inadequate health literacy. Fam Med. 2004;36(8):588-594. PubMed
20. Press VG, Shapiro MI, Mayo AM, Meltzer DO, Arora VM. More than meets the eye: relationship between low health literacy and poor vision in hospitalized patients. J Health Commun. 2013;18 Suppl 1:197-204. PubMed
21. Willens DE, Kripalani S, Schildcrout JS, et al. Association of brief health literacy screening and blood pressure in primary care. J Health Commun. 2013;18 Suppl 1:129-142. PubMed
22. Peterson PN, Shetterly SM, Clarke CL, et al. Health literacy and outcomes among patients with heart failure. JAMA. 2011;305(16):1695-1701. PubMed
23. Chew LD, Griffin JM, Partin MR, et al. Validation of screening questions for limited health literacy in a large VA outpatient population. J Gen Intern Med. 2008;23(5):561-566. PubMed
24. Averill RF, Goldfield N, Hughes JS, et al. All Patient Refined Diagnosis Related Groups (APR-DRGs): Methodology Overview. 3M Health Information Systems; 2003.
25. Waite KR, Paasche-Orlow M, Rintamaki LS, Davis TC, Wolf MS. Literacy, social stigma, and HIV medication adherence. J Gen Intern Med. 2008;23(9):1367-1372. PubMed
26. Paasche-Orlow MK, Wolf MS. The causal pathways linking health literacy to health outcomes. Am J Health Behav. 2007;31 Suppl 1:S19-26. PubMed
27. Berkman ND, Sheridan SL, Donahue KE, et al. Health literacy interventions and outcomes: an updated systematic review. Evid Rep Technol Assess (Full Rep). 2011;(199):1-941. PubMed
28. Kripalani S, Roumie CL, Dalal AK, et al. Effect of a pharmacist intervention on clinically important medication errors after hospital discharge: a randomized trial. Ann Intern Med. 2012;157(1):1-10. PubMed
29. Press VG, Arora VM, Shah LM, et al. Teaching the use of respiratory inhalers to hospitalized patients with asthma or COPD: a randomized trial. J Gen Intern Med. 2012;27(10):1317-1325. PubMed
30. Sobel RM, Paasche-Orlow MK, Waite KR, Rittner SS, Wilson EAH, Wolf MS. Asthma 1-2-3: a low literacy multimedia tool to educate African American adults about asthma. J Community Health. 2009;34(4):321-327. PubMed
31. Rothman RL, DeWalt DA, Malone R, et al. Influence of patient literacy on the effectiveness of a primary care-based diabetes disease management program. JAMA. 2004;292(14):1711-1716. PubMed
32. DeWalt DA, Malone RM, Bryant ME, et al. A heart failure self-management
program for patients of all literacy levels: a randomized, controlled trial [ISRCTN11535170].
BMC Health Serv Res. 2006;6:30. PubMed
33. Hasan O, Orav EJ, Hicks LS. Insurance status and hospital care for myocardial
infarction, stroke, and pneumonia. J Hosp Med. 2010;5(8):452-459. PubMed
34. Cook CB, Naylor DB, Hentz JG, et al. Disparities in diabetes-related hospitalizations:
relationship of age, sex, and race/ethnicity with hospital discharges, lengths
of stay, and direct inpatient charges. Ethn Dis. 2006;16(1):126-131. PubMed
35. Hadley J, Steinberg EP, Feder J. Comparison of uninsured and privately insured
hospital patients. Condition on admission, resource use, and outcome. JAMA.
1991;265(3):374-379. PubMed
36. Women’s Health Care Chartbook: Key Findings From the Kaiser Women’s
Health Survey. May 2011. https://kaiserfamilyfoundation.files.wordpress.
com/2013/01/8164.pdf. Accessed August 1, 2017.
37. Louis AJ, Arora VM, Matthiesen MI, Meltzer DO, Press VG. Screening Hospitalized Patients for Low Health Literacy: Beyond the REALM of Possibility? PubMed
© 2017 Society of Hospital Medicine
Trends in Troponin-Only Testing for AMI in Academic Teaching Hospitals and the Impact of Choosing Wisely®
Evidence suggests that troponin-only testing is the superior strategy to diagnose acute myocardial infarction (AMI).1 Because of this, in February 2015, the Choosing Wisely® campaign issued a recommendation to use troponin I or T to diagnose AMI, and not to test for myoglobin or creatine kinase-MB (CK-MB).2 This recommendation was in line with guidelines from the American Heart Association and the American College of Cardiology, which recommended that myoglobin and CK-MB are not useful and offer no benefit for the diagnosis of acute coronary syndrome.3 Some institutions have developed interventions to promote troponin-only testing, reporting substantial cost savings and no negative consequences.4,5
Despite these successes, it is likely that institutions vary with respect to the adoption of the Choosing Wisely® troponin-only testing recommendation.6 Implementing this recommendation requires both promoting clinician behavior change and a strong institutional culture of high-value care.7 Understanding the variation across institutions of troponin-only testing could inform how to promote high-value care recommendations nationwide. We aimed to describe patterns of troponin, myoglobin, and CK-MB testing in a sample of academic teaching hospitals before and after the Choosing Wisely® recommendation.
METHODS
Troponin, myoglobin, and CK-MB ordering data were extracted from Vizient’s (formerly University HealthSystem Consortium, Chicago, IL) Clinical Database/Resource Manager (CDB/RM®) for all patients with a principal discharge diagnosis of AMI at all hospitals reporting all 36 months from the fourth quarter of 2013 through the third quarter of 2016. This period includes time both before and after the Choosing Wisely® recommendation, which was released in the first quarter of 2015. Vizient’s CDB/RM contains ordering data for 300 academic medical centers and their affiliated hospitals and includes the discharge diagnoses for patients cared for by these institutions. Only patients with a principal discharge diagnosis of AMI were included because the Choosing Wisely® recommendation is specific with regard to troponin-only testing for the diagnosis of AMI. Patients with a principal diagnosis code for subcategories of myocardial ischemia (eg, stable angina, unstable angina) were not included because of the large number of diagnosis codes for these subcategories (more than 100 in the International Classification of Diseases, Ninth Revision and the International Classification of Diseases, Tenth Revision) and because the variation in their use across institutions within the dataset limited the utility of using these codes to consistently and accurately identify patients with myocardial ischemia. Moreover, the diagnosis of AMI encompasses the subcategories of myocardial ischemia.8
Hospital rates of ordering cardiac biomarkers (troponin-only or troponin and myoglobin/CK-MB) were determined overall for the entire study period and for each quarter of the study period based on the total patients with a discharge diagnosis of AMI. For each quarter of the 12 study quarters, all the hospitals were divided into tertiles based on their rate of troponin-only testing per discharge diagnosis of AMI. Hospitals were then classified into 3 groups based on their tertile ranking over the full 12 study quarters. The first group included hospitals whose rate of troponin-only testing placed them in the top tertile for each and all quarters throughout the study period. The second group included hospitals whose troponin-only testing rate placed them in the bottom tertile for each and all quarters throughout the study period. The third group included hospitals whose troponin-only testing rate each quarter led to either an increase or decrease in their tertile ranking throughout the study period. χ2 tests were used to test for bivariate associations among hospitals based on their rate of troponin-only testing and hospital size (number of beds), their regional geographic location, the volume of AMI patients seen at the hospital, whether the primary physician during the hospitalization was a cardiologist or other provider, and the hospitals’ quality ratings. Quality rating was based on an internal Vizient rating and the “Best Hospitals for Cardiology and Heart Surgery Rankings” as published in the US News & World Report.9 The Vizient quality rating is based on a composite score that combines scores from the domains of quality (hospital quality incentive scores), safety (patient safety indicators), patient-centeredness (Hospital Consumer Assessment of Healthcare Providers and Systems Hospital Survey), and equity (distribution of care by race/ethnicity, gender, and age). Simple slopes were calculated to determine the rate of change in troponin-only testing for each study quarter, and Student t tests were used to compare the rates of change of these simple slopes across study quarters.
RESULTS
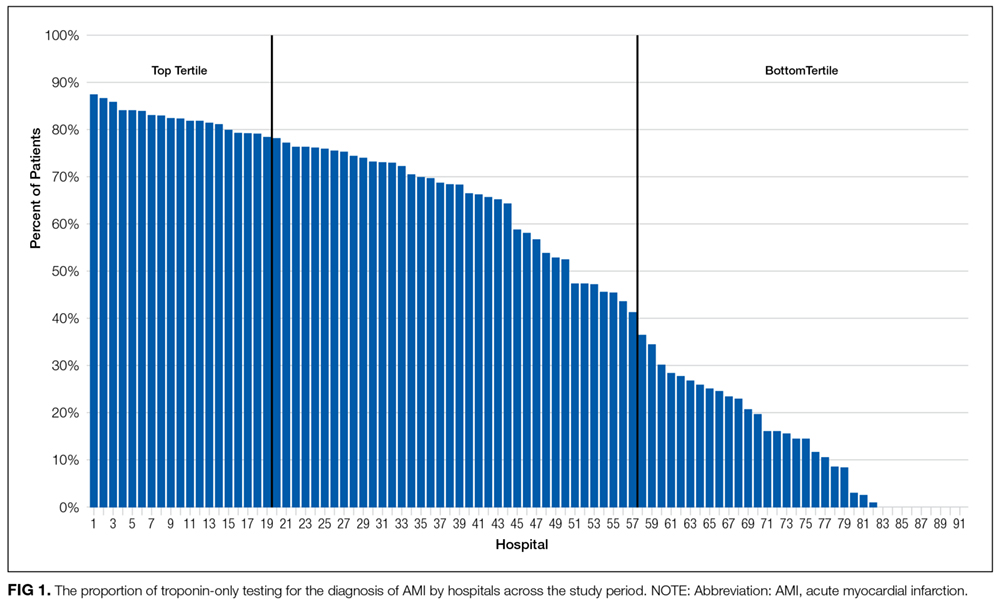
Pattern of Troponin-Only Testing by Hospital Size
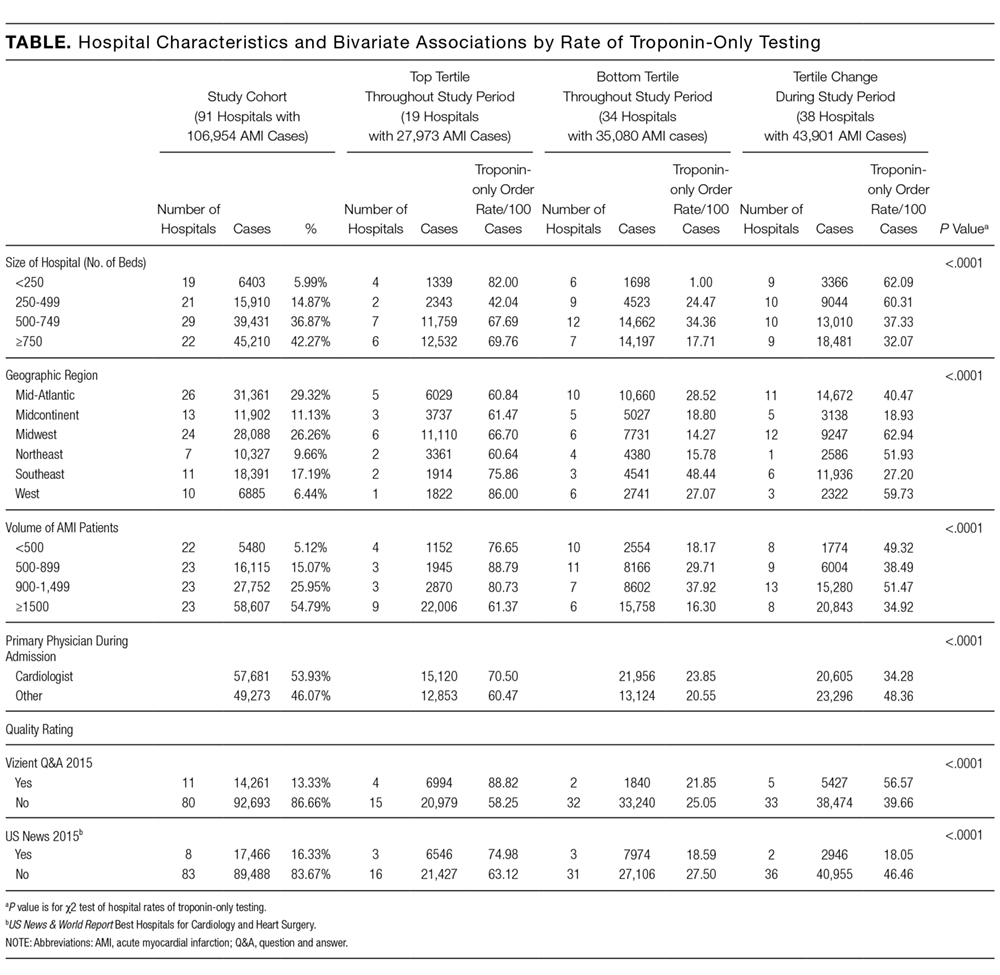
Pattern of Troponin-Only Testing by Geographic Region
The rate of troponin-only testing also varied and was statistically significantly different when comparing the 3 groups of hospitals across geographic regions of the country (P < 0.0001). Of the hospitals in the top tertile of troponin-only testing throughout the study period, the majority were in the Midwest (n = 6) and Mid-Atlantic (n = 5) regions. However, the rate of troponin-only testing for AMI in this group was highest in hospitals in the West (86/100 patients) and/or Southeast (75/100 patients) regions, although this rate was based on a small number of hospitals in these geographic areas (n = 1 in the West, n = 2 in the Southeast). Of hospitals in the bottom tertile of troponin-only testing throughout the study period, the majority were in the Mid-Atlantic region (n = 10). Hospitals that increased their troponin-only testing during the study period were predominantly in the Midwest (n = 12) and Mid-Atlantic regions (n = 11; Table), with the hospitals in the Midwest having the highest rate of troponin-only testing in this group.
Pattern of Troponin-Only Testing by Volume of AMI Patients
Of the hospitals in the top tertile of troponin-only testing during the study period, the majority cared for ≥1500 AMI patients (n = 9), but interestingly, among these hospitals, those caring for a smaller volume of AMI patients all had higher rates of troponin-only testing per 100 patients (P < 0.0001; Table). There was no other obvious pattern of troponin-only testing based on the volume of AMI patients cared for in hospitals in either the bottom tertile of troponin-only testing or hospitals that improved troponin-only testing during the study period.
Pattern of Troponin-Only Testing by Physician Type
Of the hospitals in the top tertile of troponin-only testing throughout the study period, those where a cardiologist cared for patients with AMI had higher rates of troponin-only testing (71/100 patients) than did hospitals where patients were cared for by a noncardiologist (60/100 patients). However, of the hospitals that improved their troponin-only testing during the study period, higher rates of troponin-only testing were seen in hospitals where patients were cared for by a noncardiologist (48/100 patients) compared with patients cared for by a cardiologist (34/100 patients; Table). These differences in hospital rates of troponin-only testing during the study period based on physician type were statistically significant (P < 0.0001; Table).
Pattern of Troponin-Only Testing by Quality Rating
Hospitals that were in the top tertile of troponin-only testing and were rated highly by Vizient’s quality rating or recognized as a top hospital by the US News & World Report had higher rates of troponin-only testing per 100 patients than did hospitals in the top tertile that were not ranked highly by Vizient’s quality rating or recognized as a top hospital by the US News & World Report. However, the majority of hospitals in the top tertile of troponin-only testing were not rated highly by Vizient (n = 15) or recognized as a top hospital by the US News & World Report (n = 16). The large majority of hospitals in the bottom tertile of troponin-only testing were not recognized as high-quality hospitals by Vizient (n = 32) or the US News & World Report (n = 31). Of the hospitals that improved their troponin-only testing during the study period, the majority were not recognized as high-quality hospitals by Vizient (n = 33) or the US News & World Report (n = 36), but among this group, those hospitals recognized by Vizient as high quality (n = 5) had the highest rate of troponin-only testing (57/100 patients). The differences in the rate of troponin-only testing across the different groups of hospitals and quality ratings were statistically significant (P < 0.0001; Table).
The Effect of Choosing Wisely® on Troponin-Only Testing
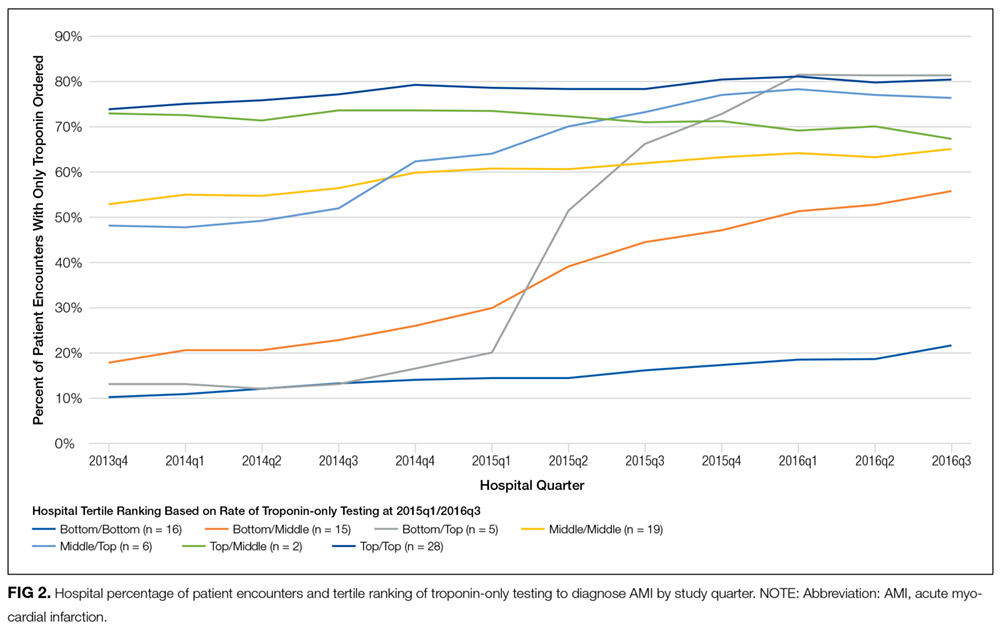
DISCUSSION
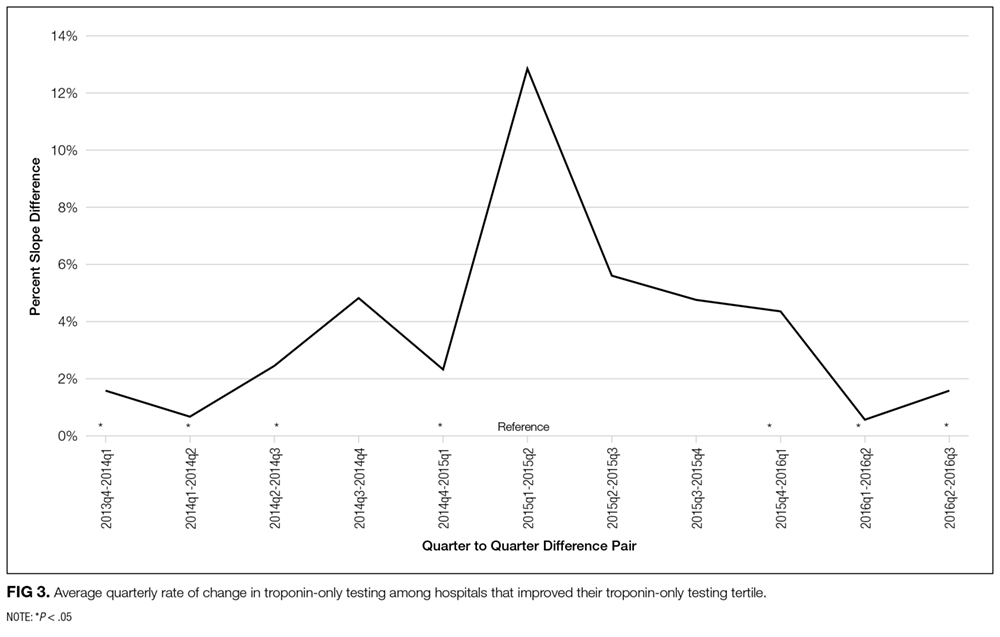
In the hospitals that demonstrated increasing adoption of troponin-only testing, there are several interesting patterns. First, among these hospitals, smaller hospitals tended to have higher overall rates of troponin-only testing per 100 patients than larger hospitals. Additionally, the hospitals with the highest rates were located in the Midwest region. These hospitals may be learning from and following the high-performing institutions observed in our data that are also located in the Midwest. Additionally, among the hospitals that significantly increased their rate of troponin-only testing, we see that the Choosing Wisely® recommendation appeared to facilitate accelerated adoption of troponin-only testing. In these institutions, it is likely that the impact of Choosing Wisely® was significant because there was attention to high-value care and already an existing movement underway to institute such high-value practices. For example, natural champions, leadership, infrastructure, and a supportive culture may all be prerequisites for Choosing Wisely® recommendations to become institutionally adopted.
Lastly, in the hospitals that have continued to order myoglobin and CK-MB, future work is needed to understand and overcome barriers to adopting high-value care practices.
There are several limitations to this study. First, because this was an observational study, we cannot prove a causal relationship between the Choosing Wisely® recommendation and the increased rates of troponin-only testing. Additionally, the Vizient CDB/RM contains reporting data for a limited number of academic medical centers only, and therefore, these results may not represent practices at nonacademic or even other academic medical centers. Our study only included patients with a principal discharge diagnosis of AMI because the Choosing Wisely® recommendation to order troponin-only is specific for diagnosing patients with AMI. However, it is possible that the Choosing Wisely® recommendation also has affected provider ordering in patients with diagnoses such as chest pain or angina, and these affects would not be captured in our study. Lastly, because instituting high-value care practices take time, our follow-up time may not have been long enough to capture improvement in troponin-only testing at institutions responding to and attempting to adhere to the Choosing Wisely® recommendation to order troponin-only testing for patients with AMI.
Disclosure
No other individuals besides the authors contributed to this work. This project was not funded or supported by any external grant or agency. Dr. Prochaska’s institute received funding from the Agency for Research Healthcare and Quality for a K12 Career Development Grant (AHRQ K12 HS023007) outside the submitted work. Dr. Hohmann and Dr Modes have nothing to disclose. Dr. Arora receives financial compensation as a member of the Board of Directors for the American Board of Internal Medicine and has received grant funding from the ABIM Foundation. She also receives royalties from McGraw Hill.
1. Pickering JW, Than MP, Cullen L, et al. Rapid rule-out of acute myocardial infarction with a single high-sensitivity cardiac troponin t measurement below the limit of detection: A collaborative meta-analysis. Ann Intern Med. 2017;166(10):715-724. PubMed
2. American Society for Clinical Pathology. Don’t test for myoglobin or CK-MB in the diagnosis of acute myocardial infarction (AMI). Instead, use troponin I or T. http://www.choosingwisely.org/clinician-lists/american-society-clinical-pathology-myoglobin-to-diagnose-acute-myocardial-infarction/. Accessed August 3, 2016.
3. Amsterdam EA, Wenger NK, Brindis RG, et al. 2014 AHA/ACC guideline for the management of patients with non–st-elevation acute coronary syndromes. Circulation. 2014;130(25):e344-e426. PubMed
4. Larochelle MR, Knight AM, Pantle H, Riedel S, Trost JC. Reducing excess cardiac biomarker testing at an academic medical center. J Gen Intern Med. 2014;29(11):1468-1474. PubMed
5. Le RD, Kosowsky JM, Landman AB, Bixho I, Melanson SEF, Tanasijevic MJ. Clinical and financial impact of removing creatine kinase-MB from the routine testing menu in the emergency setting. Am J Emerg Med. 2015;33(1):72-75. PubMed
6. Rosenberg A, Agiro A, Gottlieb M, et al. Early trends among seven recommendations from the choosing wisely campaign. JAMA Intern Med. 2015;175(12):1913. PubMed
7. Wolfson DB. Choosing Wisely recommendations using administrative claims data. JAMA Intern Med. 2016;176(4):565-565. PubMed
8. Thygesen K, Alpert JS, Jaffe AS, Simoons ML, Chaitman BR, White HD. Third universal definition of myocardial infarction. Circulation. 2012;126(16):2020-2035. PubMed
9. US News & World Report. Best hospitals for cardiology & heart surgery. http://health.usnews.com/best-hospitals/rankings/cardiology-and-heart-surgery. Accessed April 19, 2017.
10. Bradley EH, Curry LA, Ramanadhan S, Rowe L, Nembhard IM, Krumholz HM. Research in action: using positive deviance to improve quality of health care. Implement Sci IS. 2009;4:25. PubMed
Evidence suggests that troponin-only testing is the superior strategy to diagnose acute myocardial infarction (AMI).1 Because of this, in February 2015, the Choosing Wisely® campaign issued a recommendation to use troponin I or T to diagnose AMI, and not to test for myoglobin or creatine kinase-MB (CK-MB).2 This recommendation was in line with guidelines from the American Heart Association and the American College of Cardiology, which recommended that myoglobin and CK-MB are not useful and offer no benefit for the diagnosis of acute coronary syndrome.3 Some institutions have developed interventions to promote troponin-only testing, reporting substantial cost savings and no negative consequences.4,5
Despite these successes, it is likely that institutions vary with respect to the adoption of the Choosing Wisely® troponin-only testing recommendation.6 Implementing this recommendation requires both promoting clinician behavior change and a strong institutional culture of high-value care.7 Understanding the variation across institutions of troponin-only testing could inform how to promote high-value care recommendations nationwide. We aimed to describe patterns of troponin, myoglobin, and CK-MB testing in a sample of academic teaching hospitals before and after the Choosing Wisely® recommendation.
METHODS
Troponin, myoglobin, and CK-MB ordering data were extracted from Vizient’s (formerly University HealthSystem Consortium, Chicago, IL) Clinical Database/Resource Manager (CDB/RM®) for all patients with a principal discharge diagnosis of AMI at all hospitals reporting all 36 months from the fourth quarter of 2013 through the third quarter of 2016. This period includes time both before and after the Choosing Wisely® recommendation, which was released in the first quarter of 2015. Vizient’s CDB/RM contains ordering data for 300 academic medical centers and their affiliated hospitals and includes the discharge diagnoses for patients cared for by these institutions. Only patients with a principal discharge diagnosis of AMI were included because the Choosing Wisely® recommendation is specific with regard to troponin-only testing for the diagnosis of AMI. Patients with a principal diagnosis code for subcategories of myocardial ischemia (eg, stable angina, unstable angina) were not included because of the large number of diagnosis codes for these subcategories (more than 100 in the International Classification of Diseases, Ninth Revision and the International Classification of Diseases, Tenth Revision) and because the variation in their use across institutions within the dataset limited the utility of using these codes to consistently and accurately identify patients with myocardial ischemia. Moreover, the diagnosis of AMI encompasses the subcategories of myocardial ischemia.8
Hospital rates of ordering cardiac biomarkers (troponin-only or troponin and myoglobin/CK-MB) were determined overall for the entire study period and for each quarter of the study period based on the total patients with a discharge diagnosis of AMI. For each quarter of the 12 study quarters, all the hospitals were divided into tertiles based on their rate of troponin-only testing per discharge diagnosis of AMI. Hospitals were then classified into 3 groups based on their tertile ranking over the full 12 study quarters. The first group included hospitals whose rate of troponin-only testing placed them in the top tertile for each and all quarters throughout the study period. The second group included hospitals whose troponin-only testing rate placed them in the bottom tertile for each and all quarters throughout the study period. The third group included hospitals whose troponin-only testing rate each quarter led to either an increase or decrease in their tertile ranking throughout the study period. χ2 tests were used to test for bivariate associations among hospitals based on their rate of troponin-only testing and hospital size (number of beds), their regional geographic location, the volume of AMI patients seen at the hospital, whether the primary physician during the hospitalization was a cardiologist or other provider, and the hospitals’ quality ratings. Quality rating was based on an internal Vizient rating and the “Best Hospitals for Cardiology and Heart Surgery Rankings” as published in the US News & World Report.9 The Vizient quality rating is based on a composite score that combines scores from the domains of quality (hospital quality incentive scores), safety (patient safety indicators), patient-centeredness (Hospital Consumer Assessment of Healthcare Providers and Systems Hospital Survey), and equity (distribution of care by race/ethnicity, gender, and age). Simple slopes were calculated to determine the rate of change in troponin-only testing for each study quarter, and Student t tests were used to compare the rates of change of these simple slopes across study quarters.
RESULTS
Pattern of Troponin-Only Testing by Hospital Size
Pattern of Troponin-Only Testing by Geographic Region
The rate of troponin-only testing also varied and was statistically significantly different when comparing the 3 groups of hospitals across geographic regions of the country (P < 0.0001). Of the hospitals in the top tertile of troponin-only testing throughout the study period, the majority were in the Midwest (n = 6) and Mid-Atlantic (n = 5) regions. However, the rate of troponin-only testing for AMI in this group was highest in hospitals in the West (86/100 patients) and/or Southeast (75/100 patients) regions, although this rate was based on a small number of hospitals in these geographic areas (n = 1 in the West, n = 2 in the Southeast). Of hospitals in the bottom tertile of troponin-only testing throughout the study period, the majority were in the Mid-Atlantic region (n = 10). Hospitals that increased their troponin-only testing during the study period were predominantly in the Midwest (n = 12) and Mid-Atlantic regions (n = 11; Table), with the hospitals in the Midwest having the highest rate of troponin-only testing in this group.
Pattern of Troponin-Only Testing by Volume of AMI Patients
Of the hospitals in the top tertile of troponin-only testing during the study period, the majority cared for ≥1500 AMI patients (n = 9), but interestingly, among these hospitals, those caring for a smaller volume of AMI patients all had higher rates of troponin-only testing per 100 patients (P < 0.0001; Table). There was no other obvious pattern of troponin-only testing based on the volume of AMI patients cared for in hospitals in either the bottom tertile of troponin-only testing or hospitals that improved troponin-only testing during the study period.
Pattern of Troponin-Only Testing by Physician Type
Of the hospitals in the top tertile of troponin-only testing throughout the study period, those where a cardiologist cared for patients with AMI had higher rates of troponin-only testing (71/100 patients) than did hospitals where patients were cared for by a noncardiologist (60/100 patients). However, of the hospitals that improved their troponin-only testing during the study period, higher rates of troponin-only testing were seen in hospitals where patients were cared for by a noncardiologist (48/100 patients) compared with patients cared for by a cardiologist (34/100 patients; Table). These differences in hospital rates of troponin-only testing during the study period based on physician type were statistically significant (P < 0.0001; Table).
Pattern of Troponin-Only Testing by Quality Rating
Hospitals that were in the top tertile of troponin-only testing and were rated highly by Vizient’s quality rating or recognized as a top hospital by the US News & World Report had higher rates of troponin-only testing per 100 patients than did hospitals in the top tertile that were not ranked highly by Vizient’s quality rating or recognized as a top hospital by the US News & World Report. However, the majority of hospitals in the top tertile of troponin-only testing were not rated highly by Vizient (n = 15) or recognized as a top hospital by the US News & World Report (n = 16). The large majority of hospitals in the bottom tertile of troponin-only testing were not recognized as high-quality hospitals by Vizient (n = 32) or the US News & World Report (n = 31). Of the hospitals that improved their troponin-only testing during the study period, the majority were not recognized as high-quality hospitals by Vizient (n = 33) or the US News & World Report (n = 36), but among this group, those hospitals recognized by Vizient as high quality (n = 5) had the highest rate of troponin-only testing (57/100 patients). The differences in the rate of troponin-only testing across the different groups of hospitals and quality ratings were statistically significant (P < 0.0001; Table).
The Effect of Choosing Wisely® on Troponin-Only Testing
DISCUSSION
In the hospitals that demonstrated increasing adoption of troponin-only testing, there are several interesting patterns. First, among these hospitals, smaller hospitals tended to have higher overall rates of troponin-only testing per 100 patients than larger hospitals. Additionally, the hospitals with the highest rates were located in the Midwest region. These hospitals may be learning from and following the high-performing institutions observed in our data that are also located in the Midwest. Additionally, among the hospitals that significantly increased their rate of troponin-only testing, we see that the Choosing Wisely® recommendation appeared to facilitate accelerated adoption of troponin-only testing. In these institutions, it is likely that the impact of Choosing Wisely® was significant because there was attention to high-value care and already an existing movement underway to institute such high-value practices. For example, natural champions, leadership, infrastructure, and a supportive culture may all be prerequisites for Choosing Wisely® recommendations to become institutionally adopted.
Lastly, in the hospitals that have continued to order myoglobin and CK-MB, future work is needed to understand and overcome barriers to adopting high-value care practices.
There are several limitations to this study. First, because this was an observational study, we cannot prove a causal relationship between the Choosing Wisely® recommendation and the increased rates of troponin-only testing. Additionally, the Vizient CDB/RM contains reporting data for a limited number of academic medical centers only, and therefore, these results may not represent practices at nonacademic or even other academic medical centers. Our study only included patients with a principal discharge diagnosis of AMI because the Choosing Wisely® recommendation to order troponin-only is specific for diagnosing patients with AMI. However, it is possible that the Choosing Wisely® recommendation also has affected provider ordering in patients with diagnoses such as chest pain or angina, and these affects would not be captured in our study. Lastly, because instituting high-value care practices take time, our follow-up time may not have been long enough to capture improvement in troponin-only testing at institutions responding to and attempting to adhere to the Choosing Wisely® recommendation to order troponin-only testing for patients with AMI.
Disclosure
No other individuals besides the authors contributed to this work. This project was not funded or supported by any external grant or agency. Dr. Prochaska’s institute received funding from the Agency for Research Healthcare and Quality for a K12 Career Development Grant (AHRQ K12 HS023007) outside the submitted work. Dr. Hohmann and Dr Modes have nothing to disclose. Dr. Arora receives financial compensation as a member of the Board of Directors for the American Board of Internal Medicine and has received grant funding from the ABIM Foundation. She also receives royalties from McGraw Hill.
1. Pickering JW, Than MP, Cullen L, et al. Rapid rule-out of acute myocardial infarction with a single high-sensitivity cardiac troponin t measurement below the limit of detection: A collaborative meta-analysis. Ann Intern Med. 2017;166(10):715-724. PubMed
2. American Society for Clinical Pathology. Don’t test for myoglobin or CK-MB in the diagnosis of acute myocardial infarction (AMI). Instead, use troponin I or T. http://www.choosingwisely.org/clinician-lists/american-society-clinical-pathology-myoglobin-to-diagnose-acute-myocardial-infarction/. Accessed August 3, 2016.
3. Amsterdam EA, Wenger NK, Brindis RG, et al. 2014 AHA/ACC guideline for the management of patients with non–st-elevation acute coronary syndromes. Circulation. 2014;130(25):e344-e426. PubMed
4. Larochelle MR, Knight AM, Pantle H, Riedel S, Trost JC. Reducing excess cardiac biomarker testing at an academic medical center. J Gen Intern Med. 2014;29(11):1468-1474. PubMed
5. Le RD, Kosowsky JM, Landman AB, Bixho I, Melanson SEF, Tanasijevic MJ. Clinical and financial impact of removing creatine kinase-MB from the routine testing menu in the emergency setting. Am J Emerg Med. 2015;33(1):72-75. PubMed
6. Rosenberg A, Agiro A, Gottlieb M, et al. Early trends among seven recommendations from the choosing wisely campaign. JAMA Intern Med. 2015;175(12):1913. PubMed
7. Wolfson DB. Choosing Wisely recommendations using administrative claims data. JAMA Intern Med. 2016;176(4):565-565. PubMed
8. Thygesen K, Alpert JS, Jaffe AS, Simoons ML, Chaitman BR, White HD. Third universal definition of myocardial infarction. Circulation. 2012;126(16):2020-2035. PubMed
9. US News & World Report. Best hospitals for cardiology & heart surgery. http://health.usnews.com/best-hospitals/rankings/cardiology-and-heart-surgery. Accessed April 19, 2017.
10. Bradley EH, Curry LA, Ramanadhan S, Rowe L, Nembhard IM, Krumholz HM. Research in action: using positive deviance to improve quality of health care. Implement Sci IS. 2009;4:25. PubMed
© 2017 Society of Hospital Medicine
Results of the GLAGOV trial
Intravascular ultrasonography (IVUS) has been used for the past 20 years to measure atheromatous plaque in patients with coronary artery disease. The total volume of atherosclerosis in a coronary artery segment can be calculated using IVUS. A rotating transducer produces an image of a single, cross-sectional slice of the artery from which the atheroma area is calculated. A motorized device is used to withdraw the catheter, obtaining a series of cross-sectional slices at 1-mm intervals. The atheroma area for each slice is summated to obtain the total volume of atherosclerosis in the artery.
IVUS has demonstrated that statins slow the progression or even induce regression of coronary atherosclerosis in proportion to the degree of reduction in low-density lipoprotein cholesterol (LDL-C).1–4 No LDL-C-lowering therapy other than statins has shown regression of atherosclerosis in a trial using IVUS. The lowest LDL-C achieved in prior trials using statins was about 60 mg/dL.1,3 While this is very low, lower levels have not previously been explored.
Proprotein convertase subtilisin–kexin type 9 (PCSK9) inhibitors, a new class of drugs, are injectable, fully human monoclonal antibodies that inactivate the PCSK9 protein. PCSK9 inhibitors have been shown to lower LDL-C incrementally when added to statins, achieving very low LDL-C levels.5,6 However, no data exist describing the effect of low LDL-C levels reached using PCSK9 inhibitors on the progression of atherosclerosis.
THE GLAGOV TRIAL


RESULTS
LDL-C levels

Change in percent atheroma volume


Total atheroma volume and percent of patients with atheroma regression
The secondary end point measuring the total atheroma volume in the coronaries showed no change in total volume of atherosclerotic plaque in the statin monotherapy group and a decrease in the statin plus evolocumab group.

Patients with LDL-C < 70 mg/dL
A subgroup of patients had a baseline LDL-C below 70 mg/dL, the lowest level recommended by guideline. Patients in this subgroup who received statin monotherapy remained at a mean LDL-C of 70 mg/dL whereas patients on statin plus evolocumab achieved a mean LDL-C of 24 mg/dL with a mean 2-week post-dosing trough level of 15 mg/dL, an unbelievably low level of LDL-C. In this subgroup, 81% of patients receiving statin plus evolocumab had atheroma regression, compared with 48% of patients in the statin monotherapy group. The percent of patients with atheroma regression in this subgroup of patients with low LDL-C at baseline was twice that seen in the larger study population (33% vs 17%), revealing profound levels of regression in patients treated with dual therapy.
Safety

Limitations
Like all trials, this one has limitations. The population is very select: these are patients with clinically indicated angiogram, not a primary prevention population. Some study participants dropped out, which is always a limitation. And of course, this is a surrogate measure; it is a measure of disease activity, not a measure of morbidity and mortality. Morbidity and mortality data for this new class of drugs should be available in about a year, though this study suggests that those data will be favorable.
CONCLUSION
High LDL-C is universally accepted as a factor in the formation of arterial plaque and atherosclerosis. Statin therapy reduces LDL-C levels to slow or induce regression of coronary atherosclerosis in proportion to the magnitude of LDL-C reduction as measured by IVUS. However, the question of how far to reduce lipid levels has evolved over the last 4 decades. In the 1970s, a normal total cholesterol was < 300 mg/dL. More recent data that suggest optimal LDL-C levels for patients with coronary artery disease may be much lower than commonly achieved.
In this study, in patients with symptomatic coronary artery disease, treatment with statins and the addition of the PCSK9 inhibitor evolocumab achieved mean LDL-C levels of 36.6 mg/dL, produced atheroma regression with a mean change in PAV of about 1% (P < .001), induced regression in a greater percentage of patients, and showed incremental benefit for treatment of LDL-C down to as low as 20 mg/dL. The GLAGOV trial provides intriguing evidence that clinical benefits may extend to LDL-C levels as low as 20 mg/dL; however, the sample size of the trial was modest, providing limited power for safety assessments.
Since this presentation, the Further Cardiovascular Outcomes Research with PCSK9 Inhibition in Subjects with Elevated Risk (FOURIER) trial achieved a median LDL-C of 30 mg/dL and reduced risk of cardiovascular events in patients with atherosclerotic cardiovascular disease treated with evolocumab added to statin therapy.8 Additional large outcomes trials of PCSK9 inhibitors and their role in reducing LDL-C and regression of coronary atheroma and atherosclerosis are eagerly awaited.
- Nicholls SJ, Ballantyne CM, Barter PJ, et al. Effect of two intensive statin regimens on progression of coronary disease. N Engl J Med 2011; 365:2078–2087.
- Nicholls SJ, Tuzcu EM, Sipahi I, et al. Statins, high-density lipoprotein cholesterol, and regression of coronary atherosclerosis. JAMA 2007; 297: 499–508.
- Nissen SE, Nicholls SJ, Sipahi I, et al; ASTEROID Investigators. Effect of very high-intensity statin therapy on regression of coronary atherosclerosis: the ASTEROID trial. JAMA 2006; 295:1556–1565.
- Nissen SE, Tuzcu EM, Schoenhagen P, et al; REVERSAL Investigators. Effect of intensive compared with moderate lipid-lowering therapy on progression of coronary atherosclerosis: a randomized controlled trial. JAMA 2004; 291:1071–1080.
- Robinson JG, Nedergaard BS, RogersWJ, et al; LAPLACE-2 Investigators. Effect of evolocumab or ezetimibe added to moderate- or high-intensity statin therapy on LDL-C lowering in patients with hypercholesterolemia: the LAPLACE-2 randomized clinical trial. JAMA 2014; 311:1870–1882.
- Blom DJ, Hala T, Bolognese M, et al; DESCARTES Investigators. A 52-week placebo-controlled trial of evolocumab in hyperlipidemia. N Engl J Med 2014; 370:1809–1819.
- Nicholls SJ, Puri R, Anderson T, et al. Effect of evolocumab on progression of coronary disease in statin-treated patients: The GLAGOV randomized clinical trial. JAMA 2016; 316:2373–2384.
- Sabatine MS, Giugliano RP, Keech AC, et al; FOURIER Steering Committee and Investigators. Evolocumab and clinical outcomes in patients with cardiovascular disease. N Engl J Med 2017; 376:1713–1722.
Intravascular ultrasonography (IVUS) has been used for the past 20 years to measure atheromatous plaque in patients with coronary artery disease. The total volume of atherosclerosis in a coronary artery segment can be calculated using IVUS. A rotating transducer produces an image of a single, cross-sectional slice of the artery from which the atheroma area is calculated. A motorized device is used to withdraw the catheter, obtaining a series of cross-sectional slices at 1-mm intervals. The atheroma area for each slice is summated to obtain the total volume of atherosclerosis in the artery.
IVUS has demonstrated that statins slow the progression or even induce regression of coronary atherosclerosis in proportion to the degree of reduction in low-density lipoprotein cholesterol (LDL-C).1–4 No LDL-C-lowering therapy other than statins has shown regression of atherosclerosis in a trial using IVUS. The lowest LDL-C achieved in prior trials using statins was about 60 mg/dL.1,3 While this is very low, lower levels have not previously been explored.
Proprotein convertase subtilisin–kexin type 9 (PCSK9) inhibitors, a new class of drugs, are injectable, fully human monoclonal antibodies that inactivate the PCSK9 protein. PCSK9 inhibitors have been shown to lower LDL-C incrementally when added to statins, achieving very low LDL-C levels.5,6 However, no data exist describing the effect of low LDL-C levels reached using PCSK9 inhibitors on the progression of atherosclerosis.
THE GLAGOV TRIAL
RESULTS
LDL-C levels
Change in percent atheroma volume
Total atheroma volume and percent of patients with atheroma regression
The secondary end point measuring the total atheroma volume in the coronaries showed no change in total volume of atherosclerotic plaque in the statin monotherapy group and a decrease in the statin plus evolocumab group.
Patients with LDL-C < 70 mg/dL
A subgroup of patients had a baseline LDL-C below 70 mg/dL, the lowest level recommended by guideline. Patients in this subgroup who received statin monotherapy remained at a mean LDL-C of 70 mg/dL whereas patients on statin plus evolocumab achieved a mean LDL-C of 24 mg/dL with a mean 2-week post-dosing trough level of 15 mg/dL, an unbelievably low level of LDL-C. In this subgroup, 81% of patients receiving statin plus evolocumab had atheroma regression, compared with 48% of patients in the statin monotherapy group. The percent of patients with atheroma regression in this subgroup of patients with low LDL-C at baseline was twice that seen in the larger study population (33% vs 17%), revealing profound levels of regression in patients treated with dual therapy.
Safety
Limitations
Like all trials, this one has limitations. The population is very select: these are patients with clinically indicated angiogram, not a primary prevention population. Some study participants dropped out, which is always a limitation. And of course, this is a surrogate measure; it is a measure of disease activity, not a measure of morbidity and mortality. Morbidity and mortality data for this new class of drugs should be available in about a year, though this study suggests that those data will be favorable.
CONCLUSION
High LDL-C is universally accepted as a factor in the formation of arterial plaque and atherosclerosis. Statin therapy reduces LDL-C levels to slow or induce regression of coronary atherosclerosis in proportion to the magnitude of LDL-C reduction as measured by IVUS. However, the question of how far to reduce lipid levels has evolved over the last 4 decades. In the 1970s, a normal total cholesterol was < 300 mg/dL. More recent data that suggest optimal LDL-C levels for patients with coronary artery disease may be much lower than commonly achieved.
In this study, in patients with symptomatic coronary artery disease, treatment with statins and the addition of the PCSK9 inhibitor evolocumab achieved mean LDL-C levels of 36.6 mg/dL, produced atheroma regression with a mean change in PAV of about 1% (P < .001), induced regression in a greater percentage of patients, and showed incremental benefit for treatment of LDL-C down to as low as 20 mg/dL. The GLAGOV trial provides intriguing evidence that clinical benefits may extend to LDL-C levels as low as 20 mg/dL; however, the sample size of the trial was modest, providing limited power for safety assessments.
Since this presentation, the Further Cardiovascular Outcomes Research with PCSK9 Inhibition in Subjects with Elevated Risk (FOURIER) trial achieved a median LDL-C of 30 mg/dL and reduced risk of cardiovascular events in patients with atherosclerotic cardiovascular disease treated with evolocumab added to statin therapy.8 Additional large outcomes trials of PCSK9 inhibitors and their role in reducing LDL-C and regression of coronary atheroma and atherosclerosis are eagerly awaited.
- Nicholls SJ, Ballantyne CM, Barter PJ, et al. Effect of two intensive statin regimens on progression of coronary disease. N Engl J Med 2011; 365:2078–2087.
- Nicholls SJ, Tuzcu EM, Sipahi I, et al. Statins, high-density lipoprotein cholesterol, and regression of coronary atherosclerosis. JAMA 2007; 297: 499–508.
- Nissen SE, Nicholls SJ, Sipahi I, et al; ASTEROID Investigators. Effect of very high-intensity statin therapy on regression of coronary atherosclerosis: the ASTEROID trial. JAMA 2006; 295:1556–1565.
- Nissen SE, Tuzcu EM, Schoenhagen P, et al; REVERSAL Investigators. Effect of intensive compared with moderate lipid-lowering therapy on progression of coronary atherosclerosis: a randomized controlled trial. JAMA 2004; 291:1071–1080.
- Robinson JG, Nedergaard BS, RogersWJ, et al; LAPLACE-2 Investigators. Effect of evolocumab or ezetimibe added to moderate- or high-intensity statin therapy on LDL-C lowering in patients with hypercholesterolemia: the LAPLACE-2 randomized clinical trial. JAMA 2014; 311:1870–1882.
- Blom DJ, Hala T, Bolognese M, et al; DESCARTES Investigators. A 52-week placebo-controlled trial of evolocumab in hyperlipidemia. N Engl J Med 2014; 370:1809–1819.
- Nicholls SJ, Puri R, Anderson T, et al. Effect of evolocumab on progression of coronary disease in statin-treated patients: The GLAGOV randomized clinical trial. JAMA 2016; 316:2373–2384.
- Sabatine MS, Giugliano RP, Keech AC, et al; FOURIER Steering Committee and Investigators. Evolocumab and clinical outcomes in patients with cardiovascular disease. N Engl J Med 2017; 376:1713–1722.
KEY POINTS
- Statin therapy achieves regression of atherosclerosis in proportion to reductions in LDL-C.
- PCSK9 inhibitors are a new class of injectable human monoclonal antibodies shown to lower LDL-C when added to statin therapy.
- Treatment with statins plus the PCSK9 inhibitor, evolocumab, achieved mean LDL-C levels of 36.6 mg/dL, atheroma regression, and demonstrated clinical benefit for LDL-C as low as 20 mg/dL.
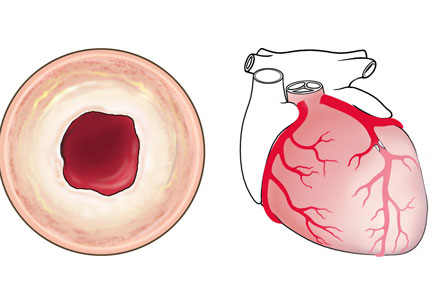
Trends in cardiovascular risk profiles
Many clinical improvements in treating patients with acute ST-elevation myocardial infarction (STEMI) have been realized in the past 20 years, including angiotensin-converting enzyme inhibitors, antiplatelet agents, and reduced time to cardiac cauterization procedures for acute myocardial infaction.1 Presumably, primary and secondary prevention measures have also resulted in changes in coronary artery disease (CAD) risk factors over the past 20 years. We sought to quantify mortality outcomes for patients treated in our catherization laboratory and to investigate trends in cardiovascular risk factors in patients during the same period.2
STEMI OUTCOMES
Data from our catherization laboratory database of 3,913 patients treated for STEMI at our tertiary care center from 1995 through 2014 were analyzed. To evaluate outcomes over time, patients were grouped based on years treated in 5-year increments resulting in 4 groups spanning 20 years.2

CARDIOVASCULAR RISK FACTORS
A reduction in mortality rates in patients treated for STEMI is to be expected over time, given the improvements in clinical practices and procedures and novel medications developed since 1996. But it is also possible that patients presenting with STEMI are healthier than in the past as a result of primary prevention efforts to minimize CAD risk factors and changes in CAD risk factors over time.
To determine whether CAD risk factors have changed over time, we analyzed the risk factors in the 3,913 patients treated for STEMI in our database. Risk factors included in the analysis were:
- Age
- Sex
- Diabetes mellitus
- Hypertension
- Smoking
- Hyperlipidemia
- Chronic renal impairment (serum creatinine greater than 1.5 mg/dL)
- Obesity (body mass index greater than 30 kg/m2).2
The prevalence of risk factors was determined in the entire cohort as well as in the 34% (n = 1,325) of patients previously diagnosed with CAD. The trend in risk factors in patients previously diagnosed with CAD could indicate the effectiveness of secondary prevention efforts compared with primary prevention in the broader patient population.


These data suggest that despite a better understanding of cardiovascular risk factors, the cardiovascular risk profiles of patients with acute STEMI have deteriorated over the past 20 years: patients are younger at presentation and more likely to be obese, to smoke, and to have hypertension and diabetes. These trends hold true in patients with and without a history of CAD, suggesting primary and secondary prevention efforts are ineffective.
TRENDS IN THE UNITED STATES
To evaluate whether geographic or patient population characteristics could have biased our results, we analyzed mortality and risk factor data from the National (Nationwide) Inpatient Sample (NIS) for patients presenting with STEMI (N = 445,319), non-STEMI (N = 915,341), and stroke (N = 937,425) from 2003 to 2013.4,5
Mortality rates
Consistent with the trend in our data, the 10-year NIS data showed a lower mortality rate in 2003 compared with 2013 in patients admitted with extreme-severity STEMI (22% vs 18%), non-STEMI (13% vs 8%), and stroke (15% vs 10%), as well as in patients with moderate-severity disease.4
Risk factors

Unfortunately, the prevalence of these relatively preventable CAD risk factors is moving in the wrong direction. The prevalence of smoking in patients presenting with non-STEMI, STEMI, or acute stroke is higher than in the past, contrary to the nationwide trend of decreasing rates of smoking.6 The increased rate of obesity evident in our data and the NSI data is consistent with rising obesity rates in the United States, which went from 30% to 37% in adults and from 14% to 17% in youth from 2000 to 2014.7 The percentage of adults with diabetes has increased tremendously in the United States, from 4.4% of adults in 1994 to 9.1% of adults in 2015.8 The rise in diabetes has led to increased rates of CAD, heart disease, and stroke in patients with diabetes.9
OPPORTUNITIES AHEAD
Despite improved STEMI outcomes, trends in cardiovascular risk profiles are deteriorating, emphasizing the critical need to educate people about primary and secondary prevention. Folsom et al10 conducted an analysis of a community-based sample to determine the prevalence of ideal cardiovascular health based on 4 ideal health behaviors (nonsmoking, low body mass index, adequate physical activity, healthy diet) and 3 ideal risk health factors (total cholesterol, blood pressure, and moderate glucose control).10 Each of the 7 behavior and risk factors was defined by ideal, intermediate, and poor characteristics. Very few study participants (0.1%) had ideal levels for all 7 healthy cardiovascular behaviors and risk factors, and over 82% had poor levels for all 7 behaviors and characteristics. The need to educate and improve cardiovascular health exists for both adults and youth. Measures of cardiovascular health in the United States indicate that 18% of adults age 50 or older and 46% of youth (ages 12 to 19) have 5 or more of the 7 health cardiovascular behaviors and risk factors at ideal levels.11
Improvement in primary and secondary prevention measures may also present opportunities to contain or reduce the cost of care. Thus far, according to NIS registry data from 2003 to 2013, the mean adjusted cost of hospitalization for patients with STEMI increased about 14%, remained about the same for patients with non-STEMI, and increased about 3% for patients with stroke.4
CONCLUSION
Advances in clinical care have improved outcomes for patients with CAD during the past 2 decades. These gains have come despite a higher prevalence of CAD risk factors in patients. More emphasis on primary and secondary prevention to reduce CAD risk factors may further improve outcomes and possibly lower the cost of care. Aggressive encouragement of risk factor modification is necessary and should go beyond cardiologists to include primary care physicians, preventive clinics, secondary cardiovascular prevention, and population-based efforts.
- Go AS, Mozaffarian D, Roger VL, et al; American Heart Association Statistics Committee and Stroke Statistics Subcommittee. Heart disease and stroke statistics—2014 update: a report from the American Heart Association. Circulation 2004; 129:e28–e292.
- Mentias A, Hill E, Barakat AF, et al. An alarming trend: change in the risk profile of patients with ST elevation myocardial infarction over the last two decades. Int J Cardiol 2017; doi:10.1016/j.ijcard.2017.05.011. [Epub ahead of print]
- Mentias A, Raza MQ, Barakat AF, et al. Effect of shorter door-to-balloon times over 20 years on outcomes of patients with anterior ST-elevation myocardial infarction undergoing primary percutaneous coronary intervention. Am J Cardiol 2017; Jul 24. doi:10.1016/j.amjcard.2017.07.006. [Epub ahead of print].
- Agarwal S, Sud K, Thakkar B, Menon V, Jaber WA, Kapadia SR. Changing trends of atherosclerotic risk factors among patients with acute myocardial infarction and acute ischemic stroke. Am J Cardiol 2017; 119:1532–1541.
- HCUP NIS Database Documentation. Healthcare Cost and Utilization Project (HCUP). Agency for Healthcare Research and Quality, Rockville, MD. https://www.hcup-us.ahrq.gov/db/nation/nis/nisdbdocumentation.jsp. March 2017. Accessed September 11 2017.
- Centers for Disease Control and Prevention. Trends in current cigarette smoking among high school students and adults, United States, 1965–2014. https://www.cdc.gov/tobacco/data_statistics/tables/trends/cig_smoking. Updated March 30, 2016. Accessed September 11, 2017.
- Ogden CL, Carroll MD, Fryar CD, Flegal KM. Prevalence of obesity among adults and youth: United States, 2011–2014. NCHS data brief, no 219. Hyattsville, MD: National Center for Health Statistics. 2015. Available at https://www.cdc.gov/nchs/data/databriefs/db219.htm. Accessed September 11, 2017.
- Centers for Disease Control and Prevention. Diabetes data and statistics. https://gis.cdc.gov/grasp/diabetes/DiabetesAtlas.html. Updated July 17, 2017. Accessed September 11, 2017.
- Centers for Disease Control and Prevention. Diabetes, heart disease, and you. https://www.cdc.gov/features/diabetes-heart-disease/index.html. Updated November 19, 2016. Accessed September 11, 2017.
- Folsom AR, Yatsuya H, Nettleton JA, Lutsey PL, Cushman M, Rosamond WD; for the ARIC Study Investigators. Community prevalence of ideal cardiovascular health, by the American Heart Association definition, and relationship with cardiovascular disease incidence. J Am Coll Cardiol 2011; 57:1690–1696.
- Mozaffarian D, Benjamin EJ, Go AS, et al; on behalf of the American Heart Association Statistics Committee and Stroke Statistics Subcommittee. Heart disease and stroke statistics—2016 update: a report from the American Heart Association. Circulation. 2016; 133:e38–e360.
Many clinical improvements in treating patients with acute ST-elevation myocardial infarction (STEMI) have been realized in the past 20 years, including angiotensin-converting enzyme inhibitors, antiplatelet agents, and reduced time to cardiac cauterization procedures for acute myocardial infaction.1 Presumably, primary and secondary prevention measures have also resulted in changes in coronary artery disease (CAD) risk factors over the past 20 years. We sought to quantify mortality outcomes for patients treated in our catherization laboratory and to investigate trends in cardiovascular risk factors in patients during the same period.2
STEMI OUTCOMES
Data from our catherization laboratory database of 3,913 patients treated for STEMI at our tertiary care center from 1995 through 2014 were analyzed. To evaluate outcomes over time, patients were grouped based on years treated in 5-year increments resulting in 4 groups spanning 20 years.2
CARDIOVASCULAR RISK FACTORS
A reduction in mortality rates in patients treated for STEMI is to be expected over time, given the improvements in clinical practices and procedures and novel medications developed since 1996. But it is also possible that patients presenting with STEMI are healthier than in the past as a result of primary prevention efforts to minimize CAD risk factors and changes in CAD risk factors over time.
To determine whether CAD risk factors have changed over time, we analyzed the risk factors in the 3,913 patients treated for STEMI in our database. Risk factors included in the analysis were:
- Age
- Sex
- Diabetes mellitus
- Hypertension
- Smoking
- Hyperlipidemia
- Chronic renal impairment (serum creatinine greater than 1.5 mg/dL)
- Obesity (body mass index greater than 30 kg/m2).2
The prevalence of risk factors was determined in the entire cohort as well as in the 34% (n = 1,325) of patients previously diagnosed with CAD. The trend in risk factors in patients previously diagnosed with CAD could indicate the effectiveness of secondary prevention efforts compared with primary prevention in the broader patient population.
These data suggest that despite a better understanding of cardiovascular risk factors, the cardiovascular risk profiles of patients with acute STEMI have deteriorated over the past 20 years: patients are younger at presentation and more likely to be obese, to smoke, and to have hypertension and diabetes. These trends hold true in patients with and without a history of CAD, suggesting primary and secondary prevention efforts are ineffective.
TRENDS IN THE UNITED STATES
To evaluate whether geographic or patient population characteristics could have biased our results, we analyzed mortality and risk factor data from the National (Nationwide) Inpatient Sample (NIS) for patients presenting with STEMI (N = 445,319), non-STEMI (N = 915,341), and stroke (N = 937,425) from 2003 to 2013.4,5
Mortality rates
Consistent with the trend in our data, the 10-year NIS data showed a lower mortality rate in 2003 compared with 2013 in patients admitted with extreme-severity STEMI (22% vs 18%), non-STEMI (13% vs 8%), and stroke (15% vs 10%), as well as in patients with moderate-severity disease.4
Risk factors
Unfortunately, the prevalence of these relatively preventable CAD risk factors is moving in the wrong direction. The prevalence of smoking in patients presenting with non-STEMI, STEMI, or acute stroke is higher than in the past, contrary to the nationwide trend of decreasing rates of smoking.6 The increased rate of obesity evident in our data and the NSI data is consistent with rising obesity rates in the United States, which went from 30% to 37% in adults and from 14% to 17% in youth from 2000 to 2014.7 The percentage of adults with diabetes has increased tremendously in the United States, from 4.4% of adults in 1994 to 9.1% of adults in 2015.8 The rise in diabetes has led to increased rates of CAD, heart disease, and stroke in patients with diabetes.9
OPPORTUNITIES AHEAD
Despite improved STEMI outcomes, trends in cardiovascular risk profiles are deteriorating, emphasizing the critical need to educate people about primary and secondary prevention. Folsom et al10 conducted an analysis of a community-based sample to determine the prevalence of ideal cardiovascular health based on 4 ideal health behaviors (nonsmoking, low body mass index, adequate physical activity, healthy diet) and 3 ideal risk health factors (total cholesterol, blood pressure, and moderate glucose control).10 Each of the 7 behavior and risk factors was defined by ideal, intermediate, and poor characteristics. Very few study participants (0.1%) had ideal levels for all 7 healthy cardiovascular behaviors and risk factors, and over 82% had poor levels for all 7 behaviors and characteristics. The need to educate and improve cardiovascular health exists for both adults and youth. Measures of cardiovascular health in the United States indicate that 18% of adults age 50 or older and 46% of youth (ages 12 to 19) have 5 or more of the 7 health cardiovascular behaviors and risk factors at ideal levels.11
Improvement in primary and secondary prevention measures may also present opportunities to contain or reduce the cost of care. Thus far, according to NIS registry data from 2003 to 2013, the mean adjusted cost of hospitalization for patients with STEMI increased about 14%, remained about the same for patients with non-STEMI, and increased about 3% for patients with stroke.4
CONCLUSION
Advances in clinical care have improved outcomes for patients with CAD during the past 2 decades. These gains have come despite a higher prevalence of CAD risk factors in patients. More emphasis on primary and secondary prevention to reduce CAD risk factors may further improve outcomes and possibly lower the cost of care. Aggressive encouragement of risk factor modification is necessary and should go beyond cardiologists to include primary care physicians, preventive clinics, secondary cardiovascular prevention, and population-based efforts.
- Go AS, Mozaffarian D, Roger VL, et al; American Heart Association Statistics Committee and Stroke Statistics Subcommittee. Heart disease and stroke statistics—2014 update: a report from the American Heart Association. Circulation 2004; 129:e28–e292.
- Mentias A, Hill E, Barakat AF, et al. An alarming trend: change in the risk profile of patients with ST elevation myocardial infarction over the last two decades. Int J Cardiol 2017; doi:10.1016/j.ijcard.2017.05.011. [Epub ahead of print]
- Mentias A, Raza MQ, Barakat AF, et al. Effect of shorter door-to-balloon times over 20 years on outcomes of patients with anterior ST-elevation myocardial infarction undergoing primary percutaneous coronary intervention. Am J Cardiol 2017; Jul 24. doi:10.1016/j.amjcard.2017.07.006. [Epub ahead of print].
- Agarwal S, Sud K, Thakkar B, Menon V, Jaber WA, Kapadia SR. Changing trends of atherosclerotic risk factors among patients with acute myocardial infarction and acute ischemic stroke. Am J Cardiol 2017; 119:1532–1541.
- HCUP NIS Database Documentation. Healthcare Cost and Utilization Project (HCUP). Agency for Healthcare Research and Quality, Rockville, MD. https://www.hcup-us.ahrq.gov/db/nation/nis/nisdbdocumentation.jsp. March 2017. Accessed September 11 2017.
- Centers for Disease Control and Prevention. Trends in current cigarette smoking among high school students and adults, United States, 1965–2014. https://www.cdc.gov/tobacco/data_statistics/tables/trends/cig_smoking. Updated March 30, 2016. Accessed September 11, 2017.
- Ogden CL, Carroll MD, Fryar CD, Flegal KM. Prevalence of obesity among adults and youth: United States, 2011–2014. NCHS data brief, no 219. Hyattsville, MD: National Center for Health Statistics. 2015. Available at https://www.cdc.gov/nchs/data/databriefs/db219.htm. Accessed September 11, 2017.
- Centers for Disease Control and Prevention. Diabetes data and statistics. https://gis.cdc.gov/grasp/diabetes/DiabetesAtlas.html. Updated July 17, 2017. Accessed September 11, 2017.
- Centers for Disease Control and Prevention. Diabetes, heart disease, and you. https://www.cdc.gov/features/diabetes-heart-disease/index.html. Updated November 19, 2016. Accessed September 11, 2017.
- Folsom AR, Yatsuya H, Nettleton JA, Lutsey PL, Cushman M, Rosamond WD; for the ARIC Study Investigators. Community prevalence of ideal cardiovascular health, by the American Heart Association definition, and relationship with cardiovascular disease incidence. J Am Coll Cardiol 2011; 57:1690–1696.
- Mozaffarian D, Benjamin EJ, Go AS, et al; on behalf of the American Heart Association Statistics Committee and Stroke Statistics Subcommittee. Heart disease and stroke statistics—2016 update: a report from the American Heart Association. Circulation. 2016; 133:e38–e360.
KEY POINTS
- Advances in treatment of CAD have improved patient outcomes over the past 20 years.
- Prevalence of risk factors for CAD has increased over the past 20 years in patients presenting with STEMI with patients now more likely to be younger and with higher prevalence of smoking, obesity, hypertension, and diabetes.
- Emphasis on primary and secondary prevention to reduce CAD risk factors is needed to improve outcomes and reduce the cost of care.

Expanding indications for TAVR: The preferred procedure in intermediate-risk patients?
Surgical aortic valve replacement (SAVR) started in the 1960s with a porcine aortic valve sutured to a stainless steel frame. The first human transcatheter aortic valve replacement (TAVR) procedure in the United States was in 2002. In the past 15 years, technological advances in heart valve design have made TAVR the preferred alternative in patients at high risk for surgical complications. This article outlines studies comparing balloon-expandable TAVR vs SAVR for patients at extreme, high, and intermediate surgical risk, and presents evidence that supports the expanded use of TAVR in patients at lower surgical risk.
TAVR: THE PREFERRED ALTERNATIVE TO SURGERY

Investigators next established TAVR outcomes as being noninferior to SAVR in high surgical risk patients (PARTNER trial cohort A) at 1 year.2 A midterm follow-up of this study published in 2015 reported comparable rates of all-cause mortality at 5 years in high-risk patients undergoing TAVR vs SAVR, thus confirming the noninferiority of TAVR vs a surgical approach in high-risk patients for the longest duration of follow-up currently available.3
For patients, if the results of 2 different procedures are similar, they are typically going to choose the less invasive option. As a result, use of TAVR has increased: nearly 300,000 procedures have been performed worldwide, and approximately 75,000 were completed in 2016 alone. These numbers are projected to increase fourfold in the next 10 years. In the United States, almost one-third of Medicare-reported aortic valve replacements in 2015 were performed using TAVR.4
These data show that TAVR has become the preferred alternative to SAVR in inoperable and high-risk patients.
TAVR IN INTERMEDIATE-RISK PATIENTS
The US Food and Drug Administration (FDA) initially approved TAVR for patients judged to be ineligible for open-chest valve replacement cardiac surgery or at high risk for SAVR. This represents a small percentage of the total patient population needing aortic valve replacement. The Society of Thoracic Surgeons database of aortic valve disease cases during 2002 to 2010 (N = 141,905) shows that just 6.2% were ranked as high risk (ie, population eligible for TAVR in 2016). Most patients (79.9%) were low risk, and 13.9% were intermediate risk.5

A subanalysis of the transfemoral-access cohort provided additional support for TAVR. It showed that the rate of death and stroke in this cohort began to trend more favorably for TAVR. At 24 months, the difference in the primary end point was statistically significant in favor of TAVR (16.3% vs 20.0% for surgery; P = .04).1

Based on these data, in August 2016, the FDA approved the Sapien valves for use in patients with aortic valve stenosis who are at intermediate risk of death or complications associated with open-heart surgery. If the differences in outcomes reported during the PARTNER S3i trial are extrapolated to the total number of valve replacement surgeries performed worldwide, the potential number of patients who may benefit from TAVR is substantial.
DOWNSIDE OF TAVR
Although results with TAVR appear promising, there are important issues to address before it can be adopted in a wider patient population (ie, low-risk patients). These primarily focus on the following:
- Stroke
- Paravalvular leak
- Need for pacemaker replacement
- Valve durability
- Leaflet immobility or valve thrombosis.
Stroke
The incidence of stroke associated with TAVR is a concern, but it has decreased with the introduction of the Sapien 3 valve. In the PARTNER 2 trial, the 30-day stroke rate in intermediate-risk patients who received the Sapien 3 valve was 2.6%.1 This compares with a 5.6% overall rate in the PARTNER 1A trials using the first Sapien valve.2 The rate of stroke events is expected to decrease further as TAVR is expanded into healthier populations with better vasculature.
Paravalvular leak
Rates of moderate or severe paravalvular leak at 30 days have also decreased with the Sapien 3 valve and were 4.2% overall in the PARTNER S3i trial.6 These rates have ranged from 11.5% overall in the PARTNER 1A trial2 to 4.2% in the PARTNER 2B trial1 that used the Sapien XT valve for transfemoral-access TAVR.
New pacemakers
The percentage of TAVR procedures that result in a new requirement for a pacemaker increased to about 11% in 2014, up from 6.8% in 2012 to 2013.8 The requirement for a new pacemaker within 30 days following TAVR appeared to decrease again in the PARTER 2 trial, to 8.5%.1
Durability
Evidence is emerging showing the limited durability of bioprosthetic aortic valve. Multiple studies have reportedly shown this, and this is true for all tissue valves, including those surgically inserted. A study assessing data from 357 patients showed that structural valve degeneration begins at 7 years postoperatively. By 10 years, only about 86% of valves were free from degeneration. At 12 years, that dropped to 69%.9
A study comparing TAVR vs SAVR showed that under identical loading conditions and with identical leaflet tissue properties, leaflets of valves placed via TAVR sustained higher stresses, strains, and fatigue damage.10
Overall, these results provide the possibility that TAVR valves may have reduced valve life compared with SAVR valves. Unknown durability may be an issue to consider when evaluating TAVR for implantation in intermediate- and low-risk patients.
Leaflet immobility and valve thrombosis
In the past 2 years, the problem of potential subclinical valve leaflet thrombosis, on both surgically inserted and TAVR valves, has emerged.11 The FDA is monitoring these complications because of their potential impact on the safety and efficacy of these valves.
This complication was first reported as an unexpected finding of reduced leaflet motion on 4-dimensional computed tomography, a sign suspicious for valve thrombosis, in a subgroup of patients evaluated 30 days after implantation.12 A study from Denmark found a 7% incidence of valve thrombosis in TAVR valves. They reported that warfarin could prevent thrombosis.13
At the Heart Hospital Baylor Plano, our TAVR team has identified approximately 50 cases of thrombosis that caused partial valve occlusion. Administering warfarin for 3 months resolved the thrombosis in virtually all cases. In 1 case, a thrombosed valve was surgically explanted with good patient outcome. Pathological analysis confirmed that reduced leaflet motion seen on 4-dimensional CT was valve thrombosis, as suspected by imaging specialists.14
IS TAVR APPROPRIATE FOR INTERMEDIATE-RISK PATIENTS?
Although there are ample data supporting the use of TAVR in intermediate-risk patients, SAVR remains the most effective option in certain clinical situations:
- Younger patients who will need valve replacement later in life
- Bicuspid valves with eccentric bulky calcification
- Aortopathy (aortic disease above the valve)
- Small calcified roots
- Severe calcification of left ventricular outflow tract
- Low-lying coronary arteries (typically, ≤ 6 mm from the aortic annulus)
- Severe septal bulging
- Severe mitral regurgitation and/or tricuspid regurgitation
- Conduction system disease that puts the patient at high risk for pacemaker implantation
- Valve replacement in valves with a diameter 20 mm or smaller.
Nevertheless, outcomes seem to support TAVR in intermediate-risk patients. At the Heart Hospital Baylor Plano, 30-day outcomes with the Sapien 3 valve have shown all-cause mortality of 1.1% and all-stroke mortality of 2.6% (1.0% for disabling stroke). Large registries of the Sapien 3 valve have reported similar outcomes at 30 days: mortality 1%, disabling stroke 2%, major vascular complications 2%, and moderate to severe paravalvular leak 2%.15
Overall, the rates of major vascular complications and of life-threatening bleeding are 2%, and the need for new pacemakers is 4%. Results from several trials support TAVR as an alternative to surgery in intermediate-risk patients. In patients who are candidates for transfemoral access, TAVR may provide additional clinical advantages. However, questions about long-term durability and new requirements for pacemakers are issues for TAVR use in intermediate- and low-risk patients. More data are needed to answer these questions.
At the Heart Hospital Baylor Plano, the number of TAVR procedures from 2012 to 2015 increased from 49 cases to 215, while the number of SAVR procedures remained constant (166 in 2012 and 162 in 2015). During that time, outcomes improved dramatically: in-hospital mortality rates dropped from 2% to 0% and 30-day mortality dropped from 3% to 0%. There have been 227 consecutive SAVR patients with no in-hospital or 30-day mortality and 261 consecutive TAVR patients with no mortality.
These results support initiating clinical trials of TAVR in low-risk patients. In 2016, the FDA approved TAVR valves for 2 clinical trials in patients with aortic stenosis who are at low risk of surgical mortality. These large clinical trials, each with about 1,200 patients, are expected to provide data that will help determine whether TAVR is a safe and effective option for low-risk patients.
- Leon MB, Smith CR, Mack MJ, et al; for the PARTNER 2 Investigators. Transcatheter or surgical aortic-valve replacement in intermediate-risk patients. N Engl J Med 2016; 374:1609–1620.
- Smith CR, Leon MB, Mack MJ, et al; for the PARTNER Trial Investigators. Transcatheter versus surgical aortic-valve replacement in high-risk patients. N Engl J Med 2011; 364:2187–2198.
- Mack MJ, Leon MB, Smith CR, et al; for the PARTNER 1 trial investigators. 5-year outcomes of transcatheter aortic valve replacement or surgical aortic valve replacement for high surgical risk patients with aortic stenosis (PARTNER 1): a randomised controlled trial. Lancet 2015; 385:2477–2484.
- Nazif T. Where we are and where we are going. Presented at Transcatheter Cardiovascular Therapeutics 2016 Annual Meeting; October 2016; Washington, DC.
- Thourani VH, Suri RM, Gunter RL, et al. Contemporary real-world outcomes of surgical aortic valve replacement in 141,905 low-risk, intermediate-risk, and high-risk patients. Ann Thorac Surg 2015; 99:55–61.
- Thourani VH, Kodali S, Makkar RR, et al. Transcatheter aortic valve replacement versus surgical valve replacement in intermediate-risk patients: a propensity score analysis. Lancet 2016; 387:2218–2225.
- Thourani VH on behalf of the PARTNER Trial Investigators. SAPIEN 3 transcatheter aortic valve replacement compared with surgery in intermediate-risk patients: a propensity score analysis. Presented at: American College of Cardiology 65th Annual Meeting; April 2016; Chicago, IL.
- Holmes DR Jr, Nishimura RA, Grover FL, et al; for the STS/ACC TVT Registry. Annual outcomes with transcatheter valve therapy: from the STS/ACC TVT Registry. J Am Coll Cardiol 2015; 66:2813–2823.
- David TE, Feindel CM, Bos J, Ivanov J, Armstrong S. Aortic valve replacement with Toronto SPV bioprosthesis: optimal patient survival but suboptimal valve durability. J Thorac Cardiovasc Surg 2008; 135:19–24.
- Martin C, Sun W. Comparison of transcatheter aortic valve and surgical bioprosthetic valve durability: a fatigue simulation study. J Biomech 2015; 48:3026–3034.
- Laschinger JC, Wu C, Ibrahim NG, Shuren JE. Reduced leaflet motion in bioprosthetic aortic valves—the FDA perspective. N Engl J Med 2015; 373:1996–1998.
- Makkar RR, Fontana G, Jilaihawi H, et al. Possible subclinical leaflet thrombosis in bioprosthetic aortic valves. N Engl J Med 2015; 373:2015–2024.
- Hansson NC, Grove EL, Andersen HR, et al. Transcatheter aortic valve thrombosis: incidence, predisposing factors, and clinical implications. J Am Coll Cardiol 2016; 68:2059–2069.
- Gopal A, Ribeiro N, Squiers JJ, et al. Pathologic confirmation of valve thrombosis detected by four-dimensional computed tomography following valve-in-valve transcatheter aortic valve replacement. Glob Cardiol Sci Prac 2017. In press.
- Kodali S, Thourani VH, White J, et al. Early clinical and echocardiographic outcomes after SAPIEN 3 transcatheter aortic valve replacement in inoperable, high-risk, and intermediate-risk patients with aortic stenosis. Eur Heart J 2016; 37:2252–2262.
Surgical aortic valve replacement (SAVR) started in the 1960s with a porcine aortic valve sutured to a stainless steel frame. The first human transcatheter aortic valve replacement (TAVR) procedure in the United States was in 2002. In the past 15 years, technological advances in heart valve design have made TAVR the preferred alternative in patients at high risk for surgical complications. This article outlines studies comparing balloon-expandable TAVR vs SAVR for patients at extreme, high, and intermediate surgical risk, and presents evidence that supports the expanded use of TAVR in patients at lower surgical risk.
TAVR: THE PREFERRED ALTERNATIVE TO SURGERY
Investigators next established TAVR outcomes as being noninferior to SAVR in high surgical risk patients (PARTNER trial cohort A) at 1 year.2 A midterm follow-up of this study published in 2015 reported comparable rates of all-cause mortality at 5 years in high-risk patients undergoing TAVR vs SAVR, thus confirming the noninferiority of TAVR vs a surgical approach in high-risk patients for the longest duration of follow-up currently available.3
For patients, if the results of 2 different procedures are similar, they are typically going to choose the less invasive option. As a result, use of TAVR has increased: nearly 300,000 procedures have been performed worldwide, and approximately 75,000 were completed in 2016 alone. These numbers are projected to increase fourfold in the next 10 years. In the United States, almost one-third of Medicare-reported aortic valve replacements in 2015 were performed using TAVR.4
These data show that TAVR has become the preferred alternative to SAVR in inoperable and high-risk patients.
TAVR IN INTERMEDIATE-RISK PATIENTS
The US Food and Drug Administration (FDA) initially approved TAVR for patients judged to be ineligible for open-chest valve replacement cardiac surgery or at high risk for SAVR. This represents a small percentage of the total patient population needing aortic valve replacement. The Society of Thoracic Surgeons database of aortic valve disease cases during 2002 to 2010 (N = 141,905) shows that just 6.2% were ranked as high risk (ie, population eligible for TAVR in 2016). Most patients (79.9%) were low risk, and 13.9% were intermediate risk.5
A subanalysis of the transfemoral-access cohort provided additional support for TAVR. It showed that the rate of death and stroke in this cohort began to trend more favorably for TAVR. At 24 months, the difference in the primary end point was statistically significant in favor of TAVR (16.3% vs 20.0% for surgery; P = .04).1
Based on these data, in August 2016, the FDA approved the Sapien valves for use in patients with aortic valve stenosis who are at intermediate risk of death or complications associated with open-heart surgery. If the differences in outcomes reported during the PARTNER S3i trial are extrapolated to the total number of valve replacement surgeries performed worldwide, the potential number of patients who may benefit from TAVR is substantial.
DOWNSIDE OF TAVR
Although results with TAVR appear promising, there are important issues to address before it can be adopted in a wider patient population (ie, low-risk patients). These primarily focus on the following:
- Stroke
- Paravalvular leak
- Need for pacemaker replacement
- Valve durability
- Leaflet immobility or valve thrombosis.
Stroke
The incidence of stroke associated with TAVR is a concern, but it has decreased with the introduction of the Sapien 3 valve. In the PARTNER 2 trial, the 30-day stroke rate in intermediate-risk patients who received the Sapien 3 valve was 2.6%.1 This compares with a 5.6% overall rate in the PARTNER 1A trials using the first Sapien valve.2 The rate of stroke events is expected to decrease further as TAVR is expanded into healthier populations with better vasculature.
Paravalvular leak
Rates of moderate or severe paravalvular leak at 30 days have also decreased with the Sapien 3 valve and were 4.2% overall in the PARTNER S3i trial.6 These rates have ranged from 11.5% overall in the PARTNER 1A trial2 to 4.2% in the PARTNER 2B trial1 that used the Sapien XT valve for transfemoral-access TAVR.
New pacemakers
The percentage of TAVR procedures that result in a new requirement for a pacemaker increased to about 11% in 2014, up from 6.8% in 2012 to 2013.8 The requirement for a new pacemaker within 30 days following TAVR appeared to decrease again in the PARTER 2 trial, to 8.5%.1
Durability
Evidence is emerging showing the limited durability of bioprosthetic aortic valve. Multiple studies have reportedly shown this, and this is true for all tissue valves, including those surgically inserted. A study assessing data from 357 patients showed that structural valve degeneration begins at 7 years postoperatively. By 10 years, only about 86% of valves were free from degeneration. At 12 years, that dropped to 69%.9
A study comparing TAVR vs SAVR showed that under identical loading conditions and with identical leaflet tissue properties, leaflets of valves placed via TAVR sustained higher stresses, strains, and fatigue damage.10
Overall, these results provide the possibility that TAVR valves may have reduced valve life compared with SAVR valves. Unknown durability may be an issue to consider when evaluating TAVR for implantation in intermediate- and low-risk patients.
Leaflet immobility and valve thrombosis
In the past 2 years, the problem of potential subclinical valve leaflet thrombosis, on both surgically inserted and TAVR valves, has emerged.11 The FDA is monitoring these complications because of their potential impact on the safety and efficacy of these valves.
This complication was first reported as an unexpected finding of reduced leaflet motion on 4-dimensional computed tomography, a sign suspicious for valve thrombosis, in a subgroup of patients evaluated 30 days after implantation.12 A study from Denmark found a 7% incidence of valve thrombosis in TAVR valves. They reported that warfarin could prevent thrombosis.13
At the Heart Hospital Baylor Plano, our TAVR team has identified approximately 50 cases of thrombosis that caused partial valve occlusion. Administering warfarin for 3 months resolved the thrombosis in virtually all cases. In 1 case, a thrombosed valve was surgically explanted with good patient outcome. Pathological analysis confirmed that reduced leaflet motion seen on 4-dimensional CT was valve thrombosis, as suspected by imaging specialists.14
IS TAVR APPROPRIATE FOR INTERMEDIATE-RISK PATIENTS?
Although there are ample data supporting the use of TAVR in intermediate-risk patients, SAVR remains the most effective option in certain clinical situations:
- Younger patients who will need valve replacement later in life
- Bicuspid valves with eccentric bulky calcification
- Aortopathy (aortic disease above the valve)
- Small calcified roots
- Severe calcification of left ventricular outflow tract
- Low-lying coronary arteries (typically, ≤ 6 mm from the aortic annulus)
- Severe septal bulging
- Severe mitral regurgitation and/or tricuspid regurgitation
- Conduction system disease that puts the patient at high risk for pacemaker implantation
- Valve replacement in valves with a diameter 20 mm or smaller.
Nevertheless, outcomes seem to support TAVR in intermediate-risk patients. At the Heart Hospital Baylor Plano, 30-day outcomes with the Sapien 3 valve have shown all-cause mortality of 1.1% and all-stroke mortality of 2.6% (1.0% for disabling stroke). Large registries of the Sapien 3 valve have reported similar outcomes at 30 days: mortality 1%, disabling stroke 2%, major vascular complications 2%, and moderate to severe paravalvular leak 2%.15
Overall, the rates of major vascular complications and of life-threatening bleeding are 2%, and the need for new pacemakers is 4%. Results from several trials support TAVR as an alternative to surgery in intermediate-risk patients. In patients who are candidates for transfemoral access, TAVR may provide additional clinical advantages. However, questions about long-term durability and new requirements for pacemakers are issues for TAVR use in intermediate- and low-risk patients. More data are needed to answer these questions.
At the Heart Hospital Baylor Plano, the number of TAVR procedures from 2012 to 2015 increased from 49 cases to 215, while the number of SAVR procedures remained constant (166 in 2012 and 162 in 2015). During that time, outcomes improved dramatically: in-hospital mortality rates dropped from 2% to 0% and 30-day mortality dropped from 3% to 0%. There have been 227 consecutive SAVR patients with no in-hospital or 30-day mortality and 261 consecutive TAVR patients with no mortality.
These results support initiating clinical trials of TAVR in low-risk patients. In 2016, the FDA approved TAVR valves for 2 clinical trials in patients with aortic stenosis who are at low risk of surgical mortality. These large clinical trials, each with about 1,200 patients, are expected to provide data that will help determine whether TAVR is a safe and effective option for low-risk patients.
- Leon MB, Smith CR, Mack MJ, et al; for the PARTNER 2 Investigators. Transcatheter or surgical aortic-valve replacement in intermediate-risk patients. N Engl J Med 2016; 374:1609–1620.
- Smith CR, Leon MB, Mack MJ, et al; for the PARTNER Trial Investigators. Transcatheter versus surgical aortic-valve replacement in high-risk patients. N Engl J Med 2011; 364:2187–2198.
- Mack MJ, Leon MB, Smith CR, et al; for the PARTNER 1 trial investigators. 5-year outcomes of transcatheter aortic valve replacement or surgical aortic valve replacement for high surgical risk patients with aortic stenosis (PARTNER 1): a randomised controlled trial. Lancet 2015; 385:2477–2484.
- Nazif T. Where we are and where we are going. Presented at Transcatheter Cardiovascular Therapeutics 2016 Annual Meeting; October 2016; Washington, DC.
- Thourani VH, Suri RM, Gunter RL, et al. Contemporary real-world outcomes of surgical aortic valve replacement in 141,905 low-risk, intermediate-risk, and high-risk patients. Ann Thorac Surg 2015; 99:55–61.
- Thourani VH, Kodali S, Makkar RR, et al. Transcatheter aortic valve replacement versus surgical valve replacement in intermediate-risk patients: a propensity score analysis. Lancet 2016; 387:2218–2225.
- Thourani VH on behalf of the PARTNER Trial Investigators. SAPIEN 3 transcatheter aortic valve replacement compared with surgery in intermediate-risk patients: a propensity score analysis. Presented at: American College of Cardiology 65th Annual Meeting; April 2016; Chicago, IL.
- Holmes DR Jr, Nishimura RA, Grover FL, et al; for the STS/ACC TVT Registry. Annual outcomes with transcatheter valve therapy: from the STS/ACC TVT Registry. J Am Coll Cardiol 2015; 66:2813–2823.
- David TE, Feindel CM, Bos J, Ivanov J, Armstrong S. Aortic valve replacement with Toronto SPV bioprosthesis: optimal patient survival but suboptimal valve durability. J Thorac Cardiovasc Surg 2008; 135:19–24.
- Martin C, Sun W. Comparison of transcatheter aortic valve and surgical bioprosthetic valve durability: a fatigue simulation study. J Biomech 2015; 48:3026–3034.
- Laschinger JC, Wu C, Ibrahim NG, Shuren JE. Reduced leaflet motion in bioprosthetic aortic valves—the FDA perspective. N Engl J Med 2015; 373:1996–1998.
- Makkar RR, Fontana G, Jilaihawi H, et al. Possible subclinical leaflet thrombosis in bioprosthetic aortic valves. N Engl J Med 2015; 373:2015–2024.
- Hansson NC, Grove EL, Andersen HR, et al. Transcatheter aortic valve thrombosis: incidence, predisposing factors, and clinical implications. J Am Coll Cardiol 2016; 68:2059–2069.
- Gopal A, Ribeiro N, Squiers JJ, et al. Pathologic confirmation of valve thrombosis detected by four-dimensional computed tomography following valve-in-valve transcatheter aortic valve replacement. Glob Cardiol Sci Prac 2017. In press.
- Kodali S, Thourani VH, White J, et al. Early clinical and echocardiographic outcomes after SAPIEN 3 transcatheter aortic valve replacement in inoperable, high-risk, and intermediate-risk patients with aortic stenosis. Eur Heart J 2016; 37:2252–2262.
KEY POINTS
- TAVR has become the preferred alternative to SAVR in inoperable and high-risk patients.
- The US Food and Drug Administration has approved TAVR with open-heart surgery.
- Initial outcomes support expanding TAVR to intermediate-risk patients, including mortality and stroke data, but concerns exist related to valve durability, valve thrombosis, and rates of permanent pacemaker implantation.

CABG: A continuing evolution
The evolution of coronary artery bypass grafting (CABG) has been a key component in significantly reducing the morbidity and mortality associated with occlusive coronary artery disease (CAD). Cleveland Clinic surgeons, through their technical interventions and innovations, have led the evolution in coronary revascularization starting in the 1960s and continuing today. This article provides a brief overview of the evolution and describes the issues associated with current CABG approaches.
EARLY WORK IN RECONSTRUCTIVE CORONARY ARTERY SURGERY
Results from the first large series of venous grafting for CAD were reported in 1970 by Favaloro and colleagues at Cleveland Clinic.1 They showed the efficacy of grafting in treating CAD, with low associated morbidity and mortality, thus establishing this surgery as the treatment modality for CAD.
The technique of surgical myocardial revascularization was a culmination of developments that began years earlier with the Vineberg procedure, involving suturing of the mammary artery to the muscle rather than a vessel-to-vessel anastomosis. From this followed the coronary patch, end-to-end bypass, and then end-to-side bypass.
In the 1970s, the refinement of suturing the left internal mammary artery (LIMA) directly to the left anterior descending (LAD) artery using magnifying loops was pioneered and popularized at Cleveland Clinic. This later became the cornerstone of future coronary revascularizations.
As a direct result of the successful technical advances and excellent clinical outcomes, the volume of CABG procedures in the United States rose steadily during the 1980s and reached its peak in 1995. It then began a slow decline that continued until 2013, when the trend began to reverse. It was still rising through 2015.
WHY THE RENEWED INTEREST IN CABG?
A key component to continued use of CABG is that it appears to have a clinical edge over other treatments. This has been shown in several high-profile studies: SYNTAX,2,3 FREEDOM,4,5 BEST,6 and NOBLE.7 For example, in the SYNTAX trial, which compared CABG vs percutaneous coronary intervention (PCI), the conclusion from both the 1-year2 and the 5-year3 results was that CABG should remain the standard of care for patients with complex lesions—those with an intermediate or high burden of CAD.
The 5-year outcomes showed that the rate of major adverse cardiac and cerebrovascular events favored CABG over PCI (26.9% vs 37.3%, respectively; P < .0001).3 All-cause mortality, although not statistically significant, also was better for CABG (11.4% vs 13.9%). This indicates that as the complexity and burden of disease increase, the benefit of CABG over PCI becomes more prominent. In short, the worse the disease, the better the results with CABG.
Why is CABG better?
One rationale is that CABG not only bypasses the culprit-lesion vessel, it also protects against future lesions. An elegant study published in 2010 showed that in most cases of acute myocardial infarction (MI), the culprit coronary lesion is in the first 7 cm of the LAD.8 With CABG, most distal anastomoses are beyond 7 cm and, thus, are beyond the location of the vast majority of potential future culprit lesions.
An important factor is the modern-day safety record of CABG. According to the Society of Thoracic
Surgeons Adult Cardiac Surgery Database,9 in 2016 the expected operative mortality for CABG was just over 2%. At the Cleveland Clinic, CABG mortality has consistently been below 1% despite the complexity of the cases and the higher percentage of reoperations performed at the Clinic. In addition, the low incidence of major complications after CABG has contributed to its endurance as an important therapeutic option for CAD over the decades.
IMPROVING LONG-TERM CABG OUTCOMES
Improving vein graft patency
The Achilles heel of CABG is the decline of patency of saphenous vein grafts. The occlusion rate of these veins is 6% to 8% at hospital discharge and approximately 10% at 1 year after CABG. By 10 years, half of the vein grafts are diseased or occluded, with progression of atherosclerotic disease over time.
There has been controversy about whether open harvesting of the saphenous vein is better than endoscopic vein harvesting for patency-related outcomes. This arose after the publication of an ad hoc analysis that gave poor marks to endoscopic vein-graft harvesting.10 Its major finding was that endoscopic vein harvesting had higher rates of vein-graft failure at 12 to 18 months than open vein harvesting (46.7% vs 38.0%, respectively; P < .001). At 3 years, endoscopic harvesting was associated with higher rates of death, MI, or repeat revascularization (20.2% vs 17.4%, P = .04).
A US Food and Drug Administration-sanctioned Society of Thoracic Surgeons observational study, however, reviewed outcomes from 235,394 patients who underwent CABG from 2003 through 2008 and found no significant increase in 5-year mortality rates with use of endoscopic vein-graft harvesting vs open harvesting.11 This study showed that the less invasive endoscopic approach is still an option.
In 2015, Taggart and colleagues12 reported on a pioneering procedure that wraps the saphenous vein graft with a stent. Initial results showed external stenting had the potential to improve vein-graft lumen and reduce intimal hyperplasia at 1 year postoperatively. Surgeons can expect more data on this technology in the future.
COMPARING CONDUIT OPTIONS FOR CABG
Arterial vs venous grafts
The 1986 report by Loop and colleagues from Cleveland Clinic showed that the patency of the mammary artery graft was superior to that of the saphenous vein and that patients receiving a mammary bypass had significantly better 10-year survival (82.6% vs 71.0%, respectively; P < .0001).13 The findings of this landmark study established the LIMA-to-LAD bypass as the technical standard for surgical coronary revascularization.
Single vs bilateral mammary artery grafts
In December 2016, results of the Arterial Revascularization Trial (ART) were published comparing single vs double mammary artery grafts.14 In this prospective randomized trial, the 5-year results showed no significant difference between these mammary grafts in terms of all-cause mortality, MI, or stroke. Bilateral mammary artery grafts, however, were associated with a higher risk of sternal wound complications (3.5% vs 1.9%, respectively; P = .005) and sternal reconstruction (1.9% vs 0.6%; P = .002).

Radial artery vs saphenous vein grafts
In the largest randomized study comparing these two graft options,16 the 1-year results showed no difference in graft patency; a follow-up analysis is in progress. In contrast, randomized studies from Canada17 and the United Kingdom18 suggest that there are potential benefits associated with use of radial artery grafts in terms of patency and clinical outcomes. In addition, observational data from centers experienced in radial artery grafting have demonstrated favorable outcomes. Radial arteries perform best when bypassing totally occluded or severely stenotic vessels in which there is no or little risk of competitive flow from the native circulation.
Right internal mammary vs radial artery grafts
A propensity-matched comparison study looking at multiple studies (N = 15,374 patients) concluded that use of the right internal mammary artery provides better outcomes.19 It was associated with a 25% risk reduction for late death and a 63% risk reduction for repeat vascularization, both statistically significant vs the radial artery rates. But there is a randomized study showing that the radial artery is as good as or better than the right internal mammary artery. At this point, it is not clear which artery is better as an adjunct for the LIMA-to-LAD bypass.
GUIDELINES FOR GRAFT SELECTION
In 2016, the Society of Thoracic Surgeons published guidelines that encouraged the use of arterial grafts, giving it a class IIa designation, meaning that the evidence indicates it is reasonable to consider.20
The guidelines note the following:
- The internal mammary artery should be used to bypass the LAD when bypass of the LAD is indicated.
- As an adjunct to the left internal mammary artery, a second arterial graft (the right internal mammary artery or radial artery) should be considered in appropriate patients.
- Use of bilateral internal mammary arteries should be considered in patients who are not at high risk for sternal complications.
COMPARING SURGICAL APPROACHES
Traditional CABG performed via median sternotomy and with the use of cardiopulmonary bypass remains the technical standard in surgical coronary revascularization. However, technologies have allowed surgeons to use different and sometimes less invasive approaches that may have good outcomes in select patients with suitable risk profiles and favorable coronary anatomies.
On-pump vs off-pump CABG
The popularity of CABG without cardiopulmonary bypass (“off-pump”) peaked in 2002, when it constituted approximately 23% of CABG procedures and then declined to 17% by 2012.21 The ROOBY (Veterans Affairs Randomized On/Off Bypass) trial of 2,203 VA patients showed that at 1 year, those in the off-pump group had worse composite outcomes, poorer graft patency, and greater incidence of incomplete revascularization than the on-pump group.22 However, the use of off-pump CABG was vindicated in two other trials—CORONARY and GOPCABE—in which experienced surgeons in high-volume centers with high-risk patients had no difference in outcomes at 1 and 5 years.23–25 The recommendation is to tailor the procedure to the patient rather than the patient to the procedure. The best option is always to do what is right for the patient. For example, patients with diseased ascending aortas or liver disease may benefit from an off-pump approach.
MINIMALLY INVASIVE CABG

Robotic CABG
This procedure has advantages and disadvantages. The advantages are primarily related to the minimally invasive approach:
- There is no surgeon hand tremor
- It is less invasive
- It provides better cosmetic results
- It is expected to result in less pain, fewer transfusions, fewer complications, and shorter length of hospital stay, although those have not been proven.
Disadvantages include the following:
- Compromised completeness of revascularization—with some “difficult” vessels left unbypassed
- Longer operative times
- Higher cost
- Concern about graft patency with inexperienced surgeons
- Higher-than-expected mortality in some reports.
In 2013, a study of 500 patients treated with robotic totally endoscopic CABG showed that this procedure could be safe and effective, although the best outcomes were achieved in patients with less severe disease requiring fewer bypasses.26 In other words, it is more appropriate for LIMA-to-LAD suturing and less complex anatomy, and it is best performed with cardiopulmonary bypass with the heart arrested.
Hybrid revascularization
This procedure is a combination of minimally invasive CABG (MIDCAB or robotic CABG) to revascularize the LAD and PCI to treat the remaining vessels in multivessel CAD. The CABG and PCI can be concurrent or staged. The hybrid approach has the attraction of being less invasive and uses the technical standard LIMA-to-LAD approach, but it has the obvious limitation of not incorporating additional arterial grafting and the possibility of a compromised technical outcome in less experienced hands.
A collaborative task force from several cardiovascular medical societies developed evidence-based guidelines to address the hybrid coronary revascularization approach. They give it a class IIa recommendation, indicating that it is a reasonable approach to treating patients in whom there are limitations and challenges to traditional CABG. For other patients, they gave it a class IIb recommendation, indicating that it may be reasonable to use as an alternative to multivessel PCI or CABG.27
THE EVOLUTION CONTINUES: CABG VS PCI
As CABG and PCI continue to evolve, surgical approaches to CAD are becoming more sophisticated with the use of more arterial conduits, less invasive surgical approaches, and development of new types of stents for PCI; however, expect the debate to continue regarding which approach to CAD is best. This is not a battle between surgical and nonsurgical specialties. Rather, the goal should be an amicable, collaborative heart-care team. After all, the most important question is, as always, which therapy is best for the individual patient.
- Sheldon WC, Favaloro RG, Sones FM Jr, Effler DB. Reconstructive coronary artery surgery: venous autograft technique. JAMA 1970; 213:78–82.
- Serruys PW, Morice M-C, Kappetein AP, et al; for the SYNTAX Investigators. Percutaneous coronary intervention versus coronary-artery bypass grafting for severe coronary artery disease. N Engl J Med 2009; 360:961–972.
- Mohr FW, Morice M-C, Kappetein AP, et al. Coronary artery bypass graft surgery versus percutaneous coronary intervention in patients with three-vessel disease and left main coronary disease: 5-year follow-up of the randomised, clinical SYNTAX trial. Lancet 2013; 381:629–638.
- Farkouh ME, Domanski M, Sleeper LA, et al; for the FREEDOM Trial Investigators. Strategies for multivessel revascularization in patients with diabetes. N Engl J Med 2012; 367:2375–2384.
- Dangas GD, Farkouh ME, Sleeper LA, et al; for the FREEDOM Investigators. Long-term outcome of PCI versus CABG in insulin and non-insulin-treated diabetic patients: results from the FREEDOM trial. J Am Coll Cardiol 2014; 64:1189–1197.
- Park S-J, Ahn J-M, Kim Y-H, et al; for the BEST Trial Investigators. Trial of everolimus-eluting stents or bypass surgery for coronary disease. N Engl J Med 2015; 372:1204–1212.
- Mäkikallio T, Holm NR, Lindsay M, et al; for the NOBLE study investigators. Percutaneous coronary angioplasty versus coronary artery bypass grafting in treatment of unprotected left main stenosis (NOBLE): a prospective, randomised, open-label, non-inferiority trial. Lancet 2016; 388:2743–2752.
- Jeon C, Candia SC, Wang JC, et al. Relative spatial distributions of coronary artery bypass graft insertion and acute thrombosis: a model for protection from acute myocardial infarction. Am Heart J 2010; 160:195–201.
- The Society of Thoracic Surgeons and Duke Clinical Research Institute. Adult cardiac surgery database: executive summary (10 years—STS period ending March 31, 2016). https://www.sts.org/sites/default/files/documents/2016Harvest2_ExecutiveSummary_new.pdf. Accessed March 10, 2017.
- Lopes RD, Hafley GE, Allen KB, et al. Endoscopic versus open vein-graft harvesting in coronary-artery bypass surgery. N Engl J Med 2009; 361:235–244.
- Williams JB, Peterson ED, Brennan JM, et al. Association between endoscopic vs open vein-graft harvesting and mortality, wound complications, and cardiovascular events in patients undergoing CABG surgery. JAMA 2012; 308:475–484.
- Taggart DP, Ben Gal Y, Lees B, et al. A randomized trial of external stenting for saphenous vein grafts in coronary artery bypass grafting. Ann Thorac Surg 2015; 99:2039–2045.
- Loop FD, Lytle BW, Cosgrove DM, et al. Influence of the internal-mammary-artery graft on 10-year survival and other cardiac events. N Engl J Med 1986; 314:1–6.
- Taggart DP, Gray AM, et al; for the ART Investigators. Randomized trial of bilateral versus single internal-thoracic-artery grafts. N Engl J Med 2016; 375:2540–2549.
- Lytle BW, Blackstone EH, Sabik JF, et al. The effect of bilateral internal thoracic artery grafting on survival during 20 postoperative years. Ann Thorac Surg 2004; 78:2005–2012; discussion 2012–2014.
- Goldman S, Sethi GK, Holman W, et al. Radial artery grafts vs saphenous vein grafts in coronary artery bypass surgery: a randomized trial. JAMA 2011; 305:167–174.
- Desai ND, Cohen EA, Naylor CD, Fremes SE; for the Radial Artery Patency Study Investigators. A randomized comparison of radial-artery and saphenous-vein coronary bypass grafts. N Engl J Med 2004; 351:2302–2309.
- Collins P, Webb CM, Chong CF, Moat NE; for the Radial Artery Versus Saphenous Vein Patency (RSVP) Trial Investigators. Radial artery versus saphenous vein patency randomized trial: five-year angiographic follow-up. Circulation 2008; 117:2859–2864.
- Benedetto U, Caputo M, Gaudino M, et al. Right internal thoracic artery or radial artery? A propensity-matched comparison on the second-best arterial conduit. J Thorac Cardiovasc Surg 2017; 153:79–88.
- Aldea GS, Bakaeen FG, Pal J, et al. The Society of Thoracic Surgeons clinical practice guidelines on arterial conduits for coronary artery bypass grafting. Ann Thorac Surg 2016; 101:801–809.
- Bakaeen FG, Shroyer AL, Gammie JS, et al. Trends in use of off-pump coronary artery bypass grafting: results from the Society of Thoracic Surgeons Adult Cardiac Surgery Database. J Thorac Cardiovasc Surg 2014; 148:856–864.
- Shroyer AL, Grover FL, Hattler B, et al; for the Veterans Affairs Randomized On/Off Bypass (ROOBY) Study Group. On-pump versus off-pump coronary-artery bypass surgery. N Engl J Med 2009; 361:1827–1837.
- Diegeler A, Börgermann J, Kappert U, et al; for the GOPCABE Study Group. Off-pump versus on-pump coronary-artery bypass grafting in elderly patients. N Engl J Med 2013; 368:1189–1198.
Lamy A, Devereaux PJ, Prabhakaran D, et al; for the CORONARY Investigators. Effects of off-pump and on-pump coronary-artery bypass grafting at 1 year. N Engl J Med 2013; 368:1179–1188. - Lamy A, Devereaux PJ, Prabhakaran D, et al; for the CORONARY Investigators. Five-year outcomes after off-pump or on-pump coronary-artery bypass grafting. N Engl J Med 2016; 375:2359–2368.
- Bonaros N, Schachner T, Lehr E, et al. Five hundred cases of robotic totally endoscopic coronary artery bypass grafting: predictors of success and safety. Ann Thorac Surg 2013; 95:803–812.
- Fihn SD, Gardin JM, Abrams J, et al; American College of Cardiology Foundation/American Heart Association Task Force. 2012 ACCF/AHA/ACP/AATS/PCNA/SCAI/STS guideline for the diagnosis and management of patients with stable ischemic heart disease: a report of the American College of Cardiology Foundation/American Heart Association task force on practice guidelines, and the American College of Physicians, American Association for Thoracic Surgery, Preventive Cardiovascular Nurses Association, Society for Cardiovascular Angiography and Interventions, and Society of Thoracic Surgeons. Circulation 2012; 126:e354–e471.
The evolution of coronary artery bypass grafting (CABG) has been a key component in significantly reducing the morbidity and mortality associated with occlusive coronary artery disease (CAD). Cleveland Clinic surgeons, through their technical interventions and innovations, have led the evolution in coronary revascularization starting in the 1960s and continuing today. This article provides a brief overview of the evolution and describes the issues associated with current CABG approaches.
EARLY WORK IN RECONSTRUCTIVE CORONARY ARTERY SURGERY
Results from the first large series of venous grafting for CAD were reported in 1970 by Favaloro and colleagues at Cleveland Clinic.1 They showed the efficacy of grafting in treating CAD, with low associated morbidity and mortality, thus establishing this surgery as the treatment modality for CAD.
The technique of surgical myocardial revascularization was a culmination of developments that began years earlier with the Vineberg procedure, involving suturing of the mammary artery to the muscle rather than a vessel-to-vessel anastomosis. From this followed the coronary patch, end-to-end bypass, and then end-to-side bypass.
In the 1970s, the refinement of suturing the left internal mammary artery (LIMA) directly to the left anterior descending (LAD) artery using magnifying loops was pioneered and popularized at Cleveland Clinic. This later became the cornerstone of future coronary revascularizations.
As a direct result of the successful technical advances and excellent clinical outcomes, the volume of CABG procedures in the United States rose steadily during the 1980s and reached its peak in 1995. It then began a slow decline that continued until 2013, when the trend began to reverse. It was still rising through 2015.
WHY THE RENEWED INTEREST IN CABG?
A key component to continued use of CABG is that it appears to have a clinical edge over other treatments. This has been shown in several high-profile studies: SYNTAX,2,3 FREEDOM,4,5 BEST,6 and NOBLE.7 For example, in the SYNTAX trial, which compared CABG vs percutaneous coronary intervention (PCI), the conclusion from both the 1-year2 and the 5-year3 results was that CABG should remain the standard of care for patients with complex lesions—those with an intermediate or high burden of CAD.
The 5-year outcomes showed that the rate of major adverse cardiac and cerebrovascular events favored CABG over PCI (26.9% vs 37.3%, respectively; P < .0001).3 All-cause mortality, although not statistically significant, also was better for CABG (11.4% vs 13.9%). This indicates that as the complexity and burden of disease increase, the benefit of CABG over PCI becomes more prominent. In short, the worse the disease, the better the results with CABG.
Why is CABG better?
One rationale is that CABG not only bypasses the culprit-lesion vessel, it also protects against future lesions. An elegant study published in 2010 showed that in most cases of acute myocardial infarction (MI), the culprit coronary lesion is in the first 7 cm of the LAD.8 With CABG, most distal anastomoses are beyond 7 cm and, thus, are beyond the location of the vast majority of potential future culprit lesions.
An important factor is the modern-day safety record of CABG. According to the Society of Thoracic
Surgeons Adult Cardiac Surgery Database,9 in 2016 the expected operative mortality for CABG was just over 2%. At the Cleveland Clinic, CABG mortality has consistently been below 1% despite the complexity of the cases and the higher percentage of reoperations performed at the Clinic. In addition, the low incidence of major complications after CABG has contributed to its endurance as an important therapeutic option for CAD over the decades.
IMPROVING LONG-TERM CABG OUTCOMES
Improving vein graft patency
The Achilles heel of CABG is the decline of patency of saphenous vein grafts. The occlusion rate of these veins is 6% to 8% at hospital discharge and approximately 10% at 1 year after CABG. By 10 years, half of the vein grafts are diseased or occluded, with progression of atherosclerotic disease over time.
There has been controversy about whether open harvesting of the saphenous vein is better than endoscopic vein harvesting for patency-related outcomes. This arose after the publication of an ad hoc analysis that gave poor marks to endoscopic vein-graft harvesting.10 Its major finding was that endoscopic vein harvesting had higher rates of vein-graft failure at 12 to 18 months than open vein harvesting (46.7% vs 38.0%, respectively; P < .001). At 3 years, endoscopic harvesting was associated with higher rates of death, MI, or repeat revascularization (20.2% vs 17.4%, P = .04).
A US Food and Drug Administration-sanctioned Society of Thoracic Surgeons observational study, however, reviewed outcomes from 235,394 patients who underwent CABG from 2003 through 2008 and found no significant increase in 5-year mortality rates with use of endoscopic vein-graft harvesting vs open harvesting.11 This study showed that the less invasive endoscopic approach is still an option.
In 2015, Taggart and colleagues12 reported on a pioneering procedure that wraps the saphenous vein graft with a stent. Initial results showed external stenting had the potential to improve vein-graft lumen and reduce intimal hyperplasia at 1 year postoperatively. Surgeons can expect more data on this technology in the future.
COMPARING CONDUIT OPTIONS FOR CABG
Arterial vs venous grafts
The 1986 report by Loop and colleagues from Cleveland Clinic showed that the patency of the mammary artery graft was superior to that of the saphenous vein and that patients receiving a mammary bypass had significantly better 10-year survival (82.6% vs 71.0%, respectively; P < .0001).13 The findings of this landmark study established the LIMA-to-LAD bypass as the technical standard for surgical coronary revascularization.
Single vs bilateral mammary artery grafts
In December 2016, results of the Arterial Revascularization Trial (ART) were published comparing single vs double mammary artery grafts.14 In this prospective randomized trial, the 5-year results showed no significant difference between these mammary grafts in terms of all-cause mortality, MI, or stroke. Bilateral mammary artery grafts, however, were associated with a higher risk of sternal wound complications (3.5% vs 1.9%, respectively; P = .005) and sternal reconstruction (1.9% vs 0.6%; P = .002).
Radial artery vs saphenous vein grafts
In the largest randomized study comparing these two graft options,16 the 1-year results showed no difference in graft patency; a follow-up analysis is in progress. In contrast, randomized studies from Canada17 and the United Kingdom18 suggest that there are potential benefits associated with use of radial artery grafts in terms of patency and clinical outcomes. In addition, observational data from centers experienced in radial artery grafting have demonstrated favorable outcomes. Radial arteries perform best when bypassing totally occluded or severely stenotic vessels in which there is no or little risk of competitive flow from the native circulation.
Right internal mammary vs radial artery grafts
A propensity-matched comparison study looking at multiple studies (N = 15,374 patients) concluded that use of the right internal mammary artery provides better outcomes.19 It was associated with a 25% risk reduction for late death and a 63% risk reduction for repeat vascularization, both statistically significant vs the radial artery rates. But there is a randomized study showing that the radial artery is as good as or better than the right internal mammary artery. At this point, it is not clear which artery is better as an adjunct for the LIMA-to-LAD bypass.
GUIDELINES FOR GRAFT SELECTION
In 2016, the Society of Thoracic Surgeons published guidelines that encouraged the use of arterial grafts, giving it a class IIa designation, meaning that the evidence indicates it is reasonable to consider.20
The guidelines note the following:
- The internal mammary artery should be used to bypass the LAD when bypass of the LAD is indicated.
- As an adjunct to the left internal mammary artery, a second arterial graft (the right internal mammary artery or radial artery) should be considered in appropriate patients.
- Use of bilateral internal mammary arteries should be considered in patients who are not at high risk for sternal complications.
COMPARING SURGICAL APPROACHES
Traditional CABG performed via median sternotomy and with the use of cardiopulmonary bypass remains the technical standard in surgical coronary revascularization. However, technologies have allowed surgeons to use different and sometimes less invasive approaches that may have good outcomes in select patients with suitable risk profiles and favorable coronary anatomies.
On-pump vs off-pump CABG
The popularity of CABG without cardiopulmonary bypass (“off-pump”) peaked in 2002, when it constituted approximately 23% of CABG procedures and then declined to 17% by 2012.21 The ROOBY (Veterans Affairs Randomized On/Off Bypass) trial of 2,203 VA patients showed that at 1 year, those in the off-pump group had worse composite outcomes, poorer graft patency, and greater incidence of incomplete revascularization than the on-pump group.22 However, the use of off-pump CABG was vindicated in two other trials—CORONARY and GOPCABE—in which experienced surgeons in high-volume centers with high-risk patients had no difference in outcomes at 1 and 5 years.23–25 The recommendation is to tailor the procedure to the patient rather than the patient to the procedure. The best option is always to do what is right for the patient. For example, patients with diseased ascending aortas or liver disease may benefit from an off-pump approach.
MINIMALLY INVASIVE CABG
Robotic CABG
This procedure has advantages and disadvantages. The advantages are primarily related to the minimally invasive approach:
- There is no surgeon hand tremor
- It is less invasive
- It provides better cosmetic results
- It is expected to result in less pain, fewer transfusions, fewer complications, and shorter length of hospital stay, although those have not been proven.
Disadvantages include the following:
- Compromised completeness of revascularization—with some “difficult” vessels left unbypassed
- Longer operative times
- Higher cost
- Concern about graft patency with inexperienced surgeons
- Higher-than-expected mortality in some reports.
In 2013, a study of 500 patients treated with robotic totally endoscopic CABG showed that this procedure could be safe and effective, although the best outcomes were achieved in patients with less severe disease requiring fewer bypasses.26 In other words, it is more appropriate for LIMA-to-LAD suturing and less complex anatomy, and it is best performed with cardiopulmonary bypass with the heart arrested.
Hybrid revascularization
This procedure is a combination of minimally invasive CABG (MIDCAB or robotic CABG) to revascularize the LAD and PCI to treat the remaining vessels in multivessel CAD. The CABG and PCI can be concurrent or staged. The hybrid approach has the attraction of being less invasive and uses the technical standard LIMA-to-LAD approach, but it has the obvious limitation of not incorporating additional arterial grafting and the possibility of a compromised technical outcome in less experienced hands.
A collaborative task force from several cardiovascular medical societies developed evidence-based guidelines to address the hybrid coronary revascularization approach. They give it a class IIa recommendation, indicating that it is a reasonable approach to treating patients in whom there are limitations and challenges to traditional CABG. For other patients, they gave it a class IIb recommendation, indicating that it may be reasonable to use as an alternative to multivessel PCI or CABG.27
THE EVOLUTION CONTINUES: CABG VS PCI
As CABG and PCI continue to evolve, surgical approaches to CAD are becoming more sophisticated with the use of more arterial conduits, less invasive surgical approaches, and development of new types of stents for PCI; however, expect the debate to continue regarding which approach to CAD is best. This is not a battle between surgical and nonsurgical specialties. Rather, the goal should be an amicable, collaborative heart-care team. After all, the most important question is, as always, which therapy is best for the individual patient.
- Sheldon WC, Favaloro RG, Sones FM Jr, Effler DB. Reconstructive coronary artery surgery: venous autograft technique. JAMA 1970; 213:78–82.
- Serruys PW, Morice M-C, Kappetein AP, et al; for the SYNTAX Investigators. Percutaneous coronary intervention versus coronary-artery bypass grafting for severe coronary artery disease. N Engl J Med 2009; 360:961–972.
- Mohr FW, Morice M-C, Kappetein AP, et al. Coronary artery bypass graft surgery versus percutaneous coronary intervention in patients with three-vessel disease and left main coronary disease: 5-year follow-up of the randomised, clinical SYNTAX trial. Lancet 2013; 381:629–638.
- Farkouh ME, Domanski M, Sleeper LA, et al; for the FREEDOM Trial Investigators. Strategies for multivessel revascularization in patients with diabetes. N Engl J Med 2012; 367:2375–2384.
- Dangas GD, Farkouh ME, Sleeper LA, et al; for the FREEDOM Investigators. Long-term outcome of PCI versus CABG in insulin and non-insulin-treated diabetic patients: results from the FREEDOM trial. J Am Coll Cardiol 2014; 64:1189–1197.
- Park S-J, Ahn J-M, Kim Y-H, et al; for the BEST Trial Investigators. Trial of everolimus-eluting stents or bypass surgery for coronary disease. N Engl J Med 2015; 372:1204–1212.
- Mäkikallio T, Holm NR, Lindsay M, et al; for the NOBLE study investigators. Percutaneous coronary angioplasty versus coronary artery bypass grafting in treatment of unprotected left main stenosis (NOBLE): a prospective, randomised, open-label, non-inferiority trial. Lancet 2016; 388:2743–2752.
- Jeon C, Candia SC, Wang JC, et al. Relative spatial distributions of coronary artery bypass graft insertion and acute thrombosis: a model for protection from acute myocardial infarction. Am Heart J 2010; 160:195–201.
- The Society of Thoracic Surgeons and Duke Clinical Research Institute. Adult cardiac surgery database: executive summary (10 years—STS period ending March 31, 2016). https://www.sts.org/sites/default/files/documents/2016Harvest2_ExecutiveSummary_new.pdf. Accessed March 10, 2017.
- Lopes RD, Hafley GE, Allen KB, et al. Endoscopic versus open vein-graft harvesting in coronary-artery bypass surgery. N Engl J Med 2009; 361:235–244.
- Williams JB, Peterson ED, Brennan JM, et al. Association between endoscopic vs open vein-graft harvesting and mortality, wound complications, and cardiovascular events in patients undergoing CABG surgery. JAMA 2012; 308:475–484.
- Taggart DP, Ben Gal Y, Lees B, et al. A randomized trial of external stenting for saphenous vein grafts in coronary artery bypass grafting. Ann Thorac Surg 2015; 99:2039–2045.
- Loop FD, Lytle BW, Cosgrove DM, et al. Influence of the internal-mammary-artery graft on 10-year survival and other cardiac events. N Engl J Med 1986; 314:1–6.
- Taggart DP, Gray AM, et al; for the ART Investigators. Randomized trial of bilateral versus single internal-thoracic-artery grafts. N Engl J Med 2016; 375:2540–2549.
- Lytle BW, Blackstone EH, Sabik JF, et al. The effect of bilateral internal thoracic artery grafting on survival during 20 postoperative years. Ann Thorac Surg 2004; 78:2005–2012; discussion 2012–2014.
- Goldman S, Sethi GK, Holman W, et al. Radial artery grafts vs saphenous vein grafts in coronary artery bypass surgery: a randomized trial. JAMA 2011; 305:167–174.
- Desai ND, Cohen EA, Naylor CD, Fremes SE; for the Radial Artery Patency Study Investigators. A randomized comparison of radial-artery and saphenous-vein coronary bypass grafts. N Engl J Med 2004; 351:2302–2309.
- Collins P, Webb CM, Chong CF, Moat NE; for the Radial Artery Versus Saphenous Vein Patency (RSVP) Trial Investigators. Radial artery versus saphenous vein patency randomized trial: five-year angiographic follow-up. Circulation 2008; 117:2859–2864.
- Benedetto U, Caputo M, Gaudino M, et al. Right internal thoracic artery or radial artery? A propensity-matched comparison on the second-best arterial conduit. J Thorac Cardiovasc Surg 2017; 153:79–88.
- Aldea GS, Bakaeen FG, Pal J, et al. The Society of Thoracic Surgeons clinical practice guidelines on arterial conduits for coronary artery bypass grafting. Ann Thorac Surg 2016; 101:801–809.
- Bakaeen FG, Shroyer AL, Gammie JS, et al. Trends in use of off-pump coronary artery bypass grafting: results from the Society of Thoracic Surgeons Adult Cardiac Surgery Database. J Thorac Cardiovasc Surg 2014; 148:856–864.
- Shroyer AL, Grover FL, Hattler B, et al; for the Veterans Affairs Randomized On/Off Bypass (ROOBY) Study Group. On-pump versus off-pump coronary-artery bypass surgery. N Engl J Med 2009; 361:1827–1837.
- Diegeler A, Börgermann J, Kappert U, et al; for the GOPCABE Study Group. Off-pump versus on-pump coronary-artery bypass grafting in elderly patients. N Engl J Med 2013; 368:1189–1198.
Lamy A, Devereaux PJ, Prabhakaran D, et al; for the CORONARY Investigators. Effects of off-pump and on-pump coronary-artery bypass grafting at 1 year. N Engl J Med 2013; 368:1179–1188. - Lamy A, Devereaux PJ, Prabhakaran D, et al; for the CORONARY Investigators. Five-year outcomes after off-pump or on-pump coronary-artery bypass grafting. N Engl J Med 2016; 375:2359–2368.
- Bonaros N, Schachner T, Lehr E, et al. Five hundred cases of robotic totally endoscopic coronary artery bypass grafting: predictors of success and safety. Ann Thorac Surg 2013; 95:803–812.
- Fihn SD, Gardin JM, Abrams J, et al; American College of Cardiology Foundation/American Heart Association Task Force. 2012 ACCF/AHA/ACP/AATS/PCNA/SCAI/STS guideline for the diagnosis and management of patients with stable ischemic heart disease: a report of the American College of Cardiology Foundation/American Heart Association task force on practice guidelines, and the American College of Physicians, American Association for Thoracic Surgery, Preventive Cardiovascular Nurses Association, Society for Cardiovascular Angiography and Interventions, and Society of Thoracic Surgeons. Circulation 2012; 126:e354–e471.
KEY POINTS
- CABG is considered the standard of care for patients with intermediate or high coronary artery disease burden.
- Traditional CABG performed via median sternotomy with the use of cardiopulmonary bypass is the technical standard for surgical coronary revascularization.
- Suturing the left internal mammary artery directly to the left anterior descending artery is the most effective technique for coronary revascularization.
- Minimally invasive approaches to CABG are safe and effective alternatives in select patient populations.
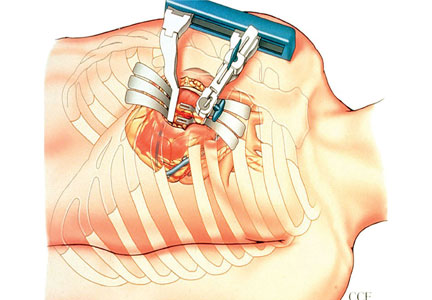
A new generation of drug-eluting stents: Indications and outcomes of bioresorbable vascular scaffolds
The development of a new generation of drug-eluting stents (DES) has had a dramatic impact on the number of stents used for percutaneous transluminal coronary angioplasty for the treatment of coronary artery disease (CAD). But even second- and third-generation DES fall short when compared with coronary artery bypass grafting (CABG) with regards to the need for repeat reavascularization. CABG is advantageous because it bypasses the entire disease segment of the vessel. Thus for multivessel complex CAD, it is still considered the best choice. Nevertheless, most patients prefer the less-invasive option of stents, so practitioners need to provide the best stent available.
There are 3 primary criteria for DES selection:
- Efficacy for a broad range of patients and lesion complexities that primarily provides consistency in improving measures of angiographic and clinical efficacy
- Safety as determined by the following:
- Enable healing and promote endothelialization
- Permit functional endothelium
- Obtaining complete apposition
- Reduction or elimination of late and very late stent thrombosis
- Minimizing the need for long-term dual antiplatelet therapy
- Performance provided by reliable delivery capabilities to the lesion site.
GREAT EXPECTATIONS
New DES must be shown to be superior to previous generation stents. Although preclinical endothelialization and other mechanistic surrogates are good enough to claim an improvement, the traditional method is to compare clinical outcomes with the new stent versus the existing stent in a randomized clinical trial.

PROBLEMS WITH DURABLE POLYMER STENTS
Complications with durable polymer DES have included increased local inflammation and neoatherosclerosis. There are reports of subacute stent thrombosis due to lack of adequate expansion and stent apposition. Also reported was late thrombosis, resulting in increased rates of myocardial infarction and death.
These issues motivated engineers to improve and iterate the DES technology. One important technological change is the decrease in strut thickness from 140 µm to as low as 60 µm. The thickness of the polymer coating also has been reduced. The polymer became thinner, more biocompatible, and in some stents, only abluminal. Further developments were to substitute the durable polymer with a biodegradable polymer and perhaps even design a polymer-free stent.
BIORESORBABLE POLYMERS EMERGE
The time course for resorption of bioresorbable polymers ranges from 2 to 15 months, but they all degrade, which should improve long-term outcomes. A meta-analysis of data from the LEADERS trial and ISAR-TEST 3 and 4 found that the bioresorbable polymer stents were associated with significantly lower rates of target-lesion revascularization (P = .029) and stent thrombosis (P = .015) than durable polymer DES at 4 years after implantation.1 Those results led to the notion that stents with a biodegradable polymer would result in lower rates of stent thrombosis than durable polymer stents; however, that was not the case when stents with biodegradable polymers were compared with second-generation DES.
In the COMPARE II trial,2 the rates of stent thrombosis and target-lesion revascularization were not statistically different for the thick-strut biodegradable polymer biolimus-eluting stent (Nobori) compared with the second-generation thin-strut permanent-polymer stents (Xience). In the CENTURY II trial,3 a third-generation biodegradable sirolimus-eluting stent (Ultimaster) had stent thrombosis rates similar to those of a durable polymer everolimus-eluting stent (Xience) 300 days after insertion (4.36% vs 5.27%, respectively). Target-lesion revascularization rates were also about the same for the stents. In the EVOLVE II trial comparing the thin-strut biodegradable everolimus-eluting stent (Synergy) vs the thin-strut permanent-polymer everolimus-eluting stent (Promus), the 12-month target lesion failure rates for the stents were essentially the same.4
THE RATIONALE FOR BIORESORBABLE STENTS
Another approach was to use biodegradable scaffolds that will be eliminating from the vessel wall once it “completes the job.” The main bioresorbable materials used were polylactic acid or biodegradable metal-like magnesium. These materials pose a technological challenge. While the biodegradable scaffolds are completely eliminated overtime, they still need to equate the performance of best-in-class drug-eluting stent with respect to efficacy and safety. After the Absorb everolimus-eluting BVS system (Absorb BVS) was launched in Europe, initial studies showed scaffold-related thrombosis rates as high as 3.4%.5–7 That compares with 0.4% for second-generation DES—a troubling result for a new technology.
Rates of restenosis and stent thrombosis are similar for bioresorbable stents and standard durable polymer stents. But what are the potential added benefits of bioresorbable stents? And will they improve patient outcomes?
Bioresorbable stents certainly appeal to patients who do not want a permanent, rigid, metallic implant. Also appealing are the proposed benefits of restoration of vasomotion, late luminal enlargement, preservation of CABG targets, and relief of angina. Whether bioresorbable stents improve these outcomes has not been established. Currently, there is no long-term evidence of reduced rates of adverse events, although in 1 study, optical coherence tomography images recorded 10 years after implantation of the first bioresorbable stents showed a pristine vessel with no signs of the struts.8
Several facts are known about the Absorb BVS:
- Preclinical evidence shows complete resorption and return of vascular function, but this takes 3 to 4 years.
- Imaging data at 5 years from the Absorb cohort B trial show complete resorption of struts, lumen preservation, return of function, and plaque regression.9
- In ABSORB III, the pivotal US trial, the stent was within the primary end point showing noninferiority in safety and effectiveness compared with Xience in the first year.10
- Absorb clinical trials in Japan and China confirmed ABSORB III results.
- Meta-analysis (> 3,300 patients) confirmed safety and effectiveness of Absorb.11
- Real-world Absorb clinical evidence continues to show improving outcomes with optimized implant techniques.
- Absorb stent was approved by the US Food and Drug Administration (FDA) in July 2016; more than 150,000 have been implanted worldwide.
The increased rates of target-lesion revascularization and stent thrombosis were likely attributable to inserting the stents into small-diameter vessels that are probably too small for the Absorb BVS. When small vessels (< 2.25 mm) are eliminated from the analysis, the rates were as follows.
Results for vessels > 2.25 mm:
- Target-lesion revascularization: 6.7 % vs 5.5%
- Stent thrombosis: 0.9% vs 0.6%.
- Results for small vessels (< 2.25 mm):
- Target-lesion revascularization: 12.9% vs 8.3%
- Stent thrombosis: 4.6% vs 1.5%.
The lesson is that the Absorb BVS should not be placed in arteries smaller than 2.25 mm in diameter.
ABSORB II STUDY RESULTS RAISE QUESTIONS
Another concern was uncovered in July 2016 when results were published from the ABSORB II trial on vasomotor reactivity at 3 years.13 This clinical trial randomized 501 patients in a 2:1 ratio to the Absorb BVS or the Xience DES at 46 sites outside the United States. Assessment for changes in mean lumen diameter between pre- and post-nitrate administration showed no differences between the groups; thus, the Absorb BVS did not achieve a level of superior vasomotor reactivity. There was vasomotor reactivity probably because the surrogate marker was angiographic follow-up and not intravascular ultrasound or tomography.
Further, the coprimary end point of angiographic late luminal loss at 3 years did not meet its noninferiority standard. The Absorb BVS was expected to have lower rates of late lumen loss because the struts are gone and there is less new intimal formation; however, at 3 years, that was not the case.
The rate of acute stent thrombosis also was alarming: 8 cases for Absorb BVS versus none for Xience. This caused alarm, raising the question of why it was happening in these patients 2 to 3 years after implantation.
Animal studies investigating the association of thicker struts and increased thrombogenicity have reported that the 157-µm BVS had much more platelet buildup and thrombogenicity than a 120-µm biomatrix stent. The 74-µm Synergy stent had even lower rates of thrombosis. The reason for increased thrombogenicity with thicker struts requires further study.
Also, an analysis of the secondary cardiac end points at 3 years in ABSORB II found no clinical patient-oriented differences between the Absorb BVS and the Xience stent (20.8% vs 24.0%, respectively; P = .44). However, rates of device-oriented clinical end points were significantly higher for Absorb BVS (10.4% vs 4.9%; P = .043).13
Clearly, the results for Absorb BVS in this study were not positive. One explanation is suboptimal implantation techniques that did not appose the polymer to the wall. A few years ago, focus shifted to an optimal technique for scaffold deployment, which included predilation, appropriate sizing of the scaffold to the size of the vessel, and postdilation with the intention of embedding the polymer in the vessel wall. Multiple studies have reported fewer incidents of stent thrombosis with the implementation of this protocol.14
Further studies have continued to report increased rates of late scaffold thrombosis in follow-ups of 30 days to 3 years. This resulted in an advisory letter from the FDA focused on appropriate clinical use of the device and withdrawal of ABSORB from commercial use in Europe and Australia.
BIORESORBABLE SCAFFOLDS PIPELINE

This is questionable because one has to believe in the vulnerable plaque theory, which assumes potential eruption of plaques. The Absorb can actually seal a thin cap atheroma and necrotic core over time. It seems that this technology can cause some late lumen enlargement and seal an existing plaque, which may have implications for the future.
SUMMARY
This is the current state of the Absorb BVS:
- More than 150,000 implanted globally
- Received FDA approval in July 2016
- Should not be used in small vessels (ie, lumen diameter < 2.25 mm)
- Thrombosis rates 2 to 3 years after implantation are of concern
- Focusing on appropriate surgical implantation technique can improve outcomes.
Overall, use of bioresorbable stent technology is intriguing. While there is ongoing patient preference for bioresorbable technology, clinical trial results raise the question of whether bioresorbable scaffolds are inferior to best-in-class DES. Improving the scaffold technology and the implantation techniques may equate the short-term outcome of the bioresorbable scaffolds with metallic stents with the hope that over time (when the scaffold is gone), the advantage will be with the bioresorbable scaffolds. Meanwhile, the technology is still seeking its best clinical utility, and a matching performance to the best-in-class DES.
Time will tell whether 5 to 10 years after implantation, BRS technology will outperform durable metallic stents.
- Stefanini GG, Byrne RA, Serruys PW, et al. Biodegradable polymer drug-eluting stents reduce the risk of stent thrombosis at 4 years in patients undergoing percutaneous coronary intervention: a pooled analysis of individual patient data from the ISAR-TEST 3, ISAR-TEST 4, and LEADERS randomized trials. Eur Heart J 2012; 33:1214–1222.
- Smits PC, Hofma S, Togni M, et al. Abluminal biodegradable polymer biolimus-eluting stent versus durable polymer everolimus-eluting stent (COMPARE II): a randomised, controlled, non-inferiority trial. Lancet 2013; 381:651–660.
- Saito S, Valdes-Chavarri M, Richardt G, et al; for the CENTURY II Investigators. A randomized, prospective, intercontinental evaluation of a bioresorbable polymer sirolimus-eluting coronary stent system: the CENTURY II (Clinical Evaluation of New Terumo Drug-Eluting Coronary Stent System in the Treatment of Patients with Coronary Artery Disease) trial. Eur Heart J 2014; 35:2021–2031.
- Kereiakes DJ, Meredith IT, Windecker S, et al. Efficacy and safety of a novel bioabsorbable polymer-coated, everolimus-eluting coronary stent: the EVOLVE II randomized trial. Circ Cardiovasc Interv 2015; 8:e002372. doi: 10.1161/CIRCINTERVENTIONS.114.002372
- Kraak RP, Hassell ME, Grundeken MJ, et al. Initial experience and clinical evaluation of the Absorb bioresorbable vascular scaffold (BVS) in real-world practice: the AMC Single Centre Real World PCI Registry. EuroIntervention 2015; 10:1160–1168.
- Capodanno D, Gori T, Nef H, et al. Percutaneous coronary intervention with everolimus-eluting bioresorbable vascular scaffolds in routine clinical practice: early and midterm outcomes from the European multicentre GHOST-EU registry. EuroIntervention 2015; 10:1144–1153.
- Ielasi A, Cortese B, Varricchio A, et al. Immediate and midterm outcomes following primary PCI with bioresorbable vascular scaffold implantation in patients with ST-segment myocardial infarction: insights from the multicentre “Registro ABSORB Italiano” (RAI registry). EuroIntervention 2015; 11:157–162.
- Onuma Y, Piazza N, Ormiston JA, Serruys PW. Everolimus-eluting bioabsorbable stent—Abbott Vascular programme. EuroIntervention 2009; 5(suppl F):F98–F102.
- De Bruyne B, Toth GG, Onuma Y, Serruys PW. ABSORB cohort B trial: five year angiographic results of the ABSORB everolimus eluting bioresorbable vascular scaffold. J Am Coll Cardiol 2014; 64(suppl):B181. Abstract TCT 619.
- Ellis SG, Kereiakes DJ, Metzger DC, et al; for the ABSORB III Investigators. Everolimus-eluting bioresorbable scaffolds for coronary artery disease. N Engl J Med 2015; 373:1905–1915.
- Stone GW, Gao R, Kimura T, et al. 1-year outcomes with the Absorb bioresorbable scaffold in patients with coronary artery disease: a patient-level, pooled meta-analysis. Lancet 2016; 387:1277–1289.
- Kuramitsu S, Sonoda S, Yokoi H, et al. Long-term coronary arterial response to biodegradable polymer biolimus-eluting stents in comparison with durable polymer sirolimus-eluting stents and bare-metal stents: five-year follow-up optical coherence tomography study. Atherosclerosis 2014; 237:23–29.
- Serruys PW, Chevalier B, Sotomi Y, et al. Comparison of an everolimus-eluting bioresorbable scaffold with an everolimus-eluting metallic stent for the treatment of coronary artery stenosis (ABSORB II): a 3 year, randomised, controlled, single-blind, multicentre clinical trial. Lancet 2016; 388:2479–2491.
- Puricel S, Cuculi F, Weissner M, et al. Bioresorbable coronary scaffold thrombosis: multicenter comprehensive analysis of clinical presentation, mechanisms, and predictors. J Am Coll Cardiol 2016; 67:921–931.
The development of a new generation of drug-eluting stents (DES) has had a dramatic impact on the number of stents used for percutaneous transluminal coronary angioplasty for the treatment of coronary artery disease (CAD). But even second- and third-generation DES fall short when compared with coronary artery bypass grafting (CABG) with regards to the need for repeat reavascularization. CABG is advantageous because it bypasses the entire disease segment of the vessel. Thus for multivessel complex CAD, it is still considered the best choice. Nevertheless, most patients prefer the less-invasive option of stents, so practitioners need to provide the best stent available.
There are 3 primary criteria for DES selection:
- Efficacy for a broad range of patients and lesion complexities that primarily provides consistency in improving measures of angiographic and clinical efficacy
- Safety as determined by the following:
- Enable healing and promote endothelialization
- Permit functional endothelium
- Obtaining complete apposition
- Reduction or elimination of late and very late stent thrombosis
- Minimizing the need for long-term dual antiplatelet therapy
- Performance provided by reliable delivery capabilities to the lesion site.
GREAT EXPECTATIONS
New DES must be shown to be superior to previous generation stents. Although preclinical endothelialization and other mechanistic surrogates are good enough to claim an improvement, the traditional method is to compare clinical outcomes with the new stent versus the existing stent in a randomized clinical trial.
PROBLEMS WITH DURABLE POLYMER STENTS
Complications with durable polymer DES have included increased local inflammation and neoatherosclerosis. There are reports of subacute stent thrombosis due to lack of adequate expansion and stent apposition. Also reported was late thrombosis, resulting in increased rates of myocardial infarction and death.
These issues motivated engineers to improve and iterate the DES technology. One important technological change is the decrease in strut thickness from 140 µm to as low as 60 µm. The thickness of the polymer coating also has been reduced. The polymer became thinner, more biocompatible, and in some stents, only abluminal. Further developments were to substitute the durable polymer with a biodegradable polymer and perhaps even design a polymer-free stent.
BIORESORBABLE POLYMERS EMERGE
The time course for resorption of bioresorbable polymers ranges from 2 to 15 months, but they all degrade, which should improve long-term outcomes. A meta-analysis of data from the LEADERS trial and ISAR-TEST 3 and 4 found that the bioresorbable polymer stents were associated with significantly lower rates of target-lesion revascularization (P = .029) and stent thrombosis (P = .015) than durable polymer DES at 4 years after implantation.1 Those results led to the notion that stents with a biodegradable polymer would result in lower rates of stent thrombosis than durable polymer stents; however, that was not the case when stents with biodegradable polymers were compared with second-generation DES.
In the COMPARE II trial,2 the rates of stent thrombosis and target-lesion revascularization were not statistically different for the thick-strut biodegradable polymer biolimus-eluting stent (Nobori) compared with the second-generation thin-strut permanent-polymer stents (Xience). In the CENTURY II trial,3 a third-generation biodegradable sirolimus-eluting stent (Ultimaster) had stent thrombosis rates similar to those of a durable polymer everolimus-eluting stent (Xience) 300 days after insertion (4.36% vs 5.27%, respectively). Target-lesion revascularization rates were also about the same for the stents. In the EVOLVE II trial comparing the thin-strut biodegradable everolimus-eluting stent (Synergy) vs the thin-strut permanent-polymer everolimus-eluting stent (Promus), the 12-month target lesion failure rates for the stents were essentially the same.4
THE RATIONALE FOR BIORESORBABLE STENTS
Another approach was to use biodegradable scaffolds that will be eliminating from the vessel wall once it “completes the job.” The main bioresorbable materials used were polylactic acid or biodegradable metal-like magnesium. These materials pose a technological challenge. While the biodegradable scaffolds are completely eliminated overtime, they still need to equate the performance of best-in-class drug-eluting stent with respect to efficacy and safety. After the Absorb everolimus-eluting BVS system (Absorb BVS) was launched in Europe, initial studies showed scaffold-related thrombosis rates as high as 3.4%.5–7 That compares with 0.4% for second-generation DES—a troubling result for a new technology.
Rates of restenosis and stent thrombosis are similar for bioresorbable stents and standard durable polymer stents. But what are the potential added benefits of bioresorbable stents? And will they improve patient outcomes?
Bioresorbable stents certainly appeal to patients who do not want a permanent, rigid, metallic implant. Also appealing are the proposed benefits of restoration of vasomotion, late luminal enlargement, preservation of CABG targets, and relief of angina. Whether bioresorbable stents improve these outcomes has not been established. Currently, there is no long-term evidence of reduced rates of adverse events, although in 1 study, optical coherence tomography images recorded 10 years after implantation of the first bioresorbable stents showed a pristine vessel with no signs of the struts.8
Several facts are known about the Absorb BVS:
- Preclinical evidence shows complete resorption and return of vascular function, but this takes 3 to 4 years.
- Imaging data at 5 years from the Absorb cohort B trial show complete resorption of struts, lumen preservation, return of function, and plaque regression.9
- In ABSORB III, the pivotal US trial, the stent was within the primary end point showing noninferiority in safety and effectiveness compared with Xience in the first year.10
- Absorb clinical trials in Japan and China confirmed ABSORB III results.
- Meta-analysis (> 3,300 patients) confirmed safety and effectiveness of Absorb.11
- Real-world Absorb clinical evidence continues to show improving outcomes with optimized implant techniques.
- Absorb stent was approved by the US Food and Drug Administration (FDA) in July 2016; more than 150,000 have been implanted worldwide.
The increased rates of target-lesion revascularization and stent thrombosis were likely attributable to inserting the stents into small-diameter vessels that are probably too small for the Absorb BVS. When small vessels (< 2.25 mm) are eliminated from the analysis, the rates were as follows.
Results for vessels > 2.25 mm:
- Target-lesion revascularization: 6.7 % vs 5.5%
- Stent thrombosis: 0.9% vs 0.6%.
- Results for small vessels (< 2.25 mm):
- Target-lesion revascularization: 12.9% vs 8.3%
- Stent thrombosis: 4.6% vs 1.5%.
The lesson is that the Absorb BVS should not be placed in arteries smaller than 2.25 mm in diameter.
ABSORB II STUDY RESULTS RAISE QUESTIONS
Another concern was uncovered in July 2016 when results were published from the ABSORB II trial on vasomotor reactivity at 3 years.13 This clinical trial randomized 501 patients in a 2:1 ratio to the Absorb BVS or the Xience DES at 46 sites outside the United States. Assessment for changes in mean lumen diameter between pre- and post-nitrate administration showed no differences between the groups; thus, the Absorb BVS did not achieve a level of superior vasomotor reactivity. There was vasomotor reactivity probably because the surrogate marker was angiographic follow-up and not intravascular ultrasound or tomography.
Further, the coprimary end point of angiographic late luminal loss at 3 years did not meet its noninferiority standard. The Absorb BVS was expected to have lower rates of late lumen loss because the struts are gone and there is less new intimal formation; however, at 3 years, that was not the case.
The rate of acute stent thrombosis also was alarming: 8 cases for Absorb BVS versus none for Xience. This caused alarm, raising the question of why it was happening in these patients 2 to 3 years after implantation.
Animal studies investigating the association of thicker struts and increased thrombogenicity have reported that the 157-µm BVS had much more platelet buildup and thrombogenicity than a 120-µm biomatrix stent. The 74-µm Synergy stent had even lower rates of thrombosis. The reason for increased thrombogenicity with thicker struts requires further study.
Also, an analysis of the secondary cardiac end points at 3 years in ABSORB II found no clinical patient-oriented differences between the Absorb BVS and the Xience stent (20.8% vs 24.0%, respectively; P = .44). However, rates of device-oriented clinical end points were significantly higher for Absorb BVS (10.4% vs 4.9%; P = .043).13
Clearly, the results for Absorb BVS in this study were not positive. One explanation is suboptimal implantation techniques that did not appose the polymer to the wall. A few years ago, focus shifted to an optimal technique for scaffold deployment, which included predilation, appropriate sizing of the scaffold to the size of the vessel, and postdilation with the intention of embedding the polymer in the vessel wall. Multiple studies have reported fewer incidents of stent thrombosis with the implementation of this protocol.14
Further studies have continued to report increased rates of late scaffold thrombosis in follow-ups of 30 days to 3 years. This resulted in an advisory letter from the FDA focused on appropriate clinical use of the device and withdrawal of ABSORB from commercial use in Europe and Australia.
BIORESORBABLE SCAFFOLDS PIPELINE
This is questionable because one has to believe in the vulnerable plaque theory, which assumes potential eruption of plaques. The Absorb can actually seal a thin cap atheroma and necrotic core over time. It seems that this technology can cause some late lumen enlargement and seal an existing plaque, which may have implications for the future.
SUMMARY
This is the current state of the Absorb BVS:
- More than 150,000 implanted globally
- Received FDA approval in July 2016
- Should not be used in small vessels (ie, lumen diameter < 2.25 mm)
- Thrombosis rates 2 to 3 years after implantation are of concern
- Focusing on appropriate surgical implantation technique can improve outcomes.
Overall, use of bioresorbable stent technology is intriguing. While there is ongoing patient preference for bioresorbable technology, clinical trial results raise the question of whether bioresorbable scaffolds are inferior to best-in-class DES. Improving the scaffold technology and the implantation techniques may equate the short-term outcome of the bioresorbable scaffolds with metallic stents with the hope that over time (when the scaffold is gone), the advantage will be with the bioresorbable scaffolds. Meanwhile, the technology is still seeking its best clinical utility, and a matching performance to the best-in-class DES.
Time will tell whether 5 to 10 years after implantation, BRS technology will outperform durable metallic stents.
- Stefanini GG, Byrne RA, Serruys PW, et al. Biodegradable polymer drug-eluting stents reduce the risk of stent thrombosis at 4 years in patients undergoing percutaneous coronary intervention: a pooled analysis of individual patient data from the ISAR-TEST 3, ISAR-TEST 4, and LEADERS randomized trials. Eur Heart J 2012; 33:1214–1222.
- Smits PC, Hofma S, Togni M, et al. Abluminal biodegradable polymer biolimus-eluting stent versus durable polymer everolimus-eluting stent (COMPARE II): a randomised, controlled, non-inferiority trial. Lancet 2013; 381:651–660.
- Saito S, Valdes-Chavarri M, Richardt G, et al; for the CENTURY II Investigators. A randomized, prospective, intercontinental evaluation of a bioresorbable polymer sirolimus-eluting coronary stent system: the CENTURY II (Clinical Evaluation of New Terumo Drug-Eluting Coronary Stent System in the Treatment of Patients with Coronary Artery Disease) trial. Eur Heart J 2014; 35:2021–2031.
- Kereiakes DJ, Meredith IT, Windecker S, et al. Efficacy and safety of a novel bioabsorbable polymer-coated, everolimus-eluting coronary stent: the EVOLVE II randomized trial. Circ Cardiovasc Interv 2015; 8:e002372. doi: 10.1161/CIRCINTERVENTIONS.114.002372
- Kraak RP, Hassell ME, Grundeken MJ, et al. Initial experience and clinical evaluation of the Absorb bioresorbable vascular scaffold (BVS) in real-world practice: the AMC Single Centre Real World PCI Registry. EuroIntervention 2015; 10:1160–1168.
- Capodanno D, Gori T, Nef H, et al. Percutaneous coronary intervention with everolimus-eluting bioresorbable vascular scaffolds in routine clinical practice: early and midterm outcomes from the European multicentre GHOST-EU registry. EuroIntervention 2015; 10:1144–1153.
- Ielasi A, Cortese B, Varricchio A, et al. Immediate and midterm outcomes following primary PCI with bioresorbable vascular scaffold implantation in patients with ST-segment myocardial infarction: insights from the multicentre “Registro ABSORB Italiano” (RAI registry). EuroIntervention 2015; 11:157–162.
- Onuma Y, Piazza N, Ormiston JA, Serruys PW. Everolimus-eluting bioabsorbable stent—Abbott Vascular programme. EuroIntervention 2009; 5(suppl F):F98–F102.
- De Bruyne B, Toth GG, Onuma Y, Serruys PW. ABSORB cohort B trial: five year angiographic results of the ABSORB everolimus eluting bioresorbable vascular scaffold. J Am Coll Cardiol 2014; 64(suppl):B181. Abstract TCT 619.
- Ellis SG, Kereiakes DJ, Metzger DC, et al; for the ABSORB III Investigators. Everolimus-eluting bioresorbable scaffolds for coronary artery disease. N Engl J Med 2015; 373:1905–1915.
- Stone GW, Gao R, Kimura T, et al. 1-year outcomes with the Absorb bioresorbable scaffold in patients with coronary artery disease: a patient-level, pooled meta-analysis. Lancet 2016; 387:1277–1289.
- Kuramitsu S, Sonoda S, Yokoi H, et al. Long-term coronary arterial response to biodegradable polymer biolimus-eluting stents in comparison with durable polymer sirolimus-eluting stents and bare-metal stents: five-year follow-up optical coherence tomography study. Atherosclerosis 2014; 237:23–29.
- Serruys PW, Chevalier B, Sotomi Y, et al. Comparison of an everolimus-eluting bioresorbable scaffold with an everolimus-eluting metallic stent for the treatment of coronary artery stenosis (ABSORB II): a 3 year, randomised, controlled, single-blind, multicentre clinical trial. Lancet 2016; 388:2479–2491.
- Puricel S, Cuculi F, Weissner M, et al. Bioresorbable coronary scaffold thrombosis: multicenter comprehensive analysis of clinical presentation, mechanisms, and predictors. J Am Coll Cardiol 2016; 67:921–931.
KEY POINTS
- Complications with first-generation durable polymer DES—stent thrombosis and restenosis with target lesion revascularization—led to the development of bioresorbable stents.
- Bioresorbable and durable polymer metallic DES have similar rates of efficacy and of stent thrombosis.
- Bioresorbable DES should be placed in appropriate patient populations and lesion subsets, and limited to arteries larger than 2.25 mm.