User login
Transdermal CBD gel decreases recalcitrant focal seizures
NEW ORLEANS – A synthetic, transdermal, cannabidiol gel reduced the rate of seizures by half in a group of adults with treatment-resistant focal seizures who were participating in an open-label, long-term extension trial.
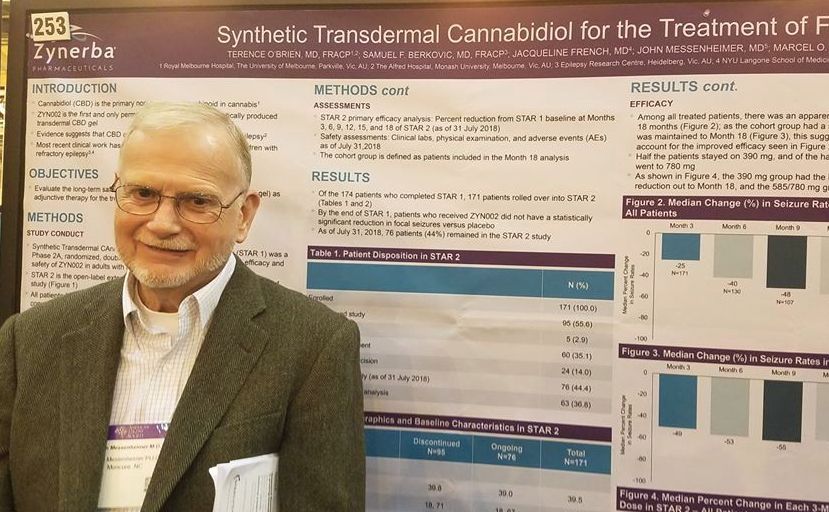
A twice-daily, 390-mg dose of the gel, dubbed ZYN002 (Zynerba) for now, was consistently effective in the 24-month STAR 2 extension trial, John Messenheimer, MD, said at the annual meeting of the American Epilepsy Society.
ZYN002 provided continuing coverage for patients who had used the active compound in the randomized phase, and quickly reduced seizures in those who entered on placebo, said Dr. Messenheimer, a consultant neurologist from Moncure, N.C.
The synthetically produced cannabidiol (CBD) transdermal gel ZYN002 is formulated to be applied twice a day to the shoulder. In addition to incompletely controlled focal epilepsies, ZYN002 is also being investigated for fragile X syndrome, developmental and epileptic encephalopathies.
STAR 2 is the extension of STAR 1 (Synthetic Transdermal Cannabidiol for the Treatment of Epilepsy), a 12-week, phase 2a study of the gel. It randomized 181 patients to placebo or to 195 mg or 390 mg CBD gel twice daily.
Patients were a mean of about 40 years old. They had incompletely controlled focal epilepsies, experiencing about 10 seizures per month despite taking a median of three antiepileptic drugs (AEDs). The most commonly used AEDs were levetiracetam (45%), carbamazepine (41%), lamotrigine (33%), lacosamide (28%), and valproate (22%).
By the end of STAR 1, there was an median 18% reduction in seizures from baseline in the 195-mg group, and the 390-mg group experienced a 14% reduction. However, neither of these findings were statistically significant compared with placebo. Dr. Messenheimer said an unusually high 25% placebo response rate contributed to the nonsignificant findings.
Still, patients remained committed to the study, Dr. Messenheimer pointed out: 171 of the 174 STAR trial completers entered the STAR 2 extension. The entire cohort started on the 390-mg dose, and at month 5, they could titrate up to 585 mg or 780 mg daily, or reduce the does to 195 mg twice daily.
At the 18-month point, 76 patients remained in the study. Five discontinued because of an adverse event. Sixty stopped because the gel was ineffective, and the rest exited the study on the decision of an investigator. Dr. Messenheimer presented a responder analysis on 63 of the remaining subjects with full data, as well as an intent-to-treat analysis on the entire STAR 2 cohort.
Among the entire cohort, continued treatment appeared to confer increasing benefit, he said in an interview. By 3 months, the median seizure reduction rate was 25%; it increased to 40% by 6 months and 48% by 9 months. For the next 9 months, the seizure reduction rate stayed steady, hovering at around 55%.
“Among all the patients, we saw an increase in efficacy over 18 months. Half of the patients stayed on 390 mg, and of the half that titrated to higher doses. Most of these went up to 780 mg, but we really didn’t see that the higher doses conferred much benefit over the 390.”
The 63-patient cohort could be viewed as a responder-only analysis, Dr. Messenheimer said, since most of the dropouts occurred in the first few months of the study. Nevertheless, the response rates in the entire 171-person cohort were quite similar, with a 49% reduction by 3 months that increased to a median 55% reduction by 18 months.
The gel was generally well tolerated, although Dr. Messenheimer pointed out three serious adverse events that were probably drug related: two cases of anxiety and one case of increased seizures. Other events that occurred in significantly more of the CBD groups were headaches (12%), upper respiratory infection (11%), lacerations (9%), and fatigue (6%).
There were no liver enzyme abnormalities.
Zynerba sponsored the study; Dr. Messenheimer is a paid consultant for Zynerba.
SOURCE: O’Brien TJ et al. AES 2018, Abstract 2.253
NEW ORLEANS – A synthetic, transdermal, cannabidiol gel reduced the rate of seizures by half in a group of adults with treatment-resistant focal seizures who were participating in an open-label, long-term extension trial.
A twice-daily, 390-mg dose of the gel, dubbed ZYN002 (Zynerba) for now, was consistently effective in the 24-month STAR 2 extension trial, John Messenheimer, MD, said at the annual meeting of the American Epilepsy Society.
ZYN002 provided continuing coverage for patients who had used the active compound in the randomized phase, and quickly reduced seizures in those who entered on placebo, said Dr. Messenheimer, a consultant neurologist from Moncure, N.C.
The synthetically produced cannabidiol (CBD) transdermal gel ZYN002 is formulated to be applied twice a day to the shoulder. In addition to incompletely controlled focal epilepsies, ZYN002 is also being investigated for fragile X syndrome, developmental and epileptic encephalopathies.
STAR 2 is the extension of STAR 1 (Synthetic Transdermal Cannabidiol for the Treatment of Epilepsy), a 12-week, phase 2a study of the gel. It randomized 181 patients to placebo or to 195 mg or 390 mg CBD gel twice daily.
Patients were a mean of about 40 years old. They had incompletely controlled focal epilepsies, experiencing about 10 seizures per month despite taking a median of three antiepileptic drugs (AEDs). The most commonly used AEDs were levetiracetam (45%), carbamazepine (41%), lamotrigine (33%), lacosamide (28%), and valproate (22%).
By the end of STAR 1, there was an median 18% reduction in seizures from baseline in the 195-mg group, and the 390-mg group experienced a 14% reduction. However, neither of these findings were statistically significant compared with placebo. Dr. Messenheimer said an unusually high 25% placebo response rate contributed to the nonsignificant findings.
Still, patients remained committed to the study, Dr. Messenheimer pointed out: 171 of the 174 STAR trial completers entered the STAR 2 extension. The entire cohort started on the 390-mg dose, and at month 5, they could titrate up to 585 mg or 780 mg daily, or reduce the does to 195 mg twice daily.
At the 18-month point, 76 patients remained in the study. Five discontinued because of an adverse event. Sixty stopped because the gel was ineffective, and the rest exited the study on the decision of an investigator. Dr. Messenheimer presented a responder analysis on 63 of the remaining subjects with full data, as well as an intent-to-treat analysis on the entire STAR 2 cohort.
Among the entire cohort, continued treatment appeared to confer increasing benefit, he said in an interview. By 3 months, the median seizure reduction rate was 25%; it increased to 40% by 6 months and 48% by 9 months. For the next 9 months, the seizure reduction rate stayed steady, hovering at around 55%.
“Among all the patients, we saw an increase in efficacy over 18 months. Half of the patients stayed on 390 mg, and of the half that titrated to higher doses. Most of these went up to 780 mg, but we really didn’t see that the higher doses conferred much benefit over the 390.”
The 63-patient cohort could be viewed as a responder-only analysis, Dr. Messenheimer said, since most of the dropouts occurred in the first few months of the study. Nevertheless, the response rates in the entire 171-person cohort were quite similar, with a 49% reduction by 3 months that increased to a median 55% reduction by 18 months.
The gel was generally well tolerated, although Dr. Messenheimer pointed out three serious adverse events that were probably drug related: two cases of anxiety and one case of increased seizures. Other events that occurred in significantly more of the CBD groups were headaches (12%), upper respiratory infection (11%), lacerations (9%), and fatigue (6%).
There were no liver enzyme abnormalities.
Zynerba sponsored the study; Dr. Messenheimer is a paid consultant for Zynerba.
SOURCE: O’Brien TJ et al. AES 2018, Abstract 2.253
NEW ORLEANS – A synthetic, transdermal, cannabidiol gel reduced the rate of seizures by half in a group of adults with treatment-resistant focal seizures who were participating in an open-label, long-term extension trial.
A twice-daily, 390-mg dose of the gel, dubbed ZYN002 (Zynerba) for now, was consistently effective in the 24-month STAR 2 extension trial, John Messenheimer, MD, said at the annual meeting of the American Epilepsy Society.
ZYN002 provided continuing coverage for patients who had used the active compound in the randomized phase, and quickly reduced seizures in those who entered on placebo, said Dr. Messenheimer, a consultant neurologist from Moncure, N.C.
The synthetically produced cannabidiol (CBD) transdermal gel ZYN002 is formulated to be applied twice a day to the shoulder. In addition to incompletely controlled focal epilepsies, ZYN002 is also being investigated for fragile X syndrome, developmental and epileptic encephalopathies.
STAR 2 is the extension of STAR 1 (Synthetic Transdermal Cannabidiol for the Treatment of Epilepsy), a 12-week, phase 2a study of the gel. It randomized 181 patients to placebo or to 195 mg or 390 mg CBD gel twice daily.
Patients were a mean of about 40 years old. They had incompletely controlled focal epilepsies, experiencing about 10 seizures per month despite taking a median of three antiepileptic drugs (AEDs). The most commonly used AEDs were levetiracetam (45%), carbamazepine (41%), lamotrigine (33%), lacosamide (28%), and valproate (22%).
By the end of STAR 1, there was an median 18% reduction in seizures from baseline in the 195-mg group, and the 390-mg group experienced a 14% reduction. However, neither of these findings were statistically significant compared with placebo. Dr. Messenheimer said an unusually high 25% placebo response rate contributed to the nonsignificant findings.
Still, patients remained committed to the study, Dr. Messenheimer pointed out: 171 of the 174 STAR trial completers entered the STAR 2 extension. The entire cohort started on the 390-mg dose, and at month 5, they could titrate up to 585 mg or 780 mg daily, or reduce the does to 195 mg twice daily.
At the 18-month point, 76 patients remained in the study. Five discontinued because of an adverse event. Sixty stopped because the gel was ineffective, and the rest exited the study on the decision of an investigator. Dr. Messenheimer presented a responder analysis on 63 of the remaining subjects with full data, as well as an intent-to-treat analysis on the entire STAR 2 cohort.
Among the entire cohort, continued treatment appeared to confer increasing benefit, he said in an interview. By 3 months, the median seizure reduction rate was 25%; it increased to 40% by 6 months and 48% by 9 months. For the next 9 months, the seizure reduction rate stayed steady, hovering at around 55%.
“Among all the patients, we saw an increase in efficacy over 18 months. Half of the patients stayed on 390 mg, and of the half that titrated to higher doses. Most of these went up to 780 mg, but we really didn’t see that the higher doses conferred much benefit over the 390.”
The 63-patient cohort could be viewed as a responder-only analysis, Dr. Messenheimer said, since most of the dropouts occurred in the first few months of the study. Nevertheless, the response rates in the entire 171-person cohort were quite similar, with a 49% reduction by 3 months that increased to a median 55% reduction by 18 months.
The gel was generally well tolerated, although Dr. Messenheimer pointed out three serious adverse events that were probably drug related: two cases of anxiety and one case of increased seizures. Other events that occurred in significantly more of the CBD groups were headaches (12%), upper respiratory infection (11%), lacerations (9%), and fatigue (6%).
There were no liver enzyme abnormalities.
Zynerba sponsored the study; Dr. Messenheimer is a paid consultant for Zynerba.
SOURCE: O’Brien TJ et al. AES 2018, Abstract 2.253
REPORTING FROM AES 2018
Key clinical point:
Major finding: The gel reduced uncontrolled focal seizures by a median of about 50%.
Study details: The open-label extension study comprised 171 subjects.
Disclosures: Zynerba sponsored the study; Dr. Messenheimer is a paid consultant for Zynerba.
Source: O’Brien TJ et al. AES 2018, Abstract 2.253
Arthroscopic SLAP IIb Repair Using Knot-Tying Versus Knotless Suture Anchors: Is There a Difference?
ABSTRACT
The use of knotless suture anchors has increased in popularity; however, there is a paucity of literature examining the difference in clinical outcomes with traditional knotted fixation. It was hypothesized that knotless fixation would provide superior clinical outcomes, improved return to play (RTP), and lower revision rates as compared with traditional knotted fixation in the repair of SLAP IIb tears. Seventy-four athletes who underwent arthroscopic SLAP IIb repair with traditional (n = 42) and knotless anchors (n = 32) by a single surgeon were evaluated after a minimum 2-year follow. Demographic and surgical data, RTP, Kerlan-Jobe Orthopaedic Clinic (KJOC) score, American Shoulder and Elbow Surgeons (ASES) score, stability, strength, and pain scores were compared. Knotless anchors had slightly higher RTP (93.5% vs 90.2%, P = .94) and RTP at the same level (58.1% vs 53.7% P = .81) compared with knotted fixation, but the difference did not reach statistical significance. Knotless anchors were less likely to require revision surgery than traditional anchors (9% vs 17%, P = .50), but the difference was not statistically significant. When comparing knotless and traditional knotted suture anchor repair of type llb SLAP tears, knotless fixation required less revision surgery and had higher RTP, ASES, and KJOC scores; however, statistical significance was not achieved in this relatively small cohort.
Continue to: Injury of the anterosuperior...
Injury of the anterosuperior labrum near the biceps origin was first described by Andrews and colleagues in 1985 in overhead athletes.1 The term SLAP, or a tear in the superior labrum anterior to posterior, was coined a few years later by Snyder and colleagues.2 They described an injury to the superior labrum beginning posteriorly and extending anteriorly, including the “anchor” of the biceps tendon to the labrum. Snyder further delineated SLAP lesions into 4 subtypes, the most common being type II, which he described as “degenerative fraying of the labrum with additional detachment of the superior labrum and biceps from the glenoid resulting in an unstable labral anchor.”2,3 Type II tears are of particular importance as they are the most common SLAP lesions, with an incidence of 55%, and comprise nearly 75% of SLAP repairs performed.2,4
Morgan and colleagues further delineated type II SLAP tears into IIa (anterior), IIb (posterior), and IIc (combined). Their group found that SLAP IIb tears were the most common type in overhead throwers, accounting for 47% of overhead athletes with type II tears.5 Further, type IIb tears can have a significant impact in throwers, in part due to greater shoulder instability as well as anterior pseudolaxity.5 SLAP injuries typically have been difficult to successfully treat nonoperatively in overhead athletes.6 A study by Edwards and colleagues6 examined 39 patients with all types of SLAP tears. Although, in their study, nonoperative management failed in 20 patients and they required surgery, 10 of the 15 overhead athletes in whom nonoperative treatment did not fail initially returned to sport at a level equal to or better than their pre-injury level, indicating that nonoperative treatment may play a role in some patients’ recovery.6
Surgical outcomes of SLAP IIb repairs have traditionally been less predictable than those of other shoulder injuries. Some believe that traditional knotted anchors may be partially to blame by abrading the rotator cuff, possibly leading to rotator cuff tears and pain. Further, knotted anchors are typically bulkier and require more experience with tying and tensioning and, therefore, may lead to less consistent results.7 The purpose of this study was to investigate if knotless anchors result in more favorable outcomes in repair of type IIb SLAP lesions when compared with traditional knotted anchors. It was hypothesized that knotless fixation will provide superior clinical outcomes, improved return to play (RTP), and lower revision rates as compared with traditional knotted fixation in the repair of SLAP IIb tears.
METHODS
PATIENT SELECTION
The authors retrospectively reviewed SLAP tears repaired by the senior author from June 2000 to September 2015. The inclusion criteria consisted of all athletes at any level who were diagnosed intraoperatively with a type IIb SLAP tear as defined by Morgan and colleagues5 with a minimum 2-year follow-up. The exclusion criteria were any patients with a previous shoulder surgery and the presence of any labral pathology aside from a SLAP IIb tear. Patients with rotator cuff or biceps pathologies were included. In all included patients, an initial course of preoperative physical therapy, including strengthening and stabilization of the scapulothoracic joint, had failed. Patient-directed surveys evaluated RTP, as well as the Kerlan-Jobe Orthopaedic Clinic (KJOC) score, American Shoulder and Elbow Surgeons (ASES) score, stability, range of motion (ROM), strength, and pain scores, as previously described.8-10 Institutional Review Board and informed consent approval were acquired prior to initiation of the study.
PATIENT EVALUATION
An appropriate preoperative history was taken, and physical examinations were performed, including evaluation of the scapulothoracic joint, as well as tests to evaluate the presence of a SLAP tear, anterior instability, posterior instability, multi-directional instability, and rotator cuff tears, as previously described.11 Patients with a history and physical examination concerning SLAP pathology underwent an magnetic resonance imaging (MRI) arthrogram, which was used in conjunction with intraoperative findings to diagnose type IIb SLAP tears.
Continue to: SURGICAL TECHNIQUE
SURGICAL TECHNIQUE
All surgeries were performed arthroscopically with the patient in the lateral decubitus position. The SLAP lesions were subsequently repaired using a technique similar to that described by Burkhart and colleagues.12 The traditional knotted fixation incorporated the use of 3.0 Bio-FASTak (Arthrex) with #2 FiberWire (Arthrex). Knotless anchor fixation was performed using 2.9 mm × 12.5 mm or 2.4 mm × 11.3 mm BioComposite PushLock (Arthrex) suture anchors, based on the size of the glenoid, with LabralTape or SutureTape (Arthrex). Patients who had surgery before January 1, 2013 underwent fixation with traditional knotted fixation; after that date, patients underwent fixation with knotless anchors.
POSTOPERATIVE REHABILITATION
Patients underwent a strict postoperative protocol in which they were kept in a sling with an abduction pillow for the first 6 weeks and performed pendulum exercises and passive motion only. A formal physical therapy regimen started at 4 weeks with passive ROM, passive posterior capsular and internal rotation stretching, scapulothoracic mobility, and biceps, rotator cuff, and capsular stabilizer strengthening. At 10 weeks, patients began biceps, rotator cuff, and scapular stabilizer resistance exercises, and at 16 weeks, throwing athletes began an interval throwing program. Patients were first eligible to return to sport without limitation at 9 months.
STATISTICAL ANALYSIS
Return to play, KJOC, ASES, stability, ROM, strength, and pain scores were analyzed and compared using Fisher exact test, the Kruskal-Wallis test, and the Wilcoxon rank sum test, where appropriate. The level of statistical significance was α = 0.05.
RESULTS
Table 1. Patient Demographics | |
Athletes (N) | 74 |
Age (yr) | 30.1 (14-64) |
Knotless anchors | 32 (43.2%) |
Knotted anchors | 42 (56.8%) |
Overhead athletes | 53 (72%) |
Throwing athletes | 29 (39%) |
Follow-up (yr) | 6.5 (2-12) |
Of the 74 athletes who met inclusion criteria, 28 were female (37.8%) and 46 (62.2%) were male. The average follow-up was 6.5 years with a minimum of 2 years and a maximum of 12 years. Forty-two (56.8%) patients underwent traditional knotted suture anchor fixation and 32 (43.2%) underwent knotless anchor fixation. The average age was 30.1 +/– 13.6 years, with a range of 14 to 64 years. The majority of athletes were right hand dominant (79.9%). Fifty-three (72%) were overhead athletes and 29 (39%) were throwing athletes (Table 1). The average age in the knotted group was 33.3 years: 29 of 42 (69%) were overhead athletes and 20 (47.6%) were throwing athletes. In the knotless group, the average age was 25.8 years: 24 of 32 (75.0%) were overhead athletes and 9 (28.1%) were throwing athletes. Primary sports at the time of injury are listed in Table 2. The average number of anchors used was 3.1, with 17 patients (23.0%) requiring ≤2 anchors, 39 (52.7%) requiring 3 anchors, and 18 (24.3%) requiring ≥4 anchors for repair. The number of anchors used was determined intraoperatively by the surgeon on the basis of the size and extent of the tear. Of the entire group of 74 patients, 91.9% returned to sport, 56.8% returned to the same level, 35.1% returned at a lower capacity, and 8.1% were unable to return to sport. Knotless anchors had a slightly higher overall RTP compared with traditional anchors (93.5% vs 90.2%, P = .94), as well as a higher RTP at the same level (58.1% vs 53.7%, P = .81). These differences were, however, not statistically significant (Table 3).
Table 2. Primary Sport at Time of SLAP IIb Injury | |
Primary Sport | n (%) |
Baseball | 14 (19.7%) |
Softball | 8 (11.3%) |
Volleyball | 6 (8.5%) |
Basketball | 5 (7.0%) |
Golf | 5 (7.0%) |
Other Sport | 33 (46.5%) |
No Primary Sport | 3 (4.1%) |
Abbreviation: SLAP, superior labrum anterior to posterior.
Knotless anchors were less likely to require revision surgery than traditional anchors (9% vs 17%, P = .50), but this difference was not statistically significant (Table 3). In the knotted group, 5 patients had revision surgery for rotator cuff tears, and 2 patients had recurrent SLAP tears. In the knotless group, 2 patients had revision surgeries for a torn rotator cuff, and 1 patient had a snapping scapula. A power analysis found that it would take over 300 athletes in each group to detect a significant difference in the revision rate between knotless and traditional anchors.
Table 3. Comparison of Anchor Type in Surgical Fixation of SLAP IIb Tears | |||||
| RTP | RTP Same Level | ASES | KJOC | Revision Rate |
Knotless anchors (n = 32) | 93.5% | 58.1% | 86.3 + 10.5 | 66.1 + 29.6 | 9% |
Traditional anchors (n = 42) | 90.2% | 53.7% | 85.3 + 15.6 | 65.6 + 27.2 | 17% |
P-value | .94 | .81 | .79 | .61 | .50 |
Abbreviations: ASES, American Shoulder and Elbow Surgeons; KJOC, Kerlan-Jobe Orthopaedic Clinic; RTP: return to play. | |||||
Continue to: Although KJOC...
Although KJOC (66.1 vs 65.6 P = .61) and ASES (86.3 vs 85.3 P = .79) scores were also superior with knotless anchors, these differences in scores were not statistically significant (Table 3). Pain was the only variable that was linked to decreased RTP, as patients who rated higher on a pain scale of 0 to 10 were less likely to return to their sport (P < .0001). There was no correlation in outcome measures or RTP with gender, age, number of anchors, or sport type (P > .05). There was no statistically significant difference in RTP, KJOC, or ASES scores between non-overhead and overhead athletes (Table 4). Overall return to sport in throwers was 85.7% (24/28), while 39.3% (11/28) returned at the same level, 46.4% (13/28) at a lower level, and 14.3% (4/28) did not return to sport.
Table 4. Overhead vs Non-Overhead Athletes After Surgical Fixation of SLAP IIb Tears | |||||
| RTP | RTP Same Level | ASES | ASES Good-Excellent | KJOC |
Overhead | 90.6% | 52.3% | 91.7 + 14.1 | 98.1% | 64.6 + 25.7 |
Non-Overhead | 95.5% | 72.7% | 86.7 + 12.7 | 100% | 88.5 + 29.6 |
P value | 0.1 | 0.29 | 0.76 | 0.50 | 0.49 |
Abbreviations: ASES, American Shoulder and Elbow Surgeons; KJOC, Kerlan-Jobe Orthopaedic Clinic; RTP: return to play. | |||||
DISCUSSION
There was no significant difference between knotted and knotless fixation in clinical outcomes or return to sport in the repair of SLAP IIb tears; however, there was a trend toward knotless anchors requiring less revision surgery and having higher RTP, ASES, and KJOC scores than knotted fixation. Despite the inclusion of 74 patients, this study was significantly underpowered, as a power analysis calculated that over 300 athletes would be required in each group to detect a difference in the revision rate.
SLAP tears, traditionally treated with knotted suture anchors, have yielded varying results in the literature, with good to excellent results being reported in 65% to 94% of patients.13-17 The success of SLAP repairs in athletes, especially overhead athletes, remains a difficult problem, as they are common injuries, and RTP is less predictable. Studies differ with regard to the percentage of overhead athletes who are able to return to their previous level of sport, with ranges being reported from 22% to 92%.16,18,19 In a systematic review of 198 patients, Sayde and colleagues16 found that 63% of overhead athletes treated with anchor fixation, tacks, or staples were able to return to their previous level of play. Morgan and colleagues5 found a higher return to sport when compared with other studies, reporting that 83% of patients undergoing SLAP repairs using traditional suture anchors had excellent results, and 87% of the 53 overhead athletes had excellent results based on UCLA shoulder scores. Further, 37 of the 44 pitchers examined (84%) were able to return to their pre-injury levels.5 This is in contrast to Friel and colleagues20 who found that in 48 patients with type II SLAP tears treated with traditional anchors, 23% reported excellent and 56% reported good results in regards to UCLA shoulder scores. Friel and colleagues also found that 62% of all athletes and 59% of overhead athletes were able to return to their previous levels of sport, which is similar to the current study.20 The large discrepancy in RTP at the pre-injury level between this study and that of Morgan and colleagues5 may be due to the shorter minimum follow-up of 1 year as well as the inclusion of all subtypes of SLAP II tears in the latter. The current study had a minimum 2-year follow-up period, with an average of 6.5 years, and was limited to SLAP IIb tears. With a longer follow-up period, patient outcomes and RTP, particularly in overhead sports, may deteriorate; therefore, the current study likely shows a more complete and accurate result.
Knotless anchors were originally introduced as a less time consuming, lower profile, and simpler device to learn and use for arthroscopic procedures.21 Kocaoglu and colleagues22 found that in Bankart repairs, the mean time per anchor placement for knotted anchors was 380 seconds, whereas placement of knotless anchors took on average 225 seconds. A learning curve also exists for proper and efficient knot tying.7 There is also variation in knot tying between surgeons, as evidenced by a wide range in both load to failure and knot height.7 A study performed by Hanypsiak and colleagues7 found that the surgical knot was the weakest portion of the suture-anchor construct, as the knot’s load to failure was less than the pullout strength of the anchor.
There is also concern for the added height associated with traditional knotted fixation, which has been supported by case reports of knot-induced glenoid erosion after arthroscopic fixation of a SLAP tear.23 Hanypsiak and colleagues7 also found that the average knot height occupied 50% to 95% of the space between the humeral head and the acromion when the shoulder is in a neutral position, indicating that the higher profile knotted anchors may contact the undersurface of the acromion, which could affect the labral repair as well as cause rotator cuff injury. Abrasion of the rotator cuff by a prominent knot may cause pain, tearing, and disability. A recent study by Park and colleagues24 reported on 11 patients with knot-induced pain after type II SLAP repair. All complained of sharp pain, with 64% also complaining of clicking. Knot location did not seem to matter, as there was no difference in preoperative symptoms, with 5 of the 11 patients having knots on the glenoid side of the repair on repeat arthroscopy. Patients with knots on the labral side did, however, have humeral head cartilage damage. The knots appeared to be the cause of pain and clicking, as after arthroscopic knot removal, dramatic pain relief was seen, with Constant and UCLA scores significantly improving in all 11 patients. All patients also had positive preoperative compression-rotation testing, and at 6 weeks after surgical knot removal, all were negative.24
Continue to: Further, as shown by Dines and colleagues...
Further, as shown by Dines and colleagues25, knotless anchors may help to better restore the meniscoid anatomy of the superior labrum better than knotted suture anchors. With regards to fixation strength, Uggen and colleagues26, using a cadaveric model, found no difference in initial fixation strength of knotless and traditional suture anchor repair of SLAP II tears, and both restored glenohumeral rotation without over-constraining the shoulder.
Despite the shorter operative time, lower profile, and more consistent tensioning with knotless anchors, the literature is limited with regard to evaluating patient outcomes. In a study by Yung and colleagues13 14 of the 16 patients with type II SLAP tears were treated with knotless anchors, and the authors found that 31.3% of patients had an excellent UCLA score while 43.8% had a good score. This is similar to the outcomes illustrated in studies by both Friel and colleagues20 and Sayde and colleagues.16 In a more recent study, Yang and colleagues27 did find some benefit in regard to ROM with knotless fixation. Their study consisted of 21 patients who underwent surgery with traditional knotted anchor fixation and 20 who underwent knotless horizontal mattress fixation. They found an average UCLA score of 37.6 and ASES score of 91.5 in patients undergoing knotless fixation, and the knotless fixation group had 5% greater total ROM, 15.6% more internal rotation at abduction, and 11.4% more external rotation at the side as compared with patients undergoing the traditional knotted technique. When compared with the current study, this study also had a significantly shorter follow-up period of 3 years.27 In a 2017 study, Bents and colleagues28 compared 44 patients who underwent knotless and 119 who underwent knotted fixation of SLAP tears. They found no statistically significant difference between knotless and knotted fixation in the ASES score, Visual Analog Scale (VAS), ASES, or Veterans RAND 12-Item Health Survey (VR-12) at 1 year postoperatively. Their outcomes were similar to those of the current study, but as in other mentioned literature, the study by Bents and colleagues28 included multiple surgeons with different postoperative protocols, was not limited to SLAP IIb tears, and also had a shorter follow-up of 1 year. Like Kocaoglu and colleagues22, Bents and colleagues did find knotless anchors to be more efficient, as operative time was reduced by 5.3 minutes per anchor. This likely would have a significant impact on surgical cost and surgeon productivity.28
One limitation of the current study was that despite the inclusion of >70 patients, the study was still significantly underpowered. It was determined that >300 patients in each group would be required to detect a significant difference in the revision rate between the 2 anchor types. Also, due to the retrospective nature of this study, no preoperative scores were collected. The inclusion of objective clinical measurements and follow-up imaging evaluating the rotator cuff and other anatomy would also be of interest.
Although statistical significance was not achieved, there was a trend toward knotless fixation requiring less revision surgery and having higher RTP, ASES, and KJOC scores when compared with traditional knotted fixation at 6.5-year follow-up. Larger studies with longer follow-up periods are necessary to determine the effects of knotted and knotless anchors on rotator cuff tears, patient reported outcomes, and RTP. These complications have been shown in the literature, mostly in case reports, and typically develop over a longer period.23 Despite this, other advantages of knotless fixation, such as its lower profile, the ability to better provide consistent tensioning, and decreased surgical time are important to consider.
1. Andrews JR, Carson WG, McLeod WD. Glenoid labrum tears related to the long head of the biceps. Am J Sports Med. 1985;13(5):337-341. doi:10.1177/036354658501300508.
2. Snyder SJ, Karzel RP, Pizzo WD, Ferkel RD, Friedman MJ. SLAP lesions of the shoulder. Arthrosc J Arthrosc Relat Surg. 1990;6(4):274-279. doi:10.1016/0749-8063(90)90056-J.
3. Ahsan ZS, Hsu JE, Gee AO. The Snyder classification of superior labrum anterior and posterior (SLAP) lesions. Clin Orthop. 2016;474(9):2075-2078. doi:10.1007/s11999-016-4826-z.
4. Erickson BJ, Jain A, Abrams GD, et al. SLAP Lesions: Trends in treatment. Arthrosc J Arthrosc Relat Surg. 2016;32(6):976-981. doi:10.1016/j.arthro.2015.11.044.
5. Morgan C, Burkhart S, Palmeri M, Gillespie M. Type II SLAP lesions: three subtypes and their relationships to superior instability and rotator cuff tears. Arthrosc J Arthrosc Relat Surg. 1998;14(6):553-565. doi:10.1016/S0749-8063(98)70049-0.
6. Edwards SL, Lee JA, Bell J-E, et al. nonoperative treatment of superior labrum anterior posterior tears: Improvements in pain, function, and quality of life. Am J Sports Med. 2010;38(7):1456-1461. doi:10.1177/0363546510370937.
7. Hanypsiak BT, DeLong JM, Simmons L, Lowe W, Burkhart S. Knot strength varies widely among expert arthroscopists. Am J Sports Med. 2014;42(8):1978-1984. doi:10.1177/0363546514535554.
8. Alberta FG, ElAttrache NS, Bissell S, et al. The development and validation of a functional assessment tool for the upper extremity in the overhead athlete. Am J Sports Med. 2010;38(5):903-911. doi:10.1177/0363546509355642.
9. Bradley JP, McClincy MP, Arner JW, Tejwani SG. Arthroscopic capsulolabral reconstruction for posterior instability of the shoulder: a prospective study of 200 shoulders. Am J Sports Med. 2013;41(9):2005-2014. doi:10.1177/0363546513493599.
10. Michener LA, McClure PW, Sennett BJ. American shoulder and elbow surgeons standardized shoulder assessment form, patient self-report section: Reliability, validity, and responsiveness. J Shoulder Elbow Surg. 2002;11(6):587-594. doi:10.1067/mse.2002.127096.
11. Cook C, Hegedus EJ. Orthopedic Physical Examination Tests: An Evidence-Based Approach. Upper Saddle River, NJ: PearsonPrentice Hall; 2008.
12. Burkhart SS, Morgan CD, Kibler WB. The disabled throwing shoulder: Spectrum of pathology part I: Pathoanatomy and biomechanics. Arthrosc J Arthrosc Relat Surg. 2003;19(4):404-420. doi:10.1053/jars.2003.50128.
13. Yung PS-H, Fong DT-P, Kong M-F, et al. Arthroscopic repair of isolated type II superior labrum anterior–posterior lesion. Knee Surg Sports Traumatol Arthrosc. 2008;16(12):1151-1157. doi:10.1007/s00167-008-0629-4.
14. Brockmeier SF, Voos JE, Williams RJ, Altchek DW, Cordasco FA, Allen AA. Outcomes After Arthroscopic Repair of Type-II SLAP Lesions: J Bone Jt Surg-Am Vol. 2009;91(7):1595-1603. doi:10.2106/JBJS.H.00205.
15. Galano GJ, Ahmad CS, Bigliani L, Levine W. Percutaneous SLAP lesion repair technique is an effective alternative to portal of Wilmington. Orthopedics. 2010;33(11). doi:10.3928/01477447-20100924-15.
16. Sayde WM, Cohen SB, Ciccotti MG, Dodson CC. Return to play after type II superior labral anterior-posterior lesion repairs in athletes: A systematic review. Clin Orthop Relat Res. 2012;470(6):1595-1600. doi:10.1007/s11999-012-2295-6.
17. Kim K-H, Bin S-I, Kim J-M. The correlation between posterior tibial slope and maximal angle of flexion after total knee arthroplasty. Knee Surg Relat Res. 2012;24(3):158-163. doi:10.5792/ksrr.2012.24.3.158.
18. Kim S-H, Ha K-I, Kim S-H, Choi H-J. Results of arthroscopic treatment of superior labral lesions. J Bone Joint Surg Am. 2002;84-A(6):981-985.
19. Pagnani MJ, Speer KP, Altchek DW, Warren RF, Dines DM. Arthroscopic fixation of superior labral lesions using a biodegradable implant: a preliminary report. Arthrosc J Arthrosc Relat Surg Off Publ Arthrosc Assoc N Am Int Arthrosc Assoc. 1995;11(2):194-198.
20. Friel NA, Karas V, Slabaugh MA, Cole BJ. Outcomes of type II superior labrum, anterior to posterior (SLAP) repair: Prospective evaluation at a minimum two-year follow-up. J Shoulder Elbow Surg. 2010;19(6):859-867. doi:10.1016/j.jse.2010.03.004.
21. Thal R. A knotless suture anchor. Arthrosc J Arthrosc Relat Surg. 2001;17(2):213-218. doi:10.1053/jars.2001.20666.
22. Kocaoglu B, Guven O, Nalbantoglu U, Aydin N, Haklar U. No difference between knotless sutures and suture anchors in arthroscopic repair of Bankart lesions in collision athletes. Knee Surg Sports Traumatol Arthrosc. 2009;17(7):844-849. doi:10.1007/s00167-009-0811-3.
23. Rhee YG, Ha JH. Knot-induced glenoid erosion after arthroscopic fixation for unstable superior labrum anterior-posterior lesion: Case report. J Shoulder Elbow Surg. 2006;15(3):391-393. doi:10.1016/j.jse.2005.03.010.
24. Park JG, Cho NS, Kim JY, Song JH, Hong SJ, Rhee YG. Arthroscopic Knot Removal for Failed Superior Labrum Anterior-Posterior Repair Secondary to Knot-Induced Pain. Am J Sports Med. 2017;45(11):2563-2568. doi:10.1177/0363546517713662.
25. Dines JS, ElAttrache NS. Horizontal Mattress With a Knotless Anchor to Better Recreate the Normal Superior Labrum Anatomy. Arthrosc J Arthrosc Relat Surg. 2008;24(12):1422-1425. doi:10.1016/j.arthro.2008.06.012.
26. Uggen C, Wei A, Glousman RE, et al. Biomechanical Comparison of Knotless Anchor Repair Versus Simple Suture Repair for Type II SLAP Lesions. Arthrosc J Arthrosc Relat Surg. 2009;25(10):1085-1092. doi:10.1016/j.arthro.2009.03.022.
27. Yang HJ, Yoon K, Jin H, Song HS. Clinical outcome of arthroscopic SLAP repair: conventional vertical knot versus knotless horizontal mattress sutures. Knee Surg Sports Traumatol Arthrosc. 2016;24(2):464-469. doi:10.1007/s00167-014-3449-8.
28. Bents EJ, Brady PC, Adams CR, Tokish JM, Higgins LD, Denard PJ. Patient-reported outcomes of knotted and knotless glenohumeral labral repairs are equivalent. Am J Orthop. 2017;46(6):279-283.
ABSTRACT
The use of knotless suture anchors has increased in popularity; however, there is a paucity of literature examining the difference in clinical outcomes with traditional knotted fixation. It was hypothesized that knotless fixation would provide superior clinical outcomes, improved return to play (RTP), and lower revision rates as compared with traditional knotted fixation in the repair of SLAP IIb tears. Seventy-four athletes who underwent arthroscopic SLAP IIb repair with traditional (n = 42) and knotless anchors (n = 32) by a single surgeon were evaluated after a minimum 2-year follow. Demographic and surgical data, RTP, Kerlan-Jobe Orthopaedic Clinic (KJOC) score, American Shoulder and Elbow Surgeons (ASES) score, stability, strength, and pain scores were compared. Knotless anchors had slightly higher RTP (93.5% vs 90.2%, P = .94) and RTP at the same level (58.1% vs 53.7% P = .81) compared with knotted fixation, but the difference did not reach statistical significance. Knotless anchors were less likely to require revision surgery than traditional anchors (9% vs 17%, P = .50), but the difference was not statistically significant. When comparing knotless and traditional knotted suture anchor repair of type llb SLAP tears, knotless fixation required less revision surgery and had higher RTP, ASES, and KJOC scores; however, statistical significance was not achieved in this relatively small cohort.
Continue to: Injury of the anterosuperior...
Injury of the anterosuperior labrum near the biceps origin was first described by Andrews and colleagues in 1985 in overhead athletes.1 The term SLAP, or a tear in the superior labrum anterior to posterior, was coined a few years later by Snyder and colleagues.2 They described an injury to the superior labrum beginning posteriorly and extending anteriorly, including the “anchor” of the biceps tendon to the labrum. Snyder further delineated SLAP lesions into 4 subtypes, the most common being type II, which he described as “degenerative fraying of the labrum with additional detachment of the superior labrum and biceps from the glenoid resulting in an unstable labral anchor.”2,3 Type II tears are of particular importance as they are the most common SLAP lesions, with an incidence of 55%, and comprise nearly 75% of SLAP repairs performed.2,4
Morgan and colleagues further delineated type II SLAP tears into IIa (anterior), IIb (posterior), and IIc (combined). Their group found that SLAP IIb tears were the most common type in overhead throwers, accounting for 47% of overhead athletes with type II tears.5 Further, type IIb tears can have a significant impact in throwers, in part due to greater shoulder instability as well as anterior pseudolaxity.5 SLAP injuries typically have been difficult to successfully treat nonoperatively in overhead athletes.6 A study by Edwards and colleagues6 examined 39 patients with all types of SLAP tears. Although, in their study, nonoperative management failed in 20 patients and they required surgery, 10 of the 15 overhead athletes in whom nonoperative treatment did not fail initially returned to sport at a level equal to or better than their pre-injury level, indicating that nonoperative treatment may play a role in some patients’ recovery.6
Surgical outcomes of SLAP IIb repairs have traditionally been less predictable than those of other shoulder injuries. Some believe that traditional knotted anchors may be partially to blame by abrading the rotator cuff, possibly leading to rotator cuff tears and pain. Further, knotted anchors are typically bulkier and require more experience with tying and tensioning and, therefore, may lead to less consistent results.7 The purpose of this study was to investigate if knotless anchors result in more favorable outcomes in repair of type IIb SLAP lesions when compared with traditional knotted anchors. It was hypothesized that knotless fixation will provide superior clinical outcomes, improved return to play (RTP), and lower revision rates as compared with traditional knotted fixation in the repair of SLAP IIb tears.
METHODS
PATIENT SELECTION
The authors retrospectively reviewed SLAP tears repaired by the senior author from June 2000 to September 2015. The inclusion criteria consisted of all athletes at any level who were diagnosed intraoperatively with a type IIb SLAP tear as defined by Morgan and colleagues5 with a minimum 2-year follow-up. The exclusion criteria were any patients with a previous shoulder surgery and the presence of any labral pathology aside from a SLAP IIb tear. Patients with rotator cuff or biceps pathologies were included. In all included patients, an initial course of preoperative physical therapy, including strengthening and stabilization of the scapulothoracic joint, had failed. Patient-directed surveys evaluated RTP, as well as the Kerlan-Jobe Orthopaedic Clinic (KJOC) score, American Shoulder and Elbow Surgeons (ASES) score, stability, range of motion (ROM), strength, and pain scores, as previously described.8-10 Institutional Review Board and informed consent approval were acquired prior to initiation of the study.
PATIENT EVALUATION
An appropriate preoperative history was taken, and physical examinations were performed, including evaluation of the scapulothoracic joint, as well as tests to evaluate the presence of a SLAP tear, anterior instability, posterior instability, multi-directional instability, and rotator cuff tears, as previously described.11 Patients with a history and physical examination concerning SLAP pathology underwent an magnetic resonance imaging (MRI) arthrogram, which was used in conjunction with intraoperative findings to diagnose type IIb SLAP tears.
Continue to: SURGICAL TECHNIQUE
SURGICAL TECHNIQUE
All surgeries were performed arthroscopically with the patient in the lateral decubitus position. The SLAP lesions were subsequently repaired using a technique similar to that described by Burkhart and colleagues.12 The traditional knotted fixation incorporated the use of 3.0 Bio-FASTak (Arthrex) with #2 FiberWire (Arthrex). Knotless anchor fixation was performed using 2.9 mm × 12.5 mm or 2.4 mm × 11.3 mm BioComposite PushLock (Arthrex) suture anchors, based on the size of the glenoid, with LabralTape or SutureTape (Arthrex). Patients who had surgery before January 1, 2013 underwent fixation with traditional knotted fixation; after that date, patients underwent fixation with knotless anchors.
POSTOPERATIVE REHABILITATION
Patients underwent a strict postoperative protocol in which they were kept in a sling with an abduction pillow for the first 6 weeks and performed pendulum exercises and passive motion only. A formal physical therapy regimen started at 4 weeks with passive ROM, passive posterior capsular and internal rotation stretching, scapulothoracic mobility, and biceps, rotator cuff, and capsular stabilizer strengthening. At 10 weeks, patients began biceps, rotator cuff, and scapular stabilizer resistance exercises, and at 16 weeks, throwing athletes began an interval throwing program. Patients were first eligible to return to sport without limitation at 9 months.
STATISTICAL ANALYSIS
Return to play, KJOC, ASES, stability, ROM, strength, and pain scores were analyzed and compared using Fisher exact test, the Kruskal-Wallis test, and the Wilcoxon rank sum test, where appropriate. The level of statistical significance was α = 0.05.
RESULTS
Table 1. Patient Demographics | |
Athletes (N) | 74 |
Age (yr) | 30.1 (14-64) |
Knotless anchors | 32 (43.2%) |
Knotted anchors | 42 (56.8%) |
Overhead athletes | 53 (72%) |
Throwing athletes | 29 (39%) |
Follow-up (yr) | 6.5 (2-12) |
Of the 74 athletes who met inclusion criteria, 28 were female (37.8%) and 46 (62.2%) were male. The average follow-up was 6.5 years with a minimum of 2 years and a maximum of 12 years. Forty-two (56.8%) patients underwent traditional knotted suture anchor fixation and 32 (43.2%) underwent knotless anchor fixation. The average age was 30.1 +/– 13.6 years, with a range of 14 to 64 years. The majority of athletes were right hand dominant (79.9%). Fifty-three (72%) were overhead athletes and 29 (39%) were throwing athletes (Table 1). The average age in the knotted group was 33.3 years: 29 of 42 (69%) were overhead athletes and 20 (47.6%) were throwing athletes. In the knotless group, the average age was 25.8 years: 24 of 32 (75.0%) were overhead athletes and 9 (28.1%) were throwing athletes. Primary sports at the time of injury are listed in Table 2. The average number of anchors used was 3.1, with 17 patients (23.0%) requiring ≤2 anchors, 39 (52.7%) requiring 3 anchors, and 18 (24.3%) requiring ≥4 anchors for repair. The number of anchors used was determined intraoperatively by the surgeon on the basis of the size and extent of the tear. Of the entire group of 74 patients, 91.9% returned to sport, 56.8% returned to the same level, 35.1% returned at a lower capacity, and 8.1% were unable to return to sport. Knotless anchors had a slightly higher overall RTP compared with traditional anchors (93.5% vs 90.2%, P = .94), as well as a higher RTP at the same level (58.1% vs 53.7%, P = .81). These differences were, however, not statistically significant (Table 3).
Table 2. Primary Sport at Time of SLAP IIb Injury | |
Primary Sport | n (%) |
Baseball | 14 (19.7%) |
Softball | 8 (11.3%) |
Volleyball | 6 (8.5%) |
Basketball | 5 (7.0%) |
Golf | 5 (7.0%) |
Other Sport | 33 (46.5%) |
No Primary Sport | 3 (4.1%) |
Abbreviation: SLAP, superior labrum anterior to posterior.
Knotless anchors were less likely to require revision surgery than traditional anchors (9% vs 17%, P = .50), but this difference was not statistically significant (Table 3). In the knotted group, 5 patients had revision surgery for rotator cuff tears, and 2 patients had recurrent SLAP tears. In the knotless group, 2 patients had revision surgeries for a torn rotator cuff, and 1 patient had a snapping scapula. A power analysis found that it would take over 300 athletes in each group to detect a significant difference in the revision rate between knotless and traditional anchors.
Table 3. Comparison of Anchor Type in Surgical Fixation of SLAP IIb Tears | |||||
| RTP | RTP Same Level | ASES | KJOC | Revision Rate |
Knotless anchors (n = 32) | 93.5% | 58.1% | 86.3 + 10.5 | 66.1 + 29.6 | 9% |
Traditional anchors (n = 42) | 90.2% | 53.7% | 85.3 + 15.6 | 65.6 + 27.2 | 17% |
P-value | .94 | .81 | .79 | .61 | .50 |
Abbreviations: ASES, American Shoulder and Elbow Surgeons; KJOC, Kerlan-Jobe Orthopaedic Clinic; RTP: return to play. | |||||
Continue to: Although KJOC...
Although KJOC (66.1 vs 65.6 P = .61) and ASES (86.3 vs 85.3 P = .79) scores were also superior with knotless anchors, these differences in scores were not statistically significant (Table 3). Pain was the only variable that was linked to decreased RTP, as patients who rated higher on a pain scale of 0 to 10 were less likely to return to their sport (P < .0001). There was no correlation in outcome measures or RTP with gender, age, number of anchors, or sport type (P > .05). There was no statistically significant difference in RTP, KJOC, or ASES scores between non-overhead and overhead athletes (Table 4). Overall return to sport in throwers was 85.7% (24/28), while 39.3% (11/28) returned at the same level, 46.4% (13/28) at a lower level, and 14.3% (4/28) did not return to sport.
Table 4. Overhead vs Non-Overhead Athletes After Surgical Fixation of SLAP IIb Tears | |||||
| RTP | RTP Same Level | ASES | ASES Good-Excellent | KJOC |
Overhead | 90.6% | 52.3% | 91.7 + 14.1 | 98.1% | 64.6 + 25.7 |
Non-Overhead | 95.5% | 72.7% | 86.7 + 12.7 | 100% | 88.5 + 29.6 |
P value | 0.1 | 0.29 | 0.76 | 0.50 | 0.49 |
Abbreviations: ASES, American Shoulder and Elbow Surgeons; KJOC, Kerlan-Jobe Orthopaedic Clinic; RTP: return to play. | |||||
DISCUSSION
There was no significant difference between knotted and knotless fixation in clinical outcomes or return to sport in the repair of SLAP IIb tears; however, there was a trend toward knotless anchors requiring less revision surgery and having higher RTP, ASES, and KJOC scores than knotted fixation. Despite the inclusion of 74 patients, this study was significantly underpowered, as a power analysis calculated that over 300 athletes would be required in each group to detect a difference in the revision rate.
SLAP tears, traditionally treated with knotted suture anchors, have yielded varying results in the literature, with good to excellent results being reported in 65% to 94% of patients.13-17 The success of SLAP repairs in athletes, especially overhead athletes, remains a difficult problem, as they are common injuries, and RTP is less predictable. Studies differ with regard to the percentage of overhead athletes who are able to return to their previous level of sport, with ranges being reported from 22% to 92%.16,18,19 In a systematic review of 198 patients, Sayde and colleagues16 found that 63% of overhead athletes treated with anchor fixation, tacks, or staples were able to return to their previous level of play. Morgan and colleagues5 found a higher return to sport when compared with other studies, reporting that 83% of patients undergoing SLAP repairs using traditional suture anchors had excellent results, and 87% of the 53 overhead athletes had excellent results based on UCLA shoulder scores. Further, 37 of the 44 pitchers examined (84%) were able to return to their pre-injury levels.5 This is in contrast to Friel and colleagues20 who found that in 48 patients with type II SLAP tears treated with traditional anchors, 23% reported excellent and 56% reported good results in regards to UCLA shoulder scores. Friel and colleagues also found that 62% of all athletes and 59% of overhead athletes were able to return to their previous levels of sport, which is similar to the current study.20 The large discrepancy in RTP at the pre-injury level between this study and that of Morgan and colleagues5 may be due to the shorter minimum follow-up of 1 year as well as the inclusion of all subtypes of SLAP II tears in the latter. The current study had a minimum 2-year follow-up period, with an average of 6.5 years, and was limited to SLAP IIb tears. With a longer follow-up period, patient outcomes and RTP, particularly in overhead sports, may deteriorate; therefore, the current study likely shows a more complete and accurate result.
Knotless anchors were originally introduced as a less time consuming, lower profile, and simpler device to learn and use for arthroscopic procedures.21 Kocaoglu and colleagues22 found that in Bankart repairs, the mean time per anchor placement for knotted anchors was 380 seconds, whereas placement of knotless anchors took on average 225 seconds. A learning curve also exists for proper and efficient knot tying.7 There is also variation in knot tying between surgeons, as evidenced by a wide range in both load to failure and knot height.7 A study performed by Hanypsiak and colleagues7 found that the surgical knot was the weakest portion of the suture-anchor construct, as the knot’s load to failure was less than the pullout strength of the anchor.
There is also concern for the added height associated with traditional knotted fixation, which has been supported by case reports of knot-induced glenoid erosion after arthroscopic fixation of a SLAP tear.23 Hanypsiak and colleagues7 also found that the average knot height occupied 50% to 95% of the space between the humeral head and the acromion when the shoulder is in a neutral position, indicating that the higher profile knotted anchors may contact the undersurface of the acromion, which could affect the labral repair as well as cause rotator cuff injury. Abrasion of the rotator cuff by a prominent knot may cause pain, tearing, and disability. A recent study by Park and colleagues24 reported on 11 patients with knot-induced pain after type II SLAP repair. All complained of sharp pain, with 64% also complaining of clicking. Knot location did not seem to matter, as there was no difference in preoperative symptoms, with 5 of the 11 patients having knots on the glenoid side of the repair on repeat arthroscopy. Patients with knots on the labral side did, however, have humeral head cartilage damage. The knots appeared to be the cause of pain and clicking, as after arthroscopic knot removal, dramatic pain relief was seen, with Constant and UCLA scores significantly improving in all 11 patients. All patients also had positive preoperative compression-rotation testing, and at 6 weeks after surgical knot removal, all were negative.24
Continue to: Further, as shown by Dines and colleagues...
Further, as shown by Dines and colleagues25, knotless anchors may help to better restore the meniscoid anatomy of the superior labrum better than knotted suture anchors. With regards to fixation strength, Uggen and colleagues26, using a cadaveric model, found no difference in initial fixation strength of knotless and traditional suture anchor repair of SLAP II tears, and both restored glenohumeral rotation without over-constraining the shoulder.
Despite the shorter operative time, lower profile, and more consistent tensioning with knotless anchors, the literature is limited with regard to evaluating patient outcomes. In a study by Yung and colleagues13 14 of the 16 patients with type II SLAP tears were treated with knotless anchors, and the authors found that 31.3% of patients had an excellent UCLA score while 43.8% had a good score. This is similar to the outcomes illustrated in studies by both Friel and colleagues20 and Sayde and colleagues.16 In a more recent study, Yang and colleagues27 did find some benefit in regard to ROM with knotless fixation. Their study consisted of 21 patients who underwent surgery with traditional knotted anchor fixation and 20 who underwent knotless horizontal mattress fixation. They found an average UCLA score of 37.6 and ASES score of 91.5 in patients undergoing knotless fixation, and the knotless fixation group had 5% greater total ROM, 15.6% more internal rotation at abduction, and 11.4% more external rotation at the side as compared with patients undergoing the traditional knotted technique. When compared with the current study, this study also had a significantly shorter follow-up period of 3 years.27 In a 2017 study, Bents and colleagues28 compared 44 patients who underwent knotless and 119 who underwent knotted fixation of SLAP tears. They found no statistically significant difference between knotless and knotted fixation in the ASES score, Visual Analog Scale (VAS), ASES, or Veterans RAND 12-Item Health Survey (VR-12) at 1 year postoperatively. Their outcomes were similar to those of the current study, but as in other mentioned literature, the study by Bents and colleagues28 included multiple surgeons with different postoperative protocols, was not limited to SLAP IIb tears, and also had a shorter follow-up of 1 year. Like Kocaoglu and colleagues22, Bents and colleagues did find knotless anchors to be more efficient, as operative time was reduced by 5.3 minutes per anchor. This likely would have a significant impact on surgical cost and surgeon productivity.28
One limitation of the current study was that despite the inclusion of >70 patients, the study was still significantly underpowered. It was determined that >300 patients in each group would be required to detect a significant difference in the revision rate between the 2 anchor types. Also, due to the retrospective nature of this study, no preoperative scores were collected. The inclusion of objective clinical measurements and follow-up imaging evaluating the rotator cuff and other anatomy would also be of interest.
Although statistical significance was not achieved, there was a trend toward knotless fixation requiring less revision surgery and having higher RTP, ASES, and KJOC scores when compared with traditional knotted fixation at 6.5-year follow-up. Larger studies with longer follow-up periods are necessary to determine the effects of knotted and knotless anchors on rotator cuff tears, patient reported outcomes, and RTP. These complications have been shown in the literature, mostly in case reports, and typically develop over a longer period.23 Despite this, other advantages of knotless fixation, such as its lower profile, the ability to better provide consistent tensioning, and decreased surgical time are important to consider.
ABSTRACT
The use of knotless suture anchors has increased in popularity; however, there is a paucity of literature examining the difference in clinical outcomes with traditional knotted fixation. It was hypothesized that knotless fixation would provide superior clinical outcomes, improved return to play (RTP), and lower revision rates as compared with traditional knotted fixation in the repair of SLAP IIb tears. Seventy-four athletes who underwent arthroscopic SLAP IIb repair with traditional (n = 42) and knotless anchors (n = 32) by a single surgeon were evaluated after a minimum 2-year follow. Demographic and surgical data, RTP, Kerlan-Jobe Orthopaedic Clinic (KJOC) score, American Shoulder and Elbow Surgeons (ASES) score, stability, strength, and pain scores were compared. Knotless anchors had slightly higher RTP (93.5% vs 90.2%, P = .94) and RTP at the same level (58.1% vs 53.7% P = .81) compared with knotted fixation, but the difference did not reach statistical significance. Knotless anchors were less likely to require revision surgery than traditional anchors (9% vs 17%, P = .50), but the difference was not statistically significant. When comparing knotless and traditional knotted suture anchor repair of type llb SLAP tears, knotless fixation required less revision surgery and had higher RTP, ASES, and KJOC scores; however, statistical significance was not achieved in this relatively small cohort.
Continue to: Injury of the anterosuperior...
Injury of the anterosuperior labrum near the biceps origin was first described by Andrews and colleagues in 1985 in overhead athletes.1 The term SLAP, or a tear in the superior labrum anterior to posterior, was coined a few years later by Snyder and colleagues.2 They described an injury to the superior labrum beginning posteriorly and extending anteriorly, including the “anchor” of the biceps tendon to the labrum. Snyder further delineated SLAP lesions into 4 subtypes, the most common being type II, which he described as “degenerative fraying of the labrum with additional detachment of the superior labrum and biceps from the glenoid resulting in an unstable labral anchor.”2,3 Type II tears are of particular importance as they are the most common SLAP lesions, with an incidence of 55%, and comprise nearly 75% of SLAP repairs performed.2,4
Morgan and colleagues further delineated type II SLAP tears into IIa (anterior), IIb (posterior), and IIc (combined). Their group found that SLAP IIb tears were the most common type in overhead throwers, accounting for 47% of overhead athletes with type II tears.5 Further, type IIb tears can have a significant impact in throwers, in part due to greater shoulder instability as well as anterior pseudolaxity.5 SLAP injuries typically have been difficult to successfully treat nonoperatively in overhead athletes.6 A study by Edwards and colleagues6 examined 39 patients with all types of SLAP tears. Although, in their study, nonoperative management failed in 20 patients and they required surgery, 10 of the 15 overhead athletes in whom nonoperative treatment did not fail initially returned to sport at a level equal to or better than their pre-injury level, indicating that nonoperative treatment may play a role in some patients’ recovery.6
Surgical outcomes of SLAP IIb repairs have traditionally been less predictable than those of other shoulder injuries. Some believe that traditional knotted anchors may be partially to blame by abrading the rotator cuff, possibly leading to rotator cuff tears and pain. Further, knotted anchors are typically bulkier and require more experience with tying and tensioning and, therefore, may lead to less consistent results.7 The purpose of this study was to investigate if knotless anchors result in more favorable outcomes in repair of type IIb SLAP lesions when compared with traditional knotted anchors. It was hypothesized that knotless fixation will provide superior clinical outcomes, improved return to play (RTP), and lower revision rates as compared with traditional knotted fixation in the repair of SLAP IIb tears.
METHODS
PATIENT SELECTION
The authors retrospectively reviewed SLAP tears repaired by the senior author from June 2000 to September 2015. The inclusion criteria consisted of all athletes at any level who were diagnosed intraoperatively with a type IIb SLAP tear as defined by Morgan and colleagues5 with a minimum 2-year follow-up. The exclusion criteria were any patients with a previous shoulder surgery and the presence of any labral pathology aside from a SLAP IIb tear. Patients with rotator cuff or biceps pathologies were included. In all included patients, an initial course of preoperative physical therapy, including strengthening and stabilization of the scapulothoracic joint, had failed. Patient-directed surveys evaluated RTP, as well as the Kerlan-Jobe Orthopaedic Clinic (KJOC) score, American Shoulder and Elbow Surgeons (ASES) score, stability, range of motion (ROM), strength, and pain scores, as previously described.8-10 Institutional Review Board and informed consent approval were acquired prior to initiation of the study.
PATIENT EVALUATION
An appropriate preoperative history was taken, and physical examinations were performed, including evaluation of the scapulothoracic joint, as well as tests to evaluate the presence of a SLAP tear, anterior instability, posterior instability, multi-directional instability, and rotator cuff tears, as previously described.11 Patients with a history and physical examination concerning SLAP pathology underwent an magnetic resonance imaging (MRI) arthrogram, which was used in conjunction with intraoperative findings to diagnose type IIb SLAP tears.
Continue to: SURGICAL TECHNIQUE
SURGICAL TECHNIQUE
All surgeries were performed arthroscopically with the patient in the lateral decubitus position. The SLAP lesions were subsequently repaired using a technique similar to that described by Burkhart and colleagues.12 The traditional knotted fixation incorporated the use of 3.0 Bio-FASTak (Arthrex) with #2 FiberWire (Arthrex). Knotless anchor fixation was performed using 2.9 mm × 12.5 mm or 2.4 mm × 11.3 mm BioComposite PushLock (Arthrex) suture anchors, based on the size of the glenoid, with LabralTape or SutureTape (Arthrex). Patients who had surgery before January 1, 2013 underwent fixation with traditional knotted fixation; after that date, patients underwent fixation with knotless anchors.
POSTOPERATIVE REHABILITATION
Patients underwent a strict postoperative protocol in which they were kept in a sling with an abduction pillow for the first 6 weeks and performed pendulum exercises and passive motion only. A formal physical therapy regimen started at 4 weeks with passive ROM, passive posterior capsular and internal rotation stretching, scapulothoracic mobility, and biceps, rotator cuff, and capsular stabilizer strengthening. At 10 weeks, patients began biceps, rotator cuff, and scapular stabilizer resistance exercises, and at 16 weeks, throwing athletes began an interval throwing program. Patients were first eligible to return to sport without limitation at 9 months.
STATISTICAL ANALYSIS
Return to play, KJOC, ASES, stability, ROM, strength, and pain scores were analyzed and compared using Fisher exact test, the Kruskal-Wallis test, and the Wilcoxon rank sum test, where appropriate. The level of statistical significance was α = 0.05.
RESULTS
Table 1. Patient Demographics | |
Athletes (N) | 74 |
Age (yr) | 30.1 (14-64) |
Knotless anchors | 32 (43.2%) |
Knotted anchors | 42 (56.8%) |
Overhead athletes | 53 (72%) |
Throwing athletes | 29 (39%) |
Follow-up (yr) | 6.5 (2-12) |
Of the 74 athletes who met inclusion criteria, 28 were female (37.8%) and 46 (62.2%) were male. The average follow-up was 6.5 years with a minimum of 2 years and a maximum of 12 years. Forty-two (56.8%) patients underwent traditional knotted suture anchor fixation and 32 (43.2%) underwent knotless anchor fixation. The average age was 30.1 +/– 13.6 years, with a range of 14 to 64 years. The majority of athletes were right hand dominant (79.9%). Fifty-three (72%) were overhead athletes and 29 (39%) were throwing athletes (Table 1). The average age in the knotted group was 33.3 years: 29 of 42 (69%) were overhead athletes and 20 (47.6%) were throwing athletes. In the knotless group, the average age was 25.8 years: 24 of 32 (75.0%) were overhead athletes and 9 (28.1%) were throwing athletes. Primary sports at the time of injury are listed in Table 2. The average number of anchors used was 3.1, with 17 patients (23.0%) requiring ≤2 anchors, 39 (52.7%) requiring 3 anchors, and 18 (24.3%) requiring ≥4 anchors for repair. The number of anchors used was determined intraoperatively by the surgeon on the basis of the size and extent of the tear. Of the entire group of 74 patients, 91.9% returned to sport, 56.8% returned to the same level, 35.1% returned at a lower capacity, and 8.1% were unable to return to sport. Knotless anchors had a slightly higher overall RTP compared with traditional anchors (93.5% vs 90.2%, P = .94), as well as a higher RTP at the same level (58.1% vs 53.7%, P = .81). These differences were, however, not statistically significant (Table 3).
Table 2. Primary Sport at Time of SLAP IIb Injury | |
Primary Sport | n (%) |
Baseball | 14 (19.7%) |
Softball | 8 (11.3%) |
Volleyball | 6 (8.5%) |
Basketball | 5 (7.0%) |
Golf | 5 (7.0%) |
Other Sport | 33 (46.5%) |
No Primary Sport | 3 (4.1%) |
Abbreviation: SLAP, superior labrum anterior to posterior.
Knotless anchors were less likely to require revision surgery than traditional anchors (9% vs 17%, P = .50), but this difference was not statistically significant (Table 3). In the knotted group, 5 patients had revision surgery for rotator cuff tears, and 2 patients had recurrent SLAP tears. In the knotless group, 2 patients had revision surgeries for a torn rotator cuff, and 1 patient had a snapping scapula. A power analysis found that it would take over 300 athletes in each group to detect a significant difference in the revision rate between knotless and traditional anchors.
Table 3. Comparison of Anchor Type in Surgical Fixation of SLAP IIb Tears | |||||
| RTP | RTP Same Level | ASES | KJOC | Revision Rate |
Knotless anchors (n = 32) | 93.5% | 58.1% | 86.3 + 10.5 | 66.1 + 29.6 | 9% |
Traditional anchors (n = 42) | 90.2% | 53.7% | 85.3 + 15.6 | 65.6 + 27.2 | 17% |
P-value | .94 | .81 | .79 | .61 | .50 |
Abbreviations: ASES, American Shoulder and Elbow Surgeons; KJOC, Kerlan-Jobe Orthopaedic Clinic; RTP: return to play. | |||||
Continue to: Although KJOC...
Although KJOC (66.1 vs 65.6 P = .61) and ASES (86.3 vs 85.3 P = .79) scores were also superior with knotless anchors, these differences in scores were not statistically significant (Table 3). Pain was the only variable that was linked to decreased RTP, as patients who rated higher on a pain scale of 0 to 10 were less likely to return to their sport (P < .0001). There was no correlation in outcome measures or RTP with gender, age, number of anchors, or sport type (P > .05). There was no statistically significant difference in RTP, KJOC, or ASES scores between non-overhead and overhead athletes (Table 4). Overall return to sport in throwers was 85.7% (24/28), while 39.3% (11/28) returned at the same level, 46.4% (13/28) at a lower level, and 14.3% (4/28) did not return to sport.
Table 4. Overhead vs Non-Overhead Athletes After Surgical Fixation of SLAP IIb Tears | |||||
| RTP | RTP Same Level | ASES | ASES Good-Excellent | KJOC |
Overhead | 90.6% | 52.3% | 91.7 + 14.1 | 98.1% | 64.6 + 25.7 |
Non-Overhead | 95.5% | 72.7% | 86.7 + 12.7 | 100% | 88.5 + 29.6 |
P value | 0.1 | 0.29 | 0.76 | 0.50 | 0.49 |
Abbreviations: ASES, American Shoulder and Elbow Surgeons; KJOC, Kerlan-Jobe Orthopaedic Clinic; RTP: return to play. | |||||
DISCUSSION
There was no significant difference between knotted and knotless fixation in clinical outcomes or return to sport in the repair of SLAP IIb tears; however, there was a trend toward knotless anchors requiring less revision surgery and having higher RTP, ASES, and KJOC scores than knotted fixation. Despite the inclusion of 74 patients, this study was significantly underpowered, as a power analysis calculated that over 300 athletes would be required in each group to detect a difference in the revision rate.
SLAP tears, traditionally treated with knotted suture anchors, have yielded varying results in the literature, with good to excellent results being reported in 65% to 94% of patients.13-17 The success of SLAP repairs in athletes, especially overhead athletes, remains a difficult problem, as they are common injuries, and RTP is less predictable. Studies differ with regard to the percentage of overhead athletes who are able to return to their previous level of sport, with ranges being reported from 22% to 92%.16,18,19 In a systematic review of 198 patients, Sayde and colleagues16 found that 63% of overhead athletes treated with anchor fixation, tacks, or staples were able to return to their previous level of play. Morgan and colleagues5 found a higher return to sport when compared with other studies, reporting that 83% of patients undergoing SLAP repairs using traditional suture anchors had excellent results, and 87% of the 53 overhead athletes had excellent results based on UCLA shoulder scores. Further, 37 of the 44 pitchers examined (84%) were able to return to their pre-injury levels.5 This is in contrast to Friel and colleagues20 who found that in 48 patients with type II SLAP tears treated with traditional anchors, 23% reported excellent and 56% reported good results in regards to UCLA shoulder scores. Friel and colleagues also found that 62% of all athletes and 59% of overhead athletes were able to return to their previous levels of sport, which is similar to the current study.20 The large discrepancy in RTP at the pre-injury level between this study and that of Morgan and colleagues5 may be due to the shorter minimum follow-up of 1 year as well as the inclusion of all subtypes of SLAP II tears in the latter. The current study had a minimum 2-year follow-up period, with an average of 6.5 years, and was limited to SLAP IIb tears. With a longer follow-up period, patient outcomes and RTP, particularly in overhead sports, may deteriorate; therefore, the current study likely shows a more complete and accurate result.
Knotless anchors were originally introduced as a less time consuming, lower profile, and simpler device to learn and use for arthroscopic procedures.21 Kocaoglu and colleagues22 found that in Bankart repairs, the mean time per anchor placement for knotted anchors was 380 seconds, whereas placement of knotless anchors took on average 225 seconds. A learning curve also exists for proper and efficient knot tying.7 There is also variation in knot tying between surgeons, as evidenced by a wide range in both load to failure and knot height.7 A study performed by Hanypsiak and colleagues7 found that the surgical knot was the weakest portion of the suture-anchor construct, as the knot’s load to failure was less than the pullout strength of the anchor.
There is also concern for the added height associated with traditional knotted fixation, which has been supported by case reports of knot-induced glenoid erosion after arthroscopic fixation of a SLAP tear.23 Hanypsiak and colleagues7 also found that the average knot height occupied 50% to 95% of the space between the humeral head and the acromion when the shoulder is in a neutral position, indicating that the higher profile knotted anchors may contact the undersurface of the acromion, which could affect the labral repair as well as cause rotator cuff injury. Abrasion of the rotator cuff by a prominent knot may cause pain, tearing, and disability. A recent study by Park and colleagues24 reported on 11 patients with knot-induced pain after type II SLAP repair. All complained of sharp pain, with 64% also complaining of clicking. Knot location did not seem to matter, as there was no difference in preoperative symptoms, with 5 of the 11 patients having knots on the glenoid side of the repair on repeat arthroscopy. Patients with knots on the labral side did, however, have humeral head cartilage damage. The knots appeared to be the cause of pain and clicking, as after arthroscopic knot removal, dramatic pain relief was seen, with Constant and UCLA scores significantly improving in all 11 patients. All patients also had positive preoperative compression-rotation testing, and at 6 weeks after surgical knot removal, all were negative.24
Continue to: Further, as shown by Dines and colleagues...
Further, as shown by Dines and colleagues25, knotless anchors may help to better restore the meniscoid anatomy of the superior labrum better than knotted suture anchors. With regards to fixation strength, Uggen and colleagues26, using a cadaveric model, found no difference in initial fixation strength of knotless and traditional suture anchor repair of SLAP II tears, and both restored glenohumeral rotation without over-constraining the shoulder.
Despite the shorter operative time, lower profile, and more consistent tensioning with knotless anchors, the literature is limited with regard to evaluating patient outcomes. In a study by Yung and colleagues13 14 of the 16 patients with type II SLAP tears were treated with knotless anchors, and the authors found that 31.3% of patients had an excellent UCLA score while 43.8% had a good score. This is similar to the outcomes illustrated in studies by both Friel and colleagues20 and Sayde and colleagues.16 In a more recent study, Yang and colleagues27 did find some benefit in regard to ROM with knotless fixation. Their study consisted of 21 patients who underwent surgery with traditional knotted anchor fixation and 20 who underwent knotless horizontal mattress fixation. They found an average UCLA score of 37.6 and ASES score of 91.5 in patients undergoing knotless fixation, and the knotless fixation group had 5% greater total ROM, 15.6% more internal rotation at abduction, and 11.4% more external rotation at the side as compared with patients undergoing the traditional knotted technique. When compared with the current study, this study also had a significantly shorter follow-up period of 3 years.27 In a 2017 study, Bents and colleagues28 compared 44 patients who underwent knotless and 119 who underwent knotted fixation of SLAP tears. They found no statistically significant difference between knotless and knotted fixation in the ASES score, Visual Analog Scale (VAS), ASES, or Veterans RAND 12-Item Health Survey (VR-12) at 1 year postoperatively. Their outcomes were similar to those of the current study, but as in other mentioned literature, the study by Bents and colleagues28 included multiple surgeons with different postoperative protocols, was not limited to SLAP IIb tears, and also had a shorter follow-up of 1 year. Like Kocaoglu and colleagues22, Bents and colleagues did find knotless anchors to be more efficient, as operative time was reduced by 5.3 minutes per anchor. This likely would have a significant impact on surgical cost and surgeon productivity.28
One limitation of the current study was that despite the inclusion of >70 patients, the study was still significantly underpowered. It was determined that >300 patients in each group would be required to detect a significant difference in the revision rate between the 2 anchor types. Also, due to the retrospective nature of this study, no preoperative scores were collected. The inclusion of objective clinical measurements and follow-up imaging evaluating the rotator cuff and other anatomy would also be of interest.
Although statistical significance was not achieved, there was a trend toward knotless fixation requiring less revision surgery and having higher RTP, ASES, and KJOC scores when compared with traditional knotted fixation at 6.5-year follow-up. Larger studies with longer follow-up periods are necessary to determine the effects of knotted and knotless anchors on rotator cuff tears, patient reported outcomes, and RTP. These complications have been shown in the literature, mostly in case reports, and typically develop over a longer period.23 Despite this, other advantages of knotless fixation, such as its lower profile, the ability to better provide consistent tensioning, and decreased surgical time are important to consider.
1. Andrews JR, Carson WG, McLeod WD. Glenoid labrum tears related to the long head of the biceps. Am J Sports Med. 1985;13(5):337-341. doi:10.1177/036354658501300508.
2. Snyder SJ, Karzel RP, Pizzo WD, Ferkel RD, Friedman MJ. SLAP lesions of the shoulder. Arthrosc J Arthrosc Relat Surg. 1990;6(4):274-279. doi:10.1016/0749-8063(90)90056-J.
3. Ahsan ZS, Hsu JE, Gee AO. The Snyder classification of superior labrum anterior and posterior (SLAP) lesions. Clin Orthop. 2016;474(9):2075-2078. doi:10.1007/s11999-016-4826-z.
4. Erickson BJ, Jain A, Abrams GD, et al. SLAP Lesions: Trends in treatment. Arthrosc J Arthrosc Relat Surg. 2016;32(6):976-981. doi:10.1016/j.arthro.2015.11.044.
5. Morgan C, Burkhart S, Palmeri M, Gillespie M. Type II SLAP lesions: three subtypes and their relationships to superior instability and rotator cuff tears. Arthrosc J Arthrosc Relat Surg. 1998;14(6):553-565. doi:10.1016/S0749-8063(98)70049-0.
6. Edwards SL, Lee JA, Bell J-E, et al. nonoperative treatment of superior labrum anterior posterior tears: Improvements in pain, function, and quality of life. Am J Sports Med. 2010;38(7):1456-1461. doi:10.1177/0363546510370937.
7. Hanypsiak BT, DeLong JM, Simmons L, Lowe W, Burkhart S. Knot strength varies widely among expert arthroscopists. Am J Sports Med. 2014;42(8):1978-1984. doi:10.1177/0363546514535554.
8. Alberta FG, ElAttrache NS, Bissell S, et al. The development and validation of a functional assessment tool for the upper extremity in the overhead athlete. Am J Sports Med. 2010;38(5):903-911. doi:10.1177/0363546509355642.
9. Bradley JP, McClincy MP, Arner JW, Tejwani SG. Arthroscopic capsulolabral reconstruction for posterior instability of the shoulder: a prospective study of 200 shoulders. Am J Sports Med. 2013;41(9):2005-2014. doi:10.1177/0363546513493599.
10. Michener LA, McClure PW, Sennett BJ. American shoulder and elbow surgeons standardized shoulder assessment form, patient self-report section: Reliability, validity, and responsiveness. J Shoulder Elbow Surg. 2002;11(6):587-594. doi:10.1067/mse.2002.127096.
11. Cook C, Hegedus EJ. Orthopedic Physical Examination Tests: An Evidence-Based Approach. Upper Saddle River, NJ: PearsonPrentice Hall; 2008.
12. Burkhart SS, Morgan CD, Kibler WB. The disabled throwing shoulder: Spectrum of pathology part I: Pathoanatomy and biomechanics. Arthrosc J Arthrosc Relat Surg. 2003;19(4):404-420. doi:10.1053/jars.2003.50128.
13. Yung PS-H, Fong DT-P, Kong M-F, et al. Arthroscopic repair of isolated type II superior labrum anterior–posterior lesion. Knee Surg Sports Traumatol Arthrosc. 2008;16(12):1151-1157. doi:10.1007/s00167-008-0629-4.
14. Brockmeier SF, Voos JE, Williams RJ, Altchek DW, Cordasco FA, Allen AA. Outcomes After Arthroscopic Repair of Type-II SLAP Lesions: J Bone Jt Surg-Am Vol. 2009;91(7):1595-1603. doi:10.2106/JBJS.H.00205.
15. Galano GJ, Ahmad CS, Bigliani L, Levine W. Percutaneous SLAP lesion repair technique is an effective alternative to portal of Wilmington. Orthopedics. 2010;33(11). doi:10.3928/01477447-20100924-15.
16. Sayde WM, Cohen SB, Ciccotti MG, Dodson CC. Return to play after type II superior labral anterior-posterior lesion repairs in athletes: A systematic review. Clin Orthop Relat Res. 2012;470(6):1595-1600. doi:10.1007/s11999-012-2295-6.
17. Kim K-H, Bin S-I, Kim J-M. The correlation between posterior tibial slope and maximal angle of flexion after total knee arthroplasty. Knee Surg Relat Res. 2012;24(3):158-163. doi:10.5792/ksrr.2012.24.3.158.
18. Kim S-H, Ha K-I, Kim S-H, Choi H-J. Results of arthroscopic treatment of superior labral lesions. J Bone Joint Surg Am. 2002;84-A(6):981-985.
19. Pagnani MJ, Speer KP, Altchek DW, Warren RF, Dines DM. Arthroscopic fixation of superior labral lesions using a biodegradable implant: a preliminary report. Arthrosc J Arthrosc Relat Surg Off Publ Arthrosc Assoc N Am Int Arthrosc Assoc. 1995;11(2):194-198.
20. Friel NA, Karas V, Slabaugh MA, Cole BJ. Outcomes of type II superior labrum, anterior to posterior (SLAP) repair: Prospective evaluation at a minimum two-year follow-up. J Shoulder Elbow Surg. 2010;19(6):859-867. doi:10.1016/j.jse.2010.03.004.
21. Thal R. A knotless suture anchor. Arthrosc J Arthrosc Relat Surg. 2001;17(2):213-218. doi:10.1053/jars.2001.20666.
22. Kocaoglu B, Guven O, Nalbantoglu U, Aydin N, Haklar U. No difference between knotless sutures and suture anchors in arthroscopic repair of Bankart lesions in collision athletes. Knee Surg Sports Traumatol Arthrosc. 2009;17(7):844-849. doi:10.1007/s00167-009-0811-3.
23. Rhee YG, Ha JH. Knot-induced glenoid erosion after arthroscopic fixation for unstable superior labrum anterior-posterior lesion: Case report. J Shoulder Elbow Surg. 2006;15(3):391-393. doi:10.1016/j.jse.2005.03.010.
24. Park JG, Cho NS, Kim JY, Song JH, Hong SJ, Rhee YG. Arthroscopic Knot Removal for Failed Superior Labrum Anterior-Posterior Repair Secondary to Knot-Induced Pain. Am J Sports Med. 2017;45(11):2563-2568. doi:10.1177/0363546517713662.
25. Dines JS, ElAttrache NS. Horizontal Mattress With a Knotless Anchor to Better Recreate the Normal Superior Labrum Anatomy. Arthrosc J Arthrosc Relat Surg. 2008;24(12):1422-1425. doi:10.1016/j.arthro.2008.06.012.
26. Uggen C, Wei A, Glousman RE, et al. Biomechanical Comparison of Knotless Anchor Repair Versus Simple Suture Repair for Type II SLAP Lesions. Arthrosc J Arthrosc Relat Surg. 2009;25(10):1085-1092. doi:10.1016/j.arthro.2009.03.022.
27. Yang HJ, Yoon K, Jin H, Song HS. Clinical outcome of arthroscopic SLAP repair: conventional vertical knot versus knotless horizontal mattress sutures. Knee Surg Sports Traumatol Arthrosc. 2016;24(2):464-469. doi:10.1007/s00167-014-3449-8.
28. Bents EJ, Brady PC, Adams CR, Tokish JM, Higgins LD, Denard PJ. Patient-reported outcomes of knotted and knotless glenohumeral labral repairs are equivalent. Am J Orthop. 2017;46(6):279-283.
1. Andrews JR, Carson WG, McLeod WD. Glenoid labrum tears related to the long head of the biceps. Am J Sports Med. 1985;13(5):337-341. doi:10.1177/036354658501300508.
2. Snyder SJ, Karzel RP, Pizzo WD, Ferkel RD, Friedman MJ. SLAP lesions of the shoulder. Arthrosc J Arthrosc Relat Surg. 1990;6(4):274-279. doi:10.1016/0749-8063(90)90056-J.
3. Ahsan ZS, Hsu JE, Gee AO. The Snyder classification of superior labrum anterior and posterior (SLAP) lesions. Clin Orthop. 2016;474(9):2075-2078. doi:10.1007/s11999-016-4826-z.
4. Erickson BJ, Jain A, Abrams GD, et al. SLAP Lesions: Trends in treatment. Arthrosc J Arthrosc Relat Surg. 2016;32(6):976-981. doi:10.1016/j.arthro.2015.11.044.
5. Morgan C, Burkhart S, Palmeri M, Gillespie M. Type II SLAP lesions: three subtypes and their relationships to superior instability and rotator cuff tears. Arthrosc J Arthrosc Relat Surg. 1998;14(6):553-565. doi:10.1016/S0749-8063(98)70049-0.
6. Edwards SL, Lee JA, Bell J-E, et al. nonoperative treatment of superior labrum anterior posterior tears: Improvements in pain, function, and quality of life. Am J Sports Med. 2010;38(7):1456-1461. doi:10.1177/0363546510370937.
7. Hanypsiak BT, DeLong JM, Simmons L, Lowe W, Burkhart S. Knot strength varies widely among expert arthroscopists. Am J Sports Med. 2014;42(8):1978-1984. doi:10.1177/0363546514535554.
8. Alberta FG, ElAttrache NS, Bissell S, et al. The development and validation of a functional assessment tool for the upper extremity in the overhead athlete. Am J Sports Med. 2010;38(5):903-911. doi:10.1177/0363546509355642.
9. Bradley JP, McClincy MP, Arner JW, Tejwani SG. Arthroscopic capsulolabral reconstruction for posterior instability of the shoulder: a prospective study of 200 shoulders. Am J Sports Med. 2013;41(9):2005-2014. doi:10.1177/0363546513493599.
10. Michener LA, McClure PW, Sennett BJ. American shoulder and elbow surgeons standardized shoulder assessment form, patient self-report section: Reliability, validity, and responsiveness. J Shoulder Elbow Surg. 2002;11(6):587-594. doi:10.1067/mse.2002.127096.
11. Cook C, Hegedus EJ. Orthopedic Physical Examination Tests: An Evidence-Based Approach. Upper Saddle River, NJ: PearsonPrentice Hall; 2008.
12. Burkhart SS, Morgan CD, Kibler WB. The disabled throwing shoulder: Spectrum of pathology part I: Pathoanatomy and biomechanics. Arthrosc J Arthrosc Relat Surg. 2003;19(4):404-420. doi:10.1053/jars.2003.50128.
13. Yung PS-H, Fong DT-P, Kong M-F, et al. Arthroscopic repair of isolated type II superior labrum anterior–posterior lesion. Knee Surg Sports Traumatol Arthrosc. 2008;16(12):1151-1157. doi:10.1007/s00167-008-0629-4.
14. Brockmeier SF, Voos JE, Williams RJ, Altchek DW, Cordasco FA, Allen AA. Outcomes After Arthroscopic Repair of Type-II SLAP Lesions: J Bone Jt Surg-Am Vol. 2009;91(7):1595-1603. doi:10.2106/JBJS.H.00205.
15. Galano GJ, Ahmad CS, Bigliani L, Levine W. Percutaneous SLAP lesion repair technique is an effective alternative to portal of Wilmington. Orthopedics. 2010;33(11). doi:10.3928/01477447-20100924-15.
16. Sayde WM, Cohen SB, Ciccotti MG, Dodson CC. Return to play after type II superior labral anterior-posterior lesion repairs in athletes: A systematic review. Clin Orthop Relat Res. 2012;470(6):1595-1600. doi:10.1007/s11999-012-2295-6.
17. Kim K-H, Bin S-I, Kim J-M. The correlation between posterior tibial slope and maximal angle of flexion after total knee arthroplasty. Knee Surg Relat Res. 2012;24(3):158-163. doi:10.5792/ksrr.2012.24.3.158.
18. Kim S-H, Ha K-I, Kim S-H, Choi H-J. Results of arthroscopic treatment of superior labral lesions. J Bone Joint Surg Am. 2002;84-A(6):981-985.
19. Pagnani MJ, Speer KP, Altchek DW, Warren RF, Dines DM. Arthroscopic fixation of superior labral lesions using a biodegradable implant: a preliminary report. Arthrosc J Arthrosc Relat Surg Off Publ Arthrosc Assoc N Am Int Arthrosc Assoc. 1995;11(2):194-198.
20. Friel NA, Karas V, Slabaugh MA, Cole BJ. Outcomes of type II superior labrum, anterior to posterior (SLAP) repair: Prospective evaluation at a minimum two-year follow-up. J Shoulder Elbow Surg. 2010;19(6):859-867. doi:10.1016/j.jse.2010.03.004.
21. Thal R. A knotless suture anchor. Arthrosc J Arthrosc Relat Surg. 2001;17(2):213-218. doi:10.1053/jars.2001.20666.
22. Kocaoglu B, Guven O, Nalbantoglu U, Aydin N, Haklar U. No difference between knotless sutures and suture anchors in arthroscopic repair of Bankart lesions in collision athletes. Knee Surg Sports Traumatol Arthrosc. 2009;17(7):844-849. doi:10.1007/s00167-009-0811-3.
23. Rhee YG, Ha JH. Knot-induced glenoid erosion after arthroscopic fixation for unstable superior labrum anterior-posterior lesion: Case report. J Shoulder Elbow Surg. 2006;15(3):391-393. doi:10.1016/j.jse.2005.03.010.
24. Park JG, Cho NS, Kim JY, Song JH, Hong SJ, Rhee YG. Arthroscopic Knot Removal for Failed Superior Labrum Anterior-Posterior Repair Secondary to Knot-Induced Pain. Am J Sports Med. 2017;45(11):2563-2568. doi:10.1177/0363546517713662.
25. Dines JS, ElAttrache NS. Horizontal Mattress With a Knotless Anchor to Better Recreate the Normal Superior Labrum Anatomy. Arthrosc J Arthrosc Relat Surg. 2008;24(12):1422-1425. doi:10.1016/j.arthro.2008.06.012.
26. Uggen C, Wei A, Glousman RE, et al. Biomechanical Comparison of Knotless Anchor Repair Versus Simple Suture Repair for Type II SLAP Lesions. Arthrosc J Arthrosc Relat Surg. 2009;25(10):1085-1092. doi:10.1016/j.arthro.2009.03.022.
27. Yang HJ, Yoon K, Jin H, Song HS. Clinical outcome of arthroscopic SLAP repair: conventional vertical knot versus knotless horizontal mattress sutures. Knee Surg Sports Traumatol Arthrosc. 2016;24(2):464-469. doi:10.1007/s00167-014-3449-8.
28. Bents EJ, Brady PC, Adams CR, Tokish JM, Higgins LD, Denard PJ. Patient-reported outcomes of knotted and knotless glenohumeral labral repairs are equivalent. Am J Orthop. 2017;46(6):279-283.
TAKE-HOME POINTS
- SLAP IIb tears are common injuries in overhead athletes, yet surgical outcomes are variable, with throwers commonly having difficulty with return to play at the same level.
- In this study, 92% of athletes returned to play post-operatively, yet only around 55% returned at the same level.
- In overhead athletes, overall return to play was 85.7%, yet only 39.3% returned at the same level.
- Knotless fixation required less revision surgery and had higher outcome scores and return to play when compared to knotted fixation; however, this did not reach statistical significance.
- Knotless fixation should be considered in SLAP IIb repairs given their lower profile leading to less rotator cuff irritation, the ability to better provide more consistent tensioning, and decreased surgical time.
Nutrition-Related Considerations in Soccer: A Review
Soccer is the world’s most popular sport. As the sport has grown, so have the physical demands and the search for ways to edge out the competition with the use of sports science and nutrition. The demands, which include intense training, ≥90 minutes matches, congested fixtures, and travel, lead to increased energy and nutrient requirements, stress on the body, and risk of impaired sleep cycles. Identifying key areas to enhance a player’s performance is an ongoing effort because of individual differences. Moreover, new information is being discovered via research, and advancing technology to measure performance is always evolving. This article focuses on the core nutrition principles known to lay the foundation for a better soccer player. These principles are obvious for some; however, nutrition and hydration are often undervalued, leaving the individual player with the responsibility to eat right. This review addresses the most applicable nutrition-related recommendations for soccer players.
Technical, tactical, and physical skills are key factors in a soccer player’s performance. However, energy demands of matches and training sessions require adequate fuel and hydration to maximize those key factors. Athletes may need to manage carbohydrates, protein, and fat separately to achieve optimal body size and body composition, and to maximize performance.
Nutrition plays a vital role in keeping the player healthy, reducing risk of injuries, speeding up recovery, and enhancing training adaptations. Research has shown what we eat and when we eat can significantly impact skeletal muscle adaptation, inflammation, immune response, and energy metabolism. These are all essential nutrition considerations for soccer players.
ENERGY METABOLISM IN SOCCER
Understanding energy demands will help determine energy requirements: type, amount, and timing of macronutrients and micronutrients. Soccer utilizes both aerobic and anaerobic energy systems. Soccer is an intermittent team-based sport; thus, it contains various high-intensity movements, such as sprinting, jumping, dribbling, and frequent changing of direction performed in between numerous low-intensity slow movements. The high intense movements collectively account for about 30% of match play, whereas 70% is walking, jogging, and standing. Although sprinting and jumping are not a large part of the 90 minutes of match play, they have a huge impact on the outcome of the match. Distance covered in the last 15 minutes of match play decreases by 14% to 45% compared with the first 15 minutes of play.1 Krustrup and colleagues2 found muscles in the quadriceps to be empty or nearly empty of glycogen (stored carbohydrates) after match play. This phenomenon can help explain a significant decrease in sprinting, jumping, and intermittent movements toward the end of a match—energy demands that rely on glycogen as the primary fuel source. Being well-fueled and hydrated and having the ability to delay fatigue can place a team at a performance advantage.
ENERGY EXPENDITURE
Beyond training load or match intensity, a soccer player’s body composition, gender, age, and position can affect energy needs. Position differences in elite soccer players show that the greatest total distance covered is by central midfielders and wide midfielders (~12 km –13 km), whereas central defenders cover the least area of the field players (≤~10 km).3,4 The environment can also play a role in energy expenditure. To further understand calorie needs, total daily energy expenditure in soccer players has been measured using doubly labeled water and estimated using heart rate, global positioning system, video match analysis, and activity records.5,6 One study estimated that energy expended during a training day for elite male soccer players is between 3442 kcal and 3824 kcal.6 Another study using doubly labeled water concluded that mean energy expenditure of elite male soccer players is 3566 kcal over a 7-day period, which included 5 training days and 2 matches.7 In terms of energy expenditure for elite female soccer players, the mean values for match day, training days, and rest days were 2914, 2783, and 2213 calories, respectively.8
Continue to: FUELING THE SOCCER PLAYER
FUELING THE SOCCER PLAYER
Depending on the match fixture, proper fueling can be a challenge due to the number of matches, travel time, and limited recovery time. Macronutrients will provide the mainstay of fuel for a player, specifically carbohydrates and fats. Carbohydrates are the preferred source of fuel for the majority of the calories consumed. Using body weight (kg) is a more current and accurate method of recommending the amount of each macronutrient an individual player should eat as compared to using a percentage of total daily calories.
- Carbohydrates: 5–10 g/kg/day
- Protein: 1.2–2.0 g/kg/day
- Fat: 0.8–1.5 g/kg/day
CARBOHYDRATE AND SOCCER PERFORMANCE
Carbohydrates are a limited supply of fuel compared with fat stores. They are an important fuel source for soccer players, as muscle glycogen is vital to performance during high intense training and match play (Table 1). Yet current research shows that a high carbohydrate intake is not required to be followed every day due to varied energy demands.9 This newer strategy is referred to as “training low,” allowing the athlete to train at a low-moderate intensity in a low glycogen state. The glycogen status of the muscle can alter the training adaptations through cellular changes in the mitochondria. Therefore, carbohydrate needs should reflect the work required or demand for optimal performance. However, on high-training load days or 24 hours pre-match, carbohydrate intake should be increased to maximize muscle glycogen stores. Soccer players need to consume up to 8-10 g/kg body weight during the 24 hours before a match.10 On low or rest days, carbohydrate intake should be reduced to reflect the decreased training load. For example, recent research has demonstrated potential training adaptations when muscle glycogen stores are not consistently high11 or intentionally kept low depending on the training load. Adjusting carbohydrate intake to the physical demands of an athlete is a strategy called nutrition periodization.
Table 1. Carbohydrates | ||
Timing | Amount | Application |
| Daily | 5–7 g/kg/day | Low–moderate training load. Match amount to training session intensity. |
Pre-Training/Match | 1–4 gm/kg | Adjust to players’ tolerance, preferences and training load. |
| During Training | 0–30 g/h | Light training session |
| Recovery/After Training | Balance meal 1.0–1.2 g/kg/h, ASAP. | Light training: < 2 h Heavy training/2 sessions/day |
| Match day -1, match day, match day +1 | 7–10 g/kg/d | Adjust to players’ tolerance, preferences. |
| During/half time | 30–60 g/h | High glycemic carbohydrates |
| Recovery/after match | 1.0–1.2 g/kg/h | High glycemic carbohydrates |
However, if glycogen stores are not well supplied before a match >90 minutes, then the muscles and the brain will become fatigued and lead to poor performance. Glycogen depletion contributes to fatigue toward the end of a match.10 In the early 1970s, Saltin and colleagues12 showed that players with high muscle glycogen stores (~400 mmol/kg dry wt) achieve higher movement intensities and cover more total distance than those players who start the match with low glycogen stores (~200 mmol/kg dry wt). Another study examined pre-match diets of male soccer players (65% vs 30% daily carbohydrate intake) to determine the effect on performance outcomes and glycogen concentrations. Results showed high-muscle glycogen concentrations in the 65% carbohydrate diet and a significantly higher amount of intense exercise bouts. More acutely, studies have shown a meal containing 200 to 300 grams of carbohydrates 2 to 4 hours before exercise prolongs endurance.13-15 Ideally, consuming fast-digesting carbohydrate sources during or at half time will help maintain blood glucose concentrations and spare muscle glycogen reserves. The majority of literature shows a 6% to 8% solution of combined fast-digesting carbohydrates (ie, glucose, fructose, sucrose, or maltodextrin) at a rate of 30 to 60 g/h enhances at least 1 aspect of performance in soccer.16-18 These performance benefits include increased running time, improved time to fatigue, and enhanced technical skills. Regarding recovery, soccer players should begin consuming carbohydrate-rich foods and beverages immediately after exhaustive training or a match to optimize glycogen reloading. Ingesting post-exercise carbohydrates stimulates muscle and liver glycogen synthesis up to tenfold compared with post-intake of no carbohydrates.19 This recovery period becomes vital when there are <8 hours between training sessions or another match, such as in youth tournaments. The form of carbohydrate, solid or liquid, can be based on preference and tolerance, as long as the source provides a large glycemic and insulin response.
An easy way to adjust daily carbohydrate intake is to schedule carbohydrate-rich foods at meals or snacks around important training sessions or before/during/after on match day. Anderson and colleagues10 looked at training loads for 1, 2, and 3 matches per week, recommending high carbohydrate intake match day minus 1, on match day, and match day plus 1 for 1 and 2 matches per week and lower carbohydrate intake on the other days. During a 3-match week, lowering carbohydrates any day of that week is not recommended. More research is needed to determine the best strategy for performance regarding carbohydrate periodization in soccer.
PROTEIN AND SOCCER PERFORMANCE
Protein is important to soccer players for muscle tissue repair, strength, bone health, and the immune system (Table 2). The American College of Sports Medicine, the Academy of Nutrition and Dietetics, and the Dietitians of Canada recommend 1.2 to 2.0 g/kg/day.20 Most soccer players meet the daily protein requirements; however, the key to optimizing the total daily amount is focusing on the source/amino acid profile, timing, and amount per feeding. Consuming divided doses of protein (20 g to 40 g) every 3 to 4 hours gives the body a continuous flow of amino acids to support muscle synthesis and recovery. In terms of body size, the recommendation is 0.25 to 0.4 g/kg every 3 to 4 hours, which includes pre-training/match and post-training/match. Protein/amino acids consumed around strength training and high-intensity sessions can promote muscle adaptations, minimize tissue breakdown, and speed recovery. Soccer matches lead to significant muscle damage21 especially at 2 sessions/day or multiple matches in a week. Protein is not a priority during training or matches, as its role is not to provide energy, and the primary goal during soccer activities is energy production. Research supports an intake of 30 to 40 g of casein, which is a slow digesting protein, at night before bed when a strength-training session has been performed that day.22,23
Table 2. Protein | ||
Timing | Amount | Application |
| Daily | 1.2–2.0 g/kg | High quality sources; chicken, lean meats, fish, seafood, eggs, dairy, beans, soy |
Pre-training/match; | 20–40 g or 0.25–0.40 g/kg | Meal/snack |
| During training/match | None needed | If training session <3 h |
| Recovery/after training Night-time feeding | 20–40 g | <30–60 min, whey, casein/whey, pea, soy protein Casein (slow-absorbing protein), strength training days |
Continue to: FAT AND SOCCER PERFORMANCE
FAT AND SOCCER PERFORMANCE
Fat is the primary source of energy at rest and at low-training intensities, such as walking or jogging for soccer players (Table 3). Besides providing slow, long-lasting energy, fat helps absorb vitamins A, D, E, and K; produce hormones; protect organs; and support the cell membrane structure. The dietary recommendations of total fat intake for athletes are similar to or slightly greater than those recommended for non-athletes. The total amount required depends on the training demands and the players’ goals. The recommended amount of dietary fat is between 20% and 35% of total daily energy intake.
Table 3. Fat | ||
Timing | Amount | Application |
Daily | 0.8–1.5 g/kg | Include well balanced meals, primarily polyunsaturated and monounsaturated fats. |
Pre-Training/Match; | ~10–30 g/meal | Limit amount. Avoid digestion and gastrointestinal issues. |
During Training/Match | None needed | Risk of gastrointestinal intolerances. |
Recovery/After Training | ~10–30 g | Include well-balanced meals, primarily polyunsaturated and monounsaturated fats. |
The key to gaining performance benefits from dietary fat depends on the type of fat selected. Some fats in excess, such as omega-6 fatty acids and saturated fats, may promote inflammation, hinder recovery, and affect brain health. Other types can help reduce inflammation, enhance muscle recovery, and improve brain health. These types include polyunsaturated omega-3 fatty acids, which are essential for the health of the athlete, allowing for a balanced fatty acid profile.23 Specific omega-3 fatty acids (EPA and DHA) have shown an improvement in the function of the mitochondria, enhancing energy cell metabolism. They also have potential to be highly anti-inflammatory, benefit rehabilitation during soft-tissue injury, and help decrease secondary damage from a concussion.
In addition, research shows that omega-3 may enhance the energy production of the mitochondria, resulting in less oxidative damage to the muscle cell.25 More research is needed on the effects of performance on soccer players. Given the slow digestion and absorption of fats, fat intake must be limited leading up to or during training sessions or matches, which may risk gastrointestinal issues and displacement of carbohydrates. Low to moderate monounsaturated and polyunsaturated fats in a recovery meal have not been shown to inhibit muscle glycogen reloading or muscle protein synthesis.26,27 In regard to fat intake post-match, fat is not a key nutrient of concern for muscle recovery, as it can be included in the next balanced meal.
MICRONUTRIENTS, VITAMINS, AND MINERALS
Exercise stresses many of the metabolic pathways where vitamins and minerals are required. High-level training demands may also increase the turnover rate of vitamins and minerals. As a result, greater dietary intakes of vitamins and minerals may be warranted. Soccer players at the greatest risk for poor vitamin and mineral levels are those who skip meals, who eliminate ≥1 of the food groups from their diet (such as vegans), or who consume unbalanced and highly processed foods. In soccer players, the micronutrients of concern include iron and vitamin D. In young female soccer players, calcium intake must be assessed along with adequate energy intake for optimal bone density. Vegetarians, vegans, and/or athletes who do not consume meat, eggs, and/or dairy in their diet are at risk for vitamin B12 deficiency. The key to obtaining all the vitamins and minerals an athlete will need is to eat a wide variety of nutrient-dense foods.
IRON
Iron deficiency, with or without anemia, may impair muscle function and limit exercise capacity. Adequate iron intake in athletes with iron deficiencies and/or anemia can improve exercise capacity. Iron depletion is 1 of the most common nutrient deficiencies observed among endurance athletes. Foot strike hemolysis can destroy red blood cells during activities such as running. Research has shown that 30% of professional male soccer players have ferritin levels <30 mcg/L at the end of a soccer season.28 Thus, fatigue and poor recovery time place soccer players at risk of an iron imbalance.29,30
Continue to: Landahl and colleagues...
Landahl and colleagues31 found that iron deficiency and iron deficiency anemia are common in female soccer players at the elite level. In their study of 28 female national soccer players, 57% had iron deficiency and 29% presented with iron deficiency anemia 6 months before the FIFA Women's World Cup. Testing hemoglobin alone is insufficient to detect relative anemia. Regular monitoring of hemoglobin and ferritin concentrations may be necessary to determine appropriate iron needs.
VITAMIN D
Vitamin D is required for optimal bone health, as it helps regulate calcium and phosphorus. Further research shows a link between vitamin D and non–bone-related functions, such as muscle health, immune support, and anti-inflammatory roles, which may be linked to performance. Soccer players with low levels of vitamin D (<30 ng/mL) may be more at risk for musculoskeletal injuries and stress fractures.34 In other sports, vitamin D may enhance muscle strength; however, no association between vitamin D and muscle strength has been found in soccer players.34,35 The geographic location of an athlete seems to be irrelevant to serum levels, as insufficient levels can be found at various latitudes.34,36-38
Evidence has shown that vitamin D may improve athletic performance in vitamin D-depleted athletes, thereby improving vertical jumps, lowering risks of muscle injury/strains and stress fractures, and reducing risk of colds/flu. In 2013, researchers showed for the first time a link between vitamin D and muscle aerobic metabolism by studying the energy efficiency of the mitochondria.32 Athletes with low vitamin D levels increased their ATP production within the muscle with vitamin D supplementation over 10 weeks to 12 weeks.33
CALCIUM
Soccer players present with stronger and denser bones than non-athletes due to running and jumping in their sport. Weight-bearing sites such as lumbar spine, hip, femoral neck, trochanter, intertrochanteric region, and both legs are sensitive to the impact of soccer movements.39 Calcium and vitamin D are also important for muscle contraction.
Given the variation in genetics, sports, and gender, optimal performance requires a healthy eating plan tailored to the individual athlete. A healthy eating plan allows an athlete to train longer and harder, delay the onset of fatigue, and speed recovery. Nutrition supports optimal performance through real food, proper hydration, nutrient timing, and supplementation.
Continue to: FLUID REQUIREMENTS FOR SOCCER PLAYERS
FLUID REQUIREMENTS FOR SOCCER PLAYERS
Many athletes overlook the importance of hydration on performance, either assuming they are hydrated or they miscalculate fluid and electrolyte needs to actual sweat losses. Numerous factors play a part in optimal hydration such as sweat rate, environment, training intensity, duration, body size, and body composition. Soccer players have fewer breaks to consume fluids during a match compared with basketball, baseball, or American football players. These breaks include a 15-minute half between coming off the pitch to the locker room and back, as well as time spent with coaches reviewing strategies; this short window of time must be maximized to rehydrate. Fluids with a carbohydrate concentration of 4% to 8% at 5 to 10 ounces and breaks every 15 to 20 minutes are optimal to maximize uptake while avoiding gastric intolerance.
Studies have shown that most players do not drink sufficiently during a match to optimize hydration, replacing only ~40% to 45% of their sweat losses.40, 41 Maughan and colleagues measured high levels of urine osmolality in some soccer players, thereby indicating that the players started their training session dehydrated.41 Soccer players must begin training or a match well hydrated due to the limited opportunities after kick-off. The athlete should drink at least 4 hours prior to exercise; if no urine is produced or urine is dark in color, then the athlete should drink again 2 hours prior.
Table 4. Sweat Rate Calculation Steps | ||
|
Changes in body mass, urine color, and thirst offer clues to the need for rehydration. Advanced hydration measurement includes testing urine specific gravity (USG) values. For example, testing pre-training or pre-match can be conducted to determine hydration status and trending changes from day to day. A USG value >1.020 is considered dehydrated in accordance with the NATA position statement.42 Calculating a sweat rate is a practical approach to determining individual hydration needs (see Table 4). Sweat rates will vary between soccer players based on their position and intensity of play, along with total match time.39 Soccer players will lose ~1.5 to 4.5 liters during match play.43-46 In general, athletes, including soccer players, should limit body weight loss to ≤2% to 3% to maintain performance. Studies have shown that >2% body mass loss can hinder soccer-specific performance, such as dribbling skills and intermittent high intensity sprinting.49-51) Table 5 outlines the detrimental effects dehydration has on performance. Urine-specific gravity values between 1.021 and 1.030 may reflect 3% to 5% change in body weight.
Table 5. Performance Outcomes at Various Dehydration Levels | ||
|
ELECTROLYTES
Sodium is the primary electrolyte lost in sweat. Other electrolytes (potassium, magnesium, and calcium) are lost at much lower levels and typically replaced through diet. Soccer players can lose large amounts of sodium; between 700 and 1500 mg of sodium/L of sweat has been reported in several studies.42-44 Studies of professional male soccer players have shown potassium losses in the range of 165 mg/L to 234 mg/L.42, 51,52 Sodium in a sports drink or in food aids with water uptake from the intestines and enhances the thirst mechanism in the brain, resulting in additional fluid being retained in the body.
REHYDRATION AFTER TRAINING OR COMPETITION
Within 2 hours after training or competition, the rehydration strategy should provide water to restore body fluid status, carbohydrates to replenish glycogen (fuel) stores, and electrolytes to speed rehydration (Table 6). The volume of fluids and type of fluids over the next 24 hours dictate the hydration status prior to the next day’s training session. It is a continuous cycle. Over time, an athlete increases the risk of being in a chronic dehydrated state, resulting in lack of motivation, risk of injury, and illness, fatigue, and poor performance. The current recommendation is to drink ~50% more in volume than the amount of weight lost, such as 22 to 24 ounces/pound lost.52
Table 6. Hydration | ||
Timing | Amount | Application |
Daily | 3.7 L adult males | Monitor urine color. |
Pre-training/match; | 16 oz or 5–7 mL/kg | Monitor urine production and color |
During training/match | 13–28 oz/h (400- | Every 15–20 min. *Dependent on sweat rate. |
Recovery/after training | 22–24 oz/1 lb body weight lost | Water + food (carbohydrates/electrolytes) |
- Mohr M, Krustrup P, Bangsbo J. Match performance of high-standard soccer players with special reference to development of fatigue. J Sports Sci. 2003;21:519-528.
- Krustrup P, Mohr M, Steensberg A, Bencke J, Kjaer M, Bangsbo J. Muscle and blood metabolites during a soccer game: implications for sprint performance. Med Sci Sports Exerc. 2006;38:1165-1174.
- Di Salvo V, Gregson W, Atkinson G, Tordoff P, Drust B. Analysis of high intensity activity in Premier League soccer. Int J Sports Med. 2009;30:205-212.
- Di Salvo V, Baron R, Tschan H, Calderon Montero FJ, Bachl N, Pigozzi F. Performance characteristics according to playing position in elite soccer. Int J Sports Med. 2007;28:222-227.
- Reilly T, Thomas V. Estimated daily energy expenditures of professional association footballers. Ergonomics. 1979;22:541-548.
- Osgnach C, Poser S, Bernardini R, Rinaldo R, di Prampero P.E. Energy cost and metabolic power in elite soccer: A new match analysis approach. Med Sci Sports Exerc. 2010;42:170-178.
- Anderson L, Orme P, Naughton RJ, Close, GL, Milsom J, Rydings D, et al. Energy intake and expenditure of professional soccer players of the English Premier League: evidence of carbohydrate periodization. Int J Sport Nutr Exerc Metab. 2017;1-25.
- Mara JK, Thompson KG, Pumpa KL. Assessing the energy expenditure of elite female soccer layers: a preliminary study. J Strength Cond Res. 2015;2780-2786.
- Bartlett JD, Hawley JA, Morton JP. Eur J Sport Sci. 2015;15(1):1, 3-12.
- Anderson L, Orme P, Di Michele R, Close GL, Morgans R, Drust B, Morton JP. Quantification of training load during one-, two- and three-game week schedules in professional soccer players from the English Premier League: implications for carbohydrate periodisation. J Sports Sci. 2016;34;1250-1259.
- Hawley JA, Morton JP. Ramping up the signal: promoting endurance training adaptation in skeletal muscle by nutritional manipulation. Clin Exp Pharmacol Physiol. 2014;41:608-613.
- Saltin B. Metabolic fundamentals in exercise. 1973;:137-146.
- Balsom PD, Wood K, Olsson P, Ekblom B. Carbohydrate intake and multiple sprint sports: With special reference to football (soccer). Int J Sports Med. 1999;20:48-52.
- Neufer PD, Costill DL, Flynn MG, Kirwan JP, Mitchell JB, Houmard J. Improvements in exercise performance: Effects of carbohydrate feedings and diet. J Appl Physiol. 1987;62:983-988.
- Sherman WM, Brodowicz G, Wright DA, Allen WK, Simonsen J, Dernbach A. Effects of 4 h preexercise carbohydrate feedings on cycling performance. Med Sci Sports Exerc. 1989;21:598-604.
- Baker LB, Rollo I, Stein KW, Jeukendrup AE. Acute effects of carbohydrate supplementation on intermittent sports performance. Nutrients. 2015;7:5733-5763.
- Goedecke JH, White NJ, Chicktay W, Mahomed H, Durandt J, Lambert MI. The effect of carbohydrate ingestion on performance during a simulated soccer match. Nutrients. 2013;5:5193-5204.
- Nicholas CW, Williams C, Lakomy HK, Phillips G, Nowitz A. Influence of ingesting a carbohydrate-electrolyte solution on endurance capacity during intermittent, high-intensity shuttle running. J Sports Sci. 1995;13:283-290.
- Burke LM, van Loon LJC, Hawley JA. Post-exercise muscle glycogen resynthesis in humans. J Appl Physiol. 2016;122:1055-1067.
- Rodriquez NR, DiMarco NM, Langley S. Position of the American Dietetic Association, Dietitians of Canada, and the American College of Sports Medicine: Nutrition and athletic performance. J Am Diet Assoc. 2009;109(3):509-527.
- Romagnoli M, Sanchis-Gomar F, Alis R, Risso-Ballester J, Bosio A, Graziani RL, Rampinini E. Changes in muscle damage, inflammation, and fatigue-related parameters in young elite soccer players after a match. J. Sports Med Phys Fit. 2016;56:1198-1205.
- Res PT, Groen B, Pennings B, Beelen M, Wallis GA, Gijsen AP, et al.Protein ingestion before sleep improves postexercise overnight recovery. Med Sci Sports Exerc. 2012;44:1560-1569.
- Snijders T, Res PT, Smeets JSJ, Van Vliet S, Van Kranenburg J, Maase K, et al.Protein ingestion before sleep increases muscle mass and strength gains during prolonged resistance-type exercise training in healthy young men. J Nutr. 2015;145:1178-1184.
- Simopoulos AP. Omega-3 fatty acids and athletics. Curr Sports Med Rep. 2007;6230-236.
- Peoples GE, McLennan PL, Howe P, Groeller H. Fish oil reduces apparent myocardial oxygen consumption in trained cyclists but does not change time to fatigue. Presented at the Fourth International Conference on Nutrition and Fitness; May 25-29, 2000; Ancient Olympia, Greece.
- Burke LM, Collier GR, Beasley S.K, Davis PG, Fricker PA, Heeley P, et al. Effect of coingestion of fat and protein with carbohydrate feedings on muscle glycogen storage. J Appl Physiol. 1995;78:2187-2192.
- Roy BD, Tarnopolsky MA. Influence of differing macronutrient intakes on muscle glycogen resynthesis after resistance exercise. J Appl Physiol. 1998;84:890-896.
- Reinke S, Taylor W.R, Duda GN, von Haehling S, Reinke P, Volk H-D et al. Absolute and functional iron deficiency in professional athletes during training and recovery. Int J Cardiol. 2012;156:186-191.
- Escanero JF, Villanueva J, Rojo A, Herrera A, del Diego C, Guerra M. Iron stores in professional athletes throughout the sports season. Physiol Behav. 1997;62:811-814.
- Heisterberg MF, Fahrenkrug J, Krustrup P, Storskov A, Kjær, M, Andersen JL. Extensive monitoring
- Landahl G, Adolfsson P, Borjesson M, Mannheimer C, Rodjer S. Iron deficiency and anemia: a common problem in female elite soccer players. Int J Sport Nutr Exerc Metab. 2005;15(6):689-694.
- Sinha A, Hollingsworth K, Ball S, Cheetham T. Improving the vitamin D status of vitamin D deficient adults is associated with improved mitochondrial oxidative function in skeletal muscle. Endocrine Abstracts, 2013;31.OC1.6
- Shuler FD, Wingate MK, Moore GH, Giangarra C. Sports health benefits of vitamin D. Sports Health. 2012;4:496-501.
- Hamilton B, Whiteley R, Farooq A, Chalabi H. Vitamin D concentration in 342 professional football players and association with lower limb isokinetic function. J Sci. Med Sport. 2014;17:139-143.
- Ksiażek A, Zagrodna A, Dziubek W, Pietraszewski B, Ochmann B, Słowińska-Lisowska M,25(OH)D3 levels relative to muscle strength and maximum oxygen uptake in athletes. J Hum Kinet. 2016;50:71-77.
- Kopeć A, Solarz K, Majda F, Słowińska-Lisowska M, Medraś M. An evaluation of the levels of vitamin D and bone turnover markers after the summer and winter periods in Polish professional soccer players. J Hum Kinet. 2013;38:135-140.
- Vander Slagmolen G, van Hellemondt FJ, Wielders JPM. Do professional soccer players have a vitamin D status supporting optimal performance in winter time? J Sports Med Doping Stud. 2014,4:2.
- Morton JP, Iqbal Z, Drust B, Burgess D, Close GL, Brukner PD. Seasonal variation in vitamin D status in professional soccer players of the English Premier League. Appl Physiol Nutr Metab. 2012;37:798-802.
- Lozano-Berges G, Matute-Llorente A, Gonzalez-Aguero A, Gomez-Bruton A, Gomez-Cabelloa A, Vincente-Rodriguez G, Casajus JA. Soccer helps build strong bones during growth: a systematic review and meta-analysis. Eur J Pediatr. 2018;177(3):295-310.
- Burke LM. Fluid balance during team sports. J Sports Sci. 1997;15:287-295.
- Maughan RJ, Merson SJ, Broad NP, Shirreffs SM. Fluid and electrolyte intake and loss in elite soccer players during training. Int J Sport Nutr Exerc Metab. 2004;14:333-346.
- Brendon P, McDermott, P, Anderson SA, Armstrong LE, Casa DJ, Cheuvront SN, et al. National Athletic Trainers’ Association Position Statement: Fluid Replacement for the Physically Active. J Athl Train. 2017;52(9):877-895.
- Shirreffs SM, Aragon-Vargas LF, Chamorro M, Maughan RJ, Serratosa L, Zachwieja JJ. The sweating response of elite professional soccer players to training in the heat. Int J Sports Med. 2005;26: 90-95.
- Maughan RJ, Watson P, Evans GH, Broad N, Shirreffs SM. Water balance and salt losses in competitive football. Int J Sport Nutr Exerc Metab. 2007;17:583-594.
- Aragón-Vargas LF, Moncada-Jiménez J, Hernández-Elizondo J, Barrenechea A,Monge-Alvarado M. Evaluation of pre-game hydration status, heat stress, and fluid balance during professional soccer competition in the heat. Eur J Sport Sci. 2009;9:269-276.
- Maughan RJ, Shirreffs SM, Merson SJ, Horswill CA. Fluid and electrolyte balance in elite male football (soccer) players training in a cool environment. J Sports Sci. 2005;23:73-79.
- Duffield R, McCall A, Coutts AJ, Peiffer JJ. Hydration, sweat and thermoregulatory responses to professional football training in the heat. J Sports Sci. 2012;30:957-965.
- Shirreffs SM, Aragon-Vargas LF, Chamorro M, Maughan RJ, Serratosa L, Zachwieja JJ. The sweating response of elite professional soccer players to training in the heat. Int J Sports Med. 2005;26:90-95.
- Edwards AM, Mann ME, Marfell-Jones MJ, Rankin DM, Noakes TD, Shillington DP. Influence of moderate dehydration on soccer performance: Physiological responses to 45 min of outdoor match-play and the immediate subsequent performance of sport-specific and mental concentration tests. Br J Sports Med. 2007;41:385-391.
- McGregor SJ, Nicholas CW, Lakomy HK, Williams C. The influence of intermittent high-intensity shuttle running and fluid ingestion on the performance of a soccer skill. J Sports Sci. 1999;17:895-903.
- Maughan RJ, Merson SJ, Broad NP, Shirreffs SM. Fluid and electrolyte intake and loss in elite soccer players during training. Int J Sport Nutr Exerc Metab. 2004;14:333-346.
- Shirreffs SM, Sawka MN, Stone M. Water and electrolyte needs for football training and match-play. J Sports Sci. 2006;24:699-707.
Soccer is the world’s most popular sport. As the sport has grown, so have the physical demands and the search for ways to edge out the competition with the use of sports science and nutrition. The demands, which include intense training, ≥90 minutes matches, congested fixtures, and travel, lead to increased energy and nutrient requirements, stress on the body, and risk of impaired sleep cycles. Identifying key areas to enhance a player’s performance is an ongoing effort because of individual differences. Moreover, new information is being discovered via research, and advancing technology to measure performance is always evolving. This article focuses on the core nutrition principles known to lay the foundation for a better soccer player. These principles are obvious for some; however, nutrition and hydration are often undervalued, leaving the individual player with the responsibility to eat right. This review addresses the most applicable nutrition-related recommendations for soccer players.
Technical, tactical, and physical skills are key factors in a soccer player’s performance. However, energy demands of matches and training sessions require adequate fuel and hydration to maximize those key factors. Athletes may need to manage carbohydrates, protein, and fat separately to achieve optimal body size and body composition, and to maximize performance.
Nutrition plays a vital role in keeping the player healthy, reducing risk of injuries, speeding up recovery, and enhancing training adaptations. Research has shown what we eat and when we eat can significantly impact skeletal muscle adaptation, inflammation, immune response, and energy metabolism. These are all essential nutrition considerations for soccer players.
ENERGY METABOLISM IN SOCCER
Understanding energy demands will help determine energy requirements: type, amount, and timing of macronutrients and micronutrients. Soccer utilizes both aerobic and anaerobic energy systems. Soccer is an intermittent team-based sport; thus, it contains various high-intensity movements, such as sprinting, jumping, dribbling, and frequent changing of direction performed in between numerous low-intensity slow movements. The high intense movements collectively account for about 30% of match play, whereas 70% is walking, jogging, and standing. Although sprinting and jumping are not a large part of the 90 minutes of match play, they have a huge impact on the outcome of the match. Distance covered in the last 15 minutes of match play decreases by 14% to 45% compared with the first 15 minutes of play.1 Krustrup and colleagues2 found muscles in the quadriceps to be empty or nearly empty of glycogen (stored carbohydrates) after match play. This phenomenon can help explain a significant decrease in sprinting, jumping, and intermittent movements toward the end of a match—energy demands that rely on glycogen as the primary fuel source. Being well-fueled and hydrated and having the ability to delay fatigue can place a team at a performance advantage.
ENERGY EXPENDITURE
Beyond training load or match intensity, a soccer player’s body composition, gender, age, and position can affect energy needs. Position differences in elite soccer players show that the greatest total distance covered is by central midfielders and wide midfielders (~12 km –13 km), whereas central defenders cover the least area of the field players (≤~10 km).3,4 The environment can also play a role in energy expenditure. To further understand calorie needs, total daily energy expenditure in soccer players has been measured using doubly labeled water and estimated using heart rate, global positioning system, video match analysis, and activity records.5,6 One study estimated that energy expended during a training day for elite male soccer players is between 3442 kcal and 3824 kcal.6 Another study using doubly labeled water concluded that mean energy expenditure of elite male soccer players is 3566 kcal over a 7-day period, which included 5 training days and 2 matches.7 In terms of energy expenditure for elite female soccer players, the mean values for match day, training days, and rest days were 2914, 2783, and 2213 calories, respectively.8
Continue to: FUELING THE SOCCER PLAYER
FUELING THE SOCCER PLAYER
Depending on the match fixture, proper fueling can be a challenge due to the number of matches, travel time, and limited recovery time. Macronutrients will provide the mainstay of fuel for a player, specifically carbohydrates and fats. Carbohydrates are the preferred source of fuel for the majority of the calories consumed. Using body weight (kg) is a more current and accurate method of recommending the amount of each macronutrient an individual player should eat as compared to using a percentage of total daily calories.
- Carbohydrates: 5–10 g/kg/day
- Protein: 1.2–2.0 g/kg/day
- Fat: 0.8–1.5 g/kg/day
CARBOHYDRATE AND SOCCER PERFORMANCE
Carbohydrates are a limited supply of fuel compared with fat stores. They are an important fuel source for soccer players, as muscle glycogen is vital to performance during high intense training and match play (Table 1). Yet current research shows that a high carbohydrate intake is not required to be followed every day due to varied energy demands.9 This newer strategy is referred to as “training low,” allowing the athlete to train at a low-moderate intensity in a low glycogen state. The glycogen status of the muscle can alter the training adaptations through cellular changes in the mitochondria. Therefore, carbohydrate needs should reflect the work required or demand for optimal performance. However, on high-training load days or 24 hours pre-match, carbohydrate intake should be increased to maximize muscle glycogen stores. Soccer players need to consume up to 8-10 g/kg body weight during the 24 hours before a match.10 On low or rest days, carbohydrate intake should be reduced to reflect the decreased training load. For example, recent research has demonstrated potential training adaptations when muscle glycogen stores are not consistently high11 or intentionally kept low depending on the training load. Adjusting carbohydrate intake to the physical demands of an athlete is a strategy called nutrition periodization.
Table 1. Carbohydrates | ||
Timing | Amount | Application |
| Daily | 5–7 g/kg/day | Low–moderate training load. Match amount to training session intensity. |
Pre-Training/Match | 1–4 gm/kg | Adjust to players’ tolerance, preferences and training load. |
| During Training | 0–30 g/h | Light training session |
| Recovery/After Training | Balance meal 1.0–1.2 g/kg/h, ASAP. | Light training: < 2 h Heavy training/2 sessions/day |
| Match day -1, match day, match day +1 | 7–10 g/kg/d | Adjust to players’ tolerance, preferences. |
| During/half time | 30–60 g/h | High glycemic carbohydrates |
| Recovery/after match | 1.0–1.2 g/kg/h | High glycemic carbohydrates |
However, if glycogen stores are not well supplied before a match >90 minutes, then the muscles and the brain will become fatigued and lead to poor performance. Glycogen depletion contributes to fatigue toward the end of a match.10 In the early 1970s, Saltin and colleagues12 showed that players with high muscle glycogen stores (~400 mmol/kg dry wt) achieve higher movement intensities and cover more total distance than those players who start the match with low glycogen stores (~200 mmol/kg dry wt). Another study examined pre-match diets of male soccer players (65% vs 30% daily carbohydrate intake) to determine the effect on performance outcomes and glycogen concentrations. Results showed high-muscle glycogen concentrations in the 65% carbohydrate diet and a significantly higher amount of intense exercise bouts. More acutely, studies have shown a meal containing 200 to 300 grams of carbohydrates 2 to 4 hours before exercise prolongs endurance.13-15 Ideally, consuming fast-digesting carbohydrate sources during or at half time will help maintain blood glucose concentrations and spare muscle glycogen reserves. The majority of literature shows a 6% to 8% solution of combined fast-digesting carbohydrates (ie, glucose, fructose, sucrose, or maltodextrin) at a rate of 30 to 60 g/h enhances at least 1 aspect of performance in soccer.16-18 These performance benefits include increased running time, improved time to fatigue, and enhanced technical skills. Regarding recovery, soccer players should begin consuming carbohydrate-rich foods and beverages immediately after exhaustive training or a match to optimize glycogen reloading. Ingesting post-exercise carbohydrates stimulates muscle and liver glycogen synthesis up to tenfold compared with post-intake of no carbohydrates.19 This recovery period becomes vital when there are <8 hours between training sessions or another match, such as in youth tournaments. The form of carbohydrate, solid or liquid, can be based on preference and tolerance, as long as the source provides a large glycemic and insulin response.
An easy way to adjust daily carbohydrate intake is to schedule carbohydrate-rich foods at meals or snacks around important training sessions or before/during/after on match day. Anderson and colleagues10 looked at training loads for 1, 2, and 3 matches per week, recommending high carbohydrate intake match day minus 1, on match day, and match day plus 1 for 1 and 2 matches per week and lower carbohydrate intake on the other days. During a 3-match week, lowering carbohydrates any day of that week is not recommended. More research is needed to determine the best strategy for performance regarding carbohydrate periodization in soccer.
PROTEIN AND SOCCER PERFORMANCE
Protein is important to soccer players for muscle tissue repair, strength, bone health, and the immune system (Table 2). The American College of Sports Medicine, the Academy of Nutrition and Dietetics, and the Dietitians of Canada recommend 1.2 to 2.0 g/kg/day.20 Most soccer players meet the daily protein requirements; however, the key to optimizing the total daily amount is focusing on the source/amino acid profile, timing, and amount per feeding. Consuming divided doses of protein (20 g to 40 g) every 3 to 4 hours gives the body a continuous flow of amino acids to support muscle synthesis and recovery. In terms of body size, the recommendation is 0.25 to 0.4 g/kg every 3 to 4 hours, which includes pre-training/match and post-training/match. Protein/amino acids consumed around strength training and high-intensity sessions can promote muscle adaptations, minimize tissue breakdown, and speed recovery. Soccer matches lead to significant muscle damage21 especially at 2 sessions/day or multiple matches in a week. Protein is not a priority during training or matches, as its role is not to provide energy, and the primary goal during soccer activities is energy production. Research supports an intake of 30 to 40 g of casein, which is a slow digesting protein, at night before bed when a strength-training session has been performed that day.22,23
Table 2. Protein | ||
Timing | Amount | Application |
| Daily | 1.2–2.0 g/kg | High quality sources; chicken, lean meats, fish, seafood, eggs, dairy, beans, soy |
Pre-training/match; | 20–40 g or 0.25–0.40 g/kg | Meal/snack |
| During training/match | None needed | If training session <3 h |
| Recovery/after training Night-time feeding | 20–40 g | <30–60 min, whey, casein/whey, pea, soy protein Casein (slow-absorbing protein), strength training days |
Continue to: FAT AND SOCCER PERFORMANCE
FAT AND SOCCER PERFORMANCE
Fat is the primary source of energy at rest and at low-training intensities, such as walking or jogging for soccer players (Table 3). Besides providing slow, long-lasting energy, fat helps absorb vitamins A, D, E, and K; produce hormones; protect organs; and support the cell membrane structure. The dietary recommendations of total fat intake for athletes are similar to or slightly greater than those recommended for non-athletes. The total amount required depends on the training demands and the players’ goals. The recommended amount of dietary fat is between 20% and 35% of total daily energy intake.
Table 3. Fat | ||
Timing | Amount | Application |
Daily | 0.8–1.5 g/kg | Include well balanced meals, primarily polyunsaturated and monounsaturated fats. |
Pre-Training/Match; | ~10–30 g/meal | Limit amount. Avoid digestion and gastrointestinal issues. |
During Training/Match | None needed | Risk of gastrointestinal intolerances. |
Recovery/After Training | ~10–30 g | Include well-balanced meals, primarily polyunsaturated and monounsaturated fats. |
The key to gaining performance benefits from dietary fat depends on the type of fat selected. Some fats in excess, such as omega-6 fatty acids and saturated fats, may promote inflammation, hinder recovery, and affect brain health. Other types can help reduce inflammation, enhance muscle recovery, and improve brain health. These types include polyunsaturated omega-3 fatty acids, which are essential for the health of the athlete, allowing for a balanced fatty acid profile.23 Specific omega-3 fatty acids (EPA and DHA) have shown an improvement in the function of the mitochondria, enhancing energy cell metabolism. They also have potential to be highly anti-inflammatory, benefit rehabilitation during soft-tissue injury, and help decrease secondary damage from a concussion.
In addition, research shows that omega-3 may enhance the energy production of the mitochondria, resulting in less oxidative damage to the muscle cell.25 More research is needed on the effects of performance on soccer players. Given the slow digestion and absorption of fats, fat intake must be limited leading up to or during training sessions or matches, which may risk gastrointestinal issues and displacement of carbohydrates. Low to moderate monounsaturated and polyunsaturated fats in a recovery meal have not been shown to inhibit muscle glycogen reloading or muscle protein synthesis.26,27 In regard to fat intake post-match, fat is not a key nutrient of concern for muscle recovery, as it can be included in the next balanced meal.
MICRONUTRIENTS, VITAMINS, AND MINERALS
Exercise stresses many of the metabolic pathways where vitamins and minerals are required. High-level training demands may also increase the turnover rate of vitamins and minerals. As a result, greater dietary intakes of vitamins and minerals may be warranted. Soccer players at the greatest risk for poor vitamin and mineral levels are those who skip meals, who eliminate ≥1 of the food groups from their diet (such as vegans), or who consume unbalanced and highly processed foods. In soccer players, the micronutrients of concern include iron and vitamin D. In young female soccer players, calcium intake must be assessed along with adequate energy intake for optimal bone density. Vegetarians, vegans, and/or athletes who do not consume meat, eggs, and/or dairy in their diet are at risk for vitamin B12 deficiency. The key to obtaining all the vitamins and minerals an athlete will need is to eat a wide variety of nutrient-dense foods.
IRON
Iron deficiency, with or without anemia, may impair muscle function and limit exercise capacity. Adequate iron intake in athletes with iron deficiencies and/or anemia can improve exercise capacity. Iron depletion is 1 of the most common nutrient deficiencies observed among endurance athletes. Foot strike hemolysis can destroy red blood cells during activities such as running. Research has shown that 30% of professional male soccer players have ferritin levels <30 mcg/L at the end of a soccer season.28 Thus, fatigue and poor recovery time place soccer players at risk of an iron imbalance.29,30
Continue to: Landahl and colleagues...
Landahl and colleagues31 found that iron deficiency and iron deficiency anemia are common in female soccer players at the elite level. In their study of 28 female national soccer players, 57% had iron deficiency and 29% presented with iron deficiency anemia 6 months before the FIFA Women's World Cup. Testing hemoglobin alone is insufficient to detect relative anemia. Regular monitoring of hemoglobin and ferritin concentrations may be necessary to determine appropriate iron needs.
VITAMIN D
Vitamin D is required for optimal bone health, as it helps regulate calcium and phosphorus. Further research shows a link between vitamin D and non–bone-related functions, such as muscle health, immune support, and anti-inflammatory roles, which may be linked to performance. Soccer players with low levels of vitamin D (<30 ng/mL) may be more at risk for musculoskeletal injuries and stress fractures.34 In other sports, vitamin D may enhance muscle strength; however, no association between vitamin D and muscle strength has been found in soccer players.34,35 The geographic location of an athlete seems to be irrelevant to serum levels, as insufficient levels can be found at various latitudes.34,36-38
Evidence has shown that vitamin D may improve athletic performance in vitamin D-depleted athletes, thereby improving vertical jumps, lowering risks of muscle injury/strains and stress fractures, and reducing risk of colds/flu. In 2013, researchers showed for the first time a link between vitamin D and muscle aerobic metabolism by studying the energy efficiency of the mitochondria.32 Athletes with low vitamin D levels increased their ATP production within the muscle with vitamin D supplementation over 10 weeks to 12 weeks.33
CALCIUM
Soccer players present with stronger and denser bones than non-athletes due to running and jumping in their sport. Weight-bearing sites such as lumbar spine, hip, femoral neck, trochanter, intertrochanteric region, and both legs are sensitive to the impact of soccer movements.39 Calcium and vitamin D are also important for muscle contraction.
Given the variation in genetics, sports, and gender, optimal performance requires a healthy eating plan tailored to the individual athlete. A healthy eating plan allows an athlete to train longer and harder, delay the onset of fatigue, and speed recovery. Nutrition supports optimal performance through real food, proper hydration, nutrient timing, and supplementation.
Continue to: FLUID REQUIREMENTS FOR SOCCER PLAYERS
FLUID REQUIREMENTS FOR SOCCER PLAYERS
Many athletes overlook the importance of hydration on performance, either assuming they are hydrated or they miscalculate fluid and electrolyte needs to actual sweat losses. Numerous factors play a part in optimal hydration such as sweat rate, environment, training intensity, duration, body size, and body composition. Soccer players have fewer breaks to consume fluids during a match compared with basketball, baseball, or American football players. These breaks include a 15-minute half between coming off the pitch to the locker room and back, as well as time spent with coaches reviewing strategies; this short window of time must be maximized to rehydrate. Fluids with a carbohydrate concentration of 4% to 8% at 5 to 10 ounces and breaks every 15 to 20 minutes are optimal to maximize uptake while avoiding gastric intolerance.
Studies have shown that most players do not drink sufficiently during a match to optimize hydration, replacing only ~40% to 45% of their sweat losses.40, 41 Maughan and colleagues measured high levels of urine osmolality in some soccer players, thereby indicating that the players started their training session dehydrated.41 Soccer players must begin training or a match well hydrated due to the limited opportunities after kick-off. The athlete should drink at least 4 hours prior to exercise; if no urine is produced or urine is dark in color, then the athlete should drink again 2 hours prior.
Table 4. Sweat Rate Calculation Steps | ||
|
Changes in body mass, urine color, and thirst offer clues to the need for rehydration. Advanced hydration measurement includes testing urine specific gravity (USG) values. For example, testing pre-training or pre-match can be conducted to determine hydration status and trending changes from day to day. A USG value >1.020 is considered dehydrated in accordance with the NATA position statement.42 Calculating a sweat rate is a practical approach to determining individual hydration needs (see Table 4). Sweat rates will vary between soccer players based on their position and intensity of play, along with total match time.39 Soccer players will lose ~1.5 to 4.5 liters during match play.43-46 In general, athletes, including soccer players, should limit body weight loss to ≤2% to 3% to maintain performance. Studies have shown that >2% body mass loss can hinder soccer-specific performance, such as dribbling skills and intermittent high intensity sprinting.49-51) Table 5 outlines the detrimental effects dehydration has on performance. Urine-specific gravity values between 1.021 and 1.030 may reflect 3% to 5% change in body weight.
Table 5. Performance Outcomes at Various Dehydration Levels | ||
|
ELECTROLYTES
Sodium is the primary electrolyte lost in sweat. Other electrolytes (potassium, magnesium, and calcium) are lost at much lower levels and typically replaced through diet. Soccer players can lose large amounts of sodium; between 700 and 1500 mg of sodium/L of sweat has been reported in several studies.42-44 Studies of professional male soccer players have shown potassium losses in the range of 165 mg/L to 234 mg/L.42, 51,52 Sodium in a sports drink or in food aids with water uptake from the intestines and enhances the thirst mechanism in the brain, resulting in additional fluid being retained in the body.
REHYDRATION AFTER TRAINING OR COMPETITION
Within 2 hours after training or competition, the rehydration strategy should provide water to restore body fluid status, carbohydrates to replenish glycogen (fuel) stores, and electrolytes to speed rehydration (Table 6). The volume of fluids and type of fluids over the next 24 hours dictate the hydration status prior to the next day’s training session. It is a continuous cycle. Over time, an athlete increases the risk of being in a chronic dehydrated state, resulting in lack of motivation, risk of injury, and illness, fatigue, and poor performance. The current recommendation is to drink ~50% more in volume than the amount of weight lost, such as 22 to 24 ounces/pound lost.52
Table 6. Hydration | ||
Timing | Amount | Application |
Daily | 3.7 L adult males | Monitor urine color. |
Pre-training/match; | 16 oz or 5–7 mL/kg | Monitor urine production and color |
During training/match | 13–28 oz/h (400- | Every 15–20 min. *Dependent on sweat rate. |
Recovery/after training | 22–24 oz/1 lb body weight lost | Water + food (carbohydrates/electrolytes) |
Soccer is the world’s most popular sport. As the sport has grown, so have the physical demands and the search for ways to edge out the competition with the use of sports science and nutrition. The demands, which include intense training, ≥90 minutes matches, congested fixtures, and travel, lead to increased energy and nutrient requirements, stress on the body, and risk of impaired sleep cycles. Identifying key areas to enhance a player’s performance is an ongoing effort because of individual differences. Moreover, new information is being discovered via research, and advancing technology to measure performance is always evolving. This article focuses on the core nutrition principles known to lay the foundation for a better soccer player. These principles are obvious for some; however, nutrition and hydration are often undervalued, leaving the individual player with the responsibility to eat right. This review addresses the most applicable nutrition-related recommendations for soccer players.
Technical, tactical, and physical skills are key factors in a soccer player’s performance. However, energy demands of matches and training sessions require adequate fuel and hydration to maximize those key factors. Athletes may need to manage carbohydrates, protein, and fat separately to achieve optimal body size and body composition, and to maximize performance.
Nutrition plays a vital role in keeping the player healthy, reducing risk of injuries, speeding up recovery, and enhancing training adaptations. Research has shown what we eat and when we eat can significantly impact skeletal muscle adaptation, inflammation, immune response, and energy metabolism. These are all essential nutrition considerations for soccer players.
ENERGY METABOLISM IN SOCCER
Understanding energy demands will help determine energy requirements: type, amount, and timing of macronutrients and micronutrients. Soccer utilizes both aerobic and anaerobic energy systems. Soccer is an intermittent team-based sport; thus, it contains various high-intensity movements, such as sprinting, jumping, dribbling, and frequent changing of direction performed in between numerous low-intensity slow movements. The high intense movements collectively account for about 30% of match play, whereas 70% is walking, jogging, and standing. Although sprinting and jumping are not a large part of the 90 minutes of match play, they have a huge impact on the outcome of the match. Distance covered in the last 15 minutes of match play decreases by 14% to 45% compared with the first 15 minutes of play.1 Krustrup and colleagues2 found muscles in the quadriceps to be empty or nearly empty of glycogen (stored carbohydrates) after match play. This phenomenon can help explain a significant decrease in sprinting, jumping, and intermittent movements toward the end of a match—energy demands that rely on glycogen as the primary fuel source. Being well-fueled and hydrated and having the ability to delay fatigue can place a team at a performance advantage.
ENERGY EXPENDITURE
Beyond training load or match intensity, a soccer player’s body composition, gender, age, and position can affect energy needs. Position differences in elite soccer players show that the greatest total distance covered is by central midfielders and wide midfielders (~12 km –13 km), whereas central defenders cover the least area of the field players (≤~10 km).3,4 The environment can also play a role in energy expenditure. To further understand calorie needs, total daily energy expenditure in soccer players has been measured using doubly labeled water and estimated using heart rate, global positioning system, video match analysis, and activity records.5,6 One study estimated that energy expended during a training day for elite male soccer players is between 3442 kcal and 3824 kcal.6 Another study using doubly labeled water concluded that mean energy expenditure of elite male soccer players is 3566 kcal over a 7-day period, which included 5 training days and 2 matches.7 In terms of energy expenditure for elite female soccer players, the mean values for match day, training days, and rest days were 2914, 2783, and 2213 calories, respectively.8
Continue to: FUELING THE SOCCER PLAYER
FUELING THE SOCCER PLAYER
Depending on the match fixture, proper fueling can be a challenge due to the number of matches, travel time, and limited recovery time. Macronutrients will provide the mainstay of fuel for a player, specifically carbohydrates and fats. Carbohydrates are the preferred source of fuel for the majority of the calories consumed. Using body weight (kg) is a more current and accurate method of recommending the amount of each macronutrient an individual player should eat as compared to using a percentage of total daily calories.
- Carbohydrates: 5–10 g/kg/day
- Protein: 1.2–2.0 g/kg/day
- Fat: 0.8–1.5 g/kg/day
CARBOHYDRATE AND SOCCER PERFORMANCE
Carbohydrates are a limited supply of fuel compared with fat stores. They are an important fuel source for soccer players, as muscle glycogen is vital to performance during high intense training and match play (Table 1). Yet current research shows that a high carbohydrate intake is not required to be followed every day due to varied energy demands.9 This newer strategy is referred to as “training low,” allowing the athlete to train at a low-moderate intensity in a low glycogen state. The glycogen status of the muscle can alter the training adaptations through cellular changes in the mitochondria. Therefore, carbohydrate needs should reflect the work required or demand for optimal performance. However, on high-training load days or 24 hours pre-match, carbohydrate intake should be increased to maximize muscle glycogen stores. Soccer players need to consume up to 8-10 g/kg body weight during the 24 hours before a match.10 On low or rest days, carbohydrate intake should be reduced to reflect the decreased training load. For example, recent research has demonstrated potential training adaptations when muscle glycogen stores are not consistently high11 or intentionally kept low depending on the training load. Adjusting carbohydrate intake to the physical demands of an athlete is a strategy called nutrition periodization.
Table 1. Carbohydrates | ||
Timing | Amount | Application |
| Daily | 5–7 g/kg/day | Low–moderate training load. Match amount to training session intensity. |
Pre-Training/Match | 1–4 gm/kg | Adjust to players’ tolerance, preferences and training load. |
| During Training | 0–30 g/h | Light training session |
| Recovery/After Training | Balance meal 1.0–1.2 g/kg/h, ASAP. | Light training: < 2 h Heavy training/2 sessions/day |
| Match day -1, match day, match day +1 | 7–10 g/kg/d | Adjust to players’ tolerance, preferences. |
| During/half time | 30–60 g/h | High glycemic carbohydrates |
| Recovery/after match | 1.0–1.2 g/kg/h | High glycemic carbohydrates |
However, if glycogen stores are not well supplied before a match >90 minutes, then the muscles and the brain will become fatigued and lead to poor performance. Glycogen depletion contributes to fatigue toward the end of a match.10 In the early 1970s, Saltin and colleagues12 showed that players with high muscle glycogen stores (~400 mmol/kg dry wt) achieve higher movement intensities and cover more total distance than those players who start the match with low glycogen stores (~200 mmol/kg dry wt). Another study examined pre-match diets of male soccer players (65% vs 30% daily carbohydrate intake) to determine the effect on performance outcomes and glycogen concentrations. Results showed high-muscle glycogen concentrations in the 65% carbohydrate diet and a significantly higher amount of intense exercise bouts. More acutely, studies have shown a meal containing 200 to 300 grams of carbohydrates 2 to 4 hours before exercise prolongs endurance.13-15 Ideally, consuming fast-digesting carbohydrate sources during or at half time will help maintain blood glucose concentrations and spare muscle glycogen reserves. The majority of literature shows a 6% to 8% solution of combined fast-digesting carbohydrates (ie, glucose, fructose, sucrose, or maltodextrin) at a rate of 30 to 60 g/h enhances at least 1 aspect of performance in soccer.16-18 These performance benefits include increased running time, improved time to fatigue, and enhanced technical skills. Regarding recovery, soccer players should begin consuming carbohydrate-rich foods and beverages immediately after exhaustive training or a match to optimize glycogen reloading. Ingesting post-exercise carbohydrates stimulates muscle and liver glycogen synthesis up to tenfold compared with post-intake of no carbohydrates.19 This recovery period becomes vital when there are <8 hours between training sessions or another match, such as in youth tournaments. The form of carbohydrate, solid or liquid, can be based on preference and tolerance, as long as the source provides a large glycemic and insulin response.
An easy way to adjust daily carbohydrate intake is to schedule carbohydrate-rich foods at meals or snacks around important training sessions or before/during/after on match day. Anderson and colleagues10 looked at training loads for 1, 2, and 3 matches per week, recommending high carbohydrate intake match day minus 1, on match day, and match day plus 1 for 1 and 2 matches per week and lower carbohydrate intake on the other days. During a 3-match week, lowering carbohydrates any day of that week is not recommended. More research is needed to determine the best strategy for performance regarding carbohydrate periodization in soccer.
PROTEIN AND SOCCER PERFORMANCE
Protein is important to soccer players for muscle tissue repair, strength, bone health, and the immune system (Table 2). The American College of Sports Medicine, the Academy of Nutrition and Dietetics, and the Dietitians of Canada recommend 1.2 to 2.0 g/kg/day.20 Most soccer players meet the daily protein requirements; however, the key to optimizing the total daily amount is focusing on the source/amino acid profile, timing, and amount per feeding. Consuming divided doses of protein (20 g to 40 g) every 3 to 4 hours gives the body a continuous flow of amino acids to support muscle synthesis and recovery. In terms of body size, the recommendation is 0.25 to 0.4 g/kg every 3 to 4 hours, which includes pre-training/match and post-training/match. Protein/amino acids consumed around strength training and high-intensity sessions can promote muscle adaptations, minimize tissue breakdown, and speed recovery. Soccer matches lead to significant muscle damage21 especially at 2 sessions/day or multiple matches in a week. Protein is not a priority during training or matches, as its role is not to provide energy, and the primary goal during soccer activities is energy production. Research supports an intake of 30 to 40 g of casein, which is a slow digesting protein, at night before bed when a strength-training session has been performed that day.22,23
Table 2. Protein | ||
Timing | Amount | Application |
| Daily | 1.2–2.0 g/kg | High quality sources; chicken, lean meats, fish, seafood, eggs, dairy, beans, soy |
Pre-training/match; | 20–40 g or 0.25–0.40 g/kg | Meal/snack |
| During training/match | None needed | If training session <3 h |
| Recovery/after training Night-time feeding | 20–40 g | <30–60 min, whey, casein/whey, pea, soy protein Casein (slow-absorbing protein), strength training days |
Continue to: FAT AND SOCCER PERFORMANCE
FAT AND SOCCER PERFORMANCE
Fat is the primary source of energy at rest and at low-training intensities, such as walking or jogging for soccer players (Table 3). Besides providing slow, long-lasting energy, fat helps absorb vitamins A, D, E, and K; produce hormones; protect organs; and support the cell membrane structure. The dietary recommendations of total fat intake for athletes are similar to or slightly greater than those recommended for non-athletes. The total amount required depends on the training demands and the players’ goals. The recommended amount of dietary fat is between 20% and 35% of total daily energy intake.
Table 3. Fat | ||
Timing | Amount | Application |
Daily | 0.8–1.5 g/kg | Include well balanced meals, primarily polyunsaturated and monounsaturated fats. |
Pre-Training/Match; | ~10–30 g/meal | Limit amount. Avoid digestion and gastrointestinal issues. |
During Training/Match | None needed | Risk of gastrointestinal intolerances. |
Recovery/After Training | ~10–30 g | Include well-balanced meals, primarily polyunsaturated and monounsaturated fats. |
The key to gaining performance benefits from dietary fat depends on the type of fat selected. Some fats in excess, such as omega-6 fatty acids and saturated fats, may promote inflammation, hinder recovery, and affect brain health. Other types can help reduce inflammation, enhance muscle recovery, and improve brain health. These types include polyunsaturated omega-3 fatty acids, which are essential for the health of the athlete, allowing for a balanced fatty acid profile.23 Specific omega-3 fatty acids (EPA and DHA) have shown an improvement in the function of the mitochondria, enhancing energy cell metabolism. They also have potential to be highly anti-inflammatory, benefit rehabilitation during soft-tissue injury, and help decrease secondary damage from a concussion.
In addition, research shows that omega-3 may enhance the energy production of the mitochondria, resulting in less oxidative damage to the muscle cell.25 More research is needed on the effects of performance on soccer players. Given the slow digestion and absorption of fats, fat intake must be limited leading up to or during training sessions or matches, which may risk gastrointestinal issues and displacement of carbohydrates. Low to moderate monounsaturated and polyunsaturated fats in a recovery meal have not been shown to inhibit muscle glycogen reloading or muscle protein synthesis.26,27 In regard to fat intake post-match, fat is not a key nutrient of concern for muscle recovery, as it can be included in the next balanced meal.
MICRONUTRIENTS, VITAMINS, AND MINERALS
Exercise stresses many of the metabolic pathways where vitamins and minerals are required. High-level training demands may also increase the turnover rate of vitamins and minerals. As a result, greater dietary intakes of vitamins and minerals may be warranted. Soccer players at the greatest risk for poor vitamin and mineral levels are those who skip meals, who eliminate ≥1 of the food groups from their diet (such as vegans), or who consume unbalanced and highly processed foods. In soccer players, the micronutrients of concern include iron and vitamin D. In young female soccer players, calcium intake must be assessed along with adequate energy intake for optimal bone density. Vegetarians, vegans, and/or athletes who do not consume meat, eggs, and/or dairy in their diet are at risk for vitamin B12 deficiency. The key to obtaining all the vitamins and minerals an athlete will need is to eat a wide variety of nutrient-dense foods.
IRON
Iron deficiency, with or without anemia, may impair muscle function and limit exercise capacity. Adequate iron intake in athletes with iron deficiencies and/or anemia can improve exercise capacity. Iron depletion is 1 of the most common nutrient deficiencies observed among endurance athletes. Foot strike hemolysis can destroy red blood cells during activities such as running. Research has shown that 30% of professional male soccer players have ferritin levels <30 mcg/L at the end of a soccer season.28 Thus, fatigue and poor recovery time place soccer players at risk of an iron imbalance.29,30
Continue to: Landahl and colleagues...
Landahl and colleagues31 found that iron deficiency and iron deficiency anemia are common in female soccer players at the elite level. In their study of 28 female national soccer players, 57% had iron deficiency and 29% presented with iron deficiency anemia 6 months before the FIFA Women's World Cup. Testing hemoglobin alone is insufficient to detect relative anemia. Regular monitoring of hemoglobin and ferritin concentrations may be necessary to determine appropriate iron needs.
VITAMIN D
Vitamin D is required for optimal bone health, as it helps regulate calcium and phosphorus. Further research shows a link between vitamin D and non–bone-related functions, such as muscle health, immune support, and anti-inflammatory roles, which may be linked to performance. Soccer players with low levels of vitamin D (<30 ng/mL) may be more at risk for musculoskeletal injuries and stress fractures.34 In other sports, vitamin D may enhance muscle strength; however, no association between vitamin D and muscle strength has been found in soccer players.34,35 The geographic location of an athlete seems to be irrelevant to serum levels, as insufficient levels can be found at various latitudes.34,36-38
Evidence has shown that vitamin D may improve athletic performance in vitamin D-depleted athletes, thereby improving vertical jumps, lowering risks of muscle injury/strains and stress fractures, and reducing risk of colds/flu. In 2013, researchers showed for the first time a link between vitamin D and muscle aerobic metabolism by studying the energy efficiency of the mitochondria.32 Athletes with low vitamin D levels increased their ATP production within the muscle with vitamin D supplementation over 10 weeks to 12 weeks.33
CALCIUM
Soccer players present with stronger and denser bones than non-athletes due to running and jumping in their sport. Weight-bearing sites such as lumbar spine, hip, femoral neck, trochanter, intertrochanteric region, and both legs are sensitive to the impact of soccer movements.39 Calcium and vitamin D are also important for muscle contraction.
Given the variation in genetics, sports, and gender, optimal performance requires a healthy eating plan tailored to the individual athlete. A healthy eating plan allows an athlete to train longer and harder, delay the onset of fatigue, and speed recovery. Nutrition supports optimal performance through real food, proper hydration, nutrient timing, and supplementation.
Continue to: FLUID REQUIREMENTS FOR SOCCER PLAYERS
FLUID REQUIREMENTS FOR SOCCER PLAYERS
Many athletes overlook the importance of hydration on performance, either assuming they are hydrated or they miscalculate fluid and electrolyte needs to actual sweat losses. Numerous factors play a part in optimal hydration such as sweat rate, environment, training intensity, duration, body size, and body composition. Soccer players have fewer breaks to consume fluids during a match compared with basketball, baseball, or American football players. These breaks include a 15-minute half between coming off the pitch to the locker room and back, as well as time spent with coaches reviewing strategies; this short window of time must be maximized to rehydrate. Fluids with a carbohydrate concentration of 4% to 8% at 5 to 10 ounces and breaks every 15 to 20 minutes are optimal to maximize uptake while avoiding gastric intolerance.
Studies have shown that most players do not drink sufficiently during a match to optimize hydration, replacing only ~40% to 45% of their sweat losses.40, 41 Maughan and colleagues measured high levels of urine osmolality in some soccer players, thereby indicating that the players started their training session dehydrated.41 Soccer players must begin training or a match well hydrated due to the limited opportunities after kick-off. The athlete should drink at least 4 hours prior to exercise; if no urine is produced or urine is dark in color, then the athlete should drink again 2 hours prior.
Table 4. Sweat Rate Calculation Steps | ||
|
Changes in body mass, urine color, and thirst offer clues to the need for rehydration. Advanced hydration measurement includes testing urine specific gravity (USG) values. For example, testing pre-training or pre-match can be conducted to determine hydration status and trending changes from day to day. A USG value >1.020 is considered dehydrated in accordance with the NATA position statement.42 Calculating a sweat rate is a practical approach to determining individual hydration needs (see Table 4). Sweat rates will vary between soccer players based on their position and intensity of play, along with total match time.39 Soccer players will lose ~1.5 to 4.5 liters during match play.43-46 In general, athletes, including soccer players, should limit body weight loss to ≤2% to 3% to maintain performance. Studies have shown that >2% body mass loss can hinder soccer-specific performance, such as dribbling skills and intermittent high intensity sprinting.49-51) Table 5 outlines the detrimental effects dehydration has on performance. Urine-specific gravity values between 1.021 and 1.030 may reflect 3% to 5% change in body weight.
Table 5. Performance Outcomes at Various Dehydration Levels | ||
|
ELECTROLYTES
Sodium is the primary electrolyte lost in sweat. Other electrolytes (potassium, magnesium, and calcium) are lost at much lower levels and typically replaced through diet. Soccer players can lose large amounts of sodium; between 700 and 1500 mg of sodium/L of sweat has been reported in several studies.42-44 Studies of professional male soccer players have shown potassium losses in the range of 165 mg/L to 234 mg/L.42, 51,52 Sodium in a sports drink or in food aids with water uptake from the intestines and enhances the thirst mechanism in the brain, resulting in additional fluid being retained in the body.
REHYDRATION AFTER TRAINING OR COMPETITION
Within 2 hours after training or competition, the rehydration strategy should provide water to restore body fluid status, carbohydrates to replenish glycogen (fuel) stores, and electrolytes to speed rehydration (Table 6). The volume of fluids and type of fluids over the next 24 hours dictate the hydration status prior to the next day’s training session. It is a continuous cycle. Over time, an athlete increases the risk of being in a chronic dehydrated state, resulting in lack of motivation, risk of injury, and illness, fatigue, and poor performance. The current recommendation is to drink ~50% more in volume than the amount of weight lost, such as 22 to 24 ounces/pound lost.52
Table 6. Hydration | ||
Timing | Amount | Application |
Daily | 3.7 L adult males | Monitor urine color. |
Pre-training/match; | 16 oz or 5–7 mL/kg | Monitor urine production and color |
During training/match | 13–28 oz/h (400- | Every 15–20 min. *Dependent on sweat rate. |
Recovery/after training | 22–24 oz/1 lb body weight lost | Water + food (carbohydrates/electrolytes) |
- Mohr M, Krustrup P, Bangsbo J. Match performance of high-standard soccer players with special reference to development of fatigue. J Sports Sci. 2003;21:519-528.
- Krustrup P, Mohr M, Steensberg A, Bencke J, Kjaer M, Bangsbo J. Muscle and blood metabolites during a soccer game: implications for sprint performance. Med Sci Sports Exerc. 2006;38:1165-1174.
- Di Salvo V, Gregson W, Atkinson G, Tordoff P, Drust B. Analysis of high intensity activity in Premier League soccer. Int J Sports Med. 2009;30:205-212.
- Di Salvo V, Baron R, Tschan H, Calderon Montero FJ, Bachl N, Pigozzi F. Performance characteristics according to playing position in elite soccer. Int J Sports Med. 2007;28:222-227.
- Reilly T, Thomas V. Estimated daily energy expenditures of professional association footballers. Ergonomics. 1979;22:541-548.
- Osgnach C, Poser S, Bernardini R, Rinaldo R, di Prampero P.E. Energy cost and metabolic power in elite soccer: A new match analysis approach. Med Sci Sports Exerc. 2010;42:170-178.
- Anderson L, Orme P, Naughton RJ, Close, GL, Milsom J, Rydings D, et al. Energy intake and expenditure of professional soccer players of the English Premier League: evidence of carbohydrate periodization. Int J Sport Nutr Exerc Metab. 2017;1-25.
- Mara JK, Thompson KG, Pumpa KL. Assessing the energy expenditure of elite female soccer layers: a preliminary study. J Strength Cond Res. 2015;2780-2786.
- Bartlett JD, Hawley JA, Morton JP. Eur J Sport Sci. 2015;15(1):1, 3-12.
- Anderson L, Orme P, Di Michele R, Close GL, Morgans R, Drust B, Morton JP. Quantification of training load during one-, two- and three-game week schedules in professional soccer players from the English Premier League: implications for carbohydrate periodisation. J Sports Sci. 2016;34;1250-1259.
- Hawley JA, Morton JP. Ramping up the signal: promoting endurance training adaptation in skeletal muscle by nutritional manipulation. Clin Exp Pharmacol Physiol. 2014;41:608-613.
- Saltin B. Metabolic fundamentals in exercise. 1973;:137-146.
- Balsom PD, Wood K, Olsson P, Ekblom B. Carbohydrate intake and multiple sprint sports: With special reference to football (soccer). Int J Sports Med. 1999;20:48-52.
- Neufer PD, Costill DL, Flynn MG, Kirwan JP, Mitchell JB, Houmard J. Improvements in exercise performance: Effects of carbohydrate feedings and diet. J Appl Physiol. 1987;62:983-988.
- Sherman WM, Brodowicz G, Wright DA, Allen WK, Simonsen J, Dernbach A. Effects of 4 h preexercise carbohydrate feedings on cycling performance. Med Sci Sports Exerc. 1989;21:598-604.
- Baker LB, Rollo I, Stein KW, Jeukendrup AE. Acute effects of carbohydrate supplementation on intermittent sports performance. Nutrients. 2015;7:5733-5763.
- Goedecke JH, White NJ, Chicktay W, Mahomed H, Durandt J, Lambert MI. The effect of carbohydrate ingestion on performance during a simulated soccer match. Nutrients. 2013;5:5193-5204.
- Nicholas CW, Williams C, Lakomy HK, Phillips G, Nowitz A. Influence of ingesting a carbohydrate-electrolyte solution on endurance capacity during intermittent, high-intensity shuttle running. J Sports Sci. 1995;13:283-290.
- Burke LM, van Loon LJC, Hawley JA. Post-exercise muscle glycogen resynthesis in humans. J Appl Physiol. 2016;122:1055-1067.
- Rodriquez NR, DiMarco NM, Langley S. Position of the American Dietetic Association, Dietitians of Canada, and the American College of Sports Medicine: Nutrition and athletic performance. J Am Diet Assoc. 2009;109(3):509-527.
- Romagnoli M, Sanchis-Gomar F, Alis R, Risso-Ballester J, Bosio A, Graziani RL, Rampinini E. Changes in muscle damage, inflammation, and fatigue-related parameters in young elite soccer players after a match. J. Sports Med Phys Fit. 2016;56:1198-1205.
- Res PT, Groen B, Pennings B, Beelen M, Wallis GA, Gijsen AP, et al.Protein ingestion before sleep improves postexercise overnight recovery. Med Sci Sports Exerc. 2012;44:1560-1569.
- Snijders T, Res PT, Smeets JSJ, Van Vliet S, Van Kranenburg J, Maase K, et al.Protein ingestion before sleep increases muscle mass and strength gains during prolonged resistance-type exercise training in healthy young men. J Nutr. 2015;145:1178-1184.
- Simopoulos AP. Omega-3 fatty acids and athletics. Curr Sports Med Rep. 2007;6230-236.
- Peoples GE, McLennan PL, Howe P, Groeller H. Fish oil reduces apparent myocardial oxygen consumption in trained cyclists but does not change time to fatigue. Presented at the Fourth International Conference on Nutrition and Fitness; May 25-29, 2000; Ancient Olympia, Greece.
- Burke LM, Collier GR, Beasley S.K, Davis PG, Fricker PA, Heeley P, et al. Effect of coingestion of fat and protein with carbohydrate feedings on muscle glycogen storage. J Appl Physiol. 1995;78:2187-2192.
- Roy BD, Tarnopolsky MA. Influence of differing macronutrient intakes on muscle glycogen resynthesis after resistance exercise. J Appl Physiol. 1998;84:890-896.
- Reinke S, Taylor W.R, Duda GN, von Haehling S, Reinke P, Volk H-D et al. Absolute and functional iron deficiency in professional athletes during training and recovery. Int J Cardiol. 2012;156:186-191.
- Escanero JF, Villanueva J, Rojo A, Herrera A, del Diego C, Guerra M. Iron stores in professional athletes throughout the sports season. Physiol Behav. 1997;62:811-814.
- Heisterberg MF, Fahrenkrug J, Krustrup P, Storskov A, Kjær, M, Andersen JL. Extensive monitoring
- Landahl G, Adolfsson P, Borjesson M, Mannheimer C, Rodjer S. Iron deficiency and anemia: a common problem in female elite soccer players. Int J Sport Nutr Exerc Metab. 2005;15(6):689-694.
- Sinha A, Hollingsworth K, Ball S, Cheetham T. Improving the vitamin D status of vitamin D deficient adults is associated with improved mitochondrial oxidative function in skeletal muscle. Endocrine Abstracts, 2013;31.OC1.6
- Shuler FD, Wingate MK, Moore GH, Giangarra C. Sports health benefits of vitamin D. Sports Health. 2012;4:496-501.
- Hamilton B, Whiteley R, Farooq A, Chalabi H. Vitamin D concentration in 342 professional football players and association with lower limb isokinetic function. J Sci. Med Sport. 2014;17:139-143.
- Ksiażek A, Zagrodna A, Dziubek W, Pietraszewski B, Ochmann B, Słowińska-Lisowska M,25(OH)D3 levels relative to muscle strength and maximum oxygen uptake in athletes. J Hum Kinet. 2016;50:71-77.
- Kopeć A, Solarz K, Majda F, Słowińska-Lisowska M, Medraś M. An evaluation of the levels of vitamin D and bone turnover markers after the summer and winter periods in Polish professional soccer players. J Hum Kinet. 2013;38:135-140.
- Vander Slagmolen G, van Hellemondt FJ, Wielders JPM. Do professional soccer players have a vitamin D status supporting optimal performance in winter time? J Sports Med Doping Stud. 2014,4:2.
- Morton JP, Iqbal Z, Drust B, Burgess D, Close GL, Brukner PD. Seasonal variation in vitamin D status in professional soccer players of the English Premier League. Appl Physiol Nutr Metab. 2012;37:798-802.
- Lozano-Berges G, Matute-Llorente A, Gonzalez-Aguero A, Gomez-Bruton A, Gomez-Cabelloa A, Vincente-Rodriguez G, Casajus JA. Soccer helps build strong bones during growth: a systematic review and meta-analysis. Eur J Pediatr. 2018;177(3):295-310.
- Burke LM. Fluid balance during team sports. J Sports Sci. 1997;15:287-295.
- Maughan RJ, Merson SJ, Broad NP, Shirreffs SM. Fluid and electrolyte intake and loss in elite soccer players during training. Int J Sport Nutr Exerc Metab. 2004;14:333-346.
- Brendon P, McDermott, P, Anderson SA, Armstrong LE, Casa DJ, Cheuvront SN, et al. National Athletic Trainers’ Association Position Statement: Fluid Replacement for the Physically Active. J Athl Train. 2017;52(9):877-895.
- Shirreffs SM, Aragon-Vargas LF, Chamorro M, Maughan RJ, Serratosa L, Zachwieja JJ. The sweating response of elite professional soccer players to training in the heat. Int J Sports Med. 2005;26: 90-95.
- Maughan RJ, Watson P, Evans GH, Broad N, Shirreffs SM. Water balance and salt losses in competitive football. Int J Sport Nutr Exerc Metab. 2007;17:583-594.
- Aragón-Vargas LF, Moncada-Jiménez J, Hernández-Elizondo J, Barrenechea A,Monge-Alvarado M. Evaluation of pre-game hydration status, heat stress, and fluid balance during professional soccer competition in the heat. Eur J Sport Sci. 2009;9:269-276.
- Maughan RJ, Shirreffs SM, Merson SJ, Horswill CA. Fluid and electrolyte balance in elite male football (soccer) players training in a cool environment. J Sports Sci. 2005;23:73-79.
- Duffield R, McCall A, Coutts AJ, Peiffer JJ. Hydration, sweat and thermoregulatory responses to professional football training in the heat. J Sports Sci. 2012;30:957-965.
- Shirreffs SM, Aragon-Vargas LF, Chamorro M, Maughan RJ, Serratosa L, Zachwieja JJ. The sweating response of elite professional soccer players to training in the heat. Int J Sports Med. 2005;26:90-95.
- Edwards AM, Mann ME, Marfell-Jones MJ, Rankin DM, Noakes TD, Shillington DP. Influence of moderate dehydration on soccer performance: Physiological responses to 45 min of outdoor match-play and the immediate subsequent performance of sport-specific and mental concentration tests. Br J Sports Med. 2007;41:385-391.
- McGregor SJ, Nicholas CW, Lakomy HK, Williams C. The influence of intermittent high-intensity shuttle running and fluid ingestion on the performance of a soccer skill. J Sports Sci. 1999;17:895-903.
- Maughan RJ, Merson SJ, Broad NP, Shirreffs SM. Fluid and electrolyte intake and loss in elite soccer players during training. Int J Sport Nutr Exerc Metab. 2004;14:333-346.
- Shirreffs SM, Sawka MN, Stone M. Water and electrolyte needs for football training and match-play. J Sports Sci. 2006;24:699-707.
- Mohr M, Krustrup P, Bangsbo J. Match performance of high-standard soccer players with special reference to development of fatigue. J Sports Sci. 2003;21:519-528.
- Krustrup P, Mohr M, Steensberg A, Bencke J, Kjaer M, Bangsbo J. Muscle and blood metabolites during a soccer game: implications for sprint performance. Med Sci Sports Exerc. 2006;38:1165-1174.
- Di Salvo V, Gregson W, Atkinson G, Tordoff P, Drust B. Analysis of high intensity activity in Premier League soccer. Int J Sports Med. 2009;30:205-212.
- Di Salvo V, Baron R, Tschan H, Calderon Montero FJ, Bachl N, Pigozzi F. Performance characteristics according to playing position in elite soccer. Int J Sports Med. 2007;28:222-227.
- Reilly T, Thomas V. Estimated daily energy expenditures of professional association footballers. Ergonomics. 1979;22:541-548.
- Osgnach C, Poser S, Bernardini R, Rinaldo R, di Prampero P.E. Energy cost and metabolic power in elite soccer: A new match analysis approach. Med Sci Sports Exerc. 2010;42:170-178.
- Anderson L, Orme P, Naughton RJ, Close, GL, Milsom J, Rydings D, et al. Energy intake and expenditure of professional soccer players of the English Premier League: evidence of carbohydrate periodization. Int J Sport Nutr Exerc Metab. 2017;1-25.
- Mara JK, Thompson KG, Pumpa KL. Assessing the energy expenditure of elite female soccer layers: a preliminary study. J Strength Cond Res. 2015;2780-2786.
- Bartlett JD, Hawley JA, Morton JP. Eur J Sport Sci. 2015;15(1):1, 3-12.
- Anderson L, Orme P, Di Michele R, Close GL, Morgans R, Drust B, Morton JP. Quantification of training load during one-, two- and three-game week schedules in professional soccer players from the English Premier League: implications for carbohydrate periodisation. J Sports Sci. 2016;34;1250-1259.
- Hawley JA, Morton JP. Ramping up the signal: promoting endurance training adaptation in skeletal muscle by nutritional manipulation. Clin Exp Pharmacol Physiol. 2014;41:608-613.
- Saltin B. Metabolic fundamentals in exercise. 1973;:137-146.
- Balsom PD, Wood K, Olsson P, Ekblom B. Carbohydrate intake and multiple sprint sports: With special reference to football (soccer). Int J Sports Med. 1999;20:48-52.
- Neufer PD, Costill DL, Flynn MG, Kirwan JP, Mitchell JB, Houmard J. Improvements in exercise performance: Effects of carbohydrate feedings and diet. J Appl Physiol. 1987;62:983-988.
- Sherman WM, Brodowicz G, Wright DA, Allen WK, Simonsen J, Dernbach A. Effects of 4 h preexercise carbohydrate feedings on cycling performance. Med Sci Sports Exerc. 1989;21:598-604.
- Baker LB, Rollo I, Stein KW, Jeukendrup AE. Acute effects of carbohydrate supplementation on intermittent sports performance. Nutrients. 2015;7:5733-5763.
- Goedecke JH, White NJ, Chicktay W, Mahomed H, Durandt J, Lambert MI. The effect of carbohydrate ingestion on performance during a simulated soccer match. Nutrients. 2013;5:5193-5204.
- Nicholas CW, Williams C, Lakomy HK, Phillips G, Nowitz A. Influence of ingesting a carbohydrate-electrolyte solution on endurance capacity during intermittent, high-intensity shuttle running. J Sports Sci. 1995;13:283-290.
- Burke LM, van Loon LJC, Hawley JA. Post-exercise muscle glycogen resynthesis in humans. J Appl Physiol. 2016;122:1055-1067.
- Rodriquez NR, DiMarco NM, Langley S. Position of the American Dietetic Association, Dietitians of Canada, and the American College of Sports Medicine: Nutrition and athletic performance. J Am Diet Assoc. 2009;109(3):509-527.
- Romagnoli M, Sanchis-Gomar F, Alis R, Risso-Ballester J, Bosio A, Graziani RL, Rampinini E. Changes in muscle damage, inflammation, and fatigue-related parameters in young elite soccer players after a match. J. Sports Med Phys Fit. 2016;56:1198-1205.
- Res PT, Groen B, Pennings B, Beelen M, Wallis GA, Gijsen AP, et al.Protein ingestion before sleep improves postexercise overnight recovery. Med Sci Sports Exerc. 2012;44:1560-1569.
- Snijders T, Res PT, Smeets JSJ, Van Vliet S, Van Kranenburg J, Maase K, et al.Protein ingestion before sleep increases muscle mass and strength gains during prolonged resistance-type exercise training in healthy young men. J Nutr. 2015;145:1178-1184.
- Simopoulos AP. Omega-3 fatty acids and athletics. Curr Sports Med Rep. 2007;6230-236.
- Peoples GE, McLennan PL, Howe P, Groeller H. Fish oil reduces apparent myocardial oxygen consumption in trained cyclists but does not change time to fatigue. Presented at the Fourth International Conference on Nutrition and Fitness; May 25-29, 2000; Ancient Olympia, Greece.
- Burke LM, Collier GR, Beasley S.K, Davis PG, Fricker PA, Heeley P, et al. Effect of coingestion of fat and protein with carbohydrate feedings on muscle glycogen storage. J Appl Physiol. 1995;78:2187-2192.
- Roy BD, Tarnopolsky MA. Influence of differing macronutrient intakes on muscle glycogen resynthesis after resistance exercise. J Appl Physiol. 1998;84:890-896.
- Reinke S, Taylor W.R, Duda GN, von Haehling S, Reinke P, Volk H-D et al. Absolute and functional iron deficiency in professional athletes during training and recovery. Int J Cardiol. 2012;156:186-191.
- Escanero JF, Villanueva J, Rojo A, Herrera A, del Diego C, Guerra M. Iron stores in professional athletes throughout the sports season. Physiol Behav. 1997;62:811-814.
- Heisterberg MF, Fahrenkrug J, Krustrup P, Storskov A, Kjær, M, Andersen JL. Extensive monitoring
- Landahl G, Adolfsson P, Borjesson M, Mannheimer C, Rodjer S. Iron deficiency and anemia: a common problem in female elite soccer players. Int J Sport Nutr Exerc Metab. 2005;15(6):689-694.
- Sinha A, Hollingsworth K, Ball S, Cheetham T. Improving the vitamin D status of vitamin D deficient adults is associated with improved mitochondrial oxidative function in skeletal muscle. Endocrine Abstracts, 2013;31.OC1.6
- Shuler FD, Wingate MK, Moore GH, Giangarra C. Sports health benefits of vitamin D. Sports Health. 2012;4:496-501.
- Hamilton B, Whiteley R, Farooq A, Chalabi H. Vitamin D concentration in 342 professional football players and association with lower limb isokinetic function. J Sci. Med Sport. 2014;17:139-143.
- Ksiażek A, Zagrodna A, Dziubek W, Pietraszewski B, Ochmann B, Słowińska-Lisowska M,25(OH)D3 levels relative to muscle strength and maximum oxygen uptake in athletes. J Hum Kinet. 2016;50:71-77.
- Kopeć A, Solarz K, Majda F, Słowińska-Lisowska M, Medraś M. An evaluation of the levels of vitamin D and bone turnover markers after the summer and winter periods in Polish professional soccer players. J Hum Kinet. 2013;38:135-140.
- Vander Slagmolen G, van Hellemondt FJ, Wielders JPM. Do professional soccer players have a vitamin D status supporting optimal performance in winter time? J Sports Med Doping Stud. 2014,4:2.
- Morton JP, Iqbal Z, Drust B, Burgess D, Close GL, Brukner PD. Seasonal variation in vitamin D status in professional soccer players of the English Premier League. Appl Physiol Nutr Metab. 2012;37:798-802.
- Lozano-Berges G, Matute-Llorente A, Gonzalez-Aguero A, Gomez-Bruton A, Gomez-Cabelloa A, Vincente-Rodriguez G, Casajus JA. Soccer helps build strong bones during growth: a systematic review and meta-analysis. Eur J Pediatr. 2018;177(3):295-310.
- Burke LM. Fluid balance during team sports. J Sports Sci. 1997;15:287-295.
- Maughan RJ, Merson SJ, Broad NP, Shirreffs SM. Fluid and electrolyte intake and loss in elite soccer players during training. Int J Sport Nutr Exerc Metab. 2004;14:333-346.
- Brendon P, McDermott, P, Anderson SA, Armstrong LE, Casa DJ, Cheuvront SN, et al. National Athletic Trainers’ Association Position Statement: Fluid Replacement for the Physically Active. J Athl Train. 2017;52(9):877-895.
- Shirreffs SM, Aragon-Vargas LF, Chamorro M, Maughan RJ, Serratosa L, Zachwieja JJ. The sweating response of elite professional soccer players to training in the heat. Int J Sports Med. 2005;26: 90-95.
- Maughan RJ, Watson P, Evans GH, Broad N, Shirreffs SM. Water balance and salt losses in competitive football. Int J Sport Nutr Exerc Metab. 2007;17:583-594.
- Aragón-Vargas LF, Moncada-Jiménez J, Hernández-Elizondo J, Barrenechea A,Monge-Alvarado M. Evaluation of pre-game hydration status, heat stress, and fluid balance during professional soccer competition in the heat. Eur J Sport Sci. 2009;9:269-276.
- Maughan RJ, Shirreffs SM, Merson SJ, Horswill CA. Fluid and electrolyte balance in elite male football (soccer) players training in a cool environment. J Sports Sci. 2005;23:73-79.
- Duffield R, McCall A, Coutts AJ, Peiffer JJ. Hydration, sweat and thermoregulatory responses to professional football training in the heat. J Sports Sci. 2012;30:957-965.
- Shirreffs SM, Aragon-Vargas LF, Chamorro M, Maughan RJ, Serratosa L, Zachwieja JJ. The sweating response of elite professional soccer players to training in the heat. Int J Sports Med. 2005;26:90-95.
- Edwards AM, Mann ME, Marfell-Jones MJ, Rankin DM, Noakes TD, Shillington DP. Influence of moderate dehydration on soccer performance: Physiological responses to 45 min of outdoor match-play and the immediate subsequent performance of sport-specific and mental concentration tests. Br J Sports Med. 2007;41:385-391.
- McGregor SJ, Nicholas CW, Lakomy HK, Williams C. The influence of intermittent high-intensity shuttle running and fluid ingestion on the performance of a soccer skill. J Sports Sci. 1999;17:895-903.
- Maughan RJ, Merson SJ, Broad NP, Shirreffs SM. Fluid and electrolyte intake and loss in elite soccer players during training. Int J Sport Nutr Exerc Metab. 2004;14:333-346.
- Shirreffs SM, Sawka MN, Stone M. Water and electrolyte needs for football training and match-play. J Sports Sci. 2006;24:699-707.
TAKE-HOME POINTS:
- Nutrition plays a vital role in keeping the player healthy, reducing risk for injury, speeding up recovery, and enhancing training adaptations.
- Average energy expenditure during a training day is ~3500-3600 kcal for elite male soccer players and ~2700-2800 kcal for elite female soccer players.
- Carbohydrate needs should reflect the work required/demand to produce optimal performance.
- Vitamin D and iron are two common nutrients of concern for soccer players.
- Studies have shown that most players do not drink sufficiently during a match to optimize hydration, replacing only ~40% to 45% of their sweat losses. Soccer players can also lose large amounts of sodium: between 700 and 1500 mg of sodium/L of sweat.
Annual cost of branded topical rosacea therapy is twice that of generics
according to a retrospective analysis of claims data published in the Journal of the American Academy of Dermatology.
“We found the mean annual cost of topical therapy for branded medications per person was nearly twice the cost of generics, despite the rise in generic drug costs,” Hadar Lev-Tov, MD, from the department of dermatology and cutaneous surgery at the University of Miami and his colleagues wrote in their study, published as a letter to the editor. “Thus, there is an opportunity to save healthcare costs, nearly $7.5 million annually, for this cohort.”
Dr. Lev-Tov and his colleagues performed an analysis of the MarketScan Commercial Claims and Encounters database to determine real-world costs and usage of rosacea medication and identified 72,173 adults with two or more claims for rosacea who visited a primary care provider, dermatologist, or ophthalmologist over 18 months, from January 2005 through December 2014. The majority of these patients – 62,074 (86%) – received topical medication therapy, while 4,463 (6%) of patients received oral therapy only. Of the patients who received topical therapy, 47,035 (75.8%) received single agent topical therapy and 15,039 (24.2%) patients used combination topical therapy. Metronidazole and azelaic acid were the most common combination used.
The researchers noted that this was “an important proportion” of patients who used combination topical therapy, despite it not being discussed in most guidelines. In addition, they added, “these medications are thought to work by similar mechanisms (anti-inflammatory, antioxidant, and KLK5 modulation) and to our knowledge have not been studied together.”
More patients were treated with branded topical medications (50,334) than with generics (39,621). With regard to price (calculated as the sum of insurance payments, copay, and deductible for each medication over 1 year), the mean annual cost of the branded topical medication was $308.02, compared with $160.37 for generic medications (P less than .0001). The researchers noted switching to a generic medication for treatment of rosacea would potentially save $147.65 per patient a year. (Costs were reported in 2015 US dollars.)
The researchers said their study was limited by lack of Medicare and Medicaid claims data, the retrospective study design, and dependence on an ICD-9 code only for diagnosis of rosacea, but they noted that 92% of patients received a diagnosis from a dermatologist. In addition, they recommended more studies be conducted on the cost-effectiveness of rosacea therapy when comparing systemic medications and topical therapies.
This study was funded in part by a grant from the American Acne and Rosacea Society. The authors report no relevant conflicts of interest.
SOURCE: Lev-Tov H et al. J Am Acad Dermatol. 2018. doi: 10.1016/j.jaad.2018.09.039.
according to a retrospective analysis of claims data published in the Journal of the American Academy of Dermatology.
“We found the mean annual cost of topical therapy for branded medications per person was nearly twice the cost of generics, despite the rise in generic drug costs,” Hadar Lev-Tov, MD, from the department of dermatology and cutaneous surgery at the University of Miami and his colleagues wrote in their study, published as a letter to the editor. “Thus, there is an opportunity to save healthcare costs, nearly $7.5 million annually, for this cohort.”
Dr. Lev-Tov and his colleagues performed an analysis of the MarketScan Commercial Claims and Encounters database to determine real-world costs and usage of rosacea medication and identified 72,173 adults with two or more claims for rosacea who visited a primary care provider, dermatologist, or ophthalmologist over 18 months, from January 2005 through December 2014. The majority of these patients – 62,074 (86%) – received topical medication therapy, while 4,463 (6%) of patients received oral therapy only. Of the patients who received topical therapy, 47,035 (75.8%) received single agent topical therapy and 15,039 (24.2%) patients used combination topical therapy. Metronidazole and azelaic acid were the most common combination used.
The researchers noted that this was “an important proportion” of patients who used combination topical therapy, despite it not being discussed in most guidelines. In addition, they added, “these medications are thought to work by similar mechanisms (anti-inflammatory, antioxidant, and KLK5 modulation) and to our knowledge have not been studied together.”
More patients were treated with branded topical medications (50,334) than with generics (39,621). With regard to price (calculated as the sum of insurance payments, copay, and deductible for each medication over 1 year), the mean annual cost of the branded topical medication was $308.02, compared with $160.37 for generic medications (P less than .0001). The researchers noted switching to a generic medication for treatment of rosacea would potentially save $147.65 per patient a year. (Costs were reported in 2015 US dollars.)
The researchers said their study was limited by lack of Medicare and Medicaid claims data, the retrospective study design, and dependence on an ICD-9 code only for diagnosis of rosacea, but they noted that 92% of patients received a diagnosis from a dermatologist. In addition, they recommended more studies be conducted on the cost-effectiveness of rosacea therapy when comparing systemic medications and topical therapies.
This study was funded in part by a grant from the American Acne and Rosacea Society. The authors report no relevant conflicts of interest.
SOURCE: Lev-Tov H et al. J Am Acad Dermatol. 2018. doi: 10.1016/j.jaad.2018.09.039.
according to a retrospective analysis of claims data published in the Journal of the American Academy of Dermatology.
“We found the mean annual cost of topical therapy for branded medications per person was nearly twice the cost of generics, despite the rise in generic drug costs,” Hadar Lev-Tov, MD, from the department of dermatology and cutaneous surgery at the University of Miami and his colleagues wrote in their study, published as a letter to the editor. “Thus, there is an opportunity to save healthcare costs, nearly $7.5 million annually, for this cohort.”
Dr. Lev-Tov and his colleagues performed an analysis of the MarketScan Commercial Claims and Encounters database to determine real-world costs and usage of rosacea medication and identified 72,173 adults with two or more claims for rosacea who visited a primary care provider, dermatologist, or ophthalmologist over 18 months, from January 2005 through December 2014. The majority of these patients – 62,074 (86%) – received topical medication therapy, while 4,463 (6%) of patients received oral therapy only. Of the patients who received topical therapy, 47,035 (75.8%) received single agent topical therapy and 15,039 (24.2%) patients used combination topical therapy. Metronidazole and azelaic acid were the most common combination used.
The researchers noted that this was “an important proportion” of patients who used combination topical therapy, despite it not being discussed in most guidelines. In addition, they added, “these medications are thought to work by similar mechanisms (anti-inflammatory, antioxidant, and KLK5 modulation) and to our knowledge have not been studied together.”
More patients were treated with branded topical medications (50,334) than with generics (39,621). With regard to price (calculated as the sum of insurance payments, copay, and deductible for each medication over 1 year), the mean annual cost of the branded topical medication was $308.02, compared with $160.37 for generic medications (P less than .0001). The researchers noted switching to a generic medication for treatment of rosacea would potentially save $147.65 per patient a year. (Costs were reported in 2015 US dollars.)
The researchers said their study was limited by lack of Medicare and Medicaid claims data, the retrospective study design, and dependence on an ICD-9 code only for diagnosis of rosacea, but they noted that 92% of patients received a diagnosis from a dermatologist. In addition, they recommended more studies be conducted on the cost-effectiveness of rosacea therapy when comparing systemic medications and topical therapies.
This study was funded in part by a grant from the American Acne and Rosacea Society. The authors report no relevant conflicts of interest.
SOURCE: Lev-Tov H et al. J Am Acad Dermatol. 2018. doi: 10.1016/j.jaad.2018.09.039.
FROM THE JOURNAL OF THE AMERICAN ACADEMY OF DERMATOLOGY
Key clinical point: Patients used branded topical medications more often than generic medications for treatment of rosacea.
Major finding: About 50,000 patients were treated with branded topical medications than with generics (almost 40,000), at a mean annual cost of $308.02 and $160.37, respectively.
Study details: A retrospective cohort analysis of 72,173 adults with rosacea treated with topical or oral therapy from a commercial claims database between January 2005 and 2014.
Disclosures: This study was funded in part by a grant from the American Acne and Rosacea Society. The authors report no relevant conflicts of interest.
Source: Lev-Tov H et al. J Am Acad Dermatol. 2018. doi: 10.1016/j.jaad.2018.09.039.
Gestational, umbilical cord vitamin D levels don’t predict atopic disease in offspring
according to study results published in the journal Allergy.
Áine Hennessy, PhD, from the School of Food and Nutritional Sciences at the University College Cork (Ireland), and her colleagues performed a prospective cohort study of 1,537 women in the Cork BASELINE Birth Cohort Study who underwent measurement of serum 25-hydroxyvitamin D (25[OH]D) from maternal sera followed by measurement of 25(OH)D in umbilical cord blood (1,050 cases). They then measured the prevalence of eczema, food allergy, allergic rhinitis, and asthma in infants at aged 2 and 5 years.
The researchers found at 2 years old, 5% of infants had persistent eczema, 4% of infants had a food allergy and 8% of infants had aeroallergen sensitization. At age 5 years, 15% of infants had asthma, while 5% had allergic rhinitis. Mothers whose children went on to have atopy did not differ in their 25(OH)D levels at 15 weeks’ gestation (mean 58.4 nmol/L vs. 58.5 nmol/L) or in the levels in umbilical cord blood (mean 35.2 nmol/L and 35.4 nmol/L).
Of the women in the cohort, 74% ranged in age from 25 to 34 years; 49% reported a personal history of allergy and 37% reported a paternal allergy. The mean birth weight of the infants was 3,458 g; infants were breastfed for mean 11.9 weeks, 73% of infants were breastfeeding by the time they left the hospital and 45% of infants were breastfeeding by age 2 months.
Limitations of the study included that parental atopy status was self-reported and that the researchers noted they did not examine genetic variants of immunoglobulin E synthesis or vitamin D receptor polymorphisms.
“To fully characterize relationships between intrauterine vitamin D exposure and allergic disease, analysis of well‐constructed, large‐scale prospective cohorts of maternal‐infant dyads, which take due consideration of an individual’s inherited risk, early‐life exposures and environmental confounders, is still needed,” Dr. Hennessy and her colleagues wrote.
The study was funded by grants from the European Commission, Ireland Health Research Board, National Children’s Research Centre, Food Standards Agency and Science Foundation Ireland. The authors report no relevant conflicts of interest.
SOURCE: Hennessy A et al. Allergy. 2018 Aug 7. doi: 10.1111/all.13590.
according to study results published in the journal Allergy.
Áine Hennessy, PhD, from the School of Food and Nutritional Sciences at the University College Cork (Ireland), and her colleagues performed a prospective cohort study of 1,537 women in the Cork BASELINE Birth Cohort Study who underwent measurement of serum 25-hydroxyvitamin D (25[OH]D) from maternal sera followed by measurement of 25(OH)D in umbilical cord blood (1,050 cases). They then measured the prevalence of eczema, food allergy, allergic rhinitis, and asthma in infants at aged 2 and 5 years.
The researchers found at 2 years old, 5% of infants had persistent eczema, 4% of infants had a food allergy and 8% of infants had aeroallergen sensitization. At age 5 years, 15% of infants had asthma, while 5% had allergic rhinitis. Mothers whose children went on to have atopy did not differ in their 25(OH)D levels at 15 weeks’ gestation (mean 58.4 nmol/L vs. 58.5 nmol/L) or in the levels in umbilical cord blood (mean 35.2 nmol/L and 35.4 nmol/L).
Of the women in the cohort, 74% ranged in age from 25 to 34 years; 49% reported a personal history of allergy and 37% reported a paternal allergy. The mean birth weight of the infants was 3,458 g; infants were breastfed for mean 11.9 weeks, 73% of infants were breastfeeding by the time they left the hospital and 45% of infants were breastfeeding by age 2 months.
Limitations of the study included that parental atopy status was self-reported and that the researchers noted they did not examine genetic variants of immunoglobulin E synthesis or vitamin D receptor polymorphisms.
“To fully characterize relationships between intrauterine vitamin D exposure and allergic disease, analysis of well‐constructed, large‐scale prospective cohorts of maternal‐infant dyads, which take due consideration of an individual’s inherited risk, early‐life exposures and environmental confounders, is still needed,” Dr. Hennessy and her colleagues wrote.
The study was funded by grants from the European Commission, Ireland Health Research Board, National Children’s Research Centre, Food Standards Agency and Science Foundation Ireland. The authors report no relevant conflicts of interest.
SOURCE: Hennessy A et al. Allergy. 2018 Aug 7. doi: 10.1111/all.13590.
according to study results published in the journal Allergy.
Áine Hennessy, PhD, from the School of Food and Nutritional Sciences at the University College Cork (Ireland), and her colleagues performed a prospective cohort study of 1,537 women in the Cork BASELINE Birth Cohort Study who underwent measurement of serum 25-hydroxyvitamin D (25[OH]D) from maternal sera followed by measurement of 25(OH)D in umbilical cord blood (1,050 cases). They then measured the prevalence of eczema, food allergy, allergic rhinitis, and asthma in infants at aged 2 and 5 years.
The researchers found at 2 years old, 5% of infants had persistent eczema, 4% of infants had a food allergy and 8% of infants had aeroallergen sensitization. At age 5 years, 15% of infants had asthma, while 5% had allergic rhinitis. Mothers whose children went on to have atopy did not differ in their 25(OH)D levels at 15 weeks’ gestation (mean 58.4 nmol/L vs. 58.5 nmol/L) or in the levels in umbilical cord blood (mean 35.2 nmol/L and 35.4 nmol/L).
Of the women in the cohort, 74% ranged in age from 25 to 34 years; 49% reported a personal history of allergy and 37% reported a paternal allergy. The mean birth weight of the infants was 3,458 g; infants were breastfed for mean 11.9 weeks, 73% of infants were breastfeeding by the time they left the hospital and 45% of infants were breastfeeding by age 2 months.
Limitations of the study included that parental atopy status was self-reported and that the researchers noted they did not examine genetic variants of immunoglobulin E synthesis or vitamin D receptor polymorphisms.
“To fully characterize relationships between intrauterine vitamin D exposure and allergic disease, analysis of well‐constructed, large‐scale prospective cohorts of maternal‐infant dyads, which take due consideration of an individual’s inherited risk, early‐life exposures and environmental confounders, is still needed,” Dr. Hennessy and her colleagues wrote.
The study was funded by grants from the European Commission, Ireland Health Research Board, National Children’s Research Centre, Food Standards Agency and Science Foundation Ireland. The authors report no relevant conflicts of interest.
SOURCE: Hennessy A et al. Allergy. 2018 Aug 7. doi: 10.1111/all.13590.
FROM ALLERGY
Key clinical point: There was no association between prevalence of atopic disease and vitamin D levels measured in maternal sera during pregnancy or in umbilical cord blood.
Major finding: Maternal vitamin D levels at 15 weeks of gestation (mean 58.4 nmol/L vs. 58.5 nmol/L) and concentrations in umbilical cord blood (mean 35.2 nmol/L and 35.4 nmol/L) were not associated with such atopic diseases as eczema, food allergy, asthma, and allergic rhinitis in children.
Study details: A prospective group of 1,537 women and infant pairs from the Cork BASELINE Birth Cohort Study.
Disclosures: This study was funded by grants from the European Commission, Ireland Health Research Board, National Children’s Research Centre, Food Standards Agency and Science Foundation Ireland. The authors report no relevant conflicts of interest.
Source: Hennessy A et al. Allergy 2018 Aug 7. doi:10.1111/all.13590.
Single-item scale effective for assessing sleep quality
The single-item sleep quality scale (SQS) produced favorable results comparable to other complex, time-intensive assessment tools, according to findings published in the Journal of Clinical Sleep Medicine.
In a study of 70 insomnia patients and 651 depression patients, concurrent criterion validity analysis yielded strong correlations between the SQS and the morning-questionnaire insomnia (MQI) and Pittsburgh Sleep Quality Index (PSQI) in patients with insomnia and depression, respectively. The investigators wrote, “The single-item format enables a patient-reported rating of sleep quality over a 7-day recall period without greatly increasing the patient’s burden. The use of a discretizing visual analog scale (VAS) increases the potential for a more sensitive measurement.” The SQS is a quick but accurate self-reported assessment of sleep quality.
The SQS was validated based on two studies. Eligible patients in the 4-week, randomized, multicenter insomnia study were aged 30-75 years and were receiving a Food and Drug Administration–approved hypnotic agent as usual treatment for insomnia based on criteria from the Diagnostic and Statistical Manual of Mental Disorders, Fourth Edition (DSM-IV). The MQI was used daily for the duration of the study, wrote Ellen Snyder, PhD, of Merck & Co., in Kenilworth, N.J., and her coauthors.
The depression study was a randomized, double-blind, parallel-group, 12-month international trial evaluating the safety of the substance P antagonist aprepitant, compared with paroxetine hydrochloride. Patients were aged 18 years or older, with a DSM-IV diagnosis of major depressive disorder. Patients completed the SQS and PSQI at baseline, week 1, and week 8.
In insomnia patients, a Pearson correlation of –.76 was found at week 1 for the SQS in relation to the MQI.
In patients with depression, Goodman-Kruskal correlation coefficients for the SQS in relation to the Pittsburgh Sleep Quality Index (PSQI) were –.87, –.88, and –.92 at baseline, week 1, and week 8, respectively.
Correlations were negative because “better sleep quality is associated with a lower score on the MQI and PSQI, but a higher score on the SQS,” the authors noted.
The results support the use of the SQS as a “practical sleep measure that can effectively gauge sleep quality without significantly increasing the burden of clinical trial participants,” compared with lengthier assessments such as the MQI and PSQI, they added.
Funding for the study was provided by Merck Sharp & Dohme.
SOURCE: Snyder E et al. J Clin Sleep Med. 2018;14(11):1849-57.
The single-item sleep quality scale (SQS) produced favorable results comparable to other complex, time-intensive assessment tools, according to findings published in the Journal of Clinical Sleep Medicine.
In a study of 70 insomnia patients and 651 depression patients, concurrent criterion validity analysis yielded strong correlations between the SQS and the morning-questionnaire insomnia (MQI) and Pittsburgh Sleep Quality Index (PSQI) in patients with insomnia and depression, respectively. The investigators wrote, “The single-item format enables a patient-reported rating of sleep quality over a 7-day recall period without greatly increasing the patient’s burden. The use of a discretizing visual analog scale (VAS) increases the potential for a more sensitive measurement.” The SQS is a quick but accurate self-reported assessment of sleep quality.
The SQS was validated based on two studies. Eligible patients in the 4-week, randomized, multicenter insomnia study were aged 30-75 years and were receiving a Food and Drug Administration–approved hypnotic agent as usual treatment for insomnia based on criteria from the Diagnostic and Statistical Manual of Mental Disorders, Fourth Edition (DSM-IV). The MQI was used daily for the duration of the study, wrote Ellen Snyder, PhD, of Merck & Co., in Kenilworth, N.J., and her coauthors.
The depression study was a randomized, double-blind, parallel-group, 12-month international trial evaluating the safety of the substance P antagonist aprepitant, compared with paroxetine hydrochloride. Patients were aged 18 years or older, with a DSM-IV diagnosis of major depressive disorder. Patients completed the SQS and PSQI at baseline, week 1, and week 8.
In insomnia patients, a Pearson correlation of –.76 was found at week 1 for the SQS in relation to the MQI.
In patients with depression, Goodman-Kruskal correlation coefficients for the SQS in relation to the Pittsburgh Sleep Quality Index (PSQI) were –.87, –.88, and –.92 at baseline, week 1, and week 8, respectively.
Correlations were negative because “better sleep quality is associated with a lower score on the MQI and PSQI, but a higher score on the SQS,” the authors noted.
The results support the use of the SQS as a “practical sleep measure that can effectively gauge sleep quality without significantly increasing the burden of clinical trial participants,” compared with lengthier assessments such as the MQI and PSQI, they added.
Funding for the study was provided by Merck Sharp & Dohme.
SOURCE: Snyder E et al. J Clin Sleep Med. 2018;14(11):1849-57.
The single-item sleep quality scale (SQS) produced favorable results comparable to other complex, time-intensive assessment tools, according to findings published in the Journal of Clinical Sleep Medicine.
In a study of 70 insomnia patients and 651 depression patients, concurrent criterion validity analysis yielded strong correlations between the SQS and the morning-questionnaire insomnia (MQI) and Pittsburgh Sleep Quality Index (PSQI) in patients with insomnia and depression, respectively. The investigators wrote, “The single-item format enables a patient-reported rating of sleep quality over a 7-day recall period without greatly increasing the patient’s burden. The use of a discretizing visual analog scale (VAS) increases the potential for a more sensitive measurement.” The SQS is a quick but accurate self-reported assessment of sleep quality.
The SQS was validated based on two studies. Eligible patients in the 4-week, randomized, multicenter insomnia study were aged 30-75 years and were receiving a Food and Drug Administration–approved hypnotic agent as usual treatment for insomnia based on criteria from the Diagnostic and Statistical Manual of Mental Disorders, Fourth Edition (DSM-IV). The MQI was used daily for the duration of the study, wrote Ellen Snyder, PhD, of Merck & Co., in Kenilworth, N.J., and her coauthors.
The depression study was a randomized, double-blind, parallel-group, 12-month international trial evaluating the safety of the substance P antagonist aprepitant, compared with paroxetine hydrochloride. Patients were aged 18 years or older, with a DSM-IV diagnosis of major depressive disorder. Patients completed the SQS and PSQI at baseline, week 1, and week 8.
In insomnia patients, a Pearson correlation of –.76 was found at week 1 for the SQS in relation to the MQI.
In patients with depression, Goodman-Kruskal correlation coefficients for the SQS in relation to the Pittsburgh Sleep Quality Index (PSQI) were –.87, –.88, and –.92 at baseline, week 1, and week 8, respectively.
Correlations were negative because “better sleep quality is associated with a lower score on the MQI and PSQI, but a higher score on the SQS,” the authors noted.
The results support the use of the SQS as a “practical sleep measure that can effectively gauge sleep quality without significantly increasing the burden of clinical trial participants,” compared with lengthier assessments such as the MQI and PSQI, they added.
Funding for the study was provided by Merck Sharp & Dohme.
SOURCE: Snyder E et al. J Clin Sleep Med. 2018;14(11):1849-57.
FROM THE JOURNAL OF CLINICAL SLEEP MEDICINE
Key clinical point: The
Major finding: Week 1 Pearson correlation was –0.76 between the SQS and the morning-questionnaire insomnia (MQI); week 8 Goodman-Kruskal correlation between SQS and the Pittsburgh Sleep Quality Index (PSQI) was –0.92.
Study details: An analysis of SQS versus other measures in 70 insomnia patients and 651 depression patients.
Disclosures: Funding for the study was provided by Merck Sharp & Dohme.
Source: Snyder E et al. J Clin Sleep Med. 2018;14(11):1849-57
CDC: Acute flaccid myelitis on the decline for 2018
, according to the Centers for Disease Control and Prevention.

Through Nov. 30, 134 cases of AFM in 33 states have been confirmed out of the 299 reported to the CDC. That represents “an increase of 18 confirmed cases from the previous week, but most of the latest confirmed AFM cases occurred in September and October,” the CDC reported Dec. 3.
There has been a pattern of increased AFM cases every other year for the previous 4 years: 120 cases in 2014, 22 cases in 2015, 149 cases in 2016, and 33 cases in 2017. “Most cases are reported between August and October, and a marked reduction in cases is seen in November. That pattern appears to be repeating in 2018 because states have reported fewer [persons under investigation] over the past couple of weeks. CDC expects this decline to continue,” the statement said.
The 16 confirmed cases in Texas are the most for any state this year, followed by Colorado with 15; Ohio with 10; and Illinois, New Jersey, and Washington with 9 each. California and Florida have not had any confirmed cases as of Nov. 30. Since 2014, over 90% of all confirmed AFM cases have occurred in children, the CDC noted.
More information on AFM is available at a CDC website for health care professionals.
, according to the Centers for Disease Control and Prevention.
Through Nov. 30, 134 cases of AFM in 33 states have been confirmed out of the 299 reported to the CDC. That represents “an increase of 18 confirmed cases from the previous week, but most of the latest confirmed AFM cases occurred in September and October,” the CDC reported Dec. 3.
There has been a pattern of increased AFM cases every other year for the previous 4 years: 120 cases in 2014, 22 cases in 2015, 149 cases in 2016, and 33 cases in 2017. “Most cases are reported between August and October, and a marked reduction in cases is seen in November. That pattern appears to be repeating in 2018 because states have reported fewer [persons under investigation] over the past couple of weeks. CDC expects this decline to continue,” the statement said.
The 16 confirmed cases in Texas are the most for any state this year, followed by Colorado with 15; Ohio with 10; and Illinois, New Jersey, and Washington with 9 each. California and Florida have not had any confirmed cases as of Nov. 30. Since 2014, over 90% of all confirmed AFM cases have occurred in children, the CDC noted.
More information on AFM is available at a CDC website for health care professionals.
, according to the Centers for Disease Control and Prevention.
Through Nov. 30, 134 cases of AFM in 33 states have been confirmed out of the 299 reported to the CDC. That represents “an increase of 18 confirmed cases from the previous week, but most of the latest confirmed AFM cases occurred in September and October,” the CDC reported Dec. 3.
There has been a pattern of increased AFM cases every other year for the previous 4 years: 120 cases in 2014, 22 cases in 2015, 149 cases in 2016, and 33 cases in 2017. “Most cases are reported between August and October, and a marked reduction in cases is seen in November. That pattern appears to be repeating in 2018 because states have reported fewer [persons under investigation] over the past couple of weeks. CDC expects this decline to continue,” the statement said.
The 16 confirmed cases in Texas are the most for any state this year, followed by Colorado with 15; Ohio with 10; and Illinois, New Jersey, and Washington with 9 each. California and Florida have not had any confirmed cases as of Nov. 30. Since 2014, over 90% of all confirmed AFM cases have occurred in children, the CDC noted.
More information on AFM is available at a CDC website for health care professionals.

Cold packs help reduce pain after laparoscopic hysterectomy
LAS VEGAS – Patients like cold packs for pain control after laparoscopic hysterectomy, according to a small trial from Cleveland Clinic Florida (Weston).

Cold packs have been shown to reduce pain in other types of surgery, so investigators at the clinic wanted to try them out for the procedure, said study lead Pamela Frazzini Padilla, MD, an ob.gyn. at the clinic.
Twenty-eight women were randomized to get packs right after surgery, and told to use them – before turning to oxycodone tabs – every 6 hours for 72 hours – and then as needed. Twenty-eight other women were randomized to the control group. Surgery was for benign indications, most often uterine bleeding secondary to fibroids. Besides the cold packs, there were no differences between the groups in analgesia protocols.
The differences in pain control, assessed on a 10-point scale over the phone, weren’t statistically significant, but they di move in the right direction. At 24 hours, women who were cold pack users reported a median pain score of 4, versus 4.5 among controls. At 72 hours, they reported a median score of 2, versus 2.5 in the control group.
At 2 weeks postoperatively, women who were cold pack users had used a mean of 4 oxycodone pills, versus 7 among the controls, which translated into a mean of 13 IV morphine equivalents versus 24 in favor of cold packs (P = .143).
While not significantly different, overall numbers of opioid tabs consumed and morphine equivalents “demonstrated lower use in the study group,” Dr. Frazzini Padilla noted at the meeting sponsored by AAGL.
Also, 89% of women said that cold packs helped reduce their pain, and 92% said they’d use them again after an operation. “In a day when everything is driven by patient satisfaction, patients’ perception of their recovery” is important. Because cold packs are cheap, harmless, and seemed to help with patient perceptions, “we do recommend that people use” them. “It’s just another added measure that we give” at Cleveland Clinic Florida, she said.
The study team also found that 86% of the women in the trial used 10 or fewer oxycodone tabs after surgery. Across the country, women are prescribed about 25 tabs after a laparoscopic hysterectomy; the study suggests it’s overkill, as an audience member noted, especially given the current climate.
The two arms of the study were well balanced. The mean age was 46 years, and mean body mass index 30.4 kg/m2.
There was no outside funding, and the investigators didn’t have any disclosures.
aotto@mdedge.com
SOURCE: Frazzini Padilla P et al. 2018 AAGL Global Congress, Abstract 21.
LAS VEGAS – Patients like cold packs for pain control after laparoscopic hysterectomy, according to a small trial from Cleveland Clinic Florida (Weston).
Cold packs have been shown to reduce pain in other types of surgery, so investigators at the clinic wanted to try them out for the procedure, said study lead Pamela Frazzini Padilla, MD, an ob.gyn. at the clinic.
Twenty-eight women were randomized to get packs right after surgery, and told to use them – before turning to oxycodone tabs – every 6 hours for 72 hours – and then as needed. Twenty-eight other women were randomized to the control group. Surgery was for benign indications, most often uterine bleeding secondary to fibroids. Besides the cold packs, there were no differences between the groups in analgesia protocols.
The differences in pain control, assessed on a 10-point scale over the phone, weren’t statistically significant, but they di move in the right direction. At 24 hours, women who were cold pack users reported a median pain score of 4, versus 4.5 among controls. At 72 hours, they reported a median score of 2, versus 2.5 in the control group.
At 2 weeks postoperatively, women who were cold pack users had used a mean of 4 oxycodone pills, versus 7 among the controls, which translated into a mean of 13 IV morphine equivalents versus 24 in favor of cold packs (P = .143).
While not significantly different, overall numbers of opioid tabs consumed and morphine equivalents “demonstrated lower use in the study group,” Dr. Frazzini Padilla noted at the meeting sponsored by AAGL.
Also, 89% of women said that cold packs helped reduce their pain, and 92% said they’d use them again after an operation. “In a day when everything is driven by patient satisfaction, patients’ perception of their recovery” is important. Because cold packs are cheap, harmless, and seemed to help with patient perceptions, “we do recommend that people use” them. “It’s just another added measure that we give” at Cleveland Clinic Florida, she said.
The study team also found that 86% of the women in the trial used 10 or fewer oxycodone tabs after surgery. Across the country, women are prescribed about 25 tabs after a laparoscopic hysterectomy; the study suggests it’s overkill, as an audience member noted, especially given the current climate.
The two arms of the study were well balanced. The mean age was 46 years, and mean body mass index 30.4 kg/m2.
There was no outside funding, and the investigators didn’t have any disclosures.
aotto@mdedge.com
SOURCE: Frazzini Padilla P et al. 2018 AAGL Global Congress, Abstract 21.
LAS VEGAS – Patients like cold packs for pain control after laparoscopic hysterectomy, according to a small trial from Cleveland Clinic Florida (Weston).
Cold packs have been shown to reduce pain in other types of surgery, so investigators at the clinic wanted to try them out for the procedure, said study lead Pamela Frazzini Padilla, MD, an ob.gyn. at the clinic.
Twenty-eight women were randomized to get packs right after surgery, and told to use them – before turning to oxycodone tabs – every 6 hours for 72 hours – and then as needed. Twenty-eight other women were randomized to the control group. Surgery was for benign indications, most often uterine bleeding secondary to fibroids. Besides the cold packs, there were no differences between the groups in analgesia protocols.
The differences in pain control, assessed on a 10-point scale over the phone, weren’t statistically significant, but they di move in the right direction. At 24 hours, women who were cold pack users reported a median pain score of 4, versus 4.5 among controls. At 72 hours, they reported a median score of 2, versus 2.5 in the control group.
At 2 weeks postoperatively, women who were cold pack users had used a mean of 4 oxycodone pills, versus 7 among the controls, which translated into a mean of 13 IV morphine equivalents versus 24 in favor of cold packs (P = .143).
While not significantly different, overall numbers of opioid tabs consumed and morphine equivalents “demonstrated lower use in the study group,” Dr. Frazzini Padilla noted at the meeting sponsored by AAGL.
Also, 89% of women said that cold packs helped reduce their pain, and 92% said they’d use them again after an operation. “In a day when everything is driven by patient satisfaction, patients’ perception of their recovery” is important. Because cold packs are cheap, harmless, and seemed to help with patient perceptions, “we do recommend that people use” them. “It’s just another added measure that we give” at Cleveland Clinic Florida, she said.
The study team also found that 86% of the women in the trial used 10 or fewer oxycodone tabs after surgery. Across the country, women are prescribed about 25 tabs after a laparoscopic hysterectomy; the study suggests it’s overkill, as an audience member noted, especially given the current climate.
The two arms of the study were well balanced. The mean age was 46 years, and mean body mass index 30.4 kg/m2.
There was no outside funding, and the investigators didn’t have any disclosures.
aotto@mdedge.com
SOURCE: Frazzini Padilla P et al. 2018 AAGL Global Congress, Abstract 21.
REPORTING FROM AAGL GLOBAL CONGRESS
Key clinical point:
Major finding: Cold pack women at 2 weeks used a mean of 4 oxycodone pills, versus 7 among the controls, which translated into a mean of 13 IV morphine equivalents versus 24 in favor of cold packs (P = 0.143)
Study details: A study of 28 women using cold packs and 28 controls.
Disclosures: There was no outside funding, and the investigators didn’t have any disclosures.
Source: Frazzini Padilla P et al. 2018 AAGL Global Congress, Abstract 21.

Methotrexate fails to cut CVD events in a large RCT
CHICAGO – Both methotrexate and canakinumab are anti-inflammatory drugs, but only canakinumab cut the incidence of cardiovascular disease events in a major clinical trial, CANTOS. A second big trial designed to parallel CANTOS tested methotrexate in roughly the same way and found it produced no cardiovascular disease benefit among high-risk patients.
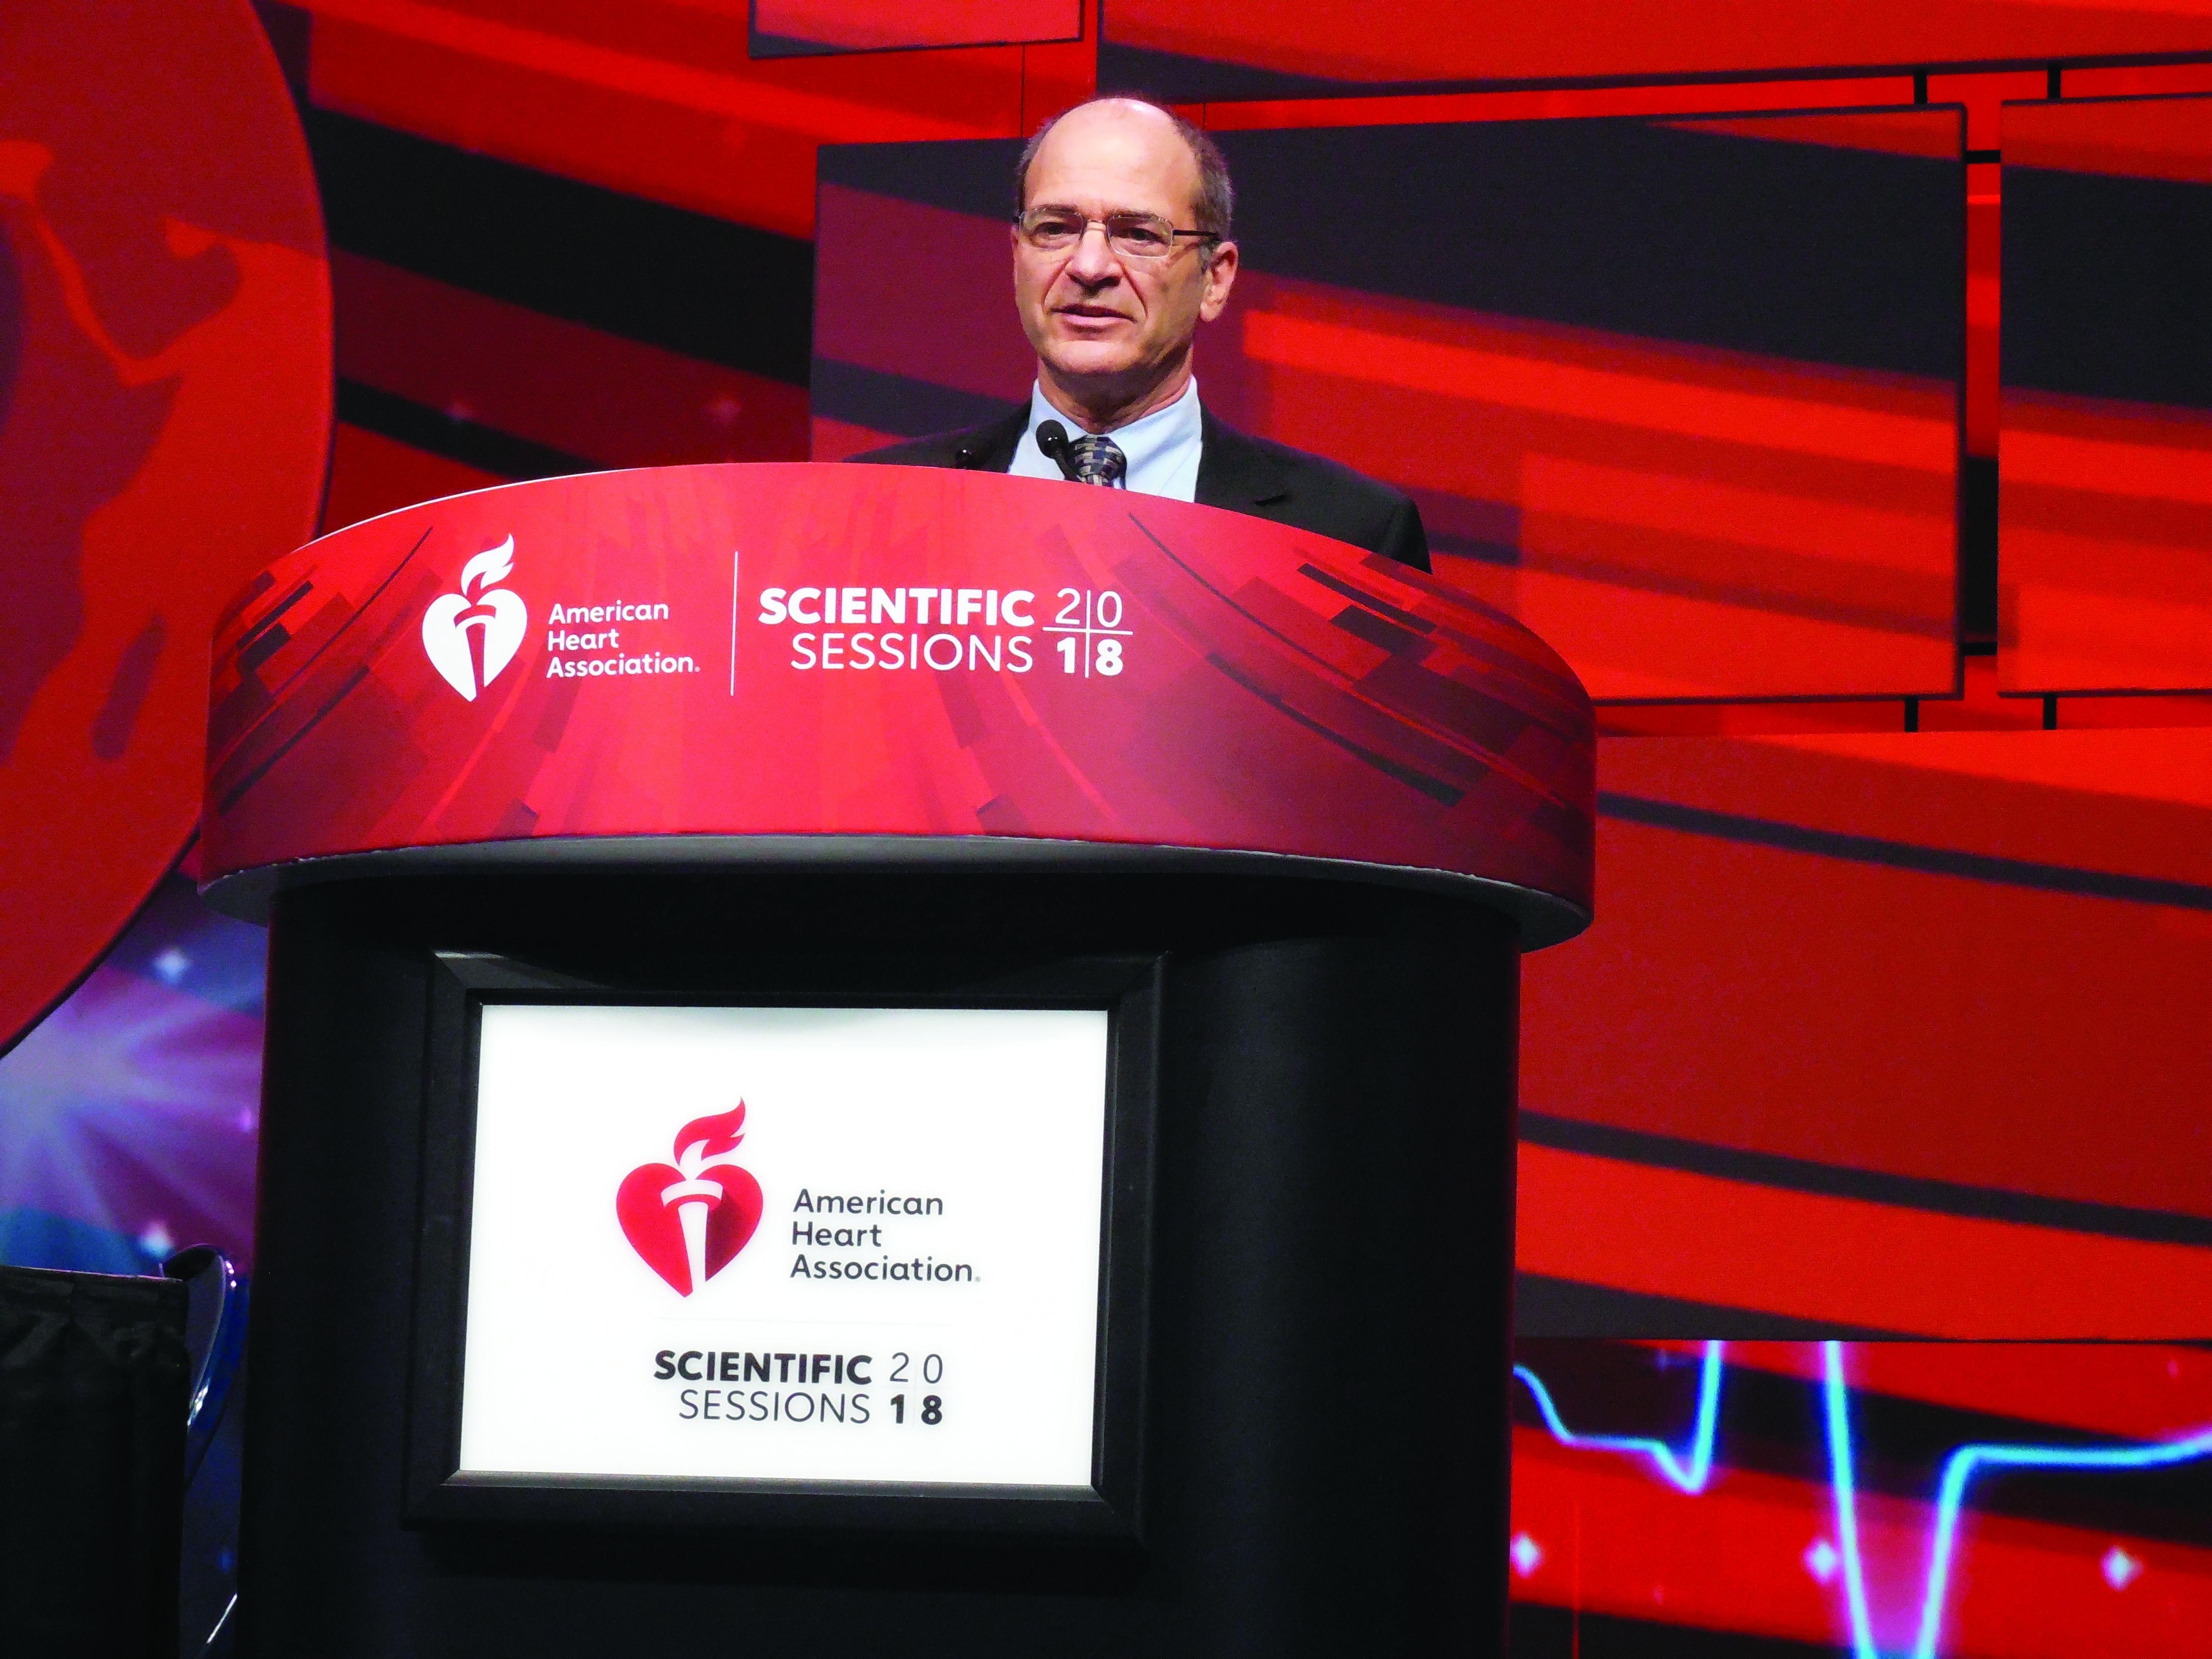
The CANTOS (Canakinumab Anti-inflammatory Thrombosis Outcome Study) results with canakinumab and the new results with methotrexate “demonstrate that inflammation inhibition [with canakinumab] can significantly reduce cardiovascular event rates independent of lipid lowering and blood pressure reduction,” Paul M. Ridker, MD, said at the American Heart Association scientific sessions. But, “inhibition of the IL [interleukin]–1 beta to IL-6 to CRP [C-reactive protein] pathway of innate immunity appears to be important for atheroprotection,” and was something methotrexate couldn’t deliver, concluded Dr. Ridker, a professor of medicine at Harvard Medical School and director of the Center for Cardiovascular Disease Prevention at Brigham and Women’s Hospital in Boston.
The new results he reported showed that weekly treatment with a single, oral, 15- to 20-mg dose of methotrexate not only had no effect on cardiovascular events but also had no discernible impact on serum levels of IL-1beta (IL-1B), IL-6, or high sensitivity (hs) CRP, in contrast to canakinumab, which Dr. Ridker took as evidence that this inflammatory pathway links to the pathophysiology of atherosclerotic cardiovascular disease.
CIRT (Cardiovascular Inflammation Reduction Trial) randomized 4,786 patients at 417 centers in the United States or Canada. Enrolled patients had to have a history of an MI or documented multivessel coronary disease, and also had to have type 2 diabetes, metabolic syndrome, or both. All patients were maintained on optimized dosages of a statin, aspirin, a beta-blocker, and an angiotensin-converting enzyme inhibitor or angiotensin-receptor blocker. All patients also received 1 mg folate daily. Randomization assigned patients to either receive 15-20 mg methotrexate orally once a week or placebo.
CIRT stopped prematurely because of futility after a median follow-up of 2.3 years. At that time, the incidence of one of two primary endpoints, the combination of cardiovascular death, nonfatal MI, and nonfatal stroke was 3.46/100 person-years with methotrexate treatment and 3.43/100 person-years with placebo, a difference that was not statistically significant. The incidence of the second primary endpoint, which combined the first three types of events plus hospitalization for unstable angina that led to urgent coronary revascularization, occurred in 4.13/100 person-years with methotrexate and 4.31/100 person years with placebo, also a difference that was not statistically significant. Concurrently with this report, the results were published online (N Engl J Med. 2018 Nov 10. doi: 10.1056/NEJMoa1809798).
Analysis of inflammatory markers in the blood after 8 months on treatment showed that methotrexate had no effect on levels of IL-1B, IL-6, and hsCRP. Methotrexate’s lack of an effect on these markers as well as the absence of an effect on cardiovascular disease events contrasted sharply with results that Dr. Ridker and his associates reported a little more than a year earlier in CANTOS. The study’s investigators randomized 10,061 patients with a history of an MI and an elevated serum level of hsCRP, at least 2.0 mg/L. After a median follow-up of 3.7 years, treatment with 150 mg of canakinumab injected subcutaneously once every 3 months produced a 15% relative risk reduction in the combined rate of cardiovascular death, nonfatal MI, and nonfatal stroke, compared with patients treated with placebo, a statistically significant between-group difference (N Engl J Med. 2017 Sep 21;377[12]:1119-31). Canakinumab had no impact on LDL cholesterol levels, but lowered hsCRP levels by more than a third. Dr. Ridker and his associates designed the CIRT and CANTOS trials “in parallel,” he said, and the CIRT results using methotrexate provided a “neutral control” to complement the positive results from canakinumab in CANTOS,
Given its high cost, canakinumab (Ilaris) is not an obviously practical option for treating patients similar to those enrolled in CANTOS, so other candidate agents that inhibit the IL-1B, IL-6, CRP inflammatory pathway are now under study, Dr. Ridker said in an interview. The mechanism of methotrexate’s inhibition of inflammation is unknown, but clearly does not involve this pathway; it may be mediated by adenosine, Dr. Ridker suggested. Canakinumab has Food and Drug Administration approval for treating systemic juvenile idiopathic arthritis and a handful of additional, low-prevalence diseases. Novartis, the company that markets canakinumab, made a submission to the Food and Drug Administration seeking an indication for prevention of cardiovascular disease based on the CANTOS results, and the company said in October 2018 that the FDA denied this request.
The CIRT results also showed a previously unseen signal of a possible safety issue with the tested methotrexate regimen. The incidence of non–basal cell skin cancer was 0.65/100 person-years with methotrexate, compared with 0.24/100 person-years with placebo, a statistically significant difference. Until now, no one had reported a link like this and it requires further analysis, Dr. Ridker said.
CIRT received no commercial funding. Dr. Ridker has been a consultant to Corvidia, Inflazome, and Novartis; he has received research funding from Kowa and Novartis; and his work led to a patent held by Brigham and Women’s Hospital for inflammatory biomarkers licensed to Siemens and AstraZeneca.
SOURCE: Ridker P et al. AHA scientific sessions, Abstract 17778.
CIRT is an important study. Considering the results from CIRT, which used methotrexate, along with the results from CANTOS, which used canakinumab, provides helpful mechanistic observations about selective drug effects when targeting inflammation. Two additional trials that are now in progress using colchicine in a clinical setting similar to CIRT and CANTOS should give us even more insight into the relationships between inflammation and atherosclerotic cardiovascular disease and possible new approaches to treatment.

Despite these differences between the two trials, the results from CIRT clearly showed that, in the enrolled patients, the dosage of methotrexate used had no apparent impact on levels of hsCRP, IL-1B, and IL-6.
Sidney C. Smith Jr., MD, is a cardiologist and professor of medicine at the University of North Carolina at Chapel Hill. He made these comments as the designated discussant for the CIRT trial. He had no disclosures.
CIRT is an important study. Considering the results from CIRT, which used methotrexate, along with the results from CANTOS, which used canakinumab, provides helpful mechanistic observations about selective drug effects when targeting inflammation. Two additional trials that are now in progress using colchicine in a clinical setting similar to CIRT and CANTOS should give us even more insight into the relationships between inflammation and atherosclerotic cardiovascular disease and possible new approaches to treatment.
Despite these differences between the two trials, the results from CIRT clearly showed that, in the enrolled patients, the dosage of methotrexate used had no apparent impact on levels of hsCRP, IL-1B, and IL-6.
Sidney C. Smith Jr., MD, is a cardiologist and professor of medicine at the University of North Carolina at Chapel Hill. He made these comments as the designated discussant for the CIRT trial. He had no disclosures.
CIRT is an important study. Considering the results from CIRT, which used methotrexate, along with the results from CANTOS, which used canakinumab, provides helpful mechanistic observations about selective drug effects when targeting inflammation. Two additional trials that are now in progress using colchicine in a clinical setting similar to CIRT and CANTOS should give us even more insight into the relationships between inflammation and atherosclerotic cardiovascular disease and possible new approaches to treatment.
Despite these differences between the two trials, the results from CIRT clearly showed that, in the enrolled patients, the dosage of methotrexate used had no apparent impact on levels of hsCRP, IL-1B, and IL-6.
Sidney C. Smith Jr., MD, is a cardiologist and professor of medicine at the University of North Carolina at Chapel Hill. He made these comments as the designated discussant for the CIRT trial. He had no disclosures.
CHICAGO – Both methotrexate and canakinumab are anti-inflammatory drugs, but only canakinumab cut the incidence of cardiovascular disease events in a major clinical trial, CANTOS. A second big trial designed to parallel CANTOS tested methotrexate in roughly the same way and found it produced no cardiovascular disease benefit among high-risk patients.
The CANTOS (Canakinumab Anti-inflammatory Thrombosis Outcome Study) results with canakinumab and the new results with methotrexate “demonstrate that inflammation inhibition [with canakinumab] can significantly reduce cardiovascular event rates independent of lipid lowering and blood pressure reduction,” Paul M. Ridker, MD, said at the American Heart Association scientific sessions. But, “inhibition of the IL [interleukin]–1 beta to IL-6 to CRP [C-reactive protein] pathway of innate immunity appears to be important for atheroprotection,” and was something methotrexate couldn’t deliver, concluded Dr. Ridker, a professor of medicine at Harvard Medical School and director of the Center for Cardiovascular Disease Prevention at Brigham and Women’s Hospital in Boston.
The new results he reported showed that weekly treatment with a single, oral, 15- to 20-mg dose of methotrexate not only had no effect on cardiovascular events but also had no discernible impact on serum levels of IL-1beta (IL-1B), IL-6, or high sensitivity (hs) CRP, in contrast to canakinumab, which Dr. Ridker took as evidence that this inflammatory pathway links to the pathophysiology of atherosclerotic cardiovascular disease.
CIRT (Cardiovascular Inflammation Reduction Trial) randomized 4,786 patients at 417 centers in the United States or Canada. Enrolled patients had to have a history of an MI or documented multivessel coronary disease, and also had to have type 2 diabetes, metabolic syndrome, or both. All patients were maintained on optimized dosages of a statin, aspirin, a beta-blocker, and an angiotensin-converting enzyme inhibitor or angiotensin-receptor blocker. All patients also received 1 mg folate daily. Randomization assigned patients to either receive 15-20 mg methotrexate orally once a week or placebo.
CIRT stopped prematurely because of futility after a median follow-up of 2.3 years. At that time, the incidence of one of two primary endpoints, the combination of cardiovascular death, nonfatal MI, and nonfatal stroke was 3.46/100 person-years with methotrexate treatment and 3.43/100 person-years with placebo, a difference that was not statistically significant. The incidence of the second primary endpoint, which combined the first three types of events plus hospitalization for unstable angina that led to urgent coronary revascularization, occurred in 4.13/100 person-years with methotrexate and 4.31/100 person years with placebo, also a difference that was not statistically significant. Concurrently with this report, the results were published online (N Engl J Med. 2018 Nov 10. doi: 10.1056/NEJMoa1809798).
Analysis of inflammatory markers in the blood after 8 months on treatment showed that methotrexate had no effect on levels of IL-1B, IL-6, and hsCRP. Methotrexate’s lack of an effect on these markers as well as the absence of an effect on cardiovascular disease events contrasted sharply with results that Dr. Ridker and his associates reported a little more than a year earlier in CANTOS. The study’s investigators randomized 10,061 patients with a history of an MI and an elevated serum level of hsCRP, at least 2.0 mg/L. After a median follow-up of 3.7 years, treatment with 150 mg of canakinumab injected subcutaneously once every 3 months produced a 15% relative risk reduction in the combined rate of cardiovascular death, nonfatal MI, and nonfatal stroke, compared with patients treated with placebo, a statistically significant between-group difference (N Engl J Med. 2017 Sep 21;377[12]:1119-31). Canakinumab had no impact on LDL cholesterol levels, but lowered hsCRP levels by more than a third. Dr. Ridker and his associates designed the CIRT and CANTOS trials “in parallel,” he said, and the CIRT results using methotrexate provided a “neutral control” to complement the positive results from canakinumab in CANTOS,
Given its high cost, canakinumab (Ilaris) is not an obviously practical option for treating patients similar to those enrolled in CANTOS, so other candidate agents that inhibit the IL-1B, IL-6, CRP inflammatory pathway are now under study, Dr. Ridker said in an interview. The mechanism of methotrexate’s inhibition of inflammation is unknown, but clearly does not involve this pathway; it may be mediated by adenosine, Dr. Ridker suggested. Canakinumab has Food and Drug Administration approval for treating systemic juvenile idiopathic arthritis and a handful of additional, low-prevalence diseases. Novartis, the company that markets canakinumab, made a submission to the Food and Drug Administration seeking an indication for prevention of cardiovascular disease based on the CANTOS results, and the company said in October 2018 that the FDA denied this request.
The CIRT results also showed a previously unseen signal of a possible safety issue with the tested methotrexate regimen. The incidence of non–basal cell skin cancer was 0.65/100 person-years with methotrexate, compared with 0.24/100 person-years with placebo, a statistically significant difference. Until now, no one had reported a link like this and it requires further analysis, Dr. Ridker said.
CIRT received no commercial funding. Dr. Ridker has been a consultant to Corvidia, Inflazome, and Novartis; he has received research funding from Kowa and Novartis; and his work led to a patent held by Brigham and Women’s Hospital for inflammatory biomarkers licensed to Siemens and AstraZeneca.
SOURCE: Ridker P et al. AHA scientific sessions, Abstract 17778.
CHICAGO – Both methotrexate and canakinumab are anti-inflammatory drugs, but only canakinumab cut the incidence of cardiovascular disease events in a major clinical trial, CANTOS. A second big trial designed to parallel CANTOS tested methotrexate in roughly the same way and found it produced no cardiovascular disease benefit among high-risk patients.
The CANTOS (Canakinumab Anti-inflammatory Thrombosis Outcome Study) results with canakinumab and the new results with methotrexate “demonstrate that inflammation inhibition [with canakinumab] can significantly reduce cardiovascular event rates independent of lipid lowering and blood pressure reduction,” Paul M. Ridker, MD, said at the American Heart Association scientific sessions. But, “inhibition of the IL [interleukin]–1 beta to IL-6 to CRP [C-reactive protein] pathway of innate immunity appears to be important for atheroprotection,” and was something methotrexate couldn’t deliver, concluded Dr. Ridker, a professor of medicine at Harvard Medical School and director of the Center for Cardiovascular Disease Prevention at Brigham and Women’s Hospital in Boston.
The new results he reported showed that weekly treatment with a single, oral, 15- to 20-mg dose of methotrexate not only had no effect on cardiovascular events but also had no discernible impact on serum levels of IL-1beta (IL-1B), IL-6, or high sensitivity (hs) CRP, in contrast to canakinumab, which Dr. Ridker took as evidence that this inflammatory pathway links to the pathophysiology of atherosclerotic cardiovascular disease.
CIRT (Cardiovascular Inflammation Reduction Trial) randomized 4,786 patients at 417 centers in the United States or Canada. Enrolled patients had to have a history of an MI or documented multivessel coronary disease, and also had to have type 2 diabetes, metabolic syndrome, or both. All patients were maintained on optimized dosages of a statin, aspirin, a beta-blocker, and an angiotensin-converting enzyme inhibitor or angiotensin-receptor blocker. All patients also received 1 mg folate daily. Randomization assigned patients to either receive 15-20 mg methotrexate orally once a week or placebo.
CIRT stopped prematurely because of futility after a median follow-up of 2.3 years. At that time, the incidence of one of two primary endpoints, the combination of cardiovascular death, nonfatal MI, and nonfatal stroke was 3.46/100 person-years with methotrexate treatment and 3.43/100 person-years with placebo, a difference that was not statistically significant. The incidence of the second primary endpoint, which combined the first three types of events plus hospitalization for unstable angina that led to urgent coronary revascularization, occurred in 4.13/100 person-years with methotrexate and 4.31/100 person years with placebo, also a difference that was not statistically significant. Concurrently with this report, the results were published online (N Engl J Med. 2018 Nov 10. doi: 10.1056/NEJMoa1809798).
Analysis of inflammatory markers in the blood after 8 months on treatment showed that methotrexate had no effect on levels of IL-1B, IL-6, and hsCRP. Methotrexate’s lack of an effect on these markers as well as the absence of an effect on cardiovascular disease events contrasted sharply with results that Dr. Ridker and his associates reported a little more than a year earlier in CANTOS. The study’s investigators randomized 10,061 patients with a history of an MI and an elevated serum level of hsCRP, at least 2.0 mg/L. After a median follow-up of 3.7 years, treatment with 150 mg of canakinumab injected subcutaneously once every 3 months produced a 15% relative risk reduction in the combined rate of cardiovascular death, nonfatal MI, and nonfatal stroke, compared with patients treated with placebo, a statistically significant between-group difference (N Engl J Med. 2017 Sep 21;377[12]:1119-31). Canakinumab had no impact on LDL cholesterol levels, but lowered hsCRP levels by more than a third. Dr. Ridker and his associates designed the CIRT and CANTOS trials “in parallel,” he said, and the CIRT results using methotrexate provided a “neutral control” to complement the positive results from canakinumab in CANTOS,
Given its high cost, canakinumab (Ilaris) is not an obviously practical option for treating patients similar to those enrolled in CANTOS, so other candidate agents that inhibit the IL-1B, IL-6, CRP inflammatory pathway are now under study, Dr. Ridker said in an interview. The mechanism of methotrexate’s inhibition of inflammation is unknown, but clearly does not involve this pathway; it may be mediated by adenosine, Dr. Ridker suggested. Canakinumab has Food and Drug Administration approval for treating systemic juvenile idiopathic arthritis and a handful of additional, low-prevalence diseases. Novartis, the company that markets canakinumab, made a submission to the Food and Drug Administration seeking an indication for prevention of cardiovascular disease based on the CANTOS results, and the company said in October 2018 that the FDA denied this request.
The CIRT results also showed a previously unseen signal of a possible safety issue with the tested methotrexate regimen. The incidence of non–basal cell skin cancer was 0.65/100 person-years with methotrexate, compared with 0.24/100 person-years with placebo, a statistically significant difference. Until now, no one had reported a link like this and it requires further analysis, Dr. Ridker said.
CIRT received no commercial funding. Dr. Ridker has been a consultant to Corvidia, Inflazome, and Novartis; he has received research funding from Kowa and Novartis; and his work led to a patent held by Brigham and Women’s Hospital for inflammatory biomarkers licensed to Siemens and AstraZeneca.
SOURCE: Ridker P et al. AHA scientific sessions, Abstract 17778.
REPORTING FROM THE AHA SCIENTIFIC SESSIONS
Key clinical point:
Major finding: The combined rate of CVD events was 3.46/100 person-years on methotrexate and 3.43/100 on placebo.
Study details: CIRT, a multicenter, randomized trial with 4,786 high-risk patients.
Disclosures: CIRT received no commercial funding. Dr. Ridker has been a consultant to Corvidia, Inflazome, and Novartis; he has received research funding from Kowa and Novartis; and his work led to a patent held by Brigham and Women’s Hospital for inflammatory biomarkers licensed to Seimens and AstraZeneca.
Source: Ridker P et al. AHA scientific sessions, Abstract 17778.
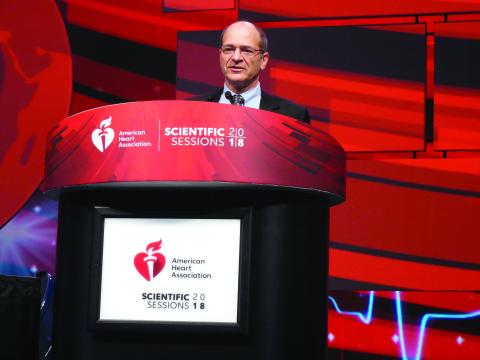
Filgotinib shows efficacy, safety in RA phase 3 and PsA phase 2 trials
CHICAGO – The selective Janus kinase 1 inhibitor filgotinib showed efficacy and safety for patients with rheumatoid arthritis in a phase 3 trial, and efficacy and safety for treating patients with psoriatic arthritis in results from a phase 2 study in two separate reports at the annual meeting of the American College of Rheumatology.
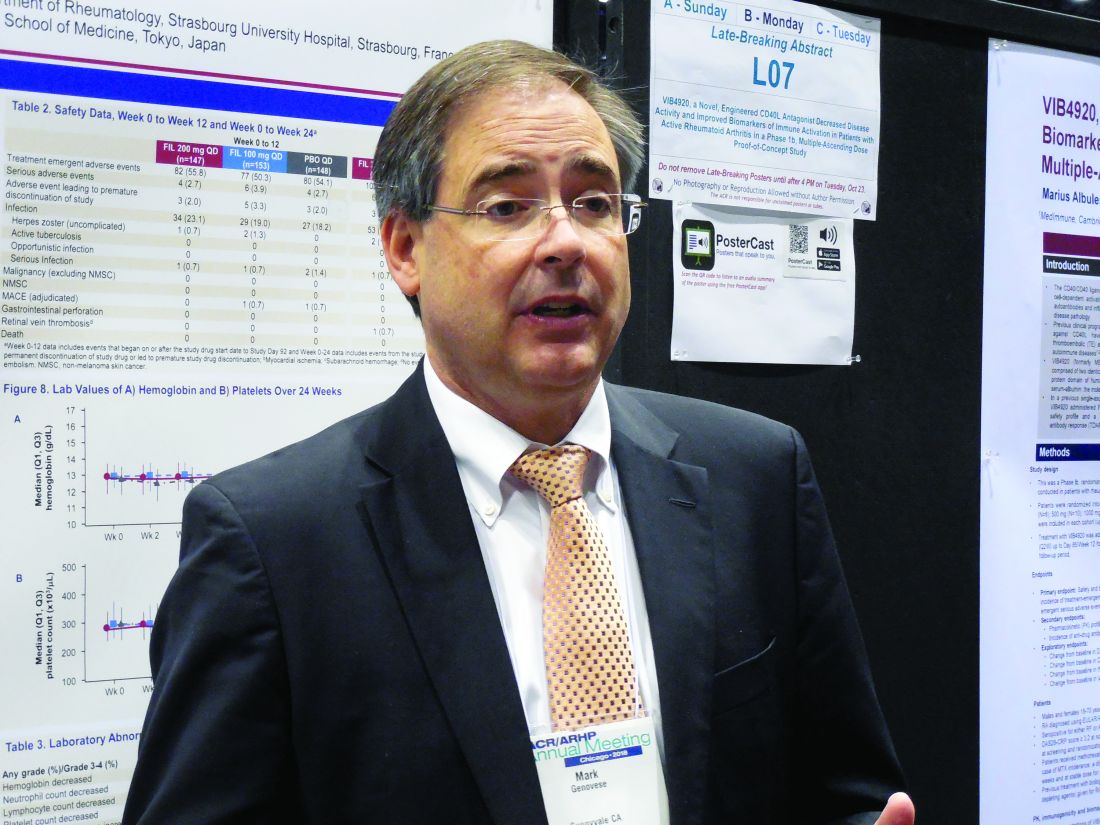
In the phase 3 study, treatment with filgotinib at an oral dosage of 200 mg once daily led to a 66% incidence of American College of Rheumatology 20 (ACR20) responses after 16 weeks of treatment in 147 patients with moderately to severely active rheumatoid arthritis (RA), compared with a 31% rate among 148 patients randomized to receive placebo, a statistically significant improvement for the study’s primary efficacy endpoint, Mark C. Genovese, MD, reported in a poster at the meeting. The rate of ACR20 responses among the 153 RA patients who received 100 mg/day filgotinib was 58%, reported Dr. Genovese, professor of medicine and director of the rheumatology clinic at Stanford (Calif.) University.
After 24 weeks of daily treatment, the longest duration studied in the trial, ACR20 rates were 69%, 55%, and 35% in the 200-mg, 100-mg, and placebo patients, respectively. Dr. Genovese also reported that after 24 weeks on treatment, the rates of patients achieving low disease activity measured by their disease activity score based on 28 joints and C-reactive protein level (DAS28-CRP) were 48%, 38%, and 21%, respectively, and the percentages of patients achieving complete remission at 24 weeks based on their DAS28-CRP scores were 31%, 26%, and 12%, respectively.
“We were incredibly fortunate to see such positive results. The drug worked very well in very-challenging-to-treat patients,” Dr. Genovese said in an interview. All of the RA patients enrolled in the study had not previously responded to or were intolerant of prior treatment with at least one biologic disease-modifying antirheumatic drug (DMARD), and almost a quarter of enrolled patients had failed prior treatment with at least three different biologic DMARDs. The number of biologic DMARDs a patient had previously received showed no relationship to how well patients responded to filgotinib, he noted.
Dr. Genovese also highlighted the relatively high percentage of patients who achieved low disease activity and remission. The 48% and 31% rates, respectively, of low disease activity and remission among patients treated with the higher filgotinib dosage for 24 weeks “is fairly impressive in patients who did not previously respond to a biologic DMARD,” the researcher said. These findings are similar to data previously reported for upadacitinib, another Janus kinase (JAK) inhibitor that, like filgotinib, is selective for the JAK1 receptor, noted Dr. Genovese, who also was the lead investigator for a phase 3 study of upadacitinib in RA patients (Lancet. 2018 June 23;391[10139]:2513-24).
The filgotinib data he presented came from the FINCH 2 (Filgotinib Versus Placebo in Adults With Active Rheumatoid Arthritis Who Have an Inadequate Response to Biologic Disease-Modifying Anti-Rheumatic Drug[s] Treatment) trial, which was run at 104 sites in 15 countries, including the United States. The results also showed a “favorable safety profile and stable laboratory parameters,” Dr. Genovese reported. Results from two additional phase 3 trials in RA patients are expected in 2019, he said.
Filgotinib studied in psoriatic arthritis
The separate, phase 2 study of filgotinib in patients with psoriatic arthritis (PsA) reported during the meeting showed safety “in line with previous reports without new safety signals” in a multicenter trial with 131 patients randomized to receive oral filgotinib 200 mg daily for 16 weeks or placebo, Philip J. Mease, MD, reported in a talk at the meeting. For the primary endpoint of achievement of ACR20 response after 16 weeks, the rate was 80% of the filgotinib-treated patients and 33% of patients in the placebo group, a statistically significant difference, said Dr. Mease, a rheumatologist at Swedish Medical Center in Seattle.

EQUATOR (A Study to Assess Efficacy and Safety of Filgotinib in Active Psoriatic Arthritis) enrolled patients at sites in seven European countries who had “very active” PsA and either a history of or current plaque psoriasis. All patients had to have a history of either insufficient response to or intolerance of at least one conventional synthetic DMARD. The enrollment criteria had no specifications for prior use of an anti–tumor necrosis factor drug, and about 15% of patients had used least one of these drugs. At entry, about three-quarters of patients were on treatment with a conventional synthetic DMARD and about a quarter received treatment with a glucocorticoid.
The results showed statistically significant benefits from filgotinib, compared with placebo, for several other measures of arthritis activity, as well as measures of psoriasis, enthesitis, and pain, Dr. Mease reported. He also highlighted a “lack of meaningful changes in hemoglobin” or other laboratory measures that, along with the efficacy findings, make filgotinib “a promising first step” for patients with PsA. Dr. Mease also noted that roughly concurrently with his report, a separate group of researchers published results from a phase 2 study of filgotinib in patients with ankylosing spondylitis that also found evidence for efficacy and safety during 12 weeks of treating 116 randomized patients (Lancet. 2018 Oct 22. doi: 10.1016/S0140-6736[18]32463-2).
FINCH 2 was sponsored by Galapagos and Gilead, the two companies developing filgotinib. Dr. Genovese has had financial relationships with Galapagos and Gilead and also with AbbVie, Lilly, and Pfizer. Dr. Mease has had financial relationships with Galapagos and Gilead and a dozen other companies.
SOURCES: Genovese M et al. Arthritis Rheumatol. 2018;70(Suppl 10), Abstract L06; Mease P et al. Arthritis Rheumatol. 2018;70(Suppl 10), Abstract 1821.
CHICAGO – The selective Janus kinase 1 inhibitor filgotinib showed efficacy and safety for patients with rheumatoid arthritis in a phase 3 trial, and efficacy and safety for treating patients with psoriatic arthritis in results from a phase 2 study in two separate reports at the annual meeting of the American College of Rheumatology.
In the phase 3 study, treatment with filgotinib at an oral dosage of 200 mg once daily led to a 66% incidence of American College of Rheumatology 20 (ACR20) responses after 16 weeks of treatment in 147 patients with moderately to severely active rheumatoid arthritis (RA), compared with a 31% rate among 148 patients randomized to receive placebo, a statistically significant improvement for the study’s primary efficacy endpoint, Mark C. Genovese, MD, reported in a poster at the meeting. The rate of ACR20 responses among the 153 RA patients who received 100 mg/day filgotinib was 58%, reported Dr. Genovese, professor of medicine and director of the rheumatology clinic at Stanford (Calif.) University.
After 24 weeks of daily treatment, the longest duration studied in the trial, ACR20 rates were 69%, 55%, and 35% in the 200-mg, 100-mg, and placebo patients, respectively. Dr. Genovese also reported that after 24 weeks on treatment, the rates of patients achieving low disease activity measured by their disease activity score based on 28 joints and C-reactive protein level (DAS28-CRP) were 48%, 38%, and 21%, respectively, and the percentages of patients achieving complete remission at 24 weeks based on their DAS28-CRP scores were 31%, 26%, and 12%, respectively.
“We were incredibly fortunate to see such positive results. The drug worked very well in very-challenging-to-treat patients,” Dr. Genovese said in an interview. All of the RA patients enrolled in the study had not previously responded to or were intolerant of prior treatment with at least one biologic disease-modifying antirheumatic drug (DMARD), and almost a quarter of enrolled patients had failed prior treatment with at least three different biologic DMARDs. The number of biologic DMARDs a patient had previously received showed no relationship to how well patients responded to filgotinib, he noted.
Dr. Genovese also highlighted the relatively high percentage of patients who achieved low disease activity and remission. The 48% and 31% rates, respectively, of low disease activity and remission among patients treated with the higher filgotinib dosage for 24 weeks “is fairly impressive in patients who did not previously respond to a biologic DMARD,” the researcher said. These findings are similar to data previously reported for upadacitinib, another Janus kinase (JAK) inhibitor that, like filgotinib, is selective for the JAK1 receptor, noted Dr. Genovese, who also was the lead investigator for a phase 3 study of upadacitinib in RA patients (Lancet. 2018 June 23;391[10139]:2513-24).
The filgotinib data he presented came from the FINCH 2 (Filgotinib Versus Placebo in Adults With Active Rheumatoid Arthritis Who Have an Inadequate Response to Biologic Disease-Modifying Anti-Rheumatic Drug[s] Treatment) trial, which was run at 104 sites in 15 countries, including the United States. The results also showed a “favorable safety profile and stable laboratory parameters,” Dr. Genovese reported. Results from two additional phase 3 trials in RA patients are expected in 2019, he said.
Filgotinib studied in psoriatic arthritis
The separate, phase 2 study of filgotinib in patients with psoriatic arthritis (PsA) reported during the meeting showed safety “in line with previous reports without new safety signals” in a multicenter trial with 131 patients randomized to receive oral filgotinib 200 mg daily for 16 weeks or placebo, Philip J. Mease, MD, reported in a talk at the meeting. For the primary endpoint of achievement of ACR20 response after 16 weeks, the rate was 80% of the filgotinib-treated patients and 33% of patients in the placebo group, a statistically significant difference, said Dr. Mease, a rheumatologist at Swedish Medical Center in Seattle.
EQUATOR (A Study to Assess Efficacy and Safety of Filgotinib in Active Psoriatic Arthritis) enrolled patients at sites in seven European countries who had “very active” PsA and either a history of or current plaque psoriasis. All patients had to have a history of either insufficient response to or intolerance of at least one conventional synthetic DMARD. The enrollment criteria had no specifications for prior use of an anti–tumor necrosis factor drug, and about 15% of patients had used least one of these drugs. At entry, about three-quarters of patients were on treatment with a conventional synthetic DMARD and about a quarter received treatment with a glucocorticoid.
The results showed statistically significant benefits from filgotinib, compared with placebo, for several other measures of arthritis activity, as well as measures of psoriasis, enthesitis, and pain, Dr. Mease reported. He also highlighted a “lack of meaningful changes in hemoglobin” or other laboratory measures that, along with the efficacy findings, make filgotinib “a promising first step” for patients with PsA. Dr. Mease also noted that roughly concurrently with his report, a separate group of researchers published results from a phase 2 study of filgotinib in patients with ankylosing spondylitis that also found evidence for efficacy and safety during 12 weeks of treating 116 randomized patients (Lancet. 2018 Oct 22. doi: 10.1016/S0140-6736[18]32463-2).
FINCH 2 was sponsored by Galapagos and Gilead, the two companies developing filgotinib. Dr. Genovese has had financial relationships with Galapagos and Gilead and also with AbbVie, Lilly, and Pfizer. Dr. Mease has had financial relationships with Galapagos and Gilead and a dozen other companies.
SOURCES: Genovese M et al. Arthritis Rheumatol. 2018;70(Suppl 10), Abstract L06; Mease P et al. Arthritis Rheumatol. 2018;70(Suppl 10), Abstract 1821.
CHICAGO – The selective Janus kinase 1 inhibitor filgotinib showed efficacy and safety for patients with rheumatoid arthritis in a phase 3 trial, and efficacy and safety for treating patients with psoriatic arthritis in results from a phase 2 study in two separate reports at the annual meeting of the American College of Rheumatology.
In the phase 3 study, treatment with filgotinib at an oral dosage of 200 mg once daily led to a 66% incidence of American College of Rheumatology 20 (ACR20) responses after 16 weeks of treatment in 147 patients with moderately to severely active rheumatoid arthritis (RA), compared with a 31% rate among 148 patients randomized to receive placebo, a statistically significant improvement for the study’s primary efficacy endpoint, Mark C. Genovese, MD, reported in a poster at the meeting. The rate of ACR20 responses among the 153 RA patients who received 100 mg/day filgotinib was 58%, reported Dr. Genovese, professor of medicine and director of the rheumatology clinic at Stanford (Calif.) University.
After 24 weeks of daily treatment, the longest duration studied in the trial, ACR20 rates were 69%, 55%, and 35% in the 200-mg, 100-mg, and placebo patients, respectively. Dr. Genovese also reported that after 24 weeks on treatment, the rates of patients achieving low disease activity measured by their disease activity score based on 28 joints and C-reactive protein level (DAS28-CRP) were 48%, 38%, and 21%, respectively, and the percentages of patients achieving complete remission at 24 weeks based on their DAS28-CRP scores were 31%, 26%, and 12%, respectively.
“We were incredibly fortunate to see such positive results. The drug worked very well in very-challenging-to-treat patients,” Dr. Genovese said in an interview. All of the RA patients enrolled in the study had not previously responded to or were intolerant of prior treatment with at least one biologic disease-modifying antirheumatic drug (DMARD), and almost a quarter of enrolled patients had failed prior treatment with at least three different biologic DMARDs. The number of biologic DMARDs a patient had previously received showed no relationship to how well patients responded to filgotinib, he noted.
Dr. Genovese also highlighted the relatively high percentage of patients who achieved low disease activity and remission. The 48% and 31% rates, respectively, of low disease activity and remission among patients treated with the higher filgotinib dosage for 24 weeks “is fairly impressive in patients who did not previously respond to a biologic DMARD,” the researcher said. These findings are similar to data previously reported for upadacitinib, another Janus kinase (JAK) inhibitor that, like filgotinib, is selective for the JAK1 receptor, noted Dr. Genovese, who also was the lead investigator for a phase 3 study of upadacitinib in RA patients (Lancet. 2018 June 23;391[10139]:2513-24).
The filgotinib data he presented came from the FINCH 2 (Filgotinib Versus Placebo in Adults With Active Rheumatoid Arthritis Who Have an Inadequate Response to Biologic Disease-Modifying Anti-Rheumatic Drug[s] Treatment) trial, which was run at 104 sites in 15 countries, including the United States. The results also showed a “favorable safety profile and stable laboratory parameters,” Dr. Genovese reported. Results from two additional phase 3 trials in RA patients are expected in 2019, he said.
Filgotinib studied in psoriatic arthritis
The separate, phase 2 study of filgotinib in patients with psoriatic arthritis (PsA) reported during the meeting showed safety “in line with previous reports without new safety signals” in a multicenter trial with 131 patients randomized to receive oral filgotinib 200 mg daily for 16 weeks or placebo, Philip J. Mease, MD, reported in a talk at the meeting. For the primary endpoint of achievement of ACR20 response after 16 weeks, the rate was 80% of the filgotinib-treated patients and 33% of patients in the placebo group, a statistically significant difference, said Dr. Mease, a rheumatologist at Swedish Medical Center in Seattle.
EQUATOR (A Study to Assess Efficacy and Safety of Filgotinib in Active Psoriatic Arthritis) enrolled patients at sites in seven European countries who had “very active” PsA and either a history of or current plaque psoriasis. All patients had to have a history of either insufficient response to or intolerance of at least one conventional synthetic DMARD. The enrollment criteria had no specifications for prior use of an anti–tumor necrosis factor drug, and about 15% of patients had used least one of these drugs. At entry, about three-quarters of patients were on treatment with a conventional synthetic DMARD and about a quarter received treatment with a glucocorticoid.
The results showed statistically significant benefits from filgotinib, compared with placebo, for several other measures of arthritis activity, as well as measures of psoriasis, enthesitis, and pain, Dr. Mease reported. He also highlighted a “lack of meaningful changes in hemoglobin” or other laboratory measures that, along with the efficacy findings, make filgotinib “a promising first step” for patients with PsA. Dr. Mease also noted that roughly concurrently with his report, a separate group of researchers published results from a phase 2 study of filgotinib in patients with ankylosing spondylitis that also found evidence for efficacy and safety during 12 weeks of treating 116 randomized patients (Lancet. 2018 Oct 22. doi: 10.1016/S0140-6736[18]32463-2).
FINCH 2 was sponsored by Galapagos and Gilead, the two companies developing filgotinib. Dr. Genovese has had financial relationships with Galapagos and Gilead and also with AbbVie, Lilly, and Pfizer. Dr. Mease has had financial relationships with Galapagos and Gilead and a dozen other companies.
SOURCES: Genovese M et al. Arthritis Rheumatol. 2018;70(Suppl 10), Abstract L06; Mease P et al. Arthritis Rheumatol. 2018;70(Suppl 10), Abstract 1821.
REPORTING FROM THE ACR ANNUAL MEETING