User login
Unexpected link between light drinking and dementia risk
new research suggests.
Investigators assessed dementia risk using changes in alcohol consumption over a 2-year period in nearly 4 million people in South Korea. After about 7 years, dementia was 21% less likely in mild drinkers and 17% less likely in moderate drinkers. Heavy drinking was linked to an 8% increased risk.
Other studies of the relationship between alcohol and dementia have yielded mixed results, and this study does little to clear those murky waters. Nor do the results mean that drinking is recommended, the investigators note.
But the study does offer new information on how risk changes over time as people change their drinking habits, lead investigator Keun Hye Jeon, MD, assistant professor of family medicine at Cha Gumi Medical Center at Cha University, Gumi, South Korea, told this news organization.
“Although numerous studies have shown a relationship between alcohol consumption and dementia, there is a paucity of understanding as to how the incidence of dementia changes with changes in drinking habits,” Dr. Jeon said.
“By measuring alcohol consumption at two time points, we were able to study the relationship between reducing, ceasing, maintaining, and increasing alcohol consumption and incident dementia,” he added.
The findings were published online in JAMA Network Open.
Tracking drinking habits
Researchers analyzed data from nearly 4 million individuals aged 40 years and older in the Korean National Health Insurance Service who completed questionnaires and underwent physical exams in 2009 and 2011.
Study participants completed questionnaires on their drinking habits and were assigned to one of five groups according to change in alcohol consumption during the study period. These groups consisted of sustained nondrinkers; those who stopped drinking (quitters); those who reduced their consumption of alcohol but did not stop drinking (reducers); those who maintained the same level of consumption (sustainers); and those who increased their level of consumption (increasers).
A standard drink in the United States contains 14 g of alcohol. For this study, mild drinking was defined as less than 15 g/day, or one drink; moderate consumption as 15-29.9 g/day, or one to two drinks; and heavy drinking as 30 g/day or more, or three or more drinks.
At baseline, 54.8% of participants were nondrinkers, 26.7% were mild drinkers, 11.0% were moderate drinkers, and 7.5% were heavy drinkers.
From 2009 to 2011, 24.2% of mild drinkers, 8.4% of moderate drinkers, and 7.6% of heavy drinkers became quitters. In the same period, 13.9% of nondrinkers, 16.1% of mild drinkers, and 17.4% of moderate drinkers increased their drinking level.
After a mean follow-up of 6.3 years, 2.5% of participants were diagnosed with dementia, 2.0% with Alzheimer’s disease, and 0.3% with vascular dementia.
Unexpected finding
Compared with consistently not drinking, mild and moderate alcohol consumption was associated with a 21% (adjust hazard ratio, 0.79; 95% confidence interval, 0.77-0.81) and 17% (aHR, 0.83; 95% CI, 0.79-0.88) decreased risk for dementia, respectively.
Heavy drinking was linked to an 8% increased risk (aHR, 1.08; 95% CI, 1.03-1.12).
Similar associations were found between alcohol consumption and risk for Alzheimer’s disease and vascular dementia.
Reducing drinking habits from heavy to moderate led to a reduction in risk for dementia and Alzheimer’s, and increasing drinking levels led to an increase in risk for both conditions.
But when the researchers analyzed dementia risk for nondrinkers who began drinking at mild levels during the study period, they found something unexpected – the risk in this group decreased by 7% for dementia (aHR, 0.93; 95% CI, 0.90-0.96) and by 8% for Alzheimer’s (aHR, 0.92; 95% CI, 0.89-0.95), compared with sustained mild drinkers.
“Our study showed that initiation of mild alcohol consumption leads to a reduced risk of all-cause dementia and Alzheimer’s disease, which has never been reported in previous studies,” Dr. Jeon said.
However, Dr. Jeon was quick to point out that this doesn’t mean that people who don’t drink should start.
Previous studies have shown that heavy alcohol use can triple an individual’s dementia risk, while other studies have shown that no amount of alcohol consumption is good for the brain.
“None of the existing health guidelines recommend starting alcohol drinking,” Dr. Jeon said. “Our findings regarding an initiation of mild alcohol consumption cannot be directly translated into clinical recommendations,” but the findings do warrant additional study, he added.
Risks persist
Commenting on the findings, Percy Griffin, PhD, director of scientific engagement for the Alzheimer’s Association in Chicago, agrees.
“While this study is interesting, and this topic deserves further study, no one should drink alcohol as a method of reducing risk of Alzheimer’s disease or other dementia based on this study,” said Dr. Griffin, who was not part of the study.
The exact tipping point in alcohol consumption that can lead to problems with cognition or increased dementia risk is unknown, Dr. Griffin said. Nor do researchers understand why mild drinking may have a protective effect.
“We do know, however, that excessive alcohol consumption has negative effects on heart health and general health, which can lead to problems with brain function,” he said. “Clinicians should have discussions with their patients around their alcohol consumption patterns and the risks associated with drinking in excess, including potential damage to their cognition.”
Funding for the study was not disclosed. Dr. Jeon and Dr. Griffin report no relevant financial relationships.
A version of this article first appeared on Medscape.com.
FROM JAMA NETWORK OPEN
Doc never met patient who died from insect bite, but negligence suit moves forward; more
On-call specialist incurred a clear ‘duty of care,’ court rules
a state appeals court ruled late in January.
The appeals decision is the result of a case involving the late Dennis Blagden.
On July 26, 2017, Mr. Blagden arrived at the Graham Hospital ED, in Canton, Ill., complaining of neck pain and an insect bite that had resulted in a swollen elbow. His ED doctor, Matthew McMillin, MD, who worked for Coleman Medical Associates, ordered tests and prescribed an anti-inflammatory pain medication and a muscle relaxant.
Dr. McMillin consulted via telephone with Kenneth Krock, MD, an internal medicine specialist and pediatrician, who was on call that day and who enjoyed admitting privileges at Graham. (Krock was also an employee of Coleman Medical Associates, which provided clinical staffing for the hospital.)
Dr. Krock had final admitting authority in this instance. Court records show that Dr. McMillin and he agreed that the patient could be discharged from the ED, despite Krock’s differential diagnosis indicating a possible infection.
Three days later, now with “hypercapnic respiratory failure, sepsis, and an altered mental state,” Mr. Blagden was again seen at the Graham Hospital ED. Mr. Blagden underwent intubation by Dr. McMillin, his original ED doctor, and was airlifted to Methodist Medical Center, in Peoria, 30 miles away. There, an MRI showed that he’d developed a spinal epidural abscess. On Aug. 7, 2017, a little over a week after his admission to Methodist, Mr. Blagden died from complications of his infection.
In January 2019, Mr. Blagden’s wife, Judy, filed a suit against Dr. McMillin, his practice, and Graham Hospital, which is a part of Graham Health System. Her suit alleged medical negligence in the death of her husband.
About 6 months later, Mr.s Blagden amended her original complaint, adding a second count of medical negligence against Dr. Krock; his practice and employer, Coleman Medical Associates; and Graham Hospital. In her amended complaint, Mrs. Blagden alleged that although Krock hadn’t actually seen her husband Dennis, his consultation with Dr. McMillin was sufficient to establish a doctor-patient relationship and thus a legal duty of care. That duty, Mrs. Blagden further alleged, was breached when Dr. Krock failed both to rule out her husband’s “infectious process” and to admit him for proper follow-up monitoring.
In July 2021, after the case had been transferred from Peoria County to Fulton County, Dr. Krock cried foul. In a motion to the court for summary judgment – that is, a ruling prior to an actual trial – he and his practice put forth the following argument: As a mere on-call consultant that day in 2017, he had neither seen the patient nor established a relationship with him, thereby precluding his legal duty of care.
The trial court judge agreed and granted both Dr. Krock and Dr. Coleman the summary judgment they had sought.
Mrs. Blagden then appealed to the Appellate Court of Illinois, Fourth District, which is located in Springfield.
In its unanimous decision, the three-judge panel reversed the lower court’s ruling. Taking direct aim at Dr. Krock’s earlier motion, Justice Eugene Doherty, who wrote the panel’s opinion, said that state law had long established that “the special relationship giving rise to a duty of care may exist even in the absence of any meeting between the physician and the patient where the physician performs specific services for the benefit of the patient.”
As Justice Doherty explained, Dr. Krock’s status that day as both the on-call doctor and the one with final admitting authority undermined his argument for summary judgment. Also undermining it, Justice Doherty added, was the fact that the conversation between the two doctors that day in 2017 was a formal exchange “contemplated by hospital bylaws.”
“While public policy should encourage informal consultations between physicians,” the justice continued, “it must not ignore actual physician involvement in decisions that directly affect a patient’s care.”
Following the Fourth District decision, the suit against Dr. McMillin, Dr. Krock, and the other defendants has now been tossed back to the trial court for further proceedings. At press time, no trial date had been set.
Will this proposed damages cap help retain more physicians?
Fear of a doctor shortage, triggered in part by a recent history of large payouts, has prompted Iowa lawmakers to push for new state caps on medical malpractice awards, as a story in the Des Moines Register reports.
Currently, Iowa caps most noneconomic damages – including those for pain and suffering – at $250,000, which is among the lowest such caps in the nation.
Under existing Iowa law, however, the limit doesn’t apply in extraordinary cases – that is, those involving “substantial or permanent loss of body function, substantial disfigurement, or death.” It also isn’t applicable in cases in which a jury decides that a defendant acted with intentional malice.
Lawmakers and Iowa Gov. Kim Reynolds would like to change this.
Under a Senate bill that has now passed out of committee and is awaiting debate on the Senate floor, even plaintiffs involved in extreme cases would receive no more than $1 million to compensate for their pain, suffering, or emotional distress. (The bill also includes a 2.1% annual hike to compensate for inflation. A similar bill, which adds “loss of pregnancy” to the list of extreme cases, has advanced to the House floor.)
Supporters say the proposed cap would help to limit mega awards. In Johnson County in March 2022, for instance, a jury awarded $97.4 million to the parents of a young boy who sustained severe brain injuries during his delivery, causing the clinic that had been involved in the case to file for bankruptcy. This award was nearly three times the total payouts ($35 million) in the entire state of Iowa in all of 2021, a year in which there were 192 closed claims, including at least a dozen that resulted in payouts of $1 million or more.
Supporters also think the proposed cap will mitigate what they see as a looming doctor shortage, especially among ob.gyns. in eastern Iowa. “I just cannot overstate how much this is affecting our workforce, and that turns into effects for the women and the children, the babies, in our state,” Shannon Leveridge, MD, an obstetrician in Davenport said. “In order to keep these women and their babies safe, we need doctors.”
But critics of the bill, including some lawmakers and the trial bar, say it overreaches, even in the case of the $97.4 million award.
“They don’t want to talk about the actual damages that are caused by medical negligence,” explained a spokesman for the trial lawyers. “So, you don’t hear about the fact that, of the $50 million of economic damages ... most of that is going to go to the 24/7 care for this child for the rest of his life.”
A version of this article first appeared on Medscape.com.
The five biggest changes in the 2023 adult vaccine schedules
This transcript has been edited for clarity.
Hello. I’m Dr Sandra Fryhofer. Welcome to Medicine Matters.
It’s a new year, which means a new ACIP adult immunization schedule – a valuable resource collating ACIP’s most up-to-date vaccination recommendations.
Here are this year’s five most important changes:
- COVID vaccines now front and center
- New emphasis on polio vaccination
- Inclusion of some nonvaccine products (such as monoclonal antibody products)
- Pharmacists group has approved the schedule for the first time
- New shared clinical decision-making option for pneumococcal vaccines
The schedule’s organization remains the same. It still has four sections:
- Table 1: vaccinations by age
- Table 2: vaccinations by medical condition and other indications
- The Notes section (alphabetically ordered by vaccine type)
- Appendix listing of vaccine-specific contraindications and precautions
But what’s unique this year is that some of the abbreviations have historical implications. The first change is no big surprise in light of what we’ve gone through in the past few years. COVID vaccines are listed first on the cover page by brand name for those authorized and by company name for those still under US emergency use authorization. They’re also listed first on the graphics and in the notes.
COVID and mRNA and protein-based vaccines have now been assigned official abbreviations based on vaccine platform and valency.
- 1vCOV-mRNA: Comirnaty/Pfizer-BioNTech and Spikevax Moderna COVID-19 vaccines
- 2vCOV-mRNA: Pfizer-BioNTech and Moderna bivalent COVID-19 vaccines
- 1vCOV-aPS: Novavax COVID-19 vaccine
Also remarkable is the absence of COVID viral vector vaccines on the list. However, the viral vector COVID vaccine (which has been available but is not preferred) does have a CDC website link in the Notes section.
A sad but necessary inclusion was triggered by recent polio cases in New York. Polio was believed to be eradicated, and we thought adults no longer needed to be vaccinated against polio. In the new schedule, the polio vaccine is listed on the cover page but is not included in the tables. Current polio vaccination recommendations are now in the Notes section.
Also of historical significance and something that may set a precedent is the inclusion of nonvaccine products. The value of COVID preexposure prophylaxis with products including monoclonal antibodies (such as Evusheld) for people who are moderately or severely immunocompromised is mentioned in the Notes section.
For the first time ever, the schedule has been approved by the American Pharmacists Association, which validates pharmacists as established partners in vaccine administration.
Color-code key
One aspect of the schedule that has not changed is the color-code key:
- Yellow: Recommended if the patient meets the age requirement
- Purple: Indicated for those with additional risk factors or another indication
- Blue: Recommended based on shared clinical decision-making
- Orange: Precaution
- Red: Contraindicated or not recommended; the vaccine should not be administered. Overlays on the red more precisely clarify whether a vaccine is really contraindicated or just not recommended. An asterisk on red means vaccinate after pregnancy if indicated.
- Gray: No recommendation or not applicable
Vaccinations by age
Table 1 lists recommended vaccinations by age. There is one major change. COVID vaccines are on the first row of the graphic, with the need for both a primary series and boosters emphasized on the overlay. The notes have hyperlinks to the most up-to-date COVID vaccination recommendations.
Pneumococcal vaccination. Pneumococcal vaccination is routinely recommended starting at age 65. Current recommendations for those not previously vaccinated have not changed since last year. But on Table 1, the bottom half of the row for those 65 or older is now blue (and that’s new). This new color blue means shared clinical decision-making and applies to people who were previously considered fully vaccinated with the now extinct combination of PCV13 and PPSV23. These patients now have the option of getting a dose of PCV20 five years after completing their PCV13-PPSV23 combo series. This option is blue because the decision is up to you and your patient.
Check the notes for more pneumococcal vaccination details. For example, for those partially vaccinated using lower valency vaccines, there’s an option of substituting PCV20 for PPSV23 to broaden and increase durability of protection.
The pneumococcal vaccination recommendation options are complicated. A new pneumococcal vaccination app can help.
Hepatitis B. For adults under age 60, the color code for the hepatitis B vaccine is yellow, meaning it’s indicated for all. For older patients, the color code is purple. If a patient who is age 60 or older wants the hepatitis B vaccine, they can have it even in the absence of additional risk indications.
Vaccinations by medical condition or other indications
Other than a few minor word changes on the overlay, the only thing that’s new is the COVID vaccine row.
This table is helpful for matching vaccine recommendations with specific medical conditions, including pregnancy, immunocompromise, HIV (with specifics according to CD4 count), asplenia, complement deficiencies, heart disease, lung disease, alcoholism, chronic liver disease, diabetes, health care personnel, and men who have sex with men.
Use this table to dot the i’s and cross the t’s when it comes to vaccination recommendations. For example, take a look at the pregnancy column. Live virus vaccines, including LAIV, MMR, and varicella, are contraindicated and color-coded red. MMR and varicella also have an asterisk, meaning vaccinate after pregnancy if indicated. HPV vaccines are not live virus vaccines, but the overlay says they are not recommended during pregnancy. The asterisk indicates that you can vaccinate after pregnancy.
Vaccine notes
The notes are in alphabetical order, and their organization (routine, special situations, and shared clinical decision-making when indicated) has not changed. They are concise and succinct, but sometimes they’re not enough. That’s why vaccine-specific links to more complete recommendations are so convenient.
Notes for hepatitis B contain nuances on specific dosing for vaccinating patients on dialysis, as well as a reminder that newer hepatitis C vaccines such as Heplisav and PreHevbrio are not recommended during pregnancy due to lack of safety data.
For influenza, everyone 6 months or older still needs yearly flu vaccination with an age- and health-appropriate flu vaccine. But for those aged 65 or older, the notes specify the three vaccine versions now preferred: high-dose, recombinant, or adjuvanted versions. However, if these aren’t available, it’s better to get any flu vaccine than to go without.
Under meningococcal vaccines, the notes for MenACWY and MenB are combined. For MenB, trade names Bexsero and Trumenba are specified because the products are not interchangeable. Booster intervals for those still at risk are different for each vaccine type: every 5 years for MenACWY boosters, and every 2-3 years for boosts of MenB.
The recent polio cases in New York have put polio vaccination in the spotlight. ACIP has now reinstated its Polio Vaccine Work Group. The new schedule lists polio vaccines on the cover page. Current recommendations have been added to the notes section. Routine vaccination for adults is not necessary, at least for now. However, those at increased risk for exposure to polio fall in the special-situation category. For those at increased risk who have completed a polio vaccine series, a single lifetime IPV booster can be given. For those at increased risk who have not completed their polio vaccine series, now would be the time to finish the series.
Appendix
The final step in using the new schedule is checking the appendix and its list of vaccine-specific contraindications and precautions.
I hope this review of the new ACIP adult immunization schedule has been helpful. For Medicine Matters, I’m Dr. Sandra Fryhofer.
Dr. Fryhofer is clinical associate professor of medicine, Emory University, Atlanta. She reported numerous conflicts of interest.
A version of this article first appeared on Medscape.com.
Finding catatonia requires knowing what to look for
Catatonia is a psychomotor syndrome identified by its clinical phenotype. Unlike common psychiatric syndromes such as major depression that are characterized by self-report of symptoms, catatonia is identified chiefly by empirically evaluated signs on clinical evaluation. Its signs are recognized through observation, physical examination, or elicitation by clinical maneuvers or the presentation of stimuli. However, catatonia is often overlooked even though its clinical signs are often visibly apparent, including to the casual observer.
Why is catatonia underdiagnosed? A key modifiable factor appears to be a prevalent misunderstanding over what catatonia looks like.1 We have sought to address this in a few ways.

First identified was the need for comprehensive educational resources on how to assess for and recognize catatonia. Using the Bush-Francis Catatonia Rating Scale – the most widely used scale for catatonia in both research and clinical settings and the most cited publication in the catatonia literature – our team developed the BFCRS Training Manual and Coding Guide.2,3 This manual expands on the definitions of each BFCRS item based on how it was originally operationalized by the scale’s authors. Subsequently, we created a comprehensive set of educational resources including videos illustrating how to assess for catatonia, a video for each of the 23 items on the BFCRS, and self-assessment tools. All resources are freely available online at https://bfcrs.urmc.edu.4
Through this project it became apparent that there are many discrepancies across the field regarding the phenotype of catatonia. Specifically, a recent review inspired by this project set about to characterize the scope of distinctions across diagnostic systems and rating scales.5 For instance, each diagnostic system and rating scale includes a unique set of signs, approaches diagnostic thresholds differently, and often operationalizes clinical features in ways that lead either to criterion overlap (for example, combativeness would be scored both as combativeness and agitation on ICD-11) or contradictions with other systems or scales (for example, varied definitions of waxy flexibility). In the face of so many inconsistencies, what is a clinician to do? What follows is a discussion of how to apply the insights from this recent review in clinical and research settings.

Starting with DSM-5-TR and ICD-11 – the current editions of the two leading diagnostic systems – one might ask: How do they compare?6,7 Overall, these two systems are broadly aligned in terms of the catatonic syndrome. Both systems identify individual clinical signs (as opposed to symptom complexes). Both require three features as a diagnostic threshold. Most of the same clinical signs are included in both systems, and the definitions of individual items are largely equivalent. Additionally, both systems allow for diagnosis of catatonia in association with psychiatric and medical conditions and include a category for unspecified catatonia.
Despite these core agreements, though, there are several important distinctions. First, whereas all 12 signs included in DSM-5-TR count toward an ICD-11 catatonia diagnosis, the opposite cannot be said. ICD-11 includes several features that are not in DSM-5-TR: rigidity, verbigeration, withdrawal, staring, ambitendency, impulsivity, and combativeness. Next, autonomic abnormality, which signifies the most severe type of catatonia called malignant catatonia, is included as a potential comorbidity in ICD-11 but not mentioned in DSM-5-TR. Third, ICD-11 includes a separate diagnosis for substance-induced catatonia, whereas this condition would be diagnosed as unspecified catatonia in DSM-5-TR.
There are also elements missing from both systems. The most notable of these is that neither system specifies the period over which findings must be present for diagnosis. By clinical convention, the practical definition of 24 hours is appropriate in most instances. The clinical features identified during direct evaluation are usually sufficient for diagnosis, but additional signs observed or documented over the prior 24 hours should be incorporated as part of the clinical evaluation. Another distinction is how to handle clinical features before and after lorazepam challenge. As noted in the BFCRS Training Manual, it would be appropriate to compare “state assessments” (that is, restricted to features identified only during direct, in-person assessment) from before and after lorazepam administration to document improvement.4
Whereas DSM-5-TR and ICD-11 are broadly in agreement, comparing these systems with catatonia rating scales reveals many sources of potential confusion, but also concrete guidance on operationalizing individual items.5 How exactly should each of catatonia’s clinical signs be defined? Descriptions differ, and thresholds of duration and frequency vary considerably across scales. As a result, clinicians who use different scales and then convert these results to diagnostic criteria are liable to come to different clinical conclusions. For instance, both echophenomena and negativism must be elicited more than five times to be scored per Northoff,8 but even a single convincing instance of either would be scored on the BFCRS as “occasional.”2
Such discrepancies are important because, whereas the psychometric properties of several catatonia scales have been documented, there are no analogous studies on the DSM-5-TR and ICD-11 criteria. Therefore, it is essential for clinicians and researchers to document how diagnostic criteria have been operationalized. The most practical and evidence-based way to do this is to use a clinically validated scale and convert these to diagnostic criteria, yet in doing so a few modifications will be necessary.
Of the available clinical scales, the BFCRS is best positioned for clinical use. The BFCRS has been validated clinically and has good reliability, detailed item definitions and audiovisual examples available. In addition, it is the only scale with a published semistructured evaluation (see initial paper and Training Manual), which takes about 5 minutes.2,4 In terms of utility, all 12 signs included by DSM-5-TR are among the first 14 items on the BFCRS, which constitutes a standalone tool known as the Bush-Francis Catatonia Screening Instrument (BFCSI, see Table).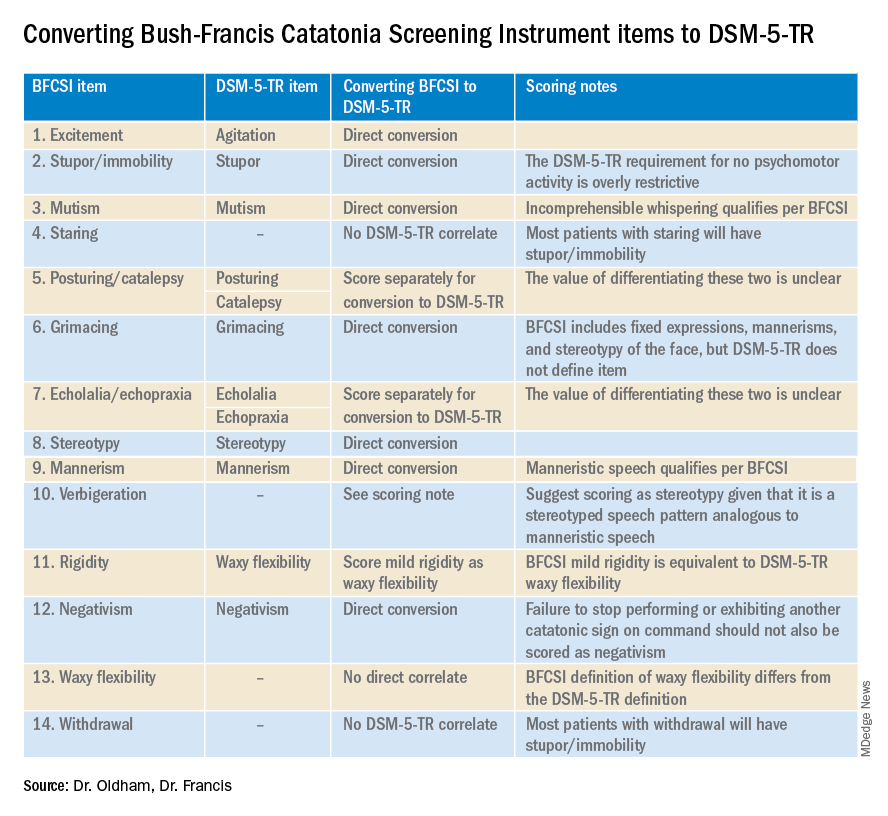
Many fundamental questions remain about catatonia,but the importance of a shared understanding of its clinical features is clear.9 Catatonia should be on the differential whenever a patient exhibits a markedly altered level of activity or grossly abnormal behavior, especially when inappropriate to context. We encourage readers to familiarize themselves with the phenotype of catatonia through online educational resources4 because the optimal care of patients with catatonia requires – at a minimum – that we know what we’re looking for.
Dr. Oldham is assistant professor of psychiatry at the University of Rochester (N.Y.) Medical Center. Dr. Francis is professor of psychiatry at Penn State University, Hershey. The authors declare no relevant conflicts of interest. Funding for the educational project hosted at https://bfcrs.urmc.edu was provided by the department of psychiatry at the University of Rochester Medical Center. Dr. Oldham is currently supported by a K23 career development award from the National Institute on Aging (AG072383). The educational resources referenced in this piece could not have been created were it not for the intellectual and thespian collaboration of Joshua R. Wortzel, MD, who is currently a fellow in child and adolescent psychiatry at Brown University, Providence, R.I. The authors are also indebted to Hochang B. Lee, MD, for his gracious support of this project.
References
1. Wortzel JR et al. J Clin Psychiatry. 2021 Aug 17;82(5):21m14025. doi: 10.4088/JCP.21m14025.
2. Bush G et al. Acta Psychiatr Scand. 1996 Feb;93(2):129-36. doi: 10.1111/j.1600-0447.1996.tb09814.x.
3. Weleff J et al. J Acad Consult Liaison Psychiatry. 2023 Jan-Feb;64(1):13-27. doi:10.1016/j.jaclp.2022.07.002.
4. Oldham MA et al. Bush-Francis Catatonia Rating Scale Assessment Resources. University of Rochester Medical Center, Department of Psychiatry. https://bfcrs.urmc.edu.
5. Oldham MA. Schizophr Res. 2022 Aug 19;S0920-9964(22)00294-8. doi: 10.1016/j.schres.2022.08.002.
6. American Psychiatric Association. Diagnostic and statistical manual of mental disorders: DSM-5-TR. Washington, D.C.: American Psychiatric Association Publishing, 2022.
7. World Health Organization. ICD-11 for Mortality and Morbidity Stastistics. 2022. https://icd.who.int/browse11/l-m/en#/http://id.who.int/icd/entity/486722075.
8. Northoff G et al. Mov Disord. May 1999;14(3):404-16. doi: 10.1002/1531-8257(199905)14:3<404::AID-MDS1004>3.0.CO;2-5.
9. Walther S et al. The Lancet Psychiatry. 2019 Jul;6(7):610-9. doi: 10.1016/S2215-0366(18)30474-7.
Catatonia is a psychomotor syndrome identified by its clinical phenotype. Unlike common psychiatric syndromes such as major depression that are characterized by self-report of symptoms, catatonia is identified chiefly by empirically evaluated signs on clinical evaluation. Its signs are recognized through observation, physical examination, or elicitation by clinical maneuvers or the presentation of stimuli. However, catatonia is often overlooked even though its clinical signs are often visibly apparent, including to the casual observer.
Why is catatonia underdiagnosed? A key modifiable factor appears to be a prevalent misunderstanding over what catatonia looks like.1 We have sought to address this in a few ways.
First identified was the need for comprehensive educational resources on how to assess for and recognize catatonia. Using the Bush-Francis Catatonia Rating Scale – the most widely used scale for catatonia in both research and clinical settings and the most cited publication in the catatonia literature – our team developed the BFCRS Training Manual and Coding Guide.2,3 This manual expands on the definitions of each BFCRS item based on how it was originally operationalized by the scale’s authors. Subsequently, we created a comprehensive set of educational resources including videos illustrating how to assess for catatonia, a video for each of the 23 items on the BFCRS, and self-assessment tools. All resources are freely available online at https://bfcrs.urmc.edu.4
Through this project it became apparent that there are many discrepancies across the field regarding the phenotype of catatonia. Specifically, a recent review inspired by this project set about to characterize the scope of distinctions across diagnostic systems and rating scales.5 For instance, each diagnostic system and rating scale includes a unique set of signs, approaches diagnostic thresholds differently, and often operationalizes clinical features in ways that lead either to criterion overlap (for example, combativeness would be scored both as combativeness and agitation on ICD-11) or contradictions with other systems or scales (for example, varied definitions of waxy flexibility). In the face of so many inconsistencies, what is a clinician to do? What follows is a discussion of how to apply the insights from this recent review in clinical and research settings.
Starting with DSM-5-TR and ICD-11 – the current editions of the two leading diagnostic systems – one might ask: How do they compare?6,7 Overall, these two systems are broadly aligned in terms of the catatonic syndrome. Both systems identify individual clinical signs (as opposed to symptom complexes). Both require three features as a diagnostic threshold. Most of the same clinical signs are included in both systems, and the definitions of individual items are largely equivalent. Additionally, both systems allow for diagnosis of catatonia in association with psychiatric and medical conditions and include a category for unspecified catatonia.
Despite these core agreements, though, there are several important distinctions. First, whereas all 12 signs included in DSM-5-TR count toward an ICD-11 catatonia diagnosis, the opposite cannot be said. ICD-11 includes several features that are not in DSM-5-TR: rigidity, verbigeration, withdrawal, staring, ambitendency, impulsivity, and combativeness. Next, autonomic abnormality, which signifies the most severe type of catatonia called malignant catatonia, is included as a potential comorbidity in ICD-11 but not mentioned in DSM-5-TR. Third, ICD-11 includes a separate diagnosis for substance-induced catatonia, whereas this condition would be diagnosed as unspecified catatonia in DSM-5-TR.
There are also elements missing from both systems. The most notable of these is that neither system specifies the period over which findings must be present for diagnosis. By clinical convention, the practical definition of 24 hours is appropriate in most instances. The clinical features identified during direct evaluation are usually sufficient for diagnosis, but additional signs observed or documented over the prior 24 hours should be incorporated as part of the clinical evaluation. Another distinction is how to handle clinical features before and after lorazepam challenge. As noted in the BFCRS Training Manual, it would be appropriate to compare “state assessments” (that is, restricted to features identified only during direct, in-person assessment) from before and after lorazepam administration to document improvement.4
Whereas DSM-5-TR and ICD-11 are broadly in agreement, comparing these systems with catatonia rating scales reveals many sources of potential confusion, but also concrete guidance on operationalizing individual items.5 How exactly should each of catatonia’s clinical signs be defined? Descriptions differ, and thresholds of duration and frequency vary considerably across scales. As a result, clinicians who use different scales and then convert these results to diagnostic criteria are liable to come to different clinical conclusions. For instance, both echophenomena and negativism must be elicited more than five times to be scored per Northoff,8 but even a single convincing instance of either would be scored on the BFCRS as “occasional.”2
Such discrepancies are important because, whereas the psychometric properties of several catatonia scales have been documented, there are no analogous studies on the DSM-5-TR and ICD-11 criteria. Therefore, it is essential for clinicians and researchers to document how diagnostic criteria have been operationalized. The most practical and evidence-based way to do this is to use a clinically validated scale and convert these to diagnostic criteria, yet in doing so a few modifications will be necessary.
Of the available clinical scales, the BFCRS is best positioned for clinical use. The BFCRS has been validated clinically and has good reliability, detailed item definitions and audiovisual examples available. In addition, it is the only scale with a published semistructured evaluation (see initial paper and Training Manual), which takes about 5 minutes.2,4 In terms of utility, all 12 signs included by DSM-5-TR are among the first 14 items on the BFCRS, which constitutes a standalone tool known as the Bush-Francis Catatonia Screening Instrument (BFCSI, see Table).
Many fundamental questions remain about catatonia,but the importance of a shared understanding of its clinical features is clear.9 Catatonia should be on the differential whenever a patient exhibits a markedly altered level of activity or grossly abnormal behavior, especially when inappropriate to context. We encourage readers to familiarize themselves with the phenotype of catatonia through online educational resources4 because the optimal care of patients with catatonia requires – at a minimum – that we know what we’re looking for.
Dr. Oldham is assistant professor of psychiatry at the University of Rochester (N.Y.) Medical Center. Dr. Francis is professor of psychiatry at Penn State University, Hershey. The authors declare no relevant conflicts of interest. Funding for the educational project hosted at https://bfcrs.urmc.edu was provided by the department of psychiatry at the University of Rochester Medical Center. Dr. Oldham is currently supported by a K23 career development award from the National Institute on Aging (AG072383). The educational resources referenced in this piece could not have been created were it not for the intellectual and thespian collaboration of Joshua R. Wortzel, MD, who is currently a fellow in child and adolescent psychiatry at Brown University, Providence, R.I. The authors are also indebted to Hochang B. Lee, MD, for his gracious support of this project.
References
1. Wortzel JR et al. J Clin Psychiatry. 2021 Aug 17;82(5):21m14025. doi: 10.4088/JCP.21m14025.
2. Bush G et al. Acta Psychiatr Scand. 1996 Feb;93(2):129-36. doi: 10.1111/j.1600-0447.1996.tb09814.x.
3. Weleff J et al. J Acad Consult Liaison Psychiatry. 2023 Jan-Feb;64(1):13-27. doi:10.1016/j.jaclp.2022.07.002.
4. Oldham MA et al. Bush-Francis Catatonia Rating Scale Assessment Resources. University of Rochester Medical Center, Department of Psychiatry. https://bfcrs.urmc.edu.
5. Oldham MA. Schizophr Res. 2022 Aug 19;S0920-9964(22)00294-8. doi: 10.1016/j.schres.2022.08.002.
6. American Psychiatric Association. Diagnostic and statistical manual of mental disorders: DSM-5-TR. Washington, D.C.: American Psychiatric Association Publishing, 2022.
7. World Health Organization. ICD-11 for Mortality and Morbidity Stastistics. 2022. https://icd.who.int/browse11/l-m/en#/http://id.who.int/icd/entity/486722075.
8. Northoff G et al. Mov Disord. May 1999;14(3):404-16. doi: 10.1002/1531-8257(199905)14:3<404::AID-MDS1004>3.0.CO;2-5.
9. Walther S et al. The Lancet Psychiatry. 2019 Jul;6(7):610-9. doi: 10.1016/S2215-0366(18)30474-7.
Three wild technologies about to change health care
When I was a child, I watched syndicated episodes of the original “Star Trek.” I was dazzled by the space travel, sure, but also the medical technology.
A handheld “tricorder” detected diseases, while an intramuscular injector (“hypospray”) could treat them. Sickbay “biobeds” came with real-time health monitors that looked futuristic at the time but seem primitive today.
Such visions inspired a lot of us kids to pursue science. Little did we know the real-life advances many of us would see in our lifetimes.
Artificial intelligence helping to spot disease, robots performing surgery, even video calls between doctor and patient – all these once sounded fantastical but now happen in clinical care.
Now, in the 23rd year of the 21st century, you might not believe wht we’ll be capable of next. Three especially wild examples are moving closer to clinical reality.
Human hibernation
Captain America, Han Solo, and “Star Trek” villain Khan – all were preserved at low temperatures and then revived, waking up alive and well months, decades, or centuries later. These are fictional examples, to be sure, but the science they’re rooted in is real.
(In one extreme case, a climber survived after almost 9 hours of efforts to revive him.)
Useful for a space traveler? Maybe not. But it’s potentially huge for someone with life-threatening injuries from a car accident or a gunshot wound.
That’s the thinking behind a breakthrough procedure that came after decades of research on pigs and dogs, now in a clinical trial. The idea: A person with massive blood loss whose heart has stopped is injected with an ice-cold fluid, cooling them from the inside, down to about 50° F.
Doctors already induce more modest hypothermia to protect the brain and other organs after cardiac arrest and during surgery on the aortic arch (the main artery carrying blood from the heart).
But this experimental procedure – called emergency preservation and resuscitation (EPR) – goes far beyond that, dramatically “decreasing the body’s need for oxygen and blood flow,” says Samuel Tisherman, MD, a trauma surgeon at the University of Maryland Medical Center and the trial’s lead researcher. This puts the patient in a state of suspended animation that “could buy time for surgeons to stop the bleeding and save more of these patients.”
The technique has been done on at least six patients, though none were reported to survive. The trial is expected to include 20 people by the time it wraps up in December, according to the listing on the U.S. clinical trials database. Though given the strict requirements for candidates (emergency trauma victims who are not likely to survive), one can’t exactly rely on a set schedule.
Still, the technology is promising. Someday we may even use it to keep patients in suspended animation for months or years, experts predict, helping astronauts through decades-long spaceflights, or stalling death in sick patients awaiting a cure.
Artificial womb
Another sci-fi classic: growing human babies outside the womb. Think the fetus fields from “The Matrix,” or the frozen embryos in “Alien: Covenant.”
In 1923, British biologist J.B.S. Haldane coined a term for that – ectogenesis. He predicted that 70% of pregnancies would take place, from fertilization to birth, in artificial wombs by 2074. That many seems unlikely, but the timeline is on track.
Developing an embryo outside the womb is already routine in in vitro fertilization. And technology enables preterm babies to survive through much of the second half of gestation. Normal human pregnancy is 40 weeks, and the youngest preterm baby ever to survive was 21 weeks and 1 day old, just a few days younger than a smattering of others who lived.
The biggest obstacle for babies younger than that is lung viability. Mechanical ventilation can damage the lungs and lead to a chronic (sometimes fatal) lung disease known as bronchopulmonary dysplasia. Avoiding this would mean figuring out a way to maintain fetal circulation – the intricate system that delivers oxygenated blood from the placenta to the fetus via the umbilical cord. Researchers at Children’s Hospital of Philadelphia have done this using a fetal lamb.
The key to their invention is a substitute placenta: an oxygenator connected to the lamb’s umbilical cord. Tubes inserted through the umbilical vein and arteries carry oxygenated blood from the “placenta” to the fetus, and deoxygenated blood back out. The lamb resides in an artificial, fluid-filled amniotic sac until its lungs and other organs are developed.
Fertility treatment could benefit, too. “An artificial womb may substitute in situations in which a gestational carrier – surrogate – is indicated,” says Paula Amato, MD, a professor of obstetrics and gynecology at Oregon Health and Science University, Portland. (Dr. Amato is not involved in the CHOP research.) For example: when the mother is missing a uterus or can’t carry a pregnancy safely.
No date is set for clinical trials yet. But according to the research, the main difference between human and lamb may come down to size. A lamb’s umbilical vessels are larger, so feeding in a tube is easier. With today’s advances in miniaturizing surgical methods, that seems like a challenge scientists can overcome.
Messenger RNA therapeutics
Back to “Star Trek.” The hypospray injector’s contents could cure just about any disease, even one newly discovered on a strange planet. That’s not unlike messenger RNA (mRNA) technology, a breakthrough that enabled scientists to quickly develop some of the first COVID-19 vaccines.
But vaccines are just the beginning of what this technology can do.
A whole field of immunotherapy is emerging that uses mRNA to deliver instructions to produce chimeric antigen receptor–modified immune cells (CAR-modified immune cells). These cells are engineered to target diseased cells and tissues, like cancer cells and harmful fibroblasts (scar tissue) that promote fibrosis in, for example, the heart and lungs.
The field is bursting with rodent research, and clinical trials have started for treating some advanced-stage malignancies.
Actual clinical use may be years away, but if all goes well, these medicines could help treat or even cure the core medical problems facing humanity. We’re talking cancer, heart disease, neurodegenerative disease – transforming one therapy into another by simply changing the mRNA’s “nucleotide sequence,” the blueprint containing instructions telling it what to do, and what disease to attack.
As this technology matures, we may start to feel as if we’re really on “Star Trek,” where Dr. Leonard “Bones” McCoy pulls out the same device to treat just about every disease or injury.
A version of this article first appeared on WebMD.com.
Can a hormone shot rescue low libido?
according to results from two small randomized controlled trials.
The data suggest that injections of kisspeptin can boost sexual desire in men and women and can increase penile rigidity in men.
Together, these two studies provide proof of concept for the development of kisspeptin-based therapeutics for men and women with distressing hypoactive sexual desire disorder (HSDD), study investigator Alexander Comninos, MD, PhD, Imperial College London, said in a news release.
One study was published online Feb. 3, 2022, in JAMA Network Open. The other was published in October 2022.
Unmet need
HSDD affects up to 10% of women and 8% of men worldwide and leads to psychological and social harm, the news release noted.
“There is a real unmet need to find new, safer, and more effective therapies for this distressing condition for both women and men seeking treatment,” Dr. Comninos said.
Kisspeptin is a naturally occurring reproductive hormone that serves as a crucial activator of the reproductive system. Emerging evidence from animal models shows that kisspeptin signaling has key roles in modulating reproductive behavior, including sexual motivation and erections.
In a double-blind, placebo-controlled, crossover study, the researchers enrolled 32 healthy heterosexual men (mean age, 37.9 years) who had HSDD.
At the first study visit, the men were given an infusion of kisspeptin-54 (1 nmol/kg per hour) or placebo (saline) over 75 minutes. The participants then crossed over to the other treatment at a second study visit at least 7 days later.
The active treatment significantly increased circulating kisspeptin levels. A steady state was reached after 30-75 minutes of infusion, the researchers reported.
Similar data in men, women
While the men viewed sexual videos, kisspeptin significantly modulated brain activity on fMRI in key structures of the sexual-processing network, compared with placebo (P = .003).
In addition, the treatment led to significant increases in penile tumescence in response to sexual stimuli (by up to 56% more than placebo; P = .02) and behavioral measures of sexual desire – most notably increased happiness about sex (P = .02).
Given the significant stimulatory effect of kisspeptin administration on penile rigidity, coupled with its demonstrated proerectile effect in rodents, future studies should examine the use of kisspeptin for patients with erectile dysfunction, the researchers wrote.
The second study included 32 women with HSDD and had the same design. Its results also showed that kisspeptin restored sexual and attraction brain processing without adverse effects.
“It is highly encouraging to see the same boosting effect in both women and men, although the precise brain pathways were slightly different, as might be expected,” coinvestigator Waljit Dhillo, PhD, Imperial College London, said in the news release.
“Collectively, the results suggest that kisspeptin may offer a safe and much-needed treatment for HSDD that affects millions of people around the world; and we look forward to taking this forward in future larger studies and in other patient groups,” Dr. Dhillo added.
The study was funded by the National Institute for Health and Care Research Imperial Biomedical Research Centre and the Medical Research Council, part of UK Research and Innovation. Dr. Comninos reported no relevant financial relationships. Dr. Dhillo reported receiving consulting fees from Myovant Sciences and KaNDy Therapeutics outside the submitted work.
A version of this article first appeared on Medscape.com.
FROM JAMA NETWORK OPEN
IVF-conceived children show strong developmental performance
In vitro fertilization has been around long enough that researchers can now compare developmental and academic achievements between these children and peers at school age.
Amber Kennedy, MBBS, and colleagues did just that. They found little difference in these milestones between a total of 11,059 IVF-conceived children and 401,654 spontaneously conceived children in a new study.
“Parents considering IVF and health care professionals can be reassured that the school age developmental and educational outcomes of IVF-conceived children are equivalent to their peers,” said Dr. Kennedy, lead author and obstetrician and gynecologist at Mercy Hospital for Women at the University of Melbourne.
The findings were published online in PLOS Medicine.
“Overall, we know that children born through IVF are doing fine in terms of health, but also emotionally and cognitively. So I wasn’t surprised. I live in this world,” said Ariadna Cymet Lanski, PsyD, chair of the American Society for Reproductive Medicine Mental Health Professional Group, who was not affiliated with the study.
Some previous researchers linked conception via IVF to an increased risk of congenital abnormalities, autism spectrum disorder, developmental delay, and intellectual disability.
Asked why the current study did not find increased risks, Dr. Kennedy said, “Our population included a relatively recent birth cohort, which may explain some differences from previous studies as IVF practices have evolved over time.”
An estimated 8 million people worldwide have been conceived through IVF since the first birth in 1978, the researchers said. In Australia, this has grown from 2% of births in the year 2000 to now nearly 5% or 1 in 20 live births, Dr. Kennedy noted. “Consequently, it is important to understand the longer-term outcomes for this population of children.”
Along with senior author Anthea Lindquist, MBBS, Dr. Kennedy and colleagues studied 585,659 single births in Victoria, Australia, between 2005 and 2014. They did not include multiple births such as twins or triplets.
The investigators compared 4,697 children conceived via IVF and 168,503 others conceived spontaneously using a standard developmental measure, the Australian Early Developmental Census (AEDC). They also assessed 8,976 children in the IVF group and 333,335 other children on a standard educational measure, the National Assessment Program–Literacy and Numeracy (NAPLAN).
For example, the developmental census measures developmental vulnerability. Dr. Kennedy and colleagues found a 0.3% difference in favor of IVF-conceived children, which statistically was no different than zero.
Similarly, the researchers reported that IVF conception had essentially no effect on overall the literacy score, with an adjusted average difference of 0.03.
Dr. Lanski said the results should be reassuring for people considering IVF. “I can see the value of the study.” The findings “probably brings a lot of comfort ... if you want to build a family, and medically this is what’s recommended.”
Not all IVF techniques are the same, and the researchers want to take a deeper dive to evaluate any distinctions among them. For example, Dr. Kennedy said, “We plan to investigate the same school-aged outcomes after specific IVF-associated techniques.”
A version of this article first appeared on WebMD.com.
FROM PLOS MEDICINE
We don’t lose our keys (or other things) as much as we think
Can’t find your keys? Misplaced your glasses? No clue where you parked your car?
We all lose things from time to time. And we’ve all heard the standard-issue advice: Picture when you had the object last. Despite this common experience,
“It is well known that we have massive recognition memory for objects,” says study coauthor Jeremy Wolfe, PhD, a professor of ophthalmology and radiology at Harvard Medical School, Boston. In other words, we’re good at recognizing objects we’ve seen before. “For example, after viewing 100 objects for 2-3 seconds each, observers can discriminate those 100 old images from 100 new ones with well over 80% accuracy.”
But remembering what your keys look like won’t necessarily help you find them. “We often want to know when and where we saw [an object],” Dr. Wolfe says. “So our goal was to measure these spatial and temporal memories.”
In a series of experiments, reported in Current Biology, Wolfe and colleagues asked people in the study to remember objects placed on a grid. They viewed 300 objects (pictures of things like a vase, a wedding dress, camo pants, a wet suit) and were asked to recall each one and where it had been located on the grid.
About a third of the people remembered 100 or more locations, by choosing either the correct square on the grid or one directly next to it. Another third remembered between 50 and 100, and the rest remembered less than 50.
Results would likely be even better in the real world “because no one gives up and decides ‘I can’t remember where anything is. I will just guess in this silly experiment,’ ” Dr. Wolfe says.
Later, they were shown items one at a time and asked to click on a time line to indicate when they had seen them. Between 60% and 80% of the time, they identified when they had seen an object within 10% of the correct time. That’s a lot better than the 40% they would have achieved by guessing.
The findings build on previous research and expand our understanding of memory, Dr. Wolfe says. “We knew that people could remember where some things were located. However, no one had tried to quantify that memory,” he says.
But wait: If we’re so good at remembering the where and when, why do we struggle to locate lost objects so much? Chances are, we don’t. We just feel that way because we tend to focus on the fails and overlook the many wins.
“This [study] is showing us something about how we come to know where hundreds of things are in our world,” Dr. Wolfe says. “We tend to notice when this fails – ‘where are my keys?’ – but on a normal day, you are successfully tapping a massive memory on a regular basis.”
Next, the researchers plan to investigate whether spatial and temporal memories are correlated – if you’re good at one, are you good at the other? So far, “that correlation looks rather weak,” Dr. Wolfe says.
A version of this article first appeared on WebMD.com.
FROM CURRENT BIOLOGY
Remote electrical neuromodulation device helps reduce migraine days
, according to recent research published in the journal Headache.
The prospective, randomized, double-blind, placebo-controlled, multicenter trial showed that remote electrical neuromodulation (REN) with Nerivio (Theranica Bio-Electronics Ltd.; Bridgewater, N.J.) found a mean reduction/decrease in the number of migraine days by an average of 4.0 days per month, according to Stewart J. Tepper MD, of the Geisel School of Medicine at Dartmouth in Hanover, N.H., and colleagues.*

“The statistically significant results were maintained in separate subanalyses of the chronic and episodic subsamples, as well as in the separate subanalyses of participants who used and did not use migraine prophylaxis,” Dr. Tepper and colleagues wrote.
A nonpharmacological alternative
Researchers randomized 248 participants into active and placebo groups, with 95 participants in the active group and 84 participants in the placebo group meeting the criteria for a modified intention-to-treat (mITT) analysis. Most of the participants in the ITT dataset were women (85.9%) with an average age of 41.7 years, and a baseline average of 12.2 migraine days and 15.6 headache days. Overall, 52.4% of participants in the ITT dataset had chronic migraine, 25.0% had migraine with aura, and 41.1% were taking preventative medication.
Dr. Tepper and colleagues followed participants for 4 weeks at baseline for observation followed by 8 weeks of participants using the REN device every other day for 45 minutes, or a placebo device that “produces electrical pulses of the same maximum intensity (34 mA) and overall energy, but with different pulse durations and much lower frequencies compared with the active device.” Participants completed a daily diary where they recorded their symptoms.
Researchers assessed the mean change in number of migraine days per month as a primary outcome, and evaluated participants who experienced episodic and chronic migraines separately in subgroup analyses. Secondary outcome measures included mean change in number of moderate or severe headache days, 50% reduction in mean number of headache days compared with baseline, Headache Impact Test short form (HIT-6) and Migraine Specific Quality of Life Questionnaire (MSQ) Role Function Domain total score mean change at 12 weeks compared with week 1, and reduction in mean number of days taking acute headache or migraine medication.
Participants receiving REN treatment had a significant reduction in mean migraine days per month compared with the placebo group (4.0 days vs. 1.3 days; 95% confidence interval, –3.9 days to –1.5 days; P < .001). In subgroup analyses, a significant reduction in migraine days was seen in participants receiving REN treatment with episodic migraine (3.2 days vs. 1.0 days; P = .003) and chronic migraine (4.7 days vs. 1.6 days; P = .001) compared with placebo.
Dr. Tepper and colleagues found a significant reduction in moderate and/or severe headache days among participants receiving REN treatment compared with placebo (3.8 days vs. 2.2 days; P = .005), a significant reduction in headache days overall compared with placebo (4.5 days vs. 1.8 days; P < .001), a significant percentage of patients who experienced 50% reduction in moderate and/or severe headache days compared with placebo (51.6% vs. 35.7%; P = .033), and a significant reduction in acute medication days compared with placebo (3.5 days vs. 1.4 days; P = .001). Dr. Tepper and colleagues found no serious device-related adverse events in either group.
The researchers noted that REN therapy is a “much-needed nonpharmacological alternative” to other preventive and acute treatments for migraine. “Given the previously well-established clinical efficacy and high safety profile in acute treatment of migraine, REN can cover the entire treatment spectrum of migraine, including both acute and preventive treatments,” they said.
‘A good place to start’
Commenting on the study, Alan M. Rapoport, MD, clinical professor of neurology at University of California, Los Angeles; past president of the International Headache Society; and editor-in-chief of Neurology Reviews, said the study was well designed, but acknowledged the 8-week follow-up time for participants as one potential area where he would have wanted to see more data.
As a medical device cleared for use by the Food and Drug Administration for acute treatment of migraine, the REM device also appears to be effective as a migraine preventative based on the results of the study with “virtually no adverse events,” he noted.
“I think this is a great treatment. I think it’s a good place to start,” Dr. Rapoport said. Given the low adverse event rate, he said he would be willing to offer the device to patients as a first option for preventing migraine and either switch to another preventative option or add an additional medication in combination based on how the patient responds. However, at the moment, he noted that this device is not covered by insurance.
Now that a REN device has been shown to work in the acute setting and as a preventative, Dr. Rapoport said he is interested in seeing other devices that have been cleared by the FDA as migraine treatments evaluated in migraine prevention. “I think we need more patients tried on the devices so we get an idea of which ones work acutely, which ones work preventively,” he said.
The authors reported personal and institutional relationships in the form of advisory board positions, consultancies, grants, research principal investigator roles, royalties, speakers bureau positions, and stockholders for a variety of pharmaceutical companies, agencies, and other organizations. Several authors disclosed ties with Theranica, the manufacturer of the REN device used in the study. Dr. Rapoport is editor-in-chief of Neurology Reviews and a consultant for Theranica, but was not involved in studies associated with the REN device.
Correction, 2/10/23: An earlier version of this article misstated the reduction in number of migraine days.
, according to recent research published in the journal Headache.
The prospective, randomized, double-blind, placebo-controlled, multicenter trial showed that remote electrical neuromodulation (REN) with Nerivio (Theranica Bio-Electronics Ltd.; Bridgewater, N.J.) found a mean reduction/decrease in the number of migraine days by an average of 4.0 days per month, according to Stewart J. Tepper MD, of the Geisel School of Medicine at Dartmouth in Hanover, N.H., and colleagues.*
“The statistically significant results were maintained in separate subanalyses of the chronic and episodic subsamples, as well as in the separate subanalyses of participants who used and did not use migraine prophylaxis,” Dr. Tepper and colleagues wrote.
A nonpharmacological alternative
Researchers randomized 248 participants into active and placebo groups, with 95 participants in the active group and 84 participants in the placebo group meeting the criteria for a modified intention-to-treat (mITT) analysis. Most of the participants in the ITT dataset were women (85.9%) with an average age of 41.7 years, and a baseline average of 12.2 migraine days and 15.6 headache days. Overall, 52.4% of participants in the ITT dataset had chronic migraine, 25.0% had migraine with aura, and 41.1% were taking preventative medication.
Dr. Tepper and colleagues followed participants for 4 weeks at baseline for observation followed by 8 weeks of participants using the REN device every other day for 45 minutes, or a placebo device that “produces electrical pulses of the same maximum intensity (34 mA) and overall energy, but with different pulse durations and much lower frequencies compared with the active device.” Participants completed a daily diary where they recorded their symptoms.
Researchers assessed the mean change in number of migraine days per month as a primary outcome, and evaluated participants who experienced episodic and chronic migraines separately in subgroup analyses. Secondary outcome measures included mean change in number of moderate or severe headache days, 50% reduction in mean number of headache days compared with baseline, Headache Impact Test short form (HIT-6) and Migraine Specific Quality of Life Questionnaire (MSQ) Role Function Domain total score mean change at 12 weeks compared with week 1, and reduction in mean number of days taking acute headache or migraine medication.
Participants receiving REN treatment had a significant reduction in mean migraine days per month compared with the placebo group (4.0 days vs. 1.3 days; 95% confidence interval, –3.9 days to –1.5 days; P < .001). In subgroup analyses, a significant reduction in migraine days was seen in participants receiving REN treatment with episodic migraine (3.2 days vs. 1.0 days; P = .003) and chronic migraine (4.7 days vs. 1.6 days; P = .001) compared with placebo.
Dr. Tepper and colleagues found a significant reduction in moderate and/or severe headache days among participants receiving REN treatment compared with placebo (3.8 days vs. 2.2 days; P = .005), a significant reduction in headache days overall compared with placebo (4.5 days vs. 1.8 days; P < .001), a significant percentage of patients who experienced 50% reduction in moderate and/or severe headache days compared with placebo (51.6% vs. 35.7%; P = .033), and a significant reduction in acute medication days compared with placebo (3.5 days vs. 1.4 days; P = .001). Dr. Tepper and colleagues found no serious device-related adverse events in either group.
The researchers noted that REN therapy is a “much-needed nonpharmacological alternative” to other preventive and acute treatments for migraine. “Given the previously well-established clinical efficacy and high safety profile in acute treatment of migraine, REN can cover the entire treatment spectrum of migraine, including both acute and preventive treatments,” they said.
‘A good place to start’
Commenting on the study, Alan M. Rapoport, MD, clinical professor of neurology at University of California, Los Angeles; past president of the International Headache Society; and editor-in-chief of Neurology Reviews, said the study was well designed, but acknowledged the 8-week follow-up time for participants as one potential area where he would have wanted to see more data.
As a medical device cleared for use by the Food and Drug Administration for acute treatment of migraine, the REM device also appears to be effective as a migraine preventative based on the results of the study with “virtually no adverse events,” he noted.
“I think this is a great treatment. I think it’s a good place to start,” Dr. Rapoport said. Given the low adverse event rate, he said he would be willing to offer the device to patients as a first option for preventing migraine and either switch to another preventative option or add an additional medication in combination based on how the patient responds. However, at the moment, he noted that this device is not covered by insurance.
Now that a REN device has been shown to work in the acute setting and as a preventative, Dr. Rapoport said he is interested in seeing other devices that have been cleared by the FDA as migraine treatments evaluated in migraine prevention. “I think we need more patients tried on the devices so we get an idea of which ones work acutely, which ones work preventively,” he said.
The authors reported personal and institutional relationships in the form of advisory board positions, consultancies, grants, research principal investigator roles, royalties, speakers bureau positions, and stockholders for a variety of pharmaceutical companies, agencies, and other organizations. Several authors disclosed ties with Theranica, the manufacturer of the REN device used in the study. Dr. Rapoport is editor-in-chief of Neurology Reviews and a consultant for Theranica, but was not involved in studies associated with the REN device.
Correction, 2/10/23: An earlier version of this article misstated the reduction in number of migraine days.
FROM HEADACHE

Frequent visits to green spaces linked to lower use of some meds
Frequent visits to green spaces such as parks and community gardens are associated with a reduced use of certain prescription medications among city dwellers, a new analysis suggests.
In a cross-sectional cohort study, frequent green space visits were associated with less frequent use of psychotropic, antihypertensive, and asthma medications in urban environments.
Viewing green or so called “blue” spaces (views of lakes, rivers, or other water views) from the home was not associated with reduced medication use.

The growing scientific evidence supporting the health benefits of nature exposure is likely to increase the availability of high-quality green spaces in urban environments and promote the use of these spaces, lead author Anu W. Turunen, PhD, from the Finnish Institute for Health and Welfare, Kuopio, Finland, told this news organization.
This might be one way to improve health and well-being among city dwellers, Dr. Turunen added.
The findings were published online in Occupational and Environmental Medicine.
Nature exposure a timely topic
Exposure to natural environments is thought to be beneficial for human health, but the evidence is inconsistent, Dr. Turunen said.
“The potential health benefits of nature exposure is a very timely topic in environmental epidemiology. Scientific evidence indicates that residential exposure to greenery and water bodies might be beneficial, especially for mental, cardiovascular, and respiratory health, but the findings are partly inconsistent and thus, more detailed information is needed,” she said.
In the current cross-sectional study, the investigators surveyed 16,000 residents of three urban areas in Finland – Helsinki, Espoo, and Vantaa – over the period of 12 months from 2015 to 2016, about their exposure to green and blue spaces.
Of this number, 43% responded, resulting in 7,321 participants.
In the questionnaire, green areas were defined as forests, parks, fields, meadows, boglands, and rocks, as well as any playgrounds or playing fields within those areas, and blue areas were defined as sea, lakes, and rivers.
Residents were asked about their use of anxiolytics, hypnotics, antidepressants, antihypertensives, and asthma medication within the past 7 to 52 weeks.
They were also asked if they had any green and blue views from any of the windows of their home, and if so, how often did they look out of those windows, selecting “seldom” to “often.”
They were also asked about how much time they spent outdoors in green spaces during the months of May and September. If so, did they spend any of that time exercising? Options ranged from never to five or more times a week.
In addition, amounts of residential green and blue spaces located within a 1 km radius of the respondents’ homes were assessed from land use and land cover data.
Covariates included health behaviors, outdoor air pollution and noise, and socioeconomic status, including household income and educational attainment.
Results showed that the presence of green and blue spaces at home, and the amount of time spent viewing them, had no association with the use of the prescribed medicines.
However, greater frequency of green space visits was associated with lower odds of using the medications surveyed.
For psychotropic medications, the odds ratios were 0.67 (95% confidence interval, 0.55-0.82) for 3-4 times per week and 0.78 (95% CI, 0.63-0.96) for 5 or more times per week.
For antihypertensive meds, the ORs were 0.64 (95% CI, 0.52-0.78) for 3-4 times per week and 0.59 (95% CI, 0.48-0.74) for 5 or more times per week.
For asthma medications, the ORs were 0.74 (95% CI, 0.58-0.94) for 3-4 times per week and 0.76 (95% CI, 0.59-0.99) for 5 or more times per week.
The observed associations were attenuated by body mass index.
“We observed that those who reported visiting green spaces often had a slightly lower BMI than those who visited green spaces less often,” Dr. Turunen said. However, no consistent interactions with socioeconomic status indicators were observed.
“We are hoping to see new results from different countries and different settings,” she noted. “Longitudinal studies, especially, are needed. In epidemiology, a large body of consistent evidence is needed to draw strong conclusions and to make recommendations.”
Evidence mounts on the benefits of nature
There is growing evidence that exposure to nature could benefit human health, especially mental and cardiovascular health, says Jochem Klompmaker, PhD, a postdoctoral researcher in the department of environmental health at the Harvard T.H. Chan School of Public Health, Boston.
Dr. Klompmaker has researched the association between exposure to green spaces and health outcomes related to neurological diseases.
In a study recently published in JAMA Network Open, and reported by this news organization, Dr. Klompmaker and his team found that among a large cohort of about 6.7 million fee-for-service Medicare beneficiaries in the United States aged 65 or older, living in areas rich with greenery, parks, and waterways was associated with fewer hospitalizations for certain neurological disorders, including Parkinson’s disease, Alzheimer’s disease, and related dementias.
Commenting on the current study, Dr. Klompmaker noted its strengths.
“A particular strength of this study is that they used data about the amount of green and blue spaces around the residential addresses of the participants, data about green space visit frequency, and data about green and blue views from home. Most other studies only have data about the amount of green and blue spaces in general,” he said.
“The strong protective associations of frequency of green space visits make sense to me and indicate the importance of one’s actual nature exposure,” he added. “Like the results of our study, these results provide clinicians with more evidence of the importance of being close to nature and of encouraging patients to take more walks. If they live near a park, that could be a good place to be more physically active and reduce stress levels.”
The study was supported by the Academy of Finland and the Ministry of the Environment. Dr. Turunen and Dr. Klompmaker report no relevant financial relationships.
A version of this article first appeared on Medscape.com.
Frequent visits to green spaces such as parks and community gardens are associated with a reduced use of certain prescription medications among city dwellers, a new analysis suggests.
In a cross-sectional cohort study, frequent green space visits were associated with less frequent use of psychotropic, antihypertensive, and asthma medications in urban environments.
Viewing green or so called “blue” spaces (views of lakes, rivers, or other water views) from the home was not associated with reduced medication use.
The growing scientific evidence supporting the health benefits of nature exposure is likely to increase the availability of high-quality green spaces in urban environments and promote the use of these spaces, lead author Anu W. Turunen, PhD, from the Finnish Institute for Health and Welfare, Kuopio, Finland, told this news organization.
This might be one way to improve health and well-being among city dwellers, Dr. Turunen added.
The findings were published online in Occupational and Environmental Medicine.
Nature exposure a timely topic
Exposure to natural environments is thought to be beneficial for human health, but the evidence is inconsistent, Dr. Turunen said.
“The potential health benefits of nature exposure is a very timely topic in environmental epidemiology. Scientific evidence indicates that residential exposure to greenery and water bodies might be beneficial, especially for mental, cardiovascular, and respiratory health, but the findings are partly inconsistent and thus, more detailed information is needed,” she said.
In the current cross-sectional study, the investigators surveyed 16,000 residents of three urban areas in Finland – Helsinki, Espoo, and Vantaa – over the period of 12 months from 2015 to 2016, about their exposure to green and blue spaces.
Of this number, 43% responded, resulting in 7,321 participants.
In the questionnaire, green areas were defined as forests, parks, fields, meadows, boglands, and rocks, as well as any playgrounds or playing fields within those areas, and blue areas were defined as sea, lakes, and rivers.
Residents were asked about their use of anxiolytics, hypnotics, antidepressants, antihypertensives, and asthma medication within the past 7 to 52 weeks.
They were also asked if they had any green and blue views from any of the windows of their home, and if so, how often did they look out of those windows, selecting “seldom” to “often.”
They were also asked about how much time they spent outdoors in green spaces during the months of May and September. If so, did they spend any of that time exercising? Options ranged from never to five or more times a week.
In addition, amounts of residential green and blue spaces located within a 1 km radius of the respondents’ homes were assessed from land use and land cover data.
Covariates included health behaviors, outdoor air pollution and noise, and socioeconomic status, including household income and educational attainment.
Results showed that the presence of green and blue spaces at home, and the amount of time spent viewing them, had no association with the use of the prescribed medicines.
However, greater frequency of green space visits was associated with lower odds of using the medications surveyed.
For psychotropic medications, the odds ratios were 0.67 (95% confidence interval, 0.55-0.82) for 3-4 times per week and 0.78 (95% CI, 0.63-0.96) for 5 or more times per week.
For antihypertensive meds, the ORs were 0.64 (95% CI, 0.52-0.78) for 3-4 times per week and 0.59 (95% CI, 0.48-0.74) for 5 or more times per week.
For asthma medications, the ORs were 0.74 (95% CI, 0.58-0.94) for 3-4 times per week and 0.76 (95% CI, 0.59-0.99) for 5 or more times per week.
The observed associations were attenuated by body mass index.
“We observed that those who reported visiting green spaces often had a slightly lower BMI than those who visited green spaces less often,” Dr. Turunen said. However, no consistent interactions with socioeconomic status indicators were observed.
“We are hoping to see new results from different countries and different settings,” she noted. “Longitudinal studies, especially, are needed. In epidemiology, a large body of consistent evidence is needed to draw strong conclusions and to make recommendations.”
Evidence mounts on the benefits of nature
There is growing evidence that exposure to nature could benefit human health, especially mental and cardiovascular health, says Jochem Klompmaker, PhD, a postdoctoral researcher in the department of environmental health at the Harvard T.H. Chan School of Public Health, Boston.
Dr. Klompmaker has researched the association between exposure to green spaces and health outcomes related to neurological diseases.
In a study recently published in JAMA Network Open, and reported by this news organization, Dr. Klompmaker and his team found that among a large cohort of about 6.7 million fee-for-service Medicare beneficiaries in the United States aged 65 or older, living in areas rich with greenery, parks, and waterways was associated with fewer hospitalizations for certain neurological disorders, including Parkinson’s disease, Alzheimer’s disease, and related dementias.
Commenting on the current study, Dr. Klompmaker noted its strengths.
“A particular strength of this study is that they used data about the amount of green and blue spaces around the residential addresses of the participants, data about green space visit frequency, and data about green and blue views from home. Most other studies only have data about the amount of green and blue spaces in general,” he said.
“The strong protective associations of frequency of green space visits make sense to me and indicate the importance of one’s actual nature exposure,” he added. “Like the results of our study, these results provide clinicians with more evidence of the importance of being close to nature and of encouraging patients to take more walks. If they live near a park, that could be a good place to be more physically active and reduce stress levels.”
The study was supported by the Academy of Finland and the Ministry of the Environment. Dr. Turunen and Dr. Klompmaker report no relevant financial relationships.
A version of this article first appeared on Medscape.com.