User login
“Enough English” to be at risk
A hectic Friday morning at the hospital seemed less stressful amid morning greetings and humor from colleagues. In a team room full of hospitalists, life and death are often discussed in detail, ranging from medical discussions to joys and frustrations of the day to philosophy, politics, and more. It is almost impossible to miss something interesting.

People breaking into their native languages over the phone call from home always make me smile. The mention of a “complicated Indian patient unable to use interpreter” caught my attention.
My friend and colleague asked if I would be willing to take over the patient since I could speak Hindi. I was doubtful if I would add anything to make a meaningful difference, given the patient wasn’t even participating in a conversation. However, my colleague’s concern for the patient and faith in me was enough to say, “Sure, let me add her to my list.”
At the bedside, it felt like a classic “acute on chronic” hot mess situation. The patient presented with a generalized rash, anasarca, renal failure, multifocal pneumonia, and delirium. All I could gather from the patient were some incomprehensible words that sounded like Hindi. I called the family to obtain some history and to provide updates. Her son was excited to hear from me, and it didn’t take him long to guess that I was from India. But that could still mean that I might speak any of the twenty-two or more Indian languages.
Answering my questions one by one in perfectly understandable English, he was short and sweet. Suspicious of missing out on details, I offered hesitantly, “You could speak in Hindi with me.” Then came a flood of information with the details, concerns, questions, and what was lost in the translation.
We all attend to patients and families with limited English proficiency (LEP), immigrants, and nonimmigrants. LEP is a term used to describe individuals who do not speak English as their primary language and have a limited ability to read, speak, write, or understand English.1 Recent data from the American Community Survey (2005-2009) reports that 8.6% of the population (24 million Americans) have LEP.2 It’s a large and growing population that needs help overcoming language barriers and the appropriate use of professional medical interpreter services – a backbone to safe, quality, and cost-effective patient care.
The following day at bedside rounds, the nurse reported that the patient was looking and responding better. She could cooperate with interpreter services and could speak “some English.” Over the years, one thing that sounds more alarming than “no English” is “some English” or “enough English.” Around noon I received a page that the patient was refusing intravenous Lasix. At the bedside, however, the patient seemed unaware of the perceived refusal. Further discussions with the nurse lead to a familiar culprit, a relatively common gesture in South Asian cultures, a head bobble or shake.
The nurse reported that the patient shook her head side to side, seemed upset, and said “NO” when trying to administer the medication. On the other hand, the patient reported that she was upset to be at the hospital but had “NO” problem with the medicine.
My patient’s “some English” was indeed “enough English” to put her at risk due to medical error, which is highly likely when patients or providers can speak or understand a language to “get by” or to “make do.” Like my patient, the LEP patient population is more likely to experience medical errors, longer hospital stays, hospital-acquired complications, surgical delays, and readmissions. They are also less likely to receive preventive care, have access to regular care, or be satisfied with their care. They are much more likely to have adverse effects from drug complications, poor understanding of diagnoses, a greater risk of being misunderstood by their physicians or ancillary staff, and less likely to follow physician instructions.3-5 One study analyzed over 1,000 adverse-incident reports from six Joint Commission-accredited hospitals for LEP and English-speaking patients and found that 49% of LEP patients experienced physical harm versus 29.5% of English-speaking patients.6
I updated the patient’s LEP status that was missing in the chart, likely due to altered mental status at the time of admission. Reliable language and English proficiency data are usually entered at the patient’s point of entry with documentation of the language services required during the patient-provider encounter. The U.S. Census Bureau’s operational definition for LEP is a patient’s self-assessed ability to speak English less than “very well,” but how well it correlates with a patient’s actual English ability needs more study. Also, one’s self-assessed perception of ability might vary day to day, and language ability, by itself, is not static; it can differ from moment to moment and situation to situation. It may be easier to understand words in English when the situation is simple and less stressful than when things are complicated and stressful.
With a definition of LEP rather vague and the term somewhat derogatory, its meaning is open to interpretation. One study found that though speaking English less than “very well” was the most sensitive measure for identifying all of the patients who reported that they were unable to communicate effectively with their physicians, it was also the least specific.7 This lower specificity could lead to misclassification of some patients as LEP who are, in fact, able to effectively communicate in English with their physicians. This type of misclassification might lead to costly language assistance and carry the potential to cause conflicts between patient and provider. Telling a patient or family that they may have a “limited English proficiency” when they have believed otherwise and feel confident about their skills may come as a challenge. Some patients may also pretend to understand English to avoid being embarrassed about their linguistic abilities or perceive that they might be judged on their abilities in general.
Exiting the room, I gently reminded the RN to use the interpreter services. “Who has never been guilty of using an ad hoc interpreter or rushing through a long interpreter phone call due to time constraints?” I thought. A study from 2011 found that 43% of hospitalized patients with LEP had communicated without an interpreter present during admission, and 40% had communicated without an interpreter present after admission.8 In other words, a system in place does not mean service in use. But, the use of a trained interpreter is not only an obligation for care providers but a right for patients as per legal requirements of Title VI of the Civil Rights Act and the Standards for Culturally and Linguistically Appropriate Services (CLAS) by the Department of Health and Human Services’ (HSS) Office of Minority Health.9 In January 2010, The Joint Commission released a set of new and revised standards for patient-centered communication as part of an initiative to advance effective communication, cultural competence, and patient- and family-centered care.
Despite the requirements and availability of qualified medical interpreter services, there are multiple perceived and experienced barriers to the use of interpreter services. The most common one is that what comes as a free service for patients is a time commitment for providers. A long list of patients, acuity of the situation, and ease of use/availability of translation aids can change the calculus. One may be able to bill a prolonged service code (99354-99357) in addition to the appropriate E/M code, although a patient cannot be billed for the actual service provided by the interpreter. Longstanding CMS policy also permits reimbursement for translation/interpretation activities, so long as they are not included and paid for as part of the rate for direct service.10
The patient, however, insisted that she would rather have her son as the interpreter on the 3-way over the phone (OPI) conference call for interpretation. “He speaks good English and knows my medical history well,” she said. I counseled the patient on the benefits of using interpreter services and explained how to use the call button light and the visual aids.
Placing emphasis on educating patients about the benefits of using, and risks of not using, interpreter services is as essential as emphasizing that care providers use the services. Some patients may voluntarily choose to provide their own interpreter. Use of family members, friends, or unqualified staff as interpreters is one of the most commonly reported causes of errors by frontline staff. Using in-language collateral may help these patients understand how medical interpretation may create a better patient experience and outcome. A short factsheet, in different languages, on qualified interpreters’ expected benefits: meaning-for-meaning communication, impartiality, medical privacy, and improved patient safety and satisfaction, can also come in handy.
However, if the patient still refuses, providers should document the refusal of the offer of free language services, the name of the interpreter designated by the patient, the interpreter’s relationship to the LEP person, and the time or portions of the patient encounter that the interpreter’s services were used. Yet, language interpretation alone can be inadequate without document translation. According to one study, despite the availability of on-site professional interpreter services, hospitalized patients who do not speak English are less likely to have signed consent forms in their medical records.11 Health care professionals, therefore, need well-translated documents to treat LEP patients. Translated documents of consent forms for medical procedures, post-discharge instructions, prescription and medical device labels, and drug usage information may enhance informed decision making, safety and reduce stress and medical errors.
An unpopular and underused service needs it all: availability, convenience, monitoring, reporting, and team effort. Due to the sheer unpopularity and underuse of interpreter services, institutions should enhance ease of availability, monitor the use and quality of interpreter services, and optimize reporting of language-related errors. Ease of availability goes hand in hand with tapping local resources. Over the years, and even more so during the pandemic, in-person interpretation has transitioned to telephonic or video interpretation due to availability, safety, and cost issues. There are challenges in translating a language, and the absence of a visual channel adds another layer of complexity.
The current body of evidence does not indicate a superior interpreting method. Still, in one study providers and interpreters exposed to all three methods were more critical of remote methods and preferred videoconferencing to the telephone as a remote method. The significantly shorter phone interviews raised questions about the prospects of miscommunication in telephonic interpretation, given the absence of a visual channel.12
One way to bypass language barriers is to recognize the value added by hiring and training bilingual health care providers and fostering cultural competence. International medical graduates in many parts of the country aid in closing language barriers. Language-concordant care enhances trust between patients and physicians, optimizes health outcomes, and advances health equity for diverse populations.13-15 The presence of bilingual providers means more effective and timelier communication and improved patient satisfaction. But, according to a Doximity study, there is a significant “language gap” between those languages spoken by physicians and their patients.16 Hospitals, therefore, should assess, qualify, and incentivize staff who can serve as on-site medical interpreters for patients as a means to facilitate language concordant care for LEP patients.
The Agency of Healthcare Research and Quality (AHRQ) also has a guide on how hospitals can better identify, report, monitor, and prevent medical errors in patients with LEP. Included is the TeamSTEPPS LEP module to help develop and deploy a customized plan to train staff in teamwork skills and lead a medical teamwork improvement initiative.17
“Without my family, I was scared that nobody would understand me”
Back to the case. My patient was recovering well, and I was tying up loose ends on the switch day for the hospitalist teams.
“You will likely be discharged in a couple of days,” I said. She and the family were grateful and satisfied with the care. She had used the interpreter services and also received ethnocultural and language concordant and culturally competent care. Reducing language barriers is one of the crucial ways to reduce racial and ethnic disparities in quality of care and health outcomes, and it starts – in many cases – with identifying LEP patients. Proper use and monitoring of interpreter services, reporting language-related errors, hiring and testing bilingual staff’s language proficiency, and educating staff on cultural awareness are essential strategies for caring for LEP patients.
At my weeks’ end, in my handoff note to the incoming providers, I highlighted: “Patient will benefit from a Hindi speaking provider, Limited English Proficiency.”
Dr. Saigal is a hospitalist and clinical assistant professor of medicine in the division of hospital medicine at the Ohio State University Wexner Medical Center, Columbus.
References
1. Questions and Answers. Limited English Proficiency: A federal interagency website. www.lep.gov/commonly-asked-questions.
2. United States Census Bureau. Percent of people 5 years and over who speak English less than ‘very well’. www.census.gov/library/visualizations/interactive/people-that-speak-english-less-than-very-well.html.
3. Jacobs EA, et al. Overcoming language barriers in health care: Costs and benefits of interpreter services. Am J Public Health. 2004;94(5):866–869. doi: 10.2105/ajph.94.5.866.
4. Gandhi TK, et al. Drug complications in outpatients. J Gen Intern Med. 2000;15(3):149–154. doi: 10.1046/j.1525-1497.2000.04199.x.
5. Karliner LS, et al. Do professional interpreters improve clinical care for patients with limited English proficiency? A systematic review of the literature. Health Serv Res. 2007;42(2):727–754. doi: 10.1111/j.1475-6773.2006.00629.x.
6. Divi C, et al. Language proficiency and adverse events in US hospitals: a pilot study. Int J Qual Health Care. 2007 Apr;19(2):60-7. doi: 10.1093/intqhc/mzl069.
7. Karliner LS, et al. Identification of limited English proficient patients in clinical care. J Gen Intern Med. 2008;23(10):1555-1560. doi:10.1007/s11606-008-0693-y.
8. Schenker Y, et al. Patterns of interpreter use for hospitalized patients with limited English proficiency. J Gen Intern Med. 2011 Jul;26(7):712-7. doi: 10.1007/s11606-010-1619-z.
9. Office of Minority Health, US Department of Health and Human Services. National Standards for Culturally and Linguistically Appropriate Services in Health Care: Final Report. Washington, DC: US Department of Health and Human Services; 2001. https://minorityhealth.hhs.gov/assets/pdf/checked/finalreport.pdf.
10. www.medicaid.gov/medicaid/financial-management/medicaid-administrative-claiming/translation-and-interpretation-services/index.html
11. Schenker Y, et al. The Impact of Language Barriers on Documentation of Informed Consent at a Hospital with On-Site Interpreter Services. J Gen Intern Med. 2007 Nov;22 Suppl 2(Suppl 2):294-9. doi: 10.1007/s11606-007-0359-1.
12. Locatis C, et al. Comparing in-person, video, and telephonic medical interpretation. J Gen Intern Med. 2010;25(4):345-350. doi:10.1007/s11606-009-1236-x.
13. Dunlap JL, et al. The effects of language concordant care on patient satisfaction and clinical understanding for Hispanic pediatric surgery patients. J Pediatr Surg. 2015 Sep;50(9):1586-9. doi: 10.1016/j.jpedsurg.2014.12.020.
14. Diamond L, et al. A Systematic Review of the Impact of Patient–Physician Non-English Language Concordance on Quality of Care and Outcomes. J Gen Intern Med. 2019 Aug;34(8):1591-1606. doi: 10.1007/s11606-019-04847-5.
15. Ngo-Metzger Q, et al. Providing high-quality care for limited English proficient patients: the importance of language concordance and interpreter use. J Gen Intern Med. 2007 Nov;22 Suppl 2(Suppl 2):324-30. doi: 10.1007/s11606-007-0340-z.
16. https://press.doximity.com/articles/first-ever-national-study-to-examine-different-languages-spoken-by-us-doctors.
17. Agency for Healthcare Research and Quality. Patients with Limited English Proficiency. www.ahrq.gov/teamstepps/lep/index.html.
A hectic Friday morning at the hospital seemed less stressful amid morning greetings and humor from colleagues. In a team room full of hospitalists, life and death are often discussed in detail, ranging from medical discussions to joys and frustrations of the day to philosophy, politics, and more. It is almost impossible to miss something interesting.
People breaking into their native languages over the phone call from home always make me smile. The mention of a “complicated Indian patient unable to use interpreter” caught my attention.
My friend and colleague asked if I would be willing to take over the patient since I could speak Hindi. I was doubtful if I would add anything to make a meaningful difference, given the patient wasn’t even participating in a conversation. However, my colleague’s concern for the patient and faith in me was enough to say, “Sure, let me add her to my list.”
At the bedside, it felt like a classic “acute on chronic” hot mess situation. The patient presented with a generalized rash, anasarca, renal failure, multifocal pneumonia, and delirium. All I could gather from the patient were some incomprehensible words that sounded like Hindi. I called the family to obtain some history and to provide updates. Her son was excited to hear from me, and it didn’t take him long to guess that I was from India. But that could still mean that I might speak any of the twenty-two or more Indian languages.
Answering my questions one by one in perfectly understandable English, he was short and sweet. Suspicious of missing out on details, I offered hesitantly, “You could speak in Hindi with me.” Then came a flood of information with the details, concerns, questions, and what was lost in the translation.
We all attend to patients and families with limited English proficiency (LEP), immigrants, and nonimmigrants. LEP is a term used to describe individuals who do not speak English as their primary language and have a limited ability to read, speak, write, or understand English.1 Recent data from the American Community Survey (2005-2009) reports that 8.6% of the population (24 million Americans) have LEP.2 It’s a large and growing population that needs help overcoming language barriers and the appropriate use of professional medical interpreter services – a backbone to safe, quality, and cost-effective patient care.
The following day at bedside rounds, the nurse reported that the patient was looking and responding better. She could cooperate with interpreter services and could speak “some English.” Over the years, one thing that sounds more alarming than “no English” is “some English” or “enough English.” Around noon I received a page that the patient was refusing intravenous Lasix. At the bedside, however, the patient seemed unaware of the perceived refusal. Further discussions with the nurse lead to a familiar culprit, a relatively common gesture in South Asian cultures, a head bobble or shake.
The nurse reported that the patient shook her head side to side, seemed upset, and said “NO” when trying to administer the medication. On the other hand, the patient reported that she was upset to be at the hospital but had “NO” problem with the medicine.
My patient’s “some English” was indeed “enough English” to put her at risk due to medical error, which is highly likely when patients or providers can speak or understand a language to “get by” or to “make do.” Like my patient, the LEP patient population is more likely to experience medical errors, longer hospital stays, hospital-acquired complications, surgical delays, and readmissions. They are also less likely to receive preventive care, have access to regular care, or be satisfied with their care. They are much more likely to have adverse effects from drug complications, poor understanding of diagnoses, a greater risk of being misunderstood by their physicians or ancillary staff, and less likely to follow physician instructions.3-5 One study analyzed over 1,000 adverse-incident reports from six Joint Commission-accredited hospitals for LEP and English-speaking patients and found that 49% of LEP patients experienced physical harm versus 29.5% of English-speaking patients.6
I updated the patient’s LEP status that was missing in the chart, likely due to altered mental status at the time of admission. Reliable language and English proficiency data are usually entered at the patient’s point of entry with documentation of the language services required during the patient-provider encounter. The U.S. Census Bureau’s operational definition for LEP is a patient’s self-assessed ability to speak English less than “very well,” but how well it correlates with a patient’s actual English ability needs more study. Also, one’s self-assessed perception of ability might vary day to day, and language ability, by itself, is not static; it can differ from moment to moment and situation to situation. It may be easier to understand words in English when the situation is simple and less stressful than when things are complicated and stressful.
With a definition of LEP rather vague and the term somewhat derogatory, its meaning is open to interpretation. One study found that though speaking English less than “very well” was the most sensitive measure for identifying all of the patients who reported that they were unable to communicate effectively with their physicians, it was also the least specific.7 This lower specificity could lead to misclassification of some patients as LEP who are, in fact, able to effectively communicate in English with their physicians. This type of misclassification might lead to costly language assistance and carry the potential to cause conflicts between patient and provider. Telling a patient or family that they may have a “limited English proficiency” when they have believed otherwise and feel confident about their skills may come as a challenge. Some patients may also pretend to understand English to avoid being embarrassed about their linguistic abilities or perceive that they might be judged on their abilities in general.
Exiting the room, I gently reminded the RN to use the interpreter services. “Who has never been guilty of using an ad hoc interpreter or rushing through a long interpreter phone call due to time constraints?” I thought. A study from 2011 found that 43% of hospitalized patients with LEP had communicated without an interpreter present during admission, and 40% had communicated without an interpreter present after admission.8 In other words, a system in place does not mean service in use. But, the use of a trained interpreter is not only an obligation for care providers but a right for patients as per legal requirements of Title VI of the Civil Rights Act and the Standards for Culturally and Linguistically Appropriate Services (CLAS) by the Department of Health and Human Services’ (HSS) Office of Minority Health.9 In January 2010, The Joint Commission released a set of new and revised standards for patient-centered communication as part of an initiative to advance effective communication, cultural competence, and patient- and family-centered care.
Despite the requirements and availability of qualified medical interpreter services, there are multiple perceived and experienced barriers to the use of interpreter services. The most common one is that what comes as a free service for patients is a time commitment for providers. A long list of patients, acuity of the situation, and ease of use/availability of translation aids can change the calculus. One may be able to bill a prolonged service code (99354-99357) in addition to the appropriate E/M code, although a patient cannot be billed for the actual service provided by the interpreter. Longstanding CMS policy also permits reimbursement for translation/interpretation activities, so long as they are not included and paid for as part of the rate for direct service.10
The patient, however, insisted that she would rather have her son as the interpreter on the 3-way over the phone (OPI) conference call for interpretation. “He speaks good English and knows my medical history well,” she said. I counseled the patient on the benefits of using interpreter services and explained how to use the call button light and the visual aids.
Placing emphasis on educating patients about the benefits of using, and risks of not using, interpreter services is as essential as emphasizing that care providers use the services. Some patients may voluntarily choose to provide their own interpreter. Use of family members, friends, or unqualified staff as interpreters is one of the most commonly reported causes of errors by frontline staff. Using in-language collateral may help these patients understand how medical interpretation may create a better patient experience and outcome. A short factsheet, in different languages, on qualified interpreters’ expected benefits: meaning-for-meaning communication, impartiality, medical privacy, and improved patient safety and satisfaction, can also come in handy.
However, if the patient still refuses, providers should document the refusal of the offer of free language services, the name of the interpreter designated by the patient, the interpreter’s relationship to the LEP person, and the time or portions of the patient encounter that the interpreter’s services were used. Yet, language interpretation alone can be inadequate without document translation. According to one study, despite the availability of on-site professional interpreter services, hospitalized patients who do not speak English are less likely to have signed consent forms in their medical records.11 Health care professionals, therefore, need well-translated documents to treat LEP patients. Translated documents of consent forms for medical procedures, post-discharge instructions, prescription and medical device labels, and drug usage information may enhance informed decision making, safety and reduce stress and medical errors.
An unpopular and underused service needs it all: availability, convenience, monitoring, reporting, and team effort. Due to the sheer unpopularity and underuse of interpreter services, institutions should enhance ease of availability, monitor the use and quality of interpreter services, and optimize reporting of language-related errors. Ease of availability goes hand in hand with tapping local resources. Over the years, and even more so during the pandemic, in-person interpretation has transitioned to telephonic or video interpretation due to availability, safety, and cost issues. There are challenges in translating a language, and the absence of a visual channel adds another layer of complexity.
The current body of evidence does not indicate a superior interpreting method. Still, in one study providers and interpreters exposed to all three methods were more critical of remote methods and preferred videoconferencing to the telephone as a remote method. The significantly shorter phone interviews raised questions about the prospects of miscommunication in telephonic interpretation, given the absence of a visual channel.12
One way to bypass language barriers is to recognize the value added by hiring and training bilingual health care providers and fostering cultural competence. International medical graduates in many parts of the country aid in closing language barriers. Language-concordant care enhances trust between patients and physicians, optimizes health outcomes, and advances health equity for diverse populations.13-15 The presence of bilingual providers means more effective and timelier communication and improved patient satisfaction. But, according to a Doximity study, there is a significant “language gap” between those languages spoken by physicians and their patients.16 Hospitals, therefore, should assess, qualify, and incentivize staff who can serve as on-site medical interpreters for patients as a means to facilitate language concordant care for LEP patients.
The Agency of Healthcare Research and Quality (AHRQ) also has a guide on how hospitals can better identify, report, monitor, and prevent medical errors in patients with LEP. Included is the TeamSTEPPS LEP module to help develop and deploy a customized plan to train staff in teamwork skills and lead a medical teamwork improvement initiative.17
“Without my family, I was scared that nobody would understand me”
Back to the case. My patient was recovering well, and I was tying up loose ends on the switch day for the hospitalist teams.
“You will likely be discharged in a couple of days,” I said. She and the family were grateful and satisfied with the care. She had used the interpreter services and also received ethnocultural and language concordant and culturally competent care. Reducing language barriers is one of the crucial ways to reduce racial and ethnic disparities in quality of care and health outcomes, and it starts – in many cases – with identifying LEP patients. Proper use and monitoring of interpreter services, reporting language-related errors, hiring and testing bilingual staff’s language proficiency, and educating staff on cultural awareness are essential strategies for caring for LEP patients.
At my weeks’ end, in my handoff note to the incoming providers, I highlighted: “Patient will benefit from a Hindi speaking provider, Limited English Proficiency.”
Dr. Saigal is a hospitalist and clinical assistant professor of medicine in the division of hospital medicine at the Ohio State University Wexner Medical Center, Columbus.
References
1. Questions and Answers. Limited English Proficiency: A federal interagency website. www.lep.gov/commonly-asked-questions.
2. United States Census Bureau. Percent of people 5 years and over who speak English less than ‘very well’. www.census.gov/library/visualizations/interactive/people-that-speak-english-less-than-very-well.html.
3. Jacobs EA, et al. Overcoming language barriers in health care: Costs and benefits of interpreter services. Am J Public Health. 2004;94(5):866–869. doi: 10.2105/ajph.94.5.866.
4. Gandhi TK, et al. Drug complications in outpatients. J Gen Intern Med. 2000;15(3):149–154. doi: 10.1046/j.1525-1497.2000.04199.x.
5. Karliner LS, et al. Do professional interpreters improve clinical care for patients with limited English proficiency? A systematic review of the literature. Health Serv Res. 2007;42(2):727–754. doi: 10.1111/j.1475-6773.2006.00629.x.
6. Divi C, et al. Language proficiency and adverse events in US hospitals: a pilot study. Int J Qual Health Care. 2007 Apr;19(2):60-7. doi: 10.1093/intqhc/mzl069.
7. Karliner LS, et al. Identification of limited English proficient patients in clinical care. J Gen Intern Med. 2008;23(10):1555-1560. doi:10.1007/s11606-008-0693-y.
8. Schenker Y, et al. Patterns of interpreter use for hospitalized patients with limited English proficiency. J Gen Intern Med. 2011 Jul;26(7):712-7. doi: 10.1007/s11606-010-1619-z.
9. Office of Minority Health, US Department of Health and Human Services. National Standards for Culturally and Linguistically Appropriate Services in Health Care: Final Report. Washington, DC: US Department of Health and Human Services; 2001. https://minorityhealth.hhs.gov/assets/pdf/checked/finalreport.pdf.
10. www.medicaid.gov/medicaid/financial-management/medicaid-administrative-claiming/translation-and-interpretation-services/index.html
11. Schenker Y, et al. The Impact of Language Barriers on Documentation of Informed Consent at a Hospital with On-Site Interpreter Services. J Gen Intern Med. 2007 Nov;22 Suppl 2(Suppl 2):294-9. doi: 10.1007/s11606-007-0359-1.
12. Locatis C, et al. Comparing in-person, video, and telephonic medical interpretation. J Gen Intern Med. 2010;25(4):345-350. doi:10.1007/s11606-009-1236-x.
13. Dunlap JL, et al. The effects of language concordant care on patient satisfaction and clinical understanding for Hispanic pediatric surgery patients. J Pediatr Surg. 2015 Sep;50(9):1586-9. doi: 10.1016/j.jpedsurg.2014.12.020.
14. Diamond L, et al. A Systematic Review of the Impact of Patient–Physician Non-English Language Concordance on Quality of Care and Outcomes. J Gen Intern Med. 2019 Aug;34(8):1591-1606. doi: 10.1007/s11606-019-04847-5.
15. Ngo-Metzger Q, et al. Providing high-quality care for limited English proficient patients: the importance of language concordance and interpreter use. J Gen Intern Med. 2007 Nov;22 Suppl 2(Suppl 2):324-30. doi: 10.1007/s11606-007-0340-z.
16. https://press.doximity.com/articles/first-ever-national-study-to-examine-different-languages-spoken-by-us-doctors.
17. Agency for Healthcare Research and Quality. Patients with Limited English Proficiency. www.ahrq.gov/teamstepps/lep/index.html.
South Asian ancestry associated with twice the risk of heart disease
according to the results of a new study.
These findings confirm previous reports and practice guidelines that identify South Asian ancestry as a risk enhancer for atherosclerotic cardiovascular disease (ASCVD), suggesting that earlier heart disease screening and prevention is warranted in this patient population, lead author Aniruddh P. Patel, MD, research fellow at the Center for Genomic Medicine, Massachusetts General Hospital, Boston, and colleagues said.
“Previous studies in multiple countries have estimated a 1.7- to 4-fold higher risk of ASCVD among South Asian individuals, compared with other ancestries, but have important potential limitations,” Dr. Patel and colleagues wrote in the paper on their prospective cohort study, published in Circulation.
The INTERHEART case-control study, for example, which assessed risk factors for acute myocardial infarction among more than 15,000 cases from 52 countries, is now 2 decades old, and “may not reflect recent advances in cardiovascular disease prevention,” the investigators wrote.
Most studies in the area have been small and retrospective, they added, and have not adequately assessed emerging risk factors, such as prediabetes, which appear to play a relatively greater role in the development of heart disease among South Asians.
Methods and results
To address this knowledge gap, Dr. Patel and colleagues analyzed data from the UK Biobank prospective cohort study, including 449,349 middle-aged participants of European ancestry and 8,124 similarly aged participants of South Asian descent who did not have heart disease upon enrollment. Respective rates of incident ASCVD (i.e., MI, ischemic stroke, or coronary revascularization) were analyzed in the context of a variety of lifestyle, anthropometric, and clinical factors.
After a median follow-up of 11.1 years, individuals of South Asian descent had an incident ASCVD rate of 6.8%, compared with 4.4% for individuals of European descent, representing twice the relative risk (adjusted hazard ratio, 2.03; 95% CI, 1.86-2.22; P < .001). Even after accounting for all covariates, risk of ASCVD remained 45% higher for South Asian individuals (aHR, 1.45; 95% CI, 1.28-1.65; P < .001). This elevation in risk was not captured by existing risk calculators, including the American College of Cardiology/American Heart Association Pooled Cohort Equations, or the QRISK3 equations.
The findings were “largely consistent across a range of age, sex, and clinical subgroups,” and “confirm and extend previous reports that hypertension, diabetes, and central adiposity are the leading associations in this observed disparity,” the investigators wrote.
Two diabetes subtypes are more prevalent in South Asians
Hypertension, diabetes, and central adiposity do not fully explain South Asians’ higher risk for ASCVD, wrote Namratha R. Kandula, MD, of Northwestern University Medical Center, Chicago, and Alka M. Kanaya, MD, of the University of California, San Francisco, in an accompanying editorial published in Circulation.
Some of the undetected risk may stem from unique diabetes disease factors, Dr. Kandula and Dr. Kanaya added.
“Newer data have demonstrated distinct subtypes of type 2 diabetes, with South Asians having a higher prevalence of both a severe insulin resistant with obesity subtype and a less recognized severe insulin deficient subtype,” they wrote. “Importantly, both of these more prevalent diabetes subtypes in South Asians were associated with a higher incidence of coronary artery calcium, a marker of subclinical atherosclerosis and strong predictor of future ASCVD, compared to other diabetes subtypes.”
Diabetes rate is higher for South Asians in the U.S.
Although the present study was conducted in the United Kingdom, the findings likely apply to individuals of South Asian ancestry living in the United States, according to principal author Amit V. Khera, MD, associate director of the precision medicine unit at the Center for Genomic Medicine, Massachusetts General Hospital.
“There are already more than 5 million individuals of South Asian ancestry in the U.S. and this represents one of the fastest-growing ethnic subgroups,” Dr. Khera said in an interview. “As in our study of individuals in the U.K., South Asians in the U.S. suffer from diabetes at much higher rates – 23% versus 12% – and this often occurs even in the absence of obesity.”
Dr. Khera noted that the 2019 ACC/AHA Guideline on the Primary Prevention of Cardiovascular Disease identify South Asian ancestry as a risk-enhancing factor, calling this a “stopgap measure.” More work is needed, he said, in the research arena and in the clinic.
Zero South Asians included in studies used to develop risk estimator
“I think the first step is to simply acknowledge that the risk estimators we use in clinical practice have important limitations when it comes to diverse patient populations,” Dr. Khera said in an interview. “We saw this in our study, where – despite a more than doubling of risk – the predicted risk based on the equations used in primary care showed no difference. This risk estimator was developed based on legacy cohort studies, in [which] zero South Asians were included. Despite important differences across race/ethnicity, the current state-of-the-art in the U.S. is to use one equation for Black individuals and another for all other ethnicities.”
Experts suggest steps for reducing heart disease risk
While risk modeling remains suboptimal, Dr. Khera suggested that clinicians can take immediate steps to reduce the risk of heart disease among individuals with South Asian ancestry.
“Despite all of the uncertainty – we still don’t have a complete understanding of why the risk is so high – there are still several things primary care doctors can do for their patients,” Dr. Khera said.
Foremost, he recommended lifestyle and dietary counseling.
“Dietary counseling is particularly effective if put in the context of cultural norms,” Dr. Khera said. “Many South Asians consider fruit juices or white rice to be healthy, when they lead to rapid spikes in blood sugar.”
Dr. Khera also advised earlier heart disease screening, such as coronary calcium scanning “sometime between age 40-50 years,” noting that positive test results may motivate patients to start or adhere to medications, such as cholesterol-lowering therapies. If necessary, clinicians can also refer to heart centers for South Asian patients, which are becoming increasingly common.

According to Cheryl A.M. Anderson, PhD, chair of the AHA’s Council on Epidemiology and Prevention, and professor and dean of the Herbert Wertheim School of Public Health and Human Longevity Science at the University of California, San Diego, the current study suggests that heart disease management strategies for South Asian patients may be lacking.
“We have had a tradition of preventing or trying to treat heart disease in a fashion that doesn’t yet account for the increased risk that might be prevalent in those of South Asian ancestry,” Dr. Anderson said in an interview.
She suggested that improving associated risk-analysis tools could be beneficial, although the tools themselves, in the context of race or ethnicity, may present their own risks.
“We want to be mindful of potential adverse implications from having everything linked to one’s ancestry, which I think this tool doesn’t do,” Dr. Anderson said, referring to the AHA/ACC Pooled Cohort Equations. “But in sort of the bigger picture of things, we always want to expand and refine our toolkit.”

According to Rajesh Dash, MD, PhD, associate professor, cardiologist, and director of the South Asian Translational Heart Initiative (SSATHI) Prevention Clinic and CardioClick Telemedicine Clinic at Stanford (Calif.) HealthCare, the science supports more active risk mitigation strategies for South Asian patients, and the AHA and the ACC “are the two entities that need to lead the way.”
“Certainly the American Heart Association and the American College of Cardiology should be taking a more active leadership role in this,” Dr. Dash said in an interview.
In 2018, the AHA issued a scientific statement about the elevated risk of ASCVD among South Asian individuals, “but it did not rise to the level of specific recommendations, and did not necessarily go as far as to incorporate new screening parameters for that population,” Dr. Dash said. He also noted that the most recent AHA/ACC guideline identifies South Asian ancestry as a risk-enhancing feature, a statement similarly lacking in actionable value.
“That does not definitively lead someone like a primary care physician to a decision to start a statin, or to be more aggressive with a diagnostic workup, like a stress test, for instance, for a patient who they otherwise would not have done one in had they not been South Asian,” Dr. Dash said.
The steps taken by the AHA and the ACC are “a healthy step forward,” he noted, “but not nearly the degree of attention or vigilance that is required, as well as the level of action that is required to change the narrative for the population.”
At the SSATHI Prevention Clinic, Dr. Dash and colleagues aren’t waiting for the narrative to change, and are already taking a more aggressive approach.
The clinic has an average patient age of 41 years, “easily 15 years younger than the average age in most cardiology clinics,” Dr. Dash said, based on the fact that approximately two-thirds of heart attacks in South Asian individuals occur under the age of 55. “We have to look earlier.”
The SSATHI Prevention Clinic screens for both traditional and emerging risk factors, and Dr. Dash suggested that primary care doctors should do the same.
“If you have a South Asian patient as a primary care physician, you should be aggressively looking for risk factors, traditional ones to start, like elevated cholesterol, hypertension, diabetes, or – and I would argue strongly – prediabetes or insulin resistance.”
Dr. Dash also recommended looking into family history, and considering screening for inflammatory biomarkers, the latter of which are commonly elevated at an earlier age among South Asian individuals, and may have a relatively greater prognostic impact.
To encourage broader implementation of this kind of approach, Dr. Dash called for more large-scale studies. Ideally, these would be randomized clinical trials, but, realistically, real-world datasets may be the answer.
The study was supported by the National Heart, Lung, and Blood Institute; the Broad Institute at MIT and Harvard; the National Human Genome Research Institute; and others. The investigators disclosed relationships with IBM Research, Sanofi, Amgen, and others. Dr. Dash disclosed relationships with HealthPals and AstraZeneca. Dr. Anderson reported no relevant conflicts of interest.
according to the results of a new study.
These findings confirm previous reports and practice guidelines that identify South Asian ancestry as a risk enhancer for atherosclerotic cardiovascular disease (ASCVD), suggesting that earlier heart disease screening and prevention is warranted in this patient population, lead author Aniruddh P. Patel, MD, research fellow at the Center for Genomic Medicine, Massachusetts General Hospital, Boston, and colleagues said.
“Previous studies in multiple countries have estimated a 1.7- to 4-fold higher risk of ASCVD among South Asian individuals, compared with other ancestries, but have important potential limitations,” Dr. Patel and colleagues wrote in the paper on their prospective cohort study, published in Circulation.
The INTERHEART case-control study, for example, which assessed risk factors for acute myocardial infarction among more than 15,000 cases from 52 countries, is now 2 decades old, and “may not reflect recent advances in cardiovascular disease prevention,” the investigators wrote.
Most studies in the area have been small and retrospective, they added, and have not adequately assessed emerging risk factors, such as prediabetes, which appear to play a relatively greater role in the development of heart disease among South Asians.
Methods and results
To address this knowledge gap, Dr. Patel and colleagues analyzed data from the UK Biobank prospective cohort study, including 449,349 middle-aged participants of European ancestry and 8,124 similarly aged participants of South Asian descent who did not have heart disease upon enrollment. Respective rates of incident ASCVD (i.e., MI, ischemic stroke, or coronary revascularization) were analyzed in the context of a variety of lifestyle, anthropometric, and clinical factors.
After a median follow-up of 11.1 years, individuals of South Asian descent had an incident ASCVD rate of 6.8%, compared with 4.4% for individuals of European descent, representing twice the relative risk (adjusted hazard ratio, 2.03; 95% CI, 1.86-2.22; P < .001). Even after accounting for all covariates, risk of ASCVD remained 45% higher for South Asian individuals (aHR, 1.45; 95% CI, 1.28-1.65; P < .001). This elevation in risk was not captured by existing risk calculators, including the American College of Cardiology/American Heart Association Pooled Cohort Equations, or the QRISK3 equations.
The findings were “largely consistent across a range of age, sex, and clinical subgroups,” and “confirm and extend previous reports that hypertension, diabetes, and central adiposity are the leading associations in this observed disparity,” the investigators wrote.
Two diabetes subtypes are more prevalent in South Asians
Hypertension, diabetes, and central adiposity do not fully explain South Asians’ higher risk for ASCVD, wrote Namratha R. Kandula, MD, of Northwestern University Medical Center, Chicago, and Alka M. Kanaya, MD, of the University of California, San Francisco, in an accompanying editorial published in Circulation.
Some of the undetected risk may stem from unique diabetes disease factors, Dr. Kandula and Dr. Kanaya added.
“Newer data have demonstrated distinct subtypes of type 2 diabetes, with South Asians having a higher prevalence of both a severe insulin resistant with obesity subtype and a less recognized severe insulin deficient subtype,” they wrote. “Importantly, both of these more prevalent diabetes subtypes in South Asians were associated with a higher incidence of coronary artery calcium, a marker of subclinical atherosclerosis and strong predictor of future ASCVD, compared to other diabetes subtypes.”
Diabetes rate is higher for South Asians in the U.S.
Although the present study was conducted in the United Kingdom, the findings likely apply to individuals of South Asian ancestry living in the United States, according to principal author Amit V. Khera, MD, associate director of the precision medicine unit at the Center for Genomic Medicine, Massachusetts General Hospital.
“There are already more than 5 million individuals of South Asian ancestry in the U.S. and this represents one of the fastest-growing ethnic subgroups,” Dr. Khera said in an interview. “As in our study of individuals in the U.K., South Asians in the U.S. suffer from diabetes at much higher rates – 23% versus 12% – and this often occurs even in the absence of obesity.”
Dr. Khera noted that the 2019 ACC/AHA Guideline on the Primary Prevention of Cardiovascular Disease identify South Asian ancestry as a risk-enhancing factor, calling this a “stopgap measure.” More work is needed, he said, in the research arena and in the clinic.
Zero South Asians included in studies used to develop risk estimator
“I think the first step is to simply acknowledge that the risk estimators we use in clinical practice have important limitations when it comes to diverse patient populations,” Dr. Khera said in an interview. “We saw this in our study, where – despite a more than doubling of risk – the predicted risk based on the equations used in primary care showed no difference. This risk estimator was developed based on legacy cohort studies, in [which] zero South Asians were included. Despite important differences across race/ethnicity, the current state-of-the-art in the U.S. is to use one equation for Black individuals and another for all other ethnicities.”
Experts suggest steps for reducing heart disease risk
While risk modeling remains suboptimal, Dr. Khera suggested that clinicians can take immediate steps to reduce the risk of heart disease among individuals with South Asian ancestry.
“Despite all of the uncertainty – we still don’t have a complete understanding of why the risk is so high – there are still several things primary care doctors can do for their patients,” Dr. Khera said.
Foremost, he recommended lifestyle and dietary counseling.
“Dietary counseling is particularly effective if put in the context of cultural norms,” Dr. Khera said. “Many South Asians consider fruit juices or white rice to be healthy, when they lead to rapid spikes in blood sugar.”
Dr. Khera also advised earlier heart disease screening, such as coronary calcium scanning “sometime between age 40-50 years,” noting that positive test results may motivate patients to start or adhere to medications, such as cholesterol-lowering therapies. If necessary, clinicians can also refer to heart centers for South Asian patients, which are becoming increasingly common.
According to Cheryl A.M. Anderson, PhD, chair of the AHA’s Council on Epidemiology and Prevention, and professor and dean of the Herbert Wertheim School of Public Health and Human Longevity Science at the University of California, San Diego, the current study suggests that heart disease management strategies for South Asian patients may be lacking.
“We have had a tradition of preventing or trying to treat heart disease in a fashion that doesn’t yet account for the increased risk that might be prevalent in those of South Asian ancestry,” Dr. Anderson said in an interview.
She suggested that improving associated risk-analysis tools could be beneficial, although the tools themselves, in the context of race or ethnicity, may present their own risks.
“We want to be mindful of potential adverse implications from having everything linked to one’s ancestry, which I think this tool doesn’t do,” Dr. Anderson said, referring to the AHA/ACC Pooled Cohort Equations. “But in sort of the bigger picture of things, we always want to expand and refine our toolkit.”
According to Rajesh Dash, MD, PhD, associate professor, cardiologist, and director of the South Asian Translational Heart Initiative (SSATHI) Prevention Clinic and CardioClick Telemedicine Clinic at Stanford (Calif.) HealthCare, the science supports more active risk mitigation strategies for South Asian patients, and the AHA and the ACC “are the two entities that need to lead the way.”
“Certainly the American Heart Association and the American College of Cardiology should be taking a more active leadership role in this,” Dr. Dash said in an interview.
In 2018, the AHA issued a scientific statement about the elevated risk of ASCVD among South Asian individuals, “but it did not rise to the level of specific recommendations, and did not necessarily go as far as to incorporate new screening parameters for that population,” Dr. Dash said. He also noted that the most recent AHA/ACC guideline identifies South Asian ancestry as a risk-enhancing feature, a statement similarly lacking in actionable value.
“That does not definitively lead someone like a primary care physician to a decision to start a statin, or to be more aggressive with a diagnostic workup, like a stress test, for instance, for a patient who they otherwise would not have done one in had they not been South Asian,” Dr. Dash said.
The steps taken by the AHA and the ACC are “a healthy step forward,” he noted, “but not nearly the degree of attention or vigilance that is required, as well as the level of action that is required to change the narrative for the population.”
At the SSATHI Prevention Clinic, Dr. Dash and colleagues aren’t waiting for the narrative to change, and are already taking a more aggressive approach.
The clinic has an average patient age of 41 years, “easily 15 years younger than the average age in most cardiology clinics,” Dr. Dash said, based on the fact that approximately two-thirds of heart attacks in South Asian individuals occur under the age of 55. “We have to look earlier.”
The SSATHI Prevention Clinic screens for both traditional and emerging risk factors, and Dr. Dash suggested that primary care doctors should do the same.
“If you have a South Asian patient as a primary care physician, you should be aggressively looking for risk factors, traditional ones to start, like elevated cholesterol, hypertension, diabetes, or – and I would argue strongly – prediabetes or insulin resistance.”
Dr. Dash also recommended looking into family history, and considering screening for inflammatory biomarkers, the latter of which are commonly elevated at an earlier age among South Asian individuals, and may have a relatively greater prognostic impact.
To encourage broader implementation of this kind of approach, Dr. Dash called for more large-scale studies. Ideally, these would be randomized clinical trials, but, realistically, real-world datasets may be the answer.
The study was supported by the National Heart, Lung, and Blood Institute; the Broad Institute at MIT and Harvard; the National Human Genome Research Institute; and others. The investigators disclosed relationships with IBM Research, Sanofi, Amgen, and others. Dr. Dash disclosed relationships with HealthPals and AstraZeneca. Dr. Anderson reported no relevant conflicts of interest.
FROM CIRCULATION
From Buns to Braids and Ponytails: Entering a New Era of Female Military Hair-Grooming Standards
Professional appearance of servicemembers has been a long-standing custom in the US Military. Specific standards are determined by each branch. Initially, men dominated the military.1,2 As the number of women as well as racial diversity increased in the military, modifications to grooming standards were slow to change and resulted in female hair standards requiring a uniform tight and sleek style or short haircut. Clinicians can be attuned to these occupational standards and their implications on the diagnosis and management of common diseases of the hair and scalp.
History of Hairstyle Standards for Female Servicemembers
For half a century, female servicemembers had limited hairstyle choices. They were not authorized to have hair shorter than one-quarter inch in length. They could choose either short hair worn down or long hair with neatly secured loose ends in the form of a bun or a tucked braid—both of which could not extend past the bottom edge of the uniform collar.3-5 Female navy sailors and air force airmen with long hair were only allowed to wear ponytails during physical training; however, army soldiers previously were limited to wearing a bun.3,6,7 Cornrows and microbraids were authorized in the mid-1990s for the US Air Force, but policy stated that locs were prohibited due to their “unkempt” and “matted” nature. Furthermore, the size of hair bulk in the air force was restricted to no more than 3 inches and could not obstruct wear of the uniform cap.5 Based on these regulations, female servicemembers with longer hair had to utilize tight hairstyles that caused prolonged traction and pressure along the scalp, which contributed to headaches, a sore scalp, and alopecia over time. Normalization of these symptoms led to underreporting, as women lived with the consequences or turned to shorter hairstyles.
In the last decade alone, female servicemembers have witnessed the greatest number of changes in authorized hairstyles despite being part of the military for more than 50 years (Figure 1).1-11 In 2014, the language used in the air force instructions to describe locs was revised to remove ethnically offensive terms.4,5 This same year, the army allowed female soldiers to wear ponytails during physical training, a privilege that had been authorized by other services years prior.3,6,7 By the end of 2018, locs were authorized by all services, and female sailors could wear a ponytail in all navy uniforms as long as it did not extend 3 inches below the collar.3,4,6-8 In 2018, the air force increased authorized hair bulk up to 3.5 inches from the previous mandate of 3 inches and approved female buzz cuts6,9; in 2020, it allowed hair bulk up to 4 inches. As of 2021, female airmen can wear a ponytail and/or braid(s) as long as it starts below the crown of the head and the length does not extend below a horizontal line running between the top of each sleeve inseam at the underarm (Figures 2–4).6 In an ongoing effort to be more inclusive of hair density differences, female airmen will be authorized to wear a ponytail not exceeding a maximum width bulk of 1 ft starting June 25, 2021, so long as they can comply with the above regulations.11 The army now allows ponytails and braids across all uniforms, as long they do not extend past the bottom of the shoulder blades. This change came just months after authorizing the wearing of ponytails tucked under the uniform blouse with tactical headgear.10 These changes allow for a variety of hairstyles for members to practice while avoiding the physical consequences that develop from repetitive traction and pressure along the same areas of the hair and scalp.
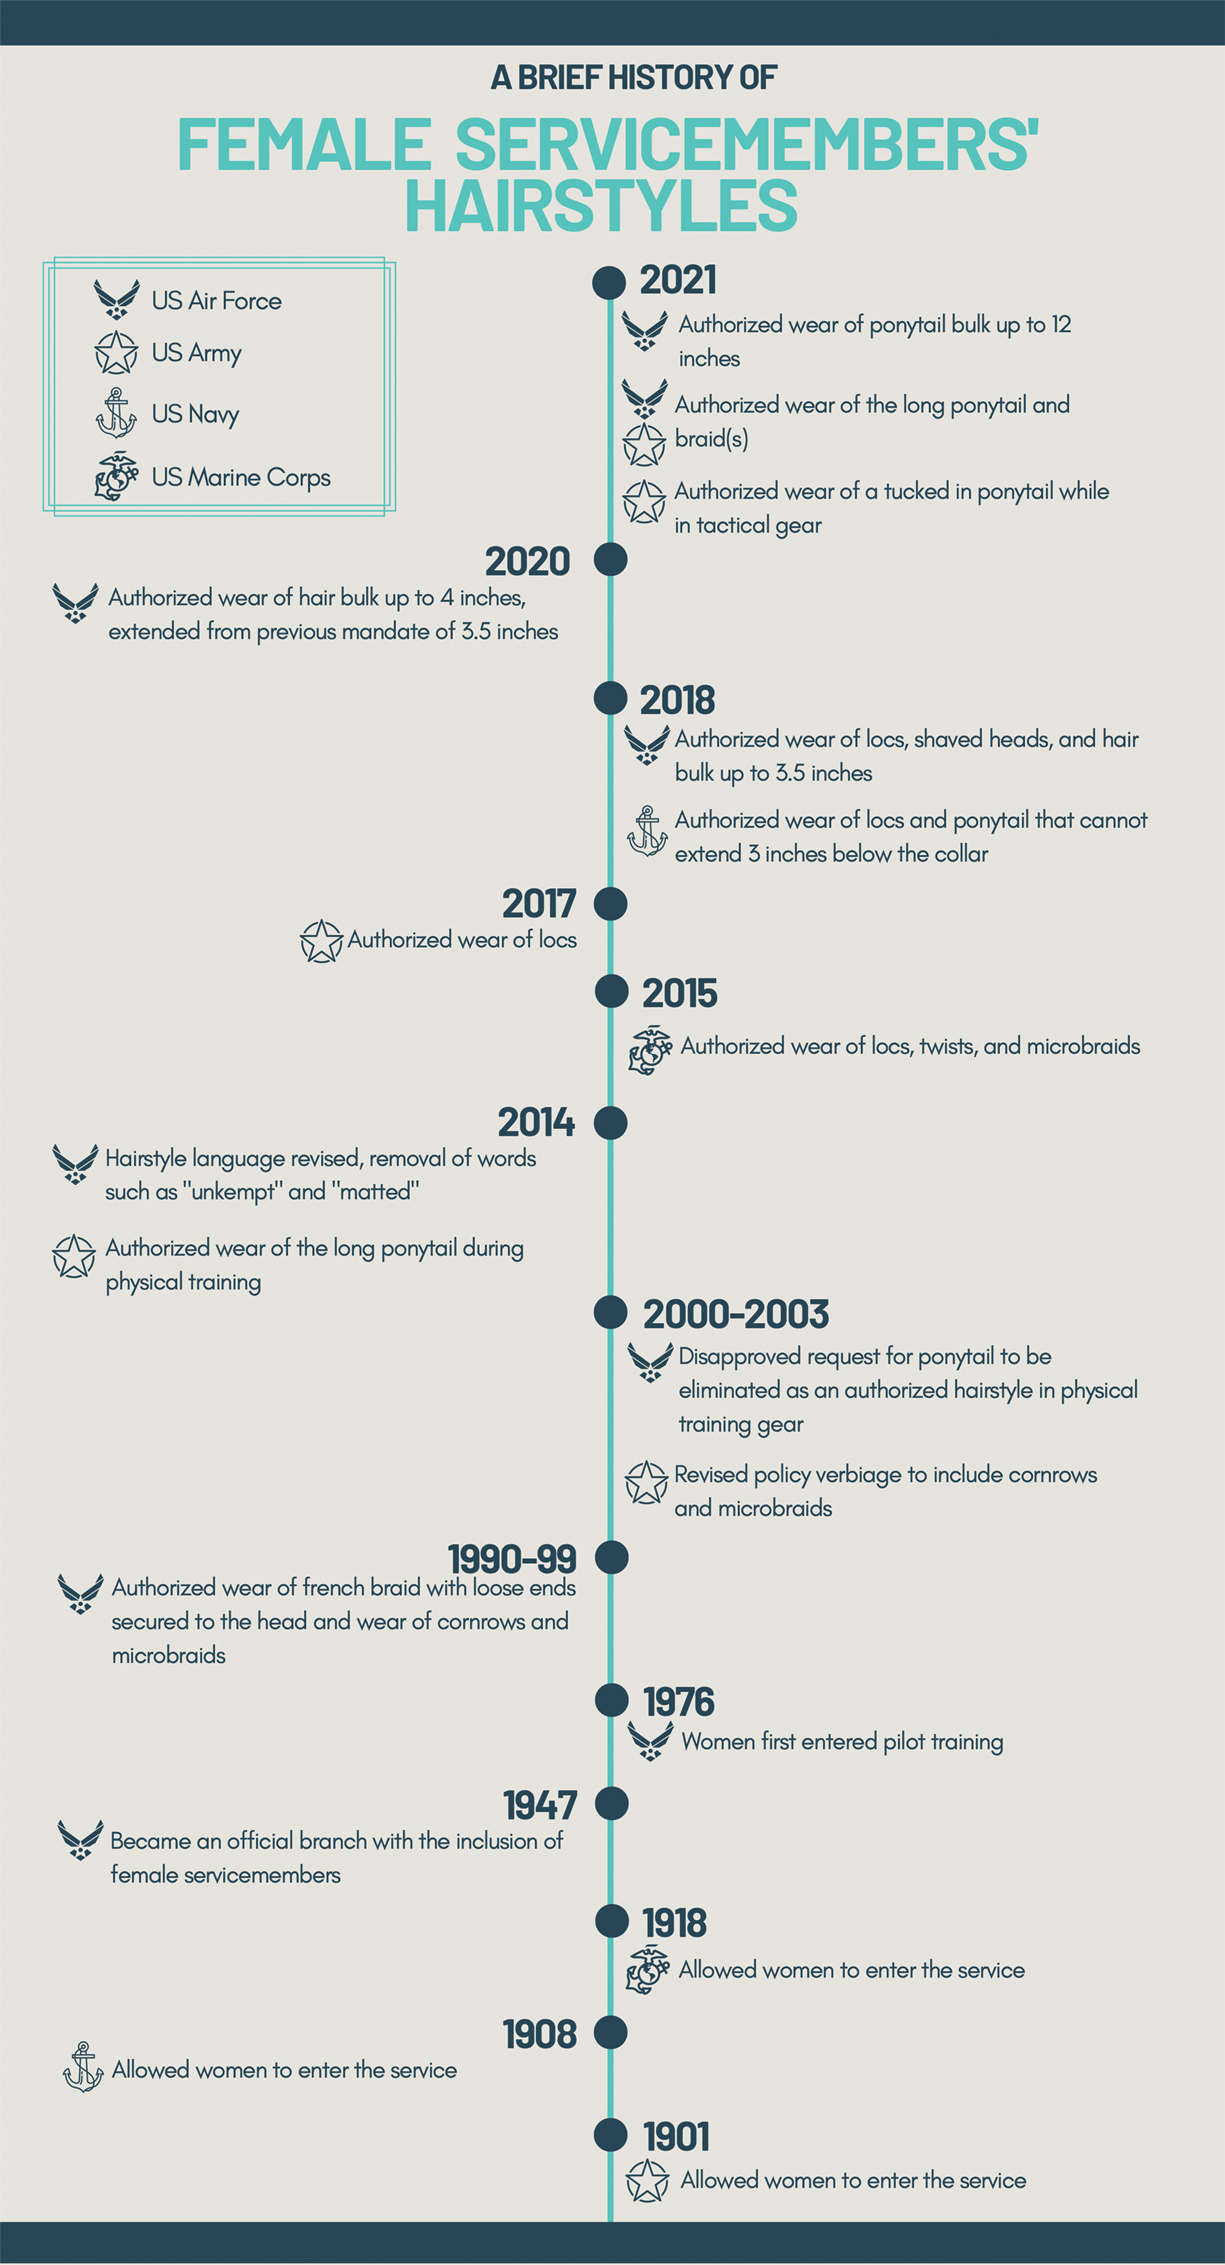
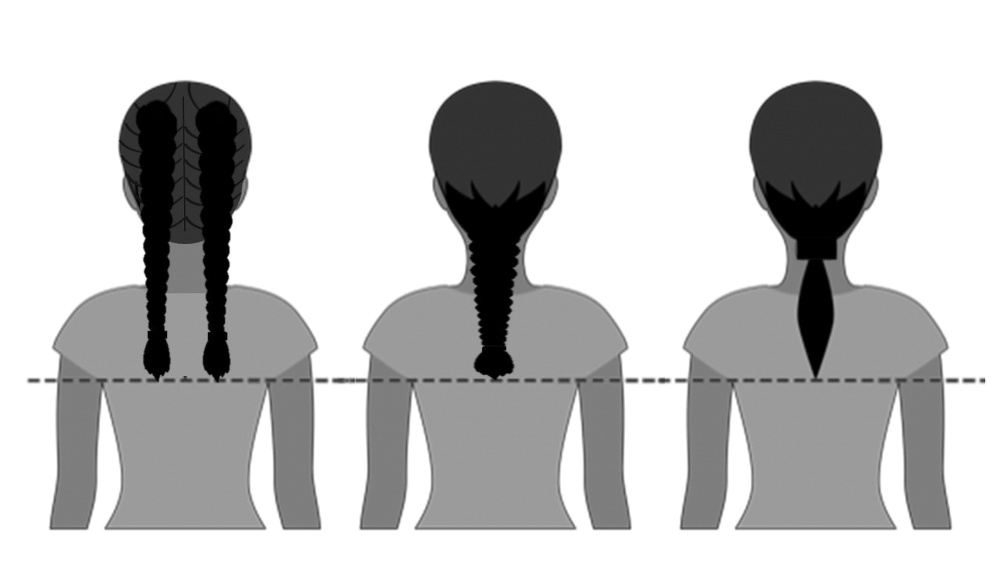


Common Hair Disorders in Female Servicemembers
Herein, we discuss 3 of the most common hair and scalp disorders linked to grooming practices utilized by women to meet prior military regulations: trichorrhexis nodosa (TN), extracranial headaches, and traction alopecia (TA). It is essential that health care providers are able to promptly recognize these conditions, understand their risk factors, and be familiar with first-line treatment options. With these new standards, the hope is that the incidence of the following conditions decreases, thus improving servicemembers’ medical readiness and overall quality of life.
Trichorrhexis Nodosa
Acquired TN is a defect in the hair shaft that causes the hair to break easily secondary to chemical, thermal, or mechanical trauma. This can include but is not limited to chemical relaxers, blow-dryers, excessive brushing or styling, flat irons, and tightly packed hairstyles. The condition is characterized by a thickened hair diameter and splitting at the tip. Clinically, it may present as brittle, lusterless, broken hair with split ends, as well as a positive tug test.14 Management includes gentle hair care and avoidance of harsh hair care practices and treatments.
Extracranial Headaches
Headaches are a common concern among military servicemembers15 and generally are classified as primary or secondary. A less commonly discussed primary headache disorder includes external-pressure headaches, which result from either sustained compression or traction of the soft tissues of the scalp, usually from wearing headbands, helmets, or tight hairstyles.16 Additional at-risk groups include those who chronically wear surgical scrub caps or flight caps, especially if clipped or pinned to the hair. In our 38 years of combined military clinical experience, we can attest that these types of headaches are common among female servicemembers. The diagnostic criteria for an external-pressure headache, commonly referred to by patients as a “ponytail headache,” includes at least 2 headache episodes triggered within 1 hour of sustained traction on the scalp, maximal at the site of traction and resolving within 1 hour after relieving the traction.16 Management includes removal of the pressure-causing source, usually a tight ponytail or bun.
Traction Alopecia
Traction alopecia is hair loss caused by repetitive or prolonged tension on the hair secondary to tight hairstyles. It can be clinically classified into 2 types: marginal and nonmarginal patchy alopecia (Figure 5).13,17,18 Traction alopecia most commonly is found in individuals with ethnic hair, predominantly Black women. Hairstyles with the highest risk for causing TA include tight buns, ponytails, cornrows, weaves, and locs—all of which are utilized by female servicemembers to maintain a professional appearance and adhere to grooming regulations.13,18 Other groups at risk include athletes (eg, ballerinas, gymnasts) and those with chronic headwear use (eg, turbans, helmets, nurse caps, wigs).18 Early TA typically presents with perifollicular erythema followed by follicular-based papules or pustules.13,18 Marginal TA classically includes frontotemporal hair loss or thinning with or without a fringe sign.17,18 Nonmarginal TA includes patchy alopecia most commonly involving the parietal or occipital scalp, seen with chignons, buns, ponytails, or the use of clips, extensions, or bobby pins.18 The first line in management is avoidance of traction-causing hairstyles or headgear. Medical therapy may be warranted and consists of a single agent or combination regimen to include oral or topical antibiotics, topical or intralesional steroids, and topical minoxidil.13,18
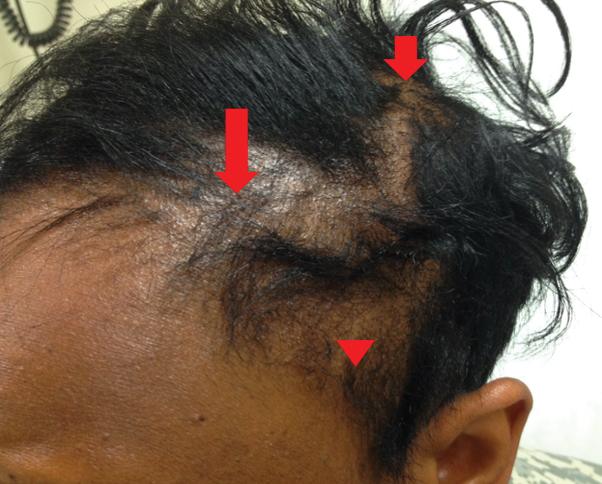
Final Thoughts
Military hair-grooming standards have evolved over time. Recent changes show that the US Department of Defense is seriously evaluating policies that may be inherently exclusive. Prior grooming standards resulted in the widespread use of tight hairstyles and harsh hair treatments among female servicemembers with long hair. These practices resulted in TN, extracranial headaches, and TA, among other hair and scalp disorders. These occupational-related hair conditions impact female servicemembers’ mental and physical well-being and thus impact military readiness. Physicians should recognize that these conditions can be related to occupational grooming standards that may impact hair care practices.
The challenge that remains is a lack of standardized documentation for hair and scalp symptoms in the medical record. Due to a paucity in reporting and documentation, limited objective data exist to guide future recommendations for military grooming standards. Another obstacle is the lack of knowledge of hair diseases among primary care providers and patients, especially due to the underrepresentation of ethnic hair in medical textbooks.19 As a result, women frequently accept their hair symptoms as normal and either suffer through them, cut their hair short, or wear wigs before considering a visit to the doctor. Furthermore, hair-grooming standards can expose racial disparities, which are the driving force behind the current policy changes. Clinicians can strive to ask about hair and scalp symptoms and document the following in relation to hair and scalp disorders: occupational grooming requirements; skin and hair type; location, number, and size of scalp lesion(s); onset; duration; current and prior hair care practices; history of treatment; and clinical course accompanied with photographic documentation. Ultimately, improved awareness in patients, collaboration between physicians, and consistent clinical documentation can help create positive change and continued improvement in hair-grooming standards within the military. Improved reporting and documentation will facilitate further study into the effectiveness of the updated hair-grooming standards in female servicemembers.
- United States Air Force Statistical Digest FY 1999. United States Air Force; 2000. Accessed June 8, 2021. https://media.defense.gov/2011/Apr/14/2001330240/-1/-1/0/AFD-110414-048.pdf
- Air Force demographics. Air Force Personnel Center website. Accessed June 8, 2021. https://www.afpc.af.mil/About/Air-Force-Demographics/
- US Department of the Army. Wear and Appearance of Army Uniforms and Insignia: Army Regulation 670-1. Department of the Army; 2021. Accessed June 8, 2021. https://armypubs.army.mil/epubs/DR_pubs/DR_a/ARN30302-AR_670-1-000-WEB-1.pdf
- Losey S. Loc hairstyles, off-duty earrings for men ok’d in new dress regs. Air Force Times. Published July 16, 2018. Accessed June 8, 2021. https://www.airforcetimes.com/news/your-air-force/2018/07/16/loc-hairstyles-off-duty-earrings-for-men-okd-in-new-dress-regs/
- Department of the Air Force. AFT 36-2903, Dress and Personal Appearance of Air Force Personnel. Department of the Air Force; 2011. Accessed June 8, 2021. https://www.uc.edu/content/dam/uc/afrotc/docs/Documents/AFI36-2903.pdf
- Department of the Air Force. AFT 36-2903, Dress and Personal Appearance of Air Force Personnel. Department of the Air Force; 2021. Accessed June 8, 2021. https://static.e-publishing.af.mil/production/1/af_a1/publication/afi36-2903/afi36-2903.pdf
- U.S. Navy uniform regulations: summary of changes (26 February 2020). Navy Personnel Command website. Accessed June 8, 2021. https://www.mynavyhr.navy.mil/Portals/55/Navy%20Uniforms/Uniform%20Regulations/Documents/SOC_2020_02_26.pdf?ver=y8Wd0ykVXgISfFpOy8qHkg%3d%3d
- US Headquarters Marine Corps. Marine Corps Uniform Regulations: Marine Corps Order 1020.34H. United States Marine Corps, 2018. Accessed June 8, 2021. https://www.marines.mil/portals/1/Publications/MCO%201020.34H%20v2.pdf?ver=2018-06-26-094038-137
- Secretary of the Air Force Public Affairs. Air Force to allow longer braids, ponytails, bangs for women. United States Air Force website. Published January 21, 2021. Accessed June 8, 2021. https://www.af.mil/News/Article-Display/Article/2478173/air-force-to-allow-longer-braids-ponytails-bangs-for-women/
- Britzky H. The Army will now allow women to wear ponytails in all uniforms. Task & Purpose. Published May 6, 2021. Accessed June 8, 2021. https://taskandpurpose.com/news/army-women-ponytails-all-uniforms/
- Secretary of the Air Force Public Affairs. Air Force readdresses women’s hair standard after feedback. US Air Force website. Published June 11, 2021. Accessed June 27, 2021. https://www.af.mil/News/Article-Display/Article/2654774/air-force-readdresses-womens-hair-standard-after-feedback/
- Myers M. Esper direct services to review racial bias in grooming standards, training and more. Air Force Times. Published July 15, 2020. Accessed June 8, 2021. https://www.airforcetimes.com/news/your-military/2020/07/15/esper-directs-services-to-review-racial-bias-in-grooming-standards-training-and-more/
- Madu P, Kundu RV. Follicular and scarring disorders in skin of color: presentation and management. Am J Clin Dermatol. 2014;15:307-321.
- Quaresma M, Martinez Velasco M, Tosti A. Hair breakage in patients of African descent: role of dermoscopy. Skin Appendage Disord. 2015;1:99-104.
- Burch RC, Loder S, Loder E, et al. The prevalence and burden of migraine and severe headache in the United States: updated statistics from government health surveillance studies. Headache. 2015;55:21-34.
- Kararizou E, Bougea AM, Giotopoulou D, et al. An update on the less-known group of other primary headaches—a review. Eur Neurol Rev. 2014;9:71-77.
- Sperling L, Cowper S, Knopp E. An Atlas of Hair Pathology with Clinical Correlations. CRC Press; 2012:67-68.
- Billero V, Miteva M. Traction alopecia: the root of the problem. Clin Cosmet Investig Dermatol. 2018;11:149-159.
- Adelekun A, Onyekaba G, Lipoff JB. Skin color in dermatology textbooks: an updated evaluation and analysis. J Am Acad Dermatol. 2021;84:194-196.
Professional appearance of servicemembers has been a long-standing custom in the US Military. Specific standards are determined by each branch. Initially, men dominated the military.1,2 As the number of women as well as racial diversity increased in the military, modifications to grooming standards were slow to change and resulted in female hair standards requiring a uniform tight and sleek style or short haircut. Clinicians can be attuned to these occupational standards and their implications on the diagnosis and management of common diseases of the hair and scalp.
History of Hairstyle Standards for Female Servicemembers
For half a century, female servicemembers had limited hairstyle choices. They were not authorized to have hair shorter than one-quarter inch in length. They could choose either short hair worn down or long hair with neatly secured loose ends in the form of a bun or a tucked braid—both of which could not extend past the bottom edge of the uniform collar.3-5 Female navy sailors and air force airmen with long hair were only allowed to wear ponytails during physical training; however, army soldiers previously were limited to wearing a bun.3,6,7 Cornrows and microbraids were authorized in the mid-1990s for the US Air Force, but policy stated that locs were prohibited due to their “unkempt” and “matted” nature. Furthermore, the size of hair bulk in the air force was restricted to no more than 3 inches and could not obstruct wear of the uniform cap.5 Based on these regulations, female servicemembers with longer hair had to utilize tight hairstyles that caused prolonged traction and pressure along the scalp, which contributed to headaches, a sore scalp, and alopecia over time. Normalization of these symptoms led to underreporting, as women lived with the consequences or turned to shorter hairstyles.
In the last decade alone, female servicemembers have witnessed the greatest number of changes in authorized hairstyles despite being part of the military for more than 50 years (Figure 1).1-11 In 2014, the language used in the air force instructions to describe locs was revised to remove ethnically offensive terms.4,5 This same year, the army allowed female soldiers to wear ponytails during physical training, a privilege that had been authorized by other services years prior.3,6,7 By the end of 2018, locs were authorized by all services, and female sailors could wear a ponytail in all navy uniforms as long as it did not extend 3 inches below the collar.3,4,6-8 In 2018, the air force increased authorized hair bulk up to 3.5 inches from the previous mandate of 3 inches and approved female buzz cuts6,9; in 2020, it allowed hair bulk up to 4 inches. As of 2021, female airmen can wear a ponytail and/or braid(s) as long as it starts below the crown of the head and the length does not extend below a horizontal line running between the top of each sleeve inseam at the underarm (Figures 2–4).6 In an ongoing effort to be more inclusive of hair density differences, female airmen will be authorized to wear a ponytail not exceeding a maximum width bulk of 1 ft starting June 25, 2021, so long as they can comply with the above regulations.11 The army now allows ponytails and braids across all uniforms, as long they do not extend past the bottom of the shoulder blades. This change came just months after authorizing the wearing of ponytails tucked under the uniform blouse with tactical headgear.10 These changes allow for a variety of hairstyles for members to practice while avoiding the physical consequences that develop from repetitive traction and pressure along the same areas of the hair and scalp.
Common Hair Disorders in Female Servicemembers
Herein, we discuss 3 of the most common hair and scalp disorders linked to grooming practices utilized by women to meet prior military regulations: trichorrhexis nodosa (TN), extracranial headaches, and traction alopecia (TA). It is essential that health care providers are able to promptly recognize these conditions, understand their risk factors, and be familiar with first-line treatment options. With these new standards, the hope is that the incidence of the following conditions decreases, thus improving servicemembers’ medical readiness and overall quality of life.
Trichorrhexis Nodosa
Acquired TN is a defect in the hair shaft that causes the hair to break easily secondary to chemical, thermal, or mechanical trauma. This can include but is not limited to chemical relaxers, blow-dryers, excessive brushing or styling, flat irons, and tightly packed hairstyles. The condition is characterized by a thickened hair diameter and splitting at the tip. Clinically, it may present as brittle, lusterless, broken hair with split ends, as well as a positive tug test.14 Management includes gentle hair care and avoidance of harsh hair care practices and treatments.
Extracranial Headaches
Headaches are a common concern among military servicemembers15 and generally are classified as primary or secondary. A less commonly discussed primary headache disorder includes external-pressure headaches, which result from either sustained compression or traction of the soft tissues of the scalp, usually from wearing headbands, helmets, or tight hairstyles.16 Additional at-risk groups include those who chronically wear surgical scrub caps or flight caps, especially if clipped or pinned to the hair. In our 38 years of combined military clinical experience, we can attest that these types of headaches are common among female servicemembers. The diagnostic criteria for an external-pressure headache, commonly referred to by patients as a “ponytail headache,” includes at least 2 headache episodes triggered within 1 hour of sustained traction on the scalp, maximal at the site of traction and resolving within 1 hour after relieving the traction.16 Management includes removal of the pressure-causing source, usually a tight ponytail or bun.
Traction Alopecia
Traction alopecia is hair loss caused by repetitive or prolonged tension on the hair secondary to tight hairstyles. It can be clinically classified into 2 types: marginal and nonmarginal patchy alopecia (Figure 5).13,17,18 Traction alopecia most commonly is found in individuals with ethnic hair, predominantly Black women. Hairstyles with the highest risk for causing TA include tight buns, ponytails, cornrows, weaves, and locs—all of which are utilized by female servicemembers to maintain a professional appearance and adhere to grooming regulations.13,18 Other groups at risk include athletes (eg, ballerinas, gymnasts) and those with chronic headwear use (eg, turbans, helmets, nurse caps, wigs).18 Early TA typically presents with perifollicular erythema followed by follicular-based papules or pustules.13,18 Marginal TA classically includes frontotemporal hair loss or thinning with or without a fringe sign.17,18 Nonmarginal TA includes patchy alopecia most commonly involving the parietal or occipital scalp, seen with chignons, buns, ponytails, or the use of clips, extensions, or bobby pins.18 The first line in management is avoidance of traction-causing hairstyles or headgear. Medical therapy may be warranted and consists of a single agent or combination regimen to include oral or topical antibiotics, topical or intralesional steroids, and topical minoxidil.13,18
Final Thoughts
Military hair-grooming standards have evolved over time. Recent changes show that the US Department of Defense is seriously evaluating policies that may be inherently exclusive. Prior grooming standards resulted in the widespread use of tight hairstyles and harsh hair treatments among female servicemembers with long hair. These practices resulted in TN, extracranial headaches, and TA, among other hair and scalp disorders. These occupational-related hair conditions impact female servicemembers’ mental and physical well-being and thus impact military readiness. Physicians should recognize that these conditions can be related to occupational grooming standards that may impact hair care practices.
The challenge that remains is a lack of standardized documentation for hair and scalp symptoms in the medical record. Due to a paucity in reporting and documentation, limited objective data exist to guide future recommendations for military grooming standards. Another obstacle is the lack of knowledge of hair diseases among primary care providers and patients, especially due to the underrepresentation of ethnic hair in medical textbooks.19 As a result, women frequently accept their hair symptoms as normal and either suffer through them, cut their hair short, or wear wigs before considering a visit to the doctor. Furthermore, hair-grooming standards can expose racial disparities, which are the driving force behind the current policy changes. Clinicians can strive to ask about hair and scalp symptoms and document the following in relation to hair and scalp disorders: occupational grooming requirements; skin and hair type; location, number, and size of scalp lesion(s); onset; duration; current and prior hair care practices; history of treatment; and clinical course accompanied with photographic documentation. Ultimately, improved awareness in patients, collaboration between physicians, and consistent clinical documentation can help create positive change and continued improvement in hair-grooming standards within the military. Improved reporting and documentation will facilitate further study into the effectiveness of the updated hair-grooming standards in female servicemembers.
- United States Air Force Statistical Digest FY 1999. United States Air Force; 2000. Accessed June 8, 2021. https://media.defense.gov/2011/Apr/14/2001330240/-1/-1/0/AFD-110414-048.pdf
- Air Force demographics. Air Force Personnel Center website. Accessed June 8, 2021. https://www.afpc.af.mil/About/Air-Force-Demographics/
- US Department of the Army. Wear and Appearance of Army Uniforms and Insignia: Army Regulation 670-1. Department of the Army; 2021. Accessed June 8, 2021. https://armypubs.army.mil/epubs/DR_pubs/DR_a/ARN30302-AR_670-1-000-WEB-1.pdf
- Losey S. Loc hairstyles, off-duty earrings for men ok’d in new dress regs. Air Force Times. Published July 16, 2018. Accessed June 8, 2021. https://www.airforcetimes.com/news/your-air-force/2018/07/16/loc-hairstyles-off-duty-earrings-for-men-okd-in-new-dress-regs/
- Department of the Air Force. AFT 36-2903, Dress and Personal Appearance of Air Force Personnel. Department of the Air Force; 2011. Accessed June 8, 2021. https://www.uc.edu/content/dam/uc/afrotc/docs/Documents/AFI36-2903.pdf
- Department of the Air Force. AFT 36-2903, Dress and Personal Appearance of Air Force Personnel. Department of the Air Force; 2021. Accessed June 8, 2021. https://static.e-publishing.af.mil/production/1/af_a1/publication/afi36-2903/afi36-2903.pdf
- U.S. Navy uniform regulations: summary of changes (26 February 2020). Navy Personnel Command website. Accessed June 8, 2021. https://www.mynavyhr.navy.mil/Portals/55/Navy%20Uniforms/Uniform%20Regulations/Documents/SOC_2020_02_26.pdf?ver=y8Wd0ykVXgISfFpOy8qHkg%3d%3d
- US Headquarters Marine Corps. Marine Corps Uniform Regulations: Marine Corps Order 1020.34H. United States Marine Corps, 2018. Accessed June 8, 2021. https://www.marines.mil/portals/1/Publications/MCO%201020.34H%20v2.pdf?ver=2018-06-26-094038-137
- Secretary of the Air Force Public Affairs. Air Force to allow longer braids, ponytails, bangs for women. United States Air Force website. Published January 21, 2021. Accessed June 8, 2021. https://www.af.mil/News/Article-Display/Article/2478173/air-force-to-allow-longer-braids-ponytails-bangs-for-women/
- Britzky H. The Army will now allow women to wear ponytails in all uniforms. Task & Purpose. Published May 6, 2021. Accessed June 8, 2021. https://taskandpurpose.com/news/army-women-ponytails-all-uniforms/
- Secretary of the Air Force Public Affairs. Air Force readdresses women’s hair standard after feedback. US Air Force website. Published June 11, 2021. Accessed June 27, 2021. https://www.af.mil/News/Article-Display/Article/2654774/air-force-readdresses-womens-hair-standard-after-feedback/
- Myers M. Esper direct services to review racial bias in grooming standards, training and more. Air Force Times. Published July 15, 2020. Accessed June 8, 2021. https://www.airforcetimes.com/news/your-military/2020/07/15/esper-directs-services-to-review-racial-bias-in-grooming-standards-training-and-more/
- Madu P, Kundu RV. Follicular and scarring disorders in skin of color: presentation and management. Am J Clin Dermatol. 2014;15:307-321.
- Quaresma M, Martinez Velasco M, Tosti A. Hair breakage in patients of African descent: role of dermoscopy. Skin Appendage Disord. 2015;1:99-104.
- Burch RC, Loder S, Loder E, et al. The prevalence and burden of migraine and severe headache in the United States: updated statistics from government health surveillance studies. Headache. 2015;55:21-34.
- Kararizou E, Bougea AM, Giotopoulou D, et al. An update on the less-known group of other primary headaches—a review. Eur Neurol Rev. 2014;9:71-77.
- Sperling L, Cowper S, Knopp E. An Atlas of Hair Pathology with Clinical Correlations. CRC Press; 2012:67-68.
- Billero V, Miteva M. Traction alopecia: the root of the problem. Clin Cosmet Investig Dermatol. 2018;11:149-159.
- Adelekun A, Onyekaba G, Lipoff JB. Skin color in dermatology textbooks: an updated evaluation and analysis. J Am Acad Dermatol. 2021;84:194-196.
Practice Points
- Military hair-grooming standards have undergone considerable changes to foster inclusivity and acknowledge racial diversity in hair and skin types.
- The chronic wearing of tight hairstyles can lead to hair breakage, headaches, and traction alopecia.
- A deliberate focus on diversity and inclusivity has started to drive policy change that eliminates racial and gender bias.

Update on Contact Dermatitis and Patch Testing in Patients With Skin of Color
The world is an increasingly diverse place, which has particular relevance for the dermatologist. Skin color plays a significant role in diagnostic approach, as there are important differences in how cutaneous disease presents in patients with skin of color (SOC). Therefore, education about these differences is imperative. In this review, we focus on allergic contact dermatitis (ACD) and patch testing in patients with SOC. We discuss allergens common to this demographic and challenges encountered in patch testing patients with SOC. We also identify key health care disparities in the evaluation and management of ACD in this population.
Has contact allergy in SOC populations been studied in North America?
Over the last 2 decades, there have been only a handful of North American studies that address contact allergy in SOC populations. Patch test results from 114 Black patients and 877 White patients at the Cleveland Clinic from 1988 to 1991 showed that overall allergy frequency was relatively similar (43.0% vs 43.6%). There were notable differences in allergen sensitization. Paraphenylenediamine (PPD), which is used in hair dye, had more positive patch test reactions in Black patients (10.6% vs 4.5%), and both PPD (21.2% vs 4.2%) and imidazolidinyl urea, a formaldehyde-releasing preservative (9.1% vs 2.6%), were more frequently allergenic in Black men compared to White men.1 Patch test results from the North American Contact Dermatitis Group from 1992 to 1998 described similar results, with minimal variation in the prevalence of ACD among 1014 Black and 8610 White patients (47%–49% vs 46%–49%).2 Positive patch test reactions to PPD were higher in Black patients for 2 of 3 test cycles (13.5% vs 5.8% [1994-1996] and 10.3% vs 5.3% [1996-1998]). Positive patch test reactions were higher in White patients for dimethylol dimethyl hydantoin, a formaldehyde-releasing preservative, also for 2 of 3 test cycles (1.8% vs 0% [1992-1994] and 2.8% vs 0.3% [1994-1996]). Finally, positive patch test reactions to thioureas (rubber accelerators) had a mixed picture: 2 test cycles were higher in Black patients (1.9% vs 1.0% [1992-1994] and 1.3% vs 0.7% [1994-1996]), but the third cycle (1996-1998) was lower (0.7% vs 1.4%). Positive patch test reactions to the metal cobalt chloride were higher in Black patients in just 1 test cycle (9.2% vs 6.6% [1992-1994]). The authors suggested that the use of darker hair dyes in the Black community may lead to more sensitization to PPD. They also theorized that this population’s more frequent use of ointment-based skin care products may make them less susceptible to sensitization to preservatives such as formaldehyde, which more commonly are found in water-based products such as creams. They concluded that differences in sensitization patterns likely were driven by cultural practices affecting exposures.2
In 2016, the North American Contact Dermatitis Group reported patch test results in 434 Black and 6634 White patients (1998-2006).3 Again, ACD prevalence was about the same in both groups (45.9% vs 43.6%). However, they reported several allergens with different reaction patterns. Black patients had higher risk ratios (RRs) for 3 rubber accelerators: mercaptobenzothiazole (RR, 2.10), mercapto mix (RR, 2.27), and thiuram mix (RR, 1.44). They also reacted to PPD (RR, 1.56) and the antibiotic bacitracin (RR, 1.34) at higher frequencies than White patients, who more frequently reacted to formaldehyde (RR, 0.58); the formaldehyde-releasing preservatives quaternium-15 (RR, 0.63) and diazolidinyl urea (in petrolatum: RR, 0.44; aqueous: RR, 0.47); the clothing finish ethylene urea melamine formalin resin (RR, 0.45); and the fragrances fragrance mix 1 (RR, 0.65) and balsam of Peru (RR, 0.55).3
Patch testing of 139 African American or Black patients at the Cleveland Clinic (2003-2012) revealed that this population most commonly had positive reactions to nickel (27.5%), fragrance mix (18.1%), bacitracin (13.0%), balsam of Peru (12.3%), and PPD (10.9%). The authors highlighted unique features of physical examination in patients with darker skin types, including lichenification and/or hyperpigmentation in those with ACD and the potential for lack of erythema and/or a papular reaction with patch test readings.4 Recently, data was presented at the American Contact Dermatitis Society Annual Meeting (March 2021) on patterns of ACD in Black and White patch tested patients in Philadelphia (2009-2019).5 Using the North American 80 comprehensive series, the researchers documented statistically significant differences in allergen sensitivity between the 2 groups. Black patients reacted to disperse blue dye (P=.019) and textile dye mix (P=.001) at higher frequencies. There was a nonsignificant trend of more frequent positive reactions to PPD in Black patients (11% vs 6%).5
Notably, all of these studies examined only 1 or 2 racial groups with a focus on Black patients. Some authors commented that this was due to low numbers of Hispanic, Asian and Pacific Islander, and Native American patients in tested populations.2,3,5 With approximately 13% of the US population self-identifying as Black,6 these patients and other minority races typically are underrepresented in large patch test studies. More data on patch test results for these groups is necessary for a complete understanding of patch testing in patients with SOC.
What are the challenges in patch testing SOC populations?
Patch testing in patients with SOC requires additional skills and experience. Darker skin does not reveal erythema as strikingly as lighter skin, making it more difficult to appreciate subtle color changes. Moreover, multiple studies have shown that ACD can have different presentations in Black patients.4,7,8 Lichenification and hyperpigmentation may be early signs of ACD in comparison to bright erythema and vesicles that can be seen in lighter skin types. It also has been reported that scalp ACD can be mistaken for seborrheic dermatitis due to lack of erythema.7 Without a high degree of clinical suspicion, a diagnosis of ACD can be missed in this patient population.
Patch test interpretation also can be challenging in patients with SOC. An early papular or follicular eruption with minimal erythema can signal a positive reaction.4,7 Because of these potentially subtle changes, patch testers should exercise care and attention when reading results for SOC populations. We recommend ample side lighting, palpation for adequate identification of positive reactions, and double-checking for positives that may have been overlooked on the initial review of findings.4,7
What health care disparities impact the evaluation and management of ACD?
There are many factors at play in this dialogue. The challenges we identified in diagnosing ACD in darker skin types are important to consider. Lack of familiarity with these unique features can lead to a delay in diagnosis and ultimately a delay in referral for patch testing. This is where dermatology training can help fill in the gap, but are the majority of programs equipped to do so? Inadequate education and exposure to patients with SOC is an issue for many dermatology residency programs. Surveys of residents and program directors in geographically less diverse regions may not receive adequate education or exposure to patients with SOC.9 Further, there is a lack of representation of SOC images for general dermatologic conditions in textbooks,10,11 which has a profound impact on the dermatologist’s ability to recognize common diseases in darker skin types. A 2019 survey of more than 5000 images from 2 dermatology textbooks showed SOC images comprised 22% to 32% of the total images.11 However, SOC images are overrepresented in textbooks for sexually transmitted infections, constituting 47% to 58% of the images; they made up 28% of images for nonvenereal infections.11 Why is that? In this article, we have shown the prevalence of ACD to be nearly equivalent in Black and White patients, yet a perusal of ACD images in dermatology textbooks will tell a different story. This trend deserves our attention; perhaps it is highlighting patterns of systemic racism seen in medicine. If our primary teaching materials are perpetuating stereotypes, we must consider the impact this can have on our personal implicit biases and the health care disparities that can ensue.
Additional factors impact time to diagnosis of ACD and referral for patch testing. A retrospective study examining distance to a North Carolina patch test referral clinic showed that patients living further from the clinic experienced a longer duration of dermatitis prior to patch test consultation and tended to live in areas with a higher county poverty rate.12 Specifically, a 17.9% increase (P<.001) in the median duration of dermatitis was observed for every 50-mile increase in distance to the patch test clinic. County poverty rate was measured by the percentage of residents living below the poverty threshold; for every 5% increase in county poverty rate, a 16.3% increase (P<.032) in duration of dermatitis was found.12
These data highlight a relationship with which many dermatologists are familiar and underscore a need for dermatologists to practice in areas that are more geographically accessible. The recently increased utilization of telehealth modalities can potentially help to bridge this gap by decreasing delays in diagnosis and providing more affordable options for evaluation by a dermatologist for patients with socioeconomic obstacles.
Final Interpretation
The prevalence of ACD among Black and White patients is similar; however, there are important differences in patch test reaction frequencies that may be related to the diverse exposure patterns for each group. Additionally, patients with SOC may have unique clinical presentations of ACD, such as lichenification and hyperpigmentation. Darker skin types also may require specialized techniques for accurate patch test readings. It is imperative that dermatologists are trained to recognize all of these features. Health care disparities come in many forms and, in this setting, can result in delayed referral for patch testing. Additional studies are needed to further examine these health care disparities and identify potential solutions.
- Dickel H, Taylor JS, Evey P, et al. Comparison of patch test results with a standard series among white and black racial groups. Am J Contact Dermat. 2001;12:77-82.
- Deleo VA, Taylor SC, Belsito DV, et al. The effect of race and ethnicity on patch test results. J Am Acad Dermatol. 2002;46(2 suppl understanding):S107-S112.
- Deleo VA, Alexis A, Warshaw EM, et al. The association of race/ethnicity and patch test results: North American Contact Dermatitis Group, 1998-2006. Dermatitis. 2016;27:288-292.
- Yu SH, Khanna U, Taylor JS, et al. Patch testing in the African American population: a 10-year experience. Dermatitis. 2019;30:277-278.
- Garg VS, Zhan, T, Brod B, et al. Patterns of allergic contact dermatitis in African Americans and Caucasians in a major metropolitan area over a ten-year period. Presented at: 32nd American Contact Dermatitis Society Annual Meeting (virtual); March 17-18, 2021.
- United States Census Bureau. QuickFacts—United States. Accessed June 11, 2021. https://www.census.gov/quickfacts/fact/table/US/PST045219
- Stallings A, Sood A. Hair-care practices in African American women: potential for allergic contact dermatitis. Semin Cutan Med Surg. 2016;35:207-210.
- Otrofanowei E, Ayanlowo OO, Akinkugbe A, et al. Clinico-etiologic profile of hand dermatitis and patch response of patients at a tertiary hospital in Lagos, Nigeria: results of a prospective observational study. Int J Dermatol. 2018;57:149-155.
- Nijhawan RI, Jacob SE, Woolery-Lloyd H. Skin of color education in dermatology residency programs: does residency training reflect the changing demographics of the United States? J Am Acad Dermatol. 2008;59:615-618.
- Ebede T, Papier A. Disparities in dermatology educational resources. J Am Acad Dermatol. 2006;55:687-690.
- Lester JC, Taylor SC, Chren MM. Under-representation of skin of colour in dermatology images: not just an educational issue. Br J Dermatol. 2019;180:1521-1522.
- Rodriguez-Homs LG, Liu B, Green CL, et al. Duration of dermatitis before patch test appointment is associated with distance to clinic and county poverty rate. Dermatitis. 2020;31:259-264.
The world is an increasingly diverse place, which has particular relevance for the dermatologist. Skin color plays a significant role in diagnostic approach, as there are important differences in how cutaneous disease presents in patients with skin of color (SOC). Therefore, education about these differences is imperative. In this review, we focus on allergic contact dermatitis (ACD) and patch testing in patients with SOC. We discuss allergens common to this demographic and challenges encountered in patch testing patients with SOC. We also identify key health care disparities in the evaluation and management of ACD in this population.
Has contact allergy in SOC populations been studied in North America?
Over the last 2 decades, there have been only a handful of North American studies that address contact allergy in SOC populations. Patch test results from 114 Black patients and 877 White patients at the Cleveland Clinic from 1988 to 1991 showed that overall allergy frequency was relatively similar (43.0% vs 43.6%). There were notable differences in allergen sensitization. Paraphenylenediamine (PPD), which is used in hair dye, had more positive patch test reactions in Black patients (10.6% vs 4.5%), and both PPD (21.2% vs 4.2%) and imidazolidinyl urea, a formaldehyde-releasing preservative (9.1% vs 2.6%), were more frequently allergenic in Black men compared to White men.1 Patch test results from the North American Contact Dermatitis Group from 1992 to 1998 described similar results, with minimal variation in the prevalence of ACD among 1014 Black and 8610 White patients (47%–49% vs 46%–49%).2 Positive patch test reactions to PPD were higher in Black patients for 2 of 3 test cycles (13.5% vs 5.8% [1994-1996] and 10.3% vs 5.3% [1996-1998]). Positive patch test reactions were higher in White patients for dimethylol dimethyl hydantoin, a formaldehyde-releasing preservative, also for 2 of 3 test cycles (1.8% vs 0% [1992-1994] and 2.8% vs 0.3% [1994-1996]). Finally, positive patch test reactions to thioureas (rubber accelerators) had a mixed picture: 2 test cycles were higher in Black patients (1.9% vs 1.0% [1992-1994] and 1.3% vs 0.7% [1994-1996]), but the third cycle (1996-1998) was lower (0.7% vs 1.4%). Positive patch test reactions to the metal cobalt chloride were higher in Black patients in just 1 test cycle (9.2% vs 6.6% [1992-1994]). The authors suggested that the use of darker hair dyes in the Black community may lead to more sensitization to PPD. They also theorized that this population’s more frequent use of ointment-based skin care products may make them less susceptible to sensitization to preservatives such as formaldehyde, which more commonly are found in water-based products such as creams. They concluded that differences in sensitization patterns likely were driven by cultural practices affecting exposures.2
In 2016, the North American Contact Dermatitis Group reported patch test results in 434 Black and 6634 White patients (1998-2006).3 Again, ACD prevalence was about the same in both groups (45.9% vs 43.6%). However, they reported several allergens with different reaction patterns. Black patients had higher risk ratios (RRs) for 3 rubber accelerators: mercaptobenzothiazole (RR, 2.10), mercapto mix (RR, 2.27), and thiuram mix (RR, 1.44). They also reacted to PPD (RR, 1.56) and the antibiotic bacitracin (RR, 1.34) at higher frequencies than White patients, who more frequently reacted to formaldehyde (RR, 0.58); the formaldehyde-releasing preservatives quaternium-15 (RR, 0.63) and diazolidinyl urea (in petrolatum: RR, 0.44; aqueous: RR, 0.47); the clothing finish ethylene urea melamine formalin resin (RR, 0.45); and the fragrances fragrance mix 1 (RR, 0.65) and balsam of Peru (RR, 0.55).3
Patch testing of 139 African American or Black patients at the Cleveland Clinic (2003-2012) revealed that this population most commonly had positive reactions to nickel (27.5%), fragrance mix (18.1%), bacitracin (13.0%), balsam of Peru (12.3%), and PPD (10.9%). The authors highlighted unique features of physical examination in patients with darker skin types, including lichenification and/or hyperpigmentation in those with ACD and the potential for lack of erythema and/or a papular reaction with patch test readings.4 Recently, data was presented at the American Contact Dermatitis Society Annual Meeting (March 2021) on patterns of ACD in Black and White patch tested patients in Philadelphia (2009-2019).5 Using the North American 80 comprehensive series, the researchers documented statistically significant differences in allergen sensitivity between the 2 groups. Black patients reacted to disperse blue dye (P=.019) and textile dye mix (P=.001) at higher frequencies. There was a nonsignificant trend of more frequent positive reactions to PPD in Black patients (11% vs 6%).5
Notably, all of these studies examined only 1 or 2 racial groups with a focus on Black patients. Some authors commented that this was due to low numbers of Hispanic, Asian and Pacific Islander, and Native American patients in tested populations.2,3,5 With approximately 13% of the US population self-identifying as Black,6 these patients and other minority races typically are underrepresented in large patch test studies. More data on patch test results for these groups is necessary for a complete understanding of patch testing in patients with SOC.
What are the challenges in patch testing SOC populations?
Patch testing in patients with SOC requires additional skills and experience. Darker skin does not reveal erythema as strikingly as lighter skin, making it more difficult to appreciate subtle color changes. Moreover, multiple studies have shown that ACD can have different presentations in Black patients.4,7,8 Lichenification and hyperpigmentation may be early signs of ACD in comparison to bright erythema and vesicles that can be seen in lighter skin types. It also has been reported that scalp ACD can be mistaken for seborrheic dermatitis due to lack of erythema.7 Without a high degree of clinical suspicion, a diagnosis of ACD can be missed in this patient population.
Patch test interpretation also can be challenging in patients with SOC. An early papular or follicular eruption with minimal erythema can signal a positive reaction.4,7 Because of these potentially subtle changes, patch testers should exercise care and attention when reading results for SOC populations. We recommend ample side lighting, palpation for adequate identification of positive reactions, and double-checking for positives that may have been overlooked on the initial review of findings.4,7
What health care disparities impact the evaluation and management of ACD?
There are many factors at play in this dialogue. The challenges we identified in diagnosing ACD in darker skin types are important to consider. Lack of familiarity with these unique features can lead to a delay in diagnosis and ultimately a delay in referral for patch testing. This is where dermatology training can help fill in the gap, but are the majority of programs equipped to do so? Inadequate education and exposure to patients with SOC is an issue for many dermatology residency programs. Surveys of residents and program directors in geographically less diverse regions may not receive adequate education or exposure to patients with SOC.9 Further, there is a lack of representation of SOC images for general dermatologic conditions in textbooks,10,11 which has a profound impact on the dermatologist’s ability to recognize common diseases in darker skin types. A 2019 survey of more than 5000 images from 2 dermatology textbooks showed SOC images comprised 22% to 32% of the total images.11 However, SOC images are overrepresented in textbooks for sexually transmitted infections, constituting 47% to 58% of the images; they made up 28% of images for nonvenereal infections.11 Why is that? In this article, we have shown the prevalence of ACD to be nearly equivalent in Black and White patients, yet a perusal of ACD images in dermatology textbooks will tell a different story. This trend deserves our attention; perhaps it is highlighting patterns of systemic racism seen in medicine. If our primary teaching materials are perpetuating stereotypes, we must consider the impact this can have on our personal implicit biases and the health care disparities that can ensue.
Additional factors impact time to diagnosis of ACD and referral for patch testing. A retrospective study examining distance to a North Carolina patch test referral clinic showed that patients living further from the clinic experienced a longer duration of dermatitis prior to patch test consultation and tended to live in areas with a higher county poverty rate.12 Specifically, a 17.9% increase (P<.001) in the median duration of dermatitis was observed for every 50-mile increase in distance to the patch test clinic. County poverty rate was measured by the percentage of residents living below the poverty threshold; for every 5% increase in county poverty rate, a 16.3% increase (P<.032) in duration of dermatitis was found.12
These data highlight a relationship with which many dermatologists are familiar and underscore a need for dermatologists to practice in areas that are more geographically accessible. The recently increased utilization of telehealth modalities can potentially help to bridge this gap by decreasing delays in diagnosis and providing more affordable options for evaluation by a dermatologist for patients with socioeconomic obstacles.
Final Interpretation
The prevalence of ACD among Black and White patients is similar; however, there are important differences in patch test reaction frequencies that may be related to the diverse exposure patterns for each group. Additionally, patients with SOC may have unique clinical presentations of ACD, such as lichenification and hyperpigmentation. Darker skin types also may require specialized techniques for accurate patch test readings. It is imperative that dermatologists are trained to recognize all of these features. Health care disparities come in many forms and, in this setting, can result in delayed referral for patch testing. Additional studies are needed to further examine these health care disparities and identify potential solutions.
- Dickel H, Taylor JS, Evey P, et al. Comparison of patch test results with a standard series among white and black racial groups. Am J Contact Dermat. 2001;12:77-82.
- Deleo VA, Taylor SC, Belsito DV, et al. The effect of race and ethnicity on patch test results. J Am Acad Dermatol. 2002;46(2 suppl understanding):S107-S112.
- Deleo VA, Alexis A, Warshaw EM, et al. The association of race/ethnicity and patch test results: North American Contact Dermatitis Group, 1998-2006. Dermatitis. 2016;27:288-292.
- Yu SH, Khanna U, Taylor JS, et al. Patch testing in the African American population: a 10-year experience. Dermatitis. 2019;30:277-278.
- Garg VS, Zhan, T, Brod B, et al. Patterns of allergic contact dermatitis in African Americans and Caucasians in a major metropolitan area over a ten-year period. Presented at: 32nd American Contact Dermatitis Society Annual Meeting (virtual); March 17-18, 2021.
- United States Census Bureau. QuickFacts—United States. Accessed June 11, 2021. https://www.census.gov/quickfacts/fact/table/US/PST045219
- Stallings A, Sood A. Hair-care practices in African American women: potential for allergic contact dermatitis. Semin Cutan Med Surg. 2016;35:207-210.
- Otrofanowei E, Ayanlowo OO, Akinkugbe A, et al. Clinico-etiologic profile of hand dermatitis and patch response of patients at a tertiary hospital in Lagos, Nigeria: results of a prospective observational study. Int J Dermatol. 2018;57:149-155.
- Nijhawan RI, Jacob SE, Woolery-Lloyd H. Skin of color education in dermatology residency programs: does residency training reflect the changing demographics of the United States? J Am Acad Dermatol. 2008;59:615-618.
- Ebede T, Papier A. Disparities in dermatology educational resources. J Am Acad Dermatol. 2006;55:687-690.
- Lester JC, Taylor SC, Chren MM. Under-representation of skin of colour in dermatology images: not just an educational issue. Br J Dermatol. 2019;180:1521-1522.
- Rodriguez-Homs LG, Liu B, Green CL, et al. Duration of dermatitis before patch test appointment is associated with distance to clinic and county poverty rate. Dermatitis. 2020;31:259-264.
Practice Points
- Similar rates of allergic contact dermatitis (ACD) exist between Black and White patients, with some differences in allergen profiles.
- Patch testing in patients with skin of color (SOC) may require side lighting and palpation, as erythema may be absent or minimal.
- Dermatologic training in evaluation and management of patients with SOC and ACD is vital.
- Distance to clinic and county poverty rate may adversely affect timely referral to a contact dermatitis specialist.
CABANA: Ablation bests drugs for AFib in racial/ethnic minorities
CABANA, which was undertaken to compare catheter ablation and rate-control or rhythm-control drug therapy for AFib, concluded there was no significant difference between the two strategies in improving the trial’s composite primary outcome of death, disabling stroke, serious bleeding, or cardiac arrest.
But a closer look at a subgroup of participants reveals an important difference in outcome among racial and ethnic minorities.
In that group, which made up about 10% of the CABANA study population, catheter ablation was significantly better at treating AFib than was drug therapy, producing roughly a 70% relative reduction in the primary endpoint and all-cause mortality.
The benefit for catheter ablation, which was not seen in the nonminority participants, appeared to be due to worse outcomes with drug therapy, the investigators report in an article published July 5 in the Journal of the American College of Cardiology.
“The study really highlights the importance of trying to secure an inclusive and diverse population in clinical trials,” lead author Kevin L. Thomas, MD, Duke University, Durham, N.C., said in an interview.
“When we focused on the racial and ethnic minorities who were included in CABANA, the findings were different. This was a surprise,” Dr. Thomas said.
“The findings from the secondary analysis of CABANA suggest that racial and ethnic minorities that are treated with drugs compared with ablation do worse,” he said. “If we can validate this in a larger sample of patients and this does in fact turn out to be true, then we would change how we practice medicine. We would have discussions with these populations about the benefits of ablation over drugs, and this would be important information to help guide our practice.”
The investigators analyzed data from 1,280 participants enrolled in the North American arm of CABANA. Of these, 127 (9.9%) were of racial or ethnic minorities, as defined by the National Institutes of Health, and were randomly assigned to receive ablation (n = 62) or drug therapy (n = 65).
Compared with nonminorities, participants of racial and ethnic minorities were younger (median age, 65.5 years, vs. 68.5 years) and were more likely to have NYHA functional class greater than or equal to II symptoms (37.0% vs. 22.0%), hypertension (92.1% vs. 76.8%), and an ejection fraction less than 40% (20.8% vs. 7.1%).
The overall median follow-up was 54.9 months. Among ethnic and minority participants, the median follow-up was 48 months, compared with 55.5 months for the nonminority participants.
Although there was no significant difference in the primary composite endpoint in the main CABANA trial, among racial and ethnic minorities treated with ablation, there was a 68% relative reduction in the trial’s primary endpoint (adjusted hazard ratio, 0.32; 95% confidence interval, 0.13-0.78) and a 72% relative reduction in all-cause mortality (aHR, 0.28; 95% CI, 0.10-0.79).
The 4-year Kaplan-Meier primary event rates were similar in both racial/ethnic minority and nonminority groups that received catheter ablation (12.3% vs. 9.9%).
However, the 4-year event rate was much higher among nonminority participants than among racial and ethnic minorities who received drug therapy (27.4% vs. 9.4%).
The corresponding all-cause 4-year mortality rates were 8.1% and 6.7%, respectively, in the ablation arm and 20.2% and 4.5%, respectively, in the drug arm.
Dr. Thomas and colleagues point out that heart failure in racial and ethnic minorities, particularly Black patients, is typically due to hypertensive heart disease, whereas in non-Hispanic White patients, it is overwhelmingly associated with coronary artery disease. “Our results in CABANA, therefore, raise the possibility that the variations in the prevalence of the heart diseases associated with AFib might account for differences in the benefits observed with ablation therapy.”
Prior data suggest that AFib in the setting of heart failure with either reduced or preserved ejection fraction has substantially better clinical outcomes with ablation versus drug therapy, but most studies either do not report racial/ethnic demographics or enroll very low numbers of minorities, they note.
Andrea M. Russo, MD, a professor of medicine at Rowan University, Camden, New Jersey, asks why drug therapy might result in worse outcomes in racial and ethnic minorities in an accompanying editorial.
“Those who received ablation did better than those who received drugs, and the main reason for that is not that ablation works better in minorities than nonminorities, it’s because drugs are worse in minority patients than they are in nonminority patients. This means that either the way we are using the drugs or the ones that we are using in minority patients are resulting in worse overall outcomes,” Dr. Russo told this news organization.
“The minority patients were younger and yet had more hypertension at baseline. There could be all kinds of factors contributing to their health,” she said.
Dr. Russo agrees with Dr. Thomas on the need to enroll diverse populations in clinical trials.
“Dr. Thomas should be commended. He did a fabulous job of looking at this issue. It’s only 10% of the group, but it is better than what we have had so far, and this is a start,” Dr. Russo said. “It’s bringing recognition to how important it is to make sure that we include underrepresented populations in these trials and also that we offer all appropriate therapies to everyone.”
Dr. Thomas reports financial relationships with Janssen, Pfizer, Biosense Webster. Dr. Russo reports no relevant financial relationships. The study was funded by the National Institutes of Health, St. Jude Medical Foundation and Corporation, Biosense Webster, Medtronic, and Boston Scientific.
A version of this article first appeared on Medscape.com.
Physician fired after slurs, including ‘cannibalism,’ against Israel
Fidaa Wishah, MD, a pediatric radiologist at Phoenix Children’s Hospital in Arizona, has been fired after the hospital reviewed evidence that included her anti-Israel comments on social media, according to the hospital’s statement.
On May 26, Dr. Wishah posted, “We will uncover your thirst to kill our Palestinian children. … We sense your fear. The fear of your collapse. A state based on atrocity, inhumanity, racism and cannibalism never last long! Hey #israel … your end is coming sooner than you think.”
Phoenix Children’s Hospital did not respond to this news organization’s request for comment but said in a statement to the Jewish News Syndicate : “After a thorough review of the facts related to this matter, this individual is no longer providing care at Phoenix Children’s. All children in the care of Phoenix Children’s receive hope, healing and the best possible health care, regardless of race, color, disability, religion, gender, gender identity, sexual orientation or national origin.”
Dr. Wishah’s profile has been removed from the hospital website. Her LinkedIn profile indicates she had been a pediatric radiology fellow at Stanford (Calif.) University, specializing in advanced magnetic resonance imaging and fetal imaging and had been a senior staff pediatric radiologist at Henry Ford Health System in Detroit.
It wasn’t the first time antisemitic comments have led to the firing of a physician. Last year, this news organization wrote about Lara Kollab, DO, a first-year resident fired for her antisemitic tweets. She was subsequently barred from medicine.
In the same post from May 26, Dr. Wishah also wrote: “We will not be #censored anymore! Bomb our media buildings and we have the phones[.] Bribe the mainstream media and we have our small #socialmedia platforms[.] From our windows ... from our streets ... next the rubble we will expose you to the world[.] We will expose the #massacre and #genocide you #zionists are proud of[.]”
Today, CAIR-AZ, a group whose mission is to “enhance understanding of Islam, protect civil rights, promote justice, and empower American Muslims,” according to its website, announced that it, along with three private law firms, will represent Dr. Wishah in what they referred to as “her wrongful termination case against Phoenix Children’s Hospital.”
The announcement, which mentions that Dr. Wishah was born and raised in Gaza, said, “Dr. Wishah has been a medical doctor since 2010 and has spent the vast majority of her career as a pediatric physician. Despite caring for thousands of children, many of whom are Jewish, she has never been accused of discriminating against any of her patients or colleagues.”
The statement added, “PCH’s decision to terminate Dr. Wishah is shameful and an attack on freedom of speech.”
A version of this article first appeared on Medscape.com.
Diversity of pediatric residents, fellows continues to lag
The proportion of underrepresented groups in pediatric fellowships decreased between 2007 and 2019, while those in pediatric residencies remained stagnant, new research revealed.
Researchers acknowledged that some of the factors contributing to the low proportion of minorities in the pediatric workforce may include educational disparities starting in primary or secondary school, such as underfunded schools and lack of educational resources.
“Something I really appreciated about the paper is that this goes beyond a student stepping into medical school, finding a mentor in pediatrics, and then eventually matriculating into a pediatric residency,” said Christle Nwora, MD, an internal medicine–pediatrics resident physician at Johns Hopkins Urban Health Residency Program in Baltimore, who was not involved in the study. “I like the idea of knowing that people aren’t going into the field and being very critical as to why.”
Prior studies, including a 2019 study published in JAMA Network Open, has found that minority students remain underrepresented in medical schools. However, this most recent study, published in Pediatrics, is one of the first to report trends in the race or ethnicity of pediatric residents and fellows.
“It’s been pretty well documented throughout the medical literature that the representation of underrepresented [groups] in medicine is low among all specialties,” study author Kimberly Montez, MD, MPH, FAAP, said in an interview. “This is one of the first studies that [show this trend] in pediatrics, [but] we were kind of expecting [these findings] knowing the rest of the literature out there.”
Dr. Montez and colleagues examined self-reported race and ethnicity data from 2007 to 2019 for pediatric residents and fellows from the GME Census reports. The annual number of pediatric trainees increased from 7,964 to 8,950 between 2007 and 2019. For pediatric subspecialty fellows, that number increased from 2,684 to 3,966.
The number of underrepresented pediatric trainees also increased over time, from 1,277 to 1,478 residents and 382 to 532 subspecialty fellows. However, researchers found that the trend in proportion of underrepresented in medicine (URiM) trainees was unchanged in pediatric residencies – 16% in 2007 to 16.5% in 2019 – and, overall, decreased for URiM subspecialty fellows from 14.2% in 2007 to 13.5% in 2019.
“I was shocked at the fact that there has been no significant increase either over the last 12 years,” said Joan Park, MD, a pediatric resident at Johns Hopkins Hospital, Baltimore, who was not involved in the study. “In the news, we’re seeing way more discussions in regards to racism and representation and the fact that that hasn’t really fueled or caught fire yet in medicine at all to really move that arrow is definitely really shocking.”
The recent study also pointed out that the percentage of underrepresented groups in pediatric residencies and fellowships is considerably lower in comparison with those groups’ representations in the U.S. population. For example, Black or African American people make up 13.4% of the U.S. population but just 5.6% of pediatric trainees. Meanwhile, American Indian or Alaskan Native people make up 1.3% of the U.S. population but make up 0.2% of pediatric trainees.
Dr. Montez hypothesized that the lack of underrepresented groups as pediatric trainees – or in the medical field, in general – may have to do with systemic barriers that span the entire educational continuum and affects them even before they reach medical school, including attendance at underfunded primary and secondary schools.
“Just think about all the barriers that exist for underrepresented minorities in medicine,” said Dr. Montez, assistant professor of pediatrics at Wake Forest University, Winston-Salem, N.C. “We know that underrepresented minorities are accepted and matriculate at lower rates than [those of] their nonminority counterparts. All of this occurs even just before getting into the field of pediatrics. So multiple barriers exist.”
Those barriers may also include racism, bias, and discrimination, which may play out unconsciously when members of an underrepresented group are applying for residencies or med school, such as “recognizing a name that may be from a different ethnic or racial background and then unconsciously biasing yourself against that applicant, for example,” Dr. Montez explained.
Dr. Montez said that although there has been progress, there is still a long way to go. She hopes the study will help academic institutions and professional organizations recognize the importance of diversity in pediatrics. She noted that pediatric trainees are more likely to experience microaggressions, which could potentially cause them to leave a program.
“I hope this will galvanize pediatric programs to really think a lot about the environment that they create for underrepresented minority trainees and also about their recruitment process in terms of making sure it’s standardized, using a holistic review,” Dr. Montez explained.
In 2016, the Association of American Medical Colleges published a diversity and inclusion strategic planning guide to improve training programs. Furthermore, in 2019, the Accreditation Council for Graduate Medical Education instituted a new common program requirement on diversity that requires programs to focus on systematic recruitment and retention of a diverse and inclusive workforce of residents and fellows.
“The same way pediatricians are aware of how the environment will shape the way a child grows up, we have to be mindful of the way an environment that surrounds the medical student will shape where they eventually end up as well,” said Dr. Nwora.
The experts disclosed no conflicts of interest.
Intervention opens access to care for minority youths with type 1 diabetes
For racial or ethnic minority youths with type 1 diabetes, participating in an interventional program improves access to care, new research shows.
Youth categorized as Black, Indigenous, and other people of color (BIPOC) had significantly improved outpatient attendance during and after participating in Novel Interventions in Children’s Healthcare (NICH), a systems intervention for children with chronic health conditions and their families.
By comparison, no improvements in care access were observed among BIPOC children who were not able to access the program because of insurance or other reasons, David V. Wagner, PhD, Associate Professor and NICH research director at Oregon Health & Science University, Portland, reported at the annual scientific sessions of the American Diabetes Association.
The findings demonstrate a need for intensive, home-based services that aim to correct health inequities, said Dr. Wagner, who presented the findings along with Winniebhelle Cadiz, a scholar in the BUILD EXITO undergraduate research training program at Portland (Ore.) State University.
The NICH program hinges on trained interventionists who visit families at home, attend clinic visits, and work with schools and other contacts to help solve problems that keep children from following medical instructions, according to a program description.
“Families report having somebody by their side to help them navigate the system, address the transportation difficulties experienced, and help them and build that relationship with their health care provider seems to be hugely influential in terms of helping them navigate and access care,” Dr. Wagner said in a presentation of the study.
A NICH for youths with chronic health conditions
The NICH program differs from some other programs that have been developed in an attempt to improve health outcomes among youths in the community, according to Dr. Wagner.
“Many of the programs that exist out there are often piloted on, and seemingly built for, those who have more resources,” he said in his presentation. “Those who are in greatest need often have difficulty accessing and responding to the services.”
NICH doesn’t take the place of existing services, but is “an addition to the continuum of care” for youths and families who are struggling because of lack of resources or marginalization in the health care system, Dr. Wagner said.
While NICH is not specific to any one chronic health condition, several previous investigations have specifically looked at the impact of the NICH program on access to care in youths with type 1 diabetes.
Youths participating in the program for a year had fewer ED visits, including fewer visits with diabetic ketoacidosis (DKA), as well as fewer and shorter admissions as compared with the year prior to participating in the program, Dr. Wagner said.
In another study, youths had fewer admissions for diabetes or DKA and less frequent pediatric ICU contact during the NICH program, as compared with before the program.
Another study showed that, while NICH had no impact overall on access to care among youths with type 1 diabetes, BIPOC youths had an improvement in the mean number of outpatient visits as compared with preprogram levels. However, because none of those studies included a control group, Dr. Wagner said, it remained unclear whether this systems intervention might improve outpatient access among youths with type 1 diabetes as compared with those who did not participate.
Intervention linked to increased BIPOC care access
The latest study includes 144 youths with type 1 diabetes referred for the program. The mean age was 13.7 years, 58% were female, and 81% were non-Hispanic White. While 51 youths were able to participate in NICH, the remaining 93 were not served by the program because of insurance denial or nonresponse, according to investigators.
While participation in the program made no difference in access to care overall, results of this study suggest NICH reduced access disparities among BIPOC youths, the investigators said.
Those BIPOC youth, 28 in total, had significantly worse access to care prior to referral. However, BIPOC youth participation in NICH was associated with improved attendance at endocrinology appointments and outpatient attendance overall.
A mean change of 1.9 more appointments per year was seen among BIPOC youth who participated in NICH, compared with a mean decrease of 0.5 appointments per year among BIPOC youth not served by the program (P = .03), according to the study abstract.
Prior to NICH participation, outpatient attendance among BIPOC youths was about 2.5 visits per year, data presented by the investigators show.
Systemic changes needed
This study is representative of systemic changes that are needed to improve access to quality care for BIPOC youth, according Cynthia E. Muñoz, PhD, MPH, ADA’s president of health care and education.

“We know that there are increased risks for poor health outcomes for these children and youths, and we know that there is a risk for mental health and psychosocial challenges for youth from these communities,” said Dr. Muñoz, a bilingual licensed psychologist and assistant professor of clinical pediatrics at the University of Southern California, Los Angeles.
In his presentation, Dr. Wagner said lumping racial and ethnic minority participants under a single BIPOC header probably wasn’t ideal because of the diversity and differences among racial and ethnic minorities. However, it was necessary in this particular study because of limited sample size.
Dr. Wagner and coauthors disclosed no conflicts of interest related to the research, which was supported by the Leona M. and Harry B. Helmsley Charitable Trust.
For racial or ethnic minority youths with type 1 diabetes, participating in an interventional program improves access to care, new research shows.
Youth categorized as Black, Indigenous, and other people of color (BIPOC) had significantly improved outpatient attendance during and after participating in Novel Interventions in Children’s Healthcare (NICH), a systems intervention for children with chronic health conditions and their families.
By comparison, no improvements in care access were observed among BIPOC children who were not able to access the program because of insurance or other reasons, David V. Wagner, PhD, Associate Professor and NICH research director at Oregon Health & Science University, Portland, reported at the annual scientific sessions of the American Diabetes Association.
The findings demonstrate a need for intensive, home-based services that aim to correct health inequities, said Dr. Wagner, who presented the findings along with Winniebhelle Cadiz, a scholar in the BUILD EXITO undergraduate research training program at Portland (Ore.) State University.
The NICH program hinges on trained interventionists who visit families at home, attend clinic visits, and work with schools and other contacts to help solve problems that keep children from following medical instructions, according to a program description.
“Families report having somebody by their side to help them navigate the system, address the transportation difficulties experienced, and help them and build that relationship with their health care provider seems to be hugely influential in terms of helping them navigate and access care,” Dr. Wagner said in a presentation of the study.
A NICH for youths with chronic health conditions
The NICH program differs from some other programs that have been developed in an attempt to improve health outcomes among youths in the community, according to Dr. Wagner.
“Many of the programs that exist out there are often piloted on, and seemingly built for, those who have more resources,” he said in his presentation. “Those who are in greatest need often have difficulty accessing and responding to the services.”
NICH doesn’t take the place of existing services, but is “an addition to the continuum of care” for youths and families who are struggling because of lack of resources or marginalization in the health care system, Dr. Wagner said.
While NICH is not specific to any one chronic health condition, several previous investigations have specifically looked at the impact of the NICH program on access to care in youths with type 1 diabetes.
Youths participating in the program for a year had fewer ED visits, including fewer visits with diabetic ketoacidosis (DKA), as well as fewer and shorter admissions as compared with the year prior to participating in the program, Dr. Wagner said.
In another study, youths had fewer admissions for diabetes or DKA and less frequent pediatric ICU contact during the NICH program, as compared with before the program.
Another study showed that, while NICH had no impact overall on access to care among youths with type 1 diabetes, BIPOC youths had an improvement in the mean number of outpatient visits as compared with preprogram levels. However, because none of those studies included a control group, Dr. Wagner said, it remained unclear whether this systems intervention might improve outpatient access among youths with type 1 diabetes as compared with those who did not participate.
Intervention linked to increased BIPOC care access
The latest study includes 144 youths with type 1 diabetes referred for the program. The mean age was 13.7 years, 58% were female, and 81% were non-Hispanic White. While 51 youths were able to participate in NICH, the remaining 93 were not served by the program because of insurance denial or nonresponse, according to investigators.
While participation in the program made no difference in access to care overall, results of this study suggest NICH reduced access disparities among BIPOC youths, the investigators said.
Those BIPOC youth, 28 in total, had significantly worse access to care prior to referral. However, BIPOC youth participation in NICH was associated with improved attendance at endocrinology appointments and outpatient attendance overall.
A mean change of 1.9 more appointments per year was seen among BIPOC youth who participated in NICH, compared with a mean decrease of 0.5 appointments per year among BIPOC youth not served by the program (P = .03), according to the study abstract.
Prior to NICH participation, outpatient attendance among BIPOC youths was about 2.5 visits per year, data presented by the investigators show.
Systemic changes needed
This study is representative of systemic changes that are needed to improve access to quality care for BIPOC youth, according Cynthia E. Muñoz, PhD, MPH, ADA’s president of health care and education.
“We know that there are increased risks for poor health outcomes for these children and youths, and we know that there is a risk for mental health and psychosocial challenges for youth from these communities,” said Dr. Muñoz, a bilingual licensed psychologist and assistant professor of clinical pediatrics at the University of Southern California, Los Angeles.
In his presentation, Dr. Wagner said lumping racial and ethnic minority participants under a single BIPOC header probably wasn’t ideal because of the diversity and differences among racial and ethnic minorities. However, it was necessary in this particular study because of limited sample size.
Dr. Wagner and coauthors disclosed no conflicts of interest related to the research, which was supported by the Leona M. and Harry B. Helmsley Charitable Trust.
FROM ADA 2021
In Black patients, acne scarring might not mean what you think
Treating the needs of patients of color requires an understanding of differences that may not be readily apparent, a dermatologist told colleagues. For example, of the term that may be misinterpreted in the doctor’s office.

“Scarring is not usually what they’re talking about, although they may have some of that as well. They’re [typically] talking about what we know as postinflammatory hyperpigmentation, not scarring. So right away, you have to clarify,” Amy McMichael, MD, professor and chair of dermatology at Wake Forest Baptist Medical Center in Winston-Salem, N.C., said in a presentation at the Inaugural Symposium for Inflammatory Skin Disease. “When you’re talking about scarring, do you mean the dark spots? What exactly are you concerned about?”
Dr. McMichael highlighted a 2014 study that reported the results of a survey of 208 women (51% were White; 49% were non-White), which included 51 Black, 23 Hispanic, and 16 Asian women aged 25-45 (mean age, 35) with 25 or more lesions. White women were more troubled by facial acne than were women of color (89% vs. 76%, respectively, P < .05), and they were more likely to say lesion clearance was most important to them (58% vs. 32%, respectively, P < .001).
Meanwhile, non-White women were much more likely than were White women to say that clearance of postinflammatory hyperpigmentation was most important to them (42% vs. 8%, respectively, P < .0001).
“Seventy percent of [non-White women] felt that their race and ethnicity required targeted attention [in treatment], and two-thirds desired acne treatment that was designed to meet the needs of their skin type,” Dr. McMichael said. “If you don’t address the issues, if you don’t talk about the pigmentation with them or explain how you’re going to address it, people don’t feel heard. They don’t feel like they’ve really seen a dermatologist who understands their needs.”
She added that it’s crucial to ask about over-the-counter products. “If you don’t discuss them, they’ll assume that what they’re doing is okay.” She warns her patients against using and exposing their skin and face to cocoa butter and oils such as tea tree oil.
Research has suggested that among people of color, Blacks and Hispanics are most likely to experience dyspigmentation and scarring, Dr. McMichael said. She advised colleagues to be aware of pomade acne in these two groups of patients. Pomade acne appears along the hair line and is caused by the use of hair products. She also cautioned about acne cosmetica, which can be triggered by products such as makeup, used to cover up acne and postinflammatory hyperpigmentation.
As for acne treatments, Dr. McMichael highlighted a long list of familiar topical and oral agents and procedural options. Less familiar strategies include laser and light-based therapies, she said.
As for up-and-coming options, she pointed to topical minocycline, “which allows us to use an anti-inflammatory agent topically rather than orally when we’re trying to get away from using a lot of oral antibiotics.”
Also consider whether female patients have polycystic ovary syndrome, she said. “Then you might consider spironolactone. I certainly use a lot more of that these days to try to avoid long-term oral antibiotics.”
She recommended earlier use of isotretinoin in patients overall, and she urged colleagues to proceed with their standard retinoid approaches. However, she noted that she lets patients know that she’ll focus first on treating the acne itself and then work on the dark spots in later treatments. “If you give people a bleaching agent in the beginning, they’re going to stop using their main products, and they’re going to chase those dark spots. That’s just something that they can’t help doing.”
Dr. McMichael disclosed investigator and consultant relationships with multiple drug makers.
Treating the needs of patients of color requires an understanding of differences that may not be readily apparent, a dermatologist told colleagues. For example, of the term that may be misinterpreted in the doctor’s office.
“Scarring is not usually what they’re talking about, although they may have some of that as well. They’re [typically] talking about what we know as postinflammatory hyperpigmentation, not scarring. So right away, you have to clarify,” Amy McMichael, MD, professor and chair of dermatology at Wake Forest Baptist Medical Center in Winston-Salem, N.C., said in a presentation at the Inaugural Symposium for Inflammatory Skin Disease. “When you’re talking about scarring, do you mean the dark spots? What exactly are you concerned about?”
Dr. McMichael highlighted a 2014 study that reported the results of a survey of 208 women (51% were White; 49% were non-White), which included 51 Black, 23 Hispanic, and 16 Asian women aged 25-45 (mean age, 35) with 25 or more lesions. White women were more troubled by facial acne than were women of color (89% vs. 76%, respectively, P < .05), and they were more likely to say lesion clearance was most important to them (58% vs. 32%, respectively, P < .001).
Meanwhile, non-White women were much more likely than were White women to say that clearance of postinflammatory hyperpigmentation was most important to them (42% vs. 8%, respectively, P < .0001).
“Seventy percent of [non-White women] felt that their race and ethnicity required targeted attention [in treatment], and two-thirds desired acne treatment that was designed to meet the needs of their skin type,” Dr. McMichael said. “If you don’t address the issues, if you don’t talk about the pigmentation with them or explain how you’re going to address it, people don’t feel heard. They don’t feel like they’ve really seen a dermatologist who understands their needs.”
She added that it’s crucial to ask about over-the-counter products. “If you don’t discuss them, they’ll assume that what they’re doing is okay.” She warns her patients against using and exposing their skin and face to cocoa butter and oils such as tea tree oil.
Research has suggested that among people of color, Blacks and Hispanics are most likely to experience dyspigmentation and scarring, Dr. McMichael said. She advised colleagues to be aware of pomade acne in these two groups of patients. Pomade acne appears along the hair line and is caused by the use of hair products. She also cautioned about acne cosmetica, which can be triggered by products such as makeup, used to cover up acne and postinflammatory hyperpigmentation.
As for acne treatments, Dr. McMichael highlighted a long list of familiar topical and oral agents and procedural options. Less familiar strategies include laser and light-based therapies, she said.
As for up-and-coming options, she pointed to topical minocycline, “which allows us to use an anti-inflammatory agent topically rather than orally when we’re trying to get away from using a lot of oral antibiotics.”
Also consider whether female patients have polycystic ovary syndrome, she said. “Then you might consider spironolactone. I certainly use a lot more of that these days to try to avoid long-term oral antibiotics.”
She recommended earlier use of isotretinoin in patients overall, and she urged colleagues to proceed with their standard retinoid approaches. However, she noted that she lets patients know that she’ll focus first on treating the acne itself and then work on the dark spots in later treatments. “If you give people a bleaching agent in the beginning, they’re going to stop using their main products, and they’re going to chase those dark spots. That’s just something that they can’t help doing.”
Dr. McMichael disclosed investigator and consultant relationships with multiple drug makers.
FROM SISD 2021
Survey spotlights the out-of-pocket burden on Blacks with atopic dermatitis
They also have significantly poorer disease control and an increased rate of comorbid skin infections.

Those are among the key findings from a 25-question survey administered to members of the National Eczema Association.
“Black individuals with AD have a unique sociodemographic and disease profile,” lead study investigator Raj Chovatiya, MD, PhD, said during the Revolutionizing Atopic Dermatitis symposium. “Out-of-pocket expenses are just one component of the real-world burden faced by this population.”
According to Dr. Chovatiya, of the department of dermatology at Northwestern University, Chicago, the clinical phenotype and burden of AD can vary across racial and ethnic groups. Black race, for example, is associated with a higher prevalence of AD, a higher burden of moderate to severe disease, increased rates of allergic comorbidities, greater AD-related impact on health-related quality of life, and more treatment-resistant AD.
“These features can make long-term AD control very difficult,” he said. “Given the variable long-term efficacy and safety of current treatments, health care providers and patients often have to combine therapies, seek new treatments, and consider adjunctive approaches – all of which can contribute to increased costs.”
AD is also associated with a considerable financial burden, he continued, including direct health care costs, lost work productivity and out-of-pocket health care expenses. “Previous population-based studies suggest that there are multifactorial increases in overall out-of-pocket health expenses in AD,” Dr. Chovatiya said. “Black race in particular is thought to be associated with increased health care utilization in AD, but little is known about the out-of-pocket health care expenses.”
To characterize the categories and impact of out-of-pocket health care expenses associated with AD management among Black individuals, he and his colleagues administered a 25-question voluntary survey to 113,502 members of the NEA between Nov. 14 and Dec. 21, 2019. They included adults with a self-reported diagnosis of AD or children, teens, or young adults who had a caregiver responding for them. In all, 1,118 respondents met inclusion criteria. Questions included those about out-of-pocket expenses for AD over the past 30 days and over the past year, as well as the disease impact on household finances.
The cohort included 75% of individuals with AD; 25% were primary caregivers of children, teens, and young adults with AD. More than three-quarters of respondents (77%) were female, 73% were White, 11% were Black, 6% were Asian, and the remainder were from other ethnic backgrounds. More than half of respondents (58%) had employer-sponsored insurance coverage and the median annual household income was between $50,000 and $75,000.
Nearly three-quarters of respondents (74%) classified their AD severity as moderate or severe, and 63% reported minimally controlled or somewhat-controlled AD. Black respondents were significantly more likely to be younger, have lower household incomes, live in an urban setting, use Medicaid or state assistance, have poor disease control, and frequent skin infections (P ≤ .02). “A numerically higher proportion of Black respondents also had increased AD severity and reported the use of step-up therapy with systemic agents, prescription polypharmacy with three or more prescriptions, and a higher monthly out-of-pocket cost,” Dr. Chovatiya said.
Compared with their non-Black counterparts, Black survey respondents reported more out-of-pocket costs for prescription medications covered by insurance (74.2% vs. 63.6%, P = .04), prescription medications not covered by insurance (65.1% vs. 46.5%, P = .0004), ED visits (22.1% vs. 11.8%, P = .005), and outpatient laboratory testing (33.3% vs. 21.8%, P = .01). Black race was associated with increased household financial impact from out-of-pocket expenses (P = .0009), and predictors of financial impact included minimally controlled AD (adjusted odds ratio, 13.88; P = .02), comorbid anxiety and/or depression (aOR, 4.34; P = .01), systemic therapy (aOR, 4.34; P = .003), out-of-pocket costs that exceeded $200 per month (aOR, 14.28; P = .0003), and Medicaid insurance (aOR, 4.02; P = .03). Blacks with Medicaid had higher odds of harmful financial impact (aOR, 3.32; P = .0002) than respondents who were Black (aOR, 1.81; P = .04) or those with Medicaid alone (aOR, 1.39; P = .04).
“I looked at some of the findings from recent studies that have talked about this burden, including an increased prevalence among Black children, a higher likelihood of moderate to severe disease, higher rates of ED visits and hospitalizations, and increased prescription medications,” Dr. Chovatiya said.“Our findings reflect these racial and socioeconomic disparities and provide another piece of evidence for increased financial burden among Black individuals with AD and support the need for targeted strategies to address these inequities.”
The study received funding support from the NEA. Dr. Chovatiya disclosed that he is a consultant to, a speaker for, and/or a member of the advisory board for AbbVie, Incyte, and Regeneron/Sanofi-Genzyme.
They also have significantly poorer disease control and an increased rate of comorbid skin infections.
Those are among the key findings from a 25-question survey administered to members of the National Eczema Association.
“Black individuals with AD have a unique sociodemographic and disease profile,” lead study investigator Raj Chovatiya, MD, PhD, said during the Revolutionizing Atopic Dermatitis symposium. “Out-of-pocket expenses are just one component of the real-world burden faced by this population.”
According to Dr. Chovatiya, of the department of dermatology at Northwestern University, Chicago, the clinical phenotype and burden of AD can vary across racial and ethnic groups. Black race, for example, is associated with a higher prevalence of AD, a higher burden of moderate to severe disease, increased rates of allergic comorbidities, greater AD-related impact on health-related quality of life, and more treatment-resistant AD.
“These features can make long-term AD control very difficult,” he said. “Given the variable long-term efficacy and safety of current treatments, health care providers and patients often have to combine therapies, seek new treatments, and consider adjunctive approaches – all of which can contribute to increased costs.”
AD is also associated with a considerable financial burden, he continued, including direct health care costs, lost work productivity and out-of-pocket health care expenses. “Previous population-based studies suggest that there are multifactorial increases in overall out-of-pocket health expenses in AD,” Dr. Chovatiya said. “Black race in particular is thought to be associated with increased health care utilization in AD, but little is known about the out-of-pocket health care expenses.”
To characterize the categories and impact of out-of-pocket health care expenses associated with AD management among Black individuals, he and his colleagues administered a 25-question voluntary survey to 113,502 members of the NEA between Nov. 14 and Dec. 21, 2019. They included adults with a self-reported diagnosis of AD or children, teens, or young adults who had a caregiver responding for them. In all, 1,118 respondents met inclusion criteria. Questions included those about out-of-pocket expenses for AD over the past 30 days and over the past year, as well as the disease impact on household finances.
The cohort included 75% of individuals with AD; 25% were primary caregivers of children, teens, and young adults with AD. More than three-quarters of respondents (77%) were female, 73% were White, 11% were Black, 6% were Asian, and the remainder were from other ethnic backgrounds. More than half of respondents (58%) had employer-sponsored insurance coverage and the median annual household income was between $50,000 and $75,000.
Nearly three-quarters of respondents (74%) classified their AD severity as moderate or severe, and 63% reported minimally controlled or somewhat-controlled AD. Black respondents were significantly more likely to be younger, have lower household incomes, live in an urban setting, use Medicaid or state assistance, have poor disease control, and frequent skin infections (P ≤ .02). “A numerically higher proportion of Black respondents also had increased AD severity and reported the use of step-up therapy with systemic agents, prescription polypharmacy with three or more prescriptions, and a higher monthly out-of-pocket cost,” Dr. Chovatiya said.
Compared with their non-Black counterparts, Black survey respondents reported more out-of-pocket costs for prescription medications covered by insurance (74.2% vs. 63.6%, P = .04), prescription medications not covered by insurance (65.1% vs. 46.5%, P = .0004), ED visits (22.1% vs. 11.8%, P = .005), and outpatient laboratory testing (33.3% vs. 21.8%, P = .01). Black race was associated with increased household financial impact from out-of-pocket expenses (P = .0009), and predictors of financial impact included minimally controlled AD (adjusted odds ratio, 13.88; P = .02), comorbid anxiety and/or depression (aOR, 4.34; P = .01), systemic therapy (aOR, 4.34; P = .003), out-of-pocket costs that exceeded $200 per month (aOR, 14.28; P = .0003), and Medicaid insurance (aOR, 4.02; P = .03). Blacks with Medicaid had higher odds of harmful financial impact (aOR, 3.32; P = .0002) than respondents who were Black (aOR, 1.81; P = .04) or those with Medicaid alone (aOR, 1.39; P = .04).
“I looked at some of the findings from recent studies that have talked about this burden, including an increased prevalence among Black children, a higher likelihood of moderate to severe disease, higher rates of ED visits and hospitalizations, and increased prescription medications,” Dr. Chovatiya said.“Our findings reflect these racial and socioeconomic disparities and provide another piece of evidence for increased financial burden among Black individuals with AD and support the need for targeted strategies to address these inequities.”
The study received funding support from the NEA. Dr. Chovatiya disclosed that he is a consultant to, a speaker for, and/or a member of the advisory board for AbbVie, Incyte, and Regeneron/Sanofi-Genzyme.
FROM REVOLUTIONIZING AD 2021