User login
Suicide Prevention on the Job
Many adults spend a large part of their time at work—making the workplace an important but underused location for suicide prevention, say CDC researchers who analyzed data on 22,053 suicides in 17 states. The US suicide rate among working adults (aged 16-64 years) rose 34% between 2000 and 2016, from 12.9 to 17.3 per 100,000.
Suicide rates rose in many occupational groups between 2012 and 2015, but identifying the specific role that occupational factors might play in suicide risk is complicated, the researchers say: Both work (eg, little job control and job insecurity) and nonwork (eg, relationship conflict) factors are associated with psychological distress and suicide. And factors such as access to lethal means while on the job play a part as well.
The major occupational group with the highest male suicide rate was Construction and Extraction (from 43.6% in 2012 to 53.2% in 2015. The Arts, Design, Entertainment, Sports, and Media groups had the highest female suicide rate (15.6%, up from 11.7%).
Health Care Support, which ranked twelfth on the 2015 list, actually saw a drop in the numbers of male suicides (19.5/100,000 in 2015, vs 22.1 in 2012). But among women, the numbers rose 31%: from 8.4 per 100,000 to 11.0, making that category third among females.
With a 13% drop (from 10.3 to 9.0), Health Care Practitioners and Technical (female) moved from fourth to sixth place. For men, the category ranked eighth, with a rate change of 23%, from 20.8 to 25.6 suicide deaths per 100,000.
The researchers say better understanding of how suicides are distributed by occupational group might help inform prevention programs and policies. The CDC recommends a comprehensive approach, including strategies such as:
- Enhancing social connectedness;
- Strengthening state or local economic supports;
- Implementing practices that encourage help-seeking and reduce stigma;
- Providing referrals to mental health and other services; and
- Reducing access to lethal means among people at risk
The CDC also encourages decision makers, such as employers, to create a response plan, should someone in their organization commit suicide.
Many adults spend a large part of their time at work—making the workplace an important but underused location for suicide prevention, say CDC researchers who analyzed data on 22,053 suicides in 17 states. The US suicide rate among working adults (aged 16-64 years) rose 34% between 2000 and 2016, from 12.9 to 17.3 per 100,000.
Suicide rates rose in many occupational groups between 2012 and 2015, but identifying the specific role that occupational factors might play in suicide risk is complicated, the researchers say: Both work (eg, little job control and job insecurity) and nonwork (eg, relationship conflict) factors are associated with psychological distress and suicide. And factors such as access to lethal means while on the job play a part as well.
The major occupational group with the highest male suicide rate was Construction and Extraction (from 43.6% in 2012 to 53.2% in 2015. The Arts, Design, Entertainment, Sports, and Media groups had the highest female suicide rate (15.6%, up from 11.7%).
Health Care Support, which ranked twelfth on the 2015 list, actually saw a drop in the numbers of male suicides (19.5/100,000 in 2015, vs 22.1 in 2012). But among women, the numbers rose 31%: from 8.4 per 100,000 to 11.0, making that category third among females.
With a 13% drop (from 10.3 to 9.0), Health Care Practitioners and Technical (female) moved from fourth to sixth place. For men, the category ranked eighth, with a rate change of 23%, from 20.8 to 25.6 suicide deaths per 100,000.
The researchers say better understanding of how suicides are distributed by occupational group might help inform prevention programs and policies. The CDC recommends a comprehensive approach, including strategies such as:
- Enhancing social connectedness;
- Strengthening state or local economic supports;
- Implementing practices that encourage help-seeking and reduce stigma;
- Providing referrals to mental health and other services; and
- Reducing access to lethal means among people at risk
The CDC also encourages decision makers, such as employers, to create a response plan, should someone in their organization commit suicide.
Many adults spend a large part of their time at work—making the workplace an important but underused location for suicide prevention, say CDC researchers who analyzed data on 22,053 suicides in 17 states. The US suicide rate among working adults (aged 16-64 years) rose 34% between 2000 and 2016, from 12.9 to 17.3 per 100,000.
Suicide rates rose in many occupational groups between 2012 and 2015, but identifying the specific role that occupational factors might play in suicide risk is complicated, the researchers say: Both work (eg, little job control and job insecurity) and nonwork (eg, relationship conflict) factors are associated with psychological distress and suicide. And factors such as access to lethal means while on the job play a part as well.
The major occupational group with the highest male suicide rate was Construction and Extraction (from 43.6% in 2012 to 53.2% in 2015. The Arts, Design, Entertainment, Sports, and Media groups had the highest female suicide rate (15.6%, up from 11.7%).
Health Care Support, which ranked twelfth on the 2015 list, actually saw a drop in the numbers of male suicides (19.5/100,000 in 2015, vs 22.1 in 2012). But among women, the numbers rose 31%: from 8.4 per 100,000 to 11.0, making that category third among females.
With a 13% drop (from 10.3 to 9.0), Health Care Practitioners and Technical (female) moved from fourth to sixth place. For men, the category ranked eighth, with a rate change of 23%, from 20.8 to 25.6 suicide deaths per 100,000.
The researchers say better understanding of how suicides are distributed by occupational group might help inform prevention programs and policies. The CDC recommends a comprehensive approach, including strategies such as:
- Enhancing social connectedness;
- Strengthening state or local economic supports;
- Implementing practices that encourage help-seeking and reduce stigma;
- Providing referrals to mental health and other services; and
- Reducing access to lethal means among people at risk
The CDC also encourages decision makers, such as employers, to create a response plan, should someone in their organization commit suicide.
Flu activity increases after 2 weeks of declines
according to the Centers for Disease Control and Prevention.
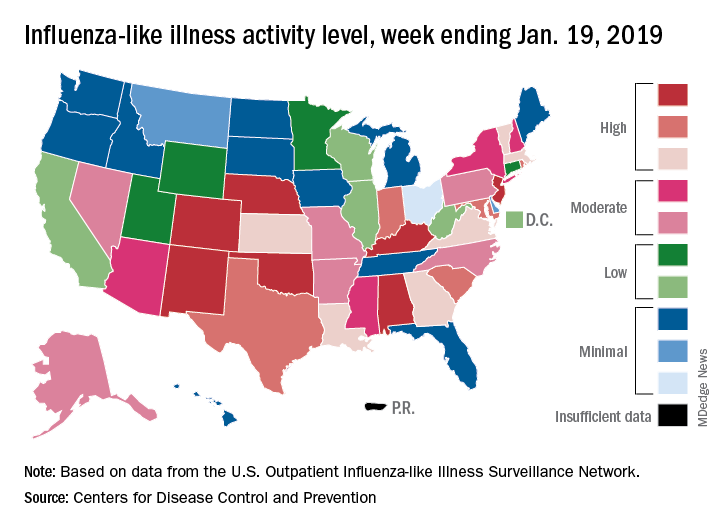
The proportion of outpatient visits for influenza-like illness (ILI) was 3.3% for the most recent measurement period, the CDC’s influenza division reported Jan 25. The previous 2-week decline had seen ILI visits dip down to 3.1% for the week ending Jan. 12 after hitting a season high of 4%.
To go along with the national increase in visits, more states reported high levels of flu activity. For the week ending Jan. 19, seven states were at level 10 on the CDC’s 1-10 scale, compared with four the previous week, and there were 18 states in the high range (levels 8-10), compared with 9 the week before, the CDC said.
Three flu-related pediatric deaths were reported in the week ending Jan. 19, although all three occurred during earlier weeks. The total number of pediatric deaths for the 2018-2019 season is now up to 22. Deaths among all ages, which are reported a week later, totaled 118 for the week ending Jan. 12, with 63% of reporting complete. There were 144 deaths during the week ending Jan. 5, with reporting 86% complete. During the second full week of 2018, in the middle of the very severe 2017-2018 season, there were 1,537 flu-related deaths, CDC data show.
according to the Centers for Disease Control and Prevention.
The proportion of outpatient visits for influenza-like illness (ILI) was 3.3% for the most recent measurement period, the CDC’s influenza division reported Jan 25. The previous 2-week decline had seen ILI visits dip down to 3.1% for the week ending Jan. 12 after hitting a season high of 4%.
To go along with the national increase in visits, more states reported high levels of flu activity. For the week ending Jan. 19, seven states were at level 10 on the CDC’s 1-10 scale, compared with four the previous week, and there were 18 states in the high range (levels 8-10), compared with 9 the week before, the CDC said.
Three flu-related pediatric deaths were reported in the week ending Jan. 19, although all three occurred during earlier weeks. The total number of pediatric deaths for the 2018-2019 season is now up to 22. Deaths among all ages, which are reported a week later, totaled 118 for the week ending Jan. 12, with 63% of reporting complete. There were 144 deaths during the week ending Jan. 5, with reporting 86% complete. During the second full week of 2018, in the middle of the very severe 2017-2018 season, there were 1,537 flu-related deaths, CDC data show.
according to the Centers for Disease Control and Prevention.
The proportion of outpatient visits for influenza-like illness (ILI) was 3.3% for the most recent measurement period, the CDC’s influenza division reported Jan 25. The previous 2-week decline had seen ILI visits dip down to 3.1% for the week ending Jan. 12 after hitting a season high of 4%.
To go along with the national increase in visits, more states reported high levels of flu activity. For the week ending Jan. 19, seven states were at level 10 on the CDC’s 1-10 scale, compared with four the previous week, and there were 18 states in the high range (levels 8-10), compared with 9 the week before, the CDC said.
Three flu-related pediatric deaths were reported in the week ending Jan. 19, although all three occurred during earlier weeks. The total number of pediatric deaths for the 2018-2019 season is now up to 22. Deaths among all ages, which are reported a week later, totaled 118 for the week ending Jan. 12, with 63% of reporting complete. There were 144 deaths during the week ending Jan. 5, with reporting 86% complete. During the second full week of 2018, in the middle of the very severe 2017-2018 season, there were 1,537 flu-related deaths, CDC data show.
Combo treatment may improve quality of life in CTCL
LA JOLLA, CALIF. — Treatment with brentuximab vedotin (BV) and lenalidomide (len) may improve quality of life (QOL) for patients with cutaneous T-cell lymphoma (CTCL), according to the principal investigator of a phase 2 trial.

In this small trial, most CTCL patients experienced relief from pruritus after one cycle of treatment with BV-len.
Investigators also observed durable responses to the combination, although two patients experienced tumor flare prior to response.
“Because of the tumor flare, we decreased the dose of lenalidomide ... and, since then, it has not been a major problem,” said Basem M. William, MD, principal investigator of the trial and a professor at Ohio State University in Columbus.
“We’re trying to be more reassuring to patients that, if they experience a little bit of tumor flare, as long as it’s not dangerous or life-threatening, if they can hold on with the treatment, this might translate to a later durable response.”
Dr. William and his colleagues presented results from this ongoing, phase 2 trial (NCT03409432) at the annual T-cell Lymphoma Forum.
Thus far, the investigators have treated 12 patients with relapsed or refractory CTCL or peripheral T-cell lymphoma (PTCL). The CTCL patients had received at least two lines of skin-directed therapy or one line of systemic therapy, and the PTCL patients had received at least one line of systemic therapy.
Dr. William and his colleagues reported results for 10 patients. Six patients had mycosis fungoides (MF), two had Sézary syndrome (SS), one had CD30+ lymphoproliferative disorder, and one had systemic anaplastic large-cell lymphoma (ALCL).
The patients’ median age was 59 (range, 49-74), there were nine males, and patients had received a median of 2 (range, 1-10) prior therapies.
The first seven patients received BV at 1.2 mg/kg and len at 20 mg daily every 3 weeks. However, after the investigators observed tumor flare in two patients, the dose of len was lowered to 10 mg.
Safety
The investigators said all adverse events (AEs) were reversible by stopping therapy, there were no grade 4 AEs, and none of the patients had grade 3 or higher neuropathy.
“We have not seen an excess of neuropathy, which is very important because both brentuximab and lenalidomide are known to cause neuropathy,” Dr. William said. “So we were fairly concerned that there would be a synergistic neurotoxic effect, which we don’t want, but we haven’t seen that.”
The most common treatment-related AE was neutropenia. Grade 3 neutropenia occurred in four patients.
Other grade 3 AEs, which occurred in patients on the 20 mg dose of len, were thrombocytopenia (n = 1), dyspnea (n = 1), vertigo (n = 1), drug rash with eosinophilia and systemic symptoms (DRESS) syndrome (n = 1), and tumor flare (n = 1).
Three patients discontinued treatment because of AEs — thrombocytopenia, tumor flare, and DRESS syndrome.
Tumor flare and response
“We did see tumor flare in two initial patients treated with the higher dose of lenalidomide, and we had to remove them from the study for their safety,” Dr. William said. “One of them had a full-blown DRESS syndrome. For their safety, we did have to remove them, but both did experience durable remissions after.”
One of the patients with tumor flare, who had MF, didn’t require treatment for 6 months after going off study. The other patient, who had SS, cleared the clone from his blood but developed DRESS syndrome.
In all, three patients achieved a response to treatment. The ALCL patient had a complete response, and two MF patients achieved a partial response.
Two MF patients and one SS patient had stable disease. The remaining four patients — two with MF, one with SS, and one with lymphoproliferative disorder — progressed.
QOL
The investigators used the Skindex-16 to assess the effect of treatment on QOL.
Five of six evaluable patients with CTCL had a 50% or greater reduction in their Skindex-16 scores after two cycles of treatment. In fact, most patients had relief from pruritus after one cycle, Dr. William said.
“Patients with cutaneous T-cell lymphoma, their biggest problem is with the symptom burden, with pruritus,” he said. “They’re really miserable from all the itching they have. They cannot sleep at night. So we’re fairly excited that most of the patients we’ve treated so far had relief from pruritus just after one cycle.”
Dr. William said he and his colleagues are excited about the overall results they have observed with BV-len, although it’s “still pretty early” in the trial. The investigators are planning to enroll a total of 42 patients and may open the trial at a second center.
The study is sponsored by Ohio State University and the lenalidomide is provided by Celgene. Dr. William reported relationships with miRagen Therapeutics, GuidePoint, Kyowa Kirin, and Celgene.
The T-cell Lymphoma Forum is organized by Jonathan Wood & Associates, which is owned by the same company as this news organization.
LA JOLLA, CALIF. — Treatment with brentuximab vedotin (BV) and lenalidomide (len) may improve quality of life (QOL) for patients with cutaneous T-cell lymphoma (CTCL), according to the principal investigator of a phase 2 trial.
In this small trial, most CTCL patients experienced relief from pruritus after one cycle of treatment with BV-len.
Investigators also observed durable responses to the combination, although two patients experienced tumor flare prior to response.
“Because of the tumor flare, we decreased the dose of lenalidomide ... and, since then, it has not been a major problem,” said Basem M. William, MD, principal investigator of the trial and a professor at Ohio State University in Columbus.
“We’re trying to be more reassuring to patients that, if they experience a little bit of tumor flare, as long as it’s not dangerous or life-threatening, if they can hold on with the treatment, this might translate to a later durable response.”
Dr. William and his colleagues presented results from this ongoing, phase 2 trial (NCT03409432) at the annual T-cell Lymphoma Forum.
Thus far, the investigators have treated 12 patients with relapsed or refractory CTCL or peripheral T-cell lymphoma (PTCL). The CTCL patients had received at least two lines of skin-directed therapy or one line of systemic therapy, and the PTCL patients had received at least one line of systemic therapy.
Dr. William and his colleagues reported results for 10 patients. Six patients had mycosis fungoides (MF), two had Sézary syndrome (SS), one had CD30+ lymphoproliferative disorder, and one had systemic anaplastic large-cell lymphoma (ALCL).
The patients’ median age was 59 (range, 49-74), there were nine males, and patients had received a median of 2 (range, 1-10) prior therapies.
The first seven patients received BV at 1.2 mg/kg and len at 20 mg daily every 3 weeks. However, after the investigators observed tumor flare in two patients, the dose of len was lowered to 10 mg.
Safety
The investigators said all adverse events (AEs) were reversible by stopping therapy, there were no grade 4 AEs, and none of the patients had grade 3 or higher neuropathy.
“We have not seen an excess of neuropathy, which is very important because both brentuximab and lenalidomide are known to cause neuropathy,” Dr. William said. “So we were fairly concerned that there would be a synergistic neurotoxic effect, which we don’t want, but we haven’t seen that.”
The most common treatment-related AE was neutropenia. Grade 3 neutropenia occurred in four patients.
Other grade 3 AEs, which occurred in patients on the 20 mg dose of len, were thrombocytopenia (n = 1), dyspnea (n = 1), vertigo (n = 1), drug rash with eosinophilia and systemic symptoms (DRESS) syndrome (n = 1), and tumor flare (n = 1).
Three patients discontinued treatment because of AEs — thrombocytopenia, tumor flare, and DRESS syndrome.
Tumor flare and response
“We did see tumor flare in two initial patients treated with the higher dose of lenalidomide, and we had to remove them from the study for their safety,” Dr. William said. “One of them had a full-blown DRESS syndrome. For their safety, we did have to remove them, but both did experience durable remissions after.”
One of the patients with tumor flare, who had MF, didn’t require treatment for 6 months after going off study. The other patient, who had SS, cleared the clone from his blood but developed DRESS syndrome.
In all, three patients achieved a response to treatment. The ALCL patient had a complete response, and two MF patients achieved a partial response.
Two MF patients and one SS patient had stable disease. The remaining four patients — two with MF, one with SS, and one with lymphoproliferative disorder — progressed.
QOL
The investigators used the Skindex-16 to assess the effect of treatment on QOL.
Five of six evaluable patients with CTCL had a 50% or greater reduction in their Skindex-16 scores after two cycles of treatment. In fact, most patients had relief from pruritus after one cycle, Dr. William said.
“Patients with cutaneous T-cell lymphoma, their biggest problem is with the symptom burden, with pruritus,” he said. “They’re really miserable from all the itching they have. They cannot sleep at night. So we’re fairly excited that most of the patients we’ve treated so far had relief from pruritus just after one cycle.”
Dr. William said he and his colleagues are excited about the overall results they have observed with BV-len, although it’s “still pretty early” in the trial. The investigators are planning to enroll a total of 42 patients and may open the trial at a second center.
The study is sponsored by Ohio State University and the lenalidomide is provided by Celgene. Dr. William reported relationships with miRagen Therapeutics, GuidePoint, Kyowa Kirin, and Celgene.
The T-cell Lymphoma Forum is organized by Jonathan Wood & Associates, which is owned by the same company as this news organization.
LA JOLLA, CALIF. — Treatment with brentuximab vedotin (BV) and lenalidomide (len) may improve quality of life (QOL) for patients with cutaneous T-cell lymphoma (CTCL), according to the principal investigator of a phase 2 trial.
In this small trial, most CTCL patients experienced relief from pruritus after one cycle of treatment with BV-len.
Investigators also observed durable responses to the combination, although two patients experienced tumor flare prior to response.
“Because of the tumor flare, we decreased the dose of lenalidomide ... and, since then, it has not been a major problem,” said Basem M. William, MD, principal investigator of the trial and a professor at Ohio State University in Columbus.
“We’re trying to be more reassuring to patients that, if they experience a little bit of tumor flare, as long as it’s not dangerous or life-threatening, if they can hold on with the treatment, this might translate to a later durable response.”
Dr. William and his colleagues presented results from this ongoing, phase 2 trial (NCT03409432) at the annual T-cell Lymphoma Forum.
Thus far, the investigators have treated 12 patients with relapsed or refractory CTCL or peripheral T-cell lymphoma (PTCL). The CTCL patients had received at least two lines of skin-directed therapy or one line of systemic therapy, and the PTCL patients had received at least one line of systemic therapy.
Dr. William and his colleagues reported results for 10 patients. Six patients had mycosis fungoides (MF), two had Sézary syndrome (SS), one had CD30+ lymphoproliferative disorder, and one had systemic anaplastic large-cell lymphoma (ALCL).
The patients’ median age was 59 (range, 49-74), there were nine males, and patients had received a median of 2 (range, 1-10) prior therapies.
The first seven patients received BV at 1.2 mg/kg and len at 20 mg daily every 3 weeks. However, after the investigators observed tumor flare in two patients, the dose of len was lowered to 10 mg.
Safety
The investigators said all adverse events (AEs) were reversible by stopping therapy, there were no grade 4 AEs, and none of the patients had grade 3 or higher neuropathy.
“We have not seen an excess of neuropathy, which is very important because both brentuximab and lenalidomide are known to cause neuropathy,” Dr. William said. “So we were fairly concerned that there would be a synergistic neurotoxic effect, which we don’t want, but we haven’t seen that.”
The most common treatment-related AE was neutropenia. Grade 3 neutropenia occurred in four patients.
Other grade 3 AEs, which occurred in patients on the 20 mg dose of len, were thrombocytopenia (n = 1), dyspnea (n = 1), vertigo (n = 1), drug rash with eosinophilia and systemic symptoms (DRESS) syndrome (n = 1), and tumor flare (n = 1).
Three patients discontinued treatment because of AEs — thrombocytopenia, tumor flare, and DRESS syndrome.
Tumor flare and response
“We did see tumor flare in two initial patients treated with the higher dose of lenalidomide, and we had to remove them from the study for their safety,” Dr. William said. “One of them had a full-blown DRESS syndrome. For their safety, we did have to remove them, but both did experience durable remissions after.”
One of the patients with tumor flare, who had MF, didn’t require treatment for 6 months after going off study. The other patient, who had SS, cleared the clone from his blood but developed DRESS syndrome.
In all, three patients achieved a response to treatment. The ALCL patient had a complete response, and two MF patients achieved a partial response.
Two MF patients and one SS patient had stable disease. The remaining four patients — two with MF, one with SS, and one with lymphoproliferative disorder — progressed.
QOL
The investigators used the Skindex-16 to assess the effect of treatment on QOL.
Five of six evaluable patients with CTCL had a 50% or greater reduction in their Skindex-16 scores after two cycles of treatment. In fact, most patients had relief from pruritus after one cycle, Dr. William said.
“Patients with cutaneous T-cell lymphoma, their biggest problem is with the symptom burden, with pruritus,” he said. “They’re really miserable from all the itching they have. They cannot sleep at night. So we’re fairly excited that most of the patients we’ve treated so far had relief from pruritus just after one cycle.”
Dr. William said he and his colleagues are excited about the overall results they have observed with BV-len, although it’s “still pretty early” in the trial. The investigators are planning to enroll a total of 42 patients and may open the trial at a second center.
The study is sponsored by Ohio State University and the lenalidomide is provided by Celgene. Dr. William reported relationships with miRagen Therapeutics, GuidePoint, Kyowa Kirin, and Celgene.
The T-cell Lymphoma Forum is organized by Jonathan Wood & Associates, which is owned by the same company as this news organization.
REPORTING FROM TCLF 2019
Key clinical point:
Major finding: Five of six evaluable CTCL patients had a 50% or greater reduction in their Skindex-16 scores after two cycles of treatment.
Study details: A phase 2 study with results reported for 10 patients.
Disclosures: The study is sponsored by Ohio State University and the lenalidomide is provided by Celgene. The principal investigator reported relationships with miRagen Therapeutics, GuidePoint, Kyowa Kirin, and Celgene.

SNOT-22 may help identify patients with undiagnosed OSA
CORONADO, CALIF. – results from a retrospective analysis demonstrated.

“We know based on experience and prior studies that there is significant overlap in symptoms for obstructive sleep apnea and chronic rhinosinusitis [CRS], which are two common conditions in the general population,” one of the study authors, David W. Jang, MD, said in an interview in advance of the Triological Society’s Combined Sections Meeting. “Therefore, it is important to identify patients with undiagnosed OSA who may present to the physician with nose- and sinus-related symptoms.”
Dr. Jang, assistant professor of rhinology and endoscopic skull surgery in the department of surgery at Duke University, Durham, N.C., and his colleagues conducted a 3-year retrospective analysis of 165 adults who presented with a rhinologic chief complaint and completed the SNOT-22 survey. The researchers compared SNOT-22 survey results between patients with untreated OSA confirmed on polysomnography without chronic rhinosinusitis and a control group of CRS patients. A chi-square test with Bonferroni correction was used for analysis.
Of the 165 patients, 41 met criteria for untreated OSA, based on a mean apnea-hypopnea index of 29.3, while 124 were included in the CRS control group. Sleep and psychological domain scores were not significantly different between the two groups, although patients in the OSA group were more likely to choose a sleep-related symptom as their most important complaint (MIC) (P less than .001). As for the cardinal symptoms of CRS, nasal discharge and loss of smell were significantly higher in the CRS group (P less than .001), while facial pain and nasal obstruction were not significantly different (P = .117 and P = .198, respectively). Facial pain and nasal obstruction were the most common MICs in the rhinologic domain for OSA patients; thick nasal discharge and postnasal discharge were the most common MICs reported by patients in the CRS group.

“It was surprising that, for the cardinal symptoms of CRS, only two of the four were significantly worse for the CRS group and predictive of CRS [nasal discharge and loss of smell],” Dr. Jang said. “Nasal obstruction and facial pain scores were similar between the two groups. Also, there was no significant difference in each of the sleep-related questions when comparing the CRS and OSA groups.”
He concluded that the findings further underscore the “significant overlap in symptoms between CRS and OSA. The SNOT-22 questionnaire may help identify patients with undiagnosed OSA.”
Dr. Jang acknowledged certain limitations of the study, including its retrospective design and relatively small sample size. He reported receiving research funding from Olympus.
The meeting was jointly sponsored by the Triological Society and the American College of Surgeons.
CORONADO, CALIF. – results from a retrospective analysis demonstrated.
“We know based on experience and prior studies that there is significant overlap in symptoms for obstructive sleep apnea and chronic rhinosinusitis [CRS], which are two common conditions in the general population,” one of the study authors, David W. Jang, MD, said in an interview in advance of the Triological Society’s Combined Sections Meeting. “Therefore, it is important to identify patients with undiagnosed OSA who may present to the physician with nose- and sinus-related symptoms.”
Dr. Jang, assistant professor of rhinology and endoscopic skull surgery in the department of surgery at Duke University, Durham, N.C., and his colleagues conducted a 3-year retrospective analysis of 165 adults who presented with a rhinologic chief complaint and completed the SNOT-22 survey. The researchers compared SNOT-22 survey results between patients with untreated OSA confirmed on polysomnography without chronic rhinosinusitis and a control group of CRS patients. A chi-square test with Bonferroni correction was used for analysis.
Of the 165 patients, 41 met criteria for untreated OSA, based on a mean apnea-hypopnea index of 29.3, while 124 were included in the CRS control group. Sleep and psychological domain scores were not significantly different between the two groups, although patients in the OSA group were more likely to choose a sleep-related symptom as their most important complaint (MIC) (P less than .001). As for the cardinal symptoms of CRS, nasal discharge and loss of smell were significantly higher in the CRS group (P less than .001), while facial pain and nasal obstruction were not significantly different (P = .117 and P = .198, respectively). Facial pain and nasal obstruction were the most common MICs in the rhinologic domain for OSA patients; thick nasal discharge and postnasal discharge were the most common MICs reported by patients in the CRS group.
“It was surprising that, for the cardinal symptoms of CRS, only two of the four were significantly worse for the CRS group and predictive of CRS [nasal discharge and loss of smell],” Dr. Jang said. “Nasal obstruction and facial pain scores were similar between the two groups. Also, there was no significant difference in each of the sleep-related questions when comparing the CRS and OSA groups.”
He concluded that the findings further underscore the “significant overlap in symptoms between CRS and OSA. The SNOT-22 questionnaire may help identify patients with undiagnosed OSA.”
Dr. Jang acknowledged certain limitations of the study, including its retrospective design and relatively small sample size. He reported receiving research funding from Olympus.
The meeting was jointly sponsored by the Triological Society and the American College of Surgeons.
CORONADO, CALIF. – results from a retrospective analysis demonstrated.
“We know based on experience and prior studies that there is significant overlap in symptoms for obstructive sleep apnea and chronic rhinosinusitis [CRS], which are two common conditions in the general population,” one of the study authors, David W. Jang, MD, said in an interview in advance of the Triological Society’s Combined Sections Meeting. “Therefore, it is important to identify patients with undiagnosed OSA who may present to the physician with nose- and sinus-related symptoms.”
Dr. Jang, assistant professor of rhinology and endoscopic skull surgery in the department of surgery at Duke University, Durham, N.C., and his colleagues conducted a 3-year retrospective analysis of 165 adults who presented with a rhinologic chief complaint and completed the SNOT-22 survey. The researchers compared SNOT-22 survey results between patients with untreated OSA confirmed on polysomnography without chronic rhinosinusitis and a control group of CRS patients. A chi-square test with Bonferroni correction was used for analysis.
Of the 165 patients, 41 met criteria for untreated OSA, based on a mean apnea-hypopnea index of 29.3, while 124 were included in the CRS control group. Sleep and psychological domain scores were not significantly different between the two groups, although patients in the OSA group were more likely to choose a sleep-related symptom as their most important complaint (MIC) (P less than .001). As for the cardinal symptoms of CRS, nasal discharge and loss of smell were significantly higher in the CRS group (P less than .001), while facial pain and nasal obstruction were not significantly different (P = .117 and P = .198, respectively). Facial pain and nasal obstruction were the most common MICs in the rhinologic domain for OSA patients; thick nasal discharge and postnasal discharge were the most common MICs reported by patients in the CRS group.
“It was surprising that, for the cardinal symptoms of CRS, only two of the four were significantly worse for the CRS group and predictive of CRS [nasal discharge and loss of smell],” Dr. Jang said. “Nasal obstruction and facial pain scores were similar between the two groups. Also, there was no significant difference in each of the sleep-related questions when comparing the CRS and OSA groups.”
He concluded that the findings further underscore the “significant overlap in symptoms between CRS and OSA. The SNOT-22 questionnaire may help identify patients with undiagnosed OSA.”
Dr. Jang acknowledged certain limitations of the study, including its retrospective design and relatively small sample size. He reported receiving research funding from Olympus.
The meeting was jointly sponsored by the Triological Society and the American College of Surgeons.
REPORTING FROM THE TRIOLOGICAL CSM
Key clinical point: Obstructive sleep apnea (OSA) should be suspected in patients with sleep dysfunction as their primary complaint without the significant nasal drainage and anosmia that characterizes chronic rhinosinusitis.
Major finding: Sleep and psychological domain scores on the SNOT-22 were not significantly different between patients with chronic rhinosinusitis and those with OSA, although OSA patients were more likely to choose a sleep-related symptom as their most important complaint (P less than .001).
Study details: A retrospective analysis of 165 adults who presented with a rhinologic chief complaint and completed the SNOT-22 survey.
Disclosures: Dr. Jang reported receiving research funding from Olympus.
New study determines factors that can send flu patients to the ICU
Numerous independent factors – including a history of obstructive/central sleep apnea syndrome (OSAS/CSAS) or myocardial infarction, along with a body mass index greater than 30 g/m2 – could be related to ICU admission and subsequent high mortality rates in influenza patients, according to an analysis of patients in the Netherlands who were treated during the influenza epidemic of 2015-2016.

Along with determining these factors, lead author M.C. Beumer, of Radboud University Medical Center, the Netherlands, and his coauthors found that “coinfections with bacterial, fungal, and viral pathogens developed more often in patients who were admitted to the ICU.” The study was published in the Journal of Critical Care.
The coauthors reviewed 199 influenza patients who were admitted to two medical centers in the Netherlands during October 2015–April 2016. Of those patients, 45 (23%) were admitted to the ICU, primarily because of respiratory failure, and their mortality rate was 17/45 (38%) versus an overall mortality rate of 18/199 (9%).
Compared with patients in the normal ward, patients admitted to the ICU more frequently had a history of OSAS/CSAS (11% vs. 3%; P = .03) and MI (20% vs. 6%; P = .007), along with a BMI higher than 30 g/m2 (30% vs. 15%; P = .04) and dyspnea as a symptom (77% vs. 48%,; P = .001). In addition, more ICU-admitted patients had influenza A rather than influenza B, compared with those not admitted (87% vs. 66%; P = .009).
Pulmonary coinfections – including bacterial, fungal, and viral pathogens – were also proportionally higher among the 45 ICU patients (56% vs. 20%; P less than .0001). The most common bacterial pathogens were Staphylococcus aureus (11%) and Streptococcus pneumoniae (7%) while Aspergillus fumigatus (18%) and Pneumocystis jirovecii (7%) topped the fungal pathogens.
Mr. Beumer and his colleagues noted potential limitations of their work, including the selection of patients from among the “most severely ill” contributing to an ICU admission rate that surpassed the 5%-10% described elsewhere. They also admitted that their study relied on a “relatively small sample size,” focusing on one seasonal influenza outbreak. However, “despite the limited validity,” they reiterated that “the identified factors may contribute to a complicated disease course and could represent a tool for early recognition of the influenza patients at risk for a complicated disease course.”
The authors reported no conflicts of interest.
SOURCE: Beumer MC et al. J Crit Care. 2019;50:59-65.
.
Numerous independent factors – including a history of obstructive/central sleep apnea syndrome (OSAS/CSAS) or myocardial infarction, along with a body mass index greater than 30 g/m2 – could be related to ICU admission and subsequent high mortality rates in influenza patients, according to an analysis of patients in the Netherlands who were treated during the influenza epidemic of 2015-2016.
Along with determining these factors, lead author M.C. Beumer, of Radboud University Medical Center, the Netherlands, and his coauthors found that “coinfections with bacterial, fungal, and viral pathogens developed more often in patients who were admitted to the ICU.” The study was published in the Journal of Critical Care.
The coauthors reviewed 199 influenza patients who were admitted to two medical centers in the Netherlands during October 2015–April 2016. Of those patients, 45 (23%) were admitted to the ICU, primarily because of respiratory failure, and their mortality rate was 17/45 (38%) versus an overall mortality rate of 18/199 (9%).
Compared with patients in the normal ward, patients admitted to the ICU more frequently had a history of OSAS/CSAS (11% vs. 3%; P = .03) and MI (20% vs. 6%; P = .007), along with a BMI higher than 30 g/m2 (30% vs. 15%; P = .04) and dyspnea as a symptom (77% vs. 48%,; P = .001). In addition, more ICU-admitted patients had influenza A rather than influenza B, compared with those not admitted (87% vs. 66%; P = .009).
Pulmonary coinfections – including bacterial, fungal, and viral pathogens – were also proportionally higher among the 45 ICU patients (56% vs. 20%; P less than .0001). The most common bacterial pathogens were Staphylococcus aureus (11%) and Streptococcus pneumoniae (7%) while Aspergillus fumigatus (18%) and Pneumocystis jirovecii (7%) topped the fungal pathogens.
Mr. Beumer and his colleagues noted potential limitations of their work, including the selection of patients from among the “most severely ill” contributing to an ICU admission rate that surpassed the 5%-10% described elsewhere. They also admitted that their study relied on a “relatively small sample size,” focusing on one seasonal influenza outbreak. However, “despite the limited validity,” they reiterated that “the identified factors may contribute to a complicated disease course and could represent a tool for early recognition of the influenza patients at risk for a complicated disease course.”
The authors reported no conflicts of interest.
SOURCE: Beumer MC et al. J Crit Care. 2019;50:59-65.
.
Numerous independent factors – including a history of obstructive/central sleep apnea syndrome (OSAS/CSAS) or myocardial infarction, along with a body mass index greater than 30 g/m2 – could be related to ICU admission and subsequent high mortality rates in influenza patients, according to an analysis of patients in the Netherlands who were treated during the influenza epidemic of 2015-2016.
Along with determining these factors, lead author M.C. Beumer, of Radboud University Medical Center, the Netherlands, and his coauthors found that “coinfections with bacterial, fungal, and viral pathogens developed more often in patients who were admitted to the ICU.” The study was published in the Journal of Critical Care.
The coauthors reviewed 199 influenza patients who were admitted to two medical centers in the Netherlands during October 2015–April 2016. Of those patients, 45 (23%) were admitted to the ICU, primarily because of respiratory failure, and their mortality rate was 17/45 (38%) versus an overall mortality rate of 18/199 (9%).
Compared with patients in the normal ward, patients admitted to the ICU more frequently had a history of OSAS/CSAS (11% vs. 3%; P = .03) and MI (20% vs. 6%; P = .007), along with a BMI higher than 30 g/m2 (30% vs. 15%; P = .04) and dyspnea as a symptom (77% vs. 48%,; P = .001). In addition, more ICU-admitted patients had influenza A rather than influenza B, compared with those not admitted (87% vs. 66%; P = .009).
Pulmonary coinfections – including bacterial, fungal, and viral pathogens – were also proportionally higher among the 45 ICU patients (56% vs. 20%; P less than .0001). The most common bacterial pathogens were Staphylococcus aureus (11%) and Streptococcus pneumoniae (7%) while Aspergillus fumigatus (18%) and Pneumocystis jirovecii (7%) topped the fungal pathogens.
Mr. Beumer and his colleagues noted potential limitations of their work, including the selection of patients from among the “most severely ill” contributing to an ICU admission rate that surpassed the 5%-10% described elsewhere. They also admitted that their study relied on a “relatively small sample size,” focusing on one seasonal influenza outbreak. However, “despite the limited validity,” they reiterated that “the identified factors may contribute to a complicated disease course and could represent a tool for early recognition of the influenza patients at risk for a complicated disease course.”
The authors reported no conflicts of interest.
SOURCE: Beumer MC et al. J Crit Care. 2019;50:59-65.
.
FROM THE JOURNAL OF CRITICAL CARE
Key clinical point:
Major finding: Flu patients in the ICU more frequently had a history of obstructive/central sleep apnea syndrome (11% vs. 3%; P = .03) and MI (20% vs. 6%; P = .007), compared with non-ICU flu patients.
Study details: A retrospective cohort study of 199 flu patients who were admitted to two academic hospitals in the Netherlands.
Disclosures: The authors reported no conflicts of interest.
Source: Beumer MC et al. J Crit Care. 2019; 50:59-65.
Prescribed opioids increase pneumonia risk in patients with, without HIV
Prescribed opioids were associated with an increase in community-acquired pneumonia in patients with and without HIV infection, according to results of a large database study.
People living with HIV (PLWH) appeared to have a greater community-acquired pneumonia (CAP) risk at lower opioid doses and particularly with immunosuppressive opioids compared with uninfected patients, although the difference was not significant, E. Jennifer Edelman, MD, of Yale University, New Haven, Conn., and her colleagues wrote in JAMA Internal Medicine.
The researchers performed a nested case-control study comprising 25,392 participants (98.9% men; mean age, 55 years) in the Veterans Aging Cohort Study from Jan. 1, 2000, through Dec. 31, 2012.
Dr. Edelman and her colleagues compared the characteristics of 4,246 CAP cases with those of 21,146 uninfected controls in the sample. They also compared cases and controls by HIV status. They ran bivariate and multivariate analysis to estimate odds ratios for CAP risk associated with opioid exposure. In addition, the researchers ran models stratified by HIV status and formally checked for an interaction between prescribed opioid characteristics and HIV status.
In unadjusted logistic regression, prescribed opioids were associated with increased odds of CAP, with the greatest risk observed with currently prescribed opioids, compared with past prescribed opioids or no opioids.
Prescribed opioids remained associated with CAP in the adjusted models for past unknown or nonimmunosuppressive (adjusted OR, 1.24; 95% confidence interval, 1.09-1.40) and past immunosuppressive opioid use (aOR, 1.42; 95% CI, 1.21-1.67).
For currently prescribed opioids, nonimmunosuppressive or unknown, the aOR was 1.23 (95% CI, 1.03-1.48). For currently prescribed immunosuppressive opioids, the aOR was 3.18 (95% CI, 2.44-4.14).
The researchers also found evidence of a dose-response effect such that currently prescribed high-dose opioids were associated with the greatest CAP risk, followed by medium- and then by low-dose opioids, whether immunosuppressive or not.
With regard to the effect of HIV status in stratified, adjusted analyses, CAP risk tended to be greater among PLWH with current prescribed opioids, especially immunosuppressive opioids, compared with uninfected patients. However, the overall interaction term for opioid × HIV status was not significant (P = .36).
Although the researchers stated that a limitation of their study was an inability to prove causality or rule out respiratory depression (vs. immunosuppression) as the cause of the increased CAP risk, “the observed effects of opioid immunosuppressive properties and CAP risk lend support to our hypothesis that opioids have clinically relevant immunosuppressive properties.”
Dr. Edelman and her colleagues cited several limitations. For example, they were not able to determine whether patients took their prescribed medications appropriately and assess whether the patients took nonmedically prescribed opioids. Also, because men made up such a large portion of the study population, it is unclear whether the results are generalizable to women.
Nevertheless, the study “adds to growing evidence of potential medical harms associated with prescribed opioids,” they wrote.
“Health care professionals should be aware of this additional CAP risk when they prescribe opioids, and future studies should investigate the effects of opioids prescribed for longer durations and on other immune-related outcomes,” wrote Dr. Edelman and her colleagues. “Understanding whether mitigating the risk of prescribed opioids for CAP is possible by using a lower dose and nonimmunosuppressive opioids awaits further study.”
However, without such data, when prescribed opioids are warranted, physicians should attempt to modify other factors known to affect CAP risk, including smoking and lack of vaccination, Dr. Edelman and her colleagues concluded.
Several U.S. government agencies and Yale University provided funding for the study. The authors reported that they had no conflicts.
SOURCE: Edelman EJ et al. JAMA Intern Med. 2019 Jan 7. doi: 10.1001/jamainternmed.2018.6101.
Prescribed opioids were associated with an increase in community-acquired pneumonia in patients with and without HIV infection, according to results of a large database study.
People living with HIV (PLWH) appeared to have a greater community-acquired pneumonia (CAP) risk at lower opioid doses and particularly with immunosuppressive opioids compared with uninfected patients, although the difference was not significant, E. Jennifer Edelman, MD, of Yale University, New Haven, Conn., and her colleagues wrote in JAMA Internal Medicine.
The researchers performed a nested case-control study comprising 25,392 participants (98.9% men; mean age, 55 years) in the Veterans Aging Cohort Study from Jan. 1, 2000, through Dec. 31, 2012.
Dr. Edelman and her colleagues compared the characteristics of 4,246 CAP cases with those of 21,146 uninfected controls in the sample. They also compared cases and controls by HIV status. They ran bivariate and multivariate analysis to estimate odds ratios for CAP risk associated with opioid exposure. In addition, the researchers ran models stratified by HIV status and formally checked for an interaction between prescribed opioid characteristics and HIV status.
In unadjusted logistic regression, prescribed opioids were associated with increased odds of CAP, with the greatest risk observed with currently prescribed opioids, compared with past prescribed opioids or no opioids.
Prescribed opioids remained associated with CAP in the adjusted models for past unknown or nonimmunosuppressive (adjusted OR, 1.24; 95% confidence interval, 1.09-1.40) and past immunosuppressive opioid use (aOR, 1.42; 95% CI, 1.21-1.67).
For currently prescribed opioids, nonimmunosuppressive or unknown, the aOR was 1.23 (95% CI, 1.03-1.48). For currently prescribed immunosuppressive opioids, the aOR was 3.18 (95% CI, 2.44-4.14).
The researchers also found evidence of a dose-response effect such that currently prescribed high-dose opioids were associated with the greatest CAP risk, followed by medium- and then by low-dose opioids, whether immunosuppressive or not.
With regard to the effect of HIV status in stratified, adjusted analyses, CAP risk tended to be greater among PLWH with current prescribed opioids, especially immunosuppressive opioids, compared with uninfected patients. However, the overall interaction term for opioid × HIV status was not significant (P = .36).
Although the researchers stated that a limitation of their study was an inability to prove causality or rule out respiratory depression (vs. immunosuppression) as the cause of the increased CAP risk, “the observed effects of opioid immunosuppressive properties and CAP risk lend support to our hypothesis that opioids have clinically relevant immunosuppressive properties.”
Dr. Edelman and her colleagues cited several limitations. For example, they were not able to determine whether patients took their prescribed medications appropriately and assess whether the patients took nonmedically prescribed opioids. Also, because men made up such a large portion of the study population, it is unclear whether the results are generalizable to women.
Nevertheless, the study “adds to growing evidence of potential medical harms associated with prescribed opioids,” they wrote.
“Health care professionals should be aware of this additional CAP risk when they prescribe opioids, and future studies should investigate the effects of opioids prescribed for longer durations and on other immune-related outcomes,” wrote Dr. Edelman and her colleagues. “Understanding whether mitigating the risk of prescribed opioids for CAP is possible by using a lower dose and nonimmunosuppressive opioids awaits further study.”
However, without such data, when prescribed opioids are warranted, physicians should attempt to modify other factors known to affect CAP risk, including smoking and lack of vaccination, Dr. Edelman and her colleagues concluded.
Several U.S. government agencies and Yale University provided funding for the study. The authors reported that they had no conflicts.
SOURCE: Edelman EJ et al. JAMA Intern Med. 2019 Jan 7. doi: 10.1001/jamainternmed.2018.6101.
Prescribed opioids were associated with an increase in community-acquired pneumonia in patients with and without HIV infection, according to results of a large database study.
People living with HIV (PLWH) appeared to have a greater community-acquired pneumonia (CAP) risk at lower opioid doses and particularly with immunosuppressive opioids compared with uninfected patients, although the difference was not significant, E. Jennifer Edelman, MD, of Yale University, New Haven, Conn., and her colleagues wrote in JAMA Internal Medicine.
The researchers performed a nested case-control study comprising 25,392 participants (98.9% men; mean age, 55 years) in the Veterans Aging Cohort Study from Jan. 1, 2000, through Dec. 31, 2012.
Dr. Edelman and her colleagues compared the characteristics of 4,246 CAP cases with those of 21,146 uninfected controls in the sample. They also compared cases and controls by HIV status. They ran bivariate and multivariate analysis to estimate odds ratios for CAP risk associated with opioid exposure. In addition, the researchers ran models stratified by HIV status and formally checked for an interaction between prescribed opioid characteristics and HIV status.
In unadjusted logistic regression, prescribed opioids were associated with increased odds of CAP, with the greatest risk observed with currently prescribed opioids, compared with past prescribed opioids or no opioids.
Prescribed opioids remained associated with CAP in the adjusted models for past unknown or nonimmunosuppressive (adjusted OR, 1.24; 95% confidence interval, 1.09-1.40) and past immunosuppressive opioid use (aOR, 1.42; 95% CI, 1.21-1.67).
For currently prescribed opioids, nonimmunosuppressive or unknown, the aOR was 1.23 (95% CI, 1.03-1.48). For currently prescribed immunosuppressive opioids, the aOR was 3.18 (95% CI, 2.44-4.14).
The researchers also found evidence of a dose-response effect such that currently prescribed high-dose opioids were associated with the greatest CAP risk, followed by medium- and then by low-dose opioids, whether immunosuppressive or not.
With regard to the effect of HIV status in stratified, adjusted analyses, CAP risk tended to be greater among PLWH with current prescribed opioids, especially immunosuppressive opioids, compared with uninfected patients. However, the overall interaction term for opioid × HIV status was not significant (P = .36).
Although the researchers stated that a limitation of their study was an inability to prove causality or rule out respiratory depression (vs. immunosuppression) as the cause of the increased CAP risk, “the observed effects of opioid immunosuppressive properties and CAP risk lend support to our hypothesis that opioids have clinically relevant immunosuppressive properties.”
Dr. Edelman and her colleagues cited several limitations. For example, they were not able to determine whether patients took their prescribed medications appropriately and assess whether the patients took nonmedically prescribed opioids. Also, because men made up such a large portion of the study population, it is unclear whether the results are generalizable to women.
Nevertheless, the study “adds to growing evidence of potential medical harms associated with prescribed opioids,” they wrote.
“Health care professionals should be aware of this additional CAP risk when they prescribe opioids, and future studies should investigate the effects of opioids prescribed for longer durations and on other immune-related outcomes,” wrote Dr. Edelman and her colleagues. “Understanding whether mitigating the risk of prescribed opioids for CAP is possible by using a lower dose and nonimmunosuppressive opioids awaits further study.”
However, without such data, when prescribed opioids are warranted, physicians should attempt to modify other factors known to affect CAP risk, including smoking and lack of vaccination, Dr. Edelman and her colleagues concluded.
Several U.S. government agencies and Yale University provided funding for the study. The authors reported that they had no conflicts.
SOURCE: Edelman EJ et al. JAMA Intern Med. 2019 Jan 7. doi: 10.1001/jamainternmed.2018.6101.
FROM JAMA INTERNAL MEDICINE
Key clinical point: Prescribed opioids, especially those with immunosuppressive properties, are associated with increased community-acquired pneumonia risk.
Major finding: For currently prescribed immunosuppressive opioids, the adjusted odds ratio for community-acquired pneumonia was 3.18 (95% confidence interval, 2.44-4.14).
Study details: A nested case-control study of 25,392 patients in the Veterans Aging Cohort Study from Jan. 1, 2000, through Dec. 31, 2012.
Disclosures: Funding was provided by a variety of government organizations and Yale University, New Haven, Conn. The authors reported that they had no conflicts.
Source: Edelman EJ et al. JAMA Intern Med. 2019 Jan 7. doi: 10.1001/jamainternmed.2018.6101.
COPD linked to higher in-hospital death rates in patients with PAD
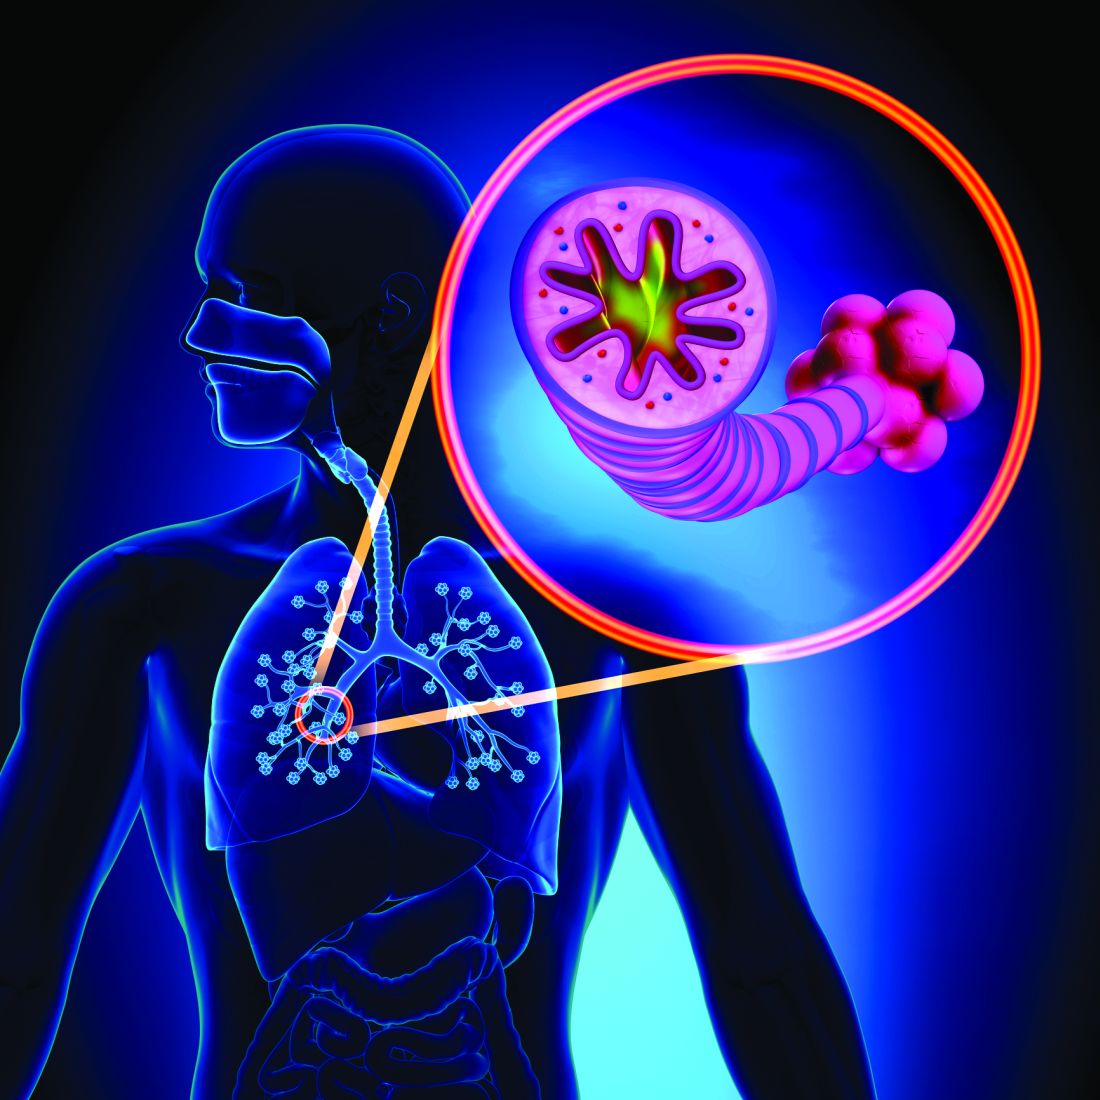
A growing body of evidence suggests that, along with other vascular beds, smoking and chronic obstructive pulmonary disease (COPD) affect the arteries of the lower limbs in terms of the development of peripheral arterial disease (PAD), reported Karsten Keller, MD, of the Johannes Gutenberg-University Mainz (Germany) and his colleagues.
This provided the rationale for their large database analysis of inpatients with concomitant COPD and PAD. They found that the additional presence of COPD was associated with increased in-hospital mortality in patients with PAD.
“Our data suggest that COPD increased the mortality of PAD patients by the factor 1.2-fold,” they wrote in Respiratory Medicine. “Unexpectedly, this increase was not driven by [myocardial infarction] as the life-threatening acute presentation of [coronary artery disease], but rather related to an increased risk for [pulmonary embolism] and a higher coprevalence of cancer.”
Dr. Keller and his colleagues inspected the German inpatient national database based on ICD codes. They identified 5,611,827 adult inpatients (64.8% men) diagnosed with PAD between January 2005 and December 2015, and of those, 13.6% also were coded for COPD. Overall, 277,894 PAD patients (5.0%) died in the hospital, Dr. Keller and his colleagues wrote.
The all-cause, in-hospital mortality was significantly higher in PAD patients with COPD, compared with those without COPD (6.5% vs. 4.7%, respectively; P less than .001), and cardiovascular events comprising pulmonary embolism (PE), deep vein thrombosis (DVT), and myocardial infarction (MI) occurred more often in coprevalence with PAD and COPD than in PAD without COPD.
In PAD patients, COPD was an independent predictor of in-hospital death (odds ratio, 1.16; 95% confidence interval, 1.15-1.17; P less than .001) as well as an independent predictor for PE (OR, 1.44; 95% CI, 1.40-1.49; P less than .001).
Overall, PAD patients with COPD were of similar age as (73 years), but stayed slightly longer in the hospital than (9 vs. 8 days), those without COPD. PAD patients without COPD revealed more often cardiovascular risk factors like essential arterial hypertension and diabetes, but the prevalence of cardiovascular diseases such as coronary artery disease and heart failure were more often found in PAD patients with COPD. In addition, cancer and renal insufficiency also were more common in PAD patients with COPD, according to the authors.
“Remarkably, PAD patients with COPD showed more frequently lower PAD stages than those without COPD. Especially, PAD stage IV was more prevalent in PAD patients without COPD (19.6% vs. 13.8%; P less than 0.001),” the authors stated. In addition, amputations were more often performed in PAD patients without COPD.
Dr. Keller and his colleagues had the following conclusions regarding the clinical implications of their study: “I) PAD patients with long-standing tobacco use might benefit from COPD screening and treatment. II) PAD patients with additional COPD should be monitored more intensively, and the treatment for COPD should be optimized. III) COPD increases the risk for PE, and it is critical not to overlook this life-threatening disease. IV) MI and PE are important causes of in-hospital death in PAD patients with and without COPD.”
The German Federal Ministry of Education and Research funded the study, and the authors reported having no conflicts.
SOURCE: Keller K et al. Respir Med. 2019 Feb;147:1-6.
A growing body of evidence suggests that, along with other vascular beds, smoking and chronic obstructive pulmonary disease (COPD) affect the arteries of the lower limbs in terms of the development of peripheral arterial disease (PAD), reported Karsten Keller, MD, of the Johannes Gutenberg-University Mainz (Germany) and his colleagues.
This provided the rationale for their large database analysis of inpatients with concomitant COPD and PAD. They found that the additional presence of COPD was associated with increased in-hospital mortality in patients with PAD.
“Our data suggest that COPD increased the mortality of PAD patients by the factor 1.2-fold,” they wrote in Respiratory Medicine. “Unexpectedly, this increase was not driven by [myocardial infarction] as the life-threatening acute presentation of [coronary artery disease], but rather related to an increased risk for [pulmonary embolism] and a higher coprevalence of cancer.”
Dr. Keller and his colleagues inspected the German inpatient national database based on ICD codes. They identified 5,611,827 adult inpatients (64.8% men) diagnosed with PAD between January 2005 and December 2015, and of those, 13.6% also were coded for COPD. Overall, 277,894 PAD patients (5.0%) died in the hospital, Dr. Keller and his colleagues wrote.
The all-cause, in-hospital mortality was significantly higher in PAD patients with COPD, compared with those without COPD (6.5% vs. 4.7%, respectively; P less than .001), and cardiovascular events comprising pulmonary embolism (PE), deep vein thrombosis (DVT), and myocardial infarction (MI) occurred more often in coprevalence with PAD and COPD than in PAD without COPD.
In PAD patients, COPD was an independent predictor of in-hospital death (odds ratio, 1.16; 95% confidence interval, 1.15-1.17; P less than .001) as well as an independent predictor for PE (OR, 1.44; 95% CI, 1.40-1.49; P less than .001).
Overall, PAD patients with COPD were of similar age as (73 years), but stayed slightly longer in the hospital than (9 vs. 8 days), those without COPD. PAD patients without COPD revealed more often cardiovascular risk factors like essential arterial hypertension and diabetes, but the prevalence of cardiovascular diseases such as coronary artery disease and heart failure were more often found in PAD patients with COPD. In addition, cancer and renal insufficiency also were more common in PAD patients with COPD, according to the authors.
“Remarkably, PAD patients with COPD showed more frequently lower PAD stages than those without COPD. Especially, PAD stage IV was more prevalent in PAD patients without COPD (19.6% vs. 13.8%; P less than 0.001),” the authors stated. In addition, amputations were more often performed in PAD patients without COPD.
Dr. Keller and his colleagues had the following conclusions regarding the clinical implications of their study: “I) PAD patients with long-standing tobacco use might benefit from COPD screening and treatment. II) PAD patients with additional COPD should be monitored more intensively, and the treatment for COPD should be optimized. III) COPD increases the risk for PE, and it is critical not to overlook this life-threatening disease. IV) MI and PE are important causes of in-hospital death in PAD patients with and without COPD.”
The German Federal Ministry of Education and Research funded the study, and the authors reported having no conflicts.
SOURCE: Keller K et al. Respir Med. 2019 Feb;147:1-6.
A growing body of evidence suggests that, along with other vascular beds, smoking and chronic obstructive pulmonary disease (COPD) affect the arteries of the lower limbs in terms of the development of peripheral arterial disease (PAD), reported Karsten Keller, MD, of the Johannes Gutenberg-University Mainz (Germany) and his colleagues.
This provided the rationale for their large database analysis of inpatients with concomitant COPD and PAD. They found that the additional presence of COPD was associated with increased in-hospital mortality in patients with PAD.
“Our data suggest that COPD increased the mortality of PAD patients by the factor 1.2-fold,” they wrote in Respiratory Medicine. “Unexpectedly, this increase was not driven by [myocardial infarction] as the life-threatening acute presentation of [coronary artery disease], but rather related to an increased risk for [pulmonary embolism] and a higher coprevalence of cancer.”
Dr. Keller and his colleagues inspected the German inpatient national database based on ICD codes. They identified 5,611,827 adult inpatients (64.8% men) diagnosed with PAD between January 2005 and December 2015, and of those, 13.6% also were coded for COPD. Overall, 277,894 PAD patients (5.0%) died in the hospital, Dr. Keller and his colleagues wrote.
The all-cause, in-hospital mortality was significantly higher in PAD patients with COPD, compared with those without COPD (6.5% vs. 4.7%, respectively; P less than .001), and cardiovascular events comprising pulmonary embolism (PE), deep vein thrombosis (DVT), and myocardial infarction (MI) occurred more often in coprevalence with PAD and COPD than in PAD without COPD.
In PAD patients, COPD was an independent predictor of in-hospital death (odds ratio, 1.16; 95% confidence interval, 1.15-1.17; P less than .001) as well as an independent predictor for PE (OR, 1.44; 95% CI, 1.40-1.49; P less than .001).
Overall, PAD patients with COPD were of similar age as (73 years), but stayed slightly longer in the hospital than (9 vs. 8 days), those without COPD. PAD patients without COPD revealed more often cardiovascular risk factors like essential arterial hypertension and diabetes, but the prevalence of cardiovascular diseases such as coronary artery disease and heart failure were more often found in PAD patients with COPD. In addition, cancer and renal insufficiency also were more common in PAD patients with COPD, according to the authors.
“Remarkably, PAD patients with COPD showed more frequently lower PAD stages than those without COPD. Especially, PAD stage IV was more prevalent in PAD patients without COPD (19.6% vs. 13.8%; P less than 0.001),” the authors stated. In addition, amputations were more often performed in PAD patients without COPD.
Dr. Keller and his colleagues had the following conclusions regarding the clinical implications of their study: “I) PAD patients with long-standing tobacco use might benefit from COPD screening and treatment. II) PAD patients with additional COPD should be monitored more intensively, and the treatment for COPD should be optimized. III) COPD increases the risk for PE, and it is critical not to overlook this life-threatening disease. IV) MI and PE are important causes of in-hospital death in PAD patients with and without COPD.”
The German Federal Ministry of Education and Research funded the study, and the authors reported having no conflicts.
SOURCE: Keller K et al. Respir Med. 2019 Feb;147:1-6.
FROM RESPIRATORY MEDICINE
Key clinical point:
Major finding: All-cause, in-hospital mortality was significantly higher in PAD patients with COPD, compared with those without (6.5% vs. 4.7%; P less than 0.001).
Study details: Database analysis of 5.6 million German PAD inpatients stratified for COPD.
Disclosures: The German Federal Ministry of Education and Research funded the study, and the authors reported having no conflicts.
Source: Keller K et al. Respir Med. 2019 Feb;147:1-6.
Flu activity down for second consecutive week
The second week of the new year brought a second straight week of declining activity for the 2018-2019 flu season, according to the Centers for Disease Control and Prevention.
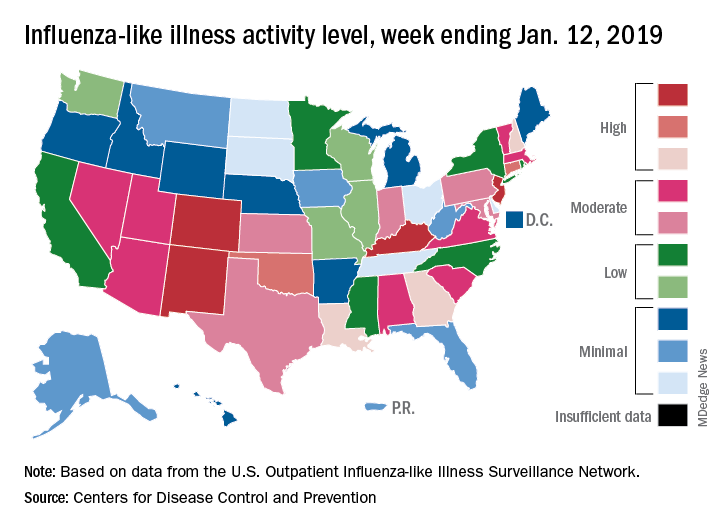
The proportion of outpatient visits for influenza-like illness (ILI) was 3.1% for the week ending Jan. 12, 2019, down from 3.5% the previous week but still above the national baseline level of 2.2%, the CDC’s influenza division reported Jan. 18.
Activity was also down at the state level. There were 4 states – Colorado, Kentucky, New Jersey, and New Mexico – at level 10 on the CDC’s 1-10 scale for ILI activity, compared with 10 the week before, and a total of 9 were in the high range from 8 to 10, compared with 15 the previous week, data from the influenza division show.
Reports of total influenza deaths, which lag a week behind other measures, continue to rise: 111 for the week ending Jan. 5, although reporting is only 72% complete. There were 89 deaths during the previous week, with reporting 82% complete so far. Total flu-related deaths among children are up to 19 for the 2018-2019 season after three more were reported during the week ending Jan. 12, the CDC said. Influenza deaths from the comparable weeks of the much more severe 2017-2018 season were 1,163 for all ages and 10 for children.
The second week of the new year brought a second straight week of declining activity for the 2018-2019 flu season, according to the Centers for Disease Control and Prevention.
The proportion of outpatient visits for influenza-like illness (ILI) was 3.1% for the week ending Jan. 12, 2019, down from 3.5% the previous week but still above the national baseline level of 2.2%, the CDC’s influenza division reported Jan. 18.
Activity was also down at the state level. There were 4 states – Colorado, Kentucky, New Jersey, and New Mexico – at level 10 on the CDC’s 1-10 scale for ILI activity, compared with 10 the week before, and a total of 9 were in the high range from 8 to 10, compared with 15 the previous week, data from the influenza division show.
Reports of total influenza deaths, which lag a week behind other measures, continue to rise: 111 for the week ending Jan. 5, although reporting is only 72% complete. There were 89 deaths during the previous week, with reporting 82% complete so far. Total flu-related deaths among children are up to 19 for the 2018-2019 season after three more were reported during the week ending Jan. 12, the CDC said. Influenza deaths from the comparable weeks of the much more severe 2017-2018 season were 1,163 for all ages and 10 for children.
The second week of the new year brought a second straight week of declining activity for the 2018-2019 flu season, according to the Centers for Disease Control and Prevention.
The proportion of outpatient visits for influenza-like illness (ILI) was 3.1% for the week ending Jan. 12, 2019, down from 3.5% the previous week but still above the national baseline level of 2.2%, the CDC’s influenza division reported Jan. 18.
Activity was also down at the state level. There were 4 states – Colorado, Kentucky, New Jersey, and New Mexico – at level 10 on the CDC’s 1-10 scale for ILI activity, compared with 10 the week before, and a total of 9 were in the high range from 8 to 10, compared with 15 the previous week, data from the influenza division show.
Reports of total influenza deaths, which lag a week behind other measures, continue to rise: 111 for the week ending Jan. 5, although reporting is only 72% complete. There were 89 deaths during the previous week, with reporting 82% complete so far. Total flu-related deaths among children are up to 19 for the 2018-2019 season after three more were reported during the week ending Jan. 12, the CDC said. Influenza deaths from the comparable weeks of the much more severe 2017-2018 season were 1,163 for all ages and 10 for children.
Zanubrutinib receives breakthrough designation for MCL
The (MCL) who have received at least one prior therapy.

Zanubrutinib (BGB-3111) is a Bruton’s tyrosine kinase inhibitor being developed by BeiGene as a potential treatment for B-cell malignancies.
Researchers have evaluated zanubrutinib in a phase 2 trial (NCT03206970) of patients with relapsed/refractory MCL. Results from this trial were presented at the 2018 annual meeting of the American Society of Hematology (Abstract 148).
As of March 27, 2018, 86 patients had been enrolled in the trial and received treatment. They had a median of two prior lines of therapy and they received zanubrutinib at 160 mg twice daily.
Eighty-five patients were evaluable for efficacy. The overall response rate was 83.5% (71/85), and the complete response rate was 58.8% (50/85). At a median follow-up of 24.1 weeks, the median duration of response and median progression-free survival had not been reached. The estimated 24-week progression-free survival rate was 82%. The most common adverse events (AEs) in this trial were decrease in neutrophil count (31.4%), rash (29.1%), upper respiratory tract infection (29.1%), and decrease in platelet count (22.1%). Common grade 3 or higher AEs included neutrophil count decrease (11.6%) and lung infection (5.8%).
Four patients had fatal treatment-emergent AEs. One death was caused by a traffic accident, one was due to cerebral hemorrhage, and one resulted from pneumonia. The fourth death occurred in a patient with infection, but the cause of death was unknown.
Breakthrough therapy designation is designed to expedite the development and review of a therapy for a serious or life-threatening disease, following preliminary clinical evidence indicating it demonstrates substantial improvement over existing therapies.
The (MCL) who have received at least one prior therapy.
Zanubrutinib (BGB-3111) is a Bruton’s tyrosine kinase inhibitor being developed by BeiGene as a potential treatment for B-cell malignancies.
Researchers have evaluated zanubrutinib in a phase 2 trial (NCT03206970) of patients with relapsed/refractory MCL. Results from this trial were presented at the 2018 annual meeting of the American Society of Hematology (Abstract 148).
As of March 27, 2018, 86 patients had been enrolled in the trial and received treatment. They had a median of two prior lines of therapy and they received zanubrutinib at 160 mg twice daily.
Eighty-five patients were evaluable for efficacy. The overall response rate was 83.5% (71/85), and the complete response rate was 58.8% (50/85). At a median follow-up of 24.1 weeks, the median duration of response and median progression-free survival had not been reached. The estimated 24-week progression-free survival rate was 82%. The most common adverse events (AEs) in this trial were decrease in neutrophil count (31.4%), rash (29.1%), upper respiratory tract infection (29.1%), and decrease in platelet count (22.1%). Common grade 3 or higher AEs included neutrophil count decrease (11.6%) and lung infection (5.8%).
Four patients had fatal treatment-emergent AEs. One death was caused by a traffic accident, one was due to cerebral hemorrhage, and one resulted from pneumonia. The fourth death occurred in a patient with infection, but the cause of death was unknown.
Breakthrough therapy designation is designed to expedite the development and review of a therapy for a serious or life-threatening disease, following preliminary clinical evidence indicating it demonstrates substantial improvement over existing therapies.
The (MCL) who have received at least one prior therapy.
Zanubrutinib (BGB-3111) is a Bruton’s tyrosine kinase inhibitor being developed by BeiGene as a potential treatment for B-cell malignancies.
Researchers have evaluated zanubrutinib in a phase 2 trial (NCT03206970) of patients with relapsed/refractory MCL. Results from this trial were presented at the 2018 annual meeting of the American Society of Hematology (Abstract 148).
As of March 27, 2018, 86 patients had been enrolled in the trial and received treatment. They had a median of two prior lines of therapy and they received zanubrutinib at 160 mg twice daily.
Eighty-five patients were evaluable for efficacy. The overall response rate was 83.5% (71/85), and the complete response rate was 58.8% (50/85). At a median follow-up of 24.1 weeks, the median duration of response and median progression-free survival had not been reached. The estimated 24-week progression-free survival rate was 82%. The most common adverse events (AEs) in this trial were decrease in neutrophil count (31.4%), rash (29.1%), upper respiratory tract infection (29.1%), and decrease in platelet count (22.1%). Common grade 3 or higher AEs included neutrophil count decrease (11.6%) and lung infection (5.8%).
Four patients had fatal treatment-emergent AEs. One death was caused by a traffic accident, one was due to cerebral hemorrhage, and one resulted from pneumonia. The fourth death occurred in a patient with infection, but the cause of death was unknown.
Breakthrough therapy designation is designed to expedite the development and review of a therapy for a serious or life-threatening disease, following preliminary clinical evidence indicating it demonstrates substantial improvement over existing therapies.
FDA approves generic version of vigabatrin
The drug is approved for the adjunctive treatment of focal seizures in patients aged 10 years and older who have not had an adequate response to other therapies.
The approval was granted to Teva Pharmaceuticals.
An FDA announcement noted that the agency has prioritized the approval of generic versions of drugs to improve access to treatments and to lower drug costs. Vigabatrin had been included on an FDA list of off-patent, off-exclusivity branded drugs without approved generics. The approval of generic vigabatrin “demonstrates that there is an open pathway to approving products like this one,” said FDA Commissioner Scott Gottlieb, MD.
The label for vigabatrin tablets includes a boxed warning for permanent vision loss. The generic vigabatrin tablets are part of a single shared-system Risk Evaluation and Mitigation Strategy (REMS) program with other drug products containing vigabatrin.
The most common side effects associated with vigabatrin tablets include dizziness, fatigue, sleepiness, involuntary eye movement, tremor, blurred vision, memory impairment, weight gain, joint pain, upper respiratory tract infection, aggression, double vision, abnormal coordination, and a confused state. Serious side effects associated with vigabatrin tablets include permanent vision loss and risk of suicidal thoughts or actions.
The drug is approved for the adjunctive treatment of focal seizures in patients aged 10 years and older who have not had an adequate response to other therapies.
The approval was granted to Teva Pharmaceuticals.
An FDA announcement noted that the agency has prioritized the approval of generic versions of drugs to improve access to treatments and to lower drug costs. Vigabatrin had been included on an FDA list of off-patent, off-exclusivity branded drugs without approved generics. The approval of generic vigabatrin “demonstrates that there is an open pathway to approving products like this one,” said FDA Commissioner Scott Gottlieb, MD.
The label for vigabatrin tablets includes a boxed warning for permanent vision loss. The generic vigabatrin tablets are part of a single shared-system Risk Evaluation and Mitigation Strategy (REMS) program with other drug products containing vigabatrin.
The most common side effects associated with vigabatrin tablets include dizziness, fatigue, sleepiness, involuntary eye movement, tremor, blurred vision, memory impairment, weight gain, joint pain, upper respiratory tract infection, aggression, double vision, abnormal coordination, and a confused state. Serious side effects associated with vigabatrin tablets include permanent vision loss and risk of suicidal thoughts or actions.
The drug is approved for the adjunctive treatment of focal seizures in patients aged 10 years and older who have not had an adequate response to other therapies.
The approval was granted to Teva Pharmaceuticals.
An FDA announcement noted that the agency has prioritized the approval of generic versions of drugs to improve access to treatments and to lower drug costs. Vigabatrin had been included on an FDA list of off-patent, off-exclusivity branded drugs without approved generics. The approval of generic vigabatrin “demonstrates that there is an open pathway to approving products like this one,” said FDA Commissioner Scott Gottlieb, MD.
The label for vigabatrin tablets includes a boxed warning for permanent vision loss. The generic vigabatrin tablets are part of a single shared-system Risk Evaluation and Mitigation Strategy (REMS) program with other drug products containing vigabatrin.
The most common side effects associated with vigabatrin tablets include dizziness, fatigue, sleepiness, involuntary eye movement, tremor, blurred vision, memory impairment, weight gain, joint pain, upper respiratory tract infection, aggression, double vision, abnormal coordination, and a confused state. Serious side effects associated with vigabatrin tablets include permanent vision loss and risk of suicidal thoughts or actions.