User login
PTSD and Emotional Eating
Nearly 80% of veterans are overweight or obese. According to researchers from Walter Reed National Military Medical Center in Maryland and Yale School of Medicine in Connecticut, obesity is more common among veterans with posttraumatic stress disorder (PTSD) compared with that in other veterans in the VHA (47% vs 41%). Moreover, they say, veterans with PTSD lose less weight during weight-loss treatment than do those without comorbid mental health conditions. PTSD also has been associated with night eating, food addiction, binge eating, and eating as a coping strategy. In a national survey, veterans who self-reported a diagnosis of PTSD were more likely to endorse eating because of emotions or stress.
The researchers conducted a study of 126 veterans referred to the MOVE! Weight Management Program at VA Connecticut Healthcare System. Although it replicates and extends findings from other studies, they believe theirs is the first study examining emotional eating among veterans seeking obesity treatment.
The veterans were given the Yale Emotional Overeating Questionnaire (YEOQ), which assesses how often the respondent has eaten an unusually large amount of food in response to anxiety, sadness, loneliness, tiredness, anger, happiness, boredom, guilt, and physical pain. The researchers also used the Primary Care PTSD Screen to test for PTSD.
A positive PTSD screen was associated with significantly higher scores on the YEOQ overall as well as higher scores on each individual item. Higher scores on the PTSD screen also were associated with more frequent emotional eating for all emotions.
The researchers note that findings about the predictive validity of emotional eating questionnaires have been mixed. Although emotions may influence eating patterns, other mechanisms could be at work, such as general concern about, or lack of control over, eating.
However, the researchers suggest that veterans with PTSD may need specific attention given to alternative coping strategies when facing difficult emotions as part of weight loss treatment.
Nearly 80% of veterans are overweight or obese. According to researchers from Walter Reed National Military Medical Center in Maryland and Yale School of Medicine in Connecticut, obesity is more common among veterans with posttraumatic stress disorder (PTSD) compared with that in other veterans in the VHA (47% vs 41%). Moreover, they say, veterans with PTSD lose less weight during weight-loss treatment than do those without comorbid mental health conditions. PTSD also has been associated with night eating, food addiction, binge eating, and eating as a coping strategy. In a national survey, veterans who self-reported a diagnosis of PTSD were more likely to endorse eating because of emotions or stress.
The researchers conducted a study of 126 veterans referred to the MOVE! Weight Management Program at VA Connecticut Healthcare System. Although it replicates and extends findings from other studies, they believe theirs is the first study examining emotional eating among veterans seeking obesity treatment.
The veterans were given the Yale Emotional Overeating Questionnaire (YEOQ), which assesses how often the respondent has eaten an unusually large amount of food in response to anxiety, sadness, loneliness, tiredness, anger, happiness, boredom, guilt, and physical pain. The researchers also used the Primary Care PTSD Screen to test for PTSD.
A positive PTSD screen was associated with significantly higher scores on the YEOQ overall as well as higher scores on each individual item. Higher scores on the PTSD screen also were associated with more frequent emotional eating for all emotions.
The researchers note that findings about the predictive validity of emotional eating questionnaires have been mixed. Although emotions may influence eating patterns, other mechanisms could be at work, such as general concern about, or lack of control over, eating.
However, the researchers suggest that veterans with PTSD may need specific attention given to alternative coping strategies when facing difficult emotions as part of weight loss treatment.
Nearly 80% of veterans are overweight or obese. According to researchers from Walter Reed National Military Medical Center in Maryland and Yale School of Medicine in Connecticut, obesity is more common among veterans with posttraumatic stress disorder (PTSD) compared with that in other veterans in the VHA (47% vs 41%). Moreover, they say, veterans with PTSD lose less weight during weight-loss treatment than do those without comorbid mental health conditions. PTSD also has been associated with night eating, food addiction, binge eating, and eating as a coping strategy. In a national survey, veterans who self-reported a diagnosis of PTSD were more likely to endorse eating because of emotions or stress.
The researchers conducted a study of 126 veterans referred to the MOVE! Weight Management Program at VA Connecticut Healthcare System. Although it replicates and extends findings from other studies, they believe theirs is the first study examining emotional eating among veterans seeking obesity treatment.
The veterans were given the Yale Emotional Overeating Questionnaire (YEOQ), which assesses how often the respondent has eaten an unusually large amount of food in response to anxiety, sadness, loneliness, tiredness, anger, happiness, boredom, guilt, and physical pain. The researchers also used the Primary Care PTSD Screen to test for PTSD.
A positive PTSD screen was associated with significantly higher scores on the YEOQ overall as well as higher scores on each individual item. Higher scores on the PTSD screen also were associated with more frequent emotional eating for all emotions.
The researchers note that findings about the predictive validity of emotional eating questionnaires have been mixed. Although emotions may influence eating patterns, other mechanisms could be at work, such as general concern about, or lack of control over, eating.
However, the researchers suggest that veterans with PTSD may need specific attention given to alternative coping strategies when facing difficult emotions as part of weight loss treatment.
Making Veteran Homelessness “Rare and Brief”
All across the nation, community by community, states are doing better at making sure veterans have homes. According to the latest VA tally, 3 states (Connecticut, Delaware, and Virginia) and 66 communities have “effectively ended” veteran homelessness. The latest to join the list is Little Rock, Arkansas.
Since 2010, homelessness has been nearly halved; between years 2017 and 2018, it declined by 5%. The progress is due in large part to Home, Together, a program run by the VA with the Department of Housing and Urban Development, and other federal, state and local partners. Using HUD’s “targeted” housing vouchers and the VA’s homelessness programs (www.va.gov/homeless/for_homeless_veterans.asp), nearly 700,000 veterans and their family members have been permanently housed, rapidly rehoused, or prevented from falling into homelessness.
VA medical centers are key to helping drive down the homeless numbers, the VA says. For instance, the Central Arkansas Veterans Healthcare System collaborates with state and local government, nonprofits, corporate partners, and community members to find homes, jobs, transportation, and services for veterans. The VA health care resources form a “band of care,” the VA says, which provides a holistic support system, including for those experiencing homelessness.
“No American veteran should be without a safe and stable place to call home,” said VA Secretary Robert Wilkie. “We will continue this important work until we achieve a day when homelessness among veterans is rare and brief in every community across our country.”
All across the nation, community by community, states are doing better at making sure veterans have homes. According to the latest VA tally, 3 states (Connecticut, Delaware, and Virginia) and 66 communities have “effectively ended” veteran homelessness. The latest to join the list is Little Rock, Arkansas.
Since 2010, homelessness has been nearly halved; between years 2017 and 2018, it declined by 5%. The progress is due in large part to Home, Together, a program run by the VA with the Department of Housing and Urban Development, and other federal, state and local partners. Using HUD’s “targeted” housing vouchers and the VA’s homelessness programs (www.va.gov/homeless/for_homeless_veterans.asp), nearly 700,000 veterans and their family members have been permanently housed, rapidly rehoused, or prevented from falling into homelessness.
VA medical centers are key to helping drive down the homeless numbers, the VA says. For instance, the Central Arkansas Veterans Healthcare System collaborates with state and local government, nonprofits, corporate partners, and community members to find homes, jobs, transportation, and services for veterans. The VA health care resources form a “band of care,” the VA says, which provides a holistic support system, including for those experiencing homelessness.
“No American veteran should be without a safe and stable place to call home,” said VA Secretary Robert Wilkie. “We will continue this important work until we achieve a day when homelessness among veterans is rare and brief in every community across our country.”
All across the nation, community by community, states are doing better at making sure veterans have homes. According to the latest VA tally, 3 states (Connecticut, Delaware, and Virginia) and 66 communities have “effectively ended” veteran homelessness. The latest to join the list is Little Rock, Arkansas.
Since 2010, homelessness has been nearly halved; between years 2017 and 2018, it declined by 5%. The progress is due in large part to Home, Together, a program run by the VA with the Department of Housing and Urban Development, and other federal, state and local partners. Using HUD’s “targeted” housing vouchers and the VA’s homelessness programs (www.va.gov/homeless/for_homeless_veterans.asp), nearly 700,000 veterans and their family members have been permanently housed, rapidly rehoused, or prevented from falling into homelessness.
VA medical centers are key to helping drive down the homeless numbers, the VA says. For instance, the Central Arkansas Veterans Healthcare System collaborates with state and local government, nonprofits, corporate partners, and community members to find homes, jobs, transportation, and services for veterans. The VA health care resources form a “band of care,” the VA says, which provides a holistic support system, including for those experiencing homelessness.
“No American veteran should be without a safe and stable place to call home,” said VA Secretary Robert Wilkie. “We will continue this important work until we achieve a day when homelessness among veterans is rare and brief in every community across our country.”
No increase in severe community-acquired pneumonia after PCV13
Despite concern about the rise of nonvaccine serotypes following widespread PCV13 immunization, cases of community-acquired pneumonia (CAP) remain nearly as low as after initial implementation of the vaccine and severe cases have not risen at all.

This was the finding of a prospective time-series analysis study from eight French pediatric emergency departments between June 2009 and May 2017.
The 12,587 children with CAP enrolled in the study between June 2009 and May 2017 were all aged 15 years or younger and came from one of eight French pediatric EDs.
Pediatric pneumonia cases per 1,000 ED visits dropped 44% after PCV13 was implemented, a decrease from 6.3 to 3.5 cases of CAP per 1,000 pediatric visits from June 2011 to May 2014, with a slight but statistically significant increase to 3.8 cases of CAP per 1,000 pediatric visits from June 2014 to May 2017. However, there was no statistically significant increase in cases with pleural effusion, hospitalization, or high inflammatory biomarkers.
“These results contrast with the recent increase in frequency of invasive pneumococcal disease observed in several countries during the same period linked to serotype replacement beyond 5 years after PCV13 implementation,” reported Naïm Ouldali, MD, of the Association Clinique et Thérapeutique Infantile du Val-de-Marne in France, and associates. The report is in JAMA Pediatrics.
“This difference in the trends suggests different consequences of serotype replacement on pneumococcal CAP vs invasive pneumococcal disease,” they wrote. “The recent slight increase in the number of all CAP cases and virus involvement may reflect changes in the epidemiology of other pathogens and/or serotype replacement with less pathogenic serotypes.”
This latter point arose from discovering no dominant serotype during the study period. Of the 11 serotypes not covered by PCV13, none appeared in more than four cases.
“The implementation of PCV13 has led to the quasi-disappearance of the more invasive serotypes and increase in others in nasopharyngeal flora, which greatly reduces the frequency of the more severe forms of CAP, but could also play a role in the slight increase in frequency of the more benign forms,” the authors reported.
Among the study’s limitations was lack of a control group, precluding the ability to attribute findings to any changes in case reporting. And “participating physicians were encouraged to not change their practice, including test use, and no other potential interfering intervention.”
Funding sources for this study included the Pediatric Infectious Diseases Group of the French Pediatrics Society, Association Clinique et Thérapeutique Infantile du Val-de-Marne, the Foundation for Medical Research and a Pfizer Investigator Initiated Research grant.
Dr Ouldali has received grants from GlaxoSmithKline, and many of the authors have financial ties and/or have received non-financial support from AstraZeneca, Biocodex, GlaxoSmithKline, Merck, Novartis, Pfizer and/or Sanofi Pasteur.
SOURCE: Ouldali N et al. JAMA Pediatrics. 2019 Feb 4. doi: 10.1001/jamapediatrics.2018.5273.
Despite concern about the rise of nonvaccine serotypes following widespread PCV13 immunization, cases of community-acquired pneumonia (CAP) remain nearly as low as after initial implementation of the vaccine and severe cases have not risen at all.
This was the finding of a prospective time-series analysis study from eight French pediatric emergency departments between June 2009 and May 2017.
The 12,587 children with CAP enrolled in the study between June 2009 and May 2017 were all aged 15 years or younger and came from one of eight French pediatric EDs.
Pediatric pneumonia cases per 1,000 ED visits dropped 44% after PCV13 was implemented, a decrease from 6.3 to 3.5 cases of CAP per 1,000 pediatric visits from June 2011 to May 2014, with a slight but statistically significant increase to 3.8 cases of CAP per 1,000 pediatric visits from June 2014 to May 2017. However, there was no statistically significant increase in cases with pleural effusion, hospitalization, or high inflammatory biomarkers.
“These results contrast with the recent increase in frequency of invasive pneumococcal disease observed in several countries during the same period linked to serotype replacement beyond 5 years after PCV13 implementation,” reported Naïm Ouldali, MD, of the Association Clinique et Thérapeutique Infantile du Val-de-Marne in France, and associates. The report is in JAMA Pediatrics.
“This difference in the trends suggests different consequences of serotype replacement on pneumococcal CAP vs invasive pneumococcal disease,” they wrote. “The recent slight increase in the number of all CAP cases and virus involvement may reflect changes in the epidemiology of other pathogens and/or serotype replacement with less pathogenic serotypes.”
This latter point arose from discovering no dominant serotype during the study period. Of the 11 serotypes not covered by PCV13, none appeared in more than four cases.
“The implementation of PCV13 has led to the quasi-disappearance of the more invasive serotypes and increase in others in nasopharyngeal flora, which greatly reduces the frequency of the more severe forms of CAP, but could also play a role in the slight increase in frequency of the more benign forms,” the authors reported.
Among the study’s limitations was lack of a control group, precluding the ability to attribute findings to any changes in case reporting. And “participating physicians were encouraged to not change their practice, including test use, and no other potential interfering intervention.”
Funding sources for this study included the Pediatric Infectious Diseases Group of the French Pediatrics Society, Association Clinique et Thérapeutique Infantile du Val-de-Marne, the Foundation for Medical Research and a Pfizer Investigator Initiated Research grant.
Dr Ouldali has received grants from GlaxoSmithKline, and many of the authors have financial ties and/or have received non-financial support from AstraZeneca, Biocodex, GlaxoSmithKline, Merck, Novartis, Pfizer and/or Sanofi Pasteur.
SOURCE: Ouldali N et al. JAMA Pediatrics. 2019 Feb 4. doi: 10.1001/jamapediatrics.2018.5273.
Despite concern about the rise of nonvaccine serotypes following widespread PCV13 immunization, cases of community-acquired pneumonia (CAP) remain nearly as low as after initial implementation of the vaccine and severe cases have not risen at all.
This was the finding of a prospective time-series analysis study from eight French pediatric emergency departments between June 2009 and May 2017.
The 12,587 children with CAP enrolled in the study between June 2009 and May 2017 were all aged 15 years or younger and came from one of eight French pediatric EDs.
Pediatric pneumonia cases per 1,000 ED visits dropped 44% after PCV13 was implemented, a decrease from 6.3 to 3.5 cases of CAP per 1,000 pediatric visits from June 2011 to May 2014, with a slight but statistically significant increase to 3.8 cases of CAP per 1,000 pediatric visits from June 2014 to May 2017. However, there was no statistically significant increase in cases with pleural effusion, hospitalization, or high inflammatory biomarkers.
“These results contrast with the recent increase in frequency of invasive pneumococcal disease observed in several countries during the same period linked to serotype replacement beyond 5 years after PCV13 implementation,” reported Naïm Ouldali, MD, of the Association Clinique et Thérapeutique Infantile du Val-de-Marne in France, and associates. The report is in JAMA Pediatrics.
“This difference in the trends suggests different consequences of serotype replacement on pneumococcal CAP vs invasive pneumococcal disease,” they wrote. “The recent slight increase in the number of all CAP cases and virus involvement may reflect changes in the epidemiology of other pathogens and/or serotype replacement with less pathogenic serotypes.”
This latter point arose from discovering no dominant serotype during the study period. Of the 11 serotypes not covered by PCV13, none appeared in more than four cases.
“The implementation of PCV13 has led to the quasi-disappearance of the more invasive serotypes and increase in others in nasopharyngeal flora, which greatly reduces the frequency of the more severe forms of CAP, but could also play a role in the slight increase in frequency of the more benign forms,” the authors reported.
Among the study’s limitations was lack of a control group, precluding the ability to attribute findings to any changes in case reporting. And “participating physicians were encouraged to not change their practice, including test use, and no other potential interfering intervention.”
Funding sources for this study included the Pediatric Infectious Diseases Group of the French Pediatrics Society, Association Clinique et Thérapeutique Infantile du Val-de-Marne, the Foundation for Medical Research and a Pfizer Investigator Initiated Research grant.
Dr Ouldali has received grants from GlaxoSmithKline, and many of the authors have financial ties and/or have received non-financial support from AstraZeneca, Biocodex, GlaxoSmithKline, Merck, Novartis, Pfizer and/or Sanofi Pasteur.
SOURCE: Ouldali N et al. JAMA Pediatrics. 2019 Feb 4. doi: 10.1001/jamapediatrics.2018.5273.
FROM JAMA PEDIATRICS
Key clinical point:
Major finding: Pediatric community-acquired pneumonia cases dropped from 6.3 to 3.5 cases per 1,000 visits from 2010 to 2014 and increased to 3.8 cases per 1,000 visits in May 2017.
Study details: The findings are based on a prospective time series analysis of 12,587 pediatric pneumonia cases (under 15 years old) in eight French emergency departments from June 2009 to May 2017.
Disclosures: Funding sources for this study included the Pediatric Infectious Diseases Group of the French Pediatrics Society, Association Clinique et Thérapeutique Infantile du Val-de-Marne, the Foundation for Medical Research, and a Pfizer Investigator Initiated Research grant. Dr. Ouldali has received grants from GlaxoSmithKline, and many of the authors have financial ties and/or have received nonfinancial support from AstraZeneca, Biocodex, GlaxoSmithKline, Merck, Novartis, Pfizer, and/or Sanofi Pasteur.
Source: Ouldali N et al. JAMA Pediatrics. 2019 Feb 4. doi: 10.1001/jamapediatrics.2018.5273.
Mapping the Pathway of Pain
What makes us pull a hand away from a hot stove or flinch at a pinprick? Researchers from the National Center for Complementary and Integrative Health say they have identified activity in the brain that governs these reactions.
Alexander Chesler, PhD, senior author of the study, says we already know a lot about local spinal cord circuits for simple reflexive responses, but “the mechanisms underlying more complex behaviors remain poorly understood.”
Using heat as the source of discomfort in their experiments, the researchers found a predictable sequence of behaviors—likened to the sequence of responding to walking cautiously on a hot beach, then hopping as the heat intensifies, then running to a water source. “This kind of ‘feed-forward’ circuitry is unique because it is an upward spiral,” says Arnab Barik, PhD, one of the study authors. “The more this pathway is activated by harmful activity, the more it reacts, leading to dramatic behavioral responses.”
The experiments showed that the parts of the brainstem involved in this circuit are the parabrachial nucleus (PBNI) and the dorsal reticular formation in the medulla (MdD). Standing on a hot surface activated a group of nerve cells in the PBNI, triggering escape responses through connections to the MdD. Interestingly, the PBNI cells express a gene that codes for substances that also contribute to multiple disease processes.
“Our data provide evidence that the PBNI produces streams of information with distinct functional significance,” says Arnab Barik, PhD, one of the study authors. “The brainstem-spinal cord pathway identified in this study selectively controls pain response and elicits appropriate behaviors based on sensory input.”
Further investigation, the researchers say, can help us understand how pain is encoded in the brain. The study findings may also offer opportunities to understand how the body becomes dysregulated during chronic pain.
What makes us pull a hand away from a hot stove or flinch at a pinprick? Researchers from the National Center for Complementary and Integrative Health say they have identified activity in the brain that governs these reactions.
Alexander Chesler, PhD, senior author of the study, says we already know a lot about local spinal cord circuits for simple reflexive responses, but “the mechanisms underlying more complex behaviors remain poorly understood.”
Using heat as the source of discomfort in their experiments, the researchers found a predictable sequence of behaviors—likened to the sequence of responding to walking cautiously on a hot beach, then hopping as the heat intensifies, then running to a water source. “This kind of ‘feed-forward’ circuitry is unique because it is an upward spiral,” says Arnab Barik, PhD, one of the study authors. “The more this pathway is activated by harmful activity, the more it reacts, leading to dramatic behavioral responses.”
The experiments showed that the parts of the brainstem involved in this circuit are the parabrachial nucleus (PBNI) and the dorsal reticular formation in the medulla (MdD). Standing on a hot surface activated a group of nerve cells in the PBNI, triggering escape responses through connections to the MdD. Interestingly, the PBNI cells express a gene that codes for substances that also contribute to multiple disease processes.
“Our data provide evidence that the PBNI produces streams of information with distinct functional significance,” says Arnab Barik, PhD, one of the study authors. “The brainstem-spinal cord pathway identified in this study selectively controls pain response and elicits appropriate behaviors based on sensory input.”
Further investigation, the researchers say, can help us understand how pain is encoded in the brain. The study findings may also offer opportunities to understand how the body becomes dysregulated during chronic pain.
What makes us pull a hand away from a hot stove or flinch at a pinprick? Researchers from the National Center for Complementary and Integrative Health say they have identified activity in the brain that governs these reactions.
Alexander Chesler, PhD, senior author of the study, says we already know a lot about local spinal cord circuits for simple reflexive responses, but “the mechanisms underlying more complex behaviors remain poorly understood.”
Using heat as the source of discomfort in their experiments, the researchers found a predictable sequence of behaviors—likened to the sequence of responding to walking cautiously on a hot beach, then hopping as the heat intensifies, then running to a water source. “This kind of ‘feed-forward’ circuitry is unique because it is an upward spiral,” says Arnab Barik, PhD, one of the study authors. “The more this pathway is activated by harmful activity, the more it reacts, leading to dramatic behavioral responses.”
The experiments showed that the parts of the brainstem involved in this circuit are the parabrachial nucleus (PBNI) and the dorsal reticular formation in the medulla (MdD). Standing on a hot surface activated a group of nerve cells in the PBNI, triggering escape responses through connections to the MdD. Interestingly, the PBNI cells express a gene that codes for substances that also contribute to multiple disease processes.
“Our data provide evidence that the PBNI produces streams of information with distinct functional significance,” says Arnab Barik, PhD, one of the study authors. “The brainstem-spinal cord pathway identified in this study selectively controls pain response and elicits appropriate behaviors based on sensory input.”
Further investigation, the researchers say, can help us understand how pain is encoded in the brain. The study findings may also offer opportunities to understand how the body becomes dysregulated during chronic pain.
FDA approves generic Advair Diskus
The Food and Drug Administration has approved a generic version of the Advair Diskus, a complex device-drug combination containing fluticasone propionate and salmeterol inhalation powder.
The generic device will be available in three strengths: fluticasone propionate 100 mcg/ salmeterol 50 mcg, fluticasone propionate 250 mcg/ salmeterol 50 mcg and fluticasone propionate 500 mcg/ salmeterol 50 mcg, according to the FDA announcement. It will be marketed by Mylan as Wixela Inhub and will launch in late February, according to a statement from Mylan.
Advair Diskus is among the most commonly used treatments for asthma and for chronic obstructive pulmonary disease (COPD), so it’s hoped this approval will increase access to the therapy, FDA officials said in a statement.
This approval is part of the FDA’s “longstanding commitment to advance access to lower cost, high quality generic alternatives,” Janet Woodcock, MD, director of the FDA’s Center for Drug Evaluation and Research, said in a statement. “People living with asthma and COPD know too well the critical importance of having access to the treatment they need to feel better. Today’s approval will bring more competition to the market which will ultimately benefit the patients who rely on this drug.”
Wixela Inhub is indicated for twice-daily treatment of asthma in patients aged 4 years and older who are not adequately controlled by long-term asthma control treatments or whose disease warrants treatment with a combination of inhaled corticosteroids and long-acting beta agonists. It also is indicated for maintenance of COPD and reduction of COPD exacerbations.
The Food and Drug Administration has approved a generic version of the Advair Diskus, a complex device-drug combination containing fluticasone propionate and salmeterol inhalation powder.
The generic device will be available in three strengths: fluticasone propionate 100 mcg/ salmeterol 50 mcg, fluticasone propionate 250 mcg/ salmeterol 50 mcg and fluticasone propionate 500 mcg/ salmeterol 50 mcg, according to the FDA announcement. It will be marketed by Mylan as Wixela Inhub and will launch in late February, according to a statement from Mylan.
Advair Diskus is among the most commonly used treatments for asthma and for chronic obstructive pulmonary disease (COPD), so it’s hoped this approval will increase access to the therapy, FDA officials said in a statement.
This approval is part of the FDA’s “longstanding commitment to advance access to lower cost, high quality generic alternatives,” Janet Woodcock, MD, director of the FDA’s Center for Drug Evaluation and Research, said in a statement. “People living with asthma and COPD know too well the critical importance of having access to the treatment they need to feel better. Today’s approval will bring more competition to the market which will ultimately benefit the patients who rely on this drug.”
Wixela Inhub is indicated for twice-daily treatment of asthma in patients aged 4 years and older who are not adequately controlled by long-term asthma control treatments or whose disease warrants treatment with a combination of inhaled corticosteroids and long-acting beta agonists. It also is indicated for maintenance of COPD and reduction of COPD exacerbations.
The Food and Drug Administration has approved a generic version of the Advair Diskus, a complex device-drug combination containing fluticasone propionate and salmeterol inhalation powder.
The generic device will be available in three strengths: fluticasone propionate 100 mcg/ salmeterol 50 mcg, fluticasone propionate 250 mcg/ salmeterol 50 mcg and fluticasone propionate 500 mcg/ salmeterol 50 mcg, according to the FDA announcement. It will be marketed by Mylan as Wixela Inhub and will launch in late February, according to a statement from Mylan.
Advair Diskus is among the most commonly used treatments for asthma and for chronic obstructive pulmonary disease (COPD), so it’s hoped this approval will increase access to the therapy, FDA officials said in a statement.
This approval is part of the FDA’s “longstanding commitment to advance access to lower cost, high quality generic alternatives,” Janet Woodcock, MD, director of the FDA’s Center for Drug Evaluation and Research, said in a statement. “People living with asthma and COPD know too well the critical importance of having access to the treatment they need to feel better. Today’s approval will bring more competition to the market which will ultimately benefit the patients who rely on this drug.”
Wixela Inhub is indicated for twice-daily treatment of asthma in patients aged 4 years and older who are not adequately controlled by long-term asthma control treatments or whose disease warrants treatment with a combination of inhaled corticosteroids and long-acting beta agonists. It also is indicated for maintenance of COPD and reduction of COPD exacerbations.
AHA report highlights CVD burden, declines in smoking, sleep importance
Almost half of U.S. adults now have some form of cardiovascular disease, according to the latest annual statistical update from the American Heart Association.
The prevalence is driven in part by the recently changed definition of hypertension, from 140/90 to 130/80 mm Hg, said authors of the American Heart Association Heart Disease and Stroke Statistics–2019 Update.
Cardiovascular disease (CVD) deaths are up, though smoking rates continue to decline, and adults are getting more exercise (Circulation. 2019;139. doi: 10.1161/CIR.0000000000000659).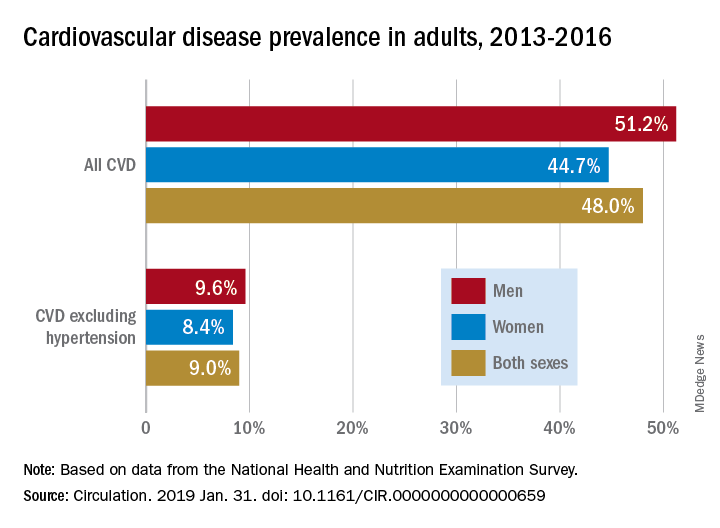
The update includes a new section on sleep and cardiovascular health, an enhanced focus on social determinants of health, and further evidence-based approaches to behavior change, according to the update’s authors, led by chair Emelia J. Benjamin, MD, professor of medicine and epidemiology at Boston University, and vice chair Paul Muntner, PhD, professor of epidemiology at the University of Alabama, Birmingham.
High blood pressure is an “overwhelming presence” that drives heart disease and stroke and can’t be dismissed in the fight against cardiovascular disease, AHA President Ivor J. Benjamin, MD, said in a statement. “Eliminating high blood pressure could have a larger impact on CVD deaths than the elimination of all other risk factors among women, and all except smoking among men.”
Using data from 2013 to 2016, 46% of adults in the United States had hypertension, and in 2016 there were 82,735 deaths attributable primarily to high blood pressure, according to the update.
Total direct costs of hypertension could approach $221 billion by 2035, according to projections in the report.
After decades of decline, U.S. cardiovascular disease deaths increased to 840,678 in 2016, up from 836,546 in 2015, the report says.
Smoking rate declines represent some of the most significant improvements outlined in the report, according to an AHA news release.
Ninety-four percent of adolescents were nonsmokers in the 2015-2016 period, which is up from 76% in 1999-2000, according to the report. The proportion of adult nonsmokers increased to 79% in 2015-2016, up from 73% in 1999-2000.
The new chapter on the importance of sleep cites data from the Centers for Disease Control and Prevention that only 65.2% of Americans have a healthy sleep duration (at least 7 hours), with even lower rates among non-Hispanic blacks, native Hawaiians and Pacific Islanders, and multiracial non-Hispanic individuals.
Short sleep duration is associated with a higher risk of all-cause mortality, total CVD, and coronary heart disease, according to a meta-analysis cited in the report. Long sleep duration, defined as greater than 8 hours, also was associated with higher risk of all-cause mortality, total CVD, coronary heart disease, and stroke.
Members of the statistical update writing group reported disclosures related to the American Heart Association, National Institutes of Health, Amgen, Sanofi, Roche, Abbott, Biogen, Medtronic, and others.
SOURCE: Benjamin EJ et al. Circulation. 2019 Jan 31.
The latest statistics on heart disease and stroke include some metrics that indicate progress, and others that suggest opportunities for improvement.
Tobacco use continues to decline; however, among high school students, e-cigarette use is up to 11.3%, which is concerning.
One bright spot is that the proportion of inactive adults has dropped to 30% in 2016, down from 40% in 2007. Despite that improvement, however, the prevalence of obesity increased significantly over the decade, to the point where nearly 40% of adults are obese and 7.7% are severely obese.

Although 48% of U.S. adults now have cardiovascular disease, according to this latest update, the number drops to just 9% when hypertension is excluded. Even so, 9% represents more than 24.3 million Americans who have coronary artery disease, stroke, or heart failure.
The cost of cardiovascular disease is astronomical, exceeding $351 billion in 2014-1205, with costs projected to increase sharply for older adults over the next few decades.
Starting in 2020, the AHA will begin charting progress in CVD using a metric called health-adjusted life expectancy (HALE), which relies on morbidity and mortality patterns to reflect the number of years a person can expect to live. Patients and the general public may find this metric more understandable than statistics about death rates and cardiovascular risk factors.
Mariell Jessup, MD, is chief science and medical officer for the American Heart Association. Her view on the latest statistical update was derived from a commentary that accompanied the update.
The latest statistics on heart disease and stroke include some metrics that indicate progress, and others that suggest opportunities for improvement.
Tobacco use continues to decline; however, among high school students, e-cigarette use is up to 11.3%, which is concerning.
One bright spot is that the proportion of inactive adults has dropped to 30% in 2016, down from 40% in 2007. Despite that improvement, however, the prevalence of obesity increased significantly over the decade, to the point where nearly 40% of adults are obese and 7.7% are severely obese.
Although 48% of U.S. adults now have cardiovascular disease, according to this latest update, the number drops to just 9% when hypertension is excluded. Even so, 9% represents more than 24.3 million Americans who have coronary artery disease, stroke, or heart failure.
The cost of cardiovascular disease is astronomical, exceeding $351 billion in 2014-1205, with costs projected to increase sharply for older adults over the next few decades.
Starting in 2020, the AHA will begin charting progress in CVD using a metric called health-adjusted life expectancy (HALE), which relies on morbidity and mortality patterns to reflect the number of years a person can expect to live. Patients and the general public may find this metric more understandable than statistics about death rates and cardiovascular risk factors.
Mariell Jessup, MD, is chief science and medical officer for the American Heart Association. Her view on the latest statistical update was derived from a commentary that accompanied the update.
The latest statistics on heart disease and stroke include some metrics that indicate progress, and others that suggest opportunities for improvement.
Tobacco use continues to decline; however, among high school students, e-cigarette use is up to 11.3%, which is concerning.
One bright spot is that the proportion of inactive adults has dropped to 30% in 2016, down from 40% in 2007. Despite that improvement, however, the prevalence of obesity increased significantly over the decade, to the point where nearly 40% of adults are obese and 7.7% are severely obese.
Although 48% of U.S. adults now have cardiovascular disease, according to this latest update, the number drops to just 9% when hypertension is excluded. Even so, 9% represents more than 24.3 million Americans who have coronary artery disease, stroke, or heart failure.
The cost of cardiovascular disease is astronomical, exceeding $351 billion in 2014-1205, with costs projected to increase sharply for older adults over the next few decades.
Starting in 2020, the AHA will begin charting progress in CVD using a metric called health-adjusted life expectancy (HALE), which relies on morbidity and mortality patterns to reflect the number of years a person can expect to live. Patients and the general public may find this metric more understandable than statistics about death rates and cardiovascular risk factors.
Mariell Jessup, MD, is chief science and medical officer for the American Heart Association. Her view on the latest statistical update was derived from a commentary that accompanied the update.
Almost half of U.S. adults now have some form of cardiovascular disease, according to the latest annual statistical update from the American Heart Association.
The prevalence is driven in part by the recently changed definition of hypertension, from 140/90 to 130/80 mm Hg, said authors of the American Heart Association Heart Disease and Stroke Statistics–2019 Update.
Cardiovascular disease (CVD) deaths are up, though smoking rates continue to decline, and adults are getting more exercise (Circulation. 2019;139. doi: 10.1161/CIR.0000000000000659).
The update includes a new section on sleep and cardiovascular health, an enhanced focus on social determinants of health, and further evidence-based approaches to behavior change, according to the update’s authors, led by chair Emelia J. Benjamin, MD, professor of medicine and epidemiology at Boston University, and vice chair Paul Muntner, PhD, professor of epidemiology at the University of Alabama, Birmingham.
High blood pressure is an “overwhelming presence” that drives heart disease and stroke and can’t be dismissed in the fight against cardiovascular disease, AHA President Ivor J. Benjamin, MD, said in a statement. “Eliminating high blood pressure could have a larger impact on CVD deaths than the elimination of all other risk factors among women, and all except smoking among men.”
Using data from 2013 to 2016, 46% of adults in the United States had hypertension, and in 2016 there were 82,735 deaths attributable primarily to high blood pressure, according to the update.
Total direct costs of hypertension could approach $221 billion by 2035, according to projections in the report.
After decades of decline, U.S. cardiovascular disease deaths increased to 840,678 in 2016, up from 836,546 in 2015, the report says.
Smoking rate declines represent some of the most significant improvements outlined in the report, according to an AHA news release.
Ninety-four percent of adolescents were nonsmokers in the 2015-2016 period, which is up from 76% in 1999-2000, according to the report. The proportion of adult nonsmokers increased to 79% in 2015-2016, up from 73% in 1999-2000.
The new chapter on the importance of sleep cites data from the Centers for Disease Control and Prevention that only 65.2% of Americans have a healthy sleep duration (at least 7 hours), with even lower rates among non-Hispanic blacks, native Hawaiians and Pacific Islanders, and multiracial non-Hispanic individuals.
Short sleep duration is associated with a higher risk of all-cause mortality, total CVD, and coronary heart disease, according to a meta-analysis cited in the report. Long sleep duration, defined as greater than 8 hours, also was associated with higher risk of all-cause mortality, total CVD, coronary heart disease, and stroke.
Members of the statistical update writing group reported disclosures related to the American Heart Association, National Institutes of Health, Amgen, Sanofi, Roche, Abbott, Biogen, Medtronic, and others.
SOURCE: Benjamin EJ et al. Circulation. 2019 Jan 31.
Almost half of U.S. adults now have some form of cardiovascular disease, according to the latest annual statistical update from the American Heart Association.
The prevalence is driven in part by the recently changed definition of hypertension, from 140/90 to 130/80 mm Hg, said authors of the American Heart Association Heart Disease and Stroke Statistics–2019 Update.
Cardiovascular disease (CVD) deaths are up, though smoking rates continue to decline, and adults are getting more exercise (Circulation. 2019;139. doi: 10.1161/CIR.0000000000000659).
The update includes a new section on sleep and cardiovascular health, an enhanced focus on social determinants of health, and further evidence-based approaches to behavior change, according to the update’s authors, led by chair Emelia J. Benjamin, MD, professor of medicine and epidemiology at Boston University, and vice chair Paul Muntner, PhD, professor of epidemiology at the University of Alabama, Birmingham.
High blood pressure is an “overwhelming presence” that drives heart disease and stroke and can’t be dismissed in the fight against cardiovascular disease, AHA President Ivor J. Benjamin, MD, said in a statement. “Eliminating high blood pressure could have a larger impact on CVD deaths than the elimination of all other risk factors among women, and all except smoking among men.”
Using data from 2013 to 2016, 46% of adults in the United States had hypertension, and in 2016 there were 82,735 deaths attributable primarily to high blood pressure, according to the update.
Total direct costs of hypertension could approach $221 billion by 2035, according to projections in the report.
After decades of decline, U.S. cardiovascular disease deaths increased to 840,678 in 2016, up from 836,546 in 2015, the report says.
Smoking rate declines represent some of the most significant improvements outlined in the report, according to an AHA news release.
Ninety-four percent of adolescents were nonsmokers in the 2015-2016 period, which is up from 76% in 1999-2000, according to the report. The proportion of adult nonsmokers increased to 79% in 2015-2016, up from 73% in 1999-2000.
The new chapter on the importance of sleep cites data from the Centers for Disease Control and Prevention that only 65.2% of Americans have a healthy sleep duration (at least 7 hours), with even lower rates among non-Hispanic blacks, native Hawaiians and Pacific Islanders, and multiracial non-Hispanic individuals.
Short sleep duration is associated with a higher risk of all-cause mortality, total CVD, and coronary heart disease, according to a meta-analysis cited in the report. Long sleep duration, defined as greater than 8 hours, also was associated with higher risk of all-cause mortality, total CVD, coronary heart disease, and stroke.
Members of the statistical update writing group reported disclosures related to the American Heart Association, National Institutes of Health, Amgen, Sanofi, Roche, Abbott, Biogen, Medtronic, and others.
SOURCE: Benjamin EJ et al. Circulation. 2019 Jan 31.
FROM CIRCULATION
Flu activity ticks up for second week in a row
Influenza activity increased for a second straight week after a 2-week drop and by one measure has topped the high reached in late December, according to the Centers for Disease Control and Prevention.
For the week ending Jan. 26, 2019, there were 16 states at level 10 on the CDC’s 1-10 scale of influenza-like illness (ILI) activity, compared with 12 states during the week ending Dec. 29. With another seven states at levels 8 and 9, that makes 23 in the high range for the week ending Jan. 26, again putting it above the 19 reported for Dec. 29, the CDC’s influenza division reported Feb. 1.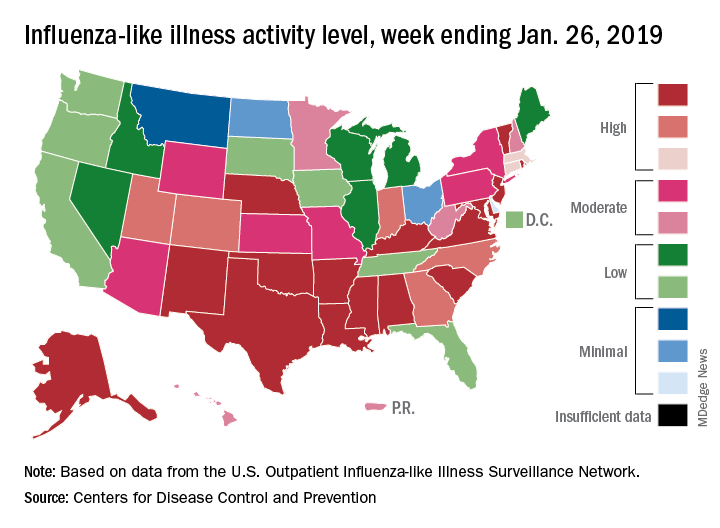
By another measure, however, that December peak in activity remains the seasonal high. The proportion of outpatient visits for ILI that week was 4.0%, compared with the 3.8% reported for Jan. 26. That’s up from 3.3% the week before and 3.1% the week before that, which in turn was the second week of a 2-week decline in activity in early January, CDC data show.
Two flu-related pediatric deaths were reported during the week ending Jan. 26, but both occurred the previous week. For the 2018-2019 flu season so far, a total of 24 pediatric flu deaths have been reported, the CDC said. At the same point in the 2017-2018 flu season, there had been 84 such deaths, according to the CDC’s Influenza-Associated Pediatric Mortality Surveillance System.
There were 143 overall flu-related deaths during the week of Jan. 19, which is the most recent week available. That is down from 189 the week before, but the Jan. 19 reporting is only 75% complete, data from the National Center for Health Statistics show.
Influenza activity increased for a second straight week after a 2-week drop and by one measure has topped the high reached in late December, according to the Centers for Disease Control and Prevention.
For the week ending Jan. 26, 2019, there were 16 states at level 10 on the CDC’s 1-10 scale of influenza-like illness (ILI) activity, compared with 12 states during the week ending Dec. 29. With another seven states at levels 8 and 9, that makes 23 in the high range for the week ending Jan. 26, again putting it above the 19 reported for Dec. 29, the CDC’s influenza division reported Feb. 1.
By another measure, however, that December peak in activity remains the seasonal high. The proportion of outpatient visits for ILI that week was 4.0%, compared with the 3.8% reported for Jan. 26. That’s up from 3.3% the week before and 3.1% the week before that, which in turn was the second week of a 2-week decline in activity in early January, CDC data show.
Two flu-related pediatric deaths were reported during the week ending Jan. 26, but both occurred the previous week. For the 2018-2019 flu season so far, a total of 24 pediatric flu deaths have been reported, the CDC said. At the same point in the 2017-2018 flu season, there had been 84 such deaths, according to the CDC’s Influenza-Associated Pediatric Mortality Surveillance System.
There were 143 overall flu-related deaths during the week of Jan. 19, which is the most recent week available. That is down from 189 the week before, but the Jan. 19 reporting is only 75% complete, data from the National Center for Health Statistics show.
Influenza activity increased for a second straight week after a 2-week drop and by one measure has topped the high reached in late December, according to the Centers for Disease Control and Prevention.
For the week ending Jan. 26, 2019, there were 16 states at level 10 on the CDC’s 1-10 scale of influenza-like illness (ILI) activity, compared with 12 states during the week ending Dec. 29. With another seven states at levels 8 and 9, that makes 23 in the high range for the week ending Jan. 26, again putting it above the 19 reported for Dec. 29, the CDC’s influenza division reported Feb. 1.
By another measure, however, that December peak in activity remains the seasonal high. The proportion of outpatient visits for ILI that week was 4.0%, compared with the 3.8% reported for Jan. 26. That’s up from 3.3% the week before and 3.1% the week before that, which in turn was the second week of a 2-week decline in activity in early January, CDC data show.
Two flu-related pediatric deaths were reported during the week ending Jan. 26, but both occurred the previous week. For the 2018-2019 flu season so far, a total of 24 pediatric flu deaths have been reported, the CDC said. At the same point in the 2017-2018 flu season, there had been 84 such deaths, according to the CDC’s Influenza-Associated Pediatric Mortality Surveillance System.
There were 143 overall flu-related deaths during the week of Jan. 19, which is the most recent week available. That is down from 189 the week before, but the Jan. 19 reporting is only 75% complete, data from the National Center for Health Statistics show.
Lifetime cost of tobacco use tops $1.9 million per smoker
according to the personal financial website WalletHub.
Economic and societal losses related to 37.8 million U.S. tobacco users – including out-of-pocket spending for cigarettes, health care expenses, and lost income – top $300 billion annually, but those costs vary considerably by state, WalletHub said in a recent report.
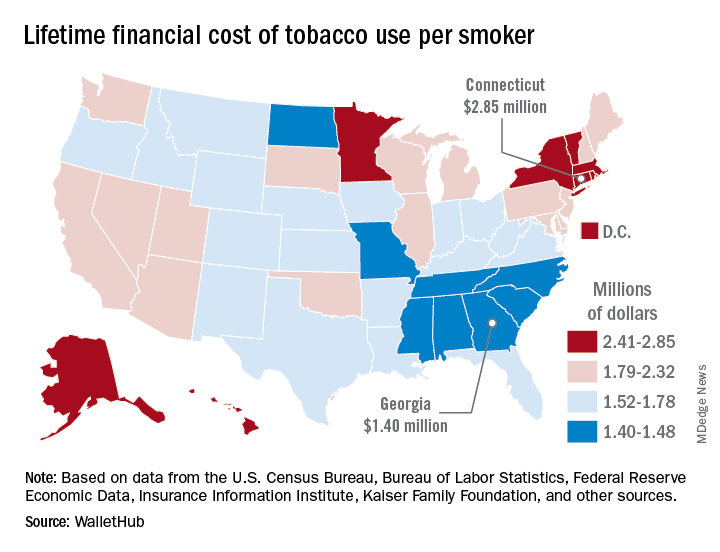
The state with the highest lifetime cost per smoker is Connecticut, with an estimated total of $2.85 million. That works out to just under $56,000 a year for 51 years because lifetime use was defined as one pack a day starting at age 18 years and continuing until age 69 years. New York has the second-highest lifetime cost, which also rounds off to $2.85 million, followed by the District of Columbia ($2.81 million), Massachusetts ($2.76 million), and Rhode Island ($2.68 million), WalletHub said.
Georgia has the lowest lifetime cost of any state – $1.40 million per smoker – followed by Missouri at $1.41 million, North Carolina at $1.42 million, Mississippi at $1.43 million, and South Carolina at $1.44 million, according to the report.
WalletHub’s formula for total lifetime cost has five components: out-of-pocket cost (one pack of cigarettes per day for 51 years), financial opportunity cost (defined as “the amount of return a person would have earned by instead investing that money in the stock market”), health care cost (spending on treatment for smoking-related health complications), income loss (an average 8% decrease caused by absenteeism and lost productivity), and other costs (loss of a homeowner’s insurance credit and costs of secondhand exposure).
The analysis was based on data from the U.S. Census Bureau, Bureau of Labor Statistics, Centers for Disease Control and Prevention, Insurance Information Institute, Campaign for Tobacco-Free Kids, NYsmokefree.com, Federal Reserve Economic Data, Kaiser Family Foundation, and the Independent Insurance Agents & Brokers of America.
according to the personal financial website WalletHub.
Economic and societal losses related to 37.8 million U.S. tobacco users – including out-of-pocket spending for cigarettes, health care expenses, and lost income – top $300 billion annually, but those costs vary considerably by state, WalletHub said in a recent report.
The state with the highest lifetime cost per smoker is Connecticut, with an estimated total of $2.85 million. That works out to just under $56,000 a year for 51 years because lifetime use was defined as one pack a day starting at age 18 years and continuing until age 69 years. New York has the second-highest lifetime cost, which also rounds off to $2.85 million, followed by the District of Columbia ($2.81 million), Massachusetts ($2.76 million), and Rhode Island ($2.68 million), WalletHub said.
Georgia has the lowest lifetime cost of any state – $1.40 million per smoker – followed by Missouri at $1.41 million, North Carolina at $1.42 million, Mississippi at $1.43 million, and South Carolina at $1.44 million, according to the report.
WalletHub’s formula for total lifetime cost has five components: out-of-pocket cost (one pack of cigarettes per day for 51 years), financial opportunity cost (defined as “the amount of return a person would have earned by instead investing that money in the stock market”), health care cost (spending on treatment for smoking-related health complications), income loss (an average 8% decrease caused by absenteeism and lost productivity), and other costs (loss of a homeowner’s insurance credit and costs of secondhand exposure).
The analysis was based on data from the U.S. Census Bureau, Bureau of Labor Statistics, Centers for Disease Control and Prevention, Insurance Information Institute, Campaign for Tobacco-Free Kids, NYsmokefree.com, Federal Reserve Economic Data, Kaiser Family Foundation, and the Independent Insurance Agents & Brokers of America.
according to the personal financial website WalletHub.
Economic and societal losses related to 37.8 million U.S. tobacco users – including out-of-pocket spending for cigarettes, health care expenses, and lost income – top $300 billion annually, but those costs vary considerably by state, WalletHub said in a recent report.
The state with the highest lifetime cost per smoker is Connecticut, with an estimated total of $2.85 million. That works out to just under $56,000 a year for 51 years because lifetime use was defined as one pack a day starting at age 18 years and continuing until age 69 years. New York has the second-highest lifetime cost, which also rounds off to $2.85 million, followed by the District of Columbia ($2.81 million), Massachusetts ($2.76 million), and Rhode Island ($2.68 million), WalletHub said.
Georgia has the lowest lifetime cost of any state – $1.40 million per smoker – followed by Missouri at $1.41 million, North Carolina at $1.42 million, Mississippi at $1.43 million, and South Carolina at $1.44 million, according to the report.
WalletHub’s formula for total lifetime cost has five components: out-of-pocket cost (one pack of cigarettes per day for 51 years), financial opportunity cost (defined as “the amount of return a person would have earned by instead investing that money in the stock market”), health care cost (spending on treatment for smoking-related health complications), income loss (an average 8% decrease caused by absenteeism and lost productivity), and other costs (loss of a homeowner’s insurance credit and costs of secondhand exposure).
The analysis was based on data from the U.S. Census Bureau, Bureau of Labor Statistics, Centers for Disease Control and Prevention, Insurance Information Institute, Campaign for Tobacco-Free Kids, NYsmokefree.com, Federal Reserve Economic Data, Kaiser Family Foundation, and the Independent Insurance Agents & Brokers of America.
Mild OSA spontaneously resolves in about one-third of young children
CORONADO, CALIF. – results from a single-center study showed.

“OSA affects up to 6% of the pediatric population, and diagnosis of young children can be particularly challenging due to the heterogeneity of presenting symptoms,” Douglas C. von Allmen, MD, said at the Triological Society’s Combined Sections Meeting. “While school-age children may present with snoring, that’s less common in the younger population. Up to one-quarter of infants may have noisy breathing, which may mimic obstructive events throughout the first 3 years of life. Additionally, long-term clinical implications of mild sleep apnea in very young children is unclear.”
According to Dr. von Allmen, a fifth-year otolaryngology resident at the University of Cincinnati, management strategies of children with OSA can include a period of observation, particularly when there’s an absence of concerning findings on polysomnography (PSG), such as hypoventilation or significant hypoxia, or when the primary etiology of the OSA is unknown. “Additionally, few studies at this point have attempted to characterize the natural history of mild OSA in pediatric patients under 3 years of age,” he said.
In an effort to assess the effects of observation on the PSG outcomes of children under 3 years with mild OSA, Dr. Von Allmen and his colleagues performed a retrospective review of 26 children who had an overnight PSG with a follow-up PSG performed 3-12 months later. They excluded patients with neuromuscular disease, tracheostomy, or interstitial lung disease. All PSGs were performed at the Cincinnati Children’s Hospital Medical Center between 2012 and 2017 and were scored by a board-certified sleep physician. The researchers defined mild OSA as at least one, but fewer than five, events per hour. The mean age of the 26 patients was 7 months, 65% were male, 92% were white, and their median body mass index was in the 39th percentile. Comorbidities include laryngomalacia (40%), cardiac disease (40%), allergies (34%), asthma (23%), and Down syndrome (11%).
Between baseline and follow-up, the apnea-hypoapnea index (AHI) trended downward from 4.3 to 3.4 events per hour (P = .19), the obstructive AHI decreased significantly from 2.7 to 1.3 events per hour (P = .013), while the central apnea index also trended downward from 1.4 to 1.2 events per hour (P = .60). The oxyhemoglobin nadir and sleep efficiency did not change significantly, but there was a decrease in the arousal index (from 14.7 to 13 events per hour; P = .027) and in the percentage of REM sleep (from 33% to 30%; P = .008).
As for postobservation OSA severity outcomes, eight patients (31%) resolved spontaneously, one patient progressed from mild to moderate OSA, and the rest remained in their mild OSA state. Subanalysis revealed that OSA resolution rate was 36% in patients with laryngomalacia, compared with 27% in those with no laryngomalacia, a difference that did not reach statistical significance (P = .98).
Dr. von Allmen pointed out that the study cohort had comorbidities which may have contributed to the persistence of OSA. He also acknowledged certain limitations of the study, including its retrospective nature, the potential for selection bias, the small sample size, and the fact that it did not include a control sample of normal children. “The presence of laryngomalacia did not affect the resolution rate in our cohort, but we’ll need larger studies to better elucidate the factors that do affect persistent disease and to identify the optimal timing of intervention in children with mild OSA,” he said.
Dr. von Allmen reported having no financial disclosures. The study received a resident research award at the meeting, which was jointly sponsored by the Triological Society and the American College of Surgeons.
SOURCE: von Allmen DC et al. Triological CSM, Abstracts.
CORONADO, CALIF. – results from a single-center study showed.
“OSA affects up to 6% of the pediatric population, and diagnosis of young children can be particularly challenging due to the heterogeneity of presenting symptoms,” Douglas C. von Allmen, MD, said at the Triological Society’s Combined Sections Meeting. “While school-age children may present with snoring, that’s less common in the younger population. Up to one-quarter of infants may have noisy breathing, which may mimic obstructive events throughout the first 3 years of life. Additionally, long-term clinical implications of mild sleep apnea in very young children is unclear.”
According to Dr. von Allmen, a fifth-year otolaryngology resident at the University of Cincinnati, management strategies of children with OSA can include a period of observation, particularly when there’s an absence of concerning findings on polysomnography (PSG), such as hypoventilation or significant hypoxia, or when the primary etiology of the OSA is unknown. “Additionally, few studies at this point have attempted to characterize the natural history of mild OSA in pediatric patients under 3 years of age,” he said.
In an effort to assess the effects of observation on the PSG outcomes of children under 3 years with mild OSA, Dr. Von Allmen and his colleagues performed a retrospective review of 26 children who had an overnight PSG with a follow-up PSG performed 3-12 months later. They excluded patients with neuromuscular disease, tracheostomy, or interstitial lung disease. All PSGs were performed at the Cincinnati Children’s Hospital Medical Center between 2012 and 2017 and were scored by a board-certified sleep physician. The researchers defined mild OSA as at least one, but fewer than five, events per hour. The mean age of the 26 patients was 7 months, 65% were male, 92% were white, and their median body mass index was in the 39th percentile. Comorbidities include laryngomalacia (40%), cardiac disease (40%), allergies (34%), asthma (23%), and Down syndrome (11%).
Between baseline and follow-up, the apnea-hypoapnea index (AHI) trended downward from 4.3 to 3.4 events per hour (P = .19), the obstructive AHI decreased significantly from 2.7 to 1.3 events per hour (P = .013), while the central apnea index also trended downward from 1.4 to 1.2 events per hour (P = .60). The oxyhemoglobin nadir and sleep efficiency did not change significantly, but there was a decrease in the arousal index (from 14.7 to 13 events per hour; P = .027) and in the percentage of REM sleep (from 33% to 30%; P = .008).
As for postobservation OSA severity outcomes, eight patients (31%) resolved spontaneously, one patient progressed from mild to moderate OSA, and the rest remained in their mild OSA state. Subanalysis revealed that OSA resolution rate was 36% in patients with laryngomalacia, compared with 27% in those with no laryngomalacia, a difference that did not reach statistical significance (P = .98).
Dr. von Allmen pointed out that the study cohort had comorbidities which may have contributed to the persistence of OSA. He also acknowledged certain limitations of the study, including its retrospective nature, the potential for selection bias, the small sample size, and the fact that it did not include a control sample of normal children. “The presence of laryngomalacia did not affect the resolution rate in our cohort, but we’ll need larger studies to better elucidate the factors that do affect persistent disease and to identify the optimal timing of intervention in children with mild OSA,” he said.
Dr. von Allmen reported having no financial disclosures. The study received a resident research award at the meeting, which was jointly sponsored by the Triological Society and the American College of Surgeons.
SOURCE: von Allmen DC et al. Triological CSM, Abstracts.
CORONADO, CALIF. – results from a single-center study showed.
“OSA affects up to 6% of the pediatric population, and diagnosis of young children can be particularly challenging due to the heterogeneity of presenting symptoms,” Douglas C. von Allmen, MD, said at the Triological Society’s Combined Sections Meeting. “While school-age children may present with snoring, that’s less common in the younger population. Up to one-quarter of infants may have noisy breathing, which may mimic obstructive events throughout the first 3 years of life. Additionally, long-term clinical implications of mild sleep apnea in very young children is unclear.”
According to Dr. von Allmen, a fifth-year otolaryngology resident at the University of Cincinnati, management strategies of children with OSA can include a period of observation, particularly when there’s an absence of concerning findings on polysomnography (PSG), such as hypoventilation or significant hypoxia, or when the primary etiology of the OSA is unknown. “Additionally, few studies at this point have attempted to characterize the natural history of mild OSA in pediatric patients under 3 years of age,” he said.
In an effort to assess the effects of observation on the PSG outcomes of children under 3 years with mild OSA, Dr. Von Allmen and his colleagues performed a retrospective review of 26 children who had an overnight PSG with a follow-up PSG performed 3-12 months later. They excluded patients with neuromuscular disease, tracheostomy, or interstitial lung disease. All PSGs were performed at the Cincinnati Children’s Hospital Medical Center between 2012 and 2017 and were scored by a board-certified sleep physician. The researchers defined mild OSA as at least one, but fewer than five, events per hour. The mean age of the 26 patients was 7 months, 65% were male, 92% were white, and their median body mass index was in the 39th percentile. Comorbidities include laryngomalacia (40%), cardiac disease (40%), allergies (34%), asthma (23%), and Down syndrome (11%).
Between baseline and follow-up, the apnea-hypoapnea index (AHI) trended downward from 4.3 to 3.4 events per hour (P = .19), the obstructive AHI decreased significantly from 2.7 to 1.3 events per hour (P = .013), while the central apnea index also trended downward from 1.4 to 1.2 events per hour (P = .60). The oxyhemoglobin nadir and sleep efficiency did not change significantly, but there was a decrease in the arousal index (from 14.7 to 13 events per hour; P = .027) and in the percentage of REM sleep (from 33% to 30%; P = .008).
As for postobservation OSA severity outcomes, eight patients (31%) resolved spontaneously, one patient progressed from mild to moderate OSA, and the rest remained in their mild OSA state. Subanalysis revealed that OSA resolution rate was 36% in patients with laryngomalacia, compared with 27% in those with no laryngomalacia, a difference that did not reach statistical significance (P = .98).
Dr. von Allmen pointed out that the study cohort had comorbidities which may have contributed to the persistence of OSA. He also acknowledged certain limitations of the study, including its retrospective nature, the potential for selection bias, the small sample size, and the fact that it did not include a control sample of normal children. “The presence of laryngomalacia did not affect the resolution rate in our cohort, but we’ll need larger studies to better elucidate the factors that do affect persistent disease and to identify the optimal timing of intervention in children with mild OSA,” he said.
Dr. von Allmen reported having no financial disclosures. The study received a resident research award at the meeting, which was jointly sponsored by the Triological Society and the American College of Surgeons.
SOURCE: von Allmen DC et al. Triological CSM, Abstracts.
REPORTING FROM THE TRIOLOGICAL CSM
Key clinical point: Comorbidities may contribute to the persistence of OSA in young children.
Major finding: OSA spontaneously resolved in 31% of patients.
Study details: A retrospective analysis of 26 children under age 3 years.
Disclosures: The researchers reported having no financial disclosures.
Source: Von Allmen et al. Triological CSM, Abstracts.
Science Has Spoken: Undetectable Equals Untransmittable
The consensus is in: Undetectable is Untransmittable (U = U). That is, scientific experts are finally willing to say that the concept of “Undetectable is Untransmittable” for HIV treatment is now “firmly established.” Anthony Fauci, director of the National Institute of Allergy and Infectious Diseases (NIAID), writing in JAMA, says an “overwhelming” body of clinical evidence provides a firm basis for accepting the concept as scientifically sound.
In the JAMA commentary, Fauci and colleagues review the results of clinical trials validating U = U. One landmark study, for instance, showed that no linked HIV transmissions occurred among HIV serodifferent heterosexual couples when the partner living with HIV had a durably suppressed viral load. Subsequent studies confirmed the findings and extended them to male-male couples.
The key, the researchers all agree, is to be absolutely adherent to antiretroviral therapy (ART). Viral suppression measured at 6 months after starting therapy is required for U = U. Stopping ART represents a “significant challenge” to successful implementation of U = U. According to the clinical trials, when ART is stopped, viral rebound usually occurs within 2 to 3 weeks. In 2 studies, stopping ART caused viral rebound to levels that would have been associated with increased risk of HIV transmission.
The NIH experts say this consensus has a variety of implications. It gives incentive to people living with HIV to start and adhere to treatment, removes the sense of fear and guilt they may have about harming others, and reduces the risk of legal penalties arising from putting virus-free partners at risk. And because “prevention as control” is a critical tool, the U = U concept can support worldwide efforts to control—or even eliminate—the pandemic.
Source:
Eisinger RW, Dieffenbach CW, Fauci AS. JAMA. 2019.
doi: 10.1001/jama.2018.21167. [Epub ahead of print.]
The consensus is in: Undetectable is Untransmittable (U = U). That is, scientific experts are finally willing to say that the concept of “Undetectable is Untransmittable” for HIV treatment is now “firmly established.” Anthony Fauci, director of the National Institute of Allergy and Infectious Diseases (NIAID), writing in JAMA, says an “overwhelming” body of clinical evidence provides a firm basis for accepting the concept as scientifically sound.
In the JAMA commentary, Fauci and colleagues review the results of clinical trials validating U = U. One landmark study, for instance, showed that no linked HIV transmissions occurred among HIV serodifferent heterosexual couples when the partner living with HIV had a durably suppressed viral load. Subsequent studies confirmed the findings and extended them to male-male couples.
The key, the researchers all agree, is to be absolutely adherent to antiretroviral therapy (ART). Viral suppression measured at 6 months after starting therapy is required for U = U. Stopping ART represents a “significant challenge” to successful implementation of U = U. According to the clinical trials, when ART is stopped, viral rebound usually occurs within 2 to 3 weeks. In 2 studies, stopping ART caused viral rebound to levels that would have been associated with increased risk of HIV transmission.
The NIH experts say this consensus has a variety of implications. It gives incentive to people living with HIV to start and adhere to treatment, removes the sense of fear and guilt they may have about harming others, and reduces the risk of legal penalties arising from putting virus-free partners at risk. And because “prevention as control” is a critical tool, the U = U concept can support worldwide efforts to control—or even eliminate—the pandemic.
Source:
Eisinger RW, Dieffenbach CW, Fauci AS. JAMA. 2019.
doi: 10.1001/jama.2018.21167. [Epub ahead of print.]
The consensus is in: Undetectable is Untransmittable (U = U). That is, scientific experts are finally willing to say that the concept of “Undetectable is Untransmittable” for HIV treatment is now “firmly established.” Anthony Fauci, director of the National Institute of Allergy and Infectious Diseases (NIAID), writing in JAMA, says an “overwhelming” body of clinical evidence provides a firm basis for accepting the concept as scientifically sound.
In the JAMA commentary, Fauci and colleagues review the results of clinical trials validating U = U. One landmark study, for instance, showed that no linked HIV transmissions occurred among HIV serodifferent heterosexual couples when the partner living with HIV had a durably suppressed viral load. Subsequent studies confirmed the findings and extended them to male-male couples.
The key, the researchers all agree, is to be absolutely adherent to antiretroviral therapy (ART). Viral suppression measured at 6 months after starting therapy is required for U = U. Stopping ART represents a “significant challenge” to successful implementation of U = U. According to the clinical trials, when ART is stopped, viral rebound usually occurs within 2 to 3 weeks. In 2 studies, stopping ART caused viral rebound to levels that would have been associated with increased risk of HIV transmission.
The NIH experts say this consensus has a variety of implications. It gives incentive to people living with HIV to start and adhere to treatment, removes the sense of fear and guilt they may have about harming others, and reduces the risk of legal penalties arising from putting virus-free partners at risk. And because “prevention as control” is a critical tool, the U = U concept can support worldwide efforts to control—or even eliminate—the pandemic.
Source:
Eisinger RW, Dieffenbach CW, Fauci AS. JAMA. 2019.
doi: 10.1001/jama.2018.21167. [Epub ahead of print.]