User login
Suicide rate highest in rural areas
The suicide rate in the United States rose over 19% from 2001 to 2015, with an increasing gap separating rural areas from those with large urban populations, according to the Centers for Disease Control and Prevention.
Suicide rates in nonmetropolitan/rural counties for those aged 10 years and older have been consistently higher, and increased more, than those in large metropolitan counties, the CDC said.
The trends for the two lower urbanization levels had similar patterns: increases from 2001 onward became significant accelerations in 2007 (nonmetro/rural) and 2008 (medium/small metro). Large metro counties, however, took a different path that involved significant decreases from 2001 to 2005, significant increases from 2005 to 2010, and then smaller increases after 2010 that were not significant, based on data from the National Vital Statistics System’s mortality data files.
The analysis of the 544,115 suicides committed during 2001-2015 used 3-year averages “to reduce the variability of a small number of observations in a particular period,” the investigators noted.
FROM MMWR SURVEILLANCE SUMMARIES
Reconstruction becoming more common after mastectomy
The rate of breast reconstruction surgery for mastectomy increased 62% from 2009 to 2014, while the mastectomy rate itself “remained relatively stable,” according to the Agency for Healthcare Research and Quality.
The rate of breast reconstructions in hospitals and ambulatory surgery settings rose steadily over the 6-year period, going from 21.7 per 100,000 women in 2009 to 35.1 per 100,000 in 2014. Meanwhile, the mastectomy rate dipped from 90.1 in 2009 to 83.2 in 2010 but varied less than 10% over the 2009-2014 time period, reaching 88.4 per 100,000 women in 2014. To put those numbers in a different context, the ratio of reconstructions to mastectomies went from 24-to-100 in 2009 to 40-to-100 in 2014, the AHRQ reported in a Statistical Brief.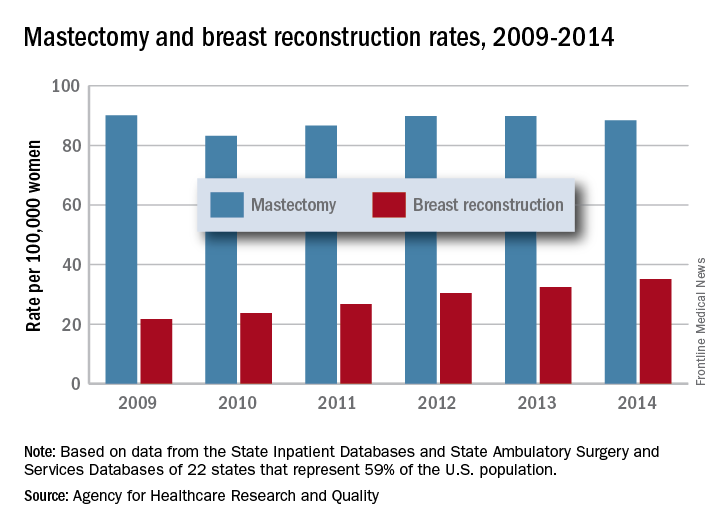
Those nonsimultaneous procedures were taking place much more often in ambulatory settings by 2014, as the rate of reconstructions at a separate visit increased 152% from 7.4 per 100,000 women in 2009 to 18.2. Simultaneous reconstructions in ambulatory settings were less common but increased at an even greater rate of 155%, going from 1.1 to 2.8 per 100,000 women. Inpatient reconstruction had little or no growth over the 6 years: Separate-visit procedures went from 6 to 6.8 and simultaneous reconstructions actually dropped from 7.4 per 100,000 women to 7.3, they reported.
The analysis was based on data from AHRQ State Inpatient Databases and State Ambulatory Surgery and Services Databases for 22 states that include 59% of the U.S. population: California, Colorado, Connecticut, Florida, Georgia, Iowa, Indiana, Maryland, Michigan, Minnesota, Missouri, Nebraska, New Jersey, New York, North Carolina, Ohio, South Carolina, South Dakota, Tennessee, Utah, Vermont, and Wisconsin.
Nearly 80% of health care personnel stepped up for flu shots
Nearly four out of five health care personnel in the United States received a flu vaccination during the 2016-2017 flu season, but a majority of those working in long-term care settings were not vaccinated, based on data from an Internet survey of more than 2,000 individuals that was conducted by the Centers for Disease Control and Prevention.
A total of 78.6% of the survey’s respondents said they’d been vaccinated during the 2016-2017 season. Vaccination coverage for health care personnel overall has remained in the 77%-79% range in recent years, but that represents an increase from 64% in 2010-2011.
“As in previous seasons, the highest coverage was among HCP whose workplace had vaccination requirements,” noted Carla L. Black, PhD, of the CDC, and colleagues (MMWR Morb Mortal Wkly Rep. 2017 Sep 29;66[38]:1009-15). The researchers reviewed data collected from an Internet panel survey of 2,438 health care personnel between March 28, 2017, and April 19, 2017.
Physicians boasted the highest vaccination coverage in 2016-2017 (96%), followed by pharmacists (94%), nurses (93%), nurse practitioners and physician assistants (92%), other clinical providers (80%), nonclinical health care providers (74%), and aides and assistants (69%).
Flu vaccination rates were highest among HCPs working in a hospital setting (92%); 94% of survey respondents in hospitals reported either having a vaccination requirement at work or being provided at least 1 day of on-site vaccination.
Vaccination rates were lowest among health care personnel in long-term care settings (68%), where only 26% reported a workplace vaccination requirement. However, vaccination rates in long-term care rose to 90% when employers required vaccination.
The report’s findings were limited by several factors, including the use of a volunteer sample, the reliance on self-reports, and the potential differences between Internet survey results and population-based estimates of flu vaccination.
However, “in the absence of vaccination requirements, the findings in this study support the recommendations found in the Guide to Community Preventive Services, which include active promotion of on-site vaccination at no cost or low cost to increase influenza vaccination coverage among HCPs,” the researchers said.
The researchers had no financial conflicts to disclose.
FROM MMWR
Key clinical point:
Major finding: Overall flu vaccination coverage among U.S. health care personnel was 78.6% in the 2016-2017 season
Data source: The data come from an Internet survey of 2,438 health care personnel.
Disclosures: The researchers had no financial conflicts to disclose.
Payment gaps seen for child visits
, according to the Agency for Healthcare Research and Quality.
Child visits covered by private insurance brought in a mean $214 for office-based physicians of all specialties in 2015, which was $88 more than the $126 they received for Medicaid-covered visits, the AHRQ said.
That gap has been consistent since 2010, even as payments rose from 2010 to 2013 and fell in 2014 and 2015. The payment gap was even larger in 2015 when looking at the most expensive 10% of child visits: $406 for those that were privately insured and $215 for those covered by Medicaid, the AHRQ reported in a recent Statistical Brief.
Variations in payments also were seen between geographic regions and among the different physician specialties. Mean payments to physicians in the Midwest were highest for both private insurance ($249) and Medicaid ($152), while the lowest payments – $192 from private insurance and $120 from Medicaid – went to physicians in the South. The South also had the smallest gap between private and Medicaid coverage at $72, and the West had the largest gap at an even $100, but none of the variation across regions was significant, the AHRQ said.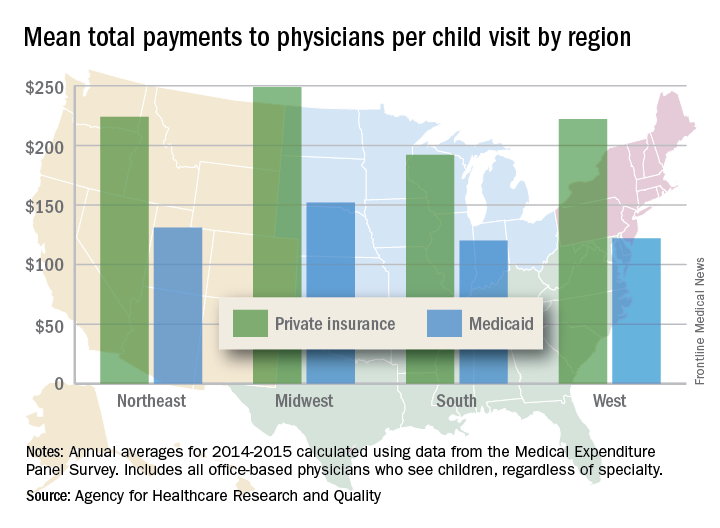
There were statistically significant gaps between private and Medicaid payments by specialty, although only for visits to orthopedists ($423 private – $162 Medicaid = $261) and primary care physicians such as family physicians and internists ($174 private – $122 Medicaid = $52). Payments to pediatricians were $190 private/$115 Medicaid, and the psychiatrists’ $111 mean payment from Medicaid represented the lowest for any specialty, data from Medical Expenditure Panel Survey’s household component show.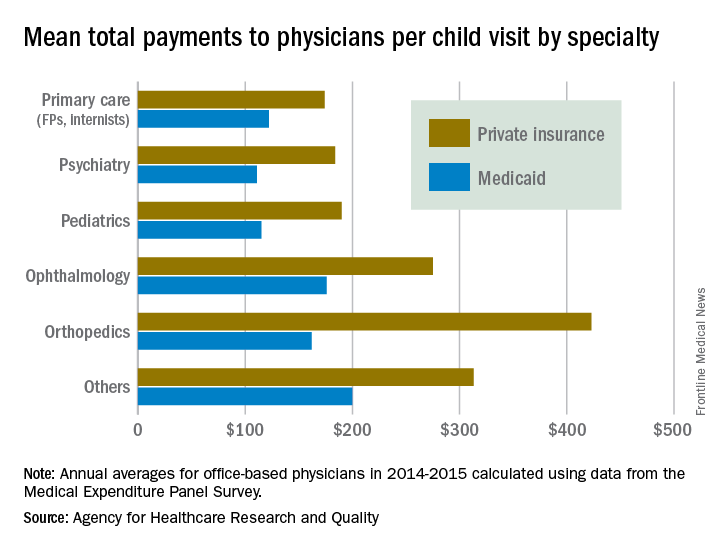
FDA approves implantable device for central sleep apnea
The U.S. Food and Drug Administration on Oct. 6 approved an implantable device for the treatment of moderate to severe central sleep apnea.
The remedē System consists of a battery pack and small, thin wires placed under the skin in the upper chest area. The wires are inserted into the blood vessels in the chest to stimulate the phrenic nerve. The system monitors respiratory signals and, when it stimulates the nerve, the diaphragm moves to restore normal breathing.![]()
The agency’s approval comes on the basis of study results showing that the system reduced the apnea–hypopnea index scores by 50% or more in 51% of patients studied. Control patients in the study saw an 11% reduction in their score.
Adverse events reported in the study included concomitant device interaction, implant site infection, and swelling and local tissue damage or pocket erosion. The remedē System is contraindicated for patients with active infection or who are known to require an MRI.
To boost HCV testing in baby boomers, offer the option
Rates of hepatitis C testing increased among New York adults born between 1945 and 1965 after the state passed a law mandating that health care providers offer HCV testing to people of that age, according to a report from the Centers for Disease Control and Prevention.
In 2013, the year before the new law became effective on Jan. 1, 2014, the total of specimens collected for HCV testing from the 106 clinics that reported data for both 2013 and 2014 was 538,229. In the following year after the law became effective, 813,492 samples were collected from the same clinics, an increase of 51.1% over 2013. The rate of increase for New York Medicaid recipients was similar at 52%.![]()
“This report highlights the potential for state laws to promote HCV testing and the utility of HCV surveillance and Medicaid claims data to monitor the quality of HCV testing and linkage to care for HCV-infected persons,” the CDC investigators concluded.
Find the full report in the MMWR (doi: 10.15585/mmwr.mm6638a3).
FROM THE MMWR
FDA approves higher dose brigatinib tablet for advanced ALK+ NSCLC
The Food and Drug Administration has approved 180 mg brigatinib (Alunbrig) tablets for treatment of anaplastic lymphoma kinase–positive (ALK+) metastatic non–small cell lung cancer (NSCLC), expanding on previously available 30-mg tablets.*

“With the approval of a 180-mg tablet, Alunbrig has become the only ALK inhibitor available as a one tablet per day dose that can be taken with or without food,” Ryan Cohlhepp, PharmD, vice president, U.S. Commercial, at Takeda Oncology said in a press release.
Approval of the regimen was based on objective response in the ongoing, two-arm, open-label, multicenter phase 2 ALTA trial, which enrolled 222 patients with metastatic or locally advanced ALK+ NSCLC who had progressed on crizotinib. Patients were randomized to brigatinib orally either 90 mg once daily or 180 mg once daily following a 7-day lead-in at 90 mg once daily. Of those in the 180-mg arm, 53% had an objective response, compared with 48% in the 90-mg arm.
Adverse reactions occurred in 40% of the patients in the 180-mg arm, compared with 38% in the 90-mg arm. The most common serious adverse reactions were pneumonia and interstitial lung disease/pneumonitis. Fatal adverse reactions occurred in 3.7% of the patients, caused by pneumonia (two patients), sudden death, dyspnea, respiratory failure, pulmonary embolism, bacterial meningitis and urosepsis (one patient each).
The ALTA trial is ongoing, and updated results will be presented at the World Conference on Lung Cancer in Yokohama, Japan, on Oct. 15-18, the company said in the press release.
*Correction, 10/4/17: An earlier version of this article misstated the previously available tablet sizes.
The Food and Drug Administration has approved 180 mg brigatinib (Alunbrig) tablets for treatment of anaplastic lymphoma kinase–positive (ALK+) metastatic non–small cell lung cancer (NSCLC), expanding on previously available 30-mg tablets.*
“With the approval of a 180-mg tablet, Alunbrig has become the only ALK inhibitor available as a one tablet per day dose that can be taken with or without food,” Ryan Cohlhepp, PharmD, vice president, U.S. Commercial, at Takeda Oncology said in a press release.
Approval of the regimen was based on objective response in the ongoing, two-arm, open-label, multicenter phase 2 ALTA trial, which enrolled 222 patients with metastatic or locally advanced ALK+ NSCLC who had progressed on crizotinib. Patients were randomized to brigatinib orally either 90 mg once daily or 180 mg once daily following a 7-day lead-in at 90 mg once daily. Of those in the 180-mg arm, 53% had an objective response, compared with 48% in the 90-mg arm.
Adverse reactions occurred in 40% of the patients in the 180-mg arm, compared with 38% in the 90-mg arm. The most common serious adverse reactions were pneumonia and interstitial lung disease/pneumonitis. Fatal adverse reactions occurred in 3.7% of the patients, caused by pneumonia (two patients), sudden death, dyspnea, respiratory failure, pulmonary embolism, bacterial meningitis and urosepsis (one patient each).
The ALTA trial is ongoing, and updated results will be presented at the World Conference on Lung Cancer in Yokohama, Japan, on Oct. 15-18, the company said in the press release.
*Correction, 10/4/17: An earlier version of this article misstated the previously available tablet sizes.
Just over half of pregnant women got flu vaccine in 2016-2017
Influenza vaccination among pregnant women during the 2016-2017 flu season was slightly higher than during the 2015-2016 season, according to the Centers for Disease Control and Prevention.
Overall coverage for 2016-2017 was 53.6% among pregnant women, compared with 49.9% in 2015-2016, continuing the overall rise seen over the last several flu seasons. Among pregnant women who received a recommendation from a health care provider and were offered vaccination, coverage was 70.5% in 2016-2017, while coverage was 43.7% among women who received a recommendation but no offer and 14.8% among those who did not receive a recommendation, the CDC reported (MMWR. 2017 Sep 29;66[38]:1016-22).
Among other subgroups, coverage by age for the 2016-2017 flu season was 41.7% for those aged 18-24 years, 58.4% for those aged 25-34 years, and 58.5% for those 35-49 years old. There also was considerable variation by race/ethnicity, with coverage at 61.2% for Hispanics, 55.4% for whites, 42.3% for blacks, and 51.7% for others. Coverage for the subgroups corresponded with the rates at which vaccination was recommended: Younger women were less likely than older women to receive a recommendation, and Hispanic and white women more likely to receive recommendations than did blacks and other races/ethnicities, the CDC said.
The 2017 data include 1,893 responses to an Internet panel survey conducted from March 28 to April 7, 2017. The analysis of the 2016 panel survey, which was conducted from March 29 to April 7, 2016, included responses from 1,692 women.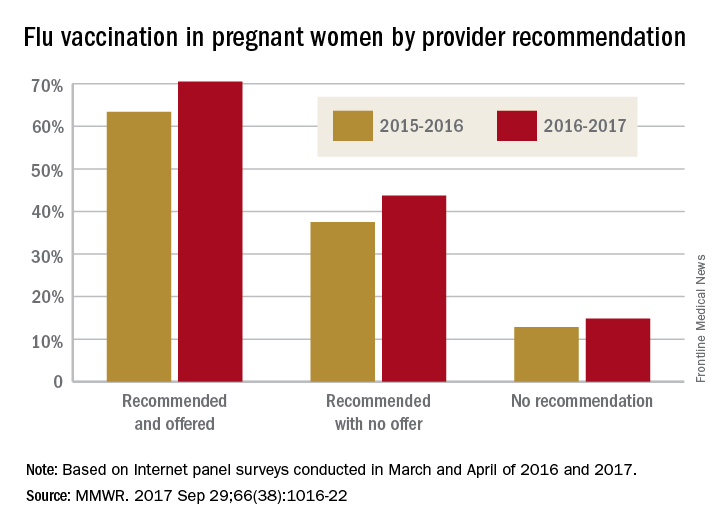
FROM MMWR
FDA warns of endoleaks associated with endovascular grafts for AAA
The Food and Drug Administration has reported an apparent increase in device-related adverse events from the use of endovascular graft repair (EVAR) to treat abdominal aortic aneurysms (AAA).
In a Letter to Health Care Providers issued on Sept. 28, the FDA indicated that “recent information from several sources, including FDA’s Medical Device Reporting system and Annual Clinical Updates to Physicians by the manufacturers, suggests an increase in the occurrence of Type III endoleaks.”
![]()
A Type III endoleak is defined by the failure to completely exclude the AAA from blood flow, thereby allowing a systematic arterial pressurization of the aneurysm sac, increasing the risk of rupture, which is a life-threatening event.
The FDA stated that predictors of Type III endoleaks included treatment with early-generation graft materials, the presence of calcified plaque, and inadequate overlap between graft components.
Secondary interventions to treat Type III endoleaks carry their own risk of adverse events.
It is recommended that health care providers should do the following:
- Consider lifelong surveillance of patients who have been treated with EVAR.
- Consider type III endoleaks in the differential diagnosis of patients who present with symptoms of potential aneurysm expansion or rupture.
- Discuss all treatment options in depth with patients before deciding on the best treatment for Type III endoleaks.
- Report any early or late device-related adverse events, including Type IIIa and Type IIIb endoleaks, associated with EVAR, as well as any device-related adverse events that occur as the result of a secondary intervention to treat Type III endoleaks.
These events should be reported to MedWatch, using the FDA’s Safety Information and Adverse Event Reporting Program Online Voluntary Reporting Form. A form also can be requested by calling 800-332-1088.
The FDA stated that it “continues to work with all manufacturers of endovascular graft systems to better understand this issue,” and that the agency would keep the public informed when significant new information becomes available.
Key clinical point:
Major finding: FDA monitoring sources have detected an apparent increase in the occurrence of Type III endoleaks following EVAR.
Data source: FDA’s Medical Device Reporting System and the Annual Clinical Updates to Physicians by the manufacturers.
Disclosures: None.
FDA approves first duodenoscope with disposable distal cap
, according to an FDA press release.
A disposable distal cap will improve the ability to clean and reprocess the duodenoscope. Without being thoroughly cleaned and disinfected, contaminated tissue can remain and potentially can be transmitted to other patients.![]()
A previous version of the Pentax duodenoscope, the ED-3490TK, was subject to a January 2017 FDA Safety Alert, because of the potential for cracks and gaps to develop in the adhesive sealing the duodenoscope’s distal cap.
“Since the issue of duodenoscope-associated transmission of infections first received widespread attention in 2015, the AGA Center for GI Innovation and Technology has been working closely with regulators and endoscope manufacturers to identify and address problems in scope design and develop a path forward to ensure zero device-associated infections,” said V. Raman Muthusamy, MD, AGAF, FACG, FASGE, chair, AGA Center for GI Innovation and Technology. “We applaud Pentax for answering our call for innovation to improve patient safety for this common and life-saving GI procedure. We encourage all device manufacturers to continue on a path of innovation to better support gastroenterologists and, most importantly, the patients we serve.”