User login
Report: Hospitals Show Improvement on Infection Rates, but Progress Slows on CAUTIs
U.S. hospitals in 2011 showed improvements in their rates of central line-associated bloodstream infections (CLABSI) and in some surgical-site infections, compared with 2010, but the rate essentially hit a plateau for catheter-associated urinary tract infections (CAUTI), according to a new CDC report.
“Reductions in some of the deadliest healthcare-associated infections are encouraging, especially when you consider the costs to both patients and the health care system,” CDC director Thomas R. Frieden, MD, MPH, says. “However, the slower progress in reducing catheter-associated urinary tract infections is a call to action for hospitals to redouble their efforts to track these infections and implement control strategies we know that work.”
The report showed a 41% reduction in 2011 central-line infections compared with 2008, the baseline year for the report. In 2010, the reduction was 32% over the 2008 baseline. The improvement was seen across ICUs, general wards, and neonatal ICUs.

—Scott Flanders, MD, SFHM, professor of medicine, director of hospital medicine, University of Michigan Health System, Ann Arbor, former SHM president
The CDC also reported a 17% drop in surgical-site infections since 2008, better than the 7% reduction in 2010. The biggest reductions were seen in coronary artery bypass graft surgery and cardiac surgery; little improvement was seen in infections from hip arthroplasty and vaginal hysterectomy procedures.
The rate of infections from CAUTIs was 7%, nearly the same as the 6% rate in 2010 data. The infection rate in ICUs actually went up—a 1% drop in 2011 compared with a 3% drop from baseline in 2010.
SHM is a partner in two initiatives that aim to reduce CAUTI infections: the University HealthSystems Consortium’s Partnership for Patients project and On the CUSP: STOP CAUTI, an American Hospital Association HRET effort that’s funded by the Agency for Healthcare Research and Quality-funded project.
Gregory Maynard, MD, SFHM, director of hospital medicine at the University of San Diego Medical Center and senior vice president of SHM’s Center for Healthcare Improvement and Innovation is encouraged by the CLABSI and SSI figures. The report highlights the need for more effort on CAUTI.
“I think all the tools and information are available for improvement teams,” he says. “The CDC, the HRET On the CUSP group, and others all have great toolkits.”
He also says it was telling that the CAUTI numbers were worse in the ICU than in general wards.
“The more complex the environment, the easier it is for those things to get lost,” he says. “It just will probably take more attention to it and making it more of a priority.
“The more complex the environment, the easier it is for those things to get lost. It just will probably take more attention to it and making it more of a priority…. We’re supposed to reduce these adverse events by a very significant amount and obviously we’re not getting there based on this report. We have to do a better job. Reducing CAUTI by 40% is one of goals for the $500 million Partnerships for Patients effort. With that much money involved, it should increase the pressure to get this done.”
Click here to hear more of Dr. Maynard's interview with The Hospitalist
Scott Flanders, MD, SFHM, a former SHM president and SHM’s physician leader for STOP CAUTI, says the report shows that CAUTIs may be more difficult to prevent. In part, that is because catheters are used more broadly throughout a hospital than, say, central lines, which are most common in ICUs.
It takes a multi-disciplinary team implementing a variety of tools: critieria for putting catheters in, managing them appropriately once they are in, and developing protocols for removing them as quickly as possible, he adds.
“Having all those elements in place are critical to preventing CAUTI and I think many hospitals around the country have not implemented all of those strategies to reduce CAUTI,” says Dr. Flanders, professor of medicine and director of hospital medicine at the University of Michigan Health System in Ann Arbor. “No single strategy used in isolation is going to be effective.”
Efforts to reduce CAUTIs have been launched more recently than efforts to reduce other infection types, he says.
“There’s been less of a drive for CAUTI,” he says. “It’s a tougher problem to tackle than some of these other issues, which is a contributing factor in the lower rate of improvement.” TH
Tom Collins is a freelance writer in South Florida.
U.S. hospitals in 2011 showed improvements in their rates of central line-associated bloodstream infections (CLABSI) and in some surgical-site infections, compared with 2010, but the rate essentially hit a plateau for catheter-associated urinary tract infections (CAUTI), according to a new CDC report.
“Reductions in some of the deadliest healthcare-associated infections are encouraging, especially when you consider the costs to both patients and the health care system,” CDC director Thomas R. Frieden, MD, MPH, says. “However, the slower progress in reducing catheter-associated urinary tract infections is a call to action for hospitals to redouble their efforts to track these infections and implement control strategies we know that work.”
The report showed a 41% reduction in 2011 central-line infections compared with 2008, the baseline year for the report. In 2010, the reduction was 32% over the 2008 baseline. The improvement was seen across ICUs, general wards, and neonatal ICUs.
—Scott Flanders, MD, SFHM, professor of medicine, director of hospital medicine, University of Michigan Health System, Ann Arbor, former SHM president
The CDC also reported a 17% drop in surgical-site infections since 2008, better than the 7% reduction in 2010. The biggest reductions were seen in coronary artery bypass graft surgery and cardiac surgery; little improvement was seen in infections from hip arthroplasty and vaginal hysterectomy procedures.
The rate of infections from CAUTIs was 7%, nearly the same as the 6% rate in 2010 data. The infection rate in ICUs actually went up—a 1% drop in 2011 compared with a 3% drop from baseline in 2010.
SHM is a partner in two initiatives that aim to reduce CAUTI infections: the University HealthSystems Consortium’s Partnership for Patients project and On the CUSP: STOP CAUTI, an American Hospital Association HRET effort that’s funded by the Agency for Healthcare Research and Quality-funded project.
Gregory Maynard, MD, SFHM, director of hospital medicine at the University of San Diego Medical Center and senior vice president of SHM’s Center for Healthcare Improvement and Innovation is encouraged by the CLABSI and SSI figures. The report highlights the need for more effort on CAUTI.
“I think all the tools and information are available for improvement teams,” he says. “The CDC, the HRET On the CUSP group, and others all have great toolkits.”
He also says it was telling that the CAUTI numbers were worse in the ICU than in general wards.
“The more complex the environment, the easier it is for those things to get lost,” he says. “It just will probably take more attention to it and making it more of a priority.
“The more complex the environment, the easier it is for those things to get lost. It just will probably take more attention to it and making it more of a priority…. We’re supposed to reduce these adverse events by a very significant amount and obviously we’re not getting there based on this report. We have to do a better job. Reducing CAUTI by 40% is one of goals for the $500 million Partnerships for Patients effort. With that much money involved, it should increase the pressure to get this done.”
Click here to hear more of Dr. Maynard's interview with The Hospitalist
Scott Flanders, MD, SFHM, a former SHM president and SHM’s physician leader for STOP CAUTI, says the report shows that CAUTIs may be more difficult to prevent. In part, that is because catheters are used more broadly throughout a hospital than, say, central lines, which are most common in ICUs.
It takes a multi-disciplinary team implementing a variety of tools: critieria for putting catheters in, managing them appropriately once they are in, and developing protocols for removing them as quickly as possible, he adds.
“Having all those elements in place are critical to preventing CAUTI and I think many hospitals around the country have not implemented all of those strategies to reduce CAUTI,” says Dr. Flanders, professor of medicine and director of hospital medicine at the University of Michigan Health System in Ann Arbor. “No single strategy used in isolation is going to be effective.”
Efforts to reduce CAUTIs have been launched more recently than efforts to reduce other infection types, he says.
“There’s been less of a drive for CAUTI,” he says. “It’s a tougher problem to tackle than some of these other issues, which is a contributing factor in the lower rate of improvement.” TH
Tom Collins is a freelance writer in South Florida.
U.S. hospitals in 2011 showed improvements in their rates of central line-associated bloodstream infections (CLABSI) and in some surgical-site infections, compared with 2010, but the rate essentially hit a plateau for catheter-associated urinary tract infections (CAUTI), according to a new CDC report.
“Reductions in some of the deadliest healthcare-associated infections are encouraging, especially when you consider the costs to both patients and the health care system,” CDC director Thomas R. Frieden, MD, MPH, says. “However, the slower progress in reducing catheter-associated urinary tract infections is a call to action for hospitals to redouble their efforts to track these infections and implement control strategies we know that work.”
The report showed a 41% reduction in 2011 central-line infections compared with 2008, the baseline year for the report. In 2010, the reduction was 32% over the 2008 baseline. The improvement was seen across ICUs, general wards, and neonatal ICUs.
—Scott Flanders, MD, SFHM, professor of medicine, director of hospital medicine, University of Michigan Health System, Ann Arbor, former SHM president
The CDC also reported a 17% drop in surgical-site infections since 2008, better than the 7% reduction in 2010. The biggest reductions were seen in coronary artery bypass graft surgery and cardiac surgery; little improvement was seen in infections from hip arthroplasty and vaginal hysterectomy procedures.
The rate of infections from CAUTIs was 7%, nearly the same as the 6% rate in 2010 data. The infection rate in ICUs actually went up—a 1% drop in 2011 compared with a 3% drop from baseline in 2010.
SHM is a partner in two initiatives that aim to reduce CAUTI infections: the University HealthSystems Consortium’s Partnership for Patients project and On the CUSP: STOP CAUTI, an American Hospital Association HRET effort that’s funded by the Agency for Healthcare Research and Quality-funded project.
Gregory Maynard, MD, SFHM, director of hospital medicine at the University of San Diego Medical Center and senior vice president of SHM’s Center for Healthcare Improvement and Innovation is encouraged by the CLABSI and SSI figures. The report highlights the need for more effort on CAUTI.
“I think all the tools and information are available for improvement teams,” he says. “The CDC, the HRET On the CUSP group, and others all have great toolkits.”
He also says it was telling that the CAUTI numbers were worse in the ICU than in general wards.
“The more complex the environment, the easier it is for those things to get lost,” he says. “It just will probably take more attention to it and making it more of a priority.
“The more complex the environment, the easier it is for those things to get lost. It just will probably take more attention to it and making it more of a priority…. We’re supposed to reduce these adverse events by a very significant amount and obviously we’re not getting there based on this report. We have to do a better job. Reducing CAUTI by 40% is one of goals for the $500 million Partnerships for Patients effort. With that much money involved, it should increase the pressure to get this done.”
Click here to hear more of Dr. Maynard's interview with The Hospitalist
Scott Flanders, MD, SFHM, a former SHM president and SHM’s physician leader for STOP CAUTI, says the report shows that CAUTIs may be more difficult to prevent. In part, that is because catheters are used more broadly throughout a hospital than, say, central lines, which are most common in ICUs.
It takes a multi-disciplinary team implementing a variety of tools: critieria for putting catheters in, managing them appropriately once they are in, and developing protocols for removing them as quickly as possible, he adds.
“Having all those elements in place are critical to preventing CAUTI and I think many hospitals around the country have not implemented all of those strategies to reduce CAUTI,” says Dr. Flanders, professor of medicine and director of hospital medicine at the University of Michigan Health System in Ann Arbor. “No single strategy used in isolation is going to be effective.”
Efforts to reduce CAUTIs have been launched more recently than efforts to reduce other infection types, he says.
“There’s been less of a drive for CAUTI,” he says. “It’s a tougher problem to tackle than some of these other issues, which is a contributing factor in the lower rate of improvement.” TH
Tom Collins is a freelance writer in South Florida.
If you’ve ever heard someone say, "I’ve been pinning for an hour. I’m addicted!" and had no idea what this person was talking about, I have one word for you: Pinterest.
Pinterest is a fabulously popular social media site that allows users to find, share, and organize images called "pins" that are displayed or "pinned" on electronic "boards." A "board" is like a digital folder that helps you organize your pins. For example, you might have boards for Healthy Recipes, Exercise, and Places I’ve Traveled. Images are uploaded from the web or from your own computer or smartphone. Since it’s social, users can "like" other people’s pins, comment on them, and "repin" or share them. They can also add friends and become part of a "pin group board," where you and selected others upload pins to the shared boards.
Why is this important for you and your medical practice? Pinterest is one of the fastest-growing social media sites in history. It launched in March 2010, and by October 2012 it had reached more than 25,000,000 active monthly users and debuted on the list of top 50 most-visited web sites in the United States.
According to the Pew Research Center, 72% of adults who are online are searching for health, and Pinterest is another social media channel you can use to reach them. If you’re thinking, "But I already do Twitter and Facebook," consider this: Approximately 80% of Pinterest users are female and, according to the U.S. Department of Labor, women make 80% of health care decisions for their families. See the connection? It’s not farfetched to posit that Pinterest may turn out to be one of the most effective social media sites for the health care industry.
Because many people are visual learners, Pinterest can be an effective tool for patient education. Several renowned institutions, including St. Jude Children’s Hospital and the Mayo Clinic, use Pinterest effectively to educate the public, share patient stories, and discuss newsworthy topics.
As physicians, you can use Pinterest similarly to build your brand and help market your practice more creatively.
You’ll find that Pinterest is very easy to learn and use. And because it’s a visual site with little to no text, it requires minimal effort on your part, or your staff’s part. A few minutes per day or every few days are sufficient to establish a presence and make connections.
There are many ways you can use Pinterest to build brand awareness and reach patients. Here are a few:
• Explain how medical or cosmetic procedures work, such as fillers and sclerotherapy.
• Explain how medical devices work, such as lasers and dermatoscopes.
• Generate awareness of medical conditions, such as psoriasis, eczema, and skin cancers. Infographics are especially effective.
• Provide inspiration. Many skin conditions are psychologically challenging. Pinning inspirational images can give patients hope.
• Share your product recommendations.
• Share uplifting patient stories and testimonials.
• Introduce and update the public to you, your staff, your office, and your services.
As for creating pin boards, the categories are endless, but here are some ideas to get you started: Patient Stories, Healthy Skin Habits, Sun Safety, Before and After, Acne Tips, Cosmetic Services, Parenting Tips, Words of Inspiration, and Meet Our Staff.
If you haven’t been on Pinterest yet, take a visit there and explore what it has to offer. And don’t be surprised if you become addicted.
Dr. Benabio is physician director at Kaiser Permanente in San Diego. Visit his consumer health blog at thedermblog.com; connect with him on Twitter @Dermdoc, and on Facebook (DermDoc).
If you’ve ever heard someone say, "I’ve been pinning for an hour. I’m addicted!" and had no idea what this person was talking about, I have one word for you: Pinterest.
Pinterest is a fabulously popular social media site that allows users to find, share, and organize images called "pins" that are displayed or "pinned" on electronic "boards." A "board" is like a digital folder that helps you organize your pins. For example, you might have boards for Healthy Recipes, Exercise, and Places I’ve Traveled. Images are uploaded from the web or from your own computer or smartphone. Since it’s social, users can "like" other people’s pins, comment on them, and "repin" or share them. They can also add friends and become part of a "pin group board," where you and selected others upload pins to the shared boards.
Why is this important for you and your medical practice? Pinterest is one of the fastest-growing social media sites in history. It launched in March 2010, and by October 2012 it had reached more than 25,000,000 active monthly users and debuted on the list of top 50 most-visited web sites in the United States.
According to the Pew Research Center, 72% of adults who are online are searching for health, and Pinterest is another social media channel you can use to reach them. If you’re thinking, "But I already do Twitter and Facebook," consider this: Approximately 80% of Pinterest users are female and, according to the U.S. Department of Labor, women make 80% of health care decisions for their families. See the connection? It’s not farfetched to posit that Pinterest may turn out to be one of the most effective social media sites for the health care industry.
Because many people are visual learners, Pinterest can be an effective tool for patient education. Several renowned institutions, including St. Jude Children’s Hospital and the Mayo Clinic, use Pinterest effectively to educate the public, share patient stories, and discuss newsworthy topics.
As physicians, you can use Pinterest similarly to build your brand and help market your practice more creatively.
You’ll find that Pinterest is very easy to learn and use. And because it’s a visual site with little to no text, it requires minimal effort on your part, or your staff’s part. A few minutes per day or every few days are sufficient to establish a presence and make connections.
There are many ways you can use Pinterest to build brand awareness and reach patients. Here are a few:
• Explain how medical or cosmetic procedures work, such as fillers and sclerotherapy.
• Explain how medical devices work, such as lasers and dermatoscopes.
• Generate awareness of medical conditions, such as psoriasis, eczema, and skin cancers. Infographics are especially effective.
• Provide inspiration. Many skin conditions are psychologically challenging. Pinning inspirational images can give patients hope.
• Share your product recommendations.
• Share uplifting patient stories and testimonials.
• Introduce and update the public to you, your staff, your office, and your services.
As for creating pin boards, the categories are endless, but here are some ideas to get you started: Patient Stories, Healthy Skin Habits, Sun Safety, Before and After, Acne Tips, Cosmetic Services, Parenting Tips, Words of Inspiration, and Meet Our Staff.
If you haven’t been on Pinterest yet, take a visit there and explore what it has to offer. And don’t be surprised if you become addicted.
Dr. Benabio is physician director at Kaiser Permanente in San Diego. Visit his consumer health blog at thedermblog.com; connect with him on Twitter @Dermdoc, and on Facebook (DermDoc).
If you’ve ever heard someone say, "I’ve been pinning for an hour. I’m addicted!" and had no idea what this person was talking about, I have one word for you: Pinterest.
Pinterest is a fabulously popular social media site that allows users to find, share, and organize images called "pins" that are displayed or "pinned" on electronic "boards." A "board" is like a digital folder that helps you organize your pins. For example, you might have boards for Healthy Recipes, Exercise, and Places I’ve Traveled. Images are uploaded from the web or from your own computer or smartphone. Since it’s social, users can "like" other people’s pins, comment on them, and "repin" or share them. They can also add friends and become part of a "pin group board," where you and selected others upload pins to the shared boards.
Why is this important for you and your medical practice? Pinterest is one of the fastest-growing social media sites in history. It launched in March 2010, and by October 2012 it had reached more than 25,000,000 active monthly users and debuted on the list of top 50 most-visited web sites in the United States.
According to the Pew Research Center, 72% of adults who are online are searching for health, and Pinterest is another social media channel you can use to reach them. If you’re thinking, "But I already do Twitter and Facebook," consider this: Approximately 80% of Pinterest users are female and, according to the U.S. Department of Labor, women make 80% of health care decisions for their families. See the connection? It’s not farfetched to posit that Pinterest may turn out to be one of the most effective social media sites for the health care industry.
Because many people are visual learners, Pinterest can be an effective tool for patient education. Several renowned institutions, including St. Jude Children’s Hospital and the Mayo Clinic, use Pinterest effectively to educate the public, share patient stories, and discuss newsworthy topics.
As physicians, you can use Pinterest similarly to build your brand and help market your practice more creatively.
You’ll find that Pinterest is very easy to learn and use. And because it’s a visual site with little to no text, it requires minimal effort on your part, or your staff’s part. A few minutes per day or every few days are sufficient to establish a presence and make connections.
There are many ways you can use Pinterest to build brand awareness and reach patients. Here are a few:
• Explain how medical or cosmetic procedures work, such as fillers and sclerotherapy.
• Explain how medical devices work, such as lasers and dermatoscopes.
• Generate awareness of medical conditions, such as psoriasis, eczema, and skin cancers. Infographics are especially effective.
• Provide inspiration. Many skin conditions are psychologically challenging. Pinning inspirational images can give patients hope.
• Share your product recommendations.
• Share uplifting patient stories and testimonials.
• Introduce and update the public to you, your staff, your office, and your services.
As for creating pin boards, the categories are endless, but here are some ideas to get you started: Patient Stories, Healthy Skin Habits, Sun Safety, Before and After, Acne Tips, Cosmetic Services, Parenting Tips, Words of Inspiration, and Meet Our Staff.
If you haven’t been on Pinterest yet, take a visit there and explore what it has to offer. And don’t be surprised if you become addicted.
Dr. Benabio is physician director at Kaiser Permanente in San Diego. Visit his consumer health blog at thedermblog.com; connect with him on Twitter @Dermdoc, and on Facebook (DermDoc).
New antihemophilic factors last longer than standard treatments
WARSAW—Recombinant Fc fusion proteins can provide long-lasting protection from bleeding in patients with hemophilia A or B, according to data presented at the 6th Annual Congress of the European Association for Haemophilia and Allied Disorders.
Data from the phase 3 A-LONG study indicated that patients with hemophilia A could maintain low bleeding rates with once- to twice-weekly prophylactic injections of a recombinant factor VIII Fc fusion protein (rFVIIIFc, efmoroctocog alfa/Elocta, Eloctate).
Similarly, results of the phase 3 B-LONG study showed that patients with hemophilia B had low bleeding rates when they received prophylactic injections of a recombinant factor IX Fc fusion protein (rFIXFc, eftrenonacog alfa/Alprolix) every 1 to 2 weeks.
Both studies were sponsored by the companies developing these factors, Biogen Idec and Swedish Orphan Biovitrum (Sobi).
A-LONG data
In the A-LONG study, researchers evaluated the efficacy, safety, and pharmacokinetics of intravenous rFVIIIFc in 165 male patients aged 12 years and older. The team found that 98% of bleeding episodes were controlled by 1 or 2 injections of rFVIIIFc.
The factor was generally well-tolerated, and no inhibitors were detected. The most common adverse events (with an incidence of 5% or higher) were nasopharyngitis, arthralgia, headache, and upper respiratory tract infection.
The study also showed that rFVIIIFc stays in the body for 50% longer than Advate [antihemophilic factor (recombinant), plasma/albumin-free method], the most frequently used factor VIII therapy. The terminal half-life for rFVIIIFc was 19 hours, compared to 12 hours for Advate.
Additionally, the mean time for maintaining a clotting factor activity level associated with less bleeding (time to 1%) was approximately 5 days for rFVIIIFc, compared to 3.5 days for Advate. And the average rate at which rFVIIIFc was cleared from the body was 2.0 mL/hr/kg, compared with 3.0 mL/hr/kg for Advate.
In the study’s individualized prophylaxis arm, patients received rFVIIIFc at a median dosing interval of 3.5 days and a median weekly dose of 78 IU/kg to prevent bleeding, which compares favorably to the recommended dose for the standard of care. Nearly one-third of patients were able to achieve every-5-days dosing in this arm.
The A-LONG data were presented in the late-breaking oral abstract session and in poster 104, “Phase 3 clinical study of recombinant FC fusion factor FVIII (rFVIIIFc) demonstrated safety, efficacy, and improved pharmacokinetics (A-LONG).”
B-LONG data
In the B-LONG study, researchers evaluated the efficacy, safety, and pharmacokinetics of intravenous rFIXFc in 123 male patients aged 12 years and older. The team found that more than 90% of bleeding episodes were controlled by a single injection of rFIXFc.
rFIXFc was generally well-tolerated, and no inhibitors were detected. The most common adverse events (with an incidence of 5% or more) were nasopharyngitis, influenza, arthralgia, upper respiratory infection, hypertension, and headache.
One serious adverse event, obstructive uropathy in the setting of hematuria, may have been related to rFIXFc treatment. However, the patient continued to receive rFIXFc, and the event resolved with medical management.
The study also showed that rFIXFc stays in the body more than twice as long as BeneFIX [Coagulation Factor IX (Recombinant)], the only recombinant factor IX therapy currently approved for prophylactic use. The terminal half-life for rFIXFc was 82 hours, compared to 34 hours for BeneFIX.
In addition, the mean time for maintaining a normal clotting factor activity level (time to 1%) was 11 days for rFIXFc, compared to 5 days for BeneFIX. And the average rate at which rFIXFc was cleared from the body was 3.2 mL/hr/kg, compared with 6.3 mL/hr/kg for BeneFIX.
All patients in the individualized interval prophylaxis arm of the study were able to go at least 1 week between rFIXFc injections, and 50% could go 14 days or longer before needing another dose to prevent bleeding. The median weekly dose was 45 IU/kg, which is comparable to the recommended dose for the current standard of care.
The B-LONG data were presented in poster 115, “Safety, efficacy, and improved pharmacokinetics (PK) demonstrated in a phase 3 clinical trial of extended half-life recombinant FC fusion factor IX (B-LONG).” 
WARSAW—Recombinant Fc fusion proteins can provide long-lasting protection from bleeding in patients with hemophilia A or B, according to data presented at the 6th Annual Congress of the European Association for Haemophilia and Allied Disorders.
Data from the phase 3 A-LONG study indicated that patients with hemophilia A could maintain low bleeding rates with once- to twice-weekly prophylactic injections of a recombinant factor VIII Fc fusion protein (rFVIIIFc, efmoroctocog alfa/Elocta, Eloctate).
Similarly, results of the phase 3 B-LONG study showed that patients with hemophilia B had low bleeding rates when they received prophylactic injections of a recombinant factor IX Fc fusion protein (rFIXFc, eftrenonacog alfa/Alprolix) every 1 to 2 weeks.
Both studies were sponsored by the companies developing these factors, Biogen Idec and Swedish Orphan Biovitrum (Sobi).
A-LONG data
In the A-LONG study, researchers evaluated the efficacy, safety, and pharmacokinetics of intravenous rFVIIIFc in 165 male patients aged 12 years and older. The team found that 98% of bleeding episodes were controlled by 1 or 2 injections of rFVIIIFc.
The factor was generally well-tolerated, and no inhibitors were detected. The most common adverse events (with an incidence of 5% or higher) were nasopharyngitis, arthralgia, headache, and upper respiratory tract infection.
The study also showed that rFVIIIFc stays in the body for 50% longer than Advate [antihemophilic factor (recombinant), plasma/albumin-free method], the most frequently used factor VIII therapy. The terminal half-life for rFVIIIFc was 19 hours, compared to 12 hours for Advate.
Additionally, the mean time for maintaining a clotting factor activity level associated with less bleeding (time to 1%) was approximately 5 days for rFVIIIFc, compared to 3.5 days for Advate. And the average rate at which rFVIIIFc was cleared from the body was 2.0 mL/hr/kg, compared with 3.0 mL/hr/kg for Advate.
In the study’s individualized prophylaxis arm, patients received rFVIIIFc at a median dosing interval of 3.5 days and a median weekly dose of 78 IU/kg to prevent bleeding, which compares favorably to the recommended dose for the standard of care. Nearly one-third of patients were able to achieve every-5-days dosing in this arm.
The A-LONG data were presented in the late-breaking oral abstract session and in poster 104, “Phase 3 clinical study of recombinant FC fusion factor FVIII (rFVIIIFc) demonstrated safety, efficacy, and improved pharmacokinetics (A-LONG).”
B-LONG data
In the B-LONG study, researchers evaluated the efficacy, safety, and pharmacokinetics of intravenous rFIXFc in 123 male patients aged 12 years and older. The team found that more than 90% of bleeding episodes were controlled by a single injection of rFIXFc.
rFIXFc was generally well-tolerated, and no inhibitors were detected. The most common adverse events (with an incidence of 5% or more) were nasopharyngitis, influenza, arthralgia, upper respiratory infection, hypertension, and headache.
One serious adverse event, obstructive uropathy in the setting of hematuria, may have been related to rFIXFc treatment. However, the patient continued to receive rFIXFc, and the event resolved with medical management.
The study also showed that rFIXFc stays in the body more than twice as long as BeneFIX [Coagulation Factor IX (Recombinant)], the only recombinant factor IX therapy currently approved for prophylactic use. The terminal half-life for rFIXFc was 82 hours, compared to 34 hours for BeneFIX.
In addition, the mean time for maintaining a normal clotting factor activity level (time to 1%) was 11 days for rFIXFc, compared to 5 days for BeneFIX. And the average rate at which rFIXFc was cleared from the body was 3.2 mL/hr/kg, compared with 6.3 mL/hr/kg for BeneFIX.
All patients in the individualized interval prophylaxis arm of the study were able to go at least 1 week between rFIXFc injections, and 50% could go 14 days or longer before needing another dose to prevent bleeding. The median weekly dose was 45 IU/kg, which is comparable to the recommended dose for the current standard of care.
The B-LONG data were presented in poster 115, “Safety, efficacy, and improved pharmacokinetics (PK) demonstrated in a phase 3 clinical trial of extended half-life recombinant FC fusion factor IX (B-LONG).”
WARSAW—Recombinant Fc fusion proteins can provide long-lasting protection from bleeding in patients with hemophilia A or B, according to data presented at the 6th Annual Congress of the European Association for Haemophilia and Allied Disorders.
Data from the phase 3 A-LONG study indicated that patients with hemophilia A could maintain low bleeding rates with once- to twice-weekly prophylactic injections of a recombinant factor VIII Fc fusion protein (rFVIIIFc, efmoroctocog alfa/Elocta, Eloctate).
Similarly, results of the phase 3 B-LONG study showed that patients with hemophilia B had low bleeding rates when they received prophylactic injections of a recombinant factor IX Fc fusion protein (rFIXFc, eftrenonacog alfa/Alprolix) every 1 to 2 weeks.
Both studies were sponsored by the companies developing these factors, Biogen Idec and Swedish Orphan Biovitrum (Sobi).
A-LONG data
In the A-LONG study, researchers evaluated the efficacy, safety, and pharmacokinetics of intravenous rFVIIIFc in 165 male patients aged 12 years and older. The team found that 98% of bleeding episodes were controlled by 1 or 2 injections of rFVIIIFc.
The factor was generally well-tolerated, and no inhibitors were detected. The most common adverse events (with an incidence of 5% or higher) were nasopharyngitis, arthralgia, headache, and upper respiratory tract infection.
The study also showed that rFVIIIFc stays in the body for 50% longer than Advate [antihemophilic factor (recombinant), plasma/albumin-free method], the most frequently used factor VIII therapy. The terminal half-life for rFVIIIFc was 19 hours, compared to 12 hours for Advate.
Additionally, the mean time for maintaining a clotting factor activity level associated with less bleeding (time to 1%) was approximately 5 days for rFVIIIFc, compared to 3.5 days for Advate. And the average rate at which rFVIIIFc was cleared from the body was 2.0 mL/hr/kg, compared with 3.0 mL/hr/kg for Advate.
In the study’s individualized prophylaxis arm, patients received rFVIIIFc at a median dosing interval of 3.5 days and a median weekly dose of 78 IU/kg to prevent bleeding, which compares favorably to the recommended dose for the standard of care. Nearly one-third of patients were able to achieve every-5-days dosing in this arm.
The A-LONG data were presented in the late-breaking oral abstract session and in poster 104, “Phase 3 clinical study of recombinant FC fusion factor FVIII (rFVIIIFc) demonstrated safety, efficacy, and improved pharmacokinetics (A-LONG).”
B-LONG data
In the B-LONG study, researchers evaluated the efficacy, safety, and pharmacokinetics of intravenous rFIXFc in 123 male patients aged 12 years and older. The team found that more than 90% of bleeding episodes were controlled by a single injection of rFIXFc.
rFIXFc was generally well-tolerated, and no inhibitors were detected. The most common adverse events (with an incidence of 5% or more) were nasopharyngitis, influenza, arthralgia, upper respiratory infection, hypertension, and headache.
One serious adverse event, obstructive uropathy in the setting of hematuria, may have been related to rFIXFc treatment. However, the patient continued to receive rFIXFc, and the event resolved with medical management.
The study also showed that rFIXFc stays in the body more than twice as long as BeneFIX [Coagulation Factor IX (Recombinant)], the only recombinant factor IX therapy currently approved for prophylactic use. The terminal half-life for rFIXFc was 82 hours, compared to 34 hours for BeneFIX.
In addition, the mean time for maintaining a normal clotting factor activity level (time to 1%) was 11 days for rFIXFc, compared to 5 days for BeneFIX. And the average rate at which rFIXFc was cleared from the body was 3.2 mL/hr/kg, compared with 6.3 mL/hr/kg for BeneFIX.
All patients in the individualized interval prophylaxis arm of the study were able to go at least 1 week between rFIXFc injections, and 50% could go 14 days or longer before needing another dose to prevent bleeding. The median weekly dose was 45 IU/kg, which is comparable to the recommended dose for the current standard of care.
The B-LONG data were presented in poster 115, “Safety, efficacy, and improved pharmacokinetics (PK) demonstrated in a phase 3 clinical trial of extended half-life recombinant FC fusion factor IX (B-LONG).”
Effectiveness of NIV vs. IMV in AECOPD
Chronic obstructive pulmonary disease (COPD) is now the third leading cause of death in the United States,[1] and its rising mortality trend is unique among the top 5 causes of death.[2] Acute exacerbations of COPD (AECOPD) are important events in the natural history of COPD, accounting for 1.5 million emergency department (ED) visits and 726,000 hospitalizations each year in the United States.[3, 4] Given the significant morbidity and mortality from AECOPD, Healthy People 2020 lists reducing deaths, hospitalizations, and ED visits as the key objectives for COPD.[5]
Over the past 2 decades, noninvasive ventilation (NIV) has emerged as a potentially useful treatment modality in AECOPD patients with acute respiratory failure. Noninvasive ventilation commonly refers to positive‐pressure ventilatory support delivered through a nasal or full‐face mask, such as bilevel positive airway pressure.[6] A number of randomized controlled trials[7, 8, 9] and meta‐analyses[10] have suggested a mortality‐reduction benefit with NIV use compared with standard medical care in AECOPD. To our knowledge, however, very few small randomized controlled trials compared NIV vs invasive mechanical ventilation (IMV) head‐to‐head,[11, 12, 13] and a recent evidence review found only 5 studies (405 subjects) on this topic.[14] Collectively, the limited evidence from randomized trials showed that NIV use resulted in similar intensive care unit (ICU) and in‐hospital mortality, fewer complications (eg, ventilator‐associated pneumonia and sepsis), and shorter hospital length of stays (LOS). Given that these trials have a smaller sample size and tend to exclude older patient (age >75 years) or patients with multiple comorbidities, there is a need to better understand the adoption and effectiveness of NIV treatment for AECOPD in a much larger patient population in the real‐world setting using observational data.
To address these knowledge gaps in the literature, we analyzed data from a large, nationally representative ED and inpatient sample. The objective of the present analysis was 2‐fold: (1) to characterize the use of NIV and IMV in AECOPD patients with acute respiratory failure at a national level; and (2) to compare the effectiveness of NIV vs IMV in the real‐world setting.
METHODS
Study Design and Setting
We conducted a retrospective cohort study using data from the 20062008 Nationwide Emergency Department Sample (NEDS),[15] a component of the Healthcare Cost and Utilization Project sponsored by the Agency for Healthcare Research and Quality. The NEDS is nationally representative of all community hospitalbased EDs in the United States, defined by the American Hospital Association as all nonfederal, short‐term, general, and other specialty hospitals.[16] Community hospitals include academic medical centers if they are nonfederal short‐term hospitals. The NEDS was constructed using administrative records from the State Emergency Department Databases and the State Inpatient Databases. The former captures information on ED visits that do not result in an admission (ie, treat‐and‐release visits or transfers to another hospital); the latter contains information on patients initially seen in the ED and then admitted to the same hospital. Taken together, the resulting NEDS represents all ED visits regardless of disposition and contains information on short‐term outcomes for patients admitted through the ED. In other words, the NEDS is the largest all‐payer ED and inpatient database in the United States. The NEDS represents an approximately 20% stratified sample of US hospital‐based EDs, containing more than 28 million records of ED visits from approximately 1000 hospitals each year. Additional details of the NEDS can be found elsewhere.[15, 17] We received a waiver for this analysis from our institutional review board.
Study Population
Patient visits were included in this analysis if they carried any COPD‐related diagnostic code (ie, International Classification of Diseases, Ninth Revision, Clinical Modification [ICD‐9‐CM] code of 491.xx [chronic bronchitis], 492.xx [emphysema], or 496.xx [chronic airway obstruction, not elsewhere classified]) as their primary ED diagnosis and any acute respiratory failure code (ie, 518.81 [acute respiratory failure], 518.82 [pulmonary insufficiency not elsewhere classified, 518.84 [acute and chronic respiratory failure], or 799.1 [respiratory arrest]) as their secondary diagnosis. Patient visits with a primary diagnosis of acute respiratory failure and a secondary diagnosis of COPD were also included. Patients age <40 years were excluded, because they are much less likely to have COPD.[18]
Modes of Mechanical Ventilation
The primary exposure variable was mode of mechanical ventilation. To compare the effectiveness of different ventilatory modes, patients were divided into 3 groups according to the ventilation mode they received: (1) NIV alone, (2) IMV alone, and (3) combined modes of NIV and IMV. The use of NIV was identified by using Current Procedural Terminology (CPT) code of 94660 or ICD‐9 procedure code 93.90, whereas the use of IMV was identified by using CPT code of 31500 or ICD‐9 procedure code 96.04 or 96.7x.
Patient‐Level and Emergency DepartmentLevel Variables
The NEDS contains information on patient demographics, national quartiles for median household income based on the patient's ZIP code, payment sources, ICD‐9‐CM diagnoses and procedures, ED disposition, hospital LOS, and hospital disposition. Hospital characteristics include annual visit volume, urban‐rural status, ownership, teaching status, and US region. Geographic regions (Northeast, South, Midwest, and West) were defined according to Census Bureau boundaries.[19] To adjust for confounding by patient mix, Elixhauser comorbidity measures were derived based on the ICD‐9 codes, using the Agency for Healthcare Research and Quality's Comorbidity Software.[20] This risk‐adjustment tool has been derived and validated extensively.[21]
Outcome Measures
The outcome measures were all‐cause inpatient mortality, hospital LOS, hospital charges, and ventilator‐related complications. Three ventilator‐related complications were identified using ICD‐9 procedure codes: ventilator‐associated pneumonia (997.31), facial injury (910.x), and iatrogenic pneumothorax (512.1).
Statistical Analysis
Summary statistics are presented as proportions (with 95% confidence intervals [CI]), means (with standard deviations [SD]), or medians (with interquartile ranges). Bivariate associations were examined using Student t tests, Kruskal‐Wallis tests, and [2] tests, as appropriate. Emergency department and discharge weights were used to obtain national estimates at the ED and visit level. At all other times (eg, the propensity score and instrumental variable analyses), the unweighted cohort was analyzed, because survey weights are generally not advised for propensity score analysis using complex survey data.[22]
Propensity Score Analysis
To adjust for baseline patient and ED characteristics that may have confounded the relationship between ventilation mode and clinical outcomes, we performed propensity score and instrumental variable analyses. To compare the effectiveness of NIV vs IMV, a propensity score or predicted probability of NIV was estimated using a logistic‐regression model with all patient characteristics (age, sex, quartiles for median household income, weekend admission, insurance status, season, calendar year, and comorbid conditions) and ED characteristics (urban/rural and teaching status, US region, annual ED volume, and annual volume of AECOPD with respiratory failure) as the independent variables. We then performed 1:1 propensity score matching based on a nearest‐neighbor algorithm with caliper distance of 0.01. Although propensity score matching may result in a smaller sample, it provides a clinically relevant estimate of treatment effect because subjects in the matched sample are potential candidates for either treatment option.[23, 24] An absolute standardized difference between characteristics of <10% was considered as adequate balance.[25]
Instrumental Variable Analysis
When hospitals always or nearly always use NIV or IMV, this suggests the choice is largely independent of patient characteristics, and it is possible to use the hospital preference as a proxy for the actual treatment choice (ie, an instrument variable). The instrumental variable analysis simulates a natural randomization of patients to 2 hospital groups with high and low NIV use.
The main difference between instrumental variable and propensity score analysis is that the former could potentially adjust for unmeasured confounders.[26] We used Stata procedure IVREG to estimate the outcome differences between NIV‐preferring hospitals (NIV use in 90% of patients) and IMV‐preferring hospitals (NIV use in 10% of patients).
All odds ratios (ORs) and ‐coefficients are presented with 95% CIs. All analyses were performed using Stata 12.0 software (StataCorp, College Station, TX). All P values are 2‐sided, with P<0.05 considered statistically significant.
Sensitivity Analyses
We conducted a sensitivity analysis to determine whether it was plausible that an unmeasured confounder could completely explain the observed results. The risk ratio of a hypothetical unmeasured confounder on study outcome and the exposure‐confounder imbalance were both varied to see at what point the observed association was reduced to 1.0.[27]
RESULTS
Patient and ED Characteristics
The 20062008 NEDS sample contained 67,651 ED visits for AECOPD with acute respiratory failure from 1594 US EDs. After the weighting procedure, there were an estimated 101,000 visits annually for AECOPD with acute respiratory failure from approximately 4700 US EDs. In the weighted analysis, the mean patient age of these visits was 68 years, and 56% were made by women. Ninety‐six percent were admitted to the hospital. Of these, the mortality rate was 9% and the mean hospital LOS was 7 days. Figure 1 shows the secular trends in NIV, IMV, and the combined use over the 3‐year study period. Use of IMV decreased from 28% in 2006 to 19% in 2008 (P<0.001), whereas NIV use increased slightly from 14% in 2006 to 16% in 2008 (P=0.049); the combined use of both ventilation modalities remained stable (4%). Inpatient mortality decreased from 10% in 2006 to 7% in 2008 (P<0.001).
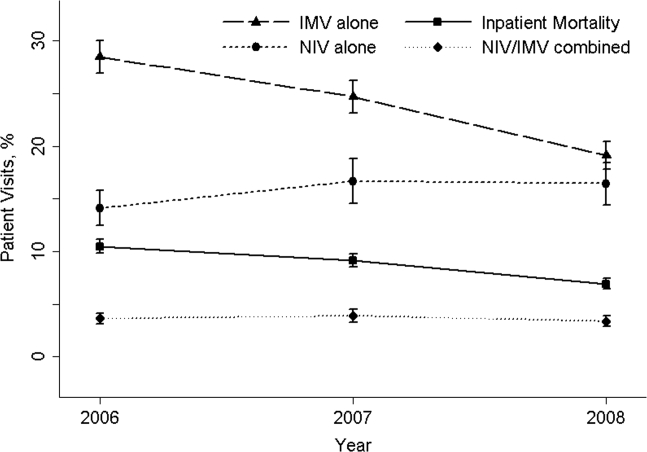
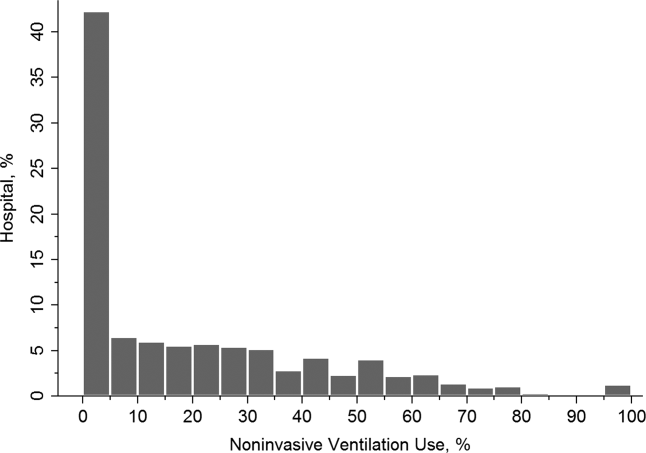
Figure 2 shows that the frequency of NIV use (including combined use of NIV and IMV) varied widely between hospitals, ranging from 0% to 100% with a median of 11%. In the unweighted cohort of AECOPD with acute respiratory failure, 43% received some forms of ventilatory support. Table 1 shows the patient and hospital characteristics of the patients receiving ventilatory support: 36% received NIV, 56% received IMV, and 8% received combined use. In general, patients receiving combined use of NIV and IMV tended to have more comorbidities (eg, congestive heart failure and pneumonia) compared with the NIV‐alone or IMV‐alone groups. With respect to hospital characteristics, NIV was used more often in hospitals with higher volumes of COPD exacerbation and respiratory failure, in nonmetropolitan hospitals, and in hospitals in the Northeast.
| NIV Alone (A) (n=10,032) | IMV Alone (B) (n=15,427) | Combined Use (C) (n=2311) | P Value, A vs B | P Value, B vs C | |
|---|---|---|---|---|---|
| |||||
| Patient characteristics | |||||
| Age, y, | <0.001 | 0.64 | |||
| 4049 | 5 | 5 | 5 | ||
| 5059 | 17 | 18 | 19 | ||
| 6069 | 31 | 33 | 33 | ||
| 7079 | 30 | 29 | 29 | ||
| 80 | 17 | 15 | 13 | ||
| Female sex, % | 57 | 53 | 54 | <0.001 | 0.87 |
| Quartile for median household income of patient ZIP code, $, % | <0.001 | <0.001 | |||
| 138,999 | 30 | 34 | 29 | ||
| 39,00047,999 | 28 | 28 | 28 | ||
| 48,00062,999 | 24 | 22 | 24 | ||
| 63,000 | 18 | 15 | 19 | ||
| Weekend admission, % | 27 | 28 | 28 | 0.07 | 0.80 |
| Insurance status, % | <0.001 | 0.91 | |||
| Medicare | 74 | 70 | 70 | ||
| Medicaid | 9 | 12 | 12 | ||
| Private | 12 | 13 | 13 | ||
| Self‐pay | 2 | 3 | 2 | ||
| Other | 2 | 2 | 2 | ||
| Season, % | <0.001 | 0.16 | |||
| Winter (January 1March 31) | 29 | 32 | 31 | ||
| Spring (April 1June 30) | 24 | 25 | 26 | ||
| Summer (July 1September 30) | 22 | 20 | 19 | ||
| Fall (October 1December 31) | 25 | 22 | 24 | ||
| No. of comorbidities, median (IQR) | 4 (35) | 4 (35) | 4 (36) | <0.001 | <0.001 |
| Selected comorbidities, % | |||||
| Hypertension | 56 | 55 | 55 | 0.01 | 0.65 |
| CHF | 38 | 40 | 44 | 0.001 | <0.001 |
| Fluid and electrolyte disorders | 37 | 44 | 49 | <0.001 | <0.001 |
| Diabetes, uncomplicated | 27 | 26 | 29 | 0.04 | 0.002 |
| Pneumonia | 19 | 34 | 39 | <0.001 | <0.001 |
| Deficiency anemia | 16 | 19 | 19 | <0.001 | 0.39 |
| Obesity | 18 | 12 | 17 | <0.001 | <0.001 |
| Depression | 15 | 11 | 11 | <0.001 | 0.54 |
| Pulmonary circulatory diseases | 15 | 11 | 14 | <0.001 | <0.001 |
| Hospital characteristics | |||||
| Annual ED visit volume, median (IQR) | 42,704 (29,50562,470) | 44,119 (29,89564,097) | 46,695 (31,29866,235) | 0.02 | 0.0003 |
| Annual ED volume of COPD exacerbation with respiratory failure, median (IQR) | 45 (2672) | 42 (2368) | 38 (2364) | <0.001 | <0.001 |
| Urban/rural and teaching status, % | <0.001 | <0.001 | |||
| Metropolitan nonteaching | 53 | 52 | 47 | ||
| Metropolitan teaching | 31 | 35 | 39 | ||
| Nonmetropolitan | 16 | 13 | 13 | ||
| US region, % | <0.001 | <0.001 | |||
| Northeast | 28 | 16 | 36 | ||
| Midwest | 17 | 22 | 15 | ||
| South | 41 | 45 | 32 | ||
| West | 14 | 17 | 17 | ||
The unadjusted differences in outcomes are shown in Table 2. The combined‐use group had the highest inpatient mortality, longest LOS, and highest charges, followed by the IMV and NIV groups. In general, complications were few across all 3 groups, but the rate of iatrogenic pneumothorax was notably lower in the NIV group. Table 3 details the statistically significant predictors of NIV use in the propensity score model. Similar to the unadjusted analysis, older age, high‐income neighborhoods, Medicare insurance, and some comorbidities were positively associated with NIV use (eg, pulmonary circulatory disorders and liver disease), whereas a few comorbidities were negatively associated with NIV use (eg, pneumonia, and alcohol and drug abuse). With respect to hospital characteristics, higher case volumes of COPD exacerbation/respiratory failure, Northeastern and nonmetropolitan hospitals, and more recent years were associated with NIV use.
| Outcome | NIV Alone (A) (n=10,032) | IMV Alone (B) (n=15,427) | Combined Use (C) (n=2311) | P Value. A vs B | P Value, B vs C |
|---|---|---|---|---|---|
| |||||
| Inpatient mortality, n (%) | 825 (8) | 2,454 (16) | 407 (18) | <0.001 | 0.04 |
| Hospital length of stay, median (IQR), d | 5 (48) | 8 (513) | 10 (716) | <0.001 | <0.001 |
| Hospital charge per visit, median (IQR), $ | 26,002 (15,74744,638) | 53,432 (31,99892,664) | 64,585 (39,024110,336) | <0.001 | <0.001 |
| Complications* | |||||
| Ventilator‐associated pneumonia, n (%) | 10 (0.1) | 10 (0.1) | 10 (0.5) | 0.09 | 1.00 |
| Facial injury, n (%) | 10 (0.1) | 10 (0.1) | 10 (0.5) | 0.26 | 1.00 |
| Iatrogenic pneumothorax, n (%) | 10 (0.1) | 90 (0.6) | 14 (0.6) | <0.001 | 0.90 |
| Patient Characteristics | Adjusted OR (95% CI)* | P Value |
|---|---|---|
| ||
| Age, y | ||
| 4049 | 1.00 (Reference) | |
| 5059 | 0.96 (0.84‐1.11) | 0.61 |
| 6069 | 0.96 (0.84‐1.10) | 0.56 |
| 7079 | 1.09 (0.94‐1.25) | 0.25 |
| 80 | 1.30 (1.12‐1.52) | 0.001 |
| Quartile for median household income of patient ZIP code, $ | ||
| 138,999 | 1.00 (Reference) | |
| 39,00047,999 | 1.13 (1.05‐1.21) | 0.001 |
| 48,00062,999 | 1.21 (1.12‐1.30) | <0.001 |
| 63,000 | 1.21 (1.11‐1.32) | <0.001 |
| Insurance status | ||
| Medicare | 1.00 (Reference) | |
| Medicaid | 0.79 (0.72‐0.88) | <0.001 |
| Private | 0.88 (0.81‐0.96) | 0.004 |
| Self‐pay | 0.68 (0.56‐0.82) | <0.001 |
| Other | 0.88 (0.73‐1.07) | 0.22 |
| Season | ||
| Winter (January 1March 31) | 1.00 (Reference) | |
| Spring (April 1June 30) | 1.06 (0.99‐1.14) | 0.11 |
| Summer (July 1September 30) | 1.17 (1.08‐1.26) | <0.001 |
| Fall (October 1December 31) | 1.24 (1.15‐1.33) | <0.001 |
| Comorbidity | ||
| CHF | 0.90 (0.85‐0.95) | <0.001 |
| Pulmonary circulatory disorders | 1.40 (1.29‐1.52) | <0.001 |
| Diabetes, complicated | 1.25 (1.08‐1.44) | 0.002 |
| Liver disease | 1.79 (1.40‐2.28) | <0.001 |
| Coagulopathy | 0.54 (0.46‐0.63) | <0.001 |
| Obesity | 1.52 (1.41‐1.65) | <0.001 |
| Weight loss | 0.50 (0.44‐0.57) | <0.001 |
| Fluid and electrolyte disorders | 0.84 (0.80‐0.89) | <0.001 |
| Deficiency anemia | 0.83 (0.78‐0.90) | <0.001 |
| Alcohol abuse | 0.66 (0.58‐0.76) | <0.001 |
| Drug abuse | 0.74 (0.62‐0.88) | 0.001 |
| Psychoses | 1.22 (1.10‐1.37) | <0.001 |
| Depression | 1.45 (1.34‐1.57) | <0.001 |
| Pneumonia | 0.48 (0.45‐0.51) | <0.001 |
| Valvular heart disease | 0.87 (0.77‐0.97) | 0.01 |
| Neurological disorders | 0.89 (0.80‐0.98) | 0.02 |
| RA/collagen vascular diseases | 1.25 (1.02‐1.53) | 0.04 |
| Blood‐loss anemia | 0.72 (0.53‐0.97) | 0.03 |
| Hospital characteristics | ||
| Annual ED visit volume, per 1000‐visit increase | 0.997 (0.996‐0.998) | <0.001 |
| Annual ED volume of COPD exacerbation with respiratory failure, per 10‐visit increase | 1.03 (1.02‐1.03) | <0.001 |
| Urban/rural and teaching status | ||
| Metropolitan nonteaching | 1.00 (Reference) | |
| Metropolitan teaching | 0.91 (0.85‐0.97) | 0.006 |
| Nonmetropolitan | 1.30 (1.20‐1.42) | <0.001 |
| US region | ||
| Northeast | 1.00 (Reference) | |
| Midwest | 0.44 (0.40‐0.48) | <0.001 |
| South | 0.54 (0.50‐0.58) | <0.001 |
| West | 0.51 (0.46‐0.56) | <0.001 |
| Calendar year | ||
| 2006 | 1.00 (Reference) | |
| 2007 | 1.30 (1.22‐1.39) | <0.001 |
| 2008 | 1.65 (1.54‐1.76) | <0.001 |
In terms of propensity score distributions (see Supporting Information, Figure E1, in the online version of this article), there was sufficient overlap of the NIV and IMV groups. After matching on propensity score for the NIV and IMV groups, the differences in baseline characteristics were all balanced (see Supporting Information, Table E1, in the online version of this article), as indicated by <10% standardized differences in all covariates between the 2 groups. Finally, in the propensity scorematched cohort (see Supporting Information, Table E2, in the online version of this article), NIV use remained associated with significantly lower inpatient mortality (risk ratio: 0.54; 95% CI: 0.50‐0.59, P<0.001), a shorter hospital LOS (mean difference, 3.2 days; 95% CI: 3.4 to 2.9 days, P<0.001), and lower hospital charges (mean difference, P<$35,012; 95% CI: $36,848 to $33,176, P<0.001), compared with IMV use. Use of NIV also was associated with a lower rate of iatrogenic pneumothorax than IMV use (0.05% vs 0.5%, P<0.001).
Using hospital preference for NIV vs IMV as an instrument, the instrumental analysis confirmed the benefits of NIV use, with a 5% reduction in inpatient mortality in the NIV‐preferring hospitals (risk difference, P<5%; 95% CI: P<1.8% to P<8.3%).
In the sensitivity analysis to assess the impact of an unmeasured confounder, the confounder would have had to have a very strong impact on outcome (risk ratio: 5) and a severe exposure‐confounder imbalance (odds ratio of exposure on confounder: 5) to reduce the observed association to 1.0. In other words, an individual unmeasured confounder is unlikely to explain the observed association.
DISCUSSION
In this nationally representative sample of 67,651 ED visits for AECOPD with acute respiratory failure, we found that NIV use was increasing from 2006 to 2008. However, the utilization of NIV remained low (16% in 2008) and varied widely by patient and hospital characteristic. As with all observational studies, causality cannot be inferred definitely; however, our study suggests that, NIV usecompared with IMV usewas associated with potentially important benefits: a reduction of inpatient mortality by 46%, shortened hospital LOS by 3 days, reduced hospital charges by approximately $35,000 per visit, and modestly reduced risk of iatrogenic pneumothorax.
A recent analysis using the US Nationwide Inpatient Sample has shown increasing use of NIV and concomitant decreasing mortality in AECOPD over time.[28] Our analysis confirmed these favorable trends in the United States using a much larger NEDS sample (28 million visits in the NEDS vs 8 million visits in the Nationwide Inpatient Sample per year). Despite these favorable trends, NIV was still underutilized for AECOPD with respiratory failure in the United States (16% in 2008) compared with major European countries (40%).[29] Although our study lacked clinical details to arrive at the optimal rate of NIV use, the low rate of NIV use is concerning and suggests room for improvement in NIV use in appropriate patients as outlined by the current COPD guidelines.[18, 30] Why is NIV not widely adopted, given its demonstrated efficacy? Previous surveys have identified several perceived reasons for low NIV use, including lack of physician knowledge, insufficient respiratory therapist training, inadequate equipment, and time required for setting up NIV.[29, 31, 32] Our study adds to the literature by showing the actual predictors of NIV use in the real world. Our data showed that the early adopters were hospitals with higher case volumes, and hospitals in the Northeast and in nonmetropolitan areas. A higher case volume has been linked with lower mortality in AECOPD (ie, practice makes perfect),[33] and frequent NIV use could explain the lower AECOPD mortality in highcase volume centers. Alternatively, smaller hospitals tend to have moonlighters working in EDs who may not be board certified in emergency medicine. Perhaps the logical next step is to conduct a qualitative study to understand the specifics of best practices and provider characteristics in these Northeastern, highercase volume centers. Another incentive to promote NIV use in clinical practice is the cost‐effectiveness associated with this intervention, as previous studies have shown that, compared with usual care, receiving NIV was associated with a reduction in costs, mainly through reduced use of the ICU.[34, 35]
Some patient factors associated with NIV use may be well justified. For example, older AECOPD patients may have an advance directive describing their treatment wishes (eg, do‐not‐intubate order),[36] and therefore NIV was preferred to IMV. Also, our data suggested AECOPD patients with a suspected pneumonia component were less likely to be placed on NIV, which is consistent with COPD guideline recommendations.[18, 30] As outlined in the current guidelines, the major contraindications to NIV include impending respiratory arrest, excessive respiratory secretions, massive gastrointestinal bleeding, recent facial trauma, or altered mental status.[18, 30] By contrast, some factors associated with NIV use may be targeted for intervention, such as lower rates of NIV use in the uninsured, patients who live in low‐income neighborhoods, and hospitals in US regions other than the Northeast.
Current guidelines recommend using NIV in AECOPD patients with early signs of respiratory failure, such as arterial pH of 7.257.35 or pCO2 45 mm Hg.[18, 30] When NIV is considered as the modality of ventilatory support, it should probably be used as early as possible,[37] because evidence suggests that delayed use of NIV may lead to severe respiratory acidosis and increased mortality.[38] Other than in ICUs, NIV can be used on general wards and in EDs that have adequate staff training and experience, because the success rates of NIV in these settings are similar to those reported in ICU studies.[8, 36, 39] In addition, NIV is more cost‐effective when performed outside the ICU.[35] In fact, studies have found a substantial portion of patients had NIV started in the ED (one‐fourth) and on the general ward (one‐fourth).[31, 40] Given the shortage of intensivists in the United States, hospitalists begin to play an important role in provision of critical care outside the ICU.[41] Once NIV is used, it is important to ensure that it is delivered effectively and monitored closely because NIV failure has been shown to be associated with high mortality.[28, 42]
This study has some potential limitations. First, we used administrative claims that lack clinical details such as data on arterial blood gases and severity scores, and thus potential residual confounding may exist. In our study, the IMV group may be sicker than the NIV group, which could partially explain the increased mortality with IMV. However, the propensity scores overlap to a great extent between the 2 study groups, suggesting that a strong confounding bias is less likely, given the observed covariates. Furthermore, the instrumental variable and sensitivity analyses taking into account unmeasured confounders still suggested the benefits of NIV. Second, the NEDS does not contain data on the location where NIV was initiated (eg, ED, ward, or ICU) or the timing of initiating NIV or IMV. As a result, for the combined‐use group, we could not further distinguish the group switching from NIV to IMV (ie, NIV failure)[42] or from IMV to NIV (ie, NIV as a weaning strategy).[43] Accordingly, we chose to focus on the comparativeness effectiveness of NIV vs IMV. Third, although the NEDS data have undergone quality‐control procedures,[44] some misclassification may exist in identifying patient population and interventions. Finally, the analysis may not reflect the most recent trend in NIV use, as the 2010 NEDS data have just been released. In addition, although the study is the largest to date on this topic, our findings may not be generalizable to EDs that were not part of the NEDS.
In summary, in this nationally representative ED and inpatient database, NIV use is increasing for AECOPD with acute respiratory failure; however, its adoption remains low and varies widely between US hospitals. Our observational study suggests that NIV appears to be more effective and safer than IMV in the real‐world setting. There is an opportunity to increase the use of NIV as recommended in guidelines and to promote the use NIV in replacement of IMV in patients with severe AECOPD. Given the increasing mortality burden of COPD, such a strategy may help reduce COPD mortality at the population level, thereby fulfilling the objectives of Healthy People 2020.
Disclosure
Partial results from this study were presented at the 2012 Society for Academic Emergency Medicine Annual Meeting, Chicago, Illinois, May 912, 2012. This project was supported by grant number R03HS020722 from the Agency for Healthcare Research and Quality. The content is solely the responsibility of the authors and does not necessarily represent the official views of the Agency for Healthcare Research and Quality. The authors have no conflicts of interest to disclose.
- Centers for Disease Control and Prevention, National Center for Health Statistics. National Vital Statistics Reports, 2011. Deaths: final data for 2008. Available at: http://www.cdc.gov/nchs/data/nvsr/nvsr59/nvsr59_10.pdf. Accessed August 15, 2012.
- , , , . Trends in the leading causes of death in the United States, 1970–2002. JAMA. 2005;294:1255–1259.
- , , . National study of emergency department visits for acute exacerbation of chronic obstructive pulmonary disease. Acad Emerg Med. 2008;15:1275–1283.
- , , , , . Chronic obstructive pulmonary disease surveillance—United States, 1971–2000. MMWR Surveill Summ. 2002;51:1–16.
- US Department of Health and Human Services. Healthy People 2020. Objectives for Respiratory Diseases. Available at: http://www.healthypeople. gov/2020/topicsobjectives2020/objectiveslist.aspx?topicId=36. Accessed May 3, 2012.
- . Mechanical ventilation: invasive versus noninvasive. Eur Respir J Suppl. 2003;47:31s–37s.
- , , , et al. Noninvasive ventilation for acute exacerbations of chronic obstructive pulmonary disease. N Engl J Med. 1995;333:817–822.
- , , . Early use of non‐invasive ventilation for acute exacerbations of chronic obstructive pulmonary disease on general respiratory wards: a multicentre randomised controlled trial. Lancet. 2000;355:1931–1935.
- , , , et al. Randomised controlled trial of nasal ventilation in acute ventilatory failure due to chronic obstructive airways disease. Lancet. 1993;341:1555–1557.
- , , , . Non‐invasive positive pressure ventilation for treatment of respiratory failure due to exacerbations of chronic obstructive pulmonary disease. Cochrane Database Syst Rev. 2004;(3):CD004104.
- , , , et al. Noninvasive vs. conventional mechanical ventilation in patients with chronic obstructive pulmonary disease after failure of medical treatment in the ward: a randomized trial. Intensive Care Med. 2002;28:1701–1707.
- . Noninvasive vs conventional mechanical ventilation in acute respiratory failure: a multicenter, randomized controlled trial. Chest. 2005;128:3916–3924.
- , , , , , . Mechanical ventilation in chronic obstructive pulmonary disease patients, noninvasive vs. invasive method (randomized prospective study). Coll Antropol. 2009;33:791–797.
- , , , et al. Noninvasive Positive‐Pressure Ventilation (NPPV) for Acute Respiratory Failure. Rockville, MD: Agency for Healthcare Research and Quality; July 2012: Report 12‐EHC089‐EF. Available at: http://effectivehealthcareahrqgov/ehc/products/273/1180/CER68_NPPV_FinalReport_20120706pdf. Accessed December 11, 2012.
- Healthcare Cost and Utilization Project (HCUP). HCUP Nationwide Emergency Department Sample (NEDS). Rockville, MD: Agency for Healthcare Research and Quality; 2012. Available at: http://www.hcup‐us.ahrq.gov/nedsoverview.jsp. Accessed April 15, 2012.
- American Hospital Association. Annual survey database. Available at: http://www.ahadata.com/ahadata/html/AHASurvey.html. Accessed April 15, 2012.
- , , , . Age‐related differences in clinical outcomes for acute asthma in the United States, 2006–2008. J Allergy Clin Immunol. 2012;129:1252e1–1258e1.
- Global Initiative for Chronic Obstructive Lung Disease (GOLD). NHLBI/WHO Global Strategy for the Diagnosis, Management and Prevention of COPD. Available at: http://www.goldcopd.org. Accessed April 15, 2012.
- .US Bureau of the Census. Census regions and divisions of the United States. Available at: http://www.census.gov/geo/www/us_regdiv.pdf. Accessed April 9, 2012.
- .Healthcare Cost and Utilization Project. Comorbidity software. Available at: http://www.hcup‐us.ahrq.gov/toolssoftware/comorbidity/comorbidity.jsp. Accessed April 15, 2012.
- , , , . Comorbidity measures for use with administrative data. Med Care. 1998;36:8–27.
- Healthcare Cost and Utilization Project (HCUP). HCUP Methods Series. Hierarchical Modeling Using HCUP Data. Rockville, MD: Agency for Healthcare Research and Quality; 2012: Report 2007‐01. Available at: http://www.hcup‐us.ahrq.gov/reports/methods/2007_01.pdf. Accessed April 15, 2012.
- , , . Indications for propensity scores and review of their use in pharmacoepidemiology. Basic Clin Pharmacol Toxicol. 2006;98:253–259.
- , , , , , . Antibiotic therapy and treatment failure in patients hospitalized for acute exacerbations of chronic obstructive pulmonary disease. JAMA. 2010;303:2035–2042.
- . An introduction to propensity score methods for reducing the effects of confounding in observational studies. Multivariate Behav Res. 2011;46:399–424.
- , , . Instrumental variable methods in comparative safety and effectiveness research. Pharmacoepidemiol Drug Saf. 2010;19:537–554.
- . Sensitivity analysis and external adjustment for unmeasured confounders in epidemiologic database studies of therapeutics. Pharmacoepidemiol Drug Saf. 2006;15:291–303.
- , , , et al. Outcomes of noninvasive ventilation for acute exacerbations of chronic obstructive pulmonary disease in the United States, 1998–2008. Am J Respir Crit Care Med. 2012;185:152–159.
- , , , , . A European survey of noninvasive ventilation practices. Eur Respir J. 2010;36:362–369.
- , . Standards for the diagnosis and treatment of patients with COPD: a summary of the ATS/ERS position paper. Eur Respir J. 2004;23:932–946.
- , , , . Utilization of noninvasive ventilation in acute care hospitals: a regional survey. Chest. 2006;129:1226–1233.
- , , . A survey of the use of noninvasive ventilation in academic emergency departments in the United States. Respir Care. 2009;54:1306–1312.
- , , . Emergency department case volume and patient outcomes in acute exacerbations of chronic obstructive pulmonary disease. Acad Emerg Med. 2012;19:656–663.
- , , , , . Noninvasive positive pressure ventilation in the setting of severe, acute exacerbations of chronic obstructive pulmonary disease: more effective and less expensive. Crit Care Med. 2000;28:2094–2102.
- , , , . Cost effectiveness of ward based non‐invasive ventilation for acute exacerbations of chronic obstructive pulmonary disease: economic analysis of randomised controlled trial. BMJ. 2003;326:956.
- , , . Noninvasive positive pressure ventilation reverses acute respiratory failure in select “do‐not‐intubate” patients. Crit Care Med. 2005;33:1976–1982.
- , . Noninvasive ventilation for acute exacerbations of chronic obstructive pulmonary disease: “Don't think twice, it's alright!”. Am J Respir Crit Care Med. 2012;185:121–123.
- , , , , . Acidosis, non‐invasive ventilation and mortality in hospitalised COPD exacerbations. Thorax. 2011;66:43–48.
- , , , , . Use of noninvasive positive‐pressure ventilation on the regular hospital ward: experience and correlates of success. Respir Care. 2006;51:1237–1243.
- , , , et al. Bilevel noninvasive positive pressure ventilation for acute respiratory failure: survey of Ontario practice. Crit Care Med. 2005;33:1477–1483.
- . Hospitalists and intensivists: partners in caring for the critically ill—the time has come. J Hosp Med. 2010;5:1–3.
- , , , , , . Incidence and causes of non‐invasive mechanical ventilation failure after initial success. Thorax. 2000;55:819–825.
- , , , . Noninvasive positive pressure ventilation as a weaning strategy for intubated adults with respiratory failure. Cochrane Database Syst Rev. 2010:CD004127.
- Healthcare Cost and Utilization Project (HCUP). HCUP Quality Control Procedures. Rockville, MD: Agency for Healthcare Research and Quality; 2012. Available at: http://www.hcup‐us.ahrq.gov/db/quality.jsp. Accessed December 15, 2012.
Chronic obstructive pulmonary disease (COPD) is now the third leading cause of death in the United States,[1] and its rising mortality trend is unique among the top 5 causes of death.[2] Acute exacerbations of COPD (AECOPD) are important events in the natural history of COPD, accounting for 1.5 million emergency department (ED) visits and 726,000 hospitalizations each year in the United States.[3, 4] Given the significant morbidity and mortality from AECOPD, Healthy People 2020 lists reducing deaths, hospitalizations, and ED visits as the key objectives for COPD.[5]
Over the past 2 decades, noninvasive ventilation (NIV) has emerged as a potentially useful treatment modality in AECOPD patients with acute respiratory failure. Noninvasive ventilation commonly refers to positive‐pressure ventilatory support delivered through a nasal or full‐face mask, such as bilevel positive airway pressure.[6] A number of randomized controlled trials[7, 8, 9] and meta‐analyses[10] have suggested a mortality‐reduction benefit with NIV use compared with standard medical care in AECOPD. To our knowledge, however, very few small randomized controlled trials compared NIV vs invasive mechanical ventilation (IMV) head‐to‐head,[11, 12, 13] and a recent evidence review found only 5 studies (405 subjects) on this topic.[14] Collectively, the limited evidence from randomized trials showed that NIV use resulted in similar intensive care unit (ICU) and in‐hospital mortality, fewer complications (eg, ventilator‐associated pneumonia and sepsis), and shorter hospital length of stays (LOS). Given that these trials have a smaller sample size and tend to exclude older patient (age >75 years) or patients with multiple comorbidities, there is a need to better understand the adoption and effectiveness of NIV treatment for AECOPD in a much larger patient population in the real‐world setting using observational data.
To address these knowledge gaps in the literature, we analyzed data from a large, nationally representative ED and inpatient sample. The objective of the present analysis was 2‐fold: (1) to characterize the use of NIV and IMV in AECOPD patients with acute respiratory failure at a national level; and (2) to compare the effectiveness of NIV vs IMV in the real‐world setting.
METHODS
Study Design and Setting
We conducted a retrospective cohort study using data from the 20062008 Nationwide Emergency Department Sample (NEDS),[15] a component of the Healthcare Cost and Utilization Project sponsored by the Agency for Healthcare Research and Quality. The NEDS is nationally representative of all community hospitalbased EDs in the United States, defined by the American Hospital Association as all nonfederal, short‐term, general, and other specialty hospitals.[16] Community hospitals include academic medical centers if they are nonfederal short‐term hospitals. The NEDS was constructed using administrative records from the State Emergency Department Databases and the State Inpatient Databases. The former captures information on ED visits that do not result in an admission (ie, treat‐and‐release visits or transfers to another hospital); the latter contains information on patients initially seen in the ED and then admitted to the same hospital. Taken together, the resulting NEDS represents all ED visits regardless of disposition and contains information on short‐term outcomes for patients admitted through the ED. In other words, the NEDS is the largest all‐payer ED and inpatient database in the United States. The NEDS represents an approximately 20% stratified sample of US hospital‐based EDs, containing more than 28 million records of ED visits from approximately 1000 hospitals each year. Additional details of the NEDS can be found elsewhere.[15, 17] We received a waiver for this analysis from our institutional review board.
Study Population
Patient visits were included in this analysis if they carried any COPD‐related diagnostic code (ie, International Classification of Diseases, Ninth Revision, Clinical Modification [ICD‐9‐CM] code of 491.xx [chronic bronchitis], 492.xx [emphysema], or 496.xx [chronic airway obstruction, not elsewhere classified]) as their primary ED diagnosis and any acute respiratory failure code (ie, 518.81 [acute respiratory failure], 518.82 [pulmonary insufficiency not elsewhere classified, 518.84 [acute and chronic respiratory failure], or 799.1 [respiratory arrest]) as their secondary diagnosis. Patient visits with a primary diagnosis of acute respiratory failure and a secondary diagnosis of COPD were also included. Patients age <40 years were excluded, because they are much less likely to have COPD.[18]
Modes of Mechanical Ventilation
The primary exposure variable was mode of mechanical ventilation. To compare the effectiveness of different ventilatory modes, patients were divided into 3 groups according to the ventilation mode they received: (1) NIV alone, (2) IMV alone, and (3) combined modes of NIV and IMV. The use of NIV was identified by using Current Procedural Terminology (CPT) code of 94660 or ICD‐9 procedure code 93.90, whereas the use of IMV was identified by using CPT code of 31500 or ICD‐9 procedure code 96.04 or 96.7x.
Patient‐Level and Emergency DepartmentLevel Variables
The NEDS contains information on patient demographics, national quartiles for median household income based on the patient's ZIP code, payment sources, ICD‐9‐CM diagnoses and procedures, ED disposition, hospital LOS, and hospital disposition. Hospital characteristics include annual visit volume, urban‐rural status, ownership, teaching status, and US region. Geographic regions (Northeast, South, Midwest, and West) were defined according to Census Bureau boundaries.[19] To adjust for confounding by patient mix, Elixhauser comorbidity measures were derived based on the ICD‐9 codes, using the Agency for Healthcare Research and Quality's Comorbidity Software.[20] This risk‐adjustment tool has been derived and validated extensively.[21]
Outcome Measures
The outcome measures were all‐cause inpatient mortality, hospital LOS, hospital charges, and ventilator‐related complications. Three ventilator‐related complications were identified using ICD‐9 procedure codes: ventilator‐associated pneumonia (997.31), facial injury (910.x), and iatrogenic pneumothorax (512.1).
Statistical Analysis
Summary statistics are presented as proportions (with 95% confidence intervals [CI]), means (with standard deviations [SD]), or medians (with interquartile ranges). Bivariate associations were examined using Student t tests, Kruskal‐Wallis tests, and [2] tests, as appropriate. Emergency department and discharge weights were used to obtain national estimates at the ED and visit level. At all other times (eg, the propensity score and instrumental variable analyses), the unweighted cohort was analyzed, because survey weights are generally not advised for propensity score analysis using complex survey data.[22]
Propensity Score Analysis
To adjust for baseline patient and ED characteristics that may have confounded the relationship between ventilation mode and clinical outcomes, we performed propensity score and instrumental variable analyses. To compare the effectiveness of NIV vs IMV, a propensity score or predicted probability of NIV was estimated using a logistic‐regression model with all patient characteristics (age, sex, quartiles for median household income, weekend admission, insurance status, season, calendar year, and comorbid conditions) and ED characteristics (urban/rural and teaching status, US region, annual ED volume, and annual volume of AECOPD with respiratory failure) as the independent variables. We then performed 1:1 propensity score matching based on a nearest‐neighbor algorithm with caliper distance of 0.01. Although propensity score matching may result in a smaller sample, it provides a clinically relevant estimate of treatment effect because subjects in the matched sample are potential candidates for either treatment option.[23, 24] An absolute standardized difference between characteristics of <10% was considered as adequate balance.[25]
Instrumental Variable Analysis
When hospitals always or nearly always use NIV or IMV, this suggests the choice is largely independent of patient characteristics, and it is possible to use the hospital preference as a proxy for the actual treatment choice (ie, an instrument variable). The instrumental variable analysis simulates a natural randomization of patients to 2 hospital groups with high and low NIV use.
The main difference between instrumental variable and propensity score analysis is that the former could potentially adjust for unmeasured confounders.[26] We used Stata procedure IVREG to estimate the outcome differences between NIV‐preferring hospitals (NIV use in 90% of patients) and IMV‐preferring hospitals (NIV use in 10% of patients).
All odds ratios (ORs) and ‐coefficients are presented with 95% CIs. All analyses were performed using Stata 12.0 software (StataCorp, College Station, TX). All P values are 2‐sided, with P<0.05 considered statistically significant.
Sensitivity Analyses
We conducted a sensitivity analysis to determine whether it was plausible that an unmeasured confounder could completely explain the observed results. The risk ratio of a hypothetical unmeasured confounder on study outcome and the exposure‐confounder imbalance were both varied to see at what point the observed association was reduced to 1.0.[27]
RESULTS
Patient and ED Characteristics
The 20062008 NEDS sample contained 67,651 ED visits for AECOPD with acute respiratory failure from 1594 US EDs. After the weighting procedure, there were an estimated 101,000 visits annually for AECOPD with acute respiratory failure from approximately 4700 US EDs. In the weighted analysis, the mean patient age of these visits was 68 years, and 56% were made by women. Ninety‐six percent were admitted to the hospital. Of these, the mortality rate was 9% and the mean hospital LOS was 7 days. Figure 1 shows the secular trends in NIV, IMV, and the combined use over the 3‐year study period. Use of IMV decreased from 28% in 2006 to 19% in 2008 (P<0.001), whereas NIV use increased slightly from 14% in 2006 to 16% in 2008 (P=0.049); the combined use of both ventilation modalities remained stable (4%). Inpatient mortality decreased from 10% in 2006 to 7% in 2008 (P<0.001).
Figure 2 shows that the frequency of NIV use (including combined use of NIV and IMV) varied widely between hospitals, ranging from 0% to 100% with a median of 11%. In the unweighted cohort of AECOPD with acute respiratory failure, 43% received some forms of ventilatory support. Table 1 shows the patient and hospital characteristics of the patients receiving ventilatory support: 36% received NIV, 56% received IMV, and 8% received combined use. In general, patients receiving combined use of NIV and IMV tended to have more comorbidities (eg, congestive heart failure and pneumonia) compared with the NIV‐alone or IMV‐alone groups. With respect to hospital characteristics, NIV was used more often in hospitals with higher volumes of COPD exacerbation and respiratory failure, in nonmetropolitan hospitals, and in hospitals in the Northeast.
| NIV Alone (A) (n=10,032) | IMV Alone (B) (n=15,427) | Combined Use (C) (n=2311) | P Value, A vs B | P Value, B vs C | |
|---|---|---|---|---|---|
| |||||
| Patient characteristics | |||||
| Age, y, | <0.001 | 0.64 | |||
| 4049 | 5 | 5 | 5 | ||
| 5059 | 17 | 18 | 19 | ||
| 6069 | 31 | 33 | 33 | ||
| 7079 | 30 | 29 | 29 | ||
| 80 | 17 | 15 | 13 | ||
| Female sex, % | 57 | 53 | 54 | <0.001 | 0.87 |
| Quartile for median household income of patient ZIP code, $, % | <0.001 | <0.001 | |||
| 138,999 | 30 | 34 | 29 | ||
| 39,00047,999 | 28 | 28 | 28 | ||
| 48,00062,999 | 24 | 22 | 24 | ||
| 63,000 | 18 | 15 | 19 | ||
| Weekend admission, % | 27 | 28 | 28 | 0.07 | 0.80 |
| Insurance status, % | <0.001 | 0.91 | |||
| Medicare | 74 | 70 | 70 | ||
| Medicaid | 9 | 12 | 12 | ||
| Private | 12 | 13 | 13 | ||
| Self‐pay | 2 | 3 | 2 | ||
| Other | 2 | 2 | 2 | ||
| Season, % | <0.001 | 0.16 | |||
| Winter (January 1March 31) | 29 | 32 | 31 | ||
| Spring (April 1June 30) | 24 | 25 | 26 | ||
| Summer (July 1September 30) | 22 | 20 | 19 | ||
| Fall (October 1December 31) | 25 | 22 | 24 | ||
| No. of comorbidities, median (IQR) | 4 (35) | 4 (35) | 4 (36) | <0.001 | <0.001 |
| Selected comorbidities, % | |||||
| Hypertension | 56 | 55 | 55 | 0.01 | 0.65 |
| CHF | 38 | 40 | 44 | 0.001 | <0.001 |
| Fluid and electrolyte disorders | 37 | 44 | 49 | <0.001 | <0.001 |
| Diabetes, uncomplicated | 27 | 26 | 29 | 0.04 | 0.002 |
| Pneumonia | 19 | 34 | 39 | <0.001 | <0.001 |
| Deficiency anemia | 16 | 19 | 19 | <0.001 | 0.39 |
| Obesity | 18 | 12 | 17 | <0.001 | <0.001 |
| Depression | 15 | 11 | 11 | <0.001 | 0.54 |
| Pulmonary circulatory diseases | 15 | 11 | 14 | <0.001 | <0.001 |
| Hospital characteristics | |||||
| Annual ED visit volume, median (IQR) | 42,704 (29,50562,470) | 44,119 (29,89564,097) | 46,695 (31,29866,235) | 0.02 | 0.0003 |
| Annual ED volume of COPD exacerbation with respiratory failure, median (IQR) | 45 (2672) | 42 (2368) | 38 (2364) | <0.001 | <0.001 |
| Urban/rural and teaching status, % | <0.001 | <0.001 | |||
| Metropolitan nonteaching | 53 | 52 | 47 | ||
| Metropolitan teaching | 31 | 35 | 39 | ||
| Nonmetropolitan | 16 | 13 | 13 | ||
| US region, % | <0.001 | <0.001 | |||
| Northeast | 28 | 16 | 36 | ||
| Midwest | 17 | 22 | 15 | ||
| South | 41 | 45 | 32 | ||
| West | 14 | 17 | 17 | ||
The unadjusted differences in outcomes are shown in Table 2. The combined‐use group had the highest inpatient mortality, longest LOS, and highest charges, followed by the IMV and NIV groups. In general, complications were few across all 3 groups, but the rate of iatrogenic pneumothorax was notably lower in the NIV group. Table 3 details the statistically significant predictors of NIV use in the propensity score model. Similar to the unadjusted analysis, older age, high‐income neighborhoods, Medicare insurance, and some comorbidities were positively associated with NIV use (eg, pulmonary circulatory disorders and liver disease), whereas a few comorbidities were negatively associated with NIV use (eg, pneumonia, and alcohol and drug abuse). With respect to hospital characteristics, higher case volumes of COPD exacerbation/respiratory failure, Northeastern and nonmetropolitan hospitals, and more recent years were associated with NIV use.
| Outcome | NIV Alone (A) (n=10,032) | IMV Alone (B) (n=15,427) | Combined Use (C) (n=2311) | P Value. A vs B | P Value, B vs C |
|---|---|---|---|---|---|
| |||||
| Inpatient mortality, n (%) | 825 (8) | 2,454 (16) | 407 (18) | <0.001 | 0.04 |
| Hospital length of stay, median (IQR), d | 5 (48) | 8 (513) | 10 (716) | <0.001 | <0.001 |
| Hospital charge per visit, median (IQR), $ | 26,002 (15,74744,638) | 53,432 (31,99892,664) | 64,585 (39,024110,336) | <0.001 | <0.001 |
| Complications* | |||||
| Ventilator‐associated pneumonia, n (%) | 10 (0.1) | 10 (0.1) | 10 (0.5) | 0.09 | 1.00 |
| Facial injury, n (%) | 10 (0.1) | 10 (0.1) | 10 (0.5) | 0.26 | 1.00 |
| Iatrogenic pneumothorax, n (%) | 10 (0.1) | 90 (0.6) | 14 (0.6) | <0.001 | 0.90 |
| Patient Characteristics | Adjusted OR (95% CI)* | P Value |
|---|---|---|
| ||
| Age, y | ||
| 4049 | 1.00 (Reference) | |
| 5059 | 0.96 (0.84‐1.11) | 0.61 |
| 6069 | 0.96 (0.84‐1.10) | 0.56 |
| 7079 | 1.09 (0.94‐1.25) | 0.25 |
| 80 | 1.30 (1.12‐1.52) | 0.001 |
| Quartile for median household income of patient ZIP code, $ | ||
| 138,999 | 1.00 (Reference) | |
| 39,00047,999 | 1.13 (1.05‐1.21) | 0.001 |
| 48,00062,999 | 1.21 (1.12‐1.30) | <0.001 |
| 63,000 | 1.21 (1.11‐1.32) | <0.001 |
| Insurance status | ||
| Medicare | 1.00 (Reference) | |
| Medicaid | 0.79 (0.72‐0.88) | <0.001 |
| Private | 0.88 (0.81‐0.96) | 0.004 |
| Self‐pay | 0.68 (0.56‐0.82) | <0.001 |
| Other | 0.88 (0.73‐1.07) | 0.22 |
| Season | ||
| Winter (January 1March 31) | 1.00 (Reference) | |
| Spring (April 1June 30) | 1.06 (0.99‐1.14) | 0.11 |
| Summer (July 1September 30) | 1.17 (1.08‐1.26) | <0.001 |
| Fall (October 1December 31) | 1.24 (1.15‐1.33) | <0.001 |
| Comorbidity | ||
| CHF | 0.90 (0.85‐0.95) | <0.001 |
| Pulmonary circulatory disorders | 1.40 (1.29‐1.52) | <0.001 |
| Diabetes, complicated | 1.25 (1.08‐1.44) | 0.002 |
| Liver disease | 1.79 (1.40‐2.28) | <0.001 |
| Coagulopathy | 0.54 (0.46‐0.63) | <0.001 |
| Obesity | 1.52 (1.41‐1.65) | <0.001 |
| Weight loss | 0.50 (0.44‐0.57) | <0.001 |
| Fluid and electrolyte disorders | 0.84 (0.80‐0.89) | <0.001 |
| Deficiency anemia | 0.83 (0.78‐0.90) | <0.001 |
| Alcohol abuse | 0.66 (0.58‐0.76) | <0.001 |
| Drug abuse | 0.74 (0.62‐0.88) | 0.001 |
| Psychoses | 1.22 (1.10‐1.37) | <0.001 |
| Depression | 1.45 (1.34‐1.57) | <0.001 |
| Pneumonia | 0.48 (0.45‐0.51) | <0.001 |
| Valvular heart disease | 0.87 (0.77‐0.97) | 0.01 |
| Neurological disorders | 0.89 (0.80‐0.98) | 0.02 |
| RA/collagen vascular diseases | 1.25 (1.02‐1.53) | 0.04 |
| Blood‐loss anemia | 0.72 (0.53‐0.97) | 0.03 |
| Hospital characteristics | ||
| Annual ED visit volume, per 1000‐visit increase | 0.997 (0.996‐0.998) | <0.001 |
| Annual ED volume of COPD exacerbation with respiratory failure, per 10‐visit increase | 1.03 (1.02‐1.03) | <0.001 |
| Urban/rural and teaching status | ||
| Metropolitan nonteaching | 1.00 (Reference) | |
| Metropolitan teaching | 0.91 (0.85‐0.97) | 0.006 |
| Nonmetropolitan | 1.30 (1.20‐1.42) | <0.001 |
| US region | ||
| Northeast | 1.00 (Reference) | |
| Midwest | 0.44 (0.40‐0.48) | <0.001 |
| South | 0.54 (0.50‐0.58) | <0.001 |
| West | 0.51 (0.46‐0.56) | <0.001 |
| Calendar year | ||
| 2006 | 1.00 (Reference) | |
| 2007 | 1.30 (1.22‐1.39) | <0.001 |
| 2008 | 1.65 (1.54‐1.76) | <0.001 |
In terms of propensity score distributions (see Supporting Information, Figure E1, in the online version of this article), there was sufficient overlap of the NIV and IMV groups. After matching on propensity score for the NIV and IMV groups, the differences in baseline characteristics were all balanced (see Supporting Information, Table E1, in the online version of this article), as indicated by <10% standardized differences in all covariates between the 2 groups. Finally, in the propensity scorematched cohort (see Supporting Information, Table E2, in the online version of this article), NIV use remained associated with significantly lower inpatient mortality (risk ratio: 0.54; 95% CI: 0.50‐0.59, P<0.001), a shorter hospital LOS (mean difference, 3.2 days; 95% CI: 3.4 to 2.9 days, P<0.001), and lower hospital charges (mean difference, P<$35,012; 95% CI: $36,848 to $33,176, P<0.001), compared with IMV use. Use of NIV also was associated with a lower rate of iatrogenic pneumothorax than IMV use (0.05% vs 0.5%, P<0.001).
Using hospital preference for NIV vs IMV as an instrument, the instrumental analysis confirmed the benefits of NIV use, with a 5% reduction in inpatient mortality in the NIV‐preferring hospitals (risk difference, P<5%; 95% CI: P<1.8% to P<8.3%).
In the sensitivity analysis to assess the impact of an unmeasured confounder, the confounder would have had to have a very strong impact on outcome (risk ratio: 5) and a severe exposure‐confounder imbalance (odds ratio of exposure on confounder: 5) to reduce the observed association to 1.0. In other words, an individual unmeasured confounder is unlikely to explain the observed association.
DISCUSSION
In this nationally representative sample of 67,651 ED visits for AECOPD with acute respiratory failure, we found that NIV use was increasing from 2006 to 2008. However, the utilization of NIV remained low (16% in 2008) and varied widely by patient and hospital characteristic. As with all observational studies, causality cannot be inferred definitely; however, our study suggests that, NIV usecompared with IMV usewas associated with potentially important benefits: a reduction of inpatient mortality by 46%, shortened hospital LOS by 3 days, reduced hospital charges by approximately $35,000 per visit, and modestly reduced risk of iatrogenic pneumothorax.
A recent analysis using the US Nationwide Inpatient Sample has shown increasing use of NIV and concomitant decreasing mortality in AECOPD over time.[28] Our analysis confirmed these favorable trends in the United States using a much larger NEDS sample (28 million visits in the NEDS vs 8 million visits in the Nationwide Inpatient Sample per year). Despite these favorable trends, NIV was still underutilized for AECOPD with respiratory failure in the United States (16% in 2008) compared with major European countries (40%).[29] Although our study lacked clinical details to arrive at the optimal rate of NIV use, the low rate of NIV use is concerning and suggests room for improvement in NIV use in appropriate patients as outlined by the current COPD guidelines.[18, 30] Why is NIV not widely adopted, given its demonstrated efficacy? Previous surveys have identified several perceived reasons for low NIV use, including lack of physician knowledge, insufficient respiratory therapist training, inadequate equipment, and time required for setting up NIV.[29, 31, 32] Our study adds to the literature by showing the actual predictors of NIV use in the real world. Our data showed that the early adopters were hospitals with higher case volumes, and hospitals in the Northeast and in nonmetropolitan areas. A higher case volume has been linked with lower mortality in AECOPD (ie, practice makes perfect),[33] and frequent NIV use could explain the lower AECOPD mortality in highcase volume centers. Alternatively, smaller hospitals tend to have moonlighters working in EDs who may not be board certified in emergency medicine. Perhaps the logical next step is to conduct a qualitative study to understand the specifics of best practices and provider characteristics in these Northeastern, highercase volume centers. Another incentive to promote NIV use in clinical practice is the cost‐effectiveness associated with this intervention, as previous studies have shown that, compared with usual care, receiving NIV was associated with a reduction in costs, mainly through reduced use of the ICU.[34, 35]
Some patient factors associated with NIV use may be well justified. For example, older AECOPD patients may have an advance directive describing their treatment wishes (eg, do‐not‐intubate order),[36] and therefore NIV was preferred to IMV. Also, our data suggested AECOPD patients with a suspected pneumonia component were less likely to be placed on NIV, which is consistent with COPD guideline recommendations.[18, 30] As outlined in the current guidelines, the major contraindications to NIV include impending respiratory arrest, excessive respiratory secretions, massive gastrointestinal bleeding, recent facial trauma, or altered mental status.[18, 30] By contrast, some factors associated with NIV use may be targeted for intervention, such as lower rates of NIV use in the uninsured, patients who live in low‐income neighborhoods, and hospitals in US regions other than the Northeast.
Current guidelines recommend using NIV in AECOPD patients with early signs of respiratory failure, such as arterial pH of 7.257.35 or pCO2 45 mm Hg.[18, 30] When NIV is considered as the modality of ventilatory support, it should probably be used as early as possible,[37] because evidence suggests that delayed use of NIV may lead to severe respiratory acidosis and increased mortality.[38] Other than in ICUs, NIV can be used on general wards and in EDs that have adequate staff training and experience, because the success rates of NIV in these settings are similar to those reported in ICU studies.[8, 36, 39] In addition, NIV is more cost‐effective when performed outside the ICU.[35] In fact, studies have found a substantial portion of patients had NIV started in the ED (one‐fourth) and on the general ward (one‐fourth).[31, 40] Given the shortage of intensivists in the United States, hospitalists begin to play an important role in provision of critical care outside the ICU.[41] Once NIV is used, it is important to ensure that it is delivered effectively and monitored closely because NIV failure has been shown to be associated with high mortality.[28, 42]
This study has some potential limitations. First, we used administrative claims that lack clinical details such as data on arterial blood gases and severity scores, and thus potential residual confounding may exist. In our study, the IMV group may be sicker than the NIV group, which could partially explain the increased mortality with IMV. However, the propensity scores overlap to a great extent between the 2 study groups, suggesting that a strong confounding bias is less likely, given the observed covariates. Furthermore, the instrumental variable and sensitivity analyses taking into account unmeasured confounders still suggested the benefits of NIV. Second, the NEDS does not contain data on the location where NIV was initiated (eg, ED, ward, or ICU) or the timing of initiating NIV or IMV. As a result, for the combined‐use group, we could not further distinguish the group switching from NIV to IMV (ie, NIV failure)[42] or from IMV to NIV (ie, NIV as a weaning strategy).[43] Accordingly, we chose to focus on the comparativeness effectiveness of NIV vs IMV. Third, although the NEDS data have undergone quality‐control procedures,[44] some misclassification may exist in identifying patient population and interventions. Finally, the analysis may not reflect the most recent trend in NIV use, as the 2010 NEDS data have just been released. In addition, although the study is the largest to date on this topic, our findings may not be generalizable to EDs that were not part of the NEDS.
In summary, in this nationally representative ED and inpatient database, NIV use is increasing for AECOPD with acute respiratory failure; however, its adoption remains low and varies widely between US hospitals. Our observational study suggests that NIV appears to be more effective and safer than IMV in the real‐world setting. There is an opportunity to increase the use of NIV as recommended in guidelines and to promote the use NIV in replacement of IMV in patients with severe AECOPD. Given the increasing mortality burden of COPD, such a strategy may help reduce COPD mortality at the population level, thereby fulfilling the objectives of Healthy People 2020.
Disclosure
Partial results from this study were presented at the 2012 Society for Academic Emergency Medicine Annual Meeting, Chicago, Illinois, May 912, 2012. This project was supported by grant number R03HS020722 from the Agency for Healthcare Research and Quality. The content is solely the responsibility of the authors and does not necessarily represent the official views of the Agency for Healthcare Research and Quality. The authors have no conflicts of interest to disclose.
Chronic obstructive pulmonary disease (COPD) is now the third leading cause of death in the United States,[1] and its rising mortality trend is unique among the top 5 causes of death.[2] Acute exacerbations of COPD (AECOPD) are important events in the natural history of COPD, accounting for 1.5 million emergency department (ED) visits and 726,000 hospitalizations each year in the United States.[3, 4] Given the significant morbidity and mortality from AECOPD, Healthy People 2020 lists reducing deaths, hospitalizations, and ED visits as the key objectives for COPD.[5]
Over the past 2 decades, noninvasive ventilation (NIV) has emerged as a potentially useful treatment modality in AECOPD patients with acute respiratory failure. Noninvasive ventilation commonly refers to positive‐pressure ventilatory support delivered through a nasal or full‐face mask, such as bilevel positive airway pressure.[6] A number of randomized controlled trials[7, 8, 9] and meta‐analyses[10] have suggested a mortality‐reduction benefit with NIV use compared with standard medical care in AECOPD. To our knowledge, however, very few small randomized controlled trials compared NIV vs invasive mechanical ventilation (IMV) head‐to‐head,[11, 12, 13] and a recent evidence review found only 5 studies (405 subjects) on this topic.[14] Collectively, the limited evidence from randomized trials showed that NIV use resulted in similar intensive care unit (ICU) and in‐hospital mortality, fewer complications (eg, ventilator‐associated pneumonia and sepsis), and shorter hospital length of stays (LOS). Given that these trials have a smaller sample size and tend to exclude older patient (age >75 years) or patients with multiple comorbidities, there is a need to better understand the adoption and effectiveness of NIV treatment for AECOPD in a much larger patient population in the real‐world setting using observational data.
To address these knowledge gaps in the literature, we analyzed data from a large, nationally representative ED and inpatient sample. The objective of the present analysis was 2‐fold: (1) to characterize the use of NIV and IMV in AECOPD patients with acute respiratory failure at a national level; and (2) to compare the effectiveness of NIV vs IMV in the real‐world setting.
METHODS
Study Design and Setting
We conducted a retrospective cohort study using data from the 20062008 Nationwide Emergency Department Sample (NEDS),[15] a component of the Healthcare Cost and Utilization Project sponsored by the Agency for Healthcare Research and Quality. The NEDS is nationally representative of all community hospitalbased EDs in the United States, defined by the American Hospital Association as all nonfederal, short‐term, general, and other specialty hospitals.[16] Community hospitals include academic medical centers if they are nonfederal short‐term hospitals. The NEDS was constructed using administrative records from the State Emergency Department Databases and the State Inpatient Databases. The former captures information on ED visits that do not result in an admission (ie, treat‐and‐release visits or transfers to another hospital); the latter contains information on patients initially seen in the ED and then admitted to the same hospital. Taken together, the resulting NEDS represents all ED visits regardless of disposition and contains information on short‐term outcomes for patients admitted through the ED. In other words, the NEDS is the largest all‐payer ED and inpatient database in the United States. The NEDS represents an approximately 20% stratified sample of US hospital‐based EDs, containing more than 28 million records of ED visits from approximately 1000 hospitals each year. Additional details of the NEDS can be found elsewhere.[15, 17] We received a waiver for this analysis from our institutional review board.
Study Population
Patient visits were included in this analysis if they carried any COPD‐related diagnostic code (ie, International Classification of Diseases, Ninth Revision, Clinical Modification [ICD‐9‐CM] code of 491.xx [chronic bronchitis], 492.xx [emphysema], or 496.xx [chronic airway obstruction, not elsewhere classified]) as their primary ED diagnosis and any acute respiratory failure code (ie, 518.81 [acute respiratory failure], 518.82 [pulmonary insufficiency not elsewhere classified, 518.84 [acute and chronic respiratory failure], or 799.1 [respiratory arrest]) as their secondary diagnosis. Patient visits with a primary diagnosis of acute respiratory failure and a secondary diagnosis of COPD were also included. Patients age <40 years were excluded, because they are much less likely to have COPD.[18]
Modes of Mechanical Ventilation
The primary exposure variable was mode of mechanical ventilation. To compare the effectiveness of different ventilatory modes, patients were divided into 3 groups according to the ventilation mode they received: (1) NIV alone, (2) IMV alone, and (3) combined modes of NIV and IMV. The use of NIV was identified by using Current Procedural Terminology (CPT) code of 94660 or ICD‐9 procedure code 93.90, whereas the use of IMV was identified by using CPT code of 31500 or ICD‐9 procedure code 96.04 or 96.7x.
Patient‐Level and Emergency DepartmentLevel Variables
The NEDS contains information on patient demographics, national quartiles for median household income based on the patient's ZIP code, payment sources, ICD‐9‐CM diagnoses and procedures, ED disposition, hospital LOS, and hospital disposition. Hospital characteristics include annual visit volume, urban‐rural status, ownership, teaching status, and US region. Geographic regions (Northeast, South, Midwest, and West) were defined according to Census Bureau boundaries.[19] To adjust for confounding by patient mix, Elixhauser comorbidity measures were derived based on the ICD‐9 codes, using the Agency for Healthcare Research and Quality's Comorbidity Software.[20] This risk‐adjustment tool has been derived and validated extensively.[21]
Outcome Measures
The outcome measures were all‐cause inpatient mortality, hospital LOS, hospital charges, and ventilator‐related complications. Three ventilator‐related complications were identified using ICD‐9 procedure codes: ventilator‐associated pneumonia (997.31), facial injury (910.x), and iatrogenic pneumothorax (512.1).
Statistical Analysis
Summary statistics are presented as proportions (with 95% confidence intervals [CI]), means (with standard deviations [SD]), or medians (with interquartile ranges). Bivariate associations were examined using Student t tests, Kruskal‐Wallis tests, and [2] tests, as appropriate. Emergency department and discharge weights were used to obtain national estimates at the ED and visit level. At all other times (eg, the propensity score and instrumental variable analyses), the unweighted cohort was analyzed, because survey weights are generally not advised for propensity score analysis using complex survey data.[22]
Propensity Score Analysis
To adjust for baseline patient and ED characteristics that may have confounded the relationship between ventilation mode and clinical outcomes, we performed propensity score and instrumental variable analyses. To compare the effectiveness of NIV vs IMV, a propensity score or predicted probability of NIV was estimated using a logistic‐regression model with all patient characteristics (age, sex, quartiles for median household income, weekend admission, insurance status, season, calendar year, and comorbid conditions) and ED characteristics (urban/rural and teaching status, US region, annual ED volume, and annual volume of AECOPD with respiratory failure) as the independent variables. We then performed 1:1 propensity score matching based on a nearest‐neighbor algorithm with caliper distance of 0.01. Although propensity score matching may result in a smaller sample, it provides a clinically relevant estimate of treatment effect because subjects in the matched sample are potential candidates for either treatment option.[23, 24] An absolute standardized difference between characteristics of <10% was considered as adequate balance.[25]
Instrumental Variable Analysis
When hospitals always or nearly always use NIV or IMV, this suggests the choice is largely independent of patient characteristics, and it is possible to use the hospital preference as a proxy for the actual treatment choice (ie, an instrument variable). The instrumental variable analysis simulates a natural randomization of patients to 2 hospital groups with high and low NIV use.
The main difference between instrumental variable and propensity score analysis is that the former could potentially adjust for unmeasured confounders.[26] We used Stata procedure IVREG to estimate the outcome differences between NIV‐preferring hospitals (NIV use in 90% of patients) and IMV‐preferring hospitals (NIV use in 10% of patients).
All odds ratios (ORs) and ‐coefficients are presented with 95% CIs. All analyses were performed using Stata 12.0 software (StataCorp, College Station, TX). All P values are 2‐sided, with P<0.05 considered statistically significant.
Sensitivity Analyses
We conducted a sensitivity analysis to determine whether it was plausible that an unmeasured confounder could completely explain the observed results. The risk ratio of a hypothetical unmeasured confounder on study outcome and the exposure‐confounder imbalance were both varied to see at what point the observed association was reduced to 1.0.[27]
RESULTS
Patient and ED Characteristics
The 20062008 NEDS sample contained 67,651 ED visits for AECOPD with acute respiratory failure from 1594 US EDs. After the weighting procedure, there were an estimated 101,000 visits annually for AECOPD with acute respiratory failure from approximately 4700 US EDs. In the weighted analysis, the mean patient age of these visits was 68 years, and 56% were made by women. Ninety‐six percent were admitted to the hospital. Of these, the mortality rate was 9% and the mean hospital LOS was 7 days. Figure 1 shows the secular trends in NIV, IMV, and the combined use over the 3‐year study period. Use of IMV decreased from 28% in 2006 to 19% in 2008 (P<0.001), whereas NIV use increased slightly from 14% in 2006 to 16% in 2008 (P=0.049); the combined use of both ventilation modalities remained stable (4%). Inpatient mortality decreased from 10% in 2006 to 7% in 2008 (P<0.001).
Figure 2 shows that the frequency of NIV use (including combined use of NIV and IMV) varied widely between hospitals, ranging from 0% to 100% with a median of 11%. In the unweighted cohort of AECOPD with acute respiratory failure, 43% received some forms of ventilatory support. Table 1 shows the patient and hospital characteristics of the patients receiving ventilatory support: 36% received NIV, 56% received IMV, and 8% received combined use. In general, patients receiving combined use of NIV and IMV tended to have more comorbidities (eg, congestive heart failure and pneumonia) compared with the NIV‐alone or IMV‐alone groups. With respect to hospital characteristics, NIV was used more often in hospitals with higher volumes of COPD exacerbation and respiratory failure, in nonmetropolitan hospitals, and in hospitals in the Northeast.
| NIV Alone (A) (n=10,032) | IMV Alone (B) (n=15,427) | Combined Use (C) (n=2311) | P Value, A vs B | P Value, B vs C | |
|---|---|---|---|---|---|
| |||||
| Patient characteristics | |||||
| Age, y, | <0.001 | 0.64 | |||
| 4049 | 5 | 5 | 5 | ||
| 5059 | 17 | 18 | 19 | ||
| 6069 | 31 | 33 | 33 | ||
| 7079 | 30 | 29 | 29 | ||
| 80 | 17 | 15 | 13 | ||
| Female sex, % | 57 | 53 | 54 | <0.001 | 0.87 |
| Quartile for median household income of patient ZIP code, $, % | <0.001 | <0.001 | |||
| 138,999 | 30 | 34 | 29 | ||
| 39,00047,999 | 28 | 28 | 28 | ||
| 48,00062,999 | 24 | 22 | 24 | ||
| 63,000 | 18 | 15 | 19 | ||
| Weekend admission, % | 27 | 28 | 28 | 0.07 | 0.80 |
| Insurance status, % | <0.001 | 0.91 | |||
| Medicare | 74 | 70 | 70 | ||
| Medicaid | 9 | 12 | 12 | ||
| Private | 12 | 13 | 13 | ||
| Self‐pay | 2 | 3 | 2 | ||
| Other | 2 | 2 | 2 | ||
| Season, % | <0.001 | 0.16 | |||
| Winter (January 1March 31) | 29 | 32 | 31 | ||
| Spring (April 1June 30) | 24 | 25 | 26 | ||
| Summer (July 1September 30) | 22 | 20 | 19 | ||
| Fall (October 1December 31) | 25 | 22 | 24 | ||
| No. of comorbidities, median (IQR) | 4 (35) | 4 (35) | 4 (36) | <0.001 | <0.001 |
| Selected comorbidities, % | |||||
| Hypertension | 56 | 55 | 55 | 0.01 | 0.65 |
| CHF | 38 | 40 | 44 | 0.001 | <0.001 |
| Fluid and electrolyte disorders | 37 | 44 | 49 | <0.001 | <0.001 |
| Diabetes, uncomplicated | 27 | 26 | 29 | 0.04 | 0.002 |
| Pneumonia | 19 | 34 | 39 | <0.001 | <0.001 |
| Deficiency anemia | 16 | 19 | 19 | <0.001 | 0.39 |
| Obesity | 18 | 12 | 17 | <0.001 | <0.001 |
| Depression | 15 | 11 | 11 | <0.001 | 0.54 |
| Pulmonary circulatory diseases | 15 | 11 | 14 | <0.001 | <0.001 |
| Hospital characteristics | |||||
| Annual ED visit volume, median (IQR) | 42,704 (29,50562,470) | 44,119 (29,89564,097) | 46,695 (31,29866,235) | 0.02 | 0.0003 |
| Annual ED volume of COPD exacerbation with respiratory failure, median (IQR) | 45 (2672) | 42 (2368) | 38 (2364) | <0.001 | <0.001 |
| Urban/rural and teaching status, % | <0.001 | <0.001 | |||
| Metropolitan nonteaching | 53 | 52 | 47 | ||
| Metropolitan teaching | 31 | 35 | 39 | ||
| Nonmetropolitan | 16 | 13 | 13 | ||
| US region, % | <0.001 | <0.001 | |||
| Northeast | 28 | 16 | 36 | ||
| Midwest | 17 | 22 | 15 | ||
| South | 41 | 45 | 32 | ||
| West | 14 | 17 | 17 | ||
The unadjusted differences in outcomes are shown in Table 2. The combined‐use group had the highest inpatient mortality, longest LOS, and highest charges, followed by the IMV and NIV groups. In general, complications were few across all 3 groups, but the rate of iatrogenic pneumothorax was notably lower in the NIV group. Table 3 details the statistically significant predictors of NIV use in the propensity score model. Similar to the unadjusted analysis, older age, high‐income neighborhoods, Medicare insurance, and some comorbidities were positively associated with NIV use (eg, pulmonary circulatory disorders and liver disease), whereas a few comorbidities were negatively associated with NIV use (eg, pneumonia, and alcohol and drug abuse). With respect to hospital characteristics, higher case volumes of COPD exacerbation/respiratory failure, Northeastern and nonmetropolitan hospitals, and more recent years were associated with NIV use.
| Outcome | NIV Alone (A) (n=10,032) | IMV Alone (B) (n=15,427) | Combined Use (C) (n=2311) | P Value. A vs B | P Value, B vs C |
|---|---|---|---|---|---|
| |||||
| Inpatient mortality, n (%) | 825 (8) | 2,454 (16) | 407 (18) | <0.001 | 0.04 |
| Hospital length of stay, median (IQR), d | 5 (48) | 8 (513) | 10 (716) | <0.001 | <0.001 |
| Hospital charge per visit, median (IQR), $ | 26,002 (15,74744,638) | 53,432 (31,99892,664) | 64,585 (39,024110,336) | <0.001 | <0.001 |
| Complications* | |||||
| Ventilator‐associated pneumonia, n (%) | 10 (0.1) | 10 (0.1) | 10 (0.5) | 0.09 | 1.00 |
| Facial injury, n (%) | 10 (0.1) | 10 (0.1) | 10 (0.5) | 0.26 | 1.00 |
| Iatrogenic pneumothorax, n (%) | 10 (0.1) | 90 (0.6) | 14 (0.6) | <0.001 | 0.90 |
| Patient Characteristics | Adjusted OR (95% CI)* | P Value |
|---|---|---|
| ||
| Age, y | ||
| 4049 | 1.00 (Reference) | |
| 5059 | 0.96 (0.84‐1.11) | 0.61 |
| 6069 | 0.96 (0.84‐1.10) | 0.56 |
| 7079 | 1.09 (0.94‐1.25) | 0.25 |
| 80 | 1.30 (1.12‐1.52) | 0.001 |
| Quartile for median household income of patient ZIP code, $ | ||
| 138,999 | 1.00 (Reference) | |
| 39,00047,999 | 1.13 (1.05‐1.21) | 0.001 |
| 48,00062,999 | 1.21 (1.12‐1.30) | <0.001 |
| 63,000 | 1.21 (1.11‐1.32) | <0.001 |
| Insurance status | ||
| Medicare | 1.00 (Reference) | |
| Medicaid | 0.79 (0.72‐0.88) | <0.001 |
| Private | 0.88 (0.81‐0.96) | 0.004 |
| Self‐pay | 0.68 (0.56‐0.82) | <0.001 |
| Other | 0.88 (0.73‐1.07) | 0.22 |
| Season | ||
| Winter (January 1March 31) | 1.00 (Reference) | |
| Spring (April 1June 30) | 1.06 (0.99‐1.14) | 0.11 |
| Summer (July 1September 30) | 1.17 (1.08‐1.26) | <0.001 |
| Fall (October 1December 31) | 1.24 (1.15‐1.33) | <0.001 |
| Comorbidity | ||
| CHF | 0.90 (0.85‐0.95) | <0.001 |
| Pulmonary circulatory disorders | 1.40 (1.29‐1.52) | <0.001 |
| Diabetes, complicated | 1.25 (1.08‐1.44) | 0.002 |
| Liver disease | 1.79 (1.40‐2.28) | <0.001 |
| Coagulopathy | 0.54 (0.46‐0.63) | <0.001 |
| Obesity | 1.52 (1.41‐1.65) | <0.001 |
| Weight loss | 0.50 (0.44‐0.57) | <0.001 |
| Fluid and electrolyte disorders | 0.84 (0.80‐0.89) | <0.001 |
| Deficiency anemia | 0.83 (0.78‐0.90) | <0.001 |
| Alcohol abuse | 0.66 (0.58‐0.76) | <0.001 |
| Drug abuse | 0.74 (0.62‐0.88) | 0.001 |
| Psychoses | 1.22 (1.10‐1.37) | <0.001 |
| Depression | 1.45 (1.34‐1.57) | <0.001 |
| Pneumonia | 0.48 (0.45‐0.51) | <0.001 |
| Valvular heart disease | 0.87 (0.77‐0.97) | 0.01 |
| Neurological disorders | 0.89 (0.80‐0.98) | 0.02 |
| RA/collagen vascular diseases | 1.25 (1.02‐1.53) | 0.04 |
| Blood‐loss anemia | 0.72 (0.53‐0.97) | 0.03 |
| Hospital characteristics | ||
| Annual ED visit volume, per 1000‐visit increase | 0.997 (0.996‐0.998) | <0.001 |
| Annual ED volume of COPD exacerbation with respiratory failure, per 10‐visit increase | 1.03 (1.02‐1.03) | <0.001 |
| Urban/rural and teaching status | ||
| Metropolitan nonteaching | 1.00 (Reference) | |
| Metropolitan teaching | 0.91 (0.85‐0.97) | 0.006 |
| Nonmetropolitan | 1.30 (1.20‐1.42) | <0.001 |
| US region | ||
| Northeast | 1.00 (Reference) | |
| Midwest | 0.44 (0.40‐0.48) | <0.001 |
| South | 0.54 (0.50‐0.58) | <0.001 |
| West | 0.51 (0.46‐0.56) | <0.001 |
| Calendar year | ||
| 2006 | 1.00 (Reference) | |
| 2007 | 1.30 (1.22‐1.39) | <0.001 |
| 2008 | 1.65 (1.54‐1.76) | <0.001 |
In terms of propensity score distributions (see Supporting Information, Figure E1, in the online version of this article), there was sufficient overlap of the NIV and IMV groups. After matching on propensity score for the NIV and IMV groups, the differences in baseline characteristics were all balanced (see Supporting Information, Table E1, in the online version of this article), as indicated by <10% standardized differences in all covariates between the 2 groups. Finally, in the propensity scorematched cohort (see Supporting Information, Table E2, in the online version of this article), NIV use remained associated with significantly lower inpatient mortality (risk ratio: 0.54; 95% CI: 0.50‐0.59, P<0.001), a shorter hospital LOS (mean difference, 3.2 days; 95% CI: 3.4 to 2.9 days, P<0.001), and lower hospital charges (mean difference, P<$35,012; 95% CI: $36,848 to $33,176, P<0.001), compared with IMV use. Use of NIV also was associated with a lower rate of iatrogenic pneumothorax than IMV use (0.05% vs 0.5%, P<0.001).
Using hospital preference for NIV vs IMV as an instrument, the instrumental analysis confirmed the benefits of NIV use, with a 5% reduction in inpatient mortality in the NIV‐preferring hospitals (risk difference, P<5%; 95% CI: P<1.8% to P<8.3%).
In the sensitivity analysis to assess the impact of an unmeasured confounder, the confounder would have had to have a very strong impact on outcome (risk ratio: 5) and a severe exposure‐confounder imbalance (odds ratio of exposure on confounder: 5) to reduce the observed association to 1.0. In other words, an individual unmeasured confounder is unlikely to explain the observed association.
DISCUSSION
In this nationally representative sample of 67,651 ED visits for AECOPD with acute respiratory failure, we found that NIV use was increasing from 2006 to 2008. However, the utilization of NIV remained low (16% in 2008) and varied widely by patient and hospital characteristic. As with all observational studies, causality cannot be inferred definitely; however, our study suggests that, NIV usecompared with IMV usewas associated with potentially important benefits: a reduction of inpatient mortality by 46%, shortened hospital LOS by 3 days, reduced hospital charges by approximately $35,000 per visit, and modestly reduced risk of iatrogenic pneumothorax.
A recent analysis using the US Nationwide Inpatient Sample has shown increasing use of NIV and concomitant decreasing mortality in AECOPD over time.[28] Our analysis confirmed these favorable trends in the United States using a much larger NEDS sample (28 million visits in the NEDS vs 8 million visits in the Nationwide Inpatient Sample per year). Despite these favorable trends, NIV was still underutilized for AECOPD with respiratory failure in the United States (16% in 2008) compared with major European countries (40%).[29] Although our study lacked clinical details to arrive at the optimal rate of NIV use, the low rate of NIV use is concerning and suggests room for improvement in NIV use in appropriate patients as outlined by the current COPD guidelines.[18, 30] Why is NIV not widely adopted, given its demonstrated efficacy? Previous surveys have identified several perceived reasons for low NIV use, including lack of physician knowledge, insufficient respiratory therapist training, inadequate equipment, and time required for setting up NIV.[29, 31, 32] Our study adds to the literature by showing the actual predictors of NIV use in the real world. Our data showed that the early adopters were hospitals with higher case volumes, and hospitals in the Northeast and in nonmetropolitan areas. A higher case volume has been linked with lower mortality in AECOPD (ie, practice makes perfect),[33] and frequent NIV use could explain the lower AECOPD mortality in highcase volume centers. Alternatively, smaller hospitals tend to have moonlighters working in EDs who may not be board certified in emergency medicine. Perhaps the logical next step is to conduct a qualitative study to understand the specifics of best practices and provider characteristics in these Northeastern, highercase volume centers. Another incentive to promote NIV use in clinical practice is the cost‐effectiveness associated with this intervention, as previous studies have shown that, compared with usual care, receiving NIV was associated with a reduction in costs, mainly through reduced use of the ICU.[34, 35]
Some patient factors associated with NIV use may be well justified. For example, older AECOPD patients may have an advance directive describing their treatment wishes (eg, do‐not‐intubate order),[36] and therefore NIV was preferred to IMV. Also, our data suggested AECOPD patients with a suspected pneumonia component were less likely to be placed on NIV, which is consistent with COPD guideline recommendations.[18, 30] As outlined in the current guidelines, the major contraindications to NIV include impending respiratory arrest, excessive respiratory secretions, massive gastrointestinal bleeding, recent facial trauma, or altered mental status.[18, 30] By contrast, some factors associated with NIV use may be targeted for intervention, such as lower rates of NIV use in the uninsured, patients who live in low‐income neighborhoods, and hospitals in US regions other than the Northeast.
Current guidelines recommend using NIV in AECOPD patients with early signs of respiratory failure, such as arterial pH of 7.257.35 or pCO2 45 mm Hg.[18, 30] When NIV is considered as the modality of ventilatory support, it should probably be used as early as possible,[37] because evidence suggests that delayed use of NIV may lead to severe respiratory acidosis and increased mortality.[38] Other than in ICUs, NIV can be used on general wards and in EDs that have adequate staff training and experience, because the success rates of NIV in these settings are similar to those reported in ICU studies.[8, 36, 39] In addition, NIV is more cost‐effective when performed outside the ICU.[35] In fact, studies have found a substantial portion of patients had NIV started in the ED (one‐fourth) and on the general ward (one‐fourth).[31, 40] Given the shortage of intensivists in the United States, hospitalists begin to play an important role in provision of critical care outside the ICU.[41] Once NIV is used, it is important to ensure that it is delivered effectively and monitored closely because NIV failure has been shown to be associated with high mortality.[28, 42]
This study has some potential limitations. First, we used administrative claims that lack clinical details such as data on arterial blood gases and severity scores, and thus potential residual confounding may exist. In our study, the IMV group may be sicker than the NIV group, which could partially explain the increased mortality with IMV. However, the propensity scores overlap to a great extent between the 2 study groups, suggesting that a strong confounding bias is less likely, given the observed covariates. Furthermore, the instrumental variable and sensitivity analyses taking into account unmeasured confounders still suggested the benefits of NIV. Second, the NEDS does not contain data on the location where NIV was initiated (eg, ED, ward, or ICU) or the timing of initiating NIV or IMV. As a result, for the combined‐use group, we could not further distinguish the group switching from NIV to IMV (ie, NIV failure)[42] or from IMV to NIV (ie, NIV as a weaning strategy).[43] Accordingly, we chose to focus on the comparativeness effectiveness of NIV vs IMV. Third, although the NEDS data have undergone quality‐control procedures,[44] some misclassification may exist in identifying patient population and interventions. Finally, the analysis may not reflect the most recent trend in NIV use, as the 2010 NEDS data have just been released. In addition, although the study is the largest to date on this topic, our findings may not be generalizable to EDs that were not part of the NEDS.
In summary, in this nationally representative ED and inpatient database, NIV use is increasing for AECOPD with acute respiratory failure; however, its adoption remains low and varies widely between US hospitals. Our observational study suggests that NIV appears to be more effective and safer than IMV in the real‐world setting. There is an opportunity to increase the use of NIV as recommended in guidelines and to promote the use NIV in replacement of IMV in patients with severe AECOPD. Given the increasing mortality burden of COPD, such a strategy may help reduce COPD mortality at the population level, thereby fulfilling the objectives of Healthy People 2020.
Disclosure
Partial results from this study were presented at the 2012 Society for Academic Emergency Medicine Annual Meeting, Chicago, Illinois, May 912, 2012. This project was supported by grant number R03HS020722 from the Agency for Healthcare Research and Quality. The content is solely the responsibility of the authors and does not necessarily represent the official views of the Agency for Healthcare Research and Quality. The authors have no conflicts of interest to disclose.
- Centers for Disease Control and Prevention, National Center for Health Statistics. National Vital Statistics Reports, 2011. Deaths: final data for 2008. Available at: http://www.cdc.gov/nchs/data/nvsr/nvsr59/nvsr59_10.pdf. Accessed August 15, 2012.
- , , , . Trends in the leading causes of death in the United States, 1970–2002. JAMA. 2005;294:1255–1259.
- , , . National study of emergency department visits for acute exacerbation of chronic obstructive pulmonary disease. Acad Emerg Med. 2008;15:1275–1283.
- , , , , . Chronic obstructive pulmonary disease surveillance—United States, 1971–2000. MMWR Surveill Summ. 2002;51:1–16.
- US Department of Health and Human Services. Healthy People 2020. Objectives for Respiratory Diseases. Available at: http://www.healthypeople. gov/2020/topicsobjectives2020/objectiveslist.aspx?topicId=36. Accessed May 3, 2012.
- . Mechanical ventilation: invasive versus noninvasive. Eur Respir J Suppl. 2003;47:31s–37s.
- , , , et al. Noninvasive ventilation for acute exacerbations of chronic obstructive pulmonary disease. N Engl J Med. 1995;333:817–822.
- , , . Early use of non‐invasive ventilation for acute exacerbations of chronic obstructive pulmonary disease on general respiratory wards: a multicentre randomised controlled trial. Lancet. 2000;355:1931–1935.
- , , , et al. Randomised controlled trial of nasal ventilation in acute ventilatory failure due to chronic obstructive airways disease. Lancet. 1993;341:1555–1557.
- , , , . Non‐invasive positive pressure ventilation for treatment of respiratory failure due to exacerbations of chronic obstructive pulmonary disease. Cochrane Database Syst Rev. 2004;(3):CD004104.
- , , , et al. Noninvasive vs. conventional mechanical ventilation in patients with chronic obstructive pulmonary disease after failure of medical treatment in the ward: a randomized trial. Intensive Care Med. 2002;28:1701–1707.
- . Noninvasive vs conventional mechanical ventilation in acute respiratory failure: a multicenter, randomized controlled trial. Chest. 2005;128:3916–3924.
- , , , , , . Mechanical ventilation in chronic obstructive pulmonary disease patients, noninvasive vs. invasive method (randomized prospective study). Coll Antropol. 2009;33:791–797.
- , , , et al. Noninvasive Positive‐Pressure Ventilation (NPPV) for Acute Respiratory Failure. Rockville, MD: Agency for Healthcare Research and Quality; July 2012: Report 12‐EHC089‐EF. Available at: http://effectivehealthcareahrqgov/ehc/products/273/1180/CER68_NPPV_FinalReport_20120706pdf. Accessed December 11, 2012.
- Healthcare Cost and Utilization Project (HCUP). HCUP Nationwide Emergency Department Sample (NEDS). Rockville, MD: Agency for Healthcare Research and Quality; 2012. Available at: http://www.hcup‐us.ahrq.gov/nedsoverview.jsp. Accessed April 15, 2012.
- American Hospital Association. Annual survey database. Available at: http://www.ahadata.com/ahadata/html/AHASurvey.html. Accessed April 15, 2012.
- , , , . Age‐related differences in clinical outcomes for acute asthma in the United States, 2006–2008. J Allergy Clin Immunol. 2012;129:1252e1–1258e1.
- Global Initiative for Chronic Obstructive Lung Disease (GOLD). NHLBI/WHO Global Strategy for the Diagnosis, Management and Prevention of COPD. Available at: http://www.goldcopd.org. Accessed April 15, 2012.
- .US Bureau of the Census. Census regions and divisions of the United States. Available at: http://www.census.gov/geo/www/us_regdiv.pdf. Accessed April 9, 2012.
- .Healthcare Cost and Utilization Project. Comorbidity software. Available at: http://www.hcup‐us.ahrq.gov/toolssoftware/comorbidity/comorbidity.jsp. Accessed April 15, 2012.
- , , , . Comorbidity measures for use with administrative data. Med Care. 1998;36:8–27.
- Healthcare Cost and Utilization Project (HCUP). HCUP Methods Series. Hierarchical Modeling Using HCUP Data. Rockville, MD: Agency for Healthcare Research and Quality; 2012: Report 2007‐01. Available at: http://www.hcup‐us.ahrq.gov/reports/methods/2007_01.pdf. Accessed April 15, 2012.
- , , . Indications for propensity scores and review of their use in pharmacoepidemiology. Basic Clin Pharmacol Toxicol. 2006;98:253–259.
- , , , , , . Antibiotic therapy and treatment failure in patients hospitalized for acute exacerbations of chronic obstructive pulmonary disease. JAMA. 2010;303:2035–2042.
- . An introduction to propensity score methods for reducing the effects of confounding in observational studies. Multivariate Behav Res. 2011;46:399–424.
- , , . Instrumental variable methods in comparative safety and effectiveness research. Pharmacoepidemiol Drug Saf. 2010;19:537–554.
- . Sensitivity analysis and external adjustment for unmeasured confounders in epidemiologic database studies of therapeutics. Pharmacoepidemiol Drug Saf. 2006;15:291–303.
- , , , et al. Outcomes of noninvasive ventilation for acute exacerbations of chronic obstructive pulmonary disease in the United States, 1998–2008. Am J Respir Crit Care Med. 2012;185:152–159.
- , , , , . A European survey of noninvasive ventilation practices. Eur Respir J. 2010;36:362–369.
- , . Standards for the diagnosis and treatment of patients with COPD: a summary of the ATS/ERS position paper. Eur Respir J. 2004;23:932–946.
- , , , . Utilization of noninvasive ventilation in acute care hospitals: a regional survey. Chest. 2006;129:1226–1233.
- , , . A survey of the use of noninvasive ventilation in academic emergency departments in the United States. Respir Care. 2009;54:1306–1312.
- , , . Emergency department case volume and patient outcomes in acute exacerbations of chronic obstructive pulmonary disease. Acad Emerg Med. 2012;19:656–663.
- , , , , . Noninvasive positive pressure ventilation in the setting of severe, acute exacerbations of chronic obstructive pulmonary disease: more effective and less expensive. Crit Care Med. 2000;28:2094–2102.
- , , , . Cost effectiveness of ward based non‐invasive ventilation for acute exacerbations of chronic obstructive pulmonary disease: economic analysis of randomised controlled trial. BMJ. 2003;326:956.
- , , . Noninvasive positive pressure ventilation reverses acute respiratory failure in select “do‐not‐intubate” patients. Crit Care Med. 2005;33:1976–1982.
- , . Noninvasive ventilation for acute exacerbations of chronic obstructive pulmonary disease: “Don't think twice, it's alright!”. Am J Respir Crit Care Med. 2012;185:121–123.
- , , , , . Acidosis, non‐invasive ventilation and mortality in hospitalised COPD exacerbations. Thorax. 2011;66:43–48.
- , , , , . Use of noninvasive positive‐pressure ventilation on the regular hospital ward: experience and correlates of success. Respir Care. 2006;51:1237–1243.
- , , , et al. Bilevel noninvasive positive pressure ventilation for acute respiratory failure: survey of Ontario practice. Crit Care Med. 2005;33:1477–1483.
- . Hospitalists and intensivists: partners in caring for the critically ill—the time has come. J Hosp Med. 2010;5:1–3.
- , , , , , . Incidence and causes of non‐invasive mechanical ventilation failure after initial success. Thorax. 2000;55:819–825.
- , , , . Noninvasive positive pressure ventilation as a weaning strategy for intubated adults with respiratory failure. Cochrane Database Syst Rev. 2010:CD004127.
- Healthcare Cost and Utilization Project (HCUP). HCUP Quality Control Procedures. Rockville, MD: Agency for Healthcare Research and Quality; 2012. Available at: http://www.hcup‐us.ahrq.gov/db/quality.jsp. Accessed December 15, 2012.
- Centers for Disease Control and Prevention, National Center for Health Statistics. National Vital Statistics Reports, 2011. Deaths: final data for 2008. Available at: http://www.cdc.gov/nchs/data/nvsr/nvsr59/nvsr59_10.pdf. Accessed August 15, 2012.
- , , , . Trends in the leading causes of death in the United States, 1970–2002. JAMA. 2005;294:1255–1259.
- , , . National study of emergency department visits for acute exacerbation of chronic obstructive pulmonary disease. Acad Emerg Med. 2008;15:1275–1283.
- , , , , . Chronic obstructive pulmonary disease surveillance—United States, 1971–2000. MMWR Surveill Summ. 2002;51:1–16.
- US Department of Health and Human Services. Healthy People 2020. Objectives for Respiratory Diseases. Available at: http://www.healthypeople. gov/2020/topicsobjectives2020/objectiveslist.aspx?topicId=36. Accessed May 3, 2012.
- . Mechanical ventilation: invasive versus noninvasive. Eur Respir J Suppl. 2003;47:31s–37s.
- , , , et al. Noninvasive ventilation for acute exacerbations of chronic obstructive pulmonary disease. N Engl J Med. 1995;333:817–822.
- , , . Early use of non‐invasive ventilation for acute exacerbations of chronic obstructive pulmonary disease on general respiratory wards: a multicentre randomised controlled trial. Lancet. 2000;355:1931–1935.
- , , , et al. Randomised controlled trial of nasal ventilation in acute ventilatory failure due to chronic obstructive airways disease. Lancet. 1993;341:1555–1557.
- , , , . Non‐invasive positive pressure ventilation for treatment of respiratory failure due to exacerbations of chronic obstructive pulmonary disease. Cochrane Database Syst Rev. 2004;(3):CD004104.
- , , , et al. Noninvasive vs. conventional mechanical ventilation in patients with chronic obstructive pulmonary disease after failure of medical treatment in the ward: a randomized trial. Intensive Care Med. 2002;28:1701–1707.
- . Noninvasive vs conventional mechanical ventilation in acute respiratory failure: a multicenter, randomized controlled trial. Chest. 2005;128:3916–3924.
- , , , , , . Mechanical ventilation in chronic obstructive pulmonary disease patients, noninvasive vs. invasive method (randomized prospective study). Coll Antropol. 2009;33:791–797.
- , , , et al. Noninvasive Positive‐Pressure Ventilation (NPPV) for Acute Respiratory Failure. Rockville, MD: Agency for Healthcare Research and Quality; July 2012: Report 12‐EHC089‐EF. Available at: http://effectivehealthcareahrqgov/ehc/products/273/1180/CER68_NPPV_FinalReport_20120706pdf. Accessed December 11, 2012.
- Healthcare Cost and Utilization Project (HCUP). HCUP Nationwide Emergency Department Sample (NEDS). Rockville, MD: Agency for Healthcare Research and Quality; 2012. Available at: http://www.hcup‐us.ahrq.gov/nedsoverview.jsp. Accessed April 15, 2012.
- American Hospital Association. Annual survey database. Available at: http://www.ahadata.com/ahadata/html/AHASurvey.html. Accessed April 15, 2012.
- , , , . Age‐related differences in clinical outcomes for acute asthma in the United States, 2006–2008. J Allergy Clin Immunol. 2012;129:1252e1–1258e1.
- Global Initiative for Chronic Obstructive Lung Disease (GOLD). NHLBI/WHO Global Strategy for the Diagnosis, Management and Prevention of COPD. Available at: http://www.goldcopd.org. Accessed April 15, 2012.
- .US Bureau of the Census. Census regions and divisions of the United States. Available at: http://www.census.gov/geo/www/us_regdiv.pdf. Accessed April 9, 2012.
- .Healthcare Cost and Utilization Project. Comorbidity software. Available at: http://www.hcup‐us.ahrq.gov/toolssoftware/comorbidity/comorbidity.jsp. Accessed April 15, 2012.
- , , , . Comorbidity measures for use with administrative data. Med Care. 1998;36:8–27.
- Healthcare Cost and Utilization Project (HCUP). HCUP Methods Series. Hierarchical Modeling Using HCUP Data. Rockville, MD: Agency for Healthcare Research and Quality; 2012: Report 2007‐01. Available at: http://www.hcup‐us.ahrq.gov/reports/methods/2007_01.pdf. Accessed April 15, 2012.
- , , . Indications for propensity scores and review of their use in pharmacoepidemiology. Basic Clin Pharmacol Toxicol. 2006;98:253–259.
- , , , , , . Antibiotic therapy and treatment failure in patients hospitalized for acute exacerbations of chronic obstructive pulmonary disease. JAMA. 2010;303:2035–2042.
- . An introduction to propensity score methods for reducing the effects of confounding in observational studies. Multivariate Behav Res. 2011;46:399–424.
- , , . Instrumental variable methods in comparative safety and effectiveness research. Pharmacoepidemiol Drug Saf. 2010;19:537–554.
- . Sensitivity analysis and external adjustment for unmeasured confounders in epidemiologic database studies of therapeutics. Pharmacoepidemiol Drug Saf. 2006;15:291–303.
- , , , et al. Outcomes of noninvasive ventilation for acute exacerbations of chronic obstructive pulmonary disease in the United States, 1998–2008. Am J Respir Crit Care Med. 2012;185:152–159.
- , , , , . A European survey of noninvasive ventilation practices. Eur Respir J. 2010;36:362–369.
- , . Standards for the diagnosis and treatment of patients with COPD: a summary of the ATS/ERS position paper. Eur Respir J. 2004;23:932–946.
- , , , . Utilization of noninvasive ventilation in acute care hospitals: a regional survey. Chest. 2006;129:1226–1233.
- , , . A survey of the use of noninvasive ventilation in academic emergency departments in the United States. Respir Care. 2009;54:1306–1312.
- , , . Emergency department case volume and patient outcomes in acute exacerbations of chronic obstructive pulmonary disease. Acad Emerg Med. 2012;19:656–663.
- , , , , . Noninvasive positive pressure ventilation in the setting of severe, acute exacerbations of chronic obstructive pulmonary disease: more effective and less expensive. Crit Care Med. 2000;28:2094–2102.
- , , , . Cost effectiveness of ward based non‐invasive ventilation for acute exacerbations of chronic obstructive pulmonary disease: economic analysis of randomised controlled trial. BMJ. 2003;326:956.
- , , . Noninvasive positive pressure ventilation reverses acute respiratory failure in select “do‐not‐intubate” patients. Crit Care Med. 2005;33:1976–1982.
- , . Noninvasive ventilation for acute exacerbations of chronic obstructive pulmonary disease: “Don't think twice, it's alright!”. Am J Respir Crit Care Med. 2012;185:121–123.
- , , , , . Acidosis, non‐invasive ventilation and mortality in hospitalised COPD exacerbations. Thorax. 2011;66:43–48.
- , , , , . Use of noninvasive positive‐pressure ventilation on the regular hospital ward: experience and correlates of success. Respir Care. 2006;51:1237–1243.
- , , , et al. Bilevel noninvasive positive pressure ventilation for acute respiratory failure: survey of Ontario practice. Crit Care Med. 2005;33:1477–1483.
- . Hospitalists and intensivists: partners in caring for the critically ill—the time has come. J Hosp Med. 2010;5:1–3.
- , , , , , . Incidence and causes of non‐invasive mechanical ventilation failure after initial success. Thorax. 2000;55:819–825.
- , , , . Noninvasive positive pressure ventilation as a weaning strategy for intubated adults with respiratory failure. Cochrane Database Syst Rev. 2010:CD004127.
- Healthcare Cost and Utilization Project (HCUP). HCUP Quality Control Procedures. Rockville, MD: Agency for Healthcare Research and Quality; 2012. Available at: http://www.hcup‐us.ahrq.gov/db/quality.jsp. Accessed December 15, 2012.
Copyright © 2013 Society of Hospital Medicine
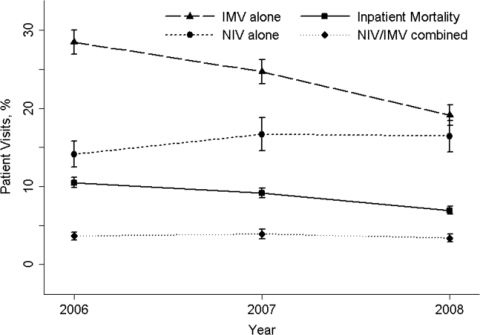
Intellectual Agenda for Hospitalists
The practice of bloodletting, performed using sticks, thorns, bones, or anything sharp, probably began in Egypt about 3,000 years ago.[1] The practice continued in Greece, where Hippocrates recommended bloodletting to balance the body's four humorsblood, phlegm, yellow bile, and black bileand continued during Roman times under the influence of Galen. In the United States, perhaps the most infamous use of bloodletting was when doctors reportedly bled as much as 5 U of blood from George Washington before he died from what was probably either acute epiglottitis or streptococcal pharyngitis.[2, 3] Although many infectious organisms, especially malaria parasites, require iron to proliferateand therefore may be less virulent in iron‐deficient people[4]acute near‐exsanguination undoubtedly did more harm than good in the elderly ex‐president.
But the practice of bloodletting continued and even flourished. In 1833 alone, France reportedly imported more than 40 million leeches to assist in bloodletting,[5] which oftentimes was thought to be sufficiently aggressive only when the patient actually fainted. Enthusiasm for bloodletting declined in the second half of the 19th century, influenced in part by a nonrandomized study that compared mortality rates among patients who were bled early in their illness with those who were bled later.[6] Nevertheless, Sir William Osler still recommended small amounts of bloodletting for pneumonia in his last edition of his famous textbook, The Principles and Practice of Medicine, published in 1920.[7] By 1927, however, the first edition of the Cecil's A Textbook of Medicine thankfully no longer recommended venesection except to treat conditions such as pulmonary edema.[8]
Why would I start this essay with a history of bloodletting? Surely, one might argue, nothing could be less relevant to a modern discussion of the quality of in‐hospital medical care. The substantial literature on quality improvement emphasizes the practical implementation of strategies to increase the appropriate adherence to processes that are known to improve outcomes. A number of common quality measures quickly come to mind: the use of aspirin, ‐blockers, angiotensin‐converting enzyme inhibitors, and statins in post‐myocardial infarction patients without contraindications,[9, 10] the rapid initiation of appropriate antibiotics to patients with community‐acquired pneumonia,[11] and early endoscopy for patients with acute upper gastrointestinal hemorrhage.[12] I could go on and on, listing in‐hospital interventions supported by class 1 evidence from more than one definitive randomized trial. In essentially all of these situations, the creation of quality metrics, often accompanied by measurement and feedback, have improved adherence and undoubtedly saved lives. But although adherence has improved, the explosion in evidence‐based medicine means that even the best hospitals may be in perpetual catch‐up mode as they try to ensure adherence with the next wave of improvement interventions.
Unfortunately, every now and then a lot of attention is paid to meeting a quality metric that turns out to be misguided. Perhaps the best recent in‐hospital example was the metric of prophylactic ‐blocker use before major noncardiac surgery. Although this recommendation initially appeared to be based on reasonable data,[13] the large Perioperative Ischemic Evaluation Study (POISE) trial showed that reductions in rates of myocardial infarction were more than offset by an increased risk of stroke and other complications; therefore, average‐risk patients actually did worse, not better, with the ‐blocker regimen used in the trial. Although some have questioned whether these results were a function of the precise ‐blocker regimen that was used, the results of POISE are actually remarkably consistent with prior data on the risk of myocardial infarction and stroke.[14, 15] What was really different was the relative importance of these and other end points in patients whose risk of cardiac death was lower than those of higher risk patients in prior studies. But more recently, an even more disturbing reality has emerged: a number of key reports on which the guidelines were based came from an investigator whose publications included data that could not be confirmed when his studies were reviewed by his home institution.[16] Regardless of the precise reasons, we no longer routinely recommend an intervention that at one time was a key quality indicator.
The ‐blocker fiasco brings me back to bloodletting. In the early 19th century, a hypothetical visionary physician interested in quality improvement would likely have looked for ways to improve the efficiency and reduce the cost of bloodletting. Perhaps the leeches could be bigger, hungrier, or applied in a more effective fashion? Or perhaps vacuum tubes would have been invented sooner?
Of course, I am overemphasizing to prove a point. I truly believe that more and more of what we recommend is based on solid evidence to document, at least for now, that we are doing the right thing. If we do it more often and in more people, net benefit will be realized.
What does all this mean for the future of hospital medicine and its emerging research endeavors? For me at least, the message is pretty clear. First, we must be careful not to over extrapolate from limited studies in high risk patients, or we will jump to more conclusions like we did with ‐blockers. Second, most advances in medicine require new and better data.
How can new clinical data be generated most quickly and efficiently? One‐off studies at individual institutions are logistically and financially challenging, whereas an enduring research infrastructure is a treasure that can study a series of questions as they arise. The Thrombolysis in Myocardial Infarction Study Group has published scores of papers looking at a series of interventions in patients with acute myocardial infarction and the acute coronary syndrome.[17, 18] The Acute Respiratory Distress Syndrome Network has demonstrated the value of lower tidal volumes and less aggressive fluid strategies in patients with respiratory failure.[19, 20]
The success of these large, multicenter research networks should become the paradigm for the study of common hospital problems, ranging from the conditions that result in admission on the medical service to the problems that have engendered surgical comanagement services. New data can be gleaned by studying the medical care system, by studying routinely gathered administrative and clinical data, or even better yet, by gathering prospective data on patients and their diseases. For hospitalized patients, a variety of unanswered questions remain regarding the epidemiology of common diseases, the value of diagnostic tests, the impact of various therapies and treatment protocols, and the incremental value of new technologies, ranging from self‐monitoring to handheld ultrasound. High‐quality research may address the genetic epidemiology of why one person is admitted with pneumococcal pneumonia, whereas family members seem perfectly healthy; which patients with a particular diagnosis might be managed for different lengths of time in different settings; what physical findings or diagnostic tests best stratify prognosis; what new technologies are truly worth their cost; and especially, what therapies really work.
I do not dispute that hospital medicine researchers should try to improve the current use of interventions that are deemed to be valuable right now. But if that is all the field does, it will be a huge disappointment. Hospitalists should not be relegated to being adherence police who spend their collective research energy finding ways to force themselves to follow recommendations based on data gathered by others.
Hospital medicine researchers are uniquely positioned to discover new information that will change what should be done and help create the quality metrics for the future. Unless both of these two goalsimproving the implementation of today's knowledge and generating new and better knowledgeare part of the research agenda, we run the risk that some of the best minds in internal medicine may, when all is said and done, have spent an inordinate number of IQ hours on what, a century from now, will be reminiscent of improving the quality of bloodletting.
- . Bloodletting over the centuries. NY State J Med. 1980;80:2022–2028.
- . The death of George Washington: an end to the controversy? Am Surg. 2008;74:770–774.
- . The death of George Washington (1732–1799) and the history of cynanche. J Med Biogr. 2005;13:225–231.
- , . Hepcidin and the iron‐infection axis. Science. 2012;338:768–772.
- . Leech therapy: a history. J Hist Dent. 2005;53:25–27.
- . Pierre‐Charles‐Alexandre Louis and the evaluation of bloodletting. J R Soc Med. 2006;99:158–160.
- , . The Principles and Practice of Medicine. New York, NY: Appleton and Co.; 1920.
- Cecil RL, Kennedy F, eds. A Textbook of Medicine by American Authors. 1st ed. Philadelphia, PA: WB Saunders; 1927.
- Department of Health and Human Services. Hospital Compare: hospital process of care measures tables. Available at: http://www.hospitalcompare.hhs.gov/staticpages/for‐consumers/poc/explainations‐of‐measures.aspx. Accessed January 3, 2013.
- , , . Trends in the use of lipid‐lowering medications at discharge in patients with acute myocardial infarction: 1998 to 2006. Am Heart J. 2009;157:185–194.
- , , , et al. Guideline‐concordant therapy and reduced mortality and length of stay in adults with community‐acquired pneumonia: playing by the rules. Arch Intern Med. 2009;169:1525–1531.
- , , , et al. International consensus recommendations on the management of patients with nonvariceal upper gastrointestinal bleeding. Ann Intern Med. 2010;152:101–113.
- , . β‐blockers and reduction of cardiac events in noncardiac surgery. JAMA. 2002;287:1445–1447.
- , , , et al; POISE Study Group. Effects of extended‐release metoprolol succinate in patients undergoing non‐cardiac surgery (POISE trial): a randomised controlled trial. Lancet. 2008;371:1839–1847.
- , , , et al. Perioperative beta blockers in patients having non‐cardiac surgery: a meta‐analysis. Lancet. 2008;372:1962–1976.
- Report on the 2012 follow‐up investigation of possible breaches of academic integrity. Erasmus MC Follow‐up Investigation Committee, 2012. Available at: http://www.eramusmc.nl. . Accessed January 3, 2013.
- , , , et al. Rivaroxaban in patients with a recent acute coronary syndrome. N Engl J Med. 2012;366:9–19.
- , , , et al. Addition of clopidogrel to aspirin and fibrinolytic therapy for myocardial infarction with ST‐segment elevation. N Engl J Med. 2005;352:1179–1189.
- Acute Respiratory Distress Syndrome Network: ventilation with lower tidal volumes as compared with traditional tidal volumes for acute lung injury and the acute respiratory distress syndrome. N Engl J Med. 2000;342:1301–1308.
- The National Heart, Lung, and Blood Institute Acute Respiratory Distress Syndrome (ARDS) Clinical Trials Network: comparison of two fluid‐management strategies in acute lung injury. N Engl J Med. 2006;354:2564–2575.
The practice of bloodletting, performed using sticks, thorns, bones, or anything sharp, probably began in Egypt about 3,000 years ago.[1] The practice continued in Greece, where Hippocrates recommended bloodletting to balance the body's four humorsblood, phlegm, yellow bile, and black bileand continued during Roman times under the influence of Galen. In the United States, perhaps the most infamous use of bloodletting was when doctors reportedly bled as much as 5 U of blood from George Washington before he died from what was probably either acute epiglottitis or streptococcal pharyngitis.[2, 3] Although many infectious organisms, especially malaria parasites, require iron to proliferateand therefore may be less virulent in iron‐deficient people[4]acute near‐exsanguination undoubtedly did more harm than good in the elderly ex‐president.
But the practice of bloodletting continued and even flourished. In 1833 alone, France reportedly imported more than 40 million leeches to assist in bloodletting,[5] which oftentimes was thought to be sufficiently aggressive only when the patient actually fainted. Enthusiasm for bloodletting declined in the second half of the 19th century, influenced in part by a nonrandomized study that compared mortality rates among patients who were bled early in their illness with those who were bled later.[6] Nevertheless, Sir William Osler still recommended small amounts of bloodletting for pneumonia in his last edition of his famous textbook, The Principles and Practice of Medicine, published in 1920.[7] By 1927, however, the first edition of the Cecil's A Textbook of Medicine thankfully no longer recommended venesection except to treat conditions such as pulmonary edema.[8]
Why would I start this essay with a history of bloodletting? Surely, one might argue, nothing could be less relevant to a modern discussion of the quality of in‐hospital medical care. The substantial literature on quality improvement emphasizes the practical implementation of strategies to increase the appropriate adherence to processes that are known to improve outcomes. A number of common quality measures quickly come to mind: the use of aspirin, ‐blockers, angiotensin‐converting enzyme inhibitors, and statins in post‐myocardial infarction patients without contraindications,[9, 10] the rapid initiation of appropriate antibiotics to patients with community‐acquired pneumonia,[11] and early endoscopy for patients with acute upper gastrointestinal hemorrhage.[12] I could go on and on, listing in‐hospital interventions supported by class 1 evidence from more than one definitive randomized trial. In essentially all of these situations, the creation of quality metrics, often accompanied by measurement and feedback, have improved adherence and undoubtedly saved lives. But although adherence has improved, the explosion in evidence‐based medicine means that even the best hospitals may be in perpetual catch‐up mode as they try to ensure adherence with the next wave of improvement interventions.
Unfortunately, every now and then a lot of attention is paid to meeting a quality metric that turns out to be misguided. Perhaps the best recent in‐hospital example was the metric of prophylactic ‐blocker use before major noncardiac surgery. Although this recommendation initially appeared to be based on reasonable data,[13] the large Perioperative Ischemic Evaluation Study (POISE) trial showed that reductions in rates of myocardial infarction were more than offset by an increased risk of stroke and other complications; therefore, average‐risk patients actually did worse, not better, with the ‐blocker regimen used in the trial. Although some have questioned whether these results were a function of the precise ‐blocker regimen that was used, the results of POISE are actually remarkably consistent with prior data on the risk of myocardial infarction and stroke.[14, 15] What was really different was the relative importance of these and other end points in patients whose risk of cardiac death was lower than those of higher risk patients in prior studies. But more recently, an even more disturbing reality has emerged: a number of key reports on which the guidelines were based came from an investigator whose publications included data that could not be confirmed when his studies were reviewed by his home institution.[16] Regardless of the precise reasons, we no longer routinely recommend an intervention that at one time was a key quality indicator.
The ‐blocker fiasco brings me back to bloodletting. In the early 19th century, a hypothetical visionary physician interested in quality improvement would likely have looked for ways to improve the efficiency and reduce the cost of bloodletting. Perhaps the leeches could be bigger, hungrier, or applied in a more effective fashion? Or perhaps vacuum tubes would have been invented sooner?
Of course, I am overemphasizing to prove a point. I truly believe that more and more of what we recommend is based on solid evidence to document, at least for now, that we are doing the right thing. If we do it more often and in more people, net benefit will be realized.
What does all this mean for the future of hospital medicine and its emerging research endeavors? For me at least, the message is pretty clear. First, we must be careful not to over extrapolate from limited studies in high risk patients, or we will jump to more conclusions like we did with ‐blockers. Second, most advances in medicine require new and better data.
How can new clinical data be generated most quickly and efficiently? One‐off studies at individual institutions are logistically and financially challenging, whereas an enduring research infrastructure is a treasure that can study a series of questions as they arise. The Thrombolysis in Myocardial Infarction Study Group has published scores of papers looking at a series of interventions in patients with acute myocardial infarction and the acute coronary syndrome.[17, 18] The Acute Respiratory Distress Syndrome Network has demonstrated the value of lower tidal volumes and less aggressive fluid strategies in patients with respiratory failure.[19, 20]
The success of these large, multicenter research networks should become the paradigm for the study of common hospital problems, ranging from the conditions that result in admission on the medical service to the problems that have engendered surgical comanagement services. New data can be gleaned by studying the medical care system, by studying routinely gathered administrative and clinical data, or even better yet, by gathering prospective data on patients and their diseases. For hospitalized patients, a variety of unanswered questions remain regarding the epidemiology of common diseases, the value of diagnostic tests, the impact of various therapies and treatment protocols, and the incremental value of new technologies, ranging from self‐monitoring to handheld ultrasound. High‐quality research may address the genetic epidemiology of why one person is admitted with pneumococcal pneumonia, whereas family members seem perfectly healthy; which patients with a particular diagnosis might be managed for different lengths of time in different settings; what physical findings or diagnostic tests best stratify prognosis; what new technologies are truly worth their cost; and especially, what therapies really work.
I do not dispute that hospital medicine researchers should try to improve the current use of interventions that are deemed to be valuable right now. But if that is all the field does, it will be a huge disappointment. Hospitalists should not be relegated to being adherence police who spend their collective research energy finding ways to force themselves to follow recommendations based on data gathered by others.
Hospital medicine researchers are uniquely positioned to discover new information that will change what should be done and help create the quality metrics for the future. Unless both of these two goalsimproving the implementation of today's knowledge and generating new and better knowledgeare part of the research agenda, we run the risk that some of the best minds in internal medicine may, when all is said and done, have spent an inordinate number of IQ hours on what, a century from now, will be reminiscent of improving the quality of bloodletting.
The practice of bloodletting, performed using sticks, thorns, bones, or anything sharp, probably began in Egypt about 3,000 years ago.[1] The practice continued in Greece, where Hippocrates recommended bloodletting to balance the body's four humorsblood, phlegm, yellow bile, and black bileand continued during Roman times under the influence of Galen. In the United States, perhaps the most infamous use of bloodletting was when doctors reportedly bled as much as 5 U of blood from George Washington before he died from what was probably either acute epiglottitis or streptococcal pharyngitis.[2, 3] Although many infectious organisms, especially malaria parasites, require iron to proliferateand therefore may be less virulent in iron‐deficient people[4]acute near‐exsanguination undoubtedly did more harm than good in the elderly ex‐president.
But the practice of bloodletting continued and even flourished. In 1833 alone, France reportedly imported more than 40 million leeches to assist in bloodletting,[5] which oftentimes was thought to be sufficiently aggressive only when the patient actually fainted. Enthusiasm for bloodletting declined in the second half of the 19th century, influenced in part by a nonrandomized study that compared mortality rates among patients who were bled early in their illness with those who were bled later.[6] Nevertheless, Sir William Osler still recommended small amounts of bloodletting for pneumonia in his last edition of his famous textbook, The Principles and Practice of Medicine, published in 1920.[7] By 1927, however, the first edition of the Cecil's A Textbook of Medicine thankfully no longer recommended venesection except to treat conditions such as pulmonary edema.[8]
Why would I start this essay with a history of bloodletting? Surely, one might argue, nothing could be less relevant to a modern discussion of the quality of in‐hospital medical care. The substantial literature on quality improvement emphasizes the practical implementation of strategies to increase the appropriate adherence to processes that are known to improve outcomes. A number of common quality measures quickly come to mind: the use of aspirin, ‐blockers, angiotensin‐converting enzyme inhibitors, and statins in post‐myocardial infarction patients without contraindications,[9, 10] the rapid initiation of appropriate antibiotics to patients with community‐acquired pneumonia,[11] and early endoscopy for patients with acute upper gastrointestinal hemorrhage.[12] I could go on and on, listing in‐hospital interventions supported by class 1 evidence from more than one definitive randomized trial. In essentially all of these situations, the creation of quality metrics, often accompanied by measurement and feedback, have improved adherence and undoubtedly saved lives. But although adherence has improved, the explosion in evidence‐based medicine means that even the best hospitals may be in perpetual catch‐up mode as they try to ensure adherence with the next wave of improvement interventions.
Unfortunately, every now and then a lot of attention is paid to meeting a quality metric that turns out to be misguided. Perhaps the best recent in‐hospital example was the metric of prophylactic ‐blocker use before major noncardiac surgery. Although this recommendation initially appeared to be based on reasonable data,[13] the large Perioperative Ischemic Evaluation Study (POISE) trial showed that reductions in rates of myocardial infarction were more than offset by an increased risk of stroke and other complications; therefore, average‐risk patients actually did worse, not better, with the ‐blocker regimen used in the trial. Although some have questioned whether these results were a function of the precise ‐blocker regimen that was used, the results of POISE are actually remarkably consistent with prior data on the risk of myocardial infarction and stroke.[14, 15] What was really different was the relative importance of these and other end points in patients whose risk of cardiac death was lower than those of higher risk patients in prior studies. But more recently, an even more disturbing reality has emerged: a number of key reports on which the guidelines were based came from an investigator whose publications included data that could not be confirmed when his studies were reviewed by his home institution.[16] Regardless of the precise reasons, we no longer routinely recommend an intervention that at one time was a key quality indicator.
The ‐blocker fiasco brings me back to bloodletting. In the early 19th century, a hypothetical visionary physician interested in quality improvement would likely have looked for ways to improve the efficiency and reduce the cost of bloodletting. Perhaps the leeches could be bigger, hungrier, or applied in a more effective fashion? Or perhaps vacuum tubes would have been invented sooner?
Of course, I am overemphasizing to prove a point. I truly believe that more and more of what we recommend is based on solid evidence to document, at least for now, that we are doing the right thing. If we do it more often and in more people, net benefit will be realized.
What does all this mean for the future of hospital medicine and its emerging research endeavors? For me at least, the message is pretty clear. First, we must be careful not to over extrapolate from limited studies in high risk patients, or we will jump to more conclusions like we did with ‐blockers. Second, most advances in medicine require new and better data.
How can new clinical data be generated most quickly and efficiently? One‐off studies at individual institutions are logistically and financially challenging, whereas an enduring research infrastructure is a treasure that can study a series of questions as they arise. The Thrombolysis in Myocardial Infarction Study Group has published scores of papers looking at a series of interventions in patients with acute myocardial infarction and the acute coronary syndrome.[17, 18] The Acute Respiratory Distress Syndrome Network has demonstrated the value of lower tidal volumes and less aggressive fluid strategies in patients with respiratory failure.[19, 20]
The success of these large, multicenter research networks should become the paradigm for the study of common hospital problems, ranging from the conditions that result in admission on the medical service to the problems that have engendered surgical comanagement services. New data can be gleaned by studying the medical care system, by studying routinely gathered administrative and clinical data, or even better yet, by gathering prospective data on patients and their diseases. For hospitalized patients, a variety of unanswered questions remain regarding the epidemiology of common diseases, the value of diagnostic tests, the impact of various therapies and treatment protocols, and the incremental value of new technologies, ranging from self‐monitoring to handheld ultrasound. High‐quality research may address the genetic epidemiology of why one person is admitted with pneumococcal pneumonia, whereas family members seem perfectly healthy; which patients with a particular diagnosis might be managed for different lengths of time in different settings; what physical findings or diagnostic tests best stratify prognosis; what new technologies are truly worth their cost; and especially, what therapies really work.
I do not dispute that hospital medicine researchers should try to improve the current use of interventions that are deemed to be valuable right now. But if that is all the field does, it will be a huge disappointment. Hospitalists should not be relegated to being adherence police who spend their collective research energy finding ways to force themselves to follow recommendations based on data gathered by others.
Hospital medicine researchers are uniquely positioned to discover new information that will change what should be done and help create the quality metrics for the future. Unless both of these two goalsimproving the implementation of today's knowledge and generating new and better knowledgeare part of the research agenda, we run the risk that some of the best minds in internal medicine may, when all is said and done, have spent an inordinate number of IQ hours on what, a century from now, will be reminiscent of improving the quality of bloodletting.
- . Bloodletting over the centuries. NY State J Med. 1980;80:2022–2028.
- . The death of George Washington: an end to the controversy? Am Surg. 2008;74:770–774.
- . The death of George Washington (1732–1799) and the history of cynanche. J Med Biogr. 2005;13:225–231.
- , . Hepcidin and the iron‐infection axis. Science. 2012;338:768–772.
- . Leech therapy: a history. J Hist Dent. 2005;53:25–27.
- . Pierre‐Charles‐Alexandre Louis and the evaluation of bloodletting. J R Soc Med. 2006;99:158–160.
- , . The Principles and Practice of Medicine. New York, NY: Appleton and Co.; 1920.
- Cecil RL, Kennedy F, eds. A Textbook of Medicine by American Authors. 1st ed. Philadelphia, PA: WB Saunders; 1927.
- Department of Health and Human Services. Hospital Compare: hospital process of care measures tables. Available at: http://www.hospitalcompare.hhs.gov/staticpages/for‐consumers/poc/explainations‐of‐measures.aspx. Accessed January 3, 2013.
- , , . Trends in the use of lipid‐lowering medications at discharge in patients with acute myocardial infarction: 1998 to 2006. Am Heart J. 2009;157:185–194.
- , , , et al. Guideline‐concordant therapy and reduced mortality and length of stay in adults with community‐acquired pneumonia: playing by the rules. Arch Intern Med. 2009;169:1525–1531.
- , , , et al. International consensus recommendations on the management of patients with nonvariceal upper gastrointestinal bleeding. Ann Intern Med. 2010;152:101–113.
- , . β‐blockers and reduction of cardiac events in noncardiac surgery. JAMA. 2002;287:1445–1447.
- , , , et al; POISE Study Group. Effects of extended‐release metoprolol succinate in patients undergoing non‐cardiac surgery (POISE trial): a randomised controlled trial. Lancet. 2008;371:1839–1847.
- , , , et al. Perioperative beta blockers in patients having non‐cardiac surgery: a meta‐analysis. Lancet. 2008;372:1962–1976.
- Report on the 2012 follow‐up investigation of possible breaches of academic integrity. Erasmus MC Follow‐up Investigation Committee, 2012. Available at: http://www.eramusmc.nl. . Accessed January 3, 2013.
- , , , et al. Rivaroxaban in patients with a recent acute coronary syndrome. N Engl J Med. 2012;366:9–19.
- , , , et al. Addition of clopidogrel to aspirin and fibrinolytic therapy for myocardial infarction with ST‐segment elevation. N Engl J Med. 2005;352:1179–1189.
- Acute Respiratory Distress Syndrome Network: ventilation with lower tidal volumes as compared with traditional tidal volumes for acute lung injury and the acute respiratory distress syndrome. N Engl J Med. 2000;342:1301–1308.
- The National Heart, Lung, and Blood Institute Acute Respiratory Distress Syndrome (ARDS) Clinical Trials Network: comparison of two fluid‐management strategies in acute lung injury. N Engl J Med. 2006;354:2564–2575.
- . Bloodletting over the centuries. NY State J Med. 1980;80:2022–2028.
- . The death of George Washington: an end to the controversy? Am Surg. 2008;74:770–774.
- . The death of George Washington (1732–1799) and the history of cynanche. J Med Biogr. 2005;13:225–231.
- , . Hepcidin and the iron‐infection axis. Science. 2012;338:768–772.
- . Leech therapy: a history. J Hist Dent. 2005;53:25–27.
- . Pierre‐Charles‐Alexandre Louis and the evaluation of bloodletting. J R Soc Med. 2006;99:158–160.
- , . The Principles and Practice of Medicine. New York, NY: Appleton and Co.; 1920.
- Cecil RL, Kennedy F, eds. A Textbook of Medicine by American Authors. 1st ed. Philadelphia, PA: WB Saunders; 1927.
- Department of Health and Human Services. Hospital Compare: hospital process of care measures tables. Available at: http://www.hospitalcompare.hhs.gov/staticpages/for‐consumers/poc/explainations‐of‐measures.aspx. Accessed January 3, 2013.
- , , . Trends in the use of lipid‐lowering medications at discharge in patients with acute myocardial infarction: 1998 to 2006. Am Heart J. 2009;157:185–194.
- , , , et al. Guideline‐concordant therapy and reduced mortality and length of stay in adults with community‐acquired pneumonia: playing by the rules. Arch Intern Med. 2009;169:1525–1531.
- , , , et al. International consensus recommendations on the management of patients with nonvariceal upper gastrointestinal bleeding. Ann Intern Med. 2010;152:101–113.
- , . β‐blockers and reduction of cardiac events in noncardiac surgery. JAMA. 2002;287:1445–1447.
- , , , et al; POISE Study Group. Effects of extended‐release metoprolol succinate in patients undergoing non‐cardiac surgery (POISE trial): a randomised controlled trial. Lancet. 2008;371:1839–1847.
- , , , et al. Perioperative beta blockers in patients having non‐cardiac surgery: a meta‐analysis. Lancet. 2008;372:1962–1976.
- Report on the 2012 follow‐up investigation of possible breaches of academic integrity. Erasmus MC Follow‐up Investigation Committee, 2012. Available at: http://www.eramusmc.nl. . Accessed January 3, 2013.
- , , , et al. Rivaroxaban in patients with a recent acute coronary syndrome. N Engl J Med. 2012;366:9–19.
- , , , et al. Addition of clopidogrel to aspirin and fibrinolytic therapy for myocardial infarction with ST‐segment elevation. N Engl J Med. 2005;352:1179–1189.
- Acute Respiratory Distress Syndrome Network: ventilation with lower tidal volumes as compared with traditional tidal volumes for acute lung injury and the acute respiratory distress syndrome. N Engl J Med. 2000;342:1301–1308.
- The National Heart, Lung, and Blood Institute Acute Respiratory Distress Syndrome (ARDS) Clinical Trials Network: comparison of two fluid‐management strategies in acute lung injury. N Engl J Med. 2006;354:2564–2575.
Chronic suppurative otitis media
Chronic suppurative otitis media remains a global burden for children despite the declining incidence in industrialized countries and advances in diagnosis and management in developing countries. The World Health Organization cites chronic suppurative otitis media (CSOM) as a major cause of acquired hearing loss, primarily in developing countries and indigenous peoples.
CSOM is characterized by a persistent discharge from the middle ear lasting for a minimum of 2 weeks. In industrialized countries, the major risk factor is tympanostomy tube placement; in developing nations, the major risk factor is early bacterial colonization with Streptococcus pneumoniae and nontypable Haemophilus influenzae and early onset of acute bacterial otitis media with perforation. In both situations, biofilms are thought to underlie the pathogenesis with S. pneumoniae and nontypable H. influenzae found on mucosal biopsies using specific fluorescent in situ hybridization assays on specimens from children with chronic suppurative otitis media or recurrent acute otitis media (ROM). Dr. Ruth B. Thornton and her colleagues reported that 11 of 17 (65%) middle-ear mucosal biopsies from children with CSOM or ROM showed evidence of bacterial biofilm, and 12 (71%) demonstrated intracellular bacteria (Pediatrics 2011;11:94).

Microbiologic studies in children with otorrhea, through either a perforation or tympanostomy tube, demonstrate primarily Staphylococcus aureus, both methicillin sensitive and resistant isolates, and Pseudomonas aeruginosa. However, it is recognized that the early pathogens are S. pneumoniae and nontypable H. influenzae in these children recovered both from cultures of ear drainage and from molecular studies of middle-ear mucosal biopsies. Amanda J. Leach, Ph.D., and Peter S. Morris, Ph.D., reported that cultures from ear discharge in Aborigine children with acute perforations identified nontypable H. influenzae in 57%, S. pneumoniae in 34%, and both in 21% (Pediatr. Inf. Dis. J. 2007;26:S4-7).
The high rate of mixed infection has also been reported in Bedouin children with recurrent and persistent otitis. In children with otorrhea from a tympanostomy tube, a dichotomy in microbiology etiology was found. In young children, nasopharyngeal pathogens (S. pneumoniae and nontypable H. influenzae) dominated and in older children, external ear commensals (Staph. aureus and P. aeruginosa) predominated (Int. J. Pediatr. Otorhinolaryngol. 2003;67:1317-23).
In industrialized countries, successful treatment of young children with otorrhea through a tympanostomy tube has been reported with both oral amoxicillin/clavulanate and topical fluoroquinolones, reflecting the frequent role of S. pneumoniae and nontypable H. influenzae in young children. However, in older children, in those with foul-smelling discharge, and in those who fail amoxicillin/clavulanate, topical fluoroquinolone is the treatment of choice. Guidelines for the treatment of otorrhea through a tympanostomy tube have been published with a recommendation that topical therapy be used as the first choice when systemic signs of illness are not present (J. Otolaryngol. 2005;34[suppl. 2]:S60-3). Treatment failures are most often due to methicillin-resistant Staph. aureus (MRSA) and often require a combination of oral therapy with an agent active against MRSA such as trimethoprim/sulfamethoxazole and topical therapy with a fluoroquinolone; removal of the tympanostomy tube also may be necessary to achieve a cure.
The prevention of chronic suppurative otitis media has proven elusive. Studies of 7-valent pneumococcal conjugate (PCV7) vaccine in Dutch children with established ROM demonstrated no reduction in episodes. In fact, more episodes of AOM or otorrhea were observed in the vaccine group, despite good immunogenicity and a reduction in colonization with vaccine-type S. pneumoniae (Int. J. Pediatr. Otorhinolaryngol. 2006;70:275-85).
In studies of PCV7 administered at 2, 4, and 6 months of age to Aborigine infants, only a marginal benefit was observed when they were compared with a historical birth cohort. By 12 months of age, 89% of those vaccinated had experienced AOM; 34%, AOM with perforation; and 14%, CSOM. Although not statistically significant, this represented a 40% decrease in CSOM at 1 year of age (BMC Pediatr. 2009;9:14).
CSOM persists as an important cause of morbidity in indigenous children and in children in developing countries. It is a major cause of acquired hearing loss and impacts dramatically on the quality of life of affected children. We have made important advances in identifying the bacterial antecedents and understanding the pathogenesis of disease, yet morbidity remains substantial. Further research in the treatment and prevention of middle-ear biofilms is likely to be critical to reducing the burden of ear disease in children.
Dr. Pelton is chief of pediatric infectious disease and also is the coordinator of the maternal-child HIV program at Boston Medical Center. He disclosed that he has received honoraria and investigator-initiated research funding from Pfizer and Merck, and honoraria from GlaxoSmithKline related to pneumococcal vaccines. E-mail him at pdnews@elsevier.com.
Chronic suppurative otitis media remains a global burden for children despite the declining incidence in industrialized countries and advances in diagnosis and management in developing countries. The World Health Organization cites chronic suppurative otitis media (CSOM) as a major cause of acquired hearing loss, primarily in developing countries and indigenous peoples.
CSOM is characterized by a persistent discharge from the middle ear lasting for a minimum of 2 weeks. In industrialized countries, the major risk factor is tympanostomy tube placement; in developing nations, the major risk factor is early bacterial colonization with Streptococcus pneumoniae and nontypable Haemophilus influenzae and early onset of acute bacterial otitis media with perforation. In both situations, biofilms are thought to underlie the pathogenesis with S. pneumoniae and nontypable H. influenzae found on mucosal biopsies using specific fluorescent in situ hybridization assays on specimens from children with chronic suppurative otitis media or recurrent acute otitis media (ROM). Dr. Ruth B. Thornton and her colleagues reported that 11 of 17 (65%) middle-ear mucosal biopsies from children with CSOM or ROM showed evidence of bacterial biofilm, and 12 (71%) demonstrated intracellular bacteria (Pediatrics 2011;11:94).
Microbiologic studies in children with otorrhea, through either a perforation or tympanostomy tube, demonstrate primarily Staphylococcus aureus, both methicillin sensitive and resistant isolates, and Pseudomonas aeruginosa. However, it is recognized that the early pathogens are S. pneumoniae and nontypable H. influenzae in these children recovered both from cultures of ear drainage and from molecular studies of middle-ear mucosal biopsies. Amanda J. Leach, Ph.D., and Peter S. Morris, Ph.D., reported that cultures from ear discharge in Aborigine children with acute perforations identified nontypable H. influenzae in 57%, S. pneumoniae in 34%, and both in 21% (Pediatr. Inf. Dis. J. 2007;26:S4-7).
The high rate of mixed infection has also been reported in Bedouin children with recurrent and persistent otitis. In children with otorrhea from a tympanostomy tube, a dichotomy in microbiology etiology was found. In young children, nasopharyngeal pathogens (S. pneumoniae and nontypable H. influenzae) dominated and in older children, external ear commensals (Staph. aureus and P. aeruginosa) predominated (Int. J. Pediatr. Otorhinolaryngol. 2003;67:1317-23).
In industrialized countries, successful treatment of young children with otorrhea through a tympanostomy tube has been reported with both oral amoxicillin/clavulanate and topical fluoroquinolones, reflecting the frequent role of S. pneumoniae and nontypable H. influenzae in young children. However, in older children, in those with foul-smelling discharge, and in those who fail amoxicillin/clavulanate, topical fluoroquinolone is the treatment of choice. Guidelines for the treatment of otorrhea through a tympanostomy tube have been published with a recommendation that topical therapy be used as the first choice when systemic signs of illness are not present (J. Otolaryngol. 2005;34[suppl. 2]:S60-3). Treatment failures are most often due to methicillin-resistant Staph. aureus (MRSA) and often require a combination of oral therapy with an agent active against MRSA such as trimethoprim/sulfamethoxazole and topical therapy with a fluoroquinolone; removal of the tympanostomy tube also may be necessary to achieve a cure.
The prevention of chronic suppurative otitis media has proven elusive. Studies of 7-valent pneumococcal conjugate (PCV7) vaccine in Dutch children with established ROM demonstrated no reduction in episodes. In fact, more episodes of AOM or otorrhea were observed in the vaccine group, despite good immunogenicity and a reduction in colonization with vaccine-type S. pneumoniae (Int. J. Pediatr. Otorhinolaryngol. 2006;70:275-85).
In studies of PCV7 administered at 2, 4, and 6 months of age to Aborigine infants, only a marginal benefit was observed when they were compared with a historical birth cohort. By 12 months of age, 89% of those vaccinated had experienced AOM; 34%, AOM with perforation; and 14%, CSOM. Although not statistically significant, this represented a 40% decrease in CSOM at 1 year of age (BMC Pediatr. 2009;9:14).
CSOM persists as an important cause of morbidity in indigenous children and in children in developing countries. It is a major cause of acquired hearing loss and impacts dramatically on the quality of life of affected children. We have made important advances in identifying the bacterial antecedents and understanding the pathogenesis of disease, yet morbidity remains substantial. Further research in the treatment and prevention of middle-ear biofilms is likely to be critical to reducing the burden of ear disease in children.
Dr. Pelton is chief of pediatric infectious disease and also is the coordinator of the maternal-child HIV program at Boston Medical Center. He disclosed that he has received honoraria and investigator-initiated research funding from Pfizer and Merck, and honoraria from GlaxoSmithKline related to pneumococcal vaccines. E-mail him at pdnews@elsevier.com.
Chronic suppurative otitis media remains a global burden for children despite the declining incidence in industrialized countries and advances in diagnosis and management in developing countries. The World Health Organization cites chronic suppurative otitis media (CSOM) as a major cause of acquired hearing loss, primarily in developing countries and indigenous peoples.
CSOM is characterized by a persistent discharge from the middle ear lasting for a minimum of 2 weeks. In industrialized countries, the major risk factor is tympanostomy tube placement; in developing nations, the major risk factor is early bacterial colonization with Streptococcus pneumoniae and nontypable Haemophilus influenzae and early onset of acute bacterial otitis media with perforation. In both situations, biofilms are thought to underlie the pathogenesis with S. pneumoniae and nontypable H. influenzae found on mucosal biopsies using specific fluorescent in situ hybridization assays on specimens from children with chronic suppurative otitis media or recurrent acute otitis media (ROM). Dr. Ruth B. Thornton and her colleagues reported that 11 of 17 (65%) middle-ear mucosal biopsies from children with CSOM or ROM showed evidence of bacterial biofilm, and 12 (71%) demonstrated intracellular bacteria (Pediatrics 2011;11:94).
Microbiologic studies in children with otorrhea, through either a perforation or tympanostomy tube, demonstrate primarily Staphylococcus aureus, both methicillin sensitive and resistant isolates, and Pseudomonas aeruginosa. However, it is recognized that the early pathogens are S. pneumoniae and nontypable H. influenzae in these children recovered both from cultures of ear drainage and from molecular studies of middle-ear mucosal biopsies. Amanda J. Leach, Ph.D., and Peter S. Morris, Ph.D., reported that cultures from ear discharge in Aborigine children with acute perforations identified nontypable H. influenzae in 57%, S. pneumoniae in 34%, and both in 21% (Pediatr. Inf. Dis. J. 2007;26:S4-7).
The high rate of mixed infection has also been reported in Bedouin children with recurrent and persistent otitis. In children with otorrhea from a tympanostomy tube, a dichotomy in microbiology etiology was found. In young children, nasopharyngeal pathogens (S. pneumoniae and nontypable H. influenzae) dominated and in older children, external ear commensals (Staph. aureus and P. aeruginosa) predominated (Int. J. Pediatr. Otorhinolaryngol. 2003;67:1317-23).
In industrialized countries, successful treatment of young children with otorrhea through a tympanostomy tube has been reported with both oral amoxicillin/clavulanate and topical fluoroquinolones, reflecting the frequent role of S. pneumoniae and nontypable H. influenzae in young children. However, in older children, in those with foul-smelling discharge, and in those who fail amoxicillin/clavulanate, topical fluoroquinolone is the treatment of choice. Guidelines for the treatment of otorrhea through a tympanostomy tube have been published with a recommendation that topical therapy be used as the first choice when systemic signs of illness are not present (J. Otolaryngol. 2005;34[suppl. 2]:S60-3). Treatment failures are most often due to methicillin-resistant Staph. aureus (MRSA) and often require a combination of oral therapy with an agent active against MRSA such as trimethoprim/sulfamethoxazole and topical therapy with a fluoroquinolone; removal of the tympanostomy tube also may be necessary to achieve a cure.
The prevention of chronic suppurative otitis media has proven elusive. Studies of 7-valent pneumococcal conjugate (PCV7) vaccine in Dutch children with established ROM demonstrated no reduction in episodes. In fact, more episodes of AOM or otorrhea were observed in the vaccine group, despite good immunogenicity and a reduction in colonization with vaccine-type S. pneumoniae (Int. J. Pediatr. Otorhinolaryngol. 2006;70:275-85).
In studies of PCV7 administered at 2, 4, and 6 months of age to Aborigine infants, only a marginal benefit was observed when they were compared with a historical birth cohort. By 12 months of age, 89% of those vaccinated had experienced AOM; 34%, AOM with perforation; and 14%, CSOM. Although not statistically significant, this represented a 40% decrease in CSOM at 1 year of age (BMC Pediatr. 2009;9:14).
CSOM persists as an important cause of morbidity in indigenous children and in children in developing countries. It is a major cause of acquired hearing loss and impacts dramatically on the quality of life of affected children. We have made important advances in identifying the bacterial antecedents and understanding the pathogenesis of disease, yet morbidity remains substantial. Further research in the treatment and prevention of middle-ear biofilms is likely to be critical to reducing the burden of ear disease in children.
Dr. Pelton is chief of pediatric infectious disease and also is the coordinator of the maternal-child HIV program at Boston Medical Center. He disclosed that he has received honoraria and investigator-initiated research funding from Pfizer and Merck, and honoraria from GlaxoSmithKline related to pneumococcal vaccines. E-mail him at pdnews@elsevier.com.

IVC Filters in Bariatric Surgery
The use of inferior vena cava (IVC) filters has increased substantially in recent years. These medical devices, which are used to prevent pulmonary embolism in patients considered to be at high risk of venous thromboembolism, were placed in 167,000 patients in 2007.1 In 2012, it is estimated that 259,000 patients will undergo placement of an IVC filter, an increase of 55%.[1] Increasing use of IVC filters is attributable to the development of retrievable versions of the devices, which have expanded indications for use such as in bariatric surgery.
Unfortunately, the increase in the use of IVC filters has been accompanied by an increase in reports of adverse events in patients receiving them. The United States Food and Drug Administration (FDA) has received more than 900 adverse event reports involving IVC filters, prompting the agency to issue a warning about their use.[2] A prior study by our group demonstrated a lack of benefit of IVC filter insertion for the prevention of pulmonary embolism among bariatric surgery patients but lacked statistical power to prove harms associated with this practice.[3]
In the current study, we analyzed data from the prospective, statewide, clinical registry of the Michigan Bariatric Surgery Collaborative. Our study population now includes 35,477 bariatric surgery patients from 32 hospitals whose procedures were performed between 2006 and 2012. Since the publication of our prior study, the use of IVC filters in bariatric surgery has decreased significantly in Michigan. For this reason, our study population now includes many more high‐risk patients who did not undergo IVC filter placement, allowing us to match IVC filter patients to similarly high‐risk patients who did not receive IVC filters. We used these data to compare outcomes within 30 days of surgery, including rates of venous thromboembolism, overall serious complications, and death among patients who did and not receive IVC filters.
METHODS
Study Setting
The Michigan Bariatric Surgery Collaborative (MBSC) is a regional voluntary consortium of hospitals and surgeons that perform bariatric surgery in Michigan. The goal of the project is to improve the quality of care for patients undergoing bariatric surgery. To do this, the participating hospitals submit data to the MBSC clinical outcomes registry, patient survey, and surgeon survey databases. Three times per year the group meets to examine these data and to design and implement changes in care to improve the outcomes of care for bariatric patients. The project is funded by Blue Cross and Blue Shield of Michigan/Blue Care Network and coordinated by faculty and staff members from the Center for Healthcare Outcomes and Policy at the University of Michigan.
The MBSC held its first collaborative meeting in June 2005 and enrolled its first patient in June 2006. The MBSC now has the participation of all of the 32 bariatric programs in Michigan, enrolling approximately 6000 patients per year in its clinical registry. Participating hospitals submit data from a review of the medical records for all of their bariatric surgery patients. This review is conducted for each patient at 30 days after surgery. The information collected includes preoperative clinical characteristics and conditions as well as perioperative clinical care and outcomes. The medical record reviews are performed by centrally trained, nurse data abstractors using a standardized and validated instrument. Each participating hospital is site visited annually to verify the accuracy and completeness of their MBSC clinical registry data.
Study Population
This study includes data for 35,477 patients undergoing bariatric surgery, including: 9829 laparoscopic adjustable gastric band, 6068 sleeve gastrectomy, 19,141 gastric bypass, and 439 biliopancreatic diversion with duodenal switch procedures between June 2006 and September 2012. Patients undergoing revisional bariatric surgery were excluded from these analyses. Prior to surgery, 1077 (3.0%) of these patients had a prophylactic IVC filter placed for prevention of pulmonary embolism. Of the IVC filters placed, 39% were temporary IVC filters, 45% were permanent IVC filters, and the type of IVC filter was not known in 15%.
Baseline Clinical Characteristics
Data collected included patient demographic characteristics (age, gender, race, type of insurance), clinical characteristics (height, weight, history of cigarette smoking, mobility limitations), and obesity‐related and other comorbid conditions (lung disease, cardiovascular disease, hyperlipidemia, gastroesophageal reflux disease, peptic ulcer disease, cholelithiasis, urinary incontinence, renal disease, diabetes, liver disease, prior history of venous thromboembolism, sleep apnea, and psychological disorders).
Risk factors for VTE were empirically derived from our data base using multivariate statistical models. Risk factors for VTE included: age, body mass index, male sex, current or past smoking, mobility limitations, asthma, home oxygen use, peripheral vascular disease, prior history of VTE, bariatric procedure time, and procedure type. The baseline predicted risk for VTE was calculated for each patient based on these risk factors and was used to divide patients into low‐ (predicted risk <1%), medium‐ (predicted risk 1%2.5%), and high‐ (predicted risk 2.5%) risk groups. Among the 35,477 patients in the registry overall, 95% are in the low‐risk group, 4% are in the medium‐risk group, and 1% are in the high‐risk group. In the matched study cohorts, 69%, 22%, and 9% were in the high‐, medium‐, and low‐risk groups, respectively.
Medical Venous Thromboembolism Prophylaxis
Data were also collected regarding the type of medical venous thromboembolism prophylaxis (unfractionated vs low molecular weight heparin) used preoperatively, postoperatively, and whether the patient was discharged to home on low molecular weight heparin.
Outcomes
Our primary outcome measures included postoperative venous thromboembolism (deep vein thrombosis or pulmonary embolism requiring treatment). We also assessed overall rate of complications and complications according to severity as follows: non‐life threatening complications (surgical site infection including wound and port site infections treated with antibiotics and/or wound opening, anastomotic stricture requiring dilatation, bleeding requiring blood transfusion of <4 units, and pneumonia requiring treatment with antibiotics only); potentially life‐threatening complications (abdominal abscess requiring percutaneous drainage or reoperation, bowel obstruction requiring reoperation, leak requiring percutaneous drainage or reoperation, bleeding requiring transfusion >4 units, reoperation, or splenectomy, band‐related problems requiring reoperation, respiratory failure requiring 2 to 7 days intubation, renal failure requiring in‐hospital dialysis, wound infection/dehiscence requiring reoperation, and venous thromboembolism); and life‐threatening complications associated with residual and lasting disability or death (myocardial infarction or cardiac arrest, renal failure requiring long‐term dialysis, respiratory failure requiring >7 days intubation or tracheostomy, and death). Other complications that are not included in these categories (eg, IVC filter related) were assessed by an end points committee to determine their severity (non‐life threatening, potentially life threatening, or life threatening associated with residual and lasting disability or death).
Statistical Analyses
We used propensity score matching to assemble cohorts in which patients with and without IVC filters were balanced on baseline characteristics. The probability of IVC filter placement was estimated for each patient using a nonparsimonious multivariate logistic regression model, in which IVC filter was the dependent variable and all of the demographic, weight, medical history, weight‐related comorbidity, and procedure‐related variables (type, length, and year of procedure; and medical venous thromboembolism prophylaxis used) in our dataset were included as covariates. IVC filter patients were matched to control patients using a greedy, 1‐ to ‐1 matching without replacement protocol resulting in cohorts that were well balanced on all baseline characteristics.
Baseline characteristics and outcomes were then compared among the cohorts using [2] and t tests as appropriate. We used mixed effects logistic regression to compare outcomes between the 2 treatment groups while controlling for clustering at the hospital and surgeon level as random effects. Odds ratios (OR) and 95% confidence intervals (CI) were calculated to compare outcomes among patients with and without IVC filters.
RESULTS
Matching resulted in cohorts of IVC filter and control patients who were well balanced on all baseline characteristics (Table 1). In contrast, there were large and significant differences between IVC filter patients and unmatched control patients. For example, mean body mass index was 58 and 57 in the matched cohorts and 47 in the unmatched control patients. Prior history of venous thromboembolism was present in 39%, 39%, and 2% of the IVC filter, matched control, and unmatched control patients, respectively. With regard to procedure mix, unmatched control patients were less likely to have open gastric bypass and more likely to have adjustable gastric band procedures than IVC filter or matched control patients.
| Variable | IVC Filter | Matched Controls | P Value | Unmatched Controls | P Value |
|---|---|---|---|---|---|
| |||||
| No. | 1077 | 1077 | 33,323 | ||
| Age (mean, y) | 48 | 49 | 0.295 | 46 | <0.0001 |
| Body mass index (mean, kg/m2) | 58 | 57 | 0.061 | 47 | <0.0001 |
| Male gender (%) | 32 | 31 | 0.546 | 21 | <0.0001 |
| Black race (%) | 27 | 25 | 0.667 | 15 | <0.0001 |
| Private Insurance (%) | 62 | 64 | 0.305 | 74 | <0.0001 |
| Smoking in past year (%) | 2 | 2 | 0.883 | 2 | 0.440 |
| Mobility limitations (%) | 18 | 18 | 0.780 | 5 | <0.0001 |
| Lung dsease (%) | 43 | 43 | 1.000 | 25 | <0.0001 |
| Cardiovascular disease (%) | 21 | 21 | 0.874 | 10 | <0.0001 |
| Hypertension (%) | 72 | 72 | 0.737 | 53 | <0.0001 |
| Hyperlipidemia (%) | 59 | 59 | 0.930 | 50 | <0.0001 |
| GERD (%) | 50 | 52 | 0.490 | 49 | 0.417 |
| Peptic ulcer disease (%) | 5 | 4 | 0.228 | 3 | <0.0001 |
| Cholelithiasis (%) | 30 | 30 | 0.963 | 27 | 0.018 |
| Urinary incontinence (%) | 25 | 25 | 0.960 | 22 | 0.029 |
| Renal failure (%) | 0.4 | 0.6 | 0.526 | 0.2 | 0.298 |
| Diabetes (%) | 46 | 48 | 0.546 | 33 | <0.0001 |
| Liver disorder (%) | 4 | 4 | 0.584 | 5 | 0.184 |
| Prior history of VTE (%) | 39 | 39 | 0.965 | 2 | <0.0001 |
| Sleep apnea (%) | 70 | 68 | 0.209 | 43 | <0.0001 |
| Musculoskeletal disorder (%) | 78 | 80 | 0.221 | 77 | 0.189 |
| History of hernia repair (%) | 5 | 6 | 0.924 | 3 | <0.0001 |
| Psychological disorder (%) | 49 | 49 | 0.796 | 47 | 0.267 |
| Total comorbidities (mean, no.) | 6 | 6 | 0.922 | 4 | <0.0001 |
| Procedure | |||||
| Adjustable gastric banding (%) | 15 | 17 | 0.099 | 29 | <0.0001 |
| Sleeve gastrectomy (%) | 12 | 13 | 0.515 | 17 | <0.0001 |
| Gastric bypass (%) | 73 | 69 | 0.058 | 53 | <0.0001 |
| Duodenal switch (%) | 0.7 | 0.8 | 0.616 | 1.3 | <0.0001 |
| Procedure Length (mean, minutes) | 114 | 116 | 0.427 | 95 | <0.0001 |
| Medical VTE prophylaxis | |||||
| Preoperative heparin: | |||||
| Unfractionated (%) | 36 | 38 | 0.246 | 34 | 0.306 |
| Low molecular weight (%) | 60 | 54 | 0.017 | 53 | <0.0001 |
| Postoperative heparin: | |||||
| Unfractionated (%) | 7 | 10 | 0.023 | 19 | <0.0001 |
| Low molecular weight (%) | 70 | 68 | 0.326 | 64 | <0.0001 |
| Postdischarge heparin: | |||||
| Low molecular weight (%) | 72 | 66 | 0.003 | 16 | <0.0001 |
With regard to outcomes (Table 2, Figures 1 and 2), IVC filter patients had significantly higher rates of venous thromboembolism (1.9% vs 0.74%; OR, 2.7; 95% CI, 1.1‐6.3; P=0.027) and deep vein thrombosis (1.2% vs 0.37%, OR, 3.3; 95% CI, 1.1‐10.1; P=0.039) than matched control patients. Rates of pulmonary embolism were higher among IVC filter patients, but the difference was not statistically significant (0.84% vs 0.46%; OR, 2.0; 95% CI, 0.6‐6.5; P=0.232). Rates of pulmonary embolism were similar for patients with a low baseline risk of venous thromboembolism (0.27% vs 0.27%; OR, 1.0; 95% CI, 0.1‐7.7; P=0.965) but were higher for medium‐risk patients (2.1% vs 0.87%; OR, 2.5; 95% CI, 0.5‐12.7; P=0.288) and high‐risk patients (2.1% vs 0.97%; OR, 2.2; 95% CI, 0.2‐24.3; P=0.530).
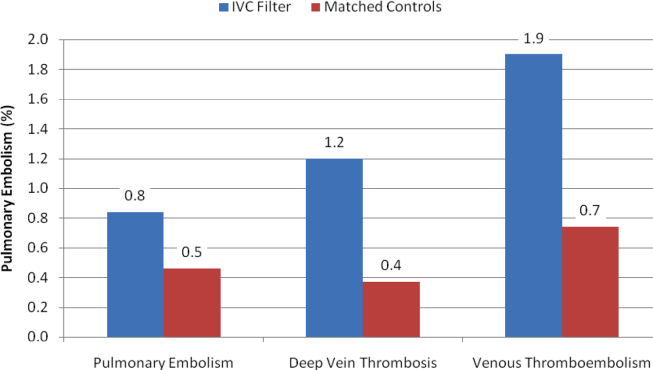
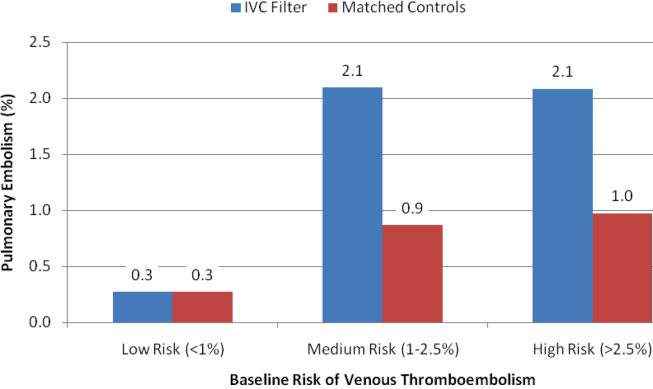
| Outcomes | Odds Ratio | 95% Confidence Interval | P Value |
|---|---|---|---|
| Venous thromboembolism | 2.7 | 1.16.3 | 0.027 |
| Deep vein thrombosis | 3.3 | 1.110.1 | 0.039 |
| Pulmonary embolism | 2.0 | 0.66.5 | 0.232 |
| Low‐risk subgroup | 1.0 | 0.17.7 | 0.965 |
| Medium‐risk subgroup | 2.5 | 0.512.7 | 0.288 |
| High‐risk subgroup | 2.2 | 0.224.3 | 0.530 |
| Any complication | 1.3 | 1.01.7 | 0.048 |
| Serious complication | 1.6 | 1.02.4 | 0.031 |
| Permanently disabling complication | 4.3 | 1.215.6 | 0.028 |
| Death | 7.0 | 0.957.3 | 0.068 |
Rates of other complications were also higher among IVC filter than matched control patients (Table 2 and Figure 3). There were significantly higher rates of complications (15.2% vs 11.6%; OR, 1.3; 95% CI, 1.0‐1.7; P=0.048), serious complications (5.8% vs 3.8%; OR, 1.6; 95% CI, 1.0‐2.4; P=0.031), and permanently disabling complications (1.2% vs 0.4%; OR, 4.3; 95% CI, 1.2‐15.6; P=0.028) among IVC filter patients. Rates of death (0.7% vs 0.1%; OR, 7.0; 95% CI, 0.9‐57.3; P=0.068) were also higher among IVC filter patients than matched control patients, but this difference was not statistically significant.
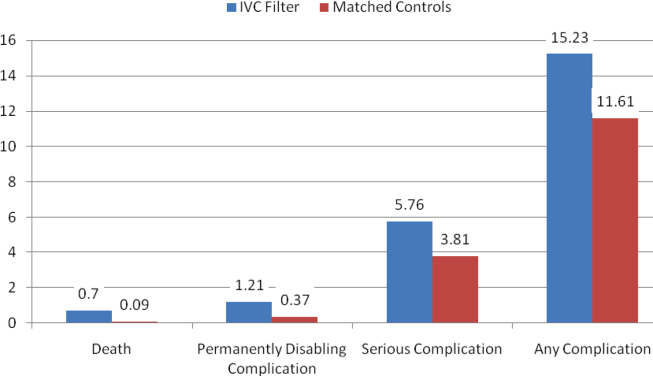
Among the 7 IVC filter patients who died, 4 had fatal pulmonary embolism, and 2 had IVC filter thrombosis/occlusion. Other IVC filter‐specific complications included IVC filter migration requiring heart valve replacement surgery in 1 patient, contrast‐induced nephropathy in 1 patient, IVC filter incision site infection in 1 patient, and technical difficulties removing a temporary IVC filter requiring that the device stay in place in 1 patient.
DISCUSSION
In this propensity matched, observational cohort study, we assessed the safety and effectiveness of prophylactic IVC filters among bariatric surgery patients. We found that patients with IVC filters had significantly worse outcomes than comparably high‐risk patients without IVC filters. Rates of venous thromboembolism were higher in the IVC filter patients, and a large proportion of the other complications among IVC filter patients were device related.
Our current study of IVC filters was prompted by an FDA advisory report regarding complications in patients receiving IVC filters.[2] The FDA's report was in turn prompted by a study indicating a high prevalence of strut fracture and embolization among 80 patients who received a certain type of retrievable IVC filter.[4] The FDA conveyed receiving 921 adverse events reports involving IVC filters between 2005 and 2009. Thirty‐six percent of these reports involved migration of the device, 16% were related to breakage and embolization of parts of the device, and 8% involved perforation of the IVC.
Research on the safety and efficacy of IVC filters in bariatric surgery patients has largely been limited to small, single‐center, case series or cohort studies.[5, 6, 7, 8, 9, 10, 11, 12, 13, 14, 15] A systematic review of this literature concluded that the evidence was insufficient to recommend IVC filters for patients undergoing bariatric surgery.[16] A 2010 study by our group was the largest and only multicenter study of IVC filters in the bariatric surgery population. We found no benefit of IVC filters in a comparison of 542 gastric bypass patients with prophylactic IVC filters to 5,834 gastric bypass patients without prophylactic IVC filters.[3]
When interpreting the results of this study, a number of limitations should be considered. Our study was observational, so there is the potential for unmeasured confounding variables to have influenced our results. To minimize the risk of confounding, we used propensity scores to match IVC filter patients to comparably high‐risk control patients, resulting in study cohorts that were well balanced on all baseline variables. Although this method accounts for confounding on the variables for which there are data, there is still the possibility that an unknown confounder could affect our findings. For example, our clinical registry lacks data on hypercoagulable states, so it is possible that a higher proportion of IVC filter patients could have had this risk factor and therefore a higher baseline risk of venous thromboembolism. However, most patients with a hypercoagulable state would have had a prior history of venous thromboembolism, which is a variable included in our database that patients were matched on.
The effects of changes in clinical care occurring during the time frame of this study should be considered in interpreting our findings. For example, bariatric surgery has been getting safer in general over time. Rates of death have fallen both in Michigan and in the rest of the country as bariatric surgeons have gained experience with this procedure. In Michigan during this time period, our group has developed and implemented a risk‐stratified, standardized approach to venous thromboembolism prophylaxis for patients undergoing bariatric surgery. For these reasons, we included the year of the procedure and the type of medical venous thromboembolism prophylaxis (unfractionated or low molecular weight heparin) used perioperatively as a matching variable in our analysis.
Another limitation that should be considered in interpreting our findings is statistical power. Although our study is the largest in this study population to date, many of the outcomes of interest are relatively rare. Considering the entire bariatric surgery population, rates of venous thromboembolism and death within 30 days are each less than 1%. Even in the high‐risk patients included in this analysis, there were a total of just 28 (1.3%) venous thromboembolism events and 8 (0.37) deaths. Nonetheless, our study did find significantly greater risks of multiple types of complications among patients receiving IVC filters.
Finally, our study captures events occurring within 30 days of bariatric surgery. Complications, including venous thromboembolism and other complications directly related to IVC filters, frequently occur after 30 days of bariatric surgery. Therefore, our study may be a conservative estimate of the risks associated with the use of IVC filters in bariatric surgery patients. Furthermore, certain brands of filters have been shown to be associated with higher risks of complications. Our study lacks data on the brand of IVC filter used and so cannot assess the extent to which this would affect our results.
CONCLUSIONS
In conclusion, our study indicates that IVC filters do not reduce the risk of pulmonary embolism in high‐risk bariatric surgery patients. They are also associated with other complications attributable to malfunctions of the device itself. We believe that the use of IVC filters among bariatric surgery patients should be discouraged.
Disclosure
This study was supported by a grant from the Agency for Healthcare Research and Quality (HS018050) and was presented at the Annual Meeting of the American Society for Metabolic and Bariatric Surgery (ASMBS), San Diego, California, June 20, 2012.
- , , . Vena cava filters: a call to action. Chest Physician. 2011;16:18a.
- U.S. Food and Drug Administration. Removing retrievable inferior vena cava filters: initial communication. August 9, 2010. Available at: http://www.fda.gov/MedicalDevices/Safety/AlertsandNotices/ucm221 676.htm. Accessed December 2, 2012.
- , , , et al. Preoperative placement of inferior vena cava filters and outcomes after gastric bypass surgery. Ann Surg. 2010;252:131–318.
- , , , et al. Prevalence of fracture and fragment embolization of Bard retrievable vena cava filters and clinical implications including cardiac perforation and tamponade. Arch Intern Med. 2010;170:1827–1831.
- , , , , , . Experience with inferior vena cava filter placement in patients undergoing open gastric bypass procedures. Ann Vasc Surg. 2006;44: 1301–1305.
- , . Preoperative placement of retrievable inferior vena cava filters in bariatric surgery. Surg Obes Relat Dis. 2007;3: 602–605.
- , , , et al. Safety and efficacy of intravascular ultrasound‐guided inferior vena cava filter in super obese bariatric patients. Surg Obes Relat Dis. 2008;4:50–54.
- , , , , , . Current indications for preoperative inferior vena cava filter insertion in patients undergoing surgery for morbid obesity. Obes Surg. 2005;15:1009–1012.
- , , , . Efficacy of prophylactic inferior vena cava filter placement in bariatric surgery. Surg Obes Relat Dis. 2007;3:606–610.
- , , , et al. Safety, feasibility, and outcome of retrievable vena cava filters in high‐risk surgical patients. J Vasc Surg. 2007;45:784–788.
- , , , . Retrievable inferior vena cava filters may be safely applied in gastric bypass surgery. Surg Endosc. 2007;21:2277–2279.
- , , , , . Inferior vena cava filter placement for pulmonary embolism risk reduction in super morbidly obese undergoing bariatric surgery. Surg Obes Relat Dis. 2007;3:461–464.
- , . A simple venous thromboembolism prophylaxis protocol for patients undergoing bariatric surgery. Obesity (Silver Spring). 2006;14:1961–1965.
- , , , et al. Risk‐group targeted inferior vena cava filter placemetn in gastric bypass patients. Obes Surg. 2009;19:451–455.
- , , , , , . Retreivable inferior vena cava filters in high‐risk patients undergoing bariatric surgery. Surg Endosc. 2009;23:2203–2207.
- , . Inferior vena caval filter insertion prior to bariatric surgery: A systematic review of the literature. J Thromb Haemost. 2010;8:1266–1270.
The use of inferior vena cava (IVC) filters has increased substantially in recent years. These medical devices, which are used to prevent pulmonary embolism in patients considered to be at high risk of venous thromboembolism, were placed in 167,000 patients in 2007.1 In 2012, it is estimated that 259,000 patients will undergo placement of an IVC filter, an increase of 55%.[1] Increasing use of IVC filters is attributable to the development of retrievable versions of the devices, which have expanded indications for use such as in bariatric surgery.
Unfortunately, the increase in the use of IVC filters has been accompanied by an increase in reports of adverse events in patients receiving them. The United States Food and Drug Administration (FDA) has received more than 900 adverse event reports involving IVC filters, prompting the agency to issue a warning about their use.[2] A prior study by our group demonstrated a lack of benefit of IVC filter insertion for the prevention of pulmonary embolism among bariatric surgery patients but lacked statistical power to prove harms associated with this practice.[3]
In the current study, we analyzed data from the prospective, statewide, clinical registry of the Michigan Bariatric Surgery Collaborative. Our study population now includes 35,477 bariatric surgery patients from 32 hospitals whose procedures were performed between 2006 and 2012. Since the publication of our prior study, the use of IVC filters in bariatric surgery has decreased significantly in Michigan. For this reason, our study population now includes many more high‐risk patients who did not undergo IVC filter placement, allowing us to match IVC filter patients to similarly high‐risk patients who did not receive IVC filters. We used these data to compare outcomes within 30 days of surgery, including rates of venous thromboembolism, overall serious complications, and death among patients who did and not receive IVC filters.
METHODS
Study Setting
The Michigan Bariatric Surgery Collaborative (MBSC) is a regional voluntary consortium of hospitals and surgeons that perform bariatric surgery in Michigan. The goal of the project is to improve the quality of care for patients undergoing bariatric surgery. To do this, the participating hospitals submit data to the MBSC clinical outcomes registry, patient survey, and surgeon survey databases. Three times per year the group meets to examine these data and to design and implement changes in care to improve the outcomes of care for bariatric patients. The project is funded by Blue Cross and Blue Shield of Michigan/Blue Care Network and coordinated by faculty and staff members from the Center for Healthcare Outcomes and Policy at the University of Michigan.
The MBSC held its first collaborative meeting in June 2005 and enrolled its first patient in June 2006. The MBSC now has the participation of all of the 32 bariatric programs in Michigan, enrolling approximately 6000 patients per year in its clinical registry. Participating hospitals submit data from a review of the medical records for all of their bariatric surgery patients. This review is conducted for each patient at 30 days after surgery. The information collected includes preoperative clinical characteristics and conditions as well as perioperative clinical care and outcomes. The medical record reviews are performed by centrally trained, nurse data abstractors using a standardized and validated instrument. Each participating hospital is site visited annually to verify the accuracy and completeness of their MBSC clinical registry data.
Study Population
This study includes data for 35,477 patients undergoing bariatric surgery, including: 9829 laparoscopic adjustable gastric band, 6068 sleeve gastrectomy, 19,141 gastric bypass, and 439 biliopancreatic diversion with duodenal switch procedures between June 2006 and September 2012. Patients undergoing revisional bariatric surgery were excluded from these analyses. Prior to surgery, 1077 (3.0%) of these patients had a prophylactic IVC filter placed for prevention of pulmonary embolism. Of the IVC filters placed, 39% were temporary IVC filters, 45% were permanent IVC filters, and the type of IVC filter was not known in 15%.
Baseline Clinical Characteristics
Data collected included patient demographic characteristics (age, gender, race, type of insurance), clinical characteristics (height, weight, history of cigarette smoking, mobility limitations), and obesity‐related and other comorbid conditions (lung disease, cardiovascular disease, hyperlipidemia, gastroesophageal reflux disease, peptic ulcer disease, cholelithiasis, urinary incontinence, renal disease, diabetes, liver disease, prior history of venous thromboembolism, sleep apnea, and psychological disorders).
Risk factors for VTE were empirically derived from our data base using multivariate statistical models. Risk factors for VTE included: age, body mass index, male sex, current or past smoking, mobility limitations, asthma, home oxygen use, peripheral vascular disease, prior history of VTE, bariatric procedure time, and procedure type. The baseline predicted risk for VTE was calculated for each patient based on these risk factors and was used to divide patients into low‐ (predicted risk <1%), medium‐ (predicted risk 1%2.5%), and high‐ (predicted risk 2.5%) risk groups. Among the 35,477 patients in the registry overall, 95% are in the low‐risk group, 4% are in the medium‐risk group, and 1% are in the high‐risk group. In the matched study cohorts, 69%, 22%, and 9% were in the high‐, medium‐, and low‐risk groups, respectively.
Medical Venous Thromboembolism Prophylaxis
Data were also collected regarding the type of medical venous thromboembolism prophylaxis (unfractionated vs low molecular weight heparin) used preoperatively, postoperatively, and whether the patient was discharged to home on low molecular weight heparin.
Outcomes
Our primary outcome measures included postoperative venous thromboembolism (deep vein thrombosis or pulmonary embolism requiring treatment). We also assessed overall rate of complications and complications according to severity as follows: non‐life threatening complications (surgical site infection including wound and port site infections treated with antibiotics and/or wound opening, anastomotic stricture requiring dilatation, bleeding requiring blood transfusion of <4 units, and pneumonia requiring treatment with antibiotics only); potentially life‐threatening complications (abdominal abscess requiring percutaneous drainage or reoperation, bowel obstruction requiring reoperation, leak requiring percutaneous drainage or reoperation, bleeding requiring transfusion >4 units, reoperation, or splenectomy, band‐related problems requiring reoperation, respiratory failure requiring 2 to 7 days intubation, renal failure requiring in‐hospital dialysis, wound infection/dehiscence requiring reoperation, and venous thromboembolism); and life‐threatening complications associated with residual and lasting disability or death (myocardial infarction or cardiac arrest, renal failure requiring long‐term dialysis, respiratory failure requiring >7 days intubation or tracheostomy, and death). Other complications that are not included in these categories (eg, IVC filter related) were assessed by an end points committee to determine their severity (non‐life threatening, potentially life threatening, or life threatening associated with residual and lasting disability or death).
Statistical Analyses
We used propensity score matching to assemble cohorts in which patients with and without IVC filters were balanced on baseline characteristics. The probability of IVC filter placement was estimated for each patient using a nonparsimonious multivariate logistic regression model, in which IVC filter was the dependent variable and all of the demographic, weight, medical history, weight‐related comorbidity, and procedure‐related variables (type, length, and year of procedure; and medical venous thromboembolism prophylaxis used) in our dataset were included as covariates. IVC filter patients were matched to control patients using a greedy, 1‐ to ‐1 matching without replacement protocol resulting in cohorts that were well balanced on all baseline characteristics.
Baseline characteristics and outcomes were then compared among the cohorts using [2] and t tests as appropriate. We used mixed effects logistic regression to compare outcomes between the 2 treatment groups while controlling for clustering at the hospital and surgeon level as random effects. Odds ratios (OR) and 95% confidence intervals (CI) were calculated to compare outcomes among patients with and without IVC filters.
RESULTS
Matching resulted in cohorts of IVC filter and control patients who were well balanced on all baseline characteristics (Table 1). In contrast, there were large and significant differences between IVC filter patients and unmatched control patients. For example, mean body mass index was 58 and 57 in the matched cohorts and 47 in the unmatched control patients. Prior history of venous thromboembolism was present in 39%, 39%, and 2% of the IVC filter, matched control, and unmatched control patients, respectively. With regard to procedure mix, unmatched control patients were less likely to have open gastric bypass and more likely to have adjustable gastric band procedures than IVC filter or matched control patients.
| Variable | IVC Filter | Matched Controls | P Value | Unmatched Controls | P Value |
|---|---|---|---|---|---|
| |||||
| No. | 1077 | 1077 | 33,323 | ||
| Age (mean, y) | 48 | 49 | 0.295 | 46 | <0.0001 |
| Body mass index (mean, kg/m2) | 58 | 57 | 0.061 | 47 | <0.0001 |
| Male gender (%) | 32 | 31 | 0.546 | 21 | <0.0001 |
| Black race (%) | 27 | 25 | 0.667 | 15 | <0.0001 |
| Private Insurance (%) | 62 | 64 | 0.305 | 74 | <0.0001 |
| Smoking in past year (%) | 2 | 2 | 0.883 | 2 | 0.440 |
| Mobility limitations (%) | 18 | 18 | 0.780 | 5 | <0.0001 |
| Lung dsease (%) | 43 | 43 | 1.000 | 25 | <0.0001 |
| Cardiovascular disease (%) | 21 | 21 | 0.874 | 10 | <0.0001 |
| Hypertension (%) | 72 | 72 | 0.737 | 53 | <0.0001 |
| Hyperlipidemia (%) | 59 | 59 | 0.930 | 50 | <0.0001 |
| GERD (%) | 50 | 52 | 0.490 | 49 | 0.417 |
| Peptic ulcer disease (%) | 5 | 4 | 0.228 | 3 | <0.0001 |
| Cholelithiasis (%) | 30 | 30 | 0.963 | 27 | 0.018 |
| Urinary incontinence (%) | 25 | 25 | 0.960 | 22 | 0.029 |
| Renal failure (%) | 0.4 | 0.6 | 0.526 | 0.2 | 0.298 |
| Diabetes (%) | 46 | 48 | 0.546 | 33 | <0.0001 |
| Liver disorder (%) | 4 | 4 | 0.584 | 5 | 0.184 |
| Prior history of VTE (%) | 39 | 39 | 0.965 | 2 | <0.0001 |
| Sleep apnea (%) | 70 | 68 | 0.209 | 43 | <0.0001 |
| Musculoskeletal disorder (%) | 78 | 80 | 0.221 | 77 | 0.189 |
| History of hernia repair (%) | 5 | 6 | 0.924 | 3 | <0.0001 |
| Psychological disorder (%) | 49 | 49 | 0.796 | 47 | 0.267 |
| Total comorbidities (mean, no.) | 6 | 6 | 0.922 | 4 | <0.0001 |
| Procedure | |||||
| Adjustable gastric banding (%) | 15 | 17 | 0.099 | 29 | <0.0001 |
| Sleeve gastrectomy (%) | 12 | 13 | 0.515 | 17 | <0.0001 |
| Gastric bypass (%) | 73 | 69 | 0.058 | 53 | <0.0001 |
| Duodenal switch (%) | 0.7 | 0.8 | 0.616 | 1.3 | <0.0001 |
| Procedure Length (mean, minutes) | 114 | 116 | 0.427 | 95 | <0.0001 |
| Medical VTE prophylaxis | |||||
| Preoperative heparin: | |||||
| Unfractionated (%) | 36 | 38 | 0.246 | 34 | 0.306 |
| Low molecular weight (%) | 60 | 54 | 0.017 | 53 | <0.0001 |
| Postoperative heparin: | |||||
| Unfractionated (%) | 7 | 10 | 0.023 | 19 | <0.0001 |
| Low molecular weight (%) | 70 | 68 | 0.326 | 64 | <0.0001 |
| Postdischarge heparin: | |||||
| Low molecular weight (%) | 72 | 66 | 0.003 | 16 | <0.0001 |
With regard to outcomes (Table 2, Figures 1 and 2), IVC filter patients had significantly higher rates of venous thromboembolism (1.9% vs 0.74%; OR, 2.7; 95% CI, 1.1‐6.3; P=0.027) and deep vein thrombosis (1.2% vs 0.37%, OR, 3.3; 95% CI, 1.1‐10.1; P=0.039) than matched control patients. Rates of pulmonary embolism were higher among IVC filter patients, but the difference was not statistically significant (0.84% vs 0.46%; OR, 2.0; 95% CI, 0.6‐6.5; P=0.232). Rates of pulmonary embolism were similar for patients with a low baseline risk of venous thromboembolism (0.27% vs 0.27%; OR, 1.0; 95% CI, 0.1‐7.7; P=0.965) but were higher for medium‐risk patients (2.1% vs 0.87%; OR, 2.5; 95% CI, 0.5‐12.7; P=0.288) and high‐risk patients (2.1% vs 0.97%; OR, 2.2; 95% CI, 0.2‐24.3; P=0.530).
| Outcomes | Odds Ratio | 95% Confidence Interval | P Value |
|---|---|---|---|
| Venous thromboembolism | 2.7 | 1.16.3 | 0.027 |
| Deep vein thrombosis | 3.3 | 1.110.1 | 0.039 |
| Pulmonary embolism | 2.0 | 0.66.5 | 0.232 |
| Low‐risk subgroup | 1.0 | 0.17.7 | 0.965 |
| Medium‐risk subgroup | 2.5 | 0.512.7 | 0.288 |
| High‐risk subgroup | 2.2 | 0.224.3 | 0.530 |
| Any complication | 1.3 | 1.01.7 | 0.048 |
| Serious complication | 1.6 | 1.02.4 | 0.031 |
| Permanently disabling complication | 4.3 | 1.215.6 | 0.028 |
| Death | 7.0 | 0.957.3 | 0.068 |
Rates of other complications were also higher among IVC filter than matched control patients (Table 2 and Figure 3). There were significantly higher rates of complications (15.2% vs 11.6%; OR, 1.3; 95% CI, 1.0‐1.7; P=0.048), serious complications (5.8% vs 3.8%; OR, 1.6; 95% CI, 1.0‐2.4; P=0.031), and permanently disabling complications (1.2% vs 0.4%; OR, 4.3; 95% CI, 1.2‐15.6; P=0.028) among IVC filter patients. Rates of death (0.7% vs 0.1%; OR, 7.0; 95% CI, 0.9‐57.3; P=0.068) were also higher among IVC filter patients than matched control patients, but this difference was not statistically significant.
Among the 7 IVC filter patients who died, 4 had fatal pulmonary embolism, and 2 had IVC filter thrombosis/occlusion. Other IVC filter‐specific complications included IVC filter migration requiring heart valve replacement surgery in 1 patient, contrast‐induced nephropathy in 1 patient, IVC filter incision site infection in 1 patient, and technical difficulties removing a temporary IVC filter requiring that the device stay in place in 1 patient.
DISCUSSION
In this propensity matched, observational cohort study, we assessed the safety and effectiveness of prophylactic IVC filters among bariatric surgery patients. We found that patients with IVC filters had significantly worse outcomes than comparably high‐risk patients without IVC filters. Rates of venous thromboembolism were higher in the IVC filter patients, and a large proportion of the other complications among IVC filter patients were device related.
Our current study of IVC filters was prompted by an FDA advisory report regarding complications in patients receiving IVC filters.[2] The FDA's report was in turn prompted by a study indicating a high prevalence of strut fracture and embolization among 80 patients who received a certain type of retrievable IVC filter.[4] The FDA conveyed receiving 921 adverse events reports involving IVC filters between 2005 and 2009. Thirty‐six percent of these reports involved migration of the device, 16% were related to breakage and embolization of parts of the device, and 8% involved perforation of the IVC.
Research on the safety and efficacy of IVC filters in bariatric surgery patients has largely been limited to small, single‐center, case series or cohort studies.[5, 6, 7, 8, 9, 10, 11, 12, 13, 14, 15] A systematic review of this literature concluded that the evidence was insufficient to recommend IVC filters for patients undergoing bariatric surgery.[16] A 2010 study by our group was the largest and only multicenter study of IVC filters in the bariatric surgery population. We found no benefit of IVC filters in a comparison of 542 gastric bypass patients with prophylactic IVC filters to 5,834 gastric bypass patients without prophylactic IVC filters.[3]
When interpreting the results of this study, a number of limitations should be considered. Our study was observational, so there is the potential for unmeasured confounding variables to have influenced our results. To minimize the risk of confounding, we used propensity scores to match IVC filter patients to comparably high‐risk control patients, resulting in study cohorts that were well balanced on all baseline variables. Although this method accounts for confounding on the variables for which there are data, there is still the possibility that an unknown confounder could affect our findings. For example, our clinical registry lacks data on hypercoagulable states, so it is possible that a higher proportion of IVC filter patients could have had this risk factor and therefore a higher baseline risk of venous thromboembolism. However, most patients with a hypercoagulable state would have had a prior history of venous thromboembolism, which is a variable included in our database that patients were matched on.
The effects of changes in clinical care occurring during the time frame of this study should be considered in interpreting our findings. For example, bariatric surgery has been getting safer in general over time. Rates of death have fallen both in Michigan and in the rest of the country as bariatric surgeons have gained experience with this procedure. In Michigan during this time period, our group has developed and implemented a risk‐stratified, standardized approach to venous thromboembolism prophylaxis for patients undergoing bariatric surgery. For these reasons, we included the year of the procedure and the type of medical venous thromboembolism prophylaxis (unfractionated or low molecular weight heparin) used perioperatively as a matching variable in our analysis.
Another limitation that should be considered in interpreting our findings is statistical power. Although our study is the largest in this study population to date, many of the outcomes of interest are relatively rare. Considering the entire bariatric surgery population, rates of venous thromboembolism and death within 30 days are each less than 1%. Even in the high‐risk patients included in this analysis, there were a total of just 28 (1.3%) venous thromboembolism events and 8 (0.37) deaths. Nonetheless, our study did find significantly greater risks of multiple types of complications among patients receiving IVC filters.
Finally, our study captures events occurring within 30 days of bariatric surgery. Complications, including venous thromboembolism and other complications directly related to IVC filters, frequently occur after 30 days of bariatric surgery. Therefore, our study may be a conservative estimate of the risks associated with the use of IVC filters in bariatric surgery patients. Furthermore, certain brands of filters have been shown to be associated with higher risks of complications. Our study lacks data on the brand of IVC filter used and so cannot assess the extent to which this would affect our results.
CONCLUSIONS
In conclusion, our study indicates that IVC filters do not reduce the risk of pulmonary embolism in high‐risk bariatric surgery patients. They are also associated with other complications attributable to malfunctions of the device itself. We believe that the use of IVC filters among bariatric surgery patients should be discouraged.
Disclosure
This study was supported by a grant from the Agency for Healthcare Research and Quality (HS018050) and was presented at the Annual Meeting of the American Society for Metabolic and Bariatric Surgery (ASMBS), San Diego, California, June 20, 2012.
The use of inferior vena cava (IVC) filters has increased substantially in recent years. These medical devices, which are used to prevent pulmonary embolism in patients considered to be at high risk of venous thromboembolism, were placed in 167,000 patients in 2007.1 In 2012, it is estimated that 259,000 patients will undergo placement of an IVC filter, an increase of 55%.[1] Increasing use of IVC filters is attributable to the development of retrievable versions of the devices, which have expanded indications for use such as in bariatric surgery.
Unfortunately, the increase in the use of IVC filters has been accompanied by an increase in reports of adverse events in patients receiving them. The United States Food and Drug Administration (FDA) has received more than 900 adverse event reports involving IVC filters, prompting the agency to issue a warning about their use.[2] A prior study by our group demonstrated a lack of benefit of IVC filter insertion for the prevention of pulmonary embolism among bariatric surgery patients but lacked statistical power to prove harms associated with this practice.[3]
In the current study, we analyzed data from the prospective, statewide, clinical registry of the Michigan Bariatric Surgery Collaborative. Our study population now includes 35,477 bariatric surgery patients from 32 hospitals whose procedures were performed between 2006 and 2012. Since the publication of our prior study, the use of IVC filters in bariatric surgery has decreased significantly in Michigan. For this reason, our study population now includes many more high‐risk patients who did not undergo IVC filter placement, allowing us to match IVC filter patients to similarly high‐risk patients who did not receive IVC filters. We used these data to compare outcomes within 30 days of surgery, including rates of venous thromboembolism, overall serious complications, and death among patients who did and not receive IVC filters.
METHODS
Study Setting
The Michigan Bariatric Surgery Collaborative (MBSC) is a regional voluntary consortium of hospitals and surgeons that perform bariatric surgery in Michigan. The goal of the project is to improve the quality of care for patients undergoing bariatric surgery. To do this, the participating hospitals submit data to the MBSC clinical outcomes registry, patient survey, and surgeon survey databases. Three times per year the group meets to examine these data and to design and implement changes in care to improve the outcomes of care for bariatric patients. The project is funded by Blue Cross and Blue Shield of Michigan/Blue Care Network and coordinated by faculty and staff members from the Center for Healthcare Outcomes and Policy at the University of Michigan.
The MBSC held its first collaborative meeting in June 2005 and enrolled its first patient in June 2006. The MBSC now has the participation of all of the 32 bariatric programs in Michigan, enrolling approximately 6000 patients per year in its clinical registry. Participating hospitals submit data from a review of the medical records for all of their bariatric surgery patients. This review is conducted for each patient at 30 days after surgery. The information collected includes preoperative clinical characteristics and conditions as well as perioperative clinical care and outcomes. The medical record reviews are performed by centrally trained, nurse data abstractors using a standardized and validated instrument. Each participating hospital is site visited annually to verify the accuracy and completeness of their MBSC clinical registry data.
Study Population
This study includes data for 35,477 patients undergoing bariatric surgery, including: 9829 laparoscopic adjustable gastric band, 6068 sleeve gastrectomy, 19,141 gastric bypass, and 439 biliopancreatic diversion with duodenal switch procedures between June 2006 and September 2012. Patients undergoing revisional bariatric surgery were excluded from these analyses. Prior to surgery, 1077 (3.0%) of these patients had a prophylactic IVC filter placed for prevention of pulmonary embolism. Of the IVC filters placed, 39% were temporary IVC filters, 45% were permanent IVC filters, and the type of IVC filter was not known in 15%.
Baseline Clinical Characteristics
Data collected included patient demographic characteristics (age, gender, race, type of insurance), clinical characteristics (height, weight, history of cigarette smoking, mobility limitations), and obesity‐related and other comorbid conditions (lung disease, cardiovascular disease, hyperlipidemia, gastroesophageal reflux disease, peptic ulcer disease, cholelithiasis, urinary incontinence, renal disease, diabetes, liver disease, prior history of venous thromboembolism, sleep apnea, and psychological disorders).
Risk factors for VTE were empirically derived from our data base using multivariate statistical models. Risk factors for VTE included: age, body mass index, male sex, current or past smoking, mobility limitations, asthma, home oxygen use, peripheral vascular disease, prior history of VTE, bariatric procedure time, and procedure type. The baseline predicted risk for VTE was calculated for each patient based on these risk factors and was used to divide patients into low‐ (predicted risk <1%), medium‐ (predicted risk 1%2.5%), and high‐ (predicted risk 2.5%) risk groups. Among the 35,477 patients in the registry overall, 95% are in the low‐risk group, 4% are in the medium‐risk group, and 1% are in the high‐risk group. In the matched study cohorts, 69%, 22%, and 9% were in the high‐, medium‐, and low‐risk groups, respectively.
Medical Venous Thromboembolism Prophylaxis
Data were also collected regarding the type of medical venous thromboembolism prophylaxis (unfractionated vs low molecular weight heparin) used preoperatively, postoperatively, and whether the patient was discharged to home on low molecular weight heparin.
Outcomes
Our primary outcome measures included postoperative venous thromboembolism (deep vein thrombosis or pulmonary embolism requiring treatment). We also assessed overall rate of complications and complications according to severity as follows: non‐life threatening complications (surgical site infection including wound and port site infections treated with antibiotics and/or wound opening, anastomotic stricture requiring dilatation, bleeding requiring blood transfusion of <4 units, and pneumonia requiring treatment with antibiotics only); potentially life‐threatening complications (abdominal abscess requiring percutaneous drainage or reoperation, bowel obstruction requiring reoperation, leak requiring percutaneous drainage or reoperation, bleeding requiring transfusion >4 units, reoperation, or splenectomy, band‐related problems requiring reoperation, respiratory failure requiring 2 to 7 days intubation, renal failure requiring in‐hospital dialysis, wound infection/dehiscence requiring reoperation, and venous thromboembolism); and life‐threatening complications associated with residual and lasting disability or death (myocardial infarction or cardiac arrest, renal failure requiring long‐term dialysis, respiratory failure requiring >7 days intubation or tracheostomy, and death). Other complications that are not included in these categories (eg, IVC filter related) were assessed by an end points committee to determine their severity (non‐life threatening, potentially life threatening, or life threatening associated with residual and lasting disability or death).
Statistical Analyses
We used propensity score matching to assemble cohorts in which patients with and without IVC filters were balanced on baseline characteristics. The probability of IVC filter placement was estimated for each patient using a nonparsimonious multivariate logistic regression model, in which IVC filter was the dependent variable and all of the demographic, weight, medical history, weight‐related comorbidity, and procedure‐related variables (type, length, and year of procedure; and medical venous thromboembolism prophylaxis used) in our dataset were included as covariates. IVC filter patients were matched to control patients using a greedy, 1‐ to ‐1 matching without replacement protocol resulting in cohorts that were well balanced on all baseline characteristics.
Baseline characteristics and outcomes were then compared among the cohorts using [2] and t tests as appropriate. We used mixed effects logistic regression to compare outcomes between the 2 treatment groups while controlling for clustering at the hospital and surgeon level as random effects. Odds ratios (OR) and 95% confidence intervals (CI) were calculated to compare outcomes among patients with and without IVC filters.
RESULTS
Matching resulted in cohorts of IVC filter and control patients who were well balanced on all baseline characteristics (Table 1). In contrast, there were large and significant differences between IVC filter patients and unmatched control patients. For example, mean body mass index was 58 and 57 in the matched cohorts and 47 in the unmatched control patients. Prior history of venous thromboembolism was present in 39%, 39%, and 2% of the IVC filter, matched control, and unmatched control patients, respectively. With regard to procedure mix, unmatched control patients were less likely to have open gastric bypass and more likely to have adjustable gastric band procedures than IVC filter or matched control patients.
| Variable | IVC Filter | Matched Controls | P Value | Unmatched Controls | P Value |
|---|---|---|---|---|---|
| |||||
| No. | 1077 | 1077 | 33,323 | ||
| Age (mean, y) | 48 | 49 | 0.295 | 46 | <0.0001 |
| Body mass index (mean, kg/m2) | 58 | 57 | 0.061 | 47 | <0.0001 |
| Male gender (%) | 32 | 31 | 0.546 | 21 | <0.0001 |
| Black race (%) | 27 | 25 | 0.667 | 15 | <0.0001 |
| Private Insurance (%) | 62 | 64 | 0.305 | 74 | <0.0001 |
| Smoking in past year (%) | 2 | 2 | 0.883 | 2 | 0.440 |
| Mobility limitations (%) | 18 | 18 | 0.780 | 5 | <0.0001 |
| Lung dsease (%) | 43 | 43 | 1.000 | 25 | <0.0001 |
| Cardiovascular disease (%) | 21 | 21 | 0.874 | 10 | <0.0001 |
| Hypertension (%) | 72 | 72 | 0.737 | 53 | <0.0001 |
| Hyperlipidemia (%) | 59 | 59 | 0.930 | 50 | <0.0001 |
| GERD (%) | 50 | 52 | 0.490 | 49 | 0.417 |
| Peptic ulcer disease (%) | 5 | 4 | 0.228 | 3 | <0.0001 |
| Cholelithiasis (%) | 30 | 30 | 0.963 | 27 | 0.018 |
| Urinary incontinence (%) | 25 | 25 | 0.960 | 22 | 0.029 |
| Renal failure (%) | 0.4 | 0.6 | 0.526 | 0.2 | 0.298 |
| Diabetes (%) | 46 | 48 | 0.546 | 33 | <0.0001 |
| Liver disorder (%) | 4 | 4 | 0.584 | 5 | 0.184 |
| Prior history of VTE (%) | 39 | 39 | 0.965 | 2 | <0.0001 |
| Sleep apnea (%) | 70 | 68 | 0.209 | 43 | <0.0001 |
| Musculoskeletal disorder (%) | 78 | 80 | 0.221 | 77 | 0.189 |
| History of hernia repair (%) | 5 | 6 | 0.924 | 3 | <0.0001 |
| Psychological disorder (%) | 49 | 49 | 0.796 | 47 | 0.267 |
| Total comorbidities (mean, no.) | 6 | 6 | 0.922 | 4 | <0.0001 |
| Procedure | |||||
| Adjustable gastric banding (%) | 15 | 17 | 0.099 | 29 | <0.0001 |
| Sleeve gastrectomy (%) | 12 | 13 | 0.515 | 17 | <0.0001 |
| Gastric bypass (%) | 73 | 69 | 0.058 | 53 | <0.0001 |
| Duodenal switch (%) | 0.7 | 0.8 | 0.616 | 1.3 | <0.0001 |
| Procedure Length (mean, minutes) | 114 | 116 | 0.427 | 95 | <0.0001 |
| Medical VTE prophylaxis | |||||
| Preoperative heparin: | |||||
| Unfractionated (%) | 36 | 38 | 0.246 | 34 | 0.306 |
| Low molecular weight (%) | 60 | 54 | 0.017 | 53 | <0.0001 |
| Postoperative heparin: | |||||
| Unfractionated (%) | 7 | 10 | 0.023 | 19 | <0.0001 |
| Low molecular weight (%) | 70 | 68 | 0.326 | 64 | <0.0001 |
| Postdischarge heparin: | |||||
| Low molecular weight (%) | 72 | 66 | 0.003 | 16 | <0.0001 |
With regard to outcomes (Table 2, Figures 1 and 2), IVC filter patients had significantly higher rates of venous thromboembolism (1.9% vs 0.74%; OR, 2.7; 95% CI, 1.1‐6.3; P=0.027) and deep vein thrombosis (1.2% vs 0.37%, OR, 3.3; 95% CI, 1.1‐10.1; P=0.039) than matched control patients. Rates of pulmonary embolism were higher among IVC filter patients, but the difference was not statistically significant (0.84% vs 0.46%; OR, 2.0; 95% CI, 0.6‐6.5; P=0.232). Rates of pulmonary embolism were similar for patients with a low baseline risk of venous thromboembolism (0.27% vs 0.27%; OR, 1.0; 95% CI, 0.1‐7.7; P=0.965) but were higher for medium‐risk patients (2.1% vs 0.87%; OR, 2.5; 95% CI, 0.5‐12.7; P=0.288) and high‐risk patients (2.1% vs 0.97%; OR, 2.2; 95% CI, 0.2‐24.3; P=0.530).
| Outcomes | Odds Ratio | 95% Confidence Interval | P Value |
|---|---|---|---|
| Venous thromboembolism | 2.7 | 1.16.3 | 0.027 |
| Deep vein thrombosis | 3.3 | 1.110.1 | 0.039 |
| Pulmonary embolism | 2.0 | 0.66.5 | 0.232 |
| Low‐risk subgroup | 1.0 | 0.17.7 | 0.965 |
| Medium‐risk subgroup | 2.5 | 0.512.7 | 0.288 |
| High‐risk subgroup | 2.2 | 0.224.3 | 0.530 |
| Any complication | 1.3 | 1.01.7 | 0.048 |
| Serious complication | 1.6 | 1.02.4 | 0.031 |
| Permanently disabling complication | 4.3 | 1.215.6 | 0.028 |
| Death | 7.0 | 0.957.3 | 0.068 |
Rates of other complications were also higher among IVC filter than matched control patients (Table 2 and Figure 3). There were significantly higher rates of complications (15.2% vs 11.6%; OR, 1.3; 95% CI, 1.0‐1.7; P=0.048), serious complications (5.8% vs 3.8%; OR, 1.6; 95% CI, 1.0‐2.4; P=0.031), and permanently disabling complications (1.2% vs 0.4%; OR, 4.3; 95% CI, 1.2‐15.6; P=0.028) among IVC filter patients. Rates of death (0.7% vs 0.1%; OR, 7.0; 95% CI, 0.9‐57.3; P=0.068) were also higher among IVC filter patients than matched control patients, but this difference was not statistically significant.
Among the 7 IVC filter patients who died, 4 had fatal pulmonary embolism, and 2 had IVC filter thrombosis/occlusion. Other IVC filter‐specific complications included IVC filter migration requiring heart valve replacement surgery in 1 patient, contrast‐induced nephropathy in 1 patient, IVC filter incision site infection in 1 patient, and technical difficulties removing a temporary IVC filter requiring that the device stay in place in 1 patient.
DISCUSSION
In this propensity matched, observational cohort study, we assessed the safety and effectiveness of prophylactic IVC filters among bariatric surgery patients. We found that patients with IVC filters had significantly worse outcomes than comparably high‐risk patients without IVC filters. Rates of venous thromboembolism were higher in the IVC filter patients, and a large proportion of the other complications among IVC filter patients were device related.
Our current study of IVC filters was prompted by an FDA advisory report regarding complications in patients receiving IVC filters.[2] The FDA's report was in turn prompted by a study indicating a high prevalence of strut fracture and embolization among 80 patients who received a certain type of retrievable IVC filter.[4] The FDA conveyed receiving 921 adverse events reports involving IVC filters between 2005 and 2009. Thirty‐six percent of these reports involved migration of the device, 16% were related to breakage and embolization of parts of the device, and 8% involved perforation of the IVC.
Research on the safety and efficacy of IVC filters in bariatric surgery patients has largely been limited to small, single‐center, case series or cohort studies.[5, 6, 7, 8, 9, 10, 11, 12, 13, 14, 15] A systematic review of this literature concluded that the evidence was insufficient to recommend IVC filters for patients undergoing bariatric surgery.[16] A 2010 study by our group was the largest and only multicenter study of IVC filters in the bariatric surgery population. We found no benefit of IVC filters in a comparison of 542 gastric bypass patients with prophylactic IVC filters to 5,834 gastric bypass patients without prophylactic IVC filters.[3]
When interpreting the results of this study, a number of limitations should be considered. Our study was observational, so there is the potential for unmeasured confounding variables to have influenced our results. To minimize the risk of confounding, we used propensity scores to match IVC filter patients to comparably high‐risk control patients, resulting in study cohorts that were well balanced on all baseline variables. Although this method accounts for confounding on the variables for which there are data, there is still the possibility that an unknown confounder could affect our findings. For example, our clinical registry lacks data on hypercoagulable states, so it is possible that a higher proportion of IVC filter patients could have had this risk factor and therefore a higher baseline risk of venous thromboembolism. However, most patients with a hypercoagulable state would have had a prior history of venous thromboembolism, which is a variable included in our database that patients were matched on.
The effects of changes in clinical care occurring during the time frame of this study should be considered in interpreting our findings. For example, bariatric surgery has been getting safer in general over time. Rates of death have fallen both in Michigan and in the rest of the country as bariatric surgeons have gained experience with this procedure. In Michigan during this time period, our group has developed and implemented a risk‐stratified, standardized approach to venous thromboembolism prophylaxis for patients undergoing bariatric surgery. For these reasons, we included the year of the procedure and the type of medical venous thromboembolism prophylaxis (unfractionated or low molecular weight heparin) used perioperatively as a matching variable in our analysis.
Another limitation that should be considered in interpreting our findings is statistical power. Although our study is the largest in this study population to date, many of the outcomes of interest are relatively rare. Considering the entire bariatric surgery population, rates of venous thromboembolism and death within 30 days are each less than 1%. Even in the high‐risk patients included in this analysis, there were a total of just 28 (1.3%) venous thromboembolism events and 8 (0.37) deaths. Nonetheless, our study did find significantly greater risks of multiple types of complications among patients receiving IVC filters.
Finally, our study captures events occurring within 30 days of bariatric surgery. Complications, including venous thromboembolism and other complications directly related to IVC filters, frequently occur after 30 days of bariatric surgery. Therefore, our study may be a conservative estimate of the risks associated with the use of IVC filters in bariatric surgery patients. Furthermore, certain brands of filters have been shown to be associated with higher risks of complications. Our study lacks data on the brand of IVC filter used and so cannot assess the extent to which this would affect our results.
CONCLUSIONS
In conclusion, our study indicates that IVC filters do not reduce the risk of pulmonary embolism in high‐risk bariatric surgery patients. They are also associated with other complications attributable to malfunctions of the device itself. We believe that the use of IVC filters among bariatric surgery patients should be discouraged.
Disclosure
This study was supported by a grant from the Agency for Healthcare Research and Quality (HS018050) and was presented at the Annual Meeting of the American Society for Metabolic and Bariatric Surgery (ASMBS), San Diego, California, June 20, 2012.
- , , . Vena cava filters: a call to action. Chest Physician. 2011;16:18a.
- U.S. Food and Drug Administration. Removing retrievable inferior vena cava filters: initial communication. August 9, 2010. Available at: http://www.fda.gov/MedicalDevices/Safety/AlertsandNotices/ucm221 676.htm. Accessed December 2, 2012.
- , , , et al. Preoperative placement of inferior vena cava filters and outcomes after gastric bypass surgery. Ann Surg. 2010;252:131–318.
- , , , et al. Prevalence of fracture and fragment embolization of Bard retrievable vena cava filters and clinical implications including cardiac perforation and tamponade. Arch Intern Med. 2010;170:1827–1831.
- , , , , , . Experience with inferior vena cava filter placement in patients undergoing open gastric bypass procedures. Ann Vasc Surg. 2006;44: 1301–1305.
- , . Preoperative placement of retrievable inferior vena cava filters in bariatric surgery. Surg Obes Relat Dis. 2007;3: 602–605.
- , , , et al. Safety and efficacy of intravascular ultrasound‐guided inferior vena cava filter in super obese bariatric patients. Surg Obes Relat Dis. 2008;4:50–54.
- , , , , , . Current indications for preoperative inferior vena cava filter insertion in patients undergoing surgery for morbid obesity. Obes Surg. 2005;15:1009–1012.
- , , , . Efficacy of prophylactic inferior vena cava filter placement in bariatric surgery. Surg Obes Relat Dis. 2007;3:606–610.
- , , , et al. Safety, feasibility, and outcome of retrievable vena cava filters in high‐risk surgical patients. J Vasc Surg. 2007;45:784–788.
- , , , . Retrievable inferior vena cava filters may be safely applied in gastric bypass surgery. Surg Endosc. 2007;21:2277–2279.
- , , , , . Inferior vena cava filter placement for pulmonary embolism risk reduction in super morbidly obese undergoing bariatric surgery. Surg Obes Relat Dis. 2007;3:461–464.
- , . A simple venous thromboembolism prophylaxis protocol for patients undergoing bariatric surgery. Obesity (Silver Spring). 2006;14:1961–1965.
- , , , et al. Risk‐group targeted inferior vena cava filter placemetn in gastric bypass patients. Obes Surg. 2009;19:451–455.
- , , , , , . Retreivable inferior vena cava filters in high‐risk patients undergoing bariatric surgery. Surg Endosc. 2009;23:2203–2207.
- , . Inferior vena caval filter insertion prior to bariatric surgery: A systematic review of the literature. J Thromb Haemost. 2010;8:1266–1270.
- , , . Vena cava filters: a call to action. Chest Physician. 2011;16:18a.
- U.S. Food and Drug Administration. Removing retrievable inferior vena cava filters: initial communication. August 9, 2010. Available at: http://www.fda.gov/MedicalDevices/Safety/AlertsandNotices/ucm221 676.htm. Accessed December 2, 2012.
- , , , et al. Preoperative placement of inferior vena cava filters and outcomes after gastric bypass surgery. Ann Surg. 2010;252:131–318.
- , , , et al. Prevalence of fracture and fragment embolization of Bard retrievable vena cava filters and clinical implications including cardiac perforation and tamponade. Arch Intern Med. 2010;170:1827–1831.
- , , , , , . Experience with inferior vena cava filter placement in patients undergoing open gastric bypass procedures. Ann Vasc Surg. 2006;44: 1301–1305.
- , . Preoperative placement of retrievable inferior vena cava filters in bariatric surgery. Surg Obes Relat Dis. 2007;3: 602–605.
- , , , et al. Safety and efficacy of intravascular ultrasound‐guided inferior vena cava filter in super obese bariatric patients. Surg Obes Relat Dis. 2008;4:50–54.
- , , , , , . Current indications for preoperative inferior vena cava filter insertion in patients undergoing surgery for morbid obesity. Obes Surg. 2005;15:1009–1012.
- , , , . Efficacy of prophylactic inferior vena cava filter placement in bariatric surgery. Surg Obes Relat Dis. 2007;3:606–610.
- , , , et al. Safety, feasibility, and outcome of retrievable vena cava filters in high‐risk surgical patients. J Vasc Surg. 2007;45:784–788.
- , , , . Retrievable inferior vena cava filters may be safely applied in gastric bypass surgery. Surg Endosc. 2007;21:2277–2279.
- , , , , . Inferior vena cava filter placement for pulmonary embolism risk reduction in super morbidly obese undergoing bariatric surgery. Surg Obes Relat Dis. 2007;3:461–464.
- , . A simple venous thromboembolism prophylaxis protocol for patients undergoing bariatric surgery. Obesity (Silver Spring). 2006;14:1961–1965.
- , , , et al. Risk‐group targeted inferior vena cava filter placemetn in gastric bypass patients. Obes Surg. 2009;19:451–455.
- , , , , , . Retreivable inferior vena cava filters in high‐risk patients undergoing bariatric surgery. Surg Endosc. 2009;23:2203–2207.
- , . Inferior vena caval filter insertion prior to bariatric surgery: A systematic review of the literature. J Thromb Haemost. 2010;8:1266–1270.
Copyright © 2013 Society of Hospital Medicine
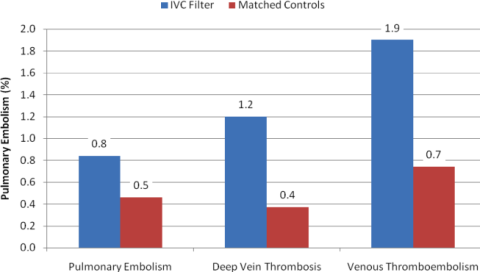
Affordable Care Act Implementation
At the Centers for Medicare and Medicaid Services (CMS), we are charged with implementing many of the major provisions of the Affordable Care Act (ACA). Major policies and programs aimed at transforming the way care is delivered and paid for, testing and scaling innovative delivery system reforms, and expanding the number of Americans with health insurance will now move forward. The healthcare system is moving from paying for volume to paying for value. Hospitals and clinicians will need to be able to manage and be accountable for populations of patients and improving health outcomes. In this article, we highlight 4 broad provisions of the ACA that are either already implemented or under development for implementation in 2014, and are anticipated to have widespread impact on our health system. The potential impacts of each provision on hospitals and hospitalists are outlined in Table 1.
| Affordable Care Act Provision | Example of Potential Impacts on Hospitals and Hospitalists |
|---|---|
| |
| Expansion of insurance coverage | Care for fewer uninsured patients/fewer unreimbursed services |
| Patients have improved access to services after discharge | |
| Shorter lengths of stay due to better access to outpatient services and care | |
| Delivery system transformation | Financial incentives aligned between inpatient and outpatient providers to better coordinate care |
| Payment is at risk if performance rates do not meet benchmarks and if costs are not lowered | |
| Consolidation of hospitals and health systems within local markets | |
| Value‐based purchasing | Medicare FFS reimbursement increased or decreased based on quality and cost measure results |
| Opportunity to align incentives between hospitals and hospitalists | |
| Patient‐centered outcomes research | Emerging research on delivery system interventions relevant to hospitalists, such as care transitions |
| Funding for PCOR available for hospitalist researchers interested in delivery systems and outcomes research | |
EXPANSION OF INSURANCE COVERAGE
The central and perhaps most anticipated provision of the ACA is the expansion of insurance to the currently uninsured through the creation of state‐based health insurance exchanges. The exchanges are a competitive marketplace for purchasing private insurance products by individuals and small and large businesses. The individual mandate that accompanies the exchange provision requires that individuals purchase insurance. For those who cannot afford it, the government provides a subsidy. Any health plan that wishes to participate in an exchange marketplace must include at minimum a package of essential health benefits in each of their insurance products, which include benefits such as ambulatory care services, maternal and newborn services, and prescription drugs.[1] Importantly, health plans are required to implement quality improvement strategies and publicly report quality data. The ACA also requires the Secretary of Health and Human Services (HHS) to develop and administer a quality rating system and an enrollee satisfaction survey system, the results of which will be available to exchange consumers. All of these requirements will promote the delivery of high‐quality healthcare to millions of previously uninsured Americans.
Implementation of the exchanges in combination with the expansion of Medicaid is expected to provide insurance to approximately 30 million people who currently lack coverage. Prior to the Supreme Court ruling in June of 2012, states were required to expand Medicaid eligibility to a minimum of 133% of the federal poverty level. This expansion is subsidized 100% by the federal government through 2016, dropping to 90% by 2020. The Supreme Court ruled that the federal government could not require states to expand their Medicaid rolls, although it is expected that most states will do so given the generous federal subsidy and the significant cost to states, hospitals, and society to provide healthcare to the uninsured.
TRANSFORMATION OF HEALTHCARE DELIVERY
In addition to the expansion of insurance coverage, the ACA initiates a transformation in the way that healthcare will be delivered through the testing and implementation of innovative payment and care delivery models. The ACA authorized the creation of the Center for Medicare and Medicaid Innovation (CMMI, or The Innovation Center) within CMS. Payment and care delivery demonstrations or pilots that demonstrate a high quality of care at lower costs can be scaled up nationally at the discretion of the Secretary, rather than requiring authorization by Congress. The Innovation Center has already launched initiatives that test a variety of new models of care, all of which incentivize care coordination, provision of team‐based care, and use of data and quality metrics to drive systems‐based improvement. These programs include pilots that bundle payments to hospitals, physician group practices, and post‐acute care facilities for episodes of care across settings. This allows providers to innovate and redesign systems to deliver equivalent or higher quality of care at lower costs. Another CMMI model, called the comprehensive primary care initiative, involves CMS partnering with private insurers to provide payment to primary care practices for the delivery of chronic disease management and coordinated care to their entire population of patients, regardless of payer. Of great relevance to all hospitalists, CMMI and CMS, in partnership with other HHS agencies, launched the Partnership for Patients program in 2011. To date, approximately 4000 hospitals have signed on to the Partnership in a collective effort to significantly reduce hospital readmissions and hospital‐acquired conditions. Hospitalists are leading the charge related to Partnership for Patients in many hospitals. The Innovation Center is concurrently launching and rapidly evaluating current pilots, while considering what other new pilots might be needed to further test models aimed at the delivery of better healthcare and health outcomes at lower costs.
Perhaps the delivery system initiative that has received the most attention is the implementation of the Medicare Shared Savings Program (MSSP), or Accountable Care Organizations (ACO). Under the MSSP, ACOs are groups of providers (which may include hospitals) and suppliers of services who work together to coordinate care for the patients they serve. Participating ACOs must achieve performance benchmarks while lowering costs to share in the cost savings with CMS. Although this program is focused on Medicare fee‐for‐service (FFS) beneficiaries, it is expected that all patients will benefit from the infrastructure redesign and care coordination that is required under this program. The pioneer ACOs are large integrated health systems or other providers that have higher levels of shared risk in addition to shared savings. Hospitals that are a part of a participating ACO have greater financial incentives to work with their primary care and other outpatient providers to reduce readmissions and other adverse events and achieve quality benchmarks. With the degree of savings as well as financial risk that is on the table, it is possible that over time, hospitals and health systems may consolidate to capture a larger share of the market. Such a consequence could have a parallel effect on job opportunities and financial incentives and risk for hospitalists in local markets.
VALUE‐BASED PURCHASING
Improvement in the quality of care delivered to all patients is another central purpose of the Affordable Care Act. The law requires that the Secretary develop a National Quality Strategy that must be updated annually; the first version of this strategy was published in April of 2011.[2] The strategy identifies 3 aims for the nation: better healthcare for individuals, better health for populations and communities, and lower costs for all. One of the levers that CMS uses to achieve these 3 aims is value‐based purchasing (VBP). VBP is a way to link the National Quality Strategy with Medicare FFS payments on a national scale by adjusting payments based on performance. VBP rewards providers and health systems that deliver better outcomes in health and healthcare at lower cost to the beneficiaries and communities they serve, rather than rewarding them for the volume of services they provide. The ACA authorizes implementation of the Hospital Value‐Based Purchasing (HVBP) program as well as the Physician Value Modifier (PVM). The HVBP program began in 2011, and currently includes process, outcome, and patient experience quality metrics as well as a total cost metric, which includes 30 days postdischarge for beneficiaries admitted to the hospital. Hospitals are rewarded on either their improvement from baseline or achievement of a benchmark, whichever is higher.[3] The PVM program adjusts providers' Medicare FFS payments up or down beginning in 2015, based on quality metrics reported on care provided in 2013. In the first year of the program, groups of 100 or more physicians are eligible for the program, and are given a choice on metrics to report and whether to elect for quality tiering and the potential for payment adjustment[4]; by payment year 2017, all physicians must participate. To participate, physicians must report on quality metrics that they choose through the Physician Quality Reporting System (PQRS) or elect to have their quality assessed based on administrative claim measures. Measures currently in the PQRS program may not always be relevant for hospitalists; CMS is working to define and include metrics that would be most meaningful to hospitalists' scope of practice and is seeking comment on whether to allow hospital‐based physicians to align with and accept hospital quality measures to count as their performance metrics.
PATIENT‐CENTERED OUTCOMES RESEARCH
Building on the down payment on Comparative Effectiveness Research (CER) funded under the American Recovery and Reinvestment Act of 2009, the ACA authorized the creation of the Patient‐Centered Outcomes Research Institute (PCORI) and allocated funding for CER over 10 years. Rebranded as Patient‐Centered Outcomes Research (PCOR), CER has the potential to improve quality and reduce costs by identifying what works for different populations of patients (eg, children, elderly, patients with multiple chronic conditions, racial and ethnic minorities) in varied settings (eg, ambulatory, hospital, nursing home) under real‐world conditions. The PCORI governance board was created in 2010, and as required by law, developed a national agenda for patient‐centered outcomes research, which includes assessment of prevention, diagnosis, and treatment options; improving healthcare systems; communicating and disseminating research; addressing healthcare disparities; and accelerating PCOR and methodological research. The amount of funding available for research and PCOR infrastructure will ramp up over the next several years, eventually reaching approximately $500 million annually, with increasing funding opportunities for comparative research questions related to clinical and delivery system interventions using pragmatic, randomized, controlled trials; implementation science; and other novel research methodologies. Hospitalists have many roles within this realm, whether as researchers comparing delivery system or clinical interventions, as educators of students or healthcare professionals on the results of PCOR and their implications for practice, or as hospital leaders responsible for implementation of evidence‐based practices.[5]
CONCLUSION
The Affordable Care Act is a transformative piece of legislation, and our healthcare system is changing rapidly. Many of the ACA's provisions will change how care is delivered in the United States and will have a direct effect on practicing physicians, hospitals, and patients. Although CMS plays a major role in the implementation of the law, the government cannot be, and should not be, the primary force in transforming health care in this country. Through the provisions highlighted here as well as others, CMS can create a supportive environment, be a catalyst, and provide incentives for change; however, true transformation must occur on the front lines. For hospitalists, this means partnering with the hospital administration and other hospital personnel, local providers, and community organizations to drive systems‐based improvements that will ultimately achieve higher‐quality care at lower costs for all. It also calls for hospitalists to lead change in their local systems focused on better care, better health, and lower costs through improvement.
Disclosure
The views expressed in this manuscript represent the authors and not necessarily the policy or opinions of the Centers for Medicare and Medicaid Services.
- Department of Health and Human Services. Essential Health Benefits: HHS Informational Bulletin. Available at: http://www.healthcare.gov/news/factsheets/2011/12/essential‐health‐benefits12162011a.html. Accessed December 13, 2012.
- Department of Health and Human Services. Report to Congress: National Strategy for Quality Improvement in Healthcare. March 2011. Available at: http://www.healthcare.gov/law/resources/reports/quality03212011a.html. Accessed December 13, 2012.
- Centers for Medicare and Medicaid Services. FY 2013 IPPS Final Rule Home Page. August 2012. Available at: http://www.cms.gov/Medicare/Medicare‐Fee‐for‐Service‐Payment/AcuteInpatientPPS/FY‐2013‐IPPS‐Final‐Rule‐Home‐Page.html. Accessed December 13, 2012.
- Centers for Medicare and Medicaid Services. Physician Fee Schedule. November 2012. Available at: http://www.cms.gov/Medicare/Medicare‐Fee‐for‐Service‐Payment/PhysicianFeeSched/index.html. Accessed December 13, 2012.
- , . Comparative effectiveness research: implications for hospitalists. J Hosp Medicine. 2010;5(5):257–260.
At the Centers for Medicare and Medicaid Services (CMS), we are charged with implementing many of the major provisions of the Affordable Care Act (ACA). Major policies and programs aimed at transforming the way care is delivered and paid for, testing and scaling innovative delivery system reforms, and expanding the number of Americans with health insurance will now move forward. The healthcare system is moving from paying for volume to paying for value. Hospitals and clinicians will need to be able to manage and be accountable for populations of patients and improving health outcomes. In this article, we highlight 4 broad provisions of the ACA that are either already implemented or under development for implementation in 2014, and are anticipated to have widespread impact on our health system. The potential impacts of each provision on hospitals and hospitalists are outlined in Table 1.
| Affordable Care Act Provision | Example of Potential Impacts on Hospitals and Hospitalists |
|---|---|
| |
| Expansion of insurance coverage | Care for fewer uninsured patients/fewer unreimbursed services |
| Patients have improved access to services after discharge | |
| Shorter lengths of stay due to better access to outpatient services and care | |
| Delivery system transformation | Financial incentives aligned between inpatient and outpatient providers to better coordinate care |
| Payment is at risk if performance rates do not meet benchmarks and if costs are not lowered | |
| Consolidation of hospitals and health systems within local markets | |
| Value‐based purchasing | Medicare FFS reimbursement increased or decreased based on quality and cost measure results |
| Opportunity to align incentives between hospitals and hospitalists | |
| Patient‐centered outcomes research | Emerging research on delivery system interventions relevant to hospitalists, such as care transitions |
| Funding for PCOR available for hospitalist researchers interested in delivery systems and outcomes research | |
EXPANSION OF INSURANCE COVERAGE
The central and perhaps most anticipated provision of the ACA is the expansion of insurance to the currently uninsured through the creation of state‐based health insurance exchanges. The exchanges are a competitive marketplace for purchasing private insurance products by individuals and small and large businesses. The individual mandate that accompanies the exchange provision requires that individuals purchase insurance. For those who cannot afford it, the government provides a subsidy. Any health plan that wishes to participate in an exchange marketplace must include at minimum a package of essential health benefits in each of their insurance products, which include benefits such as ambulatory care services, maternal and newborn services, and prescription drugs.[1] Importantly, health plans are required to implement quality improvement strategies and publicly report quality data. The ACA also requires the Secretary of Health and Human Services (HHS) to develop and administer a quality rating system and an enrollee satisfaction survey system, the results of which will be available to exchange consumers. All of these requirements will promote the delivery of high‐quality healthcare to millions of previously uninsured Americans.
Implementation of the exchanges in combination with the expansion of Medicaid is expected to provide insurance to approximately 30 million people who currently lack coverage. Prior to the Supreme Court ruling in June of 2012, states were required to expand Medicaid eligibility to a minimum of 133% of the federal poverty level. This expansion is subsidized 100% by the federal government through 2016, dropping to 90% by 2020. The Supreme Court ruled that the federal government could not require states to expand their Medicaid rolls, although it is expected that most states will do so given the generous federal subsidy and the significant cost to states, hospitals, and society to provide healthcare to the uninsured.
TRANSFORMATION OF HEALTHCARE DELIVERY
In addition to the expansion of insurance coverage, the ACA initiates a transformation in the way that healthcare will be delivered through the testing and implementation of innovative payment and care delivery models. The ACA authorized the creation of the Center for Medicare and Medicaid Innovation (CMMI, or The Innovation Center) within CMS. Payment and care delivery demonstrations or pilots that demonstrate a high quality of care at lower costs can be scaled up nationally at the discretion of the Secretary, rather than requiring authorization by Congress. The Innovation Center has already launched initiatives that test a variety of new models of care, all of which incentivize care coordination, provision of team‐based care, and use of data and quality metrics to drive systems‐based improvement. These programs include pilots that bundle payments to hospitals, physician group practices, and post‐acute care facilities for episodes of care across settings. This allows providers to innovate and redesign systems to deliver equivalent or higher quality of care at lower costs. Another CMMI model, called the comprehensive primary care initiative, involves CMS partnering with private insurers to provide payment to primary care practices for the delivery of chronic disease management and coordinated care to their entire population of patients, regardless of payer. Of great relevance to all hospitalists, CMMI and CMS, in partnership with other HHS agencies, launched the Partnership for Patients program in 2011. To date, approximately 4000 hospitals have signed on to the Partnership in a collective effort to significantly reduce hospital readmissions and hospital‐acquired conditions. Hospitalists are leading the charge related to Partnership for Patients in many hospitals. The Innovation Center is concurrently launching and rapidly evaluating current pilots, while considering what other new pilots might be needed to further test models aimed at the delivery of better healthcare and health outcomes at lower costs.
Perhaps the delivery system initiative that has received the most attention is the implementation of the Medicare Shared Savings Program (MSSP), or Accountable Care Organizations (ACO). Under the MSSP, ACOs are groups of providers (which may include hospitals) and suppliers of services who work together to coordinate care for the patients they serve. Participating ACOs must achieve performance benchmarks while lowering costs to share in the cost savings with CMS. Although this program is focused on Medicare fee‐for‐service (FFS) beneficiaries, it is expected that all patients will benefit from the infrastructure redesign and care coordination that is required under this program. The pioneer ACOs are large integrated health systems or other providers that have higher levels of shared risk in addition to shared savings. Hospitals that are a part of a participating ACO have greater financial incentives to work with their primary care and other outpatient providers to reduce readmissions and other adverse events and achieve quality benchmarks. With the degree of savings as well as financial risk that is on the table, it is possible that over time, hospitals and health systems may consolidate to capture a larger share of the market. Such a consequence could have a parallel effect on job opportunities and financial incentives and risk for hospitalists in local markets.
VALUE‐BASED PURCHASING
Improvement in the quality of care delivered to all patients is another central purpose of the Affordable Care Act. The law requires that the Secretary develop a National Quality Strategy that must be updated annually; the first version of this strategy was published in April of 2011.[2] The strategy identifies 3 aims for the nation: better healthcare for individuals, better health for populations and communities, and lower costs for all. One of the levers that CMS uses to achieve these 3 aims is value‐based purchasing (VBP). VBP is a way to link the National Quality Strategy with Medicare FFS payments on a national scale by adjusting payments based on performance. VBP rewards providers and health systems that deliver better outcomes in health and healthcare at lower cost to the beneficiaries and communities they serve, rather than rewarding them for the volume of services they provide. The ACA authorizes implementation of the Hospital Value‐Based Purchasing (HVBP) program as well as the Physician Value Modifier (PVM). The HVBP program began in 2011, and currently includes process, outcome, and patient experience quality metrics as well as a total cost metric, which includes 30 days postdischarge for beneficiaries admitted to the hospital. Hospitals are rewarded on either their improvement from baseline or achievement of a benchmark, whichever is higher.[3] The PVM program adjusts providers' Medicare FFS payments up or down beginning in 2015, based on quality metrics reported on care provided in 2013. In the first year of the program, groups of 100 or more physicians are eligible for the program, and are given a choice on metrics to report and whether to elect for quality tiering and the potential for payment adjustment[4]; by payment year 2017, all physicians must participate. To participate, physicians must report on quality metrics that they choose through the Physician Quality Reporting System (PQRS) or elect to have their quality assessed based on administrative claim measures. Measures currently in the PQRS program may not always be relevant for hospitalists; CMS is working to define and include metrics that would be most meaningful to hospitalists' scope of practice and is seeking comment on whether to allow hospital‐based physicians to align with and accept hospital quality measures to count as their performance metrics.
PATIENT‐CENTERED OUTCOMES RESEARCH
Building on the down payment on Comparative Effectiveness Research (CER) funded under the American Recovery and Reinvestment Act of 2009, the ACA authorized the creation of the Patient‐Centered Outcomes Research Institute (PCORI) and allocated funding for CER over 10 years. Rebranded as Patient‐Centered Outcomes Research (PCOR), CER has the potential to improve quality and reduce costs by identifying what works for different populations of patients (eg, children, elderly, patients with multiple chronic conditions, racial and ethnic minorities) in varied settings (eg, ambulatory, hospital, nursing home) under real‐world conditions. The PCORI governance board was created in 2010, and as required by law, developed a national agenda for patient‐centered outcomes research, which includes assessment of prevention, diagnosis, and treatment options; improving healthcare systems; communicating and disseminating research; addressing healthcare disparities; and accelerating PCOR and methodological research. The amount of funding available for research and PCOR infrastructure will ramp up over the next several years, eventually reaching approximately $500 million annually, with increasing funding opportunities for comparative research questions related to clinical and delivery system interventions using pragmatic, randomized, controlled trials; implementation science; and other novel research methodologies. Hospitalists have many roles within this realm, whether as researchers comparing delivery system or clinical interventions, as educators of students or healthcare professionals on the results of PCOR and their implications for practice, or as hospital leaders responsible for implementation of evidence‐based practices.[5]
CONCLUSION
The Affordable Care Act is a transformative piece of legislation, and our healthcare system is changing rapidly. Many of the ACA's provisions will change how care is delivered in the United States and will have a direct effect on practicing physicians, hospitals, and patients. Although CMS plays a major role in the implementation of the law, the government cannot be, and should not be, the primary force in transforming health care in this country. Through the provisions highlighted here as well as others, CMS can create a supportive environment, be a catalyst, and provide incentives for change; however, true transformation must occur on the front lines. For hospitalists, this means partnering with the hospital administration and other hospital personnel, local providers, and community organizations to drive systems‐based improvements that will ultimately achieve higher‐quality care at lower costs for all. It also calls for hospitalists to lead change in their local systems focused on better care, better health, and lower costs through improvement.
Disclosure
The views expressed in this manuscript represent the authors and not necessarily the policy or opinions of the Centers for Medicare and Medicaid Services.
At the Centers for Medicare and Medicaid Services (CMS), we are charged with implementing many of the major provisions of the Affordable Care Act (ACA). Major policies and programs aimed at transforming the way care is delivered and paid for, testing and scaling innovative delivery system reforms, and expanding the number of Americans with health insurance will now move forward. The healthcare system is moving from paying for volume to paying for value. Hospitals and clinicians will need to be able to manage and be accountable for populations of patients and improving health outcomes. In this article, we highlight 4 broad provisions of the ACA that are either already implemented or under development for implementation in 2014, and are anticipated to have widespread impact on our health system. The potential impacts of each provision on hospitals and hospitalists are outlined in Table 1.
| Affordable Care Act Provision | Example of Potential Impacts on Hospitals and Hospitalists |
|---|---|
| |
| Expansion of insurance coverage | Care for fewer uninsured patients/fewer unreimbursed services |
| Patients have improved access to services after discharge | |
| Shorter lengths of stay due to better access to outpatient services and care | |
| Delivery system transformation | Financial incentives aligned between inpatient and outpatient providers to better coordinate care |
| Payment is at risk if performance rates do not meet benchmarks and if costs are not lowered | |
| Consolidation of hospitals and health systems within local markets | |
| Value‐based purchasing | Medicare FFS reimbursement increased or decreased based on quality and cost measure results |
| Opportunity to align incentives between hospitals and hospitalists | |
| Patient‐centered outcomes research | Emerging research on delivery system interventions relevant to hospitalists, such as care transitions |
| Funding for PCOR available for hospitalist researchers interested in delivery systems and outcomes research | |
EXPANSION OF INSURANCE COVERAGE
The central and perhaps most anticipated provision of the ACA is the expansion of insurance to the currently uninsured through the creation of state‐based health insurance exchanges. The exchanges are a competitive marketplace for purchasing private insurance products by individuals and small and large businesses. The individual mandate that accompanies the exchange provision requires that individuals purchase insurance. For those who cannot afford it, the government provides a subsidy. Any health plan that wishes to participate in an exchange marketplace must include at minimum a package of essential health benefits in each of their insurance products, which include benefits such as ambulatory care services, maternal and newborn services, and prescription drugs.[1] Importantly, health plans are required to implement quality improvement strategies and publicly report quality data. The ACA also requires the Secretary of Health and Human Services (HHS) to develop and administer a quality rating system and an enrollee satisfaction survey system, the results of which will be available to exchange consumers. All of these requirements will promote the delivery of high‐quality healthcare to millions of previously uninsured Americans.
Implementation of the exchanges in combination with the expansion of Medicaid is expected to provide insurance to approximately 30 million people who currently lack coverage. Prior to the Supreme Court ruling in June of 2012, states were required to expand Medicaid eligibility to a minimum of 133% of the federal poverty level. This expansion is subsidized 100% by the federal government through 2016, dropping to 90% by 2020. The Supreme Court ruled that the federal government could not require states to expand their Medicaid rolls, although it is expected that most states will do so given the generous federal subsidy and the significant cost to states, hospitals, and society to provide healthcare to the uninsured.
TRANSFORMATION OF HEALTHCARE DELIVERY
In addition to the expansion of insurance coverage, the ACA initiates a transformation in the way that healthcare will be delivered through the testing and implementation of innovative payment and care delivery models. The ACA authorized the creation of the Center for Medicare and Medicaid Innovation (CMMI, or The Innovation Center) within CMS. Payment and care delivery demonstrations or pilots that demonstrate a high quality of care at lower costs can be scaled up nationally at the discretion of the Secretary, rather than requiring authorization by Congress. The Innovation Center has already launched initiatives that test a variety of new models of care, all of which incentivize care coordination, provision of team‐based care, and use of data and quality metrics to drive systems‐based improvement. These programs include pilots that bundle payments to hospitals, physician group practices, and post‐acute care facilities for episodes of care across settings. This allows providers to innovate and redesign systems to deliver equivalent or higher quality of care at lower costs. Another CMMI model, called the comprehensive primary care initiative, involves CMS partnering with private insurers to provide payment to primary care practices for the delivery of chronic disease management and coordinated care to their entire population of patients, regardless of payer. Of great relevance to all hospitalists, CMMI and CMS, in partnership with other HHS agencies, launched the Partnership for Patients program in 2011. To date, approximately 4000 hospitals have signed on to the Partnership in a collective effort to significantly reduce hospital readmissions and hospital‐acquired conditions. Hospitalists are leading the charge related to Partnership for Patients in many hospitals. The Innovation Center is concurrently launching and rapidly evaluating current pilots, while considering what other new pilots might be needed to further test models aimed at the delivery of better healthcare and health outcomes at lower costs.
Perhaps the delivery system initiative that has received the most attention is the implementation of the Medicare Shared Savings Program (MSSP), or Accountable Care Organizations (ACO). Under the MSSP, ACOs are groups of providers (which may include hospitals) and suppliers of services who work together to coordinate care for the patients they serve. Participating ACOs must achieve performance benchmarks while lowering costs to share in the cost savings with CMS. Although this program is focused on Medicare fee‐for‐service (FFS) beneficiaries, it is expected that all patients will benefit from the infrastructure redesign and care coordination that is required under this program. The pioneer ACOs are large integrated health systems or other providers that have higher levels of shared risk in addition to shared savings. Hospitals that are a part of a participating ACO have greater financial incentives to work with their primary care and other outpatient providers to reduce readmissions and other adverse events and achieve quality benchmarks. With the degree of savings as well as financial risk that is on the table, it is possible that over time, hospitals and health systems may consolidate to capture a larger share of the market. Such a consequence could have a parallel effect on job opportunities and financial incentives and risk for hospitalists in local markets.
VALUE‐BASED PURCHASING
Improvement in the quality of care delivered to all patients is another central purpose of the Affordable Care Act. The law requires that the Secretary develop a National Quality Strategy that must be updated annually; the first version of this strategy was published in April of 2011.[2] The strategy identifies 3 aims for the nation: better healthcare for individuals, better health for populations and communities, and lower costs for all. One of the levers that CMS uses to achieve these 3 aims is value‐based purchasing (VBP). VBP is a way to link the National Quality Strategy with Medicare FFS payments on a national scale by adjusting payments based on performance. VBP rewards providers and health systems that deliver better outcomes in health and healthcare at lower cost to the beneficiaries and communities they serve, rather than rewarding them for the volume of services they provide. The ACA authorizes implementation of the Hospital Value‐Based Purchasing (HVBP) program as well as the Physician Value Modifier (PVM). The HVBP program began in 2011, and currently includes process, outcome, and patient experience quality metrics as well as a total cost metric, which includes 30 days postdischarge for beneficiaries admitted to the hospital. Hospitals are rewarded on either their improvement from baseline or achievement of a benchmark, whichever is higher.[3] The PVM program adjusts providers' Medicare FFS payments up or down beginning in 2015, based on quality metrics reported on care provided in 2013. In the first year of the program, groups of 100 or more physicians are eligible for the program, and are given a choice on metrics to report and whether to elect for quality tiering and the potential for payment adjustment[4]; by payment year 2017, all physicians must participate. To participate, physicians must report on quality metrics that they choose through the Physician Quality Reporting System (PQRS) or elect to have their quality assessed based on administrative claim measures. Measures currently in the PQRS program may not always be relevant for hospitalists; CMS is working to define and include metrics that would be most meaningful to hospitalists' scope of practice and is seeking comment on whether to allow hospital‐based physicians to align with and accept hospital quality measures to count as their performance metrics.
PATIENT‐CENTERED OUTCOMES RESEARCH
Building on the down payment on Comparative Effectiveness Research (CER) funded under the American Recovery and Reinvestment Act of 2009, the ACA authorized the creation of the Patient‐Centered Outcomes Research Institute (PCORI) and allocated funding for CER over 10 years. Rebranded as Patient‐Centered Outcomes Research (PCOR), CER has the potential to improve quality and reduce costs by identifying what works for different populations of patients (eg, children, elderly, patients with multiple chronic conditions, racial and ethnic minorities) in varied settings (eg, ambulatory, hospital, nursing home) under real‐world conditions. The PCORI governance board was created in 2010, and as required by law, developed a national agenda for patient‐centered outcomes research, which includes assessment of prevention, diagnosis, and treatment options; improving healthcare systems; communicating and disseminating research; addressing healthcare disparities; and accelerating PCOR and methodological research. The amount of funding available for research and PCOR infrastructure will ramp up over the next several years, eventually reaching approximately $500 million annually, with increasing funding opportunities for comparative research questions related to clinical and delivery system interventions using pragmatic, randomized, controlled trials; implementation science; and other novel research methodologies. Hospitalists have many roles within this realm, whether as researchers comparing delivery system or clinical interventions, as educators of students or healthcare professionals on the results of PCOR and their implications for practice, or as hospital leaders responsible for implementation of evidence‐based practices.[5]
CONCLUSION
The Affordable Care Act is a transformative piece of legislation, and our healthcare system is changing rapidly. Many of the ACA's provisions will change how care is delivered in the United States and will have a direct effect on practicing physicians, hospitals, and patients. Although CMS plays a major role in the implementation of the law, the government cannot be, and should not be, the primary force in transforming health care in this country. Through the provisions highlighted here as well as others, CMS can create a supportive environment, be a catalyst, and provide incentives for change; however, true transformation must occur on the front lines. For hospitalists, this means partnering with the hospital administration and other hospital personnel, local providers, and community organizations to drive systems‐based improvements that will ultimately achieve higher‐quality care at lower costs for all. It also calls for hospitalists to lead change in their local systems focused on better care, better health, and lower costs through improvement.
Disclosure
The views expressed in this manuscript represent the authors and not necessarily the policy or opinions of the Centers for Medicare and Medicaid Services.
- Department of Health and Human Services. Essential Health Benefits: HHS Informational Bulletin. Available at: http://www.healthcare.gov/news/factsheets/2011/12/essential‐health‐benefits12162011a.html. Accessed December 13, 2012.
- Department of Health and Human Services. Report to Congress: National Strategy for Quality Improvement in Healthcare. March 2011. Available at: http://www.healthcare.gov/law/resources/reports/quality03212011a.html. Accessed December 13, 2012.
- Centers for Medicare and Medicaid Services. FY 2013 IPPS Final Rule Home Page. August 2012. Available at: http://www.cms.gov/Medicare/Medicare‐Fee‐for‐Service‐Payment/AcuteInpatientPPS/FY‐2013‐IPPS‐Final‐Rule‐Home‐Page.html. Accessed December 13, 2012.
- Centers for Medicare and Medicaid Services. Physician Fee Schedule. November 2012. Available at: http://www.cms.gov/Medicare/Medicare‐Fee‐for‐Service‐Payment/PhysicianFeeSched/index.html. Accessed December 13, 2012.
- , . Comparative effectiveness research: implications for hospitalists. J Hosp Medicine. 2010;5(5):257–260.
- Department of Health and Human Services. Essential Health Benefits: HHS Informational Bulletin. Available at: http://www.healthcare.gov/news/factsheets/2011/12/essential‐health‐benefits12162011a.html. Accessed December 13, 2012.
- Department of Health and Human Services. Report to Congress: National Strategy for Quality Improvement in Healthcare. March 2011. Available at: http://www.healthcare.gov/law/resources/reports/quality03212011a.html. Accessed December 13, 2012.
- Centers for Medicare and Medicaid Services. FY 2013 IPPS Final Rule Home Page. August 2012. Available at: http://www.cms.gov/Medicare/Medicare‐Fee‐for‐Service‐Payment/AcuteInpatientPPS/FY‐2013‐IPPS‐Final‐Rule‐Home‐Page.html. Accessed December 13, 2012.
- Centers for Medicare and Medicaid Services. Physician Fee Schedule. November 2012. Available at: http://www.cms.gov/Medicare/Medicare‐Fee‐for‐Service‐Payment/PhysicianFeeSched/index.html. Accessed December 13, 2012.
- , . Comparative effectiveness research: implications for hospitalists. J Hosp Medicine. 2010;5(5):257–260.
Epidemiology of Organ System Dysfunction
The International Consensus Conference (ICC) for sepsis defines severe sepsis as an infection leading to acute organ dysfunction.[1, 2] Severe sepsis afflicts over 1 million patients each year in Medicare alone, and is substantially more common among older Americans than acute myocardial infarction.[3, 4, 5] Recently, the Agency for Healthcare Research and Quality identified severe sepsis as the single most expensive cause of hospitalization in the United States.[6] The incidence of severe sepsis continues to rise.[4, 5]
Severe sepsis is often mischaracterized as a diagnosis cared for primarily in the intensive care unit (ICU). Yet, studies indicate that only 32% to 50% of patients with severe sepsis require ICU care, leaving the majority on the general care wards.[7, 8] These studies also reveal mortality rates of 26% to 30% among patients with severe sepsis who are not admitted to an ICU compared to 11% to 33% in the ICU.[7, 8]
Although a number of epidemiologic and interventional studies have focused on severe sepsis in the ICU,[3, 9, 10] much less is known about patients cared for on the general medicine wards. Without this information, clinicians cannot make informed choices about important management decisions such as targeted diagnostic testing, empirical antimicrobials, and other therapies. To this end, we sought to further characterize the infectious etiologies and resultant organ system dysfunctions in the subset of patients with severe sepsis admitted to non‐ICU medical services at a tertiary academic medical center.
METHODS
Population/Setting
All hospitalizations of adult patients (18 years old) who were initially admitted to non‐ICU medical services at the University of Michigan Hospital during 2009 through 2010 were included. The University of Michigan Hospital has 610 general medical‐surgical beds, including telemetry beds, with closed ICUs comprised of 179 beds staffed by intensivists. Patients transferred from other hospitals and those admitted to non‐medical services were excluded.
Data Abstraction and Definitions
All International Classification of Diseases, 9th Revision, Clinical Modification (ICD‐9‐CM) diagnosis codes for hospitalizations were screened using a previously published and validated algorithm for severe sepsis.[11] Following this screening, 3 randomly selected round‐numbered batches of hospitalizations were sampled with subsequent application of the exclusion criteria. Medical records including physicians' notes, consultants' notes, nurses' notes, physical therapy notes, discharge coordinators' notes, emergency room flow sheets, as well as ward flow sheets were reviewed in detail by 3 practicing hospitalists using a structured instrument closely aligned with the ICC definition of severe sepsis.[2] We also sampled a smaller number of patients whose ICD‐9‐CM diagnoses screened negative for severe sepsis. Sample size was selected as part of a project with multiple objectives, and reflected a pragmatic balance between the anticipated precision of the results and the resources available to conduct chart review.[11] All discrepancies were reconciled among the 3 reviewers.
Reviewers first assessed whether infection was present, then evaluated for evidence of each organ system dysfunction, and finally determined the extent to which those organ dysfunctions were a response to the infection. Infection was defined either as a patient with a microbiologic culture growing a pathologic organism in a normally sterile site or documentation of a suspected infection with other confirmatory evidence (radiological, physical exam finding) with resultant systemic inflammatory response and administration of antimicrobials. Community‐acquired and healthcare‐associated infections were not differentiated. Microbiologic data, confirmatory tests, and site of infection were abstracted in detail.
Organ dysfunction was defined as per the 2001 ICC criteria,[2] and was assessed for neurological, pulmonary, cardiovascular, renal, gastrointestinal, hematological, and hepatic system involvement in all patients. A summary of these clinical definitions is included in Table 1. Data on important comorbidities were also abstracted. Immunosuppression was defined as having any of the following: solid organ transplant, bone marrow/stem cell transplant, human immunodeficiency virus/acquired immunodeficiency syndrome, neutropenia (absolute neutrophil count <1000), hematologic malignancy, solid organ malignancy with chemotherapy within the past 12 months, or pharmacologic immunosuppression (prednisone >20 mg daily for >4 weeks, calcineurin inhibitor, methotrexate, tumor necrosis factor inhibitors, azathioprine, sulfasalazine, hydroxychloroquine). Last, each chart was evaluated for the presence of explicit documentation with the presence of the words or phrases: sepsis, septic shock, or severe sepsis, indicating that the clinical service recognized and fully documented that a patient had severe sepsis.
| Organ System | Parameters to Indicate Dysfunction |
|---|---|
| |
| Cardiovascular | Systolic BP <90, elevated lactate, MAP <70, requiring pressors >2 hours, decrease in systolic BP of >40 |
| Renal | Creatinine increase >0.5 mg/dL, oliguria |
| Neurological | Acute mental status changes |
| Pulmonary | Intubation, BiPAP, supplemental oxygen >6 LPM or 40% face mask, PaO2/FiO2 <300 |
| Hematologic | INR >1.5 or PTT >60 not on anticoagulation, platelets <100 or 50% of baseline |
| Ileus | Decreased bowel motility requiring a change in diet |
| Hepatic | Bilirubin >4 mg/dL and >1.5 baseline |
Data Analysis
Methods for assessment of reviewer concordance have been previously described and were summarized using the kappa statistic.[11] Initial data extraction was performed in SAS 9.1 (SAS Institute, Cary, NC) and all analyses were conducted in Stata 12 (StataCorp LP, College Station, TX). Binomial 95% confidence intervals (CIs) are presented. This project was approved by the University of Michigan Institutional Review Board.
RESULTS
Of 23,288 hospitalizations examined from 2009 through 2010, the ICD‐9based automated screen for severe sepsis was positive for 3,146 (14 %). A random sample of 111 medical records, of which 92 had screened positive for severe sepsis and 19 had screened negative, was reviewed in detail. After review by the hospitalists, 64 of these 111 hospitalizations were judged to have severe sepsis, 61 of the 92 screened positive cases (66%), and 3 of the 19 screened negative cases (16%). The 3 reviewers had a kappa of 0.70, indicating good agreement.
Characteristics of the 64 patients with severe sepsis are shown in Table 2. The mean age was 63 years old (standard deviation [SD]=17.7), and 41% were male. The mean length of stay was 13.7 days (SD=20.8). Thirty‐nine percent (95% CI, 27%‐52%) of patients (25/64) were immunosuppressed. Of patients initially admitted to the general medical ward, 25% (16/64; 95% CI, 15%‐37%) ultimately required ICU care during their admission. The overall in‐hospital mortality rate was 13% (8/64; 95% CI, 6%‐23%). Immunosuppressed patients had a mortality rate of 20% and nonimmunosuppressed patients had a mortality rate of 8%. Only 47% (30/64; 95% CI, 34%‐60%) of the medical records had explicit clinician documentation of severe sepsis.
| Age, mean (SD), y | 63 (18) |
|---|---|
| |
| Male sex, no. (%) | 26 (41) |
| Preexisting conditions, no. (%) | |
| History of diabetes | 20 (31) |
| End stage renal disease on chronic dialysis | 2 (3) |
| Chronic obstructive pulmonary disease on oxygen | 3 (5) |
| History of cancer | 15 (23) |
| Liver cirrhosis | 5 (8) |
| Immunosuppression | 25 (39) |
| Median length of stay (days) | 7.5 |
| Mean length of stay (SD) | 13.7 (20.8) |
The most common site of infection was found to be the genitourinary system, occurring in 41% (26/64; 95% CI, 29%‐54%) of patients (Table 3). Pulmonary and intra‐abdominal sites were also common, accounting for 14% (95% CI, 6.6%‐25%) and 13% (95% CI, 5.6%‐23%) of sites, respectively. An infecting organism was identified by culture in 66% (42/64; 95% CI, 53%‐77%) of case patients with specific pathogens listed in Table 4. Among patients with positive culture results, the majority grew Gram‐negative organisms (57%; 95% CI, 41%‐72%). Non‐Clostridium difficile Gram‐positive organisms were also prominent and identified in 48% (95% CI, 32%‐64%) of positive cultures. Candida was less common (12%, 95% CI, 4.0%‐26%). Fourteen cases (22%, 95% CI, 10%‐30%) had 2 or more concomitant infectious pathogens.
| Site | No. (%) |
|---|---|
| |
| Genitourinary | 26 (41) |
| Pulmonary | 9 (14) |
| Intra‐abdominal (not intraluminal) | 8 (13) |
| Bloodstream/cardiac | 5 (8) |
| Skin and soft tissue | 4 (6) |
| GI lumen | 4 (6) |
| Joint | 2 (3) |
| Multiple sites | 4 (6) |
| Unknown | 2 (2) |
| Absolute Frequency, Total Positive Culture Results, N=64, No. (%)*?>a | Patients With Cultures Growing at Least One of the Pathogens, N=42, No. (%)*?>a | |
|---|---|---|
| ||
| Gram‐negative pathogens | 30 (47) | 24 (57) |
| Escherichia coli | 12 (19) | 12 (29) |
| Escherichia coli (multidrug resistant) | 2 (3) | 2 (5) |
| Klebsiella | 6 (9) | 5 (12) |
| Pseudomonas aeruginosa | 6 (9) | 4 (10) |
| Pseudomonas aeruginosa (multidrug resistant) | 2 (3) | 2 (5) |
| Otherb | 6 (9) | 6 (14) |
| Gram‐positive pathogens | 29 (45) | 25 (59) |
| Enterococcus | 14 (22) | 13 (31) |
| Vancomycin‐resistant Enterococcus species | 5 (8) | 4 (10) |
| Staphylococcus aureus | 7 (11) | 7 (17) |
| Methicillin‐resistant Staphylococcus aureus | 3 (5) | 3 (7) |
| Streptococcus pneumoniae | 2 (3) | 2 (5) |
| Coagulase‐negative staphylococci | 1 (2) | 1 (2) |
| Clostridium difficile | 5 (8) | 5 (12) |
| Fungi | ||
| Candida species | 5 (8) | 5 (12) |
| Mycobacterium avium | 1 (2) | 1 (2) |
| Two organisms | 9 (21) | |
| Three or more organisms | 5 (12) | |
All 64 patients had at least 1 organ dysfunction, as required by the ICC definition of severe sepsis. Organ dysfunction in 2 or more organ systems occurred in 77% (95% CI, 64%‐86%) of the cases (49/64). The incidence for each organ system dysfunction is presented in Table 5, as well as its relationship to both mortality and ICU admission. The most common organ system dysfunctions were found to be cardiovascular (hypotension) and renal dysfunction occurring in 66% and 64% of the cases, respectively. In this non‐ICU population, pulmonary dysfunction occurred in 30% of cases, but was frequently associated with transfer to the ICU, as 63% of the patients with pulmonary failure required ICU care. Patients with more organ systems affected were more likely to be transferred to the ICU and to die.
| No. (%) | ICU Transfer, No. (%) | Mortality, No. (%) | |
|---|---|---|---|
| |||
| Number of failed organs, N = 64 | |||
| 1 | 15 (23%) | 0 (0%) | 0 (0%) |
| 2 | 25 (39%) | 2 (8%) | 0 (0%) |
| 3 | 7 (11%) | 2 (29%) | 1 (14%) |
| 4 | 10 (16%) | 6 (60%) | 3 (30%) |
| >4 | 7 (11%) | 6 (86%) | 4 (57%) |
| Types of organ system dysfunction, all patients, N = 64*?>a | |||
| Cardiovascular | 42 (66%) | 16 (38%)b | 8 (19%)c |
| Renal | 41 (64%) | 10 (24%)b | 5 (12%)c |
| Central nervous system | 35 (54%) | 14 (40%)b | 7 (18%)c |
| Pulmonary | 19 (30%) | 12 (63%)b | 8 (42%)c |
| Hematologic | 15 (23%) | 6 (40%)b | 6 (40%)c |
| GI (ileus) | 8 (13%) | 5 (63%)b | 1 (13%)c |
| Hepatic | 5 (8%) | 4 (80%)b | 2 (40%)c |
DISCUSSION
Severe sepsis was common among patients admitted to the general medical ward in this tertiary care center. Our patient cohort differed in important ways from previously described typical cases of severe sepsis among ICU populations. Severe sepsis on the general medical wards was more commonly associated with Gram‐negative pathogens in the setting of genitourinary tract infections. This is in contrast to Gram‐positive organisms and respiratory tract infections, which are more common in the ICU.[3, 10] Renal and cardiac dysfunction were commonly observed organ failures, whereas in the ICU, severe sepsis has been reported to more likely involve respiratory failure. These results suggest that hospitalists seeking to provide evidence‐based care to prevent postsepsis morbidity and mortality for their non‐ICU patients need to heighten their index of suspicion when caring for an infected patient and appreciate that many severe sepsis patients may not fit neatly into traditional sepsis treatment algorithms.
Studies characterizing severe sepsis in the ICU setting indicate a predominance of pulmonary infections and respiratory failure with occurrence rates of 74% to 95% and 54% to 61%, respectively.[3, 12, 13] Given that either shock or pulmonary dysfunction is often required for admission to many ICUs, it is perhaps not surprising that these rates are dramatically different on the general medicine ward, with a relative scarcity of pulmonary infections (14%) and respiratory dysfunction (30%). Instead, genitourinary infections were noted in 41% (95% CI, 29%‐54%) of the cases, in contrast to the rates of genitourinary infections in ICU patients with severe sepsis, which have rates of 5.4% to 9.1%.[3, 10] Likely as a result of this, a Gram‐negative predominance is noted in the associated microbiology. Furthermore, our study indicates that C difficile and vancomycin‐resistant Enterococcus (VRE) species appear to represent an emerging cause of severe sepsis on the general medicine wards, as they have not been noted to be causative micro‐organisms in previous studies of sepsis. This is concordant with other studies showing increases in incidence and severity of disease for C difficile as well as VRE.[14, 15]
Previous epidemiologic studies of severe sepsis originating outside the ICU are lacking, but some work has been done. One study on the epidemiology of sepsis both with and without organ dysfunction aggregated all hospitalized patients and included those both admitted to the general medicine wards and directly to the ICU.[7] Similar to our study, this study also found a predominance of Gram‐negative causative organisms, as well as comparable in‐hospital mortality rates (12.8% vs 13%). Additionally, genitourinary infections were noted in 20% of the patients, notably higher than rates reported to have been found in patients with severe sepsis in the ICU, but not the magnitude found in our study, perhaps as a result of the combined ICU‐ward population studied. A similar high prevalence of genitourinary infections was also noted in a recent administrative data‐based study of emergency medical services‐transported patients with severe sepsis, half of whom required intensive care during their hospitalization.[16]
Our study is unique in that it focuses on severe sepsis in patients, commonly cared for by hospitalists, who were admitted to the general medical ward, and uses patient level data to elucidate more characteristics of the defining organ dysfunction. Furthermore, our results suggest that severe sepsis was poorly documented in this setting, indicating a potential impact on billing, coding, case mix index, and hospital mortality statistics that rely on very specific wording, as well as a possible need for increased awareness among hospitalists. Without this awareness, an opportunity may be missed for improved patient care via specific sepsis‐targeted measures,[13, 17, 18] including more aggressive resuscitative measures[19] or intensive physical and occupational therapy interventions aimed at impacting the cognitive and functional debilities[20] that result from severe sepsis. Highlighting this growing need to better assist clinicians assess the severity of septic patients and recognize these complex cases on the general medicine wards, 1 recent study evaluated the fitness of several clinical disease‐severity scoring systems for patients with sepsis in general internal medicine departments.[21] Perhaps with the help of tools such as these, which are being piloted in some hospitals, the care of this growing population can be enhanced.
Our study has a number of limitations that should be kept in mind. First, this is a single center study performed at an academic tertiary care center with a relatively high incidence of immunosuppression, which may influence the spectrum of infecting organisms. Our center also has a relatively large, closed‐model ICU, which often operates at near capacity, potentially affecting the severity of our non‐ICU population. Second, although we screened a large number of patients, as necessitated by our intensive and detailed review of clinical information, our sample size with hospitalist‐validated severe sepsis is relatively small. With this small sample size, less prevalent infections, patient characteristics, and organ dysfunctions may by chance have been under or over‐represented, and one could expect some variance in the occurrence rates of organ system dysfunction and infection rates by sampling error alone. Further larger scale studies are warranted to confirm these data and their generalizability. Third, the data necessary to calculate sequential organ failure assessment or multiple organ dysfunction score were not collected. This may limit the ability to directly compare the organ dysfunction noted in this study with others. Additionally, given the ICC definitions of organ dysfunction, some of the organ dysfunction noted, particularly for neurological dysfunction, was reliant on subjective clinical findings documented in the record. Finally, we relied on the lack of specific terminology to indicate a lack of documentation of sepsis, which does not necessarily indicate a lack of recognition or undertreatment of this condition. However, these limitations are offset by the strengths of this study, including the patient‐level medical record validation of severe sepsis by trained hospitalist physicians, high kappa statistic, and strict application of guideline‐based definitions.
This work has important implications for both clinicians and for future research on severe sepsis. The results suggest that severe sepsis may be quite common outside the ICU, and that patients presenting with this condition who are admitted to general medical wards are not routinely characterized by the profound hypoxemia and refractory shock of iconic cases. Certainly, further study looking at larger numbers of cases is needed to better understand the specifics and nuances of this important topic as well as to further evaluate clinicians' ability to recognize and treat such patients in this setting. Furthermore, future research on the treatment of severe sepsis, including both antimicrobials and disease‐modifying agents (eg, anti‐inflammatories) must continue to include and even focus on this large population of non‐ICU patients with severe sepsis, as the risk/benefit ratios of such potential treatments may vary with severity of illness.
In conclusion, severe sepsis was commonly found in patients admitted on the general medicine wards. The epidemiology of the infections and resultant organ dysfunction appears to differ from that found in the ICU. More studies are needed to provide a deeper understanding of this disease process, as this will enable clinicians to better recognize and treat patients thus afflicted, no matter the setting.
Acknowledgments
The authors thank Laetitia Shapiro, AM, for her programming assistance.
Disclosures: This work was supported in part by the US National Institutes of HealthK08, HL091249 (TJI) and the University of Michigan SpecialistHospitalist Allied Research Program (SHARP). This work was also supported in part by VA Ann Arbor Healthcare System, Geriatric Research Education and Clinical Center (GRECC).
- , , , et al. Definitions for sepsis and organ failure and guidelines for the use of innovative therapies in sepsis. The ACCP/SCCM Consensus Conference Committee. American College of Chest Physicians/Society of Critical Care Medicine. Chest. 1992;101(6):1644–1655.
- , , , et al. 2001 SCCM/ESICM/ACCP/ATS/SIS International Sepsis Definitions Conference. Crit Care Med. 2003;31(4):1250–1256.
- , , , , , . Epidemiology of severe sepsis in the United States: analysis of incidence, outcome, and associated costs of care. Crit Care Med. 2001;29(7):1303–1310.
- , , , . Population burden of long‐term survivorship after severe sepsis in older americans. J Am Geriatr Soc. 2012;60(6):1070–1077.
- , , , . The epidemiology of sepsis in the United States from 1979 through 2000. N Engl J Med. 2003;348(16):1546–1554.
- , , . Septicemia in U.S. hospitals, 2009: statistical brief #122. October 2011. In: Healthcare Cost and Utilization Project Statistical Briefs. Rockville, MD: Agency for Health Care Policy and Research; 2006. Available from: http://www.ncbi.nlm.nih.gov/books/NBK65391. Accessed June 2, 2012.
- , , , et al. Sepsis incidence and outcome: contrasting the intensive care unit with the hospital ward. Crit Care Med. 2007;35(5):1284–1289.
- , , , , . Epidemiology of sepsis in Victoria, Australia. Crit Care Med. 2005;33(1):71–80.
- , , , et al. Effect of empirical treatment with moxifloxacin and meropenem vs meropenem on sepsis‐related organ dysfunction in patients with severe sepsis: a randomized trial. JAMA. 2012;307(22):2390–2399.
- , , , , . Incidence and impact of organ dysfunctions associated with sepsis. Chest. 2005;127(3):942–951.
- , , , et al. Identifying patients with severe sepsis using administrative claims: patient‐level validation of the Angus Implementation of the International Consensus Conference definition of severe sepsis [published online ahead of print September 18, 2012]. Medical Care. doi: 10.1097/MLR.0b013e318268ac86.
- , , , . Current epidemiology of septic shock: the CUB‐Rea Network. Am J Respir Crit Care Med. 2003;168(2):165–172.
- . Management of sepsis. N Engl J Med. 2006;355(16):1699–1713.
- , , . Current status of Clostridium difficile infection ipidemiology. Clin Infect Dis. 2012;55(suppl 2):S65–S70.
- , . Vancomycin‐resistant enterococci. Semin Respir Infect. 2000;15(4):314–326.
- , , , , , . Severe sepsis in prehospital emergency care: analysis of incidence, care, and outcome. Am J Respir Crit Care Med. 2012;186(12):1264–1271.
- , . Novel Therapies for Septic Shock Over the Past 4 Decades. JAMA. 2011;306(2):194–199.
- , , , et al. Impact of the Surviving Sepsis Campaign protocols on hospital length of stay and mortality in septic shock patients: results of a three‐year follow‐up quasi‐experimental study. Crit Care Med. 2010;38(4):1036–1043.
- , . Diagnosis and treatment of severe sepsis. Crit Care. 2007;11(suppl 5):S2.
- , , , . Long‐term cognitive impairment and functional disability among survivors of severe sepsis. JAMA. 2010;304(16):1787–1794.
- , , , , . Assessment of disease‐severity scoring systems for patients with sepsis in general internal medicine departments. Crit Care. 2011;15:R95.
The International Consensus Conference (ICC) for sepsis defines severe sepsis as an infection leading to acute organ dysfunction.[1, 2] Severe sepsis afflicts over 1 million patients each year in Medicare alone, and is substantially more common among older Americans than acute myocardial infarction.[3, 4, 5] Recently, the Agency for Healthcare Research and Quality identified severe sepsis as the single most expensive cause of hospitalization in the United States.[6] The incidence of severe sepsis continues to rise.[4, 5]
Severe sepsis is often mischaracterized as a diagnosis cared for primarily in the intensive care unit (ICU). Yet, studies indicate that only 32% to 50% of patients with severe sepsis require ICU care, leaving the majority on the general care wards.[7, 8] These studies also reveal mortality rates of 26% to 30% among patients with severe sepsis who are not admitted to an ICU compared to 11% to 33% in the ICU.[7, 8]
Although a number of epidemiologic and interventional studies have focused on severe sepsis in the ICU,[3, 9, 10] much less is known about patients cared for on the general medicine wards. Without this information, clinicians cannot make informed choices about important management decisions such as targeted diagnostic testing, empirical antimicrobials, and other therapies. To this end, we sought to further characterize the infectious etiologies and resultant organ system dysfunctions in the subset of patients with severe sepsis admitted to non‐ICU medical services at a tertiary academic medical center.
METHODS
Population/Setting
All hospitalizations of adult patients (18 years old) who were initially admitted to non‐ICU medical services at the University of Michigan Hospital during 2009 through 2010 were included. The University of Michigan Hospital has 610 general medical‐surgical beds, including telemetry beds, with closed ICUs comprised of 179 beds staffed by intensivists. Patients transferred from other hospitals and those admitted to non‐medical services were excluded.
Data Abstraction and Definitions
All International Classification of Diseases, 9th Revision, Clinical Modification (ICD‐9‐CM) diagnosis codes for hospitalizations were screened using a previously published and validated algorithm for severe sepsis.[11] Following this screening, 3 randomly selected round‐numbered batches of hospitalizations were sampled with subsequent application of the exclusion criteria. Medical records including physicians' notes, consultants' notes, nurses' notes, physical therapy notes, discharge coordinators' notes, emergency room flow sheets, as well as ward flow sheets were reviewed in detail by 3 practicing hospitalists using a structured instrument closely aligned with the ICC definition of severe sepsis.[2] We also sampled a smaller number of patients whose ICD‐9‐CM diagnoses screened negative for severe sepsis. Sample size was selected as part of a project with multiple objectives, and reflected a pragmatic balance between the anticipated precision of the results and the resources available to conduct chart review.[11] All discrepancies were reconciled among the 3 reviewers.
Reviewers first assessed whether infection was present, then evaluated for evidence of each organ system dysfunction, and finally determined the extent to which those organ dysfunctions were a response to the infection. Infection was defined either as a patient with a microbiologic culture growing a pathologic organism in a normally sterile site or documentation of a suspected infection with other confirmatory evidence (radiological, physical exam finding) with resultant systemic inflammatory response and administration of antimicrobials. Community‐acquired and healthcare‐associated infections were not differentiated. Microbiologic data, confirmatory tests, and site of infection were abstracted in detail.
Organ dysfunction was defined as per the 2001 ICC criteria,[2] and was assessed for neurological, pulmonary, cardiovascular, renal, gastrointestinal, hematological, and hepatic system involvement in all patients. A summary of these clinical definitions is included in Table 1. Data on important comorbidities were also abstracted. Immunosuppression was defined as having any of the following: solid organ transplant, bone marrow/stem cell transplant, human immunodeficiency virus/acquired immunodeficiency syndrome, neutropenia (absolute neutrophil count <1000), hematologic malignancy, solid organ malignancy with chemotherapy within the past 12 months, or pharmacologic immunosuppression (prednisone >20 mg daily for >4 weeks, calcineurin inhibitor, methotrexate, tumor necrosis factor inhibitors, azathioprine, sulfasalazine, hydroxychloroquine). Last, each chart was evaluated for the presence of explicit documentation with the presence of the words or phrases: sepsis, septic shock, or severe sepsis, indicating that the clinical service recognized and fully documented that a patient had severe sepsis.
| Organ System | Parameters to Indicate Dysfunction |
|---|---|
| |
| Cardiovascular | Systolic BP <90, elevated lactate, MAP <70, requiring pressors >2 hours, decrease in systolic BP of >40 |
| Renal | Creatinine increase >0.5 mg/dL, oliguria |
| Neurological | Acute mental status changes |
| Pulmonary | Intubation, BiPAP, supplemental oxygen >6 LPM or 40% face mask, PaO2/FiO2 <300 |
| Hematologic | INR >1.5 or PTT >60 not on anticoagulation, platelets <100 or 50% of baseline |
| Ileus | Decreased bowel motility requiring a change in diet |
| Hepatic | Bilirubin >4 mg/dL and >1.5 baseline |
Data Analysis
Methods for assessment of reviewer concordance have been previously described and were summarized using the kappa statistic.[11] Initial data extraction was performed in SAS 9.1 (SAS Institute, Cary, NC) and all analyses were conducted in Stata 12 (StataCorp LP, College Station, TX). Binomial 95% confidence intervals (CIs) are presented. This project was approved by the University of Michigan Institutional Review Board.
RESULTS
Of 23,288 hospitalizations examined from 2009 through 2010, the ICD‐9based automated screen for severe sepsis was positive for 3,146 (14 %). A random sample of 111 medical records, of which 92 had screened positive for severe sepsis and 19 had screened negative, was reviewed in detail. After review by the hospitalists, 64 of these 111 hospitalizations were judged to have severe sepsis, 61 of the 92 screened positive cases (66%), and 3 of the 19 screened negative cases (16%). The 3 reviewers had a kappa of 0.70, indicating good agreement.
Characteristics of the 64 patients with severe sepsis are shown in Table 2. The mean age was 63 years old (standard deviation [SD]=17.7), and 41% were male. The mean length of stay was 13.7 days (SD=20.8). Thirty‐nine percent (95% CI, 27%‐52%) of patients (25/64) were immunosuppressed. Of patients initially admitted to the general medical ward, 25% (16/64; 95% CI, 15%‐37%) ultimately required ICU care during their admission. The overall in‐hospital mortality rate was 13% (8/64; 95% CI, 6%‐23%). Immunosuppressed patients had a mortality rate of 20% and nonimmunosuppressed patients had a mortality rate of 8%. Only 47% (30/64; 95% CI, 34%‐60%) of the medical records had explicit clinician documentation of severe sepsis.
| Age, mean (SD), y | 63 (18) |
|---|---|
| |
| Male sex, no. (%) | 26 (41) |
| Preexisting conditions, no. (%) | |
| History of diabetes | 20 (31) |
| End stage renal disease on chronic dialysis | 2 (3) |
| Chronic obstructive pulmonary disease on oxygen | 3 (5) |
| History of cancer | 15 (23) |
| Liver cirrhosis | 5 (8) |
| Immunosuppression | 25 (39) |
| Median length of stay (days) | 7.5 |
| Mean length of stay (SD) | 13.7 (20.8) |
The most common site of infection was found to be the genitourinary system, occurring in 41% (26/64; 95% CI, 29%‐54%) of patients (Table 3). Pulmonary and intra‐abdominal sites were also common, accounting for 14% (95% CI, 6.6%‐25%) and 13% (95% CI, 5.6%‐23%) of sites, respectively. An infecting organism was identified by culture in 66% (42/64; 95% CI, 53%‐77%) of case patients with specific pathogens listed in Table 4. Among patients with positive culture results, the majority grew Gram‐negative organisms (57%; 95% CI, 41%‐72%). Non‐Clostridium difficile Gram‐positive organisms were also prominent and identified in 48% (95% CI, 32%‐64%) of positive cultures. Candida was less common (12%, 95% CI, 4.0%‐26%). Fourteen cases (22%, 95% CI, 10%‐30%) had 2 or more concomitant infectious pathogens.
| Site | No. (%) |
|---|---|
| |
| Genitourinary | 26 (41) |
| Pulmonary | 9 (14) |
| Intra‐abdominal (not intraluminal) | 8 (13) |
| Bloodstream/cardiac | 5 (8) |
| Skin and soft tissue | 4 (6) |
| GI lumen | 4 (6) |
| Joint | 2 (3) |
| Multiple sites | 4 (6) |
| Unknown | 2 (2) |
| Absolute Frequency, Total Positive Culture Results, N=64, No. (%)*?>a | Patients With Cultures Growing at Least One of the Pathogens, N=42, No. (%)*?>a | |
|---|---|---|
| ||
| Gram‐negative pathogens | 30 (47) | 24 (57) |
| Escherichia coli | 12 (19) | 12 (29) |
| Escherichia coli (multidrug resistant) | 2 (3) | 2 (5) |
| Klebsiella | 6 (9) | 5 (12) |
| Pseudomonas aeruginosa | 6 (9) | 4 (10) |
| Pseudomonas aeruginosa (multidrug resistant) | 2 (3) | 2 (5) |
| Otherb | 6 (9) | 6 (14) |
| Gram‐positive pathogens | 29 (45) | 25 (59) |
| Enterococcus | 14 (22) | 13 (31) |
| Vancomycin‐resistant Enterococcus species | 5 (8) | 4 (10) |
| Staphylococcus aureus | 7 (11) | 7 (17) |
| Methicillin‐resistant Staphylococcus aureus | 3 (5) | 3 (7) |
| Streptococcus pneumoniae | 2 (3) | 2 (5) |
| Coagulase‐negative staphylococci | 1 (2) | 1 (2) |
| Clostridium difficile | 5 (8) | 5 (12) |
| Fungi | ||
| Candida species | 5 (8) | 5 (12) |
| Mycobacterium avium | 1 (2) | 1 (2) |
| Two organisms | 9 (21) | |
| Three or more organisms | 5 (12) | |
All 64 patients had at least 1 organ dysfunction, as required by the ICC definition of severe sepsis. Organ dysfunction in 2 or more organ systems occurred in 77% (95% CI, 64%‐86%) of the cases (49/64). The incidence for each organ system dysfunction is presented in Table 5, as well as its relationship to both mortality and ICU admission. The most common organ system dysfunctions were found to be cardiovascular (hypotension) and renal dysfunction occurring in 66% and 64% of the cases, respectively. In this non‐ICU population, pulmonary dysfunction occurred in 30% of cases, but was frequently associated with transfer to the ICU, as 63% of the patients with pulmonary failure required ICU care. Patients with more organ systems affected were more likely to be transferred to the ICU and to die.
| No. (%) | ICU Transfer, No. (%) | Mortality, No. (%) | |
|---|---|---|---|
| |||
| Number of failed organs, N = 64 | |||
| 1 | 15 (23%) | 0 (0%) | 0 (0%) |
| 2 | 25 (39%) | 2 (8%) | 0 (0%) |
| 3 | 7 (11%) | 2 (29%) | 1 (14%) |
| 4 | 10 (16%) | 6 (60%) | 3 (30%) |
| >4 | 7 (11%) | 6 (86%) | 4 (57%) |
| Types of organ system dysfunction, all patients, N = 64*?>a | |||
| Cardiovascular | 42 (66%) | 16 (38%)b | 8 (19%)c |
| Renal | 41 (64%) | 10 (24%)b | 5 (12%)c |
| Central nervous system | 35 (54%) | 14 (40%)b | 7 (18%)c |
| Pulmonary | 19 (30%) | 12 (63%)b | 8 (42%)c |
| Hematologic | 15 (23%) | 6 (40%)b | 6 (40%)c |
| GI (ileus) | 8 (13%) | 5 (63%)b | 1 (13%)c |
| Hepatic | 5 (8%) | 4 (80%)b | 2 (40%)c |
DISCUSSION
Severe sepsis was common among patients admitted to the general medical ward in this tertiary care center. Our patient cohort differed in important ways from previously described typical cases of severe sepsis among ICU populations. Severe sepsis on the general medical wards was more commonly associated with Gram‐negative pathogens in the setting of genitourinary tract infections. This is in contrast to Gram‐positive organisms and respiratory tract infections, which are more common in the ICU.[3, 10] Renal and cardiac dysfunction were commonly observed organ failures, whereas in the ICU, severe sepsis has been reported to more likely involve respiratory failure. These results suggest that hospitalists seeking to provide evidence‐based care to prevent postsepsis morbidity and mortality for their non‐ICU patients need to heighten their index of suspicion when caring for an infected patient and appreciate that many severe sepsis patients may not fit neatly into traditional sepsis treatment algorithms.
Studies characterizing severe sepsis in the ICU setting indicate a predominance of pulmonary infections and respiratory failure with occurrence rates of 74% to 95% and 54% to 61%, respectively.[3, 12, 13] Given that either shock or pulmonary dysfunction is often required for admission to many ICUs, it is perhaps not surprising that these rates are dramatically different on the general medicine ward, with a relative scarcity of pulmonary infections (14%) and respiratory dysfunction (30%). Instead, genitourinary infections were noted in 41% (95% CI, 29%‐54%) of the cases, in contrast to the rates of genitourinary infections in ICU patients with severe sepsis, which have rates of 5.4% to 9.1%.[3, 10] Likely as a result of this, a Gram‐negative predominance is noted in the associated microbiology. Furthermore, our study indicates that C difficile and vancomycin‐resistant Enterococcus (VRE) species appear to represent an emerging cause of severe sepsis on the general medicine wards, as they have not been noted to be causative micro‐organisms in previous studies of sepsis. This is concordant with other studies showing increases in incidence and severity of disease for C difficile as well as VRE.[14, 15]
Previous epidemiologic studies of severe sepsis originating outside the ICU are lacking, but some work has been done. One study on the epidemiology of sepsis both with and without organ dysfunction aggregated all hospitalized patients and included those both admitted to the general medicine wards and directly to the ICU.[7] Similar to our study, this study also found a predominance of Gram‐negative causative organisms, as well as comparable in‐hospital mortality rates (12.8% vs 13%). Additionally, genitourinary infections were noted in 20% of the patients, notably higher than rates reported to have been found in patients with severe sepsis in the ICU, but not the magnitude found in our study, perhaps as a result of the combined ICU‐ward population studied. A similar high prevalence of genitourinary infections was also noted in a recent administrative data‐based study of emergency medical services‐transported patients with severe sepsis, half of whom required intensive care during their hospitalization.[16]
Our study is unique in that it focuses on severe sepsis in patients, commonly cared for by hospitalists, who were admitted to the general medical ward, and uses patient level data to elucidate more characteristics of the defining organ dysfunction. Furthermore, our results suggest that severe sepsis was poorly documented in this setting, indicating a potential impact on billing, coding, case mix index, and hospital mortality statistics that rely on very specific wording, as well as a possible need for increased awareness among hospitalists. Without this awareness, an opportunity may be missed for improved patient care via specific sepsis‐targeted measures,[13, 17, 18] including more aggressive resuscitative measures[19] or intensive physical and occupational therapy interventions aimed at impacting the cognitive and functional debilities[20] that result from severe sepsis. Highlighting this growing need to better assist clinicians assess the severity of septic patients and recognize these complex cases on the general medicine wards, 1 recent study evaluated the fitness of several clinical disease‐severity scoring systems for patients with sepsis in general internal medicine departments.[21] Perhaps with the help of tools such as these, which are being piloted in some hospitals, the care of this growing population can be enhanced.
Our study has a number of limitations that should be kept in mind. First, this is a single center study performed at an academic tertiary care center with a relatively high incidence of immunosuppression, which may influence the spectrum of infecting organisms. Our center also has a relatively large, closed‐model ICU, which often operates at near capacity, potentially affecting the severity of our non‐ICU population. Second, although we screened a large number of patients, as necessitated by our intensive and detailed review of clinical information, our sample size with hospitalist‐validated severe sepsis is relatively small. With this small sample size, less prevalent infections, patient characteristics, and organ dysfunctions may by chance have been under or over‐represented, and one could expect some variance in the occurrence rates of organ system dysfunction and infection rates by sampling error alone. Further larger scale studies are warranted to confirm these data and their generalizability. Third, the data necessary to calculate sequential organ failure assessment or multiple organ dysfunction score were not collected. This may limit the ability to directly compare the organ dysfunction noted in this study with others. Additionally, given the ICC definitions of organ dysfunction, some of the organ dysfunction noted, particularly for neurological dysfunction, was reliant on subjective clinical findings documented in the record. Finally, we relied on the lack of specific terminology to indicate a lack of documentation of sepsis, which does not necessarily indicate a lack of recognition or undertreatment of this condition. However, these limitations are offset by the strengths of this study, including the patient‐level medical record validation of severe sepsis by trained hospitalist physicians, high kappa statistic, and strict application of guideline‐based definitions.
This work has important implications for both clinicians and for future research on severe sepsis. The results suggest that severe sepsis may be quite common outside the ICU, and that patients presenting with this condition who are admitted to general medical wards are not routinely characterized by the profound hypoxemia and refractory shock of iconic cases. Certainly, further study looking at larger numbers of cases is needed to better understand the specifics and nuances of this important topic as well as to further evaluate clinicians' ability to recognize and treat such patients in this setting. Furthermore, future research on the treatment of severe sepsis, including both antimicrobials and disease‐modifying agents (eg, anti‐inflammatories) must continue to include and even focus on this large population of non‐ICU patients with severe sepsis, as the risk/benefit ratios of such potential treatments may vary with severity of illness.
In conclusion, severe sepsis was commonly found in patients admitted on the general medicine wards. The epidemiology of the infections and resultant organ dysfunction appears to differ from that found in the ICU. More studies are needed to provide a deeper understanding of this disease process, as this will enable clinicians to better recognize and treat patients thus afflicted, no matter the setting.
Acknowledgments
The authors thank Laetitia Shapiro, AM, for her programming assistance.
Disclosures: This work was supported in part by the US National Institutes of HealthK08, HL091249 (TJI) and the University of Michigan SpecialistHospitalist Allied Research Program (SHARP). This work was also supported in part by VA Ann Arbor Healthcare System, Geriatric Research Education and Clinical Center (GRECC).
The International Consensus Conference (ICC) for sepsis defines severe sepsis as an infection leading to acute organ dysfunction.[1, 2] Severe sepsis afflicts over 1 million patients each year in Medicare alone, and is substantially more common among older Americans than acute myocardial infarction.[3, 4, 5] Recently, the Agency for Healthcare Research and Quality identified severe sepsis as the single most expensive cause of hospitalization in the United States.[6] The incidence of severe sepsis continues to rise.[4, 5]
Severe sepsis is often mischaracterized as a diagnosis cared for primarily in the intensive care unit (ICU). Yet, studies indicate that only 32% to 50% of patients with severe sepsis require ICU care, leaving the majority on the general care wards.[7, 8] These studies also reveal mortality rates of 26% to 30% among patients with severe sepsis who are not admitted to an ICU compared to 11% to 33% in the ICU.[7, 8]
Although a number of epidemiologic and interventional studies have focused on severe sepsis in the ICU,[3, 9, 10] much less is known about patients cared for on the general medicine wards. Without this information, clinicians cannot make informed choices about important management decisions such as targeted diagnostic testing, empirical antimicrobials, and other therapies. To this end, we sought to further characterize the infectious etiologies and resultant organ system dysfunctions in the subset of patients with severe sepsis admitted to non‐ICU medical services at a tertiary academic medical center.
METHODS
Population/Setting
All hospitalizations of adult patients (18 years old) who were initially admitted to non‐ICU medical services at the University of Michigan Hospital during 2009 through 2010 were included. The University of Michigan Hospital has 610 general medical‐surgical beds, including telemetry beds, with closed ICUs comprised of 179 beds staffed by intensivists. Patients transferred from other hospitals and those admitted to non‐medical services were excluded.
Data Abstraction and Definitions
All International Classification of Diseases, 9th Revision, Clinical Modification (ICD‐9‐CM) diagnosis codes for hospitalizations were screened using a previously published and validated algorithm for severe sepsis.[11] Following this screening, 3 randomly selected round‐numbered batches of hospitalizations were sampled with subsequent application of the exclusion criteria. Medical records including physicians' notes, consultants' notes, nurses' notes, physical therapy notes, discharge coordinators' notes, emergency room flow sheets, as well as ward flow sheets were reviewed in detail by 3 practicing hospitalists using a structured instrument closely aligned with the ICC definition of severe sepsis.[2] We also sampled a smaller number of patients whose ICD‐9‐CM diagnoses screened negative for severe sepsis. Sample size was selected as part of a project with multiple objectives, and reflected a pragmatic balance between the anticipated precision of the results and the resources available to conduct chart review.[11] All discrepancies were reconciled among the 3 reviewers.
Reviewers first assessed whether infection was present, then evaluated for evidence of each organ system dysfunction, and finally determined the extent to which those organ dysfunctions were a response to the infection. Infection was defined either as a patient with a microbiologic culture growing a pathologic organism in a normally sterile site or documentation of a suspected infection with other confirmatory evidence (radiological, physical exam finding) with resultant systemic inflammatory response and administration of antimicrobials. Community‐acquired and healthcare‐associated infections were not differentiated. Microbiologic data, confirmatory tests, and site of infection were abstracted in detail.
Organ dysfunction was defined as per the 2001 ICC criteria,[2] and was assessed for neurological, pulmonary, cardiovascular, renal, gastrointestinal, hematological, and hepatic system involvement in all patients. A summary of these clinical definitions is included in Table 1. Data on important comorbidities were also abstracted. Immunosuppression was defined as having any of the following: solid organ transplant, bone marrow/stem cell transplant, human immunodeficiency virus/acquired immunodeficiency syndrome, neutropenia (absolute neutrophil count <1000), hematologic malignancy, solid organ malignancy with chemotherapy within the past 12 months, or pharmacologic immunosuppression (prednisone >20 mg daily for >4 weeks, calcineurin inhibitor, methotrexate, tumor necrosis factor inhibitors, azathioprine, sulfasalazine, hydroxychloroquine). Last, each chart was evaluated for the presence of explicit documentation with the presence of the words or phrases: sepsis, septic shock, or severe sepsis, indicating that the clinical service recognized and fully documented that a patient had severe sepsis.
| Organ System | Parameters to Indicate Dysfunction |
|---|---|
| |
| Cardiovascular | Systolic BP <90, elevated lactate, MAP <70, requiring pressors >2 hours, decrease in systolic BP of >40 |
| Renal | Creatinine increase >0.5 mg/dL, oliguria |
| Neurological | Acute mental status changes |
| Pulmonary | Intubation, BiPAP, supplemental oxygen >6 LPM or 40% face mask, PaO2/FiO2 <300 |
| Hematologic | INR >1.5 or PTT >60 not on anticoagulation, platelets <100 or 50% of baseline |
| Ileus | Decreased bowel motility requiring a change in diet |
| Hepatic | Bilirubin >4 mg/dL and >1.5 baseline |
Data Analysis
Methods for assessment of reviewer concordance have been previously described and were summarized using the kappa statistic.[11] Initial data extraction was performed in SAS 9.1 (SAS Institute, Cary, NC) and all analyses were conducted in Stata 12 (StataCorp LP, College Station, TX). Binomial 95% confidence intervals (CIs) are presented. This project was approved by the University of Michigan Institutional Review Board.
RESULTS
Of 23,288 hospitalizations examined from 2009 through 2010, the ICD‐9based automated screen for severe sepsis was positive for 3,146 (14 %). A random sample of 111 medical records, of which 92 had screened positive for severe sepsis and 19 had screened negative, was reviewed in detail. After review by the hospitalists, 64 of these 111 hospitalizations were judged to have severe sepsis, 61 of the 92 screened positive cases (66%), and 3 of the 19 screened negative cases (16%). The 3 reviewers had a kappa of 0.70, indicating good agreement.
Characteristics of the 64 patients with severe sepsis are shown in Table 2. The mean age was 63 years old (standard deviation [SD]=17.7), and 41% were male. The mean length of stay was 13.7 days (SD=20.8). Thirty‐nine percent (95% CI, 27%‐52%) of patients (25/64) were immunosuppressed. Of patients initially admitted to the general medical ward, 25% (16/64; 95% CI, 15%‐37%) ultimately required ICU care during their admission. The overall in‐hospital mortality rate was 13% (8/64; 95% CI, 6%‐23%). Immunosuppressed patients had a mortality rate of 20% and nonimmunosuppressed patients had a mortality rate of 8%. Only 47% (30/64; 95% CI, 34%‐60%) of the medical records had explicit clinician documentation of severe sepsis.
| Age, mean (SD), y | 63 (18) |
|---|---|
| |
| Male sex, no. (%) | 26 (41) |
| Preexisting conditions, no. (%) | |
| History of diabetes | 20 (31) |
| End stage renal disease on chronic dialysis | 2 (3) |
| Chronic obstructive pulmonary disease on oxygen | 3 (5) |
| History of cancer | 15 (23) |
| Liver cirrhosis | 5 (8) |
| Immunosuppression | 25 (39) |
| Median length of stay (days) | 7.5 |
| Mean length of stay (SD) | 13.7 (20.8) |
The most common site of infection was found to be the genitourinary system, occurring in 41% (26/64; 95% CI, 29%‐54%) of patients (Table 3). Pulmonary and intra‐abdominal sites were also common, accounting for 14% (95% CI, 6.6%‐25%) and 13% (95% CI, 5.6%‐23%) of sites, respectively. An infecting organism was identified by culture in 66% (42/64; 95% CI, 53%‐77%) of case patients with specific pathogens listed in Table 4. Among patients with positive culture results, the majority grew Gram‐negative organisms (57%; 95% CI, 41%‐72%). Non‐Clostridium difficile Gram‐positive organisms were also prominent and identified in 48% (95% CI, 32%‐64%) of positive cultures. Candida was less common (12%, 95% CI, 4.0%‐26%). Fourteen cases (22%, 95% CI, 10%‐30%) had 2 or more concomitant infectious pathogens.
| Site | No. (%) |
|---|---|
| |
| Genitourinary | 26 (41) |
| Pulmonary | 9 (14) |
| Intra‐abdominal (not intraluminal) | 8 (13) |
| Bloodstream/cardiac | 5 (8) |
| Skin and soft tissue | 4 (6) |
| GI lumen | 4 (6) |
| Joint | 2 (3) |
| Multiple sites | 4 (6) |
| Unknown | 2 (2) |
| Absolute Frequency, Total Positive Culture Results, N=64, No. (%)*?>a | Patients With Cultures Growing at Least One of the Pathogens, N=42, No. (%)*?>a | |
|---|---|---|
| ||
| Gram‐negative pathogens | 30 (47) | 24 (57) |
| Escherichia coli | 12 (19) | 12 (29) |
| Escherichia coli (multidrug resistant) | 2 (3) | 2 (5) |
| Klebsiella | 6 (9) | 5 (12) |
| Pseudomonas aeruginosa | 6 (9) | 4 (10) |
| Pseudomonas aeruginosa (multidrug resistant) | 2 (3) | 2 (5) |
| Otherb | 6 (9) | 6 (14) |
| Gram‐positive pathogens | 29 (45) | 25 (59) |
| Enterococcus | 14 (22) | 13 (31) |
| Vancomycin‐resistant Enterococcus species | 5 (8) | 4 (10) |
| Staphylococcus aureus | 7 (11) | 7 (17) |
| Methicillin‐resistant Staphylococcus aureus | 3 (5) | 3 (7) |
| Streptococcus pneumoniae | 2 (3) | 2 (5) |
| Coagulase‐negative staphylococci | 1 (2) | 1 (2) |
| Clostridium difficile | 5 (8) | 5 (12) |
| Fungi | ||
| Candida species | 5 (8) | 5 (12) |
| Mycobacterium avium | 1 (2) | 1 (2) |
| Two organisms | 9 (21) | |
| Three or more organisms | 5 (12) | |
All 64 patients had at least 1 organ dysfunction, as required by the ICC definition of severe sepsis. Organ dysfunction in 2 or more organ systems occurred in 77% (95% CI, 64%‐86%) of the cases (49/64). The incidence for each organ system dysfunction is presented in Table 5, as well as its relationship to both mortality and ICU admission. The most common organ system dysfunctions were found to be cardiovascular (hypotension) and renal dysfunction occurring in 66% and 64% of the cases, respectively. In this non‐ICU population, pulmonary dysfunction occurred in 30% of cases, but was frequently associated with transfer to the ICU, as 63% of the patients with pulmonary failure required ICU care. Patients with more organ systems affected were more likely to be transferred to the ICU and to die.
| No. (%) | ICU Transfer, No. (%) | Mortality, No. (%) | |
|---|---|---|---|
| |||
| Number of failed organs, N = 64 | |||
| 1 | 15 (23%) | 0 (0%) | 0 (0%) |
| 2 | 25 (39%) | 2 (8%) | 0 (0%) |
| 3 | 7 (11%) | 2 (29%) | 1 (14%) |
| 4 | 10 (16%) | 6 (60%) | 3 (30%) |
| >4 | 7 (11%) | 6 (86%) | 4 (57%) |
| Types of organ system dysfunction, all patients, N = 64*?>a | |||
| Cardiovascular | 42 (66%) | 16 (38%)b | 8 (19%)c |
| Renal | 41 (64%) | 10 (24%)b | 5 (12%)c |
| Central nervous system | 35 (54%) | 14 (40%)b | 7 (18%)c |
| Pulmonary | 19 (30%) | 12 (63%)b | 8 (42%)c |
| Hematologic | 15 (23%) | 6 (40%)b | 6 (40%)c |
| GI (ileus) | 8 (13%) | 5 (63%)b | 1 (13%)c |
| Hepatic | 5 (8%) | 4 (80%)b | 2 (40%)c |
DISCUSSION
Severe sepsis was common among patients admitted to the general medical ward in this tertiary care center. Our patient cohort differed in important ways from previously described typical cases of severe sepsis among ICU populations. Severe sepsis on the general medical wards was more commonly associated with Gram‐negative pathogens in the setting of genitourinary tract infections. This is in contrast to Gram‐positive organisms and respiratory tract infections, which are more common in the ICU.[3, 10] Renal and cardiac dysfunction were commonly observed organ failures, whereas in the ICU, severe sepsis has been reported to more likely involve respiratory failure. These results suggest that hospitalists seeking to provide evidence‐based care to prevent postsepsis morbidity and mortality for their non‐ICU patients need to heighten their index of suspicion when caring for an infected patient and appreciate that many severe sepsis patients may not fit neatly into traditional sepsis treatment algorithms.
Studies characterizing severe sepsis in the ICU setting indicate a predominance of pulmonary infections and respiratory failure with occurrence rates of 74% to 95% and 54% to 61%, respectively.[3, 12, 13] Given that either shock or pulmonary dysfunction is often required for admission to many ICUs, it is perhaps not surprising that these rates are dramatically different on the general medicine ward, with a relative scarcity of pulmonary infections (14%) and respiratory dysfunction (30%). Instead, genitourinary infections were noted in 41% (95% CI, 29%‐54%) of the cases, in contrast to the rates of genitourinary infections in ICU patients with severe sepsis, which have rates of 5.4% to 9.1%.[3, 10] Likely as a result of this, a Gram‐negative predominance is noted in the associated microbiology. Furthermore, our study indicates that C difficile and vancomycin‐resistant Enterococcus (VRE) species appear to represent an emerging cause of severe sepsis on the general medicine wards, as they have not been noted to be causative micro‐organisms in previous studies of sepsis. This is concordant with other studies showing increases in incidence and severity of disease for C difficile as well as VRE.[14, 15]
Previous epidemiologic studies of severe sepsis originating outside the ICU are lacking, but some work has been done. One study on the epidemiology of sepsis both with and without organ dysfunction aggregated all hospitalized patients and included those both admitted to the general medicine wards and directly to the ICU.[7] Similar to our study, this study also found a predominance of Gram‐negative causative organisms, as well as comparable in‐hospital mortality rates (12.8% vs 13%). Additionally, genitourinary infections were noted in 20% of the patients, notably higher than rates reported to have been found in patients with severe sepsis in the ICU, but not the magnitude found in our study, perhaps as a result of the combined ICU‐ward population studied. A similar high prevalence of genitourinary infections was also noted in a recent administrative data‐based study of emergency medical services‐transported patients with severe sepsis, half of whom required intensive care during their hospitalization.[16]
Our study is unique in that it focuses on severe sepsis in patients, commonly cared for by hospitalists, who were admitted to the general medical ward, and uses patient level data to elucidate more characteristics of the defining organ dysfunction. Furthermore, our results suggest that severe sepsis was poorly documented in this setting, indicating a potential impact on billing, coding, case mix index, and hospital mortality statistics that rely on very specific wording, as well as a possible need for increased awareness among hospitalists. Without this awareness, an opportunity may be missed for improved patient care via specific sepsis‐targeted measures,[13, 17, 18] including more aggressive resuscitative measures[19] or intensive physical and occupational therapy interventions aimed at impacting the cognitive and functional debilities[20] that result from severe sepsis. Highlighting this growing need to better assist clinicians assess the severity of septic patients and recognize these complex cases on the general medicine wards, 1 recent study evaluated the fitness of several clinical disease‐severity scoring systems for patients with sepsis in general internal medicine departments.[21] Perhaps with the help of tools such as these, which are being piloted in some hospitals, the care of this growing population can be enhanced.
Our study has a number of limitations that should be kept in mind. First, this is a single center study performed at an academic tertiary care center with a relatively high incidence of immunosuppression, which may influence the spectrum of infecting organisms. Our center also has a relatively large, closed‐model ICU, which often operates at near capacity, potentially affecting the severity of our non‐ICU population. Second, although we screened a large number of patients, as necessitated by our intensive and detailed review of clinical information, our sample size with hospitalist‐validated severe sepsis is relatively small. With this small sample size, less prevalent infections, patient characteristics, and organ dysfunctions may by chance have been under or over‐represented, and one could expect some variance in the occurrence rates of organ system dysfunction and infection rates by sampling error alone. Further larger scale studies are warranted to confirm these data and their generalizability. Third, the data necessary to calculate sequential organ failure assessment or multiple organ dysfunction score were not collected. This may limit the ability to directly compare the organ dysfunction noted in this study with others. Additionally, given the ICC definitions of organ dysfunction, some of the organ dysfunction noted, particularly for neurological dysfunction, was reliant on subjective clinical findings documented in the record. Finally, we relied on the lack of specific terminology to indicate a lack of documentation of sepsis, which does not necessarily indicate a lack of recognition or undertreatment of this condition. However, these limitations are offset by the strengths of this study, including the patient‐level medical record validation of severe sepsis by trained hospitalist physicians, high kappa statistic, and strict application of guideline‐based definitions.
This work has important implications for both clinicians and for future research on severe sepsis. The results suggest that severe sepsis may be quite common outside the ICU, and that patients presenting with this condition who are admitted to general medical wards are not routinely characterized by the profound hypoxemia and refractory shock of iconic cases. Certainly, further study looking at larger numbers of cases is needed to better understand the specifics and nuances of this important topic as well as to further evaluate clinicians' ability to recognize and treat such patients in this setting. Furthermore, future research on the treatment of severe sepsis, including both antimicrobials and disease‐modifying agents (eg, anti‐inflammatories) must continue to include and even focus on this large population of non‐ICU patients with severe sepsis, as the risk/benefit ratios of such potential treatments may vary with severity of illness.
In conclusion, severe sepsis was commonly found in patients admitted on the general medicine wards. The epidemiology of the infections and resultant organ dysfunction appears to differ from that found in the ICU. More studies are needed to provide a deeper understanding of this disease process, as this will enable clinicians to better recognize and treat patients thus afflicted, no matter the setting.
Acknowledgments
The authors thank Laetitia Shapiro, AM, for her programming assistance.
Disclosures: This work was supported in part by the US National Institutes of HealthK08, HL091249 (TJI) and the University of Michigan SpecialistHospitalist Allied Research Program (SHARP). This work was also supported in part by VA Ann Arbor Healthcare System, Geriatric Research Education and Clinical Center (GRECC).
- , , , et al. Definitions for sepsis and organ failure and guidelines for the use of innovative therapies in sepsis. The ACCP/SCCM Consensus Conference Committee. American College of Chest Physicians/Society of Critical Care Medicine. Chest. 1992;101(6):1644–1655.
- , , , et al. 2001 SCCM/ESICM/ACCP/ATS/SIS International Sepsis Definitions Conference. Crit Care Med. 2003;31(4):1250–1256.
- , , , , , . Epidemiology of severe sepsis in the United States: analysis of incidence, outcome, and associated costs of care. Crit Care Med. 2001;29(7):1303–1310.
- , , , . Population burden of long‐term survivorship after severe sepsis in older americans. J Am Geriatr Soc. 2012;60(6):1070–1077.
- , , , . The epidemiology of sepsis in the United States from 1979 through 2000. N Engl J Med. 2003;348(16):1546–1554.
- , , . Septicemia in U.S. hospitals, 2009: statistical brief #122. October 2011. In: Healthcare Cost and Utilization Project Statistical Briefs. Rockville, MD: Agency for Health Care Policy and Research; 2006. Available from: http://www.ncbi.nlm.nih.gov/books/NBK65391. Accessed June 2, 2012.
- , , , et al. Sepsis incidence and outcome: contrasting the intensive care unit with the hospital ward. Crit Care Med. 2007;35(5):1284–1289.
- , , , , . Epidemiology of sepsis in Victoria, Australia. Crit Care Med. 2005;33(1):71–80.
- , , , et al. Effect of empirical treatment with moxifloxacin and meropenem vs meropenem on sepsis‐related organ dysfunction in patients with severe sepsis: a randomized trial. JAMA. 2012;307(22):2390–2399.
- , , , , . Incidence and impact of organ dysfunctions associated with sepsis. Chest. 2005;127(3):942–951.
- , , , et al. Identifying patients with severe sepsis using administrative claims: patient‐level validation of the Angus Implementation of the International Consensus Conference definition of severe sepsis [published online ahead of print September 18, 2012]. Medical Care. doi: 10.1097/MLR.0b013e318268ac86.
- , , , . Current epidemiology of septic shock: the CUB‐Rea Network. Am J Respir Crit Care Med. 2003;168(2):165–172.
- . Management of sepsis. N Engl J Med. 2006;355(16):1699–1713.
- , , . Current status of Clostridium difficile infection ipidemiology. Clin Infect Dis. 2012;55(suppl 2):S65–S70.
- , . Vancomycin‐resistant enterococci. Semin Respir Infect. 2000;15(4):314–326.
- , , , , , . Severe sepsis in prehospital emergency care: analysis of incidence, care, and outcome. Am J Respir Crit Care Med. 2012;186(12):1264–1271.
- , . Novel Therapies for Septic Shock Over the Past 4 Decades. JAMA. 2011;306(2):194–199.
- , , , et al. Impact of the Surviving Sepsis Campaign protocols on hospital length of stay and mortality in septic shock patients: results of a three‐year follow‐up quasi‐experimental study. Crit Care Med. 2010;38(4):1036–1043.
- , . Diagnosis and treatment of severe sepsis. Crit Care. 2007;11(suppl 5):S2.
- , , , . Long‐term cognitive impairment and functional disability among survivors of severe sepsis. JAMA. 2010;304(16):1787–1794.
- , , , , . Assessment of disease‐severity scoring systems for patients with sepsis in general internal medicine departments. Crit Care. 2011;15:R95.
- , , , et al. Definitions for sepsis and organ failure and guidelines for the use of innovative therapies in sepsis. The ACCP/SCCM Consensus Conference Committee. American College of Chest Physicians/Society of Critical Care Medicine. Chest. 1992;101(6):1644–1655.
- , , , et al. 2001 SCCM/ESICM/ACCP/ATS/SIS International Sepsis Definitions Conference. Crit Care Med. 2003;31(4):1250–1256.
- , , , , , . Epidemiology of severe sepsis in the United States: analysis of incidence, outcome, and associated costs of care. Crit Care Med. 2001;29(7):1303–1310.
- , , , . Population burden of long‐term survivorship after severe sepsis in older americans. J Am Geriatr Soc. 2012;60(6):1070–1077.
- , , , . The epidemiology of sepsis in the United States from 1979 through 2000. N Engl J Med. 2003;348(16):1546–1554.
- , , . Septicemia in U.S. hospitals, 2009: statistical brief #122. October 2011. In: Healthcare Cost and Utilization Project Statistical Briefs. Rockville, MD: Agency for Health Care Policy and Research; 2006. Available from: http://www.ncbi.nlm.nih.gov/books/NBK65391. Accessed June 2, 2012.
- , , , et al. Sepsis incidence and outcome: contrasting the intensive care unit with the hospital ward. Crit Care Med. 2007;35(5):1284–1289.
- , , , , . Epidemiology of sepsis in Victoria, Australia. Crit Care Med. 2005;33(1):71–80.
- , , , et al. Effect of empirical treatment with moxifloxacin and meropenem vs meropenem on sepsis‐related organ dysfunction in patients with severe sepsis: a randomized trial. JAMA. 2012;307(22):2390–2399.
- , , , , . Incidence and impact of organ dysfunctions associated with sepsis. Chest. 2005;127(3):942–951.
- , , , et al. Identifying patients with severe sepsis using administrative claims: patient‐level validation of the Angus Implementation of the International Consensus Conference definition of severe sepsis [published online ahead of print September 18, 2012]. Medical Care. doi: 10.1097/MLR.0b013e318268ac86.
- , , , . Current epidemiology of septic shock: the CUB‐Rea Network. Am J Respir Crit Care Med. 2003;168(2):165–172.
- . Management of sepsis. N Engl J Med. 2006;355(16):1699–1713.
- , , . Current status of Clostridium difficile infection ipidemiology. Clin Infect Dis. 2012;55(suppl 2):S65–S70.
- , . Vancomycin‐resistant enterococci. Semin Respir Infect. 2000;15(4):314–326.
- , , , , , . Severe sepsis in prehospital emergency care: analysis of incidence, care, and outcome. Am J Respir Crit Care Med. 2012;186(12):1264–1271.
- , . Novel Therapies for Septic Shock Over the Past 4 Decades. JAMA. 2011;306(2):194–199.
- , , , et al. Impact of the Surviving Sepsis Campaign protocols on hospital length of stay and mortality in septic shock patients: results of a three‐year follow‐up quasi‐experimental study. Crit Care Med. 2010;38(4):1036–1043.
- , . Diagnosis and treatment of severe sepsis. Crit Care. 2007;11(suppl 5):S2.
- , , , . Long‐term cognitive impairment and functional disability among survivors of severe sepsis. JAMA. 2010;304(16):1787–1794.
- , , , , . Assessment of disease‐severity scoring systems for patients with sepsis in general internal medicine departments. Crit Care. 2011;15:R95.
Copyright © 2013 Society of Hospital Medicine
Nitrogen-binding agent approved for treating urea cycle disorders
Glycerol phenylbutyrate, a nitrogen-binding agent, has been approved for the chronic treatment of adults and children aged 2 years and older with urea cycle disorders, who cannot be managed with a protein-restricted diet or amino acid supplements alone, the Food and Drug Administration announced on Feb. 1.
The product, in a liquid formulation, helps eliminate excess ammonia that results from the accumulation of nitrogen in people with urea cycle disorders, which are inherited metabolic disorders. The drug is taken three times a day with a protein-restricted diet, according to the FDA statement announcing the approval. In some cases, it is used with dietary supplements, such as amino acids or arginine.
It will be marketed under the trade name Ravicti by Hyperion Therapeutics.

Approval was based on a study of 44 adults with urea cycle disorders, which found that glycerol phenylbutyrate was as effective as sodium phenylbutyrate (Buphenyl), in controlling ammonia levels, according to the FDA. In the study, patients were randomized to treatment with sodium phenylbutyrate, an approved treatment for urea cycle disorders, or glycerol phenylbutyrate for 2 weeks, then were switched to the other treatment for 2 weeks. Another three studies in children and adults "provided evidence supporting the long-term safety and effectiveness of Ravicti in patients 2 years and older," the FDA said.
Diarrhea, flatulence, and headache were the most common side effects associated with treatment, according to the FDA.
The manufacturer expects to launch the product by the end of April 2013 and will distribute it through two specialty pharmacies, according to a Hyperion statement.
The product, in a liquid formulation, helps eliminate excess ammonia that results from the accumulation of nitrogen in people with urea cycle disorders, which are inherited metabolic disorders. The drug is taken three times a day with a protein-restricted diet, according to the FDA statement announcing the approval. In some cases, it is used with dietary supplements, such as amino acids or arginine.
Glycerol phenylbutyrate, a nitrogen-binding agent, has been approved for the chronic treatment of adults and children aged 2 years and older with urea cycle disorders, who cannot be managed with a protein-restricted diet or amino acid supplements alone, the Food and Drug Administration announced on Feb. 1.
The product, in a liquid formulation, helps eliminate excess ammonia that results from the accumulation of nitrogen in people with urea cycle disorders, which are inherited metabolic disorders. The drug is taken three times a day with a protein-restricted diet, according to the FDA statement announcing the approval. In some cases, it is used with dietary supplements, such as amino acids or arginine.
It will be marketed under the trade name Ravicti by Hyperion Therapeutics.
Approval was based on a study of 44 adults with urea cycle disorders, which found that glycerol phenylbutyrate was as effective as sodium phenylbutyrate (Buphenyl), in controlling ammonia levels, according to the FDA. In the study, patients were randomized to treatment with sodium phenylbutyrate, an approved treatment for urea cycle disorders, or glycerol phenylbutyrate for 2 weeks, then were switched to the other treatment for 2 weeks. Another three studies in children and adults "provided evidence supporting the long-term safety and effectiveness of Ravicti in patients 2 years and older," the FDA said.
Diarrhea, flatulence, and headache were the most common side effects associated with treatment, according to the FDA.
The manufacturer expects to launch the product by the end of April 2013 and will distribute it through two specialty pharmacies, according to a Hyperion statement.
Glycerol phenylbutyrate, a nitrogen-binding agent, has been approved for the chronic treatment of adults and children aged 2 years and older with urea cycle disorders, who cannot be managed with a protein-restricted diet or amino acid supplements alone, the Food and Drug Administration announced on Feb. 1.
The product, in a liquid formulation, helps eliminate excess ammonia that results from the accumulation of nitrogen in people with urea cycle disorders, which are inherited metabolic disorders. The drug is taken three times a day with a protein-restricted diet, according to the FDA statement announcing the approval. In some cases, it is used with dietary supplements, such as amino acids or arginine.
It will be marketed under the trade name Ravicti by Hyperion Therapeutics.
Approval was based on a study of 44 adults with urea cycle disorders, which found that glycerol phenylbutyrate was as effective as sodium phenylbutyrate (Buphenyl), in controlling ammonia levels, according to the FDA. In the study, patients were randomized to treatment with sodium phenylbutyrate, an approved treatment for urea cycle disorders, or glycerol phenylbutyrate for 2 weeks, then were switched to the other treatment for 2 weeks. Another three studies in children and adults "provided evidence supporting the long-term safety and effectiveness of Ravicti in patients 2 years and older," the FDA said.
Diarrhea, flatulence, and headache were the most common side effects associated with treatment, according to the FDA.
The manufacturer expects to launch the product by the end of April 2013 and will distribute it through two specialty pharmacies, according to a Hyperion statement.
The product, in a liquid formulation, helps eliminate excess ammonia that results from the accumulation of nitrogen in people with urea cycle disorders, which are inherited metabolic disorders. The drug is taken three times a day with a protein-restricted diet, according to the FDA statement announcing the approval. In some cases, it is used with dietary supplements, such as amino acids or arginine.
The product, in a liquid formulation, helps eliminate excess ammonia that results from the accumulation of nitrogen in people with urea cycle disorders, which are inherited metabolic disorders. The drug is taken three times a day with a protein-restricted diet, according to the FDA statement announcing the approval. In some cases, it is used with dietary supplements, such as amino acids or arginine.